Document
Management's discussion and analysis
Table of contents
Management’s discussion and analysis
In this management’s discussion and analysis (MD&A), we, us, our, BCE and the company mean, as the context may require, either BCE Inc. or, collectively, BCE Inc., Bell Canada, their subsidiaries, joint arrangements and associates. Bell means, as the context may require, either Bell Canada or, collectively, Bell Canada, its subsidiaries, joint arrangements and associates.
All amounts in this MD&A are in millions of Canadian dollars, except where noted. Please refer to section 8, Non-GAAP financial measures, other financial measures and key performance indicators (KPIs) for a list of defined non-GAAP financial measures, other financial measures and KPIs.
Please refer to BCE’s unaudited consolidated financial statements for the first quarter of 2024 (Q1 2024 Financial Statements) when reading this MD&A. We also encourage you to read BCE’s MD&A for the year ended December 31, 2023 dated March 7, 2024 (BCE 2023 Annual MD&A). In preparing this MD&A, we have taken into account information available to us up to May 1, 2024, the date of this MD&A, unless otherwise stated.
You will find additional information relating to BCE, including BCE’s annual information form for the year ended December 31, 2023 dated March 7, 2024 and recent financial reports, including the BCE 2023 Annual MD&A, on BCE’s website at BCE.ca, on SEDAR+ at sedarplus.ca and on EDGAR at sec.gov.
Documents and other information contained in BCE’s website or in any other site referred to in BCE’s website or in this MD&A are not part of this MD&A and are not incorporated by reference herein.
This MD&A comments on our business operations, performance, financial position and other matters for the three months (Q1) ended March 31, 2024 and 2023.
Caution regarding forward-looking statements
This MD&A and, in particular, but without limitation, section 1.2, Key corporate and business developments, section 3.1, Bell CTS, the section and sub-sections entitled Assumptions and section 4.7, Liquidity, contain forward-looking statements. These forward-looking statements include, without limitation, statements relating to BCE’s 2024 annualized common share dividend, the intended use of the net proceeds of Bell Canada's February 2024 public offering, the sources of liquidity we expect to use to meet our 2024 cash requirements, BCE’s business outlook, objectives, plans and strategic priorities, and other statements that do not refer to historical facts. A statement we make is forward-looking when it uses what we know and expect today to make a statement about the future. Forward-looking statements are typically identified by the words assumption, goal, guidance, objective, outlook, project, strategy, target, commitment and other similar expressions or future or conditional verbs such as aim, anticipate, believe, could, expect, intend, may, plan, seek, should, strive and will. All such forward-looking statements are made pursuant to the safe harbour provisions of applicable Canadian securities laws and of the United States (U.S.) Private Securities Litigation Reform Act of 1995.
Unless otherwise indicated by us, forward-looking statements in this MD&A describe our expectations as at May 1, 2024 and, accordingly, are subject to change after that date. Except as may be required by applicable securities laws, we do not undertake any obligation to update or revise any forward-looking statements, whether as a result of new information, future events or otherwise.
Forward-looking statements, by their very nature, are subject to inherent risks and uncertainties and are based on several assumptions, both general and specific, which give rise to the possibility that actual results or events could differ materially from our expectations expressed in, or implied by, such forward-looking statements and that our business outlook, objectives, plans and strategic priorities may not be achieved. These statements are not guarantees of future performance or events, and we caution you against relying on any of these forward-looking statements. Forward-looking statements are presented in this MD&A for the purpose of assisting investors and others in understanding our objectives, strategic priorities and business outlook as well as our anticipated operating environment. Readers are cautioned, however, that such information may not be appropriate for other purposes.
We have made certain economic, market, operational and other assumptions in preparing the forward-looking statements contained in this MD&A and, in particular, but without limitation, the forward-looking statements contained in the previously mentioned sections of this MD&A. These assumptions include, without limitation, the assumptions described in the section and sub-sections of this MD&A entitled Assumptions, which section and
4 BCE Inc. 2024 FIRST QUARTER SHAREHOLDER REPORT
sub-sections are incorporated by reference in this cautionary statement. Subject to various factors, we believe that our assumptions were reasonable at May 1, 2024. If our assumptions turn out to be inaccurate, our actual results could be materially different from what we expect.
Important risk factors that could cause actual results or events to differ materially from those expressed in, or implied by, the previously-mentioned forward-looking statements and other forward-looking statements contained in this MD&A, include, but are not limited to: the negative effect of adverse economic conditions, including a potential recession, elevated inflation, high interest rates and financial and capital market volatility, and the resulting negative impact on business and customer spending and the demand for our products and services; the negative effect of adverse conditions associated with geopolitical events; regulatory initiatives, proceedings and decisions, government consultations and government positions that negatively affect us and influence our business including, without limitation, concerning mandatory access to networks, spectrum auctions, the imposition of consumer-related codes of conduct, approval of acquisitions, broadcast and spectrum licensing, foreign ownership requirements, privacy and cybersecurity obligations and control of copyright piracy; the inability to implement enhanced compliance frameworks and to comply with legal and regulatory obligations; unfavourable resolution of legal proceedings; the intensity of competitive activity and the failure to effectively respond to evolving competitive dynamics; the level of technological substitution and the presence of alternative service providers contributing to disruptions and disintermediation in each of our business segments; changing customer behaviour and the expansion of cloud-based, over-the-top (OTT) and other alternative solutions; advertising market pressures from economic conditions, fragmentation and non-traditional/global digital services; rising content costs and challenges in our ability to acquire or develop key content; high Canadian Internet and smartphone penetration; the failure to evolve and transform our networks, systems and operations using next-generation technologies while lowering our cost structure, including the failure to transition from a traditional telecommunications company to a tech services and digital media company and meet customer expectations of product and service experience; the inability to drive a positive customer experience; the inability to protect our physical and non-physical assets from events such as information security attacks, unauthorized access or entry, fire and natural disasters; the failure to implement an effective data governance framework; the failure to attract, develop and retain a diverse and talented team capable of furthering our strategic imperatives and high-tech transformation; the potential deterioration in employee morale and engagement resulting from staff reductions, cost reductions or reorganizations and the de-prioritization of transformation initiatives due to staff reductions, cost reductions or reorganizations; the failure to adequately manage health and safety concerns; labour disruptions and shortages; the risk that we may need to incur significant capital expenditures to provide additional capacity and reduce network congestion; service interruptions or outages due to network failures or slowdowns; events affecting the functionality of, and our ability to protect, test, maintain, replace and upgrade, our networks, information technology (IT) systems, equipment and other facilities; the failure by other telecommunications carriers on which we rely to provide services to complete planned and sufficient testing, maintenance, replacement or upgrade of their networks, equipment and other facilities, which could disrupt our operations including through network or other infrastructure failures; the complexity of our operations and IT systems and the failure to implement or maintain highly effective processes and IT systems; in-orbit and other operational risks to which the satellites used to provide our satellite television (TV) services are subject; the inability to access adequate sources of capital and generate sufficient cash flows from operating activities to meet our cash requirements, fund capital expenditures and provide for planned growth; uncertainty as to whether dividends will be declared or the dividend on common shares will be increased by BCE’s board of directors; the failure to reduce costs and adequately assess investment priorities, as well as unexpected increases in costs; the inability to manage various credit, liquidity and market risks; the failure to evolve practices to effectively monitor and control fraudulent activities; new or higher taxes due to new tax laws or changes thereto or in the interpretation thereof, and the inability to predict the outcome of government audits; the impact on our financial statements and estimates from a number of factors; pension obligation volatility and increased contributions to post-employment benefit plans; our dependence on third-party suppliers, outsourcers and consultants to provide an uninterrupted supply of the products and services we need; the failure of our vendor selection, governance and oversight processes, including our management of supplier risk in the areas of security, data governance and responsible procurement; the quality of our products and services and the extent to which they may be subject to defects or fail to comply with applicable government regulations and standards; reputational risks and the inability to meaningfully integrate environmental, social and governance (ESG) considerations into our business strategy and operations; the failure to take appropriate actions to adapt to current and emerging environmental impacts, including climate change; pandemics, epidemics and other health risks, including health concerns about radio frequency emissions from wireless communications devices and equipment; the inability to adequately manage social issues; the failure to develop and implement sufficient corporate governance practices; the adverse impact of various internal and external factors on our ability to achieve our ESG targets including, without limitation, those related to greenhouse gas emissions reduction and diversity, equity, inclusion and belonging.
We caution that the foregoing list of risk factors is not exhaustive and other factors could also materially adversely affect us. Please see section 9, Business risks of the BCE 2023 Annual MD&A for a more complete description of the above-mentioned and other risks, which section, and the other sections of the BCE 2023 Annual MD&A referred to therein, are incorporated by reference in this cautionary statement. Please also see section 6, Regulatory environment in this MD&A for an update to the regulatory initiatives and proceedings described in the BCE 2023 Annual MD&A, which section 6 is incorporated by reference in this cautionary statement. Any of those risks could cause actual results or events to differ materially from our expectations expressed in, or implied by, the forward-looking statements set out in this MD&A. Except for the updates set out in section 6, Regulatory environment in this MD&A, the risks described in the BCE 2023 Annual MD&A remain substantially unchanged.
Additional risks and uncertainties not currently known to us or that we currently deem to be immaterial may also have a material adverse effect on our business, financial condition, liquidity, financial results or reputation. We regularly consider potential acquisitions, dispositions, mergers, business combinations, investments, monetizations, joint ventures and other transactions, some of which may be significant. Except as otherwise indicated by us, forward-looking statements do not reflect the potential impact of any such transactions or of special items that may be announced or that may occur after May 1, 2024. The financial impact of these transactions and special items can be complex and depends on facts particular to each of them. We therefore cannot describe the expected impact in a meaningful way, or in the same way we present known risks affecting our business.
6 BCE Inc. 2024 FIRST QUARTER SHAREHOLDER REPORT
1 Overview
BCE Q1 2024 selected quarterly information
|
|
|
|
|
|
|
|
|
|
|
|
|
|
|
|
|
|
|
| Operating revenues |
Net earnings |
Adjusted EBITDA(1) |
|
| $6,011 |
$457 |
$2,565 |
|
| million |
million |
million |
|
(0.7%) vs. Q1 2023 |
(42.0%) vs. Q1 2023 |
+1.1% vs. Q1 2023 |
|
|
|
|
|
|
|
|
|
|
|
|
|
|
|
| Net earnings attributable to common shareholders |
Adjusted net earnings(1) |
Cash flows from operating activities |
Free cash flow(1) |
|
| $402 |
$654 |
$1,132 |
$85 |
|
| million |
million |
million |
million |
|
(44.6%) vs. Q1 2023 |
(15.3%) vs. Q1 2023 |
(9.2%) vs. Q1 2023 |
Flat vs. Q1 2023 |
|
|
|
|
BCE customer connections(6) |
|
|
|
|
|
|
|
|
|
|
|
|
Total mobile phones(2) |
Retail high-speed Internet(3)(4)(5) |
Retail internet protocol television (IPTV)(5) |
Retail residential network access services (NAS) lines(5) |
|
|
|
| +3.1% |
+5.1% |
+4.3% |
(7.8%) |
|
10.2 million subscribers
at March 31, 2024
|
4.5 million subscribers
at March 31, 2024
|
2.1 million subscribers
at March 31, 2024
|
2.0 million subscribers
at March 31, 2024
|
(1)Adjusted EBITDA is a total of segments measure, and adjusted net earnings and free cash flow are non-GAAP financial measures. See section 8.3, Total of segments measures and section 8.1, Non-GAAP financial measures in this MD&A for more information on these measures.
(2)In Q1 2024, we adjusted our mobile phone postpaid subscriber base to remove very low to non-revenue generating business market subscribers of 105,802.
(3)In Q1 2024, we removed 11,645 turbo hubs subscribers from our retail high-speed Internet subscriber base as we are no longer actively marketing this product in our wireless-to-the-home footprint.
(4)In Q1 2024, our retail high-speed Internet subscriber base increased by 3,850 business subscribers as a result of a small acquisition.
(5)In Q2 2023, our retail high-speed Internet, retail IPTV and retail residential NAS lines subscriber bases increased by 35,080, 243 and 7,458 subscribers, respectively, as a result of small acquisitions.
(6)As of Q1 2024, we are no longer reporting retail satellite TV subscribers as this no longer represents a significant proportion of our revenues. As a result, satellite TV subscribers have been removed from our retail TV subscriber base, and we now report exclusively retail IPTV subscribers.
BCE income statements - selected information
|
|
|
|
|
|
|
|
|
|
|
|
|
|
|
|
|
|
|
| |
Q1 2024 |
Q1 2023 |
$ change |
% change |
|
|
|
|
| Operating revenues |
|
|
|
|
|
|
|
|
| Service |
5,192 |
5,222 |
(30) |
|
(0.6 |
%) |
|
|
|
|
| Product |
819 |
832 |
(13) |
|
(1.6 |
%) |
|
|
|
|
| Total operating revenues |
6,011 |
6,054 |
(43) |
|
(0.7 |
%) |
|
|
|
|
| Operating costs |
(3,446) |
(3,516) |
70 |
|
2.0 |
% |
|
|
|
|
| Adjusted EBITDA |
2,565 |
2,538 |
27 |
|
1.1 |
% |
|
|
|
|
Adjusted EBITDA margin(1) |
42.7 |
% |
41.9 |
% |
|
0.8 pts |
|
|
|
|
|
|
|
|
|
|
|
|
|
|
|
|
|
|
|
|
|
|
|
|
|
|
|
|
|
|
|
|
|
|
|
|
|
|
|
|
|
|
|
|
|
|
|
|
|
|
|
|
|
|
|
|
|
|
|
|
|
|
|
|
|
|
|
|
|
|
|
|
|
|
|
|
|
|
|
|
|
|
|
|
|
|
|
|
|
|
|
|
|
|
|
|
|
|
|
|
|
|
|
|
|
|
|
|
|
|
|
|
|
|
|
|
|
|
|
|
|
|
|
|
|
|
|
|
|
|
|
|
|
|
|
|
|
|
|
|
|
|
|
|
|
|
|
|
| Net earnings attributable to: |
|
|
|
|
|
|
|
|
| Common shareholders |
402 |
725 |
(323) |
|
(44.6 |
%) |
|
|
|
|
| Preferred shareholders |
47 |
46 |
1 |
|
2.2 |
% |
|
|
|
|
| Non-controlling interest |
8 |
17 |
(9) |
|
(52.9 |
%) |
|
|
|
|
| Net earnings |
457 |
788 |
(331) |
|
(42.0 |
%) |
|
|
|
|
| Adjusted net earnings |
654 |
772 |
(118) |
|
(15.3 |
%) |
|
|
|
|
|
|
|
|
|
|
|
|
|
|
|
|
|
|
|
|
|
|
| Net earnings per common share (EPS) |
0.44 |
0.79 |
(0.35) |
(44.3 |
%) |
|
|
|
|
Adjusted EPS(2) |
0.72 |
0.85 |
(0.13) |
(15.3 |
%) |
|
|
|
|
(1) Adjusted EBITDA margin is defined as adjusted EBITDA divided by operating revenues.
(2) Adjusted EPS is a non-GAAP ratio. Refer to section 8.2, Non-GAAP ratios in this MD&A for more information on this measure.
BCE statements of cash flows – selected information
|
|
|
|
|
|
|
|
|
|
|
|
|
|
|
|
|
|
|
| |
Q1 2024 |
Q1 2023 |
$ change |
% change |
|
|
|
|
| Cash flows from operating activities |
1,132 |
|
1,247 |
|
(115) |
|
(9.2 |
%) |
|
|
|
|
| Capital expenditures |
(1,002) |
|
(1,086) |
|
84 |
|
7.7 |
% |
|
|
|
|
| Free cash flow |
85 |
|
85 |
|
— |
|
— |
|
|
|
|
|
Q1 2024 financial highlights
BCE operating revenues declined by 0.7% in Q1 2024, compared to the same period last year, driven by lower service revenues of 0.6% year over year, due to a decline in Bell Media of 7.1%, partly offset by higher service revenues in Bell CTS (Bell Communication and Technology Services) of 0.5%. This reflected lower media subscriber revenues, due to the benefit last year from a retroactive revenue adjustment related to a contract with a Canadian TV distributor, and a highly competitive market in the quarter impacting Bell CTS, as well as ongoing erosion in legacy voice, data and satellite TV revenues. The decrease in service revenues was partly mitigated by higher wireless, Internet and business solutions services revenues, the contribution from acquisitions, along with a modest increase in media advertising revenues, despite ongoing traditional broadcast TV and radio advertising market softness. Product revenues declined by 1.6% year over year, mainly driven by lower wireline equipment sales to large enterprise customers due to exceptionally strong sales in Q1 2023 as a result of the recovery from the global supply chain disruptions experienced in 2022, partly offset by greater wireless product revenues.
Net earnings and net earnings attributable to common shareholders in the first quarter of 2024 decreased by $331 million and $323 million, respectively, compared to the same period last year, mainly due to higher severance, acquisition and other costs, higher other expense, higher interest expense and higher depreciation and amortization, partly offset by lower income taxes, higher adjusted EBITDA and lower impairment of assets.
BCE's adjusted EBITDA grew by 1.1% in Q1 2024, compared to the same period last year, driven by growth from our Bell CTS segment, moderated by a decline in our Bell Media segment. The year-over-year increase in adjusted EBITDA was attributable to reduced operating costs, reflecting lower cost of revenues, including lower timing-related programming and content costs at Bell Media, along with the favourable impact of various cost reduction initiatives including workforce reductions and other operating efficiencies, partly offset by the decline in operating revenues. This drove an adjusted EBITDA margin of 42.7% in Q1 2024, up 0.8 pts year over year.
8 BCE Inc. 2024 FIRST QUARTER SHAREHOLDER REPORT
BCE's EPS of $0.44 in Q1 2024 decreased by $0.35 compared to the same period last year.
In the first quarter of 2024, adjusted net earnings, which excludes the impact of severance, acquisition and other costs, net mark-to-market gains (losses) on derivatives used to economically hedge equity settled share-based compensation plans, net equity gains (losses) on investments in associates and joint ventures, net gains (losses) on investments, early debt redemption costs and impairment of assets, net of tax and NCI, was $654 million, or $0.72 per common share, compared to $772 million, or $0.85 per common share, for the same period last year.
Cash flows from operating activities in the first quarter of 2024 decreased by $115 million, compared to the same period last year, mainly due to higher income taxes paid, partly offset by higher cash from working capital.
Free cash flow in the first quarter of 2024 of $85 million was equivalent to the same period last year, as lower cash flows from operating activities, excluding cash from acquisition and other costs paid, were offset by lower capital expenditures in Q1 2024.
1.2 Key corporate and business developments
This section contains forward-looking statements, including relating to BCE’s 2024 annualized common share dividend and the intended use of the net proceeds of Bell Canada's February 2024 public offering. Refer to the section Caution regarding forward-looking statements at the beginning of this MD&A.
Common share dividend increase
On February 7, 2024, BCE’s board of directors (the BCE Board) approved a 3.1%, or 12 cents per share, increase in the annualized common share dividend from $3.87 per share to $3.99 per share, effective with BCE’s 2024 first quarter dividend paid on April 15, 2024 to common shareholders of record on March 15, 2024.
Public debt offering
On February 15, 2024, Bell Canada completed a public offering in the United States of US $1.45 billion (Cdn $1.95 billion) principal amount of notes in two series (the Notes). The US $700 million (Cdn $942 million) Series US-9 Notes will mature on February 15, 2034 and carry an annual interest rate of 5.200%. The US $750 million (Cdn $1,009 million) Series US-10 Notes will mature on February 15, 2054 and carry an annual interest rate of 5.550%. The Notes are fully and unconditionally guaranteed by BCE Inc. A portion of the net proceeds of the offering was used to fund the repayment at maturity of Bell Canada’s US $600 million Series US-3 Notes due on March 17, 2024. The remainder of the net proceeds of the offering is intended to be used to fund the remaining payment for the 3800 megahertz (MHz) spectrum licences secured by Bell Mobility Inc. (Bell Mobility) through the Canadian government’s 3800 MHz spectrum auction and other general corporate purposes, which may include the repayment of short-term debt.
Change of auditor for fiscal 2025
The BCE Board selected Ernst & Young LLP as its external auditor for fiscal 2025 following the completion of a comprehensive request for proposal process for the 2025 external audit engagement (the RFP) by the Audit Committee of the BCE Board. In keeping with its focus on best corporate governance practices and given the long tenure of Deloitte LLP as BCE's external auditor, the Audit Committee had initiated the RFP in 2023. After careful consideration, on the advice of the Audit Committee, the BCE Board selected Ernst & Young LLP, subject to shareholder approval at BCE's 2025 annual shareholder meeting. Ernst & Young LLP was selected based on the qualifications of its audit team, staffing model, technology and independence. Deloitte LLP will continue as external auditor through the financial year ending December 31, 2024, subject to shareholder approval at the 2024 annual shareholder meeting.
Bell recognized as most sustainable telecom in the world
Bell was ranked the most sustainable communications company in the world in the Corporate Knights Global 100 2024 ranking(1). Bell scored high in the sustainable revenue and investment categories, driven by our continued investments in fleet electrification, electric vehicle charging stations and sustainable broadband services. Transitioning away from copper cable and towards fibre is helping Bell lower its environmental footprint. We also scored strongly in the sustainability pay link category, which connects sustainability targets with senior executive pay.
(1)According to the global rankings of Corporate Knights Inc., a sustainable-economy media and research company, released on January 17, 2024. BCE was ranked #51 overall and #1 in our sector and industry, in its 2024 ranking of the world’s 100 most sustainable corporations. The ranking is based on an assessment of more than 6,000 public companies with revenue over US $1 billion. All companies are scored on applicable metrics relative to their peers, with 50% of the weight assigned to sustainable revenue and sustainable investment.
As at the date of this MD&A, our forward-looking statements set out in the BCE 2023 Annual MD&A, as updated or supplemented in this MD&A, are based on certain assumptions including, without limitation, the following assumptions, as well as the various assumptions referred to under the sub-sections entitled Assumptions set out in section 3, Business segment analysis of this MD&A.
Assumptions about the Canadian economy
We have made certain assumptions concerning the Canadian economy. In particular, we have assumed:
•Improving economic growth, given the Bank of Canada’s most recent estimated growth in Canadian gross domestic product of 1.5% in 2024, representing an increase from the earlier estimate of 0.8%
•Easing, but still elevated, consumer price index (CPI) inflation as monetary policy works to reduce inflationary pressures
•Easing labour market conditions
•Growth in consumer spending driven mainly by strong population growth
•Business investment growth underpinned by the diminishing impact of past increases in interest rates, easing financial conditions and the overall growth of the economy
•Prevailing high interest rates expected to remain at or near current levels
•Population growth resulting from strong immigration
•Canadian dollar expected to remain near current levels. Further movements may be impacted by the degree of strength of the U.S. dollar, interest rates and changes in commodity prices.
Market assumptions
•A higher level of wireline and wireless competition in consumer, business and wholesale markets
•Higher, but slowing, wireless industry penetration
•A shrinking data and voice connectivity market as business customers migrate to lower-priced telecommunications solutions or alternative OTT competitors
•The Canadian traditional broadcast TV and radio advertising market is experiencing a slowdown consistent with trends in the global advertising market, with improvement expected in the medium term, although visibility to the specific timing and pace remains limited
•Declines in broadcasting distribution undertaking (BDU) subscribers driven by increasing competition from the continued rollout of subscription video on demand (SVOD) streaming services together with further scaling of OTT aggregators
Assumptions underlying expected continuing contribution holiday in 2024 in the majority of our pension plans
•At the relevant time, our defined benefit (DB) pension plans will remain in funded positions with going concern surpluses and maintain solvency ratios that exceed the minimum legal requirements for a contribution holiday to be taken for applicable DB and defined contribution (DC) components
•No significant declines in our DB pension plans’ financial position due to declines in investment returns or interest rates
•No material experience losses from other events such as through litigation or changes in laws, regulations or actuarial standards
10 BCE Inc. 2024 FIRST QUARTER SHAREHOLDER REPORT
2 Consolidated financial analysis
This section provides detailed information and analysis about BCE’s performance in Q1 2024 compared with Q1 2023. It focuses on BCE’s consolidated operating results and provides financial information for our Bell CTS and Bell Media business segments. For further discussion and analysis of our business segments, refer to section 3, Business segment analysis.
2.1 BCE consolidated income statements
|
|
|
|
|
|
|
|
|
|
|
|
|
|
|
|
|
|
|
| |
Q1 2024 |
Q1 2023 |
$ change |
% change |
|
|
|
|
| Operating revenues |
|
|
|
|
|
|
|
|
| Service |
5,192 |
5,222 |
(30) |
|
(0.6 |
%) |
|
|
|
|
| Product |
819 |
832 |
(13) |
|
(1.6 |
%) |
|
|
|
|
| Total operating revenues |
6,011 |
6,054 |
(43) |
|
(0.7 |
%) |
|
|
|
|
| Operating costs |
(3,446) |
(3,516) |
70 |
|
2.0 |
% |
|
|
|
|
| Adjusted EBITDA |
2,565 |
2,538 |
27 |
|
1.1 |
% |
|
|
|
|
| Adjusted EBITDA margin |
42.7 |
% |
41.9 |
% |
|
0.8pts |
|
|
|
|
| Severance, acquisition and other costs |
(229) |
(49) |
(180) |
|
n.m. |
|
|
|
|
| Depreciation |
(946) |
(918) |
(28) |
|
(3.1 |
%) |
|
|
|
|
| Amortization |
(316) |
(283) |
(33) |
|
(11.7 |
%) |
|
|
|
|
| Finance costs |
|
|
|
|
|
|
|
|
| Interest expense |
(416) |
(344) |
(72) |
|
(20.9 |
%) |
|
|
|
|
| Net return on post-employment benefit plans |
16 |
27 |
(11) |
|
(40.7 |
%) |
|
|
|
|
| Impairment of assets |
(13) |
(34) |
21 |
61.8 |
% |
|
|
|
|
| Other (expense) income |
(38) |
121 |
(159) |
|
n.m. |
|
|
|
|
| Income taxes |
(166) |
(270) |
104 |
|
38.5 |
% |
|
|
|
|
|
|
|
|
|
|
|
|
|
|
|
|
|
|
|
|
|
|
| Net earnings |
457 |
788 |
(331) |
|
(42.0 |
%) |
|
|
|
|
|
|
|
|
|
|
|
|
|
|
|
|
|
|
|
|
|
|
|
|
|
|
|
|
|
|
|
|
|
|
|
|
|
|
|
|
|
|
|
|
|
|
|
|
|
| Net earnings attributable to: |
|
|
|
|
|
|
|
|
| Common shareholders |
402 |
725 |
(323) |
|
(44.6 |
%) |
|
|
|
|
| Preferred shareholders |
47 |
46 |
1 |
|
2.2 |
% |
|
|
|
|
| Non-controlling interest |
8 |
17 |
(9) |
|
(52.9 |
%) |
|
|
|
|
| Net earnings |
457 |
788 |
(331) |
|
(42.0 |
%) |
|
|
|
|
| Adjusted net earnings |
654 |
772 |
(118) |
|
(15.3 |
%) |
|
|
|
|
|
|
|
|
|
|
|
|
|
|
|
|
|
|
|
|
|
|
|
|
|
|
|
|
|
|
|
| EPS |
0.44 |
0.79 |
(0.35) |
|
(44.3 |
%) |
|
|
|
|
| Adjusted EPS |
0.72 |
0.85 |
(0.13) |
|
(15.3 |
%) |
|
|
|
|
n.m.: not meaningful
2.2 Customer connections
BCE net activations (losses)
|
|
|
|
|
|
|
|
|
|
|
|
|
|
|
| |
Q1 2024 |
Q1 2023 |
% change |
|
|
|
| Mobile phone net subscriber activations (losses) |
25,208 |
|
26,635 |
|
(5.4 |
%) |
|
|
|
| Postpaid |
45,247 |
|
43,289 |
|
4.5 |
% |
|
|
|
| Prepaid |
(20,039) |
|
(16,654) |
|
(20.3 |
%) |
|
|
|
| Mobile connected devices net subscriber activations |
66,406 |
|
70,742 |
|
(6.1 |
%) |
|
|
|
| Retail high-speed Internet net subscriber activations |
31,078 |
|
27,274 |
|
13.9 |
% |
|
|
|
| Retail IPTV net subscriber activations |
14,174 |
|
10,899 |
|
30.0 |
% |
|
|
|
|
|
|
|
|
|
|
|
|
|
|
|
|
|
| Retail residential NAS lines net losses |
(43,911) |
|
(46,881) |
|
6.3 |
% |
|
|
|
| Total services net activations |
92,955 |
|
88,669 |
|
4.8 |
% |
|
|
|
Total BCE customer connections
|
|
|
|
|
|
|
|
|
|
|
|
|
|
|
| |
Q1 2024 |
Q1 2023 |
% change |
|
|
|
Mobile phone subscribers(1) |
10,206,452 |
|
9,902,492 |
|
3.1 |
% |
|
|
|
Postpaid(1) |
9,362,275 |
|
9,039,947 |
|
3.6 |
% |
|
|
|
| Prepaid |
844,177 |
|
862,545 |
|
(2.1 |
%) |
|
|
|
| Mobile connected devices subscribers |
2,798,954 |
|
2,509,983 |
|
11.5 |
% |
|
|
|
Retail high-speed Internet subscribers(2)(3)(4) |
4,496,712 |
|
4,278,497 |
|
5.1 |
% |
|
|
|
Retail IPTV subscribers(4) |
2,084,516 |
|
1,999,080 |
|
4.3 |
% |
|
|
|
|
|
|
|
|
|
|
|
|
|
|
|
|
|
Retail residential NAS lines(4) |
1,977,706 |
|
2,143,890 |
|
(7.8 |
%) |
|
|
|
Total services subscribers(5) |
21,564,340 |
|
20,833,942 |
|
3.5 |
% |
|
|
|
(1)In Q1 2024, we adjusted our mobile phone postpaid subscriber base to remove very low to non-revenue generating business market subscribers of 105,802.
(2)In Q1 2024, we removed 11,645 turbo hubs subscribers from our retail high-speed Internet subscriber base as we are no longer actively marketing this product in our wireless-to-the-home footprint.
(3)In Q1 2024, our retail high-speed Internet subscriber base increased by 3,850 business subscribers as a result of a small acquisition.
(4)In Q2 2023, our retail high-speed Internet, retail IPTV and retail residential NAS lines subscriber bases increased by 35,080, 243 and 7,458 subscribers, respectively, as a result of small acquisitions.
(5)As of Q1 2024, we are no longer reporting retail satellite TV subscribers as this no longer represents a significant proportion of our revenues. As a result, satellite TV subscribers have been removed from our retail TV subscriber base, and we now report exclusively retail IPTV subscribers.
BCE added 92,955 net retail subscriber activations in Q1 2024, up 4.8% compared to the same period last year. The net retail subscriber activations in Q1 2024 consisted of:
•25,208 mobile phone net subscriber activations, along with 66,406 mobile connected device net subscriber activations
•31,078 retail high-speed Internet net subscriber activations
•14,174 retail IPTV net subscriber activations
•43,911 retail residential NAS lines net losses
At March 31, 2024, BCE's retail subscriber connections totaled 21,564,340, up 3.5% year over year, and consisted of:
•10,206,452 mobile phone subscribers, up 3.1% year over year, and 2,798,954 mobile connected device subscribers, up 11.5% year over year
•4,496,712 retail high-speed Internet subscribers, 5.1% higher year over year
•2,084,516 retail IPTV subscribers, up 4.3% year over year
•1,977,706 retail residential NAS lines, down 7.8% year over year
12 BCE Inc. 2024 FIRST QUARTER SHAREHOLDER REPORT
2.3 Operating revenues
|
|
|
|
|
|
|
|
|
|
| BCE |
|
|
|
| Revenues |
|
|
|
| (in $ millions) |
|
|
|
|
|
|
|
|
|
|
|
|
|
|
|
|
|
|
|
|
|
|
|
|
|
|
| |
Q1 2024 |
Q1 2023 |
$ change |
% change |
|
|
|
|
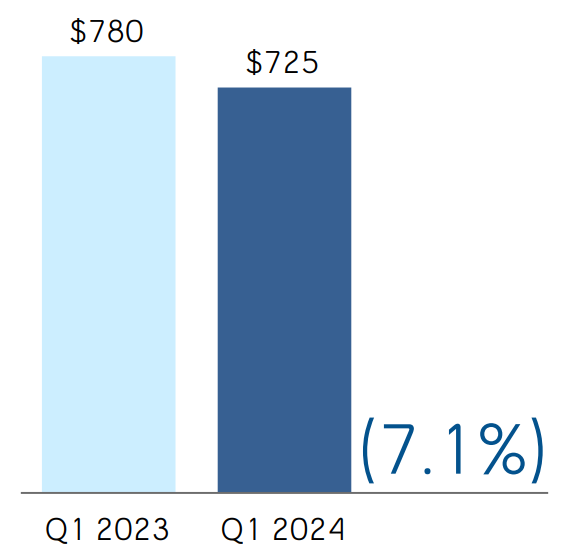
| Bell CTS |
5,375 |
|
5,367 |
|
8 |
|
0.1 |
% |
|
|
|
|
| Bell Media |
725 |
|
780 |
|
(55) |
|
(7.1 |
%) |
|
|
|
|
| Inter-segment eliminations |
(89) |
|
(93) |
|
4 |
|
4.3 |
% |
|
|
|
|
| Total BCE operating revenues |
6,011 |
|
6,054 |
|
(43) |
|
(0.7 |
%) |
|
|
|
|
BCE
BCE operating revenues decreased by 0.7% in Q1 2024, compared to the same period last year, driven by 0.6% lower service revenues of $5,192 million and 1.6% lower product revenues of $819 million. The year-over-year decrease in operating revenues resulted from a decline in our Bell Media segment, partly offset by higher revenues from our Bell CTS segment. Bell Media operating revenues decreased by 7.1% year over year, due to lower subscriber revenues, reflecting the benefit last year from a retroactive BDU revenue adjustment, partly offset by higher advertising revenues. Bell CTS operating revenues grew by 0.1% year over year, due to higher service revenues of 0.5% from continued growth in wireless revenues and wireline data revenues, moderated by ongoing erosion in wireline voice revenues. The growth in Bell CTS operating revenues was partly offset by reduced product revenues of 1.6%.
2.4 Operating costs
|
|
|
|
|
|
| BCE |
BCE |
| Operating cost profile |
Operating cost profile |
| Q1 2023 |
Q1 2024 |
|
|
|
|
|
|
|
|
|
|
|
|
|
|
|
|
|
|
|
|
|
|
|
|
|
|
|
|
| |
Q1 2024 |
Q1 2023 |
$ change |
% change |
|
|
|
|
| Bell CTS |
(2,927) |
|
(2,961) |
|
34 |
|
1.1 |
% |
|
|
|
|
| Bell Media |
(608) |
|
(648) |
|
40 |
|
6.2 |
% |
|
|
|
|
| Inter-segment eliminations |
89 |
|
93 |
|
(4) |
|
(4.3 |
%) |
|
|
|
|
| Total BCE operating costs |
(3,446) |
|
(3,516) |
|
70 |
|
2.0 |
% |
|
|
|
|
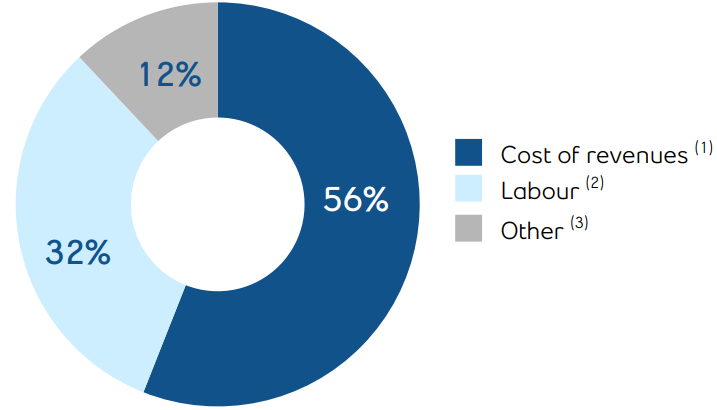
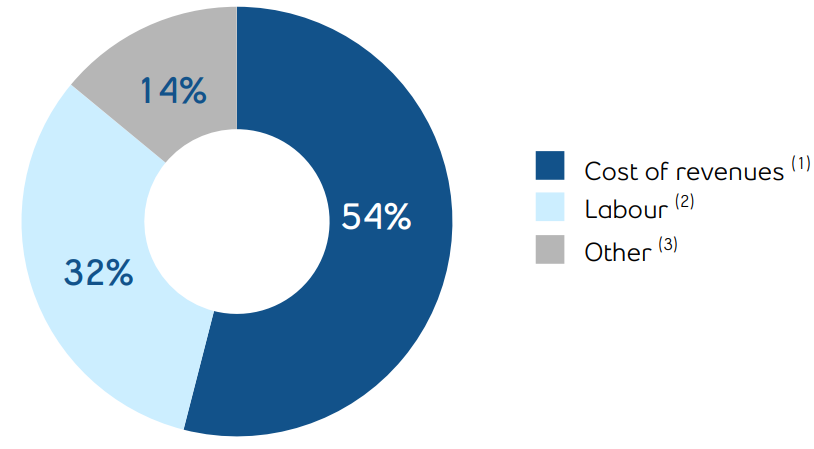
(1)Cost of revenues includes costs of wireless devices and other equipment sold, network and content costs, and payments to other carriers.
(2)Labour costs (net of capitalized costs) include wages, salaries and related taxes and benefits, post-employment benefit plans service cost, and other labour costs, including contractor and outsourcing costs.
(3)Other operating costs include marketing, advertising and sales commission costs, bad debt expense, taxes other than income taxes, IT costs, professional service fees and rent.
BCE
BCE operating costs decreased by 2.0% in Q1 2024, compared to Q1 2023, from lower expenses at Bell Media of 6.2% and Bell CTS of 1.1%, mainly reflecting lower cost of revenues, including lower timing-related programming and content costs, along with the favourable impact of various cost reduction initiatives including workforce reductions and other operating efficiencies.
14 BCE Inc. 2024 FIRST QUARTER SHAREHOLDER REPORT
2.5 Net earnings
|
|
|
|
|
| BCE |
|
|
| Net earnings |
|
|
| (in $ millions) |
|
|
|
|
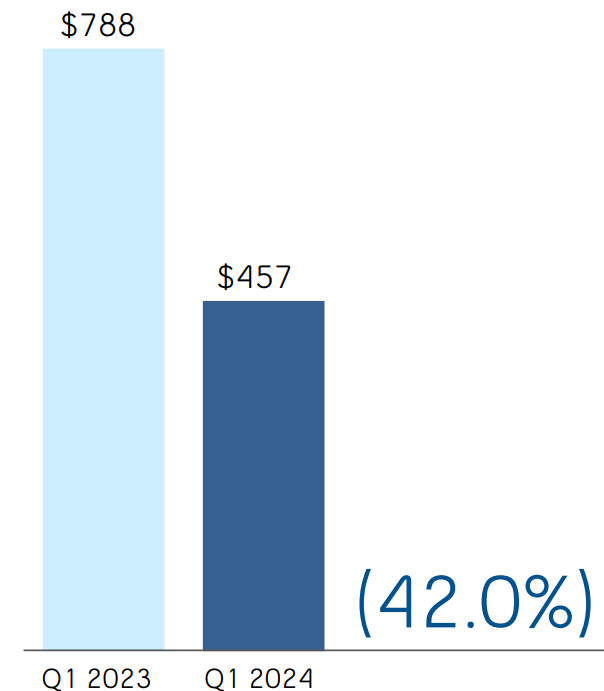
|
Net earnings in the first quarter of 2024 decreased by $331 million, compared to the same period last year, mainly due to higher severance, acquisition and other costs, higher other expense, higher interest expense and higher depreciation and amortization, partly offset by lower income taxes, higher adjusted EBITDA and lower impairment of assets.
2.6 Adjusted EBITDA
|
|
|
|
|
| BCE |
|
|
| Adjusted EBITDA |
|
|
| (in $ millions ) |
|
|
|
|
|
|
|
|
|
|
|
|
|
|
|
|
|
|
|
|
|
|
|
|
| |
Q1 2024 |
Q1 2023 |
$ change |
% change |
|
|
|
|
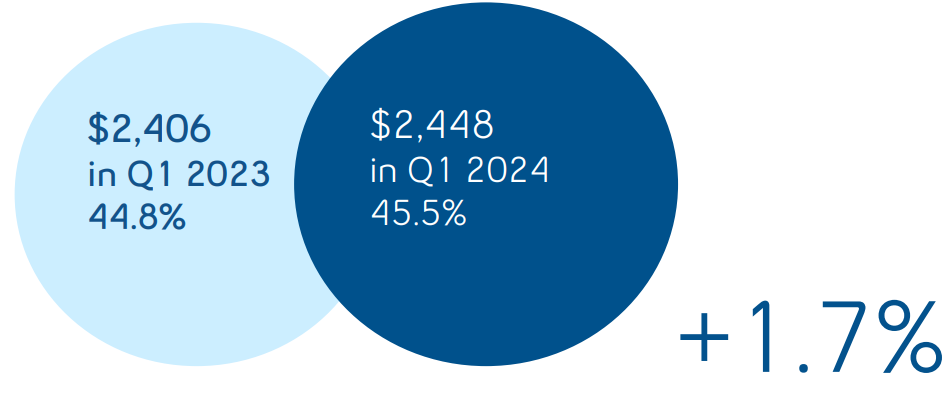
| Bell CTS |
2,448 |
|
2,406 |
|
42 |
|
1.7 |
% |
|
|
|
|
| Adjusted EBITDA margin |
45.5 |
% |
44.8 |
% |
|
0.7 pts |
|
|
|
|
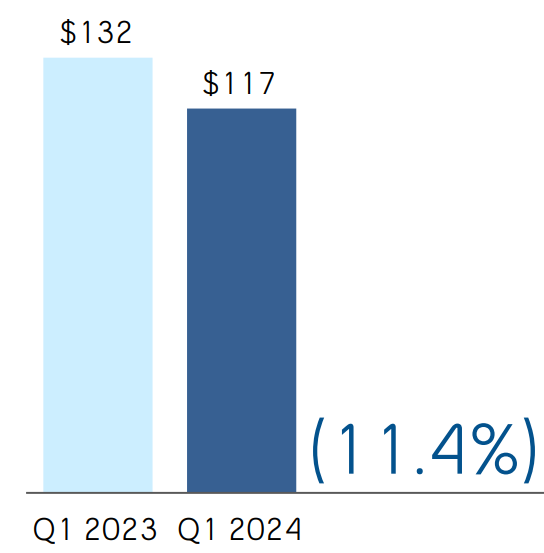
| Bell Media |
117 |
|
132 |
|
(15) |
|
(11.4 |
%) |
|
|
|
|
| Adjusted EBITDA margin |
16.1 |
% |
16.9 |
% |
|
(0.8) pts |
|
|
|
|
| Total BCE adjusted EBITDA |
2,565 |
|
2,538 |
|
27 |
|
1.1 |
% |
|
|
|
|
| Adjusted EBITDA margin |
42.7 |
% |
41.9 |
% |
|
0.8 pts |
|
|
|
|
BCE
BCE’s adjusted EBITDA grew by 1.1% in Q1 2024, compared to Q1 2023, attributable to a higher year-over-year contribution from Bell CTS of 1.7%, moderated by a decline in Bell Media of 11.4%. The increase in adjusted EBITDA was driven by lower operating expenses, partly offset by reduced operating revenues. This drove an adjusted EBITDA margin of 42.7% in Q1 2024, up 0.8 pts over the 41.9% margin in Q1 2023.
2.7 Severance, acquisition and other costs
2024
Severance, acquisition and other costs of $229 million in the first quarter of 2024 included:
•Severance costs of $234 million in Q1 2024 related to involuntary and voluntary employee terminations, including costs of the previously announced workforce reductions incurred up to March 31, 2024
•Acquisition and other costs recovery of $5 million in Q1 2024
16 BCE Inc. 2024 FIRST QUARTER SHAREHOLDER REPORT Severance, acquisition and other costs of $49 million in the first quarter of 2023 included:
2023
•Severance costs of $29 million in Q1 2023 related to involuntary and voluntary employee terminations
•Acquisition and other costs of $20 million in Q1 2023
2.8 Depreciation and amortization
Depreciation
Depreciation in the first quarter of 2024 increased by $28 million, compared to the same period in 2023, mainly due to a higher asset base as we continued to invest in our broadband and wireless networks.
Amortization
Amortization in the first quarter of 2024 increased by $33 million, compared to the same period in 2023, mainly due to a higher asset base.
Interest expense
Interest expense in the first quarter of 2024 increased by $72 million, compared to the same period last year, mainly due to higher average debt balances and higher interest rates.
Net return on post-employment benefit plans
Net return on our post-employment benefit plans is based on market conditions that existed at the beginning of the year as well as the net post-employment benefit plan asset (liability). On January 1, 2024, the discount rate was 4.6% compared to 5.3% on January 1, 2023.
In the first quarter of 2024, net return on post-employment benefit decreased by $11 million, compared to the same period last year, as a result of a lower discount rate in 2024 and a lower net asset position.
The impacts of changes in market conditions during the year are recognized in Other comprehensive income (loss) (OCI).
2.10 Impairment of assets
Impairment charges for the three months ended March 31, 2024 and 2023 of $13 million and $34 million, respectively, related mainly to right-of-use assets for certain office spaces we ceased using as part of our real estate optimization strategy as a result of our hybrid work policy.
2.11 Other (expense) income
2024
Other expense of $38 million in the first quarter of 2024 included net mark-to-market losses on derivatives used to economically hedge equity settled share-based compensation plans, partly offset by interest income and income on operations from our equity investments.
2023
Other income of $121 million in the first quarter of 2023 included gains on retirements and disposals of property, plant and equipment and intangible assets related to the sale of land as part of our real estate optimization strategy, net mark-to-market gains on derivatives used to economically hedge equity settled share-based compensation plans and income on operations from our equity investments.
Income taxes in the first quarter of 2024 decreased by $104 million, compared to the same period in 2023, mainly due to lower taxable income.
2.13 Net earnings attributable to common shareholders and EPS
Net earnings attributable to common shareholders in the first quarter of 2024 of $402 million, decreased by $323 million, compared to the same period last year, mainly due to higher severance, acquisition and other costs, higher other expense, higher interest expense and higher depreciation and amortization, partly offset by lower income taxes, higher adjusted EBITDA and lower impairment of assets.
BCE’s EPS of $0.44 in Q1 2024 decreased by $0.35 compared to the same period last year.
In the first quarter of 2024, adjusted net earnings, which excludes the impact of severance, acquisition and other costs, net mark-to-market gains (losses) on derivatives used to economically hedge equity settled share-based compensation plans, net equity gains (losses) on investments in associates and joint ventures, net gains (losses) on investments, early debt redemption costs and impairment of assets, net of tax and NCI, was $654 million, or $0.72 per common share, compared to $772 million, or $0.85 per common share, for the same period last year.
18 BCE Inc. 2024 FIRST QUARTER SHAREHOLDER REPORT
3 Business segment analysis
This section contains forward-looking statements, including relating to BCE’s plans and 2024 outlook. Refer to the section Caution regarding forward-looking statements at the beginning of this MD&A.
Key business developments
Partnership with Google Cloud to offer AI-driven contact centre solutions
Bell launched Google Cloud Contact Center AI (CCAI) from Bell for Canadian businesses, a managed solution supported by professional services expertise that enables intelligent customer and agent experience leveraging generative AI-infused technology. Providing rich conversational experiences and analytics, Google CCAI from Bell offers scalability and flexibility that can be added to existing contact centre environments and to cloud contact centres of any size. Bell will work with enterprise and mid-market customers to customize use cases that leverage the power of the innovative technical solutions available with Google CCAI from Bell, including Virtual Agent, Agent Assist and Analytics and Insights. Bell is also deploying both the virtual agent and contact centre as a service AI solutions (CCAI and CCAIP) within its own contact centres, digitally transforming and AI-enabling its internal solutions, delivering improved customer experiences to Bell customers, and helping them develop deep expertise to guide Canadian businesses with their own integrations.
Collaboration with Microsoft to bring new hybrid work solutions to Canadian businesses
Bell announced a collaboration with Microsoft to bring new solutions that will help Canadian businesses modernize their communications platforms and better collaborate in the new world of work. With Bell Operator Connect for Microsoft Teams, a cloud-based Bell solution that enables business-grade voice calling on Teams, Canadian organizations can now add Bell's high-quality voice network to Microsoft Teams without additional phone equipment or hardware. Bell has also selected Microsoft 365 as its strategic cloud collaboration solution as part of the company's own digital transformation and workforce modernization.
Partnership with SentinelOne to provide advanced endpoint protection for Canadian business
Bell announced a partnership with SentinelOne, a global leader in AI-powered security, to provide extensive data protection services for Bell’s enterprise customers. The partnership marks SentinelOne's first partnership with a major telecommunications company in Canada. The combined capabilities of Bell and SentinelOne can provide advanced end-to-end protection, enhancing modern enterprises' ability to defend faster, at greater scale, and with higher accuracy across their entire attack surface.
Launch of no name mobile
Bell entered into a retail partnership with Loblaw Companies Limited to launch no name mobile, providing Canadians new affordable wireless options and prepaid plans, powered by PC Mobile and running on Bell’s Fourth Generation network. no name prepaid plans will be available in all 278 No Frills grocery store locations across Canada.
Financial performance analysis
Q1 2024 performance highlights
|
|
|
|
|
|
|
|
|
|
|
|
|
|
|
|
|
|
|
|
|
|
|
|
| Bell CTS |
Bell CTS |
| Revenues |
Adjusted EBITDA |
| (in $ millions) |
(in $ millions) |
|
|
|
|
(% adjusted EBITDA margin) |
|
|
|
|
|
|
|
|
|
|
|
|
|
|
|
|
|
|
|
|
|
|
|
|
|
|
|
|
|
|
|
|
|
|
|
|
|
|
|
|
|
|
|
|
|
|
|
|
|
|
|
|
|
|
|
|
|
|
|
|
|
|
|
|
|
|
|
|
|
|
|
|
|
|
|
|
|
|
|
|
|
|
|
|
Total mobile phone subscriber growth(1) |
Mobile phone postpaid net subscriber activations in Q1 2024 |
Mobile phone prepaid net subscriber losses in Q1 2024 |
Mobile phone postpaid churn in Q1 2024 |
Mobile phone blended average revenue per user (ARPU)(1) |
| per month |
|
| +3.1% |
45,247 |
(20,039) |
1.21% |
— |
|
| Q1 2024 vs. Q1 2023 |
Increased 4.5 % vs. Q1 2023 |
vs. net losses of (16,654) in Q1 2023 |
Increased 0.31 pts vs. Q1 2023 |
Q1 2024:
Q1 2023:
|
$58.14
$58.15
|
|
Retail high-speed Internet subscriber growth(2)(3)(4) |
Retail high-speed Internet net subscriber activations in Q1 2024 |
Retail IPTV subscriber growth(4) |
| +5.1% |
31,078 |
+4.3% |
| Q1 2024 vs. Q1 2023 |
Increased 13.9 % vs. Q1 2023 |
Q1 2024 vs. Q1 2023 |
Retail IPTV net subscriber activations in Q1 2024 |
Retail residential NAS lines subscriber decline(4) |
| 14,174 |
(7.8%) |
| Increased 30.0 % vs. Q1 2023 |
Q1 2024 vs. Q1 2023 |
(1)In Q1 2024, we adjusted our mobile phone postpaid subscriber base to remove very low to non-revenue generating business market subscribers of 105,802.
(2)In Q1 2024, we removed 11,645 turbo hubs subscribers from our retail high-speed Internet subscriber base as we are no longer actively marketing this product in our wireless-to-the-home footprint.
(3)In Q1 2024, our retail high-speed Internet subscriber base increased by 3,850 business subscribers as a result of a small acquisition.
(4)In Q2 2023, our retail high-speed Internet, retail IPTV and retail residential NAS lines subscriber bases increased by 35,080, 243 and 7,458 subscribers, respectively, as a result of small acquisitions.
20 BCE Inc. 2024 FIRST QUARTER SHAREHOLDER REPORT
Bell CTS results
Revenues
|
|
|
|
|
|
|
|
|
|
|
|
|
|
|
|
|
|
|
| |
Q1 2024 |
Q1 2023 |
$ change |
% change |
|
|
|
|
| Wireless |
1,774 |
|
1,723 |
|
51 |
|
3.0 |
% |
|
|
|
|
| Wireline data |
2,012 |
|
2,001 |
|
11 |
|
0.5 |
% |
|
|
|
|
| Wireline voice |
683 |
|
726 |
|
(43) |
|
(5.9 |
%) |
|
|
|
|
| Other wireline services |
81 |
|
78 |
|
3 |
|
3.8 |
% |
|
|
|
|
| External service revenues |
4,550 |
|
4,528 |
|
22 |
|
0.5 |
% |
|
|
|
|
| Inter-segment service revenues |
6 |
|
7 |
|
(1) |
|
(14.3 |
%) |
|
|
|
|
| Operating service revenues |
4,556 |
|
4,535 |
|
21 |
|
0.5 |
% |
|
|
|
|
| Wireless |
684 |
|
626 |
|
58 |
|
9.3 |
% |
|
|
|
|
| Wireline |
135 |
|
206 |
|
(71) |
|
(34.5 |
%) |
|
|
|
|
|
|
|
|
|
|
|
|
|
|
|
|
|
|
|
|
|
|
|
|
|
|
|
|
|
|
|
| External/Operating product revenues |
819 |
|
832 |
|
(13) |
|
(1.6 |
%) |
|
|
|
|
| Total external revenues |
5,369 |
|
5,360 |
|
9 |
|
0.2 |
% |
|
|
|
|
| Total operating revenues |
5,375 |
|
5,367 |
|
8 |
|
0.1 |
% |
|
|
|
|
Bell CTS operating revenues increased by 0.1% in Q1 2024, compared to the same period last year, driven by higher service revenues, partly offset by lower product revenues. The year-over-year growth in service revenues was driven by higher wireless revenues and wireline data revenues, partly offset by ongoing erosion in wireline voice revenues.
Bell CTS operating service revenues increased by 0.5% in Q1 2024, compared to Q1 2023.
•Wireless revenues grew by 3.0% in Q1 2024, compared to the same period last year, driven by:
•Continued growth in our mobile phone and connected device subscriber bases coupled with the flow-through of rate increases
These factors were partly offset by:
•Greater year-over-year competitive pricing pressures
•Lower data overages driven by increased customer adoption of monthly plans with higher data thresholds, including unlimited plans
•Wireline data revenues grew by 0.5% in Q1 2024, compared to Q1 2023, driven by:
•Greater retail Internet and IPTV subscriber bases, coupled with the flow-through of residential rate increases
•The acquisitions of FX Innovation in June 2023, along with other small acquisitions
•Higher business solutions services, software subscription and maintenance contracts sales to enterprise customers
These factors were partly offset by:
•Greater acquisition, retention and bundle discounts on residential services
•Continued erosion in our satellite TV subscriber base, along with Internet protocol (IP) connectivity and legacy data declines
•Wireline voice revenues declined by 5.9% in Q1 2024, compared to the same period last year, resulting from:
•Ongoing retail residential NAS lines erosion, combined with business voice declines, driven by technological substitution to wireless and Internet-based services
•Reduced sales of international wholesale long distance minutes
These factors were partly offset by:
•Flow-through of residential rate increases
Bell CTS operating product revenues decreased by 1.6% in Q1 2024, compared to Q1 2023.
•Wireless operating product revenues increased by 9.3% in the quarter, compared to the same period last year, due to a greater sales mix of premium mobile phones and timing of sales to business market customers in the government sector, partly offset by lower contracted sales volumes, primarily from fewer mobile phone upgrades, and reduced consumer electronic sales at The Source (Bell) Electronics Inc.
•Wireline operating product revenues declined by 34.5% in Q1 2024, compared to the same period last year, resulting from exceptionally strong sales in Q1 2023 to large enterprise customers, mainly due to the recovery from global supply chain disruptions experienced in 2022
Operating costs and adjusted EBITDA
|
|
|
|
|
|
|
|
|
|
|
|
|
|
|
|
|
|
|
| |
Q1 2024 |
Q1 2023 |
$ change |
% change |
|
|
|
|
| Operating costs |
(2,927) |
(2,961) |
34 |
|
1.1 |
% |
|
|
|
|
| Adjusted EBITDA |
2,448 |
2,406 |
42 |
|
1.7 |
% |
|
|
|
|
| Adjusted EBITDA margin |
45.5 |
% |
44.8 |
% |
|
0.7pts |
|
|
|
|
Bell CTS operating costs decreased by 1.1% in Q1 2024, compared to Q1 2023, due to:
•Lower cost of goods sold primarily associated with the decline in product sales volumes
•Cost reduction initiatives, primarily driven by workforce reductions and other operating efficiencies
•Reduced payment to other carriers attributable to lower associated revenues
These factors were partly offset by:
•Higher costs related to the acquisitions of FX Innovation in June 2023, along with other small acquisitions
•Increased costs related to the revenue growth from business solutions services, maintenance and software subscriptions
Bell CTS adjusted EBITDA increased by 1.7% in Q1 2024, compared to the same period last year, from higher operating revenues, combined with lower operating costs. Adjusted EBITDA margin of 45.5% in Q1 2024, increased by 0.7 pts over Q1 2023, reflecting greater revenue flow-through and the favourable impact of various cost reduction initiatives and other operating efficiencies.
Bell CTS operating metrics
Wireless
|
|
|
|
|
|
|
|
|
|
|
|
|
|
|
|
|
|
|
| |
Q1 2024 |
Q1 2023 |
Change |
% change |
|
|
|
|
| Mobile phones |
|
|
|
|
|
|
|
|
Blended ARPU(1) ($/month) |
58.14 |
58.15 |
(0.01) |
— |
|
|
|
|
|
|
|
|
|
|
|
|
|
|
| Gross subscriber activations |
507,439 |
405,535 |
101,904 |
25.1 |
% |
|
|
|
|
| Postpaid |
366,874 |
272,609 |
94,265 |
34.6 |
% |
|
|
|
|
| Prepaid |
140,565 |
132,926 |
7,639 |
5.7 |
% |
|
|
|
|
| Net subscriber activations (losses) |
25,208 |
26,635 |
(1,427) |
(5.4 |
%) |
|
|
|
|
| Postpaid |
45,247 |
43,289 |
1,958 |
4.5 |
% |
|
|
|
|
| Prepaid |
(20,039) |
(16,654) |
(3,385) |
(20.3 |
%) |
|
|
|
|
| Blended churn % (average per month) |
1.59 |
% |
1.29 |
% |
|
(0.30)pts |
|
|
|
|
| Postpaid |
1.21 |
% |
0.90 |
% |
|
(0.31)pts |
|
|
|
|
| Prepaid |
5.74 |
% |
5.28 |
% |
|
(0.46)pts |
|
|
|
|
Subscribers(1) |
10,206,452 |
9,902,492 |
303,960 |
3.1 |
% |
|
|
|
|
Postpaid(1) |
9,362,275 |
9,039,947 |
322,328 |
3.6 |
% |
|
|
|
|
| Prepaid |
844,177 |
862,545 |
(18,368) |
(2.1 |
%) |
|
|
|
|
| Mobile connected devices |
|
|
|
|
|
|
|
|
| Net subscriber activations |
66,406 |
70,742 |
(4,336) |
(6.1 |
%) |
|
|
|
|
| Subscribers |
2,798,954 |
2,509,983 |
288,971 |
11.5 |
% |
|
|
|
|
(1)In Q1 2024, we adjusted our mobile phone postpaid subscriber base to remove very low to non-revenue generating business market subscribers of 105,802.
22 BCE Inc. 2024 FIRST QUARTER SHAREHOLDER REPORT Mobile phone blended ARPU of $58.14 in Q1 2024 was essentially stable year over year, decreasing by $0.01, compared to the same period last year, driven by:
•Higher year-over-year competitive pricing pressures
•Lower data overages due to greater customer adoption of monthly plans with higher data thresholds, including unlimited plans
These factors were partly offset by:
•Flow-through of rate increases
•The impact, in Q1 2024, from the adjustment to our mobile phone postpaid subscriber base to remove very low to non-revenue generating business market subscribers of 105,802
Mobile phone gross subscriber activations grew by 25.1% in Q1 2024, compared to Q1 2023, due to both higher postpaid and prepaid gross subscriber activations.
•Mobile phone postpaid gross subscriber activations increased by 34.6% in the quarter, compared to the same period last year, driven by population growth, continued Fifth Generation (5G) and multi-product bundling momentum and effective promotions
•Mobile phone prepaid gross subscriber activations increased by 5.7% in Q1 2024, compared to the same period last year, driven by higher immigration and travel to Canada, partly offset by more attractive promotional offers and availability of mobile 5G service on postpaid discount brands
Mobile phone net subscriber activations decreased by 5.4% in Q1 2024, compared to Q1 2023, due to greater prepaid net subscriber losses, partly offset by higher postpaid net subscriber activations.
•Mobile phone postpaid net subscriber activations increased by 4.5% in this quarter, compared to the same period last year, due to higher gross activations and greater migrations from prepaid, partly offset by increased subscriber deactivations
•Mobile phone prepaid net subscriber losses increased by 20.3% in Q1 2024, compared to the same period last year, due to higher subscriber deactivations and greater migrations to postpaid, partly offset by higher gross activations
Mobile phone blended churn of 1.59% increased by 0.30 pts in Q1 2024, compared to Q1 2023.
•Mobile phone postpaid churn of 1.21% increased by 0.31 pts this quarter, compared to Q1 2023, due to higher subscriber deactivations driven by greater overall competitive market activity and promotional offer intensity compared to the same period last year
•Mobile phone prepaid churn of 5.74% increased by 0.46 pts this quarter, compared to Q1 2023, due to higher subscriber deactivations attributable to greater overall competitive market activity and more attractive promotional offers and availability of mobile 5G service on postpaid discount brands
Mobile phone subscribers at March 31, 2024 totalled 10,206,452, an increase of 3.1%, from 9,902,492 subscribers reported at the end of Q1 2023. This consisted of 9,362,275 postpaid subscribers, an increase of 3.6% from 9,039,947 subscribers reported at the end of Q1 2023, and 844,177 prepaid subscribers, a decrease of 2.1% from 862,545 subscribers reported at the end of Q1 2023. In Q1 2024, we adjusted our mobile phone postpaid subscriber base to remove very low to non-revenue generating business market subscribers of 105,802.
Mobile connected device net subscriber activations decreased by 6.1% in Q1 2024, compared to the same period last year, due to lower Internet of Things (IoT) net activations, partly offset by higher connected car subscriptions and lower net losses from data devices, primarily from fewer tablet deactivations.
Mobile connected device subscribers at March 31, 2024 totalled 2,798,954, up 11.5% from 2,509,983 subscribers reported at the end of Q1 2023.
Wireline data
Retail high-speed Internet
|
|
|
|
|
|
|
|
|
|
|
|
|
|
|
|
|
|
|
| |
Q1 2024 |
Q1 2023 |
Change |
% change |
|
|
|
|
| Retail net subscriber activations |
31,078 |
|
27,274 |
|
3,804 |
|
13.9 |
% |
|
|
|
|
Retail subscribers(1)(2)(3) |
4,496,712 |
|
4,278,497 |
|
218,215 |
|
5.1 |
% |
|
|
|
|
(1)In Q1 2024, we removed 11,645 turbo hubs subscribers from our retail high-speed Internet subscriber base as we are no longer actively marketing this product in our wireless-to-the-home footprint.
(2)In Q1 2024, our retail high-speed Internet subscriber base increased by 3,850 business subscribers as a result of a small acquisition.
(3)In Q2 2023, our retail high-speed Internet subscriber base increased by 35,080 as a result of small acquisitions.
Retail high-speed Internet net subscriber activations increased by 13.9% in Q1 2024, compared to the same period last year, from higher gross activations due to increased customer penetration of tenured fibre-to-the-premise (FTTP) footprint, as well as greater promotional offers, including the success of our bundled service offerings, and improved year-over-year small business performance. This was partly offset by greater customer deactivations mainly attributable to aggressive promotional offers by competitors.
Retail high-speed Internet subscribers totalled 4,496,712 at March 31, 2024, up 5.1% from 4,278,497 subscribers reported at the end of Q1 2023. In Q1 2024, we removed 11,645 turbo hubs subscribers from our retail high-speed Internet subscriber base as we are no longer actively marketing this product in our wireless-to-the-home footprint. Additionally, in Q1 2024, our retail high-speed Internet subscriber base increased by 3,850 business subscribers as a result of a small acquisition.
Retail IPTV
|
|
|
|
|
|
|
|
|
|
|
|
|
|
|
|
|
|
|
| |
Q1 2024 |
Q1 2023 |
Change |
% change |
|
|
|
|
| Retail IPTV net subscriber activations |
14,174 |
|
10,899 |
|
3,275 |
|
30.0 |
% |
|
|
|
|
|
|
|
|
|
|
|
|
|
|
|
|
|
|
|
|
|
|
Retail IPTV subscribers(1) |
2,084,516 |
|
1,999,080 |
|
85,436 |
|
4.3 |
% |
|
|
|
|
|
|
|
|
|
|
|
|
|
|
|
|
|
|
|
|
|
|
(1)In Q2 2023, our retail IPTV subscriber base increased by 243 as a result of small acquisitions.
Retail IPTV net subscriber activations increased by 30.0% in Q1 2024, compared to Q1 2023, due to greater Internet pull-through, including the favourable impact on our Fibe TV streaming service, partly offset by greater competitive intensity and increased substitution with OTT services.
Retail IPTV subscribers at March 31, 2024 totalled 2,084,516, up 4.3% from 1,999,080 subscribers reported at the end of Q1 2023.
Wireline voice
|
|
|
|
|
|
|
|
|
|
|
|
|
|
|
|
|
|
|
| |
Q1 2024 |
Q1 2023 |
Change |
% change |
|
|
|
|
| Retail residential NAS lines net losses |
(43,911) |
|
(46,881) |
|
2,970 |
|
6.3 |
% |
|
|
|
|
Retail residential NAS lines(1) |
1,977,706 |
|
2,143,890 |
|
(166,184) |
|
(7.8 |
%) |
|
|
|
|
(1)In Q2 2023, our retail residential NAS lines subscriber base increased by 7,458 subscribers as a result of small acquisitions.
Retail residential NAS lines net losses declined by 6.3% in the quarter, compared to Q1 2023, driven by lower year-over-year competitive intensity, partly offset by the unfavourable impact of continued substitution to wireless and Internet-based technologies.
Retail residential NAS lines of 1,977,706 at March 31, 2024, declined by 7.8% from 2,143,890 lines reported at the end of Q1 2023. The erosion rate of 7.8% has deteriorated over the 5.1% rate of erosion experienced in Q1 2023, mainly due to the impact of the acquisition of Distributel Communications Limited in Q4 2022.
24 BCE Inc. 2024 FIRST QUARTER SHAREHOLDER REPORT
Update to 2024 outlook
As of the date of the BCE 2023 Annual MD&A, we expected moderating growth in mobile phone blended ARPU, driven by growth in 5G subscriptions, and increased roaming revenue from the easing of travel restrictions implemented as a result of the COVID-19 pandemic, partly offset by reduced data overage revenue due, among others, to the continued adoption of unlimited plans. We now expect mobile phone blended ARPU to decline in 2024, due to a higher-than-anticipated level of competitive pricing pressure which intensified progressively in the first quarter of 2024, that has carried over from the seasonally more intense Q4 2023 selling period.
Assumptions
As at the date of this MD&A, our forward-looking statements set out in the BCE 2023 Annual MD&A, as updated or supplemented in this MD&A, are based on certain assumptions including, without limitation, the following assumptions, the assumptions referred to in the Bell Media business segment discussion set out in section 3.2, Bell Media, of this MD&A, as well as the economic, market and other assumptions referred to in section 1.3, Assumptions of this MD&A.
•Increase our market share of national operators’ wireless mobile phone net additions
•Increased competitive intensity and promotional activity across all regions and market segments
•Ongoing expansion and deployment of 5G and 5G+ wireless networks, offering competitive coverage and quality
•Continued diversification of our distribution strategy with a focus on expanding direct-to-consumer (DTC) and online transactions
•In the BCE 2023 Annual MD&A, we disclosed our assumption of moderating growth in mobile phone blended ARPU. We are now assuming declining mobile phone blended ARPU, due to a higher-than-anticipated level of competitive pricing pressure which intensified progressively in the first quarter of 2024, that has carried over from the seasonally more intense Q4 2023 selling period.
•Continuing business customer adoption of advanced 5G, 5G+ and IoT solutions
•Improving wireless handset device availability in addition to stable device pricing and margins
•Further deployment of direct fibre to more homes and businesses within our wireline footprint, but at a slower pace than during any of 2020 to 2023
•Continued growth in retail Internet and IPTV subscribers
•Increasing wireless and Internet-based technological substitution
•Continued focus on the consumer household and bundled service offers for mobility and Internet customers
•Continued large business customer migration to IP-based systems
•Ongoing competitive repricing pressures in our business and wholesale markets
•Continued competitive intensity in our small and medium-sized business markets as cable operators and other telecommunications competitors continue to intensify their focus on business customers
•Traditional high-margin product categories challenged by large global cloud and OTT providers of business voice and data solutions expanding into Canada with on-demand services
•Increasing customer adoption of OTT services resulting in downsizing of TV packages
•Growing consumption of OTT TV services and on-demand video streaming, as well as the proliferation of devices, such as tablets, that consume large quantities of bandwidth, will require ongoing capital investment
•Realization of cost savings related to operating efficiencies enabled by our direct fibre footprint, changes in consumer behaviour and product innovation, digital adoption, product and service enhancements, expanding self-serve capabilities, new call centre and digital investments, other improvements to the customer service experience, management workforce reductions including attrition and retirements, and lower contracted rates from our suppliers
•No adverse material financial, operational or competitive consequences of changes in or implementation of regulations affecting our communication and technology services business
Key business developments
Launch of Crave on Prime Video Channels in Canada
On February 29, 2024, Bell Media’s Crave streaming service became available on Amazon’s Prime Video Channels in Canada. Crave's Premium, ad-free plan can be purchased by Amazon Prime Members directly through their Prime Video account. With this additional access to the service, Crave expands its reach and discoverability, giving subscribers more choice and easier access to its premium programming on a variety of platforms, including: Crave.ca, digital media players including Amazon Fire TV, Android TV, Apple TV, Chromecast, select LG Smart TVs, select Samsung Smart TVs, select Hisense Smart TVs, PlayStation, Roku, and Xbox One.
Launch of FAST Channels
On April 25, 2024, Bell Media launched 10 English and French-language free, ad-supported streaming television (FAST) channels, featuring a selection of entertainment, factual, news, and sports programming. Combining the format of traditional broadcast within the streaming landscape, these 10 channels are now available on LG Channels, and are expected to roll out on Samsung TV Plus later this spring. Additional Bell Media FAST Channels and platform partners are to be announced later this year.
|
|
|
Financial performance analysis |
Q1 2024 performance highlights
|
|
|
|
|
|
| Bell Media |
Bell Media |
| Revenues |
Adjusted EBITDA |
| (in $ millions) |
(in $ millions) |
|
|
|
|
|
|
|
|
|
|
Bell Media results
Revenues
|
|
|
|
|
|
|
|
|
|
|
|
|
|
|
|
|
|
|
|
Q1 2024 |
Q1 2023 |
$ change |
% change |
|
|
|
|
| External revenues |
642 |
|
694 |
|
(52) |
|
(7.5 |
%) |
|
|
|
|
| Inter-segment revenues |
83 |
|
86 |
|
(3) |
|
(3.5 |
%) |
|
|
|
|
| Bell Media operating revenues |
725 |
|
780 |
|
(55) |
|
(7.1 |
%) |
|
|
|
|
26 BCE Inc. 2024 FIRST QUARTER SHAREHOLDER REPORT Bell Media operating revenues decreased by 7.1% in Q1 2024, compared to the same period last year, driven by lower subscriber revenues, partly offset by higher advertising revenues. The year-over-year decline in operating revenues was moderated by the continued growth from digital revenues(1) of 33% in the quarter.
•Advertising revenues increased by 1.6% in Q1 2024, compared to the same period last year, due to continued growth in digital advertising revenues, mainly increased bookings from Bell Media's strategic audience management (SAM) TV media sales tool, along with greater out-of-home (OOH) advertising revenues driven by growth across most platforms and higher year-over-year advertising revenues from the broadcast of Super Bowl LVIII. The growth in advertising revenues was moderated by lower demand for traditional broadcast TV and radio advertising, as a result of ongoing unfavourable economic conditions, coupled with content delays driven by the Writers Guild of America (WGA) and the Screen Actors Guild and American Federation of Television and Radio Artists (SAG-AFTRA) strikes in 2023.
•Subscriber revenues declined by 13.8% in Q1 2024, compared to Q1 2023, due to the benefit last year from a retroactive adjustment related to a contract with a Canadian TV distributor, as well as lower year-over-year BDU subscribers
Operating costs and adjusted EBITDA
|
|
|
|
|
|
|
|
|
|
|
|
|
|
|
|
|
|
|
|
Q1 2024 |
Q1 2023 |
$ change |
% change |
|
|
|
|
| Operating costs |
(608) |
(648) |
40 |
|
6.2% |
|
|
|
|
| Adjusted EBITDA |
117 |
132 |
(15) |
|
(11.4%) |
|
|
|
|
| Adjusted EBITDA margin |
16.1 |
% |
16.9 |
% |
|
(0.8) |
pts |
|
|
|
|
Bell Media operating costs decreased by 6.2% in Q1 2024, compared to the same period last year, due to:
•Lower content and programming costs driven by content delays due to the WGA and SAG-AFTRA strikes in 2023
•Restructuring initiatives undertaken over the past year as a result of the unfavourable economic and broadcasting regulatory environments
•Cessation of the Canadian Radio-television and Telecommunications Commission (CRTC) Part II broadcasting licence fee
Bell Media adjusted EBITDA decreased by 11.4% in Q1 2024, compared to Q1 2023, due to lower operating revenues, partly offset by reduced operating costs.
As at the date of this MD&A, our forward-looking statements set out in the BCE 2023 Annual MD&A, as updated or supplemented in this MD&A, are based on certain assumptions including, without limitation, the following assumptions, the assumptions referred to in the Bell CTS business segment discussion set out in section 3.1, Bell CTS, of this MD&A, as well as the economic, market and other assumptions referred to in section 1.3, Assumptions, of this MD&A.
•Overall digital revenue expected to reflect continued scaling of our SAM TV and demand-side platform buying platforms, expansion of Addressable TV (ATV), as well as DTC subscriber growth, contributing towards the advancement of our digital-first media strategy
•Leveraging of first-party data to improve targeting, advertisement delivery including personalized viewing experience and attribution
•Continued escalation of media content costs to secure quality programming
•Continued scaling of Crave through optimized content offering, user experience improvements and expanded distribution
•Continued support in original French programming with a focus on digital platforms such as Crave, Noovo.ca and iHeartRadio, to better serve our French-language customers through a personalized digital experience
•Ability to successfully acquire and produce highly-rated programming and differentiated content
•Building and maintaining strategic supply arrangements for content across all screens and platforms
•No adverse material financial, operational or competitive consequences of changes in or implementation of regulations affecting our media business
(1)Digital revenues are comprised of advertising revenue from digital platforms including websites, mobile apps, connected TV apps and OOH digital assets/platforms, as well as advertising procured through Bell digital buying platforms and subscription revenue from DTC services and video on demand services.
4 Financial and capital management
This section tells you how we manage our cash and capital resources to carry out our strategy and deliver financial results. It provides an analysis of our financial condition, cash flows and liquidity on a consolidated basis.
|
|
|
|
|
|
|
|
|
|
|
|
|
|
|
|
March 31, 2024 |
December 31, 2023 |
$ change |
% change |
| Long-term debt |
31,283 |
|
31,135 |
|
148 |
|
0.5 |
% |
| Debt due within one year |
6,386 |
|
5,042 |
|
1,344 |
|
26.7 |
% |
50% of preferred shares(1) |
1,807 |
|
1,834 |
|
(27) |
|
(1.5 |
%) |
| Cash |
(789) |
|
(547) |
|
(242) |
|
(44.2 |
%) |
| Cash equivalents |
(171) |
|
(225) |
|
54 |
|
24.0 |
% |
| Short-term investments |
(700) |
|
(1,000) |
|
300 |
|
30.0 |
% |
Net debt(2) |
37,816 |
|
36,239 |
|
1,577 |
|
4.4 |
% |
(1)50% of outstanding preferred shares of $3,614 million and $3,667 million at March 31, 2024 and December 31, 2023, respectively, are classified as debt consistent with the treatment by some credit rating agencies.
(2)Net debt is a non-GAAP financial measure. See section 8.1, Non-GAAP financial measures in this MD&A for more information on this measure.
The increase of $1,344 million in debt due within one year and the increase of $148 million in long-term debt were due to:
•the issuance by Bell Canada of Series US-9 Notes, with a total principal amount of $700 million in U.S. dollars ($942 million in Canadian dollars)
•the issuance by Bell Canada of Series US-10 Notes, with a total principal amount of $750 million in U.S. dollars ($1,009 million in Canadian dollars)
•an increase in notes payable (net of repayments) of $979 million
•an increase in outstanding loans of $243 million under the Bell Mobility uncommitted trade loan agreement
•a net increase of $67 million due to higher lease liabilities and other debt
Partly offset by:
•the repayment at maturity of Series M-44 medium-term note (MTN) debentures, with a total principal amount of $1,000 million
•the repayment at maturity of Series US-3 Notes, with a total principal amount of $600 million in U.S. dollars ($748 million in Canadian dollars)
The decrease in cash equivalents of $54 million, the decrease in short-term investments of $300 million and the increase in cash of $242 million were mainly due to:
•$2,113 million repayment of long-term debt
•$1,002 million of capital expenditures
•$883 million of dividends paid on BCE common shares
•$104 million for spectrum licences
•$104 million paid for the purchase on the open market of BCE common shares for the settlement of share-based payments
•$82 million for business acquisitions
•$46 million of dividends paid on BCE preferred shares
•$38 million paid for the repurchase of BCE preferred shares
Partly offset by:
•$2,191 million of issuance of long-term debt
•$1,132 million of cash flows from operating activities
•$979 million increase in notes payable (net of repayments)
28 BCE Inc. 2024 FIRST QUARTER SHAREHOLDER REPORT
4.2 Outstanding share data
|
|
|
|
|
|
| Common shares outstanding |
Number of shares |
| Outstanding, January 1, 2024 |
912,274,545 |
|
| Shares issued under deferred share plan |
843 |
|
|
|
|
|
Outstanding, March 31, 2024 |
912,275,388 |
|
|
|
|
|
|
|
|
|
|
| Stock options outstanding |
Number of options |
Weighted average
exercise price ($) |
| Outstanding, January 1, 2024 |
7,484,561 |
|
61 |
|
|
|
|
|
|
|
| Forfeited or expired |
(884,746) |
|
59 |
|
|
|
|
| Outstanding and exercisable, March 31, 2024 |
6,599,815 |
|
61 |
|
|
|
|
|
|
|
|
|
|
|
|
|
|
|
|
|
|
|
|
|
|
|
|
|
|
|
|
|
Q1 2024 |
|
Q1 2023 |
|
$ change |
% change |
|
|
|
|
|
|
|
| Cash flows from operating activities |
1,132 |
|
|
1,247 |
|
|
(115) |
|
(9.2 |
%) |
|
|
|
|
|
|
|
| Capital expenditures |
(1,002) |
|
|
(1,086) |
|
|
84 |
|
7.7 |
% |
|
|
|
|
|
|
|
| Cash dividends paid on preferred shares |
(46) |
|
|
(55) |
|
|
9 |
|
16.4 |
% |
|
|
|
|
|
|
|
| Cash dividends paid by subsidiaries to non-controlling interest |
(14) |
|
|
(21) |
|
|
7 |
|
33.3 |
% |
|
|
|
|
|
|
|
| Acquisition and other costs paid |
15 |
|
|
— |
|
|
15 |
|
n.m. |
|
|
|
|
|
|
|
|
|
|
|
|
|
|
|
|
|
|
|
|
|
|
|
|
|
|
|
|
|
|
|
|
|
|
|
| Free cash flow |
85 |
|
|
85 |
|
|
— |
|
— |
|
|
|
|
|
|
|
|
|
|
|
|
|
|
|
|
|
|
|
|
|
|
| Business acquisitions |
(82) |
|
|
(25) |
|
|
(57) |
|
n.m. |
|
|
|
|
|
|
|
|
|
|
|
|
|
|
|
|
|
|
|
|
|
| Acquisition and other costs paid |
(15) |
|
|
— |
|
|
(15) |
|
n.m. |
|
|
|
|
|
|
|
| Short-term investments |
300 |
|
|
— |
|
|
300 |
|
n.m. |
|
|
|
|
|
|
|
| Spectrum licences |
(104) |
|
|
(11) |
|
|
(93) |
|
n.m. |
|
|
|
|
|
|
|
|
|
|
|
|
|
|
|
|
|
|
|
|
|
|
|
|
|
|
|
|
|
|
|
|
|
|
|
|
|
|
|
|
|
|
|
|
|
|
|
|
|
| Other investing activities |
(10) |
|
|
31 |
|
|
(41) |
|
n.m. |
|
|
|
|
|
|
|
|
|
|
|
|
|
|
|
|
|
|
|
|
|
| Increase (decrease) in notes payable |
979 |
|
|
(83) |
|
|
1,062 |
|
n.m. |
|
|
|
|
|
|
|
| Increase in securitized receivables |
— |
|
|
500 |
|
|
(500) |
|
(100.0 |
%) |
|
|
|
|
|
|
|
| Issue of long-term debt |
2,191 |
|
|
1,504 |
|
|
687 |
|
45.7 |
% |
|
|
|
|
|
|
|
| Repayment of long-term debt |
(2,113) |
|
|
(299) |
|
|
(1,814) |
|
n.m. |
|
|
|
|
|
|
|
| Repurchase of a financial liability |
— |
|
|
(149) |
|
|
149 |
|
100.0 |
% |
|
|
|
|
|
|
|
| Issue of common shares |
— |
|
|
10 |
|
|
(10) |
|
(100.0 |
%) |
|
|
|
|
|
|
|
|
|
|
|
|
|
|
|
|
|
|
|
|
|
|
|
|
|
|
|
|
|
|
|
|
|
|
|
| Purchase of shares for settlement of share-based payments |
(104) |
|
|
(93) |
|
|
(11) |
|
(11.8 |
%) |
|
|
|
|
|
|
|
| Repurchase of preferred shares |
(38) |
|
|
(31) |
|
|
(7) |
|
(22.6 |
%) |
|
|
|
|
|
|
|
| Cash dividends paid on common shares |
(883) |
|
|
(839) |
|
|
(44) |
|
(5.2 |
%) |
|
|
|
|
|
|
|
|
|
|
|
|
|
|
|
|
|
|
|
|
|
|
|
|
|
|
|
|
|
|
|
|
|
|
|
|
|
|
|
|
|
|
|
|
|
|
|
|
|
|
|
|
|
|
|
|
|
|
|
|
|
|
|
|
|
|
|
|
|
|
|
|
|
|
|
|
|
| Other financing activities |
(18) |
|
|
(8) |
|
|
(10) |
|
n.m. |
|
|
|
|
|
|
|
|
|
|
|
|
|
|
|
|
|
|
|
|
|
| Net increase in cash |
242 |
|
|
552 |
|
|
(310) |
|
(56.2 |
%) |
|
|
|
|
|
|
|
| Net (decrease) increase in cash equivalents |
(54) |
|
|
40 |
|
|
(94) |
|
n.m. |
|
|
|
|
|
|
|
n.m.: not meaningful
Cash flows from operating activities and free cash flow
Cash flows from operating activities in the first quarter of 2024 decreased by $115 million, compared to the same period last year, mainly due to higher income taxes paid, partly offset by higher cash from working capital.
Free cash flow in the first quarter of 2024 of $85 million was equivalent to the same period last year, as lower cash flows from operating activities, excluding cash from acquisition and other costs paid, were offset by lower capital expenditures in Q1 2024.
Capital expenditures
|
|
|
|
|
|
|
|
|
|
|
|
|
|
|
|
|
|
|
|
Q1 2024 |
Q1 2023 |
$ change |
% change |
|
|
|
|
| Bell CTS |
975 |
1,052 |
77 |
|
7.3 |
% |
|
|
|
|
Capital intensity(1) |
18.1 |
% |
19.6 |
% |
|
1.5 |
pts |
|
|
|
|
| Bell Media |
27 |
34 |
7 |
|
20.6 |
% |
|
|
|
|
| Capital intensity |
3.7 |
% |
4.4 |
% |
|
0.7 |
pts |
|
|
|
|
| BCE |
1,002 |
1,086 |
84 |
|
7.7 |
% |
|
|
|
|
| Capital intensity |
16.7 |
% |
17.9 |
% |
|
1.2 |
pts |
|
|
|
|
(1)Capital intensity is defined as capital expenditures divided by operating revenues.
BCE capital expenditures of $1,002 million in Q1 2024, declined by 7.7% or $84 million, compared to the same period last year, corresponding to a capital intensity ratio of 16.7%, down 1.2 pts over Q1 2023. The year-over-year decrease reflected:
•Lower capital expenditures in Bell CTS of $77 million year over year, due to lower planned capital spending as we continue to buildout our FTTP and 5G networks, but at a slower pace.
•Lower capital expenditures in Bell Media of $7 million year over year, mainly due to greater spending in Q1 2023 on studio expansions, along with timing of spend, partly offset by higher investments to support digital growth
Spectrum licences
On November 30 2023, provisional spectrum licence winners in the 3800 MHz spectrum auction were announced by Innovation, Science and Economic Development Canada (ISED). Bell Mobility secured the right to acquire 939 licences for 1.77 billion megahertz per population of 3800 MHz spectrum for $518 million. On January 17, 2024, Bell Mobility made the required initial payment of $104 million to ISED, representing 20% of the total payment.
2024
In the first quarter of 2024, we issued debt, net of repayments. This included:
•$2,191 million issuance of long-term debt comprised of the issuance of Series US-9 Notes with a total principal amount of $700 million in U.S. dollars ($942 million in Canadian dollars), the issuance of Series US-10 Notes with a total principal amount of $750 million in U.S. dollars ($1,009 million in Canadian dollars) and the increase of $243 million in outstanding loans under the Bell Mobility uncommitted trade loan agreement, partly offset by $3 million of discounts on our debt issuances
•$979 million issuance (net of repayments) of notes payable
Partly offset by:
•$1,000 million repayment of Series M-44 MTN debentures
•$600 million repayment of Series US-3 Notes in U.S. dollars ($748 million in Canadian dollars)
•$365 million repayment of long-term debt comprised of net payments of leases and other debt
30 BCE Inc. 2024 FIRST QUARTER SHAREHOLDER REPORT In the first quarter of 2023, we issued debt, net of repayments. This included:
2023
•$1,504 million issuance of long-term debt comprised of the issuance of Series M-58 MTN debentures with a total principal amount of $1,050 million, series M-59 MTN Debentures with a total principal amount of $450 million and the issuance of other debt of $8 million, partly offset by $4 million of discounts on our debt issuances
•$500 million increase in securitized receivables
Partly offset by:
•$299 million repayment of long-term debt comprised of net payments of leases and other debt
•$83 million repayment (net of issuances) of notes payable
Consolidation of MLSE ownership under BCE (Repurchase of a financial liability)
In January 2023, BCE repurchased the 9% interest held by the BCE Master Trust Fund (Master Trust Fund), a trust fund that holds pension fund investments serving the pension obligations of the BCE group pension plan participants, in Maple Leaf Sports & Entertainment Ltd. (MLSE) for a cash consideration of $149 million, as a result of BCE’s obligation to repurchase the Master Trust Fund’s interest in MLSE at that price.
Issuance of common shares
The issuance of common shares in the first quarter in 2024 decreased by $10 million compared to the same period in 2023, due to no stock options having been exercised in Q1 2024.
Repurchase of preferred shares
2024
In Q1 2024, BCE repurchased and canceled 2,113,588 First Preferred Shares under it's normal course issuer bid for a total cost of $38 million.
2023
In Q1 2023, BCE repurchased and canceled 1,712,000 First Preferred Shares under its previous normal course issuer bid for a total cost of $31 million.
Cash dividends paid on common shares
In the first quarter of 2024, cash dividends paid on common shares increased by $44 million compared to Q1 2023, due to a higher dividend paid in Q1 2024 of $0.9675 per common share compared to $0.9200 per common share in Q1 2023.
4.4 Post-employment benefit plans
For the three months ended March 31, 2024, we recorded an increase in our post-employment benefit plans and a gain, before taxes, in OCI of $429 million, due to an increase in the discount rate of 4.9% at March 31, 2024, compared to 4.6% at December 31, 2023, partly offset by a lower-than-expected return on plan assets and an increase in the effect of the asset limit.
For the three months ended March 31, 2023, we recorded a decrease in our post-employment benefit plans and a loss, before taxes, in OCI of $174 million, due to a decrease in the discount rate to 5.0% at March 31, 2023, compared to 5.3% at December 31, 2022, partly offset by a higher-than-expected return on plan assets of 3.3% and a decrease in the effect of the asset limit.
4.5 Financial risk management
The following table provides the fair value details of financial instruments measured at amortized cost in the consolidated statements of financial position.
|
|
|
|
|
|
|
|
|
|
|
|
|
|
|
|
|
|
|
|
|
| |
|
|
March 31, 2024 |
December 31, 2023 |
|
|
|
|
|
|
|
|
Classification |
Fair value methodology |
Carrying value |
Fair value |
Carrying value |
Fair value |
|
|
|
|
|
|
|
|
|
|
|
|
|
|
|
|
|
|
|
|
|
Debt securities
and other debt |
Debt due within one year and long-term debt |
Quoted market price of debt |
30,021 |
|
28,607 |
|
29,049 |
|
28,225 |
|
The following table provides the fair value details of financial instruments measured at fair value in the statements of financial position.
|
|
|
|
|
|
|
|
|
|
|
|
|
|
|
|
|
|
|
Classification |
Fair value |
| Carrying value of asset (liability) |
Quoted prices in active markets for identical assets (level 1) |
Observable market data (level 2)(1) |
Non-observable market inputs (level 3)(2) |
| March 31, 2024 |
|
|
|
|
|
Publicly-traded and privately-held investments(3) |
Other non-current assets |
582 |
|
7 |
|
— |
|
575 |
|
| Derivative financial instruments |
Other current assets, trade payables and other liabilities, other non-current assets and liabilities |
(292) |
|
— |
|
(292) |
|
— |
|
|
|
|
|
|
|
| Other |
Trade payables and other liabilities and other non-current assets |
145 |
|
— |
|
217 |
|
(72) |
|
| December 31, 2023 |
|
|
|
|
|
Publicly-traded and privately-held investments(3) |
Other non-current assets |
587 |
|
10 |
|
— |
|
577 |
|
| Derivative financial instruments |
Other current assets, trade payables and other liabilities, other non-current assets and liabilities |
(488) |
|
— |
|
(488) |
|
— |
|
|
|
|
|
|
|
| Other |
Other non-current assets and liabilities |
147 |
|
— |
|
216 |
|
(69) |
|
(1)Observable market data such as equity prices, interest rates, swap rate curves and foreign currency exchange rates.
(2)Non-observable market inputs such as discounted cash flows and revenue and earnings multiples. For certain privately-held investments, changes in our valuation assumption relating to revenue and earnings multiples may result in a significant increase (decrease) in the fair value of our level 3 financial instruments.
(3)Unrealized gains and losses are recorded in Other comprehensive income (loss) in the statements of comprehensive income and are reclassified from Accumulated other comprehensive income (loss) to the Deficit in the statements of financial position when realized.
Market risk
Currency exposures
In 2024, we entered into cross currency interest rate swaps with a notional amount of $700 million in U.S. dollars ($942 million in Canadian dollars) to hedge the U.S. currency exposure of our US-9 Notes maturing in 2034. The fair value of the cross currency interest rate swaps at March 31, 2024 was a net liability of $2 million recognized in Other current assets and Other non-current liabilities in the statements of financial position.
32 BCE Inc. 2024 FIRST QUARTER SHAREHOLDER REPORT
In 2024, we entered into cross currency interest rate swaps with a notional amount of $750 million in U.S. dollars ($1,009 million in Canadian dollars) to hedge the U.S. currency exposure of our US-10 Notes maturing in 2054. In connection with these swaps, cross currency basis rate swaps outstanding at December 31, 2023 with a notional amount of $644 million were settled. The fair value of the cross currency interest rate swaps at March 31, 2024 was a net liability of $8 million recognized in Other current assets, Other non-current assets, and Other non-current liabilities in the statements of financial position.
In 2024, we entered into cross currency interest rate swaps with a notional amount of $180 million in U.S. dollars ($242 million in Canadian dollars) to hedge the U.S. currency exposure of outstanding loans maturing in 2026 under our Bell Mobility uncommitted trade loan agreement. The fair value of the cross currency interest rate swaps at March 31, 2024 was a net asset of $1 million recognized in Other current assets, Other non-current assets and Other non-current liabilities in the statements of financial position.
A 10 % depreciation (appreciation) in the value of the Canadian dollar relative to the U.S. dollar would result in a gain of $17 million (loss of $73 million) recognized in net earnings at March 31, 2024 and a gain of $142 million (loss of $140 million) recognized in Other comprehensive income (loss) at March 31, 2024, with all other variables held constant.
The following table provides further details on our outstanding foreign currency forward contracts and options at March 31, 2024.
|
|
|
|
|
|
|
|
|
|
|
|
|
|
|
|
|
|
|
|
|
| Type of hedge |
Buy
currency |
Amount to receive |
Sell
currency |
Amount
to pay |
Maturity |
Hedged item |
Cash flow (1) |
USD |
1,191 |
|
CAD |
1,608 |
|
2024 |
Loans |
| Cash flow |
USD |
905 |
|
CAD |
1,203 |
|
2024 |
Commercial paper |
| Cash flow |
USD |
489 |
|
CAD |
622 |
|
2024 |
Anticipated purchases |
| Cash flow |
PHP |
2,173 |
|
CAD |
52 |
|
2024 |
|
Anticipated purchases |
| Cash flow |
USD |
563 |
|
CAD |
734 |
|
2025 |
|
Anticipated purchases |
| Cash flow |
USD |
180 |
|
CAD |
242 |
|
2026 |
|
Anticipated purchases |
| Economic |
USD |
115 |
|
CAD |
151 |
|
2024 |
|
Anticipated purchases |
Economic - options (2) |
USD |
45 |
|
CAD |
61 |
|
2024 |
|
Anticipated purchases |
| Economic - call options |
USD |
184 |
|
CAD |
232 |
|
2024 |
|
Anticipated purchases |
| Economic - call options |
CAD |
168 |
|
USD |
117 |
|
2024 |
Anticipated purchases |
| Economic - put options |
USD |
435 |
|
CAD |
566 |
|
2024 |
Anticipated purchases |
| Economic |
USD |
120 |
|
CAD |
158 |
|
2025 |
Anticipated purchases |
Economic - options (2) |
USD |
65 |
|
CAD |
85 |
|
2025 |
Anticipated purchases |
| Economic - call options |
USD |
540 |
|
CAD |
694 |
|
2025 |
Anticipated purchases |
| Economic - put options |
USD |
540 |
|
CAD |
698 |
|
2025 |
Anticipated purchases |
|
|
|
|
|
|
|
|
|
|
|
|
|
|
|
|
|
|
|
|
|
|
|
|
|
|
|
|
|
|
|
|
|
|
|
|
|
|
|
|
|
|
|
|
|
|
|
|
|
|
|
|
|
|
|
|
|
|
|
|
|
|
|
(1) Forward contracts to hedge loans secured by receivables under our securitization program.
(2) Foreign currency options with a leverage provision and a profit cap limitation.
Interest rate exposures
In 2024, we entered into forward starting interest rate swaps, effective from 2026, with a notional amount of $336 million to hedge the fair value of our US-10 Notes maturing in 2054. The fair value of the interest rate swaps at March 31, 2024 was an asset of $4 million recognized in Other non-current assets in the statements of financial position.
A 1 % increase (decrease) in interest rates would result in a loss (gain) of $6 million recognized in net earnings for the three months ended March 31, 2024, with all other variables held constant.
Equity price exposures
We use equity forward contracts on BCE’s common shares to hedge economically the cash flow exposure related to the settlement of equity settled share-based compensation plans. The fair value of our equity forward contracts at March 31, 2024 and December 31, 2023 was a net liability of $239 million and $162 million, respectively, recognized in Other current assets, Trade payables and other liabilities and Other non-current liabilities in the statements of financial position. A (loss) gain of ($90 million) and $18 million for the three months ended March 31, 2024 and 2023, respectively, relating to these equity forward contracts is recognized in Other (expense) income in the income statements.
A 5% increase (decrease) in the market price of BCE’s common shares would result in a gain (loss) of $25 million recognized in net earnings at March 31, 2024, with all other variables held constant.
BCE's and Bell Canada's key credit ratings remain unchanged from those described in the 2023 Annual MD&A.
On March 11, 2024 and March 21, 2024, respectively, S&P Global Ratings Canada, a business unit of S&P Global Canada Corp., and Moody’s Canada Inc. revised their outlook on BCE and Bell Canada to negative from stable principally as a result of ongoing debt leverage above their respective thresholds for the current ratings. However, both also affirmed all of BCE’s and Bell Canada’s existing ratings. On March 28, 2024, DBRS Limited confirmed BCE's and Bell Canada’s ratings and stable trend.
This section contains forward-looking statements, including relating to the sources of liquidity we expect to use to meet our 2024 cash requirements. Refer to the section Caution regarding forward-looking statements at the beginning of this MD&A.
Total available liquidity(1) at March 31, 2024 was $4.7 billion, comprised of $789 million in cash, $171 million in cash equivalents, $700 million in short-term investments, $700 million available under our securitized receivables program and $2.3 billion available under our $3.5 billion committed revolving and expansion credit facilities (given $1,201 million of commercial paper outstanding).
Total available liquidity at December 31, 2023 was $5.8 billion, comprised of $547 million in cash, $225 million in cash equivalents, $1,000 million in short-term investments, $700 million available under our securitized receivables program and $3.3 billion available under our $3.5 billion committed revolving and expansion credit facilities (given $197 million of commercial paper outstanding).
We expect that our cash, cash equivalents, short-term investments, amounts available under our securitized receivables program, cash flows from operations and possible capital markets financing will permit us to meet our cash requirements in 2024 for capital expenditures, post-employment benefit plans funding, dividend payments, the payment of contractual obligations, maturing debt, ongoing operations and other cash requirements.
Should our 2024 cash requirements exceed our cash, cash equivalents, short-term investments, cash generated from our operations, and funds raised under capital markets financings and our securitized receivables program, we would expect to cover such a shortfall by drawing under committed credit facilities that are currently in place or through new facilities to the extent available.
We continuously monitor our operations, capital markets and the Canadian economy with the objective of maintaining adequate liquidity.
(1)Available liquidity is a non-GAAP financial measure. Refer to section 8.1, Non-GAAP financial measures in this MD&A for more information on this measure.
34 BCE Inc. 2024 FIRST QUARTER SHAREHOLDER REPORT
5 Quarterly financial information
BCE’s Q1 2024 Financial Statements were prepared in accordance with International Financial Reporting Standards (IFRS), as issued by the International Accounting Standards Board (IASB), under International Accounting Standard (IAS) 34, Interim Financial Reporting and were approved by BCE’s board of directors on May 1, 2024.
The following table, which was also prepared in accordance with IFRS, shows selected consolidated financial data of BCE for the eight most recent completed quarters.
|
|
|
|
|
|
|
|
|
|
|
|
|
|
|
|
|
|
|
|
|
|
|
|
|
|
|
|
|
|
|
|
|
2024 |
2023 |
2022 |
|
Q1 |
Q4 |
Q3 |
Q2 |
Q1 |
Q4 |
Q3 |
Q2 |
|
|
|
|
|
| Operating revenues |
|
|
|
|
|
|
|
|
|
|
|
|
|
| Service |
5,192 |
|
5,348 |
|
5,281 |
|
5,303 |
|
5,222 |
|
5,353 |
|
5,193 |
|
5,233 |
|
|
|
|
|
|
| Product |
819 |
|
1,125 |
|
799 |
|
763 |
|
832 |
|
1,086 |
|
831 |
|
628 |
|
|
|
|
|
|
| Total operating revenues |
6,011 |
|
6,473 |
|
6,080 |
|
6,066 |
|
6,054 |
|
6,439 |
|
6,024 |
|
5,861 |
|
|
|
|
|
|
| Adjusted EBITDA |
2,565 |
|
2,567 |
|
2,667 |
|
2,645 |
|
2,538 |
|
2,437 |
|
2,588 |
|
2,590 |
|
|
|
|
|
|
Severance, acquisition and other costs |
(229) |
|
(41) |
|
(10) |
|
(100) |
|
(49) |
|
(19) |
|
(22) |
|
(40) |
|
|
|
|
|
|
| Depreciation |
(946) |
|
(954) |
|
(937) |
|
(936) |
|
(918) |
|
(922) |
|
(914) |
|
(933) |
|
|
|
|
|
|
| Amortization |
(316) |
|
(299) |
|
(295) |
|
(296) |
|
(283) |
|
(270) |
|
(267) |
|
(266) |
|
|
|
|
|
|
|
|
|
|
|
|
|
|
|
|
|
|
|
|
|
|
|
|
|
|
|
|
|
|
|
|
|
|
| Net earnings |
457 |
|
435 |
|
707 |
|
397 |
|
788 |
|
567 |
|
771 |
|
654 |
|
|
|
|
|
|
| Net earnings attributable to common shareholders |
402 |
|
382 |
|
640 |
|
329 |
|
725 |
|
528 |
|
715 |
|
596 |
|
|
|
|
|
|
|
|
|
|
|
|
|
|
|
|
|
|
|
|
|
|
|
|
|
|
|
|
|
|
|
|
|
|
|
|
|
|
|
|
|
|
|
|
|
|
|
|
| EPS - basic and diluted |
0.44 |
|
0.42 |
|
0.70 |
|
0.37 |
|
0.79 |
|
0.58 |
|
0.78 |
|
0.66 |
|
|
|
|
|
|
|
|
|
|
|
|
|
|
|
|
|
|
|
|
|
|
|
|
|
|
|
|
|
|
|
|
|
|
|
|
|
|
|
|
|
|
|
|
|
|
|
|
|
|
|
|
|
|
|
|
|
|
|
|
|
|
|
|
|
|
|
|
|
|
|
|
|
|
|
|
|
|
|
|
|
|
|
|
|
|
|
|
|
|
|
|
|
|
|
|
|
|
|
|
|
|
|
|
|
|
|
|
|
|
|
|
|
|
|
|
|
|
|
|
|
|
|
|
|
|
|
|
|
|
|
|
|
|
|
|
|
|
|
|
|
|
|
|
|
|
|
|
|
|
|
|
|
|
|
|
|
|
|
|
Weighted average number of common shares outstanding – basic (millions) |
912.3 |
|
912.3 |
|
912.3 |
|
912.2 |
|
912.1 |
|
912.0 |
|
911.9 |
|
911.9 |
|
|
|
|
|
|
|
|
|
|
|
|
|
|
|
|
|
|
|
|
|
|
|
|
|
|
|
|
|
|
|
|
|
|
|
|
|
|
|
|
|
|
|
|
|
|
|
|
|
|
|
|
|
|
|
|
|
|
|
|
|
|
6 Regulatory environment
The following is an update to the regulatory initiatives and proceedings described in the BCE 2023 Annual MD&A under section 3.3, Principal business risks and section 8, Regulatory environment.
Telecommunications Act
Review of wholesale high-speed access service framework
On March 28, 2024, Bell Canada, jointly with Competitive Network Operators of Canada, Cogeco Communications Inc., Bragg Communications Inc. (Eastlink) and Teksavvy Solutions Inc., asked the CRTC to change the procedures for final submissions in the TNC 2023‑56 proceeding. The parties proposed that the CRTC call for final submissions on the question of whether Bell Canada, Rogers Communications Canada Inc. (Rogers) and Telus Communications Inc. (Telus) would be eligible to obtain access to aggregated wholesale FTTP. The request asks the CRTC to issue a final ruling on that single issue before aggregated wholesale FTTP access service becomes available on an interim basis on May 7, 2024. In that manner, if the CRTC agrees to the proposal, then the CRTC will have determined on both an interim and a final basis whether Bell Canada, Rogers and Telus are eligible to obtain the service, even though the CRTC will not yet have issued a final decision on whether the service will be mandated on a final basis. The record for both the proceeding initiated by the joint application and for the main proceeding launched by TNC 2023-56 has closed. It is not known when the CRTC will release its decisions.
On April 8, 2024, Bell Canada filed a Notice of Appeal to the Federal Court of Appeal of Telecom Decision CRTC 2023-358 issued on November 6, 2023.
CRTC review of access to poles
On February 5, 2024, the CRTC initiated a new consultation, as anticipated in its February 15, 2023 decision, to consider the deployment of wireless facilities, such as small cells, on incumbent local exchange carriers-owned or -controlled support structures. The CRTC is examining issues including the applicability of existing tariffs to wireless facilities and what regulatory changes, if any, are required in connection with the deployment of advanced wireless technologies in Canada. Interventions were filed in this proceeding on April 4, 2024 and final replies must be filed on May 6, 2024. At this time, it is unclear what impact the CRTC’s decision in this proceeding could have on our business and financial results.
Other
Bill C-18, the Online News Act
On June 22, 2023, Bill C-18, An Act respecting online communications platforms that make news content available to persons in Canada (the Online News Act) received royal assent. The Online News Act requires digital news intermediaries, such as Google and Meta, that share news content produced by other news outlets to negotiate commercial arrangements with those outlets, compensating them for the news content shared on digital platforms. The legislation entitles Bell Media’s general news services, such as CTV and Noovo, to compensation. The total amount of compensation to be provided by the largest platform (i.e., Google) is limited to $100 million annually, and compensation provided by other platforms will be determined by the CRTC based on the platform’s Canadian advertising revenues. Of these amounts, private broadcasters cannot receive more than 30% of the overall compensation available. The amount of compensation that Bell Media may receive from Google is unclear, as is the timing of such compensation. On February 28, 2024, Google launched its open call for news outlets to apply for compensation and news organizations had until April 30, 2024 to apply. It is also unknown whether Meta will stop blocking news links and subject itself to the jurisdiction of the Online News Act, although it seems increasingly unlikely given the length of time that has passed since Meta started to block news content in Canada and that it has announced that it will stop paying for news content in Australia when the current deals it has expire. The full impact that the legislative changes could have on our business and financial results is unknown at this time. Finally, on March 13, 2024, the CRTC issued Broadcasting Notice of Consultation CRTC 2024-255 seeking public comments on its proposed mandatory bargaining process which would apply between news outlets and digital news intermediaries that are captured by the Online News Act if a digital news intermediary has not received an exemption from the CRTC as a result of reaching an agreement with news outlets. The period to submit comments ended on April 12, 2024 and we are awaiting a decision from the CRTC. This bargaining process will not apply to Google given that its compensation level has already been established.
36 BCE Inc. 2024 FIRST QUARTER SHAREHOLDER REPORT
7 Accounting policies
BCE’s Q1 2024 Financial Statements were prepared in accordance with IFRS, as issued by the IASB, under IAS 34 - Interim Financial Reporting and were approved by BCE’s board of directors on May 1, 2024. These financial statements were prepared using the same basis of presentation, accounting policies and methods of computation as outlined in Note 2, Material accounting policies in BCE’s consolidated financial statements for the year ended December 31, 2023. BCE's Q1 2024 Financial Statements do not include all of the notes required in the annual financial statements.
Future changes in accounting standards
The following accounting standard issued by the IASB has not yet been adopted by BCE.
|
|
|
|
|
|
|
|
|
|
|
|
| Standard |
Description |
Impact |
Effective date |
|
|
|
|
|
|
|
|
| IFRS 18 - Presentation and Disclosure in Financial Statements |
Sets out requirements and guidance on presentation and disclosure in financial statements, including:
•presentation in the income statements of income and expenses within defined categories - operating, investing, financing, income taxes and discontinued operations
•presentation in the income statements of new defined subtotals - operating profit and profit before financing and income taxes
•disclosure of explanations of management-defined performance measures that are related to the income statements
•enhanced guidance on aggregation and disaggregation of information and whether to provide information in the financial statements or in the notes
•disclosure of specified expenses by nature
IFRS 18 replaces IAS 1 - Presentation of Financial Statements but carries forward many of the requirements from IAS 1 unchanged.
|
We are currently assessing the impact of this standard. |
Annual reporting periods beginning on or after January 1, 2027. Early application is permitted. |
8 Non-GAAP financial measures, other financial measures and key performance indicators (KPIs)
BCE uses various financial measures to assess its business performance. Certain of these measures are calculated in accordance with International Financial Reporting Standards (IFRS or GAAP) while certain other measures do not have a standardized meaning under GAAP. We believe that our GAAP financial measures, read together with adjusted non-GAAP and other financial measures, provide readers with a better understanding of how management assesses BCE’s performance.
National Instrument 52-112, Non-GAAP and Other Financial Measures Disclosure (NI 52-112), prescribes disclosure requirements that apply to the following specified financial measures:
•Non-GAAP financial measures;
•Non-GAAP ratios;
•Total of segments measures;
•Capital management measures; and
•Supplementary financial measures.
This section provides a description and classification of the specified financial measures contemplated by NI 52-112 that we use to explain our financial results except that, for supplementary financial measures, an explanation of such measures is provided where they are first referred to if the supplementary financial measures’ labelling is not sufficiently descriptive.
8.1 Non-GAAP financial measures
A non-GAAP financial measure is a financial measure used to depict our historical or expected future financial performance, financial position or cash flow and, with respect to its composition, either excludes an amount that is included in, or includes an amount that is excluded from, the composition of the most directly comparable financial measure disclosed in BCE’s consolidated primary financial statements. We believe that non-GAAP financial measures are reflective of our on-going operating results and provide readers with an understanding of management’s perspective on and analysis of our performance.
Below are descriptions of the non-GAAP financial measures that we use to explain our results as well as reconciliations to the most directly comparable IFRS financial measures.
The term adjusted net earnings does not have any standardized meaning under IFRS. Therefore, it is unlikely to be comparable to similar measures presented by other issuers.
We define adjusted net earnings as net earnings attributable to common shareholders before severance, acquisition and other costs, net mark-to-market losses (gains) on derivatives used to economically hedge equity settled share-based compensation plans, net equity losses (gains) on investments in associates and joint ventures, net losses (gains) on investments, early debt redemption costs, impairment of assets and discontinued operations, net of tax and NCI.
We use adjusted net earnings and we believe that certain investors and analysts use this measure, among other ones, to assess the performance of our businesses without the effects of severance, acquisition and other costs, net mark-to-market losses (gains) on derivatives used to economically hedge equity settled share-based compensation plans, net equity losses (gains) on investments in associates and joint ventures, net losses (gains) on investments, early debt redemption costs, impairment of assets and discontinued operations, net of tax and NCI. We exclude these items because they affect the comparability of our financial results and could potentially distort the analysis of trends in business performance. Excluding these items does not imply they are non-recurring.
38 BCE Inc. 2024 FIRST QUARTER SHAREHOLDER REPORT
The most directly comparable IFRS financial measure is net earnings attributable to common shareholders.
The following table is a reconciliation of net earnings attributable to common shareholders to adjusted net earnings on a consolidated basis.
|
|
|
|
|
|
|
|
|
|
|
|
|
|
Q1 2024 |
Q1 2023 |
|
|
|
|
| Net earnings attributable to common shareholders |
402 |
|
725 |
|
|
|
|
|
| Reconciling items: |
|
|
|
|
|
|
| Severance, acquisition and other costs |
229 |
|
49 |
|
|
|
|
|
Net mark-to-market losses (gains) on derivatives used to economically
hedge equity settled share-based compensation plans |
90 |
|
(18) |
|
|
|
|
|
|
|
|
|
|
|
|
| Net losses on investments |
6 |
|
— |
|
|
|
|
|
|
|
|
|
|
|
|
| Impairment of assets |
13 |
|
34 |
|
|
|
|
|
| Income taxes for the above reconciling items |
(85) |
|
(18) |
|
|
|
|
|
| NCI for the above reconciling items |
(1) |
|
— |
|
|
|
|
|
|
|
|
|
|
|
|
| Adjusted net earnings |
654 |
|
772 |
|
|
|
|
|
Available liquidity
The term available liquidity does not have any standardized meaning under IFRS. Therefore, it is unlikely to be comparable to similar measures presented by other issuers.
We define available liquidity as cash, cash equivalents, short-term investments and amounts available under our securitized receivables program and our committed bank credit facilities, excluding credit facilities that are available exclusively for a pre-determined purpose.
We consider available liquidity to be an important indicator of the financial strength and performance of our businesses because it shows the funds available to meet our cash requirements, including for, but not limited to, capital expenditures, post-employment benefit plans funding, dividend payments, the payment of contractual obligations, maturing debt, on going operations, the acquisition of spectrum, and other cash requirements. We believe that certain investors and analysts use available liquidity to evaluate the financial strength and performance of our businesses. The most directly comparable IFRS financial measure is cash.
The following table is a reconciliation of cash to available liquidity on a consolidated basis.
|
|
|
|
|
|
|
|
|
|
March 31, 2024 |
December 31, 2023 |
| Cash |
789 |
|
547 |
|
| Cash equivalents |
171 |
|
225 |
|
| Short-term investments |
700 |
|
1,000 |
|
Amounts available under our securitized receivables program(1) |
700 |
|
700 |
|
Amounts available under our committed bank credit facilities(2) |
2,299 |
|
3,303 |
|
| Available liquidity |
4,659 |
|
5,775 |
|
(1) At March 31, 2024 and December 31, 2023, $700 million was available under our securitized receivables program, under which we borrowed $1,184 million in U.S. dollars ($1,605 million in Canadian dollars) and $1,200 million in U.S. dollars ($1,588 million in Canadian dollars) as at March 31, 2024 and December 31, 2023, respectively. Loans secured by receivables are included in Debt due within one year in our consolidated financial statements.
(2) At March 31, 2024 and December 31, 2023, respectively, $2,299 million and $3,303 million were available under our committed bank credit facilities, given outstanding commercial paper of $886 million in U.S. dollars ($1,201 million in Canadian dollars) and $149 million in U.S. dollars ($197 million in Canadian dollars) as at March 31, 2024 and December 31, 2023, respectively. Commercial paper outstanding is included in Debt due within one year in our consolidated financial statements.
Free cash flow and excess free cash flow
The terms free cash flow and excess free cash flow do not have any standardized meaning under IFRS. Therefore, they are unlikely to be comparable to similar measures presented by other issuers.
We define free cash flow as cash flows from operating activities, excluding cash from discontinued operations, acquisition and other costs paid (which include significant litigation costs) and voluntary pension funding, less capital expenditures, preferred share dividends and dividends paid by subsidiaries to NCI. We exclude cash from discontinued operations, acquisition and other costs paid and voluntary pension funding because they affect the comparability of our financial results and could potentially distort the analysis of trends in business performance. Excluding these items does not imply they are non-recurring.
We define excess free cash flow as free cash flow less dividends paid on common shares.
We consider free cash flow and excess free cash flow to be important indicators of the financial strength and performance of our businesses. Free cash flow shows how much cash is available to pay dividends on common shares, repay debt and reinvest in our company. Excess free cash flow shows how much cash is available to repay debt and reinvest in our company, after the payment of dividends on common shares. We believe that certain investors and analysts use free cash flow and excess free cash flow to value a business and its underlying assets and to evaluate the financial strength and performance of our businesses. The most directly comparable IFRS financial measure is cash flows from operating activities.
The following table is a reconciliation of cash flows from operating activities to free cash flow and excess free cash flow on a consolidated basis.
|
|
|
|
|
|
|
|
|
|
|
|
|
|
|
|
Q1 2024 |
Q1 2023 |
|
|
|
|
|
|
| Cash flows from operating activities |
1,132 |
|
1,247 |
|
|
|
|
|
|
|
| Capital expenditures |
(1,002) |
|
(1,086) |
|
|
|
|
|
|
|
| Cash dividends paid on preferred shares |
(46) |
|
(55) |
|
|
|
|
|
|
|
| Cash dividends paid by subsidiaries to NCI |
(14) |
|
(21) |
|
|
|
|
|
|
|
| Acquisition and other costs paid |
15 |
— |
|
|
|
|
|
|
|
|
|
|
|
|
|
|
|
|
| Free cash flow |
85 |
|
85 |
|
|
|
|
|
|
|
| Dividends paid on common shares |
(883) |
|
(839) |
|
|
|
|
|
|
|
| Excess free cash flow |
(798) |
|
(754) |
|
|
|
|
|
|
|
The term net debt does not have any standardized meaning under IFRS. Therefore, it is unlikely to be comparable to similar measures presented by other issuers.
We define net debt as debt due within one year plus long-term debt and 50% of preferred shares, less cash, cash equivalents and short-term investments, as shown in BCE’s consolidated statements of financial position. We include 50% of outstanding preferred shares in our net debt as it is consistent with the treatment by certain credit rating agencies.
We consider net debt to be an important indicator of the company’s financial leverage because it represents the amount of debt that is not covered by available cash, cash equivalents and short-term investments. We believe that certain investors and analysts use net debt to determine a company’s financial leverage.
40 BCE Inc. 2024 FIRST QUARTER SHAREHOLDER REPORT
Net debt is calculated using several asset and liability categories from the statements of financial position. The most directly comparable IFRS financial measure is long-term debt. The following table is a reconciliation of long-term debt to net debt on a consolidated basis.
|
|
|
|
|
|
|
|
|
|
March 31, 2024 |
December 31, 2023 |
| Long-term debt |
31,283 |
|
31,135 |
|
| Debt due within one year |
6,386 |
|
5,042 |
|
| 50% of preferred shares |
1,807 |
|
1,834 |
|
| Cash |
(789) |
|
(547) |
|
| Cash equivalents |
(171) |
|
(225) |
|
| Short-term investments |
(700) |
|
(1,000) |
|
| Net debt |
37,816 |
|
36,239 |
|
A non-GAAP ratio is a financial measure disclosed in the form of a ratio, fraction, percentage or similar representation and that has a non-GAAP financial measure as one or more of its components.
The term adjusted EPS does not have any standardized meaning under IFRS. Therefore, it is unlikely to be comparable to similar measures presented by other issuers.
We define adjusted EPS as adjusted net earnings per BCE common share. Adjusted net earnings is a non-GAAP financial measure. For further details on adjusted net earnings, see section 8.1, Non-GAAP financial measures.
We use adjusted EPS, and we believe that certain investors and analysts use this measure, among other ones, to assess the performance of our businesses without the effects of severance, acquisition and other costs, net mark-to-market losses (gains) on derivatives used to economically hedge equity settled share-based compensation plans, net equity losses (gains) on investments in associates and joint ventures, net losses (gains) on investments, early debt redemption costs, impairment of assets and discontinued operations, net of tax and NCI. We exclude these items because they affect the comparability of our financial results and could potentially distort the analysis of trends in business performance. Excluding these items does not imply they are non-recurring.
Dividend payout ratio
The term dividend payout ratio does not have any standardized meaning under IFRS. Therefore, it is unlikely to be comparable to similar measures presented by other issuers.
We define dividend payout ratio as dividends paid on common shares divided by free cash flow. Free cash flow is a non-GAAP financial measure. For further details on free cash flow, see section 8.1, Non-GAAP financial measures.
We consider dividend payout ratio to be an important indicator of the financial strength and performance of our businesses because it shows the sustainability of the company’s dividend payments.
8.3 Total of segments measures
A total of segments measure is a financial measure that is a subtotal or total of 2 or more reportable segments and is disclosed within the Notes to BCE’s consolidated primary financial statements.
We define adjusted EBITDA as operating revenues less operating costs as shown in BCE’s consolidated income statements.
The most directly comparable IFRS financial measure is net earnings. The following tables provide a reconciliation of net earnings to adjusted EBITDA on a consolidated basis.
|
|
|
|
|
|
|
|
|
|
|
|
|
|
|
|
|
|
|
Q1 2024 |
Q4 2023 |
Q3 2023 |
Q2 2023 |
Q1 2023 |
| Net earnings |
457 |
|
435 |
|
707 |
|
397 |
|
788 |
|
| Severance, acquisition and other costs |
|
229 |
|
|
41 |
|
|
10 |
|
100 |
|
49 |
|
| Depreciation |
|
946 |
|
954 |
|
937 |
|
936 |
|
918 |
|
| Amortization |
|
316 |
|
299 |
|
295 |
|
296 |
|
283 |
|
| Finance costs |
|
|
|
|
|
| Interest expense |
|
416 |
|
399 |
|
373 |
|
359 |
|
344 |
|
| Net return on post-employment benefit plans |
|
(16) |
|
(27) |
|
(27) |
|
(27) |
|
(27) |
|
| Impairment of assets |
|
13 |
|
109 |
|
— |
|
— |
|
34 |
|
| Other expense (income) |
|
38 |
|
147 |
|
129 |
|
311 |
|
(121) |
|
| Income taxes |
166 |
|
210 |
|
243 |
|
273 |
|
270 |
|
|
|
|
|
|
|
|
|
|
|
|
|
|
|
|
|
|
|
| Adjusted EBITDA |
2,565 |
|
2,567 |
|
2,667 |
|
2,645 |
|
2,538 |
|
|
|
|
|
|
|
|
|
|
|
|
|
|
|
|
Q4 2022 |
Q3 2022 |
Q2 2022 |
| Net earnings |
|
567 |
|
771 |
|
654 |
|
| Severance, acquisition and other costs |
|
19 |
|
22 |
|
|
40 |
|
| Depreciation |
|
922 |
|
914 |
|
933 |
|
| Amortization |
|
270 |
|
267 |
|
266 |
|
| Finance costs |
|
|
|
|
| Interest expense |
|
319 |
|
298 |
|
269 |
|
| Net return on post-employment benefit plans |
|
(13) |
|
(13) |
|
(7) |
|
| Impairment of assets |
|
150 |
|
21 |
|
106 |
|
| Other (income) expense |
|
(19) |
|
130 |
|
97 |
|
| Income taxes |
|
222 |
|
178 |
|
232 |
|
|
|
|
|
|
|
|
|
|
|
|
|
|
|
|
| Adjusted EBITDA |
|
2,437 |
|
2,588 |
|
2,590 |
|
8.4 Capital management measures
A capital management measure is a financial measure that is intended to enable a reader to evaluate our objectives, policies and processes for managing our capital and is disclosed within the Notes to BCE’s consolidated financial statements.
The financial reporting framework used to prepare the financial statements requires disclosure that helps readers assess the company’s capital management objectives, policies, and processes, as set out in IFRS in IAS 1 – Presentation of Financial Statements. BCE has its own methods for managing capital and liquidity, and IFRS does not prescribe any particular calculation method.
Net debt leverage ratio
The net debt leverage ratio represents net debt divided by adjusted EBITDA. Net debt used in the calculation of the net debt leverage ratio is a non-GAAP financial measure. For further details on net debt, see section 8.1, Non-GAAP financial measures. For the purposes of calculating our net debt leverage ratio, adjusted EBITDA is twelve-month trailing adjusted EBITDA.
We use, and believe that certain investors and analysts use, the net debt leverage ratio as a measure of financial leverage.
42 BCE Inc. 2024 FIRST QUARTER SHAREHOLDER REPORT
8.5 Supplementary financial measures
A supplementary financial measure is a financial measure that is not reported in BCE’s consolidated financial statements, and is, or is intended to be, reported periodically to represent historical or expected future financial performance, financial position, or cash flows.
An explanation of such measures is provided where they are first referred to in this MD&A if the supplementary financial measures’ labelling is not sufficiently descriptive.
In addition to the non-GAAP financial measures and other financial measures described previously, we use the following KPIs to measure the success of our strategic imperatives. These KPIs are not accounting measures and may not be comparable to similar measures presented by other issuers.
|
|
|
|
|
|
| KPI |
Definition |
| Adjusted EBITDA margin |
Adjusted EBITDA margin is defined as adjusted EBITDA divided by operating revenues. |
| ARPU |
ARPU is defined as Bell CTS wireless external services revenues divided by the average mobile phone subscriber base for the specified period, expressed as a dollar unit per month. |
| Capital intensity |
Capital intensity is defined as capital expenditures divided by operating revenues. |
| Churn |
Mobile phone churn is the rate at which existing mobile phone subscribers cancel their services. It is a measure of our ability to retain our customers. Mobile phone churn is calculated by dividing the number of mobile phone deactivations during a given period by the average number of mobile phone subscribers in the base for the specified period and is expressed as a percentage per month. |
Subscriber unit(1) |
Mobile phone subscriber unit is comprised of a recurring revenue generating portable unit (e.g. smartphones and feature phones) on an active service plan, that has access to our wireless networks and includes voice, text and/or data connectivity. We report mobile phone subscriber units in two categories: postpaid and prepaid. Prepaid mobile phone subscriber units are considered active for a period of 90 days following the expiry of the subscriber’s prepaid balance.
Mobile connected device subscriber unit is comprised of a recurring revenue generating portable unit (e.g. tablets, wearables, mobile Internet devices and IoT) on an active service plan, that has access to our wireless networks and is intended for limited or no cellular voice capability.
Wireline subscriber unit consists of an active revenue-generating unit with access to our services, including retail Internet, IPTV, and/or residential NAS. A subscriber is included in our subscriber base when the service has been installed and is operational at the customer premise and a billing relationship has been established.
• Retail Internet and IPTV subscribers have access to stand-alone services, and are primarily represented by a dwelling unit or a business location
• Retail residential NAS subscribers are based on a line count and are represented by a unique telephone number
|
(1)As of Q1 2024, we are no longer reporting retail satellite TV subscribers as this no longer represents a significant proportion of our revenues. As a result, satellite TV subscribers have been removed from our retail TV subscriber base, and we now report exclusively retail IPTV subscribers.
9 Controls and procedures
Changes in internal control over financial reporting
No changes were made in our internal control over financial reporting during the quarter ended March 31, 2024 that have materially affected, or are reasonably likely to materially affect, our internal control over financial reporting.
44 BCE Inc. 2024 FIRST QUARTER SHAREHOLDER REPORT