00007175382022FYFALSEhttp://fasb.org/us-gaap/2022#AccountingStandardsUpdate201613MemberP3YP1Yhttp://fasb.org/us-gaap/2022#OtherNoninterestExpensehttp://fasb.org/us-gaap/2022#OtherNoninterestExpensehttp://fasb.org/us-gaap/2022#OtherNoninterestExpensehttp://fasb.org/us-gaap/2022#PropertyPlantAndEquipmentAndFinanceLeaseRightOfUseAssetAfterAccumulatedDepreciationAndAmortizationhttp://fasb.org/us-gaap/2022#PropertyPlantAndEquipmentAndFinanceLeaseRightOfUseAssetAfterAccumulatedDepreciationAndAmortizationhttp://fasb.org/us-gaap/2022#OtherAssetshttp://fasb.org/us-gaap/2022#OtherAssetshttp://fasb.org/us-gaap/2022#OtherLiabilitieshttp://fasb.org/us-gaap/2022#OtherLiabilitieshttp://fasb.org/us-gaap/2022#OtherAssetshttp://fasb.org/us-gaap/2022#OtherAssetshttp://fasb.org/us-gaap/2022#OtherLiabilitieshttp://fasb.org/us-gaap/2022#OtherLiabilities00007175382022-01-012022-12-3100007175382022-06-30iso4217:USD00007175382023-06-30xbrli:shares00007175382022-12-3100007175382021-12-31iso4217:USDxbrli:shares00007175382021-01-012021-12-3100007175382020-01-012020-12-310000717538us-gaap:FiduciaryAndTrustMember2022-01-012022-12-310000717538us-gaap:FiduciaryAndTrustMember2021-01-012021-12-310000717538us-gaap:FiduciaryAndTrustMember2020-01-012020-12-310000717538us-gaap:DepositAccountMember2022-01-012022-12-310000717538us-gaap:DepositAccountMember2021-01-012021-12-310000717538us-gaap:DepositAccountMember2020-01-012020-12-3100007175382022-09-23xbrli:pure0000717538us-gaap:CommonStockMember2019-12-310000717538us-gaap:AdditionalPaidInCapitalMember2019-12-310000717538us-gaap:RetainedEarningsMember2019-12-310000717538us-gaap:AccumulatedOtherComprehensiveIncomeMember2019-12-310000717538us-gaap:TreasuryStockCommonMember2019-12-3100007175382019-12-310000717538us-gaap:RetainedEarningsMember2020-01-012020-12-310000717538us-gaap:AccumulatedOtherComprehensiveIncomeMember2020-01-012020-12-3100007175382020-12-310000717538us-gaap:CommonStockMember2020-01-012020-12-310000717538us-gaap:AdditionalPaidInCapitalMember2020-01-012020-12-310000717538us-gaap:TreasuryStockCommonMember2020-01-012020-12-310000717538us-gaap:CommonStockMember2020-12-310000717538us-gaap:AdditionalPaidInCapitalMember2020-12-310000717538us-gaap:RetainedEarningsMember2020-12-310000717538us-gaap:AccumulatedOtherComprehensiveIncomeMember2020-12-310000717538us-gaap:TreasuryStockCommonMember2020-12-310000717538srt:CumulativeEffectPeriodOfAdoptionAdjustmentMemberus-gaap:RetainedEarningsMember2020-12-310000717538srt:CumulativeEffectPeriodOfAdoptionAdjustmentMember2020-12-310000717538us-gaap:CommonStockMembersrt:CumulativeEffectPeriodOfAdoptionAdjustedBalanceMember2020-12-310000717538us-gaap:AdditionalPaidInCapitalMembersrt:CumulativeEffectPeriodOfAdoptionAdjustedBalanceMember2020-12-310000717538us-gaap:RetainedEarningsMembersrt:CumulativeEffectPeriodOfAdoptionAdjustedBalanceMember2020-12-310000717538us-gaap:AccumulatedOtherComprehensiveIncomeMembersrt:CumulativeEffectPeriodOfAdoptionAdjustedBalanceMember2020-12-310000717538us-gaap:TreasuryStockCommonMembersrt:CumulativeEffectPeriodOfAdoptionAdjustedBalanceMember2020-12-310000717538srt:CumulativeEffectPeriodOfAdoptionAdjustedBalanceMember2020-12-310000717538us-gaap:RetainedEarningsMember2021-01-012021-12-310000717538us-gaap:AccumulatedOtherComprehensiveIncomeMember2021-01-012021-12-310000717538us-gaap:CommonStockMember2021-01-012021-12-310000717538us-gaap:AdditionalPaidInCapitalMember2021-01-012021-12-310000717538us-gaap:TreasuryStockCommonMember2021-01-012021-12-310000717538us-gaap:CommonStockMember2021-12-310000717538us-gaap:AdditionalPaidInCapitalMember2021-12-310000717538us-gaap:RetainedEarningsMember2021-12-310000717538us-gaap:AccumulatedOtherComprehensiveIncomeMember2021-12-310000717538us-gaap:TreasuryStockCommonMember2021-12-310000717538us-gaap:RetainedEarningsMember2022-01-012022-12-310000717538us-gaap:AccumulatedOtherComprehensiveIncomeMember2022-01-012022-12-310000717538us-gaap:CommonStockMember2022-01-012022-12-310000717538us-gaap:AdditionalPaidInCapitalMember2022-01-012022-12-310000717538us-gaap:TreasuryStockCommonMember2022-01-012022-12-310000717538us-gaap:CommonStockMember2022-12-310000717538us-gaap:AdditionalPaidInCapitalMember2022-12-310000717538us-gaap:RetainedEarningsMember2022-12-310000717538us-gaap:AccumulatedOtherComprehensiveIncomeMember2022-12-310000717538us-gaap:TreasuryStockCommonMember2022-12-31arow:bankarow:subsidiaryBusinessTrust0000717538srt:MinimumMemberus-gaap:BuildingAndBuildingImprovementsMember2022-01-012022-12-310000717538us-gaap:BuildingAndBuildingImprovementsMembersrt:MaximumMember2022-01-012022-12-310000717538us-gaap:FurnitureAndFixturesMembersrt:MinimumMember2022-01-012022-12-310000717538us-gaap:FurnitureAndFixturesMembersrt:MaximumMember2022-01-012022-12-310000717538srt:MinimumMemberus-gaap:ComputerEquipmentMember2022-01-012022-12-310000717538us-gaap:ComputerEquipmentMembersrt:MaximumMember2022-01-012022-12-31arow:plan0000717538us-gaap:EmployeeStockOptionMember2022-01-012022-12-310000717538us-gaap:RestrictedStockUnitsRSUMember2022-01-012022-12-310000717538us-gaap:USTreasuryAndGovernmentMember2022-12-310000717538us-gaap:USStatesAndPoliticalSubdivisionsMember2022-12-310000717538us-gaap:MortgageBackedSecuritiesMember2022-12-310000717538us-gaap:CorporateDebtSecuritiesMember2022-12-310000717538us-gaap:USTreasuryAndGovernmentMemberus-gaap:FairValueMeasurementsRecurringMember2022-12-310000717538us-gaap:USStatesAndPoliticalSubdivisionsMemberus-gaap:FairValueMeasurementsRecurringMember2022-12-310000717538us-gaap:MortgageBackedSecuritiesMemberus-gaap:FairValueMeasurementsRecurringMember2022-12-310000717538us-gaap:CorporateDebtSecuritiesMemberus-gaap:FairValueMeasurementsRecurringMember2022-12-310000717538us-gaap:CollateralPledgedMember2022-12-31arow:security0000717538us-gaap:AgencySecuritiesMemberus-gaap:USTreasuryAndGovernmentMember2022-12-310000717538us-gaap:USGovernmentAgenciesDebtSecuritiesMemberus-gaap:MortgageBackedSecuritiesMember2022-12-310000717538us-gaap:MortgageBackedSecuritiesMemberus-gaap:USGovernmentSponsoredEnterprisesDebtSecuritiesMember2022-12-310000717538us-gaap:USTreasuryAndGovernmentMember2021-12-310000717538us-gaap:USStatesAndPoliticalSubdivisionsMember2021-12-310000717538us-gaap:MortgageBackedSecuritiesMember2021-12-310000717538us-gaap:CorporateDebtSecuritiesMember2021-12-310000717538us-gaap:CollateralPledgedMember2021-12-310000717538us-gaap:AgencySecuritiesMemberus-gaap:USTreasuryAndGovernmentMember2021-12-310000717538us-gaap:USGovernmentAgenciesDebtSecuritiesMemberus-gaap:MortgageBackedSecuritiesMember2021-12-310000717538us-gaap:MortgageBackedSecuritiesMemberus-gaap:USGovernmentSponsoredEnterprisesDebtSecuritiesMember2021-12-310000717538us-gaap:AgencySecuritiesMemberus-gaap:MortgageBackedSecuritiesMember2022-12-310000717538us-gaap:AgencySecuritiesMemberus-gaap:MortgageBackedSecuritiesMemberus-gaap:FairValueMeasurementsRecurringMember2022-12-310000717538us-gaap:MortgageBackedSecuritiesMemberus-gaap:FairValueMeasurementsRecurringMemberus-gaap:USGovernmentSponsoredEnterprisesDebtSecuritiesMember2022-12-310000717538us-gaap:AgencySecuritiesMemberus-gaap:MortgageBackedSecuritiesMember2021-12-310000717538us-gaap:AgencySecuritiesMemberus-gaap:MortgageBackedSecuritiesMemberus-gaap:FairValueMeasurementsRecurringMember2021-12-310000717538us-gaap:MortgageBackedSecuritiesMemberus-gaap:FairValueMeasurementsRecurringMemberus-gaap:USGovernmentSponsoredEnterprisesDebtSecuritiesMember2021-12-310000717538us-gaap:FinancingReceivables30To59DaysPastDueMemberus-gaap:CommercialLoanMember2022-12-310000717538us-gaap:CommercialRealEstateMemberus-gaap:FinancingReceivables30To59DaysPastDueMember2022-12-310000717538us-gaap:FinancingReceivables30To59DaysPastDueMemberus-gaap:ConsumerPortfolioSegmentMember2022-12-310000717538us-gaap:ResidentialPortfolioSegmentMemberus-gaap:FinancingReceivables30To59DaysPastDueMember2022-12-310000717538us-gaap:FinancingReceivables30To59DaysPastDueMember2022-12-310000717538us-gaap:FinancingReceivables60To89DaysPastDueMemberus-gaap:CommercialLoanMember2022-12-310000717538us-gaap:CommercialRealEstateMemberus-gaap:FinancingReceivables60To89DaysPastDueMember2022-12-310000717538us-gaap:FinancingReceivables60To89DaysPastDueMemberus-gaap:ConsumerPortfolioSegmentMember2022-12-310000717538us-gaap:ResidentialPortfolioSegmentMemberus-gaap:FinancingReceivables60To89DaysPastDueMember2022-12-310000717538us-gaap:FinancingReceivables60To89DaysPastDueMember2022-12-310000717538us-gaap:FinancingReceivablesEqualToGreaterThan90DaysPastDueMemberus-gaap:CommercialLoanMember2022-12-310000717538us-gaap:FinancingReceivablesEqualToGreaterThan90DaysPastDueMemberus-gaap:CommercialRealEstateMember2022-12-310000717538us-gaap:FinancingReceivablesEqualToGreaterThan90DaysPastDueMemberus-gaap:ConsumerPortfolioSegmentMember2022-12-310000717538us-gaap:FinancingReceivablesEqualToGreaterThan90DaysPastDueMemberus-gaap:ResidentialPortfolioSegmentMember2022-12-310000717538us-gaap:FinancingReceivablesEqualToGreaterThan90DaysPastDueMember2022-12-310000717538us-gaap:FinancialAssetPastDueMemberus-gaap:CommercialLoanMember2022-12-310000717538us-gaap:CommercialRealEstateMemberus-gaap:FinancialAssetPastDueMember2022-12-310000717538us-gaap:FinancialAssetPastDueMemberus-gaap:ConsumerPortfolioSegmentMember2022-12-310000717538us-gaap:ResidentialPortfolioSegmentMemberus-gaap:FinancialAssetPastDueMember2022-12-310000717538us-gaap:FinancialAssetPastDueMember2022-12-310000717538us-gaap:FinancialAssetNotPastDueMemberus-gaap:CommercialLoanMember2022-12-310000717538us-gaap:CommercialRealEstateMemberus-gaap:FinancialAssetNotPastDueMember2022-12-310000717538us-gaap:FinancialAssetNotPastDueMemberus-gaap:ConsumerPortfolioSegmentMember2022-12-310000717538us-gaap:FinancialAssetNotPastDueMemberus-gaap:ResidentialPortfolioSegmentMember2022-12-310000717538us-gaap:FinancialAssetNotPastDueMember2022-12-310000717538us-gaap:CommercialLoanMember2022-12-310000717538us-gaap:CommercialRealEstateMember2022-12-310000717538us-gaap:ConsumerPortfolioSegmentMember2022-12-310000717538us-gaap:ResidentialPortfolioSegmentMember2022-12-310000717538us-gaap:FinancingReceivables30To59DaysPastDueMemberus-gaap:CommercialLoanMember2021-12-310000717538us-gaap:CommercialRealEstateMemberus-gaap:FinancingReceivables30To59DaysPastDueMember2021-12-310000717538us-gaap:FinancingReceivables30To59DaysPastDueMemberus-gaap:ConsumerPortfolioSegmentMember2021-12-310000717538us-gaap:ResidentialPortfolioSegmentMemberus-gaap:FinancingReceivables30To59DaysPastDueMember2021-12-310000717538us-gaap:FinancingReceivables30To59DaysPastDueMember2021-12-310000717538us-gaap:FinancingReceivables60To89DaysPastDueMemberus-gaap:CommercialLoanMember2021-12-310000717538us-gaap:CommercialRealEstateMemberus-gaap:FinancingReceivables60To89DaysPastDueMember2021-12-310000717538us-gaap:FinancingReceivables60To89DaysPastDueMemberus-gaap:ConsumerPortfolioSegmentMember2021-12-310000717538us-gaap:ResidentialPortfolioSegmentMemberus-gaap:FinancingReceivables60To89DaysPastDueMember2021-12-310000717538us-gaap:FinancingReceivables60To89DaysPastDueMember2021-12-310000717538us-gaap:FinancingReceivablesEqualToGreaterThan90DaysPastDueMemberus-gaap:CommercialLoanMember2021-12-310000717538us-gaap:FinancingReceivablesEqualToGreaterThan90DaysPastDueMemberus-gaap:CommercialRealEstateMember2021-12-310000717538us-gaap:FinancingReceivablesEqualToGreaterThan90DaysPastDueMemberus-gaap:ConsumerPortfolioSegmentMember2021-12-310000717538us-gaap:FinancingReceivablesEqualToGreaterThan90DaysPastDueMemberus-gaap:ResidentialPortfolioSegmentMember2021-12-310000717538us-gaap:FinancingReceivablesEqualToGreaterThan90DaysPastDueMember2021-12-310000717538us-gaap:FinancialAssetPastDueMemberus-gaap:CommercialLoanMember2021-12-310000717538us-gaap:CommercialRealEstateMemberus-gaap:FinancialAssetPastDueMember2021-12-310000717538us-gaap:FinancialAssetPastDueMemberus-gaap:ConsumerPortfolioSegmentMember2021-12-310000717538us-gaap:ResidentialPortfolioSegmentMemberus-gaap:FinancialAssetPastDueMember2021-12-310000717538us-gaap:FinancialAssetPastDueMember2021-12-310000717538us-gaap:FinancialAssetNotPastDueMemberus-gaap:CommercialLoanMember2021-12-310000717538us-gaap:CommercialRealEstateMemberus-gaap:FinancialAssetNotPastDueMember2021-12-310000717538us-gaap:FinancialAssetNotPastDueMemberus-gaap:ConsumerPortfolioSegmentMember2021-12-310000717538us-gaap:FinancialAssetNotPastDueMemberus-gaap:ResidentialPortfolioSegmentMember2021-12-310000717538us-gaap:FinancialAssetNotPastDueMember2021-12-310000717538us-gaap:CommercialLoanMember2021-12-310000717538us-gaap:CommercialRealEstateMember2021-12-310000717538us-gaap:ConsumerPortfolioSegmentMember2021-12-310000717538us-gaap:ResidentialPortfolioSegmentMember2021-12-310000717538us-gaap:CommercialLoanMember2022-01-012022-12-310000717538us-gaap:CommercialRealEstateMember2022-01-012022-12-310000717538us-gaap:ConsumerPortfolioSegmentMember2022-01-012022-12-310000717538us-gaap:ResidentialPortfolioSegmentMember2022-01-012022-12-31arow:loan_portfolio0000717538srt:MinimumMemberus-gaap:AutomobileLoanMemberus-gaap:ConsumerPortfolioSegmentMember2022-01-012022-12-310000717538us-gaap:AutomobileLoanMemberus-gaap:ConsumerPortfolioSegmentMembersrt:MaximumMember2022-01-012022-12-310000717538srt:MinimumMemberus-gaap:CreditCardReceivablesMemberus-gaap:ConsumerPortfolioSegmentMember2022-01-012022-12-310000717538us-gaap:CreditCardReceivablesMemberus-gaap:ConsumerPortfolioSegmentMembersrt:MaximumMember2022-01-012022-12-310000717538us-gaap:CommercialLoanMember2020-12-310000717538us-gaap:CommercialRealEstateMember2020-12-310000717538us-gaap:ConsumerPortfolioSegmentMember2020-12-310000717538us-gaap:ResidentialPortfolioSegmentMember2020-12-310000717538srt:CumulativeEffectPeriodOfAdoptionAdjustmentMemberus-gaap:CommercialLoanMember2020-12-310000717538us-gaap:CommercialRealEstateMembersrt:CumulativeEffectPeriodOfAdoptionAdjustmentMember2020-12-310000717538srt:CumulativeEffectPeriodOfAdoptionAdjustmentMemberus-gaap:ConsumerPortfolioSegmentMember2020-12-310000717538us-gaap:ResidentialPortfolioSegmentMembersrt:CumulativeEffectPeriodOfAdoptionAdjustmentMember2020-12-310000717538us-gaap:CommercialLoanMembersrt:CumulativeEffectPeriodOfAdoptionAdjustedBalanceMember2020-12-310000717538us-gaap:CommercialRealEstateMembersrt:CumulativeEffectPeriodOfAdoptionAdjustedBalanceMember2020-12-310000717538us-gaap:ConsumerPortfolioSegmentMembersrt:CumulativeEffectPeriodOfAdoptionAdjustedBalanceMember2020-12-310000717538us-gaap:ResidentialPortfolioSegmentMembersrt:CumulativeEffectPeriodOfAdoptionAdjustedBalanceMember2020-12-310000717538us-gaap:CommercialLoanMember2021-01-012021-12-310000717538us-gaap:CommercialRealEstateMember2021-01-012021-12-310000717538us-gaap:ConsumerPortfolioSegmentMember2021-01-012021-12-310000717538us-gaap:ResidentialPortfolioSegmentMember2021-01-012021-12-31arow:loan0000717538us-gaap:ResidentialRealEstateMemberus-gaap:CommercialPortfolioSegmentMember2022-12-310000717538us-gaap:CommercialPortfolioSegmentMemberus-gaap:CommercialRealEstateMember2022-12-310000717538us-gaap:RealEstateMemberus-gaap:CommercialPortfolioSegmentMember2022-12-310000717538us-gaap:CommercialRealEstatePortfolioSegmentMemberus-gaap:ResidentialRealEstateMember2022-12-310000717538us-gaap:CommercialRealEstatePortfolioSegmentMemberus-gaap:CommercialRealEstateMember2022-12-310000717538us-gaap:CommercialRealEstatePortfolioSegmentMemberus-gaap:RealEstateMember2022-12-310000717538us-gaap:ResidentialRealEstateMemberus-gaap:ConsumerPortfolioSegmentMember2022-12-310000717538us-gaap:ConsumerPortfolioSegmentMemberus-gaap:CommercialRealEstateMember2022-12-310000717538us-gaap:RealEstateMemberus-gaap:ConsumerPortfolioSegmentMember2022-12-310000717538us-gaap:ResidentialPortfolioSegmentMemberus-gaap:ResidentialRealEstateMember2022-12-310000717538us-gaap:ResidentialPortfolioSegmentMemberus-gaap:CommercialRealEstateMember2022-12-310000717538us-gaap:ResidentialPortfolioSegmentMemberus-gaap:RealEstateMember2022-12-310000717538us-gaap:ResidentialRealEstateMember2022-12-310000717538us-gaap:CommercialRealEstateMember2022-12-310000717538us-gaap:RealEstateMember2022-12-310000717538us-gaap:ResidentialRealEstateMemberus-gaap:CommercialPortfolioSegmentMember2021-12-310000717538us-gaap:CommercialPortfolioSegmentMemberus-gaap:CommercialRealEstateMember2021-12-310000717538us-gaap:RealEstateMemberus-gaap:CommercialPortfolioSegmentMember2021-12-310000717538us-gaap:CommercialRealEstatePortfolioSegmentMemberus-gaap:ResidentialRealEstateMember2021-12-310000717538us-gaap:CommercialRealEstatePortfolioSegmentMemberus-gaap:CommercialRealEstateMember2021-12-310000717538us-gaap:CommercialRealEstatePortfolioSegmentMemberus-gaap:RealEstateMember2021-12-310000717538us-gaap:ResidentialRealEstateMemberus-gaap:ConsumerPortfolioSegmentMember2021-12-310000717538us-gaap:ConsumerPortfolioSegmentMemberus-gaap:CommercialRealEstateMember2021-12-310000717538us-gaap:RealEstateMemberus-gaap:ConsumerPortfolioSegmentMember2021-12-310000717538us-gaap:ResidentialPortfolioSegmentMemberus-gaap:ResidentialRealEstateMember2021-12-310000717538us-gaap:ResidentialPortfolioSegmentMemberus-gaap:CommercialRealEstateMember2021-12-310000717538us-gaap:ResidentialPortfolioSegmentMemberus-gaap:RealEstateMember2021-12-310000717538us-gaap:ResidentialRealEstateMember2021-12-310000717538us-gaap:CommercialRealEstateMember2021-12-310000717538us-gaap:RealEstateMember2021-12-310000717538us-gaap:PassMemberus-gaap:CommercialPortfolioSegmentMember2022-12-310000717538us-gaap:SpecialMentionMemberus-gaap:CommercialPortfolioSegmentMember2022-12-310000717538us-gaap:CommercialPortfolioSegmentMemberus-gaap:SubstandardMember2022-12-310000717538us-gaap:DoubtfulMemberus-gaap:CommercialPortfolioSegmentMember2022-12-310000717538us-gaap:CommercialPortfolioSegmentMember2022-12-310000717538us-gaap:CommercialRealEstatePortfolioSegmentMemberus-gaap:PassMember2022-12-310000717538us-gaap:CommercialRealEstatePortfolioSegmentMemberus-gaap:SpecialMentionMember2022-12-310000717538us-gaap:CommercialRealEstatePortfolioSegmentMemberus-gaap:SubstandardMember2022-12-310000717538us-gaap:DoubtfulMemberus-gaap:CommercialRealEstatePortfolioSegmentMember2022-12-310000717538us-gaap:CommercialRealEstatePortfolioSegmentMember2022-12-310000717538us-gaap:PerformingFinancingReceivableMemberus-gaap:ConsumerPortfolioSegmentMember2022-12-310000717538us-gaap:NonperformingFinancingReceivableMemberus-gaap:ConsumerPortfolioSegmentMember2022-12-310000717538us-gaap:ResidentialPortfolioSegmentMemberus-gaap:PerformingFinancingReceivableMember2022-12-310000717538us-gaap:ResidentialPortfolioSegmentMemberus-gaap:NonperformingFinancingReceivableMember2022-12-310000717538us-gaap:PassMemberus-gaap:CommercialPortfolioSegmentMember2021-12-310000717538us-gaap:SpecialMentionMemberus-gaap:CommercialPortfolioSegmentMember2021-12-310000717538us-gaap:CommercialPortfolioSegmentMemberus-gaap:SubstandardMember2021-12-310000717538us-gaap:DoubtfulMemberus-gaap:CommercialPortfolioSegmentMember2021-12-310000717538us-gaap:CommercialPortfolioSegmentMember2021-12-310000717538us-gaap:CommercialRealEstatePortfolioSegmentMemberus-gaap:PassMember2021-12-310000717538us-gaap:CommercialRealEstatePortfolioSegmentMemberus-gaap:SpecialMentionMember2021-12-310000717538us-gaap:CommercialRealEstatePortfolioSegmentMemberus-gaap:SubstandardMember2021-12-310000717538us-gaap:DoubtfulMemberus-gaap:CommercialRealEstatePortfolioSegmentMember2021-12-310000717538us-gaap:CommercialRealEstatePortfolioSegmentMember2021-12-310000717538us-gaap:PerformingFinancingReceivableMemberus-gaap:ConsumerPortfolioSegmentMember2021-12-310000717538us-gaap:NonperformingFinancingReceivableMemberus-gaap:ConsumerPortfolioSegmentMember2021-12-310000717538us-gaap:ResidentialPortfolioSegmentMemberus-gaap:PerformingFinancingReceivableMember2021-12-310000717538us-gaap:ResidentialPortfolioSegmentMemberus-gaap:NonperformingFinancingReceivableMember2021-12-310000717538us-gaap:CommercialPortfolioSegmentMember2022-01-012022-12-310000717538us-gaap:CommercialRealEstatePortfolioSegmentMember2022-01-012022-12-31arow:contract0000717538us-gaap:CommercialPortfolioSegmentMember2021-01-012021-12-310000717538us-gaap:CommercialRealEstatePortfolioSegmentMember2021-01-012021-12-310000717538us-gaap:LandBuildingsAndImprovementsMember2022-12-310000717538us-gaap:LandBuildingsAndImprovementsMember2021-12-310000717538us-gaap:FurnitureAndFixturesMember2022-12-310000717538us-gaap:FurnitureAndFixturesMember2021-12-310000717538us-gaap:LeaseholdImprovementsMember2022-12-310000717538us-gaap:LeaseholdImprovementsMember2021-12-310000717538us-gaap:CoreDepositsMember2022-12-310000717538us-gaap:ServicingContractsMember2022-12-310000717538us-gaap:CustomerListsMember2022-12-310000717538us-gaap:CoreDepositsMember2021-12-310000717538us-gaap:ServicingContractsMember2021-12-310000717538us-gaap:CustomerListsMember2021-12-310000717538us-gaap:CoreDepositsMember2019-12-310000717538us-gaap:ServicingContractsMember2019-12-310000717538us-gaap:CustomerListsMember2019-12-310000717538us-gaap:CoreDepositsMember2020-01-012020-12-310000717538us-gaap:ServicingContractsMember2020-01-012020-12-310000717538us-gaap:CustomerListsMember2020-01-012020-12-310000717538us-gaap:CoreDepositsMember2020-12-310000717538us-gaap:ServicingContractsMember2020-12-310000717538us-gaap:CustomerListsMember2020-12-310000717538us-gaap:CoreDepositsMember2021-01-012021-12-310000717538us-gaap:ServicingContractsMember2021-01-012021-12-310000717538us-gaap:CustomerListsMember2021-01-012021-12-310000717538us-gaap:CoreDepositsMember2022-01-012022-12-310000717538us-gaap:ServicingContractsMember2022-01-012022-12-310000717538us-gaap:CustomerListsMember2022-01-012022-12-310000717538us-gaap:CommitmentsToExtendCreditMember2022-12-310000717538us-gaap:CommitmentsToExtendCreditMember2021-12-310000717538us-gaap:StandbyLettersOfCreditMember2022-12-310000717538us-gaap:StandbyLettersOfCreditMember2021-12-310000717538srt:MinimumMemberus-gaap:StandbyLettersOfCreditMember2022-12-310000717538us-gaap:StandbyLettersOfCreditMembersrt:MaximumMember2022-12-3100007175382022-10-012022-12-310000717538us-gaap:FederalFundsPurchasedMember2022-12-310000717538us-gaap:FederalFundsPurchasedMember2021-12-310000717538us-gaap:FederalReserveBankAdvancesMember2022-12-310000717538us-gaap:FederalReserveBankAdvancesMember2021-12-310000717538us-gaap:FederalHomeLoanBankAdvancesMember2022-12-310000717538us-gaap:FederalHomeLoanBankAdvancesMember2021-12-310000717538srt:FederalHomeLoanBankOfNewYorkMember2022-12-31arow:class0000717538arow:AcstIiMemberarow:JuniorSubordinatedDebtPreferredSecuritiesMemberus-gaap:LondonInterbankOfferedRateLIBORMember2022-01-012022-12-310000717538arow:SecuredOvernightFinancingRateSOFRMemberarow:AcstIiMemberarow:JuniorSubordinatedDebtPreferredSecuritiesMember2022-01-012022-12-310000717538arow:AcstIiiMemberus-gaap:LondonInterbankOfferedRateLIBORMember2022-01-012022-12-310000717538arow:AcstIiiMemberarow:SecuredOvernightFinancingRateSOFRMember2022-01-012022-12-310000717538us-gaap:InterestRateSwapMember2022-12-310000717538us-gaap:JuniorSubordinatedDebtMemberarow:AcstIiMember2022-12-310000717538us-gaap:JuniorSubordinatedDebtMemberarow:AcstIiMember2021-12-310000717538arow:AcstIiiMemberus-gaap:JuniorSubordinatedDebtMember2022-12-310000717538arow:AcstIiiMemberus-gaap:JuniorSubordinatedDebtMember2021-12-310000717538us-gaap:AccumulatedNetUnrealizedInvestmentGainLossMember2022-01-012022-12-310000717538us-gaap:AccumulatedGainLossNetCashFlowHedgeParentMember2022-01-012022-12-310000717538us-gaap:AccumulatedDefinedBenefitPlansAdjustmentNetUnamortizedGainLossMember2022-01-012022-12-310000717538us-gaap:AccumulatedDefinedBenefitPlansAdjustmentNetTransitionAssetObligationMember2022-01-012022-12-310000717538us-gaap:AccumulatedDefinedBenefitPlansAdjustmentNetPriorServiceCostCreditMember2022-01-012022-12-310000717538us-gaap:AccumulatedNetUnrealizedInvestmentGainLossMember2021-01-012021-12-310000717538us-gaap:AccumulatedGainLossNetCashFlowHedgeParentMember2021-01-012021-12-310000717538us-gaap:AccumulatedDefinedBenefitPlansAdjustmentNetUnamortizedGainLossMember2021-01-012021-12-310000717538us-gaap:AccumulatedDefinedBenefitPlansAdjustmentNetPriorServiceCostCreditMember2021-01-012021-12-310000717538us-gaap:AccumulatedNetUnrealizedInvestmentGainLossMember2020-01-012020-12-310000717538us-gaap:AociGainLossDebtSecuritiesAvailableForSaleWithAllowanceForCreditLossParentMember2020-01-012020-12-310000717538us-gaap:AccumulatedGainLossNetCashFlowHedgeParentMember2020-01-012020-12-310000717538us-gaap:AccumulatedDefinedBenefitPlansAdjustmentNetUnamortizedGainLossMember2020-01-012020-12-310000717538us-gaap:AccumulatedDefinedBenefitPlansAdjustmentNetPriorServiceCostCreditMember2020-01-012020-12-310000717538us-gaap:AccumulatedNetUnrealizedInvestmentGainLossMember2021-12-310000717538us-gaap:AccumulatedGainLossNetCashFlowHedgeParentMember2021-12-310000717538us-gaap:AccumulatedDefinedBenefitPlansAdjustmentNetUnamortizedGainLossMember2021-12-310000717538us-gaap:AccumulatedDefinedBenefitPlansAdjustmentNetPriorServiceCostCreditMember2021-12-310000717538us-gaap:AccumulatedNetUnrealizedInvestmentGainLossMember2022-12-310000717538us-gaap:AccumulatedGainLossNetCashFlowHedgeParentMember2022-12-310000717538us-gaap:AccumulatedDefinedBenefitPlansAdjustmentNetUnamortizedGainLossMember2022-12-310000717538us-gaap:AccumulatedDefinedBenefitPlansAdjustmentNetPriorServiceCostCreditMember2022-12-310000717538us-gaap:AccumulatedNetUnrealizedInvestmentGainLossMember2020-12-310000717538us-gaap:AccumulatedGainLossNetCashFlowHedgeParentMember2020-12-310000717538us-gaap:AccumulatedDefinedBenefitPlansAdjustmentNetUnamortizedGainLossMember2020-12-310000717538us-gaap:AccumulatedDefinedBenefitPlansAdjustmentNetPriorServiceCostCreditMember2020-12-310000717538us-gaap:AccumulatedNetUnrealizedInvestmentGainLossMember2019-12-310000717538us-gaap:AccumulatedGainLossNetCashFlowHedgeParentMember2019-12-310000717538us-gaap:AccumulatedDefinedBenefitPlansAdjustmentNetUnamortizedGainLossMember2019-12-310000717538us-gaap:AccumulatedDefinedBenefitPlansAdjustmentNetPriorServiceCostCreditMember2019-12-310000717538us-gaap:ReclassificationOutOfAccumulatedOtherComprehensiveIncomeMemberus-gaap:AccumulatedGainLossNetCashFlowHedgeParentMember2022-01-012022-12-310000717538us-gaap:AccumulatedDefinedBenefitPlansAdjustmentNetPriorServiceCostCreditMemberus-gaap:ReclassificationOutOfAccumulatedOtherComprehensiveIncomeMember2022-01-012022-12-310000717538us-gaap:ReclassificationOutOfAccumulatedOtherComprehensiveIncomeMemberus-gaap:AccumulatedDefinedBenefitPlansAdjustmentNetUnamortizedGainLossMember2022-01-012022-12-310000717538us-gaap:ReclassificationOutOfAccumulatedOtherComprehensiveIncomeMemberus-gaap:AccumulatedDefinedBenefitPlansAdjustmentMember2022-01-012022-12-310000717538us-gaap:ReclassificationOutOfAccumulatedOtherComprehensiveIncomeMemberus-gaap:AccumulatedGainLossNetCashFlowHedgeParentMember2021-01-012021-12-310000717538us-gaap:AccumulatedDefinedBenefitPlansAdjustmentNetPriorServiceCostCreditMemberus-gaap:ReclassificationOutOfAccumulatedOtherComprehensiveIncomeMember2021-01-012021-12-310000717538us-gaap:ReclassificationOutOfAccumulatedOtherComprehensiveIncomeMemberus-gaap:AccumulatedDefinedBenefitPlansAdjustmentNetUnamortizedGainLossMember2021-01-012021-12-310000717538us-gaap:ReclassificationOutOfAccumulatedOtherComprehensiveIncomeMemberus-gaap:AccumulatedDefinedBenefitPlansAdjustmentMember2021-01-012021-12-310000717538us-gaap:ReclassificationOutOfAccumulatedOtherComprehensiveIncomeMemberus-gaap:AccumulatedNetUnrealizedInvestmentGainLossMember2020-01-012020-12-310000717538us-gaap:AccumulatedDefinedBenefitPlansAdjustmentNetPriorServiceCostCreditMemberus-gaap:ReclassificationOutOfAccumulatedOtherComprehensiveIncomeMember2020-01-012020-12-310000717538us-gaap:ReclassificationOutOfAccumulatedOtherComprehensiveIncomeMemberus-gaap:AccumulatedDefinedBenefitPlansAdjustmentNetUnamortizedGainLossMember2020-01-012020-12-310000717538us-gaap:ReclassificationOutOfAccumulatedOtherComprehensiveIncomeMemberus-gaap:AccumulatedDefinedBenefitPlansAdjustmentMember2020-01-012020-12-310000717538us-gaap:ReclassificationOutOfAccumulatedOtherComprehensiveIncomeMember2020-01-012020-12-310000717538srt:MinimumMemberarow:ExercisePriceRange1Member2022-12-310000717538arow:ExercisePriceRange2Member2022-12-310000717538srt:MinimumMemberarow:ExercisePriceRange3Member2022-12-310000717538arow:ExercisePriceRange3Membersrt:MaximumMember2022-12-310000717538arow:ExercisePriceRange4Member2022-12-310000717538srt:MinimumMemberarow:ExercisePriceRange5Member2022-12-310000717538arow:ExercisePriceRange5Membersrt:MaximumMember2022-12-310000717538arow:ExercisePriceRange6Membersrt:MinimumMember2022-12-310000717538arow:ExercisePriceRange6Membersrt:MaximumMember2022-12-310000717538arow:ExercisePriceRange7Member2022-12-310000717538arow:ExercisePriceRange1Member2022-12-310000717538arow:ExercisePriceRange3Member2022-12-310000717538arow:ExercisePriceRange5Member2022-12-310000717538arow:ExercisePriceRange6Member2022-12-310000717538arow:ExercisePriceRange1Member2022-01-012022-12-310000717538arow:ExercisePriceRange2Member2022-01-012022-12-310000717538arow:ExercisePriceRange3Member2022-01-012022-12-310000717538arow:ExercisePriceRange4Member2022-01-012022-12-310000717538arow:ExercisePriceRange5Member2022-01-012022-12-310000717538arow:ExercisePriceRange6Member2022-01-012022-12-310000717538arow:ExercisePriceRange7Member2022-01-012022-12-310000717538us-gaap:RestrictedStockUnitsRSUMember2021-12-310000717538us-gaap:RestrictedStockUnitsRSUMember2022-12-310000717538us-gaap:RestrictedStockUnitsRSUMember2020-12-310000717538us-gaap:RestrictedStockUnitsRSUMember2021-01-012021-12-310000717538us-gaap:RestrictedStockUnitsRSUMember2019-12-310000717538us-gaap:RestrictedStockUnitsRSUMember2020-01-012020-12-310000717538us-gaap:EmployeeStockMember2022-01-012022-12-310000717538arow:SubsequenttoJanuary12003Member2022-01-012022-12-310000717538arow:PriortoJanuary12003Membersrt:MinimumMember2022-01-012022-12-310000717538arow:PriortoJanuary12003Membersrt:MaximumMember2022-01-012022-12-310000717538us-gaap:PensionPlansDefinedBenefitMember2022-12-310000717538us-gaap:SupplementalEmployeeRetirementPlanDefinedBenefitMember2022-12-310000717538us-gaap:OtherPostretirementBenefitPlansDefinedBenefitMember2022-12-310000717538us-gaap:PensionPlansDefinedBenefitMember2022-01-012022-12-310000717538us-gaap:SupplementalEmployeeRetirementPlanDefinedBenefitMember2022-01-012022-12-310000717538us-gaap:PensionPlansDefinedBenefitMember2021-12-310000717538us-gaap:SupplementalEmployeeRetirementPlanDefinedBenefitMember2021-12-310000717538us-gaap:OtherPostretirementBenefitPlansDefinedBenefitMember2021-12-310000717538us-gaap:OtherPostretirementBenefitPlansDefinedBenefitMember2022-01-012022-12-310000717538us-gaap:PensionPlansDefinedBenefitMember2020-12-310000717538us-gaap:SupplementalEmployeeRetirementPlanDefinedBenefitMember2020-12-310000717538us-gaap:OtherPostretirementBenefitPlansDefinedBenefitMember2020-12-310000717538us-gaap:PensionPlansDefinedBenefitMember2021-01-012021-12-310000717538us-gaap:SupplementalEmployeeRetirementPlanDefinedBenefitMember2021-01-012021-12-310000717538us-gaap:OtherPostretirementBenefitPlansDefinedBenefitMember2021-01-012021-12-310000717538us-gaap:PensionPlansDefinedBenefitMember2020-01-012020-12-310000717538us-gaap:SupplementalEmployeeRetirementPlanDefinedBenefitMember2020-01-012020-12-310000717538us-gaap:OtherPostretirementBenefitPlansDefinedBenefitMember2020-01-012020-12-310000717538us-gaap:DefinedBenefitPlanCashMemberus-gaap:FairValueInputsLevel1Member2022-12-310000717538us-gaap:DefinedBenefitPlanCashMemberus-gaap:FairValueInputsLevel2Member2022-12-310000717538us-gaap:DefinedBenefitPlanCashMemberus-gaap:FairValueInputsLevel3Member2022-12-310000717538us-gaap:DefinedBenefitPlanCashMember2022-12-310000717538srt:MinimumMemberus-gaap:DefinedBenefitPlanCashMember2022-12-310000717538us-gaap:DefinedBenefitPlanCashMembersrt:MaximumMember2022-12-310000717538us-gaap:FairValueInputsLevel1Memberus-gaap:MoneyMarketFundsMember2022-12-310000717538us-gaap:FairValueInputsLevel2Memberus-gaap:MoneyMarketFundsMember2022-12-310000717538us-gaap:FairValueInputsLevel3Memberus-gaap:MoneyMarketFundsMember2022-12-310000717538us-gaap:MoneyMarketFundsMember2022-12-310000717538srt:MinimumMemberus-gaap:MoneyMarketFundsMember2022-12-310000717538us-gaap:MoneyMarketFundsMembersrt:MaximumMember2022-12-310000717538us-gaap:CommonStockMemberus-gaap:FairValueInputsLevel1Member2022-12-310000717538us-gaap:CommonStockMemberus-gaap:FairValueInputsLevel2Member2022-12-310000717538us-gaap:CommonStockMemberus-gaap:FairValueInputsLevel3Member2022-12-310000717538us-gaap:CommonStockMember2022-12-310000717538srt:MinimumMemberus-gaap:CommonStockMember2022-12-310000717538us-gaap:CommonStockMembersrt:MaximumMember2022-12-310000717538us-gaap:FairValueInputsLevel1Memberarow:NorthCountryFundsEquityMember2022-12-310000717538us-gaap:FairValueInputsLevel2Memberarow:NorthCountryFundsEquityMember2022-12-310000717538us-gaap:FairValueInputsLevel3Memberarow:NorthCountryFundsEquityMember2022-12-310000717538arow:NorthCountryFundsEquityMember2022-12-310000717538srt:MinimumMemberarow:NorthCountryFundsEquityMember2022-12-310000717538arow:NorthCountryFundsEquityMembersrt:MaximumMember2022-12-310000717538us-gaap:FairValueInputsLevel1Memberarow:OtherMutualFundsEquityMember2022-12-310000717538us-gaap:FairValueInputsLevel2Memberarow:OtherMutualFundsEquityMember2022-12-310000717538us-gaap:FairValueInputsLevel3Memberarow:OtherMutualFundsEquityMember2022-12-310000717538arow:OtherMutualFundsEquityMember2022-12-310000717538srt:MinimumMemberarow:OtherMutualFundsEquityMember2022-12-310000717538arow:OtherMutualFundsEquityMembersrt:MaximumMember2022-12-310000717538us-gaap:FairValueInputsLevel1Memberus-gaap:EquityFundsMember2022-12-310000717538us-gaap:FairValueInputsLevel2Memberus-gaap:EquityFundsMember2022-12-310000717538us-gaap:FairValueInputsLevel3Memberus-gaap:EquityFundsMember2022-12-310000717538us-gaap:EquityFundsMember2022-12-310000717538srt:MinimumMemberus-gaap:EquityFundsMember2022-12-310000717538us-gaap:EquityFundsMembersrt:MaximumMember2022-12-310000717538us-gaap:FairValueInputsLevel1Memberarow:OtherMutualFundsFixedIncomeMember2022-12-310000717538us-gaap:FairValueInputsLevel2Memberarow:OtherMutualFundsFixedIncomeMember2022-12-310000717538us-gaap:FairValueInputsLevel3Memberarow:OtherMutualFundsFixedIncomeMember2022-12-310000717538arow:OtherMutualFundsFixedIncomeMember2022-12-310000717538srt:MinimumMemberarow:OtherMutualFundsFixedIncomeMember2022-12-310000717538arow:OtherMutualFundsFixedIncomeMembersrt:MaximumMember2022-12-310000717538us-gaap:FixedIncomeFundsMemberus-gaap:FairValueInputsLevel1Member2022-12-310000717538us-gaap:FixedIncomeFundsMemberus-gaap:FairValueInputsLevel2Member2022-12-310000717538us-gaap:FixedIncomeFundsMemberus-gaap:FairValueInputsLevel3Member2022-12-310000717538us-gaap:FixedIncomeFundsMember2022-12-310000717538us-gaap:FixedIncomeFundsMembersrt:MinimumMember2022-12-310000717538us-gaap:FixedIncomeFundsMembersrt:MaximumMember2022-12-310000717538us-gaap:FairValueInputsLevel1Memberus-gaap:ExchangeTradedFundsMember2022-12-310000717538us-gaap:FairValueInputsLevel2Memberus-gaap:ExchangeTradedFundsMember2022-12-310000717538us-gaap:FairValueInputsLevel3Memberus-gaap:ExchangeTradedFundsMember2022-12-310000717538us-gaap:ExchangeTradedFundsMember2022-12-310000717538srt:MinimumMemberus-gaap:ExchangeTradedFundsMember2022-12-310000717538us-gaap:ExchangeTradedFundsMembersrt:MaximumMember2022-12-310000717538us-gaap:FairValueInputsLevel1Member2022-12-310000717538us-gaap:FairValueInputsLevel2Member2022-12-310000717538us-gaap:FairValueInputsLevel3Member2022-12-310000717538us-gaap:DefinedBenefitPlanCashMemberus-gaap:FairValueInputsLevel1Member2021-12-310000717538us-gaap:DefinedBenefitPlanCashMemberus-gaap:FairValueInputsLevel2Member2021-12-310000717538us-gaap:DefinedBenefitPlanCashMemberus-gaap:FairValueInputsLevel3Member2021-12-310000717538us-gaap:DefinedBenefitPlanCashMember2021-12-310000717538srt:MinimumMemberus-gaap:DefinedBenefitPlanCashMember2021-12-310000717538us-gaap:DefinedBenefitPlanCashMembersrt:MaximumMember2021-12-310000717538us-gaap:FairValueInputsLevel1Memberus-gaap:MoneyMarketFundsMember2021-12-310000717538us-gaap:FairValueInputsLevel2Memberus-gaap:MoneyMarketFundsMember2021-12-310000717538us-gaap:FairValueInputsLevel3Memberus-gaap:MoneyMarketFundsMember2021-12-310000717538us-gaap:MoneyMarketFundsMember2021-12-310000717538srt:MinimumMemberus-gaap:MoneyMarketFundsMember2021-12-310000717538us-gaap:MoneyMarketFundsMembersrt:MaximumMember2021-12-310000717538us-gaap:CommonStockMemberus-gaap:FairValueInputsLevel1Member2021-12-310000717538us-gaap:CommonStockMemberus-gaap:FairValueInputsLevel2Member2021-12-310000717538us-gaap:CommonStockMemberus-gaap:FairValueInputsLevel3Member2021-12-310000717538us-gaap:CommonStockMember2021-12-310000717538srt:MinimumMemberus-gaap:CommonStockMember2021-12-310000717538us-gaap:CommonStockMembersrt:MaximumMember2021-12-310000717538us-gaap:FairValueInputsLevel1Memberarow:NorthCountryFundsEquityMember2021-12-310000717538us-gaap:FairValueInputsLevel2Memberarow:NorthCountryFundsEquityMember2021-12-310000717538us-gaap:FairValueInputsLevel3Memberarow:NorthCountryFundsEquityMember2021-12-310000717538arow:NorthCountryFundsEquityMember2021-12-310000717538srt:MinimumMemberarow:NorthCountryFundsEquityMember2021-12-310000717538arow:NorthCountryFundsEquityMembersrt:MaximumMember2021-12-310000717538us-gaap:FairValueInputsLevel1Memberarow:OtherMutualFundsEquityMember2021-12-310000717538us-gaap:FairValueInputsLevel2Memberarow:OtherMutualFundsEquityMember2021-12-310000717538us-gaap:FairValueInputsLevel3Memberarow:OtherMutualFundsEquityMember2021-12-310000717538arow:OtherMutualFundsEquityMember2021-12-310000717538srt:MinimumMemberarow:OtherMutualFundsEquityMember2021-12-310000717538arow:OtherMutualFundsEquityMembersrt:MaximumMember2021-12-310000717538us-gaap:FairValueInputsLevel1Memberus-gaap:EquityFundsMember2021-12-310000717538us-gaap:FairValueInputsLevel2Memberus-gaap:EquityFundsMember2021-12-310000717538us-gaap:FairValueInputsLevel3Memberus-gaap:EquityFundsMember2021-12-310000717538us-gaap:EquityFundsMember2021-12-310000717538srt:MinimumMemberus-gaap:EquityFundsMember2021-12-310000717538us-gaap:EquityFundsMembersrt:MaximumMember2021-12-310000717538us-gaap:FairValueInputsLevel1Memberarow:NorthCountryFundsFixedIncomeMember2021-12-310000717538us-gaap:FairValueInputsLevel2Memberarow:NorthCountryFundsFixedIncomeMember2021-12-310000717538us-gaap:FairValueInputsLevel3Memberarow:NorthCountryFundsFixedIncomeMember2021-12-310000717538arow:NorthCountryFundsFixedIncomeMember2021-12-310000717538srt:MinimumMemberarow:NorthCountryFundsFixedIncomeMember2021-12-310000717538arow:NorthCountryFundsFixedIncomeMembersrt:MaximumMember2021-12-310000717538us-gaap:FairValueInputsLevel1Memberarow:OtherMutualFundsFixedIncomeMember2021-12-310000717538us-gaap:FairValueInputsLevel2Memberarow:OtherMutualFundsFixedIncomeMember2021-12-310000717538us-gaap:FairValueInputsLevel3Memberarow:OtherMutualFundsFixedIncomeMember2021-12-310000717538arow:OtherMutualFundsFixedIncomeMember2021-12-310000717538srt:MinimumMemberarow:OtherMutualFundsFixedIncomeMember2021-12-310000717538arow:OtherMutualFundsFixedIncomeMembersrt:MaximumMember2021-12-310000717538us-gaap:FixedIncomeFundsMemberus-gaap:FairValueInputsLevel1Member2021-12-310000717538us-gaap:FixedIncomeFundsMemberus-gaap:FairValueInputsLevel2Member2021-12-310000717538us-gaap:FixedIncomeFundsMemberus-gaap:FairValueInputsLevel3Member2021-12-310000717538us-gaap:FixedIncomeFundsMember2021-12-310000717538us-gaap:FixedIncomeFundsMembersrt:MinimumMember2021-12-310000717538us-gaap:FixedIncomeFundsMembersrt:MaximumMember2021-12-310000717538us-gaap:FairValueInputsLevel1Memberus-gaap:ExchangeTradedFundsMember2021-12-310000717538us-gaap:FairValueInputsLevel2Memberus-gaap:ExchangeTradedFundsMember2021-12-310000717538us-gaap:FairValueInputsLevel3Memberus-gaap:ExchangeTradedFundsMember2021-12-310000717538us-gaap:ExchangeTradedFundsMember2021-12-310000717538srt:MinimumMemberus-gaap:ExchangeTradedFundsMember2021-12-310000717538us-gaap:ExchangeTradedFundsMembersrt:MaximumMember2021-12-310000717538us-gaap:FairValueInputsLevel1Member2021-12-310000717538us-gaap:FairValueInputsLevel2Member2021-12-310000717538us-gaap:FairValueInputsLevel3Member2021-12-310000717538us-gaap:FairValueInputsLevel1Memberus-gaap:USTreasuryAndGovernmentMemberus-gaap:FairValueMeasurementsRecurringMember2022-12-310000717538us-gaap:FairValueInputsLevel2Memberus-gaap:USTreasuryAndGovernmentMemberus-gaap:FairValueMeasurementsRecurringMember2022-12-310000717538us-gaap:FairValueInputsLevel3Memberus-gaap:USTreasuryAndGovernmentMemberus-gaap:FairValueMeasurementsRecurringMember2022-12-310000717538us-gaap:FairValueInputsLevel1Memberus-gaap:USStatesAndPoliticalSubdivisionsMemberus-gaap:FairValueMeasurementsRecurringMember2022-12-310000717538us-gaap:FairValueInputsLevel2Memberus-gaap:USStatesAndPoliticalSubdivisionsMemberus-gaap:FairValueMeasurementsRecurringMember2022-12-310000717538us-gaap:FairValueInputsLevel3Memberus-gaap:USStatesAndPoliticalSubdivisionsMemberus-gaap:FairValueMeasurementsRecurringMember2022-12-310000717538us-gaap:FairValueInputsLevel1Memberus-gaap:MortgageBackedSecuritiesMemberus-gaap:FairValueMeasurementsRecurringMember2022-12-310000717538us-gaap:FairValueInputsLevel2Memberus-gaap:MortgageBackedSecuritiesMemberus-gaap:FairValueMeasurementsRecurringMember2022-12-310000717538us-gaap:FairValueInputsLevel3Memberus-gaap:MortgageBackedSecuritiesMemberus-gaap:FairValueMeasurementsRecurringMember2022-12-310000717538us-gaap:FairValueInputsLevel1Memberus-gaap:CorporateDebtSecuritiesMemberus-gaap:FairValueMeasurementsRecurringMember2022-12-310000717538us-gaap:FairValueInputsLevel2Memberus-gaap:CorporateDebtSecuritiesMemberus-gaap:FairValueMeasurementsRecurringMember2022-12-310000717538us-gaap:FairValueInputsLevel3Memberus-gaap:CorporateDebtSecuritiesMemberus-gaap:FairValueMeasurementsRecurringMember2022-12-310000717538us-gaap:FairValueMeasurementsRecurringMember2022-12-310000717538us-gaap:FairValueInputsLevel1Memberus-gaap:FairValueMeasurementsRecurringMember2022-12-310000717538us-gaap:FairValueInputsLevel2Memberus-gaap:FairValueMeasurementsRecurringMember2022-12-310000717538us-gaap:FairValueInputsLevel3Memberus-gaap:FairValueMeasurementsRecurringMember2022-12-310000717538us-gaap:USTreasuryAndGovernmentMemberus-gaap:FairValueMeasurementsRecurringMember2021-12-310000717538us-gaap:FairValueInputsLevel1Memberus-gaap:USTreasuryAndGovernmentMemberus-gaap:FairValueMeasurementsRecurringMember2021-12-310000717538us-gaap:FairValueInputsLevel2Memberus-gaap:USTreasuryAndGovernmentMemberus-gaap:FairValueMeasurementsRecurringMember2021-12-310000717538us-gaap:FairValueInputsLevel3Memberus-gaap:USTreasuryAndGovernmentMemberus-gaap:FairValueMeasurementsRecurringMember2021-12-310000717538us-gaap:USStatesAndPoliticalSubdivisionsMemberus-gaap:FairValueMeasurementsRecurringMember2021-12-310000717538us-gaap:FairValueInputsLevel1Memberus-gaap:USStatesAndPoliticalSubdivisionsMemberus-gaap:FairValueMeasurementsRecurringMember2021-12-310000717538us-gaap:FairValueInputsLevel2Memberus-gaap:USStatesAndPoliticalSubdivisionsMemberus-gaap:FairValueMeasurementsRecurringMember2021-12-310000717538us-gaap:FairValueInputsLevel3Memberus-gaap:USStatesAndPoliticalSubdivisionsMemberus-gaap:FairValueMeasurementsRecurringMember2021-12-310000717538us-gaap:MortgageBackedSecuritiesMemberus-gaap:FairValueMeasurementsRecurringMember2021-12-310000717538us-gaap:FairValueInputsLevel1Memberus-gaap:MortgageBackedSecuritiesMemberus-gaap:FairValueMeasurementsRecurringMember2021-12-310000717538us-gaap:FairValueInputsLevel2Memberus-gaap:MortgageBackedSecuritiesMemberus-gaap:FairValueMeasurementsRecurringMember2021-12-310000717538us-gaap:FairValueInputsLevel3Memberus-gaap:MortgageBackedSecuritiesMemberus-gaap:FairValueMeasurementsRecurringMember2021-12-310000717538us-gaap:CorporateDebtSecuritiesMemberus-gaap:FairValueMeasurementsRecurringMember2021-12-310000717538us-gaap:FairValueInputsLevel1Memberus-gaap:CorporateDebtSecuritiesMemberus-gaap:FairValueMeasurementsRecurringMember2021-12-310000717538us-gaap:FairValueInputsLevel2Memberus-gaap:CorporateDebtSecuritiesMemberus-gaap:FairValueMeasurementsRecurringMember2021-12-310000717538us-gaap:FairValueInputsLevel3Memberus-gaap:CorporateDebtSecuritiesMemberus-gaap:FairValueMeasurementsRecurringMember2021-12-310000717538us-gaap:FairValueMeasurementsRecurringMember2021-12-310000717538us-gaap:FairValueInputsLevel1Memberus-gaap:FairValueMeasurementsRecurringMember2021-12-310000717538us-gaap:FairValueInputsLevel2Memberus-gaap:FairValueMeasurementsRecurringMember2021-12-310000717538us-gaap:FairValueInputsLevel3Memberus-gaap:FairValueMeasurementsRecurringMember2021-12-310000717538us-gaap:FairValueMeasurementsNonrecurringMember2022-12-310000717538us-gaap:FairValueInputsLevel1Memberus-gaap:FairValueMeasurementsNonrecurringMember2022-12-310000717538us-gaap:FairValueInputsLevel2Memberus-gaap:FairValueMeasurementsNonrecurringMember2022-12-310000717538us-gaap:FairValueInputsLevel3Memberus-gaap:FairValueMeasurementsNonrecurringMember2022-12-310000717538us-gaap:FairValueMeasurementsNonrecurringMember2021-12-310000717538us-gaap:FairValueInputsLevel1Memberus-gaap:FairValueMeasurementsNonrecurringMember2021-12-310000717538us-gaap:FairValueInputsLevel2Memberus-gaap:FairValueMeasurementsNonrecurringMember2021-12-310000717538us-gaap:FairValueInputsLevel3Memberus-gaap:FairValueMeasurementsNonrecurringMember2021-12-310000717538us-gaap:CarryingReportedAmountFairValueDisclosureMember2022-12-310000717538us-gaap:EstimateOfFairValueFairValueDisclosureMember2022-12-310000717538us-gaap:FairValueInputsLevel1Memberus-gaap:EstimateOfFairValueFairValueDisclosureMember2022-12-310000717538us-gaap:FairValueInputsLevel2Memberus-gaap:EstimateOfFairValueFairValueDisclosureMember2022-12-310000717538us-gaap:FairValueInputsLevel3Memberus-gaap:EstimateOfFairValueFairValueDisclosureMember2022-12-310000717538us-gaap:CarryingReportedAmountFairValueDisclosureMember2021-12-310000717538us-gaap:EstimateOfFairValueFairValueDisclosureMember2021-12-310000717538us-gaap:FairValueInputsLevel1Memberus-gaap:EstimateOfFairValueFairValueDisclosureMember2021-12-310000717538us-gaap:FairValueInputsLevel2Memberus-gaap:EstimateOfFairValueFairValueDisclosureMember2021-12-310000717538us-gaap:FairValueInputsLevel3Memberus-gaap:EstimateOfFairValueFairValueDisclosureMember2021-12-31arow:office00007175382021-10-012021-12-310000717538us-gaap:NondesignatedMemberus-gaap:InterestRateSwapMember2022-12-310000717538us-gaap:NondesignatedMemberus-gaap:InterestRateSwapMember2021-12-310000717538us-gaap:InterestRateSwapMember2022-01-012022-12-310000717538us-gaap:InterestRateSwapMember2021-01-012021-12-310000717538srt:ParentCompanyMember2022-12-310000717538arow:GlensFallsNationalBankMember2022-12-310000717538arow:SaratogaNationalBankMember2022-12-310000717538srt:ParentCompanyMember2021-12-310000717538arow:GlensFallsNationalBankMember2021-12-310000717538arow:SaratogaNationalBankMember2021-12-310000717538srt:ParentCompanyMember2022-01-012022-12-310000717538srt:ParentCompanyMember2021-01-012021-12-310000717538srt:ParentCompanyMember2020-01-012020-12-310000717538srt:ParentCompanyMember2020-12-310000717538srt:ParentCompanyMember2019-12-310000717538arow:ConstructionServicesMembersrt:DirectorMember2022-01-012022-12-31
UNITED STATES
SECURITIES AND EXCHANGE COMMISSION
Washington, D.C. 20549
FORM 10-K
☒ Annual Report Pursuant to Section 13 or 15(d) of
The Securities Exchange Act of 1934
For the Fiscal Year Ended December 31, 2022
☐ Transition Report Pursuant to Section 13 or 15(d)
of The Securities Exchange Act of 1934
Commission File Number: 0-12507
ARROW FINANCIAL CORPORATION
(Exact name of registrant as specified in its charter)
|
|
|
|
|
|
| New York |
22-2448962 |
| (State or other jurisdiction of incorporation or organization) |
(I.R.S. Employer Identification No.) |
|
|
|
|
|
|
|
|
|
|
|
|
|
|
|
| 250 Glen Street, |
Glens Falls |
New York |
12801 |
| (Address of principal executive offices) |
(Zip Code) |
|
|
|
|
|
| Registrant’s telephone number, including area code: |
518 |
745-1000 |
Securities registered pursuant to Section 12(b) of the Act:
|
|
|
|
|
|
|
|
|
| Title of Each Class |
Trading Symbol |
Name of Each Exchange on Which Registered |
|
|
|
Common Stock, Par Value $1.00 per share
|
AROW |
NASDAQ Global Select Market |
|
|
|
Indicate by check mark if the registrant is a well-known seasoned issuer, as defined in Rule 405 of the Securities Act. ☐ Yes ☒ No
Indicate by check mark if the registrant is not required to file reports pursuant to Section 13 or Section 15(d) of the Act. ☐ Yes ☒ No
Indicate by check mark whether the registrant (1) has filed all reports required to be filed by Section 13 or 15(d) of the Securities Exchange Act of 1934 during the preceding 12 months (or for such shorter period that the registrant was required to file such reports), and (2) has been subject to such filing requirements for the past 90 days. ☐ Yes ☒ No
Indicate by check mark whether the registrant has submitted electronically every Interactive Data File required to be submitted pursuant to Rule 405 of Regulation S-T (§ 232.405 of this chapter) during the preceding 12 months (or for such shorter period that the registrant was required to submit such files). ☒ Yes ☐ No
Indicate by check mark whether the registrant is a large accelerated filer, an accelerated filer, a non-accelerated filer, or a smaller reporting company. See the definitions of “large accelerated filer,” “accelerated filer” and “smaller reporting company” in Rule 12b-2 of the Exchange Act.
|
|
|
|
|
|
|
|
|
|
|
|
| Large accelerated filer |
☐ |
Accelerated filer |
☒ |
| Non-accelerated filer |
☐ |
Smaller reporting company |
☐ |
|
|
Emerging growth company |
☐ |
| If an emerging growth company, indicate by check mark if the registrant has elected not to use the extended transition period for complying with any new or revised financial accounting standards provided pursuant to Section 13(a) of the Exchange Act. |
☐ |
| Indicate by a check mark whether the registrant has filed a report on and attestation to its management's assessment of the effectiveness of its internal control over financial reporting under Section 404(b) of the Sarbanes-Oxley Act (15 U.S.C. 7562(b)) by the registered public accounting firm that prepared or issued its audit report. |
☒ |
| If securities are registered pursuant to Section 12(b) of the Act, indicate by check mark whether the financial statements of the registrant included in the filing reflect the correction of an error to previously issued financial statements. |
☐ |
| Indicate by check mark whether any of those error corrections are restatements that required a recovery analysis of incentive-based compensation received by any of the registrant’s executive officers during the relevant recovery period pursuant to §240.10D-1(b). |
☐ |
| Indicate by check mark whether the registrant is a shell company (as defined in Rule 12b-2 of the Act). |
☐ |
State the aggregate market value of the voting and non-voting common equity held by non-affiliates computed by reference to the price at which the common equity was last sold, or the average bid and asked price of such common equity, as of the last business day of the registrant’s most recently completed second fiscal quarter: $508,555,420
Indicate the number of shares outstanding of each of the registrant’s classes of common stock, as of the latest practicable date.
|
|
|
|
|
|
|
|
|
| Class |
|
Outstanding as of June 30, 2023 |
| Common Stock, par value $1.00 per share |
|
16,553,058 |
DOCUMENTS INCORPORATED BY REFERENCE
N/A
Auditor Name: KPMG LLP Auditor Location: Albany, New York Auditor Firm ID: 185
ARROW FINANCIAL CORPORATION
FORM 10-K
TABLE OF CONTENTS
|
|
|
|
|
|
|
Page |
| Note on Terminology |
3 |
|
| The Company and Its Subsidiaries |
3 |
|
| Forward-Looking Statements |
3 |
|
| Use of Non-GAAP Financial Measures |
4 |
|
| PART I |
|
|
|
|
|
|
|
|
|
|
|
|
|
| PART II |
|
|
|
|
|
|
|
|
|
|
|
|
|
|
|
|
|
|
|
|
| PART III |
|
|
|
|
|
|
|
|
|
|
|
| PART IV |
|
|
|
|
|
|
|
|
|
|
|
|
|
NOTE ON TERMINOLOGY
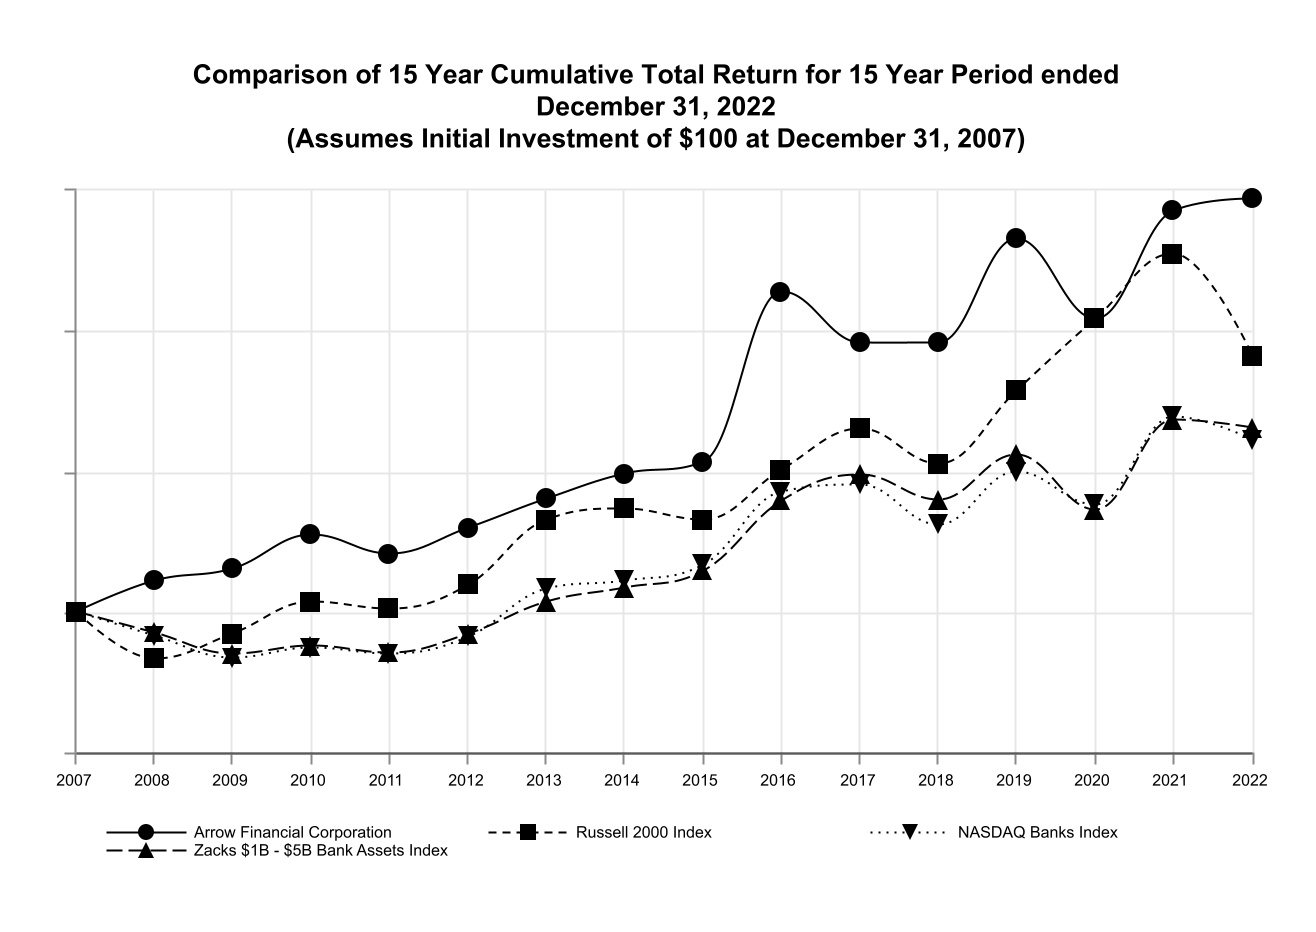
In this Annual Report on Form 10-K, the terms “Arrow,” “the registrant,” “the Company,” “we,” “us,” and “our,” generally refer to Arrow Financial Corporation and subsidiaries as a group, except where the context indicates otherwise. At certain points in this Report, our performance is compared with that of our “peer group” of financial institutions. Unless otherwise specifically stated, this peer group is comprised of the group of 165 domestic (U.S.-based) bank holding companies with $3 to $10 billion in total consolidated assets as identified in the Federal Reserve Board’s most recent “Bank Holding Company Performance Report” (which is the Performance Report for the most recently available period ending September 30, 2022), and peer group data has been derived from such Report. This peer group is not, however, identical to either of the peer groups comprising the two bank indices included in the stock performance graphs on pages 21 and 22 of this Report.
THE COMPANY AND ITS SUBSIDIARIES
Arrow is a two-bank holding company headquartered in Glens Falls, New York. The banking subsidiaries are Glens Falls National Bank and Trust Company (Glens Falls National or GFNB) whose main office is located in Glens Falls, New York, and Saratoga National Bank and Trust Company (Saratoga National or SNB) whose main office is located in Saratoga Springs, New York. Active subsidiaries of Glens Falls National include Upstate Agency, LLC (an insurance agency that sells property and casualty insurance and also specializes in selling and servicing group health care policies and life insurance), North Country Investment Advisers, Inc. (a registered investment adviser that provides investment advice to Arrow's proprietary mutual fund) and Arrow Properties, Inc. (a real estate investment trust, or REIT). Arrow also owns directly two subsidiary business trusts, organized in 2003 and 2004 to issue trust preferred securities (TRUPs), which are still outstanding.
FORWARD-LOOKING STATEMENTS
The information contained in this Annual Report on Form 10-K contains statements that are not historical in nature but rather are based on our beliefs, assumptions, expectations, estimates and projections about the future. These statements are “forward-looking statements” within the meaning of Section 21E of the Securities Exchange Act of 1934, as amended (the "Exchange Act"), and involve a degree of uncertainty and attendant risk. Words such as “expects,” “believes,” “anticipates,” “estimates” and variations of such words and similar expressions often identify such forward-looking statements. Some of these statements, such as those included in the interest rate sensitivity analysis in Item 7A of this Report, entitled “Quantitative and Qualitative Disclosures About Market Risk,” are merely presentations of what future performance or changes in future performance would look like based on hypothetical assumptions and on simulation models. Other forward-looking statements are based on our general perceptions of market conditions and trends in activity, both locally and nationally, as well as current management strategies for future operations and development.
These forward-looking statements may not be exhaustive, are not guarantees of future performance and involve certain risks and uncertainties that are difficult to quantify or, in some cases, to identify. You should not place undue reliance on any such forward-looking statements. In the case of all forward-looking statements, actual outcomes and results may differ materially from what the statements predict or forecast. Factors that could cause or contribute to such differences include, but are not limited to the following:
•continued period of high inflation could adversely impact our business and our customers;
•other rapid and dramatic changes in economic and market conditions;
•sharp fluctuations in interest rates, economic activity, or consumer spending patterns;
•sudden changes in the market for products the Company provides, such as real estate or automobile loans;
•significant changes in banking or other laws and regulations, including both enactment of new legal or regulatory measures (e.g., the Economic Growth, Regulatory Relief, and Consumer Protection Act ("Economic Growth Act"), the Tax Cuts and Jobs Act of 2017 ("Tax Act") and the Dodd-Frank Wall Street Reform and Consumer Protection Act ("Dodd-Frank")) or the modification or elimination of pre-existing measures;
•significant changes in U.S. monetary or fiscal policy, including new or revised monetary programs or targets adopted or announced by the Federal Reserve ("monetary tightening or easing") or significant new federal legislation materially affecting the federal budget ("fiscal tightening or expansion");
•the COVID-19 pandemic and its impact on economic, market and social conditions, or other health emergencies, either of which may amplify certain of the other listed factors;
•competition from other sources (e.g., non-bank entities);
•similar uncertainties inherent in banking operations or business generally, including technological developments and changes;
•our ability to remediate the material weaknesses we have identified in our internal control over financial reporting and resolve litigation and other claims related to or arising out of the identified material weaknesses;
•the continuity, timing and effectiveness of the recent transition in executive management; and
•other risks detailed from time to time within our filings with the Securities and Exchange Commission ("SEC").
The Company is under no duty to update any of the forward-looking statements after the date of this Annual Report on Form 10-K to conform such statements to actual results. All forward-looking statements, express or implied, included in this Report and the documents incorporated by reference and that are attributable to the Company are expressly qualified in their entirety by this cautionary statement. This cautionary statement should also be considered in connection with any subsequent written or oral forward-looking statements that the Company or any persons acting on our behalf may issue.
USE OF NON-GAAP FINANCIAL MEASURES
The SEC has adopted Regulation G, which applies to all public disclosures, including earnings releases, made by registered companies that contain “non-GAAP financial measures.” GAAP is generally accepted accounting principles in the United States of America. Under Regulation G, companies making public disclosures containing non-GAAP financial measures must also disclose, along with each non-GAAP financial measure, certain additional information, including a reconciliation of the non-GAAP financial measure to the closest comparable GAAP financial measure and a statement of the Company’s reasons for utilizing the non-GAAP financial measure as part of its financial disclosures. The SEC has exempted from the definition of “non-GAAP financial measures” certain commonly used financial measures that are not based on GAAP. When these exempted measures are included in public disclosures, supplemental information is not required. The following measures used in this Report, which are commonly utilized by financial institutions, have not been specifically exempted by the SEC and may constitute "non-GAAP financial measures" within the meaning of the SEC's rules, although the Company is unable to state with certainty that the SEC would so regard them.
Tax-Equivalent Net Interest Income and Net Interest Margin: Net interest income, as a component of the tabular presentation by financial institutions of Selected Financial Information regarding their recently completed operations, as well as disclosures based on that tabular presentation, is commonly presented on a tax-equivalent basis. That is, to the extent that some component of the institution's net interest income, which is presented on a before-tax basis, is exempt from taxation (e.g., is received by the institution as a result of its holdings of state or municipal obligations), an amount equal to the tax benefit derived from that component is added to the actual before-tax net interest income total. This adjustment is considered helpful in comparing one financial institution's net interest income to that of another institution or in analyzing any institution’s net interest income trend line over time, to correct any analytical distortion that might otherwise arise from the fact that financial institutions vary widely in the proportions of their portfolios that are invested in tax-exempt securities, and from the fact that even a single institution may significantly alter over time the proportion of its own portfolio that is invested in tax-exempt obligations. Moreover, net interest income is itself a component of a second financial measure commonly used by financial institutions, net interest margin, which is the ratio of net interest income to average earning assets. For purposes of this measure as well, tax-equivalent net interest income is generally used by financial institutions, again to provide a better basis of comparison from institution to institution and to better demonstrate a single institution’s performance over time. The Company follows these practices.
The Efficiency Ratio: Financial institutions often use an "efficiency ratio" as a measure of expense control. The efficiency ratio typically is defined as the ratio of noninterest expense to net interest income and noninterest income. Net interest income as utilized in calculating the efficiency ratio is typically the same as the net interest income presented in Selected Financial Information table discussed in the preceding paragraph, i.e., it is expressed on a tax-equivalent basis. Moreover, many financial institutions, in calculating the efficiency ratio, also adjust both noninterest expense and noninterest income to exclude from these items (as calculated under GAAP) certain recurring component elements of income and expense, such as intangible asset amortization (which is included in noninterest expense under GAAP but may not be included therein for purposes of calculating the efficiency ratio) and securities gains or losses (which are reflected in the calculation of noninterest income under GAAP but may be ignored for purposes of calculating the efficiency ratio). The Company makes these adjustments.
Tangible Book Value per Share: Tangible equity is total stockholders’ equity less intangible assets. Tangible book value per share is tangible equity divided by total shares issued and outstanding. Tangible book value per share is often regarded as a more meaningful comparative ratio than book value per share as calculated under GAAP, that is, total stockholders’ equity including intangible assets divided by total shares issued and outstanding. Intangible assets include many items, but in our case, essentially represents goodwill.
Adjustments for Certain Items of Income or Expense: In addition to our regular utilization in our public filings and disclosures of the various non-GAAP measures commonly utilized by financial institutions discussed above, we also may elect from time to time, in connection with our presentation of various financial measures prepared in accordance with GAAP, such as net income, earnings per share (i.e., EPS), return on average assets (i.e., ROA), and return on average equity (i.e., ROE), to additionally provide certain comparative disclosures that adjust these GAAP financial measures, typically by removing therefrom the impact of certain transactions or other material items of income or expense that are unusual or unlikely to be repeated. The Company does so only if it believes that inclusion of the resulting non-GAAP financial measures may improve the average investor's understanding of Arrow's results of operations by separating out items that have a disproportional positive or negative impact on the particular period in question or by otherwise permitting a better comparison from period-to-period in the results of operations with respect to the Company's fundamental lines of business, including the commercial banking business.
The Company believes that the non-GAAP financial measures disclosed from time-to-time are useful in evaluating Arrow's performance and that such information should be considered as supplemental in nature, and not as a substitute for or superior to, the related financial information prepared in accordance with GAAP. Arrow's non-GAAP financial measures may differ from similar measures presented by other companies.
PART I
Item 1. Business
A. GENERAL
The holding company, Arrow Financial Corporation, a New York corporation, was incorporated on March 21, 1983 and is registered as a bank holding company within the meaning of the Bank Holding Company Act of 1956. Arrow owns two nationally-chartered banks in New York (Glens Falls National and Saratoga National), and through such banks indirectly owns various non-bank subsidiaries, including an insurance agency, a registered investment adviser and a REIT. See "The Company and Its Subsidiaries," above.
|
|
|
|
|
|
|
|
|
|
|
|
Subsidiary Banks (dollars in thousands and data is as of December. 31, 2022) |
|
|
|
|
Glens Falls National |
|
Saratoga National |
| Total Assets at Year-End |
$ |
3,125,180 |
|
|
$ |
895,584 |
|
Trust Assets Under Administration and
Investment Management at Year-End
(Not Included in Total Assets) |
$ |
1,486,327 |
|
|
$ |
119,805 |
|
| Date Organized |
1851 |
|
1988 |
| Employees (full-time equivalent) |
454 |
|
|
48 |
|
| Offices |
26 |
|
|
11 |
|
| Counties of Operation |
Warren, Washington,
Saratoga, Essex &
Clinton |
|
Saratoga, Albany,
Rensselaer, & Schenectady |
| Main Office |
250 Glen Street
Glens Falls, NY |
|
171 So. Broadway
Saratoga Springs, NY |
The holding company’s business consists primarily of the ownership, supervision and control of Arrow's two banks, including the banks' subsidiaries. The holding company provides various advisory and administrative services and coordinates the general policies and operation of the banks. There were 502 full-time equivalent employees, including 34 employees within Arrow's insurance agency subsidiary, at December 31, 2022. See the discussion of our human capital resources in Section G ("HUMAN CAPITAL") of this Item 1.
Arrow offers a broad range of commercial and consumer banking and financial products. The deposit base consists of deposits derived principally from the communities served. The Company targets lending activities to consumers and small- and mid-sized companies in Arrow's regional geographic area. In addition, through an indirect lending program Arrow acquires consumer loans from an extensive network of automobile dealers that operate in New York and Vermont. Through the banks' trust operations, the Company provides retirement planning, trust and estate administration services for individuals, and pension, profit-sharing and employee benefit plan administration for corporations.
B. LENDING ACTIVITIES
Arrow engages in a wide range of lending activities, including commercial and industrial lending primarily to small and mid-sized companies; mortgage lending for residential and commercial properties; and consumer installment and home equity financing. An active indirect lending program is maintained through Arrow's sponsorship of automobile dealer programs under which consumer auto loans, primarily from dealers that meet pre-established specifications are purchased. From time to time, a portion of the Arrow's residential real estate loan originations are sold into the secondary market, primarily to the Federal Home Loan Mortgage Corporation ("Freddie Mac") and other governmental agencies. Normally, the Company retains the servicing rights on mortgage loans originated and sold into the secondary markets, subject to periodic determinations on the continuing profitability of such activity.
Generally, Arrow continues to implement lending strategies and policies that are intended to protect the quality of the loan portfolio, including strong underwriting and collateral control procedures and credit review systems. Loans are placed on nonaccrual status either due to the delinquency status of principal and/or interest or a judgment by management that the full repayment of principal and interest is unlikely. Home equity lines of credit, secured by real property, are systematically placed on nonaccrual status when 120 days past due, and residential real estate loans are placed on nonaccrual status when 150 days past due. Commercial and commercial real estate loans are evaluated on a loan-by-loan basis and are placed on nonaccrual status when 90 days past due if the full collection of principal and interest is uncertain (See Part II, Item 7.C.II.c. "Risk Elements") Subsequent cash payments on loans classified as nonaccrual may be applied entirely to principal, although income in some cases may be recognized on a cash basis.
Arrow lends primarily to borrowers within the normal retail service area in northeastern New York State, with the exception of the indirect consumer lending line of business, where Arrow acquires retail paper from an extensive network of automobile dealers that operate in a larger area of New York and Vermont. The loan portfolio does not include any foreign loans or any other significant risk concentrations. Arrow does not generally participate in loan syndications, either as originator or as a participant. However, from time to time, Arrow buys and offers participations in individual loans, typically commercial loans, in New York and adjacent states. In recent periods, the total dollar amount of such participations has fluctuated, but generally represents less than 20% of commercial loans outstanding. The majority of the portfolio is properly collateralized, and most commercial loans are further supported by personal guarantees. Arrow also participated as a lender in the Paycheck Protection Program ("PPP") administered by the Small Business Administration ("SBA") under the Coronavirus Aid, Relief, and Economic Security Act (the "CARES Act").
Arrow originated over $91.5 million in loans under the PPP in 2021 and approximately $234.2 million over the life of the PPP program. As of December 31, 2022, there were no PPP loans outstanding. See the discussion of the CARES Act in Section D ("RECENT LEGISLATIVE DEVELOPMENTS") of this Item 1.
Arrow does not engage in subprime mortgage lending as a business line and does not extend or purchase so-called "Alt A," "negative amortization," "option ARM's" or "negative equity" mortgage loans.
C. SUPERVISION AND REGULATION
The following generally describes the laws and regulations to which Arrow is subject. Bank holding companies, banks and their affiliates are extensively regulated under both federal and state law. To the extent that the following information summarizes statutory or regulatory law, it is qualified in its entirety by reference to the particular provisions of the various statutes and regulations. Any change in applicable law may have a material effect on business operations, customers, prospects and investors.
Bank Regulatory Authorities with Jurisdiction over Arrow and its Subsidiary Banks
Arrow is a registered bank holding company within the meaning of the Bank Holding Company Act of 1956 ("BHC Act") and as such is subject to regulation by the Board of Governors of the Federal Reserve System ("FRB"). As a "bank holding company" under New York State law, Arrow is also subject to regulation by the New York State Department of Financial Services. Arrow's two subsidiary banks are both national banks and are subject to supervision and examination by the Office of the Comptroller of the Currency ("OCC"). The banks are members of the Federal Reserve System and the deposits of each bank are insured by the Deposit Insurance Fund of the Federal Deposit Insurance Corporation ("FDIC"). The BHC Act generally prohibits Arrow from engaging, directly or indirectly, in activities other than banking, activities closely related to banking, and certain other financial activities. Under the BHC Act, a bank holding company generally must obtain FRB approval before acquiring, directly or indirectly, voting shares of another bank or bank holding company, if after the acquisition the acquiror would own 5 percent or more of a class of the voting shares of that other bank or bank holding company. Bank holding companies are able to acquire banks or other bank holding companies located in all 50 states, subject to certain limitations. Bank holdings companies that meet certain qualifications may choose to apply to the FRB for designation as “financial holding companies.” Upon receipt of such designation, a financial holding company may engage in a broader array of activities, such as insurance underwriting, securities underwriting and merchant banking. Arrow has not attempted to become, and has not been designated as, a financial holding company.
The FRB and the OCC have broad regulatory, examination and enforcement authority. The FRB and the OCC conduct regular examinations of the entities they regulate. In addition, banking organizations are subject to requirements for periodic reporting to the regulatory authorities. The FRB and OCC have the authority to implement various remedies if they determine that the financial condition, capital, asset quality, management, earnings, liquidity or other aspects of a banking organization's operations are unsatisfactory or if they determine the banking organization is violating or has violated any law or regulation. The authority of the federal bank regulators over banking organizations includes, but is not limited to, prohibiting unsafe or unsound practices; requiring affirmative action to correct a violation or unsafe or unsound practice; issuing administrative orders; requiring the organization to increase capital; requiring the organization to sell subsidiaries or other assets; restricting dividends, distributions and repurchases of the organization's stock; restricting the growth of the organization; assessing civil money penalties; removing officers and directors; and terminating deposit insurance. The FDIC may terminate a depository institution's deposit insurance upon a finding that the institution's financial condition is unsafe or unsound or that the institution has engaged in unsafe or unsound practices for certain other reasons.
Regulatory Supervision of Other Arrow Subsidiaries
The insurance agency subsidiary of Glens Falls National is subject to the licensing and other provisions of New York State Insurance Law and is regulated by the New York State Department of Financial Services. Arrow's investment adviser subsidiary is subject to the licensing and other provisions of the federal Investment Advisers Act of 1940 and is regulated by the SEC.
Regulation of Transactions between Banks and their Affiliates
Transactions between banks and their "affiliates" are regulated by Sections 23A and 23B of the Federal Reserve Act (FRA). Each of Arrow's non-bank subsidiaries (other than the business trusts formed to issue the TRUPs) is a subsidiary of one of the subsidiary banks, and also is an "operating subsidiary" under Sections 23A and 23B. This means each non-bank subsidiary is considered to be part of the bank that owns it and thus is not an affiliate of that bank for purposes of Section 23A and 23B. However, each of the two banks is an affiliate of the other bank, under Section 23A, and Arrow, the holding company, is also an affiliate of each bank under both Sections 23A and 23B. Extensions of credit that a bank may make to affiliates, or to third parties secured by securities or obligations of the affiliates, are substantially limited by the FRA and the Federal Deposit Insurance Act (FDIA). Such acts further restrict the range of permissible transactions between a bank and any affiliate, including a bank affiliate. Furthermore, under the FRA, a bank may engage in certain transactions, including loans and purchases of assets, with a non-bank affiliate, only if certain special conditions, including collateral requirements for loans, are met and if the other terms and conditions of the transaction, including interest rates and credit standards, are substantially the same as, or at least as favorable to the bank as, those prevailing at the time for comparable transactions by the bank with non-affiliated companies or, in the absence of comparable transactions, on terms and conditions that would be offered by the bank to non-affiliated companies.
Regulatory Capital Standards
An important area of banking regulation is the federal banking system's promulgation and enforcement of minimum capitalization standards for banks and bank holding companies.
Bank Capital Rules. In July 2013, federal bank regulators, including the FRB and the OCC, approved revised bank capital rules aimed at implementing capital requirements pursuant to Dodd-Frank. These rules were also intended to coordinate U.S. bank capital standards with the then-current drafts of the Basel III proposed bank capital standards for all of the developed world's banking organizations. The federal regulators' revised capital rules (the "Capital Rules"), which impose significantly higher minimum capital ratios on U.S. financial institutions than the rules they replaced, became effective for Arrow and its subsidiary banks on January 1, 2015, and were fully phased in by the end of 2019.
In 2020, federal bank regulators introduced an optional simplified measure of capital adequacy for qualifying community banking organizations (CBLR). A qualifying community banking organization that opts into the CBLR framework and meets all the requirements under the CBLR framework will be considered to have met the well-capitalized ratio requirements under the “prompt corrective action” regulations and will not be required to report or calculate risk-based capital ratios.
The CBLR final rule became effective as of January 1, 2020, and Arrow and both subsidiary banks have opted out of utilizing the CBLR framework. Therefore, the Capital Rules promulgated under Dodd-Frank remain applicable to Arrow and both subsidiary banks.
The Capital Rules which remain applicable to Arrow consist of two basic types of capital measures, a leverage ratio and a set of risk-based capital measures. Within these two broad types of rules, however, significant changes were made in the revised Capital Rules, as discussed as follows.
Leverage Ratio. The Capital Rules increased the minimum required leverage ratio from 3.0% to 4.0%. The leverage ratio continues to be defined as the ratio of the institution's "Tier 1" capital (as defined under the new leverage rule) to total tangible assets (as defined under the revised leverage rule).
Risk-Based Capital Measures. Current risk-based capital measures assign various risk weightings to all of the institution's assets, by asset type, and to certain off balance sheet items, and then establish minimum levels of capital to the aggregate dollar amount of such risk-weighted assets. Under the risk-based Capital Rules, there are eight major risk-weighted categories of assets (although there are several additional super-weighted categories for high-risk assets that are generally not held by community banking organizations like Arrow). The Capital Rules include a measure called the "common equity tier 1 capital ratio" (CET1). For this ratio, only common equity (basically, common stock plus surplus plus retained earnings) qualifies as capital (i.e., CET1). Preferred stock and trust preferred securities, which qualified as Tier 1 capital under the old Tier 1 risk-based capital measure (and continue to qualify as capital under the revised Tier 1 risk-based capital measure), are not included in CET1 capital. Under these rules, CET1 capital also includes most elements of accumulated other comprehensive income (AOCI), including unrealized securities gains and losses, as part of both total regulatory capital (numerator) and total assets (denominator). However, smaller banking organizations like Arrow's were given the opportunity to make a one-time irrevocable election to include or not to include certain elements of AOCI, most notably unrealized securities gains or losses. Arrow made such an election, and therefore does not include unrealized securities gains and losses in calculating the CET1 ratio under the Capital Rules. The minimum CET1 ratio under these rules, effective January 1, 2015, is 4.50%, which remained constant throughout the phase-in period.
Consistent with the general theme of higher capital levels, the Capital Rules also increased the minimum ratio for Tier 1 risk-based capital from 4.0% to 6.0%, effective January 1, 2015. The minimum level for total risk-based capital under the Capital Rules remained at 8.0%.
The Capital Rules also incorporated a capital concept, the so-called "capital conservation buffer" (set at 2.5%, after full phase-in), which must be added to each of the minimum required risk-based capital ratios (i.e., the minimum CET1 ratio, the minimum Tier 1 risk-based capital ratio and the minimum total risk-based capital ratio). The capital conservation buffer was phased-in over four years beginning January 1, 2016 (see the table below). When, during economic downturns, an institution's capital begins to erode, the first deductions from a regulatory perspective would be taken against the capital conservation buffer. To the extent that such deductions should erode the buffer below the required level (2.5% of total risk-based assets after full phase-in), the institution will not necessarily be required to replace the buffer deficit immediately, but will face restrictions on paying dividends and other negative consequences until the buffer is fully replenished.
Also under the Capital Rules, and as required under Dodd-Frank, TRUPs issued by small- to medium-sized banking organizations (such as Arrow) that were outstanding on the Dodd-Frank grandfathering date for TRUPS (May 19, 2010) will continue to qualify as tier 1 capital, up to a limit of 25% of tier 1 capital, until the TRUPs mature or are redeemed, subject to certain limitations. See the discussion of grandfathered TRUPs in Section E ("CAPITAL RESOURCES AND DIVIDENDS") of Item 7.
The following is a summary of the definitions of capital under the various risk-based measures in the Capital Rules:
Common Equity Tier 1 Capital (CET1): Equals the sum of common stock instruments and related surplus (net of treasury stock), retained earnings, accumulated other comprehensive income (AOCI), and qualifying minority interests, minus applicable regulatory adjustments and deductions. Such deductions will include AOCI, if the organization has exercised its irrevocable option not to include AOCI in capital (Arrow made such an election). Mortgage-servicing assets, deferred tax assets, and investments in financial institutions are limited to 15% of CET1 in the aggregate and 10% of CET1 for each such item individually.
Additional Tier 1 Capital: Equals the sum of noncumulative perpetual preferred stock, tier 1 minority interests, grandfathered TRUPs, and Troubled Asset Relief Program instruments, minus applicable regulatory adjustments and deductions.
Tier 2 Capital: Equals the sum of subordinated debt and preferred stock, total capital minority interests not included in Tier 1, and allowance for loan and lease losses (not exceeding 1.25% of risk-weighted assets) minus applicable regulatory adjustments and deductions.
The following table presents the Capital Rules applicable to Arrow and its subsidiary banks:
|
|
|
|
|
|
|
|
|
| Year, as of January 1 |
|
|
|
2022 |
| Minimum CET1 Ratio |
|
|
|
4.500 |
% |
| Capital Conservation Buffer ("Buffer") |
|
|
|
2.500 |
% |
| Minimum CET1 Ratio Plus Buffer |
|
|
|
7.000 |
% |
| Minimum Tier 1 Risk-Based Capital Ratio |
|
|
|
6.000 |
% |
| Minimum Tier 1 Risk-Based Capital Ratio Plus Buffer |
|
|
|
8.500 |
% |
| Minimum Total Risk-Based Capital Ratio |
|
|
|
8.000 |
% |
| Minimum Total Risk-Based Capital Ratio Plus Buffer |
|
|
|
10.500 |
% |
| Minimum Leverage Ratio |
|
|
|
4.000 |
% |
At December 31, 2022, Arrow and its two subsidiary banks exceeded, by a substantial amount, each of the applicable minimum capital ratios established under the revised Capital Rules, including the minimum CET1 Ratio, the minimum Tier 1 Risk-Based Capital Ratio, the minimum Total Risk-Based Capital Ratio, and the minimum Leverage Ratio, and including in the case of each risk-based ratio, the phased-in portion of the capital buffer. See Note 20, Regulatory Matters, to the Consolidated Financial Statements for a presentation of Arrow's period-end ratios for 2022 and 2021.
Regulatory Capital Classifications. Under applicable banking law, federal banking regulators are required to take prompt corrective action with respect to depository institutions that do not meet minimum capital requirements. The regulators have established five capital classifications for banking institutions, ranging from the highest category of "well-capitalized" to the lowest category of "critically under-capitalized". Under the Capital Rules, a banking institution is considered "well-capitalized" if it meets the following capitalization standards on the date of measurement: a CET1 risk-based capital ratio of 6.50% or greater, a Tier 1 risk-based capital ratio of 8.00% or greater, and a total risk-based capital ratio of 10.00% or greater, provided the institution is not subject to any regulatory order or written directive regarding capital maintenance.
As of December 31, 2022, Arrow and its two subsidiary banks qualified as "well-capitalized" under the revised capital classification scheme.
Regulatory Reporting. Arrow's recent failure to timely file this Annual Report on Form 10-K and the Quarterly Report on Form 10-Q for the quarter ended March 31, 2023 has resulted in a failure to timely file certain other regulatory reports, which rely in whole or in part upon the information contained in such 10-K and 10-Q Reports. Any such required reports will be promptly filed upon the filing of this Annual Report on Form 10-K and the Quarterly Report on Form 10-Q.
Dividend Restrictions; Other Regulatory Sanctions
A holding company's ability to pay dividends or repurchase its outstanding stock, as well as its ability to expand its business, including for example, through acquisitions of additional banking organizations or permitted non-bank companies, may be restricted if its capital falls below minimum regulatory capital ratios or fails to meet other informal capital guidelines that the regulators may apply from time to time to specific banking organizations. In addition to these potential regulatory limitations on payment of dividends, the holding company's ability to pay dividends to shareholders, and the subsidiary banks' ability to pay dividends to the holding company are also subject to various restrictions under applicable corporate laws, including banking laws (which affect the subsidiary banks) and the New York Business Corporation Law (which affects the holding company). The ability of the holding company and banks to pay dividends or repurchase shares in the future is, and is expected to continue to be, influenced by regulatory policies, the Capital Rules and other applicable law.
In cases where banking regulators have significant concerns regarding the financial condition, assets or operations of a bank holding company and/or one of its banks, the regulators may take enforcement action or impose enforcement orders, formal or informal, against the holding company or the particular bank. If the ratio of tangible equity to total assets of a bank falls to 2% or below, the bank will likely be closed and placed in receivership, with the FDIC as receiver.
Cybersecurity
In addition to the provisions in the Gramm-Leach-Bliley Act relating to data security (discussed below), Arrow and its subsidiaries are subject to many federal and state laws, regulations and regulatory interpretations which impose standards and requirements related to cybersecurity.
In March 2015, federal regulators issued related statements regarding cybersecurity. One statement indicates that financial institutions should design multiple layers of security controls to establish lines of defense and to ensure that their risk management processes also address the risk posed by compromised customer credentials, including security measures to reliably authenticate customers accessing internet-based services of the financial institution. The other statement indicates that a financial institution’s management is expected to maintain sufficient business continuity planning processes to ensure the rapid recovery, resumption and maintenance of the institution’s operations after a cyber-attack involving destructive malware. A financial institution is also expected to develop appropriate processes to enable recovery of data and business operations and address rebuilding network capabilities and restoring data if the institution or its critical service providers fall victim to this type of cyber-attack.
Financial institutions that fail to observe this regulatory guidance on cybersecurity may be subject to various regulatory sanctions, including financial penalties.
In February 2018, the SEC issued the “Commission Statement and Guidance on Public Company Cybersecurity Disclosures” to assist public companies in preparing disclosures about cybersecurity risks and incidents. With the increased frequency and magnitude of cybersecurity incidents, the SEC stated that it is critical that public companies take all required actions to inform investors about material cybersecurity risks and incidents in a timely fashion. Additionally, in October 2018 the SEC issued the “Report of Investigation Pursuant to Section 21(a) of the Securities Exchange Act of 1934 Regarding Certain Cyber-Related Frauds Perpetrated Against Public Companies and Related Internal Controls Requirements” which cited business email compromises that led to the incidents and that internal accounting controls may need to be reassessed in light of these emerging risks. Certain Arrow subsidiaries are subject to certain New York State cybersecurity regulations.
Privacy and Confidentiality Laws
Arrow and its subsidiaries are subject to a variety of laws that regulate customer privacy and confidentiality. The Gramm-Leach-Bliley Act requires financial institutions to adopt privacy policies, to restrict the sharing of nonpublic customer information with nonaffiliated parties upon the request of the customer, and to implement data security measures to protect customer information. Certain state laws may impose additional privacy and confidentiality restrictions. The Fair Credit Reporting Act, as amended by the Fair and Accurate Credit Transactions Act of 2003, regulates use of credit reports, providing of information to credit reporting agencies and sharing of customer information with affiliates, and sets identity theft prevention standards.
Anti-Money Laundering, the U.S. Patriot Act and OFAC
The Uniting and Strengthening America by Providing Appropriate Tools Required to Intercept and Obstruct Terrorism (USA PATRIOT) Act of 2001 initially adopted in 2001 and re-adopted by the U.S. Congress in 2006 with certain changes (the “Patriot Act”), imposes substantial record-keeping and due diligence obligations on banks and other financial institutions, with a particular focus on detecting and reporting money-laundering transactions involving domestic or international customers. The U.S. Treasury Department has issued and will continue to issue regulations clarifying the Patriot Act's requirements.
Under the Patriot Act and other federal anti-money laundering laws and regulations, including, but not limited to, the Currency and Foreign Transactions Report Act (collectively, “Anti-Money Laundering Laws”), financial institutions, including banks, must maintain certain anti-money laundering compliance, customer identification and due diligence programs that include established internal policies, procedures, and controls. Financial institutions are also prohibited from entering into specified financial transactions and account relationships and must meet enhanced standards for due diligence and customer identification. Financial institutions must take reasonable steps to conduct enhanced scrutiny of account relationships to guard against money laundering and to report suspicious transactions. Law enforcement authorities have been granted increased access to financial information maintained by financial institutions. Bank regulators routinely examine institutions for compliance with these obligations and they must consider an institution's compliance in connection with the regulatory review of applications, including applications for banking mergers and acquisitions. The U.S. Treasury Department's Financial Crises Enforcement Network (“FinCEN”) issued a final rule in 2016 increasing customer due diligence requirements for banks, including adding a requirement to identify and verify the identity of beneficial owners of customers that are legal entities, subject to certain exclusions and exemptions. The Company has established procedures for compliance with these requirements. Compliance with the provisions of the Patriot Act and other Anti-Money Laundering Laws results in substantial costs on all financial institutions.
The U.S. Department of the Treasury's Office of Foreign Assets Control (“OFAC”) is responsible for helping to insure that United States persons, including banks, do not engage in transactions with certain prohibited parties, as defined by various Executive Orders and Acts of Congress. OFAC publishes lists of persons, organizations, and countries suspected of aiding, harboring or engaging in terrorist acts, including, but not limited to, Specially Designated Nationals and Blocked Persons. If Arrow finds a name on any transaction, account or wire transfer that is on an OFAC list, Arrow must freeze or block such account or transaction, file a suspicious activity report, if required, notify the appropriate authorities and maintain appropriate records.
Community Reinvestment Act
Arrow's subsidiary banks are subject to the Community Reinvestment Act ("CRA") and implementing regulations. CRA regulations establish the framework and criteria by which the bank regulatory agencies assess an institution's record of helping to meet the credit needs of its community, including low and moderate-income individuals. CRA ratings are taken into account by regulators in reviewing certain applications made by Arrow and its bank subsidiaries.
The Dodd-Frank Act
Dodd-Frank significantly changed the regulatory structure for financial institutions and their holding companies, for example, through provisions requiring the Capital Rules. Among other provisions, Dodd-Frank implemented corporate governance revisions that apply to all public companies, not just financial institutions, permanently increased the FDIC’s standard maximum deposit insurance amount to $250,000, changed the FDIC insurance assessment base to assets rather than deposits and increased the reserve ratio for the deposit insurance fund to ensure the future strength of the fund. The federal prohibition on the payment of interest on certain demand deposits was repealed, thereby permitting depository institutions to pay interest on business transaction accounts. Dodd-Frank established a new federal agency, the Consumer Financial Protection Bureau (the “CFPB”), centralizing significant aspects of consumer financial protection under this agency. Limits were imposed for debit card interchange fees for issuers that have assets greater than $10 billion, which also could affect the amount of interchange fees collected by financial institutions with less than $10 billion in assets. Dodd-Frank also imposed new requirements related to mortgage lending, including prohibitions against payment of steering incentives and provisions relating to underwriting standards, disclosures, appraisals and escrows.
The Volcker Rule prohibited banks and their affiliates from engaging in proprietary trading and investing in certain unregistered investment companies.
Federal banking regulators and other agencies including, among others, the FRB, the OCC and the CFPB, have been engaged in extensive rule-making efforts under Dodd-Frank, and the Community Bank Leverage Ratio has impacted certain Dodd-Frank requirements, as explained above.
Incentive Compensation
Dodd-Frank required the federal bank regulatory agencies and the SEC to establish joint regulations or guidelines prohibiting incentive-based payment arrangements at specified regulated entities, such as the Company, having at least $1 billion in total assets that encourage inappropriate risks by providing an executive officer, employee, director or principal shareholder with excessive compensation, fees, or benefits or that could lead to material financial loss to the entity. In addition, these regulators must establish regulations or guidelines requiring enhanced disclosure to regulators of incentive-based compensation arrangements.
The federal bank regulators issued proposed rules to address incentive-based compensation arrangements in June 2016. Final rules have not yet been issued by the federal bank regulatory agencies under this Dodd-Frank provision.
In 2010, the FRB, OCC and FDIC issued comprehensive final guidance on incentive compensation policies intended to ensure that the incentive compensation policies of banking organizations do not undermine the safety and soundness of such organizations by encouraging excessive risk-taking. The guidance, which covers all employees that have the ability to materially affect the risk profile of an organization, either individually or as part of a group, is based upon the key principles that a banking organization’s incentive compensation arrangements should (i) provide incentives that do not encourage risk-taking beyond the organization’s ability to effectively identify and manage risks, (ii) be compatible with effective internal controls and risk management, and (iii) be supported by strong corporate governance, including active and effective oversight by the organization’s board of directors. Management believes the current and past compensation practices of the Company do not encourage excessive risk taking or undermine the safety and soundness of the organization.
The FRB will review, as part of the regular, risk-focused examination process, the incentive compensation arrangements of banking organizations, such as the Company, that are not “large, complex banking organizations.” These reviews will be tailored to each organization based on the scope and complexity of the organization’s activities and the prevalence of incentive compensation arrangements. The findings of the supervisory initiatives will be included in reports of examination. Deficiencies will be incorporated into the organization’s supervisory ratings, which can affect the organization’s ability to make acquisitions and take other actions. Enforcement actions may be taken against a banking organization if its incentive compensation arrangements, or related risk-management control or governance processes, pose a risk to the organization’s safety and soundness and the organization is not taking prompt and effective measures to correct the deficiencies.
Deposit Insurance Laws and Regulations
In February 2011, the FDIC finalized a new assessment system that took effect in the second quarter of 2011. The final rule changed the assessment base from domestic deposits to average assets minus average tangible equity, adopted a new large-bank pricing assessment scheme, and set a target size for the Deposit Insurance Fund. The rule (as mandated by Dodd-Frank) finalized a target size for the Deposit Insurance Fund Reserve Ratio at 2.0% of insured deposits.
Due to increased growth in insured deposits during the first half of 2020, on September 15, 2020, the FDIC established a plan to restore the Deposit Insurance Fund Reserve Ratio to at least 1.35% by September 30, 2028, as required by the FDIA, utilizing the rate schedule in effect at that time. In response to updated analysis and projections for the fund balance and the Deposit Insurance Fund Reserve Ratio, the FDIC adopted a final rule in October 2022 increasing the initial base deposit insurance assessment rate schedules by two percent effective January 1, 2023 and beginning on the first quarterly assessment period of 2023. The increase is intended to ensure that the reserve ratio meets the minimum ratio of 1.35% by the September 30, 2028 statutory deadline. Arrow is unable to predict whether or to what extent the FDIC may elect to impose additional special assessments on insured institutions in upcoming years, especially in light of recent high-profile large bank failures.
Reserve Requirements
Pursuant to regulations of the FRB, all banking organizations are required to maintain average daily reserves at mandated ratios against their transaction accounts and certain other types of deposit accounts. These reserves must be maintained in the form of vault cash or in an account at a Federal Reserve Bank. In March 2020, the Federal Reserve Board reduced reserve requirement ratios to zero percent to free up liquidity in the banking industry to support lending to households and businesses.
D. RECENT LEGISLATIVE DEVELOPMENTS
The CARES Act and other COVID-19 Responses
In response to the COVID-19 pandemic, the CARES Act was signed into law on March 27, 2020. The CARES Act is a $2.2 trillion economic stimulus bill that was enacted to provide relief in the wake of the COVID-19 pandemic. Several provisions within the CARES Act directly impacted financial institutions and led to action from the bank regulatory agencies.
Section 1102 of the CARES Act created the PPP, a program administered by the SBA to provide loans to small businesses for payroll and other basic expenses during the COVID-19 pandemic. Arrow participated in the PPP as a lender, originating over $234.2 million in loans in 2020 and 2021. These loans were eligible to be forgiven if certain conditions were satisfied and were fully guaranteed by the SBA. As of December 31, 2022, there were no PPP loans outstanding in Arrow's loan portfolio.
On March 22, 2020, a statement was issued by the Board of Governors of the Federal Reserve Bank, the Federal Deposit Insurance Corporation, the National Credit Union Administration, the office of the Comptroller of the Currency and the Consumer Financial Protection Bureau, titled the “Interagency Statement on Loan Modifications and Reporting for Financial Institutions Working with Customers Affected by the Coronavirus” (the “Interagency Statement”) that encourages financial institutions to work prudently with borrowers who are or may be unable to meet their contractual payment obligations due to the effects of COVID-19.
Additionally, Section 4013 of the CARES Act further provides that a qualified loan modification is exempt from classification as a troubled debt restructuring ("TDR") as defined by GAAP, from the period beginning March 1, 2020 until the earlier of December 31, 2020 or the date that is 60 days after the date on which the national emergency concerning the COVID-19 outbreak declared by the President of the United States under the National Emergencies Act terminates. Section 541 of the CAA extended this relief to the earlier of January 1, 2022, or 60 days after the national emergency termination date. The Interagency Statement was subsequently revised in April 2020 to clarify the interaction of the original guidance with Section 4013 of the CARES Act, as well as setting forth the federal banking regulators’ views on consumer protection considerations. In accordance with such guidance, Arrow offered short-term modifications in response to COVID-19 to qualified borrowers. As of January 1, 2022, all COVID related deferrals had ended.
On May 11, 2023, the COVID-19 national emergency and public health emergency declarations ended.
The American Rescue Plan Act of 2021
On March 11, 2021, the American Rescue Plan Act of 2021 ("American Rescue Plan") was signed into law to speed up the recovery from the economic and health effects of the COVID-19 pandemic and the ongoing recession. The American Rescue Plan is a $1.9 trillion economic stimulus bill that builds upon both the CARES Act and the CAA.
Several provisions within the American Rescue Plan impact financial institutions. Key provisions include direct stimulus payments for the majority of Americans, extending unemployment benefits and continuing eviction and foreclosure moratoriums. In addition, over $350 billion has been allocated to state, local and tribal governments to bridge budget shortfalls.
Other Legislative Initiatives
From time to time, various legislative and regulatory initiatives are introduced in Congress and state legislatures, as well as by regulatory authorities. These initiatives may include proposals to expand or contract the powers of bank holding companies and depository institutions or proposals to change the financial institution regulatory environment. Such legislation could change banking laws and the operating environment of our Company in substantial, but unpredictable ways. Arrow cannot predict whether any such legislation will be enacted, and, if enacted, the effect that it, or any implementing regulations would have on the Company's financial condition or results of operations.
E. STATISTICAL DISCLOSURE – (Regulation S-K, Subpart 1400)
Set forth below is an index identifying the location in this Report of various items of statistical information required to be included in this Report by the SEC’s industry guide for Bank Holding Companies.
|
|
|
|
|
|
| Required Information |
Location in Report |
| Distribution of Assets, Liabilities and Stockholders' Equity; Interest Rates and Interest Differential |
Part II, Item 7.B.I. |
| Investment Portfolio |
Part II, Item 7.C.I. |
| Loan Portfolio |
Part II, Item 7.C.II. |
| Summary of Credit Loss Experience |
Part II, Item 7.C.III. |
| Deposits |
Part II, Item 7.C.IV. |
| Return on Equity and Assets |
Part II, Item 6. |
| Short-Term Borrowings |
Part II, Item 7.C.V. |
F. COMPETITION
Arrow faces intense competition in all markets served. Competitors include traditional local commercial banks, savings banks and credit unions, non-traditional internet-based lending alternatives, as well as local offices of major regional and money center banks. Like all banks, the Company encounters strong competition in the mortgage lending space from a wide variety of other mortgage originators, all of whom are principally affected in this business by the rate and terms set, and the lending practices established from time-to-time by the very large government sponsored enterprises ("GSEs") engaged in residential mortgage lending, most importantly, “Fannie Mae” and “Freddie Mac.” For many years, these GSEs have purchased and/or guaranteed a very substantial percentage of all newly-originated mortgage loans in the U.S. Additionally, non-banking financial organizations, such as consumer finance companies, insurance companies, securities firms, money market funds, mutual funds, credit card companies and wealth management enterprises offer substantive equivalents of the various other types of loan and financial products and services and transactional accounts that are offered, even though these non-banking organizations are not subject to the same regulatory restrictions and capital requirements that apply to Arrow. Under federal banking laws, such non-banking financial organizations not only may offer products and services comparable to those offered by commercial banks, but also may establish or acquire their own commercial banks.
G. HUMAN CAPITAL
Arrow believes that its employees are among its most important assets. Accordingly, Arrow has prioritized investment in the well-being, performance, engagement and development of its employees. This includes, but is not limited to, providing access to well-being resources and assistance, offering competitive compensation and benefits to attract and retain top-level talent, empowering team members to take an active role in the formation and execution of the business strategy, and fostering a diverse and inclusive work environment that reflects the many values of the communities that Arrow serves. One example is through the creation of Arrow University, we are investing in our people by bringing employee learning and development to the forefront.
We offer opportunities to employees at all levels for personal and professional growth, technical training, and career exploration and enhancement. At December 31, 2022, Arrow had 502 full-time equivalent employees.
H. ENVIRONMENTAL, SOCIAL AND GOVERNANCE (ESG)
Arrow is firmly committed to operating in a socially conscious manner that demonstrates positive environmental, social and governance contributions.
Environmentally, Arrow is dedicated to conserving natural resources and complying with environmental regulations. Some of the steps we have taken to help promote environmentally responsible corporate citizenship include:
•Expanded our philanthropic support of environmental sustainability in our community, including organizations that impact soil and water conservation, land conservation, sustainable farming, mountain and lake protection and stewardship, and parks and recreation
•Incorporated energy-saving features into the renovation of our branches, such as interior and exterior LED lighting and energy-efficient plumbing in 40% of our branch network
•Incorporated the above environmentally friendly attributes into our Glens Falls, New York, headquarters renovation, which includes approximately 76,000 square feet of office space; motion-activated lighting; significant improvements to exterior wall and roof insulation; new HVAC systems with higher efficiency which meet modern fresh-air and ventilation requirements; energy-efficient windows and entry doors; low-VOC materials; a separate tie-in to the city stormwater and sewer system to bypass the municipal treatment of rainwater collected off the building; and green plantings on a portion of the roof
•Installed solar panels at part of our corporate headquarters, to support the main campus with approximately 3,000 square feet of green energy
•Installed electric vehicle charging stations at our SNB Main Office, with utilization offered at no charge to customers
•Reduced emissions via remote work and video conferencing for large segments of employees
•Provided and encouraged digital banking options and paperless statements
Socially, Arrow is proud of its many contributions to its employees, customers and communities, including providing professional development and holistic support of its team, giving back to its communities in dollars and volunteer hours, and meeting financial needs of the low- to moderate-income population. Arrow is also working on many ways to demonstrate the value of differences, particularly around diversity, equity, inclusion and belonging (“DEIB”).
Steps taken in this area include:
•More than $675,000 and 9,395 hours donated to our communities in 2022 in support of arts and culture, child care, economic and workforce development, emergency assistance, food security, financial literacy, mental and physical health, safe and affordable housing, transportation and more
•71 percent of donated dollars and 40 percent of hours are Community Reinvestment Act-eligible
•Prioritization of donations to organizations that make it their mission to provide affordable homeownership, environmental or sustainable activities and programming, economic empowerment, health and human services and social progress
•Lending program to facilitate first-time home ownership
•Extensive pandemic-related support to customers in need, including loan deferrals and over $234.2 million of 2,400 PPP loans through 2022
•Bank On-certified checking product for the unbanked or underbanked population with no overdraft fees
•Partnership with numerous organizations to meet the financial needs of the low- to moderate-income population
•Annual engagement with a third party to assess diversity within our employee base and support for setting and tracking goals to encourage the advancement of minorities, women, veterans and persons with disabilities
•Professional development, wellness and mental health services to our employees through the HR Department and through outside Employee Assistance Program (EAP) contracted services
•Ongoing outreach to measure employee engagement
•Three consecutive years of special bonuses for all employees in recognition of exceptional commitment and performance
•Incorporation of inclusion and belonging into our human resources policies, practices and programs
•Upcoming DEIB educational series for the Arrow Team as well as the development of a group of stakeholders to guide further initiatives
•Encouraged and facilitated employee giving including payroll deduction, dress-down days, and a fundraising campaign that totaled more than $103,000, a true reflection of our culture of giving
•Developed ESG Investment Models for our socially conscious clients
•Longstanding dedication to diversity on Arrow’s Board of Directors, exceeding Nasdaq requirements
Finally, Arrow believes that strong corporate governance is the foundation to delivering on its commitments to its stakeholders. Arrow adheres to a comprehensive governance program, which is described in further detail in its annual Proxy Statement.
I. EXECUTIVE OFFICERS OF THE REGISTRANT
The names and ages of the executive officers of Arrow and positions held by each are presented in the following table:
|
|
|
|
|
|
|
|
|
| Name |
Age |
Positions Held and Years from Which Held |
| David S. DeMarco |
61 |
President and Chief Executive Officer of Arrow since May 13, 2023 and Chief Banking Officer since 2018. In addition to his executive leadership role at Arrow, Mr. DeMarco serves as President and Chief Executive Officer of each of GFNB (serving since May 13, 2023) and SNB (serving since 2012). Prior positions in the Company include Senior Executive Vice President from February 2022 through May 2023, Senior Vice President of Arrow between May 2009 and January 2022, Executive Vice President and Chief Banking Officer of GFNB and Executive Vice President and Head of the Branch, Corporate Development, Financial Services & Marketing Division of GFNB (2003-2012). Mr. DeMarco started with the Company as a commercial lender in 1987. |
| Penko Ivanov |
54 |
Chief Financial Officer, Executive Vice President, Treasurer and Chief Accounting Officer effective February 21, 2023. Mr. Ivanov most recently served as executive vice president and chief financial officer of Bankwell Financial Group, Inc. in New Canaan, Connecticut. Prior to that, he worked in various finance positions for Doral Bank, General Electric Co. and PepsiCo Inc. Mr. Ivanov began his career with Ernst & Young in Munich, Germany. |
| David D. Kaiser |
63 |
Senior Executive Vice President and Chief Credit Officer of Arrow, GFNB and SNB since February 2022. Prior positions in the Company include Senior Vice President and Chief Credit Officer of Arrow from February 2015 through January 2022, Executive Vice President of GFNB from 2012 through January 2022, Chief Credit Officer of GFNB from 2011 through January 2022 and Corporate Banking Manager for GFNB from 2005 to 2011. Mr. Kaiser started with the Company in 2000. |
| Andrew J. Wise |
56 |
Senior Executive Vice President and Chief Operating Officer of Arrow, GFNB and SNB since February 2022. Prior positions in the Company include Senior Vice President and Chief Operating Officer of Arrow from February 2018 through January 2022, Executive Vice President and Chief Operating Officer of GFNB from October 2017 through January 2022, Chief Administrative Officer of GFNB. He joined GFNB in May 2016 as Senior Vice President of Administration. Prior to that, he worked at Adirondack Trust Company for 12 years where he was Executive Vice President and Chief Operating Officer of the Company’s insurance subsidiary. |
J. AVAILABLE INFORMATION
Arrow's Internet address is www.arrowfinancial.com. The Company makes available, free of charge on or through Arrow's website, the annual report on Form 10-K, quarterly reports on Form 10-Q, current reports on Form 8-K, and amendments to those reports as soon as practicable after they are filed or furnished with the SEC pursuant to the Exchange Act. We intend to use our website to disclose material non-public information and various other documents related to corporate operations, including Corporate Governance Guidelines, the charters of principal board committees, and codes of ethics and to comply with our disclosure obligations under Regulation FD. Accordingly, investors should monitor our website, in addition to following and reviewing our news releases, filings with the SEC and public conference calls and other presentations. The Company has adopted a financial code of ethics that applies to Arrow’s chief executive officer, chief financial officer and principal accounting officer and a business code of ethics that applies to all directors, officers and employees of the holding company and its subsidiaries. Both of these can be found at: https://www.arrowfinancial.com/Corporate/Governance.
Item 1A. Risk Factors
Arrow's financial results and the market price of its stock are subject to risks arising from many factors, including the risks listed below, as well as other risks and uncertainties. Any of these risks could materially and adversely affect Arrow's business, financial condition or results of operations. Please note that the discussion below regarding the potential impact on Arrow of certain of these factors that may develop in the future is not meant to provide predictions by Arrow's management that such factors will develop, but to acknowledge the possible negative consequences to the Company and business if certain conditions materialize.
MACROECONOMIC AND INDUSTRY RISKS
Market conditions could present significant challenges to the U.S. commercial banking industry and its core business of making and servicing loans and any substantial downturn in the regional markets in which Arrow operates or in the U.S. economy generally could adversely affect Arrow's ability to maintain steady growth in the loan portfolio and earnings. Arrow's business is highly dependent on the business environment in the markets in which the Company operates as well as the United States as a whole. Arrow's business is dependent upon the financial stability of the Company's borrowers, including their ability to pay interest on and repay the principal amount of, outstanding loans, the value of the collateral securing those loans, and the overall demand for loans and other products and services, all of which impact Arrow's stability and future growth. Although Arrow's market area has experienced a stabilizing of economic conditions in recent years and even periods of modest growth, if unpredictable or unfavorable economic conditions unique to the market area should occur in upcoming periods, these conditions will likely have an adverse effect on the quality of the loan portfolio and financial performance. As a community bank, Arrow is less able than larger regional competitors to spread the risk of unfavorable local economic conditions over a larger market area. Further, if the overall U.S. economy deteriorates, then Arrow's business, results of operations, financial condition and prospects could be adversely affected. In particular, financial performance may be adversely affected by short-term and long-term interest rates, the prevailing yield curve, inflation, monetary supply, fluctuations in the debt and equity capital markets, and the strength of the domestic economy and the local economies in the markets in which Arrow operates, all of which are beyond Arrow's control.
A continued period of high inflation could adversely impact our business and our customers. The Federal Reserve Board has raised certain benchmark interest rates in an effort to combat the pronounced increase in inflation. As rates continue to rise, the value of our investment securities, particularly those with longer maturities, would likely decrease (although this effect may be mitigated for floating rate instruments). Further, inflation increases the cost of operational expenses which increases our noninterest expenses. Additionally, our customers may be affected by inflation, which could have a negative impact on their ability to repay loans. Finally, the high inflationary environment may discourage our customers from pursuing new loans.
Arrow operates in a highly competitive industry and market areas that could negatively affect growth and profitability. Competition for commercial banking and other financial services is fierce in Arrow's market areas. In one or more aspects of business, Arrow's subsidiaries compete with other commercial banks, savings and loan associations, credit unions, finance companies, Internet-based financial services companies, mutual funds, insurance companies, brokerage and investment banking companies, and other financial intermediaries. Additionally, due to their size and other factors, many competitors may be able to achieve economies of scale and, as a result, may offer a broader range of products and services, as well as better pricing for those products and services, than Arrow can. Technology has lowered barriers to entry and made it possible for non-banks to offer products and services traditionally provided by banks, such as automatic transfer and automatic payment systems. In addition, many of Arrow's competitors are not subject to the same extensive federal regulations that govern bank holding companies and federally insured banks. Failure, by Arrow, to offer competitive services in Arrow's market areas could significantly weaken Arrow's market position, adversely affecting growth, which, in turn, could have a material adverse effect on Arrow's financial condition and results of operations.
Uncertainty relating to LIBOR and other reference rates and their potential discontinuance may negatively impact our access to funding and the value of our financial instruments and commercial agreements. Due to uncertainty surrounding the suitability and sustainability of the London interbank offered rate (LIBOR), central banks and global regulators have called for financial market participants to prepare for the discontinuance of LIBOR and the establishment of alternative reference rates. ICE Benchmark Administration (IBA), the administrator of LIBOR, announced that it will consult on its intention to cease publication of one-week and two-month U.S. dollar LIBOR at December 31, 2021, and stop the remaining U.S. dollar settings immediately after publication on June 30, 2023. At this time, it is not anticipated to have a significant impact to Arrow, or Arrow's financial instruments or commercial agreements that reference LIBOR.
Certain of our financial instruments and commercial agreements contain provisions to replace LIBOR as the benchmark following the occurrence of specified transition events. Such provisions may not be sufficient to trigger a change in the benchmark at all times when LIBOR is no longer representative of market interest rates, or that these events will align with similar events in the market generally or in other parts of the financial markets, such as the derivatives market.
Alternative reference rates are calculated using components different from those used in the calculation of LIBOR and may fluctuate differently than, and not be representative of, LIBOR. In order to compensate for these differences, certain of our financial instruments and commercial agreements allow for a benchmark replacement adjustment. However, there is no assurance that any benchmark replacement adjustment will be sufficient to produce the economic equivalent of LIBOR, either at the benchmark replacement date or over the life of such instruments and agreements.
Arrow established a committee in 2020 comprised of Bank Management to prepare for the discontinuance of LIBOR. Arrow has determined that the financial products tied to LIBOR will not be subject to cessation until June 30, 2023. This review also identified that only a few legacy contracts do not include appropriate fallback language. Arrow anticipates that the appropriate fallback provisions for these contracts will be implemented and allow for an orderly transition prior to the June 30, 2023 cessation of U.S. Dollar LIBOR (additional information regarding the replacement of LIBOR for "tough legacy" contracts can be found in the Reference Rate Reform section). As of December 31, 2021, Arrow no longer issues new LIBOR-based financial instruments. Furthermore, U.S. Dollar LIBOR indices utilized by Arrow's existing financial instruments shall cease on June 30, 2023.
Beginning January 1, 2022, Arrow is using the CME Term Secured Overnight Financing Rate (SOFR) as the primary index for financial instruments.
Uncertainty as to the nature and timing of the potential discontinuance or modification of LIBOR, the replacement of LIBOR with one or more alternative reference rates or other reforms may negatively impact market liquidity, Arrow's access to funding required to operate Arrow's business and/or the trading market for financial instruments. Furthermore, the timing of implementation and use of alternative reference rates and corresponding adjustments or other reforms could be subject to disputes, could cause the interest payable on Arrow's outstanding financial instruments and commercial agreements to be materially different than expected and may impact the value of financial instruments and commercial agreements.
The financial services industry is faced with technological advances and changes on a continuing basis, and failure to adapt to these advances and changes could have a material adverse impact on Arrow's business. Technological advances and changes in the financial services industry are pervasive and constant. The retail financial services sector, like many other retail goods and services sectors, is constantly evolving, involving new delivery and communications systems and technologies that are extraordinarily far-reaching and impactful. For Arrow to remain competitive, Arrow must comprehend and adapt to these systems and technologies. Proper implementation of new technologies can increase efficiency, decrease costs and help to meet customer demand. However, many competitors have greater resources to invest in technological advances and changes. Arrow may not always be successful in utilizing the latest technological advances in offering its products and services or in otherwise conducting its business. Failure to identify, consider, adapt to and implement technological advances and changes could have a material adverse effect on business.
Problems encountered by other financial institutions could adversely affect Arrow. Arrow's ability to engage in routine funding transactions could be adversely affected by financial or commercial problems confronting other financial institutions. Financial services institutions are interrelated as a result of trading, clearing, counterparty and other relationships. Arrow has exposure to many different counterparties in the normal course of business, and routinely executes transactions with counterparties in the financial services industry, including brokers and dealers, other commercial banks, investment banks, mutual and hedge funds, and other financial institutions. As a result, defaults by, or even rumors or questions about, one or more financial services institutions, or the financial services industry generally, including in response to recent high-profile large bank failures, could lead to market-wide liquidity problems and losses or defaults by Arrow or by other financial institutions on whom Arrow relies or with whom Arrow interacts. Some of these transactions expose Arrow to credit and other potential risks in the event of default of Arrow's counterparty or client. In addition, credit risk may be exacerbated when the collateral held by Arrow cannot be liquidated or only may be liquidated at prices not sufficient to recover the full amount due Arrow under the underlying financial instrument, held by Arrow. There is no assurance that any such losses would not materially and adversely affect results of operations.
OPERATIONAL RISKS
Any future economic or financial downturn, including any significant correction in the equity markets, may negatively affect the volume of income attributable to, and demand for, fee-based services of banks such as Arrow, including the Company's fiduciary business, which could negatively impact Arrow's financial condition and results of operations. Revenues from trust and wealth management business are dependent on the level of assets under management. Any significant downturn in the equity markets may lead Arrow's trust and wealth management customers to liquidate their investments, or may diminish account values for those customers who elect to leave their portfolios with Arrow, in either case reducing assets under management and thereby decreasing revenues from this important sector of the business. Other fee-based businesses are also susceptible to a sudden economic or financial downturn.
In addition, Arrow's loan quality is affected by the condition of the economy. Like all financial institutions, Arrow maintains an allowance for credit losses to provide for probable credit losses at the balance sheet date. Arrow's allowance for credit losses is based on its historical loss experience as well as an evaluation of the risks associated with its loan portfolio, including the size and composition of the portfolio, current economic conditions and geographic concentrations within the portfolio and other factors. While Arrow has continued to enjoy a very high level of quality in its loan portfolio generally and very low levels of loan charge-offs and non-performing loans, if the economy in Arrow's geographic market area should deteriorate to the point that recessionary conditions return, or if the regional or national economy experiences a protracted period of stagnation, the quality of our loan portfolio may weaken so significantly that its allowance for loan losses may not be adequate to cover actual or expected loan losses. In such events, Arrow may be required to increase its provisions for credit losses and this could materially and adversely affect financial results. Moreover, weak or worsening economic conditions often lead to difficulties in other areas of its business, including growth of its business generally, thereby compounding the negative effects on earnings.
Potential complications with the implementation of our new core banking system could adversely impact our business and operations. Arrow relies extensively on information systems and technology to manage the Company's business and summarize operating results. During September 2022, Arrow completed the implementation of a new core banking system which replaced the prior system. The new core system will enable future enhancements to our digital experience, improve efficiency for our teams and customers, and empower data-driven decisions. This upgrade constitutes a major investment in Arrow’s technology needs and is a key initiative within its strategic plan. The new core system implementation process has required, and will continue to require, the investment of significant personnel and financial resources. We are now using the new core system. In connection with the conversion, we have encountered, and are continuing to experience, operational and other issues, certain of which have required substantial time and resources to address, and which have had a negative impact on our operations and business and have contributed to the material weaknesses in the Company’s internal controls described in Part II, Item 9A, Controls and Procedures. We are continuing to resolve these issues expeditiously, but there can be no assurance that such issues will not have a further negative impact on our operations or business.
Arrow faces continuing and growing security risks to its information base including the information maintained relating to customers, and any breaches in the security systems implemented to protect this information could have a material negative effect on Arrow's business operations and financial condition. In the ordinary course of business, Arrow relies on electronic communications and information systems to conduct its operations and to store sensitive data.
Arrow employs an in-depth, layered, defensive approach that leverages people, processes and technology to manage and maintain cybersecurity controls. Arrow employs a variety of preventative and detective tools to monitor, block, and provide alerts regarding suspicious activity, as well as to report on any suspected advanced persistent threats. Arrow has implemented and regularly reviews and updates extensive systems of internal controls and procedures as well as corporate governance policies and procedures intended to protect its business operations, including the security and privacy of all confidential customer information. In addition, Arrow relies on the services of a variety of vendors to meet data processing and communication needs. No matter how well designed or implemented its controls are, Arrow cannot provide an absolute guarantee to protect its business operations from every type of cybersecurity or other security problem in every situation, whether as a result of systems failures, human error or negligence, cyberattacks, security breaches, fraud or misappropriation. Any failure or circumvention of these controls could have a material adverse effect on Arrow's business operations and financial condition. Notwithstanding the strength of defensive measures, the threat from cyberattacks is severe, attacks are sophisticated and increasing in volume, and attackers respond rapidly to changes in defensive measures. While to date, Arrow has not experienced a significant compromise, significant data loss or any material financial losses related to cybersecurity attacks or other security problems, Arrow's systems and those of its customers and third-party service providers are under constant threat. Risks and exposures related to cybersecurity attacks or other security problems are expected to remain high for the foreseeable future due to the rapidly evolving nature and sophistication of these threats and issues, as well as due to the expanding use of Internet banking, mobile banking and other technology-based products and services by Arrow and customers.
The computer systems and network infrastructure that Arrow uses are always vulnerable to unforeseen disruptions, including theft of confidential customer information (“identity theft”) and interruption of service as a result of fire, natural disasters, explosion, general infrastructure failure, cyberattacks or other security problems. These disruptions may arise in Arrow's internally developed systems, or the systems of our third-party service providers or may originate from the actions of our consumer and business customers who access our systems from their own networks or digital devices to process transactions. Information security and cyber security risks have increased significantly in recent years because of consumer demand to use the Internet and other electronic delivery channels to conduct financial transactions. Cybersecurity risk and other security problems are a major concern to financial services regulators and all financial service providers, including Arrow. These risks are further exacerbated due to the increased sophistication and activities of organized crime, hackers, terrorists and other disreputable parties. Arrow regularly assesses and tests security systems and disaster preparedness, including back-up systems, but the risks are substantially escalating. As a result, cybersecurity and the continued enhancement of Arrow's controls and processes to protect its systems, data and networks from attacks or unauthorized access remain a priority. Accordingly, Arrow may be required to expend additional resources to enhance its protective measures or to investigate and remediate any information security vulnerabilities or exposures. Any breach of Arrow's system security could result in disruption of its operations, unauthorized access to confidential customer information, significant regulatory costs, litigation exposure and other possible damages, loss or liability. Such costs or losses could exceed the amount of available insurance coverage, if any, and would adversely affect Arrow's earnings. Also, any failure to prevent a security breach or to quickly and effectively deal with such a breach could negatively impact customer confidence, damaging Arrow's reputation and undermining its ability to attract and keep customers. In addition, if Arrow fails to observe any of the cybersecurity requirements in federal or state laws, regulations or regulatory guidance, Arrow could be subject to various sanctions, including financial penalties.
Business could suffer if Arrow loses key personnel unexpectedly or if employee wages increase significantly. Arrow's success depends, in large part, on Arrow's ability to retain key personnel for the duration of their expected terms of service. On an ongoing basis, Arrow prepares and reviews back-up plans, in the event key personnel are unexpectedly rendered incapable of performing or depart or resign from their positions. However, any sudden unexpected change at the senior management level may adversely affect business. In addition, should Arrow's industry begin to experience a shortage of qualified employees, Arrow, like other financial institutions or businesses in general, may have difficulty attracting and retaining entry level or higher bracket personnel and also may experience, as a result of such shortages or the enactment of higher minimum wage laws locally or nationwide, increased salary expense, which would likely negatively impact results of operations.
COVID-19 or other health emergencies may adversely affect Arrow’s business activities, financial condition and results of operations. The business of Arrow and its subsidiary banks depends on the willingness and ability of its customers to conduct financial transactions. COVID-19 or other health emergencies could disrupt the business, activities, and operations of Arrow’s customers, as well as Arrow's business and operations.
Arrow has taken steps to mitigate the risk of harm to its employees and customers and to its operations from the COVID-19 pandemic or other events through its business continuity plan. There are a number of uncertainties related to the potential effects of a pandemic that may not be able to be addressed by this effort. If the spread of a pandemic or a health emergency has an adverse effect on (i) customer deposits, (ii) the ability of borrowers to satisfy their obligations, (iii) the demand for loans or other financial products and services, (iv) the ability of Arrow’s personnel and third party service providers to perform effectively, (v) financial markets, real estate markets, or economic growth, or (vi) other aspects of operations, then Arrow’s liquidity, financial condition and/or results of operations may be materially and adversely affected.
FINANCIAL RISKS
Arrow is subject to interest rate risk, which could adversely affect profitability. Profitability, like that of most financial institutions, depends to a large extent on Arrow's net interest income, which is the difference between interest income on interest-earning assets, such as loans and investment securities, and interest expense on interest-bearing liabilities, such as deposits and borrowings. Changes in monetary policy, including changes in interest rates, could influence not only the interest received on loans and securities and the amount of interest paid on deposits and borrowings, but also (1) Arrow's ability to originate loans and obtain deposits, (2) the fair value of financial assets and liabilities, and (3) the average duration of mortgage-backed securities portfolio. If the interest rates Arrow pays on deposits and other borrowings increase at a faster rate than the interest rates received on loans, securities and other interest-earning investments, net interest income, and therefore earnings, could be adversely affected. Earnings could also be adversely affected if the interest rates received on loans and other investments fall more quickly than the interest rates paid on deposits and other borrowings. Changes in interest rates, whether they are increases or decreases, can also trigger repricing and changes in the pace of payments for both assets and liabilities.
Beginning and continuing throughout 2022, the Federal Reserve raised benchmark interest rates, partially in response to increasing inflation. In 2023, rates may continue to rise and/or stay at elevated levels. Higher interest rates could have a negative impact on results of operations by reducing the ability of borrowers to repay their current loan obligations. These circumstances could not only result in increased loan defaults, foreclosures and charge-offs, but also necessitate further increases to the allowance for credit losses which may materially and adversely affect Arrow's business, results of operations, financial condition and prospects.
Arrow could recognize losses on securities held in our securities portfolio, particularly if interest rates increase or economic and market conditions deteriorate. Factors beyond our control can significantly influence and cause potential adverse changes to the fair value of securities in our portfolio. For example, fixed-rate securities acquired by us are generally subject to decreases in market value when interest rates rise. Additional factors include, but are not limited to, rating agency downgrades of the securities, our own analysis of the value of the securities, defaults by the issuers or individual mortgagors with respect to the underlying securities and instability in the credit markets. Any of the foregoing factors, as well as changing economic and market conditions, generally, could cause other-than-temporary impairments, realized or unrealized losses in future periods and declines in other comprehensive income, any of which could have a material adverse effect on our business, financial condition, results of operations and growth prospects. The process for determining whether an impairment is other-than-temporary requires complex, subjective judgments about Arrow's future financial performance and liquidity, the fair value of any collateral underlying the security and whether and to what extent the principal and interest on the security will ultimately be paid in accordance with its payment terms, any of which could subsequently prove to have been wrong.
Arrow's allowance for possible credit losses may be insufficient, and an increase in the allowance would reduce earnings. The allowance is established through a provision for credit losses based on management’s evaluation of the risks inherent in the loan portfolio and the general economy. The allowance is based upon a number of factors, including the size of the loan portfolio, asset classifications, economic trends, industry experience and trends, industry and geographic concentrations, estimated collateral values, management’s assessment of the credit risk inherent in the portfolio, historical loss experience and loan underwriting policies. In addition, Arrow evaluates all loans identified as problem loans and augments the allowance based upon an estimation of the potential loss associated with those problem loans. Additions to the allowance for credit losses decrease net income through provisions for credit losses. If the evaluation performed in connection with establishing credit loss reserves is wrong, the allowance for credit losses may not be sufficient to cover Arrow's losses, which would have an adverse effect on operating results. Arrow's regulators, in reviewing the loan portfolio as part of a regulatory examination, may from time to time require Arrow to increase the allowance for credit losses, thereby negatively affecting earnings, financial condition and capital ratios at that time. Moreover, additions to the allowance may be necessary based on changes in economic and real estate market conditions, new information regarding existing loans and leases, identification of additional problem loans and other factors, both within and outside of Arrow's control. Additions to the allowance could have a negative impact on Arrow's results of operations.
Arrow’s financial condition and the results of its operations could be negatively impacted by liquidity management. Arrow’s liquidity can be significantly and negatively impacted by factors outside the Company’s control, including general disruptions in the financial markets, governmental fiscal and monetary policies, regulatory changes, negative investor perceptions of Arrow’s creditworthiness, unexpected increases in cash or collateral requirements and the consequent inability to monetize available liquidity resources. Further, competition for deposits has continued to increase in recent years, including as a result of online banks and digital banking and fixed income alternatives for customer funds. Continued or increased competition for deposits in the current higher interest rate environment could negatively impact Arrow’s liquidity going forward.
In addition, as a holding company, Arrow relies on interest, dividends, distributions and other payments from its subsidiary banks to fund dividends as well as to satisfy its debt and other obligations. Limitations on the payments that Arrow receives from its subsidiary banks could also impact Arrow’s liquidity. A bank holding company is required by law to act as a source of financial and managerial strength for its subsidiary banks. As a result, Arrow may be required to commit resources to its subsidiary banks, even if doing so is not otherwise in the interests of the Company, its shareholders or its creditors, which could reduce the amount of funds available to meet its obligations.
The increasing complexity of Arrow's operations presents varied risks that could affect earnings and financial condition. Arrow processes a large volume of transactions on a daily basis and is exposed to numerous types of risks related to internal processes, people and systems. These risks include, but are not limited to, the risk of fraud by persons inside or outside the Company, the execution of unauthorized transactions by employees, errors relating to transaction processing and systems, breaches of data security, human error or negligence, and Arrow's internal control system and compliance with a complex array of consumer and safety and soundness regulations. Arrow could also experience additional loss as a result of potential legal actions that could arise as a result of operational deficiencies or as a result of noncompliance with applicable laws and regulations.
We have identified material weaknesses in our internal control over financial reporting which could, if not remediated, result in a material misstatement of our financial statements. Although Arrow established and maintained a system of internal controls to provide management with information on a timely basis and allow for the monitoring of compliance with operational standards, we have identified material weaknesses in our system of internal controls. Specifically, in connection with management's evaluation of the effectiveness of our internal control over financial reporting as of December 31, 2022, we determined that we did not maintain effective monitoring controls in relation to testing, communication, and oversight over internal controls over financial reporting. Also, with regard to the conversion of our core banking information technology system, we did not effectively perform risk assessment procedures to identify the impact of the conversion on our internal control over financial reporting. The material weaknesses did not result in a material misstatement of our annual or interim financial statements. However, the material weaknesses could result in a misstatement of certain account balances or disclosures that could result in a material misstatement to the annual or interim financial statements which would not be prevented or detected in a timely manner. Losses from operational risks may still occur, however, including losses from the effects of operational errors. We have developed and are executing upon a plan of remediation to address the identified material weaknesses.
If our remediation efforts are insufficient to address the identified material weaknesses or if additional material weaknesses in internal controls are discovered in the future, we may be unable to timely and accurately record, process, summarize and report our financial results. The occurrence of or failure to remediate a material weakness may adversely affect our reputation and business and the market price of shares of our common stock. For additional discussion, see Part II, Item 9A, Controls and Procedures.
RISKS RELATED TO OWNING OUR COMMON STOCK
The Company relies on the operations of its banking subsidiaries to provide liquidity, which, if limited, could impact Arrow's ability to pay dividends to its shareholders or to repurchase its common stock. Arrow is a bank holding company, a separate legal entity from its subsidiaries. The bank holding company does not have significant operations of its own. The ability of the subsidiaries, including bank and insurance subsidiaries, to pay dividends is limited by various statutes and regulations. It is possible, depending upon the financial condition of Arrow's subsidiaries and other factors, that the subsidiaries might be restricted at some point in the ability to pay dividends to the holding company, including by a bank regulator asserting that the payment of such dividends or other payments would constitute an unsafe or unsound practice. In addition, under federal banking law, Arrow is subject to consolidated capital requirements at the holding company level. If the holding company or the bank subsidiaries are required to retain or increase capital, Arrow may not be able to maintain the cash dividends or pay dividends at all, or to repurchase shares of Arrow's common stock.
LEGAL, TAX, REGULATORY AND COMPLIANCE RISKS
Capital and liquidity standards require banks and bank holding companies to maintain more and higher quality capital and greater liquidity than has historically been the case. Capital standards, particularly those adopted as a result of Dodd-Frank, continue to have a significant effect on banks and bank holding companies, including Arrow. The need to maintain more and higher quality capital, as well as greater liquidity, and generally increased regulatory scrutiny with respect to capital levels, may at some point limit business activities, including lending, and our ability to expand. It could also result in Arrow being required to take steps to increase regulatory capital and may dilute shareholder value or limit the ability to pay dividends or otherwise return capital to investors through stock repurchases. The Capital Rules promulgated under Dodd-Frank will remain applicable to Arrow.
Federal banking statutes and regulations could change in the future, which may adversely affect Arrow. Arrow is subject to extensive federal and state banking regulations and supervision. Banking laws and regulations are intended primarily to protect bank depositors’ funds (and indirectly the Federal Deposit Insurance Fund) as well as bank retail customers, who may lack the sophistication to understand or appreciate bank products and services. These laws and regulations generally are not, however, aimed at protecting or enhancing the returns on investment enjoyed by bank shareholders.
Arrow's depositor/customer awareness of the changing regulatory environment is particularly true of the set of laws and regulations under Dodd-Frank, which were passed in the aftermath of the 2008-09 financial crisis and in large part were intended to better protect bank customers (and to some degree, banks) against a wide variety of lending products and aggressive lending practices that pre-dated the crisis and are seen as having contributed to its severity. Although not all banks offered such products or engaged in such practices, all banks are affected by these laws and regulations to some degree.
Dodd-Frank restricts Arrow's lending practices, requires us to expend substantial additional resources to safeguard customers, significantly increases its regulatory burden, and subjects Arrow to significantly higher minimum capital requirements which, in the long run, may serve as a drag on its earnings, growth and ultimately on its dividends and stock price (the Dodd-Frank capital standards are separately addressed in a previous risk factor).
Although the Economic Growth Act and similar initiatives may mitigate the impact of Dodd-Frank, other statutory and regulatory changes including additional guidance and interpretations of existing rules and requirements could add to the existing regulatory burden imposed on banking organizations like Arrow, resulting in a potential material adverse effect on Arrow's financial condition and results of operations.
Non-compliance with the Patriot Act, Bank Secrecy Act, or other anti-money laundering laws and regulations could result in fines or sanctions and restrictions on conducting acquisitions or establishing new branches. The Patriot Act and Bank Secrecy Act require financial institutions to develop programs to prevent financial institutions from being used for money laundering and terrorist activities. If such activities are suspected, financial institutions are obligated to file suspicious activity reports with FinCEN. Federal anti-money laundering rules require financial institutions to establish procedures for identifying and verifying the identity of customers seeking to open new financial accounts. Failure to comply with these regulations could result in fines or sanctions, and restrictions on conducting acquisitions or establishing new branches. During the last few years, several banking institutions have received large fines for non-compliance with these laws and regulations. The policies and procedures Arrow adopted that are designed to assist in compliance with these laws and regulations may not be effective in preventing violations of these laws and regulations.
Arrow, through its banking subsidiaries, is subject to the CRA and fair lending laws, and failure to comply with these laws could lead to material penalties. CRA, the Equal Credit Opportunity Act, the Fair Housing Act and other fair lending laws and regulations impose nondiscriminatory lending requirements on financial institutions. A successful regulatory challenge to an institution’s performance under the CRA or fair lending laws and regulations could result in a wide variety of sanctions, including the required payment of damages and civil money penalties, injunctive relief, imposition of restrictions on mergers and acquisitions activity and restrictions on expansion. Private parties may also have the ability to challenge an institution’s performance under fair lending laws in private class action litigation. Such actions could have a material adverse effect on Arrow's business, financial condition and results of operations.
Item 1B. Unresolved Staff Comments - None Arrow's main office is at 250 Glen Street, Glens Falls, New York.
Item 2. Properties
The building is owned by Glens Falls National and serves as the main office for Arrow and Glens Falls National. Arrow is nearing completion of a multi-year renovation project to enhance and improve the downtown Glens Falls Main Campus. Current efforts are focused on 240 and 250 Glen Street, where Arrow is nearing completion of a two-year reconstruction that will provide added energy efficiency, productivity, and more collaborative work space. This phase of the project will also provide for a renovated and more functional Main Office branch and lending space for customers. Arrow's investment in its downtown campus dates back to 2012 with the construction of our 20 South Street Building and has continued with phased improvements to other adjacent properties. After the 240 and 250 Glen Street work is completed, some smaller-scale enhancements remain after which Arrow will have renovated and improved the entire Main Campus in Glens Falls, New York. The main office of the other banking subsidiary, Saratoga National, is in Saratoga Springs, New York. Arrow owns 26 branch banking offices, leases 11 branch banking offices, leases two residential loan origination offices and a business development office, all at market rates. Arrow's insurance agency is co-located in eight bank-owned branches, as well as two leased insurance offices. Arrow also leases office space in buildings and parking lots near the main office in Glens Falls as well as a back-up site for business continuity purposes.
In the opinion of management, the physical properties of the holding company and the various subsidiaries are suitable and adequate. For more information on Arrow's properties, see Notes 2, Summary of Significant Accounting Policies, 6, Premises and Equipment, and 18, Leases, to the Consolidated Financial Statements contained in Part II, Item 8 of this Report.
Item 3. Legal Proceedings
Except as noted below, Arrow, including its subsidiary banks, is not currently the subject of any material pending legal proceedings, other than ordinary routine litigation occurring in the normal course of their business. On an ongoing basis, Arrow is often the subject of, or a party to, various legal claims by other parties against Arrow, by Arrow against other parties, or involving Arrow, which arise in the normal course of business. Except as noted below, the various pending legal claims against Arrow will not, in the opinion of management based upon consultation with counsel, result in any material liability.
On July 1, 2020, Daphne Richard, a customer of Glens Falls National Bank and Trust Company (“GFNB”), filed a putative class action complaint against GFNB. The complaint alleged that GFNB assessed overdraft fees on certain transactions drawn on Ms. Richard’s checking account without having sufficiently disclosed its overdraft-fee practices in its account agreement. Ms. Richard, on behalf of two purported classes, sought compensatory damages, disgorgement of profits, statutory damages, treble damages, enjoinment of the conduct complained of, and costs and fees. The complaint was similar to complaints filed against other financial institutions pertaining to overdraft fees. The Court granted final approval of a settlement on July 22, 2022. The settlement, which includes and releases Arrow, GFNB, and SNB (collectively, “Defendants”), required the Defendants to establish a $1.475 million settlement fund, among other terms. The case has been closed, and the settlement funds have been substantially distributed to the class.
The Company became aware that on June 23, 2023, Robert C. Ashe filed a putative class action complaint against the Company in the United States District Court for the Northern District of New York. In addition to the Company, the complaint names as defendants Thomas J. Murphy, the Company’s former CEO and from September 30, 2022 to February 20, 2023, its interim CFO, Edward J. Campanella, the Company’s former CFO, and Penko Ivanov, the Company’s current CFO (“Individual Defendants” and, together with the Company, the "Defendants"). The complaint alleges that the Defendants made materially false and misleading statements regarding the Company’s business, operations and compliance policies in the Company’s public filings between March 12, 2022 and May 12, 2023. The complaint further alleges that the Individual Defendants are liable for these materially false and misleading statements as "controlling persons" of the Company. Based on these allegations, the complaint brings two claims for violations of Section 10(b) of the Exchange Act and Rule 10b-5 promulgated thereunder and of Section 20(a) of the Exchange Act. Mr. Ashe, on behalf of a purported class of shareholders, seeks compensatory damages as well as recovery of the costs and fees associated with the litigation. The Company believes the lawsuit to be without merit and expressly denies any wrongdoing in connection with the matters claimed in the complaint and intends to vigorously defend the lawsuit. As of the date of filing of this Form 10-K, the Company has not been served with the complaint.
Item 4. Mine Safety Disclosures - None Item 5.
PART II
Market for the Registrant's Common Equity, Related Stockholder Matters and Issuer Purchases of Equity Securities
Arrow's common stock is traded on the Global Select Market of the National Association of Securities Dealers, Inc. ("NASDAQ®") Stock Market under the symbol AROW.
Based on information received from Arrow's transfer agent and various brokers, custodians and agents, Arrow estimates there were approximately 9,700 beneficial owners of Arrow’s common stock at December 31, 2022. Arrow has no other class of stock outstanding.
Equity Compensation Plan Information
The following table sets forth certain information regarding Arrow's equity compensation plans as of December 31, 2022. These equity compensation plans were (i) the 2022 Long-Term Incentive Plan ("LTIP") and its predecessors; (ii) the Amended and Restated 2011 Employee Stock Purchase Plan ("ESPP"); and (iii) the 2020 Directors' Stock Plan ("DSP"). All of these plans have been approved by Arrow's shareholders.
|
|
|
|
|
|
|
|
|
|
|
|
|
|
|
|
|
|
| Plan Category |
(a)
Number of Securities to be Issued Upon Exercise of Outstanding Options, Restricted Stock Units, Warrants and Rights |
|
(b)
Weighted-Average
Exercise Price of Outstanding Options, Restricted Stock Units, Warrants and Rights |
|
(c)
Number of Securities Remaining Available for Future Issuance Under Equity Compensation Plans (Excluding Securities Reflected in Column (a)) |
Equity Compensation Plans Approved by Security Holders (1)(2) |
300,761 |
|
|
$ |
27.29 |
|
|
735,737 |
|
| Equity Compensation Plans Not Approved by Security Holders |
— |
|
|
|
— |
|
| Total |
300,761 |
|
|
|
|
735,737 |
|
(1)The total of 300,761 shares listed in column (a) includes 279,050 which are issuable pursuant to outstanding stock options and 21,711 which are issuable pursuant to restricted stock units all granted under the LTIP or its predecessor plans.
(2)The total of 735,737 shares listed in column (c) includes (i) 463,500 shares of common stock available for future award grants under the LTIP, (ii) 247,077 shares of common stock available for future issuance under the ESPP, and (iii) 25,160 shares of common stock available for future issuance under the DSP.
STOCK PERFORMANCE GRAPHS
The following two graphs provide a comparison of the total cumulative return (assuming reinvestment of dividends) for the common stock of Arrow as compared to the Russell 2000 Index, the ABA NASDAQ Community Bank TRBanks Index and the Zacks $1B-$5B Bank Assets Index.
The first graph presents comparative stock performance for the five-year period from December 31, 2017 to December 31, 2022 and the second graph presents comparative stock performance for the fifteen-year period from December 31, 2007 to December 31, 2022.
The historical information in the graphs and accompanying tables may not be indicative of future performance of Arrow stock on the various stock indices.
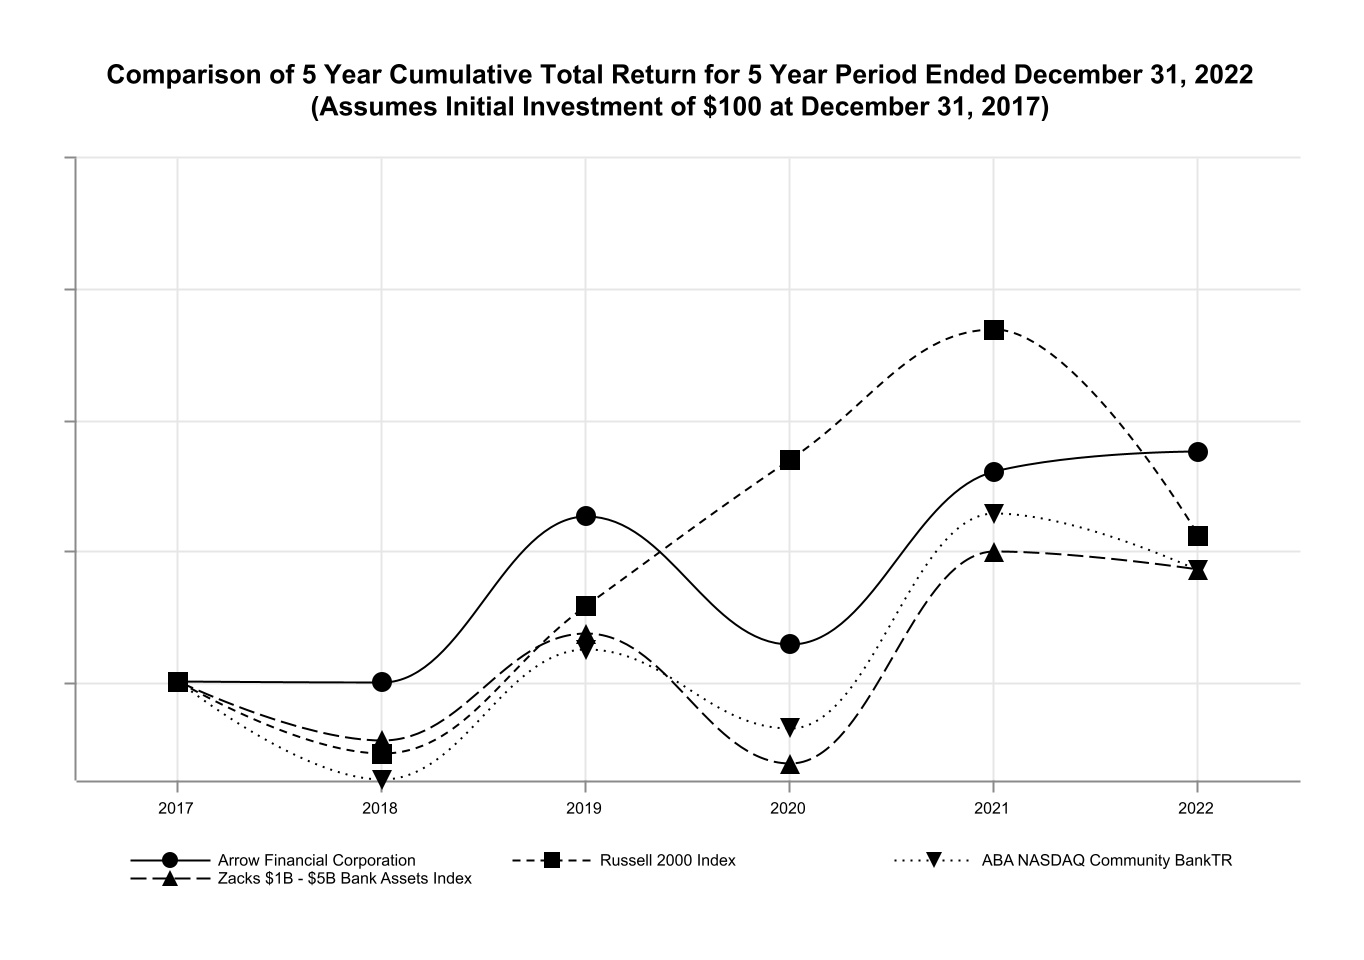
|
|
|
|
|
|
|
|
|
|
|
|
|
|
|
|
|
|
|
|
|
|
|
|
|
|
|
|
|
|
|
|
|
|
|
|
|
TOTAL RETURN PERFORMANCE
Period Ending |
| Index |
2017 |
|
2018 |
|
2019 |
|
2020 |
|
2021 |
|
2022 |
| Arrow Financial Corporation |
100.00 |
|
|
99.95 |
|
|
125.32 |
|
|
105.75 |
|
|
132.15 |
|
|
135.21 |
|
| Russell 2000 Index |
100.00 |
|
|
88.99 |
|
|
111.70 |
|
|
134.00 |
|
|
153.85 |
|
|
122.41 |
|
| ABA NASDAQ Community Bank TR |
100.00 |
|
|
85.10 |
|
|
104.92 |
|
|
92.80 |
|
|
125.74 |
|
|
116.95 |
|
| Zacks $1B - $5B Bank Assets Index |
100.00 |
|
|
91.08 |
|
|
107.31 |
|
|
87.54 |
|
|
119.93 |
|
|
117.09 |
|
Source: Prepared by Zacks Investment Research, Inc. Used with permission. All rights reserved. Copyright 1980-2023.
|
|
|
|
|
|
|
|
|
|
|
|
|
|
|
|
|
|
|
|
|
|
|
|
|
|
|
|
|
|
|
|
|
|
|
|
|
|
|
|
|
|
|
|
|
|
|
|
|
TOTAL RETURN PERFORMANCE
Period Ending |
| Index |
2007 |
|
2008 |
|
2009 |
|
2010 |
|
2011 |
|
2012 |
|
2013 |
|
2014 |
| Arrow Financial Corporation |
100.00 |
|
|
122.38 |
|
|
130.63 |
|
|
154.46 |
|
|
141.58 |
|
|
160.07 |
|
|
180.61 |
|
|
197.93 |
|
| Russell 2000 Index |
100.00 |
|
|
66.21 |
|
|
84.20 |
|
|
106.81 |
|
|
102.34 |
|
|
119.08 |
|
|
165.30 |
|
|
173.38 |
|
| ABA NASDAQ Community Bank TR |
100.00 |
|
|
82.95 |
|
|
67.03 |
|
|
74.71 |
|
|
69.83 |
|
|
82.20 |
|
|
116.47 |
|
|
121.89 |
|
| Zacks $1B - $5B Bank Assets Index |
100.00 |
|
|
84.84 |
|
|
70.34 |
|
|
75.77 |
|
|
70.60 |
|
|
84.44 |
|
|
106.87 |
|
|
116.78 |
|
|
|
|
|
|
|
|
|
|
|
|
|
|
|
|
|
|
TOTAL RETURN PERFORMANCE (Cont'd.)
Period Ending |
| Index |
2015 |
|
2016 |
|
2017 |
|
2018 |
|
2019 |
|
2020 |
|
2021 |
|
2022 |
| Arrow Financial Corporation |
206.94 |
|
|
327.92 |
|
|
291.54 |
|
|
291.38 |
|
|
365.37 |
|
|
308.29 |
|
|
385.27 |
|
|
394.20 |
|
| Russell 2000 Index |
165.74 |
|
|
201.06 |
|
|
230.51 |
|
|
205.13 |
|
|
257.49 |
|
|
308.89 |
|
|
354.66 |
|
|
282.18 |
|
| ABA NASDAQ Community Bank TR |
133.53 |
|
|
185.30 |
|
|
190.06 |
|
|
161.73 |
|
|
199.42 |
|
|
176.38 |
|
|
238.98 |
|
|
222.27 |
|
| Zacks $1B - $5B Bank Assets Index |
128.83 |
|
|
178.65 |
|
|
197.52 |
|
|
179.90 |
|
|
211.95 |
|
|
172.90 |
|
|
236.87 |
|
|
231.26 |
|
Source: Prepared by Zacks Investment Research, Inc. Used with permission. All rights reserved. Copyright 1980-2023.
The preceding stock performance graphs and tables shall not be deemed incorporated by reference, by virtue of any general statement contained herein or in any other filing incorporated by reference herein, into any other SEC filing by the Company under the Securities Act of 1933, as amended, or the Securities Exchange Act of 1934, as amended, except to the extent the Company specifically incorporates this information by reference into such filing, and shall not otherwise be deemed filed as part of any such other filing.
Unregistered Sales of Equity Securities Issuer Purchases of Equity Securities
None.
The following table presents information about repurchases by Arrow during the three months ended December 31, 2022 of Arrow's common stock (the only class of equity securities registered pursuant to Section 12 of the Securities Exchange Act of 1934):
|
|
|
|
|
|
|
|
|
|
|
|
|
|
|
|
|
|
|
|
|
|
|
|
|
Fourth Quarter 2022
Calendar Month
|
(a) Total Number of
Shares Purchased1
|
|
(b) Average Price Paid Per Share1 |
|
(c) Total Number of
Shares Purchased as
Part of Publicly
Announced
Plans or Programs2
|
|
(d) Maximum
Approximate Dollar
Value of Shares that
May Yet be
Purchased Under the
Plans or Programs2
|
| October |
1,668 |
|
|
$ |
30.58 |
|
|
— |
|
$ |
2,535,669 |
|
| November |
4,998 |
|
|
35.45 |
|
|
— |
|
2,535,669 |
|
| December |
14,686 |
|
|
34.23 |
|
|
— |
|
2,535,669 |
|
| Total |
21,352 |
|
|
34.23 |
|
|
— |
|
|
1 The total number of shares purchased and the average price paid per share listed in columns (a) and (b) consist of (i) any shares purchased in such periods in open market or private transactions under the Arrow Financial Corporation Automatic Dividend Reinvestment Plan (the "DRIP") by the administrator of the DRIP, and (ii) shares surrendered or deemed surrendered to Arrow in such periods by holders of options to acquire Arrow common stock received by them under Arrow's long-term incentive plans ("LTIPs") in connection with their stock-for-stock exercise of such options, and shares repurchased by Arrow pursuant to its publicly-announced stock repurchase program. In the months indicated, the listed number of shares purchased included the following numbers of shares purchased by Arrow through such methods: October - DRIP purchases (1,668 shares); November - DRIP purchases (747 shares), stock-for-stock option exercises (4,251 shares); and December - DRIP purchases (14,686 shares). We have suspended the operation of the DRIP as a result of the delayed filing of this Form 10-K and the related effects under applicable securities laws. Currently, we do not expect to resume operation of the DRIP for at least 12 months from the date we have filed the outstanding reports, but we cannot provide any assurance on when or if we will resume operation of the DRIP, although we expect this suspension is temporary.
2 Includes only those shares acquired by Arrow pursuant to its publicly-announced stock repurchase programs. Arrow's only publicly announced stock repurchase program in effect for 2022 was the 2022 Repurchase Program approved by the Board of Directors and announced in October 2021, under which the Board authorized management, in its discretion,to repurchase from time to time over calendar year 2022, in the open market or in privately negotiated transactions, up to $5 million of Arrow common stock subject to certain exceptions. In October 2022, the Board of Directors of Arrow approved a new stock repurchase program authorizing the repurchase, at the discretion of senior management, of up to $5 million of the Company’s common stock over the 2023 calendar year, in open-market or negotiated transactions. This new repurchase program replaced the prior $5 million repurchase program authorized on October 27, 2021, which expired December 31, 2022.
Item 6. Reserved
Item 7. Management's Discussion and Analysis of Financial Condition and Results of Operations
Selected Quarterly Information
Dollars in thousands, except per share amounts
Share and per share amounts have been restated for the September 2022 3% stock dividend
|
|
|
|
|
|
|
|
|
|
|
|
|
|
|
|
|
|
|
|
|
|
|
|
|
|
|
|
|
|
| Quarter Ended |
12/31/2022 |
|
9/30/2022 |
|
6/30/2022 |
|
3/31/2022 |
|
12/31/2021 |
| Net Income |
$ |
12,087 |
|
|
$ |
12,163 |
|
|
$ |
11,974 |
|
|
$ |
12,575 |
|
|
$ |
10,309 |
|
| Transactions Recorded in Net Income (Net of Tax): |
|
|
|
|
|
|
|
|
|
|
|
|
|
|
|
|
|
|
|
| Net Changes in Fair Value of Equity Investments |
35 |
|
|
70 |
|
|
114 |
|
|
96 |
|
|
(104) |
|
|
|
|
|
|
|
|
|
|
|
Share and Per Share Data: 1 |
|
|
|
|
|
|
|
|
|
| Period End Shares Outstanding |
16,552 |
|
|
16,523 |
|
|
16,503 |
|
|
16,493 |
|
|
16,522 |
|
| Basic Average Shares Outstanding |
16,535 |
|
|
16,512 |
|
|
16,494 |
|
|
16,511 |
|
|
16,509 |
|
| Diluted Average Shares Outstanding |
16,589 |
|
|
16,558 |
|
|
16,535 |
|
|
16,566 |
|
|
16,574 |
|
| Basic Earnings Per Share |
$ |
0.73 |
|
|
$ |
0.74 |
|
|
$ |
0.72 |
|
|
$ |
0.76 |
|
|
$ |
0.62 |
|
| Diluted Earnings Per Share |
0.73 |
|
|
0.74 |
|
|
0.72 |
|
|
$ |
0.76 |
|
|
$ |
0.62 |
|
| Cash Dividend Per Share |
0.270 |
|
|
0.262 |
|
|
0.262 |
|
|
0.262 |
|
|
0.252 |
|
| Selected Quarterly Average Balances: |
|
|
|
|
|
|
|
|
|
| Interest-Bearing Deposits at Banks |
$ |
143,499 |
|
|
$ |
209,001 |
|
|
$ |
232,545 |
|
|
$ |
410,644 |
|
|
$ |
551,890 |
|
| Investment Securities |
845,859 |
|
|
821,052 |
|
|
822,112 |
|
|
797,347 |
|
|
681,732 |
|
| Loans |
2,951,547 |
|
|
2,872,066 |
|
|
2,804,180 |
|
|
2,678,796 |
|
|
2,660,665 |
|
| Deposits |
3,614,945 |
|
|
3,598,519 |
|
|
3,569,754 |
|
|
3,582,256 |
|
|
3,590,766 |
|
| Other Borrowed Funds |
63,304 |
|
|
50,125 |
|
|
50,140 |
|
|
68,596 |
|
|
70,162 |
|
| Shareholders’ Equity |
351,402 |
|
|
361,675 |
|
|
357,228 |
|
|
370,264 |
|
|
364,409 |
|
| Total Assets |
4,074,028 |
|
|
4,047,738 |
|
|
4,012,999 |
|
|
4,054,943 |
|
|
4,060,540 |
|
| Return on Average Assets, annualized |
1.18 |
% |
|
1.19 |
% |
|
1.20 |
% |
|
1.26 |
% |
|
1.01 |
% |
| Return on Average Equity, annualized |
13.65 |
% |
|
13.34 |
% |
|
13.44 |
% |
|
13.77 |
% |
|
11.22 |
% |
Return on Average Tangible Equity, annualized 2 |
14.62 |
% |
|
14.27 |
% |
|
14.40 |
% |
|
14.72 |
% |
|
12.01 |
% |
| Average Earning Assets |
$ |
3,940,905 |
|
|
$ |
3,902,119 |
|
|
$ |
3,858,837 |
|
|
$ |
3,886,787 |
|
|
$ |
3,894,287 |
|
| Average Paying Liabilities |
2,891,092 |
|
|
2,781,985 |
|
|
2,808,287 |
|
|
2,855,884 |
|
|
2,841,304 |
|
| Interest Income |
35,904 |
|
|
34,207 |
|
|
30,593 |
|
|
28,947 |
|
|
28,354 |
|
Tax-Equivalent Adjustment 3 |
279 |
|
|
268 |
|
|
269 |
|
|
270 |
|
|
285 |
|
Interest Income, Tax-Equivalent 3 |
36,183 |
|
|
34,475 |
|
|
30,862 |
|
|
29,217 |
|
|
28,639 |
|
| Interest Expense |
5,325 |
|
|
3,306 |
|
|
1,555 |
|
|
1,122 |
|
|
1,152 |
|
| Net Interest Income |
30,579 |
|
|
30,901 |
|
|
29,038 |
|
|
27,825 |
|
|
27,202 |
|
Net Interest Income, Tax-Equivalent 3 |
30,858 |
|
|
31,169 |
|
|
29,307 |
|
|
28,095 |
|
|
27,487 |
|
| Net Interest Margin, annualized |
3.08 |
% |
|
3.14 |
% |
|
3.02 |
% |
|
2.90 |
% |
|
2.77 |
% |
Net Interest Margin, Tax-Equivalent, annualized 3 |
3.11 |
% |
|
3.17 |
% |
|
3.05 |
% |
|
2.93 |
% |
|
2.80 |
% |
Efficiency Ratio Calculation: 4 |
|
|
|
|
|
|
|
|
|
| Noninterest Expense |
$ |
20,792 |
|
|
$ |
21,448 |
|
|
$ |
20,345 |
|
|
$ |
18,945 |
|
|
$ |
20,860 |
|
| Less: Intangible Asset Amortization |
47 |
|
|
48 |
|
|
48 |
|
|
49 |
|
|
52 |
|
| Net Noninterest Expense |
20,745 |
|
|
21,400 |
|
|
20,297 |
|
|
18,896 |
|
|
20,808 |
|
| Net Interest Income, Tax-Equivalent |
30,858 |
|
|
31,169 |
|
|
29,307 |
|
|
28,095 |
|
|
27,487 |
|
| Noninterest Income |
7,165 |
|
|
7,827 |
|
|
7,744 |
|
|
8,162 |
|
|
7,589 |
|
|
|
|
|
|
|
|
|
|
|
| Less: Net Changes in Fair Value of Equity Investments |
48 |
|
|
95 |
|
|
154 |
|
|
130 |
|
|
(139) |
|
| Net Gross Income |
$ |
37,975 |
|
|
$ |
38,901 |
|
|
$ |
36,897 |
|
|
$ |
36,127 |
|
|
$ |
35,215 |
|
| Efficiency Ratio |
54.63 |
% |
|
55.01 |
% |
|
55.01 |
% |
|
52.30 |
% |
|
59.09 |
% |
Period-End Capital Information: 5 |
|
|
|
|
|
|
|
|
|
| Total Stockholders’ Equity (i.e. Book Value) |
$ |
353,538 |
|
|
$ |
345,550 |
|
|
$ |
356,498 |
|
|
$ |
357,243 |
|
|
$ |
371,186 |
|
Book Value per Share 1 |
21.36 |
|
|
20.91 |
|
|
21.60 |
|
|
21.66 |
|
|
22.47 |
|
| Goodwill and Other Intangible Assets, net |
23,373 |
|
|
23,477 |
|
|
23,583 |
|
|
23,691 |
|
|
23,791 |
|
Tangible Book Value per Share 1,2 |
19.95 |
|
|
19.49 |
|
|
20.17 |
|
|
20.22 |
|
|
21.03 |
|
Capital Ratios: 5 |
|
|
|
|
|
|
|
|
|
| Tier 1 Leverage Ratio |
9.80 |
% |
|
9.71 |
% |
|
9.60 |
% |
|
9.37 |
% |
|
9.20 |
% |
Common Equity Tier 1 Capital Ratio |
13.32 |
% |
|
13.14 |
% |
|
13.14 |
% |
|
13.48 |
% |
|
13.77 |
% |
| Tier 1 Risk-Based Capital Ratio |
14.01 |
% |
|
13.85 |
% |
|
13.86 |
% |
|
14.23 |
% |
|
14.55 |
% |
| Total Risk-Based Capital Ratio |
15.11 |
% |
|
14.93 |
% |
|
14.93 |
% |
|
15.33 |
% |
|
15.69 |
% |
Assets Under Trust Administration & Investment Mgmt
|
$ |
1,606,132 |
|
|
$ |
1,515,994 |
|
|
$ |
1,589,178 |
|
|
$ |
1,793,747 |
|
|
$ |
1,851,101 |
|
Selected Twelve-Month Information
Dollars in thousands, except per share amounts
Share and per share amounts have been restated for the September 2022 3% stock dividend
|
|
|
|
|
|
|
|
|
|
|
|
|
|
|
|
|
|
|
2022 |
|
2021 |
|
2020 |
| Net Income |
$ |
48,799 |
|
|
$ |
49,857 |
|
|
$ |
40,827 |
|
| Transactions Recorded in Net Income (Net of Tax): |
|
|
|
|
|
|
|
|
|
|
|
|
|
|
|
|
|
| Net Gain (Loss) on Securities |
315 |
|
|
83 |
|
|
(346) |
|
|
|
|
|
|
|
|
|
|
|
|
|
|
|
|
|
|
|
|
|
|
|
|
|
|
|
|
|
|
|
Period End Shares Outstanding1 |
16,552 |
|
|
16,522 |
|
|
16,461 |
|
Basic Average Shares Outstanding1 |
16,513 |
|
|
16,499 |
|
|
16,406 |
|
Diluted Average Shares Outstanding1 |
16,562 |
|
|
16,555 |
|
|
16,422 |
|
Basic Earnings Per Share1 |
$ |
2.95 |
|
|
$ |
3.02 |
|
|
$ |
2.49 |
|
Diluted Earnings Per Share1 |
2.95 |
|
|
3.01 |
|
|
2.49 |
|
Cash Dividends Per Share1 |
1.06 |
|
|
0.99 |
|
|
0.96 |
|
| Average Assets |
4,047,480 |
|
|
3,882,642 |
|
|
3,481,761 |
|
| Average Equity |
360,095 |
|
|
353,757 |
|
|
319,814 |
|
| Return on Average Assets |
1.21 |
% |
|
1.28 |
% |
|
1.17 |
% |
| Return on Average Equity |
13.55 |
% |
|
14.09 |
% |
|
12.77 |
% |
| Average Earning Assets |
$ |
3,902,077 |
|
|
$ |
3,716,856 |
|
|
$ |
3,320,937 |
|
| Average Interest-Bearing Liabilities |
2,834,266 |
|
|
2,727,441 |
|
|
2,510,655 |
|
| Interest Income |
129,651 |
|
|
115,550 |
|
|
111,896 |
|
| Interest Income, Tax-Equivalent* |
130,737 |
|
|
116,655 |
|
|
113,000 |
|
| Interest Expense |
11,308 |
|
|
5,195 |
|
|
12,694 |
|
| Net Interest Income |
118,343 |
|
|
110,355 |
|
|
99,202 |
|
| Net Interest Income, Tax-Equivalent* |
119,429 |
|
|
111,460 |
|
|
100,306 |
|
|
|
|
|
|
|
| Net Interest Margin |
3.03 |
% |
|
2.97 |
% |
|
2.99 |
% |
| Net Interest Margin, Tax-Equivalent* |
3.06 |
% |
|
3.00 |
% |
|
3.02 |
% |
Efficiency Ratio Calculation*4 |
|
|
|
|
|
| Noninterest Expense |
$ |
81,530 |
|
|
$ |
78,048 |
|
|
$ |
70,678 |
|
| Less: Intangible Asset Amortization |
193 |
|
|
210 |
|
|
227 |
|
| Net Noninterest Expense |
81,337 |
|
|
77,838 |
|
|
70,451 |
|
| Net Interest Income, Tax-Equivalent |
119,429 |
|
|
111,460 |
|
|
100,306 |
|
| Noninterest Income |
30,898 |
|
|
32,369 |
|
|
32,658 |
|
|
|
|
|
|
|
| Less: Net (Loss) Gain on Securities |
427 |
|
|
111 |
|
|
(464) |
|
| Net Gross Income, Adjusted |
$ |
149,900 |
|
|
$ |
143,718 |
|
|
$ |
133,428 |
|
| Efficiency Ratio* |
54.26 |
% |
|
54.16 |
% |
|
52.80 |
% |
Period-End Capital Information: |
|
|
|
|
|
| Tier 1 Leverage Ratio |
9.80 |
% |
|
9.20 |
% |
|
9.07 |
% |
| Total Stockholders’ Equity (i.e. Book Value) |
$ |
353,538 |
|
|
$ |
371,186 |
|
|
$ |
334,392 |
|
| Book Value per Share |
21.36 |
|
|
22.47 |
|
|
20.31 |
|
| Intangible Assets |
23,373 |
|
|
23,791 |
|
|
23,823 |
|
Tangible Book Value per Share 2 |
19.95 |
|
|
21.03 |
|
|
18.87 |
|
| Asset Quality Information: |
|
|
|
|
|
| Net Loans Charged-off as a Percentage of Average Loans |
0.08 |
% |
|
0.03 |
% |
|
0.05 |
% |
| Provision for Credit Losses as a Percentage of Average Loans |
0.17 |
% |
|
0.01 |
% |
|
0.37 |
% |
| Allowance for Credit Losses as a Percentage of Period-End Loans |
1.00 |
% |
|
1.02 |
% |
|
1.13 |
% |
| Allowance for Credit Losses as a Percentage of Nonperforming Loans |
249.95 |
% |
|
233.89 |
% |
|
456.32 |
% |
| Nonperforming Loans as a Percentage of Period-End Loans |
0.40 |
% |
|
0.44 |
% |
|
0.25 |
% |
| Nonperforming Assets as a Percentage of Total Assets |
0.32 |
% |
|
0.29 |
% |
|
0.18 |
% |
*See "Use of Non-GAAP Financial Measures" on page 4.
Arrow Financial Corporation
Reconciliation of Non-GAAP Financial Information
(Dollars In Thousands, Except Per Share Amounts)
|
|
|
|
|
|
|
|
|
|
|
|
|
|
|
|
|
|
|
|
|
|
|
|
|
|
|
|
|
|
|
|
|
| Footnotes: |
|
|
|
|
|
|
|
|
|
|
|
|
|
|
|
|
|
|
|
| 1. |
Share and per share data have been restated for the September 23, 2022, 3% stock dividend.
|
|
|
| 2. |
Non-GAAP Financial Measure Reconciliation: Tangible Book Value, Tangible Equity, and Return on Tangible Equity exclude goodwill and other intangible assets, net from total equity. These are non-GAAP financial measures which Arrow believes provides investors with information that is useful in understanding its financial performance. |
|
|
12/31/2022 |
|
9/30/2022 |
|
6/30/2022 |
|
3/31/2022 |
|
12/31/2021 |
|
Total Stockholders' Equity (GAAP) |
$ |
353,538 |
|
|
$ |
345,550 |
|
|
$ |
356,498 |
|
|
$ |
357,243 |
|
|
$ |
371,186 |
|
|
Less: Goodwill and Other Intangible assets, net |
23,373 |
|
|
23,477 |
|
|
23,583 |
|
|
23,691 |
|
|
23,791 |
|
|
Tangible Equity (Non-GAAP) |
$ |
330,165 |
|
|
$ |
322,073 |
|
|
$ |
332,915 |
|
|
$ |
333,552 |
|
|
$ |
347,395 |
|
|
|
|
|
|
|
|
|
|
|
|
|
Period End Shares Outstanding |
16,552 |
|
|
16,523 |
|
|
16,503 |
|
|
16,493 |
|
|
16,522 |
|
|
Tangible Book Value per Share (Non-GAAP) |
$ |
19.95 |
|
|
$ |
19.49 |
|
|
$ |
20.17 |
|
|
$ |
20.22 |
|
|
$ |
21.03 |
|
|
Net Income |
12,087 |
|
|
12,163 |
|
|
11,974 |
|
|
12,575 |
|
|
10,309 |
|
|
Return on Tangible Equity (Net Income/Tangible Equity - Annualized) |
14.62 |
% |
|
14.27 |
% |
|
14.40 |
% |
|
14.72 |
% |
|
12.01 |
% |
|
|
|
|
|
|
|
|
|
|
|
| 3. |
Non-GAAP Financial Measure Reconciliation: Net Interest Margin is the ratio of annualized tax-equivalent net interest income to average earning assets. This is also a non-GAAP financial measure which Arrow believes provides investors with information that is useful in understanding its financial performance.
|
|
|
12/31/2022 |
|
9/30/2022 |
|
6/30/2022 |
|
3/31/2022 |
|
12/31/2021 |
|
Interest Income (GAAP) |
$ |
35,904 |
|
|
$ |
34,207 |
|
|
$ |
30,593 |
|
|
$ |
28,947 |
|
|
$ |
28,354 |
|
|
Add: Tax Equivalent Adjustment (Non-GAAP) |
279 |
|
|
268 |
|
|
269 |
|
|
270 |
|
|
285 |
|
|
Interest Income - Tax Equivalent (Non-GAAP) |
$ |
36,183 |
|
|
$ |
34,475 |
|
|
$ |
30,862 |
|
|
$ |
29,217 |
|
|
$ |
28,639 |
|
|
|
|
|
|
|
|
|
|
|
|
|
Net Interest Income (GAAP) |
$ |
30,579 |
|
|
$ |
30,901 |
|
|
$ |
29,038 |
|
|
$ |
27,825 |
|
|
$ |
27,202 |
|
|
Add: Tax-Equivalent adjustment (Non-GAAP) |
279 |
|
|
268 |
|
|
269 |
|
|
270 |
|
|
285 |
|
|
Net Interest Income - Tax Equivalent (Non-GAAP) |
$ |
30,858 |
|
|
$ |
31,169 |
|
|
$ |
29,307 |
|
|
$ |
28,095 |
|
|
$ |
27,487 |
|
|
Average Earning Assets |
$ |
3,940,905 |
|
|
$ |
3,902,119 |
|
|
$ |
3,858,837 |
|
|
$ |
3,886,787 |
|
|
$ |
3,894,287 |
|
|
Net Interest Margin (Non-GAAP) |
3.11 |
% |
|
3.17 |
% |
|
3.05 |
% |
|
2.93 |
% |
|
2.80 |
% |
|
|
|
|
|
|
|
|
|
|
|
| 4. |
Non-GAAP Financial Measure Reconciliation: Financial Institutions often use the "efficiency ratio", a non-GAAP ratio, as a measure of expense control. Arrow believes the efficiency ratio provides investors with information that is useful in understanding its financial performance. Arrow defines efficiency ratio as the ratio of noninterest expense to net gross income (which equals tax-equivalent net interest income plus noninterest income, as adjusted). |
|
|
|
|
|
|
|
|
|
|
|
| 5. |
For the current quarter, all of the regulatory capital ratios as well as the Total Risk-Weighted Assets are calculated in accordance with bank regulatory capital rules. The December 31, 2022 CET1 ratio listed in the tables (i.e., 13.32%) exceeds the sum of the required minimum CET1 ratio plus the fully phased-in Capital Conservation Buffer (i.e., 7.00%). |
|
|
12/31/2022 |
|
9/30/2022 |
|
6/30/2022 |
|
3/31/2022 |
|
12/31/2021 |
|
Total Risk Weighted Assets |
$ |
2,883,902 |
|
|
$ |
2,856,224 |
|
|
$ |
2,790,520 |
|
|
$ |
2,661,952 |
|
|
$ |
2,552,812 |
|
|
Common Equity Tier 1 Capital |
384,003 |
|
|
375,394 |
|
|
366,798 |
|
|
358,738 |
|
|
351,497 |
|
|
Common Equity Tier 1 Ratio |
13.32 |
% |
|
13.14 |
% |
|
13.14 |
% |
|
13.48 |
% |
|
13.77 |
% |
CRITICAL ACCOUNTING ESTIMATES
The significant accounting policies, as described in Note 2 - Summary of Significant Accounting Policies to the Consolidated Financial Statements are essential in understanding the Management Discussion and Analysis. Many of the significant accounting policies require complex judgments to estimate the values of assets and liabilities. Arrow has procedures and processes in place to facilitate making these judgments. The more judgmental estimates are summarized in the following discussion. In many cases, there are numerous alternative judgments that could be used in the process of determining the inputs to the models. Where alternatives exist, Arrow has used the factors that are believed to represent the most reasonable value in developing the inputs. Actual performance that differs from estimates of the key variables could impact the results of operations.
Allowance for credit losses: The allowance for credit losses consists of the allowance for credit losses and the allowance for losses on unfunded commitments. Arrow adopted on January 1, 2021, Accounting Standards Updates (‘‘ASU’’) 2016-13, Financial Instruments - Credit Losses (Topic 326): Measurement of Credit Losses on Financial Instruments (‘‘CECL’’) and its related amendments. The CECL approach requires an estimate of the credit losses expected over the life of an exposure (or pool of exposures). The estimate of expected credit losses under the CECL approach is based on relevant information about past events, current conditions, and reasonable and supportable forecasts that affect the collectability of the reported amounts. Historical loss experience is generally the starting point for estimating expected credit losses. Arrow then considers whether the historical loss experience should be adjusted for asset-specific risk characteristics or current conditions at the reporting date that did not exist over the period from which historical experience was used. Finally, Arrow considers forecasts about future economic conditions that are reasonable and supportable. The allowance for losses on unfunded commitments represents the expected credit losses on off-balance sheet commitments such as unfunded commitments to extend credit and standby letters of credit. However, a liability is not recognized for commitments unconditionally cancellable by Arrow. The allowance for losses on unfunded commitments is determined by estimating future draws and applying the expected loss rates on those draws. Arrow considers the accounting policy relating to the allowance for credit losses to be a critical accounting estimate given the uncertainty in evaluating the level of the allowance required to cover Arrow's estimate of all expected credit losses over the expected contractual life of our loan portfolio. Determining the appropriateness of the allowance is complex and requires judgment by management about the effect of matters that are inherently uncertain. Subsequent evaluations of the then-existing loan portfolio, in light of the factors then prevailing, may result in significant changes in the allowance for credit losses in those future periods. While management’s current evaluation of the allowance for credit losses indicates that the allowance is appropriate at this time, the allowance may need to be increased in the future due to changes in conditions or assumptions. The impact of utilizing the CECL approach to calculate the reserve for credit losses will be significantly influenced by the composition, characteristics and quality of our loan portfolio, as well as the prevailing economic conditions and forecasts utilized. Material changes to these and other relevant factors may result in greater volatility to the reserve for credit losses, and therefore, greater volatility to our reported earnings. Arrow's policies on the allowance for credit losses, pension accounting and provision for income taxes are disclosed in Note 2 to the consolidated financial statements of this Form 10-K.
A. OVERVIEW
The following discussion and analysis focuses on and reviews Arrow's results of operations for each of the years in the three-year period ended December 31, 2022 and the financial condition as of December 31, 2022 and 2021. The discussion below should be read in conjunction with the selected quarterly and annual information set forth above and the Consolidated Financial Statements and other financial data presented elsewhere in this Report. When necessary, prior-year financial information has been reclassified to conform to the current-year presentation.
Summary of 2022 Financial Results: For the year ended December 31, 2022, net income was $48.8 million, down 2.1% from $49.9 million for 2021. The decrease from the prior year was primarily the result of an increase in net interest income of $8.0 million, offset by a $4.5 million increase in the provision for credit loss, a decrease in Paycheck Protection Program (PPP) revenue earned of $6.2 million and a $2.3 million decrease in the gain on the sale of loans.
Diluted EPS was $2.95 for 2022, down 2.1% from $3.01 in 2021. Return on average equity (ROE) and return on average assets (ROA) were 13.55% and 1.21%, respectively, as compared to 14.09% and 1.28%, respectively, for 2021.
Net interest income for the year ended December 31, 2022 was $118.3 million, an increase of $8.0 million, or 7.2%, from the prior year. Interest and fees on loans were $113.0 million, an increase of 7.6% from the $105.0 million for the year ended December 31, 2021. Interest and fees related to PPP loans, included in the $113.0 million, were $1.6 million. In 2021, $7.8 million of income was earned on PPP loans. Interest expense for the year ended December 31, 2022 was $11.3 million. This is an increase of $6.1 million, or 117.7%, from the $5.2 million in expense for the prior-year period.
Net interest margin was 3.03% for the year ended December 31, 2022, as compared to 2.97% for the year ended December 31, 2021. In the fourth quarter of 2022, the net interest margin was 3.08%, as compared to 2.77% for the fourth quarter of 2021. The increase in net interest margin was due to a variety of factors, including higher market rates impacting asset yields and a reduction in cash balances. Net interest margin in 2022, excluding PPP income, increased to 3.00% from 2.84% in the prior year. The cost of interest-bearing liabilities increased primarily due to the repricing of time deposits and municipal deposits.
For 2022, the provision for credit losses related to the loan portfolio was $4.8 million, compared to $272 thousand in 2021. The key drivers affecting the provision were strong loan growth, increase in net charge-offs and a deterioration in forecasted economic conditions.
Noninterest income was $30.9 million for the year ended December 31, 2022, a decrease of 4.5%, as compared to $32.4 million for the year ended December 31, 2021. Income from fiduciary activities in 2022 was $9.7 million, a decrease of $431 thousand from 2021, primarily driven by market conditions. Fees and other services to customers increased $164 thousand to $11.6 million in 2022. Gain on sales of loans decreased $2.3 million from 2021 to $83 thousand in 2022. Other operating income increased $814 thousand from 2021, due to gains related to other investments and bank-owned life insurance proceeds.
Noninterest expense for the year ended December 31, 2022 increased by $3.5 million, or 4.5%, to $81.5 million, as compared to $78.0 million in 2021. The largest component of noninterest expense is salaries and benefits paid to our employees, which totaled $47.0 million in 2022. Salaries and benefits increased $2.2 million, or 4.9%, from the prior year. Technology and equipment expense was $16.1 million, an increase of $1.2 million or 8.4%, from the prior year, reflects our continued commitment to innovation. Noninterest expense for the fourth quarter of 2022 decreased $68 thousand, or 0.3%, as compared to the fourth quarter of 2021.
The provision for income taxes for 2022 was $14.1 million, compared to $14.5 million for 2021. The effective income tax rates for 2022 and 2021 were 22.4% and 22.6%, respectively.
Total assets were $3.97 billion at December 31, 2022, a decrease of $58.4 million, or 1.5%, compared to December 31, 2021. Total cash and cash equivalents were $64.7 million at December 31, 2022, a decrease of $393.0 million, or 85.9%, compared to December 31, 2021. Total investments were $757.1 million at December 31, 2022, a decrease of $5.9 million, or 0.8%, compared to December 31, 2021. In 2022, the rising interest rate environment resulted in an increase of unrealized losses versus the prior year.
At December 31, 2022, total loan balances reached $3.0 billion, up $315 million, or 11.8%, from the prior-year level. Loan growth for the fourth quarter was $58.4 million. The consumer loan portfolio grew by $144.6 million, or 15.7%, over the balance at December 31, 2021, primarily as a result of continued strength in the indirect automobile lending program. The residential real estate loan portfolio increased $124.8 million, or 13.2%, from the prior year. Commercial loans, including commercial real estate, increased $45.9 million, or 5.7%, over the balances at December 31, 2021.
The allowance for credit losses was $30.0 million at December 31, 2022, an increase of $2.7 million from December 31, 2021. The allowance for credit losses represents 1.00% of loans outstanding, a decrease from 1.02% at year-end 2021. When expressed as a percentage of nonperforming loans, the allowance for credit loss coverage ratio was 250.0% at year-end 2022 as compared to 233.9% at year-end 2021. Asset quality remained solid at December 31, 2022. Net loan losses, expressed as an annualized percentage of average loans outstanding, were 0.08% for the year ended December 31, 2022, as compared to 0.03% for the prior year. Nonperforming assets of $12.6 million at December 31, 2022, represented 0.32% of period-end assets, compared to $11.8 million or 0.29% at December 31, 2021.
At December 31, 2022, total deposit balances were $3.5 billion, a decrease of $52.1 million, or 1.5%, from the prior-year level. Non-municipal deposits decreased by $26.6 million and municipal deposits decreased by $25.5 million as compared to December 31, 2021. Noninterest-bearing deposits grew by $26.6 million, or 3.3%, during 2022, and represented 23.9% of total deposits at year-end, as compared to the prior-year level of 22.8%. At December 31, 2022, total time deposits decreased $5.1 million from the prior-year level. Deposits decreased in the fourth quarter by $296.7 million. Non-municipal and municipal deposits decreased by $149.0 million and $147.7 million, respectively in the fourth quarter. The decline in deposits was primarily the result of increased consumer spending, pressure from competitive rate pricing and seasonality of municipal deposits.
Total borrowings were $74.8 million at December 31, 2022, an increase of $9.8 million, or 15.1%, compared to December 31, 2021.
Total shareholders’ equity was $353.5 million at period-end, a decrease of $17.6 million, or 4.8%, from the year-end 2021 balance. Arrow's regulatory capital ratios remained strong in 2022. At December 31, 2022, Arrow's Common Equity Tier 1 Capital Ratio was 13.32% and Total Risk-Based Capital Ratio was 15.11%. The capital ratios of Arrow and both its subsidiary banks continued to significantly exceed the “well capitalized” regulatory standards.
In 2022, Arrow upgraded its core banking system. The system upgrade reflects the strategic focus on a strong technology foundation and this investment paves the way for customer-facing enhancements and more efficient and improved internal operations as Arrow continues to work toward fully leveraging the capabilities of the new bank core system. In connection with the conversion, we have encountered, and are continuing to experience, operational and other issues, certain of which have required substantial time and resources to address, and which have had a negative impact on our operations and business and have contributed to material weaknesses in the Company’s internal controls described in Part II, Item 9A, Controls and Procedures. Additionally in 2022, Arrow further optimized its branch network with the December consolidation of Glens Falls National Bank's Aviation Road Office into nearby Queensbury locations. Meanwhile, construction on the downtown Glens Falls headquarters advanced; once completed later in 2023, the energy-efficient space will improve both the employee and customer experience.
The changes in net income, net interest income and net interest margin between the current and prior year are discussed in detail under the heading "Results of Operations," beginning on page 30.
Regulatory Capital and Decrease in Stockholders' Equity: As of December 31, 2022, Arrow continued to exceed all required minimum capital ratios under the current bank regulatory capital rules as implemented under Dodd-Frank (the "Capital Rules") at both the holding company and bank levels. At that date, both subsidiary banks, as well as the holding company, continued to qualify as "well-capitalized" under the capital classification guidelines as defined by the Capital Rules. Because of continued profitability and strong asset quality, the regulatory capital levels throughout recent years have consistently remained well in excess of the various required regulatory minimums in effect from time to time, as they do at present.
In 2020, federal bank regulators introduced an optional simplified measure of capital adequacy for qualifying community banking organizations (CBLR). A qualifying community banking organization that opts into the CBLR framework and meets all the requirements under the CBLR framework will be considered to have met the well-capitalized ratio requirements under the “prompt corrective action” regulations and will not be required to report or calculate risk-based capital ratios.
The CBLR final rule became effective as of January 1, 2020, and Arrow and both subsidiary banks have opted out of utilizing the CBLR framework. Therefore, the Capital Rules promulgated under Dodd-Frank will remain applicable to Arrow and both subsidiary banks.
Total stockholders' equity was $353.5 million at December 31, 2022, a decrease of $17.6 million, or 4.8%, from December 31, 2021. The components of the change in stockholders' equity since year-end 2021 are presented in the Consolidated Statement of Changes in Stockholders' Equity on page 59. Total book value per share decreased by 4.9% over the prior year level. At December 31, 2022, tangible book value per share, a non-GAAP financial measure calculated based on tangible book value (total stockholders' equity minus intangible assets including goodwill) was $19.95, a decrease of $1.08, or 5.1%, over the December 31, 2021 amount. The net decrease in total stockholders' equity during 2022 principally reflected the following factors: (i) $48.8 million of net income for the year, plus (ii) $2.0 million of equity related to various stock-based compensation plans, plus (iii) $1.9 million of equity resulting from the dividend reinvestment plan, reduced by (iv) other comprehensive loss of $50.0 million, (v) cash dividends of $17.4 million and (vi) repurchases of common stock of $2.9 million. As of December 31, 2022, Arrow's closing stock price was $33.90, resulting in a trading multiple of 1.70 to Arrow's tangible book value. The Board of Directors declared and Arrow paid a cash dividend of $0.262 per share for the first three quarters of 2022, as adjusted for a 3% stock dividend distributed September 23, 2022, a cash dividend of $0.27 per share for the fourth quarter of 2022, and declared a $0.27 per share cash dividend for the first quarter of 2023.
Loan quality: Nonperforming loans were $12.0 million at December 31, 2022, an increase of $319 thousand, or 2.7%, from year-end 2021. The ratio of nonperforming loans to period-end loans at December 31, 2022 was 0.40%, a decrease from 0.44% at December 31, 2021 and higher than Arrow's peer group ratio of 0.38% at September 30, 2022. Loans charged-off (net of recoveries) against the allowance for credit losses was $2.1 million for 2022, an increase of $1.2 million from 2021. The ratio of net charge-offs to average loans was 0.08% for 2022 and 0.03% for 2021, compared to the peer group ratio of 0.04% for the period ended September 30, 2022. At December 31, 2022, the allowance for credit losses was $30.0 million, representing 1.00% of total loans, a decrease of 2 basis points from the December 31, 2021 ratio.
Loan Segments: As of December 31, 2022, total loans grew $315.3 million, or 11.8%, as compared to the balance at December 31, 2021.
◦ Commercial and Commercial Real Estate Loans: Combined, these loans comprised 28.4% of the total loan portfolio at period-end. Commercial property values in Arrow's region have largely remained stable, however, there remains uncertainty surrounding market conditions due to the inflation and the rising interest rate environment. Appraisals on nonperforming and watched CRE loan properties are updated as deemed necessary, usually when the loan is downgraded or when there has been significant market deterioration since the last appraisal.
◦ Consumer Loans: These loans (primarily automobile loans) comprised approximately 35.7% of the total loan portfolio at period-end. Consumer automobile loans at December 31, 2022, were $1.1 billion, or 99.6% of this portfolio segment. The vast majority of automobile loans are initiated through the purchase of vehicles by consumers with automobile dealers.
Although previous supply chain constraints have lessened, inflation and higher rates may limit the potential growth in this category.
◦ Residential Real Estate Loans: These loans, including home equity loans, made up 35.9% of the total loan portfolio at period-end. Demand for residential real estate has continued but weakened as interest rates have increased. Arrow originated nearly all of the residential real estate loans currently held in the loan portfolio and applies conservative underwriting standards to loan originations. Arrow typically sells a portion of residential real estate mortgage originations into the secondary market. The ratio of the sales of originations to total originations tends to fluctuate from period to period based on market conditions and other factors. Since the second half 2021, sales have decreased as a result of the strategic decision to grow the residential loan portfolio. The rate at which mortgage loan originations are sold in future periods will depend on various circumstances, including prevailing mortgage rates, other lending opportunities, capital and liquidity needs, and the availability of a market for such transactions.
Liquidity and access to credit markets: Arrow did not experience any liquidity problems or special concerns in recent years or in 2022. Arrow’s liquidity position should provide the Company with the necessary flexibility to address any unexpected near-term disruptions. Interest-bearing cash balances at December 31, 2022 were $32.8 million which represents a significant decline as compared to $430.7 million at December 31, 2021. In the fourth quarter, deposits declined as the result of increased consumer spending, pressure from competitive rate pricing and seasonality of municipal deposits. Deposit balances nonetheless provided an abundance of liquidity to fund Arrow's asset growth. Additionally, contingent lines of credit are also available. Operating collateralized lines of credit are established and available through the FHLBNY and FRB, totaling $1.3 billion. The terms of Arrow's lines of credit have not changed significantly in recent periods (see the general liquidity discussion on page 46). Historically, Arrow has principally relied on asset-based liquidity (i.e., funds in overnight investments and cash flow from maturing investments and loans) with liability-based liquidity as a secondary source of funds (the main liability-based sources are an overnight borrowing arrangement with correspondent banks, an arrangement for overnight borrowing and term credit advances from the FHLBNY, and an additional arrangement for short-term advances at the Federal Reserve Bank discount window). Regular liquidity stress tests and tests of the contingent liquidity plan are performed to ensure that an adequate amount of available funds can be generated to meet a wide variety of potential liquidity crises.
Reference Rate Reform: On March 5, 2021, the ICE Benchmark Administration (the IBA), the administrator of LIBOR, and the United Kingdom’s Financial Conduct Authority, the regulatory supervisor for the IBA, announced certain future dates that LIBOR settings will cease to be provided by any administrator. In addition, regulators have issued statements indicating that financial institutions should not issue new LIBOR-based financial instruments after January 1, 2022. To prepare for the upcoming cessation of LIBOR, Arrow established a committee in 2020 comprised of Bank Management to prepare for the discontinuance of LIBOR, which is widely used to reprice floating rate financial instruments. Based on a review of existing floating rate financial instruments, Management has determined that the financial products tied to LIBOR will not be subject to cessation until June 30, 2023. This review also identified that only a few legacy contracts do not include appropriate fallback language. On March 15, 2022, the “Adjustable Interest Rate (LIBOR) Act” was enacted by Congress. The law provides basic framework for addressing the discontinuation of U.S. Dollar LIBOR under federal law. The law establishes a clear uniform process, on a nationwide basis, for replacing LIBOR in existing contracts that do not provide for the use of a clearly defined or practicable replacement benchmark rate (so-called “tough legacy” contracts), without affecting the ability of parties to use any appropriate benchmark rate in new contracts. In December 2022, the Federal Reserve Board adopted a final rule implementing the Adjustable Interest Rate (LIBOR) Act, which was effective February 27, 2023. Arrow no longer issues new LIBOR-based financial instruments. Furthermore, U.S. Dollar LIBOR indices utilized by Arrow's existing financial instruments shall cease on or before June 30, 2023. On January 1, 2022, Arrow designated SOFR as the replacement index for financial instruments previously tied to LIBOR.
Visa Class B Common Stock: Arrow's subsidiary bank, Glens Falls National, like other Visa member banks, bears some indirect contingent liability for Visa's direct liability arising out of certain antitrust claims involving merchant discounts to the extent that Visa's liability might exceed the amount funded in its litigation escrow account. On December 13, 2019, the Court granted final approval to a settlement in this class action lawsuit. On January 3, 2020 an appeal of the final-approved order was filed with the court. On December 16, 2021, the second circuit court of appeals set oral arguments regarding objections to final approval of the settlement for March 16, 2022. On March 16, 2022, the Second Circuit Court of Appeals heard oral arguments regarding objections to final approval of the settlement. It is currently unknown when the appeal will be decided. When the appeals process is resolved and assuming the balance in the litigation escrow account is sufficient to cover the litigation claims and related expenses, Arrow could potentially realize a gain on the receipt of Visa Class A common stock. At December 31, 2022, Glens Falls National held 27,771 shares of Visa Class B common stock, and utilizing the conversion ratio to Class A common stock at that time, these Class B shares would convert to approximately 44,000 shares of Visa Class A common stock. Since the litigation settlement is not certain, Arrow has not recognized any economic value for these shares.
B. RESULTS OF OPERATIONS
The following analysis of net interest income, the provision for credit losses, noninterest income, noninterest expense and income taxes, highlights the factors that had the greatest impact on the results of operations for December 31, 2022 and the prior two years. For a comparison of the years ended December 31, 2020 and 2021, see Part II. Item 7, Management’s Discussion and Analysis of Financial Condition and Results of Operations, in our Form 10-K for the year ended December 31, 2021.
I. NET INTEREST INCOME
Net interest income represents the difference between interest, dividends and fees earned on loans, securities and other earning assets and interest paid on deposits and other sources of funds. Changes in net interest income result from changes in the level and mix of earning assets and sources of funds (volume) and changes in the yields earned and interest rates paid (rate). Net interest margin is the ratio of net interest income to average earning assets. Net interest income may also be described as the product of average earning assets and the net interest margin.
CHANGE IN NET INTEREST INCOME
(Dollars In Thousands) (GAAP Basis)
|
|
|
|
|
|
|
|
|
|
|
|
|
|
|
|
|
|
|
|
|
|
|
|
|
|
|
|
|
|
|
|
|
|
|
|
|
|
|
|
|
|
|
Years Ended December 31, |
|
Change From Prior Year |
|
|
|
|
|
|
|
2021 to 2022 |
|
2020 to 2021 |
|
2022 |
|
2021 |
|
2020 |
|
Amount |
|
% |
|
Amount |
|
% |
| Interest and Dividend Income |
$ |
129,651 |
|
|
$ |
115,550 |
|
|
$ |
111,896 |
|
|
$ |
14,101 |
|
|
12.2 |
% |
|
$ |
3,654 |
|
|
3.3 |
% |
| Interest Expense |
11,308 |
|
|
5,195 |
|
|
12,694 |
|
|
6,113 |
|
|
117.7 |
% |
|
(7,499) |
|
|
(59.1) |
% |
| Net Interest Income |
$ |
118,343 |
|
|
$ |
110,355 |
|
|
$ |
99,202 |
|
|
$ |
7,988 |
|
|
7.2 |
% |
|
$ |
11,153 |
|
|
11.2 |
% |
Net interest income was $118.3 million in 2022, an increase of $8.0 million, or 7.2%, from the $110.4 million in 2021. This is in comparison with the increase of $11.2 million, or 11.2%, from 2020 to 2021. Factors contributing to the year-to-year changes in net interest income over the three-year period are discussed in the following portions of this Section B.I.
The following tables reflect the components of net interest income for years ended December 31, 2022, 2021 and 2020: (i) average balances of assets, liabilities and stockholders' equity, (ii) interest and dividend income earned on earning assets and interest expense incurred on interest-bearing liabilities, (iii) average yields earned on earning assets and average rates paid on interest-bearing liabilities, (iv) the net interest spread (average yield less average cost) and (v) the net interest margin (yield) on earning assets. The yield on securities available-for-sale is based on the amortized cost of the securities. Nonaccrual loans are included in average loans.
Average Consolidated Balance Sheets and Net Interest Income Analysis
(GAAP basis)
(Dollars in Thousands)
|
|
|
|
|
|
|
|
|
|
|
|
|
|
|
|
|
|
|
|
|
|
|
|
|
|
|
|
|
|
|
|
|
|
|
|
|
|
|
|
|
|
|
|
|
|
|
|
|
|
|
|
|
|
| Years Ended December 31: |
2022 |
|
2021 |
|
2020 |
|
|
|
Interest |
|
Rate |
|
|
|
Interest |
|
Rate |
|
|
|
Interest |
|
Rate |
|
Average |
|
Income/ |
|
Earned/ |
|
Average |
|
Income/ |
|
Earned/ |
|
Average |
|
Income/ |
|
Earned/ |
|
Balance |
|
Expense |
|
Paid |
|
Balance |
|
Expense |
|
Paid |
|
Balance |
|
Expense |
|
Paid |
| Interest-Bearing Deposits at Banks |
$ |
252,835 |
|
|
$ |
3,100 |
|
|
1.23 |
% |
|
$ |
418,488 |
|
|
565 |
|
|
0.14 |
% |
|
195,821 |
|
|
321 |
|
|
0.16 |
% |
| Investment Securities: |
|
|
|
|
|
|
|
|
|
|
|
|
|
|
|
|
|
| Fully Taxable |
648,540 |
|
|
10,357 |
|
|
1.60 |
% |
|
470,133 |
|
|
6,487 |
|
|
1.38 |
% |
|
398,915 |
|
|
7,131 |
|
|
1.79 |
% |
Exempt from Federal
Taxes |
173,184 |
|
|
3,212 |
|
|
1.85 |
% |
|
185,072 |
|
|
3,513 |
|
|
1.90 |
% |
|
199,410 |
|
|
3,952 |
|
|
1.98 |
% |
| Loans |
2,827,518 |
|
|
112,982 |
|
|
4.00 |
% |
|
2,643,163 |
|
|
104,985 |
|
|
3.97 |
% |
|
2,526,791 |
|
|
100,492 |
|
|
3.98 |
% |
| Total Earning Assets |
3,902,077 |
|
|
129,651 |
|
|
3.32 |
% |
|
3,716,856 |
|
|
115,550 |
|
|
3.11 |
% |
|
3,320,937 |
|
|
111,896 |
|
|
3.37 |
% |
| Allowance for Credit Losses |
(27,954) |
|
|
|
|
|
|
(27,187) |
|
|
|
|
|
|
(25,128) |
|
|
|
|
|
| Cash and Due From Banks |
30,462 |
|
|
|
|
|
|
36,464 |
|
|
|
|
|
|
35,609 |
|
|
|
|
|
| Other Assets |
142,895 |
|
|
|
|
|
|
156,509 |
|
|
|
|
|
|
150,343 |
|
|
|
|
|
| Total Assets |
$ |
4,047,480 |
|
|
|
|
|
|
$ |
3,882,642 |
|
|
|
|
|
|
$ |
3,481,761 |
|
|
|
|
|
|
|
|
|
|
|
|
|
|
|
|
|
|
|
|
|
|
|
|
|
|
|
|
|
|
|
|
|
|
|
|
|
|
|
|
|
|
|
|
|
|
|
|
|
|
|
|
|
|
|
|
|
|
|
| Deposits: |
|
|
|
|
|
|
|
|
|
|
|
|
|
|
|
|
|
Interest-Bearing Checking
Accounts |
$ |
1,038,751 |
|
|
973 |
|
|
0.09 |
% |
|
$ |
926,875 |
|
|
731 |
|
|
0.08 |
% |
|
772,000 |
|
|
1,292 |
|
|
0.17 |
% |
| Savings Deposits |
1,549,278 |
|
|
7,879 |
|
|
0.51 |
% |
|
1,496,906 |
|
|
1,904 |
|
|
0.13 |
% |
|
1,258,154 |
|
|
5,090 |
|
|
0.40 |
% |
Time Deposits of $250,000
Or More |
55,690 |
|
|
369 |
|
|
0.66 |
% |
|
87,033 |
|
|
261 |
|
|
0.30 |
% |
|
124,601 |
|
|
1,465 |
|
|
1.18 |
% |
| Other Time Deposits |
132,541 |
|
|
604 |
|
|
0.46 |
% |
|
141,677 |
|
|
632 |
|
|
0.45 |
% |
|
223,111 |
|
|
2,782 |
|
|
1.25 |
% |
Total Interest-Bearing
Deposits |
2,776,260 |
|
|
9,825 |
|
|
0.35 |
% |
|
2,652,491 |
|
|
3,528 |
|
|
0.13 |
% |
|
2,377,866 |
|
|
10,629 |
|
|
0.45 |
% |
| Short-Term Borrowings |
2,124 |
|
|
92 |
|
|
4.33 |
% |
|
4,768 |
|
|
3 |
|
|
0.06 |
% |
|
57,929 |
|
|
246 |
|
|
0.42 |
% |
FHLBNY Term Advances
and Other Long-Term Debt |
50,750 |
|
|
1,198 |
|
|
2.36 |
% |
|
65,000 |
|
|
1,469 |
|
|
2.26 |
% |
|
69,631 |
|
|
1,623 |
|
|
2.33 |
% |
| Finance Leases |
5,132 |
|
|
193 |
|
|
3.76 |
% |
|
5,182 |
|
|
195 |
|
|
3.76 |
% |
|
5,229 |
|
|
196 |
|
|
3.75 |
% |
Total Interest-
Bearing Liabilities |
2,834,266 |
|
|
11,308 |
|
|
0.40 |
% |
|
2,727,441 |
|
|
5,195 |
|
|
0.19 |
% |
|
2,510,655 |
|
|
12,694 |
|
|
0.51 |
% |
| Demand Deposits |
815,218 |
|
|
|
|
|
|
767,671 |
|
|
|
|
|
|
613,408 |
|
|
|
|
|
| Other Liabilities |
37,901 |
|
|
|
|
|
|
33,773 |
|
|
|
|
|
|
37,884 |
|
|
|
|
|
| Total Liabilities |
3,687,385 |
|
|
|
|
|
|
3,528,885 |
|
|
|
|
|
|
3,161,947 |
|
|
|
|
|
| Stockholders’ Equity |
360,095 |
|
|
|
|
|
|
353,757 |
|
|
|
|
|
|
319,814 |
|
|
|
|
|
Total Liabilities and
Stockholders’ Equity |
$ |
4,047,480 |
|
|
|
|
|
|
$ |
3,882,642 |
|
|
|
|
|
|
$ |
3,481,761 |
|
|
|
|
|
| Net Interest Income |
|
|
$ |
118,343 |
|
|
|
|
|
|
$ |
110,355 |
|
|
|
|
|
|
$ |
99,202 |
|
|
|
| Net Interest Spread |
|
|
|
|
2.92 |
% |
|
|
|
|
|
2.92 |
% |
|
|
|
|
|
2.86 |
% |
| Net Interest Margin |
|
|
|
|
3.03 |
% |
|
|
|
|
|
2.97 |
% |
|
|
|
|
|
2.99 |
% |
Changes between periods are attributed to movement in either the average daily balances or average rates for both earning assets and interest-bearing liabilities. Changes attributable to both volume and rate have been allocated proportionately between the categories.
Net Interest Income Rate and Volume Analysis
(Dollars in Thousands) (GAAP basis)
|
|
|
|
|
|
|
|
|
|
|
|
|
|
|
|
|
|
|
|
|
|
|
|
|
|
|
|
|
|
|
|
|
|
|
|
|
2022 Compared to 2021 Change in Net Interest Income Due to: |
|
2021 Compared to 2020 Change in Net Interest Income Due to: |
| Interest and Dividend Income: |
Volume |
|
Rate |
|
Total |
|
Volume |
|
Rate |
|
Total |
| Interest-Bearing Bank Balances |
$ |
(224) |
|
|
$ |
2,759 |
|
|
$ |
2,535 |
|
|
$ |
309 |
|
|
$ |
(65) |
|
|
$ |
244 |
|
| Investment Securities: |
|
|
|
|
|
|
|
|
|
|
|
| Fully Taxable |
2,443 |
|
|
1,427 |
|
|
3,870 |
|
|
1,146 |
|
|
(1,790) |
|
|
(644) |
|
| Exempt from Federal Taxes |
(214) |
|
|
(87) |
|
|
(301) |
|
|
(277) |
|
|
(162) |
|
|
(439) |
|
| Loans |
7,149 |
|
|
848 |
|
|
7,997 |
|
|
4,622 |
|
|
(129) |
|
|
4,493 |
|
| Total Interest and Dividend Income |
9,154 |
|
|
4,947 |
|
|
14,101 |
|
|
5,800 |
|
|
(2,146) |
|
|
3,654 |
|
| Interest Expense: |
|
|
|
|
|
|
|
|
|
|
|
| Deposits: |
|
|
|
|
|
|
|
|
|
|
|
| Interest-Bearing Checking Accounts |
138 |
|
|
104 |
|
|
242 |
|
|
221 |
|
|
(782) |
|
|
(561) |
|
| Savings Deposits |
88 |
|
|
5,887 |
|
|
5,975 |
|
|
822 |
|
|
(4,008) |
|
|
(3,186) |
|
| Time Deposits of $250,000 or More |
(92) |
|
|
200 |
|
|
108 |
|
|
(347) |
|
|
(857) |
|
|
(1,204) |
|
| Other Time Deposits |
(41) |
|
|
13 |
|
|
(28) |
|
|
(779) |
|
|
(1,371) |
|
|
(2,150) |
|
| Total Deposits |
93 |
|
|
6,204 |
|
|
6,297 |
|
|
(82) |
|
|
(7,019) |
|
|
(7,101) |
|
| Short-Term Borrowings |
(2) |
|
|
91 |
|
|
89 |
|
|
(126) |
|
|
(117) |
|
|
(243) |
|
| Long-Term Debt |
(322) |
|
|
51 |
|
|
(271) |
|
|
(106) |
|
|
(48) |
|
|
(154) |
|
| Finance Leases |
(2) |
|
|
— |
|
|
(2) |
|
|
(2) |
|
|
1 |
|
|
(1) |
|
| Total Interest Expense |
(233) |
|
|
6,346 |
|
|
6,113 |
|
|
(316) |
|
|
(7,183) |
|
|
(7,499) |
|
| Net Interest Income |
$ |
9,387 |
|
|
$ |
(1,399) |
|
|
$ |
7,988 |
|
|
$ |
6,116 |
|
|
$ |
5,037 |
|
|
$ |
11,153 |
|
NET INTEREST MARGIN
|
|
|
|
|
|
|
|
|
|
|
|
|
|
|
|
|
|
| YIELD ANALYSIS (GAAP Basis) |
December 31, |
|
2022 |
|
2021 |
|
2020 |
| Yield on Earning Assets |
3.32 |
% |
|
3.11 |
% |
|
3.37 |
% |
| Cost of Interest-Bearing Liabilities |
0.40 |
% |
|
0.19 |
% |
|
0.51 |
% |
| Net Interest Spread |
2.92 |
% |
|
2.92 |
% |
|
2.86 |
% |
| Net Interest Margin |
3.03 |
% |
|
2.97 |
% |
|
2.99 |
% |
| Net Interest Margin excluding PPP Loans |
3.00 |
% |
|
2.84 |
% |
|
2.97 |
% |
Arrow's earnings are derived predominantly from net interest income, which is interest income, net of interest expense. Changes in balance sheet composition, including interest-earning assets, deposits, and borrowings, combined with changes in market interest rates, impact net interest income. Net interest margin is net interest income divided by average interest-earning assets. Interest-earning assets and funding sources are managed, including noninterest and interest-bearing liabilities, in order to maximize this margin.
2022 Compared to 2021: Net interest income increased $8.0 million, or 7.2%, to $118.3 million for the year ended December 31, 2022 from $110.4 million for the year ended December 31, 2021. Interest and fees on loans were $113.0 million, an increase of 7.6% from the $105.0 million for the year ended December 31, 2021. Interest and fees related to PPP loans, included in the $113.0 million, were $1.6 million. In 2021, $7.8 million of income was earned on PPP loans. The net interest margin was 3.03% for the year ended December 31, 2022 as compared to 2.97% for the year ended December 31, 2021.
Income on investment securities increased $3.6 million, or 35.7%, between the years ended December 31, 2022 and December 31, 2021. The average balances for fully taxable securities were higher for the year, with yield increasing by 22 basis points. The average balances for securities exempt from federal taxes were lower for the year, with yield decreasing by 5 basis points.
Interest income from loans increased $8.0 million, or 7.6%, to $113.0 million for the year ended December 31, 2022 from $105.0 million for the year ended December 31, 2021. The loan portfolio yield increased 3 basis points in 2022, to 4.00%. Average loan balances increased by $184.4 million, a 7.0% increase over 2021 average balances. Within the loan portfolio, the three principal segments are residential real estate loans, consumer loans (primarily through the indirect automobile lending program) and commercial loans. The consumer loan portfolio grew by $144.6 million, or 15.7%, over the balance at December 31, 2021. The residential real estate loan portfolio increased $124.8 million, or 13.2% from the prior year. Commercial loans, including commercial real estate, increased $45.9 million, or 5.7%, over the balances at December 31, 2021.
Total interest expense on interest-bearing liabilities increased $6.1 million, or 117.7%, to $11.3 million for the year ended December 31, 2022 from $5.2 million for the year ended December 31, 2021. Average interest bearing deposit balances increased by $123.8 million and the total cost of interest-bearing deposits increased to 22 basis points from 13 basis points. In addition, average demand deposits, which are non-interest bearing, increased by $47.5 million.
II. PROVISION FOR CREDIT LOSSES AND ALLOWANCE FOR CREDIT LOSSES
Arrow considers the accounting policy relating to the allowance for credit losses to be a critical accounting policy, given the uncertainty involved in evaluating the level of the allowance required to cover credit losses inherent in the loan portfolio, and the material effect that such judgments may have on the results of operations. The provision for credit losses for 2022 was $4.8 million, compared to the $0.3 million provision for 2021. The analysis of the method employed for determining the amount of the credit loss provision is explained in detail in Notes 2, Summary of Significant Accounting Policies, and 5, Loans, to the Consolidated Financial Statements.
SUMMARY OF THE ALLOWANCE AND PROVISION FOR CREDIT LOSSES
(Dollars In Thousands) (Loans, Net of Unearned Income)
|
|
|
|
|
|
|
|
|
|
|
|
|
|
|
|
|
|
| Years-Ended December 31, |
2022 |
|
2021 |
|
|
|
|
|
|
| Period-End Loans |
$2,983,207 |
|
$2,667,941 |
|
|
|
|
|
|
| Average Loans |
2,827,518 |
|
2,643,163 |
|
|
|
|
|
|
| Period-End Assets |
3,969,509 |
|
4,027,952 |
|
|
|
|
|
|
| Nonperforming Assets, at Period-End: |
|
|
|
|
|
|
|
|
|
| Nonaccrual Loans: |
|
|
|
|
|
|
|
|
|
| Commercial Loans |
8 |
|
|
33 |
|
|
|
|
|
|
|
| Commercial Real Estate |
3,110 |
|
|
7,244 |
|
|
|
|
|
|
|
| Consumer Loans |
3,503 |
|
|
1,697 |
|
|
|
|
|
|
|
| Residential Real Estate Loans |
4,136 |
|
|
1,790 |
|
|
|
|
|
|
|
| Total Nonaccrual Loans |
10,757 |
|
|
10,764 |
|
|
|
|
|
|
|
| Loans Past Due 90 or More Days and |
|
|
|
|
|
|
|
|
|
| Still Accruing Interest |
1,157 |
|
823 |
|
|
|
|
|
|
| Restructured |
69 |
|
77 |
|
|
|
|
|
|
| Total Nonperforming Loans |
11,983 |
|
11,664 |
|
|
|
|
|
|
| Repossessed Assets |
593 |
|
126 |
|
|
|
|
|
|
| Other Real Estate Owned |
— |
|
— |
|
|
|
|
|
|
|
|
|
|
|
|
|
|
|
|
| Total Nonperforming Assets |
12,576 |
|
11,790 |
|
|
|
|
|
|
| Allowance for Credit Losses: |
|
|
|
|
|
|
|
|
|
| Balance at Beginning of Period |
$ |
27,281 |
|
|
$ |
29,232 |
|
|
|
|
|
|
|
| Impact of the Adoption of ASU 2016-13 |
— |
|
|
(1,300) |
|
|
|
|
|
|
|
| Loans Charged-off: |
|
|
|
|
|
|
|
|
|
| Commercial Loans |
(34) |
|
|
(97) |
|
|
|
|
|
|
|
| Commercial Real Estate |
— |
|
|
— |
|
|
|
|
|
|
|
| Consumer Loans |
(4,079) |
|
|
(2,133) |
|
|
|
|
|
|
|
| Residential Real Estate Loans |
(30) |
|
|
(9) |
|
|
|
|
|
|
|
| Total Loans Charged-off |
(4,143) |
|
(2,239) |
|
|
|
|
|
|
| Recoveries of Loans Previously Charged-off: |
|
|
|
|
|
|
|
|
|
| Commercial Loans |
43 |
|
|
190 |
|
|
|
|
|
|
|
| Commercial Real Estate |
— |
|
|
— |
|
|
|
|
|
|
|
| Consumer Loans |
1,973 |
|
|
1,126 |
|
|
|
|
|
|
|
| Residential Real Estate Loans |
— |
|
|
— |
|
|
|
|
|
|
|
| Total Recoveries of Loans Previously Charged-off |
2,016 |
|
|
1,316 |
|
|
|
|
|
|
|
| Net Loans Charged-off |
(2,127) |
|
|
(923) |
|
|
|
|
|
|
|
| Provision for Credit Losses |
|
|
|
|
|
|
|
|
|
| Charged to Expense |
4,798 |
|
|
272 |
|
|
|
|
|
|
|
| Balance at End of Period |
$ |
29,952 |
|
|
$ |
27,281 |
|
|
|
|
|
|
|
| Asset Quality Ratios: |
|
|
|
|
|
|
|
|
|
| Net Charge-offs to Average Loans |
0.08 |
% |
|
0.03 |
% |
|
|
|
|
|
|
| Provision for Credit Losses to Average Loans |
0.17 |
% |
|
0.01 |
% |
|
|
|
|
|
|
| Allowance for Credit Losses to Period-end Loans |
1.00 |
% |
|
1.02 |
% |
|
|
|
|
|
|
| Allowance for Credit Losses to Nonperforming Loans |
249.95 |
% |
|
233.89 |
% |
|
|
|
|
|
|
| Nonperforming Loans to Period-end Loans |
0.40 |
% |
|
0.44 |
% |
|
|
|
|
|
|
| Nonperforming Assets to Period-end Assets |
0.32 |
% |
|
0.29 |
% |
|
|
|
|
|
|
ALLOCATION OF THE ALLOWANCE FOR CREDIT LOSSES
(Dollars in Thousands)
|
|
|
|
|
|
|
|
|
|
|
|
|
|
|
|
|
|
|
|
|
|
|
|
|
|
|
|
|
2022 |
|
2021 |
|
|
|
|
|
|
| Commercial Loans |
$ |
1,961 |
|
|
$ |
2,298 |
|
|
|
|
|
|
|
| Commercial Real Estate |
15,213 |
|
|
13,523 |
|
|
|
|
|
|
|
| Consumer Loans |
2,585 |
|
|
2,402 |
|
|
|
|
|
|
|
| Residential Real Estate Loans |
10,193 |
|
|
9,058 |
|
|
|
|
|
|
|
|
|
|
|
|
|
|
|
|
|
| Total |
$ |
29,952 |
|
|
$ |
27,281 |
|
|
|
|
|
|
|
Arrow adopted CECL on January 1, 2021. The CECL approach requires an estimate of the credit losses expected over the life of a loan (or pool of loans). It replaced the incurred loss approach’s threshold that required the recognition of a credit loss when it was probable that a loss event was incurred. The allowance for credit losses is a valuation account that is deducted from, or added to, the loans’ amortized cost basis to present the net, lifetime amount expected to be collected on the loans. Loan losses are charged off against the allowance when Arrow believes a loan balance is confirmed to be uncollectible. Expected recoveries do not exceed the aggregate of amounts previously charged off and expected to be charged off.
Management estimates the allowance using relevant available information from internal and external sources related to past events, current conditions, and a reasonable and supportable single economic forecast. Historical credit loss experience provides the basis for the estimation of expected credit losses. Arrow's historical loss experience was supplemented with peer information when there was insufficient loss data for Arrow. Peer selection was based on a review of institutions with comparable loss experience as well as loan yield, bank size, portfolio concentration and geography. Adjustments to historical loss information are made for differences in current loan-specific risk characteristics such as differences in credit concentrations, delinquency level, collateral values and underwriting standards as well as changes in economic conditions or other relevant factors. Management judgment is required at each point in the measurement process.
Portfolio segment is defined as the level at which an entity develops and documents a systematic methodology to determine its allowance for credit losses. Upon adoption of CECL, Management revised the manner in which loans were pooled for similar risk characteristics. Management developed portfolio segments for estimating loss based on type of borrower and collateral as follows:
Commercial Loans
Commercial Real Estate Loans
Consumer Loans
Residential Loans
Further details related to loan portfolio segments are included in Note 5, Loans, to the Consolidated Financial Statements.
Historical credit loss experience for both Arrow and segment-specific peers provides the basis for the estimation of expected credit losses. Arrow utilized regression analyses of peer data, of which Arrow is included, where observed credit losses and selected economic factors were utilized to determine suitable loss drivers for modeling lifetime probability of default (PD) rates. Arrow uses the discounted cash flow (DCF) method to estimate expected credit losses for the commercial, commercial real estate, and residential segments. For each of these loan segments, Arrow generates cash flow projections at the instrument level wherein payment expectations are adjusted for estimated prepayment speed, curtailments, time to recovery, PD, and segment-specific loss given default (LGD) risk factors. The modeling of expected prepayment speeds, curtailment rates, and time to recovery are based on historical internal data and adjusted, if necessary, based on the reasonable and supportable forecast of economic conditions.
For the loan segments utilizing the DCF method, (commercial, commercial real estate, and residential) Management utilizes externally developed economic forecast of the following economic factors as loss drivers: national unemployment, gross domestic product and home price index (HPI). The economic forecast is applied over a reasonable and supportable forecast period. Arrow utilizes a six quarter reasonable and supportable forecast period with an eight quarter reversion to the historic mean on a straight-line basis.
The combination of adjustments for credit expectations (default and loss) and timing expectations (prepayment, curtailment, and time to recovery) produces an expected cash flow stream at the instrument level. Instrument effective yield is calculated, net of the impacts of prepayment assumptions, and the instrument expected cash flows are then discounted at that effective yield to produce an instrument-level net present value of expected cash flows (NPV). An allowance for credit loss is established for the difference between the instrument’s NPV and amortized cost basis. The contractual term excludes expected extensions, renewals, and modifications unless either of the following applies: Management has a reasonable expectation at the reporting date that a troubled debt restructuring (TDR) will be executed with an individual borrower or the extension or renewal options are included in the original or modified contract at the reporting date and are not unconditionally cancellable by Arrow.
Arrow uses the vintage analysis method to estimate expected credit losses for the consumer loan segment. The vintage method was selected since the loans within the consumer loan segment are homogeneous, not just by risk characteristic, but by loan structure. Under the vintage analysis method, a loss rate is calculated based on the quarterly net charge-offs to the outstanding loan balance for each vintage year over the lookback period. Once this periodic loss rate is calculated for each quarter in the lookback period, the periodic rates are averaged into the loss rate. The loss rate is then applied to the outstanding loan balances based on the loan's vintage year. Arrow maintains, over the life of the loan, the loss curve by vintage year. If estimated losses computed by the vintage method need to be adjusted based on current conditions and the reasonable and supportable economic forecast, these adjustments would be incorporated over a six quarter reasonable and supportable forecast period, reverting to historical losses using a straight-line method over an eight quarter period. Based on current conditions, and the reasonable and supportable economic forecast, no adjustments are currently required.
The vintage and DCF models also consider the need to qualitatively adjust expected loss estimates for information not already captured in the quantitative loss estimation process. Qualitative considerations include limitations inherent in the quantitative model; trends experienced in nonperforming and delinquent loans; changes in value of underlying collateral; changes in lending policies and procedures; nature and composition of loans; portfolio concentrations that may affect loss experience across one or more components or the portfolio; the experience, ability and depth of lending management and staff; Arrow's credit review system; and the effect of external factors such as competition, legal and regulatory requirements.
These qualitative factor adjustments may increase or decrease Arrow's estimate of expected credit losses so that the allowance for credit loss is reflective of the estimate of lifetime losses that exist in the loan portfolio at the balance sheet date.
The change in methodology from incurred loss to the expected loss over the life of the loan also impacted the allocation of the allowance for credit losses. The vintage approach combined with a shorter life of loan decreased the allowance needed for consumer loans. Residential real estate loans, due to their longer life of loan, have a higher allocation of the allowance of credit loans as compared to the incurred loss methodology.
Arrow's allowance for credit losses was $30.0 million at December 31, 2022, which represented 1.00% of loans outstanding, a decrease from 1.02% at year-end 2021.
See Note 5, Loans, to the Consolidated Financial Statements for the complete methodology used to calculate the provision for credit losses.
III. NONINTEREST INCOME
The majority of the noninterest income constitutes fee income from services, principally fees and commissions from fiduciary services, deposit account service charges, insurance commissions, net gains (losses) on securities transactions, net gains on sales of loans and other recurring fee income.
ANALYSIS OF NONINTEREST INCOME
(Dollars In Thousands)
|
|
|
|
|
|
|
|
|
|
|
|
|
|
|
|
|
|
|
|
|
|
|
|
|
|
|
|
|
|
|
|
|
|
|
|
|
|
|
|
|
|
|
Years Ended December 31, |
|
Change From Prior Year |
|
|
|
|
|
|
|
2021 to 2022 |
|
2020 to 2021 |
|
2022 |
|
2021 |
|
2020 |
|
Amount |
|
% |
|
Amount |
|
% |
| Income from Fiduciary Activities |
$ |
9,711 |
|
|
$ |
10,142 |
|
|
$ |
8,890 |
|
|
$ |
(431) |
|
|
(4.2) |
% |
|
$ |
1,252 |
|
|
14.1 |
% |
| Fees for Other Services to Customers |
11,626 |
|
|
11,462 |
|
|
10,003 |
|
|
164 |
|
|
1.4 |
% |
|
1,459 |
|
|
14.6 |
% |
|
|
|
|
|
|
|
|
|
|
|
|
|
|
|
|
|
|
|
|
|
|
|
|
|
|
|
|
|
|
|
|
|
|
|
|
|
|
|
|
|
|
| Insurance Commissions |
6,463 |
|
|
6,487 |
|
|
6,876 |
|
|
(24) |
|
|
(0.4) |
% |
|
(389) |
|
|
(5.7) |
% |
| Net Gain (Loss) on Securities |
427 |
|
|
111 |
|
|
(464) |
|
|
316 |
|
|
284.7 |
% |
|
575 |
|
|
123.9 |
% |
| Net Gain on Sales of Loans |
83 |
|
|
2,393 |
|
|
3,889 |
|
|
(2,310) |
|
|
(96.5) |
% |
|
(1,496) |
|
|
(38.5) |
% |
| Other Operating Income |
2,588 |
|
|
1,774 |
|
|
3,464 |
|
|
814 |
|
|
45.9 |
% |
|
(1,690) |
|
|
(48.8) |
% |
| Total Noninterest Income |
$ |
30,898 |
|
|
$ |
32,369 |
|
|
$ |
32,658 |
|
|
$ |
(1,471) |
|
|
(4.5) |
% |
|
$ |
(289) |
|
|
(0.9) |
% |
2022 Compared to 2021: Total noninterest income in 2022 was $30.9 million, a decrease of $1.5 million, or 4.5%, from total noninterest income of $32.4 million for 2021. Income from fiduciary activities decreased $431 thousand from 2021 to 2022. The decrease was primarily driven by market conditions. Assets under trust administration and investment management at December 31, 2022 were $1.61 billion, a decrease of $245.0 million, or 13.2%, from the prior year-end balance of $1.85 billion. Fees for other services to customers were $11.6 million for 2022, an increase of $164 thousand as compared to 2021. Insurance commissions were flat to the previous year. Net gain on securities in 2022, consisting of a change in the fair value of equity investments, was $427 thousand as compared to a loss of $111 thousand in 2021.
Net gains on the sales of loans decreased in 2022 to $83 thousand, from $2.4 million in 2021. Sales decreased primarily as a result of the strategic decision in the second half of 2021 to retain more newly originated residential real estate loans. The rate at which mortgage loan originations are sold in future periods will depend on various circumstances, including prevailing mortgage rates, other lending opportunities, capital and liquidity needs, and the availability of a market for such transactions. Therefore, Arrow is unable to predict what the retention rate of such loans in future periods may be. Servicing rights are generally retained for loans originated and sold, which also generates additional noninterest income in subsequent periods (fees for other services to customers).
Other operating income increased by $814 thousand, or 45.9% between the two years primarily due to gains on other assets of $421 thousand as well as proceeds received related to bank owned life insurance of $383 thousand.
IV. NONINTEREST EXPENSE
Noninterest expense is the measure of the delivery cost of services, products and business activities of a company. The key components of noninterest expense are presented in the following table.
ANALYSIS OF NONINTEREST EXPENSE
(Dollars In Thousands)
|
|
|
|
|
|
|
|
|
|
|
|
|
|
|
|
|
|
|
|
|
|
|
|
|
|
|
|
|
|
|
|
|
|
|
|
|
|
|
|
|
|
|
Years Ended December 31, |
|
Change From Prior Year |
|
|
|
|
|
|
|
2021 to 2022 |
|
2020 to 2021 |
|
2022 |
|
2021 |
|
2020 |
|
Amount |
|
% |
|
Amount |
|
% |
| Salaries and Employee Benefits |
$ |
47,003 |
|
$ |
44,798 |
|
$ |
42,061 |
|
$ |
2,205 |
|
4.9 |
% |
|
$ |
2,737 |
|
6.5 |
% |
| Occupancy Expenses, Net |
6,202 |
|
5,814 |
|
5,614 |
|
388 |
|
6.7 |
% |
|
200 |
|
3.6 |
% |
|
|
|
|
|
|
|
|
|
|
|
|
|
|
| Technology and Equipment Expense |
16,118 |
|
14,870 |
|
12,976 |
|
1,248 |
|
8.4 |
% |
|
1,894 |
|
14.6 |
% |
| FDIC Regular Assessment |
1,176 |
|
1,042 |
|
1,063 |
|
134 |
|
12.9 |
% |
|
(21) |
|
(2.0) |
% |
| Amortization of Intangible Assets |
193 |
|
210 |
|
227 |
|
(17) |
|
(8.1) |
% |
|
(17) |
|
(7.5) |
% |
| Other Operating Expense |
10,838 |
|
11,314 |
|
8,737 |
|
(476) |
|
(4.2) |
% |
|
2,577 |
|
29.5 |
% |
| Total Noninterest Expense |
$ |
81,530 |
|
$ |
78,048 |
|
$ |
70,678 |
|
$ |
3,482 |
|
4.5 |
% |
|
$ |
7,370 |
|
10.4 |
% |
| Efficiency Ratio |
54.26 |
% |
|
54.16 |
% |
|
52.80 |
% |
|
0.10 |
% |
|
0.2 |
% |
|
1.36 |
% |
|
2.6 |
% |
2022 compared to 2021: Noninterest expenses for 2022 were $81.5 million, an increase of $3.5 million, or 4.5%, from 2021. For 2022, the efficiency ratio was 54.26%. This ratio, which is a commonly used non-GAAP financial measure in the banking industry, is a comparative measure of a financial institution's operating efficiency. The efficiency ratio (a ratio where lower is better), as defined by Arrow, is the ratio of operating noninterest expense (excluding intangible asset amortization) to net interest income (on a tax-equivalent basis) plus operating noninterest income (excluding net securities gains or losses). See the discussion of the efficiency ratio in this Report under the heading “Use of Non-GAAP Financial Measures.”
Salaries and employee benefits expense increased $2.2 million or 4.9%, from 2021. Included within salaries and benefits was a $1.5 million reclassification between salaries and employee benefits and other operating expenses. Under ASU 2017-07 (Compensation-Retirement Benefits), interest cost, expected return on plan assets, amortization of prior service cost and amortization of net loss are required to be reclassified out of salaries and employee benefits. The reclassification was $1.7 million in 2021. Salaries and benefits were also impacted by increased benefit costs and incentive payments.
Technology expenses increased $1.2 million, or 8.4%, from 2021 due to the investment in upgrading the core banking system. The expense reflects the strategic focus on a strong technology foundation and paves the way for customer-facing enhancements and more efficient and improved internal operations.
Other operating expense decreased $476 thousand, or 4.2%, from 2021. The decrease is the result of the expense for estimated credit losses on off-balance sheet credit exposures of $685 thousand for 2021 as compared to $22 thousand in the current year.
V. INCOME TAXES
The following table sets forth the provision for income taxes and effective tax rates for the periods presented.
INCOME TAXES AND EFFECTIVE RATES
(Dollars In Thousands)
|
|
|
|
|
|
|
|
|
|
|
|
|
|
|
|
|
|
|
|
|
|
|
|
|
|
|
|
|
|
|
|
|
|
|
|
|
|
|
|
|
|
|
Years Ended December 31, |
|
Change From Prior Year |
|
|
|
|
|
|
|
2021 to 2022 |
|
2020 to 2021 |
|
2022 |
|
2021 |
|
2020 |
|
Amount |
|
% |
|
Amount |
|
% |
| Provision for Income Taxes |
$ |
14,114 |
|
|
$ |
14,547 |
|
|
$ |
11,036 |
|
|
$ |
(433) |
|
|
(3.0) |
% |
|
$ |
3,511 |
|
|
31.8 |
% |
| Effective Tax Rate |
22.4 |
% |
|
22.6 |
% |
|
21.3 |
% |
|
(0.2) |
% |
|
(0.9) |
% |
|
1.3 |
% |
|
6.1 |
% |
The provisions for federal and state income taxes amounted to $14.1 million for 2022, $14.5 million for 2021, and $11.0 million for 2020. The effective income tax rates for 2022, 2021 and 2020 were 22.4%, 22.6% and 21.3%, respectively. The effective tax rate was essentially flat between 2022 and 2021. The increase in 2021 as compared to 2020 was primarily due to the reduction of tax exempt investments held and the related investment income, combined with the increase in the New York State corporate tax rate which was effective January 1, 2021.
C. FINANCIAL CONDITION
I. INVESTMENT PORTFOLIO
During 2022 and 2021, Arrow held no trading securities.
The available-for-sale securities portfolio, held-to-maturity securities portfolio and the equity securities portfolio are further detailed below.
The table below presents the changes in the period-end balances for available-for-sale, held-to-maturity and equity securities from December 31, 2021 to December 31, 2022 (in thousands):
|
|
|
|
|
|
|
|
|
|
|
|
|
|
|
|
|
|
|
|
|
|
|
|
|
|
|
|
|
|
|
|
|
|
|
|
|
(Dollars in Thousands) |
|
Fair Value at Period-End |
|
Net Unrealized (Losses) Gains
For Period Ended |
|
12/31/2022 |
|
12/31/2021 |
|
Change |
|
12/31/2022 |
|
12/31/2021 |
|
Change |
| Securities Available-for-Sale: |
|
|
|
|
|
|
|
|
|
|
|
|
|
|
|
|
|
|
|
|
|
|
|
| U.S. Agency Securities |
$ |
175,199 |
|
|
$ |
108,365 |
|
|
$ |
66,834 |
|
|
$ |
(14,801) |
|
|
$ |
(1,635) |
|
|
$ |
(13,166) |
|
| State and Municipal Obligations |
340 |
|
|
400 |
|
|
(60) |
|
|
— |
|
|
— |
|
|
— |
|
Mortgage-Backed Securities |
397,156 |
|
|
449,751 |
|
|
(52,595) |
|
|
(50,599) |
|
|
1,009 |
|
|
(51,608) |
|
| Corporate and Other Debt Securities |
800 |
|
|
800 |
|
|
— |
|
|
(200) |
|
|
(200) |
|
|
— |
|
|
|
|
|
|
|
|
|
|
|
|
|
| Total |
$ |
573,495 |
|
|
$ |
559,316 |
|
|
$ |
14,179 |
|
|
$ |
(65,600) |
|
|
$ |
(826) |
|
|
$ |
(64,774) |
|
|
|
|
|
|
|
|
|
|
|
|
|
| Securities Held-to-Maturity: |
|
|
|
|
|
|
|
|
|
|
|
| State and Municipal Obligations |
$ |
160,470 |
|
|
$ |
184,374 |
|
|
$ |
(23,904) |
|
|
$ |
(3,130) |
|
|
$ |
4,179 |
|
|
$ |
(7,309) |
|
| Mortgage-Backed Securities |
11,153 |
|
|
16,918 |
|
|
(5,765) |
|
|
(611) |
|
|
547 |
|
|
(1,158) |
|
|
|
|
|
|
|
|
|
|
|
|
|
| Total |
$ |
171,623 |
|
|
$ |
201,292 |
|
|
$ |
(29,669) |
|
|
$ |
(3,741) |
|
|
$ |
4,726 |
|
|
$ |
(8,467) |
|
|
|
|
|
|
|
|
|
|
|
|
|
| Equity Securities |
$ |
2,174 |
|
|
$ |
1,747 |
|
|
$ |
427 |
|
|
$ |
— |
|
|
$ |
— |
|
|
$ |
— |
|
|
|
|
|
|
|
|
|
|
|
|
|
The table below presents the weighted average yield for available-for-sale and held-to-maturity securities as of December 31, 2022 (in thousands).
|
|
|
|
|
|
|
|
|
|
|
|
|
|
|
|
|
|
|
|
|
|
|
|
|
|
|
|
|
|
|
|
|
|
|
|
|
|
|
|
|
|
|
|
|
|
|
|
|
|
|
|
|
|
|
|
|
|
|
|
|
December 31, 2022 |
|
Within One Year |
|
After One But Within Five Years |
|
After Five But Within Ten Years |
|
After Ten Years |
|
Total |
|
Amount |
|
Yield |
|
Amount |
|
Yield |
|
Amount |
|
Yield |
|
Amount |
|
Yield |
|
Amount |
|
Yield |
| Securities Available-for-Sale: |
|
|
|
|
|
|
|
|
|
|
|
|
|
|
|
|
|
|
|
|
|
|
|
|
|
|
|
|
|
|
|
|
|
|
|
|
|
|
|
| U.S. Agency Securities |
$ |
— |
|
|
— |
% |
|
$ |
190,000 |
|
|
1.6 |
% |
|
$ |
— |
|
|
— |
% |
|
$ |
— |
|
|
— |
% |
|
$ |
190,000 |
|
190000000 |
1.6 |
% |
| State and Municipal Obligations |
20 |
|
|
6.3 |
% |
|
— |
|
|
— |
% |
|
320 |
|
|
6.8 |
% |
|
|
|
— |
% |
|
340 |
|
|
6.7 |
% |
Mortgage-Backed Securities |
690 |
|
|
1.7 |
% |
|
241,322 |
|
|
1.9 |
% |
|
205,743 |
|
|
1.6 |
% |
|
— |
|
|
— |
% |
|
447,755 |
|
|
1.8 |
% |
| Corporate and Other Debt Securities |
|
|
— |
% |
|
|
|
— |
% |
|
1,000 |
|
|
6.4 |
% |
|
— |
|
|
— |
% |
|
1,000 |
|
|
6.4 |
% |
|
|
|
|
|
|
|
|
|
|
|
|
|
|
|
|
|
|
|
|
| Total |
$ |
710 |
|
|
1.9 |
% |
|
$ |
431,322 |
|
|
1.8 |
% |
|
$ |
207,063 |
|
|
1.6 |
% |
|
$ |
— |
|
|
— |
% |
|
$ |
639,095 |
|
|
1.8 |
% |
|
|
|
|
|
|
|
|
|
|
|
|
|
|
|
|
|
|
|
|
| Securities Held-to-Maturity: |
|
|
|
|
|
|
|
|
|
|
|
|
|
|
|
|
|
|
|
| State and Municipal Obligations |
$ |
52,522 |
|
|
2.3 |
% |
|
$ |
108,233 |
|
|
2.4 |
% |
|
$ |
2,806 |
|
|
3.5 |
% |
|
$ |
39 |
|
|
6.1 |
% |
|
$ |
163,600 |
|
|
2.4 |
% |
| Mortgage-Backed Securities |
— |
|
|
— |
% |
|
11,764 |
|
|
2.5 |
% |
|
— |
|
|
— |
% |
|
— |
|
|
— |
% |
|
11,764 |
|
|
2.5 |
% |
| Corporate and Other Debt Securities |
— |
|
|
— |
% |
|
— |
|
|
— |
% |
|
— |
|
|
— |
% |
|
— |
|
|
— |
% |
|
— |
|
|
— |
% |
| Total |
$ |
52,522 |
|
|
2.3 |
% |
|
$ |
119,997 |
|
|
2.4 |
% |
|
$ |
2,806 |
|
|
3.5 |
% |
|
$ |
39 |
|
|
6.1 |
% |
|
$ |
175,364 |
|
|
2.4 |
% |
For the years above, Arrow held no investment securities in the securities portfolio that consisted of or included, directly or indirectly, obligations of foreign governments or government agencies of foreign issuers.
In the periods referenced above, mortgage-backed securities consisted solely of mortgage pass-through securities and collateralized mortgage obligations (CMOs) issued or guaranteed by U.S. federal agencies or by government-sponsored enterprises (GSEs). Mortgage pass-through securities provide to the investor monthly portions of principal and interest pursuant to the contractual obligations of the underlying mortgages. CMOs are pools of mortgage-backed securities, the repayments on which have generally been separated into two or more components (tranches), where each tranche has a separate estimated life and yield. Arrow's practice has been to purchase pass-through securities and CMOs that are issued or guaranteed by U.S. federal agencies or GSEs, and the tranches of CMOs purchased are generally those having shorter average lives and/or durations.
Lower market interest rates and/or payment deferrals on underlying loans that make up mortgage-backed security collateral may impact cashflows.
In the periods referenced above, U.S. Government & Agency Obligations consisted solely of agency bonds issued by GSEs. These securities generally pay fixed semi-annual coupons with principle payments at maturity. For some, callable options are included that may impact the timing of these principal payments. Arrow's practice has been to purchase Agency securities that are issued or guaranteed by GSEs with limited embedded optionality (call features). Final maturities are generally less than 5 years.
The yields on obligations of states and municipalities exempt from federal taxation were computed on a tax-equivalent basis. The yields on other debt securities shown in the table above are calculated by dividing annual interest, including accretion of discounts and amortization of premiums, by the amortized cost of the securities at December 31, 2022.
Arrow evaluates available-for-sale debt securities in unrealized loss positions at each measurement date to determine whether the decline in the fair value below the amortized cost basis (impairment) is due to credit-related factors or non-credit related factors. Any impairment that is not credit related is recognized in other comprehensive income, net of applicable taxes. Credit-related impairment is recognized within the allowance for credit losses on the balance sheet, limited to the amount by which the amortized cost basis exceeds the fair value, with a corresponding adjustment to earnings via credit loss expense. Arrow determined that at December 31, 2022, gross unrealized losses, $65.6 million, were primarily attributable to changes in interest rates, relative to when the investment securities were purchased, and not due to the credit quality of the investment securities. In 2022, the rising interest rate environment resulted in an increase in unrealized losses versus the comparable prior period. Arrow does not intend to sell, nor is it more likely than not that Arrow will be required to sell any securities before recovery of its amortized cost basis, which may be at maturity. Therefore, Arrow carried no allowance for credit loss at December 31, 2022 and there was no credit loss expense recognized by Arrow with respect to the securities portfolio during the year ended December 31, 2022.
At December 31, 2022 and 2021, the weighted average maturity was 4.2 and 4.0 years, respectively, for debt securities in the available-for-sale portfolio.
For further information regarding the portfolio of securities available-for-sale, see Note 4, Investment Securities, to the Consolidated Financial Statements.
Securities Held-to-Maturity:
The following table sets forth the carrying value of the portfolio of securities held-to-maturity at December 31 of each of the last two years.
SECURITIES HELD-TO-MATURITY
(Dollars In Thousands)
|
|
|
|
|
|
|
|
|
|
|
|
|
|
|
December 31, |
|
2022 |
|
2021 |
|
|
| State and Municipal Obligations |
$ |
163,600 |
|
|
$ |
180,195 |
|
|
|
| Mortgage Backed Securities - Residential |
11,764 |
|
|
16,371 |
|
|
|
|
|
|
|
|
|
| Total |
$ |
175,364 |
|
|
$ |
196,566 |
|
|
|
Arrow's held-to-maturity debt securities are comprised of GSEs and state and municipal obligations. GSE securities carry the explicit and/or implicit guarantee of the U.S. government, are widely recognized as “risk free,” and have a long history of zero credit loss. Arrow performs an analysis of the credit worthiness of municipal obligations to determine if a security is of investment grade. The analysis may include, but may not solely rely upon credit analysis conducted by external credit rating agencies. Arrow determined that the expected credit loss on its held to maturity debt portfolio was immaterial and, therefore, no allowance for credit loss was recorded as of December 31, 2022.
At December 31, 2022 and 2021, the weighted average maturity was 1.9 and 2.0 years, respectively, for the debt securities in the held-to-maturity portfolio.
For additional information regarding the fair value of the portfolio of securities held-to-maturity at December 31, 2022, see Note 4, Investment Securities, to the Consolidated Financial Statements.
EQUITY SECURITIES
(Dollars In Thousands)
The following table is the schedule of Equity Securities at December 31 of each of the last two years.
|
|
|
|
|
|
|
|
|
|
|
|
|
|
|
|
|
| Equity Securities |
|
|
|
|
|
|
|
|
|
December 31, |
|
|
2022 |
|
2021 |
|
|
|
|
|
|
|
|
|
| Equity Securities, at Fair Value |
|
$ |
2,174 |
|
|
$ |
1,747 |
|
|
|
|
|
|
|
|
|
|
|
|
|
|
|
|
|
|
|
|
|
|
|
|
|
|
|
|
|
|
|
|
|
|
|
|
|
|
|
|
|
|
|
|
|
|
|
|
|
|
|
|
|
|
|
|
|
|
|
|
|
|
|
|
|
|
|
|
|
|
|
|
|
|
|
|
|
|
|
|
|
|
|
|
|
|
|
|
|
|
|
|
|
|
|
|
|
|
|
|
|
|
|
|
|
|
|
|
II. LOAN PORTFOLIO
The amounts and respective percentages of loans outstanding represented by each principal category on the dates indicated were as follows:
a. Types of Loans
(Dollars In Thousands)
|
|
|
|
|
|
|
|
|
|
|
|
|
|
|
|
|
|
|
|
|
|
|
|
|
|
|
|
|
|
|
|
|
|
|
|
|
December 31, |
|
2022 |
|
2021 |
|
|
|
|
|
|
|
Amount |
|
% |
|
Amount |
|
% |
|
|
|
|
|
|
|
|
|
|
|
|
| Commercial |
$ |
140,293 |
|
|
5 |
% |
|
$ |
172,518 |
|
|
6 |
% |
|
|
|
|
|
|
|
|
|
|
|
|
|
|
|
|
|
|
|
|
|
|
|
|
|
|
|
|
|
|
|
|
| Commercial Real Estate |
707,022 |
|
|
24 |
% |
|
628,929 |
|
|
24 |
% |
|
|
|
|
|
|
|
|
|
|
|
|
| Consumer |
1,065,135 |
|
|
35 |
% |
|
920,556 |
|
|
35 |
% |
|
|
|
|
|
|
|
|
|
|
|
|
| Residential Real Estate |
1,070,757 |
|
|
36 |
% |
|
945,938 |
|
|
35 |
% |
|
|
|
|
|
|
|
|
|
|
|
|
| Total Loans |
2,983,207 |
|
|
100 |
% |
|
2,667,941 |
|
|
100 |
% |
|
|
|
|
|
|
|
|
|
|
|
|
| Allowance for Credit Losses |
(29,952) |
|
|
|
|
(27,281) |
|
|
|
|
|
|
|
|
|
|
|
|
|
|
|
| Total Loans, Net |
$ |
2,953,255 |
|
|
|
|
$ |
2,640,660 |
|
|
|
|
|
|
|
|
|
|
|
|
|
|
|
Commercial and Commercial Real Estate Loans: Commercial and commercial real estate loans in the loan portfolio were extended to businesses or borrowers primarily located in Arrow's regional markets. A portion of the loans in the commercial portfolio have variable rates tied to market indices, such as Prime, LIBOR, SOFR or FHLBNY. PPP loans were previously included within the commercial loan portfolio. There were no PPP loans outstanding as of December 31, 2022.
Consumer Loans: At December 31, 2022, consumer loans (primarily automobile loans originated through dealerships located in New York and Vermont) continue to be a significant component of Arrow's business, comprising approximately one third of the total loan portfolio.
Consumer loan originations have remained strong in 2022, with origination volume for the last three years at $572.3 million, $452.1 million and $386.4 million for 2022, 2021 and 2020, respectively.
For credit quality purposes, Arrow assigns potential automobile loan customers into one of four tiers, ranging from lower to higher quality in terms of anticipated credit risk. Arrow's experienced lending staff not only utilizes credit evaluation software tools but also reviews and evaluates each loan individually prior to the loan being funded. Arrow believes that this disciplined approach to evaluating risk has contributed to maintaining the strong credit quality in this portfolio.
Residential Real Estate Loans: Gross originations for residential real estate loans (including refinancings of mortgage loans) were $217.5 million, $244.5 million and $250.1 million for the years 2022, 2021, and 2020, respectively.
Demand for residential real estate has continued but weakened as interest rates have increased. New origination activity has benefited from the higher rates. A continuous elevated rate environment may impact future demand. Arrow continues to sell portions of these originations in the secondary market. Sales decreased during 2021 and were minimal in 2022 as the result of the strategic decision to grow the residential loan portfolio. The rate at which mortgage loan originations are sold in future periods will depend on a variety of factors, including demand for residential mortgages in our operating markets, market conditions for mortgage sales and strategic balance sheet and interest-rate risk management decisions.
The following table indicates the changing mix in the loan portfolio by including the quarterly average balances for the significant loan segments for the past five quarters. The remaining quarter-by-quarter tables present the percentage of total loans represented by each category and the annualized yield of each category.
LOAN PORTFOLIO
Quarterly Average Loan Balances
(Dollars In Thousands)
|
|
|
|
|
|
|
|
|
|
|
|
|
|
|
|
|
|
|
|
|
|
|
|
|
|
|
|
|
|
|
Quarters Ended |
|
12/31/2022 |
|
9/30/2022 |
|
6/30/2022 |
|
3/31/2022 |
|
12/31/2021 |
| Commercial excluding PPP Loans |
$ |
141,419 |
|
|
$ |
134,986 |
|
|
$ |
130,177 |
|
|
$ |
135,472 |
|
|
$ |
127,346 |
|
| PPP Loans |
— |
|
|
637 |
|
|
11,267 |
|
|
26,086 |
|
|
48,778 |
|
| Commercial Real Estate |
674,420 |
|
|
661,471 |
|
|
645,968 |
|
|
631,255 |
|
|
623,273 |
|
| Consumer |
1,065,467 |
|
|
1,047,470 |
|
|
1,013,361 |
|
|
932,401 |
|
|
921,376 |
|
| Residential Real Estate |
1,070,241 |
|
|
1,027,502 |
|
|
1,003,407 |
|
|
953,582 |
|
|
939,892 |
|
| Total Loans |
$ |
2,951,547 |
|
|
$ |
2,872,066 |
|
|
$ |
2,804,180 |
|
|
$ |
2,678,796 |
|
|
$ |
2,660,665 |
|
Percentage of Total Quarterly Average Loans
|
|
|
|
|
|
|
|
|
|
|
|
|
|
|
|
|
|
|
|
|
|
|
|
|
|
|
|
|
|
|
Quarters Ended |
|
12/31/2022 |
|
9/30/2022 |
|
6/30/2022 |
|
3/31/2022 |
|
12/31/2021 |
| Commercial excluding PPP Loans |
4.8 |
% |
|
4.7 |
% |
|
4.6 |
% |
|
5.0 |
% |
|
4.8 |
% |
| PPP Loans |
— |
% |
|
— |
% |
|
0.4 |
% |
|
1.0 |
% |
|
1.8 |
% |
| Commercial Real Estate |
22.8 |
% |
|
23.0 |
% |
|
23.0 |
% |
|
23.6 |
% |
|
23.4 |
% |
| Consumer |
36.1 |
% |
|
36.5 |
% |
|
36.2 |
% |
|
34.8 |
% |
|
34.6 |
% |
| Residential Real Estate |
36.3 |
% |
|
35.8 |
% |
|
35.8 |
% |
|
35.6 |
% |
|
35.4 |
% |
| Total Loans |
100.0 |
% |
|
100.0 |
% |
|
100.0 |
% |
|
100.0 |
% |
|
100.0 |
% |
Quarterly Yield on Loans
|
|
|
|
|
|
|
|
|
|
|
|
|
|
|
|
|
|
|
|
|
|
|
|
|
|
|
|
|
|
|
Quarters Ended |
|
12/31/2022 |
|
9/30/2022 |
|
6/30/2022 |
|
3/31/2022 |
|
12/31/2021 |
| Commercial (total portfolio) |
4.18 |
% |
|
4.17 |
% |
|
3.93 |
% |
|
4.17 |
% |
|
3.97 |
% |
| Commercial excluding PPP loans |
4.18 |
% |
|
4.17 |
% |
|
3.90 |
% |
|
3.87 |
% |
|
3.83 |
% |
| Commercial Real Estate |
4.57 |
% |
|
4.60 |
% |
|
3.82 |
% |
|
3.80 |
% |
|
3.78 |
% |
| Consumer |
4.02 |
% |
|
4.10 |
% |
|
3.83 |
% |
|
3.84 |
% |
|
3.87 |
% |
| Residential Real Estate |
3.80 |
% |
|
3.78 |
% |
|
3.70 |
% |
|
3.71 |
% |
|
3.73 |
% |
| Total Loans - QTD Average |
4.13 |
% |
|
4.09 |
% |
|
3.85 |
% |
|
3.90 |
% |
|
3.82 |
% |
The average yield on the loan portfolio increased from 3.82% for the fourth quarter of 2021 to 4.13% for the fourth quarter of 2022. The current raising rate environment prevailed for much of 2022, which impacted new loan yields for both fixed and variable rate loans.
PPP Loans
Arrow originated over $234.2 million of PPP loans in 2020 and 2021. Arrow completed the PPP program in 2022.
|
|
|
|
|
|
|
|
|
|
|
|
|
|
|
|
Outstanding PPP Loans
(Dollars In Thousands)
|
|
|
Years Ended December 31, |
|
|
|
|
|
|
|
2022 |
|
2021 |
| Beginning Balance |
|
$ |
43,649 |
|
|
$ |
114,630 |
|
| PPP Loans Funded |
|
— |
|
|
91,511 |
|
| PPP Loans Forgiven |
|
(43,649) |
|
|
(162,492) |
|
| Ending PPP Loans |
|
$ |
— |
|
|
$ |
43,649 |
|
|
|
|
|
|
|
|
|
|
|
|
|
|
|
|
|
Income Earned on PPP Loans
(Dollars In Thousands)
|
|
|
Years Ended December 31, |
|
|
|
|
|
|
|
2022 |
|
2021 |
| Interest Earned |
|
$ |
97 |
|
|
$ |
1,067 |
|
| Fees Recognized |
|
1,477 |
|
|
6,744 |
|
| Income Earned on PPP Loans |
|
$ |
1,574 |
|
|
$ |
7,811 |
|
The following table indicates the respective maturities and interest rate structure of commercial loans and commercial real estate construction loans at December 31, 2022. For purposes of determining relevant maturities, loans are assumed to mature at (but not before) their scheduled repayment dates as required by contractual terms. Demand loans and overdrafts are included in the “Within 1 Year” maturity category. Most of the commercial construction loans are made with a commitment for permanent financing, whether extended by us or unrelated third parties. The maturity distribution below reflects the final maturity of the permanent financing.
b. Maturities and Sensitivities of Loans to Changes in Interest Rates
(Dollars in Thousands)
The table below shows the maturity of loans outstanding as of December 31, 2022. Also provided are the amounts due after one year, classified according to fixed interest rates and variable interest rates (in thousands):
|
|
|
|
|
|
|
|
|
|
|
|
|
|
|
|
|
|
|
|
|
|
|
|
|
|
|
|
|
|
|
December 31, 2022 |
|
Within One Year |
|
After One But Within Five Years |
|
After Five But Within 15 Years |
|
After 15 Years |
|
Total |
| Commercial |
$ |
26,019 |
|
|
$ |
74,943 |
|
|
$ |
39,215 |
|
|
$ |
116 |
|
|
$ |
140,293 |
|
| Commercial Real Estate |
182,494 |
|
|
212,354 |
|
|
306,607 |
|
|
5,567 |
|
|
707,022 |
|
| Consumer |
11,595 |
|
|
527,907 |
|
|
525,132 |
|
|
501 |
|
|
1,065,135 |
|
| Residential Real Estate |
142,824 |
|
|
53,594 |
|
|
226,887 |
|
|
647,452 |
|
|
1,070,757 |
|
| Total |
$ |
362,932 |
|
|
$ |
868,798 |
|
|
$ |
1,097,841 |
|
|
$ |
653,636 |
|
|
$ |
2,983,207 |
|
|
|
|
|
|
|
|
|
|
|
|
|
|
After One But Within Five Years |
|
After Five But Within 15 Years |
|
After 15 Years |
|
Total |
| Loans maturing with: |
|
|
|
|
|
|
|
|
|
| Fixed Interest Rates |
|
|
$ |
600,355 |
|
|
$ |
929,621 |
|
|
$ |
651,751 |
|
|
$ |
2,181,727 |
|
| Variable Interest Rates |
|
|
268,443 |
|
|
168,220 |
|
|
1,885 |
|
|
438,548 |
|
| Total |
|
|
$ |
868,798 |
|
|
$ |
1,097,841 |
|
|
$ |
653,636 |
|
|
$ |
2,620,275 |
|
|
|
|
|
|
|
|
|
|
|
COMMITMENTS AND LINES OF CREDIT
Stand-by letters of credit represent extensions of credit granted in the normal course of business, which are not reflected in the financial statements at a given date because the commitments are not funded at that time. As of December 31, 2022, the total contingent liability for standby letters of credit amounted to $3.6 million. In addition to these instruments, there are lines of credit to customers, including home equity lines of credit, commitments for residential and commercial construction loans and other personal and commercial lines of credit, which also may be unfunded or only partially funded from time-to-time. Commercial lines, generally issued for a period of one year, are usually extended to provide for the working capital requirements of the borrower. At December 31, 2022, outstanding unfunded loan commitments in the aggregate amount were approximately $424.2 million compared to $402.3 million at December 31, 2021.
c. Risk Elements
1. Nonaccrual, Past Due and Restructured Loans
The amounts of nonaccrual, past due and restructured loans at year-end for each of the past two years are presented in the table on page 33 under the heading "Summary of the Allowance and Provision for Credit Losses."
Loans are placed on nonaccrual status either due to the delinquency status of principal and/or interest or a judgment by Management that the full repayment of principal and interest is unlikely. Unless already placed on nonaccrual status, loans secured by home equity lines of credit are put on nonaccrual status when 120 days past due and residential real estate loans are put on nonaccrual status when 150 days past due. Commercial and commercial real estate loans are evaluated on a loan-by-loan basis and are placed on nonaccrual status when 90 days past due if the full collection of principal and interest is uncertain. Under the Uniform Retail Credit Classification and Account Management Policy established by banking regulators, fixed-maturity consumer loans not secured by real estate must generally be charged-off no later than when 120 days past due. Loans secured with non-real estate collateral in the process of collection are charged-down to the value of the collateral, less cost to sell. Arrow had no material commitments to lend additional funds on outstanding nonaccrual loans at December 31, 2022. Loans past due 90 days or more and still accruing interest are those loans which were contractually past due 90 days or more but because of expected repayments, were still accruing interest.
The balance of loans 30-89 days past due and still accruing interest totaled $20.4 million at December 31, 2022 and represented 0.68% of loans outstanding at that date, as compared to approximately $12.2 million, or 0.46% of loans outstanding at December 31, 2021. These non-current loans at December 31, 2022 were composed of approximately $18.2 million of consumer loans (principally indirect automobile loans), $1.8 million of residential real estate loans and $0.4 million of commercial and commercial real estate loans.
The method for measuring all other loans is described in detail in Note 2, Summary of Significant Accounting Policies, and Note 5, Loans, to the Consolidated Financial Statements.
Note 5, Loans, to the Consolidated Financial Statements contains detailed information on modified loans and impaired loans.
2. Potential Problem Loans
On at least a quarterly basis, the internal credit quality rating is re-evaluated for commercial loans that are either past due or fully performing but exhibit certain characteristics that could reflect well-defined weaknesses. Loans are placed on nonaccrual status when the likely amount of future principal and interest payments are expected to be less than the contractual amounts, even if such loans are not past due.
Periodically, Arrow reviews the loan portfolio for evidence of potential problem loans. Potential problem loans are loans that are currently performing in accordance with contractual terms, but where known information about possible credit problems of the borrower may jeopardize loan repayment and result in a non-performing loan. In the credit monitoring program, Arrow treats loans that are classified as substandard but continue to accrue interest as potential problem loans. At December 31, 2022, Arrow identified 52 commercial loans totaling $41.7 million as potential problem loans. At December 31, 2021, Arrow identified 56 commercial loans totaling $37.5 million as potential problem loans. For these loans, although positive factors such as payment history, value of supporting collateral, and/or personal or government guarantees led Arrow to conclude that accounting for them as non-performing at year-end was not warranted, other factors, specifically, certain risk factors related to the loan or the borrower justified concerns that they may become nonperforming at some point in the future.
3. Foreign Outstandings - None
4. Loan Concentrations
The loan portfolio is well diversified. There are no concentrations of credit that exceed 10% of the portfolio, other than the general categories reported in the preceding Section C.II.a. of this Item 7, beginning on page 40. For further discussion, see Note 1, Risks and Uncertainties, to the Consolidated Financial Statements.
5. Other Real Estate Owned and Repossessed Assets
Other real estate owned ("OREO") primarily consists of real property acquired in foreclosure. OREO is carried at fair value less estimated cost to sell. Arrow establishes allowances for OREO losses, which are determined and monitored on a property-by-property basis and reflect the ongoing estimate of the property's estimated fair value less costs to sell. All Repossessed Assets for each of the five years in the table below consist of motor vehicles.
|
|
|
|
|
|
|
|
|
|
|
|
|
|
|
|
|
|
|
|
|
|
Distribution of OREO and Repossessed Assets
(Dollars In Thousands) |
December 31, |
|
2022 |
|
2021 |
|
2020 |
|
|
|
|
|
|
|
|
|
|
|
|
|
|
|
|
|
|
|
|
|
|
|
|
| Other Real Estate Owned |
— |
|
|
— |
|
|
— |
|
|
|
|
|
| Repossessed Assets |
593 |
|
|
126 |
|
|
155 |
|
|
|
|
|
| Total OREO and Repossessed Assets |
$ |
593 |
|
|
$ |
126 |
|
|
$ |
155 |
|
|
|
|
|
The following table summarizes changes in the net carrying amount of OREO and the number of properties for each of the periods presented. At December 31, 2022, Arrow had no OREO.
|
|
|
|
|
|
|
|
|
|
|
|
|
|
|
|
|
|
|
|
|
|
Schedule of Changes in OREO
(Dollars In Thousands) |
2022 |
|
2021 |
|
2020 |
|
|
|
|
| Balance at Beginning of Year |
$ |
— |
|
|
$ |
— |
|
|
$ |
1,122 |
|
|
|
|
|
| Properties Acquired Through Foreclosure |
— |
|
|
99 |
|
|
— |
|
|
|
|
|
| Gain of Sale of OREO properties |
— |
|
|
— |
|
|
192 |
|
|
|
|
|
| Subsequent Write-downs to Fair Value |
— |
|
|
(19) |
|
|
— |
|
|
|
|
|
| Sales |
— |
|
|
(80) |
|
|
(1,314) |
|
|
|
|
|
| Balance at End of Year |
$ |
— |
|
|
$ |
— |
|
|
$ |
— |
|
|
|
|
|
| Number of Properties, Beginning of Year |
— |
|
|
— |
|
|
3 |
|
|
|
|
|
| Properties Acquired During the Year |
— |
|
|
1 |
|
|
— |
|
|
|
|
|
| Properties Sold During the Year |
— |
|
|
(1) |
|
|
(3) |
|
|
|
|
|
| Number of Properties, End of Year |
— |
|
|
— |
|
|
— |
|
|
|
|
|
III. SUMMARY OF CREDIT LOSS EXPERIENCE
The information required in this section is presented in the discussion of the "Provision for Credit Losses and Allowance for Credit Losses" in Part II Item 7, Section B.II. beginning on page 33 of this Report, including:
•Charge-offs and Recoveries by loan type
•Factors that led to the amount of the Provision for Credit Losses
•Allocation of the Allowance for Credit Losses by loan type
The percent of loans in each loan category is presented in the table of loan types in the preceding section on page 40 of this Report.
IV. DEPOSITS
The following table sets forth the average balances of and average rates paid on deposits for the periods indicated.
AVERAGE DEPOSIT BALANCES
(Dollars In Thousands)
|
|
|
|
|
|
|
|
|
|
|
|
|
|
|
|
|
|
|
|
|
|
|
|
|
|
|
|
|
|
|
|
|
|
|
|
|
|
Years Ended |
|
|
12/31/2022 |
|
12/31/2021 |
|
12/31/2020 |
|
|
Average
Balance |
|
Rate |
|
Average
Balance |
|
Rate |
|
Average
Balance |
|
Rate |
|
| Demand Deposits |
$ |
815,218 |
|
|
— |
% |
|
$ |
767,671 |
|
|
— |
% |
|
$ |
613,408 |
|
|
— |
% |
|
| Interest-Bearing Checking Accounts |
1,038,751 |
|
|
0.09 |
% |
|
926,875 |
|
|
0.08 |
% |
|
772,000 |
|
|
0.17 |
% |
|
| Savings Deposits |
1,549,278 |
|
|
0.51 |
% |
|
1,496,906 |
|
|
0.13 |
% |
|
1,258,154 |
|
|
0.40 |
% |
|
| Time Deposits of $250,000 or More |
55,690 |
|
|
0.66 |
% |
|
87,033 |
|
|
0.30 |
% |
|
124,601 |
|
|
1.18 |
% |
|
| Other Time Deposits |
132,541 |
|
|
0.46 |
% |
|
141,677 |
|
|
0.45 |
% |
|
223,111 |
|
|
1.25 |
% |
|
| Total Deposits |
$ |
3,591,478 |
|
|
0.27 |
% |
|
$ |
3,420,162 |
|
|
0.10 |
% |
|
$ |
2,991,274 |
|
|
0.36 |
% |
|
Average total deposit balances increased by $171.3 million, or 5.0% in 2022, mainly in the demand deposit, checking and savings deposit categories.
Arrow used reciprocal deposits for a select group of municipalities to reduce the amount of investment securities required to be pledged as collateral for municipal deposits where municipal deposits in excess of the FDIC insurance coverage limits were transferred to other participating banks, divided into portions so as to qualify such transferred deposits for FDIC insurance coverage at each transferee bank. In return, reciprocal amounts are transferred to Arrow in equal amounts of deposits from the participant banks. The balances of reciprocal deposits were $520.6 million and $529.8 million at December 31, 2022 and 2021, respectively.
The following tables presents the quarterly average balance by deposit type for each of the most recent five quarters.
DEPOSIT PORTFOLIO
Quarterly Average Deposit Balances
(Dollars In Thousands)
|
|
|
|
|
|
|
|
|
|
|
|
|
|
|
|
|
|
|
|
|
|
|
|
|
|
|
|
|
|
|
Quarters Ended |
|
12/31/2022 |
|
9/30/2022 |
|
6/30/2022 |
|
3/31/2022 |
|
12/31/2021 |
| Demand Deposits |
$ |
787,157 |
|
|
$ |
866,659 |
|
|
$ |
811,607 |
|
|
$ |
794,968 |
|
|
$ |
819,624 |
|
| Interest-Bearing Checking Accounts |
1,082,267 |
|
|
996,116 |
|
|
1,048,752 |
|
|
1,027,740 |
|
|
998,398 |
|
| Savings Deposits |
1,548,293 |
|
|
1,549,451 |
|
|
1,541,616 |
|
|
1,557,855 |
|
|
1,562,318 |
|
| Time Deposits of $250,000 or More |
65,897 |
|
|
49,459 |
|
|
37,418 |
|
|
70,101 |
|
|
71,965 |
|
| Other Time Deposits |
131,331 |
|
|
136,834 |
|
|
130,361 |
|
|
131,592 |
|
|
138,461 |
|
| Total Deposits |
$ |
3,614,945 |
|
|
$ |
3,598,519 |
|
|
$ |
3,569,754 |
|
|
$ |
3,582,256 |
|
|
$ |
3,590,766 |
|
|
|
|
|
|
|
|
|
|
|
|
|
|
|
|
|
|
|
|
|
|
|
|
|
|
|
|
|
|
|
|
Quarters Ended |
|
12/31/2022 |
|
9/30/2022 |
|
6/30/2022 |
|
3/31/2022 |
|
12/31/2021 |
| Non-Municipal Deposits |
$ |
2,668,704 |
|
|
$ |
2,719,291 |
|
|
$ |
2,662,052 |
|
|
$ |
2,639,258 |
|
|
$ |
2,629,553 |
|
| Municipal Deposits |
946,241 |
|
|
879,228 |
|
|
907,702 |
|
|
942,998 |
|
|
961,213 |
|
| Total Deposits |
$ |
3,614,945 |
|
|
$ |
3,598,519 |
|
|
$ |
3,569,754 |
|
|
$ |
3,582,256 |
|
|
$ |
3,590,766 |
|
The above tables provide information on trends in the balance and mix of the deposit portfolio by presenting, for each of the last five quarters, the quarterly average balances by deposit type. Time deposits over $250,000 and other time deposits have decreased for the four quarters leading into the fourth quarter of 2022. In the current quarter, the overall balance of time deposits has increased as the result of a strategic initiative to grow certificate of deposit balances. Despite the increase in the average deposit balance from the third to fourth quarter of 2022, deposits decreased from September 30, 2022 to December 31, 2022. The decrease in deposits was primarily the result of both increased consumer spending and pressure from competitive rate pricing.
In general, there is a seasonal pattern to municipal deposits which dip to a low point in August each year. Account balances tend to increase throughout the fall and into early winter from tax deposits, flatten out after the beginning of the ensuing calendar year, and increase again at the end of March from the electronic deposit of NYS Aid payments to school districts. In addition to seasonal behavior, the likelihood of downward trajectory of municipal balances may be the result of record high balances that included American Rescue Plan and other COVID-19 pandemic response stimulus as well as increasing competition in the current rate environment.
The total quarterly average balances as a percentage of total deposits are illustrated in the table below.
|
|
|
|
|
|
|
|
|
|
|
|
|
|
|
|
|
|
|
|
|
|
|
|
|
|
|
|
|
|
| Percentage of Total Quarterly Average Deposits |
Quarters Ended |
|
12/31/2022 |
|
9/30/2022 |
|
6/30/2022 |
|
3/31/2022 |
|
12/31/2021 |
| Demand Deposits |
21.8 |
% |
|
24.1 |
% |
|
22.7 |
% |
|
22.2 |
% |
|
22.8 |
% |
| Interest-Bearing Checking Accounts |
29.9 |
% |
|
27.7 |
% |
|
29.4 |
% |
|
28.7 |
% |
|
27.8 |
% |
| Savings Deposits |
42.9 |
% |
|
43.0 |
% |
|
43.2 |
% |
|
43.4 |
% |
|
43.5 |
% |
| Time Deposits of $250,000 or More |
1.8 |
% |
|
1.4 |
% |
|
1.0 |
% |
|
2.0 |
% |
|
2.0 |
% |
| Other Time Deposits |
3.6 |
% |
|
3.8 |
% |
|
3.7 |
% |
|
3.7 |
% |
|
3.9 |
% |
| Total Deposits |
100.0 |
% |
|
100.0 |
% |
|
100.0 |
% |
|
100.0 |
% |
|
100.0 |
% |
The total quarterly interest cost of deposits, by type of deposit and in total, for each of the most recent five quarters is set forth in the table below:
|
|
|
|
|
|
|
|
|
|
|
|
|
|
|
|
|
|
|
|
|
|
|
|
|
|
|
|
|
|
| Quarterly Cost of Deposits |
Quarters Ended |
|
12/31/2022 |
|
9/30/2022 |
|
6/30/2022 |
|
3/31/2022 |
|
12/31/2021 |
| Demand Deposits |
— |
% |
|
— |
% |
|
— |
% |
|
— |
% |
|
— |
% |
| Interest-Bearing Checking Accounts |
0.13 |
% |
|
0.11 |
% |
|
0.08 |
% |
|
0.06 |
% |
|
0.07 |
% |
| Savings Deposits |
1.05 |
% |
|
0.63 |
% |
|
0.23 |
% |
|
0.11 |
% |
|
0.10 |
% |
| Time Deposits of $250,000 or More |
1.36 |
% |
|
0.71 |
% |
|
0.28 |
% |
|
0.16 |
% |
|
0.18 |
% |
| Other Time Deposits |
0.71 |
% |
|
0.43 |
% |
|
0.34 |
% |
|
0.33 |
% |
|
0.35 |
% |
| Total Deposits |
0.54 |
% |
|
0.33 |
% |
|
0.14 |
% |
|
0.08 |
% |
|
0.08 |
% |
The cost of deposits began to increase in the second quarter of 2022, and accelerated in the third and fourth quarters. The Federal Funds rate increased throughout 2022 and is anticipated to continue into 2023. Arrow believes it is well positioned for a variety of rate environments.
The maturities of time deposits of $250,000 or more at December 31, 2022 are presented below. (Dollars In Thousands)
|
|
|
|
|
|
| Maturing in: |
|
| Under Three Months |
$ |
15,215 |
|
| Three to Six Months |
13,848 |
|
| Six to Twelve Months |
30,002 |
|
| 2024 |
14,653 |
|
| 2025 |
2,254 |
|
| 2026 |
252 |
|
| 2027 |
— |
|
| Later |
— |
|
| Total |
$ |
76,224 |
|
V. SHORT-TERM BORROWINGS (Dollars in Thousands)
|
|
|
|
|
|
|
|
|
|
|
|
|
|
|
|
|
|
|
12/31/2022 |
|
12/31/2021 |
|
12/31/2020 |
Overnight Advances from the FHLBNY, Federal Funds Purchased
and Securities Sold Under Agreements to Repurchase: |
|
|
|
|
|
| Balance at December 31 |
$ |
27,000 |
|
|
$ |
— |
|
|
$ |
17,486 |
|
| Maximum Month-End Balance |
27,000 |
|
|
15,798 |
|
|
73,949 |
|
| Average Balance During the Year |
2,124 |
|
|
4,768 |
|
|
57,929 |
|
| Average Rate During the Year |
4.34 |
% |
|
0.06 |
% |
|
0.43 |
% |
| Rate at December 31 |
4.61 |
% |
|
N/A |
|
0.07 |
% |
D. LIQUIDITY
The objective of effective liquidity management is to ensure that Arrow has the ability to raise cash when needed at a reasonable cost. This includes the capability of meeting expected and unexpected obligations to Arrow's customers at any time. Given the uncertain nature of customer demands and the need to maximize earnings, Arrow must have available reasonably priced sources of funds, both on- and off-balance sheet, that can be accessed quickly in times of need. Arrow’s liquidity position should provide the Company with the necessary flexibility to address any unexpected near-term disruptions such as reduced cash flows from the investment and loan portfolio, unexpected deposit runoff, or increased loan originations.
Arrow's primary sources of available liquidity are overnight investments in federal funds sold, interest bearing bank balances at the Federal Reserve Bank of New York, and cash flow from investment securities and loans. Certain investment securities are categorized as available-for-sale at time of purchase based on their marketability and collateral value, as well as their yield and maturity. The securities available-for-sale portfolio was $573.5 million at year-end 2022, an increase of $14.2 million from the year-end 2021 level. Due to the potential for volatility in market values, Arrow may not always be able to sell securities on short notice at their carrying value, even to provide needed liquidity. Arrow also held interest-bearing cash balances at December 31, 2022 of $32.8 million compared to $430.7 million at December 31, 2021.
In addition to liquidity from cash, short-term investments, investment securities and loans, Arrow has supplemented available operating liquidity with additional off-balance sheet sources such as a federal funds lines of credit with correspondent banks and credit lines with the FHLBNY. The federal funds lines of credit are with two correspondent banks totaling $52 million which were not drawn on in 2022.
To support the borrowing relationship with the FHLBNY, Arrow has pledged collateral, including residential mortgage, home equity and commercial real estate loans. At December 31, 2022, Arrow had outstanding collateralized obligations with the FHLBNY of $45 million; as of that date, the unused borrowing capacity at the FHLBNY was approximately $608 million. Brokered deposits have also been identified as an available source of funding accessible in a relatively short time period. At December 31, 2022, there were no outstanding brokered deposits. In addition, Arrow's two bank subsidiaries have each established a borrowing facility with the Federal Reserve Bank of New York, pledging certain consumer loans as collateral for potential "discount window" advances, which are maintained for contingency liquidity purposes. At December 31, 2022, the amount available under this facility was approximately $649 million in the aggregate, and there were no advances then outstanding.
Arrow performs regular liquidity stress tests and tests of the contingent liquidity plan to ensure that an adequate amount of available funds can be generated to meet a wide variety of potential liquidity events. Additionally, Arrow continually monitors levels and composition of uninsured deposits.
Arrow measures and monitors basic liquidity as a ratio of liquid assets to total short-term liabilities, both with and without the availability of borrowing arrangements. Based on the level of overnight investments, available liquidity from the investment securities portfolio, cash flows from the loan portfolio, the stable core deposit base and the significant borrowing capacity, Arrow believes that the available liquidity is sufficient to meet all reasonably likely events or occurrences. At December 31, 2022, Arrow's basic liquidity ratio, including FHLBNY collateralized borrowing capacity, was 19.6% of total assets, or $619 million in excess of Arrow's internally-set minimum target ratio of 4%.
Arrow did not experience any liquidity constraints in 2022 and did not experience any such constraints in recent prior years. Arrow has not at any time during such period been forced to pay above-market rates to obtain retail deposits or other funds from any source.
E. CAPITAL RESOURCES AND DIVIDENDS
Important Regulatory Capital Standards: Dodd-Frank, enacted in 2010, directed U.S. bank regulators to promulgate revised bank organization capital standards, which were required to be at least as strict as the regulatory capital standards for banks then in effect. The Capital Rules under Dodd-Frank were adopted by the Federal bank regulatory agencies in 2013 and became effective for Arrow and its subsidiary banks on January 1, 2015. These Capital Rules are summarized in an earlier section of this Report, "Regulatory Capital Standards," beginning on page 7.
The table below sets forth the various capital ratios achieved by Arrow and its subsidiary banks, Glens Falls National and Saratoga National, as of December 31, 2022, as determined under the bank regulatory capital standards in effect on that date, as well as the minimum levels for such capital ratios that bank holding companies and banks are required to maintain under the Capital Rules (not including the "capital conservation buffer"). As demonstrated in the table, all of Arrow's and the banks' capital ratios at year-end were well in excess of the minimum required levels for such ratios, as established by the regulators.
(See Item 1, Section C, under "Regulatory Capital Standards" and Item 8, Note 19 in the Notes to Consolidated Financial Statements, for information regarding the "capital conservation buffer.") In addition, on December 31, 2022, Arrow and each of the banks qualified as "well-capitalized", the highest capital classification category under the revised capital classification scheme recently established by the federal bank regulators, that was in effect on that date.
|
|
|
|
|
|
|
|
|
|
|
|
|
|
|
|
|
|
|
|
|
Capital Ratios: |
Arrow |
|
GFNB |
|
SNB |
Minimum
Required
Ratio |
| Tier 1 Leverage Ratio |
9.8% |
|
9.0% |
|
10.5% |
4.0% |
| Common Equity Tier 1 Capital Ratio |
13.3% |
|
13.2% |
|
14.3% |
4.5% |
| Tier 1 Risk-Based Capital Ratio |
14.0% |
|
13.2% |
|
14.3% |
6.0% |
| Total Risk-Based Capital Ratio |
15.1% |
|
14.3% |
|
15.5% |
8.0% |
Federal bank regulators introduced an optional simplified measure of capital adequacy for qualifying community banking organizations (CBLR). A qualifying community banking organization that opts into the CBLR framework and meets all the requirements under the CBLR framework will be considered to have met the well-capitalized ratio requirements under the “prompt corrective action” regulations and will not be required to report or calculate risk-based capital ratios.
The CBLR final rule became effective as of January 1, 2020, and Arrow and both subsidiary banks have opted out of utilizing the CBLR framework. Therefore, the Capital Rules promulgated under Dodd-Frank will remain applicable to Arrow and both subsidiary banks.
Stockholders' Equity at Year-end 2022: Total stockholders' equity was $353.5 million at December 31, 2022, a decrease of $17.6 million, or 4.8%, from December 31, 2021. The net decrease in total stockholders' equity during 2022 principally reflected the following factors: (i) $48.8 million of net income for the year, plus (ii) $2.0 million of equity related to various stock-based compensation plans, plus (iii) $1.9 million of equity resulting from the dividend reinvestment plan, reduced by (iv) other comprehensive loss of $50.0 million, (v) cash dividends of $17.4 million and (vi) repurchases of common stock of $2.9 million.
Trust Preferred Securities: In each of 2003 and 2004, Arrow issued $10 million of trust preferred securities (TRUPs) in a private placement. Under the Federal Reserve Board's regulatory capital rules then in effect, TRUPs proceeds typically qualified as Tier 1 capital for bank holding companies such as Arrow, but only in amounts up to 25% of Tier 1 capital, net of goodwill less any associated deferred tax liability. Under the Dodd-Frank Act, any trust preferred securities that Arrow might issue on or after the grandfathering date set forth in Dodd-Frank (May 19, 2010) would not qualify as Tier 1 capital under bank regulatory capital guidelines. For Arrow, TRUPs outstanding prior to the grandfathering cutoff date set forth in Dodd-Frank (May 19, 2010) would continue to qualify as Tier 1 capital until maturity or redemption, subject to limitations. Thus, Arrow's outstanding TRUPs continue to qualify as Tier 1 regulatory capital, subject to such limitations. Arrow's recent failure to timely file this Annual Report on Form 10-K and the Quarterly Report on Form 10-Q for the quarter ended March 31, 2023, and deliver such reports to the trustee would represent a default under the indenture if the Trustee or the holders of at least 25% of the aggregate principal amount of the outstanding securities delivered such a notice. If the trustee delivers a notice of default, Arrow will have 30 days to remedy the default or else it will constitute an event of default under the indenture. The trustee has not provided a notice as of the date hereof.
In the first quarter of 2020, Arrow entered into interest rate swap agreements to synthetically fix the variable rate interest payments associated with $20 million in outstanding subordinated trust securities. The effective fixed rate is 3.43% until maturity. These agreements are designated as cash flow hedges.
Dividends: The source of funds for the payment by Arrow of cash dividends to stockholders consists primarily of dividends declared and paid to it by its bank subsidiaries. In addition to legal and regulatory limitations on payments of dividends by Arrow (i.e., the need to maintain adequate regulatory capital), there are also legal and regulatory limitations applicable to the payment of dividends by the bank subsidiaries to Arrow. As of December 31, 2022, under the statutory limitations in national banking law, the maximum amount that could have been paid by the bank subsidiaries to Arrow, without special regulatory approval, was approximately $88.8 million The ability of Arrow and its banks to pay dividends in the future is and will continue to be influenced by regulatory policies, capital guidelines and applicable laws.
See Part II, Item 5, "Market for the Registrant's Common Equity, Related Stockholder Matters and Issuer Purchases of Equity Securities" for a recent history of its cash dividend payments.
Stock Repurchase Program: In October 2021, the Board of Directors approved a $5 million stock repurchase program, effective for the period January 1, 2022 through December 31, 2022 (the 2022 Repurchase Program), under which management is authorized, in its discretion, to permit Arrow to repurchase up to $5 million of shares of Arrow's common stock, in the open market or in privately negotiated transactions, to the extent management believes Arrow's stock is reasonably priced and such repurchases appear to be an attractive use of available capital and in the best interests of shareholders. This 2022 program replaced a similar repurchase program which was in effect for the 2021 calendar year (the 2021 program), which also authorized the repurchase of up to $5.0 million of shares of Arrow's common stock. As of December 31, 2022 approximately $2.5 million had been used under the 2022 program to repurchase Arrow shares. In addition, approximately $408 thousand of Arrow's Common Stock was purchased during 2022 other than through its repurchase program, i.e., repurchases of Arrow shares on the market utilizing funds accumulated under Arrow's Dividend Reinvestment Plan and the surrender or deemed surrender of Arrow stock to Arrow in connection with employees' stock-for-stock exercises of compensatory stock options to buy Arrow stock.
The 2022 program expired on December 31, 2022. A similar 2023 program, allowing for stock repurchases of up to $5 million for calendar year 2023 was approved by the Board of Directors in October 2022.
F. OFF-BALANCE SHEET ARRANGEMENTS
In the normal course of operations, Arrow may engage in a variety of financial transactions or arrangements, including derivative transactions or arrangements, that in accordance with GAAP are not recorded in the financial statements, or are recorded in amounts that differ from the notional amounts. These transactions or arrangements involve, to varying degrees, elements of credit, interest rate, and liquidity risk. Such transactions or arrangements may be used by Arrow or Arrow's customers for general corporate purposes, such as managing credit, interest rate, or liquidity risk or to optimize capital, or may be used by Arrow or Arrow's customers to manage funding needs.
In 2021, Arrow entered into interest rate swap agreements with certain commercial customers to provide them with a long-term fixed rate, while simultaneously Arrow entered into offsetting interest rate swap agreements with a counterparty to swap the fixed rate to a variable rate to manage interest rate exposure.
Arrow's commercial loan interest rate swap agreements are not designated as a hedge for accounting purposes. The commercial loan interest rate swap agreements have substantially equivalent and offsetting terms, they do not present any material exposure to Arrow's consolidated statements of income. Arrow records its interest rate swap agreements at fair value and is presented on a gross basis within other assets and other liabilities on the consolidated balance sheets. Changes in the fair value of assets and liabilities arising from these derivatives are included, net, in other income in the consolidated statement of income.
G. CONTRACTUAL OBLIGATIONS (Dollars In Thousands)
|
|
|
|
|
|
|
|
|
|
|
|
|
|
|
|
|
|
|
|
|
|
|
|
|
|
|
|
|
|
|
Payments Due by Period |
| Contractual Obligation |
Total |
|
Less Than
1 Year
|
|
1-3 Years |
|
3-5 Years |
|
More Than 5 Years |
| Long-Term Debt Obligations: |
|
|
|
|
|
|
|
|
|
Federal Home Loan Bank Advances 1 |
$ |
27,800 |
|
|
$ |
27,800 |
|
|
$ |
— |
|
|
$ |
— |
|
|
$ |
— |
|
|
Junior Subordinated Obligations
Issued to Unconsolidated
Subsidiary Trusts 2
|
20,000 |
|
|
— |
|
|
— |
|
|
— |
|
|
20,000 |
|
Operating Lease Obligations 3 |
6,996 |
|
|
964 |
|
|
1,336 |
|
|
1,119 |
|
|
3,577 |
|
Finance Lease Obligations 3 |
8,555 |
|
|
243 |
|
|
512 |
|
|
536 |
|
|
7,264 |
|
Obligations under Retirement Plans 4 |
43,202 |
|
|
4,240 |
|
|
9,281 |
|
|
8,680 |
|
|
21,001 |
|
| Total |
$ |
106,553 |
|
|
$ |
33,247 |
|
|
$ |
11,129 |
|
|
$ |
10,335 |
|
|
$ |
51,842 |
|
1 See Note 10, Debt, to the Consolidated Financial Statements for additional information on Federal Home Loan Bank Advances, including call provisions.
2 See Note 10, Debt, to the Consolidated Financial Statements for additional information on Junior Subordinated Obligations Issued to Unconsolidated Subsidiary Trusts (trust preferred securities).
3 See Note 18, Leases, to the Consolidated Financial Statements for additional information on Operating Lease Obligations.
4 See Note 13, Retirement Benefit Plans, to the Consolidated Financial Statements for additional information on Retirement Benefit Plans.
H. RECENTLY ISSUED ACCOUNTING STANDARDS
The following accounting standard has been issued and becomes effective for Arrow at a future date:
In March 2020, the FASB issued ASU 2020-04, Reference Rate Reform (Topic 848): Facilitation of the Effects of Reference Rate Reform on Financial Reporting. On January 7, 2021, the FASB issued ASU 2021-01, which refines the scope of ASC 848 and clarifies some of its guidance. The ASU and related amendments provide temporary optional expedients and exceptions to the existing guidance for applying GAAP to affected contract modifications and hedge accounting relationships in the transition away from the LIBOR or other interbank offered rate on financial reporting. The guidance also allows a one-time election to sell and/or reclassify to AFS or trading HTM debt securities that reference an interest rate affected by reference rate reform. The amendments in this ASU are effective March 12, 2020 through December 31, 2022 and permit relief solely for reference rate reform actions and different elections over the effective date for legacy and new activity. In December 2022, FASB issued ASU 2022-06, "Reference Rate Reform (Topic 848)" which deferred the sunset date of Topic 848 to December 31, 2024, to allow for a transition period after the sunset of LIBOR. Arrow does not expect it will have a material impact on the consolidated financial statements.
In March 2022, the FASB issued ASU 2022-02, Financial Instruments-Credit Losses (Topic 326), Troubled Debt Restructurings and Vintage Disclosures. ASU 2022-02 addresses areas identified by the FASB as part of its post-implementation review of the credit losses standard (ASU 2016-13) that introduced the CECL model. The amendments eliminate the accounting guidance for troubled debt restructurings by creditors that have adopted the CECL model and enhance the disclosure requirements for loan refinancings and restructurings made with borrowers experiencing financial difficulty.
For Arrow, ASU 2022-02 is effective for fiscal years beginning after December 15, 2022. Arrow does not expect it will have a material impact on the consolidated financial statements.
I. FOURTH QUARTER RESULTS
Arrow reported net income of $12.1 million for the fourth quarter of 2022, an increase of $1.8 million, or 17.2%, from the net income of $10.3 million reported for the fourth quarter of 2021. Diluted earnings per common share for the fourth quarter of 2022 were $0.73, up from $0.62 during the fourth quarter of 2021. The net change in earnings between the two quarters was primarily due to the following: (a) a $3.4 million increase in net interest income, (b) a $424 thousand decrease in noninterest income, (c) a $851 thousand increase in the provision for credit losses, (d) a $68 thousand decrease in noninterest expense, and (e) a $390 thousand increase in the provision for income taxes. The principal factors contributing to these quarter-to-quarter changes are included in the discussion of the year-to-year changes in net income set forth elsewhere in this Item 7, specifically, in Section B, "Results of Operations," above, as well as in Arrow's Current Report on Form 8-K, as filed with the SEC on January 30, 2023, incorporating by reference Arrow's earnings release for the year ended December 31, 2022.
SELECTED FOURTH QUARTER FINANCIAL INFORMATION
(Dollars In Thousands, Except Per Share Amounts)
|
|
|
|
|
|
|
|
|
|
|
|
|
For the Quarters Ended
December 31, |
|
2022 |
|
2021 |
| Interest and Dividend Income |
$ |
35,904 |
|
|
$ |
28,354 |
|
| Interest Expense |
5,325 |
|
|
1,152 |
|
| Net Interest Income |
30,579 |
|
|
27,202 |
|
| Provision for Credit Losses |
1,409 |
|
|
558 |
|
| Net Interest Income after Provision for Credit Losses |
29,170 |
|
|
26,644 |
|
| Noninterest Income |
7,165 |
|
|
7,589 |
|
| Noninterest Expense |
20,792 |
|
|
20,860 |
|
| Income Before Provision for Income Taxes |
15,543 |
|
|
13,373 |
|
| Provision for Income Taxes |
3,456 |
|
|
3,064 |
|
| Net Income |
$ |
12,087 |
|
|
$ |
10,309 |
|
| SHARE AND PER SHARE DATA: |
|
|
|
| Weighted Average Number of Shares Outstanding: |
|
|
|
| Basic |
16,535 |
|
|
16,509 |
|
| Diluted |
16,589 |
|
|
16,574 |
|
| Basic Earnings Per Common Share |
$ |
0.73 |
|
|
$ |
0.62 |
|
| Diluted Earnings Per Common Share |
0.73 |
|
|
$ |
0.62 |
|
| Cash Dividends Per Common Share |
0.270 |
|
|
0.252 |
|
| AVERAGE BALANCES: |
|
|
|
| Assets |
$ |
4,074,028 |
|
|
$ |
4,060,540 |
|
| Earning Assets |
3,940,905 |
|
|
3,894,287 |
|
| Loans |
2,951,547 |
|
|
2,660,665 |
|
| Deposits |
3,614,945 |
|
|
3,590,766 |
|
| Stockholders’ Equity |
351,402 |
|
|
364,409 |
|
| SELECTED RATIOS (Annualized): |
|
|
|
| Return on Average Assets |
1.18 |
% |
|
1.01 |
% |
| Return on Average Equity |
13.65 |
% |
|
11.22 |
% |
| Net Interest Margin |
3.08 |
% |
|
2.77 |
% |
| Net Charge-offs to Average Loans |
0.09 |
% |
|
0.03 |
% |
| Provision for Credit Losses to Average Loans |
0.19 |
% |
|
0.08 |
% |
SUMMARY OF QUARTERLY FINANCIAL DATA (Unaudited)
The following quarterly financial information for 2022 and 2021 is unaudited, but, in the opinion of Management, fairly presents the results of Arrow.
SELECTED QUARTERLY FINANCIAL DATA
(Dollars In Thousands, Except Per Share Amounts)
|
|
|
|
|
|
|
|
|
|
|
|
|
|
|
|
|
|
|
|
|
|
|
|
|
2022 |
|
First
Quarter
|
|
Second
Quarter
|
|
Third
Quarter
|
|
Fourth
Quarter
|
| Total Interest and Dividend Income |
$ |
28,947 |
|
|
$ |
30,593 |
|
|
$ |
34,207 |
|
|
$ |
35,904 |
|
| Net Interest Income |
27,825 |
|
|
29,038 |
|
|
30,901 |
|
|
30,579 |
|
| Provision for Credit Losses |
769 |
|
|
905 |
|
|
1,715 |
|
|
1,409 |
|
| Net (Loss) Gain on Securities |
130 |
|
|
154 |
|
|
95,000 |
|
|
48 |
|
| Income Before Provision for Income Taxes |
16,273 |
|
|
15,532 |
|
|
15,565 |
|
|
15,543 |
|
| Net Income |
12,575 |
|
|
11,974 |
|
|
12,163 |
|
|
12,087 |
|
| Basic Earnings Per Common Share |
0.76 |
|
|
0.72 |
|
|
0.74 |
|
|
0.73 |
|
| Diluted Earnings Per Common Share |
0.76 |
|
|
0.72 |
|
|
0.74 |
|
|
0.73 |
|
|
|
|
|
|
|
|
|
|
|
|
|
|
|
|
|
|
|
|
|
|
|
|
|
|
2021 |
|
First
Quarter
|
|
Second
Quarter
|
|
Third
Quarter
|
|
Fourth
Quarter
|
| Total Interest and Dividend Income |
$ |
27,694 |
|
|
$ |
29,695 |
|
|
$ |
29,807 |
|
|
$ |
28,354 |
|
| Net Interest Income |
26,155 |
|
|
28,360 |
|
|
28,638 |
|
|
27,202 |
|
| Provision for Loan Losses |
(648) |
|
|
263 |
|
|
99 |
|
|
558 |
|
| Net Gain on Securities |
16 |
|
|
196 |
|
|
(106) |
|
|
(139) |
|
| Income Before Provision for Income Taxes |
16,733 |
|
|
17,488 |
|
|
16,810 |
|
|
13,373 |
|
| Net Income |
13,280 |
|
|
13,279 |
|
|
12,989 |
|
|
10,309 |
|
| Basic Earnings Per Common Share |
0.81 |
|
|
0.80 |
|
|
0.79 |
|
|
0.62 |
|
| Diluted Earnings Per Common Share |
0.81 |
|
|
0.80 |
|
|
0.78 |
|
|
0.62 |
|
Item 7A. Quantitative and Qualitative Disclosures About Market Risk
In addition to credit risk in the loan portfolio and liquidity risk, discussed earlier, Arrow's business activities also generate market risk. Market risk is the possibility that changes in future market rates (interest rates) or prices (market value of financial instruments) will make Arrow's position (i.e. assets and operations) less valuable. Arrow's primary market risk is interest rate volatility. The ongoing monitoring and management of interest rate risk is an important component of the asset/liability management process, which is governed by policies that are reviewed and approved annually by the Board of Directors. The Board of Directors delegates responsibility for carrying out asset/liability oversight and control to Management's Asset/Liability Committee ("ALCO"). In this capacity ALCO develops guidelines and strategies impacting the asset/liability profile based upon estimated market risk sensitivity, policy limits and overall market interest rate levels and trends.
Changes in market interest rates, whether increases or decreases, can trigger repricing and changes in the pace of payments for both assets and liabilities (prepayment risk). This may individually or in combination affect net interest income, net interest margin, and ultimately net income, either positively or negatively. ALCO utilizes the results of a detailed and dynamic simulation model to quantify this interest rate risk by projecting net interest income in various interest rate scenarios.
Arrow's standard simulation model applies a parallel shift in interest rates, ramped over a 12-month period, to capture the impact of changing interest rates on net interest income. The results are compared to ALCO policy limits which specify a maximum tolerance level for net interest income exposure over a one-year horizon, assuming no balance sheet growth and a 200 basis point upward and a 100 basis point downward shift in interest rates. Additional tools to monitor potential longer-term interest rate risk, including periodic stress testing involving hypothetical sudden and significant interest rate spikes, are also evaluated.
The following table summarizes the percentage change in net interest income as compared to the base scenario, which assumes no change in market interest rates as generated from the standard simulation model. The results are presented for each of the first two years of the simulation period for the 200 basis point increase in interest rate scenario and the 100 basis point decrease in interest rate scenario. These results are well within the ALCO policy limits as shown.
As of December 31, 2022:
|
|
|
|
|
|
|
|
|
|
|
|
|
|
|
|
|
|
|
Change in Interest Rate |
|
Policy Limit |
|
+ 200 basis points |
|
- 100 basis points |
|
|
| Calculated change in Net Interest Income - Year 1 |
(2.47)% |
|
0.39% |
|
(10.00)% |
| Calculated change in Net Interest Income - Year 2 |
10.11% |
|
10.45% |
|
(15.00)% |
The balance sheet shows an inverse relationship between changes in prevailing rates and the Company's net interest income in the near term, suggesting that liabilities and sources of funds generally reprice more quickly than earning assets. However, when net interest income is simulated over a longer time frame, the balance sheet shows a relatively neutral profile with long-term asset sensitivity, as asset yields continue to reprice while the cost of funding reaches assumed ceilings or floors.
The hypothetical estimates underlying the sensitivity analysis are based upon numerous assumptions, including: the nature and timing of changes in interest rates including yield curve shape, prepayments on loans and securities, deposit decay rates, pricing decisions on loans and deposits, reinvestment/replacement of asset and liability cash flows, and others. While assumptions are developed based upon current economic and local market conditions, Arrow cannot make any assurance as to the predictive nature of these assumptions including how customer preferences or competitor influences might change.
Also, as market conditions vary from those assumed in the sensitivity analysis, actual results will differ due to: prepayment/refinancing levels likely deviating from those assumed, the varying impact of interest rate changes on caps or floors on adjustable rate assets, the potential effect of changing debt service levels on customers with adjustable rate loans, depositor early withdrawals and product preference changes, unanticipated shifts in the yield curve and other internal/external variables. Furthermore, the sensitivity analysis does not reflect actions that ALCO might take in responding to or anticipating changes in interest rates.
Item 8. Financial Statements and Supplementary Data
The following audited Consolidated Financial Statements and unaudited supplementary data are submitted herewith:
Reports of Independent Registered Public Accounting Firm
Consolidated Balance Sheets as of December 31, 2022 and 2021
Consolidated Statements of Income for the Years Ended December 31, 2022, 2021 and 2020
Consolidated Statements of Comprehensive Income for the Years Ended December 31, 2022, 2021 and 2020
Consolidated Statements of Cash Flows for the Years Ended December 31, 2022, 2021 and 2020
Notes to Consolidated Financial Statements
Report of Independent Registered Public Accounting Firm
To the Stockholders and Board of Directors
Arrow Financial Corporation:
Opinion on the Consolidated Financial Statements
Consolidated Statements of Changes in Stockholders' Equity for the Years Ended December 31, 2022, 2021 and 2020 We have audited the accompanying consolidated balance sheets of Arrow Financial Corporation and subsidiaries (the Company) as of December 31, 2022 and 2021, the related consolidated statements of income, comprehensive income, changes in stockholders’ equity, and cash flows for each of the years in the three-year period ended December 31, 2022, and the related notes (collectively, the consolidated financial statements). In our opinion, the consolidated financial statements present fairly, in all material respects, the financial position of the Company as of December 31, 2022 and 2021, and the results of its operations and its cash flows for each of the years in the three-year period ended December 31, 2022, in conformity with U.S. generally accepted accounting principles.
We also have audited, in accordance with the standards of the Public Company Accounting Oversight Board (United States) (PCAOB), the Company’s internal control over financial reporting as of December 31, 2022, based on criteria established in Internal Control – Integrated Framework (2013) issued by the Committee of Sponsoring Organizations of the Treadway Commission, and our report dated July 17, 2023 expressed an adverse opinion on the effectiveness of the Company’s internal control over financial reporting.
Change in Accounting Principle
As discussed in Note 2 to the consolidated financial statements, the Company has elected to change its method of accounting for the recognition and measurement of credit losses as of January 1, 2021 due to the adoption of ASC Topic 326, Financial Instruments- Credit Losses.
Basis for Opinion
These consolidated financial statements are the responsibility of the Company’s management. Our responsibility is to express an opinion on these consolidated financial statements based on our audits. We are a public accounting firm registered with the PCAOB and are required to be independent with respect to the Company in accordance with the U.S. federal securities laws and the applicable rules and regulations of the Securities and Exchange Commission and the PCAOB.
We conducted our audits in accordance with the standards of the PCAOB. Those standards require that we plan and perform the audit to obtain reasonable assurance about whether the consolidated financial statements are free of material misstatement, whether due to error or fraud. Our audits included performing procedures to assess the risks of material misstatement of the consolidated financial statements, whether due to error or fraud, and performing procedures that respond to those risks. Such procedures included examining, on a test basis, evidence regarding the amounts and disclosures in the consolidated financial statements. Our audits also included evaluating the accounting principles used and significant estimates made by management, as well as evaluating the overall presentation of the consolidated financial statements. We believe that our audits provide a reasonable basis for our opinion.
Critical Audit Matter
The critical audit matter communicated below is a matter arising from the current period audit of the consolidated financial statements that was communicated or required to be communicated to the audit committee and that: (1) relates to accounts or disclosures that are material to the consolidated financial statements and (2) involved our especially challenging, subjective, or complex judgments. The communication of a critical audit matter does not alter in any way our opinion on the consolidated financial statements, taken as a whole, and we are not, by communicating the critical audit matter below, providing a separate opinion on the critical audit matter or on the accounts or disclosures to which it relates.
Allowance for Credit Losses – Loans evaluated on a collective basis
As discussed in Notes 2 and 5 to the consolidated financial statements, the Company’s allowance for credit losses totaled $30 million as of December 31, 2022. The collective ACL on loans includes the measure of expected credit losses on a collective (pooled) basis for loan portfolio segments that share similar risk characteristics. The Company estimates the collective ACL on loans using relevant available information, from internal and external sources, related to past events, current conditions, and a single reasonable and supportable forecast. For all loan portfolio segments other than consumer, the Company uses a discounted cash flow methodology where the respective quantitative allowance for each segment is measured by comparing the net present value of expected cash flows projected using a probability of default (PD) and loss given default (LGD) modeling methodology to the amortized cost. The Company uses regression models to develop the PD and LGD, which are derived from historical credit loss experience for both the Company and segment-specific selected peers, that incorporate external economic forecasts for the economic factors over the reasonable and supportable forecast period. After the reasonable and supportable forecast period, the Company reverts to long-term mean economic factors over a reversion period on a straight-line basis. Cash flows over the contractual term of the loans are the basis for modeled cash flows, adjusted for modeled defaults and expected prepayments and discounted at the effective interest rate. For the consumer loan segment the Company uses a vintage analysis model where the quantitative allowance for the loan segment is measured by applying the loss rate to the loan outstanding balance based on the loan’s vintage year. The loss rate is calculated based on the quarterly net charge-offs to outstanding loan balance for each vintage year over the lookback period. If estimated losses computed by the vintage method need to be adjusted based on current conditions and the reasonable and supportable economic forecast, these adjustments would be incorporated over a six quarter reasonable and supportable forecast period, reverting to historical losses using a straight-line method over an eight quarter period. For all loan portfolio segments, the Company applies additional qualitative adjustments, including the effects of limitations inherent in the quantitative models, so that the collective ACL is reflective of the estimate of lifetime losses that exist in the loan portfolio at the balance sheet date.
We identified the assessment of the collective ACL on loans as a critical audit matter. A high degree of audit effort, including specialized skills and knowledge, and subjective and complex auditor judgment was involved in the assessment of the collective ACL on loans due to significant measurement uncertainty. Specifically, the assessment encompassed the evaluation of the collective ACL on loans methodology, including the methods and models used to estimate (1) the PD and LGD and their significant assumptions including portfolio segmentation, the reasonable and supportable forecast period, the composition of the peer group and the period from which historical Company and peer experience was used, (2) the vintage model and the significant assumptions including portfolio segmentation, the length of the lookback period, and the need to adjust the estimated losses based on current conditions, (3) the expected prepayments assumption, and (4) the qualitative adjustments and their significant assumptions, including the effects of limitations inherent in the quantitative models. The assessment also included an evaluation of the conceptual soundness and performance of the PD and LGD and Vintage models. In addition, auditor judgment was required to evaluate the sufficiency of audit evidence obtained.
The following are the primary procedures we performed to address this critical audit matter. We evaluated the design and tested the operating effectiveness of certain internal controls related to the Company’s measurement of the collective ACL on loans estimate, including controls over the:
•development of the collective ACL on loans methodology
•development of the PD and LGD and Vintage models
•performance monitoring of the PD and LGD and Vintage models
•identification and determination of the expected prepayments assumption and the significant assumptions used in the PD and LGD and Vintage models
•development of the qualitative adjustments, including the significant assumptions used in the measurement of the qualitative adjustments
•analysis of the collective ACL on loans results, trends, and ratios.
We evaluated the Company’s process to develop the collective ACL on loans estimate by testing certain sources of data, factors, and assumptions that the Company used, and considered the relevance and reliability of such data, factors, and assumptions. In addition, we involved credit risk professionals with specialized skills and knowledge, who assisted in:
•evaluating the Company’s collective ACL on loans methodology for compliance with U.S. generally accepted accounting principles
•evaluating judgments made by the Company relative to the development and performance monitoring of the PD and LGD and Vintage models, by comparing them to relevant Company-specific metrics and trends, including macroeconomic trends, and the applicable industry and regulatory practices
•assessing the conceptual soundness and performance testing of the PD and LGD and Vintage models, by inspecting the model documentation to determine whether the models are suitable for their intended use
•evaluating the expected prepayments assumption by comparing to relevant Company-specific metrics and trends and the applicable industry and regulatory practices
•evaluating for all loan portfolio segments other than consumer, the length of the period from which historical Company and peer experience was used and the reasonable and supportable forecast period by comparing them to specific portfolio risk characteristics and trends
•evaluating for the consumer segment the length of the lookback period, and the need to adjust the estimated losses based on current conditions by comparing to the Company’s business environment and relevant industry practices
•assessing the composition of the peer group by comparing to Company and specific portfolio risk characteristics
•determining whether the loan portfolio is segmented by similar risk characteristics by comparing to the Company’s business environment and relevant industry practices
•evaluating the methodology used to develop the qualitative adjustments and the effect of those adjustments on the collective ACL on loans compared with relevant credit risk factors and consistency with credit trends and identified limitations of the underlying quantitative models.
We also assessed the sufficiency of the audit evidence obtained related to the collective ACL on loans by evaluating the:
•cumulative results of the audit procedures
•qualitative aspects of the Company’s accounting practices
•potential bias in the accounting estimate.
/s/ KPMG LLP
We have served as the Company’s auditor since 1990.
Albany, New York
July 17, 2023
Report of Independent Registered Public Accounting Firm
To the Stockholders and Board of Directors
Arrow Financial Corporation:
Opinion on Internal Control Over Financial Reporting
We have audited Arrow Financial Corporation and subsidiaries' (the Company) internal control over financial reporting as of December 31, 2022, based on criteria established in Internal Control – Integrated Framework (2013) issued by the Committee of Sponsoring Organizations of the Treadway Commission. In our opinion, because of the effect of the material weaknesses described below on the achievement of the objectives of the control criteria, the Company has not maintained effective internal control over financial reporting as of December 31, 2022, based on criteria established in Internal Control – Integrated Framework (2013) issued by the Committee of Sponsoring Organizations of the Treadway Commission.
We also have audited, in accordance with the standards of the Public Company Accounting Oversight Board (United States) (PCAOB), the consolidated balance sheets of the Company as of December 31, 2022 and 2021, the related consolidated statements of income, comprehensive income, stockholders’ equity, and cash flows for each of the years in the three-year period ended December 31, 2022, and the related notes (collectively, the consolidated financial statements), and our report dated July 17, 2023 expressed an unqualified opinion on those consolidated financial statements.
A material weakness is a deficiency, or a combination of deficiencies, in internal control over financial reporting, such that there is a reasonable possibility that a material misstatement of the Company’s annual or interim financial statements will not be prevented or detected on a timely basis. Material weaknesses related to the following have been identified and included in management’s assessment: The Company did not maintain effective monitoring controls related to 1) Internal Audit’s testing of management’s internal control over financial reporting, 2) the completeness and accuracy of information presented to the Audit Committee by Internal Audit, and 3) the related Audit Committee oversight over Internal Audit’s testing of management’s internal control over financial reporting. Additionally, with regard to the Company’s conversion of its core banking information technology system, the Company did not effectively perform risk assessment procedures to identify the impact of the conversion on their internal control over financial reporting. These material weaknesses were considered in determining the nature, timing, and extent of audit tests in our audit of the 2022 consolidated financial statements, and this report does not affect our report on those consolidated statements.
Basis for Opinion
The Company’s management is responsible for maintaining effective internal control over financial reporting and for its assessment of the effectiveness of internal control over financial reporting, included in the accompanying Report of Independent Registered Public Accounting Firm. Our responsibility is to express an opinion on the Company’s internal control over financial reporting based on our audit. We are a public accounting firm registered with the PCAOB and are required to be independent with respect to the Company in accordance with the U.S. federal securities laws and the applicable rules and regulations of the Securities and Exchange Commission and the PCAOB.
We conducted our audit in accordance with the standards of the PCAOB. Those standards require that we plan and perform the audit to obtain reasonable assurance about whether effective internal control over financial reporting was maintained in all material respects. Our audit of internal control over financial reporting included obtaining an understanding of internal control over financial reporting, assessing the risk that a material weakness exists, and testing and evaluating the design and operating effectiveness of internal control based on the assessed risk. Our audit also included performing such other procedures as we considered necessary in the circumstances. We believe that our audit provides a reasonable basis for our opinion.
Definition and Limitations of Internal Control Over Financial Reporting
A company’s internal control over financial reporting is a process designed to provide reasonable assurance regarding the reliability of financial reporting and the preparation of financial statements for external purposes in accordance with generally accepted accounting principles. A company’s internal control over financial reporting includes those policies and procedures that (1) pertain to the maintenance of records that, in reasonable detail, accurately and fairly reflect the transactions and dispositions of the assets of the company; (2) provide reasonable assurance that transactions are recorded as necessary to permit preparation of financial statements in accordance with generally accepted accounting principles, and that receipts and expenditures of the company are being made only in accordance with authorizations of management and directors of the company; and (3) provide reasonable assurance regarding prevention or timely detection of unauthorized acquisition, use, or disposition of the company’s assets that could have a material effect on the financial statements.
Because of its inherent limitations, internal control over financial reporting may not prevent or detect misstatements. Also, projections of any evaluation of effectiveness to future periods are subject to the risk that controls may become inadequate because of changes in conditions, or that the degree of compliance with the policies or procedures may deteriorate.
/s/ KPMG LLP
Albany, New York
July 17, 2023
ARROW FINANCIAL CORPORATION AND SUBSIDIARIES
CONSOLIDATED BALANCE SHEETS
(Dollars In Thousands, Except Share and Per Share Amounts)
|
|
|
|
|
|
|
|
|
|
|
|
| |
December 31, 2022 |
|
December 31, 2021 |
| ASSETS |
|
|
|
| Cash and Due From Banks |
$ |
31,886 |
|
|
$ |
26,978 |
|
| Interest-Bearing Deposits at Banks |
32,774 |
|
|
430,718 |
|
| Investment Securities: |
|
|
|
| Available-for-Sale |
573,495 |
|
|
559,316 |
|
|
Held-to-Maturity (Approximate Fair Value of $171,623 at
December 31, 2022, and $201,292 at December 31, 2021)
|
175,364 |
|
|
196,566 |
|
| Equity Securities |
2,174 |
|
|
1,747 |
|
| Other Investments |
6,064 |
|
|
5,380 |
|
| Loans |
2,983,207 |
|
|
2,667,941 |
|
| Allowance for Credit Losses |
(29,952) |
|
|
(27,281) |
|
| Net Loans |
2,953,255 |
|
|
2,640,660 |
|
| Premises and Equipment, Net |
56,491 |
|
|
46,217 |
|
| Goodwill |
21,873 |
|
|
21,873 |
|
| Other Intangible Assets, Net |
1,500 |
|
|
1,918 |
|
| Other Assets |
114,633 |
|
|
96,579 |
|
| Total Assets |
$ |
3,969,509 |
|
|
$ |
4,027,952 |
|
| LIABILITIES |
|
|
|
| Noninterest-Bearing Deposits |
$ |
836,871 |
|
|
$ |
810,274 |
|
| Interest-Bearing Checking Accounts |
997,694 |
|
|
994,391 |
|
| Savings Deposits |
1,454,364 |
|
|
1,531,287 |
|
| Time Deposits over $250,000 |
76,224 |
|
|
82,811 |
|
| Other Time Deposits |
133,211 |
|
|
131,734 |
|
| Total Deposits |
3,498,364 |
|
|
3,550,497 |
|
|
|
|
|
| Federal Home Loan Bank Overnight Advances |
27,000 |
|
|
— |
|
| Federal Home Loan Bank Term Advances |
27,800 |
|
|
45,000 |
|
| Junior Subordinated Obligations Issued to Unconsolidated Subsidiary Trusts |
20,000 |
|
|
20,000 |
|
| Finance Leases |
5,119 |
|
|
5,169 |
|
| Other Liabilities |
37,688 |
|
|
36,100 |
|
| Total Liabilities |
3,615,971 |
|
|
3,656,766 |
|
| STOCKHOLDERS’ EQUITY |
|
|
|
Preferred Stock, $1 Par Value, 1,000,000 Shares Authorized |
— |
|
|
— |
|
Common Stock, $1 Par Value; 30,000,000 Shares Authorized (21,423,992 Shares Issued at December 31, 2022, and 20,800,144 Shares Issued at December 31, 2021) |
21,424 |
|
|
20,800 |
|
| Additional Paid-in Capital |
400,270 |
|
|
377,996 |
|
| Retained Earnings |
65,401 |
|
|
54,078 |
|
|
|
|
|
| Accumulated Other Comprehensive (Loss) Income |
(49,655) |
|
|
347 |
|
Treasury Stock, at Cost (4,872,355 Shares at December 31, 2022, and 4,759,414 Shares at December 31, 2021) |
(83,902) |
|
|
(82,035) |
|
| Total Stockholders’ Equity |
353,538 |
|
|
371,186 |
|
| Total Liabilities and Stockholders’ Equity |
$ |
3,969,509 |
|
|
$ |
4,027,952 |
|
See Notes to Consolidated Financial Statements.
ARROW FINANCIAL CORPORATION AND SUBSIDIARIES
CONSOLIDATED STATEMENTS OF INCOME
(Dollars In Thousands, Except Per Share Amounts)
|
|
|
|
|
|
|
|
|
|
|
|
|
|
|
|
|
|
|
|
|
| |
|
Years Ended December 31, |
| |
|
2022 |
|
2021 |
|
2020 |
| INTEREST AND DIVIDEND INCOME |
|
|
|
|
|
|
| Interest and Fees on Loans |
|
$ |
112,982 |
|
|
$ |
104,985 |
|
|
$ |
100,492 |
|
| Interest on Deposits at Banks |
|
3,100 |
|
|
565 |
|
|
321 |
|
| Interest and Dividends on Investment Securities: |
|
|
|
|
|
|
| Fully Taxable |
|
10,357 |
|
|
6,487 |
|
|
7,131 |
|
| Exempt from Federal Taxes |
|
3,212 |
|
|
3,513 |
|
|
3,952 |
|
| Total Interest and Dividend Income |
|
129,651 |
|
|
115,550 |
|
|
111,896 |
|
| INTEREST EXPENSE |
|
|
|
|
|
|
| Interest-Bearing Checking Accounts |
|
973 |
|
|
731 |
|
|
1,292 |
|
| Savings Deposits |
|
7,879 |
|
|
1,904 |
|
|
5,090 |
|
| Time Deposits over $250,000 |
|
369 |
|
|
261 |
|
|
1,465 |
|
| Other Time Deposits |
|
604 |
|
|
632 |
|
|
2,782 |
|
Federal Funds Purchased and
Securities Sold Under Agreements to Repurchase |
|
— |
|
|
3 |
|
|
60 |
|
| Federal Home Loan Bank Advances |
|
605 |
|
|
783 |
|
|
1,063 |
|
Junior Subordinated Obligations Issued to
Unconsolidated Subsidiary Trusts |
|
685 |
|
|
686 |
|
|
746 |
|
| Interest on Financing Leases |
|
193 |
|
|
195 |
|
|
196 |
|
| Total Interest Expense |
|
11,308 |
|
|
5,195 |
|
|
12,694 |
|
| NET INTEREST INCOME |
|
118,343 |
|
|
110,355 |
|
|
99,202 |
|
| Provision for Credit Losses |
|
4,798 |
|
|
272 |
|
|
9,319 |
|
NET INTEREST INCOME AFTER PROVISION FOR
CREDIT LOSSES |
|
113,545 |
|
|
110,083 |
|
|
89,883 |
|
| NONINTEREST INCOME |
|
|
|
|
|
|
| Income From Fiduciary Activities |
|
9,711 |
|
|
10,142 |
|
|
8,890 |
|
| Fees for Other Services to Customers |
|
11,626 |
|
|
11,462 |
|
|
10,003 |
|
| Insurance Commissions |
|
6,463 |
|
|
6,487 |
|
|
6,876 |
|
| Net Gain (Loss) on Securities |
|
427 |
|
|
111 |
|
|
(464) |
|
| Net Gain on Sales of Loans |
|
83 |
|
|
2,393 |
|
|
3,889 |
|
| Other Operating Income |
|
2,588 |
|
|
1,774 |
|
|
3,464 |
|
| Total Noninterest Income |
|
30,898 |
|
|
32,369 |
|
|
32,658 |
|
| NONINTEREST EXPENSE |
|
|
|
|
|
|
| Salaries and Employee Benefits |
|
47,003 |
|
|
44,798 |
|
|
42,061 |
|
| Occupancy Expenses, Net |
|
6,202 |
|
|
5,814 |
|
|
5,614 |
|
| Technology and Equipment Expense |
|
16,118 |
|
|
14,870 |
|
|
12,976 |
|
| FDIC Assessments |
|
1,176 |
|
|
1,042 |
|
|
1,063 |
|
| Other Operating Expense |
|
11,031 |
|
|
11,524 |
|
|
8,964 |
|
| Total Noninterest Expense |
|
81,530 |
|
|
78,048 |
|
|
70,678 |
|
| INCOME BEFORE PROVISION FOR INCOME TAXES |
|
62,913 |
|
|
64,404 |
|
|
51,863 |
|
| Provision for Income Taxes |
|
14,114 |
|
|
14,547 |
|
|
11,036 |
|
| NET INCOME |
|
$ |
48,799 |
|
|
$ |
49,857 |
|
|
$ |
40,827 |
|
| Average Shares Outstanding: |
|
|
|
|
|
|
| Basic |
|
16,513 |
|
|
16,499 |
|
|
16,406 |
|
| Diluted |
|
16,562 |
|
|
16,555 |
|
|
16,422 |
|
| Per Common Share: |
|
|
|
|
|
|
| Basic Earnings |
|
$ |
2.95 |
|
|
$ |
3.02 |
|
|
$ |
2.49 |
|
| Diluted Earnings |
|
2.95 |
|
|
3.01 |
|
|
2.49 |
|
Share and Per Share Amounts have been restated for the September 23, 2022 3% stock dividend.
See Notes to Consolidated Financial Statements.
ARROW FINANCIAL CORPORATION AND SUBSIDIARIES
CONSOLIDATED STATEMENTS OF COMPREHENSIVE (LOSS) INCOME
(Dollars In Thousands)
|
|
|
|
|
|
|
|
|
|
|
|
|
|
|
|
|
|
|
Years Ended December 31, |
|
2022 |
|
2021 |
|
2020 |
| Net Income |
$ |
48,799 |
|
|
$ |
49,857 |
|
|
$ |
40,827 |
|
| Other Comprehensive (Loss) Income, Net of Tax: |
|
|
|
|
|
| Unrealized Net Securities Holding (Losses) Gains Arising During the Year |
(48,227) |
|
|
(6,413) |
|
|
5,306 |
|
| Reclassification Adjustment for Net Securities Losses Arising During the Year |
— |
|
|
— |
|
|
28 |
|
| Net Unrealized Gains on Cash Flow Hedge Agreements |
2,582 |
|
|
929 |
|
|
485 |
|
|
|
|
|
|
|
Reclassification of Net Unrealized Loss (Gain) on Cash Flow Hedge Agreements to
Interest Expense |
152 |
|
|
(94) |
|
|
— |
|
| Net Retirement Plan (Loss) Gain |
(5,147) |
|
|
6,500 |
|
|
(251) |
|
| Net Retirement Plan Prior Service Cost |
— |
|
|
— |
|
|
(353) |
|
| Settlement Cost |
428 |
|
|
— |
|
|
— |
|
| Amortization of Net Retirement Plan Actuarial Loss |
41 |
|
|
68 |
|
|
169 |
|
| Amortization of Net Retirement Plan Prior Service Cost |
169 |
|
|
173 |
|
|
157 |
|
| Other Comprehensive (Loss) Income |
(50,002) |
|
|
1,163 |
|
|
5,541 |
|
| Comprehensive (Loss) Income |
$ |
(1,203) |
|
|
$ |
51,020 |
|
|
$ |
46,368 |
|
See Notes to Consolidated Financial Statements.
|
|
|
|
|
|
|
|
|
|
|
|
|
|
|
|
|
|
|
|
|
|
|
|
|
|
|
|
|
|
|
|
|
|
|
|
|
|
| ARROW FINANCIAL CORPORATION AND SUBSIDIARIES |
| CONSOLIDATED STATEMENTS OF CHANGES IN STOCKHOLDERS’ EQUITY |
| (Dollars In Thousands, Except Share and Per Share Amounts) |
|
|
|
|
|
|
|
|
|
|
|
|
|
|
|
Common
Stock |
|
Additional
Paid-In
Capital |
|
Retained
Earnings |
|
|
|
Accumu-
lated
Other Compre-
hensive
(Loss) Income |
|
Treasury
Stock |
|
Total |
| Balance at December 31, 2019 |
$ |
19,606 |
|
|
$ |
335,355 |
|
|
$ |
33,218 |
|
|
|
|
$ |
(6,357) |
|
|
$ |
(80,094) |
|
|
301,728 |
|
| Net Income |
— |
|
|
— |
|
|
40,827 |
|
|
|
|
— |
|
|
— |
|
|
40,827 |
|
| Other Comprehensive Income |
— |
|
|
— |
|
|
— |
|
|
|
|
5,541 |
|
|
— |
|
|
5,541 |
|
|
|
|
|
|
|
|
|
|
|
|
|
|
|
3% Stock Dividend (588,025 Shares) |
588 |
|
|
15,818 |
|
|
(16,406) |
|
|
|
|
— |
|
|
— |
|
|
— |
|
Cash Dividends Paid, $0.96 per Share1 |
— |
|
|
— |
|
|
(15,740) |
|
|
|
|
— |
|
|
— |
|
|
(15,740) |
|
Shares Issued for Stock Option Exercises, net (33,112 Shares) |
— |
|
|
433 |
|
|
— |
|
|
|
|
— |
|
|
315 |
|
|
748 |
|
Shares Issued Under the Directors' Stock Plan (4,245 Shares) |
— |
|
|
83 |
|
|
— |
|
|
|
|
— |
|
|
42 |
|
|
125 |
|
Shares Issued Under the Employee Stock Purchase Plan (18,286 Shares) |
— |
|
|
339 |
|
|
— |
|
|
|
|
— |
|
|
174 |
|
|
513 |
|
Shares Issued for Dividend Reinvestment Plans (63,425 Shares) |
— |
|
|
1,214 |
|
|
— |
|
|
|
|
— |
|
|
594 |
|
|
1,808 |
|
| Stock-Based Compensation Expense |
— |
|
|
420 |
|
|
— |
|
|
|
|
— |
|
|
— |
|
|
420 |
|
Purchase of Treasury Stock (52,505 Shares) |
— |
|
|
— |
|
|
— |
|
|
|
|
— |
|
|
(1,578) |
|
|
(1,578) |
|
|
|
|
|
|
|
|
|
|
|
|
|
|
|
| Balance at December 31, 2020 |
20,194 |
|
|
353,662 |
|
|
41,899 |
|
|
|
|
(816) |
|
|
(80,547) |
|
|
334,392 |
|
|
|
|
|
|
|
|
|
|
|
|
|
|
|
| Balance at December 31, 2020 |
$ |
20,194 |
|
|
$ |
353,662 |
|
|
$ |
41,899 |
|
|
|
|
$ |
(816) |
|
|
$ |
(80,547) |
|
|
$ |
334,392 |
|
| Cumulative impact of adoption of ASU 2016-13 |
— |
|
|
— |
|
|
120 |
|
|
|
|
— |
|
|
— |
|
|
120 |
|
| Balance at January 1, 2021 as adjusted for impact of adoption of ASU 2016-13 |
20,194 |
|
|
353,662 |
|
|
42,019 |
|
|
|
|
(816) |
|
|
(80,547) |
|
|
334,512 |
|
| Net Income |
— |
|
|
— |
|
|
49,857 |
|
|
|
|
— |
|
|
— |
|
|
49,857 |
|
| Other Comprehensive Income |
— |
|
|
— |
|
|
— |
|
|
|
|
1,163 |
|
|
— |
|
|
1,163 |
|
|
|
|
|
|
|
|
|
|
|
|
|
|
|
|
|
|
|
|
|
|
|
|
|
|
|
|
|
3% Stock Dividend (605,670 Shares) |
606 |
|
|
20,896 |
|
|
(21,502) |
|
|
|
|
— |
|
|
— |
|
|
— |
|
Cash Dividends Paid, $0.99 per Share1 |
— |
|
|
— |
|
|
(16,296) |
|
|
|
|
— |
|
|
— |
|
|
(16,296) |
|
Shares Issued for Stock Option Exercises, net (54,757 Shares) |
— |
|
|
1,016 |
|
|
— |
|
|
|
|
— |
|
|
489 |
|
|
1,505 |
|
Shares Issued Under the Directors' Stock Plan (11,051 Shares) |
— |
|
|
278 |
|
|
— |
|
|
|
|
— |
|
|
98 |
|
|
376 |
|
Shares Issued Under the Employee Stock Purchase Plan (14,903 Shares) |
— |
|
|
350 |
|
|
— |
|
|
|
|
— |
|
|
131 |
|
|
481 |
|
Shares Issued for Dividend Reinvestment Plans (51,403 Shares) |
— |
|
|
1,380 |
|
|
— |
|
|
|
|
— |
|
|
456 |
|
|
1,836 |
|
| Stock-Based Compensation Expense |
— |
|
|
414 |
|
|
— |
|
|
|
|
— |
|
|
— |
|
|
414 |
|
Purchase of Treasury Stock (73,555 Shares) |
— |
|
|
— |
|
|
— |
|
|
|
|
— |
|
|
(2,662) |
|
|
(2,662) |
|
| Balance at December 31, 2021 |
$ |
20,800 |
|
|
$ |
377,996 |
|
|
$ |
54,078 |
|
|
|
|
$ |
347 |
|
|
$ |
(82,035) |
|
|
$ |
371,186 |
|
|
|
|
|
|
|
|
|
|
|
|
|
|
|
|
|
|
|
|
|
|
|
|
|
|
|
|
|
|
|
|
|
|
|
|
|
|
|
|
|
|
|
|
|
|
|
|
|
|
|
|
|
| ARROW FINANCIAL CORPORATION AND SUBSIDIARIES |
| CONSOLIDATED STATEMENTS OF CHANGES IN STOCKHOLDERS’ EQUITY |
| (Dollars In Thousands, Except Share and Per Share Amounts) |
|
|
|
|
|
|
|
|
|
|
|
|
|
|
|
Common
Stock |
|
Additional
Paid-In
Capital |
|
Retained
Earnings |
|
|
|
Accumu-
lated
Other Compre-
hensive
(Loss) Income |
|
Treasury
Stock |
|
Total |
| Balance at December 31, 2021 |
$ |
20,800 |
|
|
$ |
377,996 |
|
|
$ |
54,078 |
|
|
|
|
$ |
347 |
|
|
$ |
(82,035) |
|
|
$ |
371,186 |
|
|
|
|
|
|
|
|
|
|
|
|
|
|
|
|
|
|
|
|
|
|
|
|
|
|
|
|
|
| Net Income |
— |
|
|
— |
|
|
48,799 |
|
|
|
|
— |
|
|
— |
|
|
48,799 |
|
| Other Comprehensive Loss |
— |
|
|
— |
|
|
— |
|
|
|
|
(50,002) |
|
|
— |
|
|
(50,002) |
|
|
|
|
|
|
|
|
|
|
|
|
|
|
|
|
|
|
|
|
|
|
|
|
|
|
|
|
|
3% Stock Dividend (623,848 Shares)2 |
624 |
|
|
19,408 |
|
|
(20,032) |
|
|
|
|
— |
|
|
— |
|
|
— |
|
Cash Dividends Paid, $1.06 per Share1 |
— |
|
|
— |
|
|
(17,444) |
|
|
|
|
— |
|
|
— |
|
|
(17,444) |
|
Shares Issued for Stock Option Exercises, net (28,052 Shares) |
— |
|
|
384 |
|
|
— |
|
|
|
|
— |
|
|
247 |
|
|
631 |
|
Shares Issued Under the Directors' Stock Plan (12,933 Shares) |
— |
|
|
295 |
|
|
— |
|
|
|
|
— |
|
|
113 |
|
|
408 |
|
Shares Issued Under the Employee Stock Purchase Plan (15,207 Shares) |
— |
|
|
344 |
|
|
— |
|
|
|
|
— |
|
|
133 |
|
|
477 |
|
Shares Issued for Dividend Reinvestment Plans (57,745 Shares) |
— |
|
|
1,392 |
|
|
— |
|
|
|
|
— |
|
|
512 |
|
|
1,904 |
|
| Stock-Based Compensation Expense |
— |
|
|
451 |
|
|
— |
|
|
|
|
— |
|
|
— |
|
|
451 |
|
Purchase of Treasury Stock (84,132 Shares) |
— |
|
|
— |
|
|
— |
|
|
|
|
— |
|
|
(2,872) |
|
|
(2,872) |
|
|
|
|
|
|
|
|
|
|
|
|
|
|
|
| Balance at December 31, 2022 |
$ |
21,424 |
|
|
$ |
400,270 |
|
|
$ |
65,401 |
|
|
|
|
$ |
(49,655) |
|
|
$ |
(83,902) |
|
|
$ |
353,538 |
|
1 Cash dividends paid per share have been adjusted for the September 23, 2022 3% stock dividend.
2 Included in the shares issued for the 3% stock dividend in 2022 were treasury shares of 142,746
See Notes to Consolidated Financial Statements.
ARROW FINANCIAL CORPORATION AND SUBSIDIARIES
CONSOLIDATED STATEMENTS OF CASH FLOWS
(Dollars in Thousands)
|
|
|
|
|
|
|
|
|
|
|
|
|
|
|
|
|
|
|
December 31, |
| Cash Flows from Operating Activities: |
2022 |
|
2021 |
|
2020 |
| Net Income |
$ |
48,799 |
|
|
$ |
49,857 |
|
|
$ |
40,827 |
|
| Adjustments to Reconcile Net Income to Net Cash Provided by Operating Activities: |
|
|
|
|
|
| Provision for Credit Losses |
4,798 |
|
|
272 |
|
|
9,319 |
|
| Depreciation and Amortization |
7,548 |
|
|
7,826 |
|
|
6,867 |
|
|
|
|
|
|
|
|
|
|
|
|
|
|
|
|
|
|
|
| Loss on the Sale of Securities Available-for-Sale |
— |
|
|
— |
|
|
37 |
|
|
|
|
|
|
|
| Net (Gain) Loss on Equity Securities |
(427) |
|
|
(111) |
|
|
427 |
|
|
|
|
|
|
|
| Loans Originated and Held-for-Sale |
(799) |
|
|
(48,720) |
|
|
(94,773) |
|
| Proceeds from the Sale of Loans Held-for-Sale |
1,380 |
|
|
61,044 |
|
|
87,729 |
|
| Net Gains on the Sale of Loans |
(83) |
|
|
(2,393) |
|
|
(3,889) |
|
Net Gains (Losses) on the Sale or Write-down of Premises and Equipment,
Other Real Estate Owned and Repossessed Assets |
167 |
|
|
277 |
|
|
(161) |
|
|
|
|
|
|
|
| Contributions to Pension & Postretirement Plans |
(741) |
|
|
(622) |
|
|
(673) |
|
| Deferred Income Tax (Benefit) Expense |
(1,252) |
|
|
945 |
|
|
(2,240) |
|
| Shares Issued Under the Directors’ Stock Plan |
408 |
|
|
376 |
|
|
125 |
|
| Stock-Based Compensation Expense |
451 |
|
|
414 |
|
|
420 |
|
| Tax Benefit from Exercise of Stock Options |
34 |
|
|
69 |
|
|
52 |
|
| Net Increase in Other Assets |
(1,427) |
|
|
(5,065) |
|
|
(2,339) |
|
| Net Increase in Other Liabilities |
857 |
|
|
4,037 |
|
|
586 |
|
| Net Cash Provided By Operating Activities |
59,713 |
|
|
68,206 |
|
|
42,314 |
|
| Cash Flows from Investing Activities: |
|
|
|
|
|
| Proceeds from the Sale of Securities Available-for-Sale |
— |
|
|
— |
|
|
65,273 |
|
| Proceeds from the Maturities and Calls of Securities Available-for-Sale |
104,120 |
|
|
118,330 |
|
|
104,941 |
|
| Purchases of Securities Available-for-Sale |
(184,785) |
|
|
(323,372) |
|
|
(173,234) |
|
|
|
|
|
|
|
| Proceeds from the Maturities and Calls of Securities Held-to-Maturity |
32,068 |
|
|
30,561 |
|
|
33,896 |
|
| Purchases of Securities Held-to-Maturity |
(11,459) |
|
|
(9,377) |
|
|
(7,953) |
|
| Net Increase in Loans |
(319,547) |
|
|
(85,123) |
|
|
(200,554) |
|
|
|
|
|
|
|
Proceeds from the Sales of Premises and Equipment, Other
Real Estate Owned and Repossessed Assets |
1,475 |
|
|
1,547 |
|
|
2,478 |
|
| Purchase of Premises and Equipment |
(14,250) |
|
|
(7,137) |
|
|
(5,132) |
|
|
|
|
|
|
|
|
|
|
|
|
|
| Net (Increase) Decrease in Federal Home Loan Bank Stock |
(684) |
|
|
(31) |
|
|
4,968 |
|
| Purchase of Bank Owned Life Insurance |
— |
|
|
— |
|
|
(12,000) |
|
| Net Cash Used In Investing Activities |
(393,062) |
|
|
(274,602) |
|
|
(187,317) |
|
| Cash Flows from Financing Activities: |
|
|
|
|
|
| Net (Decrease) Increase in Deposits |
(52,133) |
|
|
315,771 |
|
|
618,672 |
|
| Net Increase (Decrease) in Short-Term Federal Home Loan Bank Borrowings |
27,000 |
|
|
— |
|
|
(130,000) |
|
| Net Decrease in Short-Term Borrowings |
— |
|
|
(17,486) |
|
|
(33,613) |
|
| Federal Home Loan Bank Advances |
— |
|
|
— |
|
|
45,000 |
|
| Finance Lease Payments |
(50) |
|
|
(48) |
|
|
(37) |
|
| Repayments of Federal Home Loan Bank Advances |
(17,200) |
|
|
— |
|
|
(30,000) |
|
| Purchase of Treasury Stock |
(2,872) |
|
|
(2,662) |
|
|
(1,578) |
|
| Shares Issued for Stock Option Exercises, net |
631 |
|
|
1,505 |
|
|
748 |
|
| Shares Issued Under the Employee Stock Purchase Plan |
477 |
|
|
481 |
|
|
513 |
|
|
|
|
|
|
|
| Shares Issued for Dividend Reinvestment Plans |
1,904 |
|
|
1,836 |
|
|
1,808 |
|
|
|
|
|
|
|
| Cash Dividends Paid |
(17,444) |
|
|
(16,296) |
|
|
(15,740) |
|
| Net Cash (Used) Provided By Financing Activities |
(59,687) |
|
|
283,101 |
|
|
455,773 |
|
| Net (Decrease) Increase in Cash and Cash Equivalents |
(393,036) |
|
|
76,705 |
|
|
310,770 |
|
| Cash and Cash Equivalents at Beginning of Year |
457,696 |
|
|
380,991 |
|
|
70,221 |
|
| Cash and Cash Equivalents at End of Year |
$ |
64,660 |
|
|
$ |
457,696 |
|
|
$ |
380,991 |
|
|
|
|
|
|
|
| Supplemental Disclosures to Statements of Cash Flow Information: |
|
|
|
|
|
| Interest on Deposits and Borrowings |
$ |
5,752 |
|
|
$ |
5,373 |
|
|
$ |
13,799 |
|
| Income Taxes |
13,018 |
|
|
14,760 |
|
|
10,969 |
|
| Non-cash Investing and Financing Activity: |
|
|
|
|
|
| Transfer of Loans to Other Real Estate Owned and Repossessed Assets |
1,656 |
|
|
1,358 |
|
|
1,000 |
|
|
|
|
|
|
|
|
|
|
|
|
|
|
|
|
|
|
|
See Notes to Consolidated Financial Statements.
NOTES TO CONSOLIDATED FINANCIAL STATEMENTS
Note 1:RISKS AND UNCERTAINTIES
Nature of Operations - Arrow Financial Corporation, a New York corporation, was incorporated on March 21, 1983 and is registered as a bank holding company within the meaning of the Bank Holding Company Act of 1956. The banking subsidiaries are Glens Falls National Bank and Trust Company (Glens Falls National or GFNB) whose main office is located in Glens Falls, New York, and Saratoga National Bank and Trust Company (Saratoga National or SNB) whose main office is located in Saratoga Springs, New York. The two banks provide a full range of services to individuals and small to mid-size businesses in northeastern New York State from Albany, the State's capitol, to the Canadian border. Both banks have wealth management departments which provide investment management and administrative services. An active subsidiary of Glens Falls National is Upstate Agency LLC, offering insurance services including property, and casualty insurance, group health insurance and individual life insurance products. North Country Investment Advisers, Inc., a registered investment adviser that provides investment advice to our proprietary mutual fund, and Arrow Properties, Inc., a real estate investment trust, or REIT, are subsidiaries of Glens Falls National. Arrow also owns directly two subsidiary business trusts, organized in 2003 and 2004 to issue trust preferred securities (TRUPs), which are still outstanding.
Concentrations of Credit - With the exception of some indirect auto lending, Arrow's loans are primarily with borrowers in upstate New York. Although the loan portfolios of the subsidiary banks are well diversified, tourism has a substantial impact on the northeastern New York economy. The commitments to extend credit are fairly consistent with the distribution of loans presented in Note 5, "Loans," generally have the same credit risk and are subject to normal credit policies. Generally, the loans are secured by assets and are expected to be repaid from cash flow or the sale of selected assets of the borrowers. Arrow evaluates each customer's creditworthiness on a case-by-case basis. The amount of collateral obtained, if deemed necessary by Arrow upon extension of credit, is based upon Management's credit evaluation of the counterparty. The nature of the collateral varies with the type of loan and may include: residential real estate, cash and securities, inventory, accounts receivable, property, plant and equipment, income producing commercial properties and automobiles.
Liquidity - The objective of effective liquidity management is to ensure that Arrow has the ability to raise cash when needed at a reasonable cost. This includes the capability of meeting expected and unexpected obligations to Arrow's customers at any time. Given the uncertain nature of customer demands and the need to maximize earnings, Arrow must have available reasonably priced sources of funds, both on- and off-balance sheet, that can be accessed quickly in times of need. Arrow’s liquidity position should provide the Company with the necessary flexibility to address any unexpected near-term disruptions such as reduced cash flows from the investment and loan portfolio, unexpected deposit runoff, or increased loan originations.
Arrow's primary sources of available liquidity are overnight investments in federal funds sold, interest bearing bank balances at the Federal Reserve Bank of New York, and cash flow from investment securities and loans.
Note 2:SUMMARY OF SIGNIFICANT ACCOUNTING POLICIES
Principles of Consolidation - The financial statements of Arrow and its wholly owned subsidiaries are consolidated and all material inter-company transactions have been eliminated. In the “Parent Company Only” financial statements in Note 21, the investment in wholly owned subsidiaries is carried under the equity method of accounting. When necessary, prior years’ Consolidated Financial Statements have been reclassified to conform to the current-year financial statement presentation.
Arrow determines whether it has a controlling financial interest in an entity by first evaluating whether the entity is a voting interest entity or a variable interest entity under GAAP. Voting interest entities are entities in which the total equity investment at risk is sufficient to enable the entity to finance itself independently and provides the equity holders with the obligation to absorb losses, the right to receive residual returns and the right to make decisions about the entity’s activities. Arrow consolidates voting interest entities in which it has all, or at least a majority of, the voting interest. As defined in applicable accounting standards, variable interest entities (VIE) are entities that lack one or more of the characteristics of a voting interest entity. A controlling financial interest in a VIE is present when Arrow has both the power and ability to direct the activities of the VIE that most significantly impact the VIE's economic performance and an obligation to absorb losses or the right to receive benefits that could potentially be significant to the VIE. Arrow's wholly owned subsidiaries Arrow Capital Statutory Trust II and Arrow Capital Statutory Trust III are VIEs for which Arrow is not the primary beneficiary. Accordingly, the accounts of these entities are not included in Arrow's Consolidated Financial Statements.
Segment Reporting - Arrow operations are primarily in the community banking industry, which constitutes Arrow’s only segment for financial reporting purposes. Arrow provides other services, such as trust administration, retirement plan administration, advice to the Company's proprietary mutual funds and insurance products, but these services do not rise to the quantitative thresholds for separate disclosure. Arrow operates primarily in the northeastern region of New York State in Warren, Washington, Saratoga, Essex, Clinton, Rensselaer, Albany, and Schenectady counties and surrounding areas.
Cash and Cash Equivalents - Cash and cash equivalents include the following items: cash at branches, due from bank balances, cash items in the process of collection, interest-bearing bank balances and federal funds sold.
Securities - Management determines the appropriate classification of securities at the time of purchase. Securities reported as held-to-maturity are those debt securities which Arrow has both the positive intent and ability to hold to maturity and are stated at amortized cost. Securities available-for-sale are reported at fair value, with unrealized gains and losses reported in accumulated other comprehensive income or loss, net of taxes. Equity securities with readily determinable fair values are stated at fair value with realized and unrealized gains and losses reported in income. Arrow performs a qualitative assessment to determine whether investments are impaired.
Premiums and discounts are amortized or accreted over the life of the related security as an adjustment to yield using the interest method. Dividend and interest income are recognized when earned. Realized gains and losses on securities sold are derived using the specific identification method for determining the cost of securities sold.
Allowance for Credit Losses – Held to Maturity (HTM) Debt Securities - Arrow's HTM debt securities are also required to utilize the CECL approach to estimate expected credit losses. Management measures expected credit losses on HTM debt securities on a collective basis by major security types that share similar risk characteristics, such as financial asset type and collateral type adjusted for current conditions and reasonable and supportable forecasts. Management classifies the HTM portfolio into the following major security types: U.S. government agency or U.S. government sponsored mortgage-backed and collateralized mortgage obligations securities, and state and municipal debt securities.
The mortgage-backed and collateralized mortgage obligations HTM securities are issued by U.S. government entities and agencies. These securities are either explicitly or implicitly guaranteed by the U.S. government as to timely repayment of principal and interest, are highly rated by major rating agencies, and have a long history of no credit losses. Therefore, Arrow did not record a credit loss for these securities.
State and municipal bonds carry an investment grade from an accredited ratings agency, primarily with an investment grade rating. In addition, Arrow has a limited amount of New York state local municipal bonds that are not rated. The estimate of expected credit losses on the HTM portfolio is based on the expected cash flows of each individual CUSIP over its contractual life and utilized a municipal loss forecast model for determining PD and LGD rates. Management may exercise discretion to make adjustments based on environmental factors. A calculated expected credit loss for individual securities was determined using the PD and LGD rates. Arrow determined that the expected credit loss on its municipal bond portfolio was de minimis, and therefore, an allowance for credit losses was not recorded.
Allowance for Credit Losses – Available for Sale (AFS) Debt Securities - The impairment model for AFS debt securities differs from the CECL approach utilized by HTM debt securities since AFS debt securities are measured at fair value rather than amortized cost. For AFS debt securities in an unrealized loss position, the Bank first assesses whether it intends to sell, or it is more likely than not that it will be required to sell the security before recovery of its amortized cost basis. If either of the criteria regarding intent or requirement to sell is met, the security’s amortized cost basis is written down to fair value through income. For AFS debt securities that do not meet the aforementioned criteria, in making this assessment, Management considers the extent to which fair value is less than amortized cost, any changes to the rating of the security by a rating agency, adverse conditions specifically related to the security, failure of the issuer of the debt security to make scheduled interest or principal payments, among other factors. If this assessment indicates that a credit loss exists, the present value of cash flows expected to be collected from the security are compared to the amortized cost basis of the security. The cash flows are estimated using information relevant to the collectability of the security, including information about past events, current conditions and reasonable and supportable forecasts. If the present value of cash flows expected to be collected is less than the amortized cost basis, a credit loss exists and an allowance for credit losses is recorded for the credit loss, limited by the amount that the fair value is less than the amortized cost basis. Any impairment that has not been recorded through an allowance for credit losses is recognized in other comprehensive income.
Investments in Federal Reserve Bank and Federal Home Loan Bank (“FHLB”) stock are required for membership in those organizations and are carried at cost since there is no market value available. The FHLB New York continues to pay dividends and repurchase stock. As such, the Company has not recognized any impairment on its holdings of Federal Reserve Bank and FHLB stock.
Loans - Loans are reported at their principal outstanding balance, net of deferred fees and costs, and unearned income. Arrow has the intent and ability to hold to maturity. Interest income on loans is accrued and credited to income based upon the principal amount outstanding. Loan fees and costs directly associated with loan originations are deferred and amortized/accreted as an adjustment to yield over the lives of the loans originated.
Arrow originated loans to commercial borrowers under the PPP during 2020 and 2021. PPP loans had an interest rate of 1% and included an origination and servicing fee as a result of originating these loans. The original term on the PPP loans was two years, however the borrower had the option to apply for forgiveness. Subsequent to the funding of the loans, additional guidance was provided permitting the term of a PPP loan to be extended to five years if both parties agree to the revised terms. As of December 31, 2022, there were no PPP loans outstanding.
From time-to-time, Arrow has sold (most with servicing retained) residential real estate loans at or shortly after origination. Any gain or loss on the sale of loans, along with the value of the servicing right, is recognized at the time of sale as the difference between the recorded basis in the loan and net proceeds from the sale. Loans held for sale are recorded at the lower of cost or fair value on an aggregate basis.
Loans are placed on nonaccrual status either due to the delinquency status of principal and/or interest or a judgment by management that the full repayment of principal and interest is unlikely. Unless already placed on nonaccrual status, loans secured by home equity lines of credit are put on nonaccrual status when 120 days past due; residential real estate loans when 150 days past due; commercial and commercial real estate loans are evaluated on a loan-by-loan basis and are placed on nonaccrual status when 90 days past due if the full collection of principal and interest is uncertain; all other loans are to be moved to nonaccrual status upon the earliest occurrence of repossession, bankruptcy, delinquency of 90 days or more unless the loan is secured and in the process of collection with no loss anticipated or when full collection of principal and interest is in doubt.
The balance of any accrued interest deemed uncollectible at the date the loan is placed on nonaccrual status is reversed, generally against interest income. A loan is returned to accrual status at the later of the date when the past due status of the loan falls below the threshold for nonaccrual status or Management deems that it is likely that the borrower will repay all interest and principal. For payments received while the loan is on nonaccrual status, Arrow may recognize interest income on a cash basis if the repayment of the remaining principal and accrued interest is deemed likely.
Allowance for Credit Losses – Loans - CECL - Accounting Standards Update (“ASU”) 2016-13, Financial Instruments - Credit Losses (Topic 326): Measurement of Credit Losses on Financial Instruments (CECL) approach requires an estimate of the credit losses expected over the life of a loan (or pool of loans). It replaces the incurred loss approach’s threshold that required the recognition of a credit loss when it was probable that a loss event was incurred. The allowance for credit losses is a valuation account that is deducted from, or added to, the loans’ amortized cost basis to present the net, lifetime amount expected to be collected on the loans. Credit losses are charged off against the allowance when Management believes a loan balance is confirmed to be uncollectible. Expected recoveries do not exceed the aggregate of amounts previously charged off and expected to be charged off.
Management estimates the allowance using relevant available information from internal and external sources related to past events, current conditions, and a reasonable and supportable single economic forecast. Historical credit loss experience provides the basis for the estimation of expected credit losses. Arrow's historical loss experience was supplemented with peer information when there was insufficient loss data for Arrow. Peer selection was based on a review of institutions with comparable loss experience as well as loan yield, bank size, portfolio concentration and geography. Adjustments to historical loss information are made for differences in current loan-specific risk characteristics such as differences in credit concentrations, delinquency level, collateral values and underwriting standards as well as changes in economic conditions or other relevant factors. Management judgment is required at each point in the measurement process.
Portfolio segment is defined as the level at which an entity develops and documents a systematic methodology to determine its allowance for credit losses. Upon adoption of CECL, Management revised the manner in which loans were pooled for similar risk characteristics. Management developed portfolio segments for estimating loss based on type of borrower and collateral as follows:
Commercial Loans
Commercial Real Estate Loans
Consumer Loans
Residential Loans
Further details related to loan portfolio segments is included in Note 5, Loans.
Historical credit loss experience for both Arrow and segment-specific peers provides the basis for the estimation of expected credit losses. Arrow utilized regression analyses of peer data, of which Arrow is included, where observed credit losses and selected economic factors were utilized to determine suitable loss drivers for modeling lifetime probability of default (PD) rates. Arrow uses the discounted cash flow (DCF) method to estimate expected credit losses for the commercial, commercial real estate, and residential segments. For each of these loan segments, Arrow generates cash flow projections at the instrument level wherein payment expectations are adjusted for estimated prepayment speed, curtailments, time to recovery, PD, and segment-specific loss given default (LGD) risk factors. The modeling of expected prepayment speeds, curtailment rates, and time to recovery are based on historical internal data and adjusted, if necessary, based on the reasonable and supportable forecast of economic conditions.
For the loan segments utilizing the DCF method, (commercial, commercial real estate, and residential) Management utilizes externally developed economic forecast of the following economic factors as loss drivers: national unemployment, gross domestic product and home price index (HPI). The economic forecast is applied over a reasonable and supportable forecast period. Arrow utilizes a six quarter reasonable and supportable forecast period with an eight quarter reversion to the historic mean on a straight-line basis.
The combination of adjustments for credit expectations (default and loss) and timing expectations (prepayment, curtailment, and time to recovery) produces an expected cash flow stream at the instrument level. Instrument effective yield is calculated, net of the impacts of prepayment assumptions, and the instrument expected cash flows are then discounted at that effective yield to produce an instrument-level net present value of expected cash flows (NPV). An allowance for credit loss is established for the difference between the instrument’s NPV and amortized cost basis. The contractual term excludes expected extensions, renewals, and modifications unless either of the following applies: Management has a reasonable expectation at the reporting date that a troubled debt restructuring (TDR) will be executed with an individual borrower or the extension or renewal options are included in the original or modified contract at the reporting date and are not unconditionally cancellable by Arrow.
Arrow uses the vintage analysis method to estimate expected credit losses for the consumer loan segment. The vintage method was selected since the loans within the consumer loan segment are homogeneous, not just by risk characteristic, but by loan structure. Under the vintage analysis method, a loss rate is calculated based on the quarterly net charge-offs to the outstanding loan balance for each vintage year over the lookback period. Once this periodic loss rate is calculated for each quarter in the lookback period, the periodic rates are averaged into the loss rate. The loss rate is then applied to the outstanding loan balances based on the loan's vintage year. Arrow maintains, over the life of the loan, the loss curve by vintage year. If estimated losses computed by the vintage method need to be adjusted based on current conditions and the reasonable and supportable economic forecast, these adjustments would be incorporated over a six quarter reasonable and supportable forecast period, reverting to historical losses using a straight-line method over an eight quarter period. Based on current conditions and the reasonable and supportable economic forecast, no adjustment to the loss rate for each vintage is currently required.
The vintage and DCF models also consider the need to qualitatively adjust expected loss estimates for information not already captured in the quantitative loss estimation process. Qualitative considerations include limitations inherent in the quantitative model; trends experienced in nonperforming and delinquent loans; changes in value of underlying collateral; changes in lending policies and procedures; nature and composition of loans; portfolio concentrations that may affect loss experience across one or more components or the portfolio; the experience, ability and depth of lending management and staff; Arrow's credit review system; and the effect of external factors such as competition, legal and regulatory requirements. These qualitative factor adjustments may increase or decrease Arrow's estimate of expected credit losses so that the allowance for credit loss is reflective of the estimate of lifetime losses that exist in the loan portfolio at the balance sheet date.
All loans not included in the vintage analysis method that exceed $250,000 which are on nonaccrual, are evaluated on an individual basis. For collateral dependent financial assets where Arrow has determined that foreclosure of the collateral is probable, or where the borrower is experiencing financial difficulty and Arrow expects repayment of the financial asset to be provided substantially through the operation or sale of the collateral, Arrow has elected a practical expedient to measure the allowance for credit loss as the difference between the fair value of the collateral less cost to sell, and the amortized cost basis of the asset as of the measurement date. In the event where the repayment of a collateral dependent financial asset is expected to be provided substantially through the operating of the collateral, Arrow will use fair value of the collateral at the reporting date when recording the net carrying amount of the asset and determining the allowance for credit losses. When repayment is expected to be from the sale of the collateral, expected credit losses are calculated as the amount by which the amortized cost basis of the financial asset exceeds the fair value of the underlying collateral less estimated cost to sell. The allowance for credit losses may be zero if the fair value of the collateral at the measurement date exceeds the amortized cost basis of the financial asset.
Except as set forth below, a loan that has been modified or renewed is considered a TDR when two conditions are met:
•The borrower is experiencing financial difficulty, and
•Concessions are made for the borrower's benefit that would not otherwise be considered for a borrower or transaction with similar credit risk characteristics.
Arrow's allowance for credit losses reflects all effects of a TDR when an individual asset is specifically identified as a reasonably expected TDR. Arrow has determined that a TDR is reasonably expected no later than the point it is determined that modification is the best course of action and it is at least reasonably possible that the troubled borrower will accept some form of concession to avoid a default. Reasonably expected TDRs and executed non-performing TDRs are evaluated individually to determine the required allowance for credit losses. TDRs performing in accordance with their modified contractual terms for a reasonable period of time may be included in Arrow's existing pools based on the underlying risk characteristics of the loan to measure the allowance for credit losses.
Allowance for Loan Losses – Incurred Loss Method - Prior to the adoption of CECL on January 1, 2021, Arrow calculated the allowance for loan losses using the incurred loss method whereby the allowance represented management’s estimate of probable incurred losses inherent in the current loan portfolio based on current information available. Provisions to the allowance for loan losses were offset by actual loan charge-offs (net of any recoveries). The loan portfolio was evaluated for potential charge-offs on a monthly basis. In general, automobile and other consumer loans were charged-off when 120 days delinquent. Residential real estate loans were charged-off when a loss becomes known or based on a new appraisal at the earlier of 180 days past due or repossession. Commercial and commercial real estate loans were evaluated early in their delinquency status and were charged-off when management concluded that not all principal would be repaid from on-going cash flows or liquidation of collateral. An evaluation of estimated proceeds from the liquidation of the loan’s collateral was compared to the loan carrying amount and a charge to the allowance for loan losses was taken for any deficiency. While management used available information to recognize losses on loans, future additions to the allowance could have been necessary based on changes in economic conditions in Arrow's market area. In addition, various Federal regulatory agencies, as an integral part of their examination process, reviewed Arrow's allowance for loan losses. Such agencies could have required Arrow to recognize additions to the allowance in future periods, based on their judgments about information available to them at the time of their examination, which may not have been currently available to management.
All nonaccrual loans over $250 thousand and all troubled debt restructured loans were considered to be impaired loans and these loans were evaluated individually to determine the amount of impairment, if any. The amount of impairment, if any, related to individual impaired loans was measured based on either the present value of expected future cash flows discounted at the loan's effective interest rate, the loan's observable market price or the fair value of the collateral if the loan was collateral dependent. Arrow determined impairment for collateral dependent loans based on the fair value of the collateral less estimated costs to sell. Any excess of the recorded investment in the collateral dependent impaired loan over the estimated collateral value, less costs to sell, was typically charged off. For impaired loans which were not collateral dependent, impairment was measured by comparing the recorded investment in the loan to the present value of the expected cash flows, discounted at the loan’s effective interest rate. If this amount was less than the recorded investment in the loan, an impairment reserve was recognized as part of the allowance for loan losses, or based upon the judgment of management all or a portion of the excess of the recorded investment in the loan over the present value of the estimated future cash flow might have been charged off.
The allowance for loan losses on the remaining loans was primarily determined based upon consideration of the historical net loss factor incorporating a rolling average annual twelve quarter look-back period of the respective segment that have occurred within each pool of loans over the loss emergence period (LEP), adjusted as necessary based upon consideration of qualitative considerations impacting the inherent risk of loss in the respective loan portfolios. The LEP is an estimate of the average amount of time from the point at which a loss was incurred on a loan to the point at which the loss was recognized in the financial statements. Since the LEP might have changed under various economic environments, the LEP calculation was updated on an annual basis.
In addition to historical net loss factors, qualitative factors that impact the inherent risk of loss associated with the loan categories within total loan portfolio was evaluated. These include:
•Changes in the volume and severity of past due, nonaccrual and adversely classified loans
•Changes in the nature and volume of the portfolio and in the terms of loans
•Changes in the value of the underlying collateral for collateral dependent loans
•Changes in lending policies and procedures, including changes in underwriting standards and collection, charge-off, and recovery practices not considered elsewhere in estimating loan losses
•Changes in the quality of the loan review system
•Changes in the experience, ability, and depth of lending management and other relevant staff
•Changes in international, national, regional, and local economic and business conditions and developments that affect the collectability of the portfolio
•The existence and effect of any concentrations of credit, and changes in the level of such concentrations
•The effect of other external factors such as competition and legal and regulatory requirements on the level of estimated loan losses in the existing portfolio or pool
In management’s opinion, the allowance for credit losses at each balance sheet date, either under the CECL methodology or the incurred loss methodology, is sufficient to provide for probable loan losses inherent in the corresponding loan portfolio.
Estimated Credit Losses on Off-Balance Sheet Credit Exposures Recognized as Other Liabilities - Arrow estimates expected credit losses over the contractual period in which Arrow has exposure to credit risk via a contractual obligation to extend credit, unless that obligation is unconditionally cancellable by Arrow. The allowance for credit losses on off-balance sheet credit exposures recognized in other liabilities, is adjusted as an expense in other noninterest expense. The estimate includes consideration of the likelihood that funding will occur and an estimate of expected credit losses on commitments expected to be funded over their estimated lives. Estimating credit losses on unfunded commitments requires the Bank to consider the following categories of off-balance sheet credit exposure: unfunded commitments to extend credit, unfunded lines of credit, and standby letters of credit. Each of these unfunded commitments is then analyzed for a probability of funding to calculate a probable funding amount. The life of loan loss factor by related portfolio segment from the loan allowance for credit loss calculation is then applied to the probable funding amount to calculate the estimated credit losses on off-balance sheet credit exposures recognized as other liabilities.
Accrued Interest Receivable - Upon adoption of CECL on January 1, 2021, Arrow made the following elections regarding accrued interest receivable: (1) presented accrued interest receivable balances separately within the other assets balance sheet line item; (2) excluded interest receivable that is included in amortized cost of financing receivables from related disclosures requirements and (3) continued Arrow's policy to write off accrued interest receivable by reversing interest income. For loans, write off typically occurs upon becoming over 90 to 120 days past due and therefore the amount of such write offs are immaterial. Historically, Arrow has not experienced uncollectible accrued interest receivable on investment securities.
Comprehensive Income (Loss) - For Arrow, comprehensive income (loss) represents net income plus unrealized net securities holding gains or losses arising during the year (net of taxes), the reclassification adjustment for net securities gains and losses arising during the year (net of taxes), net unrealized gains or losses on cash flow hedge agreements, reclassification of net unrealized gain or loss on cash flow hedge agreements to interest expense (net of taxes), net retirement plan gain or loss (net of taxes), net retirement plan prior service cost (net of taxes), amortization of net retirement plan actuarial gain or loss (net of taxes) and amortization of net retirement plan prior service credit or cost (net of taxes) and is presented in the Consolidated Statements of Comprehensive Income (Loss) and Consolidated Statements of Changes in Shareholders’ Equity. Accumulated other comprehensive income (loss) represents the unrealized net securities holding gains or losses arising during the year (net of taxes), net unrealized gains or losses on cash flow hedge agreements, reclassification of net unrealized gain or loss on cash flow hedge agreements to interest expense (net of taxes), net retirement plan gain or loss (net of taxes), net retirement plan prior service cost (net of taxes), amortization of net retirement plan actuarial gain or loss (net of taxes) and amortization of net retirement plan prior service credit or cost (net of taxes) in the Company’s defined-benefit retirement and pension plan, supplemental employee retirement plan, and post-retirement life and healthcare benefit plan.
Revenue Recognition - The following is a description of principal activities from which Arrow generates its revenue from noninterest income sources.
Income from Fiduciary Activities: represents revenue derived mainly through the management of client investments which is based on the market value of the covered assets and the fee schedule contained in the applicable account management agreement. Since the revenue is mainly based on the market value of assets, this amount can be volatile as financial markets increase and decrease based on various economic factors. The terms of the account management agreements generally specify that the performance obligations are completed each quarter. Accordingly, the Company mainly recognizes revenue from fiduciary activities on a quarterly basis.
Fees for Other Services to Customers: represents general service fees for monthly deposit account maintenance and account activity plus fees from other deposit-based services. Revenue is recognized when the performance obligation is completed, which is generally on a monthly basis for account maintenance services, or upon the completion of a deposit-related transaction. Payment for these performance obligations is generally received at the time the performance obligations are satisfied.
Insurance Commissions: represents commissions and fees paid by insurance carriers for both property and casualty insurance policies, and for services performed for employment benefits clients. Revenue from the property and casualty insurance business is recognized when the performance obligation is satisfied, which is generally the effective date of the bound coverage since there are no significant performance obligations remaining.
Revenue from the employment benefit brokerage business is recognized when the benefit servicing performance obligations are satisfied, generally on a monthly basis.
Other Real Estate Owned and Repossessed Assets - Real estate acquired by foreclosure and assets acquired by repossession are recorded at the fair value of the property less estimated costs to sell at the time of repossession. Subsequent declines in fair value, after transfer to other real estate owned and repossessed assets are recognized through a valuation allowance. Such declines in fair value along with related operating expenses to administer such properties or assets are charged directly to operating expense.
Premises and Equipment - Premises and equipment are stated at cost, less accumulated depreciation and amortization. Depreciation and amortization included in operating expenses are computed largely on the straight-line method. Depreciation is based on the estimated useful lives of the assets (buildings and improvements 20-40 years; furniture and equipment 7-10 years; data processing equipment 5-7 years) and, in the case of leasehold improvements, amortization is computed over the terms of the respective leases or their estimated useful lives, whichever is shorter. Gains or losses on disposition are reflected in earnings.
Leases - Arrow recognizes right-of-use assets and lease liabilities on the balance sheet for all leases with terms longer than 12 months, and has elected not to separate lease and non-lease components, but accounts for the resulting combined component as a single lease component. Arrow also elected to account for short-term leases, those leases with a "lease term" of twelve months or less, as an operating lease. Since Arrow has not been able to determine the rate implicit in its leases, the secured borrowing rate from the Federal Home Loan Bank of New York is utilized to determine the lease discount rate. The expected expiration date of each new lease is determined on a lease-by-lease basis based on certain criteria, such as the availability of renewal options in the lease contracts, the amount of leasehold improvements required in addition to the feasibility of growth potential.
Investments in Real Estate Limited Partnerships - These limited partnerships acquire, develop and operate low and moderate-income housing. As a limited partner in these projects, Arrow receives low income housing tax credits and tax deductions for losses incurred by the underlying properties. The proportional amortization method allowed in Accounting Standards Update 2014-01 "Investments - Equity Method and Joint Ventures (Topic 323): Accounting for Investments in Qualified Affordable Housing Projects" is applied. The proportional amortization method permits an entity to amortize the initial cost of the investment in proportion to the amount of the tax credits and other tax benefits received and to recognize the net investment performance in the income statement as a component of income tax expense.
Investments in Historical Tax Credits - Arrow accounts for historic rehabilitation tax credits using the deferral method of accounting under which the tax benefit generated from an investment tax credit is recorded as a reduction to the GAAP asset basis. Accordingly, Arrow recognized a current tax receivable and a deferred tax asset and corresponding reduction in the basis of Arrow's historic tax credit investment.
Bank-Owned Life Insurance - Arrow has purchased life insurance policies on certain employees, key executives and directors. Bank-owned life insurance is recorded at the amount that can be realized under the insurance contract at the balance sheet date, which is the cash surrender value adjusted for other charges or other amounts due that are probable at settlement.
Derivative Instruments and Hedging Activities - Arrow enters into interest rate swap agreements that are not designated as hedges for accounting purposes. As the interest rate swap agreements have substantially equivalent and offsetting terms, they do not present any material exposure to Arrow's consolidated statements of income. Arrow records its interest rate swap agreements at fair value and is presented on a gross basis within other assets and other liabilities on the consolidated balance sheets. Changes in the fair value of assets and liabilities arising from these derivatives are included, net, in other income in the consolidated statement of income.
In addition, Arrow has entered into interest rate swaps to synthetically fix the variable rate interest payments in outstanding subordinated trust securities. These agreements are designated as cash flow hedges. For derivatives designated and that qualify as cash flow hedges of interest rate risk, the gain or loss on the derivative is recorded in Accumulated Other Comprehensive Income and subsequently reclassified into interest expense in the same period during which the hedge transaction affects earnings.
Income Taxes - Arrow accounts for income taxes under the asset and liability method. Deferred tax assets and liabilities are recognized for the future tax consequences attributable to differences between the financial statement carrying amounts of existing assets and liabilities and their respective tax bases. Deferred tax assets and liabilities are measured using enacted tax rates expected to apply to taxable income in the years in which those temporary differences are expected to be recovered or settled. The effect on deferred tax assets and liabilities of a change in tax rates is recognized in income tax expense in the period that includes the enactment date. Arrow’s policy is that deferred tax assets are reduced by a valuation allowance if, based on the weight of available evidence, it is more likely than not that some or all of the deferred tax assets will not be realized.
Goodwill and Other Intangible Assets - Identifiable intangible assets acquired in a business combination are capitalized and amortized. Any remaining unidentifiable intangible asset is classified as goodwill, for which amortization is not required but which must be evaluated for impairment. Arrow tests for impairment of goodwill on an annual basis, or when events and circumstances indicate potential impairment.
In evaluating goodwill for impairment, Arrow first assesses certain qualitative factors to determine if it is more likely than not that the fair value of the reporting unit is less than its carrying value. If it is more likely than not that the fair value of a reporting unit exceeds its carrying amount, goodwill of the reporting unit is considered not impaired. If the carrying amount of a reporting unit exceeds its fair value, the second step of the goodwill impairment test is performed to measure the amount of impairment loss, if any.
The carrying amounts of other recognized intangible assets that meet recognition criteria and for which separate accounting records have been maintained (mortgage servicing rights and customer intangibles), have been included in the consolidated balance sheet as “Other Intangible Assets, Net.”
Arrow has sold residential real estate loans, primarily to Freddie Mac, with servicing retained. Mortgage servicing rights are recognized as an asset when loans are sold with servicing retained, by allocating the cost of an originated mortgage loan between the loan and servicing right based on estimated relative fair values. The cost allocated to the servicing right is capitalized as a separate asset and amortized in proportion to, and over the period of, estimated net servicing income. Capitalized mortgage servicing rights are evaluated for impairment by comparing the asset’s carrying value to its current estimated fair value. Fair values are estimated using a discounted cash flow approach, which considers future servicing income and costs, current market interest rates, and anticipated prepayment, and default rates. Impairment losses are recognized through a valuation allowance for servicing rights having a current fair value that is less than amortized cost on an aggregate basis. Adjustments to increase or decrease the valuation allowance are charged or credited to income as a component of other operating income.
Pension and Postretirement Benefits - Arrow maintains a non-contributory, defined benefit pension plan covering substantially all employees, a supplemental pension plan covering certain executive officers selected by the Board of Directors, and certain post-retirement medical, dental and life insurance benefits for employees and retirees which are more fully described in Note 13, Retirement Benefit Plans. The costs of these plans, based on actuarial computations of current and future benefits for employees, are charged to current operating expenses. The cost of post-retirement benefits other than pensions is recognized on an accrual basis as employees perform services to earn the benefits. Arrow recognizes the overfunded or underfunded status of our single employer defined benefit pension plan as an asset or liability on its consolidated balance sheet and recognizes changes in the funded status in comprehensive income in the year in which the change occurred.
Prior service costs or credits are amortized on a straight-line basis over the average remaining service period of active participants. Gains and losses in excess of 10% of the greater of the benefit obligation or the fair value of assets are amortized over the average remaining service period of active participants.
The discount rate assumption is determined by preparing an analysis of the respective plan’s expected future cash flows and high-quality fixed-income investments currently available and expected to be available during the period to maturity of the pension benefits.
Stock-Based Compensation Plans - Arrow has three stock-based compensation plans, which are described more fully in Note 12, Stock Based Compensation. The Company expenses the grant date fair value of stock options and restricted stock units granted. For stock options and restricted stock units, the expense is recognized over the vesting period of the grant, typically four years for stock options and three years for restricted stock units, on a straight-line basis. Shares are generally issued from treasury for the exercise of stock options.
Arrow sponsors an Employee Stock Purchase Plan ("ESPP") under which employees may purchase Arrow’s common stock at a 5% discount below market price at the time of purchase. This stock purchase plan is not considered a compensatory plan.
Arrow maintains an employee stock ownership plan (“ESOP”). Substantially all employees of Arrow and its subsidiaries are eligible to participate upon satisfaction of applicable service requirements. The ESOP has the ability to borrow funds from one of Arrow’s subsidiary banks to purchase outstanding shares of Arrow’s common stock. At December 31, 2022 and 2021, there were no loans outstanding and no unallocated shares. In addition, Arrow makes additional cash contributions to the Plan each year.
Securities Sold Under Agreements to Repurchase - In securities repurchase agreements, Arrow receives cash from a counterparty in exchange for the transfer of securities to a third party custodian’s account that explicitly recognizes Arrow’s interest in the securities. These agreements are accounted for by Arrow as secured financing transactions, since it maintains effective control over the transferred securities, and meets other criteria for such accounting. Accordingly, the cash proceeds are recorded as borrowed funds, and the underlying securities continue to be carried in Arrow’s securities available-for-sale portfolio.
Earnings Per Share (“EPS”) - Basic EPS excludes dilution and is computed by dividing income available to common stockholders by the weighted average number of common shares outstanding for the period. Diluted EPS reflects the potential dilution that could occur if securities or other contracts to issue common stock were exercised or converted into common stock or resulted in the issuance of common stock that then shared in the earnings of the entity (such as Arrow’s stock options), computed using the treasury stock method. Unallocated common shares held by Arrow’s ESOP are not included in the weighted average number of common shares outstanding for either the basic or diluted EPS calculation.
Financial Instruments - Arrow is party to financial instruments with off-balance sheet risk in the normal course of business to meet the financing needs of its customers. These financial instruments include commitments to extend credit and standby letters of credit. Commitments to extend credit include home equity lines of credit, commitments for residential and commercial construction loans and other personal and commercial lines of credit. These instruments involve, to varying degrees, elements of credit and interest rate risk in excess of the amount recognized in the consolidated balance sheets. The contract or notional amounts of those instruments reflect the extent of the involvement Arrow has in particular classes of financial instruments.
Arrow's policy is to record such instruments when funded. Fair value estimates are made at a specific point in time, based on relevant market information and information about the financial instrument. These estimates do not reflect any premium or discount that could result from offering for sale at one time Arrow's entire holdings of a particular financial instrument. Because no market exists for a significant portion of Arrow's financial instruments, fair value estimates are based on judgments regarding future expected loss experience, current economic conditions, risk characteristics of various financial instruments, and other factors. These estimates are subjective in nature and involve uncertainties and matters of significant judgment and therefore cannot be determined with precision. Changes in assumptions could significantly affect the estimates.
Fair value estimates are based on existing on- and off-balance sheet financial instruments without attempting to estimate the value of anticipated future business and the value of assets and liabilities that are not considered financial instruments. For example, Arrow has a wealth management department that contributes net fee income annually. The value of the wealth management department customer relationships is not considered a financial instrument of the Company, and therefore this value has not been incorporated into the fair value estimates. Other significant assets and liabilities that are not considered financial assets or liabilities include deferred taxes, premises and equipment, the value of low-cost, long-term core deposits and goodwill. In addition, the tax ramifications related to the realization of the unrealized gains and losses can have a significant effect on fair value estimates and have not been considered in any of the estimates.
The fair value for loans is disclosed using the "exit price" notion which is a reasonable estimate of what another party might pay in an orderly transaction. Fair values for loans are calculated for portfolios of loans with similar financial characteristics. Loans are segregated by type such as commercial, commercial real estate, residential mortgage, indirect auto and other consumer loans. Each loan category is further segmented into fixed and adjustable interest rate terms and by performing and nonperforming categories. The fair value of performing loans is calculated by determining the estimated future cash flow, which is the contractual cash flow adjusted for estimated prepayments. The discount rate is determined by starting with current market yields, and adjusting for a discount spread. The discount spread is applied separately for each loan type based on market information. A liquidity premium is determined for each loan type based on market inefficiencies associated with the sale of a financial instrument. Finally, a credit loss component is determined utilizing the credit loss assumptions used in the allowance for credit loss model.
The carrying amount of short-term assets and liabilities is a reasonable estimate of fair value: cash and due from banks, federal funds sold and purchased, securities sold under agreements to repurchase, demand deposits, savings, N.O.W. and money market deposits, brokered money market deposits and time deposits, other short-term borrowings, accrued interest receivable and accrued interest payable. The fair value estimates of other on- and off-balance sheet financial instruments, as well as the method of arriving at fair value estimates, are included in the related footnotes and summarized in Note 17, Fair Values.
Fair Value Measures - Arrow determines the fair value of financial instruments under the following hierarchy:
•Level 1 – Unadjusted quoted prices in active markets that are accessible at the measurement date for identical, unrestricted assets or liabilities;
•Level 2 – Quoted prices for similar assets or liabilities in active markets, quoted prices for identical or similar assets or liabilities in markets that are not active, or inputs that are observable, either directly or indirectly, for substantially the full term of the asset or liability;
•Level 3 – Prices or valuation techniques that require inputs that are both significant to the fair value measurement and unobservable (i.e., supported by little or no market activity).
A financial instrument’s level within the fair value hierarchy is based on the lowest level of input that is significant to the fair value measurement.
Management’s Use of Estimates -The preparation of the Consolidated Financial Statements in conformity with accounting principles generally accepted in the United States of America requires management to make estimates and assumptions that affect the reported amounts of assets and liabilities and disclosure of contingent assets and liabilities at the date of the Consolidated Financial Statements and the reported amounts of income and expenses during the reporting period. Our most significant estimates are the allowance for credit losses, the evaluation of impairment of investment securities, goodwill impairment, pension and other postretirement liabilities and an analysis of a need for a valuation allowance for deferred tax assets. Actual results could differ from those estimates.
A material estimate that is particularly susceptible to significant change in the near term is the allowance for credit losses. In connection with the determination of the allowance for credit losses, management obtains appraisals for properties. The allowance for credit losses is management’s best estimate of probable credit losses as of the balance sheet date. While management uses available information to recognize losses on loans, future adjustments to the allowance for credit losses may be necessary based on changes in economic conditions.
There were no additional accounting standards adopted by Arrow in 2022.
Note 3:CASH AND CASH EQUIVALENTS (Dollars In Thousands)
|
|
|
|
|
|
|
|
|
|
|
|
|
2022 |
|
2021 |
| Balances at December 31: |
|
|
|
| Cash and Due From Banks |
$ |
31,886 |
|
|
$ |
26,978 |
|
| Interest-Bearing Deposits at Banks |
32,774 |
|
|
430,718 |
|
| Total Cash and Cash Equivalents |
$ |
64,660 |
|
|
$ |
457,696 |
|
|
|
|
|
|
|
|
|
|
|
|
|
|
|
|
|
Decline in cash from the prior year was primarily the result of record loan growth of $315 million and a decrease in deposits of $52 million.
Note 4: INVESTMENT SECURITIES (Dollars In Thousands)
The following table is the schedule of Available-For-Sale Securities at December 31, 2022 and 2021:
|
|
|
|
|
|
|
|
|
|
|
|
|
|
|
|
|
|
|
|
|
|
|
|
|
|
|
|
|
|
|
|
|
|
|
| Available-For-Sale Securities |
|
|
U.S. Government & Agency
Obligations |
|
State and
Municipal
Obligations |
|
Mortgage-
Backed
Securities |
|
Corporate
and Other
Debt
Securities |
|
|
|
Total
Available-
For-Sale
Securities |
| December 31, 2022 |
|
|
|
|
|
|
|
|
|
|
|
|
Available-For-Sale Securities,
at Amortized Cost |
|
$ |
190,000 |
|
|
$ |
340 |
|
|
$ |
447,755 |
|
|
$ |
1,000 |
|
|
|
|
$ |
639,095 |
|
| Gross Unrealized Gains |
|
15 |
|
|
— |
|
|
65 |
|
|
— |
|
|
|
|
80 |
|
| Gross Unrealized Losses |
|
(14,816) |
|
|
— |
|
|
(50,664) |
|
|
(200) |
|
|
|
|
(65,680) |
|
Available-For-Sale Securities,
at Fair Value |
|
$ |
175,199 |
|
|
$ |
340 |
|
|
$ |
397,156 |
|
|
$ |
800 |
|
|
|
|
$ |
573,495 |
|
Available-For-Sale Securities,
Pledged as Collateral,
at Fair Value |
|
|
|
|
|
|
|
|
|
|
|
308,266 |
|
|
|
|
|
|
|
|
|
|
|
|
|
|
Maturities of Debt Securities,
at Amortized Cost: |
|
|
|
|
|
|
|
|
|
|
|
|
| Within One Year |
|
— |
|
|
20 |
|
|
690 |
|
|
— |
|
|
|
|
710 |
|
| From 1 - 5 Years |
|
190,000 |
|
|
— |
|
|
241,322 |
|
|
— |
|
|
|
|
431,322 |
|
| From 5 - 10 Years |
|
— |
|
|
320 |
|
|
205,743 |
|
|
1,000 |
|
|
|
|
207,063 |
|
| Over 10 Years |
|
— |
|
|
— |
|
|
— |
|
|
— |
|
|
|
|
— |
|
|
|
|
|
|
|
|
|
|
|
|
|
|
Maturities of Debt Securities,
at Fair Value: |
|
|
|
|
|
|
|
|
|
|
|
|
| Within One Year |
|
— |
|
|
20 |
|
|
667 |
|
|
— |
|
|
|
|
687 |
|
| From 1 - 5 Years |
|
175,199 |
|
|
— |
|
|
222,112 |
|
|
— |
|
|
|
|
397,311 |
|
| From 5 - 10 Years |
|
— |
|
|
320 |
|
|
174,377 |
|
|
800 |
|
|
|
|
175,497 |
|
| Over 10 Years |
|
— |
|
|
— |
|
|
— |
|
|
— |
|
|
|
|
— |
|
|
|
|
|
|
|
|
|
|
|
|
|
|
Securities in a Continuous
Loss Position, at Fair Value: |
|
|
|
|
|
|
|
|
|
|
|
|
| Less than 12 Months |
|
$ |
66,690 |
|
|
$ |
— |
|
|
$ |
183,868 |
|
|
$ |
— |
|
|
|
|
$ |
250,558 |
|
| 12 Months or Longer |
|
93,493 |
|
|
— |
|
|
199,262 |
|
|
800 |
|
|
|
|
293,555 |
|
| Total |
|
$ |
160,183 |
|
|
$ |
— |
|
|
$ |
383,130 |
|
|
$ |
800 |
|
|
|
|
$ |
544,113 |
|
Number of Securities in a
Continuous Loss Position |
|
23 |
|
|
— |
|
|
150 |
|
|
1 |
|
|
|
|
174 |
|
|
|
|
|
|
|
|
|
|
|
|
|
|
Unrealized Losses on
Securities in a Continuous
Loss Position: |
|
|
|
|
|
|
|
|
|
|
|
|
| Less than 12 Months |
|
$ |
3,310 |
|
|
$ |
— |
|
|
$ |
18,756 |
|
|
$ |
— |
|
|
|
|
$ |
22,066 |
|
| 12 Months or Longer |
|
11,506 |
|
|
— |
|
|
31,908 |
|
|
200 |
|
|
|
|
43,614 |
|
| Total |
|
$ |
14,816 |
|
|
$ |
— |
|
|
$ |
50,664 |
|
|
$ |
200 |
|
|
|
|
$ |
65,680 |
|
|
|
|
|
|
|
|
|
|
|
|
|
|
| Disaggregated Details: |
|
|
|
|
|
|
|
|
|
|
|
|
|
|
|
|
|
|
|
|
|
|
|
|
|
|
|
|
|
|
|
|
|
|
|
|
|
|
US Agency Obligations,
at Amortized Cost |
|
190,000 |
|
|
|
|
|
|
|
|
|
|
|
US Agency Obligations,
at Fair Value |
|
175,199 |
|
|
|
|
|
|
|
|
|
|
|
US Government Agency
Securities, at Amortized Cost |
|
|
|
|
|
$ |
7,934 |
|
|
|
|
|
|
|
US Government Agency
Securities, at Fair Value |
|
|
|
|
|
7,433 |
|
|
|
|
|
|
|
Government Sponsored Entity
Securities, at Amortized Cost |
|
|
|
|
|
439,821 |
|
|
|
|
|
|
|
Government Sponsored Entity
Securities, at Fair Value |
|
|
|
|
|
389,723 |
|
|
|
|
|
|
|
|
|
|
|
|
|
|
|
|
|
|
|
|
|
|
|
|
|
|
|
|
|
|
|
|
|
|
|
|
|
|
|
|
|
|
| Available-For-Sale Securities |
|
|
U.S. Government & Agency
Obligations |
|
State and
Municipal
Obligations |
|
Mortgage-
Backed
Securities |
|
Corporate
and Other
Debt
Securities |
|
|
|
Total
Available-
For-Sale
Securities |
| December 31, 2021 |
|
|
|
|
|
|
|
|
|
|
|
|
Available-For-Sale Securities,
at Amortized Cost |
|
$ |
110,000 |
|
|
$ |
400 |
|
|
$ |
448,742 |
|
|
$ |
1,000 |
|
|
|
|
$ |
560,142 |
|
| Gross Unrealized Gains |
|
63 |
|
|
— |
|
|
3,617 |
|
|
— |
|
|
|
|
3,680 |
|
| Gross Unrealized Losses |
|
(1,698) |
|
|
— |
|
|
(2,608) |
|
|
(200) |
|
|
|
|
(4,506) |
|
Available-For-Sale Securities,
at Fair Value |
|
$ |
108,365 |
|
|
$ |
400 |
|
|
$ |
449,751 |
|
|
$ |
800 |
|
|
|
|
$ |
559,316 |
|
Available-For-Sale Securities,
Pledged as Collateral,
at Fair Value |
|
|
|
|
|
|
|
|
|
|
|
298,106 |
|
|
|
|
|
|
|
|
|
|
|
|
|
|
Securities in a Continuous
Loss Position, at Fair Value: |
|
|
|
|
|
|
|
|
|
|
|
|
| Less than 12 Months |
|
$ |
74,088 |
|
|
$ |
— |
|
|
$ |
263,292 |
|
|
$ |
— |
|
|
|
|
$ |
337,380 |
|
| 12 Months or Longer |
|
29,214 |
|
|
— |
|
|
— |
|
|
800 |
|
|
|
|
30,014 |
|
| Total |
|
$ |
103,302 |
|
|
$ |
— |
|
|
$ |
263,292 |
|
|
$ |
800 |
|
|
|
|
$ |
367,394 |
|
Number of Securities in a
Continuous Loss Position |
|
14 |
|
|
— |
|
|
39 |
|
|
1 |
|
|
|
|
54 |
|
|
|
|
|
|
|
|
|
|
|
|
|
|
Unrealized Losses on
Securities in a Continuous
Loss Position: |
|
|
|
|
|
|
|
|
|
|
|
|
| Less than 12 Months |
|
$ |
912 |
|
|
$ |
— |
|
|
$ |
2,608 |
|
|
$ |
— |
|
|
|
|
$ |
3,520 |
|
| 12 Months or Longer |
|
786 |
|
|
— |
|
|
— |
|
|
200 |
|
|
|
|
986 |
|
| Total |
|
$ |
1,698 |
|
|
$ |
— |
|
|
$ |
2,608 |
|
|
$ |
200 |
|
|
|
|
$ |
4,506 |
|
|
|
|
|
|
|
|
|
|
|
|
|
|
| Disaggregated Details: |
|
|
|
|
|
|
|
|
|
|
|
|
|
|
|
|
|
|
|
|
|
|
|
|
|
|
|
|
|
|
|
|
|
|
|
|
|
|
US Agency Obligations,
at Amortized Cost |
|
$ |
110,000 |
|
|
|
|
|
|
|
|
|
|
|
US Agency Obligations,
at Fair Value |
|
108,365 |
|
|
|
|
|
|
|
|
|
|
|
US Government Agency
Securities, at Amortized Cost |
|
|
|
|
|
$ |
9,386 |
|
|
|
|
|
|
|
US Government Agency
Securities, at Fair Value |
|
|
|
|
|
9,371 |
|
|
|
|
|
|
|
Government Sponsored Entity
Securities, at Amortized Cost |
|
|
|
|
|
439,356 |
|
|
|
|
|
|
|
Government Sponsored Entity
Securities, at Fair Value |
|
|
|
|
|
440,380 |
|
|
|
|
|
|
|
At December 31, 2022, there was no allowance for credit losses for the available for sale securities portfolio.
The following table is the schedule of Held-To-Maturity Securities at December 31, 2022 and 2021:
|
|
|
|
|
|
|
|
|
|
|
|
|
|
|
|
|
|
|
|
|
|
|
| Held-To-Maturity Securities |
|
|
State and
Municipal
Obligations |
|
Mortgage-
Backed
Securities |
|
|
|
Total
Held-To
Maturity
Securities |
| December 31, 2022 |
|
|
|
|
|
|
|
|
Held-To-Maturity Securities,
at Amortized Cost |
|
$ |
163,600 |
|
|
$ |
11,764 |
|
|
|
|
$ |
175,364 |
|
| Gross Unrealized Gains |
|
1 |
|
|
— |
|
|
|
|
1 |
|
| Gross Unrealized Losses |
|
(3,131) |
|
|
(611) |
|
|
|
|
(3,742) |
|
Held-To-Maturity Securities,
at Fair Value |
|
$ |
160,470 |
|
|
$ |
11,153 |
|
|
|
|
$ |
171,623 |
|
Held-To-Maturity Securities,
Pledged as Collateral, at Fair Value |
|
|
|
|
|
|
|
142,982 |
|
|
|
|
|
|
|
|
|
|
Maturities of Debt Securities,
at Amortized Cost: |
|
|
|
|
|
|
|
|
| Within One Year |
|
52,522 |
|
|
— |
|
|
|
|
52,522 |
|
| From 1 - 5 Years |
|
108,233 |
|
|
11,764 |
|
|
|
|
119,997 |
|
| From 5 - 10 Years |
|
2,806 |
|
|
— |
|
|
|
|
2,806 |
|
| Over 10 Years |
|
39 |
|
|
— |
|
|
|
|
39 |
|
|
|
|
|
|
|
|
|
|
Maturities of Debt Securities,
at Fair Value: |
|
|
|
|
|
|
|
|
| Within One Year |
|
52,233 |
|
|
— |
|
|
|
|
52,233 |
|
| From 1 - 5 Years |
|
105,414 |
|
|
11,153 |
|
|
|
|
116,567 |
|
| From 5 - 10 Years |
|
2,784 |
|
|
— |
|
|
|
|
2,784 |
|
| Over 10 Years |
|
39 |
|
|
— |
|
|
|
|
39 |
|
|
|
|
|
|
|
|
|
|
Securities in a Continuous
Loss Position, at Fair Value: |
|
|
|
|
|
|
|
|
| Less than 12 Months |
|
$ |
137,773 |
|
|
$ |
11,153 |
|
|
|
|
$ |
148,926 |
|
| 12 Months or Longer |
|
— |
|
|
— |
|
|
|
|
— |
|
| Total |
|
$ |
137,773 |
|
|
$ |
11,153 |
|
|
|
|
$ |
148,926 |
|
Number of Securities in a
Continuous Loss Position |
|
397 |
|
|
16 |
|
|
|
|
413 |
|
|
|
|
|
|
|
|
|
|
Unrealized Losses on Securities
in a Continuous Loss Position: |
|
|
|
|
|
|
|
|
| Less than 12 Months |
|
$ |
3,131 |
|
|
$ |
611 |
|
|
|
|
$ |
3,742 |
|
| 12 Months or Longer |
|
— |
|
|
— |
|
|
|
|
— |
|
| Total |
|
$ |
3,131 |
|
|
$ |
611 |
|
|
|
|
$ |
3,742 |
|
|
|
|
|
|
|
|
|
|
| Disaggregated Details: |
|
|
|
|
|
|
|
|
US Government Agency
Securities, at Amortized Cost |
|
|
|
3,898 |
|
|
|
|
|
US Government Agency
Securities, at Fair Value |
|
|
|
3,687 |
|
|
|
|
|
Government Sponsored Entity
Securities, at Amortized Cost |
|
|
|
7,866 |
|
|
|
|
|
Government Sponsored Entity
Securities, at Fair Value |
|
|
|
7,466 |
|
|
|
|
|
|
|
|
|
|
|
|
|
|
|
|
|
|
|
|
|
|
|
|
|
|
|
|
| Held-To-Maturity Securities |
|
|
State and
Municipal
Obligations |
|
Mortgage-
Backed
Securities |
|
|
|
Total
Held-To
Maturity
Securities |
|
|
|
|
|
|
|
|
|
|
|
|
|
|
|
|
|
|
| December 31, 2021 |
|
|
|
|
|
|
|
|
Held-To-Maturity Securities,
at Amortized Cost |
|
$ |
180,195 |
|
|
$ |
16,371 |
|
|
|
|
$ |
196,566 |
|
| Gross Unrealized Gains |
|
4,179 |
|
|
547 |
|
|
|
|
4,726 |
|
| Gross Unrealized Losses |
|
— |
|
|
— |
|
|
|
|
— |
|
Held-To-Maturity Securities,
at Fair Value |
|
$ |
184,374 |
|
|
$ |
16,918 |
|
|
|
|
$ |
201,292 |
|
Held-To-Maturity Securities,
Pledged as Collateral, at Fair Value |
|
|
|
|
|
|
|
175,218 |
|
|
|
|
|
|
|
|
|
|
Securities in a Continuous
Loss Position, at Fair Value: |
|
|
|
|
|
|
|
|
| Less than 12 Months |
|
$ |
— |
|
|
$ |
— |
|
|
|
|
$ |
— |
|
| 12 Months or Longer |
|
— |
|
|
— |
|
|
|
|
— |
|
| Total |
|
$ |
— |
|
|
$ |
— |
|
|
|
|
$ |
— |
|
Number of Securities in a
Continuous Loss Position |
|
— |
|
|
— |
|
|
|
|
— |
|
|
|
|
|
|
|
|
|
|
Unrealized Losses on Securities
in a Continuous Loss Position: |
|
|
|
|
|
|
|
|
| Less than 12 Months |
|
$ |
— |
|
|
$ |
— |
|
|
|
|
$ |
— |
|
| 12 Months or Longer |
|
— |
|
|
— |
|
|
|
|
— |
|
| Total |
|
$ |
— |
|
|
$ |
— |
|
|
|
|
$ |
— |
|
|
|
|
|
|
|
|
|
|
| Disaggregated Details: |
|
|
|
|
|
|
|
|
US Government Agency
Securities, at Amortized Cost |
|
|
|
5,518 |
|
|
|
|
|
US Government Agency
Securities, at Fair Value |
|
|
|
5,647 |
|
|
|
|
|
Government Sponsored Entity
Securities, at Amortized Cost |
|
|
|
10,853 |
|
|
|
|
|
Government Sponsored Entity
Securities, at Fair Value |
|
|
|
11,271 |
|
|
|
|
|
In the tables above, maturities of mortgage-backed securities are included based on their contractual average lives. Actual maturities will differ because issuers may have the right to call or prepay obligations with or without prepayment penalties.
Securities in a continuous loss position, in the tables above for December 31, 2022 and December 31, 2021 do not reflect any deterioration of the credit worthiness of the issuing entities.
Arrow evaluates available-for-sale debt securities in unrealized loss positions at each measurement date to determine whether the decline in the fair value below the amortized cost basis (impairment) is due to credit-related factors or noncredit-related factors. Any impairment that is not credit related is recognized in other comprehensive income, net of applicable taxes. Credit-related impairment is recognized within the allowance for credit losses on the balance sheet, limited to the amount by which the amortized cost basis exceeds the fair value, with a corresponding adjustment to earnings via credit loss expense. Arrow determined that at December 31, 2022, gross unrealized losses were primarily attributable to changes in interest rates, relative to when the investment securities were purchased, and not due to the credit quality of the investment securities. Arrow does not intend to sell, nor is it more likely than not that Arrow will be required to sell the security before recovery of its amortized cost basis, which may be at maturity. Therefore, Arrow carried no allowance for credit loss at December 31, 2022 and there was no credit loss expense recognized by Arrow with respect to the securities portfolio during 2022.
Arrow's held to maturity debt securities are comprised of securities issued by U.S. government agencies or U.S. government-sponsored enterprises or state and municipal obligations. U.S. government agencies and U.S. government-sponsored enterprise securities carry the explicit and/or implicit guarantee of the U.S. government, are widely recognized as “risk free,” and have a long history of zero credit loss. Arrow determined that the expected credit loss on its held to maturity debt portfolio was immaterial and therefore no allowance for credit loss was recorded as of December 31, 2022.
The following table is the schedule of Equity Securities at December 31, 2022 and 2021.
|
|
|
|
|
|
|
|
|
|
|
|
|
|
|
| Equity Securities |
|
|
|
|
|
|
|
December 31, |
|
|
2022 |
|
2021 |
|
|
|
|
|
| Equity Securities, at Fair Value |
|
$ |
2,174 |
|
|
$ |
1,747 |
|
|
|
|
|
|
|
|
|
|
|
|
|
|
|
|
|
|
|
|
|
|
|
|
|
|
|
|
|
|
|
|
|
|
|
|
|
|
|
|
|
|
|
|
|
|
|
|
|
|
|
|
|
|
|
|
|
|
|
|
|
|
|
|
|
|
|
|
|
|
|
|
|
|
|
|
The following is a summary of realized and unrealized gains and losses recognized in net income on equity securities during the years ended December 31, 2022 and 2021:
|
|
|
|
|
|
|
|
|
|
|
|
|
|
|
|
|
December 31, |
|
|
2022 |
|
2021 |
| Net Gain (Loss) on Equity Securities |
|
$ |
427 |
|
|
$ |
111 |
|
| Less: Net Gain (Loss) recognized during the reporting period on equity securities sold during the period |
|
— |
|
|
— |
|
| Unrealized Net Gain (Loss) recognized during the reporting period on equity securities still held at the reporting date |
|
$ |
427 |
|
|
$ |
111 |
|
|
|
|
|
|
Schedule of Federal Reserve Bank and Federal Home Loan Bank Stock (at cost)
|
|
|
|
|
|
|
|
|
|
|
|
|
|
|
|
|
December 31, |
|
|
2022 |
|
2021 |
| Federal Reserve Bank Stock |
|
$ |
1,180 |
|
|
$ |
1,161 |
|
| Federal Home Loan Bank Stock |
|
4,884 |
|
|
4,219 |
|
| Total Federal Reserve Bank and Federal Home Loan Bank Stock |
|
$ |
6,064 |
|
|
$ |
5,380 |
|
Note 5:LOANS (Dollars In Thousands)
Loan Categories and Past Due Loans
The following table presents loan balances outstanding as of December 31, 2022 and December 31, 2021 and an analysis of the recorded investment in loans that are past due at these dates. Loans held-for-sale of $656 and $1,154 as of December 31, 2022, and December 31, 2021, respectively, are included in the residential real estate balances for current loans.
|
|
|
|
|
|
|
|
|
|
|
|
|
|
|
|
|
|
|
|
|
|
|
|
|
|
|
|
|
|
| Schedule of Past Due Loans by Loan Category |
|
|
|
Commercial |
|
|
|
|
|
|
|
Commercial |
|
Real Estate |
|
Consumer |
|
Residential |
|
Total |
| December 31, 2022 |
|
|
|
|
|
|
|
|
|
| Loans Past Due 30-59 Days |
$ |
48 |
|
|
$ |
370 |
|
|
$ |
13,657 |
|
|
$ |
1,833 |
|
|
$ |
15,908 |
|
| Loans Past Due 60-89 Days |
33 |
|
|
— |
|
|
4,517 |
|
|
112 |
|
|
4,662 |
|
| Loans Past Due 90 or More Days |
44 |
|
|
— |
|
|
3,503 |
|
|
4,790 |
|
|
8,337 |
|
| Total Loans Past Due |
125 |
|
|
370 |
|
|
21,677 |
|
|
6,735 |
|
|
28,907 |
|
| Current Loans |
140,168 |
|
|
706,652 |
|
|
1,043,458 |
|
|
1,064,022 |
|
|
2,954,300 |
|
| Total Loans |
$ |
140,293 |
|
|
$ |
707,022 |
|
|
$ |
1,065,135 |
|
|
$ |
1,070,757 |
|
|
$ |
2,983,207 |
|
|
|
|
|
|
|
|
|
|
|
| December 31, 2021 |
|
|
|
|
|
|
|
|
|
| Loans Past Due 30-59 Days |
$ |
202 |
|
|
$ |
— |
|
|
$ |
6,713 |
|
|
$ |
107 |
|
|
$ |
7,022 |
|
| Loans Past Due 60-89 Days |
3 |
|
|
— |
|
|
2,709 |
|
|
2,557 |
|
|
5,269 |
|
| Loans Past Due 90 or More Days |
157 |
|
|
1,180 |
|
|
1,564 |
|
|
1,981 |
|
|
4,882 |
|
| Total Loans Past Due |
362 |
|
|
1,180 |
|
|
10,986 |
|
|
4,645 |
|
|
17,173 |
|
| Current Loans |
172,156 |
|
|
627,749 |
|
|
909,570 |
|
|
941,293 |
|
|
2,650,768 |
|
| Total Loans |
$ |
172,518 |
|
|
$ |
628,929 |
|
|
$ |
920,556 |
|
|
$ |
945,938 |
|
|
$ |
2,667,941 |
|
|
|
|
|
|
|
|
|
|
|
|
|
|
|
|
|
|
|
|
|
|
|
|
|
|
|
|
|
|
|
| Schedule of Non Accrual Loans by Category |
|
|
|
Commercial |
|
|
|
|
|
|
| December 31, 2022 |
Commercial |
|
Real Estate |
|
Consumer |
|
Residential |
|
Total |
Loans 90 or More Days Past Due
and Still Accruing Interest |
$ |
44 |
|
|
$ |
— |
|
|
$ |
— |
|
|
$ |
1,113 |
|
|
$ |
1,157 |
|
| Nonaccrual Loans |
8 |
|
|
3,110 |
|
|
3,503 |
|
|
4,136 |
|
|
10,757 |
|
| Nonaccrual With No Allowance for Credit Loss |
8 |
|
|
3,110 |
|
|
3,503 |
|
|
4,136 |
|
|
10,757 |
|
| Interest Income on Nonaccrual Loans |
— |
|
|
— |
|
|
— |
|
|
5 |
|
|
5 |
|
|
|
|
|
|
|
|
|
|
|
| December 31, 2021 |
|
|
|
|
|
|
|
|
|
Loans 90 or More Days Past Due
and Still Accruing Interest |
$ |
157 |
|
|
$ |
— |
|
|
$ |
— |
|
|
$ |
666 |
|
|
$ |
823 |
|
| Nonaccrual Loans |
34 |
|
|
7,243 |
|
|
1,697 |
|
|
1,790 |
|
|
10,764 |
|
Arrow disaggregates its loan portfolio into the following four categories:
Commercial - Arrow offers a variety of loan options to meet the specific needs of our commercial customers including term loans, time notes and lines of credit. Such loans are made available to businesses for working capital needs such as inventory and receivables, business expansion and equipment purchases. Generally, a collateral lien is placed on equipment or other assets owned by the borrower. Generally, these loans carry a higher risk than commercial real estate loans due to the nature of the underlying collateral, which can be business assets such as equipment and accounts receivable and generally have a lower liquidation value than real estate. In the event of default by the borrower, Arrow may be required to liquidate collateral at deeply discounted values. To reduce the risk, management usually obtains personal guarantees to support the borrowing, as permitted by applicable law.
Commercial Real Estate - Arrow offers commercial real estate loans to finance real estate purchases, refinancings, expansions and improvements to commercial properties. Commercial real estate loans are made to finance the purchases of real property which generally consists of real estate with completed structures. These commercial real estate loans are typically secured by first liens on the real estate, which may include apartments, commercial structures, housing businesses, healthcare facilities, and both owner and non owner-occupied facilities. These loans are typically less risky than commercial loans, since they are secured by real estate and buildings, and are generally originated in amounts of no more than 80% of the appraised value of the property. However, the Company also offers commercial construction and land development loans to finance projects. Many projects will ultimately be used by the borrowers' businesses, while others are developed for resale. These real estate loans are also typically secured by first liens on the real estate, which may include apartments, commercial structures, housing businesses, healthcare facilities and both owner-occupied and non-owner-occupied facilities.
There is enhanced risk during the construction period, since the loan is secured by an incomplete project.
Consumer Loans - This category is primarily comprised of automobile loans. Arrow primarily finances the purchases of automobiles indirectly through dealer relationships located throughout upstate New York and Vermont. Most automobile loans carry a fixed rate of interest with principal repayment terms typically ranging from three to seven years. Automobile loans are underwritten on a secured basis using the underlying collateral being financed. Arrow also offers a variety of consumer installment loans to finance personal expenditures. Most of these loans carry a fixed rate of interest with principal repayment terms typically ranging from one to five years, based upon the nature of the collateral and the size of the loan. In addition to installment loans, Arrow also offers personal lines of credit and overdraft protection. Several of these consumer loans are unsecured, which carry a higher risk of loss.
Residential - Residential real estate loans consist primarily of loans secured by first or second mortgages on primary residences. Arrow originates fixed-rate and adjustable-rate one-to-four-family residential real estate loans for the construction, purchase of real estate or refinancing of an existing mortgage. These loans are collateralized primarily by owner-occupied properties generally located in Arrow's market area. Loans on one-to-four-family residential real estate are generally originated in amounts of no more than 80% of the purchase price or appraised value (whichever is lower), or have private mortgage insurance. Arrow’s underwriting analysis for residential mortgage loans typically includes credit verification, independent appraisals, and a review of the borrower’s financial condition. Mortgage title insurance and hazard insurance are normally required. It is Arrow's general practice to underwrite residential real estate loans to secondary market standards. Construction loans have a unique risk, because they are secured by an incomplete dwelling. This risk is reduced through periodic site inspections, including one at each loan draw period. In addition, the Company offers fixed home equity loans, as well as home equity lines of credit to consumers to finance home improvements, debt consolidation, education and other uses. Arrow's policy allows for a maximum loan to value ratio of 80%, although periodically higher advances are allowed. Arrow originates home equity lines of credit and second mortgage loans (loans secured by a second junior lien position on one-to-four-family residential real estate). Risk is generally reduced through underwriting criteria, which include credit verification, appraisals, a review of the borrower's financial condition, and personal cash flows. A security interest, with title insurance when necessary, is taken in the underlying real estate.
Schedule of Supplemental Loan Information
|
|
|
|
|
|
|
|
|
|
|
|
|
2022 |
|
2021 |
Supplemental Information: |
|
|
|
Unamortized deferred loan origination costs, net of deferred loan
origination fees, included in the above balances |
$ |
6,774 |
|
|
$ |
5,179 |
|
| Overdrawn deposit accounts, included in the above balances |
298 |
|
|
182 |
|
| Pledged loans under a blanket collateral agreement to secure borrowings from the Federal Home Loan Bank of New York |
663,259 |
|
|
778,902 |
|
Residential real estate loans serviced for Freddie Mac, not included
in the balances above |
195,133 |
|
|
215,209 |
|
|
|
|
|
|
|
|
|
|
|
|
|
|
|
|
|
|
|
|
|
|
|
|
|
|
|
|
|
Allowance for Credit Losses
Loan segments were selected by call code and application code to ensure each segment is comprised of loans with homogenous loan characteristics and similar risk profiles. The resulting loan segments are commercial, commercial real estate, consumer and residential real estate loans. The consumer segment is mainly comprised of automobile loans, and since they are relatively short-term in nature, with similar dollar amounts and collateral, the vintage analysis method was selected to determine the credit loss reserve. The vintage method utilizes Arrow loan data exclusively as the method calculates a loss rate based on the total origination balance of the loans by year and the charge-off and recovery rate of the same origination year. Arrow maintains, over the life of the loan, the loss curve by vintage year. The discounted cash flow method (DCF) is used to calculate the reserve for credit losses for the commercial, commercial real estate and residential real estate segments.
The December 31, 2022 allowance for credit losses calculation incorporated a reasonable and supportable forecast period to account for economic conditions utilized in the measurement. The quantitative model utilized an economic forecast sourced from reputable third-parties that reflected economic decline with an increase of approximately 0.3% in the national unemployment rate during the six-quarter forecast period, while forecasted gross domestic product declined approximately 0.5%. The home price index forecast increased approximately 3.5% from the previous quarter level. Key assumptions utilized in the CECL calculation include loan segmentation, credit loss regression analysis, reasonable and supportable forecast period, reversion period, discounted cash flow inputs including economic forecast data and prepayment and curtailment speeds and qualitative factors. Key assumptions are reviewed and approved on a quarterly basis. Driven by current economic forecasts, loan growth and net charge offs during the year, the provision for credit losses in 2022 was $4.8 million. Management's evaluation considers the allowance for credit losses for loans to be appropriate as of December 31, 2022.
The following table details activity in the allowance for credit losses on loans for the twelve months ended December 31, 2022 and December 31, 2021
|
|
|
|
|
|
|
|
|
|
|
|
|
|
|
|
|
|
|
|
|
|
|
|
|
|
|
|
|
|
|
|
|
| Allowance for Credit Losses |
|
|
|
|
Commercial |
|
|
|
|
|
|
|
|
|
|
Commercial |
|
Real Estate |
|
Consumer |
|
Residential |
|
|
|
Total |
|
| Rollforward of the Allowance for Credit Losses for the Year Ended: |
|
|
|
|
|
|
|
|
|
|
|
|
|
|
|
|
|
|
|
|
|
|
|
|
| December 31, 2021 |
$ |
2,298 |
|
|
$ |
13,136 |
|
|
$ |
2,402 |
|
|
$ |
9,445 |
|
|
|
|
$ |
27,281 |
|
|
|
|
|
|
|
|
|
|
|
|
|
|
|
|
|
|
|
|
|
|
|
|
|
|
|
|
| Charge-offs |
(34) |
|
|
— |
|
|
(4,079) |
|
|
(30) |
|
|
|
|
(4,143) |
|
|
| Recoveries |
43 |
|
|
— |
|
|
1,973 |
|
|
— |
|
|
|
|
2,016 |
|
|
| Provision |
(346) |
|
|
2,077 |
|
|
2,289 |
|
|
778 |
|
|
|
|
4,798 |
|
|
| December 31, 2022 |
$ |
1,961 |
|
|
$ |
15,213 |
|
|
$ |
2,585 |
|
|
$ |
10,193 |
|
|
|
|
$ |
29,952 |
|
|
|
|
|
|
|
|
|
|
|
|
|
|
|
|
|
|
|
|
|
|
|
|
|
|
|
|
|
|
|
|
|
|
|
|
|
|
|
|
|
|
|
|
|
|
|
|
|
|
|
|
|
|
|
|
|
|
|
|
|
|
|
|
|
|
|
|
|
|
|
|
|
|
|
|
|
|
|
|
|
|
|
|
|
|
|
|
|
|
|
|
|
|
|
|
|
|
|
|
|
|
|
|
|
|
|
|
|
|
|
|
|
|
|
|
|
|
|
|
|
|
|
|
|
|
|
|
|
|
|
|
|
|
|
|
|
|
|
|
|
|
|
|
|
|
|
|
|
|
|
|
|
|
|
|
|
|
|
|
|
|
|
|
|
|
|
|
|
|
|
|
|
|
|
|
|
|
|
|
|
|
|
|
|
|
|
|
|
|
|
|
|
|
|
|
|
|
|
|
|
|
|
|
|
|
|
|
|
|
|
|
|
|
|
|
|
|
|
|
|
|
|
|
|
|
|
|
|
|
|
|
|
|
|
|
|
|
|
|
|
|
|
|
|
|
|
|
|
|
|
|
|
|
|
|
|
|
|
|
|
|
|
|
|
|
|
|
|
|
|
|
|
|
|
|
|
|
|
|
|
|
|
|
|
|
|
|
|
|
|
|
|
|
|
|
|
|
|
|
|
|
|
|
|
|
|
|
|
|
|
|
|
|
|
|
|
|
|
|
|
|
|
|
|
|
|
|
|
|
|
|
|
|
|
|
|
|
|
|
|
|
|
|
|
|
|
|
|
|
|
|
|
|
|
|
|
|
|
|
|
|
|
|
|
|
|
|
|
|
|
|
|
|
|
|
|
|
|
|
|
|
|
| December 31, 2020 |
$ |
2,173 |
|
|
$ |
9,990 |
|
|
$ |
11,562 |
|
|
$ |
5,507 |
|
|
|
|
$ |
29,232 |
|
| Impact of Adoption ASC 326 |
2,084 |
|
|
2,064 |
|
|
(9,383) |
|
|
3,935 |
|
|
|
|
(1,300) |
|
| Balance as of January 1, 2021 as adjusted for ASU 2016-13 |
4,257 |
|
|
12,054 |
|
|
2,179 |
|
|
9,442 |
|
|
|
|
27,932 |
|
| Charge-offs |
(98) |
|
|
— |
|
|
(2,132) |
|
|
(9) |
|
|
|
|
(2,239) |
|
| Recoveries |
190 |
|
|
— |
|
|
1,126 |
|
|
— |
|
|
|
|
1,316 |
|
| Provision |
(2,051) |
|
|
1,082 |
|
|
1,229 |
|
|
12 |
|
|
|
|
272 |
|
| December 31, 2021 |
$ |
2,298 |
|
|
$ |
13,136 |
|
|
$ |
2,402 |
|
|
$ |
9,445 |
|
|
|
|
$ |
27,281 |
|
|
|
|
|
|
|
|
|
|
|
|
|
|
|
|
|
|
|
|
|
|
|
|
|
|
|
|
|
|
|
|
|
|
|
|
|
|
|
|
|
|
|
|
|
|
|
|
|
|
|
|
|
|
|
|
|
|
|
|
|
|
|
|
|
|
|
|
|
|
|
|
|
|
|
|
|
|
|
|
|
|
|
|
|
Estimated Credit Losses on Off-Balance Sheet Credit Exposures Recognized as Other Liabilities
Financial instrument credit losses apply to off-balance sheet credit exposures such as unfunded loan commitments and standby letters of credit. A liability for expected credit losses for off-balance sheet exposures is recognized if the entity has a present contractual obligation to extend the credit and the obligation is not unconditionally cancellable by the entity. Changes in the allowance are reflected in other operating expenses within the non-interest expense category. As of December 31, 2022, the total unfunded commitment off-balance sheet credit exposure was $1.8 million.
Individually Evaluated Loans
All loans not included in the vintage analysis method that exceed $250,000, which are on nonaccrual status, are evaluated on an individual basis. Arrow made the policy election to apply a practical expedient for collateral dependent financial assets when the borrower is experiencing financial difficulty and the repayment is expected through the sale of the collateral. This allows Arrow to use fair value of the collateral at the reporting date adjusted for estimated cost to sell when recording the net carrying amount of the asset and determining the allowance for credit losses for a financial asset. In the event where the repayment of a collateral dependent financial asset is expected to be provided substantially through the operating of the collateral, Arrow will use fair value of the collateral at the reporting date when recording the net carrying amount of the asset and determining the allowance for credit losses. As of December 31, 2022, there were five total relationships identified to be evaluated for loss on an individual basis which had an amortized cost basis of $5.1 million and none had an allowance for credit loss.
The following tables present the amortized cost basis of collateral-dependent loans by class of loans as of December 31, 2022 and December 31, 2021:
|
|
|
|
|
|
|
|
|
|
|
|
|
|
|
|
|
|
| December 31, 2022 |
Collateral Type -Residential Real Estate |
|
Collateral Type - Commercial Real Estate |
|
Total Loans |
| Commercial |
$ |
— |
|
|
$ |
— |
|
|
$ |
— |
|
| Commercial Real Estate |
— |
|
|
3,110 |
|
|
3,110 |
|
| Consumer |
— |
|
|
— |
|
|
— |
|
| Residential |
1,963 |
|
|
— |
|
|
1,963 |
|
| Total |
$ |
1,963 |
|
|
$ |
3,110 |
|
|
$ |
5,073 |
|
|
|
|
|
|
|
|
|
|
|
|
|
|
|
|
|
|
|
| December 31, 2021 |
Collateral Type -Residential Real Estate |
|
Collateral Type - Commercial Real Estate |
|
Total Loans |
| Commercial |
$ |
— |
|
|
$ |
— |
|
|
$ |
— |
|
| Commercial Real Estate |
— |
|
|
6,732 |
|
|
6,732 |
|
| Consumer |
— |
|
|
— |
|
|
— |
|
| Residential |
673 |
|
|
— |
|
|
673 |
|
| Total |
$ |
673 |
|
|
$ |
6,732 |
|
|
$ |
7,405 |
|
|
|
|
|
|
|
|
|
|
|
|
|
|
|
|
|
|
|
|
|
|
|
|
|
|
|
|
|
|
|
|
|
| Allowance for Credit Losses - Collectively and Individually Evaluated |
|
Commercial |
|
Commercial Real Estate |
|
Consumer |
|
Residential |
|
|
|
Total |
| December 31, 2022 |
|
|
|
|
|
|
|
|
|
|
|
| Ending Loan Balance - Collectively Evaluated |
$ |
140,293 |
|
|
$ |
703,912 |
|
|
$ |
1,065,135 |
|
|
$ |
1,068,794 |
|
|
|
|
$ |
2,978,134 |
|
| Allowance for Credit Losses - Loans Collectively Evaluated |
1,961 |
|
|
15,213 |
|
|
2,585 |
|
|
10,193 |
|
|
|
|
29,952 |
|
|
|
|
|
|
|
|
|
|
|
|
|
| Ending Loan Balance - Individually Evaluated |
— |
|
|
3,110 |
|
|
— |
|
|
1,963 |
|
|
|
|
5,073 |
|
| Allowance for Credit Losses - Loans Individually Evaluated |
— |
|
|
— |
|
|
— |
|
|
— |
|
|
|
|
— |
|
|
|
|
|
|
|
|
|
|
|
|
|
|
|
|
|
|
|
|
|
|
|
|
|
|
|
|
|
|
|
|
|
|
|
Commercial |
|
Commercial Real Estate |
|
Consumer |
|
Residential |
|
|
|
Total |
| December 31, 2021 |
|
|
|
|
|
|
|
|
|
|
|
| Ending Loan Balance - Collectively Evaluated for Impairment |
$ |
172,518 |
|
|
$ |
622,197 |
|
|
$ |
920,556 |
|
|
$ |
945,265 |
|
|
|
|
$ |
2,660,536 |
|
| Allowance for Loan Losses - Loans Collectively Evaluated for Impairment |
2,298 |
|
|
12,537 |
|
|
2,402 |
|
|
9,445 |
|
|
|
|
$ |
26,682 |
|
| Ending Loan Balance - Individually Evaluated for Impairment |
— |
|
|
6,732 |
|
|
— |
|
|
673 |
|
|
|
|
7,405 |
|
| Allowance for Loan Losses - Loans Individually Evaluated for Impairment |
— |
|
|
599 |
|
|
— |
|
|
— |
|
|
|
|
599 |
|
|
|
|
|
|
|
|
|
|
|
|
|
|
|
|
|
|
|
|
|
|
|
|
|
|
|
|
|
|
|
|
|
|
|
|
|
|
|
|
|
|
|
|
|
|
|
|
|
|
|
|
|
|
|
|
|
|
|
|
|
|
|
|
|
|
|
|
|
|
|
|
|
|
|
|
|
|
|
|
|
|
|
|
|
Through the provision for credit losses, an allowance for credit losses is maintained that reflects the best estimate of the calculated expected credit losses in Arrow's loan portfolio as of the balance sheet date. Additions are made to the allowance for credit losses through a periodic provision for credit losses. Actual credit losses are charged against the allowance for credit losses when loans are deemed uncollectible and recoveries of amounts previously charged off are recorded as credits to the allowance for credit losses.
Arrow's loan officers and risk managers meet at least quarterly to discuss and review the conditions and risks associated with certain criticized and classified commercial-related relationships. In addition, the independent internal loan review department performs periodic reviews of the credit quality indicators on individual loans in the commercial loan portfolio.
Management considers the need to qualitatively adjust expected credit loss estimates for information not already captured in the loss estimation process. These qualitative factor adjustments may increase or decrease management’s estimate of expected credit losses. Adjustments are not made for information that has already been considered and included in the loss estimation process.
Management considers the qualitative factors that are relevant to Arrow as of the reporting date, which may include, but are not limited to the following factors:
•The nature and volume of Arrow's financial assets;
•The existence, growth, and effect of any concentrations of credit;
•The volume and severity of past due loans, the volume of nonaccrual loans, and the volume and severity of adversely classified or graded loans;
•The value of the underlying collateral for loans that are not collateral-dependent;
•Arrow's lending policies and procedures, including changes in underwriting standards and practices for collections, write-offs, and recoveries;
•The quality of Arrow's loan review function;
•The experience, ability, and depth of Arrow's lending, investment, collection, and other relevant management/staff;
•The effect of other external factors such as the regulatory, legal and technological environments; competition; and events such as natural disasters;
•Actual and expected changes in international, national, regional, and local economic and business conditions and developments in which the institution operates that affect the collectability of financial assets; and
•Other qualitative factors not reflected in quantitative loss rate calculations.
Loan Credit Quality Indicators
The following table presents credit quality indicators by total loans amortized cost basis by origination year as of December 31, 2022 and December 31, 2021:
|
|
|
|
|
|
|
|
|
|
|
|
|
|
|
|
|
|
|
|
|
|
|
|
|
|
|
|
|
|
|
Term Loans Amortized Cost Basis by Origination Year |
Revolving Loans Amortized Cost Basis |
Revolving Loan Converted to Term |
Total |
| December 31, 2022 |
2022 |
2021 |
2020 |
2019 |
2018 |
Prior |
| Commercial: |
|
|
|
|
|
|
|
|
|
| Risk rating |
|
|
|
|
|
|
|
|
|
| Satisfactory |
$ |
42,038 |
|
$ |
28,718 |
|
$ |
16,870 |
|
$ |
7,857 |
|
$ |
8,129 |
|
$ |
20,379 |
|
$ |
8,909 |
|
$ |
— |
|
$ |
132,900 |
|
| Special mention |
— |
|
— |
|
— |
|
— |
|
— |
|
30 |
|
30 |
|
— |
|
60 |
|
| Substandard |
— |
|
— |
|
255 |
|
478 |
|
— |
|
3,464 |
|
3,136 |
|
— |
|
7,333 |
|
| Doubtful |
— |
|
— |
|
— |
|
— |
|
— |
|
— |
|
— |
|
— |
|
— |
|
| Total Commercial Loans |
$ |
42,038 |
|
$ |
28,718 |
|
$ |
17,125 |
|
$ |
8,335 |
|
$ |
8,129 |
|
$ |
23,873 |
|
$ |
12,075 |
|
$ |
— |
|
$ |
140,293 |
|
|
|
|
|
|
|
|
|
|
|
| Commercial Real Estate: |
|
|
|
|
|
|
|
|
|
| Risk rating |
|
|
|
|
|
|
|
|
|
| Satisfactory |
$ |
152,858 |
|
$ |
115,111 |
|
$ |
121,811 |
|
$ |
43,647 |
|
$ |
63,913 |
|
$ |
159,876 |
|
$ |
1,603 |
|
$ |
— |
|
$ |
658,819 |
|
| Special mention |
9,678 |
|
— |
|
— |
|
— |
|
789 |
|
241 |
|
— |
|
— |
|
10,708 |
|
| Substandard |
607 |
|
— |
|
5,807 |
|
812 |
|
4,371 |
|
25,677 |
|
221 |
|
— |
|
37,495 |
|
| Doubtful |
— |
|
— |
|
— |
|
— |
|
— |
|
— |
|
— |
|
— |
|
— |
|
| Total Commercial Real Estate Loans |
$ |
163,143 |
|
$ |
115,111 |
|
$ |
127,618 |
|
$ |
44,459 |
|
$ |
69,073 |
|
$ |
185,794 |
|
$ |
1,824 |
|
$ |
— |
|
$ |
707,022 |
|
|
|
|
|
|
|
|
|
|
|
| Consumer: |
|
|
|
|
|
|
|
|
|
| Risk rating |
|
|
|
|
|
|
|
|
|
| Performing |
$ |
482,530 |
|
$ |
284,831 |
|
$ |
154,819 |
|
$ |
88,165 |
|
$ |
38,852 |
|
$ |
12,032 |
|
$ |
504 |
|
$ |
— |
|
$ |
1,061,733 |
|
| Nonperforming |
758 |
|
1,468 |
|
607 |
|
325 |
|
157 |
|
87 |
|
— |
|
— |
|
3,402 |
|
| Total Consumer Loans |
$ |
483,288 |
|
$ |
286,299 |
|
$ |
155,426 |
|
$ |
88,490 |
|
$ |
39,009 |
|
$ |
12,119 |
|
$ |
504 |
|
$ |
— |
|
$ |
1,065,135 |
|
|
|
|
|
|
|
|
|
|
|
| Residential: |
|
|
|
|
|
|
|
|
|
| Risk rating |
|
|
|
|
|
|
|
|
|
| Performing |
$ |
210,565 |
|
$ |
198,195 |
|
$ |
128,372 |
|
$ |
82,965 |
|
$ |
74,281 |
|
$ |
259,787 |
|
$ |
111,563 |
|
$ |
— |
|
$ |
1,065,728 |
|
| Nonperforming |
— |
|
255 |
|
939 |
|
597 |
|
520 |
|
2,311 |
|
407 |
|
— |
|
5,029 |
|
| Total Residential Loans |
$ |
210,565 |
|
$ |
198,450 |
|
$ |
129,311 |
|
$ |
83,562 |
|
$ |
74,801 |
|
$ |
262,098 |
|
$ |
111,970 |
|
$ |
— |
|
$ |
1,070,757 |
|
|
|
|
|
|
|
|
|
|
|
| Total Loans |
$ |
899,034 |
|
$ |
628,578 |
|
$ |
429,480 |
|
$ |
224,846 |
|
$ |
191,012 |
|
$ |
483,884 |
|
$ |
126,373 |
|
$ |
— |
|
$ |
2,983,207 |
|
|
|
|
|
|
|
|
|
|
|
|
|
|
|
|
|
|
|
|
|
|
|
|
|
|
|
|
|
|
|
|
Term Loans Amortized Cost Basis by Origination Year |
Revolving Loans Amortized Cost Basis |
Revolving Loan Converted to Term |
Total |
| December 31, 2021 |
2021 |
2020 |
2019 |
2018 |
2017 |
Prior |
| Commercial: |
|
|
|
|
|
|
|
|
|
| Risk rating |
|
|
|
|
|
|
|
|
|
| Satisfactory |
$ |
75,615 |
|
$ |
35,522 |
|
$ |
11,591 |
|
$ |
11,661 |
|
$ |
7,792 |
|
$ |
3,442 |
|
$ |
12,783 |
|
$ |
— |
|
$ |
158,406 |
|
| Special mention |
— |
|
— |
|
3 |
|
— |
|
— |
|
5,899 |
|
— |
|
— |
|
5,902 |
|
| Substandard |
3,541 |
|
3,791 |
|
589 |
|
— |
|
25 |
|
12 |
|
252 |
|
— |
|
8,210 |
|
| Doubtful |
— |
|
— |
|
— |
|
— |
|
— |
|
— |
|
— |
|
— |
|
— |
|
| Total Commercial Loans |
$ |
79,156 |
|
$ |
39,313 |
|
$ |
12,183 |
|
$ |
11,661 |
|
$ |
7,817 |
|
$ |
9,353 |
|
$ |
13,035 |
|
$ |
— |
|
$ |
172,518 |
|
|
|
|
|
|
|
|
|
|
|
| Commercial Real Estate: |
|
|
|
|
|
|
|
|
|
| Risk rating |
|
|
|
|
|
|
|
|
|
| Satisfactory |
$ |
140,636 |
|
$ |
276,461 |
|
$ |
42,369 |
|
$ |
37,997 |
|
$ |
22,155 |
|
$ |
59,698 |
|
$ |
1,923 |
|
$ |
— |
|
$ |
581,239 |
|
| Special mention |
— |
|
7,893 |
|
1,204 |
|
— |
|
137 |
|
1,906 |
|
— |
|
— |
|
11,140 |
|
| Substandard |
7,248 |
|
16,405 |
|
3,910 |
|
96 |
|
— |
|
8,867 |
|
24 |
|
— |
|
36,550 |
|
| Doubtful |
— |
|
— |
|
— |
|
— |
|
— |
|
— |
|
— |
|
— |
|
— |
|
| Total Commercial Real Estate Loans |
$ |
147,884 |
|
$ |
300,759 |
|
$ |
47,483 |
|
$ |
38,093 |
|
$ |
22,292 |
|
$ |
70,471 |
|
$ |
1,947 |
|
$ |
— |
|
$ |
628,929 |
|
|
|
|
|
|
|
|
|
|
|
| Consumer: |
|
|
|
|
|
|
|
|
|
| Risk rating |
|
|
|
|
|
|
|
|
|
| Performing |
$ |
402,558 |
|
$ |
239,492 |
|
$ |
154,517 |
|
$ |
82,673 |
|
$ |
29,587 |
|
$ |
9,578 |
|
$ |
455 |
|
$ |
— |
|
$ |
918,860 |
|
| Nonperforming |
388 |
|
399 |
|
502 |
|
151 |
|
160 |
|
96 |
|
— |
|
— |
|
1,696 |
|
| Total Consumer Loans |
$ |
402,946 |
|
$ |
239,891 |
|
$ |
155,019 |
|
$ |
82,824 |
|
$ |
29,747 |
|
$ |
9,674 |
|
$ |
455 |
|
$ |
— |
|
$ |
920,556 |
|
|
|
|
|
|
|
|
|
|
|
| Residential: |
|
|
|
|
|
|
|
|
|
| Risk rating |
|
|
|
|
|
|
|
|
|
| Performing |
$ |
187,708 |
|
$ |
146,113 |
|
$ |
93,547 |
|
$ |
88,505 |
|
$ |
93,524 |
|
$ |
215,679 |
|
$ |
118,595 |
|
$ |
— |
|
$ |
943,671 |
|
| Nonperforming |
— |
|
133 |
|
— |
|
27 |
|
162 |
|
1,907 |
|
38 |
|
— |
|
2,267 |
|
| Total Residential Loans |
$ |
187,708 |
|
$ |
146,246 |
|
$ |
93,547 |
|
$ |
88,532 |
|
$ |
93,686 |
|
$ |
217,586 |
|
$ |
118,633 |
|
$ |
— |
|
$ |
945,938 |
|
|
|
|
|
|
|
|
|
|
|
| Total Loans |
$ |
817,694 |
|
$ |
726,209 |
|
$ |
308,232 |
|
$ |
221,110 |
|
$ |
153,542 |
|
$ |
307,084 |
|
$ |
134,070 |
|
$ |
— |
|
$ |
2,667,941 |
|
For the purposes of the table above, nonperforming consumer and residential loans were those loans on nonaccrual status or are 90 days or more past due and still accruing interest.
The recorded investment of consumer mortgage loans secured by residential real estate properties for which formal foreclosure proceedings are in process is $3.2 million.
For the allowance calculation, an internally developed system of five credit quality indicators is used to rate the credit worthiness of each commercial loan defined as follows:
1) Satisfactory - "Satisfactory" borrowers have acceptable financial condition with satisfactory record of earnings and sufficient historical and projected cash flow to service the debt. Borrowers have satisfactory repayment histories and primary and secondary sources of repayment can be clearly identified;
2) Special Mention - Loans in this category have potential weaknesses that deserve management’s close attention. If left uncorrected, these potential weaknesses may result in deterioration of the repayment prospects for the asset or in the institution’s credit position at some future date. "Special mention" assets are not adversely classified and do not expose an institution to sufficient risk to warrant adverse classification. Loans which might be assigned this credit quality indicator include loans to borrowers with deteriorating financial strength and/or earnings record and loans with potential for problems due to weakening economic or market conditions;
3) Substandard - Loans classified as “substandard” are inadequately protected by the current sound net worth or paying capacity of the borrower or the collateral pledged, if any. Loans in this category have well defined weaknesses that jeopardize the repayment. They are characterized by the distinct possibility that the Company will sustain some loss if the deficiencies are not corrected. “Substandard” loans may include loans which are likely to require liquidation of collateral to effect repayment, and other loans where character or ability to repay has become suspect. Loss potential, while existing in the aggregate amount of substandard assets, does not have to exist in individual assets classified substandard;
4) Doubtful - Loans classified as “doubtful” have all of the weaknesses inherent in those classified as “substandard” with the added characteristic that the weaknesses make collection or liquidation in full, on the basis of current existing facts, conditions, and values, highly questionable and improbable.
Although possibility of loss is extremely high, classification of these loans as “loss” has been deferred due to specific pending factors or events which may strengthen the value (e.g. possibility of additional collateral, injection of capital, collateral liquidation, debt restructure, economic recovery, etc). Loans classified as “doubtful” need to be placed on non-accrual; and
5) Loss - Loans classified as “loss” are considered uncollectible with collateral of such little value that their continuance as bankable assets is not warranted. As of the date of the balance sheet, all loans in this category have been charged-off to the allowance for credit losses.
Commercial loans are generally evaluated on an annual basis depending on the size and complexity of the loan relationship, unless the credit related quality indicator falls to a level of "special mention" or below, when the loan is evaluated quarterly. The credit quality indicator is one of the factors used in assessing the level of incurred risk of loss in our commercial related loan portfolios.
Loans Modified in Trouble Debt Restructurings
The following table presents information on loans modified in trouble debt restructurings during the periods indicated:
|
|
|
|
|
|
|
|
|
|
|
|
|
|
|
|
|
|
|
|
|
|
|
|
|
|
|
|
|
|
| Loans Modified in Trouble Debt Restructurings During the Period |
|
|
|
Commercial |
|
|
|
|
|
|
|
Commercial |
|
Real Estate |
|
Consumer |
|
Residential |
|
Total |
| For the Year Ended: |
|
|
|
|
|
|
|
|
|
| December 31, 2022 |
|
|
|
|
|
|
|
|
|
| Number of Loans |
— |
|
|
— |
|
|
3 |
|
|
— |
|
|
3 |
|
| Pre-Modification Outstanding Recorded Investment |
$ |
— |
|
|
$ |
— |
|
|
$ |
28 |
|
|
$ |
— |
|
|
$ |
28 |
|
| Post-Modification Outstanding Recorded Investment |
— |
|
|
— |
|
|
28 |
|
|
— |
|
|
28 |
|
| Subsequent Default, Number of Contracts |
— |
|
|
— |
|
|
— |
|
|
— |
|
|
— |
|
| Subsequent Default, Recorded Investment |
— |
|
|
— |
|
|
— |
|
|
— |
|
|
— |
|
| Commitments to lend additional funds to modified loans |
— |
|
|
— |
|
|
— |
|
|
— |
|
|
— |
|
|
|
|
|
|
|
|
|
|
|
| December 31, 2021 |
|
|
|
|
|
|
|
|
|
| Number of Loans |
— |
|
|
— |
|
|
1 |
|
|
— |
|
|
1 |
|
| Pre-Modification Outstanding Recorded Investment |
$ |
— |
|
|
$ |
— |
|
|
$ |
16 |
|
|
$ |
— |
|
|
$ |
16 |
|
| Post-Modification Outstanding Recorded Investment |
— |
|
|
— |
|
|
16 |
|
|
— |
|
|
16 |
|
| Subsequent Default, Number of Contracts |
— |
|
|
— |
|
|
— |
|
|
— |
|
|
— |
|
| Subsequent Default, Recorded Investment |
— |
|
|
— |
|
|
— |
|
|
— |
|
|
— |
|
| Commitments to lend additional funds to modified loans |
— |
|
|
— |
|
|
— |
|
|
— |
|
|
— |
|
|
|
|
|
|
|
|
|
|
|
|
|
|
|
|
|
|
|
|
|
|
|
|
|
|
|
|
|
|
|
|
|
|
|
|
|
|
|
|
|
|
|
|
|
|
|
|
|
|
|
|
|
|
|
|
|
|
|
|
|
|
|
|
|
|
|
|
|
|
|
|
|
|
|
|
|
|
|
|
|
In general, currently and prior to the COVID-19 pandemic, loans requiring modification were restructured to accommodate the projected cash-flows of the borrower. Such modifications may involve a reduction of the interest rate, a significant deferral of payments or forgiveness of a portion of the outstanding principal balance. As indicated in the table above, no loans modified during the preceding twelve months subsequently defaulted as of December 31, 2022 or December 31, 2021.
Note 6:PREMISES AND EQUIPMENT (Dollars In Thousands)
A summary of premises and equipment at December 31, 2022 and 2021 is presented below:
|
|
|
|
|
|
|
|
|
|
|
|
|
2022 |
|
2021 |
| Land and Bank Premises |
$ |
41,295 |
|
|
$ |
40,848 |
|
| Equipment, Furniture and Fixtures |
50,962 |
|
|
38,496 |
|
| Leasehold Improvements |
5,083 |
|
|
4,410 |
|
| Total Cost |
97,340 |
|
|
83,754 |
|
| Accumulated Depreciation and Amortization |
(45,486) |
|
|
(42,351) |
|
| Net Owned Premises and Equipment |
51,854 |
|
|
41,403 |
|
| Leased Assets (see Note 18) |
4,637 |
|
|
4,814 |
|
| Net Premises and Equipment |
$ |
56,491 |
|
|
$ |
46,217 |
|
Amounts charged to expense for depreciation totaled $3,330, $2,993 and $2,758 in 2022, 2021 and 2020, respectively.
Note 7:OTHER INTANGIBLE ASSETS (Dollars In Thousands)
The following table presents information on Arrow’s other intangible assets (other than goodwill) as of December 31, 2022, 2021 and 2020:
|
|
|
|
|
|
|
|
|
|
|
|
|
|
|
|
|
|
|
|
|
|
|
|
|
Depositor
Intangibles |
|
Mortgage
Servicing
Rights1
|
|
Customer Intangibles2 |
|
Total |
Gross Carrying Amount, December 31, 2022 |
$ |
2,247 |
|
|
$ |
3,296 |
|
|
$ |
4,382 |
|
|
$ |
9,925 |
|
| Accumulated Amortization |
(2,247) |
|
|
(2,511) |
|
|
(3,667) |
|
|
(8,425) |
|
Net Carrying Amount, December 31, 2022 |
$ |
— |
|
|
$ |
785 |
|
|
$ |
715 |
|
|
$ |
1,500 |
|
Gross Carrying Amount, December 31, 2021 |
$ |
2,247 |
|
|
$ |
3,286 |
|
|
$ |
4,382 |
|
|
$ |
9,915 |
|
| Accumulated Amortization |
(2,247) |
|
|
(2,276) |
|
|
(3,474) |
|
|
(7,997) |
|
Net Carrying Amount, December 31, 2021 |
$ |
— |
|
|
$ |
1,010 |
|
|
$ |
908 |
|
|
$ |
1,918 |
|
|
|
|
|
|
|
|
|
| Rollforward of Intangible Assets: |
|
|
|
|
|
|
|
Balance, December 31, 2019 |
$ |
— |
|
|
$ |
316 |
|
|
$ |
1,345 |
|
|
$ |
1,661 |
|
| Intangible Assets Acquired |
— |
|
|
621 |
|
|
— |
|
|
621 |
|
| Intangible Assets Disposed |
— |
|
|
— |
|
|
— |
|
|
— |
|
| Amortization of Intangible Assets |
— |
|
|
(105) |
|
|
(227) |
|
|
(332) |
|
Balance, December 31, 2020 |
— |
|
|
832 |
|
|
1,118 |
|
|
1,950 |
|
| Intangible Assets Acquired |
— |
|
|
436 |
|
|
— |
|
|
436 |
|
| Intangible Assets Disposed |
— |
|
|
— |
|
|
— |
|
|
— |
|
| Amortization of Intangible Assets |
— |
|
|
(258) |
|
|
(210) |
|
|
(468) |
|
Balance, December 31, 2021 |
— |
|
|
1,010 |
|
|
908 |
|
|
1,918 |
|
| Intangible Assets Acquired |
— |
|
|
10 |
|
|
— |
|
|
10 |
|
| Intangible Assets Disposed |
— |
|
|
— |
|
|
— |
|
|
— |
|
| Amortization of Intangible Assets |
— |
|
|
(235) |
|
|
(193) |
|
|
(428) |
|
Balance, December 31, 2022 |
$ |
— |
|
|
$ |
785 |
|
|
$ |
715 |
|
|
$ |
1,500 |
|
1 Amortization of mortgage servicing rights is reported in the Consolidated Statements of Income as a reduction of mortgage servicing fee income, which is included with fees for other services to customers.
2 Amortization of customer intangibles are reported in the Consolidated Statements of Income as a component of other operating expense.
The following table presents the remaining estimated annual amortization expense for Arrow's intangible assets as of December 31, 2022:
|
|
|
|
|
|
|
|
|
|
|
|
|
|
|
|
|
|
|
|
|
|
|
Mortgage
Servicing Rights |
|
Customer Intangibles |
|
Total |
| Estimated Annual Amortization Expense: |
|
|
|
|
|
|
| 2023 |
|
$ |
215 |
|
|
$ |
176 |
|
|
$ |
391 |
|
| 2024 |
|
206 |
|
|
155 |
|
|
361 |
|
| 2025 |
|
195 |
|
|
107 |
|
|
302 |
|
| 2026 |
|
144 |
|
|
89 |
|
|
233 |
|
| 2027 |
|
25 |
|
|
72 |
|
|
97 |
|
| 2028 and beyond |
|
— |
|
|
116 |
|
|
116 |
|
| Total |
|
$ |
785 |
|
|
$ |
715 |
|
|
$ |
1,500 |
|
Note 8:COMMITMENTS AND CONTINGENCIES (Dollars In Thousands)
The following table presents the notional amount and fair value of Arrow's off-balance sheet commitments to extend credit and commitments under standby letters of credit as of December 31, 2022 and 2021:
|
|
|
|
|
|
|
|
|
|
|
|
| Balance at December 31, |
2022 |
|
2021 |
| Notional Amount: |
|
|
|
| Commitments to Extend Credit |
$ |
424,197 |
|
|
$ |
402,280 |
|
| Standby Letters of Credit |
3,627 |
|
|
3,223 |
|
| Fair Value: |
|
|
|
| Commitments to Extend Credit |
$ |
— |
|
|
$ |
— |
|
| Standby Letters of Credit |
2 |
|
|
24 |
|
Arrow is party to financial instruments with off-balance sheet risk in the normal course of business to meet the financing needs of its customers. These financial instruments include commitments to extend credit and standby letters of credit. Commitments to extend credit include home equity lines of credit, commitments for residential and commercial construction loans and other personal and commercial lines of credit. Those instruments involve, to varying degrees, elements of credit and interest rate risk in excess of the amount recognized in the consolidated balance sheets. The contract or notional amounts of those instruments reflect the extent of the involvement Arrow has in particular classes of financial instruments.
Arrow's exposure to credit loss in the event of nonperformance by the other party to the financial instrument for commitments to extend credit and standby letters of credit is represented by the contractual notional amount of those instruments. Arrow uses the same credit policies in making commitments and conditional obligations as it does for on-balance sheet instruments.
Commitments to extend credit are agreements to lend to a customer as long as there is no violation of any condition established in the contract. Commitments generally have fixed expiration dates or other termination clauses and may require payment of a fee. Since many of the commitments are expected to expire without being drawn upon, the total commitment amounts do not necessarily represent future cash requirements. Arrow evaluates each customer's creditworthiness on a case-by-case basis. Home equity lines of credit are secured by residential real estate. Construction lines of credit are secured by underlying real estate. For other lines of credit, the amount of collateral obtained, if deemed necessary by Arrow upon extension of credit, is based on management's credit evaluation of the counterparty. Collateral held varies, but may include accounts receivable, inventory, property, plant and equipment, and income-producing commercial properties. Most of the commitments are variable rate instruments.
Arrow does not issue any guarantees that would require liability-recognition or disclosure, other than its standby letters of credit. Arrow has issued conditional commitments in the form of standby letters of credit to guarantee payment on behalf of a customer and guarantee the performance of a customer to a third party. Standby letters of credit generally arise in connection with lending relationships. The credit risk involved in issuing these instruments is essentially the same as that involved in extending loans to customers. Contingent obligations under standby letters of credit at December 31, 2022 and 2021 represent the maximum potential future payments Arrow could be required to make. Typically, these instruments have terms of 12 months or less and expire unused; therefore, the total amounts do not necessarily represent future cash requirements. Each customer is evaluated individually for creditworthiness under the same underwriting standards used for commitments to extend credit and on-balance sheet instruments. Company policies governing loan collateral apply to standby letters of credit at the time of credit extension. Loan-to-value ratios will generally range from 50% for movable assets, such as inventory, to 100% for liquid assets, such as bank CD's. Fees for standby letters of credit range from 1% to 3% of the notional amount. Fees are collected upfront and amortized over the life of the commitment. The carrying amount and fair value of Arrow's standby letters of credit at December 31, 2022 and 2021 were insignificant. The fair value of standby letters of credit is based on the fees currently charged for similar agreements or the cost to terminate the arrangement with the counterparties.
The fair value of commitments to extend credit is determined by estimating the fees to enter into similar agreements, taking into account the remaining terms and present creditworthiness of the counterparties, and for fixed rate loan commitments, the difference between the current and committed interest rates. Arrow provides several types of commercial lines of credit and standby letters of credit to its commercial customers. The pricing of these services is not isolated as Arrow considers the customer's complete deposit and borrowing relationship in pricing individual products and services. The commitments to extend credit also include commitments under home equity lines of credit, for which Arrow charges no fee. The carrying value and fair value of commitments to extend credit are not material and Arrow does not expect to incur any material loss as a result of these commitments.
In the normal course of business, Arrow and its subsidiary banks become involved in a variety of routine legal proceedings. At present, there are no legal proceedings pending or threatened, which in the opinion of management and counsel, would result in a material loss to Arrow, except as noted below.
Except as noted below, Arrow, including its subsidiary banks, is not currently the subject of any material pending legal proceedings, other than ordinary routine litigation occurring in the normal course of their business. On an ongoing basis, Arrow is often the subject of, or a party to, various legal claims by other parties against Arrow, by Arrow against other parties, or involving Arrow, which arise in the normal course of business. Except as noted below, the various pending legal claims against Arrow will not, in the opinion of management based upon consultation with counsel, result in any material liability.
On July 1, 2020, Daphne Richard, a customer of GFNB, filed a putative class action complaint against GFNB. The complaint alleged that GFNB assessed overdraft fees on certain transactions drawn on Ms. Richard’s checking account without having sufficiently disclosed its overdraft-fee practices in its account agreement. Ms. Richard, on behalf of two purported classes, sought compensatory damages, disgorgement of profits, statutory damages, treble damages, enjoinment of the conduct complained of, and costs and fees. The complaint was similar to complaints filed against other financial institutions pertaining to overdraft fees. The case has been settled, and the court has granted final approval of the settlement’s terms. The settlement, which includes and releases Arrow, GFNB, and SNB (collectively, “Defendants”), requires the Defendants to establish a $1.475 million settlement fund, among other terms. By March 31, 2023, Arrow informed the court how the settlement funds were distributed, and the plaintiff's attorney filed the Final Report Regarding Status of Disbursements. Arrow received notice that the case has been closed.
Note 9:TIME DEPOSITS (Dollars In Thousands)
The following summarizes the contractual maturities of time deposits during years subsequent to December 31, 2022:
|
|
|
|
|
|
|
|
|
| Year of Maturity |
|
Total Time
Deposits |
| 2023 |
|
$ |
145,253 |
|
| 2024 |
|
42,462 |
|
| 2025 |
|
13,166 |
|
| 2026 |
|
4,263 |
|
| 2027 |
|
4,291 |
|
| 2028 and beyond |
|
— |
|
| Total |
|
$ |
209,435 |
|
Note 10:DEBT (Dollars in Thousands)
Schedule of Short-Term Borrowings:
|
|
|
|
|
|
|
|
|
|
|
|
|
2022 |
|
2021 |
| Balances at December 31: |
|
|
|
| Overnight Advances from the Federal Home Loan Bank of New York |
27,000 |
|
|
— |
|
|
|
|
|
| Total Short-Term Borrowings |
$ |
27,000 |
|
|
$ |
— |
|
|
|
|
|
| Maximum Borrowing Capacity at December 31: |
|
|
|
| Federal Funds Purchased |
$ |
52,000 |
|
|
$ |
52,000 |
|
| Federal Home Loan Bank of New York |
663,259 |
|
|
778,902 |
|
| Federal Reserve Bank of New York |
649,112 |
|
|
594,034 |
|
|
|
|
|
| Available Borrowing Capacity at December 31: |
|
|
|
| Federal Funds Purchased |
$ |
52,000 |
|
|
$ |
52,000 |
|
| Federal Home Loan Bank of New York |
608,458 |
|
|
733,902 |
|
| Federal Reserve Bank of New York |
649,112 |
|
|
594,034 |
|
Arrow's subsidiary banks have in place unsecured federal funds lines of credit with two correspondent banks. As a member of the FHLBNY, Arrow participates in the advance program which allows for overnight and term advances up to the limit of pledged collateral, including FHLBNY stock and any loans secured by real estate such as commercial real estate, residential real estate and home equity loans (see Notes 4: Investment Securities, and 5: Loans to the Consolidated Financial Statements). The maximum borrowing capacities at the FHLBNY and FRB are determined based on the fair value of the collateral pledged, subject to discounts determined by the respective lenders. As of December 31, 2022, the carrying cost for the FHLBNY collateral was approximately $899 million and approximately $939 million for the FRB. As of December 31, 2022, the fair value for the FHLBNY collateral was approximately $800 million and approximately $890 million for the FRB. The investment in FHLBNY stock is proportional to the total of Arrow's overnight and term advances (see the Schedule of Federal Reserve Bank and Federal Home Loan Bank Stock in Note 4, Investment Securities, to the Consolidated Financial Statements). Arrow's bank subsidiaries have also established borrowing facilities with the Federal Reserve Bank of New York for potential “discount window” advances, pledging certain consumer loans as collateral (see Note 5, Loans, to the Consolidated Financial Statements).
Long Term Debt - FHLBNY Term Advances
In addition to overnight advances, Arrow also borrows longer-term funds from the FHLBNY.
Maturity Schedule of FHLBNY Term Advances:
|
|
|
|
|
|
|
|
|
|
|
|
|
|
|
|
|
|
|
|
|
|
|
|
|
|
|
|
|
Balances |
|
Weighted Average Rate |
|
|
|
|
|
|
|
|
|
| Final Maturity |
|
2022 |
|
2021 |
|
2022 |
|
2021 |
| First Year |
|
$ |
27,800 |
|
|
$ |
5,000 |
|
|
2.70 |
% |
|
1.81 |
% |
| Second Year |
|
— |
|
|
20,000 |
|
|
— |
% |
|
1.75 |
% |
| Third Year |
|
— |
|
|
20,000 |
|
|
— |
% |
|
1.76 |
% |
| Fourth Year |
|
— |
|
|
— |
|
|
— |
% |
|
— |
% |
| Fifth Year |
|
— |
|
|
— |
|
|
— |
% |
|
— |
% |
| Total |
|
$ |
27,800 |
|
|
$ |
45,000 |
|
|
2.70 |
% |
|
1.77 |
% |
Long Term Debt - Guaranteed Preferred Beneficial Interests in Corporation's Junior Subordinated Debentures
During 2022, there were outstanding two classes of financial instruments issued by two separate subsidiary business trusts of Arrow, identified as “Junior Subordinated Obligations Issued to Unconsolidated Subsidiary Trusts” on the Consolidated Balance Sheets and the Consolidated Statements of Income.
The first of the two classes of trust-issued instruments outstanding at year-end was issued by Arrow Capital Statutory Trust II ("ACST II"), a Delaware business trust established on July 16, 2003, upon the filing of a certificate of trust with the Delaware Secretary of State. In July 2003, ACST II issued all of its voting (common) stock to Arrow and issued and sold to an unaffiliated purchaser 30-year guaranteed preferred beneficial interests in the trust's assets ("ACST II trust preferred securities"). The rate on the securities is variable, adjusting quarterly to the 3-month LIBOR plus 3.15%. Arrow designated SOFR as the replacement index for financial instruments. The rate on the securities will be tied to the 3-month SOFR plus 3.15% post-conversation. ACST II used the proceeds of the sale of its trust preferred securities to purchase an identical amount of junior subordinated debentures issued by Arrow that bear an interest rate identical at all times to the rate payable on the ACST II trust preferred securities. The ACST II trust preferred securities became redeemable after July 23, 2008 and mature on July 23, 2033.
The second of the two classes of trust-issued instruments outstanding at year-end was issued by Arrow Capital Statutory Trust III ("ACST III"), a Delaware business trust established on December 23, 2004, upon the filing of a certificate of trust with the Delaware Secretary of State. On December 28, 2004, the ACST III issued all of its voting (common) stock to Arrow and issued and sold to an unaffiliated purchaser 30-year guaranteed preferred beneficial interests in the trust's assets ("ACST III"). The rate on the ACST III trust preferred securities is a variable rate, adjusted quarterly, equal to the 3-month LIBOR plus 2.00%. The rate on the securities will be tied to the 3-month SOFR plus 2.00% post-conversation. ACST III used the proceeds of the sale of its trust preferred securities to purchase an identical amount of junior subordinated debentures issued by Arrow that bear an interest rate identical at all times to the rate payable on the ACST III trust preferred securities. The ACST III trust preferred securities became redeemable on or after March 31, 2010 and mature on December 28, 2034. Arrow has entered into interest rate swaps to synthetically fix the variable rate interest payments associated with $20 million in outstanding subordinated trust securities. These agreements are designated as cash flow hedges.
The primary assets of the two subsidiary trusts having trust preferred securities outstanding at year-end, ACST II and ACST III (the “Trusts”), are Arrow's junior subordinated debentures discussed above, and the sole revenues of the Trusts are payments received by them from Arrow with respect to the junior subordinated debentures. The trust preferred securities issued by the Trusts are non-voting. All common voting securities of the Trusts are owned by Arrow. Arrow used the net proceeds from its sale of junior subordinated debentures to the Trusts, facilitated by the Trust’s sale of their trust preferred securities to the purchasers thereof, for general corporate purposes. The trust preferred securities and underlying junior subordinated debentures, with associated expense that is tax deductible, qualify as Tier I capital under regulatory definitions.
Arrow's primary source of funds to pay interest on the debentures that are held by the Trusts are current dividends received by Arrow from its subsidiary banks. Accordingly, Arrow's ability to make payments on the debentures, and the ability of the Trusts to make payments on their trust preferred securities, are dependent upon the continuing ability of Arrow's subsidiary banks to pay dividends to Arrow. Since the trust preferred securities issued by the subsidiary trusts and the underlying junior subordinated debentures issued by Arrow at December 31, 2022, 2021 and 2020 are classified as debt for financial statement purposes, the expense associated with these securities is recorded as interest expense in the Consolidated Statements of Income for the three years. Arrow's recent failure to timely file this Annual Report on Form 10-K and the Quarterly Report on Form 10-Q for the quarter ended March 31, 2023, and deliver such reports to the trustee would represent a default under the indenture if the the Trustee or the holders of at least 25% of the aggregate principal amount of the outstanding securities delivered such a notice. If the trustee delivers a notice of default, Arrow will have 30 days to remedy the default or else it will constitute an event of default under the indenture. The trustee has not provided a notice as of the date hereof.
Schedule of Guaranteed Preferred Beneficial Interests in Corporation's Junior Subordinated Debentures
|
|
|
|
|
|
|
|
|
|
|
|
|
2022 |
|
2021 |
| ACST II |
|
|
|
| Balance at December 31, |
$ |
10,000 |
|
|
$ |
10,000 |
|
| Period End: |
|
|
|
| Variable Interest Rate |
6.82 |
% |
|
3.28 |
% |
| Fixed Interest Rate resulting from cash flow hedge agreement |
4.00 |
% |
|
4.00 |
% |
|
|
|
|
| ACST III |
|
|
|
| Balance at December 31, |
$ |
10,000 |
|
|
$ |
10,000 |
|
| Period End: |
|
|
|
| Variable Interest Rate |
5.67 |
% |
|
2.13 |
% |
| Fixed Interest Rate resulting from cash flow hedge agreement |
2.86 |
% |
|
2.86 |
% |
Note 11:COMPREHENSIVE (LOSS) INCOME, NET OF TAX (Dollars In Thousands)
The following table presents the components of other comprehensive (loss) income for the years ended December 31, 2022, 2021 and 2020:
|
|
|
|
|
|
|
|
|
|
|
|
|
|
|
|
|
|
| Schedule of Comprehensive (Loss) Income |
|
Before-Tax
Amount |
|
Tax
Expense
(Benefit) |
|
Net-of-Tax
Amount |
| 2022 |
|
|
|
|
|
| Net Unrealized Securities Holding Losses Arising During the Period |
$ |
(64,774) |
|
|
16,547 |
|
|
(48,227) |
|
|
|
|
|
|
|
| Net Unrealized Gains on Cash Flow Swap |
3,467 |
|
|
(885) |
|
|
2,582 |
|
| Reclassification of Net Unrealized Loss on Cash Flow Hedge Agreements to Interest Expense |
204 |
|
|
(52) |
|
|
152 |
|
| Net Retirement Plan Loss |
(6,938) |
|
|
1,791 |
|
|
(5,147) |
|
| Settlement Cost |
577 |
|
|
(149) |
|
|
428 |
|
| Amortization of Net Retirement Plan Actuarial Loss |
56 |
|
|
(15) |
|
|
41 |
|
| Amortization of Net Retirement Plan Prior Service Cost |
228 |
|
|
(59) |
|
|
169 |
|
| Other Comprehensive Loss |
$ |
(67,180) |
|
|
$ |
17,178 |
|
|
$ |
(50,002) |
|
|
|
|
|
|
|
| 2021 |
|
|
|
|
|
| Net Unrealized Securities Holding Losses Arising During the Period |
$ |
(8,616) |
|
|
$ |
2,203 |
|
|
$ |
(6,413) |
|
|
|
|
|
|
|
| Net Unrealized Gains on Cash Flow Swap |
1,249 |
|
|
(320) |
|
|
929 |
|
| Reclassification of Net Unrealized Gain Cash Flow Hedge Agreements to Interest Expense |
(126) |
|
|
32 |
|
|
(94) |
|
| Net Retirement Plan Loss |
8,733 |
|
|
(2,233) |
|
|
6,500 |
|
|
|
|
|
|
|
| Amortization of Net Retirement Plan Actuarial Loss |
91 |
|
|
(23) |
|
|
68 |
|
| Amortization of Net Retirement Plan Prior Service Cost |
232 |
|
|
(59) |
|
|
173 |
|
| Other Comprehensive Income |
$ |
1,563 |
|
|
$ |
(400) |
|
|
$ |
1,163 |
|
|
|
|
|
|
|
| 2020 |
|
|
|
|
|
| Net Unrealized Securities Holding Gains Arising During the Period |
$ |
7,129 |
|
|
$ |
(1,823) |
|
|
$ |
5,306 |
|
| Reclassification Adjustment for Securities Losses Included in Net Income |
37 |
|
|
(9) |
|
|
28 |
|
| Net Unrealized Gains on Cash Flow Swap |
651 |
|
|
(166) |
|
|
485 |
|
| Net Retirement Plan Loss |
(337) |
|
|
86 |
|
|
(251) |
|
| Net Retirement Plan Prior Service Cost |
(472) |
|
|
119 |
|
|
(353) |
|
| Amortization of Net Retirement Plan Actuarial Loss |
227 |
|
|
(58) |
|
|
169 |
|
| Amortization of Net Retirement Plan Prior Service Cost |
211 |
|
|
(54) |
|
|
157 |
|
| Other Comprehensive Income |
$ |
7,446 |
|
|
$ |
(1,905) |
|
|
$ |
5,541 |
|
The following table presents the changes in accumulated other comprehensive (loss) income by component:
|
|
|
|
|
|
|
|
|
|
|
|
|
|
|
|
|
|
|
|
|
|
|
|
|
|
|
|
|
|
Changes in Accumulated Other Comprehensive (Loss) Income by Component (1) |
|
|
|
|
|
|
|
|
|
|
|
Unrealized |
|
|
|
Defined Benefit Plan Items |
|
|
|
Gains and |
|
Unrealized |
|
|
|
|
|
|
|
Losses on |
|
Gain On |
|
Net |
|
Net Prior |
|
|
|
Available-for- |
|
Cash Flow |
|
Actuarial |
|
Service |
|
|
|
Sale Securities |
|
Swap |
|
Gain (Loss) |
|
(Cost ) Credit |
|
Total |
| For the Year-To-Date periods ended: |
|
|
|
|
|
|
|
|
|
|
|
|
|
|
|
|
|
|
|
| December 31, 2021 |
$ |
(614) |
|
|
$ |
1,320 |
|
|
$ |
639 |
|
|
$ |
(998) |
|
|
$ |
347 |
|
| Other comprehensive (loss) income before reclassifications |
(48,227) |
|
|
2582 |
|
(5,147) |
|
|
428 |
|
|
(50,364) |
|
| Amounts reclassified from accumulated other comprehensive (loss) income |
— |
|
|
152 |
|
|
41 |
|
|
169 |
|
|
362 |
|
| Net current-period other comprehensive (loss) income |
(48,227) |
|
|
2,734 |
|
|
(5,106) |
|
|
597 |
|
|
(50,002) |
|
|
|
|
|
|
|
|
|
|
|
| December 31, 2022 |
$ |
(48,841) |
|
|
$ |
4,054 |
|
|
$ |
(4,467) |
|
|
$ |
(401) |
|
|
$ |
(49,655) |
|
|
|
|
|
|
|
|
|
|
|
| December 31, 2020 |
$ |
5,799 |
|
|
$ |
485 |
|
|
$ |
(5,929) |
|
|
$ |
(1,171) |
|
|
$ |
(816) |
|
| Other comprehensive (loss) income before reclassifications |
(6,413) |
|
|
929 |
|
|
6,500 |
|
|
— |
|
|
1,016 |
|
| Amounts reclassified from accumulated other comprehensive income |
— |
|
|
(94) |
|
|
68 |
|
|
173 |
|
|
147 |
|
| Net current-period other comprehensive income (loss) |
(6,413) |
|
|
835 |
|
|
6,568 |
|
|
173 |
|
|
1,163 |
|
| December 31, 2021 |
$ |
(614) |
|
|
$ |
1,320 |
|
|
$ |
639 |
|
|
$ |
(998) |
|
|
$ |
347 |
|
|
|
|
|
|
|
|
|
|
|
| December 31, 2019 |
$ |
465 |
|
|
$ |
— |
|
|
$ |
(5,847) |
|
|
$ |
(975) |
|
|
$ |
(6,357) |
|
| Other comprehensive income (loss) before reclassifications |
5,306 |
|
|
485 |
|
|
(251) |
|
|
(353) |
|
|
5,187 |
|
| Amounts reclassified from accumulated other comprehensive income (loss) |
28 |
|
|
— |
|
|
169 |
|
|
157 |
|
|
354 |
|
| Net current-period other comprehensive income |
5,334 |
|
|
485 |
|
|
(82) |
|
|
(196) |
|
|
5,541 |
|
|
|
|
|
|
|
|
|
|
|
| December 31, 2020 |
$ |
5,799 |
|
|
$ |
485 |
|
|
$ |
(5,929) |
|
|
$ |
(1,171) |
|
|
$ |
(816) |
|
|
|
|
|
|
|
|
|
|
|
(1) All amounts are net of tax. Amounts in parentheses indicate debits.
The following table presents the reclassifications out of accumulated other comprehensive income (loss)
|
|
|
|
|
|
|
|
|
|
|
|
|
|
|
Reclassifications Out of Accumulated Other Comprehensive Income (Loss) (1) |
|
|
|
Amounts Reclassified |
|
|
| Details about Accumulated Other |
|
from Accumulated Other |
|
Affected Line Item in the Statement |
| Comprehensive Income (Loss) Components |
|
Comprehensive Income (Loss) |
|
Where Net Income Is Presented |
|
|
|
|
|
| For the Year-to-date periods ended: |
|
|
|
|
|
|
|
|
|
| December 31, 2022 |
|
|
|
|
|
|
|
|
|
|
|
|
|
|
|
|
|
|
|
|
|
|
|
|
|
|
|
|
|
|
|
|
|
|
|
|
|
|
|
| Reclassification of Net Unrealized Gain on Cash Flow Hedge Agreements to Interest Expense |
|
$ |
(204) |
|
|
Interest expense |
| Amortization of defined benefit pension items |
|
|
|
|
| Prior-service credit |
|
(228) |
|
(2) |
Salaries and Employee Benefits |
| Actuarial Loss |
|
(56) |
|
(2) |
Salaries and Employee Benefits |
|
|
(488) |
|
|
Total before tax |
|
|
126 |
|
|
Provision for Income Taxes |
| Total reclassifications for the period |
|
$ |
(362) |
|
|
Net of tax |
|
|
|
|
|
|
|
|
|
|
|
|
|
|
|
|
|
|
|
|
| December 31, 2021 |
|
|
|
|
|
|
|
|
|
| Reclassification of Net Unrealized Gain on Cash Flow Hedge Agreements to Interest Expense |
|
126 |
|
|
|
|
|
|
|
|
|
|
|
|
|
|
|
|
|
|
|
|
|
|
|
|
|
|
|
| Amortization of defined benefit pension items |
|
|
|
|
| Prior-service credit |
|
$ |
(232) |
|
(2) |
Salaries and Employee Benefits |
| Actuarial Loss |
|
(91) |
|
(2) |
Salaries and Employee Benefits |
|
|
(197) |
|
|
Total before tax |
|
|
50 |
|
|
Provision for Income Taxes |
| Total reclassifications for the period |
|
$ |
(147) |
|
|
Net of tax |
|
|
|
|
|
|
|
|
|
|
|
|
|
|
|
|
|
|
|
|
| December 31, 2020 |
|
|
|
|
|
|
|
|
|
|
|
|
|
|
| Unrealized gains and losses on available-for-sale securities |
|
$ |
(37) |
|
|
Loss on Securities Transactions, Net |
|
|
(37) |
|
|
Total before tax |
|
|
9 |
|
|
Provision for Income Taxes |
|
|
$ |
(28) |
|
|
Net of tax |
|
|
|
|
|
| Amortization of defined benefit pension items |
|
|
|
|
| Prior-service credit |
|
$ |
(211) |
|
(2) |
Salaries and Employee Benefits |
| Actuarial Loss |
|
(227) |
|
(2) |
Salaries and Employee Benefits |
|
|
(438) |
|
|
Total before tax |
|
|
112 |
|
|
Provision for Income Taxes |
|
|
$ |
(326) |
|
|
Net of tax |
|
|
|
|
|
| Total reclassifications for the period |
|
$ |
(354) |
|
|
Net of tax |
|
|
|
|
|
(1) Amounts in parentheses indicate debits to profit/loss.
(2) These accumulated other comprehensive income components are included in the computation of net periodic pension cost (see retirement benefit plans footnote for additional details).
Note 12:STOCK-BASED COMPENSATION (Dollars In Thousands, Except Share and Per Share Amounts)
Arrow has established three stock-based compensation plans: a Long Term Incentive Plan, an Employee Stock Purchase Plan (ESPP) and an Employee Stock Ownership Plan (ESOP). All share and per share data have been adjusted for the September 23, 2022 3% stock dividend.
Long Term Incentive Plan
The Long Term Incentive Plan provides for the grant of incentive stock options, non-qualified stock options, restricted stock, restricted stock units, performance units and performance shares. The Compensation Committee of the Board of Directors administers the Long Term Incentive Plan.
|
|
|
|
|
|
|
|
|
|
|
|
|
|
|
Shares Available for Grant at December 31, 2022 |
|
|
|
463,500 |
|
Stock Options - Options may be granted at a price no less than the greater of the par value or fair market value of such shares on the date on which such option is granted, and generally expire ten years from the date of grant. The options usually vest over a four-year period.
The following table summarizes information about stock option activity for the year ended December 31, 2022.
|
|
|
|
|
|
|
|
|
|
|
|
|
|
|
|
|
|
|
|
|
|
|
|
|
Shares |
|
Weighted Average Exercise Price |
|
Weighted Average Remaining Contractual Life (in years) |
|
Aggregate Intrinsic Value |
| Outstanding at January 1, 2022 |
278,899 |
|
|
$ |
27.62 |
|
|
|
|
|
| Granted |
58,710 |
|
|
$ |
34.79 |
|
|
|
|
|
| Exercised |
(28,571) |
|
|
$ |
22.08 |
|
|
|
|
|
| Forfeited |
(29,988) |
|
|
$ |
30.21 |
|
|
|
|
|
| Outstanding at December 31, 2022 |
279,050 |
|
|
$ |
29.41 |
|
|
6.36 |
|
$ |
1,250 |
|
| Vested at Period-End |
156,388 |
|
|
$ |
27.63 |
|
|
4.96 |
|
$ |
979 |
|
| Expected to Vest |
122,662 |
|
|
$ |
31.68 |
|
|
8.14 |
|
$ |
272 |
|
The following is the Schedule of Stock Options Granted Under the Long Term Incentive Plan by Exercise Price Range.
|
|
|
|
|
|
|
|
|
|
|
|
|
|
|
|
|
|
|
|
|
|
|
|
|
|
|
|
Exercise Price Ranges |
|
|
|
$18.60 |
$19.54 |
$20.59 to $21.02 |
$27.85 |
$28.17 to $28.29 |
$31.170 to $32.28 |
$34.79 |
Total |
| Outstanding at December 31, 2022 |
|
|
|
|
|
|
|
|
| Number of Stock Options Outstanding |
3,849 |
|
9,338 |
|
19,868 |
|
49,996 |
|
69,780 |
|
72,659 |
|
53,560 |
|
279,050 |
|
| Weighted-Average Remaining Contractual Life (in years) |
0.09 |
1.08 |
2.61 |
8.08 |
5.63 |
5.92 |
9.07 |
6.36 |
| Weighted-Average Exercise Price |
$ |
18.60 |
|
$ |
19.54 |
|
$ |
20.82 |
|
$ |
27.85 |
|
$ |
28.22 |
|
$ |
31.85 |
|
$ |
34.79 |
|
$ |
29.41 |
|
|
|
|
|
|
|
|
|
|
| Vested at December 31, 2022 |
|
|
|
|
|
|
|
|
| Number of Stock Options Outstanding |
3,849 |
|
9,338 |
|
19,868 |
|
13,783 |
|
58,656 |
|
49,814 |
|
1,030 |
|
156,338 |
|
| Weighted-Average Remaining Contractual Life (in years) |
0.09 |
1.08 |
2.61 |
8.08 |
5.54 |
5.39 |
9.07 |
4.96 |
| Weighted-Average Exercise Price |
$ |
18.60 |
|
$ |
19.54 |
|
$ |
20.82 |
|
$ |
27.85 |
|
$ |
28.24 |
|
$ |
31.65 |
|
$ |
34.79 |
|
$ |
27.63 |
|
The following is the Schedule of Other Information on Stock Options Granted.
|
|
|
|
|
|
|
|
|
|
|
|
|
|
|
|
|
|
|
|
|
|
|
2022 |
|
2021 |
|
2020 |
| Stock Options Granted |
|
58,710 |
|
|
58,880 |
|
|
55,511 |
|
| Weighted Average Grant Date Information: |
|
|
|
|
|
|
| Fair Value of Options Granted |
|
$ |
7.43 |
|
|
$ |
4.57 |
|
|
$ |
4.56 |
|
| Fair Value Assumptions: |
|
|
|
|
|
|
| Dividend Yield |
|
2.90 |
% |
|
3.41 |
% |
|
2.90 |
% |
| Expected Volatility |
|
27.15 |
% |
|
26.53 |
% |
|
20.25 |
% |
| Risk Free Interest Rate |
|
1.69 |
% |
|
0.49 |
% |
|
1.53 |
% |
| Expected Lives (in years) |
|
8.56 |
|
8.75 |
|
6.68 |
|
|
|
|
|
|
|
| Amount Expensed During the Year |
|
$ |
312 |
|
|
$ |
282 |
|
|
$ |
301 |
|
| Compensation Costs for Non-vested Awards Not Yet Recognized |
|
542 |
|
|
427 |
|
|
440 |
|
| Weighted Average Expected Vesting Period, In Years |
|
2.22 |
|
2.16 |
|
2.17 |
| Proceeds From Stock Options Exercised |
|
$ |
631 |
|
|
$ |
1,505 |
|
|
$ |
748 |
|
| Tax Benefits Related to Stock Options Exercised |
|
33 |
|
|
69 |
|
|
52 |
|
| Intrinsic Value of Stock Options Exercised |
|
338 |
|
|
439 |
|
|
282 |
|
|
|
|
|
|
|
|
|
Restricted Stock Units - The Company grants restricted stock units which gives the recipient the right to receive shares of Company stock upon vesting. The fair value of each restricted stock unit is the market value of Company stock on the date of grant. 100% of the restricted stock unit awards vest three years from the grant date. Once vested, the restricted stock units become vested units and are no longer forfeitable. Vested units settle upon retirement of the recipient. Unvested restricted stock unit awards will generally be forfeited if the recipient ceases to be employed by the Company, with limited exceptions.
The following table summarizes information about restricted stock unit activity for the year ended December 31, 2022.
|
|
|
|
|
|
|
|
|
|
|
|
|
Restricted Stock Units |
|
Weighted Average Grant Date Fair Value |
| Non-vested at January 1, 2022 |
13,599 |
|
|
$ |
29.27 |
|
| Granted |
4,312 |
|
|
$ |
34.79 |
|
| Vested |
(4,391) |
|
|
$ |
28.17 |
|
|
|
|
|
| Non-vested at December 31, 2022 |
13,520 |
|
|
$ |
31.38 |
|
|
|
|
|
| Non-vested at January 1, 2021 |
12,373 |
|
|
$ |
29.81 |
|
| Granted |
5,026 |
|
|
$ |
27.71 |
|
| Vested |
(3,800) |
|
|
$ |
28.95 |
|
|
|
|
|
| Non-vested at December 31, 2021 |
13,599 |
|
|
$ |
29.27 |
|
|
|
|
|
| Non-vested at January 1, 2020 |
8,191 |
|
|
$ |
28.53 |
|
| Granted |
4,182 |
|
|
$ |
32.28 |
|
|
|
|
|
|
|
|
|
| Non-vested at December 31, 2020 |
12,373 |
|
|
$ |
29.81 |
|
|
|
|
|
|
|
|
|
The following table presents information on the amounts expensed related to Restricted Stock Units awarded pursuant to the Long Term Incentive Plan for the years ended December 31, 2022, 2021 and 2020.
|
|
|
|
|
|
|
|
|
|
|
|
|
|
|
|
|
|
|
|
|
|
|
2022 |
|
2021 |
|
2020 |
| Amount Expensed During the Year |
|
$ |
141 |
|
|
$ |
132 |
|
|
$ |
119 |
|
| Compensation Costs for Non-vested Awards Not Yet Recognized |
|
158 |
|
|
149 |
|
|
141 |
|
Employee Stock Purchase Plan
Arrow sponsors an ESPP under which employees purchase Arrow's common stock at a 5% discount below market price. Under current accounting guidance, a stock purchase plan with a discount of 5% or less is not considered a compensatory plan. We have suspended the operation of the ESPP as a result of the delayed filing of this Form 10-K and the related effects under applicable securities laws.
Employee Stock Ownership Plan
Arrow maintains an employee stock ownership plan (“ESOP”). Substantially all employees of Arrow and its subsidiaries are eligible to participate upon satisfaction of applicable service requirements. The Company makes cash contributions to the Plan each year.
Schedule of ESOP Compensation Expense
|
|
|
|
|
|
|
|
|
|
|
|
|
|
|
|
|
|
|
|
|
|
|
2022 |
|
2021 |
|
2020 |
| ESOP Compensation Expense |
|
$ |
1,457 |
|
|
$ |
1,487 |
|
|
$ |
1,619 |
|
Note 13: RETIREMENT BENEFIT PLANS (Dollars in Thousands)
Arrow sponsors qualified and nonqualified defined benefit pension plans and other postretirement benefit plans for its employees. Arrow maintains a non-contributory pension plan, which covers substantially all employees. Effective December 1, 2002, all active participants in the qualified defined benefit pension plan were given a one-time irrevocable election to continue participating in the traditional plan design, for which benefits were based on years of service and the participant’s final compensation (as defined), or to begin participating in the new cash balance plan design. All employees who participate in the plan after December 1, 2002 automatically participate in the cash balance plan design. The interest credits under the cash balance plan are based on the 30-year U.S. Treasury rate in effect for November of the prior year with a minimum interest credit of 3.0%. The service credits under the cash balance plan are equal to 6.0% of eligible salaries for employees who become participants on or after January 1, 2003. For employees in the plan prior to January 1, 2003, the service credits are scaled based on the age of the participant, and range from 6.0% to 12.0%. The funding policy is to contribute up to the maximum amount that can be deducted for federal income tax purposes and to make all payments required under ERISA. Arrow also maintains a supplemental non-qualified unfunded retirement plan to provide eligible employees of Arrow and its subsidiaries with benefits in excess of qualified plan limits imposed by federal tax law.
Arrow has multiple non-pension postretirement benefit plans. The health care, dental and life insurance plans are contributory, with participants’ contributions adjusted annually. Arrow’s policy is to fund the cost of postretirement benefits based on the current cost of the underlying policies. However, the health care plan provision allows for grandfathered participants to receive automatic increases of Company contributions each year based on the increase in inflation and limited to a maximum of 5%.
As of December 31, 2022, Arrow uses the sex-distinct amount-weighted Pri-2012 mortality tables for employees, healthy retirees and contingent survivors, with mortality improvements projected using Scale MP-2021 on a generational basis for the Pension Plan and the sex-distinct amount-weighted White Collar tables for employees, healthy retirees and contingent survivors, with mortality improvements projected using Scale MP-2021 on a generational basis for the Select Executive Retirement Plan.
Segment interest rates of 5.09%, 5.60% and 5.41% were used in determining the present value of a lump sum payment/annuitizing cash balance accounts as of December 31, 2022.
Effective January 1, 2021, Glens Falls National amended the Arrow Financial Corporation Employees' Pension Plan. The plan change was adopted January 1, 2021 and the amendment was valued as of December 31, 2020. The plan amendment included the following:
Effective January 1, 2021, the benefit payable to or on behalf of each participant:
•whose employment with the Employer (or any predecessor Employer, except as noted below) terminated on or before January 1, 2016;
•who satisfied the requirements for early, normal, or late retirement as of such termination;
•who never participated in the United Vermont Bancorporation Plan and;
•who is, or whose beneficiary is, receiving monthly benefit payments from the plan as of January 1, 2021 (including a participant or beneficiary who shall commence receiving benefits from the plan as of January 1, 2021), shall be increased by three percent (3%).
The foregoing increase was applied to the monthly benefit actually payable to the participant, or to the participant's beneficiary, as of January 1, 2021, determined after all applicable adjustments, regardless of whether such benefit had been determined under the Company's plan or the plan of a predecessor employer that had been merged into the plan.
The plan amendment caused a $351,638 increase in the projected benefit obligation creating a positive service cost which will be amortized over 9.70 years (the average expected future service of active plan participants.)
Effective January 1, 2021, Glens Falls National amended the Arrow Financial Corporation Employees' Select Executive Retirement Plan. The plan change was adopted January 1, 2021 and the amendment was valued as of December 31, 2020. The plan amendment provides a special adjustment to the monthly benefit payment for certain retirees. The plan amendment caused a $122,797 increase in the projected benefit obligation creating a positive prior service cost which will be amortized over 12.5 years.
Settlement accounting is required when lump sum payments during a fiscal year exceed that fiscal year's Service Cost plus Interest Cost components of the Net Periodic Pension Cost. For 2022, the sum of the Service Cost and Interest Cost was $3.3 million and the 2022 total lump sum payments exceeded that amount. The Plan therefore recognized in the 2022 Net Periodic Pension Cost a portion of the Unamortized Net (Gain)/Loss equal to the ratio of the projected benefit obligation for the participants that received a lump sum to the total projected benefit obligation. As of December 31, 2022, the Unamortized Net Loss prior to reflecting settlement accounting was $7.2 million. The ratio of the projected benefit obligation for participants that received a lump sum to the total projected benefit obligation was 8.06%.
The effect of the settlement that was recognized in the 2022 Net Periodic Pension Cost was $577 thousand, which has been fully reflected in the 2022 Net Periodic Cost.
The following tables set forth changes in the plans’ benefit obligations (projected benefit obligation for pension benefits and accumulated benefit obligation for postretirement benefits) and changes in the plans’ assets and the funded status of the pension plans and other postretirement benefit plan at December 31:
Schedule of Defined Benefit Plan Disclosures
|
|
|
|
|
|
|
|
|
|
|
|
|
|
|
|
|
|
|
Employees'
Pension
Plan |
|
Select
Executive
Retirement
Plan |
|
Postretirement
Benefit
Plans |
| Defined Benefit Plan Funded Status |
|
|
|
|
|
| December 31, 2022 |
|
|
|
|
|
| Fair Value of Plan Assets |
$ |
54,300 |
|
|
$ |
— |
|
|
$ |
— |
|
| Benefit Obligation |
39,528 |
|
|
6,070 |
|
|
6,482 |
|
| Funded Status of Plan |
$ |
14,772 |
|
|
$ |
(6,070) |
|
|
$ |
(6,482) |
|
|
|
|
|
|
|
| December 31, 2021 |
|
|
|
|
|
| Fair Value of Plan Assets |
$ |
68,925 |
|
|
$ |
— |
|
|
$ |
— |
|
| Benefit Obligation |
45,659 |
|
|
6,455 |
|
|
7,994 |
|
| Funded Status of Plan |
$ |
23,266 |
|
|
$ |
(6,455) |
|
|
$ |
(7,994) |
|
|
|
|
|
|
|
| Change in Benefit Obligation |
|
|
|
|
|
Benefit Obligation, at January 1, 2022 |
$ |
45,659 |
|
|
$ |
6,455 |
|
|
$ |
7,994 |
|
Service Cost 1 |
1,877 |
|
|
835 |
|
|
90 |
|
Interest Cost 2 |
1,439 |
|
|
225 |
|
|
248 |
|
|
|
|
|
|
|
| Plan Participants' Contributions |
— |
|
|
— |
|
|
427 |
|
|
|
|
|
|
|
| Actuarial Gain |
(4,555) |
|
|
(983) |
|
|
(1,571) |
|
| Benefits Paid |
(4,892) |
|
|
(462) |
|
|
(706) |
|
Benefit Obligation, at December 31, 2022 |
$ |
39,528 |
|
|
$ |
6,070 |
|
|
$ |
6,482 |
|
|
|
|
|
|
|
Benefit Obligation, at January 1, 2021 |
$ |
44,877 |
|
|
$ |
5,820 |
|
|
$ |
9,028 |
|
Service Cost 1 |
1,934 |
|
|
582 |
|
|
109 |
|
Interest Cost 2 |
1,365 |
|
|
191 |
|
|
249 |
|
| Plan Participants' Contributions |
— |
|
|
— |
|
|
432 |
|
|
|
|
|
|
|
| Actuarial Loss |
(347) |
|
|
332 |
|
|
(1,240) |
|
| Benefits Paid |
(2,170) |
|
|
(470) |
|
|
(584) |
|
Benefit Obligation, at December 31, 2021 |
45,659 |
|
|
6,455 |
|
|
7,994 |
|
|
|
|
|
|
|
| Change in Fair Value of Plan Assets |
|
|
|
|
|
Fair Value of Plan Assets, at January 1, 2022 |
$ |
68,925 |
|
|
$ |
— |
|
|
$ |
— |
|
| Actual Return on Plan Assets |
(9,733) |
|
|
— |
|
|
— |
|
| Employer Contributions |
— |
|
|
462 |
|
|
279 |
|
| Plan Participants' Contributions |
— |
|
|
— |
|
|
427 |
|
| Benefits Paid |
(4,892) |
|
|
(462) |
|
|
(706) |
|
Fair Value of Plan Assets, at December 31, 2022 |
$ |
54,300 |
|
|
$ |
— |
|
|
$ |
— |
|
|
|
|
|
|
|
Fair Value of Plan Assets, at January 1, 2021 |
$ |
59,837 |
|
|
$ |
— |
|
|
$ |
— |
|
| Actual Return on Plan Assets |
11,258 |
|
|
— |
|
|
— |
|
| Employer Contributions |
— |
|
|
470 |
|
|
152 |
|
| Plan Participants' Contributions |
— |
|
|
— |
|
|
432 |
|
| Benefits Paid |
(2,170) |
|
|
(470) |
|
|
(584) |
|
Fair Value of Plan Assets, at December 31, 2021 |
$ |
68,925 |
|
|
$ |
— |
|
|
$ |
— |
|
|
|
|
|
|
|
Accumulated Benefit Obligation at December 31, 2022 |
$ |
39,506 |
|
|
$ |
6,024 |
|
|
$ |
6,482 |
|
|
|
|
|
|
|
|
|
|
|
|
|
|
|
|
|
|
|
|
|
|
|
|
|
|
|
|
|
|
|
|
Employees'
Pension
Plan |
|
Select
Executive
Retirement
Plan |
|
Postretirement
Benefit
Plans |
| Amounts Recognized in the Consolidated Balance Sheets |
|
|
|
|
|
| December 31, 2022 |
|
|
|
|
|
| Prepaid Pension Asset |
$ |
14,772 |
|
|
$ |
— |
|
|
— |
|
| Accrued Benefit Liability |
— |
|
|
(6,070) |
|
|
(6,482) |
|
| Net Benefit (Expense) Recognized |
$ |
14,772 |
|
|
$ |
(6,070) |
|
|
$ |
(6,482) |
|
|
|
|
|
|
|
| December 31, 2021 |
|
|
|
|
|
| Prepaid Pension Asset |
$ |
23,266 |
|
|
$ |
— |
|
|
— |
|
| Accrued Benefit Liability |
— |
|
|
(6,455) |
|
|
(7,994) |
|
| Net Benefit (Expense) Recognized |
$ |
23,266 |
|
|
$ |
(6,455) |
|
|
$ |
(7,994) |
|
|
|
|
|
|
|
| Amounts Recognized in Other Comprehensive Income (Loss) |
|
|
|
|
|
For the Year Ended December 31, 2022 |
|
|
|
|
|
| Net Unamortized Loss (Gain) Arising During the Period |
$ |
9,492 |
|
|
$ |
(983) |
|
|
$ |
(1,571) |
|
|
|
|
|
|
|
| Amortization of Net (Loss) Gain |
— |
|
|
(212) |
|
|
156 |
|
| Amortization of Prior Service Cost |
(78) |
|
|
(44) |
|
|
(106) |
|
| Settlement Cost |
$ |
(577) |
|
|
$ |
— |
|
|
$ |
— |
|
Total Other Comprehensive Income (Loss) for Pension and
Other Postretirement Benefit Plans |
$ |
8,837 |
|
|
$ |
(1,239) |
|
|
$ |
(1,521) |
|
|
|
|
|
|
|
For the Year Ended December 31, 2021 |
|
|
|
|
|
| Net Unamortized (Gain) Loss Arising During the Period |
$ |
(7,826) |
|
|
$ |
332 |
|
|
$ |
(1,239) |
|
|
|
|
|
|
|
| Amortization of Net (Loss) Gain |
— |
|
|
(178) |
|
|
87 |
|
| Amortization of Prior Service Cost |
(78) |
|
|
(48) |
|
|
(106) |
|
Total Other Comprehensive (Loss) Income for Pension and
Other Postretirement Benefit Plans |
$ |
(7,904) |
|
|
$ |
106 |
|
|
$ |
(1,258) |
|
|
|
|
|
|
|
For the Year Ended December 31, 2020 |
|
|
|
|
|
| Net Unamortized (Gain) Loss Arising During the Period |
$ |
(182) |
|
|
$ |
368 |
|
|
$ |
151 |
|
| Net Prior Service Cost Arising During the Period |
349 |
|
|
123 |
|
|
— |
|
| Amortization of Net Loss |
(81) |
|
|
(146) |
|
|
— |
|
| Amortization of Prior Service Cost |
(63) |
|
|
(42) |
|
|
(106) |
|
Total Other Comprehensive Income for Pension and
Other Postretirement Benefit Plans |
$ |
23 |
|
|
$ |
303 |
|
|
$ |
45 |
|
|
|
|
|
|
|
| Accumulated Other Comprehensive Income |
|
|
|
|
|
| December 31, 2022 |
|
|
|
|
|
| Net Actuarial Loss (Gain) |
$ |
6,574 |
|
|
$ |
1,453 |
|
|
$ |
(2,597) |
|
| Prior Service Cost |
376 |
|
|
370 |
|
|
366 |
|
| Total Accumulated Other Comprehensive Income (Loss), Before Tax |
$ |
6,950 |
|
|
$ |
1,823 |
|
|
$ |
(2,231) |
|
|
|
|
|
|
|
| December 31, 2021 |
|
|
|
|
|
| Net Actuarial (Gain) Loss |
$ |
(2,341) |
|
|
$ |
2,651 |
|
|
$ |
(1,182) |
|
| Prior Service Cost |
453 |
|
|
411 |
|
|
472 |
|
| Total Accumulated Other Comprehensive (Loss) Income, Before Tax |
$ |
(1,888) |
|
|
$ |
3,062 |
|
|
$ |
(710) |
|
|
|
|
|
|
|
|
|
|
|
|
|
|
|
|
|
|
|
|
|
|
|
|
|
|
Employees'
Pension
Plan |
|
Select
Executive
Retirement
Plan |
|
Postretirement
Benefit
Plans |
|
|
|
|
|
|
| Net Periodic Benefit Cost |
|
|
|
|
|
| For the Year Ended December 31, 2022 |
|
|
|
|
|
Service Cost 1 |
$ |
1,877 |
|
|
$ |
835 |
|
|
$ |
90 |
|
Interest Cost 2 |
1,439 |
|
|
225 |
|
|
248 |
|
Expected Return on Plan Assets 2 |
(4,314) |
|
|
— |
|
|
— |
|
Amortization of Prior Service Cost 2 |
77 |
|
|
44 |
|
|
106 |
|
Amortization of Net Loss (Gain) 2 |
— |
|
|
212 |
|
|
(156) |
|
Settlement Cost 2 |
577 |
|
|
— |
|
|
— |
|
| Net Periodic Benefit (Income) Cost |
$ |
(344) |
|
|
$ |
1,316 |
|
|
$ |
288 |
|
|
|
|
|
|
|
| For the Year Ended December 31, 2021 |
|
|
|
|
|
Service Cost 1 |
$ |
1,934 |
|
|
$ |
582 |
|
|
$ |
109 |
|
Interest Cost 2 |
1,365 |
|
|
191 |
|
|
249 |
|
Expected Return on Plan Assets 2 |
(3,780) |
|
|
— |
|
|
— |
|
Amortization of Prior Service Cost 2 |
78 |
|
|
48 |
|
|
106 |
|
Amortization of Net Loss 2 |
— |
|
|
179 |
|
|
(88) |
|
| Net Periodic Benefit (Income) Cost |
$ |
(403) |
|
|
$ |
1,000 |
|
|
$ |
376 |
|
|
|
|
|
|
|
| For the Year Ended December 31, 2020 |
|
|
|
|
|
Service Cost 1 |
$ |
1,663 |
|
|
$ |
408 |
|
|
$ |
123 |
|
Interest Cost 2 |
1,544 |
|
|
192 |
|
|
310 |
|
Expected Return on Plan Assets 2 |
(3,608) |
|
|
— |
|
|
— |
|
Amortization of Prior Service Cost 2 |
63 |
|
|
42 |
|
|
106 |
|
Amortization of Net Loss (Gain) 2 |
81 |
|
|
146 |
|
|
— |
|
| Net Periodic Benefit (Income) Cost |
$ |
(257) |
|
|
$ |
788 |
|
|
$ |
539 |
|
|
|
|
|
|
|
Weighted-Average Assumptions Used in
Calculating Benefit Obligation |
|
|
|
|
|
| December 31, 2022 |
|
|
|
|
|
| Discount Rate |
5.59 |
% |
|
5.61 |
% |
|
5.62 |
% |
| Rate of Compensation Increase |
3.50 |
% |
|
3.50 |
% |
|
3.50 |
% |
Interest Rate Credit for Determining
Projected Cash Balance Account |
3.99 |
% |
|
3.99 |
% |
|
|
Interest Rates segments to Annuitize Cash
Balance Account (Segment 1, Segment 2 and Segment 3,
respectively) |
5.09%, 5.60% and 5.41% |
|
5.09%, 5.60% and 5.41% |
|
|
Interest Rates to Convert Annuities to Actuarially
Equivalent Lump Sum Amounts (Segment 1, Segment 2 and
Segment 3, respectively) |
5.09%,5.60% and 5.41% |
|
5.09%, 5.60% and 5.41% |
|
|
|
|
|
|
|
|
| December 31, 2021 |
|
|
|
|
|
| Discount Rate |
3.30 |
% |
|
3.29 |
% |
|
3.32 |
% |
| Rate of Compensation Increase |
3.50 |
% |
|
3.50 |
% |
|
3.50 |
% |
Interest Rate Credit for Determining
Projected Cash Balance Account |
3.00 |
% |
|
3.00 |
% |
|
|
|
|
|
|
|
|
|
|
|
|
|
|
|
|
|
|
|
|
|
|
|
|
|
|
|
Employees'
Pension
Plan |
|
Select
Executive
Retirement
Plan |
|
Postretirement
Benefit
Plans |
Weighted-Average Assumptions Used in
Calculating Net Periodic Benefit Cost |
|
|
|
|
|
| December 31, 2022 |
|
|
|
|
|
| Discount Rate |
3.30 |
% |
|
5.61 |
% |
|
3.32 |
% |
| Expected Long-Term Return on Plan Assets |
6.50 |
% |
|
|
|
|
| Rate of Compensation Increase |
3.50 |
% |
|
3.50 |
% |
|
3.50 |
% |
Interest Rate Credit for Determining
Projected Cash Balance Account |
3.00 |
% |
|
3.99 |
% |
|
|
Interest Rates to Annuitize Cash
Balance Account (Segment 1, Segment 2, and Segment 3,
respectively) |
5.09%, 5.60% and 5.41% |
|
5.09%, 5.60% and 5.41% |
|
|
Interest Rates to Convert Annuities to Actuarially
Equivalent Lump Sum Amounts (Segment 1, Segment 2 and
Segment 3, respectively) |
5.09%, 5.60% and 5.41% |
|
5.09%, 5.60% and 5.41% |
|
|
|
|
|
|
|
|
| December 31, 2021 |
|
|
|
|
|
| Discount Rate |
3.14 |
% |
|
3.19 |
% |
|
3.17 |
% |
| Expected Long-Term Return on Plan Assets |
6.50 |
% |
|
|
|
|
| Rate of Compensation Increase |
3.50 |
% |
|
3.50 |
% |
|
3.50 |
% |
Interest Rate Credit for Determining
Projected Cash Balance Account |
3.00 |
% |
|
3.00 |
% |
|
|
Interest Rates to Annuitize Cash
Balance Account (Segment 1, Segment 2, and Segment 3,
respectively) |
1.02%, 2.72% and 3.08% |
|
1.02%, 2.72% and 3.08% |
|
|
Interest Rates to Convert Annuities to Actuarially
Equivalent Lump Sum Amounts (Segment 1, Segment 2 and
Segment 3, respectively) |
1.02%, 2.72% and 3.08% |
|
1.02%, 2.72% and 3.08% |
|
|
|
|
|
|
|
|
|
|
|
|
|
|
|
|
|
|
|
|
| December 31, 2020 |
|
|
|
|
|
| Discount Rate |
3.72 |
% |
|
3.75 |
% |
|
3.76 |
% |
| Expected Long-Term Return on Plan Assets |
6.50 |
% |
|
|
|
|
| Rate of Compensation Increase |
3.50 |
% |
|
3.50 |
% |
|
3.50 |
% |
Interest Rate Credit for Determining
Projected Cash Balance Account |
3.00 |
% |
|
3.00 |
% |
|
|
|
|
|
|
|
|
|
|
|
|
|
|
Footnotes:
1.Included in Salaries and Employee Benefits on the Consolidated Statements of Income
2.Included in Other Operating Expense on the Consolidated Statements of Income
Schedule of Defined Benefit Plan Disclosures
Information about Defined Benefit Plan Assets - Employees' Pension Plan
|
|
|
|
|
|
|
|
|
|
|
|
|
|
|
|
|
|
|
|
|
|
|
|
|
|
|
|
|
|
|
|
|
|
|
|
|
|
|
|
|
|
| Fair Value Measurements Using: |
| Asset Category |
Quoted Prices
in Active Markets
for Identical Assets
(Level 1) |
|
Significant Other Observable Inputs
(Level 2) |
|
Significant Unobservable Inputs
(Level 3) |
|
Total |
|
Percent of Total |
|
Target Allocation Minimum |
|
Target Allocation Maximum |
| December 31, 2022 |
|
|
|
|
|
|
|
|
|
|
|
|
|
| Cash |
$ |
— |
|
|
$ |
— |
|
|
$ |
— |
|
|
$ |
— |
|
|
— |
% |
|
— |
% |
|
15.0 |
% |
| Interest-Bearing Money Market Fund |
1,291 |
|
|
— |
|
|
— |
|
|
1,291 |
|
|
2.4 |
% |
|
— |
% |
|
15.0 |
% |
Arrow Common Stock1 |
6,411 |
|
|
— |
|
|
— |
|
|
6,411 |
|
|
11.8 |
% |
|
— |
% |
|
10.0 |
% |
North Country Funds - Equity 2 |
20,714 |
|
|
— |
|
|
— |
|
|
20,714 |
|
|
38.2 |
% |
|
|
|
|
| Other Mutual Funds - Equity |
15,059 |
|
|
— |
|
|
— |
|
|
15,059 |
|
|
27.7 |
% |
|
|
|
|
| Total Equity Funds |
35,773 |
|
|
— |
|
|
— |
|
|
35,773 |
|
|
65.9 |
% |
|
55.0 |
% |
|
85.0 |
% |
|
|
|
|
|
|
|
|
|
|
|
|
|
|
| Other Mutual Funds - Fixed Income |
6,094 |
|
|
— |
|
|
— |
|
|
6,094 |
|
|
11.2 |
% |
|
|
|
|
| Total Fixed Income Funds |
6,094 |
|
|
— |
|
|
— |
|
|
6,094 |
|
|
11.2 |
% |
|
10.0 |
% |
|
30.0 |
% |
| Alternative ETF |
4,731 |
|
|
— |
|
|
— |
|
|
4,731 |
|
|
8.7 |
% |
|
— |
% |
|
20.0 |
% |
| Total |
$ |
54,300 |
|
|
$ |
— |
|
|
$ |
— |
|
|
$ |
54,300 |
|
|
100.0 |
% |
|
|
|
|
|
|
|
|
|
|
|
|
|
|
|
|
|
|
| December 31, 2021 |
|
|
|
|
|
|
|
|
|
|
|
|
|
| Cash |
$ |
— |
|
|
$ |
— |
|
|
$ |
— |
|
|
$ |
— |
|
|
— |
% |
|
— |
% |
|
15.0 |
% |
| Interest-Bearing Money Market Fund |
2,439 |
|
|
— |
|
|
— |
|
|
2,439 |
|
|
3.5 |
% |
|
— |
% |
|
15.0 |
% |
Arrow Common Stock1 |
6,469 |
|
|
— |
|
|
— |
|
|
6,469 |
|
|
9.4 |
% |
|
— |
% |
|
10.0 |
% |
North Country Funds - Equity 2 |
29,490 |
|
|
— |
|
|
— |
|
|
29,490 |
|
|
42.8 |
% |
|
|
|
|
| Other Mutual Funds - Equity |
16,761 |
|
|
— |
|
|
— |
|
|
16,761 |
|
|
24.3 |
% |
|
|
|
|
| Total Equity Funds |
46,251 |
|
|
— |
|
|
— |
|
|
46,251 |
|
|
67.1 |
% |
|
55.0 |
% |
|
85.0 |
% |
North Country Funds - Fixed income 2 |
6,317 |
|
|
— |
|
|
— |
|
|
6,317 |
|
|
9.2 |
% |
|
|
|
|
| Other Mutual Funds - Fixed Income |
2,675 |
|
|
— |
|
|
— |
|
|
2,675 |
|
|
3.9 |
% |
|
|
|
|
| Total Fixed Income Funds |
8,992 |
|
|
— |
|
|
— |
|
|
8,992 |
|
|
13.1 |
% |
|
10.0 |
% |
|
30.0 |
% |
| Alternative ETF |
4,774 |
|
|
— |
|
|
— |
|
|
4,774 |
|
|
6.9 |
% |
|
— |
% |
|
20.0 |
% |
| Total |
$ |
68,925 |
|
|
$ |
— |
|
|
$ |
— |
|
|
$ |
68,925 |
|
|
100.0 |
% |
|
|
|
|
Footnotes:
1 Payment for the acquisition of Common Stock was under 10% of the total fair value of the employee's pension plan assets
at the time of acquisition.
2 The North Country Funds - Equity and the North Country Funds - Fixed Income are publicly traded mutual funds advised
by Arrow's subsidiary, North Country Investment Advisers, Inc.
dissolved in 2022.
Schedule of Defined Benefit Plan Disclosures
|
|
|
|
|
|
|
|
|
|
|
|
|
|
|
|
|
|
|
Employees'
Pension
Plan |
|
Select
Executive
Retirement
Plan |
|
Postretirement
Benefit
Plans |
| Expected Future Benefit Payments |
|
|
|
|
|
| 2023 |
$ |
3,192 |
|
|
$ |
432 |
|
|
$ |
616 |
|
| 2024 |
3,469 |
|
|
675 |
|
|
629 |
|
| 2025 |
3,215 |
|
|
656 |
|
|
637 |
|
| 2026 |
2,778 |
|
|
628 |
|
|
665 |
|
| 2027 |
3,299 |
|
|
630 |
|
|
680 |
|
| 2028 - 2032 |
15,355 |
|
|
2,736 |
|
|
2,910 |
|
|
|
|
|
|
|
Estimated Contributions During 2023 |
$ |
— |
|
|
$ |
432 |
|
|
$ |
616 |
|
|
|
|
|
|
|
| Assumed Health Care Cost Trend Rates |
|
|
|
|
|
| December 31, 2022 |
|
|
|
|
|
Health Care Cost Trend
Rate Assumed for Next Year |
|
|
|
|
7.75 |
% |
Rate to which the Cost Trend
Rate is Assumed to Decline
(the Ultimate Trend Rate) |
|
|
|
|
4.04 |
% |
Year that the Rate Reaches
the Ultimate Trend Rate |
|
|
|
|
2075 |
|
|
|
|
|
|
| December 31, 2021 |
|
|
|
|
|
Health Care Cost Trend
Rate Assumed for Next Year |
|
|
|
|
7.00 |
% |
Rate to which the Cost Trend
Rate is Assumed to Decline
(the Ultimate Trend Rate) |
|
|
|
|
3.78 |
% |
Year that the Rate Reaches
the Ultimate Trend Rate |
|
|
|
|
2075 |
|
|
|
|
|
|
|
|
|
|
|
|
|
|
|
|
|
|
|
|
|
|
|
|
|
|
|
|
|
|
|
|
|
|
|
|
Fair Value of Plan Assets (Defined Benefit Plan):
North Country Funds - Fixed Income was liquidated and For information on fair value measurements, including descriptions of level 1, 2 and 3 of the fair value hierarchy and the valuation methods employed by Arrow, see Notes 2, Summary of Significant Accounting Policies, and 17, Fair Values, to the Consolidated Financial Statements.
The fair value of level 1 financial instruments in the table above are based on unadjusted, quoted market prices from exchanges in active markets.
In accordance with ERISA guidelines, the Board authorized the purchase of Arrow common stock up to 10% of the fair market value of the plan's assets at the time of acquisition.
Pension Plan Investment Policies and Strategies:
The Company maintains a non-contributory pension benefit plan covering substantially all employees for the purpose of rewarding long and loyal service to the Company. The pension assets are held in trust and are invested in a prudent manner for the exclusive purpose of providing benefits to participants. The investment objective is to achieve an inflation-protected rate of return that meets the actuarial assumption which is used for funding purposes. The investment strategy attempts to maximize the investment return on assets at a level of risk deemed appropriate by the Company while complying with ERISA and any applicable regulations and laws. The investment strategy utilizes asset allocation as a principal determinant for establishing the risk/reward profile of the assets. Asset allocation ranges are established, periodically reviewed, and adjusted as funding levels, and participant benefit characteristics change. Active and passive investment management is employed to help enhance the risk/return profile of the assets.
The plan’s assets are invested in a diversified portfolio of equity securities comprised of companies with small, mid, and large capitalizations. Both domestic and international equities are allowed to provide further diversification and opportunity for return in potentially higher growth economies with lower correlation of returns. Growth and value styles of investment are employed to increase the diversification and offer varying opportunities for appreciation. The fixed income portion of the plan may be invested in U.S. dollar denominated debt securities that shall be rated within the top four ratings categories by nationally recognized ratings agencies. The fixed income portion will be invested without regard to industry or sector based on analysis of each target security’s structural and repayment features, current pricing and trading opportunities as well as credit quality of the issuer.
Individual bonds with ratings that fall below the plan’s rating requirements will be sold only when it is in the best interests of the plan. Hybrid investments, such as convertible bonds, may be used to provide growth characteristics while offering some protection to declining equity markets by having a fixed income component. Alternative investments such as Treasury Inflation Protected Securities, commodities, and REITs may be used to further enhance diversification while offering opportunities for return. In accordance with ERISA guidelines, common stock of the Company may be purchased up to 10% of the fair market value of the plan’s assets at the time of acquisition. Derivative investments are prohibited in the plan.
The return on assets assumption was developed through review of historical market returns, historical asset class volatility and correlations, current market conditions, the plan’s past experience, and expectations on potential future market returns. The assumption represents a long-term average view of the performance of the assets in the plan, a return that may or may not be achieved during any one calendar year. The assumption is based on the return of the plan using the historical 15 year return adjusted for the potential for lower than historical returns due to low interest rates.
Cash Flows - We were not required to and we did not make any contribution to our qualified pension plan in 2022. Arrow makes contributions for its postretirement benefits in an amount equal to actual expenses for the year.
Note 14:OTHER EXPENSES (Dollars In Thousands)
Other operating expenses included in the Consolidated Statements of Income are as follows:
|
|
|
|
|
|
|
|
|
|
|
|
|
|
|
|
|
|
|
2022 |
|
2021 |
|
2020 |
| Legal and Other Professional Fees |
3,076 |
|
|
2,706 |
|
|
2,516 |
|
| Postage and Courier |
1,277 |
|
|
1,044 |
|
|
957 |
|
| Advertising and Promotion |
1,190 |
|
|
1,083 |
|
|
1,140 |
|
| Stationery and Printing |
805 |
|
|
721 |
|
|
713 |
|
| Intangible Asset Amortization |
193 |
|
|
210 |
|
|
227 |
|
| Litigation Reserve Expense |
— |
|
|
1,475 |
|
|
— |
|
| All Other |
4,490 |
|
|
4,285 |
|
|
3,411 |
|
| Total Other Operating Expense |
$ |
11,031 |
|
|
$ |
11,524 |
|
|
$ |
8,964 |
|
Note 15:INCOME TAXES (Dollars In Thousands)
The provision for income taxes is summarized below:
|
|
|
|
|
|
|
|
|
|
|
|
|
|
|
|
|
|
| Current Tax Expense: |
2022 |
|
2021 |
|
2020 |
| Federal |
$ |
12,263 |
|
|
$ |
10,957 |
|
|
$ |
10,791 |
|
| State |
3,103 |
|
|
2,645 |
|
|
2,485 |
|
| Total Current Tax Expense |
15,366 |
|
|
13,602 |
|
|
13,276 |
|
| Deferred Tax (Benefit) Expense: |
|
|
|
|
|
| Federal |
(798) |
|
|
712 |
|
|
(1,569) |
|
| State |
(454) |
|
|
233 |
|
|
(671) |
|
| Total Deferred Tax (Benefit) Expense |
(1,252) |
|
|
945 |
|
|
(2,240) |
|
|
|
|
|
|
|
| Total Provision for Income Taxes |
$ |
14,114 |
|
|
$ |
14,547 |
|
|
$ |
11,036 |
|
The provisions for income taxes differed from the amounts computed by applying the U.S. Federal Income Tax Rate of 21% to pre-tax income as a result of the following:
|
|
|
|
|
|
|
|
|
|
|
|
|
|
|
|
|
|
|
|
|
|
|
|
|
|
|
2022 |
|
|
|
2021 |
|
|
|
2020 |
|
|
|
|
|
|
|
|
|
|
|
|
| Statutory Federal Tax Rate |
|
|
21.0 |
% |
|
|
|
21.0 |
% |
|
|
|
21.0 |
% |
| (Decrease) Increase Resulting From: |
|
|
|
|
|
|
|
|
|
|
|
|
|
|
|
|
|
|
|
|
|
|
|
| Tax-Exempt Income |
|
|
(1.4) |
|
|
|
|
(1.5) |
|
|
|
|
(2.1) |
|
| Nondeductible Interest Expense |
|
|
— |
|
|
|
|
— |
|
|
|
|
0.1 |
|
| State Taxes, Net of Federal Income Tax Benefit |
|
|
3.4 |
|
|
|
|
3.4 |
|
|
|
|
2.6 |
|
| Tax benefit from stock based compensation |
|
|
— |
|
|
|
|
— |
|
|
|
|
(0.1) |
|
| Other Items, Net |
|
|
(0.6) |
|
|
|
|
(0.3) |
|
|
|
|
(0.2) |
|
| Effective Tax Rate |
|
|
22.4 |
% |
|
|
|
22.6 |
% |
|
|
|
21.3 |
% |
|
|
|
|
|
|
|
|
|
|
|
|
|
|
|
|
|
|
|
|
|
|
|
|
The tax effects of temporary differences that give rise to significant portions of the deferred tax assets and deferred tax liabilities at December 31, 2022 and 2021 are presented below:
|
|
|
|
|
|
|
|
|
|
|
|
|
2022 |
|
2021 |
| Deferred Tax Assets: |
|
|
|
| Net Unrealized Losses on Securities Available-for-Sale Included in Accumulated Other Comprehensive Income |
$ |
16,914 |
|
|
$ |
211 |
|
| Allowance for Credit Losses |
8,199 |
|
|
7,440 |
|
| Lease liabilities |
2,821 |
|
|
3,142 |
|
| Pension and Deferred Compensation Plans |
3,571 |
|
|
3,309 |
|
| Pension Liability Included in Accumulated Other Comprehensive Income |
1,692 |
|
|
124 |
|
| Historic Tax Credit |
749 |
|
|
1,023 |
|
|
|
|
|
| Other |
745 |
|
|
841 |
|
|
|
|
|
| Total Gross Deferred Tax Assets |
34,691 |
|
|
16,090 |
|
| Valuation Allowance for Deferred Tax Assets |
— |
|
|
— |
|
| Total Gross Deferred Tax Assets, Net of Valuation Allowance |
$ |
34,691 |
|
|
$ |
16,090 |
|
| Deferred Tax Liabilities: |
|
|
|
| Pension Plans |
$ |
5,606 |
|
|
$ |
5,470 |
|
| Depreciation |
3,165 |
|
|
3,070 |
|
| ROU assets |
2,646 |
|
|
3,005 |
|
| Deferred Income |
3,266 |
|
|
3,778 |
|
| Net Unrealized Gains on Equity Securities |
272 |
|
|
160 |
|
|
|
|
|
| Goodwill |
3,416 |
|
|
3,428 |
|
| Gain on Cash Flow Hedge Agreements |
1,404 |
|
|
453 |
|
| Other |
— |
|
|
85 |
|
| Total Gross Deferred Tax Liabilities |
$ |
19,775 |
|
|
$ |
19,449 |
|
|
|
|
|
| Deferred Tax Asset (Liability), Net |
$ |
14,916 |
|
|
$ |
(3,359) |
|
Management believes that the realization of the recognized gross deferred tax assets at December 31, 2022 and 2021 is more likely than not, based on historic earnings and expectations as to future taxable income.
Interest and penalties are recorded as a component of the provision for income taxes, if any. There are no current examinations of our Federal or state income tax returns, nor have we been notified of any upcoming examinations. Tax years 2019 through 2022 are subject to Federal and New York State examination. Management annually conducts an analysis of its tax positions and has concluded that it has no uncertain tax positions as of December 31, 2022.
Note 16: EARNINGS PER SHARE (Dollars In Thousands, Except Per Share Amounts)
The following table presents a reconciliation of the numerator and denominator used in the calculation of basic and diluted earnings per common share ("EPS") for each of the years in the three-year period ended December 31, 2022. All share and per share amounts have been adjusted for the September 23, 2022 3% stock dividend.
|
|
|
|
|
|
|
|
|
|
|
|
|
|
|
|
|
|
| Earnings Per Share |
|
Year-to-Date Period Ended: |
|
12/31/2022 |
|
12/31/2021 |
|
12/31/2020 |
| Earnings Per Share - Basic: |
|
|
|
|
|
| Net Income |
$ |
48,799 |
|
|
$ |
49,857 |
|
|
$ |
40,827 |
|
| Weighted Average Shares - Basic |
16,513 |
|
|
16,499 |
|
|
16,406 |
|
| Earnings Per Share - Basic |
$ |
2.95 |
|
|
$ |
3.02 |
|
|
$ |
2.49 |
|
|
|
|
|
|
|
| Earnings Per Share - Diluted: |
|
|
|
|
|
| Net Income |
$ |
48,799 |
|
|
$ |
49,857 |
|
|
$ |
40,827 |
|
| Weighted Average Shares - Basic |
16,513 |
|
|
16,499 |
|
|
16,406 |
|
| Dilutive Average Shares Attributable to Stock Options |
49 |
|
|
56 |
|
|
16 |
|
| Weighted Average Shares - Diluted |
16,562 |
|
|
16,555 |
|
|
16,422 |
|
| Earnings Per Share - Diluted |
$ |
2.95 |
|
|
$ |
3.01 |
|
|
$ |
2.49 |
|
|
|
|
|
|
|
Note 17:FAIR VALUES (Dollars In Thousands)
FASB ASC Subtopic 820-10 defines fair value, establishes a framework for measuring fair value in generally accepted accounting principles (GAAP) and requires certain disclosures about fair value measurements. There are no nonfinancial assets or liabilities measured at fair value on a recurring basis. The only assets or liabilities that Arrow measured at fair value on a recurring basis at December 31, 2022 and 2021 were securities available-for-sale, equity securities and derivatives. Arrow held no securities or liabilities for trading on such dates. For information on fair value measurements, including descriptions of level 1, 2 and 3 of the fair value hierarchy and the valuation methods employed by Arrow, see Note 2, Summary of Significant Accounting Policies, to the Consolidated Financial Statements.
The table below presents the financial instrument's fair value and the amounts within the fair value hierarchy based on the lowest level of input that is significant to the fair value measurement:
|
|
|
|
|
|
|
|
|
|
|
|
|
|
|
|
|
|
|
|
|
|
|
|
|
|
|
|
|
|
| Fair Value of Assets and Liabilities Measured on a Recurring and Nonrecurring Basis |
|
|
|
Fair Value Measurements at Reporting Date Using: |
| Fair Value of Assets and Liabilities Measured on a Recurring Basis: |
Fair Value |
|
Quoted Prices
In Active Markets for Identical Assets
(Level 1) |
|
Significant Other
Observable Inputs
(Level 2) |
|
Significant Unobservable Inputs
(Level 3) |
|
|
| December 31, 2022 |
|
|
|
|
|
|
|
|
|
| Assets: |
|
|
|
|
|
|
|
|
|
| Securities Available-for Sale: |
|
|
|
|
|
|
|
|
|
| U.S. Government & Agency Obligations |
$ |
175,199 |
|
|
$ |
— |
|
|
$ |
175,199 |
|
|
$ |
— |
|
|
|
| State and Municipal Obligations |
340 |
|
|
— |
|
|
340 |
|
|
— |
|
|
|
| Mortgage-Backed Securities |
397,156 |
|
|
— |
|
|
397,156 |
|
|
— |
|
|
|
| Corporate and Other Debt Securities |
800 |
|
|
— |
|
|
800 |
|
|
— |
|
|
|
| Total Securities Available-for-Sale |
573,495 |
|
|
— |
|
|
573,495 |
|
|
$ |
— |
|
|
|
| Equity Securities |
2,174 |
|
|
— |
|
|
2,174 |
|
|
— |
|
|
|
| Total Securities Measured on a Recurring Basis |
575,669 |
|
|
— |
|
|
575,669 |
|
|
— |
|
|
|
| Derivatives, included in other assets |
7,506 |
|
|
— |
|
|
7,506 |
|
|
— |
|
|
|
| Total Measured on a Recurring Basis |
$ |
583,175 |
|
|
$ |
— |
|
|
$ |
583,175 |
|
|
$ |
— |
|
|
|
| Liabilities: |
|
|
|
|
|
|
|
|
|
| Derivatives, included in other liabilities |
$ |
7,506 |
|
|
$ |
— |
|
|
$ |
7,506 |
|
|
$ |
— |
|
|
|
| Total Measured on a Recurring Basis |
$ |
7,506 |
|
|
$ |
— |
|
|
$ |
7,506 |
|
|
$ |
— |
|
|
|
| December 31, 2021 |
|
|
|
|
|
|
|
|
|
| Assets: |
|
|
|
|
|
|
|
|
|
| Securities Available-for Sale: |
|
|
|
|
|
|
|
|
|
| U.S. Government & Agency Obligations |
$ |
108,365 |
|
|
$ |
— |
|
|
$ |
108,365 |
|
|
$ |
— |
|
|
|
| State and Municipal Obligations |
400 |
|
|
— |
|
|
400 |
|
|
— |
|
|
|
| Mortgage-Backed Securities |
449,751 |
|
|
— |
|
|
449,751 |
|
|
— |
|
|
|
| Corporate and Other Debt Securities |
800 |
|
|
— |
|
|
800 |
|
|
— |
|
|
|
| Total Securities Available-for-Sale |
559,316 |
|
|
— |
|
559,316 |
|
|
— |
|
|
| Equity Securities |
1,747 |
|
|
— |
|
|
1,747 |
|
|
— |
|
|
|
| Total Securities Measured on a Recurring Basis |
561,063 |
|
|
— |
|
|
561,063 |
|
|
— |
|
|
|
| Derivatives, included in other assets |
2,083 |
|
|
— |
|
|
2,083 |
|
|
— |
|
|
|
| Total Measured on a Recurring Basis |
$ |
563,146 |
|
|
$ |
— |
|
|
$ |
563,146 |
|
|
$ |
— |
|
|
|
| Liabilities: |
|
|
|
|
|
|
|
|
|
| Derivatives, included in other liabilities |
$ |
2,083 |
|
|
$ |
— |
|
|
$ |
2,083 |
|
|
$ |
— |
|
|
|
| Total Measured on a Recurring Basis |
$ |
2,083 |
|
|
$ |
— |
|
|
$ |
2,083 |
|
|
$ |
— |
|
|
|
|
|
|
|
|
|
|
|
|
|
|
|
|
|
|
|
|
|
|
|
|
|
|
|
|
|
|
|
|
|
|
|
|
|
|
|
|
|
|
|
|
|
|
|
|
|
|
|
|
|
|
|
|
|
|
|
|
|
|
|
| Fair Value of Assets and Liabilities Measured on a Nonrecurring Basis: |
Fair Value |
|
Quoted Prices
In Active Markets for Identical Assets
(Level 1) |
|
Significant Other
Observable Inputs
(Level 2) |
|
Significant Unobservable Inputs
(Level 3) |
|
Gains (Losses) Recognized in Earnings |
| December 31, 2022 |
|
|
|
|
|
|
|
|
|
| Collateral Dependent Impaired Loans |
$ |
— |
|
|
$ |
— |
|
|
$ |
— |
|
|
$ |
— |
|
|
$ |
— |
|
| Other Real Estate Owned and Repossessed Assets, Net |
593 |
|
|
— |
|
|
— |
|
|
593 |
|
|
— |
|
| December 31, 2021 |
|
|
|
|
|
|
|
|
|
| Collateral Dependent Impaired Loans |
$ |
2,457 |
|
|
$ |
— |
|
|
$ |
— |
|
|
$ |
2,457 |
|
|
$ |
— |
|
| Other Real Estate Owned and Repossessed Assets, Net |
126 |
|
|
— |
|
|
— |
|
|
126 |
|
|
— |
|
The fair value of financial instruments is determined under the following hierarchy:
•Level 1 - Unadjusted quoted prices in active markets that are accessible at the measurement date for identical, unrestricted assets or liabilities;
•Level 2 - Quoted prices for similar assets or liabilities in active markets, quoted prices for identical or similar assets or liabilities in markets that are not active, or inputs that are observable, either directly or indirectly, for substantially the full term of the asset or liability; and
•Level 3 - Prices or valuation techniques that require inputs that are both significant to the fair value measurement and unobservable (i.e., supported by little or no market activity).
There were no transfers between Levels 1, 2 and 3 for the years ended December 31, 2022 or 2021.
Fair Value Methodology for Assets and Liabilities Measured on a Recurring Basis
The fair value of level 1 securities available-for-sale are based on unadjusted, quoted market prices from exchanges in active markets. The fair value of level 2 securities available-for-sale are based on an independent bond and equity pricing service for identical assets or significantly similar securities and an independent equity pricing service for equity securities not actively traded. The pricing services use a variety of techniques to arrive at fair value including market maker bids, quotes and pricing models. Inputs to the pricing models include recent trades, benchmark interest rates, spreads and actual and projected cash flows. The fair value of Level 2 equities are based on the last observable price in open markets. The fair value of Level 2 derivatives is determined using inputs that are observable in the market place obtained from third parties including yield curves, publicly available volatilities, and floating indexes.
Fair Value Methodology for Assets and Liabilities Measured on a Nonrecurring Basis
The fair value of collateral dependent impaired loans and other real estate owned was based on third-party appraisals less estimated cost to sell. The appraisals may be adjusted by management for qualitative factors such as economic conditions and estimated liquidation expenses. Other assets which might have been included in this table include mortgage servicing rights, goodwill and other intangible assets. Arrow evaluates each of these assets for impairment at least annually, with no impairment recognized for these assets at December 31, 2022 and 2021.
Fair Value Methodology for Financial Instruments Not Measured on a Recurring or Nonrecurring Basis
The fair value for securities held-to-maturity is determined utilizing an independent bond pricing service for identical assets or significantly similar securities. The pricing service uses a variety of techniques to arrive at fair value including market maker bids, quotes and pricing models. Inputs to the pricing models include recent trades, benchmark interest rates, spreads and actual and projected cash flows.
ASU 2016-01 "Recognition and Measurement of Financial Assets and Financial Liabilities" requires that the fair value for loans must be disclosed using the "exit price" notion which is a reasonable estimate of what another party might pay in an orderly transaction. Fair values for loans are calculated for portfolios of loans with similar financial characteristics. Loans are segregated by type such as commercial, commercial real estate, residential mortgage, indirect auto and other consumer loans. Each loan category is further segmented into fixed and adjustable interest rate terms and by performing and nonperforming categories. The fair value of performing loans is calculated by determining the estimated future cash flow, which is the contractual cash flow adjusted for estimated prepayments. The discount rate is determined by starting with current market yields, and first adjusting for a liquidity premium. This premium is separately determined for each loan type. Then a credit loss component is determined utilizing the credit loss assumptions used in the allowance for credit loss model. Finally, a discount spread is applied separately for consumer loans vs. commercial loans based on market information and utilization of the swap curve.
The fair value of time deposits is based on the discounted value of contractual cash flows, except that the fair value is limited to the extent that the customer could redeem the certificate after imposition of a premature withdrawal penalty. The discount rates are estimated using the Federal Home Loan Bank of New York ("FHLBNY") yield curve, which is considered representative of Arrow’s time deposit rates.
The fair value of all other deposits is equal to the carrying value.
The fair value of FHLBNY advances is calculated by the FHLBNY.
The carrying amount of FHLBNY and FRB stock approximates fair value. If the stock was redeemed, the Company will receive an amount equal to the par value of the stock.
The book value of the outstanding trust preferred securities (Junior Subordinated Obligations Issued to Unconsolidated Subsidiary Trusts) are considered to approximate fair value since the interest rates are variable (indexed to LIBOR and to be indexed to SOFR post-conversion) and Arrow is well-capitalized.
Fair Value by Balance Sheet Grouping
The following table presents a summary of the carrying amount, the fair value and the fair value hierarchy of Arrow’s financial instruments:
|
|
|
|
|
|
|
|
|
|
|
|
|
|
|
|
|
|
|
|
|
|
|
|
|
|
|
|
|
|
| Schedule of Fair Values by Balance Sheet Grouping |
|
|
|
|
|
Fair Value Hierarchy |
|
Carrying
Amount |
|
Fair
Value |
|
Level 1 |
|
Level 2 |
|
Level 3 |
| December 31, 2022 |
|
|
|
|
|
|
|
|
|
| Cash and Cash Equivalents |
$ |
64,660 |
|
|
$ |
64,660 |
|
|
$ |
64,660 |
|
|
$ |
— |
|
|
$ |
— |
|
| Securities Available-for-Sale |
573,495 |
|
|
573,495 |
|
|
— |
|
|
573,495 |
|
|
— |
|
| Securities Held-to-Maturity |
175,364 |
|
|
171,623 |
|
|
— |
|
|
171,623 |
|
|
— |
|
| Equity Securities |
2,174 |
|
|
2,174 |
|
|
|
|
2,174 |
|
|
|
| Federal Home Loan Bank and Federal Reserve Bank Stock |
6,064 |
|
|
6,064 |
|
|
— |
|
|
6,064 |
|
|
— |
|
| Net Loans |
2,953,255 |
|
|
2,742,721 |
|
|
— |
|
|
— |
|
|
2,742,721 |
|
| Accrued Interest Receivable |
9,890 |
|
|
9,890 |
|
|
— |
|
|
9,890 |
|
|
— |
|
| Derivatives, included in other assets |
7,506 |
|
|
7,506 |
|
|
— |
|
|
7,506 |
|
|
— |
|
| Deposits |
3,498,364 |
|
|
3,492,021 |
|
|
— |
|
|
3,492,021 |
|
|
— |
|
|
|
|
|
|
|
|
|
|
|
|
|
|
|
|
|
|
|
|
|
| Federal Home Loan Bank Term Advances |
27,800 |
|
|
27,757 |
|
|
— |
|
|
27,757 |
|
|
— |
|
Junior Subordinated Obligations Issued
to Unconsolidated Subsidiary Trusts |
20,000 |
|
|
20,000 |
|
|
— |
|
|
20,000 |
|
|
— |
|
| Accrued Interest Payable |
357 |
|
|
357 |
|
|
— |
|
|
357 |
|
|
— |
|
| Derivatives, included in other liabilities |
7,506 |
|
|
7,506 |
|
|
— |
|
|
7,506 |
|
|
— |
|
|
|
|
|
|
|
|
|
|
|
| December 31, 2021 |
|
|
|
|
|
|
|
|
|
| Cash and Cash Equivalents |
$ |
457,696 |
|
|
$ |
457,696 |
|
|
$ |
457,696 |
|
|
$ |
— |
|
|
$ |
— |
|
| Securities Available-for-Sale |
559,316 |
|
|
559,316 |
|
|
— |
|
|
559,316 |
|
|
— |
|
| Securities Held-to-Maturity |
196,566 |
|
|
201,292 |
|
|
— |
|
|
201,292 |
|
|
— |
|
| Equity Securities |
1,747 |
|
|
1,747 |
|
|
— |
|
|
1,747 |
|
|
|
| Federal Home Loan Bank and Federal Reserve Bank Stock |
5,380 |
|
|
5,380 |
|
|
— |
|
|
5,380 |
|
|
— |
|
| Net Loans |
2,640,660 |
|
|
2,618,311 |
|
|
— |
|
|
— |
|
|
2,618,311 |
|
| Accrued Interest Receivable |
7,384 |
|
|
7,384 |
|
|
— |
|
|
7,384 |
|
|
— |
|
| Derivatives, included in other assets |
2,083 |
|
|
2,083 |
|
|
— |
|
|
2,083 |
|
|
— |
|
| Deposits |
3,550,497 |
|
|
3,548,554 |
|
|
— |
|
|
3,548,554 |
|
|
— |
|
|
|
|
|
|
|
|
|
|
|
|
|
|
|
|
|
|
|
|
|
| Federal Home Loan Bank Term Advances |
45,000 |
|
|
45,518 |
|
|
— |
|
|
45,518 |
|
|
— |
|
Junior Subordinated Obligations Issued
to Unconsolidated Subsidiary Trusts |
20,000 |
|
|
20,000 |
|
|
— |
|
|
20,000 |
|
|
— |
|
| Accrued Interest Payable |
138 |
|
|
138 |
|
|
— |
|
|
138 |
|
|
— |
|
| Derivatives, included in other liabilities |
2,083 |
|
|
2,083 |
|
|
— |
|
|
2,083 |
|
|
— |
|
Note 18:LEASES (Dollars In Thousands)
Arrow is a lessee in its leases, which are mainly for financial services locations in addition to leases for corporate vehicles. These leases generally require the Company to pay third-party expenses on behalf of the Lessor, which are referred to as variable payments. Under some leases, the Company pays the variable payments to the lessor, and in other leases, the Company pays the variable payments directly to the applicable third party. None of the Company's current leases include any residual value guarantees or any subleases, and there are no significant rights or obligations of the Company for leases that have not commenced as of the reporting date.
Arrow leases two of its branch offices, at market rates, from Stewart’s Shops Corp. Mr. Gary C. Dake, President of Stewart’s Shops Corp., serves as a director on the board of directors of each of Arrow and the two subsidiary banks. Arrow also leases one administrative office from an entity controlled by Elizabeth Miller, who serves as a director on the board of directors of each of Arrow and the two subsidiary banks. Additional information regarding these relationships can be found in Part III, Item 13 under the caption "Related Party Transactions."
The following includes quantitative data related to the Company's leases as of and for the twelve months ended December 31, 2022 and December 31, 2021:
|
|
|
|
|
|
|
|
|
|
|
|
|
|
|
|
|
Twelve Months Ended |
| Finance Lease Amounts: |
Classification |
December 31, 2022 |
|
December 31, 2021 |
| Right-of-Use Assets |
Premises and Equipment, Net |
$ |
4,637 |
|
|
$ |
4,814 |
|
| Lease Liabilities |
Finance Leases |
5,119 |
|
|
5,169 |
|
|
|
|
|
|
| Operating Lease Amounts: |
|
|
|
|
| Right-of-Use Assets |
Other Assets |
$ |
5,627 |
|
|
$ |
6,941 |
|
| Lease Liabilities |
Other Liabilities |
5,822 |
|
|
7,124 |
|
|
|
|
|
|
| Other Information: |
|
|
|
|
|
|
|
|
|
| Cash Paid For Amounts Included In The Measurement Of Lease Liabilities: |
|
|
|
| Operating Outgoing Cash Flows From Finance Leases |
|
$ |
193 |
|
|
$ |
195 |
|
| Operating Outgoing Cash Flows From Operating Leases |
|
1,301 |
|
|
794 |
|
| Financing Outgoing Cash Flows From Finance Leases |
|
50 |
|
|
48 |
|
| Right-of-Use Assets Obtained In Exchange For New Finance Lease Liabilities |
— |
|
|
— |
|
| Right-of-Use Assets Obtained In Exchange For New Operating Lease Liabilities |
— |
|
|
2,508 |
|
| Weighted-average Remaining Lease Term - Finance Leases (Yrs.) |
27.24 |
|
28.20 |
| Weighted-average Remaining Lease Term - Operating Leases (Yrs.) |
11.14 |
|
11.17 |
| Weighted-average Discount Rate—Finance Leases |
|
3.75 |
% |
|
3.75 |
% |
| Weighted-average Discount Rate—Operating Leases |
|
2.92 |
% |
|
2.86 |
% |
|
|
|
|
|
|
|
|
|
|
|
|
|
|
|
|
|
|
|
|
|
|
|
|
| Lease cost information for the Company's leases is as follows: |
|
|
|
Three Months Ended |
|
Twelve Months Ended |
|
December 31, 2022 |
|
December 31, 2021 |
|
December 31, 2022 |
|
December 31, 2021 |
| Lease Cost: |
|
|
|
|
|
|
|
| Finance Lease Cost: |
|
|
|
|
|
|
|
| Reduction in the Carrying Amount of Right-of-Use Assets |
$ |
44 |
|
|
$ |
44 |
|
|
$ |
177 |
|
|
$ |
177 |
|
| Interest on Lease Liabilities |
48 |
|
|
49 |
|
|
193 |
|
|
195 |
|
| Operating Lease Cost |
304 |
|
|
270 |
|
|
1,229 |
|
|
1,007 |
|
| Short-term Lease Cost |
15 |
|
|
19 |
|
|
47 |
|
|
47 |
|
| Variable Lease Cost |
81 |
|
|
67 |
|
|
334 |
|
|
270 |
|
| Total Lease Cost |
$ |
492 |
|
|
$ |
449 |
|
|
$ |
1,980 |
|
|
$ |
1,696 |
|
|
|
|
|
|
|
|
|
|
|
|
|
|
|
|
| Future Lease Payments at December 31, 2022 are as follows: |
|
|
Operating
Leases
|
|
Finance
Leases
|
| Twelve Months Ended: |
|
|
|
|
| 12/31/2023 |
|
$ |
964 |
|
|
$ |
243 |
|
| 12/31/2024 |
|
699 |
|
|
249 |
|
| 12/31/2025 |
|
637 |
|
|
263 |
|
| 12/31/2026 |
|
574 |
|
|
268 |
|
| 12/31/2027 |
|
545 |
|
|
268 |
|
| Thereafter |
|
3,577 |
|
|
7,264 |
|
| Total Undiscounted Cash Flows |
|
6,996 |
|
|
8,555 |
|
| Less: Net Present Value Adjustment |
|
1,174 |
|
|
3,436 |
|
| Lease Liability |
|
$ |
5,822 |
|
|
$ |
5,119 |
|
Note 19. DERIVATIVE INSTRUMENTS AND HEDGING ACTIVITIES (In Thousands)
Arrow is exposed to certain risks arising from both its business operations and economic conditions. Arrow principally manages its exposures to a wide variety of business and operational risks through management of its core business activities. Arrow manages economic risks, including interest rate, primarily by managing the amount, sources and duration of its assets and liabilities and through the use of derivative instruments. Specifically, Arrow enters into derivative financial instruments to manage exposures that arise from business activities that result in the receipt or payment of future known and uncertain cash amounts, the value of which are determined by interest rates. Arrow's derivative financial instruments are used to manage differences in the amount, timing and duration of known or expected cash receipts and its known or expected cash payments principally related to certain fixed rate borrowings. Arrow also has interest rate derivatives that result from a service provided to certain qualifying customers and, therefore, are not used to manage interest rate risk in the Company’s assets or liabilities. The Company manages a matched book with respect to its derivative instruments in order to minimize its net risk exposure resulting from such transactions.
Derivatives Not Designated as Hedging Instruments
Arrow enters into interest rate swap agreements with its commercial customers to provide them with a long-term fixed rate, while simultaneously entering into offsetting interest rate swap agreements with a counterparty to swap the fixed rate to a variable rate to manage interest rate exposure.
These interest rate swap agreements are not designated as hedges for accounting purposes. As the interest rate swap agreements have substantially equivalent and offsetting terms, they do not present any material exposure to Arrow's consolidated statements of income. Arrow records its interest rate swap agreements at fair value and is presented on a gross basis within other assets and other liabilities on the consolidated balance sheets. Changes in the fair value of assets and liabilities arising from these derivatives are included, net, in other income in the consolidated statement of income.
The following table depicts the fair value adjustment recorded related to the notional amount of derivatives outstanding as well as the notional amount of the interest rate swap agreements.
|
|
|
|
|
|
|
|
|
|
|
|
| Derivatives Not Designated as Hedging Instruments - Interest Rate Swap Agreements |
|
December 31, 2022 |
|
December 31, 2021 |
| Fair value adjustment included in other assets |
$ |
7,506 |
|
|
$ |
2,083 |
|
| Fair value adjustment included in other liabilities |
7,506 |
|
|
2,083 |
|
| Notional amount |
127,763 |
|
|
172,668 |
|
Derivatives Designated as Hedging Instruments
Arrow has entered into interest rate swaps to synthetically fix the variable rate interest payments associated with $20 million in outstanding subordinated trust securities. These agreements are designated as cash flow hedges.
For derivatives designated and that qualify as cash flow hedges of interest rate risk, the gain or loss on the derivative is recorded in Accumulated Other Comprehensive Income ("AOCI") and subsequently reclassified into interest expense in the same period during which the hedge transaction affects earnings. Amounts reported in AOCI related to derivatives will be reclassified to interest expense as interest payments are made on Arrow's Junior Subordinated Obligations Issued to Unconsolidated Subsidiary Trusts borrowings.
The following table indicates the effect of cash flow hedge accounting on AOCI and on the consolidated statement of income.
|
|
|
|
|
|
|
|
|
|
|
|
| Derivatives Designated as Hedging Instruments - Cash Flow Hedge Agreements |
|
December 31, 2022 |
|
December 31, 2021 |
| Amount of gain recognized in AOCI |
$ |
3,467 |
|
|
$ |
1,249 |
|
| Amount of (loss) gain reclassified from AOCI interest expense |
(204) |
|
|
126 |
|
Note 20:REGULATORY MATTERS (Dollars in Thousands)
In the normal course of business, Arrow and its subsidiaries operate under certain regulatory restrictions, such as the extent and structure of covered inter-company borrowings and maintenance of reserve requirement balances.
The principal source of the funds for the payment of stockholder dividends by Arrow has been from dividends declared and paid to Arrow by its bank subsidiaries. As of December 31, 2022, the maximum amount that could have been paid by subsidiary banks to Arrow, without prior regulatory approval, was approximately $88.8 million.
Under current Federal Reserve regulations, Arrow is prohibited from borrowing from the subsidiary banks unless such borrowings are secured by specific obligations. Additionally, the maximum of any such borrowings from any one subsidiary bank (aggregated with all other "covered transactions" between the bank and Arrow) is limited to 10% of that bank’s capital and surplus. Loans and other covered transactions between any one subsidiary bank and all of its affiliates cannot exceed 20% of that bank's capital and surplus.
Arrow and its subsidiary banks are subject to various regulatory capital requirements administered by the federal banking agencies. Failure to meet minimum capital requirements can initiate certain mandatory--and possibly additional discretionary--actions by regulators that, if undertaken, could have a direct material effect on an institution’s financial statements. Under capital adequacy guidelines and the regulatory framework for prompt corrective action, Arrow and its subsidiary banks must meet specific capital guidelines that involve quantitative measures of assets, liabilities, and certain off-balance sheet items as calculated under regulatory accounting practices. Capital amounts and classification are also subject to qualitative judgments by the regulators about components, risk weightings, and other factors.
Current quantitative measures established by regulation to ensure capital adequacy require Arrow and its subsidiary banks to maintain minimum capital amounts and ratios (set forth in the table below) of total and Tier I capital (as defined in the regulations) to risk-weighted assets (as defined), and of Tier I capital (as defined) to average assets (as defined). Management believes, as of December 31, 2022 and 2021, that Arrow and both subsidiary banks meet all capital adequacy requirements to which they are subject. The regulatory capital requirements incorporate a capital concept, the so-called "capital conservation buffer" (set at 2.5%, after full phase-in), which must be added to each of the minimum required risk-based capital ratios (i.e., the minimum CET1 ratio, the minimum Tier 1 risk-based capital ratio and the minimum total risk-based capital ratio). As of January 1, 2019, the capital conservation buffer increased to 2.50% of risk weighted assets.
In 2020, federal bank regulators introduced an optional simplified measure of capital adequacy for qualifying community banking organizations (CBLR). A qualifying community banking organization that opts into the CBLR framework and meets all the requirements under the CBLR framework will be considered to have met the well-capitalized ratio requirements under the “prompt corrective action” regulations and will not be required to report or calculate risk-based capital ratios.
The CBLR final rule became effective as of January 1, 2020, and Arrow and both subsidiary banks have opted out of utilizing the CBLR framework. Therefore, the Capital Rules promulgated under Dodd-Frank remain applicable to Arrow and both subsidiary banks.
As of December 31, 2022, Arrow and both subsidiary banks qualified as well-capitalized under the regulatory framework for prompt corrective action. To be categorized as “well-capitalized,” Arrow and its subsidiary banks must maintain minimum total risk-based, Tier I risk-based, Tier I leverage, and CET1 risk-based ratios as set forth in the table below. There are no conditions or events that management believes have changed Arrow’s or its subsidiary banks’ categories. The actual capital amounts and ratios for Arrow and its subsidiary banks, Glens Falls National and Saratoga National, are presented in the table below as of December 31, 2022 and 2021:
|
|
|
|
|
|
|
|
|
|
|
|
|
|
|
|
|
|
|
|
|
|
|
|
|
|
|
|
|
|
|
|
|
|
|
|
|
Actual |
|
Minimum Amounts For Capital Adequacy Purposes (including "capital conservation buffer") |
|
Minimum Amounts To Be Well-Capitalized |
|
Amount |
|
Ratio |
|
Amount |
|
Ratio |
|
Amount |
|
Ratio |
| As of December 31, 2022 |
|
|
|
|
|
|
|
|
|
|
|
Total Capital
(to Risk Weighted Assets): |
|
|
|
|
|
|
|
|
|
|
|
| Arrow |
$ |
435,857 |
|
|
15.1 |
% |
|
$ |
303,079 |
|
|
10.5 |
% |
|
$ |
288,647 |
|
|
10.0 |
% |
| Glens Falls National |
315,458 |
|
|
14.3 |
% |
|
231,630 |
|
|
10.5 |
% |
|
220,600 |
|
|
10.0 |
% |
| Saratoga National |
104,279 |
|
|
15.5 |
% |
|
70,641 |
|
|
10.5 |
% |
|
67,277 |
|
|
10.0 |
% |
Tier I Capital
(to Risk Weighted Assets): |
|
|
|
|
|
|
|
|
|
|
|
|
|
|
|
|
|
|
|
|
|
|
|
|
|
|
|
|
|
|
|
|
|
|
|
|
|
|
|
|
|
|
|
|
|
|
|
|
Actual |
|
Minimum Amounts For Capital Adequacy Purposes (including "capital conservation buffer") |
|
Minimum Amounts To Be Well-Capitalized |
|
Amount |
|
Ratio |
|
Amount |
|
Ratio |
|
Amount |
|
Ratio |
| Arrow |
404,059 |
|
|
14.0 |
% |
|
245,322 |
|
|
8.5 |
% |
|
230,891 |
|
|
8.0 |
% |
| Glens Falls National |
292,134 |
|
|
13.2 |
% |
|
188,117 |
|
|
8.5 |
% |
|
177,051 |
|
|
8.0 |
% |
| Saratoga National |
95,891 |
|
|
14.3 |
% |
|
56,998 |
|
|
8.5 |
% |
|
53,645 |
|
|
8.0 |
% |
Tier I Capital
(to Average Assets): |
|
|
|
|
|
|
|
|
|
|
|
| Arrow |
404,059 |
|
|
9.8 |
% |
|
164,922 |
|
|
4.0 |
% |
|
206,153 |
|
|
5.0 |
% |
| Glens Falls National |
292,134 |
|
|
9.0 |
% |
|
129,837 |
|
|
4.0 |
% |
|
162,297 |
|
|
5.0 |
% |
| Saratoga National |
95,891 |
|
|
10.5 |
% |
|
36,530 |
|
|
4.0 |
% |
|
45,662 |
|
|
5.0 |
% |
Common Equity Tier 1 Capital
(to Risk Weighted Assets): |
|
|
|
|
|
|
|
|
|
|
|
| Arrow |
384,003 |
|
|
13.3 |
% |
|
202,107 |
|
|
7.0 |
% |
|
187,671 |
|
|
6.5 |
% |
| Glens Falls National |
292,078 |
|
|
13.2 |
% |
|
154,890 |
|
|
7.0 |
% |
|
143,826 |
|
|
6.5 |
% |
| Saratoga National |
95,891 |
|
|
14.3 |
% |
|
46,940 |
|
|
7.0 |
% |
|
43,587 |
|
|
6.5 |
% |
|
|
|
|
|
|
|
|
|
|
|
|
| As of December 31, 2021 |
|
|
|
|
|
|
|
|
|
|
|
Total Capital
(to Risk Weighted Assets): |
|
|
|
|
|
|
|
|
|
|
|
| Arrow |
$ |
400,661 |
|
|
15.7 |
% |
|
$ |
267,958 |
|
|
10.5 |
% |
|
$ |
255,198 |
|
|
10.0 |
% |
| Glens Falls National |
295,047 |
|
|
15.1 |
% |
|
205,165 |
|
|
10.5 |
% |
|
195,395 |
|
|
10.0 |
% |
| Saratoga National |
90,924 |
|
|
15.2 |
% |
|
62,809 |
|
|
10.5 |
% |
|
59,818 |
|
|
10.0 |
% |
Tier I Capital
(to Risk Weighted Assets): |
|
|
|
|
|
|
|
|
|
|
|
| Arrow |
371,556 |
|
|
14.6 |
% |
|
216,317 |
|
|
8.5 |
% |
|
203,592 |
|
|
8.0 |
% |
| Glens Falls National |
274,208 |
|
|
14.1 |
% |
|
165,303 |
|
|
8.5 |
% |
|
155,579 |
|
|
8.0 |
% |
| Saratoga National |
83,432 |
|
|
13.9 |
% |
|
51,020 |
|
|
8.5 |
% |
|
48,018 |
|
|
8.0 |
% |
Tier I Capital
(to Average Assets): |
|
|
|
|
|
|
|
|
|
|
|
| Arrow |
371,556 |
|
|
9.2 |
% |
|
161,546 |
|
|
4.0 |
% |
|
201,933 |
|
|
5.0 |
% |
| Glens Falls National |
274,208 |
|
|
8.6 |
% |
|
127,539 |
|
|
4.0 |
% |
|
159,423 |
|
|
5.0 |
% |
| Saratoga National |
83,432 |
|
|
9.8 |
% |
|
34,054 |
|
|
4.0 |
% |
|
42,567 |
|
|
5.0 |
% |
Common Equity Tier 1 Capital
(to Risk Weighted Assets): |
|
|
|
|
|
|
|
|
|
|
|
| Arrow |
351,497 |
|
|
13.8 |
% |
|
178,296 |
|
|
7.0 |
% |
|
165,560 |
|
|
6.5 |
% |
| Glens Falls National |
274,149 |
|
|
14.1 |
% |
|
136,102 |
|
|
7.0 |
% |
|
126,381 |
|
|
6.5 |
% |
| Saratoga National |
83,432 |
|
|
13.9 |
% |
|
42,016 |
|
|
7.0 |
% |
|
39,015 |
|
|
6.5 |
% |
Note 21:PARENT ONLY FINANCIAL INFORMATION (Dollars In Thousands)
Condensed financial information for Arrow Financial Corporation is as follows:
|
|
|
|
|
|
|
|
|
|
|
|
| BALANCE SHEETS |
December 31, |
| ASSETS |
2022 |
|
2021 |
| Interest-Bearing Deposits with Subsidiary Banks |
$ |
1,532 |
|
|
$ |
232 |
|
|
|
|
|
| Equity Securities |
2,174 |
|
|
1,747 |
|
|
|
|
|
| Investment in Subsidiaries at Equity |
354,664 |
|
|
377,163 |
|
| Other Assets |
16,458 |
|
|
13,061 |
|
| Total Assets |
$ |
374,828 |
|
|
$ |
392,203 |
|
| LIABILITIES |
|
|
|
Junior Subordinated Obligations Issued to
Unconsolidated Subsidiary Trusts |
$ |
20,000 |
|
|
$ |
20,000 |
|
| Other Liabilities |
1,290 |
|
|
1,017 |
|
| Total Liabilities |
21,290 |
|
|
21,017 |
|
| STOCKHOLDERS’ EQUITY |
|
|
|
| Total Stockholders’ Equity |
353,538 |
|
|
371,186 |
|
| Total Liabilities and Stockholders’ Equity |
$ |
374,828 |
|
|
$ |
392,203 |
|
|
|
|
|
|
|
|
|
|
|
|
|
|
|
|
|
|
|
|
| STATEMENTS OF INCOME |
Years Ended December 31, |
|
| Income: |
2022 |
|
2021 |
|
2020 |
|
| Dividends from Bank Subsidiaries |
$ |
19,264 |
|
|
$ |
15,994 |
|
|
$ |
17,199 |
|
|
| Interest and Dividends on Investments |
49 |
|
|
49 |
|
|
49 |
|
|
| Other Income (Including Management Fees) |
1,095 |
|
|
664 |
|
|
246 |
|
|
|
|
|
|
|
|
|
| Total Income |
20,408 |
|
|
16,707 |
|
|
17,494 |
|
|
| Expense: |
|
|
|
|
|
|
| Interest Expense |
685 |
|
|
686 |
|
|
746 |
|
|
|
|
|
|
|
|
|
| Other Expense |
1,030 |
|
|
879 |
|
|
878 |
|
|
| Total Expense |
1,715 |
|
|
1,565 |
|
|
1,624 |
|
|
| Income Before Income Tax Benefit and Equity |
|
|
|
|
|
|
| in Undistributed Net Income of Subsidiaries |
18,693 |
|
|
15,142 |
|
|
15,870 |
|
|
| Income Tax Benefit |
257 |
|
|
312 |
|
|
431 |
|
|
| Equity in Undistributed Net Income of Subsidiaries |
29,849 |
|
|
34,403 |
|
|
24,526 |
|
|
| Net Income |
$ |
48,799 |
|
|
$ |
49,857 |
|
|
$ |
40,827 |
|
|
The Statement of Changes in Stockholders’ Equity is not reported because it is identical to the Consolidated Statement of Changes in Stockholders’ Equity.
|
|
|
|
|
|
|
|
|
|
|
|
|
|
|
|
|
|
| STATEMENTS OF CASH FLOWS |
Years Ended December 31, |
|
2022 |
|
2021 |
|
2020 |
| Cash Flows from Operating Activities: |
|
|
|
|
|
| Net Income |
$ |
48,799 |
|
|
$ |
49,857 |
|
|
$ |
40,827 |
|
| Adjustments to Reconcile Net Income to Net Cash Provided by Operating Activities: |
|
|
|
|
|
| Undistributed Net Income of Subsidiaries |
(29,849) |
|
|
(34,403) |
|
|
(24,526) |
|
|
|
|
|
|
|
| Shares Issued Under the Directors’ Stock Plan |
408 |
|
|
376 |
|
|
125 |
|
|
|
|
|
|
|
| Changes in Other Assets and Other Liabilities |
(754) |
|
|
(462) |
|
|
(3,606) |
|
| Net Cash Provided by Operating Activities |
18,604 |
|
|
15,368 |
|
|
12,820 |
|
|
|
|
|
|
|
|
|
|
|
|
|
|
|
|
|
|
|
|
|
|
|
|
|
|
|
|
|
|
|
| Cash Flows from Financing Activities: |
|
|
|
|
|
| Stock Options Exercised |
631 |
|
|
1,505 |
|
|
748 |
|
| Shares Issued Under the Employee Stock Purchase Plan |
477 |
|
|
481 |
|
|
513 |
|
| Shares Issued for Dividend Reinvestment Plans |
1,904 |
|
|
1,836 |
|
|
1,808 |
|
|
|
|
|
|
|
| Purchase of Treasury Stock |
(2,872) |
|
|
(2,662) |
|
|
(1,578) |
|
| Cash Dividends Paid |
(17,444) |
|
|
(16,296) |
|
|
(15,740) |
|
| Net Cash Used in Financing Activities |
(17,304) |
|
|
(15,136) |
|
|
(14,249) |
|
| Net Increase (Decrease) in Cash and Cash Equivalents |
1,300 |
|
|
232 |
|
|
(1,429) |
|
| Cash and Cash Equivalents at Beginning of the Year |
232 |
|
|
— |
|
|
1,429 |
|
| Cash and Cash Equivalents at End of the Year |
$ |
1,532 |
|
|
$ |
232 |
|
|
$ |
— |
|
Supplemental Disclosures to Statements of
Cash Flow Information: |
|
|
|
|
|
| Interest Paid |
$ |
685 |
|
|
$ |
686 |
|
|
$ |
746 |
|
|
|
|
|
|
|
|
|
|
|
|
|
Note 22:RELATED PARTY TRANSACTION
A member of the GFNB Board of Directors, is the Chief Executive Officer of the general contractor leading the multi-year renovation project to enhance and improve the downtown Glens Falls Main Campus. The reconstruction will provide added energy efficiency and more collaborative work space. In 2022, Arrow paid $10.9 million to this general contractor. GFNB is a subsidiary of Arrow Financial Corporation.
Note 23:SUBSEQUENT EVENTS
Effective May 12, 2023, Mr. Murphy terminated his employment as President and CEO and as a director of the Company and all other positions he held with the Company and its affiliates. Effective May 13, 2023, the Company appointed David S. DeMarco to serve as President and CEO of the Company and GFNB, in addition to continuing to serve as President and CEO of SNB.
The Company became aware that on June 23, 2023, Robert C. Ashe filed a putative class action complaint against the Company in the United States District Court for the Northern District of New York. In addition to the Company, the complaint names as defendants Thomas J. Murphy, the Company’s former CEO and from September 30, 2022, to February 20, 2023, its interim CFO, Edward J. Campanella, the Company’s former CFO, and Penko Ivanov, the Company’s current CFO (“Individual Defendants” and, together with the Company, the "Defendants"). The complaint alleges that the Defendants made materially false and misleading statements regarding the Company’s business, operations and compliance policies in the Company’s public filings between March 12, 2022 and May 12, 2023. The complaint further alleges that the Individual Defendants are liable for these materially false and misleading statements as "controlling persons" of the Company. Based on these allegations, the complaint brings two claims for violations of Section 10(b) of the Exchange Act and Rule 10b-5 promulgated thereunder and of Section 20(a) of the Exchange Act. Mr. Ashe, on behalf of a purported class of shareholders, seeks compensatory damages as well as recovery of the costs and fees associated with the litigation. The Company believes the lawsuit to be without merit and expressly denies any wrongdoing in connection with the matters claimed in the complaint and intends to vigorously defend the lawsuit. As of the date of filing of this Form 10-K, the Company has not been served with the complaint.
Item 9. Changes in and Disagreements with Accountants on Accounting and Financial Disclosure - None.
Item 9A. Controls and Procedures
Management, under the supervision and with the participation of the Chief Executive Officer (who is our principal executive officer) and Chief Financial Officer (who is our principal financial officer), evaluated the effectiveness of our disclosure controls and procedures, as defined in Rule 13a-15(e) and 15d15(e) of the Securities Exchange Act of 1934, as amended (the "Exchange Act"), as of December 31, 2022. The term "disclosure controls and procedures" means controls and other procedures of a company that are designed to ensure that:
•information required to be disclosed by a company in the reports that it files or submits under the Exchange Act is recorded, processed, summarized and reported, within the time periods specified in the SEC’s rules and forms; and
•information required to be disclosed by a company in the reports that it files or submits under the Exchange Act is accumulated and communicated to management, including the principal executive and principal financial officers, or persons and committees performing similar functions, such as the Audit Committee, as appropriate to allow timely decisions regarding required disclosure.
Based on that evaluation, our Chief Executive Officer and Chief Financial Officer concluded that as of December 31, 2022, our disclosure controls and procedures were not effective due to a material weakness in internal controls over financial reporting described below under the heading "Management's Annual Report on Internal Control Over Financial Reporting." We have in place and are executing a remediation plan to address the material weakness described below.
Following identification of the material weakness and prior to filing this Form 10-K, we performed relevant and responsive substantive procedures as of December 31, 2022 and for the year then ended, in order to complete our financial statements and related disclosures. Based on these procedures, Management believes that our consolidated financial statements included in this Form 10-K have been prepared in accordance with GAAP. Our Chief Executive Officer and Chief Financial Officer have certified that, based on their knowledge, the financial statements, and other financial information included in this Form 10-K, fairly present in all material respects the financial condition, results of operations, and cash flows of the Company as of the dates, and for the periods presented in this Form 10-K for 2022.
Management’s Report on Internal Control Over Financial Reporting
Management conducted an assessment, under the supervision and with the participation of our Chief Executive Officer and Chief Financial Officer under the oversight of our Board of Directors, of the effectiveness of our internal control over financial reporting as of December 31, 2022, based on criteria established in Internal Control - Integrated Framework (2013) issued by the COSO. Based on this evaluation, management concluded that our internal control over financial reporting was not effective as of December 31, 2022, because of the following material weaknesses identified in our internal control over financial reporting:
•We did not maintain effective monitoring controls related to 1) Internal Audit’s testing of management’s internal control over financial reporting, 2) the completeness and accuracy of information presented to the Audit Committee by Internal Audit, and 3) the related Audit Committee oversight over Internal Audit’s testing of management’s internal control over financial reporting.
•With regard to the conversion of our core banking information technology system, we did not effectively perform risk assessment procedures to identify the impact of the conversion on our internal control over financial reporting.
Management concluded that these material weaknesses were primarily due to:
•The Company did not have an effective control environment. Specifically, it did not effectively establish structure, authority and responsibility to support a functioning system of internal control. The Company’s Audit Committee did not demonstrate sufficient oversight of Internal Audit’s monitoring of management’s design, implementation and conduct of internal control over financial reporting. The Company did not have sufficient internal resources with appropriate knowledge and expertise to design and implement, document and operate effectively certain internal controls over financial reporting and certain information technology systems. The Company did not have sufficient training of personnel on the COSO 2013 Framework and its implications on financial reporting and their related internal control responsibilities. Additionally, the Company did not have effective policies and procedures that held personnel accountable for defined internal control responsibilities.
•The Company did not have an effective risk assessment process that successfully identified and assessed risks of misstatement to ensure controls were designed and implemented to respond to the risks associated with the core banking information technology system conversion. The Company did not adequately communicate the changes necessary in financial reporting and related internal controls throughout its organization.
•The Company did not have an effective information and communication process that identified and assessed the source of and controls necessary to ensure the reliability of information used in financial reporting to the Company’s Board of Directors, and communications with relevant third parties.
•The Company did not have effective monitoring activities through Internal Audit to assess the operation of internal control over financial reporting, including the continued appropriateness of control design and level of documentation maintained to support control effectiveness as well as monitoring corrective action to remediate known control deficiencies in a timely manner.
The material weaknesses did not result in a material misstatement of our annual or interim financial statements or previously released financial results.
Management’s Plan to Remediate the Identified Material Weaknesses
During the first quarter of 2023 we initiated, and will continue to implement, measures designed to improve our internal control over financial reporting to remediate the deficiencies that comprised the material weaknesses, including the subsequent engagement of a professional services firm to review the Company’s control program required by the Sarbanes-Oxley Act of 2002, as amended, and assist with overall Company-wide processes and with selecting and developing control activities designed to mitigate risks and support achievement of control objectives. In addition, the Company, including the Audit Committee as it carries out its oversight and monitoring responsibilities, is in the process of evaluating the assignment of responsibilities of internal and external resources associated with the performance of internal controls over financial reporting and will consider hiring additional resources, contracting external resources, and/or providing additional training to existing resources, within the Company and its related oversight bodies as appropriate. In addition, we have initiated a process to identify and maintain the information required to support the functioning of internal controls over financial reporting and to establish and reinforce communication protocols within the Company and related oversight bodies, including the sharing of required information and expectations to enable personnel to perform internal control responsibilities (e.g., formal training programs and corporate communications). Lastly, the Company, including the Audit Committee as it carries out its oversight and monitoring responsibilities, will ensure that a risk assessment is performed when changes to existing information technology systems and/or business processes are taking place, to identify and assess risks of material misstatement with changes to existing controls and ensure that the financial reporting processes and related internal controls are in place to respond to those risks in our internal control over financial reporting.
We are committed to remediating the material weaknesses as promptly as possible and are the process of implementing the remediation plan. We are in the process of designing, implementing, documenting, and testing the effectiveness of these processes, procedures and controls.
The material weaknesses set forth above will not be considered remediated until the applicable remedial controls operate for a sufficient period of time and we have concluded, through management testing, that these controls are operating effectively. We may also conclude that additional measures may be required to remediate the material weaknesses in our internal control over financial reporting.
Even once remediated, internal controls over financial reporting may not prevent or detect all misstatements because of their inherent limitations. Further, no internal control over financial reporting framework can provide absolute assurance that all instances of fraud will be detected and prevented. Additionally, any projections of any evaluation of effectiveness to future periods are subject to the risk that controls may become inadequate because of changes in conditions or that the degree of compliance with policies or procedures may deteriorate.
Changes in Internal Control Over Financial Reporting
No changes in our internal control over financial reporting (as defined in Rules 13a-15(f) and 15d-15(f) under the Exchange Act), other than the material weaknesses described above, occurred during the year ended December 31, 2022, that have materially affected, or are reasonably likely to materially affect, our internal control over financial reporting.
Item 9B. Other Information – None.
Item 9C. Disclosure Regarding Foreign Jurisdictions that Prevent Inspections – None.
PART III
Item 10. Directors, Executive Officers and Corporate Governance
Certain required information regarding our Executive Officers is contained in Part I, Item 1.G. of this Report, "Executive Officers of the Registrant." Arrow has adopted a Financial Code of Ethics applicable to our principal executive officer, principal financial officer and principal accounting officer, a copy of which can be found on our website at www.arrowfinancial.com under the link "Corporate Governance" on the header tab "Corporate."
Director Nomination Process:
The Governance Committee is responsible for identifying and recommending to the full Board suitable nominees to serve as Directors, including incumbents. Director nominees are selected and based upon the following criteria:
•Individual Strengths: The candidate’s knowledge, skill, experience and expertise
•Board Composition: The objective of achieving certain characteristics for the Board as a group, such as diversity of background, occupation, viewpoint, ethnicity, race, gender and other attributes
•Succession Planning: Balance among age groups from those who are in mid-career to those nearing or recently entered into retirement
Additionally, the Governance Committee will not generally recommend a new candidate for nomination unless the candidate has demonstrated notable leadership and accomplishment in business, higher education, politics and/or cultural endeavors. The Governance Committee further assesses a candidate’s understanding of the regulatory and policy environment in which the Company does business and the candidate's interest in the communities served by the Company. Other factors considered by the Governance Committee include a candidate’s personal character, integrity and financial acumen. For candidates with prior experience as a Director of the Company or one of its subsidiaries, such candidate's service record will be an important factor in evaluating the desirability of the candidate's continuing service as a Director. Generally, Directors may not serve on the boards of more than two other public companies and may not serve on the board of any other public company whose principal business is financial services.
To identify new candidates for Director, the Governance Committee will employ its own search protocols, seek suggestions from Management and consider any Director nominee proposals it properly receives from shareholders. The same screening process is applied to all suggested candidates, regardless of the source. The Board will give substantial weight to the recommendations of the Governance Committee in selecting Director nominees for election and in filling Director vacancies. Under normal circumstances, the Board will not select nominees, including incumbent Directors, who have not been recommended by a majority of the members of the Governance Committee. For information on how shareholders may participate in the Director nomination process, see “Shareholder Submissions of Director Nominees for the 2024 Annual Meeting” in the Additional Shareholder Information section.
Individual strengths and skills, diversity, experience, composition and succession planning are considered by the Governance Committee when identifying and approving new board candidates. The diversity composition of the Board is set forth in the following table:
|
|
|
|
|
|
|
|
|
|
|
|
|
|
|
| Board Diversity Matrix as of June 1, 2023 |
| Total Number of Directors |
9 |
|
Female |
Male |
Non-Binary |
Did Not Disclose Gender |
| Part I: Gender Identity |
|
|
|
|
| Directors |
2 |
7 |
— |
|
— |
|
| Part II: Demographic Background |
|
|
|
|
| African American or Black |
— |
|
1 |
— |
|
— |
|
| Alaskan Native or Native American |
— |
|
— |
|
— |
|
— |
|
| Asian |
— |
|
— |
|
— |
|
— |
|
| Hispanic or Latinx |
— |
|
— |
|
— |
|
— |
|
| Native Hawaiian or Pacific Islander |
— |
|
— |
|
— |
|
— |
|
| White |
2 |
6 |
— |
|
— |
|
| Two or More Races or Ethnicities |
— |
|
— |
|
— |
|
— |
|
| LGBTQ+ |
— |
| Did Not Disclose Demographic Background |
— |
Director Biographies:
We have prepared the following biographies to provide shareholders with detailed information about each Director of the Company, including areas of strength. No specific minimum qualification standards have been established.
|
|
|
|
|
|
|
Mark L. Behan
Mr. Behan, age 62, became a Director of the Company on January 1, 2017; he has been a Director of GFNB and SNB, since 2015 and April 2022, respectively. Mr. Behan founded Behan Communications Inc. in 1988; the company is a public affairs and strategic communications firm serving national and regional clients and is an adviser to chief executives in major businesses and non-profit organizations in the Capital Region of New York State. Mr. Behan is a director or trustee of several non-profit organizations. Mr. Behan is a graduate of Colgate University. Mr. Behan is also a former newspaper executive with extensive knowledge of the economic, political and community issues of the Capital Region and the Adirondacks.
|
|
|
|
|
|
|
|
Gregory J. Champion
Mr. Champion, age 68, became a Director of the Company on May 5, 2021; he has been a Director of GFNB and SNB since April 2018 and April 2022, respectively. . Mr. Champion brings over 30 years of legal experience, including advising both privately-held and publicly-traded companies on corporate governance matters and serving as corporate secretary of both privately-held and publicly- traded companies. Mr. Champion has a B.A. from St. Lawrence University and a J.D. (summa cum laude) from Syracuse University College of Law. Mr. Champion serves as Executive Vice President, Legal, for Syncromune, Inc., a startup company seeking to develop intratumoral immunotherapy treatment for metastatic cancer patients.
|
|
|
|
|
|
|
|
Elizabeth A. Miller
Ms. Miller, age 69, has been a Director of the Company since January 2017; she has been a Director of GFNB and SNB since 2015 and April 2022, respectively. Ms. Miller is President and the CEO of Miller Mechanical Services, Inc. in Glens Falls, New York and Chair of Doty Machine Works in Fort Edward, New York. Ms.Miller is a leading commercial and residential investor in Downtown Glens Falls. She holds bachelor’s and master’s degrees from the College of Saint Rose. Ms. Miller has a strong understanding of the community and its business base, particularly local manufacturing.
|
|
|
|
|
|
|
|
William L. Owens, Esq.
Mr. Owens, age 74, has been a Director of the Company and GFNB since 2015; he has been a Director of SNB since April 2022. Mr. Owens was elected Chairman of the Board in May 2023. Mr. Owens is a former U.S. Congressman who represented New York’s 21st District from 2009 to 2014. Prior to his election to Congress, he was a managing partner at Stafford, Owens, Piller, Murnane, Kelleher & Trombley, PLLC, a Plattsburgh, New York law firm, where he practiced business and tax law for more than 30 years. In 2015, he rejoined the firm as a partner and resumed his role as Managing Partner in 2016. He also serves as Senior Advisor for Dentons, an international law firm. Mr. Owens holds a bachelor’s degree from Manhattan College and a law degree from Fordham University. He has a unique understanding of the North Country, specifically the Plattsburgh market, and is a leading authority on US Canada trade issues.
|
|
|
|
|
|
|
|
David G. Kruczlnicki
Mr. Kruczlnicki, age 70, has been a Director of the Company since 1989; he has been a Director of SNB since 2015 and a Director of GFNB since April 2022. He previously served 26 years as a Director of GFNB. Mr. Kruczlnicki is President of a consulting firm that advises nonprofits on business planning and teaches at Siena College and Clarkson University Graduate School, and UNC/Chappel Hill. He was President and CEO of Glens Falls Hospital, a large regional medical center, from 1989 until his retirement in 2013. Mr. Kruczlnicki received a bachelor’s degree from Siena College and a master’s degree from Rensselaer Polytechnic Institute. He also served on the board of directors of several affiliates of Glens Falls Hospital, numerous other health-related organizations, and Pruyn & Company, a local, privately owned paper company. As a former health care executive, Mr. Kruczlnicki has significant experience overseeing finance and human resources as well as directorship experience from his service as a director of numerous private and regional organizations.
|
|
|
|
|
|
|
|
Raymond F. O’Conor
Mr. O'Conor, age 68, became a Director of the Company on January 1, 2017; he has been a Director of SNB since 1996 and Chairman of the SNB Board since 2001; he has also served as a Director of GFNB since April 2022. He was a Senior Vice President of the Company from 2009 until his retirement in 2012 and also served as President and CEO of SNB from 1995 until his retirement at the end of 2012. Mr. O’Conor is also a published author and CEO of Saratoga County Capital Resource Corporation, a community development agency. He has an extensive knowledge of community banking, and more specifically, the Company, as a former member of the executive management team.
|
|
|
|
|
|
|
|
Tenée R. Casaccio, AIA
Ms. Casaccio, age 57, has been a Director of the Company since January 2014; she has also served as a Director of GFNB and SNB since 2010 and April 2022, respectively. Ms. Casaccio has served as President of JMZ Architects, a specialized architectural firm and Planners, PC, a nationally-certified Women Owned Business Enterprise and specialized planning firm located in Glens Falls, since 2009. She earned a Bachelor of Architecture degree from Virginia Tech and holds licenses to practice architecture in New York and several other states. Ms. Casaccio has been with JMZ Architects since 1993. She has significant executive experience and a strong understanding of the New York State business climate.
|
|
|
|
|
|
|
|
Gary C. Dake
Mr. Dake, age 62, has been a Director of the Company since 2003; he has also served as a Director of SNB and GFNB since 2001 and April 2022, respectively. Mr. Dake is President of Stewart’s Shops Corp., a large, privately owned, vertically integrated, multi-state convenience store chain. Mr. Dake holds a bachelor’s degree from St. Lawrence University. He has experience with large business operations as a result of his management of Stewart’s, which also gives him a unique and broad understanding of the many communities the Company serves.
|
|
|
|
|
|
|
|
Colin L. Read, PhD
Mr. Read, age 63, has been a Director of the Company since 2013; he has also served as a Director of GFNB and SNB since 2010 and April 2022, respectively. Dr. Read is a professor of economics and finance in the State University of New York system. He served as Mayor of the City of Plattsburgh, New York for four years, after three years of service on the Clinton County Legislature. He is president of ESG Analytics Group, has taught money and finance since 1987, and teaches sustainability. He is a published author, with various contributions to print, online and television media, as well as 12 books on global finance. Dr. Read has a PhD in economics from Queen’s University, an MBA from the University of Alaska, a law degree from the University of Connecticut, and a master’s degree in Taxation from the University of Tulsa. His expertise in economics and understanding of the Plattsburgh, New York area are key strengths.
|
Item 11. Executive Compensation
Executive Compensation
The Company's Named Executive Officers for 2022 were Thomas J. Murphy, our then President and CEO and, from September 30, 2022, until February 2023, Interim Treasurer, CFO and PAO; David S. DeMarco, Senior Executive Vice President and Chief Banking Officer ("CBO"); David D. Kaiser, Senior Executive Vice President and Chief Credit Officer ("CCO"); Andrew J. Wise, Senior Executive Vice President and Chief Operating Officer ("COO") and Edward J. Campanella, Senior Executive Vice President, Treasurer and CFO until his resignation which was effective September 30, 2022.
Compensation Discussion and Analysis
This Compensation Discussion and Analysis section provides our shareholders with an explanation of our Named Executive Officer compensation philosophies, programs, process, decisions, and other relevant information. It is organized as follows:
•Overview
•Philosophy and Program
•Process
•Decisions
•Other
Overview:
The following section provides an overview of our business, 2022 performance and our key compensation actions.
Business Environment and Performance
Arrow Financial Corporation delivered another year of strong financial results in 2022 with record loan growth, excellent earnings and sustained profitability.
In 2022, we made key investments in our technology and our team, with the upgrade to our core banking system and the payment of a special employee bonus for outstanding performance. We made meaningful contributions to our customers, employees, shareholders and the communities we serve. Our measured and thoughtful approach keeps us focused on organic growth, expense management and deepening and growing relationships. Arrow’s conservative business model emphasizes a strong capital position, high loan quality, knowledge of our market and responsiveness to our customers. We outperformed comparable community bank benchmarks for shareholder return performance over one-year, three-year, and five-year periods of time. Summary results for the fiscal year ended December 31, 2022 include:
In addition to our total shareholder return performance, we also highlight several important financial achievements in 2022.
|
|
|
|
|
|
|
|
|
2022 Returns |
2022 Growth |
2022 Asset Quality |
|
A 3% stock dividend was distributed to shareholders during 2022.
Cash dividends paid effectively increased 3%.
Return on average equity (ROE) was 13.55%, compared to 14.09% for 2021.
Return on average assets (ROA) was 1.21%, compared to 1.28% for 2021.
|
The loan portfolio reached a record high, increasing 11.8% to $2.98 billion.
Total deposit balances were $3.5 billion.
|
Asset quality remained strong, nonperforming assets represented 0.32% of total assets at December 31, 2022.
Allowance for net loan losses represented 1.00% of period-end loans at December 31, 2022.
|
Compensation Program Overview
Our compensation program includes several integrated elements designed to retain and appropriately award our NEOs, enhance the long-term profitability of the business within acceptable risk parameters, align the financial interests of our NEOs with the interests of our shareholders and support a total rewards approach to executive compensation. Below is a short listing of the elements of pay and their relative magnitude for our CEO and other NEOs.
Key Compensation Decisions and Actions
The business environment and our performance impacted various compensation decisions. The following is a summary of key decisions and actions regarding executive compensation in 2022 and early 2023.
•Base Salary Adjustments: The Compensation Committee approved merit and market-based salary increases for each NEO in January of 2022. Recognizing the uncertainty of current macro-economic forecasts, at the request of Management, the Compensation Committee approved no salary increases for the NEOs for 2023 but plans to revisit salary increases later in the year.
•Short-Term Incentive Plan (“STIP”) Awards: In February of 2023, awards were made to our NEOs based on the achievement of specified Company and individual performance results for fiscal year 2022. Actual bonus payouts as a percentage of target were 112% on average in 2022 for our NEOs. These awards reflected increased target STIP opportunities for our NEOs other than our CEO, moving from a 30% of base salary target to 40% of base salary. The increases were intended to better align the NEOs' target bonus opportunity with competitive market practice. Additionally, last year in 2022 the Compensation Committee approved the mix of corporate and individual goals for 2022 bonus calculations. Further details are available under the "STIP Award Decisions" section of the CD&A.
•Long-Term Incentive Plan Awards: In January of 2022, grants of stock options were made to the NEOs under the 2013 LTIP. These awards were made to better align our NEOs' interests with those of our shareholders and to foster a long-term performance orientation. The awards vest ratably in four equal annual installments which helps promote retention.
•Restricted Stock Unit Award: In January of 2022, the CEO was awarded RSUs that vest after three years and will be distributed ratably over 10 years post-retirement.
•New Employment Agreements: On February 1, 2023, the Company entered into new employment agreements with each of Messrs. Murphy, DeMarco, Kaiser and Wise that were substantially similar to their existing employment agreements. The employment agreements are described in more detail in the Agreements with Named Executive Officers section, below.
•CEO Transition: Effective May 12, 2023, Mr. Murphy terminated his employment as President and CEO and as a director of the Company and all other positions he held with the Company and its affiliates. Effective May 13, 2023, the Company appointed Mr. DeMarco to serve as President and CEO of the Company and GFNB, in addition to continuing to serve as President and CEO of SNB. Mr. DeMarco's compensation remains as set forth in the employment agreement entered into in February 2023.
•CFO Transition: Our former Senior Executive Vice President, Treasurer and CFO, Edward J. Campanella, resigned effective September 30, 2022. Effective October 1, 2022, the Company and Mr. Campanella signed a six-month Professional Services Agreement, under which Mr. Campanella agreed to hold himself available to render advice and assistance to Arrow and oversee certain projects for the Company at the request of the CEO of Arrow. In exchange for these services, Mr. Campanella received $5,000 per week, plus approved out-of-pocket expenses. The agreement terminated March 31, 2023.
•New CFO: Penko Ivanov was appointed Chief Financial Officer, Executive Vice President, Treasurer and Chief Accounting Officer effective February 21, 2023. He received a compensation package that is customary with our compensation packages for our other NEOs. Mr. Ivanov's employment agreement is similar to the employment agreements with Messrs. DeMarco, Kaiser, and Wise, and is described in more detail in the Agreements with Named Executive Officers section, below.
Philosophy and Program:
The following section describes our overall compensation philosophy and program elements. Our executive compensation program is designed to attract and retain key executives and to motivate our executives to improve the Company’s long-term profitability within acceptable risk parameters. We accomplish this through a number of compensation elements, each with its own purpose, operation, and timing.
Base Salary
•Purpose: Provide fixed compensation for performance of the requirements of the position.
•Operation: In setting or adjusting base salary levels for our NEOs, the Company may consider the following factors: the executive’s position, recent promotions, Company and individual performance, market compensation information, experience, professional standing in the field of banking and financial services and commitment to the community.
•Timing: Base salaries for new hires are set as part of the negotiation process when individuals are being recruited. Base salaries for our NEOs are subsequently reviewed and approved annually by the Compensation Committee, typically in January, so the Compensation Committee can take into account performance results from the complete prior fiscal year, as well as any proposed organizational changes.
STIP
•Purpose: Reward Company and individual performance relative to our annual performance goals.
•Operation: Our STIP is based on a comprehensive quantitative and qualitative assessment of both Company and individual performance. In setting goals under the STIP, the Compensation Committee considers multiple inputs, including but not limited to: specific financial goals, trend analysis regarding our financial performance, general business and economic outlook, and individual goals and objectives. The Compensation Committee, in its sole discretion, will determine, on a case-by-case basis, whether an NEO will receive a bonus award for the year and, if so, the amount of this bonus.
•Timing: The Compensation Committee meets at the beginning of each year to determine the STIP awards for the previous year when the Company’s final year-end performance is generally known and can be accurately measured. At the same meeting, the Compensation Committee also typically sets the STIP goals for the current year.
2022 LTIP
•Purpose: Align the interests of our NEOs with those of our shareholders and foster a long-term performance orientation.
•Operation: Long-term incentive compensation is provided through the Company’s 2022 LTIP. The 2022 LTIP allows for grants of various types of equity awards, such as restricted stock, RSUs and stock options. Historically, the Company has provided long-term incentive compensation in the form of stock options, which only provide value to our NEOs if the Company’s stock price increases. Stock options vest 25% per year over a four-year period which promotes participant retention. The stock options have a term of 10 years, which we believe effectively focuses management on long-term performance. In 2018, we expanded the use of long-term incentives to include RSUs for Mr. Murphy. The RSUs granted in 2022 vest 100% after three years but vested awards are not settled until after Mr. Murphy's employment has terminated. The Compensation Committee believed that this was an effective method of providing Mr. Murphy with retirement-related benefits that are commensurate with his role in a shareholder-friendly manner.
•Timing: The Company’s annual stock option awards and RSUs are generally granted in January each year, shortly after the close of the Company’s fiscal year.
Executive Benefits
•Purpose: The executive benefit program is intended to provide appropriate security and benefits for our NEOs, allowing them to focus on managing the business.
•Operation: Generally, NEOs are eligible for the benefits package we offer to our full-time employees, which includes medical, dental, life/long-term disability insurance and qualified retirement plans. In addition, our executive compensation program includes a Supplemental Executive Retirement Plan ("SERP"), Deferred Compensation Plan, limited executive perquisites (the personal use of a company automobile, reimbursement of country club dues and a golf course membership, as applicable), and Employment Agreements. See the following sections for additional information on these programs:
◦"Pension Benefits and Table" - contained in the Executive Compensation section
◦"Nonqualified Deferred Compensation" - contained in the Executive Compensation section
◦Agreements With Named Executive Officers section
•Timing: All forms of executive benefits are reviewed and approved by the Compensation Committee on an annual basis.
The Compensation Committee believes these four components – base salary, short-term incentives, long-term incentives, and executive benefits – comprise a total compensation program that retains and appropriately rewards NEOs, aligns the financial interests of our NEOs with the interests of our shareholders, and supports a total rewards approach to executive compensation. While we have no stated policy on the allocation of compensation and benefits, our executive compensation program is reviewed at least annually by the Compensation Committee to ensure that various considerations such as fixed versus variable, short-term versus long-term, cash versus equity-based compensation, and benefits provided are and remain appropriate considering competitive pressure and the Company’s primary business objectives.
Compensation Policies & Features
In addition to our compensation elements, the executive compensation program also incorporates the following policies and features which the Compensation Committee feel are important aspects of a well-constructed, balanced compensation program.
•Hedging and Pledging Policies: The Company has hedging and pledging policies for its Directors and Officers who are subject to the SEC’s Section 16 reporting requirements. The policy prohibits Directors and Section 16 Officers from entering into financial transactions designed to hedge or offset any decrease in market value of Company common stock. In addition, the Company requires Board approval prior to the pledging of any Company stock by an NEO. The Company does not have a hedging policy for non-Executive Officer employees.
•Clawback Policy: The Company may seek to recover any incentives paid or payable to an NEO on the achievement of financial or operational goals that subsequently are deemed by the Company to be inaccurate, misstated or misleading. The Company will revisit its policy in light of Section 10D of the Exchange Act and NASDAQ requirements relevant thereto.
•Stock Ownership Policy: The Company has a stock ownership policy for NEOs. NEOs are required to own shares of the Company’s common stock equal in value to three times base salary for the CEO and equal in value to one times base salary for other NEOs. Until the required ownership is attained, this policy restricts the NEO’s ability to sell shares of the Company’s common stock obtained through the 2022 LTIP (or predecessor plans). These stock ownership requirements are measured each year by the Compensation Committee, using holdings valued as of the Company's annual meeting record date for that year. Common shares owned outright or vested shares held through benefit plans are currently counted toward the stock ownership requirement. Individuals have five years from appointment or promotion to a Company executive officer to meet these requirements. The independent members of the Board have the discretion to address and approve exceptions on a case-by-case basis.
•No Tax Gross-Ups: The Company does not pay any taxes that are owed by its NEOs.
•Double-Trigger Mechanism: Employment agreements for all NEOs include a “double-trigger” mechanism for change-of-control payments.
•No Stock Option Repricing: The Company has never repriced stock options. The 2022 LTIP prohibits repricing without shareholder approval.
Process:
The following section describes the process and key inputs that are considered in making decisions regarding NEO compensation.
Role of the Compensation Committee, Independent Consultants, and Management
Each year the Compensation Committee discusses, reviews, recommends, and approves certain actions related to NEO compensation and our overall compensation program. The Committee utilizes outside advisors in certain cases to assist them in the review and decision-making process. Additionally, certain members of the management team assist in developing materials and proposals that support our compensation philosophy and objectives for the Compensation Committee to consider during the year.
•The Compensation Committee: Oversees our executive compensation policies and process. The Committee is responsible for the final decisions on components of executive compensation for the CEO and the other NEOs and makes recommendations to the full Board as needed. The Compensation Committee is also responsible for reviewing and approving all aspects of compensation of our CEO and other NEOs, and it receives input from the CEO and the full Board on key compensation policy issues.
•The Committee’s Independent Consultant: The Compensation Committee retained the services of Pearl Meyer & Partners, LLC (“Pearl Meyer”) to provide assistance regarding executive compensation and support with compensation policies and proxy disclosure. Pearl Meyer performed a comprehensive review of the executive compensation program in 2019 to provide context for 2020 pay decisions. Pearl Meyer provided no other consulting services for the Company in 2022 and has certified its independence for the Committee.
•Company Management: Our CEO provides the Compensation Committee with an annual review of his own goals for the Company, including broad performance and individual goals, as well as a performance assessment for each of the other NEOs. Management also provides information and data on Company and individual performance and executive compensation to the Compensation Committee. Although our CEO provides insight and recommendations regarding NEO compensation, the Compensation Committee votes on decisions regarding NEO compensation. Where appropriate, the Board will also make recommendations or determinations or give its approval regarding NEO compensation. Although the Compensation Committee meets with our CEO to obtain his views, goals and assessments regarding compensation matters, as discussed above, the decisions regarding his compensation package are made solely by the Compensation Committee without the CEO or other NEOs present.
Benchmarking
In setting program targets and making compensation decisions, the Compensation Committee uses a variety of data sources and information related to market practices for bank holding companies like ours.
The Compensation Committee considers a select number of key inputs, summarized below, to provide market-competitive information for base salary, short and long-term incentive targets, and estimated total direct compensation, with ranges for performance.
This information allows the Compensation Committee to see potential pay and range of pay for executive roles, and it provides context for the Committee in setting targeted pay levels going forward.
On an annual basis, the Compensation Committee conducts a peer review of benchmarking data through the Company's participation in the annual NYBA Pearl Meyer Report. Additionally, the group periodically commissions an independent outside consulting firm to conduct a comprehensive review of the Company’s executive compensation program, most recently in 2019. This review conducted by Pearl Meyer ("Pearl Meyer Report”) provides an independent and objective analysis of all elements of compensation, individually and in aggregate, relative to market and peer group practices.
A primary data source used in the Pearl Meyer Report for determining the competitive market for NEO compensation was the information publicly disclosed by a peer group of other publicly traded banks. This peer group was developed by Pearl Meyer using objective parameters that reflect bank holding companies of similar asset size located in our general geographic region.
The Pearl Meyer Report's 2019 peer group, which is listed below, consisted of 20 companies in the Northeast that ranged from approximately $1.7 billion to $5.2 billion in assets, positioning the Company at approximately the median for size at the time of the Pearl Meyer Report:
|
|
|
|
|
|
|
|
|
|
ACNB Corporation
Bar Harbor Bankshares
WSFS Bank
Camden National Corporation
Chemung Financial Corporation
CNB Financial Corporation
Codorus Valley Bancorp, Inc.
|
Enterprise Bancorp, Inc.
Financial Institutions, Inc.
First Community Bankshares, Inc.
Premier Financial Corp.
HarborOne Bancorp, Inc.
Orrstown Financial Services, Inc.
Peapack-Gladstone Financial Corporation
|
Peoples Bancorp Inc.
Peoples Financial Services Corp.
The First Bancorp, Inc.
Univest Financial Corporation
Washington Trust Bancorp, Inc.
Western New England Bancorp, Inc.
|
In addition to the peer group data, the Pearl Meyer Report used data from other banking industry surveys representing bank holding companies of similar asset size and regions to that of the Company.
Previous Say-on-Pay Vote Results
We strive to continually deliver a compensation program that is aligned with our business strategy and needs, compensation philosophy and objectives, and market best practices. In 2022, 94% of our votes cast were in favor of our “say-on-pay” vote.
Decisions:
The following section describes the decisions made regarding NEO compensation.
January 2022 Base Salary Decisions
The Compensation Committee met in January 2022 to review the current base salaries for our NEOs. The Committee reflected on corporate and individual executive performance for 2021 in determining any merit-based increases. In addition, the Committee reviewed the competitiveness of current salary levels to comparable companies. The Compensation Committee approved the base salaries below for the Named Executive Officers effective January 1, 2022. The nature of each increase is also described in the table below.
|
|
|
|
|
|
|
|
|
|
|
|
|
|
|
|
|
|
Named
Executive Officer |
2021
Salary |
January 2022 Raise |
2022
Salary |
Nature of Increase |
| % of Base Salary |
Amount |
| Thomas J. Murphy |
$ |
600,000 |
|
8.33 |
$ |
50,000 |
|
$ |
650,000 |
|
Merit and Market-Based |
| Edward J. Campanella |
300,000 |
|
8.33 |
25,000 |
|
325,000 |
|
Merit and Market-Based |
| David S. DeMarco |
365,000 |
|
8.22 |
30,000 |
|
395,000 |
|
Merit and Additional Responsibilities |
| David D. Kaiser |
300,000 |
|
8.33 |
25,000 |
|
325,000 |
|
Merit and Additional Responsibilities |
| Andrew J. Wise |
300,000 |
|
8.33 |
25,000 |
|
325,000 |
|
Merit and Market-Based |
STIP Award Decisions
Each year, the Compensation Committee sets goals that will result in bonus awards only in years of successful financial performance by the Company. The STIP has a master governor feature that limits the total pool for all participants to 10% of Net Operating Earnings (defined below) after subtracting 7% of fiscal year end shareholders equity. Determining the amount of the annual STIP awards for an NEO consists of the following four-part process. For 2022, each NEO other than Mr. Campanella was eligible to receive an award under the STIP. Mr. Campanella did not receive an award due to his separation from the Company prior to the end of the year.
1.Determining the Individual NEO STIP Funding Maximums: To determine individual NEO STIP maximum bonus payouts for the year, the Compensation Committee uses Internal Net Operating Earnings (“Internal NOE”), which is different from U.S. GAAP in that it represents the net income of the Company before considering significant nonrecurring items, net of tax. The significant nonrecurring items are reviewed by the Compensation Committee on a case-by-case basis to determine their appropriateness for inclusion or exclusion from the calculation. Items are
included to the extent that they are relevant, regularly recurring and deemed to be in the normal course of business operations.
Individual NEO STIP maximums are funded based on Internal NOE performance relative to the stated goals. The interpolations between threshold and target, and target and maximum are to increase the funding by five percentage points for every one percentage point increase in Internal NOE.
|
|
|
|
|
|
|
|
|
|
|
|
|
|
|
| Company Performance Measure |
Threshold Goal |
Target Goal |
Maximum Goal |
Results |
| Internal NOE ($M) |
42.48 |
47.20 |
51.92 |
48.31 |
| Resulting Maximum STIP Funding (% of Target) |
50 |
100 |
150 |
111.74 |
Based on our Internal NOE performance, the Committee approved the resulting 111.74% maximum funding level. The individual NEO maximum STIP payout amounts for fiscal year 2022 were as follows:
|
|
|
|
|
|
|
|
|
|
|
|
|
|
|
| Named Executive Officer |
Base Salary |
Target STIP % |
Target STIP Amount |
Maximum STIP Payout Opportunity |
| Thomas J. Murphy |
$ |
650,000 |
|
50 |
$ |
325,000 |
|
363,170 |
|
| David S. DeMarco |
395,000 |
|
40 |
158,000 |
|
176,557 |
|
| David D. Kaiser |
325,000 |
|
40 |
130,000 |
|
145,268 |
|
| Andrew J. Wise |
325,000 |
|
40 |
130,000 |
|
145,268 |
|
2.Financial Performance Assessment: The Company then performs an assessment of financial performance using the basket of weighted Company performance measures that were approved at the beginning of the year. The Compensation Committee believes this structure provides an appropriate portfolio of performance goals and a balanced perspective while ensuring sound risk management. In the case of each goal, participants can receive less than the stated amount if the goal is not met, but not greater than such amount if the goal is exceeded. The following table shows the performance measure and goal weighting for 2022:
|
|
|
|
|
|
|
|
|
|
|
|
|
|
|
|
|
|
|
|
|
Company
Performance Measure |
Weighting
for Goals (CEO)
|
Weighting
for Goals (Other NEOs)
|
Target
Goal |
Actual
Achieved |
% Funded (CEO) |
% Funded (Other NEOs) |
| Internal NOE ($M) |
60% |
80% |
$47.20 |
$48.31 |
60.00 |
80.00 |
| ROE (using Internal NOE) |
10% |
5% |
12.15% |
13.42% |
10.00 |
5.00 |
| Efficiency Ratio |
10% |
5% |
55.90% |
54.26% |
10.00 |
5.00 |
| Non-Performing Loans |
10% |
5% |
0.50% |
0.40% |
10.00 |
5.00 |
| Net Charge-Offs |
10% |
5% |
0.15% |
0.08% |
10.00 |
5.00 |
| Total |
100% |
100% |
|
|
100.00 |
100.00 |
3.Individual Performance: The Compensation Committee also performs an overall assessment of each NEO's performance (excluding the CEO for purposes of STIP measurement, since the CEO's goal is weighted 100% to Company performance). The Compensation Committee relies on input from the CEO for assessment of the other NEOs. Based on the CEO's assessment, the Committee approved individual achievement against individual performance goals for each NEO (excluding the CEO) equivalent to the 111.74% maximum funding level, as adjusted for the Financial Performance Assessment.
4.Application of Corporate and Individual Goal Weighting: The next step in determining the NEO’s STIP awards is the application of the relative weighting assigned to Company performance versus individual performance for that NEO. Typically, the relative weighting for NEOs is based on their position with the Company. For 2022, the Compensation Committee approved a change to the mix of corporate versus individual performance for NEOs other than the CEO. Previously, it was a 50% tied to corporate performance and 50% tied to individual performance. For 2022, the mix was adjusted to emphasize corporate performance at 75% and de-emphasize individual performance at 25%. The CEO's mix remained unchanged at 100% corporate performance.
|
|
|
|
|
|
|
|
|
Named
Executive Officer |
Bonus Weighting |
| % Company |
% Individual |
| Thomas J. Murphy |
100 |
0 |
| Edward J. Campanella |
75 |
25 |
| David S. DeMarco |
75 |
25 |
| David D. Kaiser |
75 |
25 |
| Andrew J. Wise |
75 |
25 |
The formula for determining preliminary STIP awards once all information is available and assessments have been performed is as follows. Although there is a formula for determining STIP awards, the Compensation Committee retains full discretion for approving awards to all our NEOs.
|
|
|
|
|
|
|
|
|
|
|
|
|
|
|
|
|
|
|
|
|
|
|
|
|
|
|
|
|
|
| NEO |
Maximum STIP Amount |
Company |
Individual |
Combined Achieve-
ment % |
STIP Funding Amount |
| Achieve-ment % |
Weighting % |
Weighted Achieve-
ment % |
Achieve-ment % |
Weighting % |
Weighted Achieve-
ment % |
| Thomas J. Murphy |
363,170 |
|
111.74 |
100 |
111.74 |
-- |
-- |
-- |
112 |
363,170 |
|
| David S. DeMarco |
176,557 |
|
111.74 |
75 |
83.81 |
111.74 |
25 |
28 |
112 |
176,557 |
|
| David D. Kaiser |
145,268 |
|
111.74 |
75 |
83.81 |
111.74 |
25 |
28 |
112 |
145,268 |
|
| Andrew J. Wise |
145,268 |
|
111.74 |
75 |
83.81 |
111.74 |
25 |
28 |
112 |
145,268 |
|
|
|
|
|
|
|
|
|
|
|
At a meeting in February 2023, the Compensation Committee reviewed the parameters and results of the 2022 STIP award goals for its NEOs. Based on the results of the Company’s performance, the amounts of the STIP awards to be paid under the STIP for Messrs. Murphy, DeMarco, Kaiser and Wise were determined as follows.
|
|
|
|
|
|
|
|
|
|
Named
Executive Officer |
2022 Annual Incentive
Actual Awards
|
|
| Amount |
% of Base Salary |
|
| Thomas J. Murphy |
363,170 |
|
55.9 |
|
| David S. DeMarco |
176,557 |
|
44.7 |
|
| David D. Kaiser |
145,268 |
|
44.7 |
|
| Andrew J. Wise |
145,268 |
|
44.7 |
|
January 2022 Award Decisions Under 2013 LTIP
At its January 2022 meeting, the Compensation Committee awarded stock options to our NEOs consistent with the grants of January 2021. The Compensation Committee has had a long-standing practice of granting a fixed number of stock options to executives that it believes provides a proper incentive for alignment and motivation while maintaining a conservative risk profile. The following stock option awards were granted at an exercise price of $35.83, the closing price of our common stock on the date of grant, and vest ratably over a four-year period. The grant date fair value of such awards was estimated in each case using the Black-Scholes method.
|
|
|
|
|
|
|
|
|
Named
Executive Officer |
Stock Option Grants in
January 2022
(# shares)
|
Grant Date Fair Value of
January 2022 Option Awards
|
| Thomas J. Murphy |
10,000 |
$ |
76,500 |
|
| Edward J. Campanella |
5,000 |
38,250 |
|
| David S. DeMarco |
5,000 |
38,250 |
|
| David D. Kaiser |
5,000 |
38,250 |
|
| Andrew J. Wise |
5,000 |
38,250 |
|
In addition to the annual stock option grants awarded to the NEOs, Mr. Murphy received 4,186 RSUs that vest 100% after three years of service and are settled over a 10-year period beginning one year after his retirement. As adjusted for the 3% stock dividend distributed on September 23, 2022, the RSU grant now contains 4,312 shares. The RSU grant value represented 25% of Mr. Murphy’s fiscal year end base salary at December 31, 2021. The Committee determined to grant this award to Mr. Murphy based on a comprehensive analysis and discussion with the Company’s independent compensation advisor, with the goal of fostering long-term shareholder alignment through and following the executive’s career at the Company.
Executive Benefits Plan Decisions
On February 1, 2022, each of Messrs. DeMarco, Kaiser, Campanella and Wise were promoted to Senior Executive Vice Presidents of the Company and its subsidiary banks as a reflection of the Company's strong operational and financial performance under their leadership, and in acknowledgement of their consistent and anticipated future executive leadership of the organization. The Compensation Committee approved new employment agreements with Messrs. Murphy, DeMarco, Kaiser, and Wise effective February 1, 2023. In connection with his appointment to President and Chief Executive Officer in May 2023 following Mr. Murphy’s termination of employment, Mr. DeMarco’s compensation will remain as set forth in his employment agreement. These agreements are substantially similar to the existing agreements, which our Compensation Committee approves each year. The Company's new CFO also received a similar employment agreement approved by the Compensation Committee.
The Compensation Committee will continue to review the appropriateness of employment agreements on a case-by-case basis. The employment agreements are described in more detail in the Agreements with Named Executive Officers section.
The Compensation Committee did not make any other changes to executive benefits programs or policies, but did provide for the continuation of other programs, such as our Deferred Compensation Plan and limited executive perquisites.
Other Information:
The following are other aspects of our compensation that are material to our overall program, process, and decisions.
Risk Oversight - Compensation
The Board of Directors, Compensation Committee, and Management will continue to ensure that proper policies are maintained to monitor compensation levels carefully to ensure they reflect an appropriate balance of pay-for-performance within acceptable risk parameters. We believe incentive compensation awards should be aligned with the institution’s overall business strategy and support its desired risk profile. To that end, each year Management conducts an internal compensation risk assessment to understand the various elements of its overall compensation program, including all incentives. As part of the exercise, Management annually completes an inventory of our existing compensation programs, including incentives; evaluated the plans; determined the existence of Management and Committee oversight; considered appropriate risk mitigants; and assigned a risk rating based on documentation to support these controls. The Company recognizes that an effective incentive program should encourage and reward appropriate performance and requires an appropriate amount of risk-taking, which is in the long-term benefit of the Company and shareholders. Based on our evaluation, the Company has determined its compensation programs and policies do not create excessive and unnecessary risk taking. Our determination is supported by the following key attributes:
•Our compensation program contains an appropriate balance of fixed and variable compensation.
•The Company offers incentive compensation in multiple forms, including, historically, the award of stock options that vest over time. In addition, the RSU program for our CEO creates significant alignment with shareholders during employment with our Company, assuming he meets the vesting criteria or retirement eligibility.
•Our STIP contains both a threshold and maximum payment, protecting the Company from the extreme levels of risk that accompany unlimited upside incentive compensation programs and inappropriate pay and performance alignment.
•Although there is a formula for determining the dollar amount of the annual STIP bonus awards, the Compensation Committee retains full discretion for making STIP bonus awards to our Executive Officers.
•The Company has share ownership guidelines that further promote and incentivize long-term thinking to serve the best interests of the Company.
•Our benefits programs are competitive with the market and provide for reasonable base line levels of health, welfare and security, further enhancing the risk-mitigating aspects of our overall program.
•We have adopted a “clawback” policy that will allow us to seek to recover any incentive paid or payable to an Executive Officer on the achievement of financial or operational goals that subsequently are deemed by the Company to be inaccurate, misstated or misleading. The Company will revisit its policy in light of Section 10D of the Exchange Act and NASDAQ requirements relevant thereto.
The Company and its Board, including the Compensation Committee, will continue to ensure that proper policies are maintained to monitor ongoing risk management and assessment of compensation practices.
Impact of Accounting and Tax on the Form of Compensation
The Compensation Committee and Management consider the accounting and individual and corporate tax consequences of the compensation plans prior to making changes. The Compensation Committee has considered the impact of the expense, which will be recognized by the Company in accordance with FASB ASC TOPIC 718, on the Company’s use of long-term equity incentives. The Compensation Committee believes it is important and necessary that it retain the discretion to provide and revise compensation arrangements as it determines are in the best interest of the Company and its shareholders, which such compensation may be in excess of $1 million and would not be deductible under the limitations imposed by §162(m) of the IRC, as amended.
Compensation Committee Report:
The Compensation Committee of the Board has reviewed and discussed with Management the Compensation Discussion and Analysis section, as required by Item 402(b) of the SEC’s Regulation S-K and the Compensation Committee’s Charter. Based on its review and discussion, the Compensation Committee has recommended to the Board that the Compensation Discussion and Analysis be included in this Annual Report on Form 10-K.
David G. Kruczlnicki, Chair
Mark L. Behan
Gary C. Dake
William L. Owens
Executive Compensation
This Executive Compensation section includes several tables with details of the compensation actually paid and/or awarded to certain NEOs of the Company for each of the last three fiscal years. Tables included in this section are:
•Summary Compensation
•Grants of Plan-Based Awards
•Outstanding Equity Awards at Fiscal Year-End
•Option Exercises and Stock Vested
•Pension Benefits
Summary Compensation Table:
The following table sets forth information concerning total compensation paid to and compensatory awards received by each of the NEOs for each of the relevant years:
|
|
|
|
|
|
|
|
|
|
|
|
|
|
|
|
|
|
|
|
|
|
|
|
|
|
|
|
|
|
|
Name and
Principal Position |
Year |
Salary |
|
Stock
Awards
(a) |
Option Awards (b) |
Non-Equity
Incentive Plan
Compensation
(c) |
Change in Pension Value and Non-qualified Deferred
Compensation Earnings
(d)
|
All Other Compensation
(f)
|
Total |
Thomas J. Murphy
President and CEO, Interim Treasurer, CFO, and CAO (g) |
2022 |
$ |
650,000 |
|
|
|
$ |
149,984 |
|
$ |
76,500 |
|
$ |
363,170 |
|
$ |
470,237 |
|
$ |
32,313 |
|
$ |
1,742,204 |
|
| 2021 |
600,000 |
|
|
|
139,297 |
|
48,500 |
|
430,229 |
|
908,942 |
|
19,121 |
|
2,146,089 |
|
| 2020 |
560,000 |
|
|
|
135,017 |
|
49,900 |
|
300,960 |
|
614,685 |
|
31,697 |
|
1,692,259 |
|
Edward J. Campanella
former Senior Executive Vice President,
Treasurer and CFO |
2022 |
270,288 |
|
(e) |
|
— |
38,250 |
|
— |
|
19,015 |
|
83,527 |
|
411,080 |
|
| 2021 |
300,000 |
|
|
|
— |
24,250 |
|
129,243 |
|
23,484 |
|
37,052 |
|
514,029 |
|
| 2020 |
275,000 |
|
|
|
— |
24,950 |
|
88,787 |
|
27,601 |
|
19,511 |
|
435,849 |
|
David S. DeMarco
Senior Executive Vice
President and CBO (g) |
2022 |
395,000 |
|
|
|
— |
38,250 |
|
176,557 |
|
98,377 |
|
34,005 |
|
742,189 |
|
| 2021 |
365,000 |
|
|
|
— |
24,250 |
|
157,246 |
|
84,891 |
|
32,522 |
|
663,909 |
|
| 2020 |
340,000 |
|
|
|
— |
24,950 |
|
109,773 |
|
89,043 |
|
31,568 |
|
595,334 |
|
David D. Kaiser
Senior Executive Vice
President and CCO |
2022 |
325,000 |
|
|
|
— |
38,250 |
|
145,268 |
|
71,538 |
|
32,769 |
|
612,825 |
|
| 2021 |
300,000 |
|
|
|
— |
24,250 |
|
129,243 |
|
54,844 |
|
30,354 |
|
538,691 |
|
| 2020 |
275,000 |
|
|
|
— |
24,950 |
|
88,787 |
|
59,202 |
|
32,138 |
|
480,077 |
|
Andrew J. Wise
Senior Executive Vice President and COO |
2022 |
325,000 |
|
|
|
— |
38,250 |
|
145,268 |
|
21,388 |
|
40,358 |
|
570,264 |
|
| 2021 |
300,000 |
|
|
|
— |
24,250 |
|
129,243 |
|
21,178 |
|
37,363 |
|
512,034 |
|
| 2020 |
250,000 |
|
|
|
— |
24,950 |
|
80,715 |
|
24,093 |
|
34,638 |
|
414,396 |
|
|
|
|
|
|
|
|
|
|
|
|
|
|
|
|
|
|
|
|
|
|
|
|
|
|
|
(a) This column sets forth the grant date fair value of the RSUs granted under the Company’s 2013 LTIP for each of the listed years, calculated in accordance with FASB ASC TOPIC 718 using the assumptions referred to in the Company's financial statements, footnotes to financial statements and Management's Discussions and Analysis in the Company's Form 10-K for the year ended December 31, 2022. The estimated value of each RSU granted in 2022 under the 2013 LTIP was $34.79, the closing price of our common stock on the date of the grant as restated for the 3% stock dividend distributed in September 2022.
(b) This column sets forth the grant date fair value of option awards granted under the Company’s compensatory stock plans for each of the listed years, calculated in accordance with FASB ASC TOPIC 718 using the assumptions referred in the Company's financial statements, footnotes to financial statements and Management's Discussions and Analysis in the Company's Form 10-K for the year ended December 31, 2022. The grant date fair value of each stock option granted under the 2013 LTIP, in each case using the Black-Scholes model to estimate fair value, was $4.99 per option share in 2020 (all grants were made January 30, 2020); $4.85 per option share in 2021 (all grants were made January 30, 2021) and $7.65 per option share in 2022 (all grants were made January 26, 2022). All such stock options vest ratably in equal installments over the first four anniversaries following the date of grant. In connection with Mr. Campanella's resignation from the Company, any and all unvested options held by Mr. Campanella on September 30, 2022 were forfeited and he had until December 31, 2022 to exercise any and all vested options held by him on his last day of employment.
(c) This column sets forth the STIP payments made for each of the listed years, based on the financial performance of the Company, strategic Company results and individual performance factors during that year, as applicable. STIP amounts payable for a given year are generally paid in February of the succeeding year.
(d) This column sets forth the actuarial increase during each of the listed years in the present value of the retirement benefits under qualified pension plans and nonqualified deferred compensation plans established by the Company that cover such NEO, determined using interest rate, mortality rate and other assumptions consistent with those used in the Company’s financial statements. The increase in present value of retirement benefits reported for each of the NEOs for 2022 includes (i) under the Company’s Employees’ Pension Plan (“Pension Plan”), $121,563 for Mr. Murphy, $11,525 for Mr. Campanella, $53,855 for Mr. DeMarco, $51,003 for Mr. Kaiser and $12,179 for Mr. Wise and (ii) under the Company’s SERP, $348,674 for Mr. Murphy, $7,490 for Mr. Campanella, $44,522 for Mr. DeMarco and $20,535 for Mr. Kaiser, $9,209 for Mr. Wise.
(e) Represents the amount paid through September 30, 2022, the effective date of Mr. Campanella's resignation.
(f) All Other Compensation includes the following components for 2022:
|
|
|
|
|
|
|
|
|
|
|
|
|
|
|
|
|
|
|
|
|
| Name |
Company Contribution
to ESOP |
Life Insurance & Long Term Disability Premiums Paid by Company for Benefit of NEO |
Dollar Value of Discount in Share Price for Company Common Stock Purchased Under Employees' Stock Purchase Plan |
Perquisites Received Greater than $10,000 |
Total Other Compensation |
| Thomas J. Murphy |
$ |
18,300 |
|
$ |
1,146 |
|
$ |
632 |
|
$ |
12,236 |
|
(a) |
$ |
32,313 |
|
| Edward J. Campanella |
— |
|
859 |
|
— |
|
82,667 |
|
(a), (b) |
83,527 |
|
| David S. DeMarco |
18,300 |
|
1,146 |
|
158 |
|
14,401 |
|
(a) |
34,005 |
|
| David D. Kaiser |
18,300 |
|
1,146 |
|
32 |
|
13,292 |
|
(a) |
32,769 |
|
| Andrew J. Wise |
18,300 |
|
1,146 |
|
632 |
|
20,281 |
|
(a) |
40,358 |
|
(a)Messrs. Murphy, Campanella, DeMarco, Kaiser and Wise received both a country club membership and personal use of a Company vehicle.
(b)Mr. Campanella received $65,000 under the six-month Professional Services Agreement by and between the Company and Mr. Campanella, effective October 1, 2022. See the Agreements with Named Executive Officers section for a description of the agreement.
(g) Effective May 12, 2023, Mr. Murphy terminated his employment as President and CEO and as a director of the Company and all other positions he held with the Company and its affiliates. Effective on May 13, 2023, the Company appointed Mr. DeMarco to serve as President and Chief Executive Officer of the Company and President and Chief Executive Officer of GFNB in addition to continuing to serve as President and Chief Executive Officer of SNB.
Grants of Plan-Based Awards Table:
As noted in the Compensation Discussion and Analysis, the Company provides officers and key employees with both an annual STIP and an LTIP to attract and retain such officers and employees and to motivate them to improve the Company’s short- and long-term performance, respectively.
The STIP bonus payable to covered individuals, including NEOs, is based on a comprehensive quantitative and qualitative assessment of both Company and individual performance. The amounts listed in the table below represent each NEO’s 2022 target incentive award, as well as his threshold incentive award (50% of target) and maximum incentive award (150% of target). The Compensation Committee, in its sole discretion, will determine on a case-by-case basis whether an NEO will receive a STIP bonus payment for the year and, if so, the amount of this bonus, which typically falls within the limits set forth above. Because a STIP bonus payment is discretionary, no NEO has a contractual right to a bonus under the STIP for any given year, even if the pre-established quantitative performance standards for the Company or the Company function for which the NEO is responsible have been met for such year, or the NEO’s individual performance standards have been met.
Historically, the Company has limited its grants of stock-based awards under its long-term incentive plans to stock options. However, beginning in January 2018, the Company awarded Mr. Murphy RSUs. (See "January 2022 Long-Term Incentive Award Decisions" in the Compensation Discussion and Analysis section for a description of the material terms of this award.) The Company’s 2022 LTIP authorizes the granting of stock options and other stock-based awards as a long-term incentive component within the overall compensation program.
|
|
|
|
|
|
|
|
|
|
|
|
|
|
|
|
|
|
|
|
|
|
|
|
|
|
|
|
|
|
|
|
|
|
|
|
| Name |
Grant Date |
Estimated Future Payouts
Under Non-Equity
Incentive Plan |
Estimated Future Payouts
Under Equity
Incentive Plan |
All Other Stock Awards:
Number of Shares of Stock or Units |
All Other Option Awards:
Number of
Securities
Underlying Options |
Exercise or Base Price of Option Awards
($/Share) |
Grant Date Fair Value of Stock and Option Awards |
Threshold
(a) |
Target |
Max |
Threshold |
Target |
Max |
| Thomas J. Murphy |
|
$ |
162,500 |
|
$ |
325,000 |
|
$ |
487,500 |
|
— |
— |
— |
— |
— |
— |
— |
| 1/26/2022 |
|
|
|
|
|
|
|
10,000 |
|
$35.83 |
$ |
76,500 |
|
| 1/26/2022 |
|
|
|
|
|
|
4,186 |
|
|
$ |
149,984 |
|
| Edward J. Campanella (b) |
|
— |
|
— |
|
— |
|
— |
— |
— |
— |
— |
|
— |
— |
| 1/26/2022 |
|
|
|
|
|
|
|
5,000 |
|
35.83 |
38,250 |
|
| David S. DeMarco |
|
79,000 |
|
158,000 |
|
237,000 |
|
— |
— |
— |
— |
— |
|
— |
— |
|
| 1/26/2022 |
|
|
|
|
|
|
|
5,000 |
|
35.83 |
38,250 |
|
| David D. Kaiser |
|
65,000 |
|
130,000 |
|
195,000 |
|
— |
— |
— |
— |
— |
|
— |
— |
| 1/26/2022 |
|
|
|
|
|
|
|
5,000 |
|
35.83 |
38,250 |
|
| Andrew J. Wise |
|
65,000 |
|
130,000 |
|
195,000 |
|
— |
— |
— |
— |
— |
|
— |
— |
| 1/26/2022 |
|
|
|
|
|
|
|
5,000 |
|
35.83 |
38,250 |
|
(a)The threshold incentive award to any covered person under the STIP, including an NEO, is not the minimum bonus payment such person may receive under the STIP. The Compensation Committee may choose to pay a bonus under the STIP to any covered person, including an NEO, that is less than their threshold incentive award, or not to pay such person any bonus under the STIP, even if applicable performance thresholds or targets have been met by the Company and/or such person for the year in question.
(b)As a result of Mr. Campanella's resignation on September 30, 2022, he was not entitled to receive a STIP payment or LTIP award with respect to 2022 performance; further, in connection with Mr. Campanella's resignation from the Company, any and all unvested options held by Mr. Campanella on September 30, 2022 were forfeited and he had until December 31, 2022 to exercise any and all vested options held by him on his last day of employment.
Outstanding Equity Awards at Fiscal Year-End Table:
The following table shows all outstanding stock-based awards held by each NEO as of December 31, 2022. All such awards consist of stock options to acquire the Company’s common stock or RSUs granted under the Company’s 2022 LTIP (or predecessor plans). The number of shares and exercise prices on this table have been adjusted for the 3% stock dividend distributed on September 23, 2022.
|
|
|
|
|
|
|
|
|
|
|
|
|
|
|
|
|
|
|
|
|
|
|
|
|
|
|
|
|
|
| Name |
Securities Underlying Unexercised Options (Exercisable) |
Securities Underlying Unexercised Options
(Unexercisable)
(a) |
Equity Incentive Plan Awards:
Securities Underlying Unexercised Unearned Options |
Option Exercise Price |
Option Expiration
Date |
Shares or Units of Stock Not Vested (b) |
Market Value of Shares or
Units of Stock Not Vested |
Equity Incentive Plan Awards: Number of Unearned Shares, Units or Other Rights Not Vested |
Equity Incentive Plan Awards: Market or Payout Value of Unearned Shares, Units or Other Rights Not Vested |
| Thomas J. Murphy |
2,898 |
|
— |
|
— |
$28.29 |
1/31/2028 |
— |
— |
— |
— |
| 2,815 |
|
2,814 |
|
— |
$28.17 |
1/30/2029 |
— |
— |
— |
— |
| 2,732 |
|
5,464 |
|
— |
$32.28 |
01/29/2030 |
— |
— |
— |
— |
| 2,652 |
|
7,957 |
|
— |
$27.85 |
01/27/2031 |
— |
— |
— |
— |
| — |
|
10,300 |
|
— |
$34.79 |
01/26/2032 |
— |
— |
— |
— |
| — |
|
— |
|
— |
— |
— |
13,520 |
$458,328 |
— |
— |
|
|
|
|
|
|
|
|
|
|
|
|
|
|
|
|
|
|
|
|
|
|
|
|
|
|
|
|
|
|
|
|
|
|
|
|
|
|
|
|
|
|
|
|
|
|
|
|
|
|
|
|
|
|
|
|
| David S. DeMarco |
5,970 |
|
— |
|
— |
$31.17 |
1/25/2027 |
— |
— |
— |
— |
| 5,796 |
|
— |
|
— |
$28.29 |
1/31/2028 |
— |
— |
— |
— |
| 4,220 |
|
1,407 |
|
— |
$28.17 |
1/30/2029 |
— |
— |
— |
— |
| 2,732 |
|
2,731 |
|
— |
$32.28 |
01/29/2030 |
— |
— |
— |
— |
| 1,326 |
|
3,979 |
|
— |
$27.85 |
01/27/2031 |
— |
— |
— |
— |
| — |
|
5,150 |
|
— |
$34.79 |
01/26/2032 |
— |
— |
— |
— |
|
|
|
|
|
|
|
|
|
|
|
|
|
|
|
|
|
|
|
|
| David D. Kaiser |
5,971 |
|
— |
|
— |
$31.17 |
1/25/2027 |
— |
— |
— |
— |
| 5,797 |
|
— |
|
— |
$28.29 |
1/31/2028 |
— |
— |
— |
— |
| 4,220 |
|
1,408 |
|
— |
$28.17 |
1/30/2029 |
— |
— |
— |
— |
| 2,732 |
|
2,731 |
|
— |
$32.28 |
01/29/2030 |
— |
— |
— |
— |
| 1,326 |
|
3,979 |
|
— |
$27.85 |
01/27/2031 |
— |
— |
— |
— |
| — |
|
5,150 |
|
— |
$34.79 |
01/26/2032 |
— |
— |
— |
— |
| Andrew J. Wise |
596 |
|
— |
|
— |
$31.17 |
1/25/2027 |
— |
— |
— |
— |
|
|
|
|
|
|
|
|
|
| 2,448 |
|
1,407 |
|
— |
$28.17 |
1/30/2029 |
— |
— |
— |
— |
| 2,732 |
|
2,732 |
|
— |
$32.28 |
01/29/2030 |
— |
— |
— |
— |
| 1,320 |
|
3,980 |
|
— |
$27.85 |
01/27/2031 |
— |
— |
— |
— |
| — |
|
5,150 |
|
— |
$34.79 |
01/26/2032 |
— |
— |
— |
— |
(a)All stock options vest ratably in equal installments over the first four anniversaries following the date of the grant.
(b)Mr. Murphy's RSUs vest 100% on the third anniversary of the applicable date of grant, but will not settle until his retirement.
Mr. Campanella had no outstanding equity awards at December 31, 2022 as a result of his September 30, 2022 resignation. In connection with Mr. Campanella's resignation from the Company, any and all unvested options held by Mr. Campanella on September 30, 2022 were forfeited and he had until December 31, 2022 to exercise any and all vested options held by him on his last day of employment.
Option Exercises and Stock Vested Table:
The following table sets forth information regarding the stock option exercises and shares vested by each NEO during 2022:
|
|
|
|
|
|
|
|
|
|
|
|
|
|
|
|
|
|
|
|
|
| Name |
Option Awards |
Stock Awards |
|
Number Shares Acquired on Exercise
(a) |
Value Realized
on Exercise
(b) |
Number Shares Acquired on Vesting
(c) |
|
Value Realized
on Vesting
(d) |
|
| Thomas J. Murphy |
— |
|
$ |
— |
|
4,391 |
|
(e) |
$ |
150,815 |
|
(e) |
| Edward J. Campanella |
— |
|
— |
|
— |
|
|
— |
|
|
| David S. DeMarco |
— |
|
— |
|
— |
|
|
— |
|
|
| David D. Kaiser |
9,287 |
|
124,811 |
|
— |
|
|
— |
|
|
| Andrew J. Wise |
2,155 |
|
10,227 |
|
— |
|
|
— |
|
|
(a)Represents the total number of shares subject to stock options that the NEO exercised during the year, restated for the September 23, 2022 3% stock dividend, if applicable.
(b)Represents the “spread” of options on the date of exercise, i.e., the difference between the dollar value of the shares of common stock for which options were exercised, based on the closing price of the Company's common stock on the date of exercise, and the exercise price (purchase price) of such shares under the options.
(c)Represents the total number of shares subject to RSUs that vested during the year, restated for the September 23, 2022 3% stock dividend noting that such vested awards are not settled until Mr. Murphy's employment has terminated.
(d)Represents the fair market value of the Company's common stock on the vest date multiplied by the number of shares vested.
(e)Receipt of vested shares is deferred and will be paid in ten substantially equal annual installments commencing on the first anniversary date of Mr. Murphy's retirement.
Pension Benefits and Table:
The Company maintains a qualified retirement plan for eligible employees who have attained the age of 18, completed one year of service and work a minimum of 1,000 hours per calendar year. Eligible compensation under the retirement plan includes salary, overtime, sick pay, bonuses and other cash and non-cash benefits.
Participants in the retirement plan with 25 years of service may retire at any age, participants with 10 years of service may retire at or after age 55, and participants with five years of service may retire at or after age 65. For early retirement prior to age 65, annuity payments, if elected, would be reduced by 0.25% for each month the participant elects to retire before age 65. Participants who are eligible to retire may not commence receipt of their benefit prior to age 55.
The Company maintains an unfunded, non-qualified SERP, in part for the benefit of NEOs, as determined by the Compensation Committee on a case-by-case basis. The SERP contains both a qualified retirement plan “makeup” benefit feature and a special additional SERP benefit feature. For those NEOs who qualify and are selected to participate in the “makeup” benefit feature, the award provides enhanced installment payments post-retirement that are designed to give the NEO the overall level of retirement payments he would have received under the qualified retirement plan alone if there were no limitations on maximum retirement payments to high-paid personnel in the Internal Revenue Code. Under the additional SERP benefit feature, the Compensation Committee is authorized to grant to selected Executive Officers additional payments upon their retirement, beyond their SERP “make-up” benefit payments. Such additional payments are also typically structured as post-retirement installment payments, the amounts of which are determined on a case-by-case basis by the Compensation Committee at or before the time of retirement. Messrs. Murphy (prior to his resignation), Campanella (prior to his resignation), DeMarco, Kaiser, and Wise participate in the “make-up” benefit feature of the SERP.
In 2022, none of the NEOs, excluding Mr. Murphy, participated in the special additional benefit feature of the SERP. In January 2018, Mr. Murphy was provided a special SERP award. Specifically, the Compensation Committee approved the adjustment of Mr. Murphy’s existing arrangement to increase the formula for pay-based credits up to 30% of eligible compensation. Further, in 2018 the Compensation Committee approved an award of special retirement benefits to Mr. Murphy, providing him with an annuity payable at a normal retirement age of 65 that is equal to 40% of his compensation, averaged over 60 consecutive calendar months which produce the highest average during the last 120 consecutive calendar months of Mr. Murphy’s employment, offset by his Social Security retirement benefits that would be payable at age 65 and further offset by the actuarial value of other qualified and non-qualified plan benefits derived from contributions made by the Company.
The following table sets forth the present value of accumulated benefits under both the qualified and non-qualified retirement plans of the Company payable to each NEO as of December 31, 2022, and the number of years of service credited to them under the plans. The present value was determined using interest rate and mortality rate assumptions consistent with those described in Note 13 to the Company’s consolidated financial statements.
|
|
|
|
|
|
|
|
|
|
|
|
|
|
|
| Name |
Plan Name |
Years of
Credited Service |
Value of Accumulated Benefit as of 12/31/22 |
Payments During
Last Fiscal Year |
| Thomas J. Murphy |
Retirement Plan |
18.00 |
|
$ |
701,152 |
|
— |
|
| SERP |
10.00 |
|
2,525,375 |
|
— |
|
| Edward J. Campanella |
Retirement Plan |
5.00 |
|
63,643 |
|
— |
|
| SERP |
4.00 |
|
19,184 |
|
— |
|
| David S. DeMarco |
Retirement Plan |
35.08 |
|
723,715 |
|
— |
|
| SERP |
10.00 |
|
170,070 |
|
— |
|
| David D. Kaiser |
Retirement Plan |
22.00 |
|
535,909 |
|
— |
|
| SERP |
6.00 |
|
55,787 |
|
— |
|
| Andrew J. Wise |
Retirement Plan |
6.00 |
|
82,597 |
|
— |
|
| SERP |
4.00 |
|
14,539 |
|
— |
|
Nonqualified Deferred Compensation:
The Company has an Executive Officer Deferred Compensation Plan (“Officers’ Deferral Plan”) under which an Executive Officer may elect on a year-to-year basis to defer until retirement all or a portion of his salary or bonus payments otherwise payable to him during and for such year. Amounts deferred earn interest at a rate equal to the highest rate currently paid on individual retirement accounts by GFNB. None of the NEOs elected to defer under the plan salary or bonus amounts payable to them in or for 2022 or in or for the prior two years.
Pay Ratio Disclosure:
As of December 31, 2020, our total employee population, excluding Mr. Murphy, consisted of 524 employees who were all located in the United States. As of December 31, 2022, our total employee population, excluding Mr. Murphy, consisted of 507 employees who were all located in the United States. To identify the median compensated employee, we used Box 5 of Form W-2 compensation for the full year 2020 for all such employees, annualizing compensation for those employees hired during 2020. We used the same employee, and calculated that employee's total compensation for the year ended December 31, 2022, for this pay ratio disclosure. Since December 31, 2020, there has been no material change in the Company's employee population or employee compensation arrangements that the Company believes would significantly impact its pay ratio disclosure.
The 2022 annual total compensation of the median employee described above was $51,816. Mr. Murphy’s 2022 annual total compensation, including increase in pension and SERP benefits for the year, was $1,742,204. The ratio of these amounts is 1-to-34.
This calculation is a reasonable estimate calculated in a manner consistent with SEC rules based on our payroll and employment records and the methodology described above. The SEC rules for identifying the median compensated employee and calculating the pay ratio based on that employee’s annual total compensation allow companies to adopt a variety of methodologies, to apply certain exclusions, and to make reasonable estimates and assumptions that reflect compensation practices. As such, the pay ratio reported by other companies may not be comparable to the pay ratio reported above, as other companies may have different employment and compensation practices and may utilize different methodologies, exclusions, estimates and assumptions in calculating their own pay ratios.
Agreements with Named Executive Officers
Employment Agreements:
The Company has employment agreements with Messrs. DeMarco, Kaiser and Wise. The Company also had an employment agreement with Mr. Murphy to serve as President and CEO of both the Company and GFNB until the termination of his employment effective May 12, 2023; Mr. DeMarco serves as President and CEO of the Company, GFNB and SNB; Mr. Kaiser serves as Senior Executive Vice President and CCO of the Company and Senior Executive Vice President and CCO of GFNB and SNB; and Mr. Wise serves as COO and Senior Executive Vice President of the Company and COO and Senior Executive Vice President of GFNB and SNB. The Company had an employment agreement with Mr. Campanella who served as Senior Executive Vice President, Treasurer and CFO of the Company and Senior Executive Vice President, Treasurer and CFO of GFNB and SNB until his resignation which was effective September 30, 2022. Effective February 1, 2023, Messrs. Murphy, DeMarco, Kaiser and Wise entered into new employment agreements with the Company, replacing their prior employment agreements with agreements that were substantially similar to their existing employment agreements. Prior to his termination of employment in May 2023, Mr. Murphy’s agreement was for a three-year term. The agreements of Messrs. DeMarco, Kaiser and Wise are each for a two-year term. At the beginning of each calendar year, the Board is required under these agreements to consider and vote upon a proposal to replace each of the agreements with new, comparable agreements having similar terms, conditions and benefits. Effective February 21, 2023, the Company appointed Penko Ivanov as CFO, Executive Vice President, Treasurer and CAO of Arrow GFNB, SNB, as well as its insurance subsidiary, Upstate Agency, LLC for a two year term. As a result, following Mr. Ivanov’s start date of February 21, 2023, Thomas J. Murphy, the Company’s President and Chief Executive Officer, no longer served as the Company’s interim Treasurer, CFO and CAO.
Under each agreement, the NEO is guaranteed his current base annual salary and certain other benefits for the duration of the agreement. Also under each agreement, the NEO is entitled to participate in certain other benefit plans, including medical, dental and life insurance plans; is eligible for (although not entitled to receive) cash awards under the STIP and equity-based awards under the 2022 LTIP (or predecessor plans); and is also eligible to participate in various retirement and supplemental retirement plans.
In the event the NEO is terminated other than for “cause” or terminates his own employment for “good reason,” the NEO will receive a lump-sum payment equal to the greater of (i) the dollar amount of base salary that would have been payable to him during the remaining term of the agreement or (ii) one year’s base salary. The NEO's receipt of such payment, and the other payments upon termination described in this section, is conditioned upon the execution of a separation and release agreement satisfactory to the Company.
Additionally, under the agreements, if during the term of the agreement there is a change of control of the Company and, within 12 months after such change of control, either (i) the Company terminates the employment of the NEO other than for cause or (ii) such NEO terminates his own employment with the Company for good reason, the NEO will be entitled to receive an aggregate dollar amount, payable in installments over a two-year period following the date of his termination (or in a lump sum, in the event of unforeseeable emergency), equal to two or three times the sum of the executive's (a) annual base salary and (b) target bonus under the STIP for the relative year (the "Base Amount"), subject to downward adjustment to reflect the value of any other “change of control” payments or benefits he might receive following such change of control. In the case of Mr. Murphy, the multiple is three times the applicable Base Amount, and in the cases of Messrs. Ivanov, Campanella (prior to his resignation), DeMarco, Kaiser and Wise, the multiple is two times the Base Amount, subject, in each case, to downward adjustment to reflect the value of any other “change-of-control” payment or benefits the NEO might receive under other compensatory arrangements then in effect. In such circumstances, the NEO shall be entitled to receive medical, dental and life insurance coverage that is generally equivalent to the coverage then held by him on the date of his termination, subject to employee cost-sharing, for a period of two years following such date. Under each agreement, the NEO will not receive any payment following a change of control to the extent such payment constitutes an “excess parachute payment” under the Internal Revenue Code.
Each of the employment agreements for Messrs. Murphy, Ivanov, Campanella, DeMarco, Kaiser and Wise contain non-compete and non-solicitation provisions. For a period of two years following the termination of the NEO’s employment, for any reason, he is generally precluded from being employed by, an owner of, or adviser to any bank or insured financial institution located in any New York county in which the Company or its subsidiaries provide financial services, maintain a branch or office or have acted to establish a branch or office. Under the non-solicitation provision, for a period of two years following the NEO’s termination of employment for any reason, he is generally precluded from soliciting customers or clients of the Company or its subsidiaries on behalf of any other financial institution that provides financial services. The NEO is also precluded from employing or soliciting employees of the Company or its subsidiaries on behalf of another corporation or entity. The agreements also contain confidentiality and non-disparagement covenants in favor of the Company.
In connection with Mr. Campanella's resignation, his employment agreement terminated without any termination payments being made thereunder.
Professional Services Agreement:
Effective September 30, 2022, Mr. Campanella resigned from service as Senior Executive Vice President, Treasurer and Chief Financial Officer of Arrow and Senior Executive Vice President and Chief Financial Officer of both GFNB and SNB, as well as all other positions with the Company and its affiliates. Effective October 1, 2022, the Company and Mr. Campanella signed a Professional Services Agreement. Pursuant to the Professional Services Agreement, Mr. Campanella agreed to hold himself available to render advice and assistance to Arrow and oversee certain projects for Arrow as may be requested from time to time by the CEO of Arrow. Payments to Mr. Campanella pursuant to this Professional Services Agreement are included in the "Other" column of the Summary Compensation Table.
Potential Payments Upon Termination or Change of Control:
The description below is based on a theoretical change of control on December 31, 2022 and does not address the specific circumstances and effects of Mr. Murphy's termination in May 2023.
Termination for Cause
In the event of a termination of any NEO for cause, the NEO in question would not receive any cash severance payment or enhanced retirement benefits beyond the benefits described in the “Pension Benefits Table” within the Executive Compensation section. Eligibility for regular Company severance or retirement payments is determined in a manner consistent with all employees of the Company under applicable Company plans and policies.
Termination by the Company Other Than for Cause
If there is a termination of any of the NEOs by the Company other than for cause, the NEO is entitled under his current employment agreement with the Company to receive a lump-sum payment in an amount equal to the greater of (i) his base salary payable during the remaining term of the agreement or (ii) one year’s base salary. The table later in this section shows the estimated payouts for Messrs. Murphy, DeMarco, Kaiser and Wise, had they been terminated by the Company other than for cause as of December 31, 2022.
The Company does not have a formal written severance plan or policy that generally covers employees or executives who are terminated by the Company other than for cause; therefore, none of the NEOs would be entitled to any additional severance payments under any such policy or plan if terminated by the Company other than for cause. However, the Company does have a SERP, in which Executive Officers such as NEOs are eligible to participate, if so determined by the Compensation Committee. In 2022, as selected by the Compensation Committee, Messrs. Murphy, DeMarco, Wise and Kaiser participated in the “make-up” benefits feature of the SERP. Additionally, in 2018, Mr. Murphy was selected to participate in the additional special benefits feature of the SERP. See "Broad-based and Select Executive Retirement Plans" in the Compensation Discussion and Analysis section for a description of the material terms of the award.
For further information concerning the SERP, see the discussion accompanying the “Pension Benefits Table” in the Executive Compensation section. In the past, the Company has, from time to time at the discretion of the Board or its Compensation Committee, awarded severance payments to NEOs in differing amounts, determined on a case-by-case basis, even in cases where such payments were not required under the SERP or under the terms of any employment agreement between the Company and such officer. Except as discussed above and with regard to Mr. Murphy's award described in "Broad-based and Select Executive Retirement Plans" in the Compensation Discussion and Analysis section, any termination by the Company of an NEO other than for cause would not generally result in enhanced retirement benefits beyond the benefits described in the “Pension Benefits Table” in the Executive Compensation section. (The foregoing discussion assumes that the hypothetical termination of an NEO by the Company other than for cause is not preceded by a change of control. Any such termination following a change of control may result in a greater payment to the NEO, as discussed later in this section.)
Termination for Good Reason
Each of the current NEO employment agreements provides for payments to the NEO if he were to voluntarily terminate his employment for “good reason.” Good reason is defined as a (i) failure by the Company to offer the NEO an annual replacement agreement on terms, conditions and benefits comparable to his existing employment agreement; (ii) material diminution in his title, authority, duties or responsibilities; (iii) required relocation of the NEO more than 100 miles from his existing base location of employment; or (iv) material breach by the Company of the NEO’s employment agreement. Under each NEO’s employment agreement, the amount due to the NEO if he were to terminate his employment for good reason during the term of the agreement, is a lump-sum payment equal to the greater of the amount of (i) his base salary payable during the remaining term of the agreement or (ii) one year’s base salary. For a discussion of the impact of a voluntary termination by an NEO of his own employment on any retirement benefits due him under the Company’s qualified retirement plan or under the Company’s nonqualified SERP or any payments under any other severance plan or policy, see the discussion in the preceding section, “Termination by the Company Other Than for Cause.” (The foregoing discussion assumes that the hypothetical termination of the NEO by the Company other than for cause is not preceded by a change of control. Any such termination following a change of control may result in a greater payment to the NEO, as discussed later in this section.)
Termination in Connection with a Change of Control
Under the employment agreements with each of the NEOs, certain payments are to be made by the Company to each NEO if, following a change of control of the Company, his employment is terminated without cause or he voluntarily terminates his employment for good reason. For the NEOs, the amounts that would have been payable to each had his employment been terminated as of December 31, 2022, by the Company or by such officer himself for good reason following a change of control are identified in tables later in this section. In addition, all of the outstanding stock options granted to these NEOs, to the extent not fully vested, would under the terms of such options vest immediately upon a change of control, regardless of whether the employment of such person is terminated or terminates on or after such change of control. If, during the 12 months following a change of control, Mr. Murphy's employment is terminated by the Company without cause or by Mr. Murphy for good reason, his RSUs, to the extent not fully vested, would under the terms of such RSUs automatically vest fully on the date of such termination, and would settle within 30 days thereafter. Other than the foregoing, termination of any of the NEOs following a change of control would generally not result in enhanced retirement benefits beyond the benefits described in the “Pension Benefits Table” in the Executive Compensation section. Eligibility for other payments would be determined in a manner consistent with all Company employees under applicable plans and policies.
A “change of control” of the Company is defined in the employment agreements with NEOs as follows: (i) the acquisition by one person, or more than one person acting as a group, of ownership of stock of the Company that, together with stock held by such person or group, constitutes more than 50% of the total fair market value or total voting power of the stock of the Company; (ii) the acquisition by one person, or more than one person acting as a group, of ownership of stock of the Company that, together with stock of the Company acquired during the 12-month period ending on the date of the most recent acquisition by such person or group, constitutes 30% or more of the total voting power of the stock of the Company; (iii) a majority of the members of the Board are replaced during any 12-month period by Directors whose appointment or election is not endorsed by a majority of the members of the Board before the date of the appointment or election; or (iv) one person, or more than one person acting as a group, acquires, or has acquired during the 12-month period ending on the date of the most recent acquisition by such person or group, assets from the Company that have a total gross fair market value, determined without regard to any liabilities associated with such assets, equal to or more than 40% of the total gross fair market value of all of the assets of the Company immediately before such acquisition(s).
Voluntary Termination or Early Retirement
In 2022, the early retirement or voluntary termination of employment by any NEO (other than a voluntary termination of employment by the NEO for “good reason,” which is discussed separately above) would generally not result in any enhanced retirement benefits beyond the benefits described in “Pension Benefits Table” in the Executive Compensation section. To the extent that any NEO may hold unvested stock options as of the date of his self-termination or early retirement, the plan Administrator might choose to accelerate the vesting of such options as of the date of such termination or early retirement. To the extent that Mr. Murphy may hold unvested RSUs as of the date of his self-termination or early retirement, such RSUs shall automatically be forfeited on the date of such self-termination or early retirement. Eligibility for regular Company severance or retirement payments by an NEO is determined in a manner consistent with all Company employees under applicable plans and policies. Participation in either the “makeup” benefit feature or the special additional benefit feature of the SERP, including in the event of early retirement, is limited to select Executive Officers, as determined from time to time by the Compensation Committee acting in its sole discretion.
Messrs. Murphy, DeMarco, Kaiser and Wise are currently eligible for SERP payments upon their termination of employment or early retirement. There were no enhanced retirement benefit payments, vesting accelerations or other payments made to Mr. Campanella related to his resignation which was effective September 30, 2022.
Death or Disability
In the event of death or disability, the NEO would generally not receive any cash severance payment or enhanced retirement benefits beyond those described in “Pension Benefits Table” within the Executive Compensation section. Eligibility for regular Company severance or retirement payments is determined in a manner consistent with all employees of the Company under applicable plans and policies. However, under the standard stock option award agreements applicable to all option recipients, including NEOs, upon the death or permanent disability of a recipient who holds unvested stock option awards, any such awards will be subject to accelerated vesting as of such date. Additionally, under the terms of the RSUs, upon the death or permanent disability of Mr. Murphy, if he holds unvested RSUs at the time of such death or disability, any such awards will be subject to accelerated vesting as of such date.
Potential Payments Table:
The table below shows the estimated potential payments and benefits to each of the NEOs upon various "termination of employment" scenarios, assuming the NEO’s employment terminated as of December 31, 2022; the value of the Company’s common stock was $33.90, the closing price of the common stock on December 30, 2022; and in the case of a post change-in-control termination, the triggering change-in-control event occurred in 2022. This table does not address the specific circumstances and effects of Mr. Murphy's termination in May 2023 because it occurred after December 31, 2022.
|
|
|
|
|
|
|
|
|
|
|
|
|
|
|
|
|
|
|
|
|
|
|
|
Name and
Principal
Position |
Type of
Payment |
Involuntary Termination Without Cause or Voluntary Termination with Good Reason |
Change of Control
(a) |
Retirement |
Death or Disability |
Thomas J. Murphy
President and CEO |
Cash Compensation |
$ |
1,354,167 |
|
(b) |
$ |
2,100,901 |
|
(g) |
— |
|
— |
|
Stock Options (c) |
— |
|
|
73,116 |
|
|
— |
|
73,116 |
|
RSUs (d) |
— |
|
|
458,328 |
|
|
458,328 |
|
458,328 |
|
SERP – Pension & ESOP (e) |
2,583,006 |
|
|
2,583,006 |
|
|
2,583,006 |
|
2,583,006 |
|
Health and Welfare Benefits (f) |
— |
|
|
23,224 |
|
|
— |
|
— |
|
| Total |
3,937,173 |
|
|
5,238,575 |
|
|
3,041,334 |
|
3,114,450 |
|
|
|
|
|
|
|
|
|
|
|
|
|
|
|
|
|
|
|
|
|
|
|
|
|
|
|
|
|
|
|
|
|
|
|
|
|
|
|
|
|
|
|
|
David S. DeMarco
Senior Executive Vice President and CBO |
Cash Compensation |
427,917 |
|
(b) |
900,672 |
|
(g) |
— |
|
— |
|
Stock Options (c) |
— |
|
|
36,559 |
|
|
— |
|
36,559 |
|
RSUs |
— |
|
|
— |
|
|
— |
|
— |
|
SERP – Pension & ESOP (e) |
186,892 |
|
|
186,892 |
|
|
186,892 |
|
186,892 |
|
Health and Welfare Benefits (f) |
— |
|
|
31,302 |
|
|
— |
|
— |
|
| Total |
614,809 |
|
|
1,155,425 |
|
|
186,892 |
|
223,451 |
|
David D. Kaiser Senior Executive Vice President and CCO |
Cash Compensation |
352,083 |
|
(b) |
723,754 |
|
(g) |
— |
|
— |
|
Stock Options (c) |
— |
|
|
36,565 |
|
|
— |
|
36,565 |
|
RSUs |
— |
|
|
— |
|
|
— |
|
— |
|
SERP – Pension & ESOP (e) |
66,587 |
|
|
66,587 |
|
|
66,587 |
|
66,587 |
|
Health and Welfare Benefits (f) |
— |
|
|
31,302 |
|
|
— |
|
— |
|
Total |
418,670 |
|
|
858,208 |
|
|
66,587 |
|
103,152 |
|
Andrew J. Wise, Senior Executive Vice President and COO |
Cash Compensation |
352,083 |
|
(b) |
670,524 |
|
(g) |
— |
|
— |
|
Stock Options (c) |
— |
|
|
36,567 |
|
|
— |
|
36,567 |
|
| RSUs |
— |
|
|
— |
|
|
— |
|
— |
|
SERP – Pension & ESOP (e) |
25,274 |
|
|
25,274 |
|
|
25,274 |
|
25,274 |
|
Health and Welfare Benefits (f) |
— |
|
|
31,302 |
|
|
— |
|
— |
|
| Total |
377,357 |
|
|
763,667 |
|
|
25,274 |
|
61,841 |
|
(a)Assuming termination of an NEO's employment by the Company without cause or by the NEO for good reason within 12 months following a change of control, Messrs. Murphy, DeMarco, Kaiser and Wise will each receive an amount payable in installments or, in the event of unforeseeable emergency, in a lump-sum equal to, for Mr. Murphy, 2.99 times the average annual compensation for the most recent five taxable years, and in the case of Messrs. DeMarco, Kaiser and Wise, two times the average annual compensation for the most recent five taxable years, in each case adjusted downward to reflect any other change-of-control payment or benefits they might receive under other compensatory arrangements then in effect, such as the value they might receive from accelerated vesting of stock options. Their agreements further provide that under no circumstances will Messrs. Murphy, DeMarco, Kaiser and Wise receive payments under the employment agreements if such payments would constitute an “excess parachute payment” under the tax laws.
(b)Messrs. Murphy, DeMarco, Kaiser and Wise will each receive a lump-sum payment equal to the greater of the amount of (i) their base salary payable during the remaining term of the agreement in effect on December 31, 2022 or (ii) one year’s base salary.
(c)Reflects accelerated vesting of stock options.
(d)Reflects accelerated vesting of the RSU as a result of death, disability (as defined in the applicable award agreement) or upon the attainment of age 55 and 10 years of service or attainment of a combined age and years of service totaling 65.
(e)Represents $2,525,375 for benefits under the SERP pension plan and $57,631.31 for SERP ESOP account value for Mr. Murphy; $170,070 for benefits under the SERP pension plan and $16,822 for SERP ESOP account value for Mr. DeMarco; and $55,787 for benefits under the SERP pension plan and $10,800 for SERP ESOP account value for Mr. Kaiser; $14,539 for benefits under the SERP pension plan and $10,735 for SERP ESOP account value for Wise. SERP pension plan benefits are payable in the form of an annuity and SERP ESOP account values are payable in a lump sum.
(f)Represents the projected cost for 24 months of medical and dental insurance coverage under the Company’s fully insured medical and self-insured dental plans, assuming continued cost-sharing by the NEO, plus continued premium payments for 24 months of term life insurance and split-dollar insurance policies.
(g)For Mr. Murphy, the lump-sum amount $2,100,901 is adjusted downward by $531,444 as a result of accelerated vesting of stock options and RSUs. For Mr. DeMarco, the lump-sum amount $900,672 is adjusted downward by $36,559 as a result of accelerated vesting of stock options. For Mr. Kaiser, the lump-sum amount $723,754 is adjusted downward by $36,565 as a result of accelerated vesting of stock options. For Mr. Wise, the lump-sum amount $670,524 is adjusted downward by $36,567 as a result of accelerated vesting of stock options.
Director Compensation:
The Compensation Committee makes recommendations to the full Board regarding Director compensation. The Board itself, however, is responsible for determining the compensation payable to Directors for their services. Amounts paid for service on subsidiary bank boards are considered by the Board in its periodic review of total Director compensation.
• Director Compensation for 2022
With respect to 2022 Director compensation, at its October 2021 meeting, the Arrow Board of Directors approved the following Director retainer fees for 2022:
|
|
|
|
|
|
|
|
|
2022 Director Compensation Table |
| Annual Retainer |
|
Position |
| $ |
27,000 |
|
(a) |
Arrow Director |
| $ |
27,000 |
|
(a) |
GFNB Director |
| $ |
25,000 |
|
(a) |
SNB Director |
|
|
|
| $ |
4,000 |
|
|
Member, Audit Committee |
| $ |
2,500 |
|
|
Member, Compensation Committee |
| $ |
2,500 |
|
|
Member, Governance Committee |
| $ |
2,500 |
|
|
Member, NCIA Board and Wealth Management Committee |
| $ |
2,500 |
|
|
Manager, Upstate Agency |
|
|
|
| $ |
10,000 |
|
|
Chair, Audit Committee |
| $ |
10,000 |
|
|
Chair, Compensation Committee |
| $ |
10,000 |
|
|
Chair, Governance Committee |
| $ |
7,500 |
|
|
Chair, Wealth Management Committee/NCIA |
|
|
|
| $ |
5,000 |
|
|
Lead Director |
| $ |
10,000 |
|
|
Chair, Arrow Board |
| $ |
10,000 |
|
|
Chair, GFNB Board |
| $ |
10,000 |
|
|
Chair, SNB Board |
|
|
|
(a) 2022 amounts in effect from January 1, 2022 through June 30, 2022. See below for a discussion of changes to director compensation effective July 1, 2022. |
At the Organizational Meetings of Arrow and its subsidiary banks in April 2022, for purposes of efficiency, the boards of directors of GFNB and SNB were reconstituted such that all directors of Arrow would also serve as directors of GFNB and SNB. Due to this change, at the July 2022 Arrow Board Meeting the above 2022 director compensation structure was revised effective July 1, 2022 as follows: GFNB Director fees were decreased from $27,000 to $24,000 and SNB Director fees were decreased from $25,000 to $12,000.
Only non-Management Directors receive compensation for their services as Directors. Management Directors (those persons who are also officers) receive no additional compensation for their services as Directors. Therefore, Mr. Murphy, who was both a Director and an Executive Officer of the Company, received no Director compensation in 2022, although he was entitled to reimbursement of any expenses he incurred in connection with his service as a Director. Mr. Murphy's service as a director terminated effective May 12, 2023. Directors receive a portion of their fees in shares of Company common stock in accordance with the Arrow Financial Corporation 2020 Directors' Stock Plan. In 2022, fees earned in shares of Company stock consisted of $13,500 of the Director’s basic annual retainer fee for serving as a Company Director, $12,750 of the Director’s basic annual retainer fee for serving as a Director of GFNB and $9,250 of the Director's basic annual retainer fee for serving as a Director of SNB, as well as 50% of the fees related to serving as Chair of the Board and serving on or chairing the various Board committees.
• Director Compensation for 2023
With respect to 2023 Director compensation, at its October 2022 meeting, the Arrow Board of Directors approved the following Director retainer fees for 2023:
|
|
|
|
|
|
2023 Director Compensation Table |
| Annual Retainer |
Position |
| $ |
30,000 |
|
Arrow Director |
| $ |
24,000 |
|
GFNB Director |
| $ |
12,000 |
|
SNB Director |
|
|
| $ |
4,000 |
|
Member, Audit Committee |
| $ |
2,500 |
|
Member, Compensation Committee |
| $ |
2,500 |
|
Member, Governance Committee |
| $ |
2,500 |
|
Member, NCIA Board and Wealth Management Committee |
| $ |
2,500 |
|
Manager, Upstate Agency |
|
|
| $ |
10,000 |
|
Chair, Audit Committee |
| $ |
10,000 |
|
Chair, Compensation Committee |
| $ |
10,000 |
|
Chair, Governance Committee |
| $ |
7,500 |
|
Chair, Wealth Management Committee/NCIA |
| $ |
5,000 |
|
Chair, Upstate Agency |
|
|
| $ |
10,000 |
|
Lead Director |
| $ |
25,000 |
|
Chair, Arrow Board |
| $ |
10,000 |
|
Chair, GFNB Board |
| $ |
10,000 |
|
Chair, SNB Board |
•Directors' Deferred Compensation Plan
Under the Company’s Directors’ Deferred Compensation Plan, Directors of the Company and its subsidiary banks may elect to defer receipt of some or all of the cash fees otherwise payable to them in any year to a later date, subject to certain limits set forth in the Deferred Compensation Plan and applicable law. Under this unfunded plan, amounts deferred are credited to the plan account of the deferring Director. The deferred amounts earn interest from time to time at a rate equal to the highest rate being paid on individual retirement accounts by GFNB. Deferred amounts are ultimately distributable on a date or dates selected by the Director, subject to certain restrictions. Distributions under the plan are payable in cash, either in a lump-sum or in annual installments as the participant may choose. During 2022, no Directors elected to defer fees under the plan.
•Incentive Stock-Based Compensation
Under the Company’s current long-term incentive plan, the Arrow Financial Corporation 2022 Long Term Incentive Plan (“2022 LTIP”), the Board is authorized, in its discretion and after consultation with the Compensation Committee, to make grants of stock-based incentive awards to non-Management Directors of the Company as additional compensation for their service as Directors. The terms and conditions of awards granted to Directors are established by the Board itself, not by the Compensation Committee. The Board believes the grant of such awards, particularly in the form of stock options for the Company’s common stock, serves an important purpose by further aligning Directors’ interests with those of our shareholders, as stock options only provide value to the holder if the Company’s stock price increases.
Historically, the Board has approved annual grants of a fixed number of stock options to non-Management Directors under the 2022 LTIP (and predecessor plans). These options typically vest ratably over a four-year period, subject to accelerated vesting in the event of a change-in-control of the Company. All Directors’ stock options granted under the 2022 LTIP have a maximum term of 10 years from the date of the grant and are exercisable only while the Director continues to serve in such capacity and, for a short period following termination of service. The Board may elect to accelerate the vesting of options on a case-by-case basis, to extend the period of post-termination exercisability up to the maximum term of the option and has most often elected to do so in practice. All options granted to Directors in 2022 will vest ratably over a four-year period, reinforcing the long-term nature of the grant. The exercise price for all stock options granted to Directors in 2022 was the fair market value of the Company’s common stock on the date of grant, i.e., the reported closing price of the stock on such date.
In early 2022, the Board granted to each then-current non-Management Director who also was a Director in 2021, a standard annual incentive award for a fixed maximum number of stock options under the 2013 LTIP. The number and grant date value of all such options are listed in the “2022 Director Compensation Table” later in this section.
In early 2023, the Board granted to each eligible non-Management Director for their 2022 service a standard annual incentive award of stock options under the 2022 LTIP, generally subject to the usual terms and same maximum amount and downward adjustments, if any, as pertained to the 2022 grants described above.
Stock Ownership Guidelines
In order to better align the interests of Directors with the interests of our shareholders, the Company has established individual stock ownership guidelines for non-Management Directors. Under these guidelines, each non-Management Director of the Company is expected to achieve, within five years following such Director's election or appointment to the Board, and thereafter to maintain as long as such Director serves as a Director, beneficial ownership of a number of shares of the Company’s stock having a market value at least equal to five times the basic annual retainer fee payable from time to time to such Director for serving on the Company’s Board. Under normal circumstances, if and for so long as a non-Management Director does not meet this target level of beneficial ownership, restrictions may be placed on the Director’s ability to sell shares of the Company’s common stock obtained through the exercise of stock option awards previously or subsequently granted to the Director under the 2022 LTIP, predecessor plans or successor plans. The target ownership requirement for each non-Management Director is set by the Compensation Committee and Governance Committee, and measured each year by the Governance Committee, using holdings valued as of the Company's proxy record date each year. Common shares owned outright (including shares held jointly with a spouse) or held through Company plans (e.g., the Company’s Automatic Dividend Reinvestment Plan) are currently counted toward the stock ownership requirement. Unexercised stock options do not count toward the stock ownership requirement. The independent members of the Board have the discretion to address and approve exceptions.
The Compensation Committee has determined that, as of March 10, 2022, the Company's last annual meeting record date, all non-Management Directors who have served on the Company's Board for at least five years have met the stock ownership guidelines. Management Directors are subject to a separate policy. For a description of those guidelines, see “Stock Ownership Policy” for Named Executive Officers in the Compensation Discussion and Analysis section.
2022 Director Compensation Table
The following Director Compensation Table summarizes all compensation paid by the Company and its subsidiaries to the non-Management Directors of the Company for the fiscal year ended December 31, 2022. Management Directors (who, in 2022, consisted solely of Mr. Murphy) do not receive any compensation for service as Directors of the Company or either of its subsidiary banks. Compensation received in 2022 by Mr. Murphy is reported in the “Summary Compensation Table” within the Executive Compensation section.
|
|
|
|
|
|
|
|
|
|
|
|
|
|
|
|
|
|
|
|
|
|
|
|
|
|
|
| Director |
Fees Earned
or Paid
in Cash (a) |
|
Stock
Awards
(b)
|
|
Option Awards
(c)
|
|
Change in
Pension Value/ Nonqualified Deferred Compensation Earnings |
All Other Compensation |
2022 Director Compensation
Total |
| Mark L. Behan |
$ |
31,750 |
|
|
$ |
31,750 |
|
|
$ |
7,650 |
|
|
$ |
— |
|
$ |
— |
|
$ |
71,150 |
|
| Tenée R. Casaccio |
34,250 |
|
|
34,250 |
|
|
7,650 |
|
|
— |
|
— |
|
76,150 |
|
| Gregory J. Champion |
32,500 |
|
|
32,500 |
|
|
7,650 |
|
|
— |
|
|
|
72,650 |
|
Michael B. Clarke (e) (f) |
10,083 |
|
|
10,083 |
|
|
7,650 |
|
|
— |
|
— |
|
27,816 |
|
| Gary C. Dake |
35,000 |
|
|
35,000 |
|
|
7,650 |
|
|
— |
|
— |
|
77,650 |
|
Thomas L. Hoy (g) |
39,250 |
|
|
39,250 |
|
|
7,650 |
|
|
— |
|
— |
|
86,150 |
|
| David G. Kruczlnicki |
35,750 |
|
|
35,750 |
|
|
7,650 |
|
|
— |
|
1,159 |
|
(d) |
80,309 |
|
| Elizabeth A. Miller |
32,500 |
|
|
32,500 |
|
|
7,650 |
|
|
— |
|
— |
|
72,650 |
|
| Raymond F. O'Conor |
33,750 |
|
|
33,750 |
|
|
7,650 |
|
|
— |
|
— |
|
75,150 |
|
| William L. Owens |
34,250 |
|
|
34,250 |
|
|
7,650 |
|
|
— |
|
— |
|
76,150 |
|
| Colin L. Read |
35,500 |
|
|
35,500 |
|
|
7,650 |
|
|
— |
|
— |
|
78,650 |
|
(a)Represents the cash portion of Basic Annual Retainer and meeting fees relating to service on Boards and Committees.
(b)Represents that portion of each listed Director’s total 2022 Directors’ fees that were paid in shares of Company stock, in accordance with the 2020 Directors’ Stock Plan. For purposes of determining the number of shares of the Company’s common stock distributable to these Directors, the shares are valued at the market price of the Company’s common stock on the date of distribution, in accordance with FASB ASC TOPIC 718. In 2022, the Directors received, as payment of that portion of their basic annual retainer fee regularly payable in such year in shares of Company stock and a quarterly distribution of shares at a per share price based on the closing price on the date of distribution. As of December 31, 2022, no non-employee Directors held any unvested stock awards.
(c)Stock options granted to Directors are valued in accordance with FASB ASC TOPIC 718. The stock options were granted January 26, 2022, at a per share exercise price of $34.79, the closing price of our common stock on the date of grant as restated for the 3% stock dividend distributed in September 23, 2022. Options vest ratably over a period of four years following the date of grant. As of December 31, 2022, each non-employee Director held the following aggregate number of unexercised stock options (whether vested or not vested): Behan 5,470 options, Casaccio 9,150 options, Champion 1,560 options, Dake 6,665 options, Hoy 10,428 options, Kruczlnicki 3,766 options, Miller 5,251 options, O'Conor 5,470 options, Owens 5,208 options and Read 5,805 options.
(d)Represents interest earned by the listed Director during 2022 on the principal balance of the Director’s account under the Directors’ Deferred Compensation Plan.
(e)Mr. Clarke retired from the Board on May 4, 2022, and his director compensation is reflective of the term of his service as a director.
(f)In conjunction with his retirement and in recognition of Mr. Clarke's many years of service as a Director, the Board accelerated the vesting of his unvested stock options as of the date of his termination of service and extended the exercise period pursuant to which his options may be exercised to the full exercise period of ten years from the grant date.
(g)As a result of Mr. Hoy's death, the remaining unvested options vested automatically as of June 11, 2023. Mr. Hoy's estate has until three months after June 11, 2023, to exercise the options.
Item 12. Security Ownership of Certain Beneficial Owners and Management and Related Stockholder Matters
Certain information required by this item is set forth under "Equity Compensation Plan Information" in Part II, item 5 of this Report.
The following table sets forth the beneficial ownership of the Company’s common stock, as defined under SEC rules, as of June 1, 2023, for each Director, Director nominee and NEO of the Company, as well as for all Directors and Executive Officers as a group.
Beneficial ownership includes all shares of common stock for which the individual has sole or shared voting power or investment power and all shares that the individual has the right to acquire within 60 days of June 1, 2023 through the exercise of any option, RSU, warrant or right. There were 16,553,058 shares of the Company's common stock outstanding as of that date.
|
|
|
|
|
|
|
|
|
|
|
|
|
|
|
|
|
|
| Name |
Number
of Shares Owned (a) |
Options
Exercisable
Within
60 Days |
Total Beneficial Ownership
of Company Common Stock |
Percent of
Shares Outstanding
(b) |
| Mark L. Behan |
6,058 |
|
|
3,892 |
|
9,950 |
|
* |
Edward J. Campanella (c) |
— |
|
|
— |
|
— |
|
* |
| Tenée R. Casaccio |
18,493 |
|
|
7,572 |
|
26,065 |
|
* |
| Gregory J. Champion |
4,908 |
|
|
522 |
|
5,430 |
|
* |
| Gary C. Dake |
46,721 |
|
|
3,927 |
|
50,648 |
|
* |
| David S. DeMarco |
33,949 |
|
|
25,429 |
|
59,378 |
|
* |
| Thomas L. Hoy |
216,280 |
|
(d) |
8,850 |
|
225,130 |
|
—% |
| David D. Kaiser |
23,863 |
|
(e) |
25,432 |
|
49,295 |
|
* |
| David G. Kruczlnicki |
52,855 |
|
|
2,188 |
|
55,043 |
|
* |
| Elizabeth A. Miller |
32,254 |
|
(f) |
3,728 |
|
35,982 |
|
* |
Thomas J. Murphy (g) |
67,189 |
|
|
34,242 |
|
101,431 |
|
* |
Raymond F. O’Conor |
47,794 |
|
|
3,892 |
|
51,686 |
|
* |
| William L. Owens |
12,990 |
|
|
3,630 |
|
16,620 |
|
* |
| Colin L. Read |
9,443 |
|
|
4,227 |
|
13,670 |
|
* |
| Andrew J. Wise |
6,548 |
|
|
12,489 |
|
19,037 |
|
* |
Total Shares of Directors and Executive Officers as a Group (15 people) |
579,345 |
|
|
140,020 |
|
719,365 |
|
—% |
(a)The Company has rounded partial share holdings for purposes of the table data.
(b)The use of an asterisk (“*”) denotes a percentage ownership of less than 1%.
(c)Mr. Campanella resigned as our CFO effective September 30, 2022, the reported figure reflects Mr. Campanella's holdings to the knowledge of the Company.
(d)Includes 22,444 shares held directly by Director Hoy’s wife and 3,207 shares held by Director Hoy’s wife in an individual retirement account.
(e)Includes 4,765 shares held in the Kaiser Family Trust.
(f)Includes 5,677 shares held in the Miller Family Partnership, L.P.
(g)Mr. Murphy terminated his employment as CEO effective May 12, 2023, the reported figure reflects Mr. Murphy's holdings to the knowledge of the Company.
5% Shareholders:
The following table sets forth the beneficial ownership of the Company’s common stock as of June 1, 2023, by the holder known by us to be a beneficial owner of more than 5% of the outstanding shares of the Company's common stock on such date. Beneficial ownership includes all shares of common stock for which the person or entity has sole or shared voting power or investment power.
|
|
|
|
|
|
|
|
|
|
|
|
|
|
|
| Name |
Shares Owned |
Percent |
|
BlackRock, Inc.
55 East 52nd Street
New York, NY 10055
|
1,195,975 |
|
(a) |
7.23 |
% |
(b) |
|
|
|
|
|
(a)The listed number of shares of the Company’s common stock by BlackRock, Inc. ("BlackRock") is based solely upon a Schedule 13G, Amendment No. 13 filed by BlackRock on January 31, 2023 with the SEC. In that schedule, BlackRock reported that as of December 31, 2022, it had sole dispositive power over all such shares and the sole voting power with respect to 1,168,654 shares. BlackRock is an asset management company that provides asset management services to numerous mutual funds.
(b)Percentage based on 16,553,058 shares of the Company's common stock outstanding on June 1, 2023.
The Company's subsidiary banks, GFNB and SNB, in their capacities as fiduciary of numerous accounts in their respective Wealth Management departments, including, in the case of GFNB, as trustee of the Company's ESOP, held between them 1,943,055 shares of the Company's common stock, or 11.74% of the total shares outstanding on June 1, 2023. However, GFNB and SNB were the beneficial owners of only a relatively small number of these shares. Other persons, such as the individual ESOP participants, had the sole power to vote and/or direct the disposition of most of these shares. As a result, neither GFNB nor SNB were the beneficial owners of more than 5% of the shares of the Company's common stock outstanding and entitled to vote on the record date.
Item 13. Certain Relationships and Related Transactions, and Director Independence
Director Independence:
Under applicable law and regulation, it is the responsibility of the Board to review and make a determination regarding the independence and qualifications of each member, as well as additional review and determination for members of certain committees.
Under the NASDAQ listing standards, a majority of the members of the full Board must meet a general independence requirement. The Board has determined that the following Company Directors currently meet this requirement: Behan, Champion, Dake, Kruczlnicki, Miller, O'Conor, Owens and Read. Prior to his death in June 2023, Director Hoy also met the NASDAQ listing standard criteria for independence. Prior to the termination of his service as a director in May 2023, Director Murphy was not independent due to his position as the Company President and CEO. Director Casaccio is not independent for the reasons noted below.
In making its independence determinations for individual Directors, the Board considers transactions and relationships between (i) the Company and its subsidiaries, and (ii) the Directors and/or their immediate family or any businesses they control. The Board considers the objective tests for Director independence set forth in the NASDAQ listing standards and other regulatory guidelines for such transactions and relationships, as well as a variety of subjective factors, including particular or unique relationships between the Company and the Director, even if such relationships do not exceed the specific dollar threshold that would disqualify such Director under applicable regulatory guidelines. In its review of Director independence at year-end 2022, the Board considered the following 2022 transactions between the Company and the following individual Directors:
•Ms. Casaccio is President and part-owner of JMZ Architects and Planners, PC ("JMZ"), an architectural firm located in Glens Falls, New York. In 2016, GFNB engaged JMZ to provide architectural, design and space utilization services for the four buildings located in downtown Glens Falls that represent GFNB’s main campus. The project is ongoing, and in 2022 payments to JMZ totaled approximately $175,000. Given the level of payments to JMZ, Ms. Casaccio will not be deemed to be an independent director and will not serve on any of the Board’s committees. See “Related Party Transactions” later in this section for further information on these business transactions.
•Mr. Dake is President of Stewart’s Shops Corporation ("Stewart's"), a large, private company that owns and operates a regional chain of convenience stores. During 2022, the Company's subsidiary banks paid approximately $101,000 to Stewart’s for rent and incidentals for leased space at market rates and other immaterial purchases. This amount is less than 0.01% of the annual gross revenue of Stewart’s, which approximates $2.7 billion. The Board has determined that the Company’s payments were below the objective limits for general Director independence set forth in the NASDAQ listing standards and that the Company’s relationship with Stewart’s and Mr. Dake did not compromise his independence.
•Ms. Miller is the grantor of The Elizabeth A. Miller Family Irrevocable Insurance Trust which leased an administrative office to Arrow Financial during 2022. Total 2022 payments on this lease were $24,000. The Board has determined that the Company’s payments were below the objective limits for general Director independence set forth in the NASDAQ listing standards and that the Company’s relationship with Ms. Miller did not compromise her independence.
•Mr. Owens is Managing Partner at the law firm of Stafford, Owens, Piller, Murnane, Kelleher & Trombley, PLLC (“Stafford Owens”). During 2022, Stafford Owens received approximately $36,700 of total payments from certain GFNB loan customers in connection with its representation of GFNB at loan closings. The Board determined that the total payments received by Stafford Owens from all sources in connection with the firm's representation of GFNB in 2022 were well below the objective limits for general Director independence set forth in the NASDAQ listing standards and the relationship did not compromise Mr. Owen's independence.
There were no “Compensation Committee interlocks,” as defined under the SEC rules, in existence during fiscal year 2022. No member of the Compensation Committee is a current or former employee of the Company or any of its subsidiaries. No member of the Compensation Committee is party to any related party transactions with the Company requiring disclosure by us hereunder except Director Dake (see “Related Party Transactions” later in this section).
In addition to meeting NASDAQ general independence standards applicable to Directors, the Directors who serve on the Audit and/or Compensation Committees must meet certain additional independence or regulatory requirements, some of which may be more rigorous than the general standards. The Board has determined that Directors Champion, Kruczlnicki, Miller and Read, who constitute the Audit Committee, all meet the SEC’s more stringent independence requirements for Audit Committee members. The Board has also determined that Directors Kruczlnicki and Read each qualify as an “Audit Committee Financial Expert,” as defined by the SEC rules (not all Audit Committee members need to be financial experts). Further, the Board has determined that Directors Behan, Dake, Kruczlnicki and Owens, who constitute the Compensation Committee, all meet the independence requirements of NASDAQ and the SEC for Compensation Committee members.
Related Party Transactions:
Under the Company’s Statement of Policy with respect to Related Party Transactions, the Audit Committee or the Board itself must approve certain transactions or relationships between the Company and its “related parties,” including Directors and Executive Officers, as well as their immediate family members and controlled companies, if such transactions or relationships in any year will involve an aggregate dollar amount of goods, services or payments in excess of $120,000. Loans from the Company's subsidiary banks to Directors and Executive Officers, their families and controlled businesses, and other related parties, are generally exempt from the above described preapproval policy, as most such loans are subject to Board preapproval under a separate federal banking law, Regulation O.
2022 Transactions with Related Parties
During 2022, several Directors and Executive Officers and/or their related parties had outstanding loans from one or both of the Company's subsidiary banks in amounts of $120,000 or more. All such loans were made in the ordinary course of business of the bank, on the bank’s standard terms and conditions, and did not involve more than normal risk of collectability or present any other preferential features. As of December 31, 2022, none of these loans were classified by the Company as a non-accrual, past due, restructured or potential problem loan.
A summary of the transactions in 2022 between the Company the related parties that involved an aggregate dollar amount in excess of $120,000 follows.
Ms. Casaccio is President and part-owner of JMZ, an architectural firm located in Glens Falls, New York. In 2016, GFNB engaged JMZ to provide architectural, design and space utilization services for the four buildings located in downtown Glens Falls that represent GFNB’s main campus. The project has continued, and in 2022 payments to JMZ totaled approximately $175,000. The terms of the engagement from GFNB’s perspective were no less favorable than terms the Company could have obtained from a non-related party for comparable services in an arms-length transaction.
Item 14. Principal Accounting Fees and Services
The Company's independent registered public accounting firm for the year ended December 31, 2022 was KPMG LLP ("KPMG"), The Audit Committee assists the Board in fulfilling its oversight role relating to the Company’s financial statements and the financial reporting process, including the system of disclosure controls and the Company’s internal controls and procedures. Its duties include reviewing the independent registered public accounting firm’s qualifications and independence, the performance of the independent registered public accounting firm, and the Company’s internal audit function. The duties of the Audit Committee are set forth in the Audit Committee Charter, which has been adopted by the Board and is reviewed annually by the Committee. A copy of the current charter of the Audit Committee is available on our website at www.arrowfinancial.com/corporate/governance. The Audit Committee also reviews business or financial transactions between the Company and Company insiders and their related parties, such as any transactions with an individual Director or business entity in which the Director has a controlling or material interest. In accordance with applicable rules, the Audit Committee must specifically approve in advance all services performed by the independent auditor.
The following table sets forth the aggregate fees billed to the Company and its subsidiaries for the fiscal years ended December 31, 2022 and 2021, by the Company’s independent registered public accounting firm, KPMG. The tax fees in this table represent fees paid to KPMG for the specified year for tax preparation and consulting services.
|
|
|
|
|
|
|
|
|
| Categories of Service |
2022 |
2021 |
| Audit Fees |
$ |
1,428,073 |
|
$ |
545,500 |
|
| Audit-Related Fees |
— |
— |
| Tax Fees |
105,600 |
|
96,700 |
|
| All Other Fees |
— |
— |
| Total Fees |
$ |
1,533,673 |
|
$ |
642,200 |
|
PART IV
Item 15. Exhibits, Financial Statement Schedules
1. Financial Statements
The following financial statements, the notes thereto, and the independent auditors’ report thereon are filed in Part II, Item 8 of this Report. See the index to such financial statements at the beginning of Item 8.
Reports of Independent Registered Public Accounting Firm
Consolidated Balance Sheets as of December 31, 2022 and 2021
Consolidated Statements of Income for the Years Ended December 31, 2022, 2021 and 2020
Consolidated Statements of Comprehensive Income for the Years Ended December 31, 2022, 2021 and 2020
Consolidated Statements of Changes in Stockholders’ Equity for the Years Ended December 31, 2022, 2021 and 2020
Consolidated Statements of Cash Flows for the Years Ended December 31, 2022, 2021 and 2020
Notes to Consolidated Financial Statements
2. Schedules
All schedules are omitted as the required information is either not applicable or not required or is contained in the respective financial statements or in the notes thereto.
3. Exhibits:
See Exhibit Index on page 143.
Item 16. Form 10-K Summary - None The following exhibits are incorporated by reference herein.
EXHIBIT INDEX
|
|
|
|
|
|
|
Exhibit
Number
|
Exhibit |
3.(i) |
|
| 3.(ii) |
|
| 4.1 |
|
| 4.2 |
|
| 4.3 |
|
| 4.4 |
|
| 4.5 |
Amended and Restated Trust Agreement among the Registrant, as Depositor, Wilmington Trust Company, as Property Trustee, Wilmington Trust Company, as Delaware trustee, and certain Administrators named therein, dated as of December 28, 2004, relating to Arrow Capital Statutory Trust III, incorporated herein by reference from the Registrant’s Annual Report on Form 10-K for the year ended December 31, 2004, Exhibit 4.6 |
| 4.6 |
|
| 4.7 |
|
| 4.8 |
|
| 4.9 |
|
| 10.1 |
|
| 10.2 |
|
| 10.3 |
|
| 10.4 |
|
| 10.5 |
|
| 10.6 |
|
| 10.7 |
|
| 10.8 |
|
| 10.9 |
|
|
|
|
|
|
|
|
Exhibit
Number
|
Exhibit |
| 10.10 |
|
| 10.11 |
|
| 10.12 |
|
| 10.13 |
|
| 10.14 |
|
| 10.15 |
|
| 10.16 |
|
| 10.17 |
|
| 10.18 |
|
| 10.19 |
|
| 10.20 |
|
| 10.21 |
|
| 14 |
|
The following exhibits are submitted herewith:
|
|
|
|
|
|
|
Exhibit
Number
|
Exhibit |
|
|
| 21 |
|
| 23 |
|
| 31.1 |
|
| 31.2 |
|
| 32 |
|
| 101.INS |
XBRL Instance Document |
| 101.SCH |
XBRL Taxonomy Extension Schema Document |
| 101.CAL |
XBRL Taxonomy Extension Calculation Linkbase Document |
| 101.DEF |
XBRL Taxonomy Extension Definition Linkbase Document |
| 101.LAB |
XBRL Taxonomy Extension Labels Linkbase Document |
| 101.PRE |
XBRL Taxonomy Extension Presentation Linkbase Document |
* Management contracts or compensation plans required to be filed as an exhibit.
Pursuant to the requirements of Section 13 or 15(d) of the Securities Exchange Act of 1934, the Registrant has duly caused this Report to be signed on its behalf by the undersigned, thereunto duly authorized.
ARROW FINANCIAL CORPORATION
|
|
|
|
|
|
|
|
|
| Date: |
July 17, 2023 |
By: /s/ David S. DeMarco
David S. DeMarco
President and Chief Executive Officer
(Principal Executive Officer)
|
|
|
|
| Date: |
July 17, 2023 |
By: /s/ Penko Ivanov
Penko Ivanov
Chief Financial Officer
(Principal Financial and Accounting Officer)
|
Pursuant to the requirements of the Securities Exchange Act of 1934, this Report has been signed below on July 17, 2023 by the following persons in the capacities indicated.
|
|
|
|
|
|
|
/s/ Mark L. Behan
Mark L. Behan
Director
|
/s/ Elizabeth A. Miller
Elizabeth A. Miller
Director
|
|
|
|
/s/ Tenée R. Casaccio
Tenée R. Casaccio
Director
|
/s/ Raymond F. O'Conor
Raymond F. O'Conor
Director
|
|
|
|
_/s/ Gregory J. Champion
Gregory J. Champion
Director
|
/s/ William L. Owens
William L. Owens
Director and Chairman
|
|
|
|
/s/ Gary C. Dake
Gary C. Dake
Director
|
/s/ Colin L. Read
Colin L. Read
Director
|
|
|
|
/s/ David G. Kruczlnicki
David G. Kruczlnicki
Director
|
|
|
|
|
|
|
|
|
|
EX-21
2
ex21subs-2022.htm
EX-21
Document
Exhibit 21
Arrow Financial Corporation
250 Glen Street
Glens Falls, NY 12801
Subsidiaries
December 31, 2022
|
|
|
|
|
|
| Subsidiary |
Percent of Common Stock Owned |
Subsidiaries of Arrow Financial Corporation: |
|
Glens Falls National Bank and Trust Company
A Nationally Chartered Commercial Bank
Headquarters: Glens Falls, NY |
100 |
Saratoga National Bank and Trust Company
A Nationally Chartered Commercial Bank
Headquarters: Saratoga Springs, NY |
100 |
Arrow Capital Statutory Trust II
A Non-deposit Trust Company
Headquarters: Glens Falls, NY |
100 |
Arrow Capital Statutory Trust III
A Non-deposit Trust Company
Headquarters: Glens Falls, NY |
100 |
| Subsidiaries of Glens Falls National Bank and Trust Company: |
|
Arrow Properties, Inc.
A Real Estate Investment Trust
(Glens Falls National Bank also holds approximately 82%
of non-voting preferred stock)
Headquarters: Glens Falls, NY |
100 |
North Country Investment Advisers, Inc.
A New York Corporation
Headquarters: Glens Falls, NY |
100 |
NC Financial Services, Inc.
A New York Corporation
Headquarters: Glens Falls, NY |
90 |
Glens Falls National Community Development Corporation
A New York Corporation
Headquarters: Glens Falls, NY |
100 |
Upstate Agency, LLC
A New York Corporation
Headquarters: South Glens Falls, NY |
100 |
| Subsidiaries of Saratoga National Bank and Trust Company: |
|
NC Financial Services, Inc.
A New York Corporation
Headquarters: Glens Falls, NY |
10 |
EX-23
3
ex23consent-2022.htm
EX-23
Document
Consent of Independent Registered Public Accounting Firm
The Board of Directors
Arrow Financial Corporation:
We consent to the incorporation by reference in the registration statements (No. 333-258552 and 333-263812) on Forms S-3 and (No. 333-151550, 333-188480, 333-238096, and 333-264787) on Forms S-8 of our reports dated July 17, 2023 with respect to the consolidated financial statements of Arrow Financial Corporation and subsidiaries and the effectiveness of internal control over financial reporting.
/s/ KPMG LLP
Albany, New York
July 17, 2023
EX-31.1
4
ex311ceocert-2022.htm
EX-31.1
Document
Certification of the Chief Executive Officer Pursuant to
Securities Exchange Act Rules 13a-14 and 15d-14
As Adopted Pursuant to
Section 302 of the Sarbanes-Oxley Act of 2002
I, David S. DeMarco, certify that:
1. I have reviewed the annual report on Form 10-K of Arrow Financial Corporation;
2. Based on my knowledge, this report does not contain any untrue statement of a material fact or omit to state a material fact necessary to make the statements made, in light of the circumstances under which such statements were made, not misleading with respect to the period covered by this report;
3. Based on my knowledge, the financial statements, and other financial information included in this report, fairly present in all material respects the financial condition, results of operations and cash flows of the registrant as of, and for, the periods presented in this report;
4. The registrant's other certifying officers and I are responsible for establishing and maintaining disclosure controls and procedures (as defined in Exchange Act Rules 13a-15(e) and 15d-15(e)) and internal control over financial reporting (as defined in Exchange Act Rules 13a-15(f) and 15d-15(f)) for the registrant and have:
(a) Designed such disclosure controls and procedures, or caused such disclosure controls and procedures to be designed under our supervision, to ensure that material information relating to the registrant, including its consolidated subsidiaries, is made known to us by others within those entities, particularly during the period in which this report is being prepared;
(b) Designed such internal control over financial reporting, or caused such internal control over financial reporting to be designed under our supervision, to provide reasonable assurance regarding the reliability of financial reporting and the preparation of financial statements for external purposes in accordance with generally accepted accounting principles;
(c) Evaluated the effectiveness of the registrant's disclosure controls and procedures and presented in this report our conclusions about the effectiveness of the disclosure controls and procedures, as of the end of the period covered by this report based on such evaluation; and
(d) Disclosed in this report any change in the registrant's internal control over financial reporting that occurred during the registrant's most recent fiscal quarter (the registrant's fourth fiscal quarter in the case of an annual report) that has materially affected, or is reasonably likely to materially affect, the registrant's internal control over financial reporting.
5. The registrant's other certifying officers and I have disclosed, based on our most recent evaluation of internal control over financial reporting, to the registrant's auditors and the audit committee of the registrant's board of directors (or persons performing the equivalent functions):
(a) All significant deficiencies and material weaknesses in the design or operation of internal control over financial reporting which are reasonably likely to adversely affect the registrant's ability to record, process, summarize and report financial information; and
(b) Any fraud, whether or not material, that involves management or other employees who have a significant role in the registrant's internal control over financial reporting.
Date: July 17, 2023
By: /s/ David S. DeMarco
David S. DeMarco
Chief Executive Officer
EX-31.2
5
ex312cfocert-2022.htm
EX-31.2
Document
Certification of the Chief Financial Officer Pursuant to
Securities Exchange Act Rules 13a-14 and 15d-14
As Adopted Pursuant to
Section 302 of the Sarbanes-Oxley Act of 2002
I, Penko Ivanov, certify that:
1. I have reviewed the annual report on Form 10-K of Arrow Financial Corporation;
2. Based on my knowledge, this report does not contain any untrue statement of a material fact or omit to state a material fact necessary to make the statements made, in light of the circumstances under which such statements were made, not misleading with respect to the period covered by this report;
3. Based on my knowledge, the financial statements, and other financial information included in this report, fairly present in all material respects the financial condition, results of operations and cash flows of the registrant as of, and for, the periods presented in this report;
4. The registrant's other certifying officers and I are responsible for establishing and maintaining disclosure controls and procedures (as defined in Exchange Act Rules 13a-15(e) and 15d-15(e)) and internal control over financial reporting (as defined in Exchange Act Rules 13a-15(f) and 15d-15(f)) for the registrant and have:
(a) Designed such disclosure controls and procedures, or caused such disclosure controls and procedures to be designed under our supervision, to ensure that material information relating to the registrant, including its consolidated subsidiaries, is made known to us by others within those entities, particularly during the period in which this report is being prepared;
(b) Designed such internal control over financial reporting, or caused such internal control over financial reporting to be designed under our supervision, to provide reasonable assurance regarding the reliability of financial reporting and the preparation of financial statements for external purposes in accordance with generally accepted accounting principles;
(c) Evaluated the effectiveness of the registrant's disclosure controls and procedures and presented in this report our conclusions about the effectiveness of the disclosure controls and procedures, as of the end of the period covered by this report based on such evaluation; and
(d) Disclosed in this report any change in the registrant's internal control over financial reporting that occurred during the registrant's most recent fiscal quarter (the registrant's fourth fiscal quarter in the case of an annual report) that has materially affected, or is reasonably likely to materially affect, the registrant's internal control over financial reporting.
5. The registrant's other certifying officers and I have disclosed, based on our most recent evaluation of internal control over financial reporting, to the registrant's auditors and the audit committee of the registrant's board of directors (or persons performing the equivalent functions):
(a) All significant deficiencies and material weaknesses in the design or operation of internal control over financial reporting which are reasonably likely to adversely affect the registrant's ability to record, process, summarize and report financial information; and
(b) Any fraud, whether or not material, that involves management or other employees who have a significant role in the registrant's internal control over financial reporting.
Date: July 17, 2023
By: /s/ Penko Ivanov
Penko Ivanov
Chief Financial Officer
EX-32
6
ex32906cert-2022.htm
EX-32
Document
Certification of Chief Executive Officer and Chief Financial Officer
Pursuant to 18 U.S.C. Section 1350
As Adopted Pursuant To
Section 906 of The Sarbanes-Oxley Act of 2002
In connection with the Annual Report of Arrow Financial Corporation (the "Company") on Form 10-K for the year ended December 31, 2022, filed with the Securities and Exchange Commission (the "Report"), we, David S. DeMarco, Chief Executive Officer of the Company, and Penko Ivanov, Chief Financial Officer of the Company, hereby certify, in accordance with 18 U.S.C. Section 1350, as adopted pursuant to Section 906 of the Sarbanes-Oxley Act of 2002, that, to the best of our knowledge:
(a) The Report fully complies with the requirements of Section 13(a) or 15(d) of the Securities Exchange Act of 1934, as amended; and
(b) The information contained in the Report fairly presents, in all material respects, the financial condition and results of operations of the Company.
Dated: July 17, 2023
/s/ David S. DeMarco
David S. DeMarco
Chief Executive Officer
/s/ Penko Ivanov
Penko Ivanov
Chief Financial Officer
A signed original of this written statement required by Section 906 has been provided to Arrow Financial Corporation and will be retained by Arrow Financial Corporation and furnished to the Securities and Exchange Commission or its staff upon request.