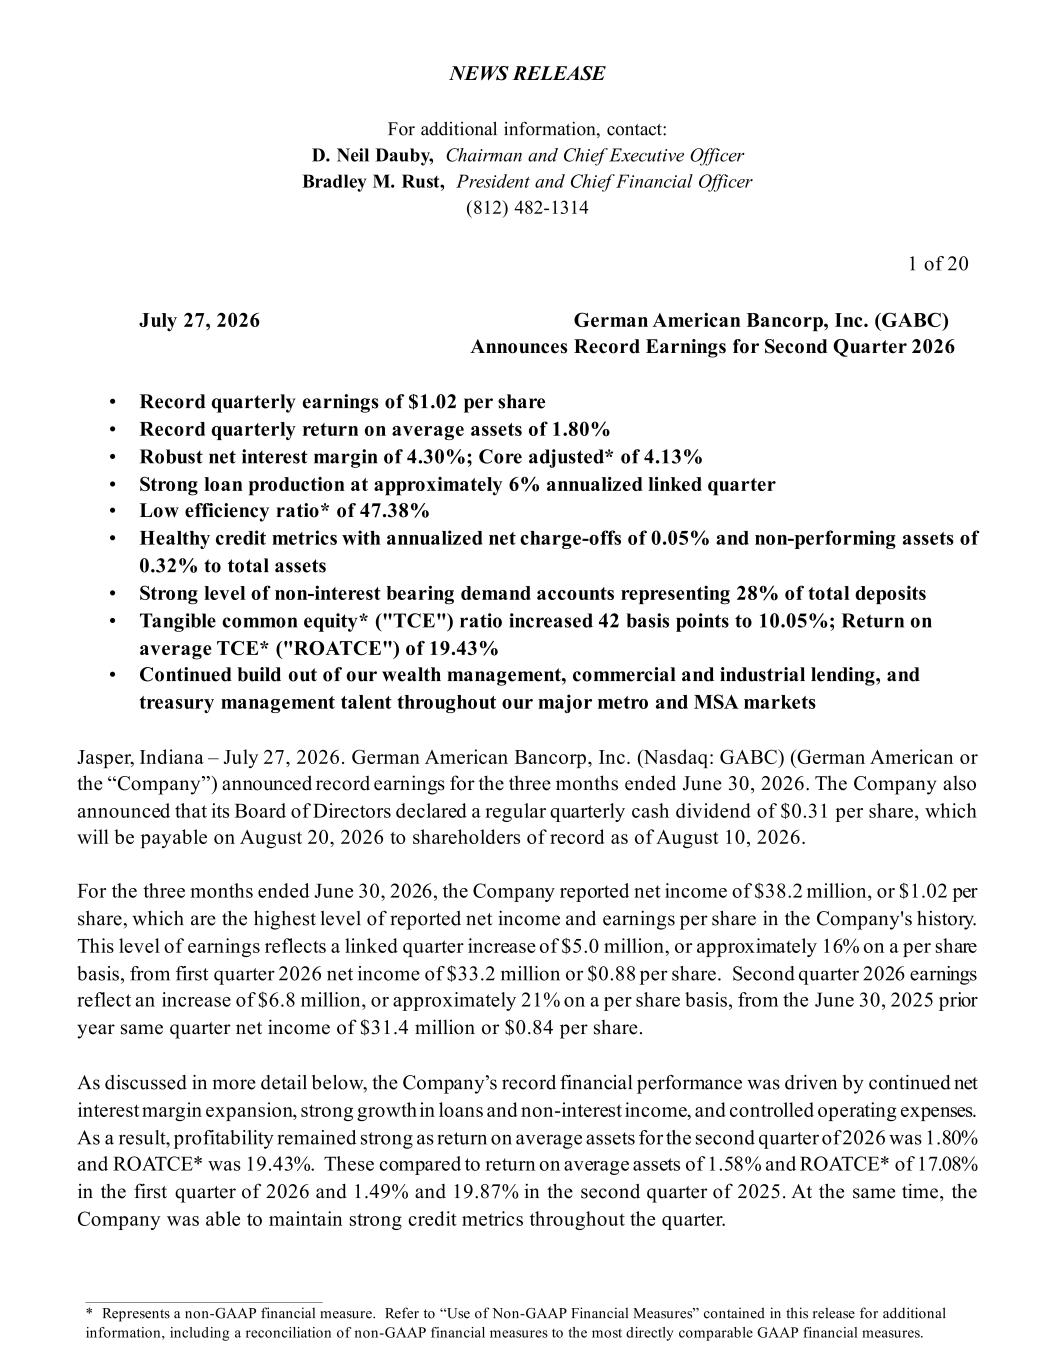
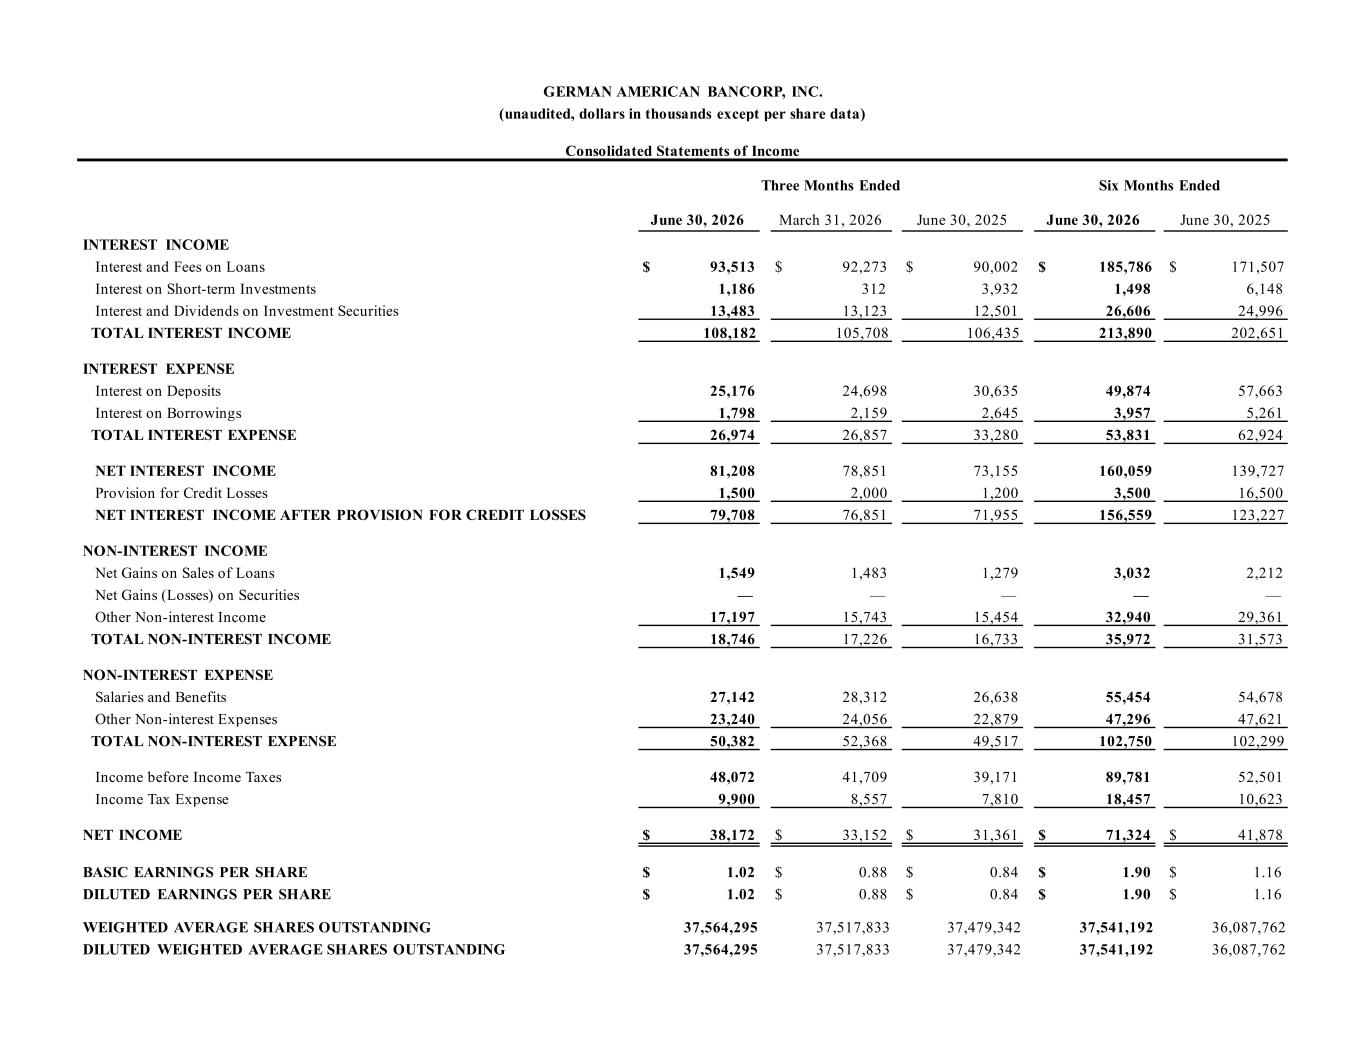
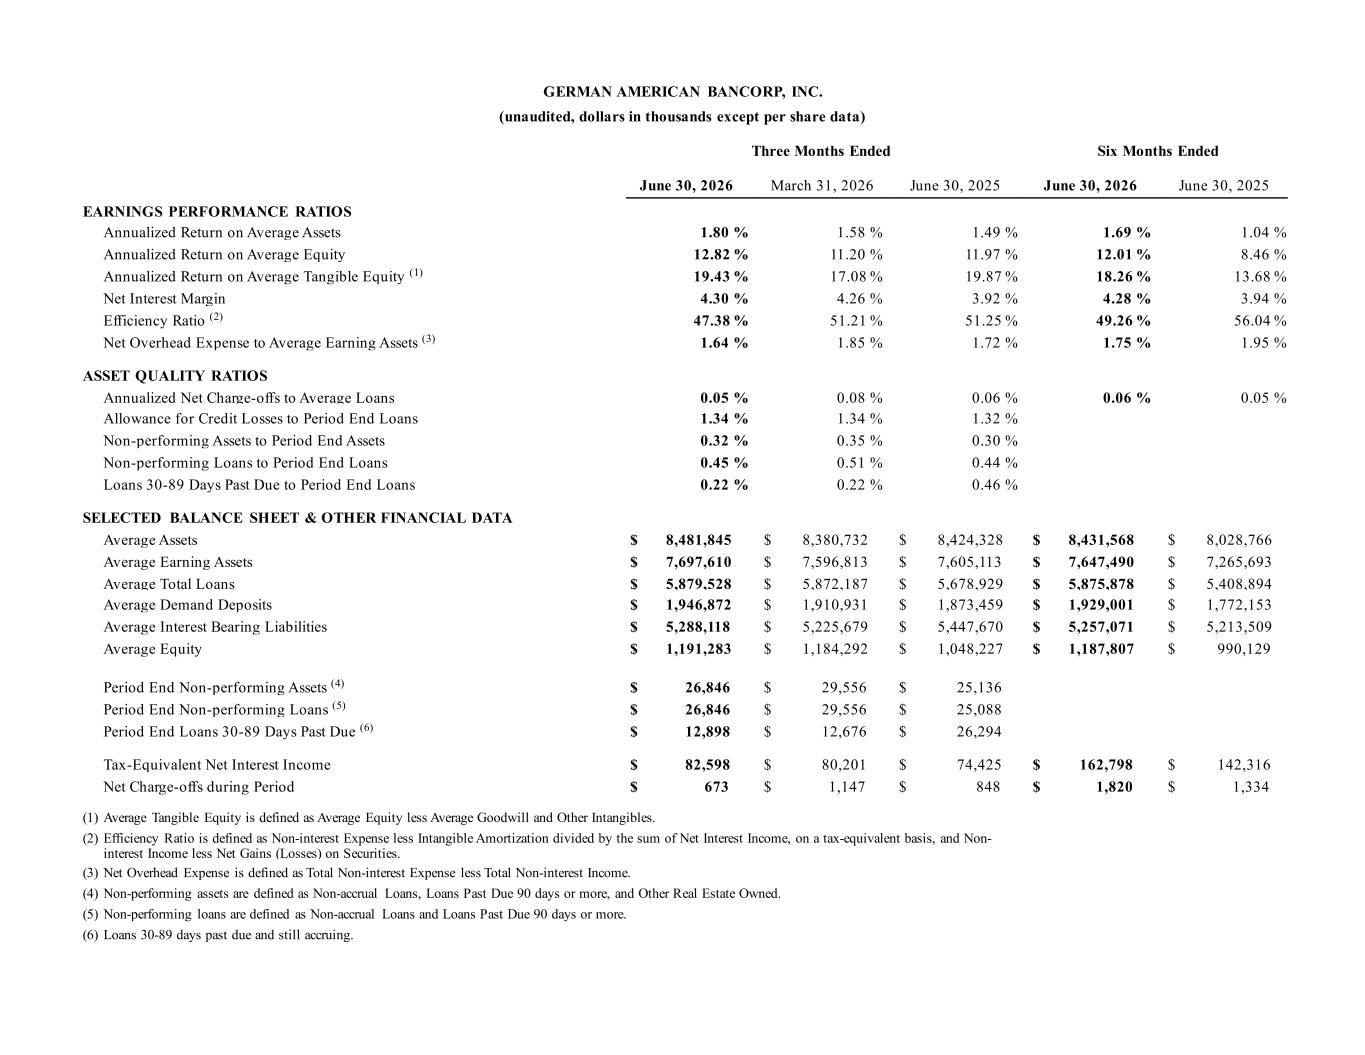
NEWS RELEASE For additional information, contact: D. Neil Dauby, Chairman and Chief Executive Officer Bradley M. Rust, President and Chief Financial Officer (812) 482-1314 1 of 20 ___________________________________________ * Represents a non-GAAP financial measure. Refer to “Use of Non-GAAP Financial Measures” contained in this release for additional information, including a reconciliation of non-GAAP financial measures to the most directly comparable GAAP financial measures. July 27, 2026 German American Bancorp, Inc. (GABC) Announces Record Earnings for Second Quarter 2026 • Record quarterly earnings of $1.02 per share • Record quarterly return on average assets of 1.80% • Robust net interest margin of 4.30%; Core adjusted* of 4.13% • Strong loan production at approximately 6% annualized linked quarter • Low efficiency ratio* of 47.38% • Healthy credit metrics with annualized net charge-offs of 0.05% and non-performing assets of 0.32% to total assets • Strong level of non-interest bearing demand accounts representing 28% of total deposits • Tangible common equity* ("TCE") ratio increased 42 basis points to 10.05%; Return on average TCE* ("ROATCE") of 19.43% • Continued build out of our wealth management, commercial and industrial lending, and treasury management talent throughout our major metro and MSA markets Jasper, Indiana – July 27, 2026. German American Bancorp, Inc. (Nasdaq: GABC) (German American or the “Company”) announced record earnings for the three months ended June 30, 2026. The Company also announced that its Board of Directors declared a regular quarterly cash dividend of $0.31 per share, which will be payable on August 20, 2026 to shareholders of record as of August 10, 2026. For the three months ended June 30, 2026, the Company reported net income of $38.2 million, or $1.02 per share, which are the highest level of reported net income and earnings per share in the Company's history. This level of earnings reflects a linked quarter increase of $5.0 million, or approximately 16% on a per share basis, from first quarter 2026 net income of $33.2 million or $0.88 per share. Second quarter 2026 earnings reflect an increase of $6.8 million, or approximately 21% on a per share basis, from the June 30, 2025 prior year same quarter net income of $31.4 million or $0.84 per share. As discussed in more detail below, the Company’s record financial performance was driven by continued net interest margin expansion, strong growth in loans and non-interest income, and controlled operating expenses. As a result, profitability remained strong as return on average assets for the second quarter of 2026 was 1.80% and ROATCE* was 19.43%. These compared to return on average assets of 1.58% and ROATCE* of 17.08% in the first quarter of 2026 and 1.49% and 19.87% in the second quarter of 2025. At the same time, the Company was able to maintain strong credit metrics throughout the quarter.
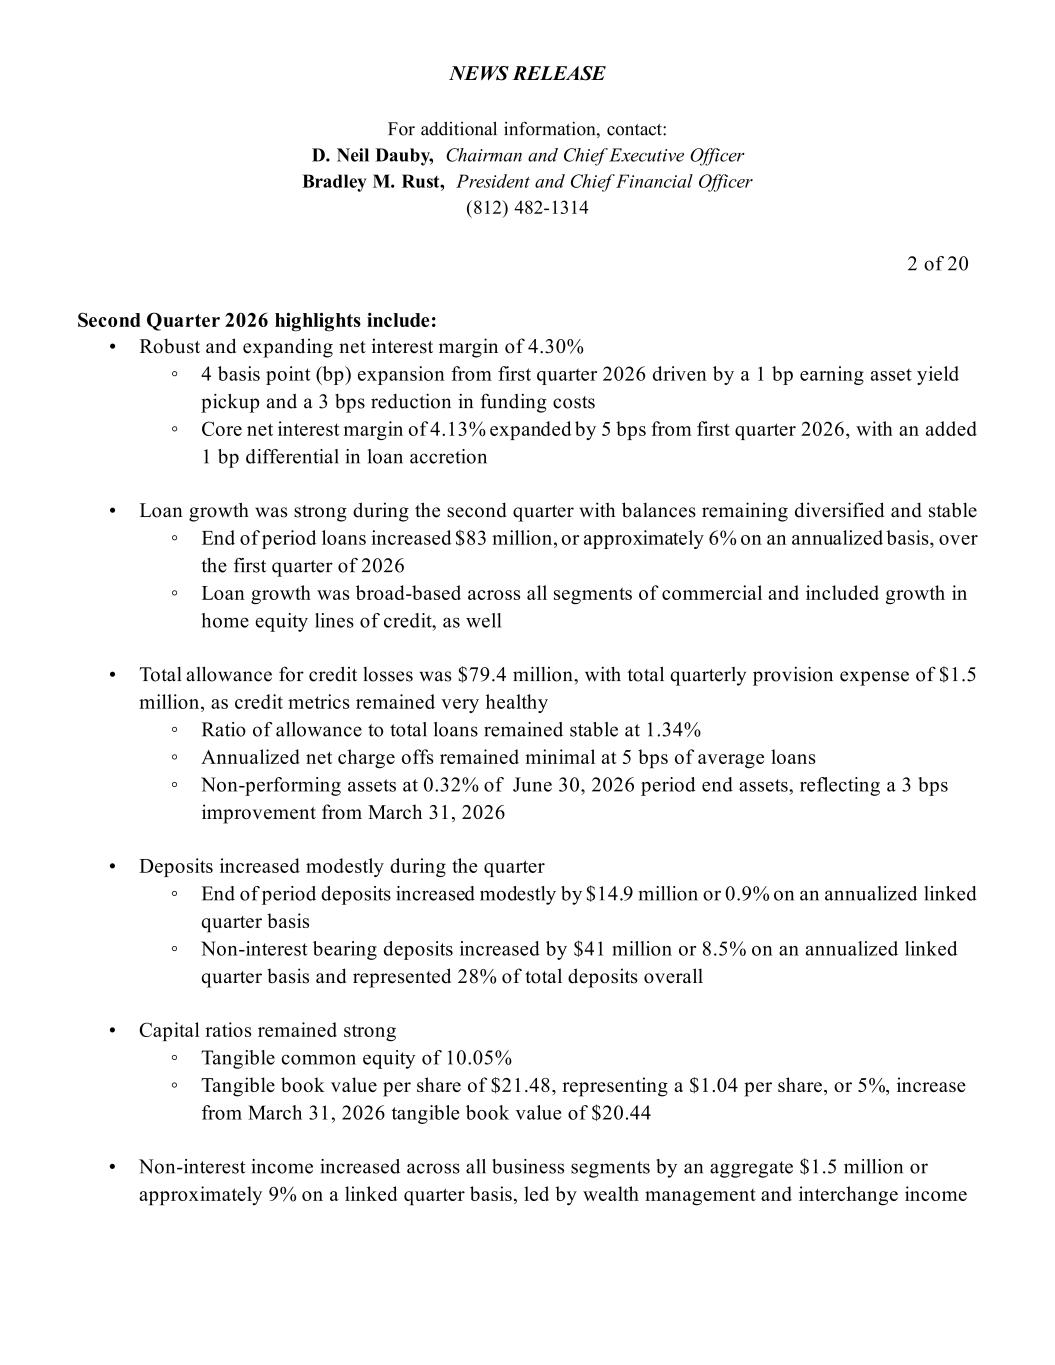
NEWS RELEASE For additional information, contact: D. Neil Dauby, Chairman and Chief Executive Officer Bradley M. Rust, President and Chief Financial Officer (812) 482-1314 2 of 20 Second Quarter 2026 highlights include: • Robust and expanding net interest margin of 4.30% ◦ 4 basis point (bp) expansion from first quarter 2026 driven by a 1 bp earning asset yield pickup and a 3 bps reduction in funding costs ◦ Core net interest margin of 4.13% expanded by 5 bps from first quarter 2026, with an added 1 bp differential in loan accretion • Loan growth was strong during the second quarter with balances remaining diversified and stable ◦ End of period loans increased $83 million, or approximately 6% on an annualized basis, over the first quarter of 2026 ◦ Loan growth was broad-based across all segments of commercial and included growth in home equity lines of credit, as well • Total allowance for credit losses was $79.4 million, with total quarterly provision expense of $1.5 million, as credit metrics remained very healthy ◦ Ratio of allowance to total loans remained stable at 1.34% ◦ Annualized net charge offs remained minimal at 5 bps of average loans ◦ Non-performing assets at 0.32% of June 30, 2026 period end assets, reflecting a 3 bps improvement from March 31, 2026 • Deposits increased modestly during the quarter ◦ End of period deposits increased modestly by $14.9 million or 0.9% on an annualized linked quarter basis ◦ Non-interest bearing deposits increased by $41 million or 8.5% on an annualized linked quarter basis and represented 28% of total deposits overall • Capital ratios remained strong ◦ Tangible common equity of 10.05% ◦ Tangible book value per share of $21.48, representing a $1.04 per share, or 5%, increase from March 31, 2026 tangible book value of $20.44 • Non-interest income increased across all business segments by an aggregate $1.5 million or approximately 9% on a linked quarter basis, led by wealth management and interchange income
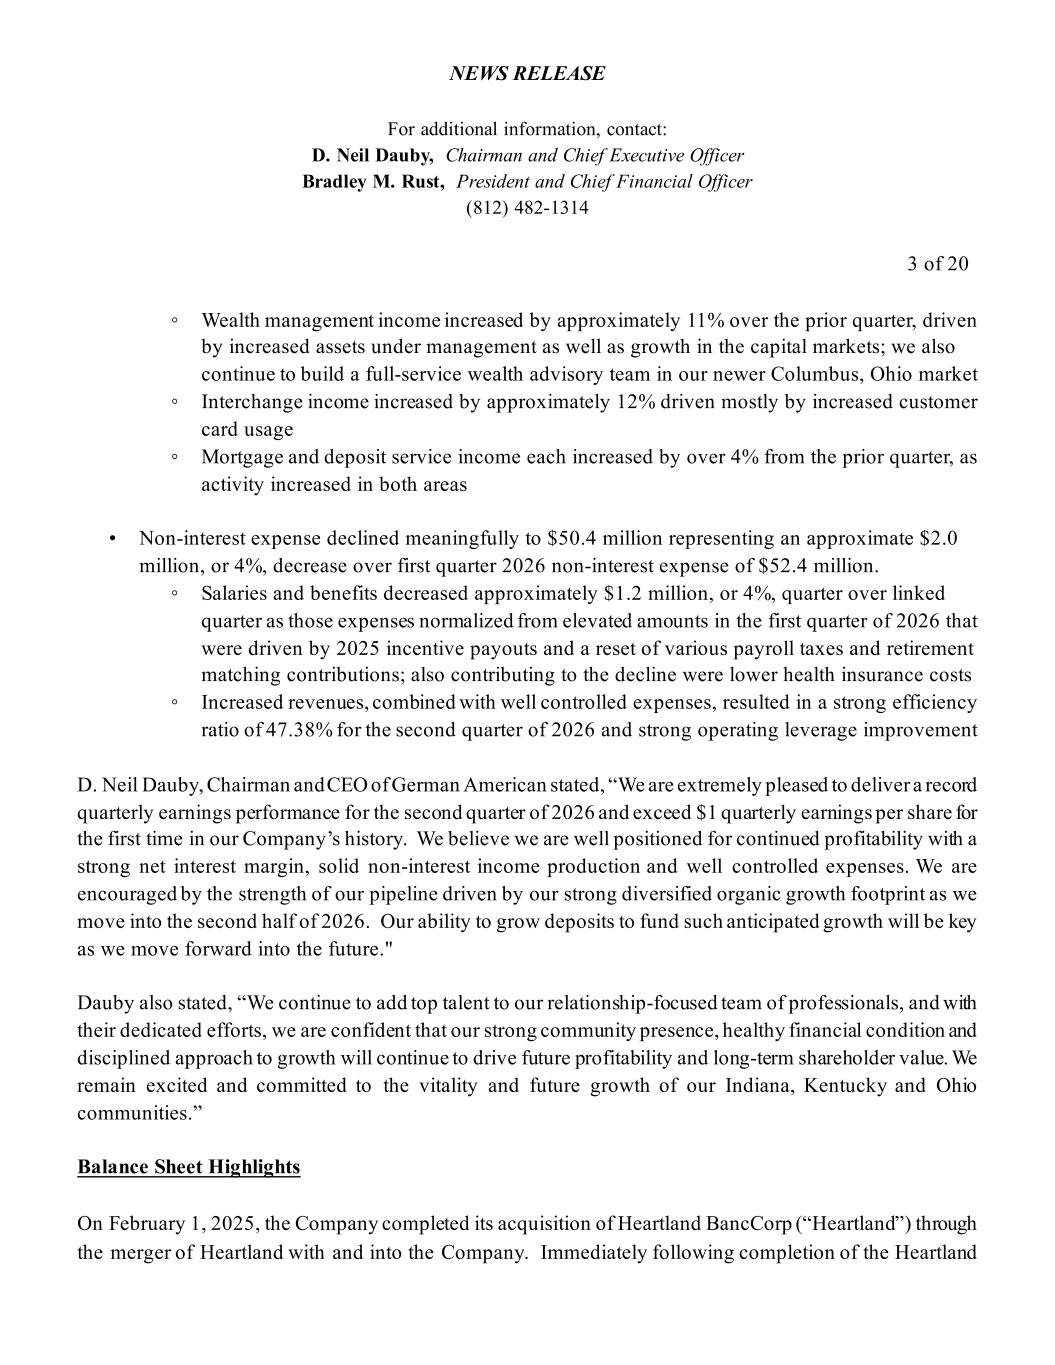
NEWS RELEASE For additional information, contact: D. Neil Dauby, Chairman and Chief Executive Officer Bradley M. Rust, President and Chief Financial Officer (812) 482-1314 3 of 20 ◦ Wealth management income increased by approximately 11% over the prior quarter, driven by increased assets under management as well as growth in the capital markets; we also continue to build a full-service wealth advisory team in our newer Columbus, Ohio market ◦ Interchange income increased by approximately 12% driven mostly by increased customer card usage ◦ Mortgage and deposit service income each increased by over 4% from the prior quarter, as activity increased in both areas • Non-interest expense declined meaningfully to $50.4 million representing an approximate $2.0 million, or 4%, decrease over first quarter 2026 non-interest expense of $52.4 million. ◦ Salaries and benefits decreased approximately $1.2 million, or 4%, quarter over linked quarter as those expenses normalized from elevated amounts in the first quarter of 2026 that were driven by 2025 incentive payouts and a reset of various payroll taxes and retirement matching contributions; also contributing to the decline were lower health insurance costs ◦ Increased revenues, combined with well controlled expenses, resulted in a strong efficiency ratio of 47.38% for the second quarter of 2026 and strong operating leverage improvement D. Neil Dauby, Chairman and CEO of German American stated, “We are extremely pleased to deliver a record quarterly earnings performance for the second quarter of 2026 and exceed $1 quarterly earnings per share for the first time in our Company’s history. We believe we are well positioned for continued profitability with a strong net interest margin, solid non-interest income production and well controlled expenses. We are encouraged by the strength of our pipeline driven by our strong diversified organic growth footprint as we move into the second half of 2026. Our ability to grow deposits to fund such anticipated growth will be key as we move forward into the future." Dauby also stated, “We continue to add top talent to our relationship-focused team of professionals, and with their dedicated efforts, we are confident that our strong community presence, healthy financial condition and disciplined approach to growth will continue to drive future profitability and long-term shareholder value. We remain excited and committed to the vitality and future growth of our Indiana, Kentucky and Ohio communities.” Balance Sheet Highlights On February 1, 2025, the Company completed its acquisition of Heartland BancCorp (“Heartland”) through the merger of Heartland with and into the Company. Immediately following completion of the Heartland
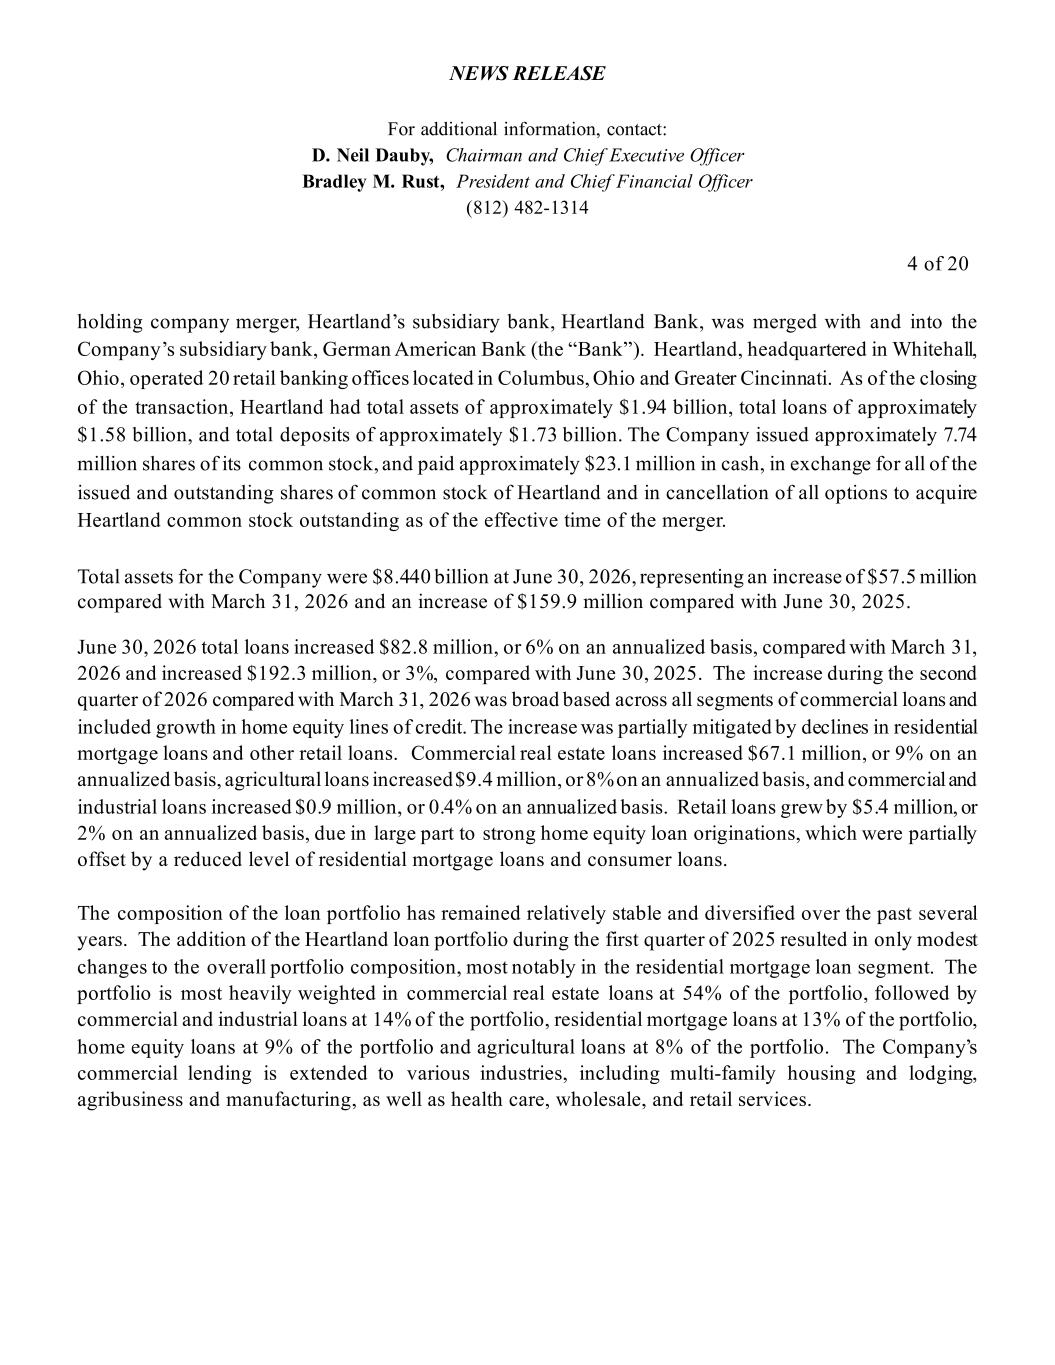
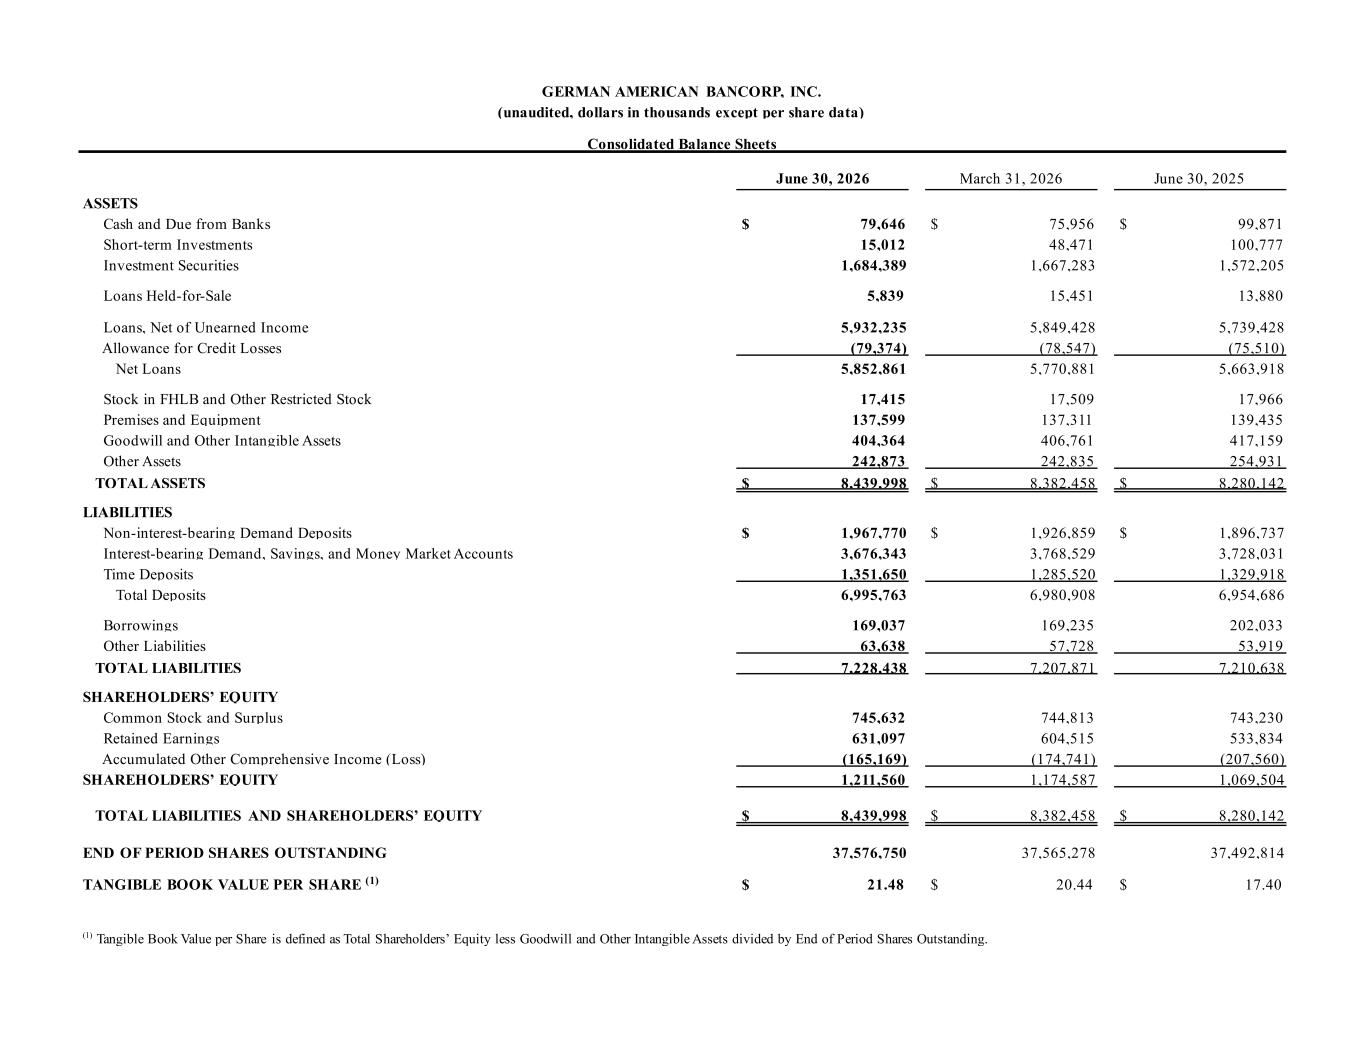
NEWS RELEASE For additional information, contact: D. Neil Dauby, Chairman and Chief Executive Officer Bradley M. Rust, President and Chief Financial Officer (812) 482-1314 4 of 20 holding company merger, Heartland’s subsidiary bank, Heartland Bank, was merged with and into the Company’s subsidiary bank, German American Bank (the “Bank”). Heartland, headquartered in Whitehall, Ohio, operated 20 retail banking offices located in Columbus, Ohio and Greater Cincinnati. As of the closing of the transaction, Heartland had total assets of approximately $1.94 billion, total loans of approximately $1.58 billion, and total deposits of approximately $1.73 billion. The Company issued approximately 7.74 million shares of its common stock, and paid approximately $23.1 million in cash, in exchange for all of the issued and outstanding shares of common stock of Heartland and in cancellation of all options to acquire Heartland common stock outstanding as of the effective time of the merger. Total assets for the Company were $8.440 billion at June 30, 2026, representing an increase of $57.5 million compared with March 31, 2026 and an increase of $159.9 million compared with June 30, 2025. June 30, 2026 total loans increased $82.8 million, or 6% on an annualized basis, compared with March 31, 2026 and increased $192.3 million, or 3%, compared with June 30, 2025. The increase during the second quarter of 2026 compared with March 31, 2026 was broad based across all segments of commercial loans and included growth in home equity lines of credit. The increase was partially mitigated by declines in residential mortgage loans and other retail loans. Commercial real estate loans increased $67.1 million, or 9% on an annualized basis, agricultural loans increased $9.4 million, or 8% on an annualized basis, and commercial and industrial loans increased $0.9 million, or 0.4% on an annualized basis. Retail loans grew by $5.4 million, or 2% on an annualized basis, due in large part to strong home equity loan originations, which were partially offset by a reduced level of residential mortgage loans and consumer loans. The composition of the loan portfolio has remained relatively stable and diversified over the past several years. The addition of the Heartland loan portfolio during the first quarter of 2025 resulted in only modest changes to the overall portfolio composition, most notably in the residential mortgage loan segment. The portfolio is most heavily weighted in commercial real estate loans at 54% of the portfolio, followed by commercial and industrial loans at 14% of the portfolio, residential mortgage loans at 13% of the portfolio, home equity loans at 9% of the portfolio and agricultural loans at 8% of the portfolio. The Company’s commercial lending is extended to various industries, including multi-family housing and lodging, agribusiness and manufacturing, as well as health care, wholesale, and retail services.
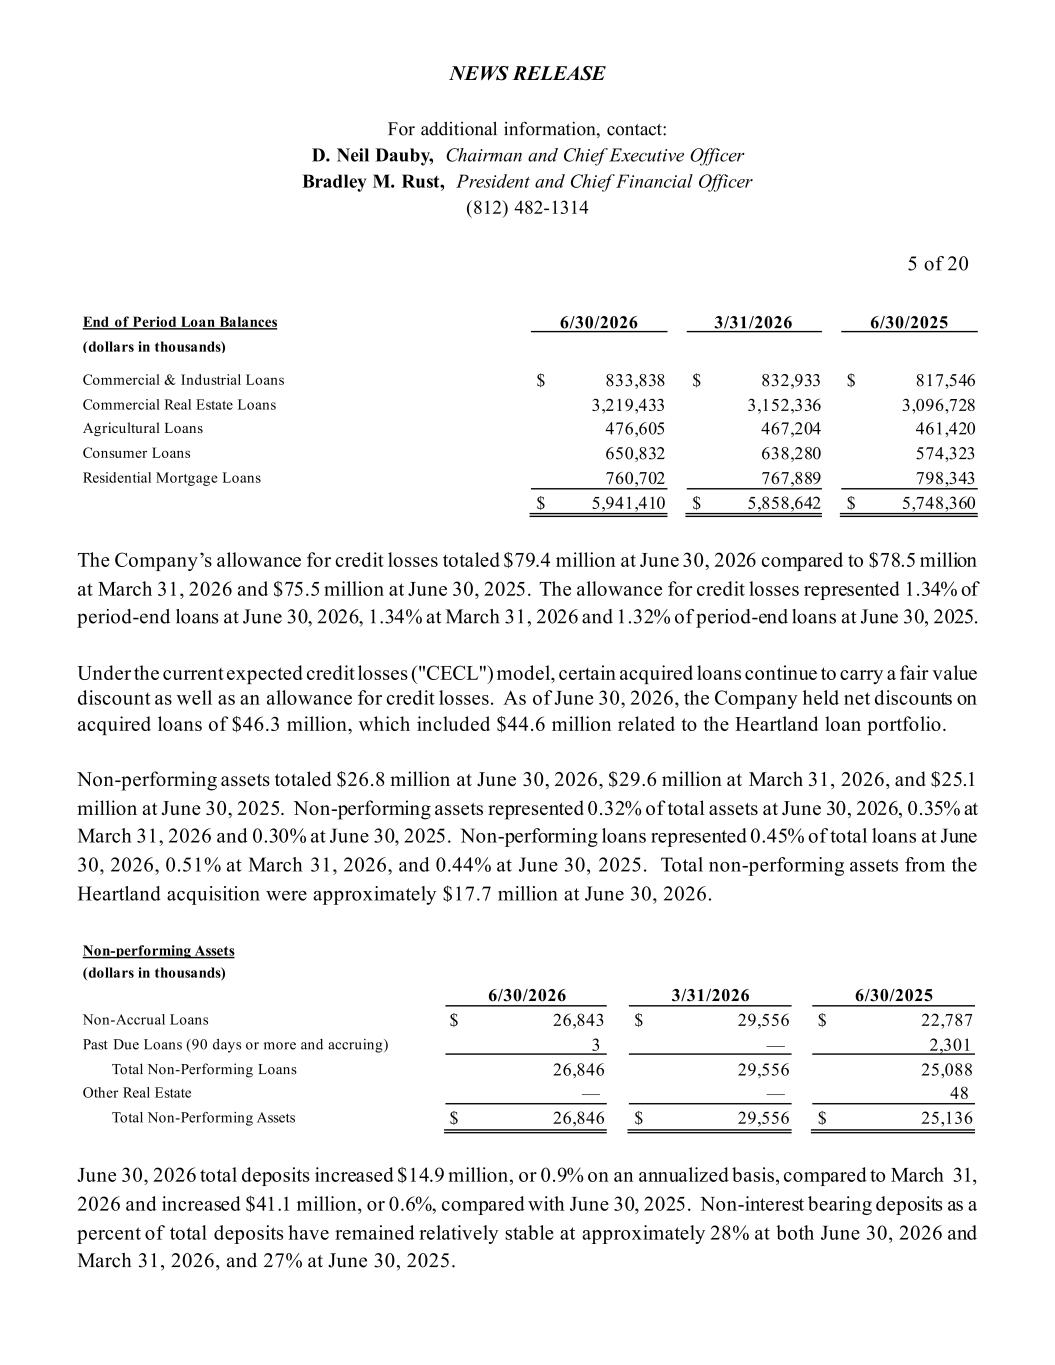
NEWS RELEASE For additional information, contact: D. Neil Dauby, Chairman and Chief Executive Officer Bradley M. Rust, President and Chief Financial Officer (812) 482-1314 5 of 20 End of Period Loan Balances 6/30/2026 3/31/2026 6/30/2025 (dollars in thousands) Commercial & Industrial Loans $ 833,838 $ 832,933 $ 817,546 Commercial Real Estate Loans 3,219,433 3,152,336 3,096,728 Agricultural Loans 476,605 467,204 461,420 Consumer Loans 650,832 638,280 574,323 Residential Mortgage Loans 760,702 767,889 798,343 $ 5,941,410 $ 5,858,642 $ 5,748,360 The Company’s allowance for credit losses totaled $79.4 million at June 30, 2026 compared to $78.5 million at March 31, 2026 and $75.5 million at June 30, 2025. The allowance for credit losses represented 1.34% of period-end loans at June 30, 2026, 1.34% at March 31, 2026 and 1.32% of period-end loans at June 30, 2025. Under the current expected credit losses ("CECL") model, certain acquired loans continue to carry a fair value discount as well as an allowance for credit losses. As of June 30, 2026, the Company held net discounts on acquired loans of $46.3 million, which included $44.6 million related to the Heartland loan portfolio. Non-performing assets totaled $26.8 million at June 30, 2026, $29.6 million at March 31, 2026, and $25.1 million at June 30, 2025. Non-performing assets represented 0.32% of total assets at June 30, 2026, 0.35% at March 31, 2026 and 0.30% at June 30, 2025. Non-performing loans represented 0.45% of total loans at June 30, 2026, 0.51% at March 31, 2026, and 0.44% at June 30, 2025. Total non-performing assets from the Heartland acquisition were approximately $17.7 million at June 30, 2026. Non-performing Assets (dollars in thousands) 6/30/2026 3/31/2026 6/30/2025 Non-Accrual Loans $ 26,843 $ 29,556 $ 22,787 Past Due Loans (90 days or more and accruing) 3 — 2,301 Total Non-Performing Loans 26,846 29,556 25,088 Other Real Estate — — 48 Total Non-Performing Assets $ 26,846 $ 29,556 $ 25,136 June 30, 2026 total deposits increased $14.9 million, or 0.9% on an annualized basis, compared to March 31, 2026 and increased $41.1 million, or 0.6%, compared with June 30, 2025. Non-interest bearing deposits as a percent of total deposits have remained relatively stable at approximately 28% at both June 30, 2026 and March 31, 2026, and 27% at June 30, 2025.
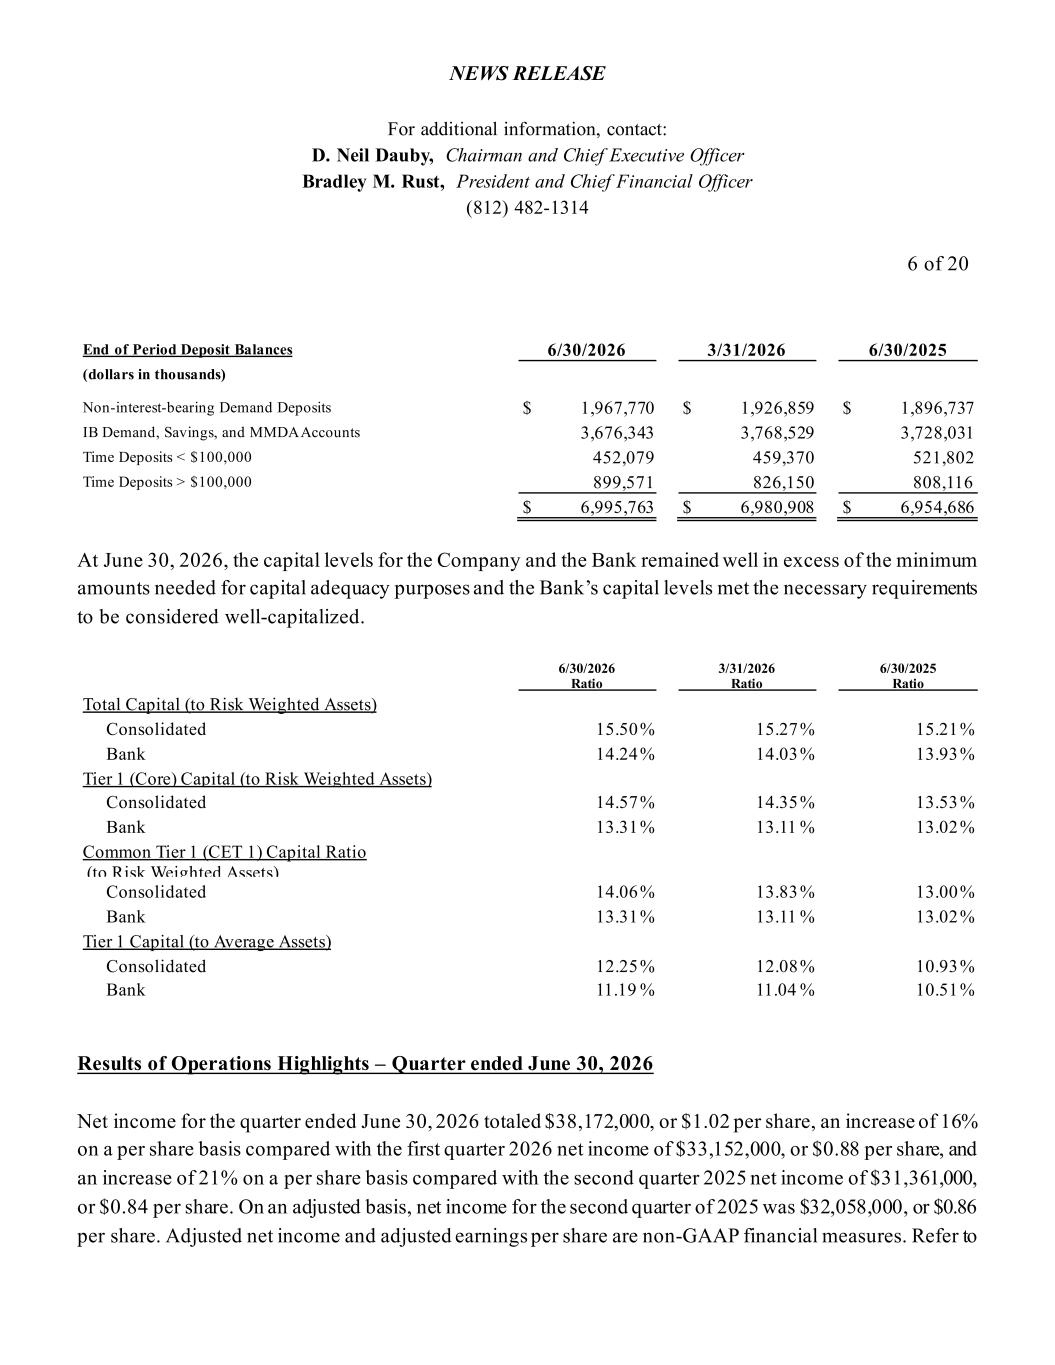
NEWS RELEASE For additional information, contact: D. Neil Dauby, Chairman and Chief Executive Officer Bradley M. Rust, President and Chief Financial Officer (812) 482-1314 6 of 20 End of Period Deposit Balances 6/30/2026 3/31/2026 6/30/2025 (dollars in thousands) Non-interest-bearing Demand Deposits $ 1,967,770 $ 1,926,859 $ 1,896,737 IB Demand, Savings, and MMDA Accounts 3,676,343 3,768,529 3,728,031 Time Deposits < $100,000 452,079 459,370 521,802 Time Deposits > $100,000 899,571 826,150 808,116 $ 6,995,763 $ 6,980,908 $ 6,954,686 At June 30, 2026, the capital levels for the Company and the Bank remained well in excess of the minimum amounts needed for capital adequacy purposes and the Bank’s capital levels met the necessary requirements to be considered well-capitalized. 6/30/2026 Ratio 3/31/2026 Ratio 6/30/2025 Ratio Total Capital (to Risk Weighted Assets) Consolidated 15.50 % 15.27 % 15.21 % Bank 14.24 % 14.03 % 13.93 % Tier 1 (Core) Capital (to Risk Weighted Assets) Consolidated 14.57 % 14.35 % 13.53 % Bank 13.31 % 13.11 % 13.02 % Common Tier 1 (CET 1) Capital Ratio (to Risk Weighted Assets) Consolidated 14.06 % 13.83 % 13.00 % Bank 13.31 % 13.11 % 13.02 % Tier 1 Capital (to Average Assets) Consolidated 12.25 % 12.08 % 10.93 % Bank 11.19 % 11.04 % 10.51 % Results of Operations Highlights – Quarter ended June 30, 2026 Net income for the quarter ended June 30, 2026 totaled $38,172,000, or $1.02 per share, an increase of 16% on a per share basis compared with the first quarter 2026 net income of $33,152,000, or $0.88 per share, and an increase of 21% on a per share basis compared with the second quarter 2025 net income of $31,361,000, or $0.84 per share. On an adjusted basis, net income for the second quarter of 2025 was $32,058,000, or $0.86 per share. Adjusted net income and adjusted earnings per share are non-GAAP financial measures. Refer to
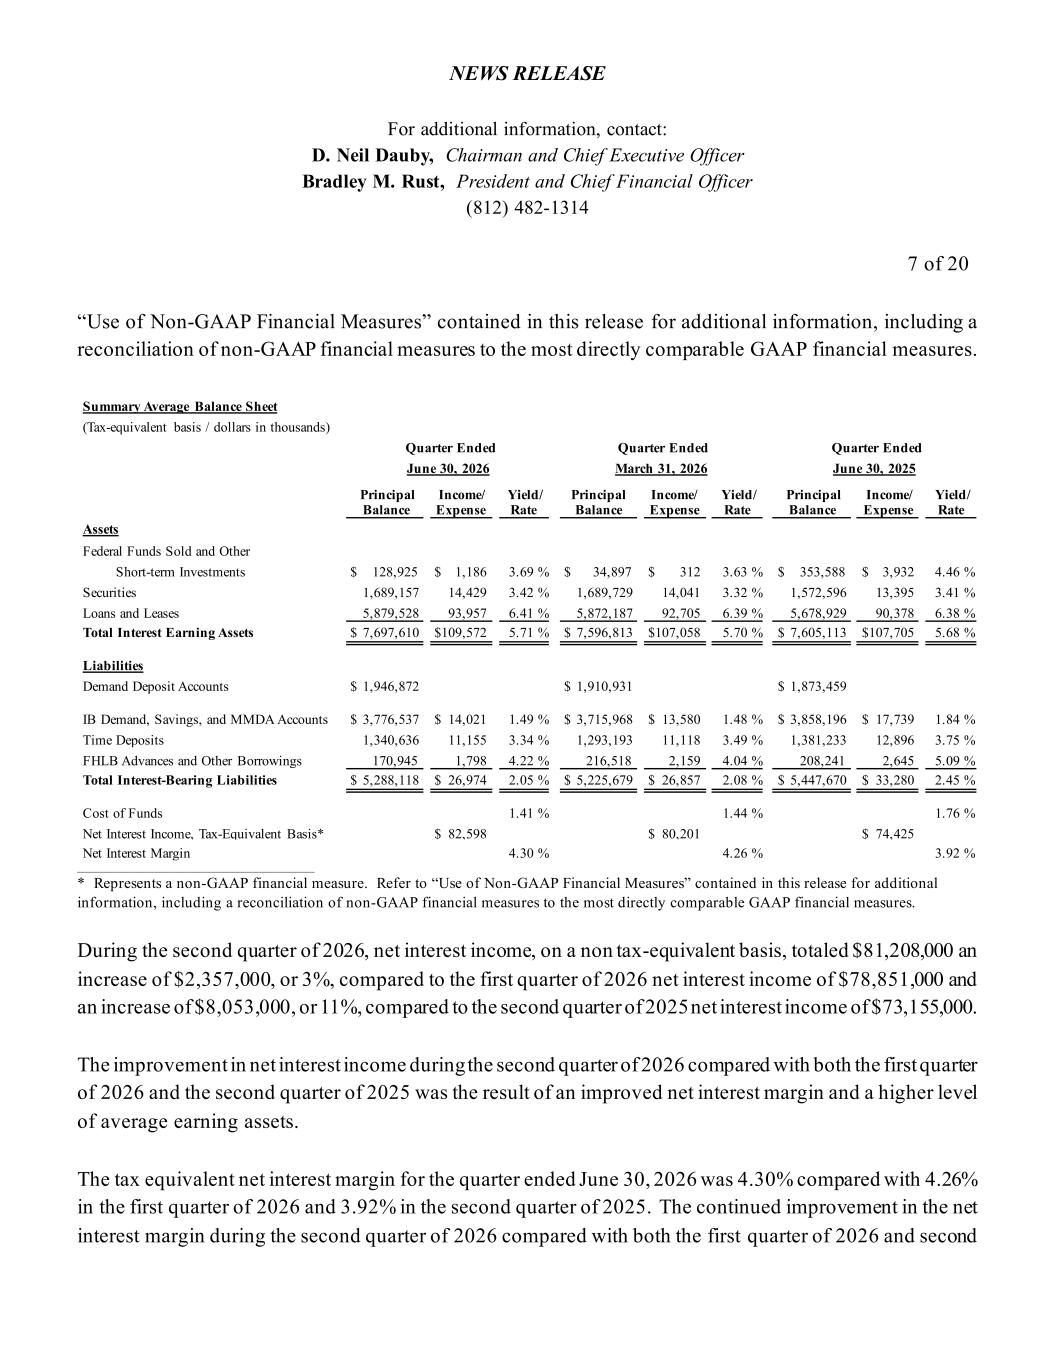
NEWS RELEASE For additional information, contact: D. Neil Dauby, Chairman and Chief Executive Officer Bradley M. Rust, President and Chief Financial Officer (812) 482-1314 7 of 20 “Use of Non-GAAP Financial Measures” contained in this release for additional information, including a reconciliation of non-GAAP financial measures to the most directly comparable GAAP financial measures. Summary Average Balance Sheet (Tax-equivalent basis / dollars in thousands) Quarter Ended Quarter Ended Quarter Ended June 30, 2026 March 31, 2026 June 30, 2025 Principal Balance Income/ Expense Yield/ Rate Principal Balance Income/ Expense Yield/ Rate Principal Balance Income/ Expense Yield/ Rate Assets Federal Funds Sold and Other Short-term Investments $ 128,925 $ 1,186 3.69 % $ 34,897 $ 312 3.63 % $ 353,588 $ 3,932 4.46 % Securities 1,689,157 14,429 3.42 % 1,689,729 14,041 3.32 % 1,572,596 13,395 3.41 % Loans and Leases 5,879,528 93,957 6.41 % 5,872,187 92,705 6.39 % 5,678,929 90,378 6.38 % Total Interest Earning Assets $ 7,697,610 $109,572 5.71 % $ 7,596,813 $107,058 5.70 % $ 7,605,113 $107,705 5.68 % Liabilities Demand Deposit Accounts $ 1,946,872 $ 1,910,931 $ 1,873,459 IB Demand, Savings, and MMDA Accounts $ 3,776,537 $ 14,021 1.49 % $ 3,715,968 $ 13,580 1.48 % $ 3,858,196 $ 17,739 1.84 % Time Deposits 1,340,636 11,155 3.34 % 1,293,193 11,118 3.49 % 1,381,233 12,896 3.75 % FHLB Advances and Other Borrowings 170,945 1,798 4.22 % 216,518 2,159 4.04 % 208,241 2,645 5.09 % Total Interest-Bearing Liabilities $ 5,288,118 $ 26,974 2.05 % $ 5,225,679 $ 26,857 2.08 % $ 5,447,670 $ 33,280 2.45 % Cost of Funds 1.41 % 1.44 % 1.76 % Net Interest Income, Tax-Equivalent Basis* $ 82,598 $ 80,201 $ 74,425 Net Interest Margin 4.30 % 4.26 % 3.92 % ___________________________________________ * Represents a non-GAAP financial measure. Refer to “Use of Non-GAAP Financial Measures” contained in this release for additional information, including a reconciliation of non-GAAP financial measures to the most directly comparable GAAP financial measures. During the second quarter of 2026, net interest income, on a non tax-equivalent basis, totaled $81,208,000 an increase of $2,357,000, or 3%, compared to the first quarter of 2026 net interest income of $78,851,000 and an increase of $8,053,000, or 11%, compared to the second quarter of 2025 net interest income of $73,155,000. The improvement in net interest income during the second quarter of 2026 compared with both the first quarter of 2026 and the second quarter of 2025 was the result of an improved net interest margin and a higher level of average earning assets. The tax equivalent net interest margin for the quarter ended June 30, 2026 was 4.30% compared with 4.26% in the first quarter of 2026 and 3.92% in the second quarter of 2025. The continued improvement in the net interest margin during the second quarter of 2026 compared with both the first quarter of 2026 and second
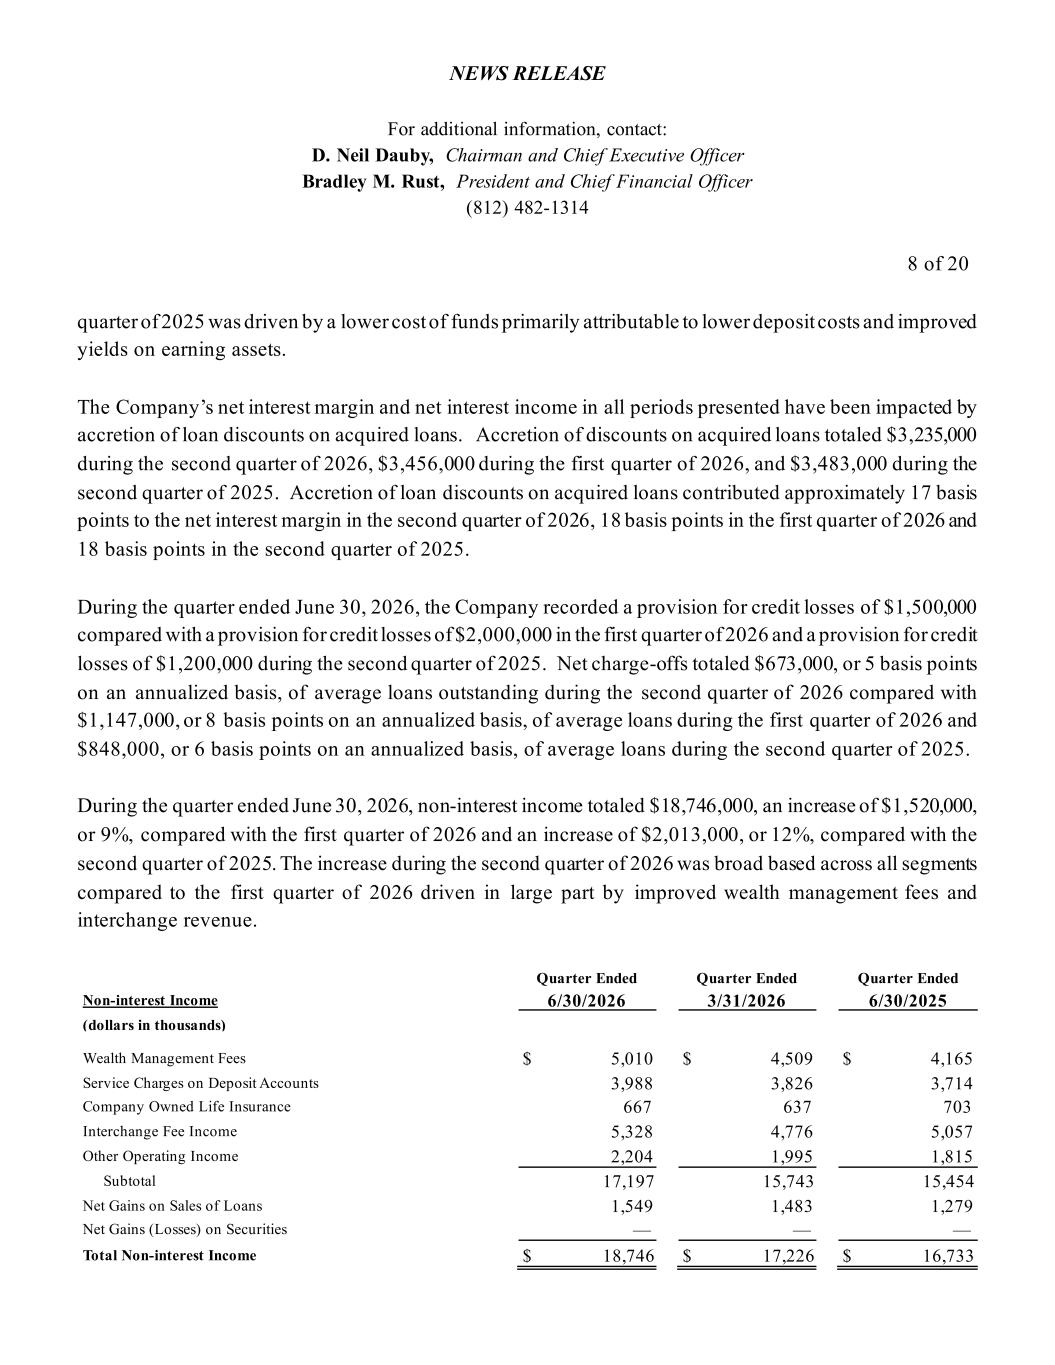
NEWS RELEASE For additional information, contact: D. Neil Dauby, Chairman and Chief Executive Officer Bradley M. Rust, President and Chief Financial Officer (812) 482-1314 8 of 20 quarter of 2025 was driven by a lower cost of funds primarily attributable to lower deposit costs and improved yields on earning assets. The Company’s net interest margin and net interest income in all periods presented have been impacted by accretion of loan discounts on acquired loans. Accretion of discounts on acquired loans totaled $3,235,000 during the second quarter of 2026, $3,456,000 during the first quarter of 2026, and $3,483,000 during the second quarter of 2025. Accretion of loan discounts on acquired loans contributed approximately 17 basis points to the net interest margin in the second quarter of 2026, 18 basis points in the first quarter of 2026 and 18 basis points in the second quarter of 2025. During the quarter ended June 30, 2026, the Company recorded a provision for credit losses of $1,500,000 compared with a provision for credit losses of $2,000,000 in the first quarter of 2026 and a provision for credit losses of $1,200,000 during the second quarter of 2025. Net charge-offs totaled $673,000, or 5 basis points on an annualized basis, of average loans outstanding during the second quarter of 2026 compared with $1,147,000, or 8 basis points on an annualized basis, of average loans during the first quarter of 2026 and $848,000, or 6 basis points on an annualized basis, of average loans during the second quarter of 2025. During the quarter ended June 30, 2026, non-interest income totaled $18,746,000, an increase of $1,520,000, or 9%, compared with the first quarter of 2026 and an increase of $2,013,000, or 12%, compared with the second quarter of 2025. The increase during the second quarter of 2026 was broad based across all segments compared to the first quarter of 2026 driven in large part by improved wealth management fees and interchange revenue. Quarter Ended Quarter Ended Quarter Ended Non-interest Income 6/30/2026 3/31/2026 6/30/2025 (dollars in thousands) Wealth Management Fees $ 5,010 $ 4,509 $ 4,165 Service Charges on Deposit Accounts 3,988 3,826 3,714 Company Owned Life Insurance 667 637 703 Interchange Fee Income 5,328 4,776 5,057 Other Operating Income 2,204 1,995 1,815 Subtotal 17,197 15,743 15,454 Net Gains on Sales of Loans 1,549 1,483 1,279 Net Gains (Losses) on Securities — — — Total Non-interest Income $ 18,746 $ 17,226 $ 16,733
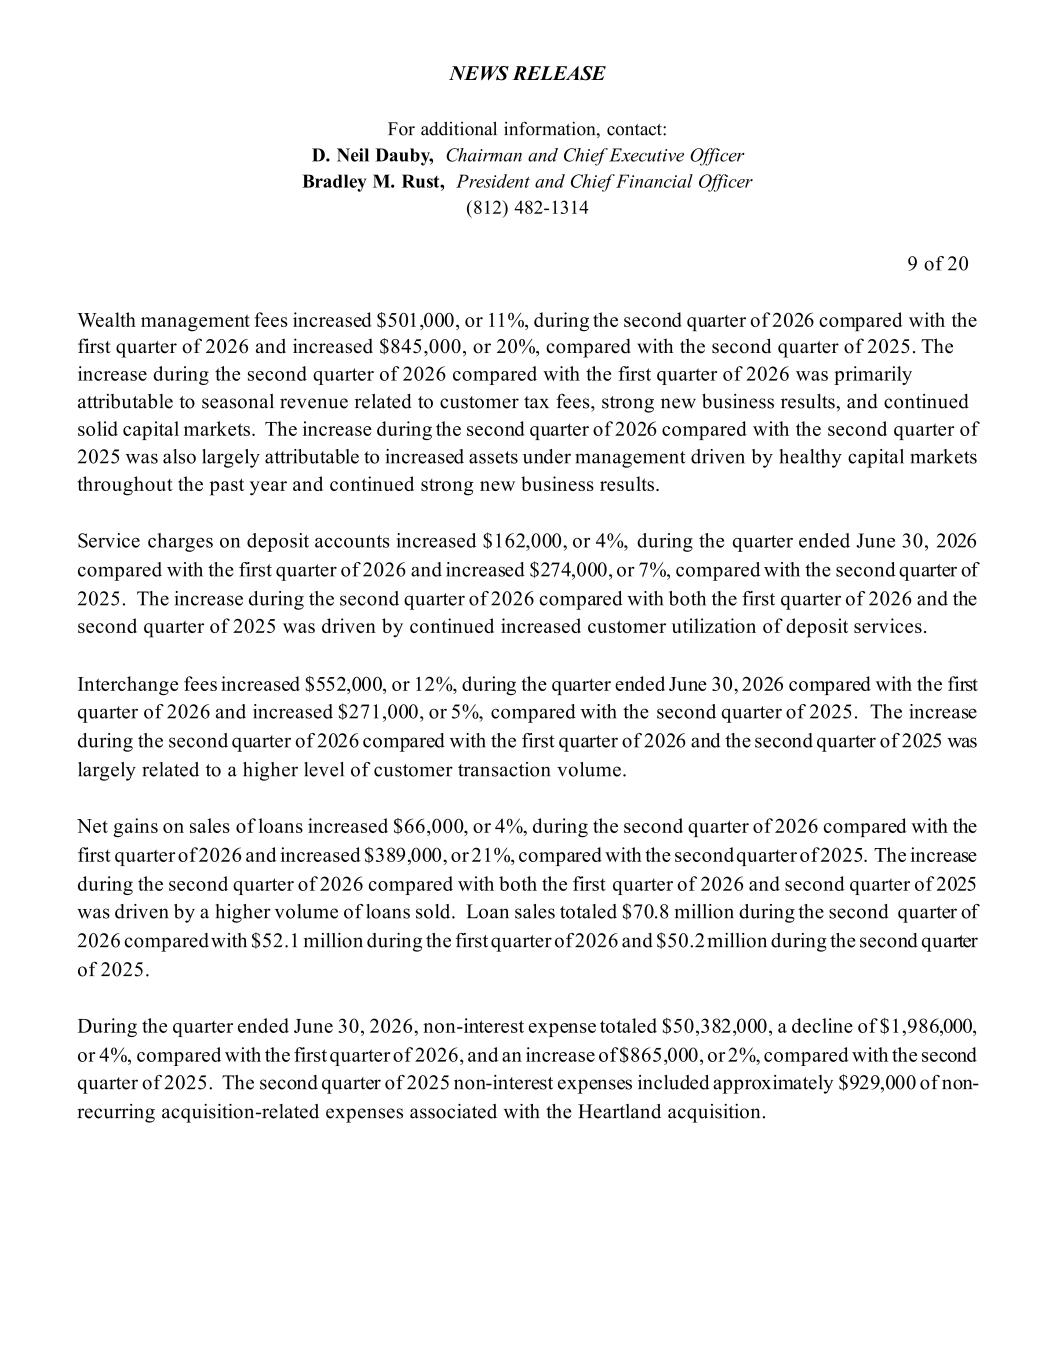
NEWS RELEASE For additional information, contact: D. Neil Dauby, Chairman and Chief Executive Officer Bradley M. Rust, President and Chief Financial Officer (812) 482-1314 9 of 20 Wealth management fees increased $501,000, or 11%, during the second quarter of 2026 compared with the first quarter of 2026 and increased $845,000, or 20%, compared with the second quarter of 2025. The increase during the second quarter of 2026 compared with the first quarter of 2026 was primarily attributable to seasonal revenue related to customer tax fees, strong new business results, and continued solid capital markets. The increase during the second quarter of 2026 compared with the second quarter of 2025 was also largely attributable to increased assets under management driven by healthy capital markets throughout the past year and continued strong new business results. Service charges on deposit accounts increased $162,000, or 4%, during the quarter ended June 30, 2026 compared with the first quarter of 2026 and increased $274,000, or 7%, compared with the second quarter of 2025. The increase during the second quarter of 2026 compared with both the first quarter of 2026 and the second quarter of 2025 was driven by continued increased customer utilization of deposit services. Interchange fees increased $552,000, or 12%, during the quarter ended June 30, 2026 compared with the first quarter of 2026 and increased $271,000, or 5%, compared with the second quarter of 2025. The increase during the second quarter of 2026 compared with the first quarter of 2026 and the second quarter of 2025 was largely related to a higher level of customer transaction volume. Net gains on sales of loans increased $66,000, or 4%, during the second quarter of 2026 compared with the first quarter of 2026 and increased $389,000, or 21%, compared with the second quarter of 2025. The increase during the second quarter of 2026 compared with both the first quarter of 2026 and second quarter of 2025 was driven by a higher volume of loans sold. Loan sales totaled $70.8 million during the second quarter of 2026 compared with $52.1 million during the first quarter of 2026 and $50.2 million during the second quarter of 2025. During the quarter ended June 30, 2026, non-interest expense totaled $50,382,000, a decline of $1,986,000, or 4%, compared with the first quarter of 2026, and an increase of $865,000, or 2%, compared with the second quarter of 2025. The second quarter of 2025 non-interest expenses included approximately $929,000 of non- recurring acquisition-related expenses associated with the Heartland acquisition.
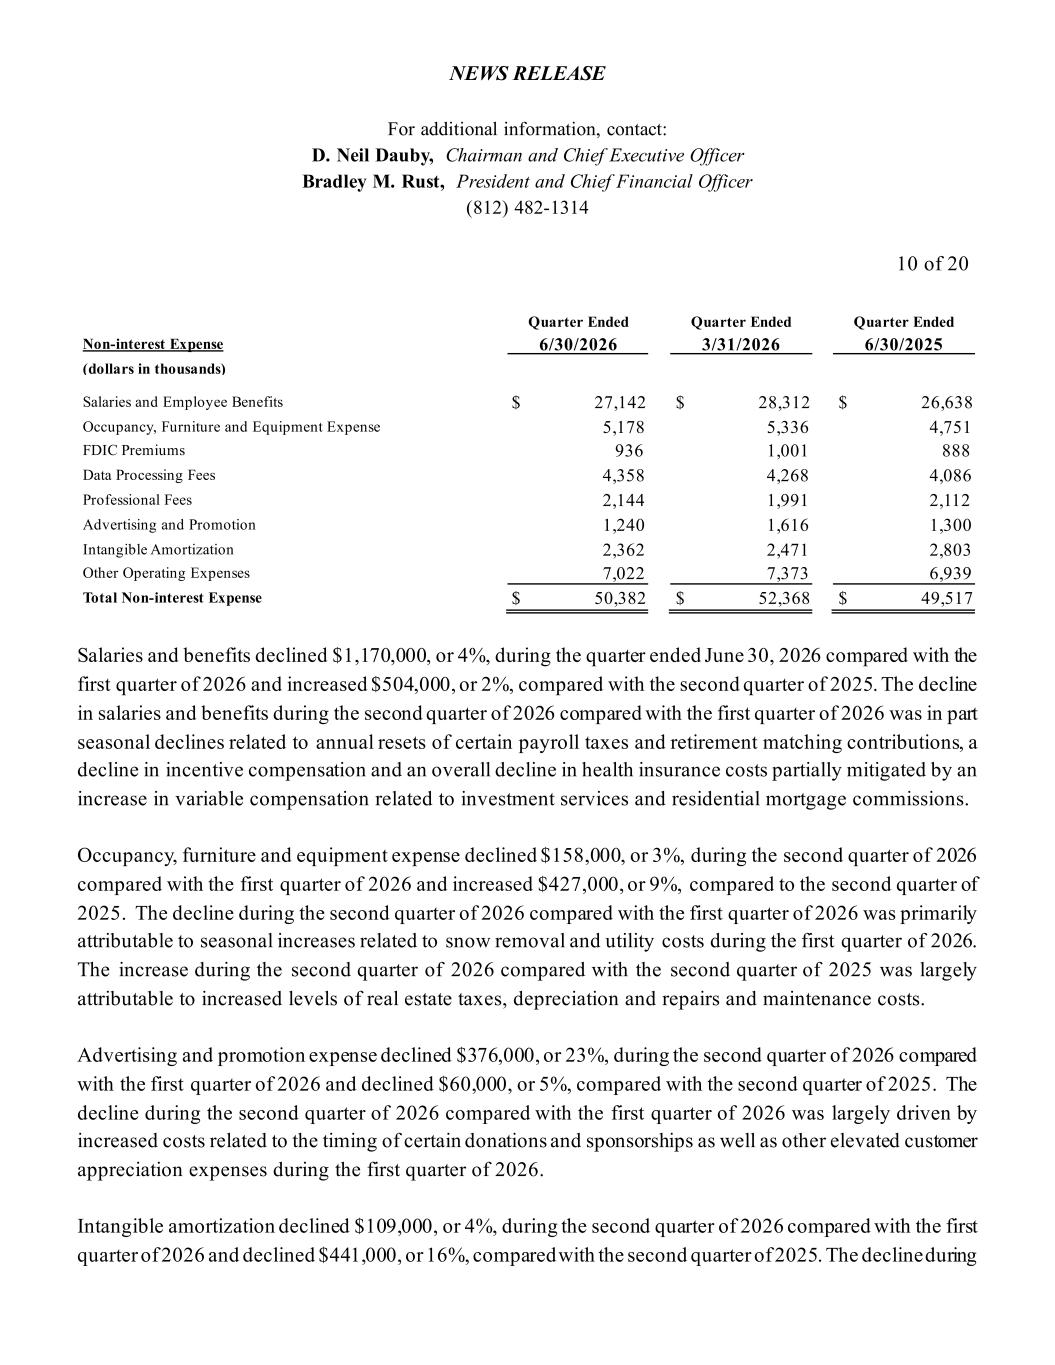
NEWS RELEASE For additional information, contact: D. Neil Dauby, Chairman and Chief Executive Officer Bradley M. Rust, President and Chief Financial Officer (812) 482-1314 10 of 20 Quarter Ended Quarter Ended Quarter Ended Non-interest Expense 6/30/2026 3/31/2026 6/30/2025 (dollars in thousands) Salaries and Employee Benefits $ 27,142 $ 28,312 $ 26,638 Occupancy, Furniture and Equipment Expense 5,178 5,336 4,751 FDIC Premiums 936 1,001 888 Data Processing Fees 4,358 4,268 4,086 Professional Fees 2,144 1,991 2,112 Advertising and Promotion 1,240 1,616 1,300 Intangible Amortization 2,362 2,471 2,803 Other Operating Expenses 7,022 7,373 6,939 Total Non-interest Expense $ 50,382 $ 52,368 $ 49,517 Salaries and benefits declined $1,170,000, or 4%, during the quarter ended June 30, 2026 compared with the first quarter of 2026 and increased $504,000, or 2%, compared with the second quarter of 2025. The decline in salaries and benefits during the second quarter of 2026 compared with the first quarter of 2026 was in part seasonal declines related to annual resets of certain payroll taxes and retirement matching contributions, a decline in incentive compensation and an overall decline in health insurance costs partially mitigated by an increase in variable compensation related to investment services and residential mortgage commissions. Occupancy, furniture and equipment expense declined $158,000, or 3%, during the second quarter of 2026 compared with the first quarter of 2026 and increased $427,000, or 9%, compared to the second quarter of 2025. The decline during the second quarter of 2026 compared with the first quarter of 2026 was primarily attributable to seasonal increases related to snow removal and utility costs during the first quarter of 2026. The increase during the second quarter of 2026 compared with the second quarter of 2025 was largely attributable to increased levels of real estate taxes, depreciation and repairs and maintenance costs. Advertising and promotion expense declined $376,000, or 23%, during the second quarter of 2026 compared with the first quarter of 2026 and declined $60,000, or 5%, compared with the second quarter of 2025. The decline during the second quarter of 2026 compared with the first quarter of 2026 was largely driven by increased costs related to the timing of certain donations and sponsorships as well as other elevated customer appreciation expenses during the first quarter of 2026. Intangible amortization declined $109,000, or 4%, during the second quarter of 2026 compared with the first quarter of 2026 and declined $441,000, or 16%, compared with the second quarter of 2025. The decline during
NEWS RELEASE For additional information, contact: D. Neil Dauby, Chairman and Chief Executive Officer Bradley M. Rust, President and Chief Financial Officer (812) 482-1314 11 of 20 the second quarter of 2026 compared to both the first quarter of 2026 and the second quarter of 2025 was primarily attributable to the accelerated amortization method for which intangibles are amortized. Other operating expenses declined $351,000, or 5%, during the second quarter of 2026 compared with the first quarter of 2026 and increased $83,000, or 1%, compared with the second quarter of 2025. The decline during the second quarter of 2026 compared with the first quarter of 2026 was largely the result of a decline in the reserves related to unfunded loan commitments. About German American German American Bancorp, Inc. (Nasdaq: GABC) is a financial holding company based in Jasper, Indiana. German American, through its banking subsidiary German American Bank, operates 93 banking offices located throughout Indiana (central/southern), Kentucky (northern/central/western), and Ohio (central/ southwest). In Columbus, Ohio and Greater Cincinnati, the Company does business as Heartland Bank, a Division of German American Bank. The Company also owns an investment brokerage subsidiary, German American Investment Services, Inc. Cautionary Note Regarding Forward-Looking Statements Certain statements in this press release may be deemed “forward-looking statements” within the meaning of the Private Securities Litigation Reform Act of 1995, Section 27A of the Securities Act of 1933, as amended, and Section 21E of the Securities Exchange Act of 1934, as amended. Readers are cautioned that, by their nature, forward-looking statements are based on assumptions and are subject to risks, uncertainties, and other factors. Forward-looking statements can often, but not always, be identified by the use of words like “believe”, “continue”, “pattern”, “estimate”, “project”, “intend”, “anticipate”, “expect” and similar expressions or future or conditional verbs such as “will”, “would”, “should”, “could”, “might”, “can”, “may”, or similar expressions. Actual results and experience could differ materially from the anticipated results or other expectations expressed or implied by these forward-looking statements as a result of a number of factors, including but not limited to, those discussed in this press release. Factors that could cause actual experience to differ from the expectations expressed or implied in this press release include: a. changes in interest rates and the timing and magnitude of any such changes; b. unfavorable economic conditions, including prolonged periods of inflation, and the resulting adverse impact on, among other things, credit quality;
NEWS RELEASE For additional information, contact: D. Neil Dauby, Chairman and Chief Executive Officer Bradley M. Rust, President and Chief Financial Officer (812) 482-1314 12 of 20 c. the soundness of other financial institutions and general investor sentiment regarding the stability of financial institutions; d. changes in our liquidity position; e. the impacts of epidemics, pandemics or other infectious disease outbreaks; f. changes in competitive conditions; g. the introduction, withdrawal, success and timing of asset/liability management strategies or of mergers and acquisitions and other business initiatives and strategies; h. changes in customer borrowing, repayment, investment and deposit practices; i. changes in fiscal, monetary and tax policies; j. changes in trade policies of, and other activities undertaken by, governments, including tariffs, which could have a material adverse effect on our customers and, as a result, our business; k. changes in financial and capital markets; l. capital management activities, including possible future sales of new securities, or possible repurchases or redemptions by German American of outstanding debt or equity securities; m. risks of expansion through acquisitions and mergers, including the possibility that the anticipated cost savings and strategic gains, are not realized when expected or at all as a result of unexpected credit quality problems of the acquired loans or other assets, unexpected attrition of the customer base or employee base of the acquired institution or branches, and difficulties in integration of the acquired operations; n. factors driving impairment charges on investments; o. the impact, extent and timing of technological changes; p. potential cyber-attacks, information security breaches and other criminal activities; q. litigation liabilities, including related costs, expenses, settlements and judgments, or the outcome of matters before regulatory agencies, whether pending or commencing in the future; r. actions of the Federal Reserve Board; s. the regulatory and financial impacts associated with exceeding $10 billion in total assets; t. changes in accounting principles and interpretations; u. potential increases of federal deposit insurance premium expense, and possible future special assessments of FDIC premiums, either industry wide or specific to German American’s banking subsidiary;
NEWS RELEASE For additional information, contact: D. Neil Dauby, Chairman and Chief Executive Officer Bradley M. Rust, President and Chief Financial Officer (812) 482-1314 13 of 20 v. actions of the regulatory authorities under the Dodd-Frank Wall Street Reform and Consumer Protection Act (the “Dodd-Frank Act”) and the Federal Deposit Insurance Act and other possible legislative and regulatory actions and reforms; w. impacts resulting from possible amendments or revisions to the Dodd-Frank Act and the regulations promulgated thereunder, or to Consumer Financial Protection Bureau rules and regulations; x. the continued availability of earnings and excess capital sufficient for the lawful and prudent declaration and payment of cash dividends; and y. other risk factors expressly identified in German American’s cautionary language included under the headings “Forward-Looking Statements and Associated Risk” and “Risk Factors” in German American’s Annual Report on Form 10-K for the year ended December 31, 2025, and other documents subsequently filed by German American with the SEC. Such statements reflect our views with respect to future events and are subject to these and other risks, uncertainties and assumptions relating to the operations, results of operations, growth strategy and liquidity of German American. Readers are cautioned not to place undue reliance on these forward-looking statements. It is intended that these forward- looking statements speak only as of the date they are made. We do not undertake any obligation to release publicly any revisions to these forward-looking statements to reflect future events or circumstances or to reflect the occurrence of unanticipated events.
GERMAN AMERICAN BANCORP, INC. (unaudited, dollars in thousands except per share data) Consolidated Balance Sheets June 30, 2026 March 31, 2026 June 30, 2025 ASSETS Cash and Due from Banks $ 79,646 $ 75,956 $ 99,871 Short-term Investments 15,012 48,471 100,777 Investment Securities 1,684,389 1,667,283 1,572,205 Loans Held-for-Sale 5,839 15,451 13,880 Loans, Net of Unearned Income 5,932,235 5,849,428 5,739,428 Allowance for Credit Losses (79,374) (78,547) (75,510) Net Loans 5,852,861 5,770,881 5,663,918 Stock in FHLB and Other Restricted Stock 17,415 17,509 17,966 Premises and Equipment 137,599 137,311 139,435 Goodwill and Other Intangible Assets 404,364 406,761 417,159 Other Assets 242,873 242,835 254,931 TOTAL ASSETS $ 8,439,998 $ 8,382,458 $ 8,280,142 LIABILITIES Non-interest-bearing Demand Deposits $ 1,967,770 $ 1,926,859 $ 1,896,737 Interest-bearing Demand, Savings, and Money Market Accounts 3,676,343 3,768,529 3,728,031 Time Deposits 1,351,650 1,285,520 1,329,918 Total Deposits 6,995,763 6,980,908 6,954,686 Borrowings 169,037 169,235 202,033 Other Liabilities 63,638 57,728 53,919 TOTAL LIABILITIES 7,228,438 7,207,871 7,210,638 SHAREHOLDERS’ EQUITY Common Stock and Surplus 745,632 744,813 743,230 Retained Earnings 631,097 604,515 533,834 Accumulated Other Comprehensive Income (Loss) (165,169) (174,741) (207,560) SHAREHOLDERS’ EQUITY 1,211,560 1,174,587 1,069,504 TOTAL LIABILITIES AND SHAREHOLDERS’ EQUITY $ 8,439,998 $ 8,382,458 $ 8,280,142 END OF PERIOD SHARES OUTSTANDING 37,576,750 37,565,278 37,492,814 TANGIBLE BOOK VALUE PER SHARE (1) $ 21.48 $ 20.44 $ 17.40 (1) Tangible Book Value per Share is defined as Total Shareholders’ Equity less Goodwill and Other Intangible Assets divided by End of Period Shares Outstanding.
GERMAN AMERICAN BANCORP, INC. (unaudited, dollars in thousands except per share data) Consolidated Statements of Income Three Months Ended Six Months Ended June 30, 2026 March 31, 2026 June 30, 2025 June 30, 2026 June 30, 2025 INTEREST INCOME Interest and Fees on Loans $ 93,513 $ 92,273 $ 90,002 $ 185,786 $ 171,507 Interest on Short-term Investments 1,186 312 3,932 1,498 6,148 Interest and Dividends on Investment Securities 13,483 13,123 12,501 26,606 24,996 TOTAL INTEREST INCOME 108,182 105,708 106,435 213,890 202,651 INTEREST EXPENSE Interest on Deposits 25,176 24,698 30,635 49,874 57,663 Interest on Borrowings 1,798 2,159 2,645 3,957 5,261 TOTAL INTEREST EXPENSE 26,974 26,857 33,280 53,831 62,924 NET INTEREST INCOME 81,208 78,851 73,155 160,059 139,727 Provision for Credit Losses 1,500 2,000 1,200 3,500 16,500 NET INTEREST INCOME AFTER PROVISION FOR CREDIT LOSSES 79,708 76,851 71,955 156,559 123,227 NON-INTEREST INCOME Net Gains on Sales of Loans 1,549 1,483 1,279 3,032 2,212 Net Gains (Losses) on Securities — — — — — Other Non-interest Income 17,197 15,743 15,454 32,940 29,361 TOTAL NON-INTEREST INCOME 18,746 17,226 16,733 35,972 31,573 NON-INTEREST EXPENSE Salaries and Benefits 27,142 28,312 26,638 55,454 54,678 Other Non-interest Expenses 23,240 24,056 22,879 47,296 47,621 TOTAL NON-INTEREST EXPENSE 50,382 52,368 49,517 102,750 102,299 Income before Income Taxes 48,072 41,709 39,171 89,781 52,501 Income Tax Expense 9,900 8,557 7,810 18,457 10,623 NET INCOME $ 38,172 $ 33,152 $ 31,361 $ 71,324 $ 41,878 BASIC EARNINGS PER SHARE $ 1.02 $ 0.88 $ 0.84 $ 1.90 $ 1.16 DILUTED EARNINGS PER SHARE $ 1.02 $ 0.88 $ 0.84 $ 1.90 $ 1.16 WEIGHTED AVERAGE SHARES OUTSTANDING 37,564,295 37,517,833 37,479,342 37,541,192 36,087,762 DILUTED WEIGHTED AVERAGE SHARES OUTSTANDING 37,564,295 37,517,833 37,479,342 37,541,192 36,087,762
GERMAN AMERICAN BANCORP, INC. (unaudited, dollars in thousands except per share data) Three Months Ended Six Months Ended June 30, 2026 March 31, 2026 June 30, 2025 June 30, 2026 June 30, 2025 EARNINGS PERFORMANCE RATIOS Annualized Return on Average Assets 1.80 % 1.58 % 1.49 % 1.69 % 1.04 % Annualized Return on Average Equity 12.82 % 11.20 % 11.97 % 12.01 % 8.46 % Annualized Return on Average Tangible Equity (1) 19.43 % 17.08 % 19.87 % 18.26 % 13.68 % Net Interest Margin 4.30 % 4.26 % 3.92 % 4.28 % 3.94 % Efficiency Ratio (2) 47.38 % 51.21 % 51.25 % 49.26 % 56.04 % Net Overhead Expense to Average Earning Assets (3) 1.64 % 1.85 % 1.72 % 1.75 % 1.95 % ASSET QUALITY RATIOS Annualized Net Charge-offs to Average Loans 0.05 % 0.08 % 0.06 % 0.06 % 0.05 % Allowance for Credit Losses to Period End Loans 1.34 % 1.34 % 1.32 % Non-performing Assets to Period End Assets 0.32 % 0.35 % 0.30 % Non-performing Loans to Period End Loans 0.45 % 0.51 % 0.44 % Loans 30-89 Days Past Due to Period End Loans 0.22 % 0.22 % 0.46 % SELECTED BALANCE SHEET & OTHER FINANCIAL DATA Average Assets $ 8,481,845 $ 8,380,732 $ 8,424,328 $ 8,431,568 $ 8,028,766 Average Earning Assets $ 7,697,610 $ 7,596,813 $ 7,605,113 $ 7,647,490 $ 7,265,693 Average Total Loans $ 5,879,528 $ 5,872,187 $ 5,678,929 $ 5,875,878 $ 5,408,894 Average Demand Deposits $ 1,946,872 $ 1,910,931 $ 1,873,459 $ 1,929,001 $ 1,772,153 Average Interest Bearing Liabilities $ 5,288,118 $ 5,225,679 $ 5,447,670 $ 5,257,071 $ 5,213,509 Average Equity $ 1,191,283 $ 1,184,292 $ 1,048,227 $ 1,187,807 $ 990,129 Period End Non-performing Assets (4) $ 26,846 $ 29,556 $ 25,136 Period End Non-performing Loans (5) $ 26,846 $ 29,556 $ 25,088 Period End Loans 30-89 Days Past Due (6) $ 12,898 $ 12,676 $ 26,294 Tax-Equivalent Net Interest Income $ 82,598 $ 80,201 $ 74,425 $ 162,798 $ 142,316 Net Charge-offs during Period $ 673 $ 1,147 $ 848 $ 1,820 $ 1,334 (1) Average Tangible Equity is defined as Average Equity less Average Goodwill and Other Intangibles. (2) Efficiency Ratio is defined as Non-interest Expense less Intangible Amortization divided by the sum of Net Interest Income, on a tax-equivalent basis, and Non- interest Income less Net Gains (Losses) on Securities. (3) Net Overhead Expense is defined as Total Non-interest Expense less Total Non-interest Income. (4) Non-performing assets are defined as Non-accrual Loans, Loans Past Due 90 days or more, and Other Real Estate Owned. (5) Non-performing loans are defined as Non-accrual Loans and Loans Past Due 90 days or more. (6) Loans 30-89 days past due and still accruing.
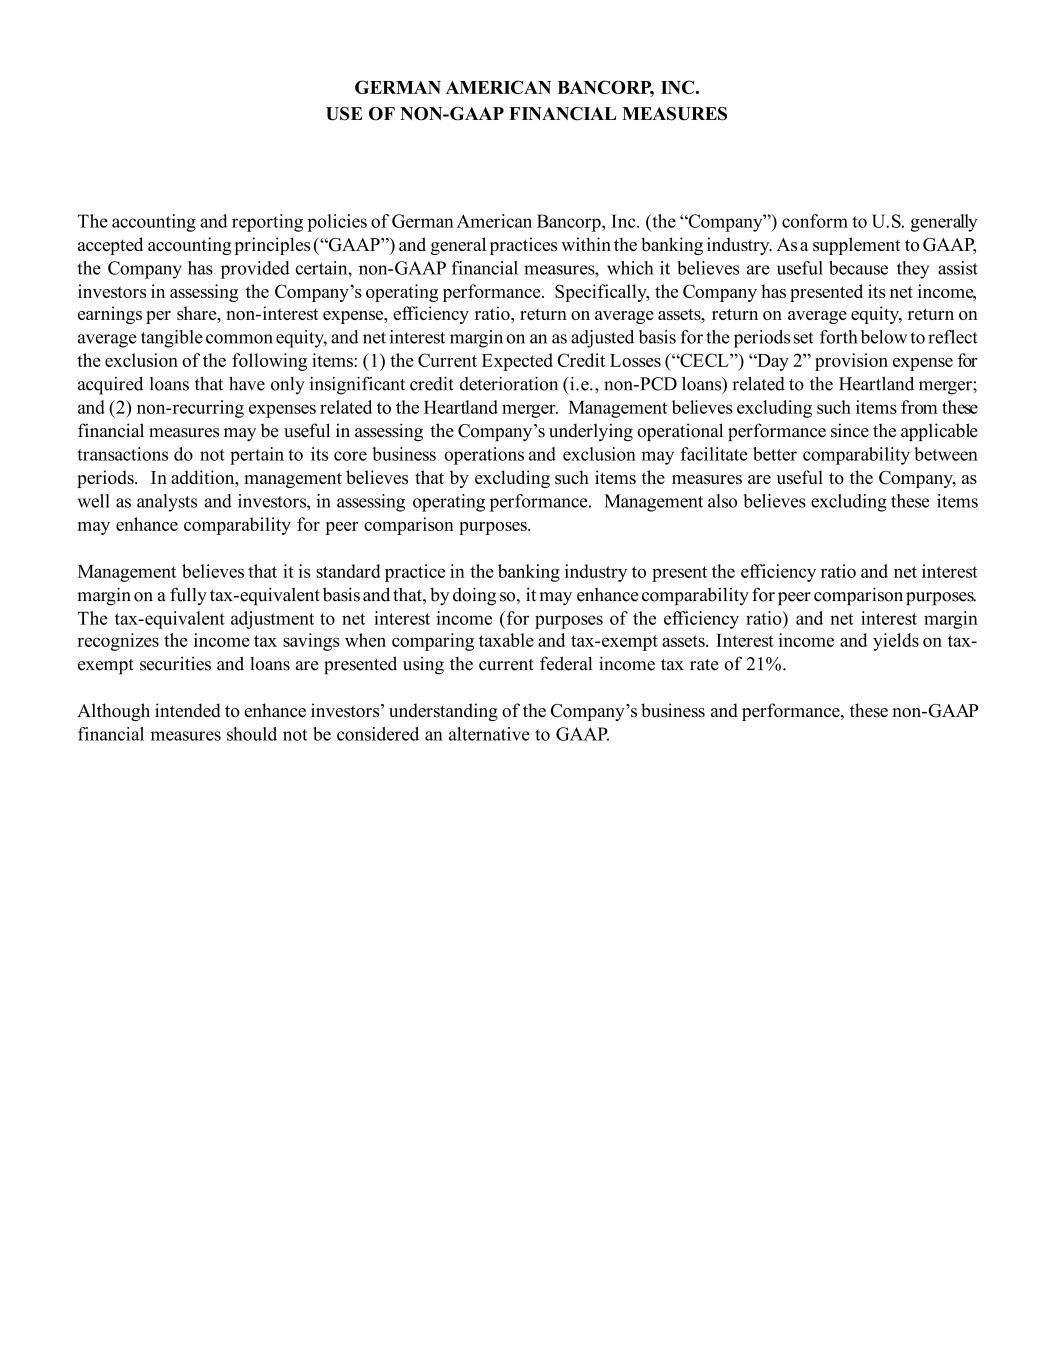
GERMAN AMERICAN BANCORP, INC. USE OF NON-GAAP FINANCIAL MEASURES The accounting and reporting policies of German American Bancorp, Inc. (the “Company”) conform to U.S. generally accepted accounting principles (“GAAP”) and general practices within the banking industry. As a supplement to GAAP, the Company has provided certain, non-GAAP financial measures, which it believes are useful because they assist investors in assessing the Company’s operating performance. Specifically, the Company has presented its net income, earnings per share, non-interest expense, efficiency ratio, return on average assets, return on average equity, return on average tangible common equity, and net interest margin on an as adjusted basis for the periods set forth below to reflect the exclusion of the following items: (1) the Current Expected Credit Losses (“CECL”) “Day 2” provision expense for acquired loans that have only insignificant credit deterioration (i.e., non-PCD loans) related to the Heartland merger; and (2) non-recurring expenses related to the Heartland merger. Management believes excluding such items from these financial measures may be useful in assessing the Company’s underlying operational performance since the applicable transactions do not pertain to its core business operations and exclusion may facilitate better comparability between periods. In addition, management believes that by excluding such items the measures are useful to the Company, as well as analysts and investors, in assessing operating performance. Management also believes excluding these items may enhance comparability for peer comparison purposes. Management believes that it is standard practice in the banking industry to present the efficiency ratio and net interest margin on a fully tax-equivalent basis and that, by doing so, it may enhance comparability for peer comparison purposes. The tax-equivalent adjustment to net interest income (for purposes of the efficiency ratio) and net interest margin recognizes the income tax savings when comparing taxable and tax-exempt assets. Interest income and yields on tax- exempt securities and loans are presented using the current federal income tax rate of 21%. Although intended to enhance investors’ understanding of the Company’s business and performance, these non-GAAP financial measures should not be considered an alternative to GAAP.
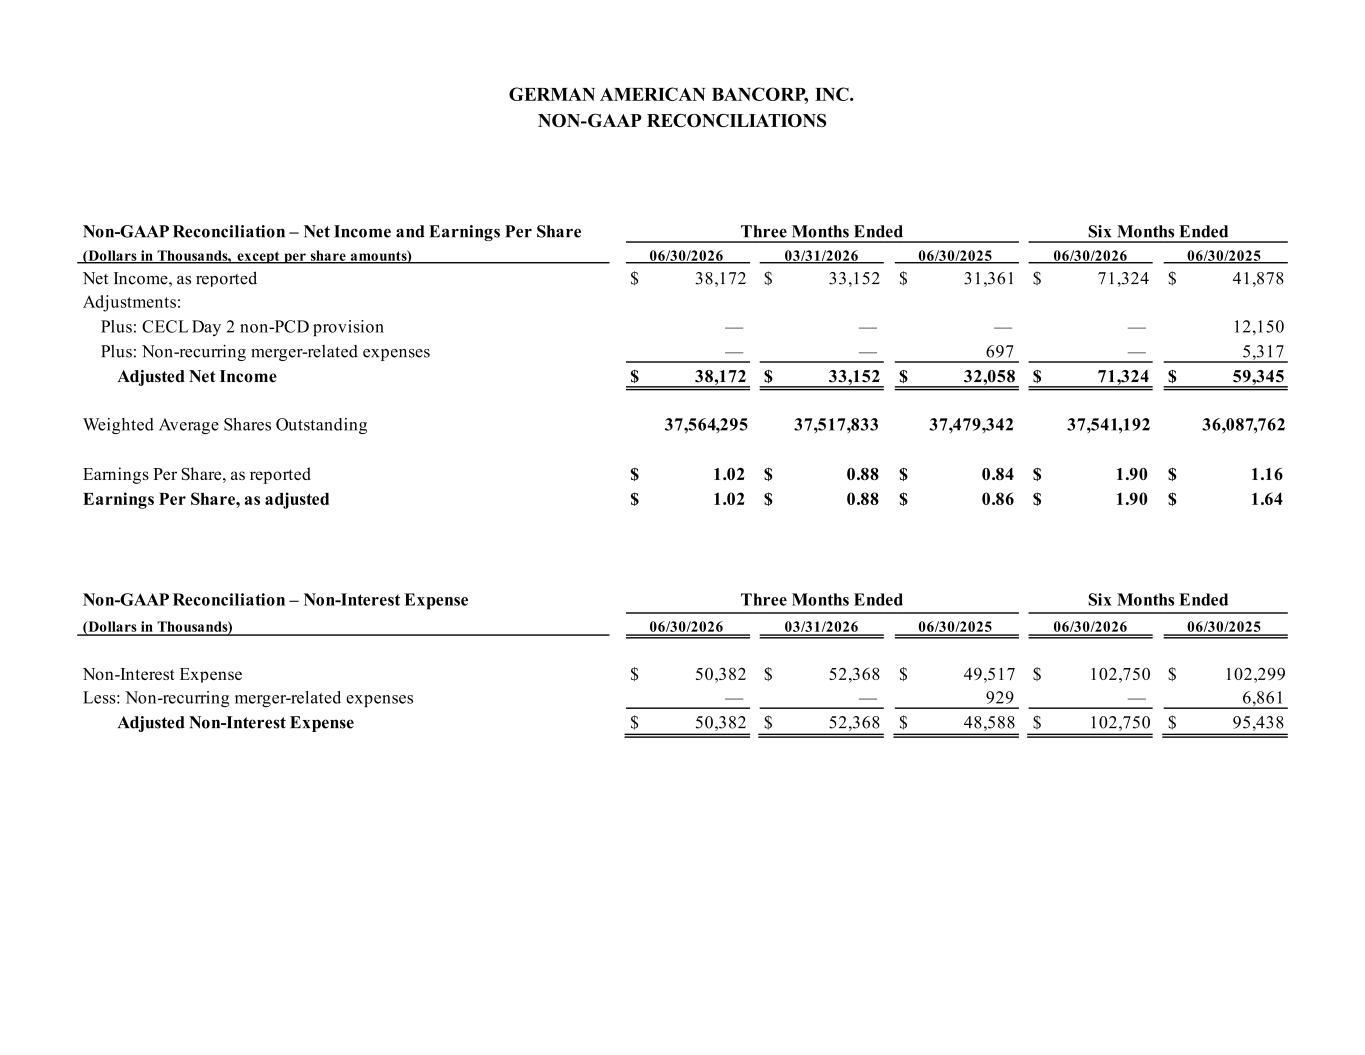
GERMAN AMERICAN BANCORP, INC. NON-GAAP RECONCILIATIONS Non-GAAP Reconciliation – Net Income and Earnings Per Share Three Months Ended Six Months Ended (Dollars in Thousands, except per share amounts) 06/30/2026 03/31/2026 06/30/2025 06/30/2026 06/30/2025 Net Income, as reported $ 38,172 $ 33,152 $ 31,361 $ 71,324 $ 41,878 Adjustments: Plus: CECL Day 2 non-PCD provision — — — — 12,150 Plus: Non-recurring merger-related expenses — — 697 — 5,317 Adjusted Net Income $ 38,172 $ 33,152 $ 32,058 $ 71,324 $ 59,345 Weighted Average Shares Outstanding 37,564,295 37,517,833 37,479,342 37,541,192 36,087,762 Earnings Per Share, as reported $ 1.02 $ 0.88 $ 0.84 $ 1.90 $ 1.16 Earnings Per Share, as adjusted $ 1.02 $ 0.88 $ 0.86 $ 1.90 $ 1.64 Non-GAAP Reconciliation – Non-Interest Expense Three Months Ended Six Months Ended (Dollars in Thousands) 06/30/2026 03/31/2026 06/30/2025 06/30/2026 06/30/2025 Non-Interest Expense $ 50,382 $ 52,368 $ 49,517 $ 102,750 $ 102,299 Less: Non-recurring merger-related expenses — — 929 — 6,861 Adjusted Non-Interest Expense $ 50,382 $ 52,368 $ 48,588 $ 102,750 $ 95,438
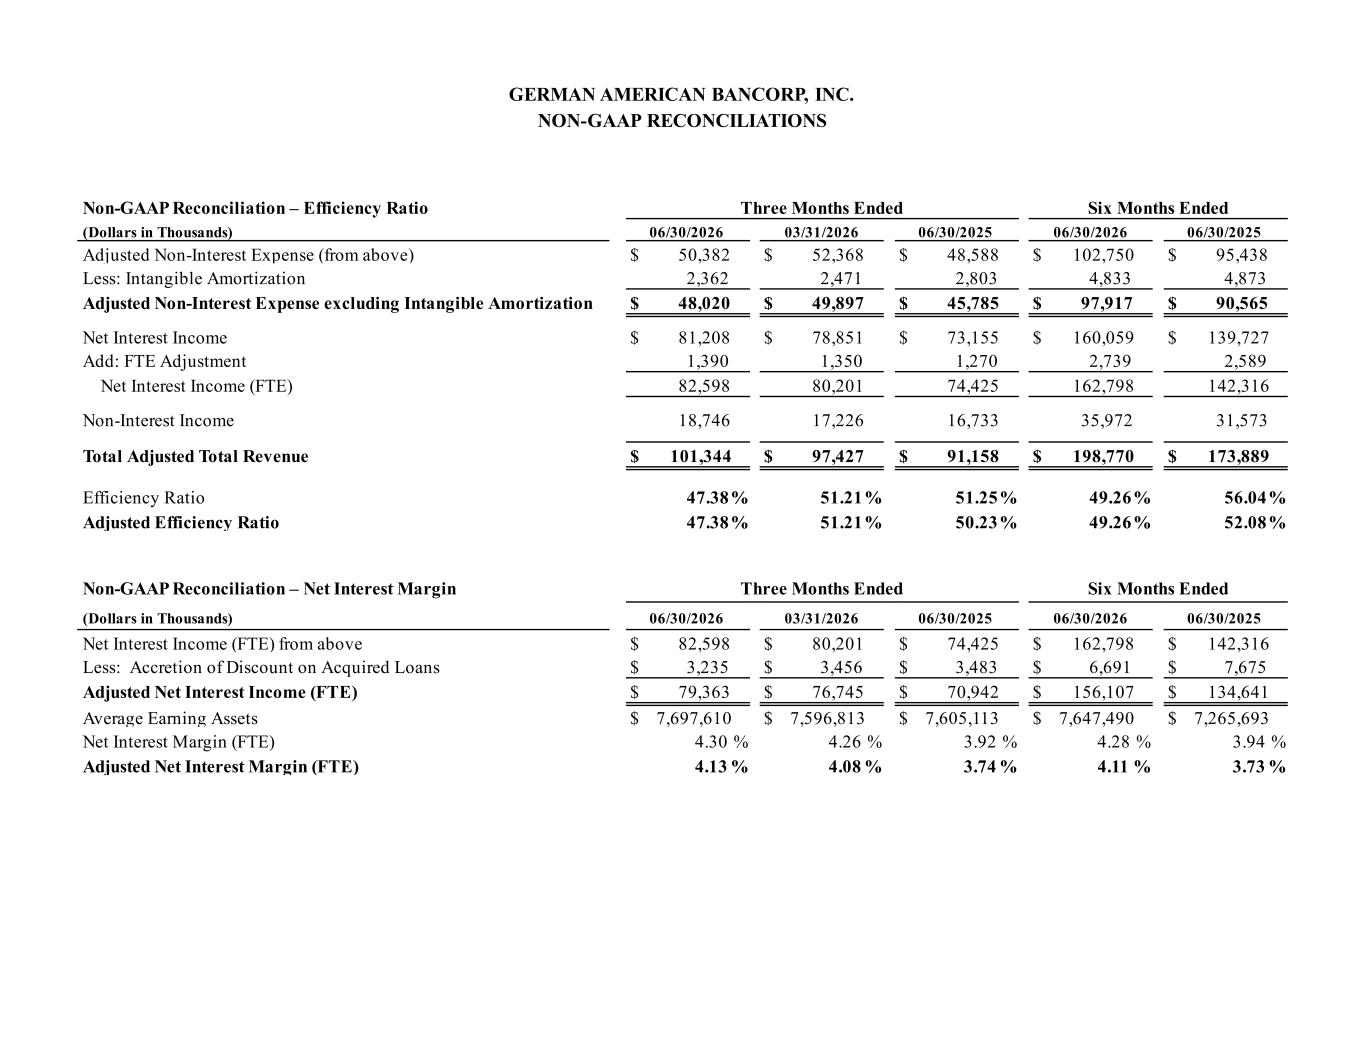
GERMAN AMERICAN BANCORP, INC. NON-GAAP RECONCILIATIONS Non-GAAP Reconciliation – Efficiency Ratio Three Months Ended Six Months Ended (Dollars in Thousands) 06/30/2026 03/31/2026 06/30/2025 06/30/2026 06/30/2025 Adjusted Non-Interest Expense (from above) $ 50,382 $ 52,368 $ 48,588 $ 102,750 $ 95,438 Less: Intangible Amortization 2,362 2,471 2,803 4,833 4,873 Adjusted Non-Interest Expense excluding Intangible Amortization $ 48,020 $ 49,897 $ 45,785 $ 97,917 $ 90,565 Net Interest Income $ 81,208 $ 78,851 $ 73,155 $ 160,059 $ 139,727 Add: FTE Adjustment 1,390 1,350 1,270 2,739 2,589 Net Interest Income (FTE) 82,598 80,201 74,425 162,798 142,316 Non-Interest Income 18,746 17,226 16,733 35,972 31,573 Total Adjusted Total Revenue $ 101,344 $ 97,427 $ 91,158 $ 198,770 $ 173,889 Efficiency Ratio 47.38 % 51.21 % 51.25 % 49.26 % 56.04 % Adjusted Efficiency Ratio 47.38 % 51.21 % 50.23 % 49.26 % 52.08 % Non-GAAP Reconciliation – Net Interest Margin Three Months Ended Six Months Ended (Dollars in Thousands) 06/30/2026 03/31/2026 06/30/2025 06/30/2026 06/30/2025 Net Interest Income (FTE) from above $ 82,598 $ 80,201 $ 74,425 $ 162,798 $ 142,316 Less: Accretion of Discount on Acquired Loans $ 3,235 $ 3,456 $ 3,483 $ 6,691 $ 7,675 Adjusted Net Interest Income (FTE) $ 79,363 $ 76,745 $ 70,942 $ 156,107 $ 134,641 Average Earning Assets $ 7,697,610 $ 7,596,813 $ 7,605,113 $ 7,647,490 $ 7,265,693 Net Interest Margin (FTE) 4.30 % 4.26 % 3.92 % 4.28 % 3.94 % Adjusted Net Interest Margin (FTE) 4.13 % 4.08 % 3.74 % 4.11 % 3.73 %
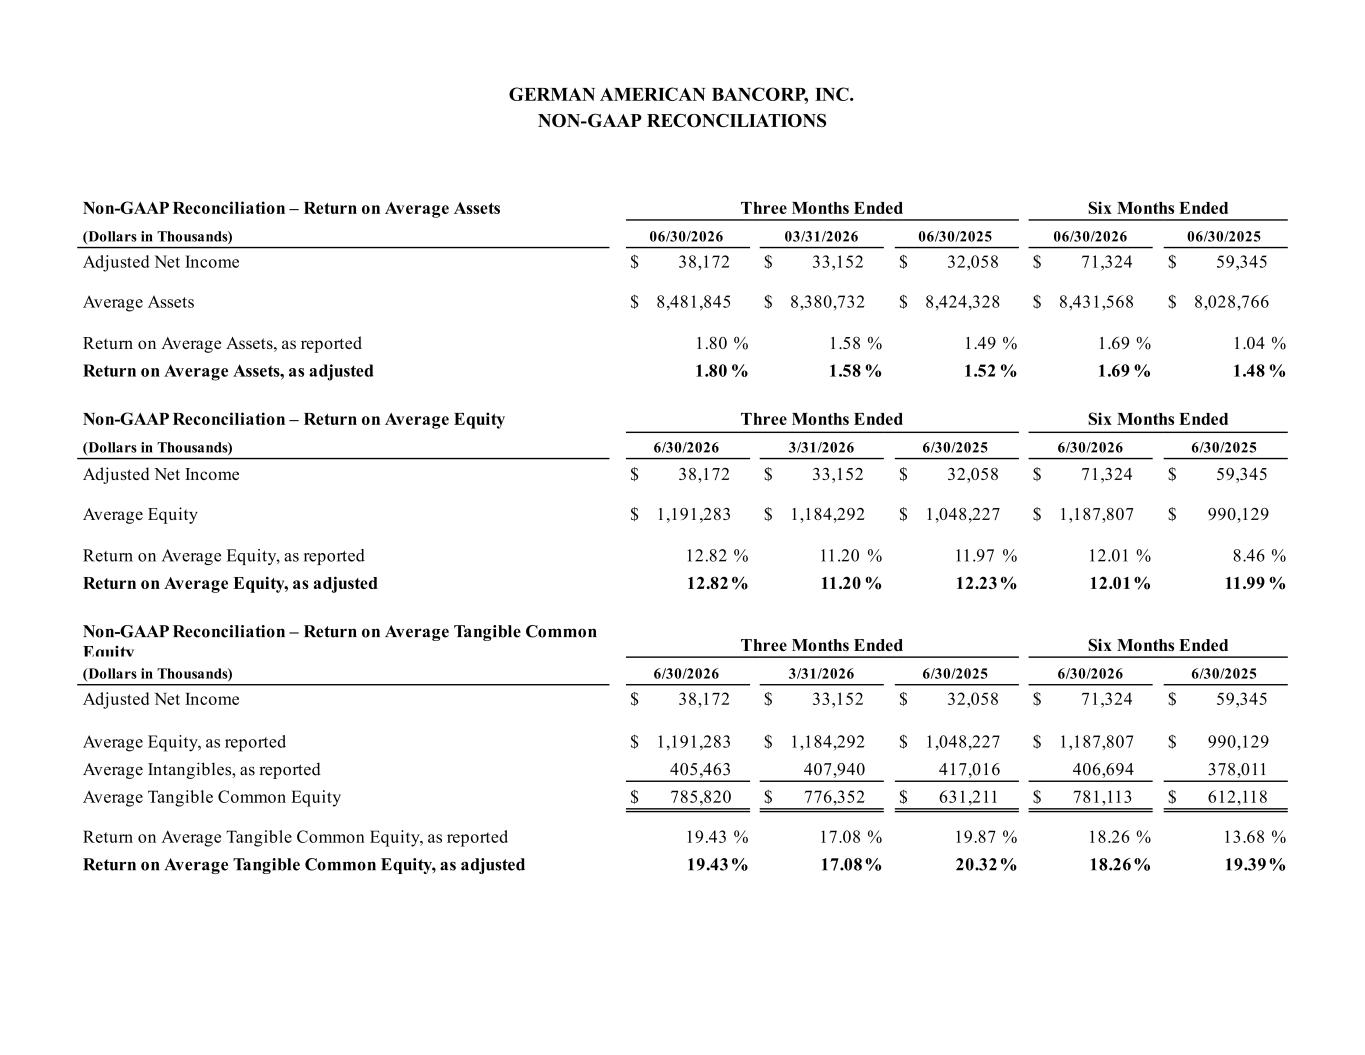
GERMAN AMERICAN BANCORP, INC. NON-GAAP RECONCILIATIONS Non-GAAP Reconciliation – Return on Average Assets Three Months Ended Six Months Ended (Dollars in Thousands) 06/30/2026 03/31/2026 06/30/2025 06/30/2026 06/30/2025 Adjusted Net Income $ 38,172 $ 33,152 $ 32,058 $ 71,324 $ 59,345 Average Assets $ 8,481,845 $ 8,380,732 $ 8,424,328 $ 8,431,568 $ 8,028,766 Return on Average Assets, as reported 1.80 % 1.58 % 1.49 % 1.69 % 1.04 % Return on Average Assets, as adjusted 1.80 % 1.58 % 1.52 % 1.69 % 1.48 % Non-GAAP Reconciliation – Return on Average Equity Three Months Ended Six Months Ended (Dollars in Thousands) 6/30/2026 3/31/2026 6/30/2025 6/30/2026 6/30/2025 Adjusted Net Income $ 38,172 $ 33,152 $ 32,058 $ 71,324 $ 59,345 Average Equity $ 1,191,283 $ 1,184,292 $ 1,048,227 $ 1,187,807 $ 990,129 Return on Average Equity, as reported 12.82 % 11.20 % 11.97 % 12.01 % 8.46 % Return on Average Equity, as adjusted 12.82 % 11.20 % 12.23 % 12.01 % 11.99 % Non-GAAP Reconciliation – Return on Average Tangible Common Equity Three Months Ended Six Months Ended (Dollars in Thousands) 6/30/2026 3/31/2026 6/30/2025 6/30/2026 6/30/2025 Adjusted Net Income $ 38,172 $ 33,152 $ 32,058 $ 71,324 $ 59,345 Average Equity, as reported $ 1,191,283 $ 1,184,292 $ 1,048,227 $ 1,187,807 $ 990,129 Average Intangibles, as reported 405,463 407,940 417,016 406,694 378,011 Average Tangible Common Equity $ 785,820 $ 776,352 $ 631,211 $ 781,113 $ 612,118 Return on Average Tangible Common Equity, as reported 19.43 % 17.08 % 19.87 % 18.26 % 13.68 % Return on Average Tangible Common Equity, as adjusted 19.43 % 17.08 % 20.32 % 18.26 % 19.39 %
 エドガーで原本を確認する