Delaware |
1-09720 |
16-1434688 |
||||||
(State or other jurisdiction of incorporation) |
(Commission File Number) |
(IRS Employer Identification No.) |
||||||
☐ |
Written communications pursuant to Rule 425 under the Securities Act (17 CFR 230.425) |
||||
☐ |
Soliciting material pursuant to Rule 14a-12 under the Exchange Act (17 CFR 240.14a-12) |
||||
☐ |
Pre-commencement communications pursuant to Rule 14d-2(b) under the Exchange Act (17 CFR 240.14d-2(b)) |
||||
☐ |
Pre-commencement communications pursuant to Rule 13e-4(c) under the Exchange Act (17 CFR 240.13e-4(c)) |
||||
| Title of each class | Trading Symbol | Name of each exchange on which registered | ||||||
| Common Stock | PAR | New York Stock Exchange | ||||||
| Exhibit No. | Exhibit Description | |||||||
| 99.1 | ||||||||
| 99.2 | ||||||||
| 104 | Cover Page Interactive Data File (embedded within the Inline XBRL document) | |||||||
PAR TECHNOLOGY CORPORATION |
||||||||
(Registrant) |
||||||||
| Date: | February 28, 2025 | /s/ Bryan A. Menar |
||||||
Bryan A. Menar |
||||||||
Chief Financial Officer |
||||||||
(Principal Financial Officer) |
||||||||

|
FOR RELEASE:
CONTACT:
|
New Hartford, NY, February 28, 2025
Christopher R. Byrnes (315) 743-8376
chris_byrnes@partech.com, www.partech.com
|
||||
Q4 2024 Financial Highlights(2) |
|||||||||||||||||||||||
| (in millions, except % and per share amounts) | GAAP | Non-GAAP(1) |
|||||||||||||||||||||
| Q4 2024 | Q4 2023 | vs. Q4 2023 | Q4 2024 | Q4 2023 | vs. Q4 2023 | ||||||||||||||||||
| Revenue | $105.0 | $69.9 | better 50.2% |
||||||||||||||||||||
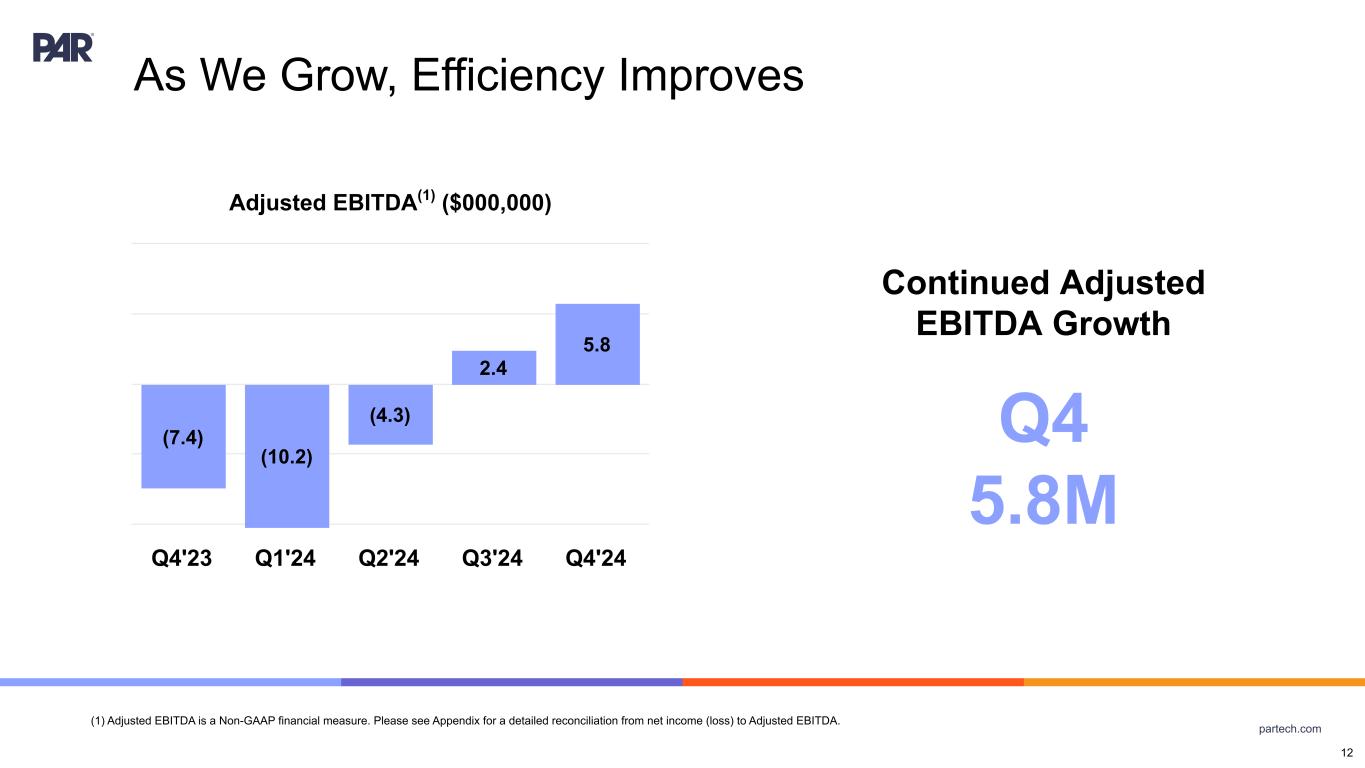
| Net Loss from Continuing Operations/Adjusted EBITDA | $(25.3) | $(21.5) | worse $3.8 million |
$5.8 | $(7.4) | better $13.1 million |
|||||||||||||||||
| Diluted Net Loss Per Share from Continuing Operations | $(0.68) | $(0.77) | better $0.09 |
$(0.00) | $(0.43) | better $0.43 |
|||||||||||||||||
| Subscription Service Gross Margin Percentage | 53.2% | 48.1% | better 5.1% |
64.7% | 65.3% | worse 0.6% |
|||||||||||||||||
Full Year 2024 Financial Highlights(2) |
|||||||||||||||||||||||
| (in millions, except % and per share amounts) | GAAP | Non-GAAP(1) |
|||||||||||||||||||||
| 2024 | 2023 | vs. 2023 | 2024 | 2023 | vs. 2023 | ||||||||||||||||||
| Revenue | $350.0 | $276.7 | better 26.5% |
||||||||||||||||||||
| Net Loss from Continuing Operations/Adjusted EBITDA | $(89.9) | $(81.6) | worse $8.3 million |
$(6.4) | $(38.4) | better $32.0 million |
|||||||||||||||||
| Diluted Net Loss Per Share from Continuing Operations | $(2.63) | $(2.96) | better $0.33 |
$(0.73) | $(1.96) | better $1.23 |
|||||||||||||||||
| Subscription Service Gross Margin Percentage | 53.5% | 48.0% | better 5.5% |
65.9% | 66.4% | worse 0.5% |
|||||||||||||||||
| Assets | December 31, 2024 | December 31, 2023 | |||||||||
| Current assets: | |||||||||||
| Cash and cash equivalents | $ | 108,117 | $ | 37,183 | |||||||
| Cash held on behalf of customers | 13,428 | 10,170 | |||||||||
| Short-term investments | 524 | 37,194 | |||||||||
| Accounts receivable – net | 59,726 | 42,679 | |||||||||
| Inventories | 21,861 | 23,560 | |||||||||
| Other current assets | 14,390 | 8,123 | |||||||||
| Current assets of discontinued operations | — | 21,690 | |||||||||
| Total current assets | 218,046 | 180,599 | |||||||||
| Property, plant and equipment – net | 14,107 | 15,524 | |||||||||
| Goodwill | 887,459 | 488,918 | |||||||||
| Intangible assets – net | 237,333 | 93,969 | |||||||||
| Lease right-of-use assets | 8,221 | 3,169 | |||||||||
| Other assets | 15,561 | 17,642 | |||||||||
| Noncurrent assets of discontinued operations | — | 2,785 | |||||||||
| Total Assets | $ | 1,380,727 | $ | 802,606 | |||||||
| Liabilities and Shareholders’ Equity | |||||||||||
| Current liabilities: | |||||||||||
| Accounts payable | $ | 34,784 | $ | 25,599 | |||||||
| Accrued salaries and benefits | 22,487 | 14,128 | |||||||||
| Accrued expenses | 13,938 | 3,533 | |||||||||
| Customers payable | 13,428 | 10,170 | |||||||||
| Lease liabilities – current portion | 2,256 | 1,120 | |||||||||
| Customer deposits and deferred service revenue | 24,944 | 9,304 | |||||||||
| Current liabilities of discontinued operations | — | 16,378 | |||||||||
| Total current liabilities | 111,837 | 80,232 | |||||||||
| Lease liabilities – net of current portion | 6,053 | 2,145 | |||||||||
| Long-term debt | 368,355 | 377,647 | |||||||||
| Deferred service revenue – noncurrent | 1,529 | 4,204 | |||||||||
| Other long-term liabilities | 21,243 | 3,603 | |||||||||
| Noncurrent liabilities of discontinued operations | — | 1,710 | |||||||||
| Total liabilities | 509,017 | 469,541 | |||||||||
| Shareholders’ equity: | |||||||||||
Preferred stock, $.02 par value, 1,000,000 shares authorized, none outstanding |
— | — | |||||||||
| Common stock, $.02 par value, 116,000,000 shares authorized; 40,187,671 and 29,386,234 shares issued, 38,717,366 and 28,029,915 outstanding at December 31, 2024 and December 31, 2023, respectively | 798 | 584 | |||||||||
| Additional paid in capital | 1,085,473 | 625,154 | |||||||||
| Equity consideration payable | 108,182 | — | |||||||||
| Accumulated deficit | (279,943) | (274,956) | |||||||||
| Accumulated other comprehensive loss | (20,951) | (939) | |||||||||
Treasury stock, at cost, 1,470,305 and 1,356,319 shares at December 31, 2024 and December 31, 2023, respectively |
(21,849) | (16,778) | |||||||||
| Total shareholders’ equity | 871,710 | 333,065 | |||||||||
| Total Liabilities and Shareholders’ Equity | $ | 1,380,727 | $ | 802,606 | |||||||
| Three Months Ended December 31, | Year Ended December 31, |
||||||||||||||||||||||
| 2024 | 2023 | 2024 | 2023 | ||||||||||||||||||||
| Revenues, net: | |||||||||||||||||||||||
| Subscription service | $ | 64,262 | $ | 32,897 | $ | 207,422 | $ | 122,597 | |||||||||||||||
| Hardware | 26,048 | 24,400 | 87,040 | 103,391 | |||||||||||||||||||
| Professional service | 14,695 | 12,603 | 55,520 | 50,726 | |||||||||||||||||||
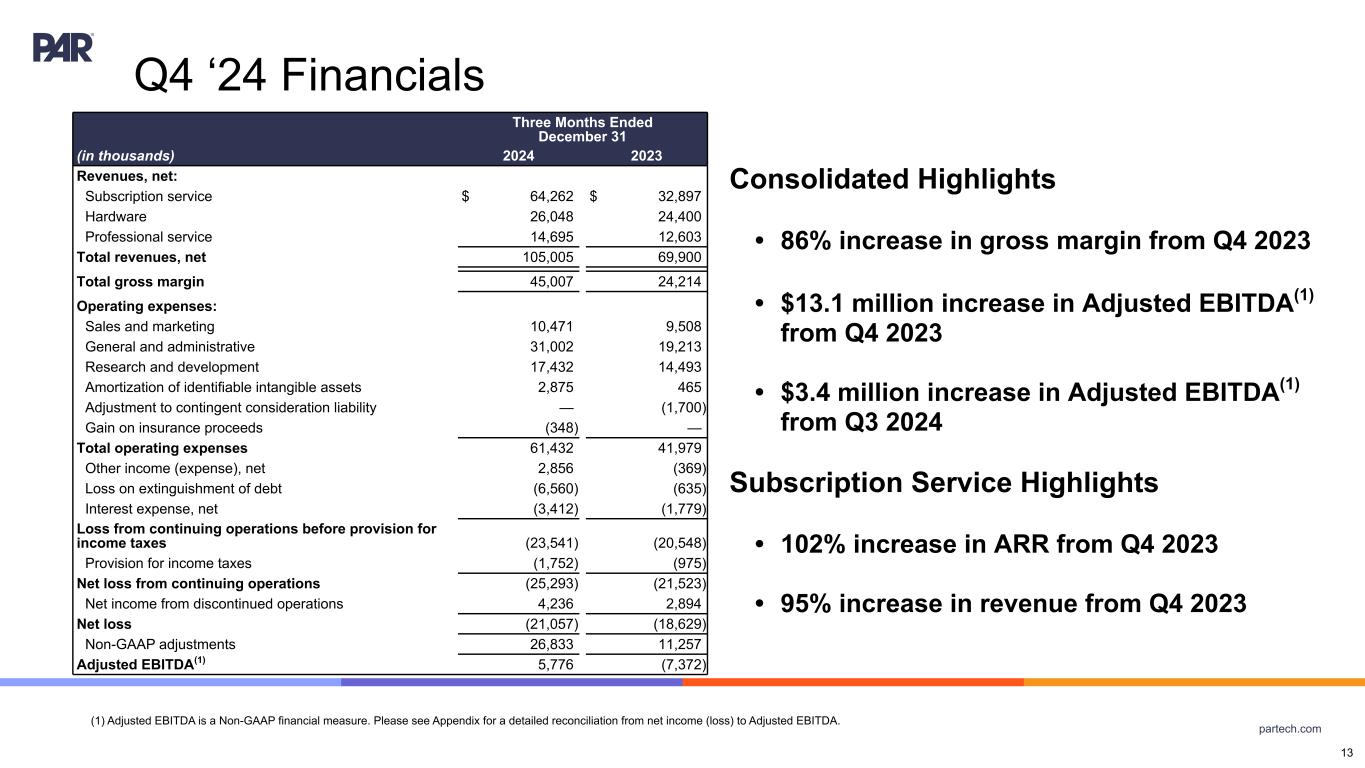
| Total revenues, net | 105,005 | 69,900 | 349,982 | 276,714 | |||||||||||||||||||
| Cost of sales: | |||||||||||||||||||||||
| Subscription service | 30,095 | 17,080 | 96,519 | 63,735 | |||||||||||||||||||
| Hardware | 19,336 | 17,317 | 65,923 | 80,319 | |||||||||||||||||||
| Professional service | 10,567 | 11,289 | 41,416 | 43,214 | |||||||||||||||||||
| Total cost of sales | 59,998 | 45,686 | 203,858 | 187,268 | |||||||||||||||||||
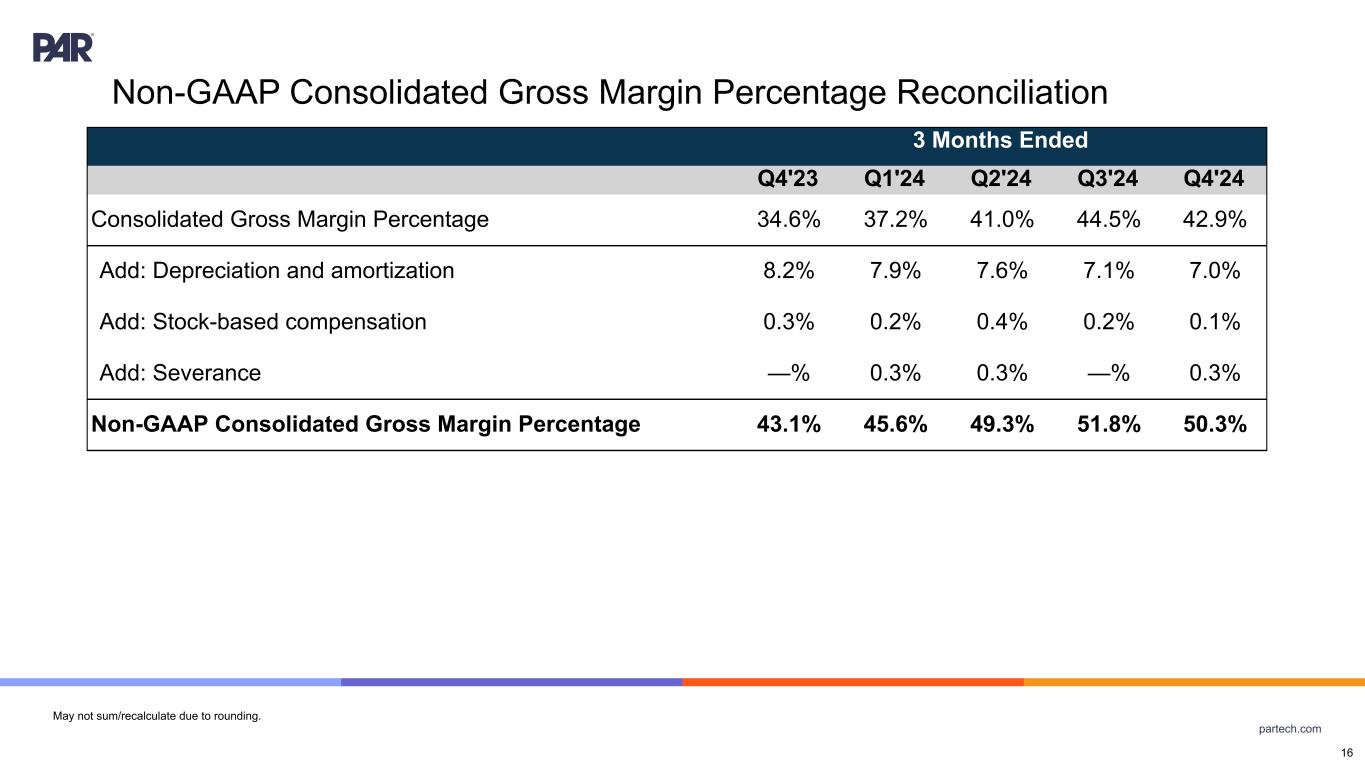
| Gross margin | 45,007 | 24,214 | 146,124 | 89,446 | |||||||||||||||||||
| Operating expenses: | |||||||||||||||||||||||
| Sales and marketing | 10,471 | 9,508 | 41,708 | 38,513 | |||||||||||||||||||
| General and administrative | 31,002 | 19,213 | 108,898 | 72,139 | |||||||||||||||||||
| Research and development | 17,432 | 14,493 | 67,258 | 58,356 | |||||||||||||||||||
| Amortization of identifiable intangible assets | 2,875 | 465 | 8,452 | 1,858 | |||||||||||||||||||
| Adjustment to contingent consideration liability | — | (1,700) | (600) | (9,200) | |||||||||||||||||||
| Gain on insurance proceeds | (348) | — | (495) | (500) | |||||||||||||||||||
| Total operating expenses | 61,432 | 41,979 | 225,221 | 161,166 | |||||||||||||||||||
| Operating loss | (16,425) | (17,765) | (79,097) | (71,720) | |||||||||||||||||||
| Other income (expense), net | 2,856 | (369) | 1,146 | (485) | |||||||||||||||||||
| Loss on extinguishment of debt | (6,560) | (635) | (6,560) | (635) | |||||||||||||||||||
| Interest expense, net | (3,412) | (1,779) | (10,167) | (6,931) | |||||||||||||||||||
| Loss from continuing operations before income taxes | (23,541) | (20,548) | (94,678) | (79,771) | |||||||||||||||||||
| Benefit from (provision for) income taxes | (1,752) | (975) | 4,768 | (1,848) | |||||||||||||||||||
| Net loss from continuing operations | (25,293) | (21,523) | (89,910) | (81,619) | |||||||||||||||||||
| Net income from discontinued operations | 4,236 | 2,894 | 84,923 | 11,867 | |||||||||||||||||||
| Net loss | $ | (21,057) | $ | (18,629) | $ | (4,987) | $ | (69,752) | |||||||||||||||
| Net income (loss) per share (basic and diluted): | |||||||||||||||||||||||
| Continuing operations | $ | (0.68) | $ | (0.77) | $ | (2.63) | $ | (2.96) | |||||||||||||||
| Discontinued operations | 0.11 | 0.10 | 2.49 | 0.43 | |||||||||||||||||||
| Total | $ | (0.57) | $ | (0.67) | $ | (0.14) | $ | (2.53) | |||||||||||||||
| Weighted average shares outstanding (basic and diluted) | 37,197 | 27,968 | 34,155 | 27,552 | |||||||||||||||||||
| Non-GAAP Measure or Adjustment | Definition | Usefulness to management and investors | ||||||
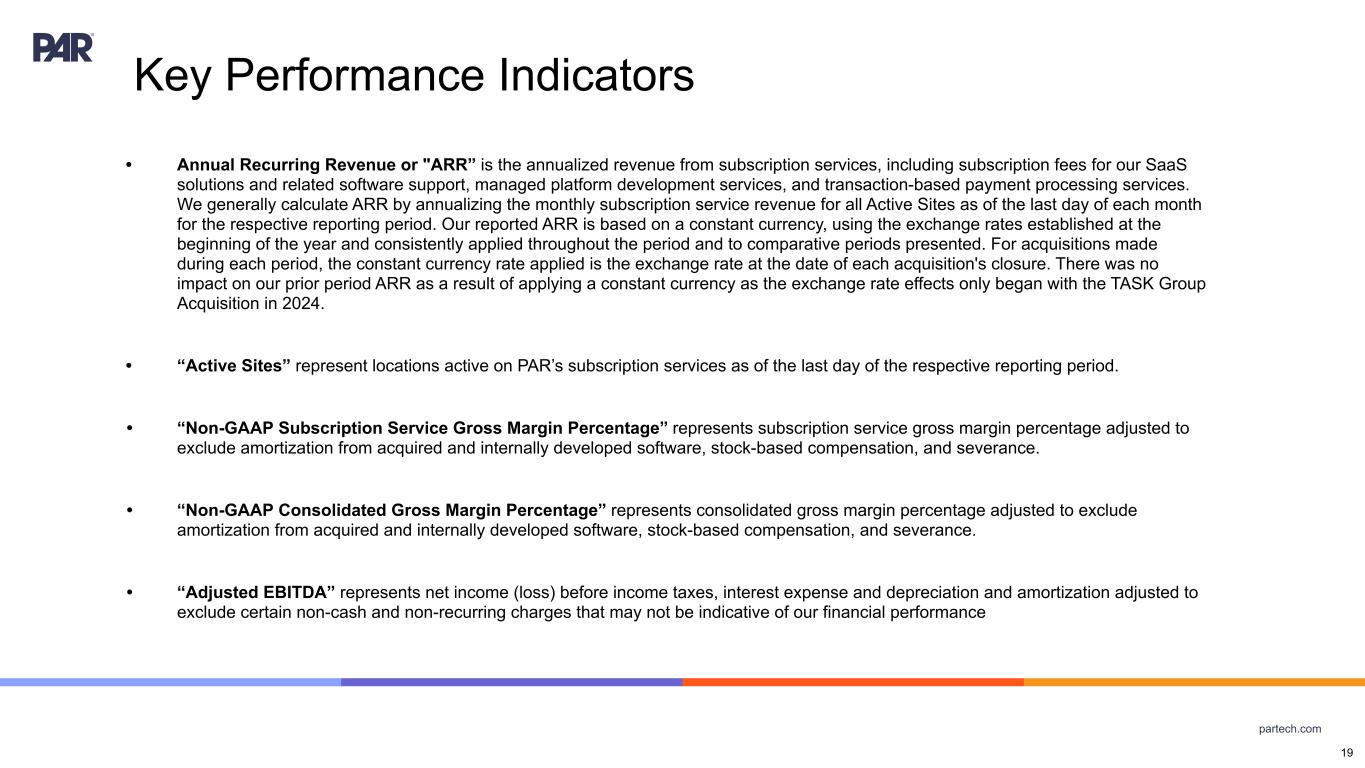
| Non-GAAP subscription service gross margin percentage | Represents subscription service gross margin percentage adjusted to exclude amortization from acquired and internally developed software, stock-based compensation, and severance. |
We believe that non-GAAP subscription service gross margin percentage and adjusted EBITDA provide useful perspectives with respect to the Company's core operating performance and ongoing cash earnings by adjusting for certain non-cash and non-recurring charges that may not be indicative of our financial performance. | ||||||
| Adjusted EBITDA | Represents net loss before income taxes, interest expense and depreciation and amortization adjusted to exclude certain non-cash and non-recurring charges that may not be indicative of our financial performance. |
|||||||
| Non-GAAP diluted net loss per share | Represents net loss per share excluding amortization of acquired intangible assets and certain non-cash and non-recurring charges that may not be indicative of our financial performance. |
We believe that adjusting our diluted net loss per share to remove non-cash and non-recurring charges provides a useful perspective with respect to the Company's operating performance as well as comparisons to past and competitor operating results. |
||||||
| Stock-based compensation | Consists of non-cash charges related to our employee equity incentive plans. | We exclude stock-based compensation because management does not view these non-cash charges as part of our core operating performance. This adjustment facilitates a useful evaluation of our current operating performance as well as comparisons to past and competitor operating results. | ||||||
| Contingent consideration | Adjustment reflects a non-cash reduction to the fair market value of the contingent consideration liability related to our acquisition of MENU Technologies AG (the "MENU Acquisition"). | We exclude changes to the fair market value of our contingent consideration liability because management does not view these non-cash, non-recurring charges as part of our core operating performance. This adjustment facilitates a useful evaluation of our current operating performance as well as comparisons to past and competitor operating results. | ||||||
| Non-GAAP Measure or Adjustment | Definition | Usefulness to management and investors | ||||||
| Transaction costs | Adjustment reflects non-recurring professional fees incurred in transaction due diligence and integration, including costs incurred in the acquisitions of Stuzo Blocker, Inc., Stuzo Holdings, LLC and their subsidiaries (the "Stuzo Acquisition"), TASK Group Holdings Limited, and Delaget (the "Delaget Acquisition") | We exclude professional fees incurred in corporate development and integration because management does not view these non-recurring charges, which are inconsistent in size and are significantly impacted by the timing and valuation of our transactions, as part of our core operating performance. This adjustment facilitates a useful evaluation of our current operating performance, comparisons to past and competitor operating results, and additional means to evaluate expense trends. | ||||||
| Gain on insurance proceeds | Adjustment reflects the gain on insurance proceeds due to the settlement of legacy claims. | We exclude these non-recurring adjustments because management does not view these costs as part of our core operating performance. These adjustments facilitate a useful evaluation of our current operating performance as well as comparisons to past and competitor operating results. | ||||||
| Severance | Adjustment reflects severance tied to non-recurring restructuring events included in cost of sales, sales and marketing expense, general and administrative expense, and research and development expense. | |||||||
| Litigation expense | Adjustment reflects the release of a loss contingency and settlement expenses for legal matters. | |||||||
| Loss on extinguishment of debt | Adjustment reflects loss on extinguishment of debt related to the conversion of the 4.500% Convertible Senior Notes due 2024 and a portion of the 2.875% Convertible Senior Notes due 2026. | |||||||
| Discontinued operations | Adjustment reflects income from discontinued operations related to the disposition of our Government segment. | |||||||
| Impairment loss | Adjustment reflects impairment loss related to the discontinuance of the Brink POS trademark and the impairment of internally developed software costs not meeting the general release threshold as a result of acquiring go-to-market software in the MENU Acquisition. | |||||||
| Other (income) expense, net | Adjustment reflects foreign currency transaction gains and losses and other non-recurring income and expenses recorded in other (income) expense, net in the accompanying statements of operations. | |||||||
| Non-recurring income taxes | Adjustment reflects a partial release of our deferred tax asset valuation allowance resulting from the Stuzo Acquisition and Delaget Acquisition. | We exclude these non-cash and non-recurring adjustments for purposes of calculating non-GAAP diluted net loss per share because management does not view these costs as part of our core operating performance. These adjustments facilitate a useful evaluation of our current operating performance, comparisons to past and competitor operating results, and additional means to evaluate expense trends. | ||||||
| Non-cash interest | Adjustment reflects non-cash amortization of issuance costs and discount related to the Company's long-term debt. | |||||||
| Acquired intangible assets amortization | Adjustment reflects amortization expense of acquired developed technology included within cost of sales and amortization expense of other acquired intangible assets. | |||||||
| (in thousands) | Three Months Ended December 31, | Year Ended December 31, |
|||||||||||||||||||||
| Reconciliation of Net Loss to Adjusted EBITDA | 2024 | 2023 | 2024 | 2023 | |||||||||||||||||||
| Net loss | $ | (21,057) | $ | (18,629) | $ | (4,987) | $ | (69,752) | |||||||||||||||
| Discontinued operations | (4,236) | (2,894) | (84,923) | (11,867) | |||||||||||||||||||
| Net loss from continuing operations | (25,293) | (21,523) | (89,910) | (81,619) | |||||||||||||||||||
| Provision for (benefit from) income taxes | 1,752 | 975 | (4,768) | 1,848 | |||||||||||||||||||
| Interest expense, net | 3,412 | 1,779 | 10,167 | 6,931 | |||||||||||||||||||
| Depreciation and amortization | 11,205 | 6,881 | 37,907 | 27,014 | |||||||||||||||||||
| Stock-based compensation | 7,905 | 3,747 | 24,487 | 14,291 | |||||||||||||||||||
| Contingent consideration | — | (1,700) | (600) | (9,200) | |||||||||||||||||||
| Litigation expense | — | (808) | — | (808) | |||||||||||||||||||
| Transaction costs | 2,351 | 2,273 | 8,454 | 2,273 | |||||||||||||||||||
| Gain on insurance proceeds | (348) | — | (495) | (500) | |||||||||||||||||||
| Severance | 1,088 | — | 2,769 | 253 | |||||||||||||||||||
| Loss on extinguishment of debt | 6,560 | 635 | 6,560 | 635 | |||||||||||||||||||
| Impairment loss | — | — | 225 | — | |||||||||||||||||||
| Other (income) expense, net | (2,856) | 369 | (1,146) | 485 | |||||||||||||||||||
| Adjusted EBITDA | $ | 5,776 | $ | (7,372) | $ | (6,350) | $ | (38,397) | |||||||||||||||
| (in thousands, except per share amounts) | Three Months Ended December 31, | Year Ended December 31, |
|||||||||||||||||||||
| Reconciliation between GAAP and Non-GAAP diluted net loss per share | 2024 | 2023 | 2024 | 2023 | |||||||||||||||||||
| Diluted net loss per share | $ | (0.57) | $ | (0.67) | $ | (0.14) | $ | (2.53) | |||||||||||||||
| Discontinued operations | (0.11) | (0.10) | (2.49) | (0.43) | |||||||||||||||||||
| Diluted net loss per share from continuing operations | (0.68) | (0.77) | (2.63) | (2.96) | |||||||||||||||||||
| Non-recurring income taxes | 0.03 | — | (0.19) | — | |||||||||||||||||||
| Non-cash interest | 0.02 | 0.02 | 0.07 | 0.08 | |||||||||||||||||||
| Acquired intangible assets amortization | 0.24 | 0.16 | 0.84 | 0.66 | |||||||||||||||||||
| Stock-based compensation | 0.21 | 0.13 | 0.72 | 0.52 | |||||||||||||||||||
| Contingent consideration | — | (0.06) | (0.02) | (0.33) | |||||||||||||||||||
| Litigation expense | — | (0.03) | — | (0.03) | |||||||||||||||||||
| Transaction costs | 0.06 | 0.08 | 0.25 | 0.08 | |||||||||||||||||||
| Gain on insurance proceeds | (0.01) | — | (0.01) | (0.02) | |||||||||||||||||||
| Severance | 0.03 | — | 0.08 | 0.01 | |||||||||||||||||||
| Loss on extinguishment of debt | 0.18 | 0.02 | 0.19 | 0.02 | |||||||||||||||||||
| Impairment loss | — | — | 0.01 | — | |||||||||||||||||||
| Other (income) expense, net | (0.08) | 0.01 | (0.03) | 0.02 | |||||||||||||||||||
| Non-GAAP diluted net loss per share | $ | (0.00) | $ | (0.43) | $ | (0.73) | $ | (1.96) | |||||||||||||||
| Diluted weighted average shares outstanding | 37,197 | 27,968 | 34,155 | 27,552 | |||||||||||||||||||
| Three Months Ended December 31, | Year Ended December 31, |
||||||||||||||||||||||
| Reconciliation between GAAP and Non-GAAP Subscription Service Gross Margin Percentage |
2024 | 2023 | 2024 | 2023 | |||||||||||||||||||
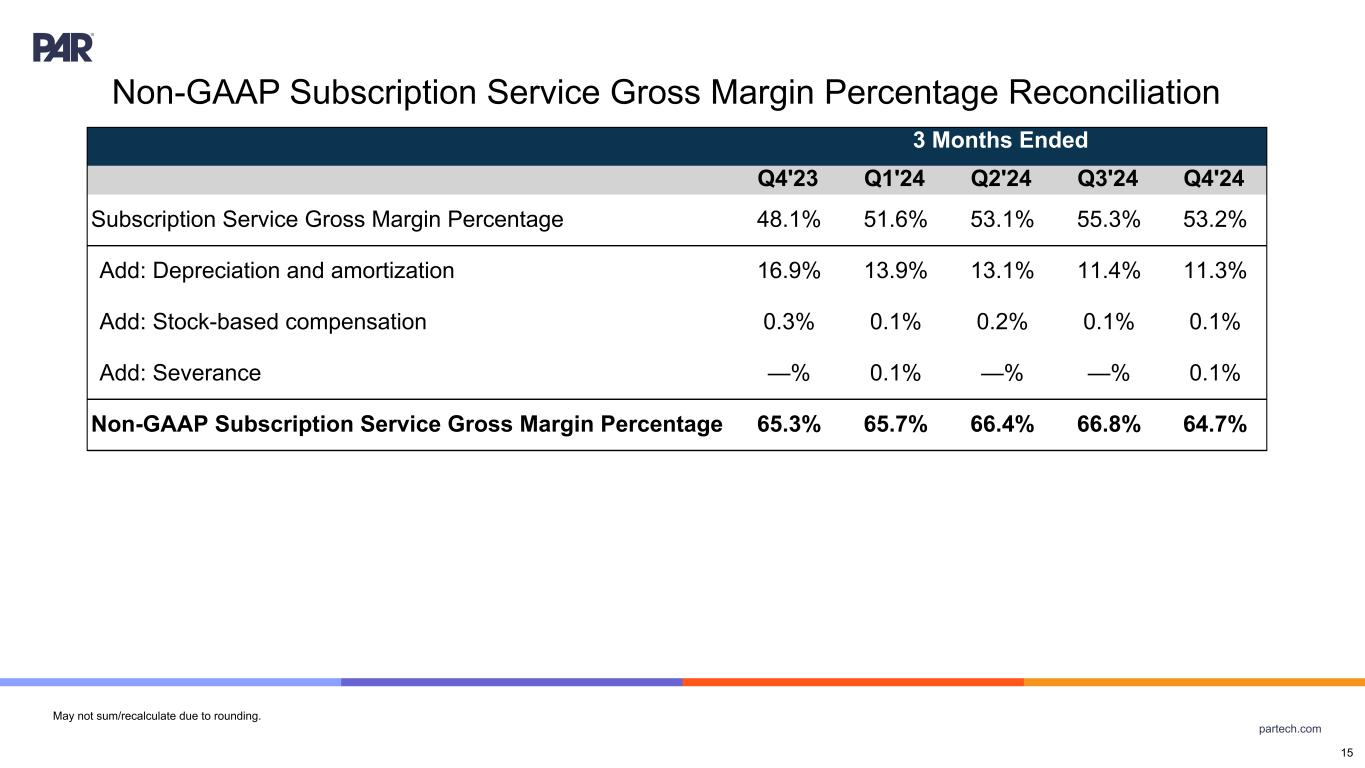
| Subscription Service Gross Margin Percentage | 53.2 | % | 48.1 | % | 53.5 | % | 48.0 | % | |||||||||||||||
| Depreciation and amortization | 11.3 | % | 16.9 | % | 12.2 | % | 18.1 | % | |||||||||||||||
| Stock-based compensation | 0.1 | % | 0.3 | % | 0.1 | % | 0.3 | % | |||||||||||||||
| Severance | 0.1 | % | — | % | 0.1 | % | — | % | |||||||||||||||
| Non-GAAP Subscription Service Gross Margin Percentage | 64.7 | % | 65.3 | % | 65.9 | % | 66.4 | % | |||||||||||||||

