| New Jersey | 1-3215 | 22-1024240 | ||||||
| (State or Other Jurisdiction of Incorporation) | (Commission File Number) | (IRS Employer Identification No.) | ||||||
| Title of each class | Trading Symbol(s) | Name of each exchange on which registered | ||||||
| Common Stock, Par Value $1.00 | JNJ | New York Stock Exchange | ||||||
| 0.650% Notes Due May 2024 | JNJ24C | New York Stock Exchange | ||||||
| 5.50% Notes Due November 2024 | JNJ24BP | New York Stock Exchange | ||||||
| 1.150% Notes Due November 2028 | JNJ28 | New York Stock Exchange | ||||||
| 1.650% Notes Due May 2035 | JNJ35 | New York Stock Exchange | ||||||
| Exhibit No. |
Description of Exhibit |
||||
| 104 | The cover page from this Current Report on Form 8-K, formatted in Inline XBRL. | ||||
| Johnson & Johnson | ||||||||||||||
| (Registrant) |
||||||||||||||
| Date: | July 20, 2023 | By: | /s/ Robert J. Decker, Jr. | |||||||||||
| Robert J. Decker, Jr. Controller (Principal Accounting Officer) |
||||||||||||||


| Regulatory | Janssen Marks First Approval Worldwide for AKEEGA (Niraparib and Abiraterone Acetate Dual Action Tablet) with EC Authorisation for the Treatment of Patients with Metastatic Castration Resistant Prostate Cancer with BRCA1/2 Mutations | Press Release | ||||||
| Milvexian Granted U.S. FDA Fast Track Designation for All Three Indications Under Evaluation in Phase 3 Librexia Program: Ischemic Stroke, Acute Coronary Syndrome and Atrial Fibrillation | Press Release | |||||||
| Janssen Submits New Drug Application to U.S. FDA Seeking Approval of Investigational Single Tablet Combination Therapy of Macitentan and Tadalafil for Treatment of Patients with Pulmonary Arterial Hypertension (PAH) | Press Release | |||||||
| Janssen Submits Supplemental Biologics License Application to U.S. FDA Seeking Approval of CARVYKTI for the Earlier Treatment of Patients with Relapsed or Refractory Multiple Myeloma | Press Release | |||||||
| Data Release | Janssen Reports First Results from Phase 2 SunRISe-1 Study of TAR-200 and Anti-PD-1 Antibody Cetrelimab in Patients with Bacillus Calmette-Guérin-Unresponsive Non-Muscle-Invasive Bladder Cancer | Press Release | ||||||
| First Phase 3 TREMFYA (guselkumab) Data in Inflammatory Bowel Disease Show Positive Induction Results Among Patients with Moderately to Severely Active Ulcerative Colitis | Press Release | |||||||
| New Data Published on Biosense Webster QDOT MICRO Catheter – the Latest Advancement in Focal RF Ablation for Treating AFib | Press Release | |||||||
| Janssen to Highlight Scientific Advances and Commitment to Transform Cancer Care at ASCO and EHA with More than 90 Presentations Showcasing Robust, Differentiated Portfolio and Pipeline in Hematologic Malignancies and Solid Tumors | Press Release | |||||||
| New Phase 2 Data Demonstrate Potential Benefit of Nipocalimab for Pregnant Individuals at High Risk of Early-Onset Severe Hemolytic Disease of the Fetus and Newborn (HDFN) | Press Release | |||||||
Janssen Announces Positive Topline Results for JNJ-2113—a Novel, First and Only Oral IL-23 Receptor Antagonist Peptide in Development for Moderate-to-Severe Plaque Psoriasis1 |
Press Release | |||||||
Treatment with RYBREVANT (amivantamab-vmjw) Plus Chemotherapy Resulted in Statistically Significant and Clinically Meaningful Improvement in Progression-Free Survival in Patients with Newly Diagnosed EGFR Exon 20 Insertion Mutation-Positive Non-Small Cell Lung Cancer1 |
Press Release | |||||||
|
Other |
Johnson & Johnson Announces Launch of Kenvue Inc. IPO Roadshow | Press Release | ||||||
| Janssen Enters Worldwide Collaboration and License Agreement with Cellular Biomedicine Group to Develop Next Generation CAR-T Therapies | Press Release | |||||||
($ in Billions, except EPS) |
July 2023 |
April 2023 |
||||||
|
Adjusted Operational Sales1,2,5
Change vs. Prior Year / Mid-point
|
6.0% – 7.0% / 6.5% |
4.5% – 5.5% / 5.0% |
||||||
|
Operational Sales2,5/ Mid-point
Change vs. Prior Year / Mid-point
|
$99.3B – $100.3B / $99.8B
7.0% – 8.0% / 7.5%
|
$97.9B – $98.9B / $98.4B
5.5% – 6.5% / 6.0%
|
||||||
|
Estimated Reported Sales3,5/ Mid-point
Change vs. Prior Year / Mid-point
|
$98.8B – $99.8B / $99.3B
6.5% – 7.5% / 7.0%
|
$97.9B – $98.9B / $98.4B
5.5% – 6.5% / 6.0%
|
||||||
|
Adjusted Operational EPS (Diluted)2,4/ Mid-point
Change vs. Prior Year / Mid-point
|
$10.60 – $10.70 / $10.65
4.5% – 5.5% / 5.0%
|
$10.50 – $10.60 / $10.55
3.5% – 4.5% / 4.0%
|
||||||
|
Adjusted EPS (Diluted)3,4 / Mid-point
Change vs. Prior Year / Mid-point
|
$10.70 – $10.80 / $10.75
5.5% – 6.5% / 6.0%
|
$10.60 – $10.70 / $10.65
4.5% – 5.5% / 5.0%
|
||||||
| Press Contacts: | Investor Contacts: | |||||||
| Tesia Williams | Jessica Moore | |||||||
| media-relations@its.jnj.com | investor-relations@its.jnj.com | |||||||
| Johnson & Johnson and Subsidiaries | |||||||||||||||||||||||||||||
| Supplementary Sales Data | |||||||||||||||||||||||||||||
| (Unaudited; Dollars in Millions) | SECOND QUARTER |
||||||||||||||||||||||||||||
| Percent Change | |||||||||||||||||||||||||||||
| 2023 | 2022 | Total | Operations | Currency | |||||||||||||||||||||||||
| Sales to customers by | |||||||||||||||||||||||||||||
| geographic area | |||||||||||||||||||||||||||||
| U.S. | $ | 13,444 | 12,197 | 10.2 | % | 10.2 | — | ||||||||||||||||||||||
| Europe | 5,894 | 6,085 | (3.1) | (3.9) | 0.8 | ||||||||||||||||||||||||
| Western Hemisphere excluding U.S. | 1,713 | 1,536 | 11.5 | 17.7 | (6.2) | ||||||||||||||||||||||||
| Asia-Pacific, Africa | 4,479 | 4,202 | 6.6 | 12.5 | (5.9) | ||||||||||||||||||||||||
| International | 12,086 | 11,823 | 2.2 | 4.7 | (2.5) | ||||||||||||||||||||||||
| Worldwide | $ | 25,530 | 24,020 | 6.3 | % | 7.5 | (1.2) | ||||||||||||||||||||||
| Note: Percentages have been calculated using actual, non-rounded figures and, therefore, may not recalculate precisely. | |||||||||||||||||||||||||||||
| Johnson & Johnson and Subsidiaries | |||||||||||||||||||||||||||||
| Supplementary Sales Data | |||||||||||||||||||||||||||||
| (Unaudited; Dollars in Millions) | SIX MONTHS |
||||||||||||||||||||||||||||
| Percent Change | |||||||||||||||||||||||||||||
| 2023 | 2022 | Total | Operations | Currency | |||||||||||||||||||||||||
| Sales to customers by | |||||||||||||||||||||||||||||
| geographic area | |||||||||||||||||||||||||||||
| U.S. | $ | 25,961 | 23,611 | 10.0 | % | 10.0 | — | ||||||||||||||||||||||
| Europe | 12,226 | 12,109 | 1.0 | 3.0 | (2.0) | ||||||||||||||||||||||||
| Western Hemisphere excluding U.S. | 3,300 | 3,018 | 9.3 | 16.1 | (6.8) | ||||||||||||||||||||||||
| Asia-Pacific, Africa | 8,789 | 8,708 | 0.9 | 8.2 | (7.3) | ||||||||||||||||||||||||
| International | 24,315 | 23,835 | 2.0 | 6.5 | (4.5) | ||||||||||||||||||||||||
| Worldwide | $ | 50,276 | 47,446 | 6.0 | % | 8.2 | (2.2) | ||||||||||||||||||||||
Note: Percentages have been calculated using actual, non-rounded figures and, therefore, may not recalculate precisely. | |||||||||||||||||||||||||||||
| Johnson & Johnson and Subsidiaries | |||||||||||||||||||||||||||||
| Supplementary Sales Data | |||||||||||||||||||||||||||||
| (Unaudited; Dollars in Millions) | SECOND QUARTER |
||||||||||||||||||||||||||||
| Percent Change | |||||||||||||||||||||||||||||
| 2023 | 2022 | Total | Operations | Currency | |||||||||||||||||||||||||
| Sales to customers by | |||||||||||||||||||||||||||||
| segment of business | |||||||||||||||||||||||||||||
Consumer Health |
|||||||||||||||||||||||||||||
| U.S. | $ | 1,787 | 1,687 | 6.0 | % | 6.0 | — | ||||||||||||||||||||||
| International | 2,224 | 2,118 | 5.0 | 9.0 | (4.0) | ||||||||||||||||||||||||
| 4,011 | 3,805 | 5.4 | 7.7 | (2.3) | |||||||||||||||||||||||||
Pharmaceutical (1) |
|||||||||||||||||||||||||||||
| U.S. | 7,818 | 7,159 | 9.2 | 9.2 | — | ||||||||||||||||||||||||
| International | 5,913 | 6,158 | (4.0) | (2.5) | (1.5) | ||||||||||||||||||||||||
| 13,731 | 13,317 | 3.1 | 3.8 | (0.7) | |||||||||||||||||||||||||
Pharmaceutical excluding COVID-19 Vaccine (1) |
|||||||||||||||||||||||||||||
| U.S. | 7,818 | 7,114 | 9.9 | 9.9 | — | ||||||||||||||||||||||||
| International | 5,628 | 5,659 | (0.5) | 1.5 | (2.0) | ||||||||||||||||||||||||
| 13,446 | 12,773 | 5.3 | 6.2 | (0.9) | |||||||||||||||||||||||||
| MedTech | |||||||||||||||||||||||||||||
| U.S. | 3,839 | 3,351 | 14.6 | 14.6 | — | ||||||||||||||||||||||||
| International | 3,949 | 3,547 | 11.3 | 14.7 | (3.4) | ||||||||||||||||||||||||
| 7,788 | 6,898 | 12.9 | 14.7 | (1.8) | |||||||||||||||||||||||||
| U.S. | 13,444 | 12,197 | 10.2 | 10.2 | — | ||||||||||||||||||||||||
| International | 12,086 | 11,823 | 2.2 | 4.7 | (2.5) | ||||||||||||||||||||||||
| Worldwide | 25,530 | 24,020 | 6.3 | 7.5 | (1.2) | ||||||||||||||||||||||||
| U.S. | 13,444 | 12,152 | 10.6 | 10.6 | — | ||||||||||||||||||||||||
| International | 11,801 | 11,324 | 4.2 | 7.0 | (2.8) | ||||||||||||||||||||||||
Worldwide excluding COVID-19 Vaccine (1) |
$ | 25,245 | 23,476 | 7.5 | % | 8.9 | (1.4) | ||||||||||||||||||||||
| Note: Percentages have been calculated using actual, non-rounded figures and, therefore, may not recalculate precisely. | |||||||||||||||||||||||||||||
(1) Refer to supplemental sales reconciliation schedules. |
|||||||||||||||||||||||||||||
| Johnson & Johnson and Subsidiaries | |||||||||||||||||||||||||||||
| Supplementary Sales Data | |||||||||||||||||||||||||||||
| (Unaudited; Dollars in Millions) | SIX MONTHS |
||||||||||||||||||||||||||||
| Percent Change | |||||||||||||||||||||||||||||
| 2022 | 2021 | Total | Operations | Currency | |||||||||||||||||||||||||
| Sales to customers by | |||||||||||||||||||||||||||||
| segment of business | |||||||||||||||||||||||||||||
Consumer Health |
|||||||||||||||||||||||||||||
| U.S. | $ | 3,522 | 3,244 | 8.6 | % | 8.6 | — | ||||||||||||||||||||||
| International | 4,341 | 4,147 | 4.7 | 10.1 | (5.4) | ||||||||||||||||||||||||
| 7,863 | 7,391 | 6.4 | 9.5 | (3.1) | |||||||||||||||||||||||||
Pharmaceutical (1) |
|||||||||||||||||||||||||||||
| U.S. | 14,841 | 13,791 | 7.6 | 7.6 | — | ||||||||||||||||||||||||
| International | 12,303 | 12,395 | (0.7) | 3.1 | (3.8) | ||||||||||||||||||||||||
| 27,144 | 26,186 | 3.7 | 5.5 | (1.8) | |||||||||||||||||||||||||
Pharmaceutical excluding COVID-19 Vaccine (1) |
|||||||||||||||||||||||||||||
| U.S. | 14,841 | 13,671 | 8.6 | 8.6 | — | ||||||||||||||||||||||||
| International | 11,271 | 11,514 | (2.1) | 1.9 | (4.0) | ||||||||||||||||||||||||
| 26,112 | 25,185 | 3.7 | 5.5 | (1.8) | |||||||||||||||||||||||||
| MedTech | |||||||||||||||||||||||||||||
| U.S. | 7,598 | 6,576 | 15.5 | 15.5 | — | ||||||||||||||||||||||||
| International | 7,671 | 7,293 | 5.2 | 10.3 | (5.1) | ||||||||||||||||||||||||
| 15,269 | 13,869 | 10.1 | 12.8 | (2.7) | |||||||||||||||||||||||||
| U.S. | 25,961 | 23,611 | 10.0 | 10.0 | — | ||||||||||||||||||||||||
| International | 24,315 | 23,835 | 2.0 | 6.5 | (4.5) | ||||||||||||||||||||||||
| Worldwide | 50,276 | 47,446 | 6.0 | 8.2 | (2.2) | ||||||||||||||||||||||||
| U.S. | 25,961 | 23,491 | 10.5 | 10.5 | — | ||||||||||||||||||||||||
| International | 23,283 | 22,954 | 1.4 | 6.1 | (4.7) | ||||||||||||||||||||||||
Worldwide excluding COVID-19 Vaccine (1) |
$ | 49,244 | 46,445 | 6.0 | % | 8.3 | (2.3) | ||||||||||||||||||||||
| Note: Percentages have been calculated using actual, non-rounded figures and, therefore, may not recalculate precisely. | |||||||||||||||||||||||||||||
(1) Refer to supplemental sales reconciliation schedules. |
|||||||||||||||||||||||||||||
| Johnson & Johnson and Subsidiaries | |||||||||||||||||||||||||||||
| Condensed Consolidated Statement of Earnings | |||||||||||||||||||||||||||||
| (Unaudited; in Millions Except Per Share Figures) | SECOND QUARTER |
||||||||||||||||||||||||||||
| 2023 | 2022 | Percent | |||||||||||||||||||||||||||
| Percent | Percent | Increase | |||||||||||||||||||||||||||
| Amount | to Sales | Amount | to Sales | (Decrease) | |||||||||||||||||||||||||
| Sales to customers | $ | 25,530 | 100.0 | $ | 24,020 | 100.0 | 6.3 | ||||||||||||||||||||||
| Cost of products sold | 8,212 | 32.2 | 7,919 | 33.0 | 3.7 | ||||||||||||||||||||||||
| Gross Profit | 17,318 | 67.8 | 16,101 | 67.0 | 7.6 | ||||||||||||||||||||||||
| Selling, marketing and administrative expenses | 6,665 | 26.1 | 6,226 | 25.9 | 7.1 | ||||||||||||||||||||||||
| Research and development expense | 3,829 | 15.0 | 3,703 | 15.4 | 3.4 | ||||||||||||||||||||||||
| Interest (income) expense, net | (23) | (0.1) | (26) | (0.1) | |||||||||||||||||||||||||
| Other (income) expense, net* | (60) | (0.2) | 273 | 1.1 | |||||||||||||||||||||||||
| Restructuring | 145 | 0.5 | 85 | 0.4 | |||||||||||||||||||||||||
| Earnings before provision for taxes on income | 6,762 | 26.5 | 5,840 | 24.3 | 15.8 | ||||||||||||||||||||||||
| Provision for taxes on income | 1,618 | 6.4 | 1,026 | 4.3 | 57.7 | ||||||||||||||||||||||||
| Net earnings | $ | 5,144 | 20.1 | $ | 4,814 | 20.0 | 6.9 | ||||||||||||||||||||||
| Net earnings per share (Diluted) | $ | 1.96 | $ | 1.80 | 8.9 | ||||||||||||||||||||||||
| Average shares outstanding (Diluted) | 2,625.7 | 2,667.9 | |||||||||||||||||||||||||||
| Effective tax rate | 23.9 | % | 17.6 | % | |||||||||||||||||||||||||
Adjusted earnings before provision for taxes and net earnings (1) (A) |
|||||||||||||||||||||||||||||
| Earnings before provision for taxes on income | $ | 8,824 | 34.6 | $ | 8,171 | 34.0 | 8.0 | ||||||||||||||||||||||
| Net earnings | $ | 7,358 | 28.8 | $ | 6,912 | 28.8 | 6.5 | ||||||||||||||||||||||
| Net earnings per share (Diluted) | $ | 2.80 | $ | 2.59 | 8.1 | ||||||||||||||||||||||||
| Effective tax rate | 16.6 | % | 15.4 | % | |||||||||||||||||||||||||
| * Fiscal second quarter Other (income) expense, net includes $37 million related to the Company's 10.4% non-controlling interest in Kenvue, Inc. from the time of the initial public offering on May 8, 2023 through the end of the fiscal second quarter. | |||||||||||||||||||||||||||||
(1) See Reconciliation of Non-GAAP Financial Measures. |
|||||||||||||||||||||||||||||
(A) NON-GAAP FINANCIAL MEASURES "Adjusted earnings before provision for taxes on income," "adjusted net earnings," "adjusted net earnings per share (diluted)," and "adjusted effective tax rate" are non-GAAP financial measures and should not be considered replacements for GAAP results. The Company provides earnings before provision for taxes on income, net earnings, net earnings per share (diluted), and effective tax rate on an adjusted basis because management believes that these measures provide useful information to investors. Among other things, these measures may assist investors in evaluating the Company's results of operations period over period. In various periods, these measures may exclude such items as intangible asset amortization expense, significant gains from divestitures, significant costs associated with acquisitions, restructuring, litigation, and changes in applicable laws and regulations (including significant accounting or tax matters). Special items may be highly variable, difficult to predict, and of a size that sometimes has substantial impact on the Company's reported results of operations for a period. Management uses these measures internally for planning, forecasting and evaluating the performances of the Company's businesses, including allocating resources and evaluating results relative to employee performance compensation targets. Unlike earnings before provision for taxes on income, net earnings, net earnings per share (diluted), and effective tax rate prepared in accordance with GAAP, adjusted earnings before provision for taxes on income, adjusted net earnings, adjusted net earnings per share (diluted), and adjusted effective tax rate may not be comparable with the calculation of similar measures for other companies. The limitations of using these non-GAAP financial measures as performance measures are that they provide a view of the Company's results of operations without including all events during a period, such as intangible asset amortization expense, significant gains from divestitures, the effects of an acquisition, restructuring, litigation, and changes in applicable laws and regulations (including significant accounting or tax matters) and do not provide a comparable view of the Company's performance to other companies in the health care industry. Investors should consider non-GAAP financial measures in addition to, and not as replacements for, or superior to, measures of financial performance prepared in accordance with GAAP. | |||||||||||||||||||||||||||||
| Johnson & Johnson and Subsidiaries | |||||||||||||||||||||||||||||
| Condensed Consolidated Statement of Earnings | |||||||||||||||||||||||||||||
| (Unaudited; in Millions Except Per Share Figures) | SIX MONTHS |
||||||||||||||||||||||||||||
| 2022 | 2021 | Percent | |||||||||||||||||||||||||||
| Percent | Percent | Increase | |||||||||||||||||||||||||||
| Amount | to Sales | Amount | to Sales | (Decrease) | |||||||||||||||||||||||||
| Sales to customers | $ | 50,276 | 100.0 | $ | 47,446 | 100.0 | 6.0 | ||||||||||||||||||||||
| Cost of products sold | 16,607 | 33.0 | 15,517 | 32.7 | 7.0 | ||||||||||||||||||||||||
| Gross Profit | 33,669 | 67.0 | 31,929 | 67.3 | 5.4 | ||||||||||||||||||||||||
| Selling, marketing and administrative expenses | 12,803 | 25.5 | 12,164 | 25.6 | 5.3 | ||||||||||||||||||||||||
| Research and development expense | 7,392 | 14.7 | 7,165 | 15.1 | 3.2 | ||||||||||||||||||||||||
| In-process research and development | 49 | 0.1 | 610 | 1.3 | |||||||||||||||||||||||||
| Interest (income) expense, net | (43) | (0.1) | (38) | (0.1) | |||||||||||||||||||||||||
| Other (income) expense, net* | 7,168 | 14.3 | 171 | 0.4 | |||||||||||||||||||||||||
| Restructuring | 275 | 0.5 | 155 | 0.3 | |||||||||||||||||||||||||
| Earnings before provision for taxes on income | 6,025 | 12.0 | 11,702 | 24.7 | (48.5) | ||||||||||||||||||||||||
| Provision for taxes on income | 949 | 1.9 | 1,739 | 3.7 | (45.4) | ||||||||||||||||||||||||
| Net earnings | $ | 5,076 | 10.1 | $ | 9,963 | 21.0 | (49.1) | ||||||||||||||||||||||
| Net earnings per share (Diluted) | $ | 1.93 | $ | 3.73 | (48.3) | ||||||||||||||||||||||||
| Average shares outstanding (Diluted) | 2,630.7 | 2,669.2 | |||||||||||||||||||||||||||
| Effective tax rate | 15.8 | % | 14.9 | % | |||||||||||||||||||||||||
Adjusted earnings before provision for taxes and net earnings (1) (A) |
|||||||||||||||||||||||||||||
| Earnings before provision for taxes on income | $ | 17,292 | 34.4 | $ | 16,389 | 34.5 | 5.5 | ||||||||||||||||||||||
| Net earnings | $ | 14,426 | 28.7 | $ | 14,041 | 29.6 | 2.7 | ||||||||||||||||||||||
| Net earnings per share (Diluted) | $ | 5.48 | $ | 5.26 | 4.2 | ||||||||||||||||||||||||
| Effective tax rate | 16.6 | % | 14.3 | % | |||||||||||||||||||||||||
| * Fiscal six months Other (income) expense, net includes $37 million related to the Company's 10.4% non-controlling interest in Kenvue, Inc. from the time of the initial public offering on May 8, 2023 through the end of the fiscal second quarter. | |||||||||||||||||||||||||||||
(1) See Reconciliation of Non-GAAP Financial Measures. |
|||||||||||||||||||||||||||||
(A) NON-GAAP FINANCIAL MEASURES "Adjusted earnings before provision for taxes on income," "adjusted net earnings," "adjusted net earnings per share (diluted)," and "adjusted effective tax rate" are non-GAAP financial measures and should not be considered replacements for GAAP results. The Company provides earnings before provision for taxes on income, net earnings, net earnings per share (diluted), and effective tax rate on an adjusted basis because management believes that these measures provide useful information to investors. Among other things, these measures may assist investors in evaluating the Company's results of operations period over period. In various periods, these measures may exclude such items as intangible asset amortization expense, significant gains from divestitures, significant costs associated with acquisitions, restructuring, litigation, and changes in applicable laws and regulations (including significant accounting or tax matters). Special items may be highly variable, difficult to predict, and of a size that sometimes has substantial impact on the Company's reported results of operations for a period. Management uses these measures internally for planning, forecasting and evaluating the performances of the Company's businesses, including allocating resources and evaluating results relative to employee performance compensation targets. Unlike earnings before provision for taxes on income, net earnings, net earnings per share (diluted), and effective tax rate prepared in accordance with GAAP, adjusted earnings before provision for taxes on income, adjusted net earnings, adjusted net earnings per share (diluted), and adjusted effective tax rate may not be comparable with the calculation of similar measures for other companies. The limitations of using these non-GAAP financial measures as performance measures are that they provide a view of the Company's results of operations without including all events during a period, such as intangible asset amortization expense, significant gains from divestitures, the effects of an acquisition, restructuring, litigation, and changes in applicable laws and regulations (including significant accounting or tax matters) and do not provide a comparable view of the Company's performance to other companies in the health care industry. Investors should consider non-GAAP financial measures in addition to, and not as replacements for, or superior to, measures of financial performance prepared in accordance with GAAP. | |||||||||||||||||||||||||||||
| Johnson & Johnson and Subsidiaries | |||||||||||||||||
| Reconciliation of Non-GAAP Financial Measures | |||||||||||||||||
Second Quarter |
|||||||||||||||||
| (Dollars in Millions Except Per Share Data) | 2023 | 2022 | |||||||||||||||
| Net Earnings, after tax- as reported | $ | 5,144 | $ | 4,814 | |||||||||||||
| Pre-tax Adjustments | |||||||||||||||||
| Litigation related | 137 | 385 | |||||||||||||||
| Intangible Asset Amortization expense | 1,211 | 1,095 | |||||||||||||||
COVID-19 Vaccine related costs 1 |
165 | 276 | |||||||||||||||
| Consumer Health separation costs | 282 | 268 | |||||||||||||||
Restructuring related 2 |
145 | 128 | |||||||||||||||
Medical Device Regulation 3 |
85 | 70 | |||||||||||||||
| Acquisition, integration and divestiture related | 38 | - | |||||||||||||||
| (Gains)/losses on securities | (1) | 109 | |||||||||||||||
| Tax Adjustments | |||||||||||||||||
Tax impact on special item adjustments 4 |
(373) | (313) | |||||||||||||||
| Consumer Health separation tax related costs | 546 | 2 | |||||||||||||||
| Tax legislation and other tax related | (21) | 78 | |||||||||||||||
| Adjusted Net Earnings, after tax | $ | 7,358 | $ | 6,912 | |||||||||||||
| Average shares outstanding (Diluted) | 2,625.7 | 2,667.9 | |||||||||||||||
| Adjusted net earnings per share (Diluted) | $ | 2.80 | $ | 2.59 | |||||||||||||
| Operational adjusted net earnings per share (Diluted) | $ | 2.84 | |||||||||||||||
| Notes: | |||||||||||||||||
1 |
COVID-19 Vaccine related costs include remaining commitments and obligations, including external manufacturing network exit costs and required clinical trial expenses, associated with the Company's completion of its COVID-19 vaccine contractual commitments. | ||||||||||||||||
2 |
In the first and second quarter of 2023, the company completed a prioritization of its research and development (R&D) investment within the Pharmaceutical segment to focus on the most promising medicines with the greatest benefit to patients. This resulted in the exit of certain programs within therapeutic areas. The R&D program exits are primarily in infectious diseases and vaccines including the discontinuation of its respiratory syncytial virus (RSV) adult vaccine program, hepatitis and HIV development. The restructuring expenses of $145 million in the quarter ($275 million Q2 YTD) include the termination of partnered and non-partnered program costs and asset impairments. | ||||||||||||||||
3 |
European Medical Device Regulation (MDR) costs represent one-time compliance costs for the Company’s previously registered products. MDR is a replacement of the existing European Medical Devices Directive regulatory framework, and manufacturers of currently marketed medical devices were required to comply with EU MDR beginning in May 2021. The Company considers the adoption of EU MDR to be a significant one-time regulatory change and is not indicative of on-going operations. The Company has excluded only external third-party regulatory and consulting costs from its MedTech operating segments' measures of profit and loss used for making operating decisions and assessing performance which is expected to be completed during 2024. | ||||||||||||||||
4 |
The tax impact related to special item adjustments reflects the current and deferred income taxes associated with the above pre-tax special items in arriving at adjusted earnings. | ||||||||||||||||
| Johnson & Johnson and Subsidiaries | ||||||||||||||||||||
| Reconciliation of Non-GAAP Financial Measures | ||||||||||||||||||||
Six Months Ended |
||||||||||||||||||||
| (Dollars in Millions Except Per Share Data) | 2023 | 2022 | ||||||||||||||||||
| Net Earnings, after tax- as reported | $ | 5,076 | $ | 9,963 | ||||||||||||||||
| Pre-tax Adjustments | ||||||||||||||||||||
| Litigation related | 7,037 | 385 | ||||||||||||||||||
| Intangible Asset Amortization expense | 2,415 | 2,203 | ||||||||||||||||||
COVID-19 Vaccine related costs 1 |
609 | 276 | ||||||||||||||||||
| Consumer Health separation costs | 582 | 370 | ||||||||||||||||||
Restructuring related 2 |
275 | 200 | ||||||||||||||||||
Medical Device Regulation 3 |
149 | 130 | ||||||||||||||||||
| Acquisition, integration and divestiture related | 80 | - | ||||||||||||||||||
| (Gains)/losses on securities | 71 | 520 | ||||||||||||||||||
| IPR&D | 49 | 610 | ||||||||||||||||||
| Other | - | (7) | ||||||||||||||||||
| Tax Adjustments | ||||||||||||||||||||
Tax impact on special item adjustments 4 |
(2,430) | (706) | ||||||||||||||||||
| Consumer Health separation tax related costs | 557 | 98 | ||||||||||||||||||
| Tax legislation and other tax related | (44) | (1) | ||||||||||||||||||
| Adjusted Net Earnings, after tax | $ | 14,426 | $ | 14,041 | ||||||||||||||||
| Average shares outstanding (Diluted) | 2,630.7 | 2,669.2 | ||||||||||||||||||
| Adjusted net earnings per share (Diluted) | $ | 5.48 | $ | 5.26 | ||||||||||||||||
| Operational adjusted net earnings per share (Diluted) | $ | 5.59 | ||||||||||||||||||
| Notes: | ||||||||||||||||||||
1 |
COVID-19 Vaccine related costs include remaining commitments and obligations, including external manufacturing network exit costs and required clinical trial expenses, associated with the Company's completion of its COVID-19 vaccine contractual commitments. | |||||||||||||||||||
2 |
In the first and second quarter of 2023, the company completed a prioritization of its research and development (R&D) investment within the Pharmaceutical segment to focus on the most promising medicines with the greatest benefit to patients. This resulted in the exit of certain programs within therapeutic areas. The R&D program exits are primarily in infectious diseases and vaccines including the discontinuation of its respiratory syncytial virus (RSV) adult vaccine program, hepatitis and HIV development. The restructuring expenses of $145 million in the quarter ($275 million Q2 YTD) include the termination of partnered and non-partnered program costs and asset impairments. | |||||||||||||||||||
3 |
European Medical Device Regulation (MDR) costs represent one-time compliance costs for the Company’s previously registered products. MDR is a replacement of the existing European Medical Devices Directive regulatory framework, and manufacturers of currently marketed medical devices were required to comply with EU MDR beginning in May 2021. The Company considers the adoption of EU MDR to be a significant one-time regulatory change and is not indicative of on-going operations. The Company has excluded only external third-party regulatory and consulting costs from its MedTech operating segments' measures of profit and loss used for making operating decisions and assessing performance which is expected to be completed during 2024. | |||||||||||||||||||
4 |
The tax impact related to special item adjustments reflects the current and deferred income taxes associated with the above pre-tax special items in arriving at adjusted earnings. | |||||||||||||||||||
| Johnson & Johnson and Subsidiaries | |||||||||||||||||||||||||||||
| Reconciliation of Non-GAAP Financial Measure | |||||||||||||||||||||||||||||
Adjusted Operational Sales Growth (A) |
|||||||||||||||||||||||||||||
SECOND QUARTER 2023 ACTUAL vs. 2022 ACTUAL |
|||||||||||||||||||||||||||||
| Segments | |||||||||||||||||||||||||||||
| Consumer Health | Pharmaceutical | MedTech | Total | ||||||||||||||||||||||||||
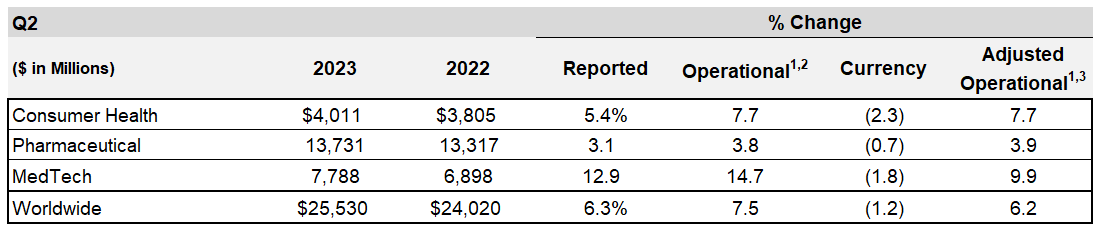
| WW As Reported | 5.4 | % | 3.1 | % | 12.9 | % | 6.3 | % | |||||||||||||||||||||
| U.S. | 6.0 | % | 9.2 | % | 14.6 | % | 10.2 | % | |||||||||||||||||||||
| International | 5.0 | % | (4.0) | % | 11.3 | % | 2.2 | % | |||||||||||||||||||||
| WW Currency | (2.3) | (0.7) | (1.8) | (1.2) | |||||||||||||||||||||||||
| U.S. | — | — | — | — | |||||||||||||||||||||||||
| International | (4.0) | (1.5) | (3.4) | (2.5) | |||||||||||||||||||||||||
| WW Operational | 7.7 | % | 3.8 | % | 14.7 | % | 7.5 | % | |||||||||||||||||||||
| U.S. | 6.0 | % | 9.2 | % | 14.6 | % | 10.2 | % | |||||||||||||||||||||
| International | 9.0 | % | (2.5) | % | 14.7 | % | 4.7 | % | |||||||||||||||||||||
| Abiomed | (4.8) | (1.4) | |||||||||||||||||||||||||||
| U.S. | (8.1) | (2.2) | |||||||||||||||||||||||||||
| International | (1.7) | (0.5) | |||||||||||||||||||||||||||
| All Other Acquisitions and Divestitures | 0.0 | 0.1 | 0.0 | 0.1 | |||||||||||||||||||||||||
| U.S. | 0.0 | 0.0 | 0.0 | 0.0 | |||||||||||||||||||||||||
| International | 0.0 | 0.3 | 0.0 | 0.2 | |||||||||||||||||||||||||
| WW Adjusted Operational | 7.7 | % | 3.9 | % | 9.9 | % | 6.2 | % | |||||||||||||||||||||
| U.S. | 6.0 | % | 9.2 | % | 6.5 | % | 8.0 | % | |||||||||||||||||||||
| International | 9.0 | % | (2.2) | % | 13.0 | % | 4.4 | % | |||||||||||||||||||||
Note: Percentages are based on actual, non-rounded figures and may not sum |
|||||||||||||||||||||||||||||
(A) NON-GAAP FINANCIAL MEASURE “Adjusted operational sales growth" excludes acquisitions, divestitures and translational currency and is a non-GAAP financial measure. Investors should consider non-GAAP financial measures in addition to, and not as replacements for, or superior to, measures of financial performance prepared in accordance with GAAP. Due to the variable nature of acquisitions and divestitures, and the impact they may have on the analysis of underlying business performance and trends, management believes that providing this measure enhances an investor’s understanding of the Company’s performance and may assist in the evaluation of ongoing business operations period over period. This non-GAAP financial measure is presented to permit investors to more fully understand how management assesses the performance of the Company, including for internal evaluation of the performance of the Company's businesses and planning and forecasting for future periods. The use of this non-GAAP financial measure as a performance measure is limited in that it provides a view of the Company's results of operations without including all events during a period and may not provide a comparable view of the Company's performance to that of other companies in the health care industry. |
|||||||||||||||||||||||||||||
| Johnson & Johnson and Subsidiaries | ||||||||||||||||||||||||||
| Reconciliation of Non-GAAP Financial Measure | ||||||||||||||||||||||||||
Adjusted Operational Sales Growth (A) | ||||||||||||||||||||||||||
SIX MONTHS 2023 ACTUAL vs. 2022 ACTUAL | ||||||||||||||||||||||||||
| Segments | ||||||||||||||||||||||||||
| Consumer Health | Pharmaceutical | MedTech | Total | |||||||||||||||||||||||
| WW As Reported | 6.4 | % | 3.7 | % | 10.1 | % | 6.0 | % | ||||||||||||||||||
| U.S. | 8.6 | % | 7.6 | % | 15.5 | % | 10.0 | % | ||||||||||||||||||
| International | 4.7 | % | (0.7) | % | 5.2 | % | 2.0 | % | ||||||||||||||||||
| WW Currency | (3.1) | (1.8) | (2.7) | (2.2) | ||||||||||||||||||||||
| U.S. | — | — | — | — | ||||||||||||||||||||||
| International | (5.4) | (3.8) | (5.1) | (4.5) | ||||||||||||||||||||||
| WW Operational | 9.5 | % | 5.5 | % | 12.8 | % | 8.2 | % | ||||||||||||||||||
| U.S. | 8.6 | % | 7.6 | % | 15.5 | % | 10.0 | % | ||||||||||||||||||
| International | 10.1 | % | 3.1 | % | 10.3 | % | 6.5 | % | ||||||||||||||||||
| Abiomed | (4.7) | (1.4) | ||||||||||||||||||||||||
| U.S. | (8.2) | (2.3) | ||||||||||||||||||||||||
| International | (1.6) | (0.5) | ||||||||||||||||||||||||
| All Other Acquisitions and Divestitures | 0.0 | 0.1 | 0.0 | 0.1 | ||||||||||||||||||||||
| U.S. | 0.0 | 0.0 | 0.0 | 0.0 | ||||||||||||||||||||||
| International | 0.0 | 0.3 | 0.0 | 0.2 | ||||||||||||||||||||||
| WW Adjusted Operational | 9.5 | % | 5.6 | % | 8.1 | % | 6.9 | % | ||||||||||||||||||
| U.S. | 8.6 | % | 7.6 | % | 7.3 | % | 7.7 | % | ||||||||||||||||||
| International | 10.1 | % | 3.4 | % | 8.7 | % | 6.2 | % | ||||||||||||||||||
Note: Percentages are based on actual, non-rounded figures and may not sum |
||||||||||||||||||||||||||
(A) NON-GAAP FINANCIAL MEASURE “Adjusted operational sales growth" excludes acquisitions, divestitures and translational currency and is a non-GAAP financial measure. Investors should consider non-GAAP financial measures in addition to, and not as replacements for, or superior to, measures of financial performance prepared in accordance with GAAP. Due to the variable nature of acquisitions and divestitures, and the impact they may have on the analysis of underlying business performance and trends, management believes that providing this measure enhances an investor’s understanding of the Company’s performance and may assist in the evaluation of ongoing business operations period over period. This non-GAAP financial measure is presented to permit investors to more fully understand how management assesses the performance of the Company, including for internal evaluation of the performance of the Company's businesses and planning and forecasting for future periods. The use of this non-GAAP financial measure as a performance measure is limited in that it provides a view of the Company's results of operations without including all events during a period and may not provide a comparable view of the Company's performance to that of other companies in the health care industry. | ||||||||||||||||||||||||||
| Johnson & Johnson | |||||||||||||||||||||||||||||
| Segment Sales | |||||||||||||||||||||||||||||
| (Dollars in Millions) | |||||||||||||||||||||||||||||
| SECOND QUARTER | |||||||||||||||||||||||||||||
| % Change | |||||||||||||||||||||||||||||
| 2023 | 2022 | Reported | Operational (1) |
Currency | |||||||||||||||||||||||||
CONSUMER HEALTH SEGMENT (2) |
|||||||||||||||||||||||||||||
| OTC | |||||||||||||||||||||||||||||
| US | $ | 712 | 663 | 7.5 | % | 7.5 | % | — | % | ||||||||||||||||||||
| Intl | 947 | 818 | 15.7 | 19.0 | (3.3) | ||||||||||||||||||||||||
| WW | 1,659 | 1,482 | 12.0 | 13.9 | (1.9) | ||||||||||||||||||||||||
| SKIN HEALTH / BEAUTY | |||||||||||||||||||||||||||||
| US | 650 | 629 | 3.4 | 3.4 | — | ||||||||||||||||||||||||
| Intl | 498 | 497 | 0.3 | 3.8 | (3.5) | ||||||||||||||||||||||||
| WW | 1,148 | 1,126 | 2.0 | 3.5 | (1.5) | ||||||||||||||||||||||||
| ORAL CARE | |||||||||||||||||||||||||||||
| US | 173 | 170 | 1.7 | 1.7 | — | ||||||||||||||||||||||||
| Intl | 225 | 224 | 0.3 | 3.4 | (3.1) | ||||||||||||||||||||||||
| WW | 398 | 394 | 0.9 | 2.7 | (1.8) | ||||||||||||||||||||||||
| BABY CARE | |||||||||||||||||||||||||||||
| US | 99 | 88 | 12.5 | 12.5 | — | ||||||||||||||||||||||||
| Intl | 261 | 287 | (9.1) | (4.0) | (5.1) | ||||||||||||||||||||||||
| WW | 360 | 375 | (4.0) | (0.2) | (3.8) | ||||||||||||||||||||||||
| WOMEN'S HEALTH | |||||||||||||||||||||||||||||
| US | 4 | 3 | (2.1) | (2.1) | — | ||||||||||||||||||||||||
| Intl | 235 | 228 | 3.5 | 10.2 | (6.7) | ||||||||||||||||||||||||
| WW | 238 | 230 | 3.4 | 10.0 | (6.6) | ||||||||||||||||||||||||
| WOUND CARE / OTHER | |||||||||||||||||||||||||||||
| US | 149 | 133 | 12.3 | 12.3 | — | ||||||||||||||||||||||||
| Intl | 58 | 65 | (10.3) | (4.6) | (5.7) | ||||||||||||||||||||||||
| WW | 207 | 197 | 4.9 | 6.8 | (1.9) | ||||||||||||||||||||||||
| TOTAL CONSUMER HEALTH | |||||||||||||||||||||||||||||
| US | 1,787 | 1,687 | 6.0 | 6.0 | — | ||||||||||||||||||||||||
| Intl | 2,224 | 2,118 | 5.0 | 9.0 | (4.0) | ||||||||||||||||||||||||
| WW | $ | 4,011 | 3,805 | 5.4 | % | 7.7 | % | (2.3) | % | ||||||||||||||||||||
| See footnotes at end of schedule | |||||||||||||||||||||||||||||
| Johnson & Johnson | |||||||||||||||||||||||||||||
| Segment Sales | |||||||||||||||||||||||||||||
| (Dollars in Millions) | |||||||||||||||||||||||||||||
| SECOND QUARTER | |||||||||||||||||||||||||||||
| % Change | |||||||||||||||||||||||||||||
| 2023 | 2022 | Reported | Operational (1) |
Currency | |||||||||||||||||||||||||
PHARMACEUTICAL SEGMENT (2) (3) |
|||||||||||||||||||||||||||||
| IMMUNOLOGY | |||||||||||||||||||||||||||||
| US | $ | 2,865 | 2,853 | 0.4 | % | 0.4 | % | — | % | ||||||||||||||||||||
| Intl | 1,631 | 1,559 | 4.7 | 6.6 | (1.9) | ||||||||||||||||||||||||
| WW | 4,496 | 4,411 | 1.9 | 2.6 | (0.7) | ||||||||||||||||||||||||
REMICADE |
|||||||||||||||||||||||||||||
| US | 277 | 391 | (29.3) | (29.3) | — | ||||||||||||||||||||||||
US Exports (4) |
33 | 44 | (24.9) | (24.9) | — | ||||||||||||||||||||||||
| Intl | 152 | 212 | (28.2) | (25.2) | (3.0) | ||||||||||||||||||||||||
| WW | 462 | 647 | (28.6) | (27.6) | (1.0) | ||||||||||||||||||||||||
SIMPONI / SIMPONI ARIA |
|||||||||||||||||||||||||||||
| US | 285 | 301 | (5.1) | (5.1) | — | ||||||||||||||||||||||||
| Intl | 244 | 266 | (8.2) | (4.3) | (3.9) | ||||||||||||||||||||||||
| WW | 529 | 566 | (6.6) | (4.7) | (1.9) | ||||||||||||||||||||||||
STELARA |
|||||||||||||||||||||||||||||
| US | 1,817 | 1,731 | 4.9 | 4.9 | — | ||||||||||||||||||||||||
| Intl | 981 | 868 | 13.0 | 14.1 | (1.1) | ||||||||||||||||||||||||
| WW | 2,797 | 2,599 | 7.6 | 8.0 | (0.4) | ||||||||||||||||||||||||
TREMFYA |
|||||||||||||||||||||||||||||
| US | 450 | 382 | 17.8 | 17.8 | — | ||||||||||||||||||||||||
| Intl | 255 | 214 | 19.4 | 21.0 | (1.6) | ||||||||||||||||||||||||
| WW | 706 | 597 | 18.3 | 18.9 | (0.6) | ||||||||||||||||||||||||
OTHER IMMUNOLOGY |
|||||||||||||||||||||||||||||
| US | 4 | 3 | 17.8 | 17.8 | — | ||||||||||||||||||||||||
| Intl | 0 | 0 | — | — | — | ||||||||||||||||||||||||
| WW | 4 | 3 | 17.8 | 17.8 | — | ||||||||||||||||||||||||
| INFECTIOUS DISEASES | |||||||||||||||||||||||||||||
| US | 395 | 415 | (4.9) | (4.9) | — | ||||||||||||||||||||||||
| Intl | 727 | 901 | (19.4) | (22.0) | 2.6 | ||||||||||||||||||||||||
| WW | 1,121 | 1,316 | (14.8) | (16.6) | 1.8 | ||||||||||||||||||||||||
COVID-19 VACCINE |
|||||||||||||||||||||||||||||
| US | — | 45 | * | * | — | ||||||||||||||||||||||||
| Intl | 285 | 499 | (43.0) | (47.4) | 4.4 | ||||||||||||||||||||||||
| WW | 285 | 544 | (47.7) | (51.8) | 4.1 | ||||||||||||||||||||||||
EDURANT / rilpivirine |
|||||||||||||||||||||||||||||
| US | 8 | 9 | (9.0) | (9.0) | — | ||||||||||||||||||||||||
| Intl | 258 | 215 | 19.9 | 17.3 | 2.6 | ||||||||||||||||||||||||
| WW | 266 | 225 | 18.6 | 16.2 | 2.4 | ||||||||||||||||||||||||
PREZISTA / PREZCOBIX / REZOLSTA / SYMTUZA |
|||||||||||||||||||||||||||||
| US | 382 | 355 | 7.6 | 7.6 | — | ||||||||||||||||||||||||
| Intl | 109 | 110 | (0.2) | (1.0) | 0.8 | ||||||||||||||||||||||||
| WW | 491 | 464 | 5.8 | 5.6 | 0.2 | ||||||||||||||||||||||||
OTHER INFECTIOUS DISEASES |
|||||||||||||||||||||||||||||
| US | 5 | 6 | (27.2) | (27.2) | — | ||||||||||||||||||||||||
| Intl | 74 | 77 | (3.5) | 3.6 | (7.1) | ||||||||||||||||||||||||
| WW | 79 | 83 | (5.2) | 1.3 | (6.5) | ||||||||||||||||||||||||
| See footnotes at end of schedule | |||||||||||||||||||||||||||||
| Johnson & Johnson | |||||||||||||||||||||||||||||
| Segment Sales | |||||||||||||||||||||||||||||
| (Dollars in Millions) | |||||||||||||||||||||||||||||
| SECOND QUARTER | |||||||||||||||||||||||||||||
| % Change | |||||||||||||||||||||||||||||
| 2023 | 2022 | Reported | Operational (1) |
Currency | |||||||||||||||||||||||||
PHARMACEUTICAL SEGMENT (2) (3) (Continued) |
|||||||||||||||||||||||||||||
| NEUROSCIENCE | |||||||||||||||||||||||||||||
| US | $ | 1,029 | 896 | 14.9% | 14.9% | —% | |||||||||||||||||||||||
| Intl | 764 | 837 | (8.8) | (4.6) | (4.2) | ||||||||||||||||||||||||
| WW | 1,793 | 1,734 | 3.5 | 5.5 | (2.0) | ||||||||||||||||||||||||
CONCERTA / methylphenidate |
|||||||||||||||||||||||||||||
| US | 64 | 38 | 68.2 | 68.2 | — | ||||||||||||||||||||||||
| Intl | 143 | 123 | 16.3 | 21.3 | (5.0) | ||||||||||||||||||||||||
| WW | 208 | 161 | 28.6 | 32.4 | (3.8) | ||||||||||||||||||||||||
INVEGA SUSTENNA / XEPLION / INVEGA |
|||||||||||||||||||||||||||||
TRINZA / TREVICTA |
|||||||||||||||||||||||||||||
| US | 721 | 691 | 4.3 | 4.3 | — | ||||||||||||||||||||||||
| Intl | 310 | 362 | (14.4) | (12.6) | (1.8) | ||||||||||||||||||||||||
| WW | 1,031 | 1,054 | (2.1) | (1.5) | (0.6) | ||||||||||||||||||||||||
SPRAVATO |
|||||||||||||||||||||||||||||
| US | 144 | 74 | 93.2 | 93.2 | — | ||||||||||||||||||||||||
| Intl | 25 | 11 | * | * | * | ||||||||||||||||||||||||
| WW | 169 | 85 | 98.2 | 98.5 | (0.3) | ||||||||||||||||||||||||
OTHER NEUROSCIENCE |
|||||||||||||||||||||||||||||
| US | 100 | 93 | 9.3 | 9.3 | — | ||||||||||||||||||||||||
| Intl | 286 | 341 | (16.4) | (9.9) | (6.5) | ||||||||||||||||||||||||
| WW | 386 | 433 | (10.9) | (5.8) | (5.1) | ||||||||||||||||||||||||
| ONCOLOGY | |||||||||||||||||||||||||||||
| US | 2,069 | 1,679 | 23.2 | 23.2 | — | ||||||||||||||||||||||||
| Intl | 2,329 | 2,362 | (1.4) | 0.1 | (1.5) | ||||||||||||||||||||||||
| WW | 4,398 | 4,042 | 8.8 | 9.7 | (0.9) | ||||||||||||||||||||||||
CARVYKTI |
|||||||||||||||||||||||||||||
| US | 114 | 24 | * | * | — | ||||||||||||||||||||||||
| Intl | 3 | — | * | * | * | ||||||||||||||||||||||||
| WW | 117 | 24 | * | * | * | ||||||||||||||||||||||||
DARZALEX |
|||||||||||||||||||||||||||||
| US | 1,322 | 1,021 | 29.5 | 29.5 | — | ||||||||||||||||||||||||
| Intl | 1,110 | 965 | 15.0 | 17.0 | (2.0) | ||||||||||||||||||||||||
| WW | 2,431 | 1,986 | 22.4 | 23.4 | (1.0) | ||||||||||||||||||||||||
ERLEADA |
|||||||||||||||||||||||||||||
| US | 241 | 233 | 3.6 | 3.6 | — | ||||||||||||||||||||||||
| Intl | 326 | 218 | 49.7 | 51.7 | (2.0) | ||||||||||||||||||||||||
| WW | 567 | 450 | 25.9 | 26.9 | (1.0) | ||||||||||||||||||||||||
IMBRUVICA |
|||||||||||||||||||||||||||||
| US | 262 | 349 | (24.9) | (24.9) | — | ||||||||||||||||||||||||
| Intl | 579 | 620 | (6.7) | (5.7) | (1.0) | ||||||||||||||||||||||||
| WW | 841 | 970 | (13.2) | (12.6) | (0.6) | ||||||||||||||||||||||||
ZYTIGA / abiraterone acetate |
|||||||||||||||||||||||||||||
| US | 9 | 19 | (55.2) | (55.2) | — | ||||||||||||||||||||||||
| Intl | 218 | 486 | (55.1) | (53.8) | (1.3) | ||||||||||||||||||||||||
| WW | 227 | 505 | (55.1) | (53.8) | (1.3) | ||||||||||||||||||||||||
OTHER ONCOLOGY |
|||||||||||||||||||||||||||||
| US | 122 | 33 | * | * | — | ||||||||||||||||||||||||
| Intl | 92 | 72 | 27.8 | 29.4 | (1.6) | ||||||||||||||||||||||||
| WW | 214 | 106 | * | * | * | ||||||||||||||||||||||||
See footnotes at end of schedule |
|||||||||||||||||||||||||||||
| Johnson & Johnson | |||||||||||||||||||||||||||||
| Segment Sales | |||||||||||||||||||||||||||||
| (Dollars in Millions) | |||||||||||||||||||||||||||||
| SECOND QUARTER | |||||||||||||||||||||||||||||
| % Change | |||||||||||||||||||||||||||||
| 2023 | 2022 | Reported | Operational (1) |
Currency | |||||||||||||||||||||||||
PHARMACEUTICAL SEGMENT (2) (3) (Continued) |
|||||||||||||||||||||||||||||
| PULMONARY HYPERTENSION | |||||||||||||||||||||||||||||
| US | $ | 684 | 560 | 22.0 | % | 22.0 | % | — | % | ||||||||||||||||||||
| Intl | 289 | 284 | 2.0 | 5.7 | (3.7) | ||||||||||||||||||||||||
| WW | 972 | 843 | 15.3 | 16.5 | (1.2) | ||||||||||||||||||||||||
OPSUMIT |
|||||||||||||||||||||||||||||
| US | 328 | 265 | 23.7 | 23.7 | — | ||||||||||||||||||||||||
| Intl | 179 | 173 | 3.4 | 6.0 | (2.6) | ||||||||||||||||||||||||
| WW | 507 | 438 | 15.7 | 16.7 | (1.0) | ||||||||||||||||||||||||
UPTRAVI |
|||||||||||||||||||||||||||||
| US | 338 | 272 | 24.2 | 24.2 | — | ||||||||||||||||||||||||
| Intl | 61 | 56 | 10.0 | 14.1 | (4.1) | ||||||||||||||||||||||||
| WW | 399 | 328 | 21.8 | 22.5 | (0.7) | ||||||||||||||||||||||||
OTHER PULMONARY HYPERTENSION |
|||||||||||||||||||||||||||||
| US | 18 | 23 | (23.8) | (23.8) | — | ||||||||||||||||||||||||
| Intl | 48 | 55 | (10.9) | (3.7) | (7.2) | ||||||||||||||||||||||||
| WW | 66 | 78 | (14.7) | (9.7) | (5.0) | ||||||||||||||||||||||||
| CARDIOVASCULAR / METABOLISM / OTHER | |||||||||||||||||||||||||||||
| US | 776 | 757 | 2.6 | 2.6 | — | ||||||||||||||||||||||||
| Intl | 174 | 215 | (19.0) | (18.3) | (0.7) | ||||||||||||||||||||||||
| WW | 950 | 972 | (2.2) | (2.0) | (0.2) | ||||||||||||||||||||||||
XARELTO |
|||||||||||||||||||||||||||||
| US | 637 | 609 | 4.7 | 4.7 | — | ||||||||||||||||||||||||
| Intl | — | — | — | — | — | ||||||||||||||||||||||||
| WW | 637 | 609 | 4.7 | 4.7 | — | ||||||||||||||||||||||||
OTHER |
|||||||||||||||||||||||||||||
| US | 138 | 148 | (6.3) | (6.3) | — | ||||||||||||||||||||||||
| Intl | 174 | 215 | (19.0) | (18.3) | (0.7) | ||||||||||||||||||||||||
| WW | 313 | 363 | (13.8) | (13.4) | (0.4) | ||||||||||||||||||||||||
| TOTAL PHARMACEUTICAL | |||||||||||||||||||||||||||||
| US | 7,818 | 7,159 | 9.2 | 9.2 | — | ||||||||||||||||||||||||
| Intl | 5,913 | 6,158 | (4.0) | (2.5) | (1.5) | ||||||||||||||||||||||||
| WW | $ | 13,731 | 13,317 | 3.1 | % | 3.8 | % | (0.7) | % | ||||||||||||||||||||
See footnotes at end of schedule |
|||||||||||||||||||||||||||||
| Johnson & Johnson | |||||||||||||||||||||||||||||
| Segment Sales | |||||||||||||||||||||||||||||
| (Dollars in Millions) | |||||||||||||||||||||||||||||
| SECOND QUARTER | |||||||||||||||||||||||||||||
| % Change | |||||||||||||||||||||||||||||
| 2023 | 2022 | Reported | Operational (1) |
Currency | |||||||||||||||||||||||||
MEDTECH SEGMENT (2) (3) |
|||||||||||||||||||||||||||||
| INTERVENTIONAL SOLUTIONS | |||||||||||||||||||||||||||||
| US | $ | 908 | 525 | 73.1 | % | 73.1 | % | — | % | ||||||||||||||||||||
| Intl | 712 | 525 | 35.7 | 40.7 | (5.0) | ||||||||||||||||||||||||
| WW | 1,620 | 1,049 | 54.4 | 56.9 | (2.5) | ||||||||||||||||||||||||
| ELECTROPHYSIOLOGY | |||||||||||||||||||||||||||||
| US | 609 | 499 | 22.0 | 22.0 | — | ||||||||||||||||||||||||
| Intl | 587 | 469 | 25.1 | 30.0 | (4.9) | ||||||||||||||||||||||||
| WW | 1,196 | 968 | 23.5 | 25.9 | (2.4) | ||||||||||||||||||||||||
| ABIOMED | |||||||||||||||||||||||||||||
| US | 272 | — | * | * | — | ||||||||||||||||||||||||
| Intl | 59 | — | * | * | * | ||||||||||||||||||||||||
| WW | 331 | — | * | * | * | ||||||||||||||||||||||||
| OTHER INTERVENTIONAL SOLUTIONS | |||||||||||||||||||||||||||||
| US | 27 | 26 | 4.5 | 4.5 | — | ||||||||||||||||||||||||
| Intl | 67 | 56 | 20.0 | 25.3 | (5.3) | ||||||||||||||||||||||||
| WW | 93 | 81 | 15.1 | 18.8 | (3.7) | ||||||||||||||||||||||||
| ORTHOPAEDICS | |||||||||||||||||||||||||||||
| US | 1,388 | 1,338 | 3.7 | 3.7 | — | ||||||||||||||||||||||||
| Intl | 878 | 820 | 7.0 | 9.0 | (2.0) | ||||||||||||||||||||||||
| WW | 2,265 | 2,157 | 5.0 | 5.7 | (0.7) | ||||||||||||||||||||||||
HIPS |
|||||||||||||||||||||||||||||
| US | 250 | 240 | 4.1 | 4.1 | — | ||||||||||||||||||||||||
| Intl | 147 | 148 | (0.8) | 1.2 | (2.0) | ||||||||||||||||||||||||
| WW | 397 | 388 | 2.2 | 3.0 | (0.8) | ||||||||||||||||||||||||
KNEES |
|||||||||||||||||||||||||||||
| US | 221 | 216 | 2.4 | 2.4 | — | ||||||||||||||||||||||||
| Intl | 142 | 133 | 6.3 | 8.0 | (1.7) | ||||||||||||||||||||||||
| WW | 363 | 349 | 3.9 | 4.5 | (0.6) | ||||||||||||||||||||||||
TRAUMA |
|||||||||||||||||||||||||||||
| US | 483 | 464 | 4.3 | 4.3 | — | ||||||||||||||||||||||||
| Intl | 255 | 232 | 9.9 | 10.9 | (1.0) | ||||||||||||||||||||||||
| WW | 739 | 696 | 6.1 | 6.5 | (0.4) | ||||||||||||||||||||||||
SPINE, SPORTS & OTHER |
|||||||||||||||||||||||||||||
| US | 433 | 418 | 3.5 | 3.5 | — | ||||||||||||||||||||||||
| Intl | 334 | 306 | 9.0 | 11.6 | (2.6) | ||||||||||||||||||||||||
| WW | 766 | 724 | 5.8 | 7.0 | (1.2) | ||||||||||||||||||||||||
| See footnotes at end of schedule | |||||||||||||||||||||||||||||
| Johnson & Johnson | |||||||||||||||||||||||||||||
| Segment Sales | |||||||||||||||||||||||||||||
| (Dollars in Millions) | |||||||||||||||||||||||||||||
| SECOND QUARTER | |||||||||||||||||||||||||||||
| % Change | |||||||||||||||||||||||||||||
| 2023 | 2022 | Reported | Operational (1) |
Currency | |||||||||||||||||||||||||
MEDTECH SEGMENT (2) (3) (Continued) |
|||||||||||||||||||||||||||||
| SURGERY | |||||||||||||||||||||||||||||
| US | $ | 1,015 | 992 | 2.2 | % | 2.2 | % | — | % | ||||||||||||||||||||
| Intl | 1,580 | 1,458 | 8.4 | 12.6 | (4.2) | ||||||||||||||||||||||||
| WW | 2,594 | 2,450 | 5.9 | 8.4 | (2.5) | ||||||||||||||||||||||||
ADVANCED |
|||||||||||||||||||||||||||||
| US | 466 | 454 | 2.7 | 2.7 | — | ||||||||||||||||||||||||
| Intl | 757 | 702 | 7.8 | 12.1 | (4.3) | ||||||||||||||||||||||||
| WW | 1,222 | 1,156 | 5.8 | 8.4 | (2.6) | ||||||||||||||||||||||||
GENERAL |
|||||||||||||||||||||||||||||
| US | 548 | 538 | 1.9 | 1.9 | — | ||||||||||||||||||||||||
| Intl | 823 | 756 | 8.9 | 13.1 | (4.2) | ||||||||||||||||||||||||
| WW | 1,372 | 1,294 | 6.0 | 8.4 | (2.4) | ||||||||||||||||||||||||
| VISION | |||||||||||||||||||||||||||||
| US | 529 | 496 | 6.6 | 6.6 | — | ||||||||||||||||||||||||
| Intl | 778 | 745 | 4.6 | 7.1 | (2.5) | ||||||||||||||||||||||||
| WW | 1,308 | 1,241 | 5.4 | 6.9 | (1.5) | ||||||||||||||||||||||||
CONTACT LENSES / OTHER |
|||||||||||||||||||||||||||||
| US | 409 | 374 | 9.1 | 9.1 | — | ||||||||||||||||||||||||
| Intl | 530 | 519 | 2.2 | 4.8 | (2.6) | ||||||||||||||||||||||||
| WW | 939 | 894 | 5.1 | 6.6 | (1.5) | ||||||||||||||||||||||||
SURGICAL |
|||||||||||||||||||||||||||||
| US | 120 | 122 | (1.1) | (1.1) | — | ||||||||||||||||||||||||
| Intl | 249 | 225 | 10.1 | 12.3 | (2.2) | ||||||||||||||||||||||||
| WW | 369 | 347 | 6.2 | 7.6 | (1.4) | ||||||||||||||||||||||||
| TOTAL MEDTECH | |||||||||||||||||||||||||||||
| US | 3,839 | 3,351 | 14.6 | 14.6 | — | ||||||||||||||||||||||||
| Intl | 3,949 | 3,547 | 11.3 | 14.7 | (3.4) | ||||||||||||||||||||||||
| WW | $ | 7,788 | 6,898 | 12.9 | % | 14.7 | % | (1.8) | % | ||||||||||||||||||||
| See footnotes at end of schedule | |||||||||||||||||||||||||||||
| Johnson & Johnson | |||||||||||||||||||||||||||||
| Segment Sales | |||||||||||||||||||||||||||||
| (Dollars in Millions) | |||||||||||||||||||||||||||||
| SIX MONTHS | |||||||||||||||||||||||||||||
| % Change | |||||||||||||||||||||||||||||
| 2023 | 2022 | Reported | Operational (1) |
Currency | |||||||||||||||||||||||||
CONSUMER HEALTH SEGMENT (2) |
|||||||||||||||||||||||||||||
| OTC | |||||||||||||||||||||||||||||
| US | $ | 1,457 | 1,333 | 9.3 | % | 9.3 | % | — | % | ||||||||||||||||||||
| Intl | 1,844 | 1,609 | 14.6 | 19.4 | (4.8) | ||||||||||||||||||||||||
| WW | 3,301 | 2,943 | 12.2 | 14.8 | (2.6) | ||||||||||||||||||||||||
| SKIN HEALTH / BEAUTY | |||||||||||||||||||||||||||||
| US | 1,267 | 1,173 | 8.0 | 8.0 | — | ||||||||||||||||||||||||
| Intl | 991 | 965 | 2.7 | 8.1 | (5.4) | ||||||||||||||||||||||||
| WW | 2,258 | 2,138 | 5.6 | 8.0 | (2.4) | ||||||||||||||||||||||||
| ORAL CARE | |||||||||||||||||||||||||||||
| US | 332 | 313 | 6.2 | 6.2 | — | ||||||||||||||||||||||||
| Intl | 427 | 447 | (4.7) | (0.3) | (4.4) | ||||||||||||||||||||||||
| WW | 759 | 760 | (0.2) | 2.4 | (2.6) | ||||||||||||||||||||||||
| BABY CARE | |||||||||||||||||||||||||||||
| US | 195 | 173 | 12.7 | 12.7 | — | ||||||||||||||||||||||||
| Intl | 524 | 557 | (6.0) | 0.1 | (6.1) | ||||||||||||||||||||||||
| WW | 719 | 730 | (1.6) | 3.1 | (4.7) | ||||||||||||||||||||||||
| WOMEN'S HEALTH | |||||||||||||||||||||||||||||
| US | 7 | 7 | (0.1) | (0.1) | — | ||||||||||||||||||||||||
| Intl | 449 | 452 | (0.7) | 7.2 | (7.9) | ||||||||||||||||||||||||
| WW | 455 | 458 | (0.6) | 7.1 | (7.7) | ||||||||||||||||||||||||
| WOUND CARE / OTHER | |||||||||||||||||||||||||||||
| US | 264 | 245 | 7.9 | 7.9 | — | ||||||||||||||||||||||||
| Intl | 107 | 117 | (8.4) | (1.5) | (6.9) | ||||||||||||||||||||||||
| WW | 371 | 361 | 2.6 | 4.9 | (2.3) | ||||||||||||||||||||||||
| TOTAL CONSUMER HEALTH | |||||||||||||||||||||||||||||
| US | 3,522 | 3,244 | 8.6 | 8.6 | — | ||||||||||||||||||||||||
| Intl | 4,341 | 4,147 | 4.7 | 10.1 | (5.4) | ||||||||||||||||||||||||
| WW | $ | 7,863 | 7,391 | 6.4 | % | 9.5 | % | (3.1) | % | ||||||||||||||||||||
| See footnotes at end of schedule | |||||||||||||||||||||||||||||
| Johnson & Johnson | |||||||||||||||||||||||||||||
| Segment Sales | |||||||||||||||||||||||||||||
| (Dollars in Millions) | |||||||||||||||||||||||||||||
| SIX MONTHS | |||||||||||||||||||||||||||||
| % Change | |||||||||||||||||||||||||||||
| 2023 | 2022 | Reported | Operational (1) |
Currency | |||||||||||||||||||||||||
PHARMACEUTICAL SEGMENT (2) (3) |
|||||||||||||||||||||||||||||
| IMMUNOLOGY | |||||||||||||||||||||||||||||
| US | $ | 5,313 | 5,354 | (0.8) | % | (0.8) | % | — | % | ||||||||||||||||||||
| Intl | 3,295 | 3,176 | 3.8 | 8.2 | (4.4) | ||||||||||||||||||||||||
| WW | 8,608 | 8,530 | 0.9 | 2.6 | (1.7) | ||||||||||||||||||||||||
REMICADE |
|||||||||||||||||||||||||||||
| US | 553 | 749 | (26.2) | (26.2) | — | ||||||||||||||||||||||||
US Exports (4) |
74 | 124 | (40.3) | (40.3) | — | ||||||||||||||||||||||||
| Intl | 322 | 437 | (26.2) | (22.5) | (3.7) | ||||||||||||||||||||||||
| WW | 949 | 1,310 | (27.5) | (26.3) | (1.2) | ||||||||||||||||||||||||
SIMPONI / SIMPONI ARIA |
|||||||||||||||||||||||||||||
| US | 556 | 588 | (5.4) | (5.4) | — | ||||||||||||||||||||||||
| Intl | 510 | 549 | (7.1) | (1.1) | (6.0) | ||||||||||||||||||||||||
| WW | 1,066 | 1,137 | (6.2) | (3.3) | (2.9) | ||||||||||||||||||||||||
STELARA |
|||||||||||||||||||||||||||||
| US | 3,268 | 3,110 | 5.1 | 5.1 | — | ||||||||||||||||||||||||
| Intl | 1,974 | 1,777 | 11.1 | 15.2 | (4.1) | ||||||||||||||||||||||||
| WW | 5,241 | 4,887 | 7.2 | 8.7 | (1.5) | ||||||||||||||||||||||||
TREMFYA |
|||||||||||||||||||||||||||||
| US | 856 | 773 | 10.7 | 10.7 | — | ||||||||||||||||||||||||
| Intl | 489 | 413 | 18.4 | 22.8 | (4.4) | ||||||||||||||||||||||||
| WW | 1,346 | 1,187 | 13.4 | 15.0 | (1.6) | ||||||||||||||||||||||||
OTHER IMMUNOLOGY |
|||||||||||||||||||||||||||||
| US | 7 | 9 | (30.2) | (30.2) | — | ||||||||||||||||||||||||
| Intl | 0 | 0 | — | — | — | ||||||||||||||||||||||||
| WW | 7 | 9 | (30.2) | (30.2) | — | ||||||||||||||||||||||||
| INFECTIOUS DISEASES | |||||||||||||||||||||||||||||
| US | 787 | 876 | (10.2) | (10.2) | — | ||||||||||||||||||||||||
| Intl | 1,920 | 1,737 | 10.5 | 12.3 | (1.8) | ||||||||||||||||||||||||
| WW | 2,707 | 2,613 | 3.6 | 4.7 | (1.1) | ||||||||||||||||||||||||
COVID-19 VACCINE |
|||||||||||||||||||||||||||||
| US | — | 120 | * | * | — | ||||||||||||||||||||||||
| Intl | 1,032 | 881 | 17.1 | 18.4 | (1.3) | ||||||||||||||||||||||||
| WW | 1,032 | 1,001 | 3.0 | 4.2 | (1.2) | ||||||||||||||||||||||||
EDURANT / rilpivirine |
|||||||||||||||||||||||||||||
| US | 17 | 18 | (5.3) | (5.3) | — | ||||||||||||||||||||||||
| Intl | 529 | 454 | 16.4 | 18.0 | (1.6) | ||||||||||||||||||||||||
| WW | 546 | 473 | 15.6 | 17.1 | (1.5) | ||||||||||||||||||||||||
PREZISTA / PREZCOBIX / REZOLSTA / SYMTUZA |
|||||||||||||||||||||||||||||
| US | 760 | 724 | 5.0 | 5.0 | — | ||||||||||||||||||||||||
| Intl | 208 | 242 | (13.9) | (12.1) | (1.8) | ||||||||||||||||||||||||
| WW | 968 | 965 | 0.3 | 0.7 | (0.4) | ||||||||||||||||||||||||
OTHER INFECTIOUS DISEASES |
|||||||||||||||||||||||||||||
| US | 10 | 14 | (30.6) | (30.6) | — | ||||||||||||||||||||||||
| Intl | 151 | 160 | (5.6) | (1.2) | (4.4) | ||||||||||||||||||||||||
| WW | 161 | 174 | (7.6) | (3.6) | (4.0) | ||||||||||||||||||||||||
| See footnotes at end of schedule | |||||||||||||||||||||||||||||
| Johnson & Johnson | |||||||||||||||||||||||||||||
| Segment Sales | |||||||||||||||||||||||||||||
| (Dollars in Millions) | |||||||||||||||||||||||||||||
| SIX MONTHS | |||||||||||||||||||||||||||||
| % Change | |||||||||||||||||||||||||||||
| 2023 | 2022 | Reported | Operational (1) |
Currency | |||||||||||||||||||||||||
PHARMACEUTICAL SEGMENT (2) (3) (Continued) |
|||||||||||||||||||||||||||||
| NEUROSCIENCE | |||||||||||||||||||||||||||||
| US | $ | 2,007 | 1,739 | 15.4% | 15.4% | —% | |||||||||||||||||||||||
| Intl | 1,590 | 1,735 | (8.4) | (3.8) | (4.6) | ||||||||||||||||||||||||
| WW | 3,597 | 3,475 | 3.5 | 5.8 | (2.3) | ||||||||||||||||||||||||
CONCERTA / methylphenidate |
|||||||||||||||||||||||||||||
| US | 134 | 73 | 84.0 | 84.0 | — | ||||||||||||||||||||||||
| Intl | 279 | 245 | 13.9 | 20.7 | (6.8) | ||||||||||||||||||||||||
| WW | 414 | 318 | 30.0 | 35.3 | (5.3) | ||||||||||||||||||||||||
INVEGA SUSTENNA / XEPLION / INVEGA |
|||||||||||||||||||||||||||||
TRINZA / TREVICTA |
|||||||||||||||||||||||||||||
| US | 1,434 | 1,352 | 6.0 | 6.0 | — | ||||||||||||||||||||||||
| Intl | 641 | 749 | (14.5) | (10.7) | (3.8) | ||||||||||||||||||||||||
| WW | 2,075 | 2,102 | (1.3) | 0.1 | (1.4) | ||||||||||||||||||||||||
SPRAVATO |
|||||||||||||||||||||||||||||
| US | 255 | 135 | 88.3 | 88.3 | — | ||||||||||||||||||||||||
| Intl | 45 | 20 | * | * | * | ||||||||||||||||||||||||
| WW | 300 | 155 | 93.1 | 93.8 | (0.7) | ||||||||||||||||||||||||
OTHER NEUROSCIENCE |
|||||||||||||||||||||||||||||
| US | 184 | 179 | 3.1 | 3.1 | — | ||||||||||||||||||||||||
| Intl | 625 | 721 | (13.4) | (8.7) | (4.7) | ||||||||||||||||||||||||
| WW | 809 | 900 | (10.1) | (6.4) | (3.7) | ||||||||||||||||||||||||
| ONCOLOGY | |||||||||||||||||||||||||||||
| US | 3,958 | 3,261 | 21.4 | 21.4 | — | ||||||||||||||||||||||||
| Intl | 4,552 | 4,731 | (3.8) | 0.0 | (3.8) | ||||||||||||||||||||||||
| WW | 8,510 | 7,992 | 6.5 | 8.8 | (2.3) | ||||||||||||||||||||||||
CARVYKTI |
|||||||||||||||||||||||||||||
| US | 184 | 24 | * | * | — | ||||||||||||||||||||||||
| Intl | 5 | — | * | * | * | ||||||||||||||||||||||||
| WW | 189 | 24 | * | * | * | ||||||||||||||||||||||||
DARZALEX |
|||||||||||||||||||||||||||||
| US | 2,513 | 1,974 | 27.3 | 27.3 | — | ||||||||||||||||||||||||
| Intl | 2,182 | 1,868 | 16.8 | 21.5 | (4.7) | ||||||||||||||||||||||||
| WW | 4,695 | 3,842 | 22.2 | 24.5 | (2.3) | ||||||||||||||||||||||||
ERLEADA |
|||||||||||||||||||||||||||||
| US | 490 | 439 | 11.8 | 11.8 | — | ||||||||||||||||||||||||
| Intl | 619 | 412 | 50.3 | 55.9 | (5.6) | ||||||||||||||||||||||||
| WW | 1,109 | 850 | 30.4 | 33.2 | (2.8) | ||||||||||||||||||||||||
IMBRUVICA |
|||||||||||||||||||||||||||||
| US | 532 | 719 | (26.0) | (26.0) | — | ||||||||||||||||||||||||
| Intl | 1,136 | 1,288 | (11.8) | (8.8) | (3.0) | ||||||||||||||||||||||||
| WW | 1,668 | 2,008 | (16.9) | (15.0) | (1.9) | ||||||||||||||||||||||||
ZYTIGA / abiraterone acetate |
|||||||||||||||||||||||||||||
| US | 25 | 38 | (34.7) | (34.7) | — | ||||||||||||||||||||||||
| Intl | 447 | 1,006 | (55.6) | (53.0) | (2.6) | ||||||||||||||||||||||||
| WW | 472 | 1,044 | (54.8) | (52.3) | (2.5) | ||||||||||||||||||||||||
OTHER ONCOLOGY |
|||||||||||||||||||||||||||||
| US | 214 | 67 | * | * | — | ||||||||||||||||||||||||
| Intl | 162 | 156 | 3.6 | 7.1 | (3.5) | ||||||||||||||||||||||||
| WW | 376 | 224 | 68.0 | 70.4 | (2.4) | ||||||||||||||||||||||||
See footnotes at end of schedule |
|||||||||||||||||||||||||||||
| Johnson & Johnson | |||||||||||||||||||||||||||||
| Segment Sales | |||||||||||||||||||||||||||||
| (Dollars in Millions) | |||||||||||||||||||||||||||||
| SIX MONTHS | |||||||||||||||||||||||||||||
| % Change | |||||||||||||||||||||||||||||
| 2023 | 2022 | Reported | Operational (1) |
Currency | |||||||||||||||||||||||||
PHARMACEUTICAL SEGMENT (2) (3) (Continued) |
|||||||||||||||||||||||||||||
| PULMONARY HYPERTENSION | |||||||||||||||||||||||||||||
| US | $ | 1,284 | 1,132 | 13.4 | % | 13.4 | % | — | % | ||||||||||||||||||||
| Intl | 561 | 563 | (0.4) | 5.5 | (5.9) | ||||||||||||||||||||||||
| WW | 1,844 | 1,695 | 8.8 | 10.8 | (2.0) | ||||||||||||||||||||||||
OPSUMIT |
|||||||||||||||||||||||||||||
| US | 601 | 538 | 11.6 | 11.6 | — | ||||||||||||||||||||||||
| Intl | 346 | 343 | 0.9 | 6.1 | (5.2) | ||||||||||||||||||||||||
| WW | 947 | 881 | 7.5 | 9.5 | (2.0) | ||||||||||||||||||||||||
UPTRAVI |
|||||||||||||||||||||||||||||
| US | 642 | 541 | 18.7 | 18.7 | — | ||||||||||||||||||||||||
| Intl | 119 | 112 | 6.6 | 11.7 | (5.1) | ||||||||||||||||||||||||
| WW | 761 | 653 | 16.6 | 17.5 | (0.9) | ||||||||||||||||||||||||
OTHER PULMONARY HYPERTENSION |
|||||||||||||||||||||||||||||
| US | 41 | 53 | (23.0) | (23.0) | — | ||||||||||||||||||||||||
| Intl | 95 | 108 | (11.7) | (2.8) | (8.9) | ||||||||||||||||||||||||
| WW | 136 | 161 | (15.5) | (9.5) | (6.0) | ||||||||||||||||||||||||
| CARDIOVASCULAR / METABOLISM / OTHER | |||||||||||||||||||||||||||||
| US | 1,491 | 1,429 | 4.3 | 4.3 | — | ||||||||||||||||||||||||
| Intl | 386 | 453 | (14.7) | (12.0) | (2.7) | ||||||||||||||||||||||||
| WW | 1,877 | 1,882 | (0.3) | 0.4 | (0.7) | ||||||||||||||||||||||||
XARELTO |
|||||||||||||||||||||||||||||
| US | 1,215 | 1,117 | 8.8 | 8.8 | — | ||||||||||||||||||||||||
| Intl | — | — | — | — | — | ||||||||||||||||||||||||
| WW | 1,215 | 1,117 | 8.8 | 8.8 | — | ||||||||||||||||||||||||
OTHER |
|||||||||||||||||||||||||||||
| US | 275 | 312 | (11.8) | (11.8) | — | ||||||||||||||||||||||||
| Intl | 386 | 453 | (14.7) | (12.0) | (2.7) | ||||||||||||||||||||||||
| WW | 662 | 765 | (13.5) | (11.9) | (1.6) | ||||||||||||||||||||||||
| TOTAL PHARMACEUTICAL | |||||||||||||||||||||||||||||
| US | 14,841 | 13,791 | 7.6 | 7.6 | — | ||||||||||||||||||||||||
| Intl | 12,303 | 12,395 | (0.7) | 3.1 | (3.8) | ||||||||||||||||||||||||
| WW | $ | 27,144 | 26,186 | 3.7 | % | 5.5 | % | (1.8) | % | ||||||||||||||||||||
See footnotes at end of schedule |
|||||||||||||||||||||||||||||
| Johnson & Johnson | |||||||||||||||||||||||||||||
| Segment Sales | |||||||||||||||||||||||||||||
| (Dollars in Millions) | |||||||||||||||||||||||||||||
| SIX MONTHS | |||||||||||||||||||||||||||||
| % Change | |||||||||||||||||||||||||||||
| 2023 | 2022 | Reported | Operational (1) |
Currency | |||||||||||||||||||||||||
MEDTECH SEGMENT (2) (3) |
|||||||||||||||||||||||||||||
| INTERVENTIONAL SOLUTIONS | |||||||||||||||||||||||||||||
| US | $ | 1,771 | 1,019 | 73.8 | % | 73.8 | % | — | % | ||||||||||||||||||||
| Intl | 1,352 | 1,123 | 20.5 | 27.0 | (6.5) | ||||||||||||||||||||||||
| WW | 3,123 | 2,141 | 45.8 | 49.3 | (3.5) | ||||||||||||||||||||||||
| ELECTROPHYSIOLOGY | |||||||||||||||||||||||||||||
| US | 1,180 | 969 | 21.7 | 21.7 | — | ||||||||||||||||||||||||
| Intl | 1,109 | 1,001 | 10.8 | 17.3 | (6.5) | ||||||||||||||||||||||||
| WW | 2,288 | 1,970 | 16.2 | 19.5 | (3.3) | ||||||||||||||||||||||||
| ABIOMED | |||||||||||||||||||||||||||||
| US | 536 | — | * | * | — | ||||||||||||||||||||||||
| Intl | 119 | — | * | * | * | ||||||||||||||||||||||||
| WW | 655 | — | * | * | * | ||||||||||||||||||||||||
| OTHER INTERVENTIONAL SOLUTIONS | |||||||||||||||||||||||||||||
| US | 55 | 51 | 10.8 | 10.8 | — | ||||||||||||||||||||||||
| Intl | 125 | 121 | 2.8 | 8.9 | (6.1) | ||||||||||||||||||||||||
| WW | 180 | 171 | 5.1 | 9.5 | (4.4) | ||||||||||||||||||||||||
| ORTHOPAEDICS | |||||||||||||||||||||||||||||
| US | 2,751 | 2,627 | 4.7 | 4.7 | — | ||||||||||||||||||||||||
| Intl | 1,759 | 1,719 | 2.3 | 6.4 | (4.1) | ||||||||||||||||||||||||
| WW | 4,510 | 4,345 | 3.8 | 5.4 | (1.6) | ||||||||||||||||||||||||
HIPS |
|||||||||||||||||||||||||||||
| US | 491 | 465 | 5.6 | 5.6 | — | ||||||||||||||||||||||||
| Intl | 296 | 312 | (5.1) | (1.3) | (3.8) | ||||||||||||||||||||||||
| WW | 787 | 777 | 1.3 | 2.8 | (1.5) | ||||||||||||||||||||||||
KNEES |
|||||||||||||||||||||||||||||
| US | 447 | 417 | 7.2 | 7.2 | — | ||||||||||||||||||||||||
| Intl | 284 | 271 | 4.8 | 8.8 | (4.0) | ||||||||||||||||||||||||
| WW | 731 | 688 | 6.3 | 7.9 | (1.6) | ||||||||||||||||||||||||
TRAUMA |
|||||||||||||||||||||||||||||
| US | 974 | 939 | 3.7 | 3.7 | — | ||||||||||||||||||||||||
| Intl | 522 | 505 | 3.2 | 7.0 | (3.8) | ||||||||||||||||||||||||
| WW | 1,496 | 1,444 | 3.6 | 4.9 | (1.3) | ||||||||||||||||||||||||
SPINE, SPORTS & OTHER |
|||||||||||||||||||||||||||||
| US | 839 | 805 | 4.1 | 4.1 | — | ||||||||||||||||||||||||
| Intl | 657 | 630 | 4.2 | 8.7 | (4.5) | ||||||||||||||||||||||||
| WW | 1,495 | 1,436 | 4.2 | 6.1 | (1.9) | ||||||||||||||||||||||||
| See footnotes at end of schedule | |||||||||||||||||||||||||||||
| Johnson & Johnson | |||||||||||||||||||||||||||||
| Segment Sales | |||||||||||||||||||||||||||||
| (Dollars in Millions) | |||||||||||||||||||||||||||||
| SIX MONTHS | |||||||||||||||||||||||||||||
| % Change | |||||||||||||||||||||||||||||
| 2023 | 2022 | Reported | Operational (1) |
Currency | |||||||||||||||||||||||||
MEDTECH SEGMENT (2) (3) (Continued) |
|||||||||||||||||||||||||||||
| SURGERY | |||||||||||||||||||||||||||||
| US | $ | 1,990 | 1,913 | 4.0 | % | 4.0 | % | — | % | ||||||||||||||||||||
| Intl | 3,039 | 2,971 | 2.3 | 7.7 | (5.4) | ||||||||||||||||||||||||
| WW | 5,028 | 4,884 | 3.0 | 6.3 | (3.3) | ||||||||||||||||||||||||
ADVANCED |
|||||||||||||||||||||||||||||
| US | 910 | 871 | 4.5 | 4.5 | — | ||||||||||||||||||||||||
| Intl | 1,430 | 1,431 | 0.0 | 5.3 | (5.3) | ||||||||||||||||||||||||
| WW | 2,340 | 2,302 | 1.7 | 5.0 | (3.3) | ||||||||||||||||||||||||
GENERAL |
|||||||||||||||||||||||||||||
| US | 1,079 | 1,042 | 3.6 | 3.6 | — | ||||||||||||||||||||||||
| Intl | 1,608 | 1,540 | 4.5 | 10.0 | (5.5) | ||||||||||||||||||||||||
| WW | 2,688 | 2,582 | 4.1 | 7.4 | (3.3) | ||||||||||||||||||||||||
| VISION | |||||||||||||||||||||||||||||
| US | 1,087 | 1,017 | 6.9 | 6.9 | — | ||||||||||||||||||||||||
| Intl | 1,521 | 1,481 | 2.7 | 7.5 | (4.8) | ||||||||||||||||||||||||
| WW | 2,608 | 2,498 | 4.4 | 7.2 | (2.8) | ||||||||||||||||||||||||
CONTACT LENSES / OTHER |
|||||||||||||||||||||||||||||
| US | 853 | 774 | 10.1 | 10.1 | — | ||||||||||||||||||||||||
| Intl | 1,039 | 1,030 | 0.9 | 6.3 | (5.4) | ||||||||||||||||||||||||
| WW | 1,892 | 1,804 | 4.9 | 8.0 | (3.1) | ||||||||||||||||||||||||
SURGICAL |
|||||||||||||||||||||||||||||
| US | 234 | 243 | (3.6) | (3.6) | — | ||||||||||||||||||||||||
| Intl | 482 | 451 | 6.7 | 10.2 | (3.5) | ||||||||||||||||||||||||
| WW | 716 | 694 | 3.1 | 5.4 | (2.3) | ||||||||||||||||||||||||
| TOTAL MEDTECH | |||||||||||||||||||||||||||||
| US | 7,598 | 6,576 | 15.5 | 15.5 | — | ||||||||||||||||||||||||
| Intl | 7,671 | 7,293 | 5.2 | 10.3 | (5.1) | ||||||||||||||||||||||||
| WW | $ | 15,269 | 13,869 | 10.1 | % | 12.8 | % | (2.7) | % | ||||||||||||||||||||
| See footnotes at end of schedule | |||||||||||||||||||||||||||||
Note: Column and rows within tables may not add due to rounding. Percentages have been calculated using actual, non- | |||||||||||||||||||||||||||||
| rounded figures and, therefore, may not recalculate precisely. | |||||||||||||||||||||||||||||
| * Percentage greater than 100% or not meaningful | |||||||||||||||||||||||||||||
(1) Operational growth excludes the effect of translational currency |
|||||||||||||||||||||||||||||
(2) Unaudited |
|||||||||||||||||||||||||||||
(3) Certain prior year amounts have been reclassified to conform to current year product disclosures | |||||||||||||||||||||||||||||
(4) Reported as U.S. sales | |||||||||||||||||||||||||||||
| Supplemental Sales Reconciliation (Unaudited) | ||||||||||||||||||||||||||||||||||||||
| (Dollars in Millions) | ||||||||||||||||||||||||||||||||||||||
| SECOND QUARTER | ||||||||||||||||||||||||||||||||||||||
| Percent Change | ||||||||||||||||||||||||||||||||||||||
| 2023 | 2022 | Total | Operations | Currency | ||||||||||||||||||||||||||||||||||
| Pharmaceutical | ||||||||||||||||||||||||||||||||||||||
| U.S. | $ | 7,818 | 7,159 | 9.2 | % | 9.2 | - | |||||||||||||||||||||||||||||||
| International | 5,913 | 6,158 | (4.0) | (2.5) | (1.5) | |||||||||||||||||||||||||||||||||
| Worldwide | 13,731 | 13,317 | 3.1 | 3.8 | (0.7) | |||||||||||||||||||||||||||||||||
| COVID-19 Vaccine | ||||||||||||||||||||||||||||||||||||||
| U.S. | - | 45 | * | * | - | |||||||||||||||||||||||||||||||||
| International | 285 | 499 | (43.0) | (47.4) | 4.4 | |||||||||||||||||||||||||||||||||
| Worldwide | 285 | 544 | (47.7) | (51.8) | 4.1 | |||||||||||||||||||||||||||||||||
| Pharmaceutical excluding COVID-19 Vaccine | ||||||||||||||||||||||||||||||||||||||
| U.S. | 7,818 | 7,114 | 9.9 | 9.9 | - | |||||||||||||||||||||||||||||||||
| International | 5,628 | 5,659 | (0.5) | 1.5 | (2.0) | |||||||||||||||||||||||||||||||||
| Worldwide | 13,446 | 12,773 | 5.3 | 6.2 | (0.9) | |||||||||||||||||||||||||||||||||
| Worldwide | ||||||||||||||||||||||||||||||||||||||
| U.S. | 13,444 | 12,197 | 10.2 | 10.2 | - | |||||||||||||||||||||||||||||||||
| International | 12,086 | 11,823 | 2.2 | 4.7 | (2.5) | |||||||||||||||||||||||||||||||||
| Worldwide | 25,530 | 24,020 | 6.3 | 7.5 | (1.2) | |||||||||||||||||||||||||||||||||
| COVID-19 Vaccine | ||||||||||||||||||||||||||||||||||||||
| U.S. | - | 45 | * | * | - | |||||||||||||||||||||||||||||||||
| International | 285 | 499 | (43.0) | (47.4) | 4.4 | |||||||||||||||||||||||||||||||||
| Worldwide | 285 | 544 | (47.7) | (51.8) | 4.1 | |||||||||||||||||||||||||||||||||
| Worldwide | ||||||||||||||||||||||||||||||||||||||
| U.S. | 13,444 | 12,152 | 10.6 | 10.6 | - | |||||||||||||||||||||||||||||||||
| International | 11,801 | 11,324 | 4.2 | 7.0 | (2.8) | |||||||||||||||||||||||||||||||||
| Worldwide excluding COVID-19 Vaccine | $ | 25,245 | 23,476 | 7.5 | % | 8.9 | (1.4) | |||||||||||||||||||||||||||||||
| Note: Columns and rows within tables may not add due to rounding | ||||||||||||||||||||||||||||||||||||||
| * Percentage greater than 100% or not meaningful | ||||||||||||||||||||||||||||||||||||||
| Supplemental Sales Reconciliation (Unaudited) | ||||||||||||||||||||||||||||||||||||||
| (Dollars in Millions) | ||||||||||||||||||||||||||||||||||||||
| SIX MONTHS | ||||||||||||||||||||||||||||||||||||||
| Percent Change | ||||||||||||||||||||||||||||||||||||||
| 2022 | 2021 | Total | Operations | Currency | ||||||||||||||||||||||||||||||||||
| Pharmaceutical | ||||||||||||||||||||||||||||||||||||||
| U.S. | $ | 14,841 | 13,791 | 7.6 | % | 7.6 | - | |||||||||||||||||||||||||||||||
| International | 12,303 | 12,395 | (0.7) | 3.1 | (3.8) | |||||||||||||||||||||||||||||||||
| Worldwide | 27,144 | 26,186 | 3.7 | 5.5 | (1.8) | |||||||||||||||||||||||||||||||||
| COVID-19 Vaccine | ||||||||||||||||||||||||||||||||||||||
| U.S. | - | 120 | * | * | - | |||||||||||||||||||||||||||||||||
| International | 1,032 | 881 | 17.1 | 18.4 | (1.3) | |||||||||||||||||||||||||||||||||
| Worldwide | 1,032 | 1,001 | 3.0 | 4.2 | (1.2) | |||||||||||||||||||||||||||||||||
| Pharmaceutical excluding COVID-19 Vaccine | ||||||||||||||||||||||||||||||||||||||
| U.S. | 14,841 | 13,671 | 8.6 | 8.6 | - | |||||||||||||||||||||||||||||||||
| International | 11,271 | 11,514 | (2.1) | 1.9 | (4.0) | |||||||||||||||||||||||||||||||||
| Worldwide | 26,112 | 25,185 | 3.7 | 5.5 | (1.8) | |||||||||||||||||||||||||||||||||
| Worldwide | ||||||||||||||||||||||||||||||||||||||
| U.S. | 25,961 | 23,611 | 10.0 | 10.0 | - | |||||||||||||||||||||||||||||||||
| International | 24,315 | 23,835 | 2.0 | 6.5 | (4.5) | |||||||||||||||||||||||||||||||||
| Worldwide | 50,276 | 47,446 | 6.0 | 8.2 | (2.2) | |||||||||||||||||||||||||||||||||
| COVID-19 Vaccine | ||||||||||||||||||||||||||||||||||||||
| U.S. | - | 120 | * | * | - | |||||||||||||||||||||||||||||||||
| International | 1,032 | 881 | 17.1 | 18.4 | (1.3) | |||||||||||||||||||||||||||||||||
| Worldwide | 1,032 | 1,001 | 3.0 | 4.2 | (1.2) | |||||||||||||||||||||||||||||||||
| Worldwide | ||||||||||||||||||||||||||||||||||||||
| U.S. | 25,961 | 23,491 | 10.5 | 10.5 | - | |||||||||||||||||||||||||||||||||
| International | 23,283 | 22,954 | 1.4 | 6.1 | (4.7) | |||||||||||||||||||||||||||||||||
| Worldwide excluding COVID-19 Vaccine | $ | 49,244 | 46,445 | 6.0 | % | 8.3 | (2.3) | |||||||||||||||||||||||||||||||
| Note: Columns and rows within tables may not add due to rounding | ||||||||||||||||||||||||||||||||||||||
| * Percentage greater than 100% or not meaningful | ||||||||||||||||||||||||||||||||||||||