false2025Q312/310000109380http://fasb.org/us-gaap/2025#OtherAssetshttp://fasb.org/us-gaap/2025#OtherAssetshttp://fasb.org/us-gaap/2025#OtherAssetshttp://fasb.org/us-gaap/2025#OtherAssetshttp://fasb.org/us-gaap/2025#PropertyPlantAndEquipmentAndFinanceLeaseRightOfUseAssetAfterAccumulatedDepreciationAndAmortizationhttp://fasb.org/us-gaap/2025#PropertyPlantAndEquipmentAndFinanceLeaseRightOfUseAssetAfterAccumulatedDepreciationAndAmortizationhttp://fasb.org/us-gaap/2025#OtherLiabilitieshttp://fasb.org/us-gaap/2025#OtherLiabilitieshttp://fasb.org/us-gaap/2025#LongTermDebtAndCapitalLeaseObligationshttp://fasb.org/us-gaap/2025#LongTermDebtAndCapitalLeaseObligationsxbrli:sharesiso4217:USDiso4217:USDxbrli:shareszions:statezions:segmentzions:securityxbrli:purezions:branchzions:case00001093802025-01-012025-09-300000109380us-gaap:CommonStockMember2025-01-012025-09-300000109380zions:SeriesAFloatingRateNonCumulativePerpetualPreferredStockMember2025-01-012025-09-3000001093802025-10-3100001093802025-09-3000001093802024-12-3100001093802025-07-012025-09-3000001093802024-07-012024-09-3000001093802024-01-012024-09-300000109380us-gaap:PreferredStockMember2025-06-300000109380us-gaap:CommonStockMember2025-06-300000109380us-gaap:AdditionalPaidInCapitalMember2025-06-300000109380us-gaap:RetainedEarningsMember2025-06-300000109380us-gaap:AccumulatedOtherComprehensiveIncomeMember2025-06-3000001093802025-06-300000109380us-gaap:RetainedEarningsMember2025-07-012025-09-300000109380us-gaap:AccumulatedOtherComprehensiveIncomeMember2025-07-012025-09-300000109380us-gaap:CommonStockMember2025-07-012025-09-300000109380us-gaap:AdditionalPaidInCapitalMember2025-07-012025-09-300000109380us-gaap:PreferredStockMember2025-09-300000109380us-gaap:CommonStockMember2025-09-300000109380us-gaap:AdditionalPaidInCapitalMember2025-09-300000109380us-gaap:RetainedEarningsMember2025-09-300000109380us-gaap:AccumulatedOtherComprehensiveIncomeMember2025-09-300000109380us-gaap:PreferredStockMember2024-06-300000109380us-gaap:CommonStockMember2024-06-300000109380us-gaap:AdditionalPaidInCapitalMember2024-06-300000109380us-gaap:RetainedEarningsMember2024-06-300000109380us-gaap:AccumulatedOtherComprehensiveIncomeMember2024-06-3000001093802024-06-300000109380us-gaap:RetainedEarningsMember2024-07-012024-09-300000109380us-gaap:AccumulatedOtherComprehensiveIncomeMember2024-07-012024-09-300000109380us-gaap:CommonStockMember2024-07-012024-09-300000109380us-gaap:AdditionalPaidInCapitalMember2024-07-012024-09-300000109380us-gaap:PreferredStockMember2024-09-300000109380us-gaap:CommonStockMember2024-09-300000109380us-gaap:AdditionalPaidInCapitalMember2024-09-300000109380us-gaap:RetainedEarningsMember2024-09-300000109380us-gaap:AccumulatedOtherComprehensiveIncomeMember2024-09-3000001093802024-09-300000109380us-gaap:PreferredStockMember2024-12-310000109380us-gaap:CommonStockMember2024-12-310000109380us-gaap:AdditionalPaidInCapitalMember2024-12-310000109380us-gaap:RetainedEarningsMember2024-12-310000109380us-gaap:AccumulatedOtherComprehensiveIncomeMember2024-12-310000109380us-gaap:RetainedEarningsMember2025-01-012025-09-300000109380us-gaap:AccumulatedOtherComprehensiveIncomeMember2025-01-012025-09-300000109380us-gaap:CommonStockMember2025-01-012025-09-300000109380us-gaap:AdditionalPaidInCapitalMember2025-01-012025-09-300000109380us-gaap:PreferredStockMember2023-12-310000109380us-gaap:CommonStockMember2023-12-310000109380us-gaap:AdditionalPaidInCapitalMember2023-12-310000109380us-gaap:RetainedEarningsMember2023-12-310000109380us-gaap:AccumulatedOtherComprehensiveIncomeMember2023-12-3100001093802023-12-310000109380us-gaap:RetainedEarningsMember2024-01-012024-09-300000109380us-gaap:AccumulatedOtherComprehensiveIncomeMember2024-01-012024-09-300000109380us-gaap:CommonStockMember2024-01-012024-09-300000109380us-gaap:AdditionalPaidInCapitalMember2024-01-012024-09-300000109380zions:TradingSecuritiesMemberus-gaap:FairValueInputsLevel1Member2025-09-300000109380zions:TradingSecuritiesMemberus-gaap:FairValueInputsLevel2Member2025-09-300000109380zions:TradingSecuritiesMemberus-gaap:FairValueInputsLevel3Member2025-09-300000109380zions:TradingSecuritiesMember2025-09-300000109380us-gaap:USTreasurySecuritiesMemberus-gaap:FairValueInputsLevel1Member2025-09-300000109380us-gaap:USTreasurySecuritiesMemberus-gaap:FairValueInputsLevel2Member2025-09-300000109380us-gaap:USTreasurySecuritiesMemberus-gaap:FairValueInputsLevel3Member2025-09-300000109380us-gaap:USTreasurySecuritiesMember2025-09-300000109380us-gaap:USStatesAndPoliticalSubdivisionsMemberus-gaap:FairValueInputsLevel1Member2025-09-300000109380us-gaap:USStatesAndPoliticalSubdivisionsMemberus-gaap:FairValueInputsLevel2Member2025-09-300000109380us-gaap:USStatesAndPoliticalSubdivisionsMemberus-gaap:FairValueInputsLevel3Member2025-09-300000109380us-gaap:USStatesAndPoliticalSubdivisionsMember2025-09-300000109380us-gaap:OtherDebtSecuritiesMemberus-gaap:FairValueInputsLevel1Member2025-09-300000109380us-gaap:OtherDebtSecuritiesMemberus-gaap:FairValueInputsLevel2Member2025-09-300000109380us-gaap:OtherDebtSecuritiesMemberus-gaap:FairValueInputsLevel3Member2025-09-300000109380us-gaap:OtherDebtSecuritiesMember2025-09-300000109380zions:DebtSecuritiesAvailableForSaleExcludingAccruedInterestMemberus-gaap:FairValueInputsLevel1Member2025-09-300000109380zions:DebtSecuritiesAvailableForSaleExcludingAccruedInterestMemberus-gaap:FairValueInputsLevel2Member2025-09-300000109380zions:DebtSecuritiesAvailableForSaleExcludingAccruedInterestMemberus-gaap:FairValueInputsLevel3Member2025-09-300000109380zions:DebtSecuritiesAvailableForSaleExcludingAccruedInterestMember2025-09-300000109380zions:FinancingReceivableHeldForSaleMemberus-gaap:FairValueInputsLevel1Member2025-09-300000109380zions:FinancingReceivableHeldForSaleMemberus-gaap:FairValueInputsLevel2Member2025-09-300000109380zions:FinancingReceivableHeldForSaleMemberus-gaap:FairValueInputsLevel3Member2025-09-300000109380zions:FinancingReceivableHeldForSaleMember2025-09-300000109380zions:BankownedlifeinsuranceMemberus-gaap:FairValueInputsLevel1Member2025-09-300000109380zions:BankownedlifeinsuranceMemberus-gaap:FairValueInputsLevel2Member2025-09-300000109380zions:BankownedlifeinsuranceMemberus-gaap:FairValueInputsLevel3Member2025-09-300000109380zions:BankownedlifeinsuranceMember2025-09-300000109380us-gaap:PrivateEquityFundsMemberus-gaap:FairValueInputsLevel1Member2025-09-300000109380us-gaap:PrivateEquityFundsMemberus-gaap:FairValueInputsLevel2Member2025-09-300000109380us-gaap:PrivateEquityFundsMemberus-gaap:FairValueInputsLevel3Member2025-09-300000109380us-gaap:PrivateEquityFundsMember2025-09-300000109380us-gaap:InterestOnlyStripMemberus-gaap:FairValueInputsLevel1Member2025-09-300000109380us-gaap:InterestOnlyStripMemberus-gaap:FairValueInputsLevel2Member2025-09-300000109380us-gaap:InterestOnlyStripMemberus-gaap:FairValueInputsLevel3Member2025-09-300000109380us-gaap:InterestOnlyStripMember2025-09-300000109380us-gaap:WarrantyRightsAndObligationsFairValueOptionMemberus-gaap:FairValueInputsLevel1Memberus-gaap:DeferredCompensationArrangementWithIndividualByTypeOfCompensationPensionAndOtherPostretirementBenefitsMember2025-09-300000109380us-gaap:WarrantyRightsAndObligationsFairValueOptionMemberus-gaap:FairValueInputsLevel2Memberus-gaap:DeferredCompensationArrangementWithIndividualByTypeOfCompensationPensionAndOtherPostretirementBenefitsMember2025-09-300000109380us-gaap:WarrantyRightsAndObligationsFairValueOptionMemberus-gaap:FairValueInputsLevel3Memberus-gaap:DeferredCompensationArrangementWithIndividualByTypeOfCompensationPensionAndOtherPostretirementBenefitsMember2025-09-300000109380us-gaap:WarrantyRightsAndObligationsFairValueOptionMemberus-gaap:DeferredCompensationArrangementWithIndividualByTypeOfCompensationPensionAndOtherPostretirementBenefitsMember2025-09-300000109380us-gaap:DerivativeMemberus-gaap:FairValueInputsLevel1Member2025-09-300000109380us-gaap:DerivativeMemberus-gaap:FairValueInputsLevel2Member2025-09-300000109380us-gaap:DerivativeMemberus-gaap:FairValueInputsLevel3Member2025-09-300000109380us-gaap:DerivativeMember2025-09-300000109380us-gaap:FairValueInputsLevel1Member2025-09-300000109380us-gaap:FairValueInputsLevel2Member2025-09-300000109380us-gaap:FairValueInputsLevel3Member2025-09-300000109380zions:TradingSecuritiesMemberus-gaap:FairValueInputsLevel1Member2024-12-310000109380zions:TradingSecuritiesMemberus-gaap:FairValueInputsLevel2Member2024-12-310000109380zions:TradingSecuritiesMemberus-gaap:FairValueInputsLevel3Member2024-12-310000109380zions:TradingSecuritiesMember2024-12-310000109380us-gaap:USTreasurySecuritiesMemberus-gaap:FairValueInputsLevel1Member2024-12-310000109380us-gaap:USTreasurySecuritiesMemberus-gaap:FairValueInputsLevel2Member2024-12-310000109380us-gaap:USTreasurySecuritiesMemberus-gaap:FairValueInputsLevel3Member2024-12-310000109380us-gaap:USTreasurySecuritiesMember2024-12-310000109380us-gaap:USStatesAndPoliticalSubdivisionsMemberus-gaap:FairValueInputsLevel1Member2024-12-310000109380us-gaap:USStatesAndPoliticalSubdivisionsMemberus-gaap:FairValueInputsLevel2Member2024-12-310000109380us-gaap:USStatesAndPoliticalSubdivisionsMemberus-gaap:FairValueInputsLevel3Member2024-12-310000109380us-gaap:USStatesAndPoliticalSubdivisionsMember2024-12-310000109380us-gaap:OtherDebtSecuritiesMemberus-gaap:FairValueInputsLevel1Member2024-12-310000109380us-gaap:OtherDebtSecuritiesMemberus-gaap:FairValueInputsLevel2Member2024-12-310000109380us-gaap:OtherDebtSecuritiesMemberus-gaap:FairValueInputsLevel3Member2024-12-310000109380us-gaap:OtherDebtSecuritiesMember2024-12-310000109380zions:DebtSecuritiesAvailableForSaleExcludingAccruedInterestMemberus-gaap:FairValueInputsLevel1Member2024-12-310000109380zions:DebtSecuritiesAvailableForSaleExcludingAccruedInterestMemberus-gaap:FairValueInputsLevel2Member2024-12-310000109380zions:DebtSecuritiesAvailableForSaleExcludingAccruedInterestMemberus-gaap:FairValueInputsLevel3Member2024-12-310000109380zions:DebtSecuritiesAvailableForSaleExcludingAccruedInterestMember2024-12-310000109380zions:FinancingReceivableHeldForSaleMemberus-gaap:FairValueInputsLevel1Member2024-12-310000109380zions:FinancingReceivableHeldForSaleMemberus-gaap:FairValueInputsLevel2Member2024-12-310000109380zions:FinancingReceivableHeldForSaleMemberus-gaap:FairValueInputsLevel3Member2024-12-310000109380zions:FinancingReceivableHeldForSaleMember2024-12-310000109380zions:BankownedlifeinsuranceMemberus-gaap:FairValueInputsLevel1Member2024-12-310000109380zions:BankownedlifeinsuranceMemberus-gaap:FairValueInputsLevel2Member2024-12-310000109380zions:BankownedlifeinsuranceMemberus-gaap:FairValueInputsLevel3Member2024-12-310000109380zions:BankownedlifeinsuranceMember2024-12-310000109380us-gaap:PrivateEquityFundsMemberus-gaap:FairValueInputsLevel1Member2024-12-310000109380us-gaap:PrivateEquityFundsMemberus-gaap:FairValueInputsLevel2Member2024-12-310000109380us-gaap:PrivateEquityFundsMemberus-gaap:FairValueInputsLevel3Member2024-12-310000109380us-gaap:PrivateEquityFundsMember2024-12-310000109380us-gaap:InterestOnlyStripMemberus-gaap:FairValueInputsLevel1Member2024-12-310000109380us-gaap:InterestOnlyStripMemberus-gaap:FairValueInputsLevel2Member2024-12-310000109380us-gaap:InterestOnlyStripMemberus-gaap:FairValueInputsLevel3Member2024-12-310000109380us-gaap:InterestOnlyStripMember2024-12-310000109380us-gaap:WarrantyRightsAndObligationsFairValueOptionMemberus-gaap:FairValueInputsLevel1Memberus-gaap:DeferredCompensationArrangementWithIndividualByTypeOfCompensationPensionAndOtherPostretirementBenefitsMember2024-12-310000109380us-gaap:WarrantyRightsAndObligationsFairValueOptionMemberus-gaap:FairValueInputsLevel2Memberus-gaap:DeferredCompensationArrangementWithIndividualByTypeOfCompensationPensionAndOtherPostretirementBenefitsMember2024-12-310000109380us-gaap:WarrantyRightsAndObligationsFairValueOptionMemberus-gaap:FairValueInputsLevel3Memberus-gaap:DeferredCompensationArrangementWithIndividualByTypeOfCompensationPensionAndOtherPostretirementBenefitsMember2024-12-310000109380us-gaap:WarrantyRightsAndObligationsFairValueOptionMemberus-gaap:DeferredCompensationArrangementWithIndividualByTypeOfCompensationPensionAndOtherPostretirementBenefitsMember2024-12-310000109380us-gaap:DerivativeMemberus-gaap:FairValueInputsLevel1Member2024-12-310000109380us-gaap:DerivativeMemberus-gaap:FairValueInputsLevel2Member2024-12-310000109380us-gaap:DerivativeMemberus-gaap:FairValueInputsLevel3Member2024-12-310000109380us-gaap:DerivativeMember2024-12-310000109380us-gaap:FairValueInputsLevel1Member2024-12-310000109380us-gaap:FairValueInputsLevel2Member2024-12-310000109380us-gaap:FairValueInputsLevel3Member2024-12-310000109380us-gaap:PrivateEquityFundsMemberus-gaap:FairValueInputsLevel3Member2025-06-300000109380us-gaap:ServicingContractsMemberus-gaap:FairValueInputsLevel3Member2025-06-300000109380us-gaap:PrivateEquityFundsMemberus-gaap:FairValueInputsLevel3Member2024-06-300000109380us-gaap:ServicingContractsMemberus-gaap:FairValueInputsLevel3Member2024-06-300000109380us-gaap:PrivateEquityFundsMemberus-gaap:FairValueInputsLevel3Member2024-12-310000109380us-gaap:ServicingContractsMemberus-gaap:FairValueInputsLevel3Member2024-12-310000109380us-gaap:PrivateEquityFundsMemberus-gaap:FairValueInputsLevel3Member2023-12-310000109380us-gaap:ServicingContractsMemberus-gaap:FairValueInputsLevel3Member2023-12-310000109380us-gaap:PrivateEquityFundsMemberus-gaap:FairValueInputsLevel3Member2025-07-012025-09-300000109380us-gaap:ServicingContractsMemberus-gaap:FairValueInputsLevel3Member2025-07-012025-09-300000109380us-gaap:PrivateEquityFundsMemberus-gaap:FairValueInputsLevel3Member2024-07-012024-09-300000109380us-gaap:ServicingContractsMemberus-gaap:FairValueInputsLevel3Member2024-07-012024-09-300000109380us-gaap:PrivateEquityFundsMemberus-gaap:FairValueInputsLevel3Member2025-01-012025-09-300000109380us-gaap:ServicingContractsMemberus-gaap:FairValueInputsLevel3Member2025-01-012025-09-300000109380us-gaap:PrivateEquityFundsMemberus-gaap:FairValueInputsLevel3Member2024-01-012024-09-300000109380us-gaap:ServicingContractsMemberus-gaap:FairValueInputsLevel3Member2024-01-012024-09-300000109380us-gaap:PrivateEquityFundsMemberus-gaap:FairValueInputsLevel3Member2025-09-300000109380us-gaap:ServicingContractsMemberus-gaap:FairValueInputsLevel3Member2025-09-300000109380us-gaap:PrivateEquityFundsMemberus-gaap:FairValueInputsLevel3Member2024-09-300000109380us-gaap:ServicingContractsMemberus-gaap:FairValueInputsLevel3Member2024-09-300000109380us-gaap:FairValueInputsLevel3Member2025-07-012025-09-300000109380us-gaap:FairValueInputsLevel3Member2024-07-012024-09-300000109380us-gaap:FairValueInputsLevel3Member2025-01-012025-09-300000109380us-gaap:FairValueInputsLevel3Member2024-01-012024-09-300000109380zions:CollateralDependentLoansMemberus-gaap:FairValueMeasurementsNonrecurringMemberus-gaap:FairValueInputsLevel2Member2025-09-300000109380zions:CollateralDependentLoansMemberus-gaap:FairValueMeasurementsNonrecurringMemberus-gaap:FairValueInputsLevel2Member2025-07-012025-09-300000109380us-gaap:CarryingReportedAmountFairValueDisclosureMemberus-gaap:FairValueInputsLevel2Member2025-09-300000109380us-gaap:EstimateOfFairValueFairValueDisclosureMemberus-gaap:FairValueInputsLevel2Member2025-09-300000109380us-gaap:CarryingReportedAmountFairValueDisclosureMemberus-gaap:FairValueInputsLevel2Member2024-12-310000109380us-gaap:EstimateOfFairValueFairValueDisclosureMemberus-gaap:FairValueInputsLevel2Member2024-12-310000109380us-gaap:CarryingReportedAmountFairValueDisclosureMemberus-gaap:FairValueInputsLevel3Member2025-09-300000109380us-gaap:EstimateOfFairValueFairValueDisclosureMemberus-gaap:FairValueInputsLevel3Member2025-09-300000109380us-gaap:CarryingReportedAmountFairValueDisclosureMemberus-gaap:FairValueInputsLevel3Member2024-12-310000109380us-gaap:EstimateOfFairValueFairValueDisclosureMemberus-gaap:FairValueInputsLevel3Member2024-12-310000109380us-gaap:AssetPledgedAsCollateralMember2025-09-300000109380us-gaap:AssetPledgedAsCollateralMember2024-12-310000109380zions:FixedRateAvailableForSaleSecuritiesMember2025-01-012025-09-300000109380zions:FixedRateAvailableForSaleSecuritiesMember2024-01-012024-12-310000109380us-gaap:AgencySecuritiesMember2025-09-300000109380zions:AgencyGuaranteedMortgageBackedSecuritiesMember2025-09-300000109380zions:SmallBusinessAdministrationLoanBackedSecuritiesMember2025-09-300000109380zions:AvailableforsaleOtherdebtsecuritiesMember2025-09-300000109380us-gaap:AgencySecuritiesMember2024-12-310000109380zions:AgencyGuaranteedMortgageBackedSecuritiesMember2024-12-310000109380zions:SmallBusinessAdministrationLoanBackedSecuritiesMember2024-12-310000109380zions:AvailableforsaleOtherdebtsecuritiesMember2024-12-310000109380zions:AvailableForSaleUnrealizedGainsOtherMembersrt:MaximumMember2025-09-300000109380zions:AvailableForSaleUnrealizedGainsOtherMembersrt:MaximumMember2024-12-310000109380zions:TaxableMember2025-07-012025-09-300000109380zions:NontaxableMember2025-07-012025-09-300000109380zions:TaxableMember2024-07-012024-09-300000109380zions:NontaxableMember2024-07-012024-09-300000109380zions:TaxableMember2025-01-012025-09-300000109380zions:NontaxableMember2025-01-012025-09-300000109380zions:TaxableMember2024-01-012024-09-300000109380zions:NontaxableMember2024-01-012024-09-300000109380us-gaap:CommercialPortfolioSegmentMemberzions:CommercialAndIndustrialMember2025-09-300000109380us-gaap:CommercialPortfolioSegmentMemberzions:CommercialAndIndustrialMember2024-12-310000109380us-gaap:CommercialPortfolioSegmentMemberzions:OwnerOccupiedMember2025-09-300000109380us-gaap:CommercialPortfolioSegmentMemberzions:OwnerOccupiedMember2024-12-310000109380us-gaap:CommercialPortfolioSegmentMemberzions:MunicipalMember2025-09-300000109380us-gaap:CommercialPortfolioSegmentMemberzions:MunicipalMember2024-12-310000109380us-gaap:CommercialPortfolioSegmentMemberus-gaap:FinanceLeasesPortfolioSegmentMember2025-09-300000109380us-gaap:CommercialPortfolioSegmentMemberus-gaap:FinanceLeasesPortfolioSegmentMember2024-12-310000109380us-gaap:CommercialPortfolioSegmentMember2025-09-300000109380us-gaap:CommercialPortfolioSegmentMember2024-12-310000109380us-gaap:CommercialRealEstatePortfolioSegmentMemberzions:TermMember2025-09-300000109380us-gaap:CommercialRealEstatePortfolioSegmentMemberzions:TermMember2024-12-310000109380us-gaap:CommercialRealEstatePortfolioSegmentMemberzions:ConstructionAndLandDevelopmentMember2025-09-300000109380us-gaap:CommercialRealEstatePortfolioSegmentMemberzions:ConstructionAndLandDevelopmentMember2024-12-310000109380us-gaap:CommercialRealEstatePortfolioSegmentMember2025-09-300000109380us-gaap:CommercialRealEstatePortfolioSegmentMember2024-12-310000109380us-gaap:ConsumerPortfolioSegmentMemberzions:OneThroughFourFamilyResidentialMember2025-09-300000109380us-gaap:ConsumerPortfolioSegmentMemberzions:OneThroughFourFamilyResidentialMember2024-12-310000109380us-gaap:ConsumerPortfolioSegmentMemberus-gaap:HomeEquityMember2025-09-300000109380us-gaap:ConsumerPortfolioSegmentMemberus-gaap:HomeEquityMember2024-12-310000109380us-gaap:ConsumerPortfolioSegmentMemberzions:ConstructionAndOtherConsumerRealEstateMember2025-09-300000109380us-gaap:ConsumerPortfolioSegmentMemberzions:ConstructionAndOtherConsumerRealEstateMember2024-12-310000109380us-gaap:ConsumerPortfolioSegmentMemberzions:BankcardAndOtherRevolvingPlansMember2025-09-300000109380us-gaap:ConsumerPortfolioSegmentMemberzions:BankcardAndOtherRevolvingPlansMember2024-12-310000109380us-gaap:ConsumerPortfolioSegmentMemberzions:OtherConsumerLoansMember2025-09-300000109380us-gaap:ConsumerPortfolioSegmentMemberzions:OtherConsumerLoansMember2024-12-310000109380us-gaap:ConsumerPortfolioSegmentMember2025-09-300000109380us-gaap:ConsumerPortfolioSegmentMember2024-12-310000109380us-gaap:CommercialRealEstatePortfolioSegmentMemberzions:LandAcquisitionAndDevelopmentMember2025-09-300000109380us-gaap:CommercialRealEstatePortfolioSegmentMemberzions:LandAcquisitionAndDevelopmentMember2024-12-310000109380us-gaap:AssetPledgedAsCollateralWithoutRightMember2025-09-300000109380us-gaap:AssetPledgedAsCollateralWithoutRightMember2024-12-310000109380us-gaap:CommercialPortfolioSegmentMember2025-06-300000109380us-gaap:CommercialRealEstatePortfolioSegmentMember2025-06-300000109380us-gaap:ConsumerPortfolioSegmentMember2025-06-300000109380us-gaap:CommercialPortfolioSegmentMember2025-07-012025-09-300000109380us-gaap:CommercialRealEstatePortfolioSegmentMember2025-07-012025-09-300000109380us-gaap:ConsumerPortfolioSegmentMember2025-07-012025-09-300000109380us-gaap:CommercialPortfolioSegmentMember2025-01-012025-09-300000109380us-gaap:CommercialRealEstatePortfolioSegmentMember2025-01-012025-09-300000109380us-gaap:ConsumerPortfolioSegmentMember2025-01-012025-09-300000109380us-gaap:CommercialPortfolioSegmentMember2024-06-300000109380us-gaap:CommercialRealEstatePortfolioSegmentMember2024-06-300000109380us-gaap:ConsumerPortfolioSegmentMember2024-06-300000109380us-gaap:CommercialPortfolioSegmentMember2024-07-012024-09-300000109380us-gaap:CommercialRealEstatePortfolioSegmentMember2024-07-012024-09-300000109380us-gaap:ConsumerPortfolioSegmentMember2024-07-012024-09-300000109380us-gaap:CommercialPortfolioSegmentMember2024-09-300000109380us-gaap:CommercialRealEstatePortfolioSegmentMember2024-09-300000109380us-gaap:ConsumerPortfolioSegmentMember2024-09-300000109380us-gaap:CommercialPortfolioSegmentMember2023-12-310000109380us-gaap:CommercialRealEstatePortfolioSegmentMember2023-12-310000109380us-gaap:ConsumerPortfolioSegmentMember2023-12-310000109380us-gaap:CommercialPortfolioSegmentMember2024-01-012024-09-300000109380us-gaap:CommercialRealEstatePortfolioSegmentMember2024-01-012024-09-300000109380us-gaap:ConsumerPortfolioSegmentMember2024-01-012024-09-300000109380us-gaap:CommercialPortfolioSegmentMemberzions:CommercialAndIndustrialMemberus-gaap:FinancialAssetNotPastDueMember2025-09-300000109380us-gaap:CommercialPortfolioSegmentMemberzions:CommercialAndIndustrialMemberzions:FinancialAsset30To89DaysPastDueMember2025-09-300000109380us-gaap:CommercialPortfolioSegmentMemberzions:CommercialAndIndustrialMemberus-gaap:FinancingReceivablesEqualToGreaterThan90DaysPastDueMember2025-09-300000109380us-gaap:CommercialPortfolioSegmentMemberzions:CommercialAndIndustrialMemberus-gaap:FinancialAssetPastDueMember2025-09-300000109380us-gaap:CommercialPortfolioSegmentMemberzions:CommercialAndIndustrialMemberus-gaap:FinancingReceivables1To29DaysPastDueMember2025-09-300000109380us-gaap:CommercialPortfolioSegmentMemberzions:OwnerOccupiedMemberus-gaap:FinancialAssetNotPastDueMember2025-09-300000109380us-gaap:CommercialPortfolioSegmentMemberzions:OwnerOccupiedMemberzions:FinancialAsset30To89DaysPastDueMember2025-09-300000109380us-gaap:CommercialPortfolioSegmentMemberzions:OwnerOccupiedMemberus-gaap:FinancingReceivablesEqualToGreaterThan90DaysPastDueMember2025-09-300000109380us-gaap:CommercialPortfolioSegmentMemberzions:OwnerOccupiedMemberus-gaap:FinancialAssetPastDueMember2025-09-300000109380us-gaap:CommercialPortfolioSegmentMemberzions:OwnerOccupiedMemberus-gaap:FinancingReceivables1To29DaysPastDueMember2025-09-300000109380us-gaap:CommercialPortfolioSegmentMemberzions:MunicipalMemberus-gaap:FinancialAssetNotPastDueMember2025-09-300000109380us-gaap:CommercialPortfolioSegmentMemberzions:MunicipalMemberzions:FinancialAsset30To89DaysPastDueMember2025-09-300000109380us-gaap:CommercialPortfolioSegmentMemberzions:MunicipalMemberus-gaap:FinancingReceivablesEqualToGreaterThan90DaysPastDueMember2025-09-300000109380us-gaap:CommercialPortfolioSegmentMemberzions:MunicipalMemberus-gaap:FinancialAssetPastDueMember2025-09-300000109380us-gaap:CommercialPortfolioSegmentMemberzions:MunicipalMemberus-gaap:FinancingReceivables1To29DaysPastDueMember2025-09-300000109380us-gaap:CommercialPortfolioSegmentMemberus-gaap:FinanceLeasesPortfolioSegmentMemberus-gaap:FinancialAssetNotPastDueMember2025-09-300000109380us-gaap:CommercialPortfolioSegmentMemberus-gaap:FinanceLeasesPortfolioSegmentMemberzions:FinancialAsset30To89DaysPastDueMember2025-09-300000109380us-gaap:CommercialPortfolioSegmentMemberus-gaap:FinanceLeasesPortfolioSegmentMemberus-gaap:FinancingReceivablesEqualToGreaterThan90DaysPastDueMember2025-09-300000109380us-gaap:CommercialPortfolioSegmentMemberus-gaap:FinanceLeasesPortfolioSegmentMemberus-gaap:FinancialAssetPastDueMember2025-09-300000109380us-gaap:CommercialPortfolioSegmentMemberus-gaap:FinanceLeasesPortfolioSegmentMemberus-gaap:FinancingReceivables1To29DaysPastDueMember2025-09-300000109380us-gaap:CommercialPortfolioSegmentMemberus-gaap:FinancialAssetNotPastDueMember2025-09-300000109380us-gaap:CommercialPortfolioSegmentMemberzions:FinancialAsset30To89DaysPastDueMember2025-09-300000109380us-gaap:CommercialPortfolioSegmentMemberus-gaap:FinancingReceivablesEqualToGreaterThan90DaysPastDueMember2025-09-300000109380us-gaap:CommercialPortfolioSegmentMemberus-gaap:FinancialAssetPastDueMember2025-09-300000109380us-gaap:CommercialPortfolioSegmentMemberus-gaap:FinancingReceivables1To29DaysPastDueMember2025-09-300000109380us-gaap:CommercialRealEstatePortfolioSegmentMemberzions:TermMemberus-gaap:FinancialAssetNotPastDueMember2025-09-300000109380us-gaap:CommercialRealEstatePortfolioSegmentMemberzions:TermMemberzions:FinancialAsset30To89DaysPastDueMember2025-09-300000109380us-gaap:CommercialRealEstatePortfolioSegmentMemberzions:TermMemberus-gaap:FinancingReceivablesEqualToGreaterThan90DaysPastDueMember2025-09-300000109380us-gaap:CommercialRealEstatePortfolioSegmentMemberzions:TermMemberus-gaap:FinancialAssetPastDueMember2025-09-300000109380us-gaap:CommercialRealEstatePortfolioSegmentMemberzions:TermMemberus-gaap:FinancingReceivables1To29DaysPastDueMember2025-09-300000109380us-gaap:CommercialRealEstatePortfolioSegmentMemberzions:ConstructionAndLandDevelopmentMemberus-gaap:FinancialAssetNotPastDueMember2025-09-300000109380us-gaap:CommercialRealEstatePortfolioSegmentMemberzions:ConstructionAndLandDevelopmentMemberzions:FinancialAsset30To89DaysPastDueMember2025-09-300000109380us-gaap:CommercialRealEstatePortfolioSegmentMemberzions:ConstructionAndLandDevelopmentMemberus-gaap:FinancingReceivablesEqualToGreaterThan90DaysPastDueMember2025-09-300000109380us-gaap:CommercialRealEstatePortfolioSegmentMemberzions:ConstructionAndLandDevelopmentMemberus-gaap:FinancialAssetPastDueMember2025-09-300000109380us-gaap:CommercialRealEstatePortfolioSegmentMemberzions:ConstructionAndLandDevelopmentMemberus-gaap:FinancingReceivables1To29DaysPastDueMember2025-09-300000109380us-gaap:CommercialRealEstatePortfolioSegmentMemberus-gaap:FinancialAssetNotPastDueMember2025-09-300000109380us-gaap:CommercialRealEstatePortfolioSegmentMemberzions:FinancialAsset30To89DaysPastDueMember2025-09-300000109380us-gaap:CommercialRealEstatePortfolioSegmentMemberus-gaap:FinancingReceivablesEqualToGreaterThan90DaysPastDueMember2025-09-300000109380us-gaap:CommercialRealEstatePortfolioSegmentMemberus-gaap:FinancialAssetPastDueMember2025-09-300000109380us-gaap:CommercialRealEstatePortfolioSegmentMemberus-gaap:FinancingReceivables1To29DaysPastDueMember2025-09-300000109380us-gaap:ConsumerPortfolioSegmentMemberzions:OneThroughFourFamilyResidentialMemberus-gaap:FinancialAssetNotPastDueMember2025-09-300000109380us-gaap:ConsumerPortfolioSegmentMemberzions:OneThroughFourFamilyResidentialMemberzions:FinancialAsset30To89DaysPastDueMember2025-09-300000109380us-gaap:ConsumerPortfolioSegmentMemberzions:OneThroughFourFamilyResidentialMemberus-gaap:FinancingReceivablesEqualToGreaterThan90DaysPastDueMember2025-09-300000109380us-gaap:ConsumerPortfolioSegmentMemberzions:OneThroughFourFamilyResidentialMemberus-gaap:FinancialAssetPastDueMember2025-09-300000109380us-gaap:ConsumerPortfolioSegmentMemberzions:OneThroughFourFamilyResidentialMemberus-gaap:FinancingReceivables1To29DaysPastDueMember2025-09-300000109380us-gaap:ConsumerPortfolioSegmentMemberus-gaap:HomeEquityMemberus-gaap:FinancialAssetNotPastDueMember2025-09-300000109380us-gaap:ConsumerPortfolioSegmentMemberus-gaap:HomeEquityMemberzions:FinancialAsset30To89DaysPastDueMember2025-09-300000109380us-gaap:ConsumerPortfolioSegmentMemberus-gaap:HomeEquityMemberus-gaap:FinancingReceivablesEqualToGreaterThan90DaysPastDueMember2025-09-300000109380us-gaap:ConsumerPortfolioSegmentMemberus-gaap:HomeEquityMemberus-gaap:FinancialAssetPastDueMember2025-09-300000109380us-gaap:ConsumerPortfolioSegmentMemberus-gaap:HomeEquityMemberus-gaap:FinancingReceivables1To29DaysPastDueMember2025-09-300000109380us-gaap:ConsumerPortfolioSegmentMemberzions:ConstructionAndOtherConsumerRealEstateMemberus-gaap:FinancialAssetNotPastDueMember2025-09-300000109380us-gaap:ConsumerPortfolioSegmentMemberzions:ConstructionAndOtherConsumerRealEstateMemberzions:FinancialAsset30To89DaysPastDueMember2025-09-300000109380us-gaap:ConsumerPortfolioSegmentMemberzions:ConstructionAndOtherConsumerRealEstateMemberus-gaap:FinancingReceivablesEqualToGreaterThan90DaysPastDueMember2025-09-300000109380us-gaap:ConsumerPortfolioSegmentMemberzions:ConstructionAndOtherConsumerRealEstateMemberus-gaap:FinancialAssetPastDueMember2025-09-300000109380us-gaap:ConsumerPortfolioSegmentMemberzions:ConstructionAndOtherConsumerRealEstateMemberus-gaap:FinancingReceivables1To29DaysPastDueMember2025-09-300000109380us-gaap:ConsumerPortfolioSegmentMemberzions:BankcardAndOtherRevolvingPlansMemberus-gaap:FinancialAssetNotPastDueMember2025-09-300000109380us-gaap:ConsumerPortfolioSegmentMemberzions:BankcardAndOtherRevolvingPlansMemberzions:FinancialAsset30To89DaysPastDueMember2025-09-300000109380us-gaap:ConsumerPortfolioSegmentMemberzions:BankcardAndOtherRevolvingPlansMemberus-gaap:FinancingReceivablesEqualToGreaterThan90DaysPastDueMember2025-09-300000109380us-gaap:ConsumerPortfolioSegmentMemberzions:BankcardAndOtherRevolvingPlansMemberus-gaap:FinancialAssetPastDueMember2025-09-300000109380us-gaap:ConsumerPortfolioSegmentMemberzions:BankcardAndOtherRevolvingPlansMemberus-gaap:FinancingReceivables1To29DaysPastDueMember2025-09-300000109380us-gaap:ConsumerPortfolioSegmentMemberzions:OtherConsumerLoansMemberus-gaap:FinancialAssetNotPastDueMember2025-09-300000109380us-gaap:ConsumerPortfolioSegmentMemberzions:OtherConsumerLoansMemberzions:FinancialAsset30To89DaysPastDueMember2025-09-300000109380us-gaap:ConsumerPortfolioSegmentMemberzions:OtherConsumerLoansMemberus-gaap:FinancingReceivablesEqualToGreaterThan90DaysPastDueMember2025-09-300000109380us-gaap:ConsumerPortfolioSegmentMemberzions:OtherConsumerLoansMemberus-gaap:FinancialAssetPastDueMember2025-09-300000109380us-gaap:ConsumerPortfolioSegmentMemberzions:OtherConsumerLoansMemberus-gaap:FinancingReceivables1To29DaysPastDueMember2025-09-300000109380us-gaap:ConsumerPortfolioSegmentMemberus-gaap:FinancialAssetNotPastDueMember2025-09-300000109380us-gaap:ConsumerPortfolioSegmentMemberzions:FinancialAsset30To89DaysPastDueMember2025-09-300000109380us-gaap:ConsumerPortfolioSegmentMemberus-gaap:FinancingReceivablesEqualToGreaterThan90DaysPastDueMember2025-09-300000109380us-gaap:ConsumerPortfolioSegmentMemberus-gaap:FinancialAssetPastDueMember2025-09-300000109380us-gaap:ConsumerPortfolioSegmentMemberus-gaap:FinancingReceivables1To29DaysPastDueMember2025-09-300000109380us-gaap:FinancialAssetNotPastDueMember2025-09-300000109380zions:FinancialAsset30To89DaysPastDueMember2025-09-300000109380us-gaap:FinancingReceivablesEqualToGreaterThan90DaysPastDueMember2025-09-300000109380us-gaap:FinancialAssetPastDueMember2025-09-300000109380us-gaap:FinancingReceivables1To29DaysPastDueMember2025-09-300000109380us-gaap:CommercialPortfolioSegmentMemberzions:CommercialAndIndustrialMemberus-gaap:FinancialAssetNotPastDueMember2024-12-310000109380us-gaap:CommercialPortfolioSegmentMemberzions:CommercialAndIndustrialMemberzions:FinancialAsset30To89DaysPastDueMember2024-12-310000109380us-gaap:CommercialPortfolioSegmentMemberzions:CommercialAndIndustrialMemberus-gaap:FinancingReceivablesEqualToGreaterThan90DaysPastDueMember2024-12-310000109380us-gaap:CommercialPortfolioSegmentMemberzions:CommercialAndIndustrialMemberus-gaap:FinancialAssetPastDueMember2024-12-310000109380us-gaap:CommercialPortfolioSegmentMemberzions:CommercialAndIndustrialMemberus-gaap:FinancingReceivables1To29DaysPastDueMember2024-12-310000109380us-gaap:CommercialPortfolioSegmentMemberzions:OwnerOccupiedMemberus-gaap:FinancialAssetNotPastDueMember2024-12-310000109380us-gaap:CommercialPortfolioSegmentMemberzions:OwnerOccupiedMemberzions:FinancialAsset30To89DaysPastDueMember2024-12-310000109380us-gaap:CommercialPortfolioSegmentMemberzions:OwnerOccupiedMemberus-gaap:FinancingReceivablesEqualToGreaterThan90DaysPastDueMember2024-12-310000109380us-gaap:CommercialPortfolioSegmentMemberzions:OwnerOccupiedMemberus-gaap:FinancialAssetPastDueMember2024-12-310000109380us-gaap:CommercialPortfolioSegmentMemberzions:OwnerOccupiedMemberus-gaap:FinancingReceivables1To29DaysPastDueMember2024-12-310000109380us-gaap:CommercialPortfolioSegmentMemberzions:MunicipalMemberus-gaap:FinancialAssetNotPastDueMember2024-12-310000109380us-gaap:CommercialPortfolioSegmentMemberzions:MunicipalMemberzions:FinancialAsset30To89DaysPastDueMember2024-12-310000109380us-gaap:CommercialPortfolioSegmentMemberzions:MunicipalMemberus-gaap:FinancingReceivablesEqualToGreaterThan90DaysPastDueMember2024-12-310000109380us-gaap:CommercialPortfolioSegmentMemberzions:MunicipalMemberus-gaap:FinancialAssetPastDueMember2024-12-310000109380us-gaap:CommercialPortfolioSegmentMemberzions:MunicipalMemberus-gaap:FinancingReceivables1To29DaysPastDueMember2024-12-310000109380us-gaap:CommercialPortfolioSegmentMemberus-gaap:FinanceLeasesPortfolioSegmentMemberus-gaap:FinancialAssetNotPastDueMember2024-12-310000109380us-gaap:CommercialPortfolioSegmentMemberus-gaap:FinanceLeasesPortfolioSegmentMemberzions:FinancialAsset30To89DaysPastDueMember2024-12-310000109380us-gaap:CommercialPortfolioSegmentMemberus-gaap:FinanceLeasesPortfolioSegmentMemberus-gaap:FinancingReceivablesEqualToGreaterThan90DaysPastDueMember2024-12-310000109380us-gaap:CommercialPortfolioSegmentMemberus-gaap:FinanceLeasesPortfolioSegmentMemberus-gaap:FinancialAssetPastDueMember2024-12-310000109380us-gaap:CommercialPortfolioSegmentMemberus-gaap:FinanceLeasesPortfolioSegmentMemberus-gaap:FinancingReceivables1To29DaysPastDueMember2024-12-310000109380us-gaap:CommercialPortfolioSegmentMemberus-gaap:FinancialAssetNotPastDueMember2024-12-310000109380us-gaap:CommercialPortfolioSegmentMemberzions:FinancialAsset30To89DaysPastDueMember2024-12-310000109380us-gaap:CommercialPortfolioSegmentMemberus-gaap:FinancingReceivablesEqualToGreaterThan90DaysPastDueMember2024-12-310000109380us-gaap:CommercialPortfolioSegmentMemberus-gaap:FinancialAssetPastDueMember2024-12-310000109380us-gaap:CommercialPortfolioSegmentMemberus-gaap:FinancingReceivables1To29DaysPastDueMember2024-12-310000109380us-gaap:CommercialRealEstatePortfolioSegmentMemberzions:TermMemberus-gaap:FinancialAssetNotPastDueMember2024-12-310000109380us-gaap:CommercialRealEstatePortfolioSegmentMemberzions:TermMemberzions:FinancialAsset30To89DaysPastDueMember2024-12-310000109380us-gaap:CommercialRealEstatePortfolioSegmentMemberzions:TermMemberus-gaap:FinancingReceivablesEqualToGreaterThan90DaysPastDueMember2024-12-310000109380us-gaap:CommercialRealEstatePortfolioSegmentMemberzions:TermMemberus-gaap:FinancialAssetPastDueMember2024-12-310000109380us-gaap:CommercialRealEstatePortfolioSegmentMemberzions:TermMemberus-gaap:FinancingReceivables1To29DaysPastDueMember2024-12-310000109380us-gaap:CommercialRealEstatePortfolioSegmentMemberzions:ConstructionAndLandDevelopmentMemberus-gaap:FinancialAssetNotPastDueMember2024-12-310000109380us-gaap:CommercialRealEstatePortfolioSegmentMemberzions:ConstructionAndLandDevelopmentMemberzions:FinancialAsset30To89DaysPastDueMember2024-12-310000109380us-gaap:CommercialRealEstatePortfolioSegmentMemberzions:ConstructionAndLandDevelopmentMemberus-gaap:FinancingReceivablesEqualToGreaterThan90DaysPastDueMember2024-12-310000109380us-gaap:CommercialRealEstatePortfolioSegmentMemberzions:ConstructionAndLandDevelopmentMemberus-gaap:FinancialAssetPastDueMember2024-12-310000109380us-gaap:CommercialRealEstatePortfolioSegmentMemberzions:ConstructionAndLandDevelopmentMemberus-gaap:FinancingReceivables1To29DaysPastDueMember2024-12-310000109380us-gaap:CommercialRealEstatePortfolioSegmentMemberus-gaap:FinancialAssetNotPastDueMember2024-12-310000109380us-gaap:CommercialRealEstatePortfolioSegmentMemberzions:FinancialAsset30To89DaysPastDueMember2024-12-310000109380us-gaap:CommercialRealEstatePortfolioSegmentMemberus-gaap:FinancingReceivablesEqualToGreaterThan90DaysPastDueMember2024-12-310000109380us-gaap:CommercialRealEstatePortfolioSegmentMemberus-gaap:FinancialAssetPastDueMember2024-12-310000109380us-gaap:CommercialRealEstatePortfolioSegmentMemberus-gaap:FinancingReceivables1To29DaysPastDueMember2024-12-310000109380us-gaap:ConsumerPortfolioSegmentMemberzions:OneThroughFourFamilyResidentialMemberus-gaap:FinancialAssetNotPastDueMember2024-12-310000109380us-gaap:ConsumerPortfolioSegmentMemberzions:OneThroughFourFamilyResidentialMemberzions:FinancialAsset30To89DaysPastDueMember2024-12-310000109380us-gaap:ConsumerPortfolioSegmentMemberzions:OneThroughFourFamilyResidentialMemberus-gaap:FinancingReceivablesEqualToGreaterThan90DaysPastDueMember2024-12-310000109380us-gaap:ConsumerPortfolioSegmentMemberzions:OneThroughFourFamilyResidentialMemberus-gaap:FinancialAssetPastDueMember2024-12-310000109380us-gaap:ConsumerPortfolioSegmentMemberzions:OneThroughFourFamilyResidentialMemberus-gaap:FinancingReceivables1To29DaysPastDueMember2024-12-310000109380us-gaap:ConsumerPortfolioSegmentMemberus-gaap:HomeEquityMemberus-gaap:FinancialAssetNotPastDueMember2024-12-310000109380us-gaap:ConsumerPortfolioSegmentMemberus-gaap:HomeEquityMemberzions:FinancialAsset30To89DaysPastDueMember2024-12-310000109380us-gaap:ConsumerPortfolioSegmentMemberus-gaap:HomeEquityMemberus-gaap:FinancingReceivablesEqualToGreaterThan90DaysPastDueMember2024-12-310000109380us-gaap:ConsumerPortfolioSegmentMemberus-gaap:HomeEquityMemberus-gaap:FinancialAssetPastDueMember2024-12-310000109380us-gaap:ConsumerPortfolioSegmentMemberus-gaap:HomeEquityMemberus-gaap:FinancingReceivables1To29DaysPastDueMember2024-12-310000109380us-gaap:ConsumerPortfolioSegmentMemberzions:ConstructionAndOtherConsumerRealEstateMemberus-gaap:FinancialAssetNotPastDueMember2024-12-310000109380us-gaap:ConsumerPortfolioSegmentMemberzions:ConstructionAndOtherConsumerRealEstateMemberzions:FinancialAsset30To89DaysPastDueMember2024-12-310000109380us-gaap:ConsumerPortfolioSegmentMemberzions:ConstructionAndOtherConsumerRealEstateMemberus-gaap:FinancingReceivablesEqualToGreaterThan90DaysPastDueMember2024-12-310000109380us-gaap:ConsumerPortfolioSegmentMemberzions:ConstructionAndOtherConsumerRealEstateMemberus-gaap:FinancialAssetPastDueMember2024-12-310000109380us-gaap:ConsumerPortfolioSegmentMemberzions:ConstructionAndOtherConsumerRealEstateMemberus-gaap:FinancingReceivables1To29DaysPastDueMember2024-12-310000109380us-gaap:ConsumerPortfolioSegmentMemberzions:BankcardAndOtherRevolvingPlansMemberus-gaap:FinancialAssetNotPastDueMember2024-12-310000109380us-gaap:ConsumerPortfolioSegmentMemberzions:BankcardAndOtherRevolvingPlansMemberzions:FinancialAsset30To89DaysPastDueMember2024-12-310000109380us-gaap:ConsumerPortfolioSegmentMemberzions:BankcardAndOtherRevolvingPlansMemberus-gaap:FinancingReceivablesEqualToGreaterThan90DaysPastDueMember2024-12-310000109380us-gaap:ConsumerPortfolioSegmentMemberzions:BankcardAndOtherRevolvingPlansMemberus-gaap:FinancialAssetPastDueMember2024-12-310000109380us-gaap:ConsumerPortfolioSegmentMemberzions:BankcardAndOtherRevolvingPlansMemberus-gaap:FinancingReceivables1To29DaysPastDueMember2024-12-310000109380us-gaap:ConsumerPortfolioSegmentMemberzions:OtherConsumerLoansMemberus-gaap:FinancialAssetNotPastDueMember2024-12-310000109380us-gaap:ConsumerPortfolioSegmentMemberzions:OtherConsumerLoansMemberzions:FinancialAsset30To89DaysPastDueMember2024-12-310000109380us-gaap:ConsumerPortfolioSegmentMemberzions:OtherConsumerLoansMemberus-gaap:FinancingReceivablesEqualToGreaterThan90DaysPastDueMember2024-12-310000109380us-gaap:ConsumerPortfolioSegmentMemberzions:OtherConsumerLoansMemberus-gaap:FinancialAssetPastDueMember2024-12-310000109380us-gaap:ConsumerPortfolioSegmentMemberzions:OtherConsumerLoansMemberus-gaap:FinancingReceivables1To29DaysPastDueMember2024-12-310000109380us-gaap:ConsumerPortfolioSegmentMemberus-gaap:FinancialAssetNotPastDueMember2024-12-310000109380us-gaap:ConsumerPortfolioSegmentMemberzions:FinancialAsset30To89DaysPastDueMember2024-12-310000109380us-gaap:ConsumerPortfolioSegmentMemberus-gaap:FinancingReceivablesEqualToGreaterThan90DaysPastDueMember2024-12-310000109380us-gaap:ConsumerPortfolioSegmentMemberus-gaap:FinancialAssetPastDueMember2024-12-310000109380us-gaap:ConsumerPortfolioSegmentMemberus-gaap:FinancingReceivables1To29DaysPastDueMember2024-12-310000109380us-gaap:FinancialAssetNotPastDueMember2024-12-310000109380zions:FinancialAsset30To89DaysPastDueMember2024-12-310000109380us-gaap:FinancingReceivablesEqualToGreaterThan90DaysPastDueMember2024-12-310000109380us-gaap:FinancialAssetPastDueMember2024-12-310000109380us-gaap:FinancingReceivables1To29DaysPastDueMember2024-12-310000109380srt:MaximumMemberus-gaap:DoubtfulMember2025-09-300000109380us-gaap:DoubtfulMember2024-12-310000109380us-gaap:CommercialPortfolioSegmentMemberzions:CommercialAndIndustrialMemberus-gaap:PassMember2025-09-300000109380us-gaap:CommercialPortfolioSegmentMemberzions:CommercialAndIndustrialMemberus-gaap:SpecialMentionMember2025-09-300000109380us-gaap:CommercialPortfolioSegmentMemberzions:CommercialAndIndustrialMemberzions:AccruingSubstandardMember2025-09-300000109380us-gaap:CommercialPortfolioSegmentMemberzions:CommercialAndIndustrialMemberzions:NonaccrualMember2025-09-300000109380us-gaap:CommercialPortfolioSegmentMemberzions:OwnerOccupiedMemberus-gaap:PassMember2025-09-300000109380us-gaap:CommercialPortfolioSegmentMemberzions:OwnerOccupiedMemberus-gaap:SpecialMentionMember2025-09-300000109380us-gaap:CommercialPortfolioSegmentMemberzions:OwnerOccupiedMemberzions:AccruingSubstandardMember2025-09-300000109380us-gaap:CommercialPortfolioSegmentMemberzions:OwnerOccupiedMemberzions:NonaccrualMember2025-09-300000109380us-gaap:CommercialPortfolioSegmentMemberzions:MunicipalMemberus-gaap:PassMember2025-09-300000109380us-gaap:CommercialPortfolioSegmentMemberzions:MunicipalMemberus-gaap:SpecialMentionMember2025-09-300000109380us-gaap:CommercialPortfolioSegmentMemberzions:MunicipalMemberzions:AccruingSubstandardMember2025-09-300000109380us-gaap:CommercialPortfolioSegmentMemberzions:MunicipalMemberzions:NonaccrualMember2025-09-300000109380us-gaap:CommercialPortfolioSegmentMemberus-gaap:FinanceLeasesPortfolioSegmentMemberus-gaap:PassMember2025-09-300000109380us-gaap:CommercialPortfolioSegmentMemberus-gaap:FinanceLeasesPortfolioSegmentMemberus-gaap:SpecialMentionMember2025-09-300000109380us-gaap:CommercialPortfolioSegmentMemberus-gaap:FinanceLeasesPortfolioSegmentMemberzions:AccruingSubstandardMember2025-09-300000109380us-gaap:CommercialPortfolioSegmentMemberus-gaap:FinanceLeasesPortfolioSegmentMemberzions:NonaccrualMember2025-09-300000109380us-gaap:CommercialRealEstatePortfolioSegmentMemberzions:TermMemberus-gaap:PassMember2025-09-300000109380us-gaap:CommercialRealEstatePortfolioSegmentMemberzions:TermMemberus-gaap:SpecialMentionMember2025-09-300000109380us-gaap:CommercialRealEstatePortfolioSegmentMemberzions:TermMemberzions:AccruingSubstandardMember2025-09-300000109380us-gaap:CommercialRealEstatePortfolioSegmentMemberzions:TermMemberzions:NonaccrualMember2025-09-300000109380us-gaap:CommercialRealEstatePortfolioSegmentMemberzions:ConstructionAndLandDevelopmentMemberus-gaap:PassMember2025-09-300000109380us-gaap:CommercialRealEstatePortfolioSegmentMemberzions:ConstructionAndLandDevelopmentMemberus-gaap:SpecialMentionMember2025-09-300000109380us-gaap:CommercialRealEstatePortfolioSegmentMemberzions:ConstructionAndLandDevelopmentMemberzions:AccruingSubstandardMember2025-09-300000109380us-gaap:CommercialRealEstatePortfolioSegmentMemberzions:ConstructionAndLandDevelopmentMemberzions:NonaccrualMember2025-09-300000109380us-gaap:ConsumerPortfolioSegmentMemberzions:OneThroughFourFamilyResidentialMemberus-gaap:PassMember2025-09-300000109380us-gaap:ConsumerPortfolioSegmentMemberzions:OneThroughFourFamilyResidentialMemberus-gaap:SpecialMentionMember2025-09-300000109380us-gaap:ConsumerPortfolioSegmentMemberzions:OneThroughFourFamilyResidentialMemberzions:AccruingSubstandardMember2025-09-300000109380us-gaap:ConsumerPortfolioSegmentMemberzions:OneThroughFourFamilyResidentialMemberzions:NonaccrualMember2025-09-300000109380us-gaap:ConsumerPortfolioSegmentMemberus-gaap:HomeEquityMemberus-gaap:PassMember2025-09-300000109380us-gaap:ConsumerPortfolioSegmentMemberus-gaap:HomeEquityMemberus-gaap:SpecialMentionMember2025-09-300000109380us-gaap:ConsumerPortfolioSegmentMemberus-gaap:HomeEquityMemberzions:AccruingSubstandardMember2025-09-300000109380us-gaap:ConsumerPortfolioSegmentMemberus-gaap:HomeEquityMemberzions:NonaccrualMember2025-09-300000109380us-gaap:ConsumerPortfolioSegmentMemberzions:ConstructionAndOtherConsumerRealEstateMemberus-gaap:PassMember2025-09-300000109380us-gaap:ConsumerPortfolioSegmentMemberzions:ConstructionAndOtherConsumerRealEstateMemberus-gaap:SpecialMentionMember2025-09-300000109380us-gaap:ConsumerPortfolioSegmentMemberzions:ConstructionAndOtherConsumerRealEstateMemberzions:AccruingSubstandardMember2025-09-300000109380us-gaap:ConsumerPortfolioSegmentMemberzions:ConstructionAndOtherConsumerRealEstateMemberzions:NonaccrualMember2025-09-300000109380us-gaap:ConsumerPortfolioSegmentMemberzions:BankcardAndOtherRevolvingPlansMemberus-gaap:PassMember2025-09-300000109380us-gaap:ConsumerPortfolioSegmentMemberzions:BankcardAndOtherRevolvingPlansMemberus-gaap:SpecialMentionMember2025-09-300000109380us-gaap:ConsumerPortfolioSegmentMemberzions:BankcardAndOtherRevolvingPlansMemberzions:AccruingSubstandardMember2025-09-300000109380us-gaap:ConsumerPortfolioSegmentMemberzions:BankcardAndOtherRevolvingPlansMemberzions:NonaccrualMember2025-09-300000109380us-gaap:ConsumerPortfolioSegmentMemberzions:OtherConsumerLoansMemberus-gaap:PassMember2025-09-300000109380us-gaap:ConsumerPortfolioSegmentMemberzions:OtherConsumerLoansMemberus-gaap:SpecialMentionMember2025-09-300000109380us-gaap:ConsumerPortfolioSegmentMemberzions:OtherConsumerLoansMemberzions:AccruingSubstandardMember2025-09-300000109380us-gaap:ConsumerPortfolioSegmentMemberzions:OtherConsumerLoansMemberzions:NonaccrualMember2025-09-300000109380us-gaap:CommercialPortfolioSegmentMemberzions:CommercialAndIndustrialMemberus-gaap:PassMember2024-12-310000109380us-gaap:CommercialPortfolioSegmentMemberzions:CommercialAndIndustrialMemberus-gaap:SpecialMentionMember2024-12-310000109380us-gaap:CommercialPortfolioSegmentMemberzions:CommercialAndIndustrialMemberzions:AccruingSubstandardMember2024-12-310000109380us-gaap:CommercialPortfolioSegmentMemberzions:CommercialAndIndustrialMemberzions:NonaccrualMember2024-12-310000109380us-gaap:CommercialPortfolioSegmentMemberzions:OwnerOccupiedMemberus-gaap:PassMember2024-12-310000109380us-gaap:CommercialPortfolioSegmentMemberzions:OwnerOccupiedMemberus-gaap:SpecialMentionMember2024-12-310000109380us-gaap:CommercialPortfolioSegmentMemberzions:OwnerOccupiedMemberzions:AccruingSubstandardMember2024-12-310000109380us-gaap:CommercialPortfolioSegmentMemberzions:OwnerOccupiedMemberzions:NonaccrualMember2024-12-310000109380us-gaap:CommercialPortfolioSegmentMemberzions:MunicipalMemberus-gaap:PassMember2024-12-310000109380us-gaap:CommercialPortfolioSegmentMemberzions:MunicipalMemberus-gaap:SpecialMentionMember2024-12-310000109380us-gaap:CommercialPortfolioSegmentMemberzions:MunicipalMemberzions:AccruingSubstandardMember2024-12-310000109380us-gaap:CommercialPortfolioSegmentMemberzions:MunicipalMemberzions:NonaccrualMember2024-12-310000109380us-gaap:CommercialPortfolioSegmentMemberus-gaap:FinanceLeasesPortfolioSegmentMemberus-gaap:PassMember2024-12-310000109380us-gaap:CommercialPortfolioSegmentMemberus-gaap:FinanceLeasesPortfolioSegmentMemberus-gaap:SpecialMentionMember2024-12-310000109380us-gaap:CommercialPortfolioSegmentMemberus-gaap:FinanceLeasesPortfolioSegmentMemberzions:AccruingSubstandardMember2024-12-310000109380us-gaap:CommercialPortfolioSegmentMemberus-gaap:FinanceLeasesPortfolioSegmentMemberzions:NonaccrualMember2024-12-310000109380us-gaap:CommercialRealEstatePortfolioSegmentMemberzions:TermMemberus-gaap:PassMember2024-12-310000109380us-gaap:CommercialRealEstatePortfolioSegmentMemberzions:TermMemberus-gaap:SpecialMentionMember2024-12-310000109380us-gaap:CommercialRealEstatePortfolioSegmentMemberzions:TermMemberzions:AccruingSubstandardMember2024-12-310000109380us-gaap:CommercialRealEstatePortfolioSegmentMemberzions:TermMemberzions:NonaccrualMember2024-12-310000109380us-gaap:CommercialRealEstatePortfolioSegmentMemberzions:ConstructionAndLandDevelopmentMemberus-gaap:PassMember2024-12-310000109380us-gaap:CommercialRealEstatePortfolioSegmentMemberzions:ConstructionAndLandDevelopmentMemberus-gaap:SpecialMentionMember2024-12-310000109380us-gaap:CommercialRealEstatePortfolioSegmentMemberzions:ConstructionAndLandDevelopmentMemberzions:AccruingSubstandardMember2024-12-310000109380us-gaap:CommercialRealEstatePortfolioSegmentMemberzions:ConstructionAndLandDevelopmentMemberzions:NonaccrualMember2024-12-310000109380us-gaap:ConsumerPortfolioSegmentMemberzions:OneThroughFourFamilyResidentialMemberus-gaap:PassMember2024-12-310000109380us-gaap:ConsumerPortfolioSegmentMemberzions:OneThroughFourFamilyResidentialMemberus-gaap:SpecialMentionMember2024-12-310000109380us-gaap:ConsumerPortfolioSegmentMemberzions:OneThroughFourFamilyResidentialMemberzions:AccruingSubstandardMember2024-12-310000109380us-gaap:ConsumerPortfolioSegmentMemberzions:OneThroughFourFamilyResidentialMemberzions:NonaccrualMember2024-12-310000109380us-gaap:ConsumerPortfolioSegmentMemberus-gaap:HomeEquityMemberus-gaap:PassMember2024-12-310000109380us-gaap:ConsumerPortfolioSegmentMemberus-gaap:HomeEquityMemberus-gaap:SpecialMentionMember2024-12-310000109380us-gaap:ConsumerPortfolioSegmentMemberus-gaap:HomeEquityMemberzions:AccruingSubstandardMember2024-12-310000109380us-gaap:ConsumerPortfolioSegmentMemberus-gaap:HomeEquityMemberzions:NonaccrualMember2024-12-310000109380us-gaap:ConsumerPortfolioSegmentMemberzions:ConstructionAndOtherConsumerRealEstateMemberus-gaap:PassMember2024-12-310000109380us-gaap:ConsumerPortfolioSegmentMemberzions:ConstructionAndOtherConsumerRealEstateMemberus-gaap:SpecialMentionMember2024-12-310000109380us-gaap:ConsumerPortfolioSegmentMemberzions:ConstructionAndOtherConsumerRealEstateMemberzions:AccruingSubstandardMember2024-12-310000109380us-gaap:ConsumerPortfolioSegmentMemberzions:ConstructionAndOtherConsumerRealEstateMemberzions:NonaccrualMember2024-12-310000109380us-gaap:ConsumerPortfolioSegmentMemberzions:BankcardAndOtherRevolvingPlansMemberus-gaap:PassMember2024-12-310000109380us-gaap:ConsumerPortfolioSegmentMemberzions:BankcardAndOtherRevolvingPlansMemberus-gaap:SpecialMentionMember2024-12-310000109380us-gaap:ConsumerPortfolioSegmentMemberzions:BankcardAndOtherRevolvingPlansMemberzions:AccruingSubstandardMember2024-12-310000109380us-gaap:ConsumerPortfolioSegmentMemberzions:BankcardAndOtherRevolvingPlansMemberzions:NonaccrualMember2024-12-310000109380us-gaap:ConsumerPortfolioSegmentMemberzions:OtherConsumerLoansMemberus-gaap:PassMember2024-12-310000109380us-gaap:ConsumerPortfolioSegmentMemberzions:OtherConsumerLoansMemberus-gaap:SpecialMentionMember2024-12-310000109380us-gaap:ConsumerPortfolioSegmentMemberzions:OtherConsumerLoansMemberzions:AccruingSubstandardMember2024-12-310000109380us-gaap:ConsumerPortfolioSegmentMemberzions:OtherConsumerLoansMemberzions:NonaccrualMember2024-12-310000109380us-gaap:CommercialPortfolioSegmentMemberzions:CommercialAndIndustrialMember2025-07-012025-09-300000109380us-gaap:CommercialPortfolioSegmentMemberzions:MunicipalMember2025-07-012025-09-300000109380us-gaap:CommercialRealEstatePortfolioSegmentMemberzions:TermMember2025-07-012025-09-300000109380us-gaap:ConsumerPortfolioSegmentMemberzions:BankcardAndOtherRevolvingPlansMember2025-07-012025-09-300000109380us-gaap:ConsumerPortfolioSegmentMemberzions:OtherConsumerLoansMember2025-07-012025-09-300000109380us-gaap:CommercialPortfolioSegmentMemberzions:CommercialAndIndustrialMember2025-01-012025-09-300000109380us-gaap:CommercialPortfolioSegmentMemberzions:MunicipalMember2025-01-012025-09-300000109380us-gaap:CommercialPortfolioSegmentMemberus-gaap:FinanceLeasesPortfolioSegmentMember2025-01-012025-09-300000109380us-gaap:CommercialRealEstatePortfolioSegmentMemberzions:TermMember2025-01-012025-09-300000109380us-gaap:ConsumerPortfolioSegmentMemberzions:OneThroughFourFamilyResidentialMember2025-01-012025-09-300000109380us-gaap:ConsumerPortfolioSegmentMemberus-gaap:HomeEquityMember2025-01-012025-09-300000109380us-gaap:ConsumerPortfolioSegmentMemberzions:BankcardAndOtherRevolvingPlansMember2025-01-012025-09-300000109380us-gaap:ConsumerPortfolioSegmentMemberzions:OtherConsumerLoansMember2025-01-012025-09-300000109380us-gaap:CommercialPortfolioSegmentMemberzions:CommercialAndIndustrialMember2024-07-012024-09-300000109380us-gaap:CommercialPortfolioSegmentMemberzions:OwnerOccupiedMember2024-07-012024-09-300000109380us-gaap:ConsumerPortfolioSegmentMemberus-gaap:HomeEquityMember2024-07-012024-09-300000109380us-gaap:ConsumerPortfolioSegmentMemberzions:BankcardAndOtherRevolvingPlansMember2024-07-012024-09-300000109380us-gaap:CommercialPortfolioSegmentMemberzions:CommercialAndIndustrialMember2024-01-012024-09-300000109380us-gaap:CommercialPortfolioSegmentMemberzions:OwnerOccupiedMember2024-01-012024-09-300000109380us-gaap:CommercialRealEstatePortfolioSegmentMemberzions:TermMember2024-01-012024-09-300000109380us-gaap:ConsumerPortfolioSegmentMemberzions:OneThroughFourFamilyResidentialMember2024-01-012024-09-300000109380us-gaap:ConsumerPortfolioSegmentMemberus-gaap:HomeEquityMember2024-01-012024-09-300000109380us-gaap:ConsumerPortfolioSegmentMemberzions:BankcardAndOtherRevolvingPlansMember2024-01-012024-09-300000109380us-gaap:ConsumerPortfolioSegmentMemberzions:OtherConsumerLoansMember2024-01-012024-09-300000109380zions:NonaccrualMember2025-09-300000109380us-gaap:PaymentDeferralMember2025-07-012025-09-300000109380us-gaap:PaymentDeferralMember2025-01-012025-09-300000109380us-gaap:PaymentDeferralMember2024-07-012024-09-300000109380us-gaap:PaymentDeferralMember2024-01-012024-09-300000109380us-gaap:CommercialPortfolioSegmentMemberzions:CommercialAndIndustrialMemberus-gaap:ContractualInterestRateReductionMember2025-07-012025-09-300000109380us-gaap:CommercialPortfolioSegmentMemberzions:CommercialAndIndustrialMemberus-gaap:ExtendedMaturityMember2025-07-012025-09-300000109380us-gaap:CommercialPortfolioSegmentMemberzions:CommercialAndIndustrialMemberus-gaap:PrincipalForgivenessMember2025-07-012025-09-300000109380us-gaap:CommercialPortfolioSegmentMemberzions:CommercialAndIndustrialMemberus-gaap:PaymentDeferralMember2025-07-012025-09-300000109380us-gaap:CommercialPortfolioSegmentMemberzions:CommercialAndIndustrialMemberzions:MultipleModificationTypesMember2025-07-012025-09-300000109380us-gaap:CommercialPortfolioSegmentMemberzions:OwnerOccupiedMemberus-gaap:ContractualInterestRateReductionMember2025-07-012025-09-300000109380us-gaap:CommercialPortfolioSegmentMemberzions:OwnerOccupiedMemberus-gaap:ExtendedMaturityMember2025-07-012025-09-300000109380us-gaap:CommercialPortfolioSegmentMemberzions:OwnerOccupiedMemberus-gaap:PrincipalForgivenessMember2025-07-012025-09-300000109380us-gaap:CommercialPortfolioSegmentMemberzions:OwnerOccupiedMemberus-gaap:PaymentDeferralMember2025-07-012025-09-300000109380us-gaap:CommercialPortfolioSegmentMemberzions:OwnerOccupiedMemberzions:MultipleModificationTypesMember2025-07-012025-09-300000109380us-gaap:CommercialPortfolioSegmentMemberzions:OwnerOccupiedMember2025-07-012025-09-300000109380us-gaap:CommercialPortfolioSegmentMemberus-gaap:ContractualInterestRateReductionMember2025-07-012025-09-300000109380us-gaap:CommercialPortfolioSegmentMemberus-gaap:ExtendedMaturityMember2025-07-012025-09-300000109380us-gaap:CommercialPortfolioSegmentMemberus-gaap:PrincipalForgivenessMember2025-07-012025-09-300000109380us-gaap:CommercialPortfolioSegmentMemberus-gaap:PaymentDeferralMember2025-07-012025-09-300000109380us-gaap:CommercialPortfolioSegmentMemberzions:MultipleModificationTypesMember2025-07-012025-09-300000109380us-gaap:CommercialRealEstatePortfolioSegmentMemberzions:TermMemberus-gaap:ContractualInterestRateReductionMember2025-07-012025-09-300000109380us-gaap:CommercialRealEstatePortfolioSegmentMemberzions:TermMemberus-gaap:ExtendedMaturityMember2025-07-012025-09-300000109380us-gaap:CommercialRealEstatePortfolioSegmentMemberzions:TermMemberus-gaap:PrincipalForgivenessMember2025-07-012025-09-300000109380us-gaap:CommercialRealEstatePortfolioSegmentMemberzions:TermMemberus-gaap:PaymentDeferralMember2025-07-012025-09-300000109380us-gaap:CommercialRealEstatePortfolioSegmentMemberzions:TermMemberzions:MultipleModificationTypesMember2025-07-012025-09-300000109380us-gaap:CommercialRealEstatePortfolioSegmentMemberzions:ConstructionAndLandDevelopmentMemberus-gaap:ContractualInterestRateReductionMember2025-07-012025-09-300000109380us-gaap:CommercialRealEstatePortfolioSegmentMemberzions:ConstructionAndLandDevelopmentMemberus-gaap:ExtendedMaturityMember2025-07-012025-09-300000109380us-gaap:CommercialRealEstatePortfolioSegmentMemberzions:ConstructionAndLandDevelopmentMemberus-gaap:PrincipalForgivenessMember2025-07-012025-09-300000109380us-gaap:CommercialRealEstatePortfolioSegmentMemberzions:ConstructionAndLandDevelopmentMemberus-gaap:PaymentDeferralMember2025-07-012025-09-300000109380us-gaap:CommercialRealEstatePortfolioSegmentMemberzions:ConstructionAndLandDevelopmentMemberzions:MultipleModificationTypesMember2025-07-012025-09-300000109380us-gaap:CommercialRealEstatePortfolioSegmentMemberzions:ConstructionAndLandDevelopmentMember2025-07-012025-09-300000109380us-gaap:CommercialRealEstatePortfolioSegmentMemberus-gaap:ContractualInterestRateReductionMember2025-07-012025-09-300000109380us-gaap:CommercialRealEstatePortfolioSegmentMemberus-gaap:ExtendedMaturityMember2025-07-012025-09-300000109380us-gaap:CommercialRealEstatePortfolioSegmentMemberus-gaap:PrincipalForgivenessMember2025-07-012025-09-300000109380us-gaap:CommercialRealEstatePortfolioSegmentMemberus-gaap:PaymentDeferralMember2025-07-012025-09-300000109380us-gaap:CommercialRealEstatePortfolioSegmentMemberzions:MultipleModificationTypesMember2025-07-012025-09-300000109380us-gaap:ConsumerPortfolioSegmentMemberzions:OneThroughFourFamilyResidentialMemberus-gaap:ContractualInterestRateReductionMember2025-07-012025-09-300000109380us-gaap:ConsumerPortfolioSegmentMemberzions:OneThroughFourFamilyResidentialMemberus-gaap:ExtendedMaturityMember2025-07-012025-09-300000109380us-gaap:ConsumerPortfolioSegmentMemberzions:OneThroughFourFamilyResidentialMemberus-gaap:PrincipalForgivenessMember2025-07-012025-09-300000109380us-gaap:ConsumerPortfolioSegmentMemberzions:OneThroughFourFamilyResidentialMemberus-gaap:PaymentDeferralMember2025-07-012025-09-300000109380us-gaap:ConsumerPortfolioSegmentMemberzions:OneThroughFourFamilyResidentialMemberzions:MultipleModificationTypesMember2025-07-012025-09-300000109380us-gaap:ConsumerPortfolioSegmentMemberzions:OneThroughFourFamilyResidentialMember2025-07-012025-09-300000109380us-gaap:ContractualInterestRateReductionMember2025-07-012025-09-300000109380us-gaap:ExtendedMaturityMember2025-07-012025-09-300000109380us-gaap:PrincipalForgivenessMember2025-07-012025-09-300000109380zions:MultipleModificationTypesMember2025-07-012025-09-300000109380us-gaap:CommercialPortfolioSegmentMemberzions:CommercialAndIndustrialMemberus-gaap:ContractualInterestRateReductionMember2025-01-012025-09-300000109380us-gaap:CommercialPortfolioSegmentMemberzions:CommercialAndIndustrialMemberus-gaap:ExtendedMaturityMember2025-01-012025-09-300000109380us-gaap:CommercialPortfolioSegmentMemberzions:CommercialAndIndustrialMemberus-gaap:PrincipalForgivenessMember2025-01-012025-09-300000109380us-gaap:CommercialPortfolioSegmentMemberzions:CommercialAndIndustrialMemberus-gaap:PaymentDeferralMember2025-01-012025-09-300000109380us-gaap:CommercialPortfolioSegmentMemberzions:CommercialAndIndustrialMemberzions:MultipleModificationTypesMember2025-01-012025-09-300000109380us-gaap:CommercialPortfolioSegmentMemberzions:OwnerOccupiedMemberus-gaap:ContractualInterestRateReductionMember2025-01-012025-09-300000109380us-gaap:CommercialPortfolioSegmentMemberzions:OwnerOccupiedMemberus-gaap:ExtendedMaturityMember2025-01-012025-09-300000109380us-gaap:CommercialPortfolioSegmentMemberzions:OwnerOccupiedMemberus-gaap:PrincipalForgivenessMember2025-01-012025-09-300000109380us-gaap:CommercialPortfolioSegmentMemberzions:OwnerOccupiedMemberus-gaap:PaymentDeferralMember2025-01-012025-09-300000109380us-gaap:CommercialPortfolioSegmentMemberzions:OwnerOccupiedMemberzions:MultipleModificationTypesMember2025-01-012025-09-300000109380us-gaap:CommercialPortfolioSegmentMemberzions:OwnerOccupiedMember2025-01-012025-09-300000109380us-gaap:CommercialPortfolioSegmentMemberus-gaap:ContractualInterestRateReductionMember2025-01-012025-09-300000109380us-gaap:CommercialPortfolioSegmentMemberus-gaap:ExtendedMaturityMember2025-01-012025-09-300000109380us-gaap:CommercialPortfolioSegmentMemberus-gaap:PrincipalForgivenessMember2025-01-012025-09-300000109380us-gaap:CommercialPortfolioSegmentMemberus-gaap:PaymentDeferralMember2025-01-012025-09-300000109380us-gaap:CommercialPortfolioSegmentMemberzions:MultipleModificationTypesMember2025-01-012025-09-300000109380us-gaap:CommercialRealEstatePortfolioSegmentMemberzions:TermMemberus-gaap:ContractualInterestRateReductionMember2025-01-012025-09-300000109380us-gaap:CommercialRealEstatePortfolioSegmentMemberzions:TermMemberus-gaap:ExtendedMaturityMember2025-01-012025-09-300000109380us-gaap:CommercialRealEstatePortfolioSegmentMemberzions:TermMemberus-gaap:PrincipalForgivenessMember2025-01-012025-09-300000109380us-gaap:CommercialRealEstatePortfolioSegmentMemberzions:TermMemberus-gaap:PaymentDeferralMember2025-01-012025-09-300000109380us-gaap:CommercialRealEstatePortfolioSegmentMemberzions:TermMemberzions:MultipleModificationTypesMember2025-01-012025-09-300000109380us-gaap:CommercialRealEstatePortfolioSegmentMemberzions:ConstructionAndLandDevelopmentMemberus-gaap:ContractualInterestRateReductionMember2025-01-012025-09-300000109380us-gaap:CommercialRealEstatePortfolioSegmentMemberzions:ConstructionAndLandDevelopmentMemberus-gaap:ExtendedMaturityMember2025-01-012025-09-300000109380us-gaap:CommercialRealEstatePortfolioSegmentMemberzions:ConstructionAndLandDevelopmentMemberus-gaap:PrincipalForgivenessMember2025-01-012025-09-300000109380us-gaap:CommercialRealEstatePortfolioSegmentMemberzions:ConstructionAndLandDevelopmentMemberus-gaap:PaymentDeferralMember2025-01-012025-09-300000109380us-gaap:CommercialRealEstatePortfolioSegmentMemberzions:ConstructionAndLandDevelopmentMemberzions:MultipleModificationTypesMember2025-01-012025-09-300000109380us-gaap:CommercialRealEstatePortfolioSegmentMemberzions:ConstructionAndLandDevelopmentMember2025-01-012025-09-300000109380us-gaap:CommercialRealEstatePortfolioSegmentMemberus-gaap:ContractualInterestRateReductionMember2025-01-012025-09-300000109380us-gaap:CommercialRealEstatePortfolioSegmentMemberus-gaap:ExtendedMaturityMember2025-01-012025-09-300000109380us-gaap:CommercialRealEstatePortfolioSegmentMemberus-gaap:PrincipalForgivenessMember2025-01-012025-09-300000109380us-gaap:CommercialRealEstatePortfolioSegmentMemberus-gaap:PaymentDeferralMember2025-01-012025-09-300000109380us-gaap:CommercialRealEstatePortfolioSegmentMemberzions:MultipleModificationTypesMember2025-01-012025-09-300000109380us-gaap:ConsumerPortfolioSegmentMemberzions:OneThroughFourFamilyResidentialMemberus-gaap:ContractualInterestRateReductionMember2025-01-012025-09-300000109380us-gaap:ConsumerPortfolioSegmentMemberzions:OneThroughFourFamilyResidentialMemberus-gaap:ExtendedMaturityMember2025-01-012025-09-300000109380us-gaap:ConsumerPortfolioSegmentMemberzions:OneThroughFourFamilyResidentialMemberus-gaap:PrincipalForgivenessMember2025-01-012025-09-300000109380us-gaap:ConsumerPortfolioSegmentMemberzions:OneThroughFourFamilyResidentialMemberus-gaap:PaymentDeferralMember2025-01-012025-09-300000109380us-gaap:ConsumerPortfolioSegmentMemberzions:OneThroughFourFamilyResidentialMemberzions:MultipleModificationTypesMember2025-01-012025-09-300000109380us-gaap:ConsumerPortfolioSegmentMemberus-gaap:HomeEquityMemberus-gaap:ContractualInterestRateReductionMember2025-01-012025-09-300000109380us-gaap:ConsumerPortfolioSegmentMemberus-gaap:HomeEquityMemberus-gaap:ExtendedMaturityMember2025-01-012025-09-300000109380us-gaap:ConsumerPortfolioSegmentMemberus-gaap:HomeEquityMemberus-gaap:PrincipalForgivenessMember2025-01-012025-09-300000109380us-gaap:ConsumerPortfolioSegmentMemberus-gaap:HomeEquityMemberus-gaap:PaymentDeferralMember2025-01-012025-09-300000109380us-gaap:ConsumerPortfolioSegmentMemberus-gaap:HomeEquityMemberzions:MultipleModificationTypesMember2025-01-012025-09-300000109380us-gaap:ConsumerPortfolioSegmentMemberus-gaap:ContractualInterestRateReductionMember2025-01-012025-09-300000109380us-gaap:ConsumerPortfolioSegmentMemberus-gaap:ExtendedMaturityMember2025-01-012025-09-300000109380us-gaap:ConsumerPortfolioSegmentMemberus-gaap:PrincipalForgivenessMember2025-01-012025-09-300000109380us-gaap:ConsumerPortfolioSegmentMemberus-gaap:PaymentDeferralMember2025-01-012025-09-300000109380us-gaap:ConsumerPortfolioSegmentMemberzions:MultipleModificationTypesMember2025-01-012025-09-300000109380us-gaap:ContractualInterestRateReductionMember2025-01-012025-09-300000109380us-gaap:ExtendedMaturityMember2025-01-012025-09-300000109380us-gaap:PrincipalForgivenessMember2025-01-012025-09-300000109380zions:MultipleModificationTypesMember2025-01-012025-09-300000109380us-gaap:CommercialPortfolioSegmentMemberzions:CommercialAndIndustrialMemberus-gaap:ContractualInterestRateReductionMember2024-07-012024-09-300000109380us-gaap:CommercialPortfolioSegmentMemberzions:CommercialAndIndustrialMemberus-gaap:ExtendedMaturityMember2024-07-012024-09-300000109380us-gaap:CommercialPortfolioSegmentMemberzions:CommercialAndIndustrialMemberus-gaap:PrincipalForgivenessMember2024-07-012024-09-300000109380us-gaap:CommercialPortfolioSegmentMemberzions:CommercialAndIndustrialMemberus-gaap:PaymentDeferralMember2024-07-012024-09-300000109380us-gaap:CommercialPortfolioSegmentMemberzions:CommercialAndIndustrialMemberzions:MultipleModificationTypesMember2024-07-012024-09-300000109380us-gaap:CommercialRealEstatePortfolioSegmentMemberzions:TermMemberus-gaap:ContractualInterestRateReductionMember2024-07-012024-09-300000109380us-gaap:CommercialRealEstatePortfolioSegmentMemberzions:TermMemberus-gaap:ExtendedMaturityMember2024-07-012024-09-300000109380us-gaap:CommercialRealEstatePortfolioSegmentMemberzions:TermMemberus-gaap:PrincipalForgivenessMember2024-07-012024-09-300000109380us-gaap:CommercialRealEstatePortfolioSegmentMemberzions:TermMemberus-gaap:PaymentDeferralMember2024-07-012024-09-300000109380us-gaap:CommercialRealEstatePortfolioSegmentMemberzions:TermMemberzions:MultipleModificationTypesMember2024-07-012024-09-300000109380us-gaap:CommercialRealEstatePortfolioSegmentMemberzions:TermMember2024-07-012024-09-300000109380us-gaap:CommercialRealEstatePortfolioSegmentMemberzions:ConstructionAndLandDevelopmentMemberus-gaap:ContractualInterestRateReductionMember2024-07-012024-09-300000109380us-gaap:CommercialRealEstatePortfolioSegmentMemberzions:ConstructionAndLandDevelopmentMemberus-gaap:ExtendedMaturityMember2024-07-012024-09-300000109380us-gaap:CommercialRealEstatePortfolioSegmentMemberzions:ConstructionAndLandDevelopmentMemberus-gaap:PrincipalForgivenessMember2024-07-012024-09-300000109380us-gaap:CommercialRealEstatePortfolioSegmentMemberzions:ConstructionAndLandDevelopmentMemberus-gaap:PaymentDeferralMember2024-07-012024-09-300000109380us-gaap:CommercialRealEstatePortfolioSegmentMemberzions:ConstructionAndLandDevelopmentMemberzions:MultipleModificationTypesMember2024-07-012024-09-300000109380us-gaap:CommercialRealEstatePortfolioSegmentMemberzions:ConstructionAndLandDevelopmentMember2024-07-012024-09-300000109380us-gaap:CommercialRealEstatePortfolioSegmentMemberus-gaap:ContractualInterestRateReductionMember2024-07-012024-09-300000109380us-gaap:CommercialRealEstatePortfolioSegmentMemberus-gaap:ExtendedMaturityMember2024-07-012024-09-300000109380us-gaap:CommercialRealEstatePortfolioSegmentMemberus-gaap:PrincipalForgivenessMember2024-07-012024-09-300000109380us-gaap:CommercialRealEstatePortfolioSegmentMemberus-gaap:PaymentDeferralMember2024-07-012024-09-300000109380us-gaap:CommercialRealEstatePortfolioSegmentMemberzions:MultipleModificationTypesMember2024-07-012024-09-300000109380us-gaap:ContractualInterestRateReductionMember2024-07-012024-09-300000109380us-gaap:ExtendedMaturityMember2024-07-012024-09-300000109380us-gaap:PrincipalForgivenessMember2024-07-012024-09-300000109380zions:MultipleModificationTypesMember2024-07-012024-09-300000109380us-gaap:CommercialPortfolioSegmentMemberzions:CommercialAndIndustrialMemberus-gaap:ContractualInterestRateReductionMember2024-01-012024-09-300000109380us-gaap:CommercialPortfolioSegmentMemberzions:CommercialAndIndustrialMemberus-gaap:ExtendedMaturityMember2024-01-012024-09-300000109380us-gaap:CommercialPortfolioSegmentMemberzions:CommercialAndIndustrialMemberus-gaap:PrincipalForgivenessMember2024-01-012024-09-300000109380us-gaap:CommercialPortfolioSegmentMemberzions:CommercialAndIndustrialMemberus-gaap:PaymentDeferralMember2024-01-012024-09-300000109380us-gaap:CommercialPortfolioSegmentMemberzions:CommercialAndIndustrialMemberzions:MultipleModificationTypesMember2024-01-012024-09-300000109380us-gaap:CommercialPortfolioSegmentMemberzions:OwnerOccupiedMemberus-gaap:ContractualInterestRateReductionMember2024-01-012024-09-300000109380us-gaap:CommercialPortfolioSegmentMemberzions:OwnerOccupiedMemberus-gaap:ExtendedMaturityMember2024-01-012024-09-300000109380us-gaap:CommercialPortfolioSegmentMemberzions:OwnerOccupiedMemberus-gaap:PrincipalForgivenessMember2024-01-012024-09-300000109380us-gaap:CommercialPortfolioSegmentMemberzions:OwnerOccupiedMemberus-gaap:PaymentDeferralMember2024-01-012024-09-300000109380us-gaap:CommercialPortfolioSegmentMemberzions:OwnerOccupiedMemberzions:MultipleModificationTypesMember2024-01-012024-09-300000109380us-gaap:CommercialPortfolioSegmentMemberzions:MunicipalMemberus-gaap:ContractualInterestRateReductionMember2024-01-012024-09-300000109380us-gaap:CommercialPortfolioSegmentMemberzions:MunicipalMemberus-gaap:ExtendedMaturityMember2024-01-012024-09-300000109380us-gaap:CommercialPortfolioSegmentMemberzions:MunicipalMemberus-gaap:PrincipalForgivenessMember2024-01-012024-09-300000109380us-gaap:CommercialPortfolioSegmentMemberzions:MunicipalMemberus-gaap:PaymentDeferralMember2024-01-012024-09-300000109380us-gaap:CommercialPortfolioSegmentMemberzions:MunicipalMemberzions:MultipleModificationTypesMember2024-01-012024-09-300000109380us-gaap:CommercialPortfolioSegmentMemberzions:MunicipalMember2024-01-012024-09-300000109380us-gaap:CommercialPortfolioSegmentMemberus-gaap:ContractualInterestRateReductionMember2024-01-012024-09-300000109380us-gaap:CommercialPortfolioSegmentMemberus-gaap:ExtendedMaturityMember2024-01-012024-09-300000109380us-gaap:CommercialPortfolioSegmentMemberus-gaap:PrincipalForgivenessMember2024-01-012024-09-300000109380us-gaap:CommercialPortfolioSegmentMemberus-gaap:PaymentDeferralMember2024-01-012024-09-300000109380us-gaap:CommercialPortfolioSegmentMemberzions:MultipleModificationTypesMember2024-01-012024-09-300000109380us-gaap:CommercialRealEstatePortfolioSegmentMemberzions:TermMemberus-gaap:ContractualInterestRateReductionMember2024-01-012024-09-300000109380us-gaap:CommercialRealEstatePortfolioSegmentMemberzions:TermMemberus-gaap:ExtendedMaturityMember2024-01-012024-09-300000109380us-gaap:CommercialRealEstatePortfolioSegmentMemberzions:TermMemberus-gaap:PrincipalForgivenessMember2024-01-012024-09-300000109380us-gaap:CommercialRealEstatePortfolioSegmentMemberzions:TermMemberus-gaap:PaymentDeferralMember2024-01-012024-09-300000109380us-gaap:CommercialRealEstatePortfolioSegmentMemberzions:TermMemberzions:MultipleModificationTypesMember2024-01-012024-09-300000109380us-gaap:CommercialRealEstatePortfolioSegmentMemberzions:ConstructionAndLandDevelopmentMemberus-gaap:ContractualInterestRateReductionMember2024-01-012024-09-300000109380us-gaap:CommercialRealEstatePortfolioSegmentMemberzions:ConstructionAndLandDevelopmentMemberus-gaap:ExtendedMaturityMember2024-01-012024-09-300000109380us-gaap:CommercialRealEstatePortfolioSegmentMemberzions:ConstructionAndLandDevelopmentMemberus-gaap:PrincipalForgivenessMember2024-01-012024-09-300000109380us-gaap:CommercialRealEstatePortfolioSegmentMemberzions:ConstructionAndLandDevelopmentMemberus-gaap:PaymentDeferralMember2024-01-012024-09-300000109380us-gaap:CommercialRealEstatePortfolioSegmentMemberzions:ConstructionAndLandDevelopmentMemberzions:MultipleModificationTypesMember2024-01-012024-09-300000109380us-gaap:CommercialRealEstatePortfolioSegmentMemberzions:ConstructionAndLandDevelopmentMember2024-01-012024-09-300000109380us-gaap:CommercialRealEstatePortfolioSegmentMemberus-gaap:ContractualInterestRateReductionMember2024-01-012024-09-300000109380us-gaap:CommercialRealEstatePortfolioSegmentMemberus-gaap:ExtendedMaturityMember2024-01-012024-09-300000109380us-gaap:CommercialRealEstatePortfolioSegmentMemberus-gaap:PrincipalForgivenessMember2024-01-012024-09-300000109380us-gaap:CommercialRealEstatePortfolioSegmentMemberus-gaap:PaymentDeferralMember2024-01-012024-09-300000109380us-gaap:CommercialRealEstatePortfolioSegmentMemberzions:MultipleModificationTypesMember2024-01-012024-09-300000109380us-gaap:ConsumerPortfolioSegmentMemberzions:OneThroughFourFamilyResidentialMemberus-gaap:ContractualInterestRateReductionMember2024-01-012024-09-300000109380us-gaap:ConsumerPortfolioSegmentMemberzions:OneThroughFourFamilyResidentialMemberus-gaap:ExtendedMaturityMember2024-01-012024-09-300000109380us-gaap:ConsumerPortfolioSegmentMemberzions:OneThroughFourFamilyResidentialMemberus-gaap:PrincipalForgivenessMember2024-01-012024-09-300000109380us-gaap:ConsumerPortfolioSegmentMemberzions:OneThroughFourFamilyResidentialMemberus-gaap:PaymentDeferralMember2024-01-012024-09-300000109380us-gaap:ConsumerPortfolioSegmentMemberzions:OneThroughFourFamilyResidentialMemberzions:MultipleModificationTypesMember2024-01-012024-09-300000109380us-gaap:ConsumerPortfolioSegmentMemberus-gaap:HomeEquityMemberus-gaap:ContractualInterestRateReductionMember2024-01-012024-09-300000109380us-gaap:ConsumerPortfolioSegmentMemberus-gaap:HomeEquityMemberus-gaap:ExtendedMaturityMember2024-01-012024-09-300000109380us-gaap:ConsumerPortfolioSegmentMemberus-gaap:HomeEquityMemberus-gaap:PrincipalForgivenessMember2024-01-012024-09-300000109380us-gaap:ConsumerPortfolioSegmentMemberus-gaap:HomeEquityMemberus-gaap:PaymentDeferralMember2024-01-012024-09-300000109380us-gaap:ConsumerPortfolioSegmentMemberus-gaap:HomeEquityMemberzions:MultipleModificationTypesMember2024-01-012024-09-300000109380us-gaap:ConsumerPortfolioSegmentMemberzions:OtherConsumerLoansMemberus-gaap:ContractualInterestRateReductionMember2024-01-012024-09-300000109380us-gaap:ConsumerPortfolioSegmentMemberzions:OtherConsumerLoansMemberus-gaap:ExtendedMaturityMember2024-01-012024-09-300000109380us-gaap:ConsumerPortfolioSegmentMemberzions:OtherConsumerLoansMemberus-gaap:PrincipalForgivenessMember2024-01-012024-09-300000109380us-gaap:ConsumerPortfolioSegmentMemberzions:OtherConsumerLoansMemberus-gaap:PaymentDeferralMember2024-01-012024-09-300000109380us-gaap:ConsumerPortfolioSegmentMemberzions:OtherConsumerLoansMemberzions:MultipleModificationTypesMember2024-01-012024-09-300000109380us-gaap:ConsumerPortfolioSegmentMemberus-gaap:ContractualInterestRateReductionMember2024-01-012024-09-300000109380us-gaap:ConsumerPortfolioSegmentMemberus-gaap:ExtendedMaturityMember2024-01-012024-09-300000109380us-gaap:ConsumerPortfolioSegmentMemberus-gaap:PrincipalForgivenessMember2024-01-012024-09-300000109380us-gaap:ConsumerPortfolioSegmentMemberus-gaap:PaymentDeferralMember2024-01-012024-09-300000109380us-gaap:ConsumerPortfolioSegmentMemberzions:MultipleModificationTypesMember2024-01-012024-09-300000109380us-gaap:ContractualInterestRateReductionMember2024-01-012024-09-300000109380us-gaap:ExtendedMaturityMember2024-01-012024-09-300000109380us-gaap:PrincipalForgivenessMember2024-01-012024-09-300000109380zions:MultipleModificationTypesMember2024-01-012024-09-300000109380us-gaap:ConsumerPortfolioSegmentMemberus-gaap:HomeEquityMember2025-07-012025-09-300000109380us-gaap:CommercialPortfolioSegmentMemberzions:MunicipalMember2024-07-012024-09-300000109380us-gaap:ConsumerPortfolioSegmentMemberzions:OneThroughFourFamilyResidentialMember2024-07-012024-09-300000109380us-gaap:ConsumerPortfolioSegmentMemberzions:OtherConsumerLoansMember2024-07-012024-09-300000109380us-gaap:CommercialPortfolioSegmentMemberzions:CommercialAndIndustrialMemberus-gaap:FinancialAssetNotPastDueMember2024-09-300000109380us-gaap:CommercialPortfolioSegmentMemberzions:CommercialAndIndustrialMemberzions:FinancialAsset30To89DaysPastDueMember2024-09-300000109380us-gaap:CommercialPortfolioSegmentMemberzions:CommercialAndIndustrialMemberus-gaap:FinancingReceivablesEqualToGreaterThan90DaysPastDueMember2024-09-300000109380us-gaap:CommercialPortfolioSegmentMemberzions:CommercialAndIndustrialMemberus-gaap:FinancialAssetPastDueMember2024-09-300000109380us-gaap:CommercialPortfolioSegmentMemberzions:CommercialAndIndustrialMember2024-09-300000109380us-gaap:CommercialPortfolioSegmentMemberzions:OwnerOccupiedMemberus-gaap:FinancialAssetNotPastDueMember2024-09-300000109380us-gaap:CommercialPortfolioSegmentMemberzions:OwnerOccupiedMemberzions:FinancialAsset30To89DaysPastDueMember2024-09-300000109380us-gaap:CommercialPortfolioSegmentMemberzions:OwnerOccupiedMemberus-gaap:FinancingReceivablesEqualToGreaterThan90DaysPastDueMember2024-09-300000109380us-gaap:CommercialPortfolioSegmentMemberzions:OwnerOccupiedMemberus-gaap:FinancialAssetPastDueMember2024-09-300000109380us-gaap:CommercialPortfolioSegmentMemberzions:OwnerOccupiedMember2024-09-300000109380us-gaap:CommercialPortfolioSegmentMemberzions:MunicipalMemberus-gaap:FinancialAssetNotPastDueMember2024-09-300000109380us-gaap:CommercialPortfolioSegmentMemberzions:MunicipalMemberzions:FinancialAsset30To89DaysPastDueMember2024-09-300000109380us-gaap:CommercialPortfolioSegmentMemberzions:MunicipalMemberus-gaap:FinancingReceivablesEqualToGreaterThan90DaysPastDueMember2024-09-300000109380us-gaap:CommercialPortfolioSegmentMemberzions:MunicipalMemberus-gaap:FinancialAssetPastDueMember2024-09-300000109380us-gaap:CommercialPortfolioSegmentMemberzions:MunicipalMember2024-09-300000109380us-gaap:CommercialPortfolioSegmentMemberus-gaap:FinancialAssetNotPastDueMember2024-09-300000109380us-gaap:CommercialPortfolioSegmentMemberzions:FinancialAsset30To89DaysPastDueMember2024-09-300000109380us-gaap:CommercialPortfolioSegmentMemberus-gaap:FinancingReceivablesEqualToGreaterThan90DaysPastDueMember2024-09-300000109380us-gaap:CommercialPortfolioSegmentMemberus-gaap:FinancialAssetPastDueMember2024-09-300000109380us-gaap:CommercialRealEstatePortfolioSegmentMemberzions:TermMemberus-gaap:FinancialAssetNotPastDueMember2024-09-300000109380us-gaap:CommercialRealEstatePortfolioSegmentMemberzions:TermMemberzions:FinancialAsset30To89DaysPastDueMember2024-09-300000109380us-gaap:CommercialRealEstatePortfolioSegmentMemberzions:TermMemberus-gaap:FinancingReceivablesEqualToGreaterThan90DaysPastDueMember2024-09-300000109380us-gaap:CommercialRealEstatePortfolioSegmentMemberzions:TermMemberus-gaap:FinancialAssetPastDueMember2024-09-300000109380us-gaap:CommercialRealEstatePortfolioSegmentMemberzions:TermMember2024-09-300000109380us-gaap:CommercialRealEstatePortfolioSegmentMemberzions:ConstructionAndLandDevelopmentMemberus-gaap:FinancialAssetNotPastDueMember2024-09-300000109380us-gaap:CommercialRealEstatePortfolioSegmentMemberzions:ConstructionAndLandDevelopmentMemberzions:FinancialAsset30To89DaysPastDueMember2024-09-300000109380us-gaap:CommercialRealEstatePortfolioSegmentMemberzions:ConstructionAndLandDevelopmentMemberus-gaap:FinancingReceivablesEqualToGreaterThan90DaysPastDueMember2024-09-300000109380us-gaap:CommercialRealEstatePortfolioSegmentMemberzions:ConstructionAndLandDevelopmentMemberus-gaap:FinancialAssetPastDueMember2024-09-300000109380us-gaap:CommercialRealEstatePortfolioSegmentMemberzions:ConstructionAndLandDevelopmentMember2024-09-300000109380us-gaap:CommercialRealEstatePortfolioSegmentMemberus-gaap:FinancialAssetNotPastDueMember2024-09-300000109380us-gaap:CommercialRealEstatePortfolioSegmentMemberzions:FinancialAsset30To89DaysPastDueMember2024-09-300000109380us-gaap:CommercialRealEstatePortfolioSegmentMemberus-gaap:FinancingReceivablesEqualToGreaterThan90DaysPastDueMember2024-09-300000109380us-gaap:CommercialRealEstatePortfolioSegmentMemberus-gaap:FinancialAssetPastDueMember2024-09-300000109380us-gaap:ConsumerPortfolioSegmentMemberzions:OneThroughFourFamilyResidentialMemberus-gaap:FinancialAssetNotPastDueMember2024-09-300000109380us-gaap:ConsumerPortfolioSegmentMemberzions:OneThroughFourFamilyResidentialMemberzions:FinancialAsset30To89DaysPastDueMember2024-09-300000109380us-gaap:ConsumerPortfolioSegmentMemberzions:OneThroughFourFamilyResidentialMemberus-gaap:FinancingReceivablesEqualToGreaterThan90DaysPastDueMember2024-09-300000109380us-gaap:ConsumerPortfolioSegmentMemberzions:OneThroughFourFamilyResidentialMemberus-gaap:FinancialAssetPastDueMember2024-09-300000109380us-gaap:ConsumerPortfolioSegmentMemberzions:OneThroughFourFamilyResidentialMember2024-09-300000109380us-gaap:ConsumerPortfolioSegmentMemberus-gaap:HomeEquityMemberus-gaap:FinancialAssetNotPastDueMember2024-09-300000109380us-gaap:ConsumerPortfolioSegmentMemberus-gaap:HomeEquityMemberzions:FinancialAsset30To89DaysPastDueMember2024-09-300000109380us-gaap:ConsumerPortfolioSegmentMemberus-gaap:HomeEquityMemberus-gaap:FinancingReceivablesEqualToGreaterThan90DaysPastDueMember2024-09-300000109380us-gaap:ConsumerPortfolioSegmentMemberus-gaap:HomeEquityMemberus-gaap:FinancialAssetPastDueMember2024-09-300000109380us-gaap:ConsumerPortfolioSegmentMemberus-gaap:HomeEquityMember2024-09-300000109380us-gaap:ConsumerPortfolioSegmentMemberzions:OtherConsumerLoansMemberus-gaap:FinancialAssetNotPastDueMember2024-09-300000109380us-gaap:ConsumerPortfolioSegmentMemberzions:OtherConsumerLoansMemberzions:FinancialAsset30To89DaysPastDueMember2024-09-300000109380us-gaap:ConsumerPortfolioSegmentMemberzions:OtherConsumerLoansMemberus-gaap:FinancingReceivablesEqualToGreaterThan90DaysPastDueMember2024-09-300000109380us-gaap:ConsumerPortfolioSegmentMemberzions:OtherConsumerLoansMemberus-gaap:FinancialAssetPastDueMember2024-09-300000109380us-gaap:ConsumerPortfolioSegmentMemberzions:OtherConsumerLoansMember2024-09-300000109380us-gaap:ConsumerPortfolioSegmentMemberus-gaap:FinancialAssetNotPastDueMember2024-09-300000109380us-gaap:ConsumerPortfolioSegmentMemberzions:FinancialAsset30To89DaysPastDueMember2024-09-300000109380us-gaap:ConsumerPortfolioSegmentMemberus-gaap:FinancingReceivablesEqualToGreaterThan90DaysPastDueMember2024-09-300000109380us-gaap:ConsumerPortfolioSegmentMemberus-gaap:FinancialAssetPastDueMember2024-09-300000109380us-gaap:FinancialAssetNotPastDueMember2024-09-300000109380zions:FinancialAsset30To89DaysPastDueMember2024-09-300000109380us-gaap:FinancingReceivablesEqualToGreaterThan90DaysPastDueMember2024-09-300000109380us-gaap:FinancialAssetPastDueMember2024-09-300000109380us-gaap:CommercialPortfolioSegmentMemberzions:CommercialAndIndustrialMemberzions:SingleFamilyResidentialMember2025-09-300000109380us-gaap:CommercialPortfolioSegmentMemberzions:OwnerOccupiedMemberzions:IndustrialBuildingMember2025-09-300000109380us-gaap:CommercialPortfolioSegmentMemberzions:MunicipalMemberzions:MultifamilyApartmentsMember2025-09-300000109380us-gaap:CommercialRealEstatePortfolioSegmentMemberzions:TermMembersrt:OfficeBuildingMember2025-09-300000109380us-gaap:ConsumerPortfolioSegmentMemberzions:OneThroughFourFamilyResidentialMemberzions:SingleFamilyResidentialMember2025-09-300000109380us-gaap:CommercialPortfolioSegmentMemberzions:OwnerOccupiedMemberzions:RetailFacilityMember2024-12-310000109380us-gaap:CommercialPortfolioSegmentMemberzions:MunicipalMemberzions:MultifamilyApartmentsMember2024-12-310000109380us-gaap:CommercialRealEstatePortfolioSegmentMemberzions:TermMembersrt:OfficeBuildingMember2024-12-310000109380us-gaap:ConsumerPortfolioSegmentMemberzions:OneThroughFourFamilyResidentialMemberzions:SingleFamilyResidentialMember2024-12-310000109380us-gaap:ConsumerPortfolioSegmentMemberus-gaap:HomeEquityMemberzions:SingleFamilyResidentialMember2024-12-310000109380us-gaap:SecuritiesSoldUnderAgreementsToRepurchaseMemberus-gaap:AssetPledgedAsCollateralMember2025-09-300000109380us-gaap:USTreasurySecuritiesMemberus-gaap:SecuritiesSoldUnderAgreementsToRepurchaseMemberus-gaap:AssetPledgedAsCollateralMember2025-09-300000109380zions:HedgesOfFloatingRateAssetsMemberus-gaap:DesignatedAsHedgingInstrumentMemberus-gaap:CashFlowHedgingMember2025-09-300000109380zions:HedgesOfFloatingRateAssetsMemberus-gaap:OtherAssetsMemberus-gaap:DesignatedAsHedgingInstrumentMemberus-gaap:CashFlowHedgingMember2025-09-300000109380zions:HedgesOfFloatingRateAssetsMemberus-gaap:OtherLiabilitiesMemberus-gaap:DesignatedAsHedgingInstrumentMemberus-gaap:CashFlowHedgingMember2025-09-300000109380zions:HedgesOfFloatingRateAssetsMemberus-gaap:DesignatedAsHedgingInstrumentMemberus-gaap:CashFlowHedgingMember2024-12-310000109380zions:HedgesOfFloatingRateAssetsMemberus-gaap:OtherAssetsMemberus-gaap:DesignatedAsHedgingInstrumentMemberus-gaap:CashFlowHedgingMember2024-12-310000109380zions:HedgesOfFloatingRateAssetsMemberus-gaap:OtherLiabilitiesMemberus-gaap:DesignatedAsHedgingInstrumentMemberus-gaap:CashFlowHedgingMember2024-12-310000109380zions:HedgesOfFloatingRateLiabilitiesMemberus-gaap:DesignatedAsHedgingInstrumentMemberus-gaap:CashFlowHedgingMember2025-09-300000109380zions:HedgesOfFloatingRateLiabilitiesMemberus-gaap:OtherAssetsMemberus-gaap:DesignatedAsHedgingInstrumentMemberus-gaap:CashFlowHedgingMember2025-09-300000109380zions:HedgesOfFloatingRateLiabilitiesMemberus-gaap:OtherLiabilitiesMemberus-gaap:DesignatedAsHedgingInstrumentMemberus-gaap:CashFlowHedgingMember2025-09-300000109380zions:HedgesOfFloatingRateLiabilitiesMemberus-gaap:DesignatedAsHedgingInstrumentMemberus-gaap:CashFlowHedgingMember2024-12-310000109380zions:HedgesOfFloatingRateLiabilitiesMemberus-gaap:OtherAssetsMemberus-gaap:DesignatedAsHedgingInstrumentMemberus-gaap:CashFlowHedgingMember2024-12-310000109380zions:HedgesOfFloatingRateLiabilitiesMemberus-gaap:OtherLiabilitiesMemberus-gaap:DesignatedAsHedgingInstrumentMemberus-gaap:CashFlowHedgingMember2024-12-310000109380zions:HedgesOfFixedRateAssetsMemberus-gaap:DesignatedAsHedgingInstrumentMemberus-gaap:FairValueHedgingMember2025-09-300000109380zions:HedgesOfFixedRateAssetsMemberus-gaap:OtherAssetsMemberus-gaap:DesignatedAsHedgingInstrumentMemberus-gaap:FairValueHedgingMember2025-09-300000109380zions:HedgesOfFixedRateAssetsMemberus-gaap:OtherLiabilitiesMemberus-gaap:DesignatedAsHedgingInstrumentMemberus-gaap:FairValueHedgingMember2025-09-300000109380zions:HedgesOfFixedRateAssetsMemberus-gaap:DesignatedAsHedgingInstrumentMemberus-gaap:FairValueHedgingMember2024-12-310000109380zions:HedgesOfFixedRateAssetsMemberus-gaap:OtherAssetsMemberus-gaap:DesignatedAsHedgingInstrumentMemberus-gaap:FairValueHedgingMember2024-12-310000109380zions:HedgesOfFixedRateAssetsMemberus-gaap:OtherLiabilitiesMemberus-gaap:DesignatedAsHedgingInstrumentMemberus-gaap:FairValueHedgingMember2024-12-310000109380zions:HedgesOfFixedRateLiabilitiesMemberus-gaap:DesignatedAsHedgingInstrumentMemberus-gaap:FairValueHedgingMember2025-09-300000109380zions:HedgesOfFixedRateLiabilitiesMemberus-gaap:OtherAssetsMemberus-gaap:DesignatedAsHedgingInstrumentMemberus-gaap:FairValueHedgingMember2025-09-300000109380zions:HedgesOfFixedRateLiabilitiesMemberus-gaap:OtherLiabilitiesMemberus-gaap:DesignatedAsHedgingInstrumentMemberus-gaap:FairValueHedgingMember2025-09-300000109380zions:HedgesOfFixedRateLiabilitiesMemberus-gaap:DesignatedAsHedgingInstrumentMemberus-gaap:FairValueHedgingMember2024-12-310000109380zions:HedgesOfFixedRateLiabilitiesMemberus-gaap:OtherAssetsMemberus-gaap:DesignatedAsHedgingInstrumentMemberus-gaap:FairValueHedgingMember2024-12-310000109380zions:HedgesOfFixedRateLiabilitiesMemberus-gaap:OtherLiabilitiesMemberus-gaap:DesignatedAsHedgingInstrumentMemberus-gaap:FairValueHedgingMember2024-12-310000109380us-gaap:DesignatedAsHedgingInstrumentMember2025-09-300000109380us-gaap:OtherAssetsMemberus-gaap:DesignatedAsHedgingInstrumentMember2025-09-300000109380us-gaap:OtherLiabilitiesMemberus-gaap:DesignatedAsHedgingInstrumentMember2025-09-300000109380us-gaap:DesignatedAsHedgingInstrumentMember2024-12-310000109380us-gaap:OtherAssetsMemberus-gaap:DesignatedAsHedgingInstrumentMember2024-12-310000109380us-gaap:OtherLiabilitiesMemberus-gaap:DesignatedAsHedgingInstrumentMember2024-12-310000109380zions:InterestRateSwapsForCustomersMemberus-gaap:NondesignatedMember2025-09-300000109380zions:InterestRateSwapsForCustomersMemberus-gaap:OtherAssetsMemberus-gaap:NondesignatedMember2025-09-300000109380zions:InterestRateSwapsForCustomersMemberus-gaap:OtherLiabilitiesMemberus-gaap:NondesignatedMember2025-09-300000109380zions:InterestRateSwapsForCustomersMemberus-gaap:NondesignatedMember2024-12-310000109380zions:InterestRateSwapsForCustomersMemberus-gaap:OtherAssetsMemberus-gaap:NondesignatedMember2024-12-310000109380zions:InterestRateSwapsForCustomersMemberus-gaap:OtherLiabilitiesMemberus-gaap:NondesignatedMember2024-12-310000109380us-gaap:CommodityContractMemberus-gaap:NondesignatedMember2025-09-300000109380us-gaap:CommodityContractMemberus-gaap:OtherAssetsMemberus-gaap:NondesignatedMember2025-09-300000109380us-gaap:CommodityContractMemberus-gaap:OtherLiabilitiesMemberus-gaap:NondesignatedMember2025-09-300000109380us-gaap:CommodityContractMemberus-gaap:NondesignatedMember2024-12-310000109380us-gaap:CommodityContractMemberus-gaap:OtherAssetsMemberus-gaap:NondesignatedMember2024-12-310000109380us-gaap:CommodityContractMemberus-gaap:OtherLiabilitiesMemberus-gaap:NondesignatedMember2024-12-310000109380us-gaap:OtherContractMemberus-gaap:NondesignatedMember2025-09-300000109380us-gaap:OtherContractMemberus-gaap:OtherAssetsMemberus-gaap:NondesignatedMember2025-09-300000109380us-gaap:OtherContractMemberus-gaap:OtherLiabilitiesMemberus-gaap:NondesignatedMember2025-09-300000109380us-gaap:OtherContractMemberus-gaap:NondesignatedMember2024-12-310000109380us-gaap:OtherContractMemberus-gaap:OtherAssetsMemberus-gaap:NondesignatedMember2024-12-310000109380us-gaap:OtherContractMemberus-gaap:OtherLiabilitiesMemberus-gaap:NondesignatedMember2024-12-310000109380us-gaap:ForeignExchangeContractMemberus-gaap:NondesignatedMember2025-09-300000109380us-gaap:ForeignExchangeContractMemberus-gaap:OtherAssetsMemberus-gaap:NondesignatedMember2025-09-300000109380us-gaap:ForeignExchangeContractMemberus-gaap:OtherLiabilitiesMemberus-gaap:NondesignatedMember2025-09-300000109380us-gaap:ForeignExchangeContractMemberus-gaap:NondesignatedMember2024-12-310000109380us-gaap:ForeignExchangeContractMemberus-gaap:OtherAssetsMemberus-gaap:NondesignatedMember2024-12-310000109380us-gaap:ForeignExchangeContractMemberus-gaap:OtherLiabilitiesMemberus-gaap:NondesignatedMember2024-12-310000109380zions:PurchasedCreditDerivativeMemberus-gaap:NondesignatedMember2025-09-300000109380zions:PurchasedCreditDerivativeMemberus-gaap:OtherAssetsMemberus-gaap:NondesignatedMember2025-09-300000109380zions:PurchasedCreditDerivativeMemberus-gaap:OtherLiabilitiesMemberus-gaap:NondesignatedMember2025-09-300000109380zions:PurchasedCreditDerivativeMemberus-gaap:NondesignatedMember2024-12-310000109380zions:PurchasedCreditDerivativeMemberus-gaap:OtherAssetsMemberus-gaap:NondesignatedMember2024-12-310000109380zions:PurchasedCreditDerivativeMemberus-gaap:OtherLiabilitiesMemberus-gaap:NondesignatedMember2024-12-310000109380us-gaap:NondesignatedMember2025-09-300000109380us-gaap:OtherAssetsMemberus-gaap:NondesignatedMember2025-09-300000109380us-gaap:OtherLiabilitiesMemberus-gaap:NondesignatedMember2025-09-300000109380us-gaap:NondesignatedMember2024-12-310000109380us-gaap:OtherAssetsMemberus-gaap:NondesignatedMember2024-12-310000109380us-gaap:OtherLiabilitiesMemberus-gaap:NondesignatedMember2024-12-310000109380us-gaap:OtherAssetsMember2025-09-300000109380us-gaap:OtherLiabilitiesMember2025-09-300000109380us-gaap:OtherAssetsMember2024-12-310000109380us-gaap:OtherLiabilitiesMember2024-12-310000109380zions:HedgesOfFloatingRateAssetsMemberus-gaap:DesignatedAsHedgingInstrumentMemberus-gaap:CashFlowHedgingMember2025-07-012025-09-300000109380zions:HedgesOfFloatingRateAssetsMemberus-gaap:DesignatedAsHedgingInstrumentMemberus-gaap:CashFlowHedgingMember2024-07-012024-09-300000109380zions:HedgesOfFloatingRateLiabilitiesMemberus-gaap:DesignatedAsHedgingInstrumentMemberus-gaap:CashFlowHedgingMember2025-07-012025-09-300000109380zions:HedgesOfFloatingRateLiabilitiesMemberus-gaap:DesignatedAsHedgingInstrumentMemberus-gaap:CashFlowHedgingMember2024-07-012024-09-300000109380zions:HedgesOfFixedRateAssetsMemberus-gaap:DesignatedAsHedgingInstrumentMemberus-gaap:FairValueHedgingMember2025-07-012025-09-300000109380zions:HedgesOfFixedRateAssetsMemberus-gaap:DesignatedAsHedgingInstrumentMemberus-gaap:FairValueHedgingMember2024-07-012024-09-300000109380zions:HedgesOfFixedRateLiabilitiesMemberus-gaap:DesignatedAsHedgingInstrumentMemberus-gaap:FairValueHedgingMember2025-07-012025-09-300000109380zions:HedgesOfFixedRateLiabilitiesMemberus-gaap:DesignatedAsHedgingInstrumentMemberus-gaap:FairValueHedgingMember2024-07-012024-09-300000109380us-gaap:DesignatedAsHedgingInstrumentMember2025-07-012025-09-300000109380us-gaap:DesignatedAsHedgingInstrumentMember2024-07-012024-09-300000109380zions:HedgesOfFloatingRateAssetsMemberus-gaap:DesignatedAsHedgingInstrumentMemberus-gaap:CashFlowHedgingMember2025-01-012025-09-300000109380zions:HedgesOfFloatingRateAssetsMemberus-gaap:DesignatedAsHedgingInstrumentMemberus-gaap:CashFlowHedgingMember2024-01-012024-09-300000109380zions:HedgesOfFloatingRateLiabilitiesMemberus-gaap:DesignatedAsHedgingInstrumentMemberus-gaap:CashFlowHedgingMember2025-01-012025-09-300000109380zions:HedgesOfFloatingRateLiabilitiesMemberus-gaap:DesignatedAsHedgingInstrumentMemberus-gaap:CashFlowHedgingMember2024-01-012024-09-300000109380zions:HedgesOfFixedRateAssetsMemberus-gaap:DesignatedAsHedgingInstrumentMemberus-gaap:FairValueHedgingMember2025-01-012025-09-300000109380zions:HedgesOfFixedRateLiabilitiesMemberus-gaap:DesignatedAsHedgingInstrumentMemberus-gaap:FairValueHedgingMember2025-01-012025-09-300000109380zions:HedgesOfFixedRateAssetsMemberus-gaap:DesignatedAsHedgingInstrumentMemberus-gaap:FairValueHedgingMember2024-01-012024-09-300000109380zions:HedgesOfFixedRateLiabilitiesMemberus-gaap:DesignatedAsHedgingInstrumentMemberus-gaap:FairValueHedgingMember2024-01-012024-09-300000109380us-gaap:DesignatedAsHedgingInstrumentMember2025-01-012025-09-300000109380us-gaap:DesignatedAsHedgingInstrumentMember2024-01-012024-09-300000109380us-gaap:CashFlowHedgingMemberus-gaap:DesignatedAsHedgingInstrumentMember2025-09-300000109380us-gaap:CashFlowHedgingMemberus-gaap:DesignatedAsHedgingInstrumentMember2024-09-300000109380zions:InterestRateSwapsForCustomersMemberus-gaap:NondesignatedMember2025-07-012025-09-300000109380zions:InterestRateSwapsForCustomersMemberus-gaap:NondesignatedMember2025-01-012025-09-300000109380zions:InterestRateSwapsForCustomersMemberus-gaap:NondesignatedMember2024-07-012024-09-300000109380zions:InterestRateSwapsForCustomersMemberus-gaap:NondesignatedMember2024-01-012024-09-300000109380us-gaap:OtherContractMemberus-gaap:NondesignatedMember2025-07-012025-09-300000109380us-gaap:OtherContractMemberus-gaap:NondesignatedMember2025-01-012025-09-300000109380us-gaap:OtherContractMemberus-gaap:NondesignatedMember2024-07-012024-09-300000109380us-gaap:OtherContractMemberus-gaap:NondesignatedMember2024-01-012024-09-300000109380us-gaap:ForeignExchangeContractMemberus-gaap:NondesignatedMember2025-07-012025-09-300000109380us-gaap:ForeignExchangeContractMemberus-gaap:NondesignatedMember2025-01-012025-09-300000109380us-gaap:ForeignExchangeContractMemberus-gaap:NondesignatedMember2024-07-012024-09-300000109380us-gaap:ForeignExchangeContractMemberus-gaap:NondesignatedMember2024-01-012024-09-300000109380zions:PurchasedCreditDerivativeMemberus-gaap:NondesignatedMember2025-07-012025-09-300000109380zions:PurchasedCreditDerivativeMemberus-gaap:NondesignatedMember2025-01-012025-09-300000109380zions:PurchasedCreditDerivativeMemberus-gaap:NondesignatedMember2024-07-012024-09-300000109380zions:PurchasedCreditDerivativeMemberus-gaap:NondesignatedMember2024-01-012024-09-300000109380us-gaap:NondesignatedMember2025-07-012025-09-300000109380us-gaap:NondesignatedMember2025-01-012025-09-300000109380us-gaap:NondesignatedMember2024-07-012024-09-300000109380us-gaap:NondesignatedMember2024-01-012024-09-300000109380zions:HedgesOfFixedRateAssetsMember2025-07-012025-09-300000109380zions:HedgesOfFixedRateAssetsMember2024-07-012024-09-300000109380zions:HedgesOfFixedRateLiabilitiesMember2025-07-012025-09-300000109380zions:HedgesOfFixedRateLiabilitiesMember2024-07-012024-09-300000109380zions:HedgesOfFixedRateAssetsMember2025-01-012025-09-300000109380zions:HedgesOfFixedRateAssetsMember2024-01-012024-09-300000109380zions:HedgesOfFixedRateLiabilitiesMember2025-01-012025-09-300000109380zions:HedgesOfFixedRateLiabilitiesMember2024-01-012024-09-300000109380zions:HedgesOfFixedRateAssetsMemberus-gaap:FairValueHedgingMember2025-09-300000109380zions:HedgesOfFixedRateAssetsMemberus-gaap:FairValueHedgingMember2024-12-310000109380zions:HedgesOfFixedRateLiabilitiesMemberus-gaap:FairValueHedgingMember2025-09-300000109380zions:HedgesOfFixedRateLiabilitiesMemberus-gaap:FairValueHedgingMember2024-12-310000109380us-gaap:FairValueHedgingMember2025-09-300000109380zions:A4.70FixedToFloatingSeniorNotesMemberus-gaap:SeniorNotesMember2025-09-300000109380us-gaap:AccumulatedNetUnrealizedInvestmentGainLossMember2024-12-310000109380us-gaap:AccumulatedGainLossNetCashFlowHedgeParentMember2024-12-310000109380us-gaap:AccumulatedDefinedBenefitPlansAdjustmentMember2024-12-310000109380us-gaap:AccumulatedNetUnrealizedInvestmentGainLossMember2025-01-012025-09-300000109380us-gaap:AccumulatedGainLossNetCashFlowHedgeParentMember2025-01-012025-09-300000109380us-gaap:AccumulatedDefinedBenefitPlansAdjustmentMember2025-01-012025-09-300000109380us-gaap:AccumulatedNetUnrealizedInvestmentGainLossMember2025-09-300000109380us-gaap:AccumulatedGainLossNetCashFlowHedgeParentMember2025-09-300000109380us-gaap:AccumulatedDefinedBenefitPlansAdjustmentMember2025-09-300000109380us-gaap:AccumulatedNetUnrealizedInvestmentGainLossMember2023-12-310000109380us-gaap:AccumulatedGainLossNetCashFlowHedgeParentMember2023-12-310000109380us-gaap:AccumulatedDefinedBenefitPlansAdjustmentMember2023-12-310000109380us-gaap:AccumulatedNetUnrealizedInvestmentGainLossMember2024-01-012024-09-300000109380us-gaap:AccumulatedGainLossNetCashFlowHedgeParentMember2024-01-012024-09-300000109380us-gaap:AccumulatedDefinedBenefitPlansAdjustmentMember2024-01-012024-09-300000109380us-gaap:AccumulatedNetUnrealizedInvestmentGainLossMember2024-09-300000109380us-gaap:AccumulatedGainLossNetCashFlowHedgeParentMember2024-09-300000109380us-gaap:AccumulatedDefinedBenefitPlansAdjustmentMember2024-09-300000109380us-gaap:ReclassificationOutOfAccumulatedOtherComprehensiveIncomeMemberus-gaap:AccumulatedNetUnrealizedInvestmentGainLossMember2025-07-012025-09-300000109380us-gaap:ReclassificationOutOfAccumulatedOtherComprehensiveIncomeMemberus-gaap:AccumulatedNetUnrealizedInvestmentGainLossMember2024-07-012024-09-300000109380us-gaap:ReclassificationOutOfAccumulatedOtherComprehensiveIncomeMemberus-gaap:AccumulatedNetUnrealizedInvestmentGainLossMember2025-01-012025-09-300000109380us-gaap:ReclassificationOutOfAccumulatedOtherComprehensiveIncomeMemberus-gaap:AccumulatedNetUnrealizedInvestmentGainLossMember2024-01-012024-09-300000109380us-gaap:ReclassificationOutOfAccumulatedOtherComprehensiveIncomeMemberus-gaap:AccumulatedGainLossNetCashFlowHedgeParentMember2025-07-012025-09-300000109380us-gaap:ReclassificationOutOfAccumulatedOtherComprehensiveIncomeMemberus-gaap:AccumulatedGainLossNetCashFlowHedgeParentMember2024-07-012024-09-300000109380us-gaap:ReclassificationOutOfAccumulatedOtherComprehensiveIncomeMemberus-gaap:AccumulatedGainLossNetCashFlowHedgeParentMember2025-01-012025-09-300000109380us-gaap:ReclassificationOutOfAccumulatedOtherComprehensiveIncomeMemberus-gaap:AccumulatedGainLossNetCashFlowHedgeParentMember2024-01-012024-09-300000109380us-gaap:StandbyLettersOfCreditMember2025-09-300000109380us-gaap:StandbyLettersOfCreditMember2024-12-310000109380us-gaap:PerformanceGuaranteeMember2025-09-300000109380us-gaap:PerformanceGuaranteeMember2024-12-310000109380us-gaap:OperatingSegmentsMemberzions:ProductsAndServicesCommercialAccountFeesMemberzions:ZionsBankSegmentMember2025-07-012025-09-300000109380us-gaap:OperatingSegmentsMemberzions:ProductsAndServicesCommercialAccountFeesMemberzions:ZionsBankSegmentMember2024-07-012024-09-300000109380us-gaap:OperatingSegmentsMemberzions:ProductsAndServicesCommercialAccountFeesMemberzions:CaliforniaBankAndTrustSegmentMember2025-07-012025-09-300000109380us-gaap:OperatingSegmentsMemberzions:ProductsAndServicesCommercialAccountFeesMemberzions:CaliforniaBankAndTrustSegmentMember2024-07-012024-09-300000109380us-gaap:OperatingSegmentsMemberzions:ProductsAndServicesCommercialAccountFeesMemberzions:AmegyCorporationSegmentMember2025-07-012025-09-300000109380us-gaap:OperatingSegmentsMemberzions:ProductsAndServicesCommercialAccountFeesMemberzions:AmegyCorporationSegmentMember2024-07-012024-09-300000109380us-gaap:OperatingSegmentsMemberzions:ProductsAndServicesCardFeesMemberzions:ZionsBankSegmentMember2025-07-012025-09-300000109380us-gaap:OperatingSegmentsMemberzions:ProductsAndServicesCardFeesMemberzions:ZionsBankSegmentMember2024-07-012024-09-300000109380us-gaap:OperatingSegmentsMemberzions:ProductsAndServicesCardFeesMemberzions:CaliforniaBankAndTrustSegmentMember2025-07-012025-09-300000109380us-gaap:OperatingSegmentsMemberzions:ProductsAndServicesCardFeesMemberzions:CaliforniaBankAndTrustSegmentMember2024-07-012024-09-300000109380us-gaap:OperatingSegmentsMemberzions:ProductsAndServicesCardFeesMemberzions:AmegyCorporationSegmentMember2025-07-012025-09-300000109380us-gaap:OperatingSegmentsMemberzions:ProductsAndServicesCardFeesMemberzions:AmegyCorporationSegmentMember2024-07-012024-09-300000109380us-gaap:OperatingSegmentsMemberzions:ProductsAndServicesRetailAndBusinessBankingFeesMemberzions:ZionsBankSegmentMember2025-07-012025-09-300000109380us-gaap:OperatingSegmentsMemberzions:ProductsAndServicesRetailAndBusinessBankingFeesMemberzions:ZionsBankSegmentMember2024-07-012024-09-300000109380us-gaap:OperatingSegmentsMemberzions:ProductsAndServicesRetailAndBusinessBankingFeesMemberzions:CaliforniaBankAndTrustSegmentMember2025-07-012025-09-300000109380us-gaap:OperatingSegmentsMemberzions:ProductsAndServicesRetailAndBusinessBankingFeesMemberzions:CaliforniaBankAndTrustSegmentMember2024-07-012024-09-300000109380us-gaap:OperatingSegmentsMemberzions:ProductsAndServicesRetailAndBusinessBankingFeesMemberzions:AmegyCorporationSegmentMember2025-07-012025-09-300000109380us-gaap:OperatingSegmentsMemberzions:ProductsAndServicesRetailAndBusinessBankingFeesMemberzions:AmegyCorporationSegmentMember2024-07-012024-09-300000109380us-gaap:OperatingSegmentsMemberzions:ProductsAndServicesCapitalMarketsAndForeignExchangeFeesMemberzions:ZionsBankSegmentMember2025-07-012025-09-300000109380us-gaap:OperatingSegmentsMemberzions:ProductsAndServicesCapitalMarketsAndForeignExchangeFeesMemberzions:ZionsBankSegmentMember2024-07-012024-09-300000109380us-gaap:OperatingSegmentsMemberzions:ProductsAndServicesCapitalMarketsAndForeignExchangeFeesMemberzions:CaliforniaBankAndTrustSegmentMember2025-07-012025-09-300000109380us-gaap:OperatingSegmentsMemberzions:ProductsAndServicesCapitalMarketsAndForeignExchangeFeesMemberzions:CaliforniaBankAndTrustSegmentMember2024-07-012024-09-300000109380us-gaap:OperatingSegmentsMemberzions:ProductsAndServicesCapitalMarketsAndForeignExchangeFeesMemberzions:AmegyCorporationSegmentMember2025-07-012025-09-300000109380us-gaap:OperatingSegmentsMemberzions:ProductsAndServicesCapitalMarketsAndForeignExchangeFeesMemberzions:AmegyCorporationSegmentMember2024-07-012024-09-300000109380us-gaap:OperatingSegmentsMemberzions:ProductsAndServicesWealthManagementFeesMemberzions:ZionsBankSegmentMember2025-07-012025-09-300000109380us-gaap:OperatingSegmentsMemberzions:ProductsAndServicesWealthManagementFeesMemberzions:ZionsBankSegmentMember2024-07-012024-09-300000109380us-gaap:OperatingSegmentsMemberzions:ProductsAndServicesWealthManagementFeesMemberzions:CaliforniaBankAndTrustSegmentMember2025-07-012025-09-300000109380us-gaap:OperatingSegmentsMemberzions:ProductsAndServicesWealthManagementFeesMemberzions:CaliforniaBankAndTrustSegmentMember2024-07-012024-09-300000109380us-gaap:OperatingSegmentsMemberzions:ProductsAndServicesWealthManagementFeesMemberzions:AmegyCorporationSegmentMember2025-07-012025-09-300000109380us-gaap:OperatingSegmentsMemberzions:ProductsAndServicesWealthManagementFeesMemberzions:AmegyCorporationSegmentMember2024-07-012024-09-300000109380us-gaap:OperatingSegmentsMemberzions:ProductsAndServicesOtherCustomerRelatedFeesMemberzions:ZionsBankSegmentMember2025-07-012025-09-300000109380us-gaap:OperatingSegmentsMemberzions:ProductsAndServicesOtherCustomerRelatedFeesMemberzions:ZionsBankSegmentMember2024-07-012024-09-300000109380us-gaap:OperatingSegmentsMemberzions:ProductsAndServicesOtherCustomerRelatedFeesMemberzions:CaliforniaBankAndTrustSegmentMember2025-07-012025-09-300000109380us-gaap:OperatingSegmentsMemberzions:ProductsAndServicesOtherCustomerRelatedFeesMemberzions:CaliforniaBankAndTrustSegmentMember2024-07-012024-09-300000109380us-gaap:OperatingSegmentsMemberzions:ProductsAndServicesOtherCustomerRelatedFeesMemberzions:AmegyCorporationSegmentMember2025-07-012025-09-300000109380us-gaap:OperatingSegmentsMemberzions:ProductsAndServicesOtherCustomerRelatedFeesMemberzions:AmegyCorporationSegmentMember2024-07-012024-09-300000109380us-gaap:OperatingSegmentsMemberzions:ZionsBankSegmentMember2025-07-012025-09-300000109380us-gaap:OperatingSegmentsMemberzions:ZionsBankSegmentMember2024-07-012024-09-300000109380us-gaap:OperatingSegmentsMemberzions:CaliforniaBankAndTrustSegmentMember2025-07-012025-09-300000109380us-gaap:OperatingSegmentsMemberzions:CaliforniaBankAndTrustSegmentMember2024-07-012024-09-300000109380us-gaap:OperatingSegmentsMemberzions:AmegyCorporationSegmentMember2025-07-012025-09-300000109380us-gaap:OperatingSegmentsMemberzions:AmegyCorporationSegmentMember2024-07-012024-09-300000109380us-gaap:OperatingSegmentsMemberzions:ProductsAndServicesCommercialAccountFeesMemberzions:NationalBankOfArizonaSegmentMember2025-07-012025-09-300000109380us-gaap:OperatingSegmentsMemberzions:ProductsAndServicesCommercialAccountFeesMemberzions:NationalBankOfArizonaSegmentMember2024-07-012024-09-300000109380us-gaap:OperatingSegmentsMemberzions:ProductsAndServicesCommercialAccountFeesMemberzions:NevadaStateBankSegmentMember2025-07-012025-09-300000109380us-gaap:OperatingSegmentsMemberzions:ProductsAndServicesCommercialAccountFeesMemberzions:NevadaStateBankSegmentMember2024-07-012024-09-300000109380us-gaap:OperatingSegmentsMemberzions:ProductsAndServicesCommercialAccountFeesMemberzions:VectraBankColoradoSegmentMember2025-07-012025-09-300000109380us-gaap:OperatingSegmentsMemberzions:ProductsAndServicesCommercialAccountFeesMemberzions:VectraBankColoradoSegmentMember2024-07-012024-09-300000109380us-gaap:OperatingSegmentsMemberzions:ProductsAndServicesCardFeesMemberzions:NationalBankOfArizonaSegmentMember2025-07-012025-09-300000109380us-gaap:OperatingSegmentsMemberzions:ProductsAndServicesCardFeesMemberzions:NationalBankOfArizonaSegmentMember2024-07-012024-09-300000109380us-gaap:OperatingSegmentsMemberzions:ProductsAndServicesCardFeesMemberzions:NevadaStateBankSegmentMember2025-07-012025-09-300000109380us-gaap:OperatingSegmentsMemberzions:ProductsAndServicesCardFeesMemberzions:NevadaStateBankSegmentMember2024-07-012024-09-300000109380us-gaap:OperatingSegmentsMemberzions:ProductsAndServicesCardFeesMemberzions:VectraBankColoradoSegmentMember2025-07-012025-09-300000109380us-gaap:OperatingSegmentsMemberzions:ProductsAndServicesCardFeesMemberzions:VectraBankColoradoSegmentMember2024-07-012024-09-300000109380us-gaap:OperatingSegmentsMemberzions:ProductsAndServicesRetailAndBusinessBankingFeesMemberzions:NationalBankOfArizonaSegmentMember2025-07-012025-09-300000109380us-gaap:OperatingSegmentsMemberzions:ProductsAndServicesRetailAndBusinessBankingFeesMemberzions:NationalBankOfArizonaSegmentMember2024-07-012024-09-300000109380us-gaap:OperatingSegmentsMemberzions:ProductsAndServicesRetailAndBusinessBankingFeesMemberzions:NevadaStateBankSegmentMember2025-07-012025-09-300000109380us-gaap:OperatingSegmentsMemberzions:ProductsAndServicesRetailAndBusinessBankingFeesMemberzions:NevadaStateBankSegmentMember2024-07-012024-09-300000109380us-gaap:OperatingSegmentsMemberzions:ProductsAndServicesRetailAndBusinessBankingFeesMemberzions:VectraBankColoradoSegmentMember2025-07-012025-09-300000109380us-gaap:OperatingSegmentsMemberzions:ProductsAndServicesRetailAndBusinessBankingFeesMemberzions:VectraBankColoradoSegmentMember2024-07-012024-09-300000109380us-gaap:OperatingSegmentsMemberzions:ProductsAndServicesCapitalMarketsAndForeignExchangeFeesMemberzions:NationalBankOfArizonaSegmentMember2025-07-012025-09-300000109380us-gaap:OperatingSegmentsMemberzions:ProductsAndServicesCapitalMarketsAndForeignExchangeFeesMemberzions:NationalBankOfArizonaSegmentMember2024-07-012024-09-300000109380us-gaap:OperatingSegmentsMemberzions:ProductsAndServicesCapitalMarketsAndForeignExchangeFeesMemberzions:NevadaStateBankSegmentMember2025-07-012025-09-300000109380us-gaap:OperatingSegmentsMemberzions:ProductsAndServicesCapitalMarketsAndForeignExchangeFeesMemberzions:NevadaStateBankSegmentMember2024-07-012024-09-300000109380us-gaap:OperatingSegmentsMemberzions:ProductsAndServicesCapitalMarketsAndForeignExchangeFeesMemberzions:VectraBankColoradoSegmentMember2025-07-012025-09-300000109380us-gaap:OperatingSegmentsMemberzions:ProductsAndServicesCapitalMarketsAndForeignExchangeFeesMemberzions:VectraBankColoradoSegmentMember2024-07-012024-09-300000109380us-gaap:OperatingSegmentsMemberzions:ProductsAndServicesWealthManagementFeesMemberzions:NationalBankOfArizonaSegmentMember2025-07-012025-09-300000109380us-gaap:OperatingSegmentsMemberzions:ProductsAndServicesWealthManagementFeesMemberzions:NationalBankOfArizonaSegmentMember2024-07-012024-09-300000109380us-gaap:OperatingSegmentsMemberzions:ProductsAndServicesWealthManagementFeesMemberzions:NevadaStateBankSegmentMember2025-07-012025-09-300000109380us-gaap:OperatingSegmentsMemberzions:ProductsAndServicesWealthManagementFeesMemberzions:NevadaStateBankSegmentMember2024-07-012024-09-300000109380us-gaap:OperatingSegmentsMemberzions:ProductsAndServicesWealthManagementFeesMemberzions:VectraBankColoradoSegmentMember2025-07-012025-09-300000109380us-gaap:OperatingSegmentsMemberzions:ProductsAndServicesWealthManagementFeesMemberzions:VectraBankColoradoSegmentMember2024-07-012024-09-300000109380us-gaap:OperatingSegmentsMemberzions:ProductsAndServicesOtherCustomerRelatedFeesMemberzions:NationalBankOfArizonaSegmentMember2025-07-012025-09-300000109380us-gaap:OperatingSegmentsMemberzions:ProductsAndServicesOtherCustomerRelatedFeesMemberzions:NationalBankOfArizonaSegmentMember2024-07-012024-09-300000109380us-gaap:OperatingSegmentsMemberzions:ProductsAndServicesOtherCustomerRelatedFeesMemberzions:NevadaStateBankSegmentMember2025-07-012025-09-300000109380us-gaap:OperatingSegmentsMemberzions:ProductsAndServicesOtherCustomerRelatedFeesMemberzions:NevadaStateBankSegmentMember2024-07-012024-09-300000109380us-gaap:OperatingSegmentsMemberzions:ProductsAndServicesOtherCustomerRelatedFeesMemberzions:VectraBankColoradoSegmentMember2025-07-012025-09-300000109380us-gaap:OperatingSegmentsMemberzions:ProductsAndServicesOtherCustomerRelatedFeesMemberzions:VectraBankColoradoSegmentMember2024-07-012024-09-300000109380us-gaap:OperatingSegmentsMemberzions:NationalBankOfArizonaSegmentMember2025-07-012025-09-300000109380us-gaap:OperatingSegmentsMemberzions:NationalBankOfArizonaSegmentMember2024-07-012024-09-300000109380us-gaap:OperatingSegmentsMemberzions:NevadaStateBankSegmentMember2025-07-012025-09-300000109380us-gaap:OperatingSegmentsMemberzions:NevadaStateBankSegmentMember2024-07-012024-09-300000109380us-gaap:OperatingSegmentsMemberzions:VectraBankColoradoSegmentMember2025-07-012025-09-300000109380us-gaap:OperatingSegmentsMemberzions:VectraBankColoradoSegmentMember2024-07-012024-09-300000109380us-gaap:OperatingSegmentsMemberzions:ProductsAndServicesCommercialAccountFeesMemberzions:CommerceBankOfWashingtonSegmentMember2025-07-012025-09-300000109380us-gaap:OperatingSegmentsMemberzions:ProductsAndServicesCommercialAccountFeesMemberzions:CommerceBankOfWashingtonSegmentMember2024-07-012024-09-300000109380zions:CorporateReconcilingItemsAndEliminationsMemberzions:ProductsAndServicesCommercialAccountFeesMember2025-07-012025-09-300000109380zions:CorporateReconcilingItemsAndEliminationsMemberzions:ProductsAndServicesCommercialAccountFeesMember2024-07-012024-09-300000109380zions:ProductsAndServicesCommercialAccountFeesMember2025-07-012025-09-300000109380zions:ProductsAndServicesCommercialAccountFeesMember2024-07-012024-09-300000109380us-gaap:OperatingSegmentsMemberzions:ProductsAndServicesCardFeesMemberzions:CommerceBankOfWashingtonSegmentMember2025-07-012025-09-300000109380us-gaap:OperatingSegmentsMemberzions:ProductsAndServicesCardFeesMemberzions:CommerceBankOfWashingtonSegmentMember2024-07-012024-09-300000109380zions:CorporateReconcilingItemsAndEliminationsMemberzions:ProductsAndServicesCardFeesMember2025-07-012025-09-300000109380zions:CorporateReconcilingItemsAndEliminationsMemberzions:ProductsAndServicesCardFeesMember2024-07-012024-09-300000109380zions:ProductsAndServicesCardFeesMember2025-07-012025-09-300000109380zions:ProductsAndServicesCardFeesMember2024-07-012024-09-300000109380us-gaap:OperatingSegmentsMemberzions:ProductsAndServicesRetailAndBusinessBankingFeesMemberzions:CommerceBankOfWashingtonSegmentMember2025-07-012025-09-300000109380us-gaap:OperatingSegmentsMemberzions:ProductsAndServicesRetailAndBusinessBankingFeesMemberzions:CommerceBankOfWashingtonSegmentMember2024-07-012024-09-300000109380zions:CorporateReconcilingItemsAndEliminationsMemberzions:ProductsAndServicesRetailAndBusinessBankingFeesMember2025-07-012025-09-300000109380zions:CorporateReconcilingItemsAndEliminationsMemberzions:ProductsAndServicesRetailAndBusinessBankingFeesMember2024-07-012024-09-300000109380zions:ProductsAndServicesRetailAndBusinessBankingFeesMember2025-07-012025-09-300000109380zions:ProductsAndServicesRetailAndBusinessBankingFeesMember2024-07-012024-09-300000109380us-gaap:OperatingSegmentsMemberzions:ProductsAndServicesCapitalMarketsAndForeignExchangeFeesMemberzions:CommerceBankOfWashingtonSegmentMember2025-07-012025-09-300000109380us-gaap:OperatingSegmentsMemberzions:ProductsAndServicesCapitalMarketsAndForeignExchangeFeesMemberzions:CommerceBankOfWashingtonSegmentMember2024-07-012024-09-300000109380zions:CorporateReconcilingItemsAndEliminationsMemberzions:ProductsAndServicesCapitalMarketsAndForeignExchangeFeesMember2025-07-012025-09-300000109380zions:CorporateReconcilingItemsAndEliminationsMemberzions:ProductsAndServicesCapitalMarketsAndForeignExchangeFeesMember2024-07-012024-09-300000109380zions:ProductsAndServicesCapitalMarketsAndForeignExchangeFeesMember2025-07-012025-09-300000109380zions:ProductsAndServicesCapitalMarketsAndForeignExchangeFeesMember2024-07-012024-09-300000109380us-gaap:OperatingSegmentsMemberzions:ProductsAndServicesWealthManagementFeesMemberzions:CommerceBankOfWashingtonSegmentMember2025-07-012025-09-300000109380us-gaap:OperatingSegmentsMemberzions:ProductsAndServicesWealthManagementFeesMemberzions:CommerceBankOfWashingtonSegmentMember2024-07-012024-09-300000109380zions:CorporateReconcilingItemsAndEliminationsMemberzions:ProductsAndServicesWealthManagementFeesMember2025-07-012025-09-300000109380zions:CorporateReconcilingItemsAndEliminationsMemberzions:ProductsAndServicesWealthManagementFeesMember2024-07-012024-09-300000109380zions:ProductsAndServicesWealthManagementFeesMember2025-07-012025-09-300000109380zions:ProductsAndServicesWealthManagementFeesMember2024-07-012024-09-300000109380us-gaap:OperatingSegmentsMemberzions:ProductsAndServicesOtherCustomerRelatedFeesMemberzions:CommerceBankOfWashingtonSegmentMember2025-07-012025-09-300000109380us-gaap:OperatingSegmentsMemberzions:ProductsAndServicesOtherCustomerRelatedFeesMemberzions:CommerceBankOfWashingtonSegmentMember2024-07-012024-09-300000109380zions:CorporateReconcilingItemsAndEliminationsMemberzions:ProductsAndServicesOtherCustomerRelatedFeesMember2025-07-012025-09-300000109380zions:CorporateReconcilingItemsAndEliminationsMemberzions:ProductsAndServicesOtherCustomerRelatedFeesMember2024-07-012024-09-300000109380zions:ProductsAndServicesOtherCustomerRelatedFeesMember2025-07-012025-09-300000109380zions:ProductsAndServicesOtherCustomerRelatedFeesMember2024-07-012024-09-300000109380us-gaap:OperatingSegmentsMemberzions:CommerceBankOfWashingtonSegmentMember2025-07-012025-09-300000109380us-gaap:OperatingSegmentsMemberzions:CommerceBankOfWashingtonSegmentMember2024-07-012024-09-300000109380zions:CorporateReconcilingItemsAndEliminationsMember2025-07-012025-09-300000109380zions:CorporateReconcilingItemsAndEliminationsMember2024-07-012024-09-300000109380us-gaap:OperatingSegmentsMemberzions:ProductsAndServicesCommercialAccountFeesMemberzions:ZionsBankSegmentMember2025-01-012025-09-300000109380us-gaap:OperatingSegmentsMemberzions:ProductsAndServicesCommercialAccountFeesMemberzions:ZionsBankSegmentMember2024-01-012024-09-300000109380us-gaap:OperatingSegmentsMemberzions:ProductsAndServicesCommercialAccountFeesMemberzions:CaliforniaBankAndTrustSegmentMember2025-01-012025-09-300000109380us-gaap:OperatingSegmentsMemberzions:ProductsAndServicesCommercialAccountFeesMemberzions:CaliforniaBankAndTrustSegmentMember2024-01-012024-09-300000109380us-gaap:OperatingSegmentsMemberzions:ProductsAndServicesCommercialAccountFeesMemberzions:AmegyCorporationSegmentMember2025-01-012025-09-300000109380us-gaap:OperatingSegmentsMemberzions:ProductsAndServicesCommercialAccountFeesMemberzions:AmegyCorporationSegmentMember2024-01-012024-09-300000109380us-gaap:OperatingSegmentsMemberzions:ProductsAndServicesCardFeesMemberzions:ZionsBankSegmentMember2025-01-012025-09-300000109380us-gaap:OperatingSegmentsMemberzions:ProductsAndServicesCardFeesMemberzions:ZionsBankSegmentMember2024-01-012024-09-300000109380us-gaap:OperatingSegmentsMemberzions:ProductsAndServicesCardFeesMemberzions:CaliforniaBankAndTrustSegmentMember2025-01-012025-09-300000109380us-gaap:OperatingSegmentsMemberzions:ProductsAndServicesCardFeesMemberzions:CaliforniaBankAndTrustSegmentMember2024-01-012024-09-300000109380us-gaap:OperatingSegmentsMemberzions:ProductsAndServicesCardFeesMemberzions:AmegyCorporationSegmentMember2025-01-012025-09-300000109380us-gaap:OperatingSegmentsMemberzions:ProductsAndServicesCardFeesMemberzions:AmegyCorporationSegmentMember2024-01-012024-09-300000109380us-gaap:OperatingSegmentsMemberzions:ProductsAndServicesRetailAndBusinessBankingFeesMemberzions:ZionsBankSegmentMember2025-01-012025-09-300000109380us-gaap:OperatingSegmentsMemberzions:ProductsAndServicesRetailAndBusinessBankingFeesMemberzions:ZionsBankSegmentMember2024-01-012024-09-300000109380us-gaap:OperatingSegmentsMemberzions:ProductsAndServicesRetailAndBusinessBankingFeesMemberzions:CaliforniaBankAndTrustSegmentMember2025-01-012025-09-300000109380us-gaap:OperatingSegmentsMemberzions:ProductsAndServicesRetailAndBusinessBankingFeesMemberzions:CaliforniaBankAndTrustSegmentMember2024-01-012024-09-300000109380us-gaap:OperatingSegmentsMemberzions:ProductsAndServicesRetailAndBusinessBankingFeesMemberzions:AmegyCorporationSegmentMember2025-01-012025-09-300000109380us-gaap:OperatingSegmentsMemberzions:ProductsAndServicesRetailAndBusinessBankingFeesMemberzions:AmegyCorporationSegmentMember2024-01-012024-09-300000109380us-gaap:OperatingSegmentsMemberzions:ProductsAndServicesCapitalMarketsAndForeignExchangeFeesMemberzions:ZionsBankSegmentMember2025-01-012025-09-300000109380us-gaap:OperatingSegmentsMemberzions:ProductsAndServicesCapitalMarketsAndForeignExchangeFeesMemberzions:ZionsBankSegmentMember2024-01-012024-09-300000109380us-gaap:OperatingSegmentsMemberzions:ProductsAndServicesCapitalMarketsAndForeignExchangeFeesMemberzions:CaliforniaBankAndTrustSegmentMember2025-01-012025-09-300000109380us-gaap:OperatingSegmentsMemberzions:ProductsAndServicesCapitalMarketsAndForeignExchangeFeesMemberzions:CaliforniaBankAndTrustSegmentMember2024-01-012024-09-300000109380us-gaap:OperatingSegmentsMemberzions:ProductsAndServicesCapitalMarketsAndForeignExchangeFeesMemberzions:AmegyCorporationSegmentMember2025-01-012025-09-300000109380us-gaap:OperatingSegmentsMemberzions:ProductsAndServicesCapitalMarketsAndForeignExchangeFeesMemberzions:AmegyCorporationSegmentMember2024-01-012024-09-300000109380us-gaap:OperatingSegmentsMemberzions:ProductsAndServicesWealthManagementFeesMemberzions:ZionsBankSegmentMember2025-01-012025-09-300000109380us-gaap:OperatingSegmentsMemberzions:ProductsAndServicesWealthManagementFeesMemberzions:ZionsBankSegmentMember2024-01-012024-09-300000109380us-gaap:OperatingSegmentsMemberzions:ProductsAndServicesWealthManagementFeesMemberzions:CaliforniaBankAndTrustSegmentMember2025-01-012025-09-300000109380us-gaap:OperatingSegmentsMemberzions:ProductsAndServicesWealthManagementFeesMemberzions:CaliforniaBankAndTrustSegmentMember2024-01-012024-09-300000109380us-gaap:OperatingSegmentsMemberzions:ProductsAndServicesWealthManagementFeesMemberzions:AmegyCorporationSegmentMember2025-01-012025-09-300000109380us-gaap:OperatingSegmentsMemberzions:ProductsAndServicesWealthManagementFeesMemberzions:AmegyCorporationSegmentMember2024-01-012024-09-300000109380us-gaap:OperatingSegmentsMemberzions:ProductsAndServicesOtherCustomerRelatedFeesMemberzions:ZionsBankSegmentMember2025-01-012025-09-300000109380us-gaap:OperatingSegmentsMemberzions:ProductsAndServicesOtherCustomerRelatedFeesMemberzions:ZionsBankSegmentMember2024-01-012024-09-300000109380us-gaap:OperatingSegmentsMemberzions:ProductsAndServicesOtherCustomerRelatedFeesMemberzions:CaliforniaBankAndTrustSegmentMember2025-01-012025-09-300000109380us-gaap:OperatingSegmentsMemberzions:ProductsAndServicesOtherCustomerRelatedFeesMemberzions:CaliforniaBankAndTrustSegmentMember2024-01-012024-09-300000109380us-gaap:OperatingSegmentsMemberzions:ProductsAndServicesOtherCustomerRelatedFeesMemberzions:AmegyCorporationSegmentMember2025-01-012025-09-300000109380us-gaap:OperatingSegmentsMemberzions:ProductsAndServicesOtherCustomerRelatedFeesMemberzions:AmegyCorporationSegmentMember2024-01-012024-09-300000109380us-gaap:OperatingSegmentsMemberzions:ZionsBankSegmentMember2025-01-012025-09-300000109380us-gaap:OperatingSegmentsMemberzions:ZionsBankSegmentMember2024-01-012024-09-300000109380us-gaap:OperatingSegmentsMemberzions:CaliforniaBankAndTrustSegmentMember2025-01-012025-09-300000109380us-gaap:OperatingSegmentsMemberzions:CaliforniaBankAndTrustSegmentMember2024-01-012024-09-300000109380us-gaap:OperatingSegmentsMemberzions:AmegyCorporationSegmentMember2025-01-012025-09-300000109380us-gaap:OperatingSegmentsMemberzions:AmegyCorporationSegmentMember2024-01-012024-09-300000109380us-gaap:OperatingSegmentsMemberzions:ProductsAndServicesCommercialAccountFeesMemberzions:NationalBankOfArizonaSegmentMember2025-01-012025-09-300000109380us-gaap:OperatingSegmentsMemberzions:ProductsAndServicesCommercialAccountFeesMemberzions:NationalBankOfArizonaSegmentMember2024-01-012024-09-300000109380us-gaap:OperatingSegmentsMemberzions:ProductsAndServicesCommercialAccountFeesMemberzions:NevadaStateBankSegmentMember2025-01-012025-09-300000109380us-gaap:OperatingSegmentsMemberzions:ProductsAndServicesCommercialAccountFeesMemberzions:NevadaStateBankSegmentMember2024-01-012024-09-300000109380us-gaap:OperatingSegmentsMemberzions:ProductsAndServicesCommercialAccountFeesMemberzions:VectraBankColoradoSegmentMember2025-01-012025-09-300000109380us-gaap:OperatingSegmentsMemberzions:ProductsAndServicesCommercialAccountFeesMemberzions:VectraBankColoradoSegmentMember2024-01-012024-09-300000109380us-gaap:OperatingSegmentsMemberzions:ProductsAndServicesCardFeesMemberzions:NationalBankOfArizonaSegmentMember2025-01-012025-09-300000109380us-gaap:OperatingSegmentsMemberzions:ProductsAndServicesCardFeesMemberzions:NationalBankOfArizonaSegmentMember2024-01-012024-09-300000109380us-gaap:OperatingSegmentsMemberzions:ProductsAndServicesCardFeesMemberzions:NevadaStateBankSegmentMember2025-01-012025-09-300000109380us-gaap:OperatingSegmentsMemberzions:ProductsAndServicesCardFeesMemberzions:NevadaStateBankSegmentMember2024-01-012024-09-300000109380us-gaap:OperatingSegmentsMemberzions:ProductsAndServicesCardFeesMemberzions:VectraBankColoradoSegmentMember2025-01-012025-09-300000109380us-gaap:OperatingSegmentsMemberzions:ProductsAndServicesCardFeesMemberzions:VectraBankColoradoSegmentMember2024-01-012024-09-300000109380us-gaap:OperatingSegmentsMemberzions:ProductsAndServicesRetailAndBusinessBankingFeesMemberzions:NationalBankOfArizonaSegmentMember2025-01-012025-09-300000109380us-gaap:OperatingSegmentsMemberzions:ProductsAndServicesRetailAndBusinessBankingFeesMemberzions:NationalBankOfArizonaSegmentMember2024-01-012024-09-300000109380us-gaap:OperatingSegmentsMemberzions:ProductsAndServicesRetailAndBusinessBankingFeesMemberzions:NevadaStateBankSegmentMember2025-01-012025-09-300000109380us-gaap:OperatingSegmentsMemberzions:ProductsAndServicesRetailAndBusinessBankingFeesMemberzions:NevadaStateBankSegmentMember2024-01-012024-09-300000109380us-gaap:OperatingSegmentsMemberzions:ProductsAndServicesRetailAndBusinessBankingFeesMemberzions:VectraBankColoradoSegmentMember2025-01-012025-09-300000109380us-gaap:OperatingSegmentsMemberzions:ProductsAndServicesRetailAndBusinessBankingFeesMemberzions:VectraBankColoradoSegmentMember2024-01-012024-09-300000109380us-gaap:OperatingSegmentsMemberzions:ProductsAndServicesCapitalMarketsAndForeignExchangeFeesMemberzions:NationalBankOfArizonaSegmentMember2025-01-012025-09-300000109380us-gaap:OperatingSegmentsMemberzions:ProductsAndServicesCapitalMarketsAndForeignExchangeFeesMemberzions:NationalBankOfArizonaSegmentMember2024-01-012024-09-300000109380us-gaap:OperatingSegmentsMemberzions:ProductsAndServicesCapitalMarketsAndForeignExchangeFeesMemberzions:NevadaStateBankSegmentMember2025-01-012025-09-300000109380us-gaap:OperatingSegmentsMemberzions:ProductsAndServicesCapitalMarketsAndForeignExchangeFeesMemberzions:NevadaStateBankSegmentMember2024-01-012024-09-300000109380us-gaap:OperatingSegmentsMemberzions:ProductsAndServicesCapitalMarketsAndForeignExchangeFeesMemberzions:VectraBankColoradoSegmentMember2025-01-012025-09-300000109380us-gaap:OperatingSegmentsMemberzions:ProductsAndServicesCapitalMarketsAndForeignExchangeFeesMemberzions:VectraBankColoradoSegmentMember2024-01-012024-09-300000109380us-gaap:OperatingSegmentsMemberzions:ProductsAndServicesWealthManagementFeesMemberzions:NationalBankOfArizonaSegmentMember2025-01-012025-09-300000109380us-gaap:OperatingSegmentsMemberzions:ProductsAndServicesWealthManagementFeesMemberzions:NationalBankOfArizonaSegmentMember2024-01-012024-09-300000109380us-gaap:OperatingSegmentsMemberzions:ProductsAndServicesWealthManagementFeesMemberzions:NevadaStateBankSegmentMember2025-01-012025-09-300000109380us-gaap:OperatingSegmentsMemberzions:ProductsAndServicesWealthManagementFeesMemberzions:NevadaStateBankSegmentMember2024-01-012024-09-300000109380us-gaap:OperatingSegmentsMemberzions:ProductsAndServicesWealthManagementFeesMemberzions:VectraBankColoradoSegmentMember2025-01-012025-09-300000109380us-gaap:OperatingSegmentsMemberzions:ProductsAndServicesWealthManagementFeesMemberzions:VectraBankColoradoSegmentMember2024-01-012024-09-300000109380us-gaap:OperatingSegmentsMemberzions:ProductsAndServicesOtherCustomerRelatedFeesMemberzions:NationalBankOfArizonaSegmentMember2025-01-012025-09-300000109380us-gaap:OperatingSegmentsMemberzions:ProductsAndServicesOtherCustomerRelatedFeesMemberzions:NationalBankOfArizonaSegmentMember2024-01-012024-09-300000109380us-gaap:OperatingSegmentsMemberzions:ProductsAndServicesOtherCustomerRelatedFeesMemberzions:NevadaStateBankSegmentMember2025-01-012025-09-300000109380us-gaap:OperatingSegmentsMemberzions:ProductsAndServicesOtherCustomerRelatedFeesMemberzions:NevadaStateBankSegmentMember2024-01-012024-09-300000109380us-gaap:OperatingSegmentsMemberzions:ProductsAndServicesOtherCustomerRelatedFeesMemberzions:VectraBankColoradoSegmentMember2025-01-012025-09-300000109380us-gaap:OperatingSegmentsMemberzions:ProductsAndServicesOtherCustomerRelatedFeesMemberzions:VectraBankColoradoSegmentMember2024-01-012024-09-300000109380us-gaap:OperatingSegmentsMemberzions:NationalBankOfArizonaSegmentMember2025-01-012025-09-300000109380us-gaap:OperatingSegmentsMemberzions:NationalBankOfArizonaSegmentMember2024-01-012024-09-300000109380us-gaap:OperatingSegmentsMemberzions:NevadaStateBankSegmentMember2025-01-012025-09-300000109380us-gaap:OperatingSegmentsMemberzions:NevadaStateBankSegmentMember2024-01-012024-09-300000109380us-gaap:OperatingSegmentsMemberzions:VectraBankColoradoSegmentMember2025-01-012025-09-300000109380us-gaap:OperatingSegmentsMemberzions:VectraBankColoradoSegmentMember2024-01-012024-09-300000109380us-gaap:OperatingSegmentsMemberzions:ProductsAndServicesCommercialAccountFeesMemberzions:CommerceBankOfWashingtonSegmentMember2025-01-012025-09-300000109380us-gaap:OperatingSegmentsMemberzions:ProductsAndServicesCommercialAccountFeesMemberzions:CommerceBankOfWashingtonSegmentMember2024-01-012024-09-300000109380zions:CorporateReconcilingItemsAndEliminationsMemberzions:ProductsAndServicesCommercialAccountFeesMember2025-01-012025-09-300000109380zions:CorporateReconcilingItemsAndEliminationsMemberzions:ProductsAndServicesCommercialAccountFeesMember2024-01-012024-09-300000109380zions:ProductsAndServicesCommercialAccountFeesMember2025-01-012025-09-300000109380zions:ProductsAndServicesCommercialAccountFeesMember2024-01-012024-09-300000109380us-gaap:OperatingSegmentsMemberzions:ProductsAndServicesCardFeesMemberzions:CommerceBankOfWashingtonSegmentMember2025-01-012025-09-300000109380us-gaap:OperatingSegmentsMemberzions:ProductsAndServicesCardFeesMemberzions:CommerceBankOfWashingtonSegmentMember2024-01-012024-09-300000109380zions:CorporateReconcilingItemsAndEliminationsMemberzions:ProductsAndServicesCardFeesMember2025-01-012025-09-300000109380zions:CorporateReconcilingItemsAndEliminationsMemberzions:ProductsAndServicesCardFeesMember2024-01-012024-09-300000109380zions:ProductsAndServicesCardFeesMember2025-01-012025-09-300000109380zions:ProductsAndServicesCardFeesMember2024-01-012024-09-300000109380us-gaap:OperatingSegmentsMemberzions:ProductsAndServicesRetailAndBusinessBankingFeesMemberzions:CommerceBankOfWashingtonSegmentMember2025-01-012025-09-300000109380us-gaap:OperatingSegmentsMemberzions:ProductsAndServicesRetailAndBusinessBankingFeesMemberzions:CommerceBankOfWashingtonSegmentMember2024-01-012024-09-300000109380zions:CorporateReconcilingItemsAndEliminationsMemberzions:ProductsAndServicesRetailAndBusinessBankingFeesMember2025-01-012025-09-300000109380zions:CorporateReconcilingItemsAndEliminationsMemberzions:ProductsAndServicesRetailAndBusinessBankingFeesMember2024-01-012024-09-300000109380zions:ProductsAndServicesRetailAndBusinessBankingFeesMember2025-01-012025-09-300000109380zions:ProductsAndServicesRetailAndBusinessBankingFeesMember2024-01-012024-09-300000109380us-gaap:OperatingSegmentsMemberzions:ProductsAndServicesCapitalMarketsAndForeignExchangeFeesMemberzions:CommerceBankOfWashingtonSegmentMember2025-01-012025-09-300000109380us-gaap:OperatingSegmentsMemberzions:ProductsAndServicesCapitalMarketsAndForeignExchangeFeesMemberzions:CommerceBankOfWashingtonSegmentMember2024-01-012024-09-300000109380zions:CorporateReconcilingItemsAndEliminationsMemberzions:ProductsAndServicesCapitalMarketsAndForeignExchangeFeesMember2025-01-012025-09-300000109380zions:CorporateReconcilingItemsAndEliminationsMemberzions:ProductsAndServicesCapitalMarketsAndForeignExchangeFeesMember2024-01-012024-09-300000109380zions:ProductsAndServicesCapitalMarketsAndForeignExchangeFeesMember2025-01-012025-09-300000109380zions:ProductsAndServicesCapitalMarketsAndForeignExchangeFeesMember2024-01-012024-09-300000109380us-gaap:OperatingSegmentsMemberzions:ProductsAndServicesWealthManagementFeesMemberzions:CommerceBankOfWashingtonSegmentMember2025-01-012025-09-300000109380us-gaap:OperatingSegmentsMemberzions:ProductsAndServicesWealthManagementFeesMemberzions:CommerceBankOfWashingtonSegmentMember2024-01-012024-09-300000109380zions:CorporateReconcilingItemsAndEliminationsMemberzions:ProductsAndServicesWealthManagementFeesMember2025-01-012025-09-300000109380zions:CorporateReconcilingItemsAndEliminationsMemberzions:ProductsAndServicesWealthManagementFeesMember2024-01-012024-09-300000109380zions:ProductsAndServicesWealthManagementFeesMember2025-01-012025-09-300000109380zions:ProductsAndServicesWealthManagementFeesMember2024-01-012024-09-300000109380us-gaap:OperatingSegmentsMemberzions:ProductsAndServicesOtherCustomerRelatedFeesMemberzions:CommerceBankOfWashingtonSegmentMember2025-01-012025-09-300000109380us-gaap:OperatingSegmentsMemberzions:ProductsAndServicesOtherCustomerRelatedFeesMemberzions:CommerceBankOfWashingtonSegmentMember2024-01-012024-09-300000109380zions:CorporateReconcilingItemsAndEliminationsMemberzions:ProductsAndServicesOtherCustomerRelatedFeesMember2025-01-012025-09-300000109380zions:CorporateReconcilingItemsAndEliminationsMemberzions:ProductsAndServicesOtherCustomerRelatedFeesMember2024-01-012024-09-300000109380zions:ProductsAndServicesOtherCustomerRelatedFeesMember2025-01-012025-09-300000109380zions:ProductsAndServicesOtherCustomerRelatedFeesMember2024-01-012024-09-300000109380us-gaap:OperatingSegmentsMemberzions:CommerceBankOfWashingtonSegmentMember2025-01-012025-09-300000109380us-gaap:OperatingSegmentsMemberzions:CommerceBankOfWashingtonSegmentMember2024-01-012024-09-300000109380zions:CorporateReconcilingItemsAndEliminationsMember2025-01-012025-09-300000109380zions:CorporateReconcilingItemsAndEliminationsMember2024-01-012024-09-300000109380us-gaap:RestrictedStockUnitsRSUMember2025-07-012025-09-300000109380us-gaap:RestrictedStockUnitsRSUMember2024-07-012024-09-300000109380us-gaap:RestrictedStockUnitsRSUMember2025-01-012025-09-300000109380us-gaap:RestrictedStockUnitsRSUMember2024-01-012024-09-300000109380us-gaap:EmployeeStockOptionMember2025-07-012025-09-300000109380us-gaap:EmployeeStockOptionMember2024-07-012024-09-300000109380us-gaap:EmployeeStockOptionMember2025-01-012025-09-300000109380us-gaap:EmployeeStockOptionMember2024-01-012024-09-300000109380stpr:UTzions:ZionsBankSegmentMember2025-09-300000109380stpr:IDzions:ZionsBankSegmentMember2025-09-300000109380stpr:WYzions:ZionsBankSegmentMember2025-09-300000109380stpr:CAzions:CaliforniaBankAndTrustSegmentMember2025-09-300000109380stpr:CAzions:FirstBankCoachellaValleyBranchesMemberzions:CaliforniaBankAndTrustSegmentMember2025-09-300000109380stpr:TXzions:AmegyCorporationSegmentMember2025-09-300000109380stpr:AZzions:NationalBankOfArizonaSegmentMember2025-09-300000109380stpr:NVzions:NevadaStateBankSegmentMember2025-09-300000109380stpr:COzions:VectraBankColoradoSegmentMember2025-09-300000109380stpr:NMzions:VectraBankColoradoSegmentMember2025-09-300000109380stpr:WAzions:CommerceBankOfWashingtonSegmentMember2025-09-300000109380stpr:ORzions:CommerceBankOfWashingtonSegmentMember2025-09-30
UNITED STATES
SECURITIES AND EXCHANGE COMMISSION
Washington, D.C. 20549
FORM 10-Q
☒ QUARTERLY REPORT PURSUANT TO SECTION 13 OR 15(d) OF THE SECURITIES EXCHANGE ACT OF 1934 For the quarterly period ended September 30, 2025 OR
☐ TRANSITION REPORT PURSUANT TO SECTION 13 OR 15(d) OF THE SECURITIES EXCHANGE ACT OF 1934 For the transition period from __________ to __________
COMMISSION FILE NUMBER 001-12307
ZIONS BANCORPORATION, NATIONAL ASSOCIATION
(Exact name of registrant as specified in its charter)
|
|
|
|
|
|
United States of America |
87-0189025 |
(State or other jurisdiction of
incorporation or organization) |
(I.R.S. Employer
Identification No.) |
| One South Main |
|
Salt Lake City, Utah |
84133-1109 |
| (Address of principal executive offices) |
(Zip Code) |
Registrant’s telephone number, including area code: (801) 844-8208
Securities registered pursuant to Section 12(b) of the Act:
|
|
|
|
|
|
|
|
|
| Title of Each Class |
Trading Symbols |
Name of Each Exchange on Which Registered |
|
|
|
Common Stock, par value $0.001 |
ZION |
The NASDAQ Stock Market LLC |
| Depositary Shares each representing a 1/40th ownership interest in a share of: |
|
|
Series A Floating-Rate Non-Cumulative Perpetual Preferred Stock |
ZIONP |
The NASDAQ Stock Market LLC |
|
|
|
|
|
|
•Indicate by check mark whether the registrant (1) has filed all reports required to be filed by Section 13 or 15(d) of the Securities Exchange Act of 1934 during the preceding 12 months (or for such shorter period that the registrant was required to file such reports), and (2) has been subject to such filing requirements for the past 90 days. Yes ý No ¨
•Indicate by check mark whether the registrant has submitted electronically every Interactive Data File required to be submitted pursuant to Rule 405 of Regulation S-T (§232.405 of this chapter) during the preceding 12 months (or for such shorter period that the registrant was required to submit such files). Yes ý No ¨
•Indicate by check mark whether the registrant is a large accelerated filer, an accelerated filer, a non-accelerated filer, a smaller reporting company, or an emerging growth company. See the definitions of “large accelerated filer,” “accelerated filer,” “smaller reporting company,” and “emerging growth company” in Rule 12b-2 of the Exchange Act.
Large accelerated filer ý Accelerated filer ¨ Non-accelerated filer ¨ Smaller reporting company ☐ Emerging growth company ¨
•If an emerging growth company, indicate by check mark if the registrant has elected not to use the extended transition period for complying with any new or revised financial accounting standards provided pursuant to Section 13(a) of the Exchange Act. ¨
•Indicate by check mark whether the registrant is a shell company (as defined in Rule 12b-2 of the Exchange Act). Yes ¨ No ý
•Indicate the number of shares outstanding of each of the issuer’s classes of common stock, as of the latest practicable date.
Number of common shares outstanding at October 31, 2025: 147,641,034 shares
ZIONS BANCORPORATION, NATIONAL ASSOCIATION AND SUBSIDIARIES
Table of Contents
|
|
|
|
|
|
|
|
|
|
|
Page |
|
|
|
|
|
| Item 1. |
|
|
|
|
|
|
|
|
|
|
|
|
|
|
|
|
|
|
|
|
|
|
|
|
|
|
| Item 2. |
|
|
|
|
|
| Item 3. |
|
|
|
|
|
| Item 4. |
|
|
|
|
|
|
|
|
|
| Item 1. |
|
|
|
|
|
| Item 1A. |
|
|
|
|
|
| Item 2. |
|
|
|
|
|
| Item 5. |
|
|
|
|
|
| Item 6. |
|
|
|
|
|
|
Table of Contents
ZIONS BANCORPORATION, NATIONAL ASSOCIATION AND SUBSIDIARIES
GLOSSARY OF ACRONYMS AND ABBREVIATIONS
|
|
|
|
|
|
|
|
|
|
|
|
| ACL |
Allowance for Credit Losses |
GAAP |
Generally Accepted Accounting Principles |
| AFS |
Available-for-Sale |
GCF |
General Collateral Finance |
| ALLL |
Allowance for Loan and Lease Losses |
HECL |
Home Equity Credit Line |
| Amegy |
Amegy Bank, a division of Zions Bancorporation, National Association |
HTM |
Held-to-Maturity |
| AOCI |
Accumulated Other Comprehensive Income or Loss |
IPO |
Initial Public Offering |
| ASU |
Accounting Standards Update |
LTV |
Loan-to-Value |
| BDC |
Business Development Company |
NASDAQ |
National Association of Securities Dealers Automated Quotations |
| Board |
Board of Directors |
NBAZ |
National Bank of Arizona, a division of Zions Bancorporation, National Association |
| bps |
Basis Points |
NDFI |
Nondepository Financial Institution |
| BTFP |
Bank Term Funding Program |
NM |
Not Meaningful |
| CB&T |
California Bank & Trust, a division of Zions Bancorporation, National Association |
NSB |
Nevada State Bank, a division of Zions Bancorporation, National Association |
| CET1 |
Common Equity Tier 1 |
OCC |
Office of the Comptroller of the Currency |
| CLTV |
Combined Loan-to-Value Ratio |
OREO |
Other Real Estate Owned |
| CODM |
Chief Operating Decision Maker |
PAGA |
Private Attorneys General Act |
| CRE |
Commercial Real Estate |
PEI |
Private Equity Investment |
| CVA |
Credit Valuation Adjustment |
PPNR |
Pre-provision Net Revenue |
| DTA |
Deferred Tax Asset |
REIT |
Real Estate Investment Trust |
| DTL |
Deferred Tax Liability |
ROU |
Right-of-Use |
| EaR |
Earnings at Risk |
RULC |
Reserve for Unfunded Lending Commitments |
| EPS |
Earnings per Share |
S&P |
Standard & Poor's |
| EVE |
Economic Value of Equity |
SBA |
U.S. Small Business Administration |
| FASB |
Financial Accounting Standards Board |
SBIC |
Small Business Investment Company |
| FDIC |
Federal Deposit Insurance Corporation |
SEC |
Securities and Exchange Commission |
| FHLB |
Federal Home Loan Bank |
TCBW |
The Commerce Bank of Washington, a division of Zions Bancorporation, National Association |
| FICO |
Fair Isaac Corporation |
U.S. |
United States |
| FRB |
Federal Reserve Board |
Vectra |
Vectra Bank Colorado, a division of Zions Bancorporation, National Association |
| FTP |
Funds Transfer Pricing |
Zions Bank |
Zions Bank, a division of Zions Bancorporation, National Association |
ZIONS BANCORPORATION, NATIONAL ASSOCIATION AND SUBSIDIARIES
PART I. FINANCIAL INFORMATION
ITEM 2. MANAGEMENT’S DISCUSSION AND ANALYSIS OF FINANCIAL CONDITION AND RESULTS OF OPERATIONS
FORWARD-LOOKING INFORMATION
This quarterly report contains “forward-looking statements” as defined under the Private Securities Litigation Reform Act of 1995. These statements reflect management’s current expectations and assumptions regarding future events and outcomes. However, they are inherently subject to known and unknown risks, uncertainties, and other factors that could cause actual results, achievements, industry developments, or regulatory outcomes to differ materially from those expressed or implied. Forward-looking statements may include, among others:
•Statements concerning the beliefs, plans, objectives, goals, targets, commitments, designs, guidelines, expectations, anticipations, and future financial condition, operating results, and performance of Zions Bancorporation, National Association, and its subsidiaries (collectively “Zions Bancorporation, N.A.,” “the Bank,” “we,” “our,” “us”); and
•Statements preceded or followed by, or that include, terminology such as “may,” “might,” “can,” “continue,” “could,” “should,” “would,” “believe,” “anticipate,” “estimate,” “forecasts,” “expect,” “intend,” “target,” “commit,” “design,” “plan,” “projects,” “will,” or similar words and expressions, including their negative forms.
Forward-looking statements are not guarantees and should not be relied upon as representing management’s views as of any subsequent date. Actual results and outcomes may differ materially from those presented. Although the following list is not comprehensive, key factors that may cause material differences include:
•The quality and composition of our loan and investment securities portfolios and the quality and composition of our deposits;
•Changes in general industry, political, and economic conditions, including increases in the national debt, elevated inflation, economic slowdowns or recessions, and other macroeconomic challenges; changes in interest and reference rates, which could negatively impact our revenues and expenses, the valuation and performance of our assets and liabilities, and the availability and cost of funding and liquidity;
•Political developments, including government shutdowns and other significant disruptions and changes in the funding, size, scope, and effectiveness of the government and its agencies and services;
•The effects of newly enacted and proposed regulations affecting us and the banking industry, as well as changes and uncertainties in the interpretation, enforcement, and applicability of laws and fiscal, monetary, regulatory, trade, and tax policies;
•Actions taken by governments, agencies, central banks, and similar organizations, including those that result in decreases in revenue, increases in regulatory bank fees, insurance assessments, and capital standards; and other regulatory requirements;
•Evolving trade policies and disputes, such as proposed and implemented tariffs and resulting market volatility and uncertainty, including the effects on supply chains, expenses, and revenues for both us and our customers;
•Judicial, regulatory and administrative inquiries, investigations, examinations or proceedings and the outcomes thereof that create uncertainty for, or are adverse to, us or the banking industry;
•Changes in our credit ratings;
•Our ability to innovate and otherwise address competitive pressures and other factors that may affect aspects of our business, such as pricing, relevance of, and demand for, our products and services, and our ability to recruit and retain talent;
•The potential for both positive and disruptive impacts of emerging technologies, including stablecoins and other digital currencies, blockchain, artificial intelligence, quantum computing, and related innovations affecting both us and the banking industry;
ZIONS BANCORPORATION, NATIONAL ASSOCIATION AND SUBSIDIARIES
•Our ability to complete projects and initiatives and execute our strategic plans, manage our risks, control compensation and other expenses, and achieve our business objectives;
•Our ability to develop and maintain technology and information security systems, along with effective controls designed to guard against fraud, cybersecurity, and privacy risks and related incidents, particularly given the accelerating pace at which threat actors are developing and deploying increasingly sophisticated and targeted tactics against the financial services industry;
•Our ability to provide adequate oversight of our suppliers to help us prevent or mitigate effects upon us and our customers of inadequate performance, systems failures, or cyber and other incidents by, or affecting, third parties upon whom we rely for the delivery of various products and services;
•The effects of wars, geopolitical conflicts, and other local, national, or international disasters, crises, or conflicts that may occur in the future;
•Natural disasters, pandemics, wildfires, catastrophic events, and other emergencies and incidents, and their impact on our and our customers’ operations, business, and communities, including the increasing difficulty in, and the expense of, obtaining property, auto, business, and other insurance products;
•Governmental and social responses to environmental, social, and governance issues, including those with respect to climate change and diversity;
•Securities and capital markets behavior, including volatility and changes in market liquidity and our ability to raise capital;
•The possibility that our recorded goodwill could become impaired, which may have an adverse impact on our earnings and shareholders’ equity;
•The impact of bank closures or adverse developments at other banks on general investor sentiment regarding the stability and liquidity of banks; and
•Adverse news and other expressions of negative public opinion whether directed at us, other banks, the banking industry, or otherwise that may adversely affect our reputation and that of the banking industry generally.
Factors that could cause our actual results, performance, achievements, industry trends, or regulatory outcomes to differ materially from those expressed or implied in the forward-looking statements are discussed in our 2024 Form 10-K and subsequent filings with the Securities and Exchange Commission (“SEC”). These documents are available on our website (www.zionsbancorporation.com) and from the SEC (www.sec.gov).
We caution against placing undue reliance on forward-looking statements, as they reflect our views only as of the date they are issued. Except as required by law, we specifically disclaim any obligation to update any factors or publicly announce revisions to forward-looking statements to reflect future events or developments.
RESULTS OF OPERATIONS
Comparisons noted below are calculated for the current quarter versus the same prior year period, unless otherwise specified. Reasons for changes in the current year-to-date period compared with the same prior year period are generally consistent with the quarter-to-date comparisons unless otherwise specified. Growth rates of 100% or more are considered not meaningful (“NM”) as they typically reflect a low starting point.
ZIONS BANCORPORATION, NATIONAL ASSOCIATION AND SUBSIDIARIES
Third Quarter 2025 Financial Performance
|
|
|
|
|
|
|
|
|
|
|
|
|
|
|
|
|
|
|
|
|
Net Earnings Applicable to Common Shareholders
(in millions) |
|
Diluted EPS |
|
Adjusted PPNR
(in millions) 1
|
|
Efficiency Ratio 1 |


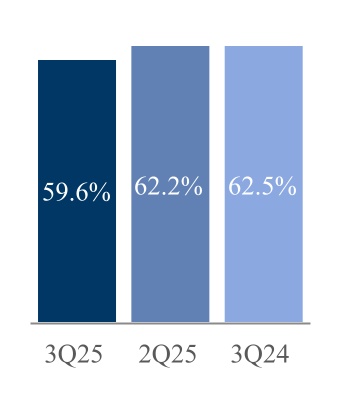
1 For information on non-GAAP financial measures, see page 41.
Executive Summary
Our financial performance in the third quarter of 2025, relative to the prior year period, reflected growth in net earnings applicable to common shareholders, diluted earnings per share (“EPS”), and adjusted pre-provision net revenue (“PPNR”). Diluted EPS increased to $1.48, compared with $1.37 in the third quarter of 2024, as higher net interest income and noninterest income were partially offset by a higher provision for credit losses and increased noninterest expense.
During the quarter, we recorded a $60 million provision for credit losses in connection with revolving lines of credit extended to two related commercial borrowers to finance the origination and purchase of commercial and residential mortgages. Of the total exposure, we charged off $50 million of the combined loan balances and established a full reserve for the remaining $10 million. These actions resulted from a review of the borrowers, guarantors, and associated collateral, which identified apparent irregularities and misrepresentations. As a result, legal action has been initiated to pursue recovery of the outstanding amounts owed from the guarantors of the credits.
•Net interest income increased $52 million, or 8%, compared with the prior year period, primarily due to lower funding costs and favorable shifts in the composition of average interest-earning assets. As a result, the net interest margin improved to 3.28%, compared with 3.03%.
◦Average interest-earning assets declined $111 million, primarily attributable to a reduction in average money market investments and average securities. These declines were partially offset by an increase in average loans and leases.
◦Average interest-bearing liabilities decreased $641 million, or 1%, mainly due to a reduction in average interest-bearing deposits, partially offset by an increase in average borrowed funds.
•The provision for credit losses was $49 million, compared with $13 million in the prior year period. The year-over-year increase was due to the previously disclosed credit losses involving two related commercial loans.
•Customer-related noninterest income increased $5 million, or 3%, primarily due to higher loan-related fees and income, largely resulting from increased mortgage loan sales activity. This growth was partially offset by an $11 million net credit valuation adjustment (“CVA”) loss, recorded in capital markets fees and income. This loss was primarily driven by an update to our valuation methodology, in addition to changes in other market factors. Excluding the impact of the net CVA loss, customer-related noninterest income increased $13 million, or 8%, benefiting primarily from improved loan syndication activity and higher customer swap fees.
ZIONS BANCORPORATION, NATIONAL ASSOCIATION AND SUBSIDIARIES
•Noncustomer-related noninterest income increased $12 million, or 86%, mainly due to increased dividends and other income, which were primarily attributable to a gain on the sale of a bank-owned property and higher dividends received on Federal Home Loan Bank (“FHLB”) stock.
•Noninterest expense increased $25 million, or 5%, primarily due to higher salaries and employee benefits expense, as well as an increase in technology, telecom, and information processing expense. These increases were partially offset by a decline in deposit insurance and regulatory expense.
•Total loans and leases increased $1.4 billion, or 2%, primarily driven by growth in the consumer 1-4 family residential mortgage and commercial and industrial loan portfolios.
◦Net loan and lease charge-offs totaled $56 million, or 0.37% of average loans and leases annualized, compared with $3 million, or 0.02%, in the prior year quarter. The increase in charge-offs was mainly driven by the previously disclosed $50 million loss associated with two related commercial loans.
◦Nonperforming assets totaled $324 million, or 0.54% of total loans and leases and other real estate owned, compared with $368 million, or 0.62%. The decrease was primarily in the commercial and industrial loan portfolio. Classified loans totaled $2.4 billion, or 4.00% of total loans and leases, compared with $2.1 billion, or 3.55%, in the prior year quarter, and decreased from $2.7 billion, or 4.43%, in the prior quarter.
•Total deposits decreased $840 million, or 1%. The reduction in interest-bearing deposits was primarily due to the migration of a consumer interest-bearing product into a new noninterest-bearing offering, along with a decrease in brokered deposits. This decline was partially offset by an increase in noninterest-bearing demand deposits, mainly driven by the aforementioned product migration. Customer deposits, excluding brokered deposits, totaled $71.1 billion, compared with $70.5 billion.
•Total borrowed funds increased $1.8 billion, or 51%, compared with the prior year quarter. This growth was driven by higher levels of long-term debt and short-term advances from the FHLB, partially offset by the full repayment of borrowings under the Federal Reserve Board (“FRB”) Bank Term Funding Program (“BTFP”).
Net Interest Income and Net Interest Margin
NET INTEREST INCOME AND NET INTEREST MARGIN
|
|
|
|
|
|
|
|
|
|
|
|
|
|
|
|
|
|
|
|
|
|
|
|
|
|
|
|
|
|
|
|
|
|
|
|
|
|
|
|
|
|
|
|
|
|
|
|
|
Three Months Ended
September 30, |
|
Amount change |
|
Percent change |
|
Nine Months Ended
September 30, |
|
Amount change |
|
Percent change |
| (Dollar amounts in millions) |
2025 |
|
2024 |
|
|
|
2025 |
|
2024 |
|
|
|
|
|
|
|
|
|
|
|
|
|
|
|
|
|
|
Interest and fees on loans 1 |
$ |
898 |
|
|
$ |
899 |
|
|
$ |
(1) |
|
|
— |
% |
|
$ |
2,623 |
|
|
$ |
2,641 |
|
|
$ |
(18) |
|
|
(1) |
% |
| Interest on money market investments |
41 |
|
|
67 |
|
|
(26) |
|
|
(39) |
|
|
144 |
|
|
170 |
|
|
(26) |
|
|
(15) |
|
| Interest on securities |
125 |
|
|
138 |
|
|
(13) |
|
|
(9) |
|
|
376 |
|
|
420 |
|
|
(44) |
|
|
(10) |
|
Total interest income |
1,064 |
|
|
1,104 |
|
|
(40) |
|
|
(4) |
|
|
3,143 |
|
|
3,231 |
|
|
(88) |
|
|
(3) |
|
| Interest on deposits |
313 |
|
|
403 |
|
|
(90) |
|
|
(22) |
|
|
951 |
|
|
1,169 |
|
|
(218) |
|
|
(19) |
|
| Interest on short- and long-term borrowings |
79 |
|
|
81 |
|
|
(2) |
|
|
(2) |
|
|
248 |
|
|
259 |
|
|
(11) |
|
|
(4) |
|
Total interest expense |
392 |
|
|
484 |
|
|
(92) |
|
|
(19) |
|
|
1,199 |
|
|
1,428 |
|
|
(229) |
|
|
(16) |
|
Net interest income |
$ |
672 |
|
|
$ |
620 |
|
|
$ |
52 |
|
|
8 |
|
|
$ |
1,944 |
|
|
$ |
1,803 |
|
|
$ |
141 |
|
|
8 |
|
|
|
|
|
|
|
|
|
|
|
|
|
|
|
|
|
| Average interest-earning assets |
$ |
82,783 |
|
|
$ |
82,894 |
|
|
$ |
(111) |
|
|
— |
% |
|
$ |
83,116 |
|
|
$ |
82,204 |
|
|
$ |
912 |
|
|
1 |
% |
| Average interest-bearing liabilities |
$ |
55,987 |
|
|
$ |
56,628 |
|
|
$ |
(641) |
|
|
(1) |
|
|
$ |
56,866 |
|
|
$ |
55,854 |
|
|
$ |
1,012 |
|
|
2 |
|
|
|
|
|
|
bps |
|
|
|
|
|
|
|
bps |
|
|
|
|
|
|
|
|
|
|
|
|
|
|
|
|
|
|
|
|
|
|
|
|
|
|
|
|
|
|
|
|
|
|
|
|
|
|
|
|
|
|
|
|
|
|
|
|
|
|
Net interest margin 2 |
3.28% |
|
3.03% |
|
25 |
|
|
|
|
3.18% |
|
2.98% |
|
20 |
|
|
|
1 Includes interest income recoveries of $2 million and $1 million for the three months ended, and $8 million and $5 million for the nine months ended September 30, 2025, and 2024, respectively.
2 Taxable-equivalent rates used where applicable.
ZIONS BANCORPORATION, NATIONAL ASSOCIATION AND SUBSIDIARIES
Net interest income accounted for 78% of total net revenue (sum of net interest income plus noninterest income) in both the third quarters of 2025 and 2024. It increased $52 million, or 8%, for the three months ended September 30, 2025, relative to the same prior year period. This increase was primarily due to lower funding costs and a favorable shift in the composition of average interest-earning assets, reflecting growth in higher-yielding loans and a decline in lower-yielding money market investments and securities. As a result, the net interest margin improved to 3.28%, compared with 3.03%.
The following chart presents the changes in yields on average interest-earning assets:
The yield on average interest-earning assets, net of hedging activity, declined 19 basis points (“bps”) in the third quarter of 2025, compared with the prior year period, reflecting a lower interest rate environment. The yield on average money market investments declined 100 bps, while the net yield on average loans decreased 24 bps, and the net yield on average securities declined 13 bps during the third quarter of 2025.
The following chart presents the changes in rates paid on average interest-bearing liabilities:
ZIONS BANCORPORATION, NATIONAL ASSOCIATION AND SUBSIDIARIES
The total cost of deposits decreased 47 bps, and the rate paid on total deposits and interest-bearing liabilities decreased 44 bps during the third quarter of 2025, compared with the prior year period, reflecting the lower interest rate environment. The rates paid on interest-bearing deposits and total borrowed funds decreased 68 bps and 30 bps, respectively.
Average interest-earning assets decreased $111 million from the prior year quarter, as a decline in average money market investments and average securities was partially offset by an increase in average loans and leases.
Average loans and leases increased $2.1 billion, or 4%, to $60.8 billion, primarily due to growth in average consumer and commercial loans. Average securities decreased $1.2 billion, or 6%, to $18.2 billion, largely attributable to principal reductions, net of reinvestments. The paydown of lower-yielding securities continues to improve the overall yield of interest-earning assets and the net interest margin.
Average interest-bearing liabilities decreased $641 million, or 1%, from the prior year quarter. This decline was primarily driven by a reduction in average interest-bearing deposits, largely resulting from the migration of a consumer interest-bearing product into a new noninterest-bearing offering, along with a decrease in brokered deposits. The decrease was partially offset by an increase in average borrowed funds, reflecting an increase in long-term debt.
ZIONS BANCORPORATION, NATIONAL ASSOCIATION AND SUBSIDIARIES
Average deposits decreased $726 million, or 1%, to $74.3 billion. Average interest-bearing deposits decreased $925 million, or 2%. Average noninterest-bearing deposits increased $199 million or 1%, and represented 34% of total deposits for the quarter, compared with 33% during the same prior year period. The change in average deposits was mainly due to the same drivers noted above.
Average borrowed funds, primarily composed of secured borrowings, increased $284 million, or 4%, to $6.6 billion. This growth was driven by increases in long-term debt, partially offset by the full repayment of borrowings under the FRB BTFP and a decrease in security repurchase agreements. The increase in long-term debt reflects the issuance of $500 million in 4.70% Fixed-to-Floating Senior Notes in August 2025, and $500 million in 6.82% Fixed-to-Floating Subordinated Notes in November 2024. These issuances were partially offset by the redemption of $88 million in 6.95% Fixed-to-Floating Subordinated Notes in December 2024.
For more information on our investment securities portfolio and borrowed funds and how we manage liquidity risk, refer to the “Investment Securities Portfolio” section on page 18 and the “Liquidity Risk Management” section on page 38. For further discussion of the effects of market rates on net interest income and how we manage interest rate risk, refer to the “Interest Rate and Market Risk Management” section on page 35.
The following schedule summarizes the average balances, the amount of interest earned or paid, and the applicable yields for interest-earning assets and the costs of interest-bearing liabilities:
ZIONS BANCORPORATION, NATIONAL ASSOCIATION AND SUBSIDIARIES
CONSOLIDATED AVERAGE BALANCE SHEETS, YIELDS AND RATES
|
|
|
|
|
|
|
|
|
|
|
|
|
|
|
|
|
|
|
|
|
|
|
|
|
|
|
|
|
|
|
|
|
|
|
|
| (Unaudited) |
Three Months Ended
September 30, 2025 |
|
Three Months Ended
September 30, 2024 |
| (Dollar amounts in millions) |
Average
balance |
|
Interest |
|
Yield/
Rate 1
|
|
Average
balance |
|
Interest |
|
Yield/
Rate 1
|
| ASSETS |
|
|
|
|
|
|
|
|
|
|
|
| Money market investments: |
|
|
|
|
|
|
|
|
|
|
|
| Interest-bearing deposits |
$ |
1,582 |
|
|
$ |
17 |
|
|
4.42 |
% |
|
$ |
2,457 |
|
|
$ |
34 |
|
|
5.53 |
% |
| Federal funds sold and securities purchased under agreements to resell |
1,940 |
|
|
24 |
|
|
4.87 |
|
|
2,258 |
|
|
33 |
|
|
5.82 |
|
| Total money market investments |
3,522 |
|
|
41 |
|
|
4.67 |
|
|
4,715 |
|
|
67 |
|
|
5.67 |
|
| Trading securities |
83 |
|
|
1 |
|
|
4.63 |
|
|
32 |
|
|
1 |
|
|
4.18 |
|
| Investment securities: |
|
|
|
|
|
|
|
|
|
|
|
| Available-for-sale |
9,078 |
|
|
76 |
|
|
3.28 |
|
|
9,442 |
|
|
84 |
|
|
3.53 |
|
| Held-to-maturity |
9,143 |
|
|
50 |
|
|
2.19 |
|
|
9,936 |
|
|
55 |
|
|
2.22 |
|
Total investment securities |
18,221 |
|
|
126 |
|
|
2.73 |
|
|
19,378 |
|
|
139 |
|
|
2.86 |
|
| Loans held for sale |
171 |
|
|
3 |
|
|
NM |
|
104 |
|
|
2 |
|
|
NM |
Loans and leases: 2 |
|
|
|
|
|
|
|
|
|
|
|
| Commercial |
31,558 |
|
|
474 |
|
|
5.97 |
|
|
30,671 |
|
|
473 |
|
|
6.14 |
|
| Commercial real estate |
13,611 |
|
|
227 |
|
|
6.64 |
|
|
13,523 |
|
|
245 |
|
|
7.23 |
|
| Consumer |
15,617 |
|
|
203 |
|
|
5.16 |
|
|
14,471 |
|
|
189 |
|
|
5.18 |
|
| Total loans and leases |
60,786 |
|
|
904 |
|
|
5.91 |
|
|
58,665 |
|
|
907 |
|
|
6.15 |
|
| Total interest-earning assets |
82,783 |
|
|
1,075 |
|
|
5.16 |
|
|
82,894 |
|
|
1,116 |
|
|
5.35 |
|
| Cash and due from banks |
702 |
|
|
|
|
|
|
703 |
|
|
|
|
|
| Allowance for credit losses on loans and debt securities |
(687) |
|
|
|
|
|
|
(699) |
|
|
|
|
|
| Goodwill and intangibles |
1,095 |
|
|
|
|
|
|
1,054 |
|
|
|
|
|
| Other assets |
5,262 |
|
|
|
|
|
|
5,218 |
|
|
|
|
|
| Total assets |
$ |
89,155 |
|
|
|
|
|
|
$ |
89,170 |
|
|
|
|
|
| LIABILITIES AND SHAREHOLDERS’ EQUITY |
|
|
|
|
|
|
|
|
|
|
| Interest-bearing deposits: |
|
|
|
|
|
|
|
|
|
|
|
| Savings and money market |
$ |
39,252 |
|
|
$ |
216 |
|
|
2.18 |
% |
|
$ |
39,031 |
|
|
$ |
266 |
|
|
2.72 |
% |
| Time |
10,129 |
|
|
97 |
|
|
3.81 |
|
|
11,275 |
|
|
137 |
|
|
4.81 |
|
|
|
|
|
|
|
|
|
|
|
|
|
| Total interest-bearing deposits |
49,381 |
|
|
313 |
|
|
2.51 |
|
|
50,306 |
|
|
403 |
|
|
3.19 |
|
| Borrowed funds: |
|
|
|
|
|
|
|
|
|
|
|
Federal funds and security repurchase agreements |
665 |
|
|
7 |
|
|
4.28 |
|
|
1,072 |
|
|
14 |
|
|
5.33 |
|
| Other short-term borrowings |
4,731 |
|
|
53 |
|
|
4.48 |
|
|
4,704 |
|
|
58 |
|
|
4.89 |
|
| Long-term debt |
1,210 |
|
|
19 |
|
|
6.13 |
|
|
546 |
|
|
9 |
|
|
5.91 |
|
| Total borrowed funds |
6,606 |
|
|
79 |
|
|
4.76 |
|
|
6,322 |
|
|
81 |
|
|
5.06 |
|
| Total interest-bearing liabilities |
55,987 |
|
|
392 |
|
|
2.78 |
|
|
56,628 |
|
|
484 |
|
|
3.40 |
|
| Noninterest-bearing demand deposits |
24,922 |
|
|
|
|
|
|
24,723 |
|
|
|
|
|
| Other liabilities |
1,564 |
|
|
|
|
|
|
1,641 |
|
|
|
|
|
| Total liabilities |
82,473 |
|
|
|
|
|
|
82,992 |
|
|
|
|
|
| Shareholders’ equity: |
|
|
|
|
|
|
|
|
|
|
|
| Preferred equity |
66 |
|
|
|
|
|
|
440 |
|
|
|
|
|
| Common equity |
6,616 |
|
|
|
|
|
|
5,738 |
|
|
|
|
|
| Total shareholders’ equity |
6,682 |
|
|
|
|
|
|
6,178 |
|
|
|
|
|
| Total liabilities and shareholders’ equity |
$ |
89,155 |
|
|
|
|
|
|
$ |
89,170 |
|
|
|
|
|
| Spread on average interest-bearing funds |
|
|
|
|
2.38 |
% |
|
|
|
|
|
1.95 |
% |
| Net impact of noninterest-bearing sources of funds |
|
|
|
|
0.90 |
% |
|
|
|
|
|
1.08 |
% |
Net interest margin |
|
|
$ |
683 |
|
|
3.28 |
% |
|
|
|
$ |
632 |
|
|
3.03 |
% |
Memo: total cost of deposits |
$ |
74,303 |
|
|
313 |
|
|
1.67 |
% |
|
$ |
75,029 |
|
|
403 |
|
|
2.14 |
% |
| Memo: total deposits and interest-bearing liabilities |
$ |
80,909 |
|
|
392 |
|
|
1.92 |
% |
|
$ |
81,351 |
|
|
484 |
|
|
2.36 |
% |
1 Taxable-equivalent rates used where applicable.
2 Net of unamortized purchase premiums, discounts, and deferred loan fees and costs.
ZIONS BANCORPORATION, NATIONAL ASSOCIATION AND SUBSIDIARIES
|
|
|
|
|
|
|
|
|
|
|
|
|
|
|
|
|
|
|
|
|
|
|
|
|
|
|
|
|
|
|
|
|
|
|
|
|
Nine Months Ended
September 30, 2025 |
|
Nine Months Ended
September 30, 2024 |
| (Dollar amounts in millions) |
Average
balance |
|
Interest |
|
Yield/
Rate 1
|
|
Average
balance |
|
Interest |
|
Yield/
Rate 1
|
| ASSETS |
|
|
|
|
|
|
|
|
|
|
|
| Money market investments: |
|
|
|
|
|
|
|
|
|
|
|
| Interest-bearing deposits |
$ |
1,586 |
|
|
$ |
53 |
|
|
4.51 |
% |
|
$ |
1,940 |
|
|
$ |
81 |
|
|
5.59 |
% |
| Federal funds sold and securities purchased under agreements to resell |
2,552 |
|
|
91 |
|
|
4.77 |
|
|
2,037 |
|
|
89 |
|
|
5.86 |
|
| Total money market investments |
4,138 |
|
|
144 |
|
|
4.67 |
|
|
3,977 |
|
|
170 |
|
|
5.72 |
|
| Trading securities |
117 |
|
|
4 |
|
|
4.68 |
|
|
35 |
|
|
1 |
|
|
4.42 |
|
| Investment securities: |
|
|
|
|
|
|
|
|
|
|
|
| Available-for-sale |
9,091 |
|
|
223 |
|
|
3.27 |
|
|
9,725 |
|
|
256 |
|
|
3.52 |
|
| Held-to-maturity |
9,348 |
|
|
155 |
|
|
2.22 |
|
|
10,110 |
|
|
169 |
|
|
2.24 |
|
Total investment securities |
18,439 |
|
|
378 |
|
|
2.74 |
|
|
19,835 |
|
|
425 |
|
|
2.87 |
|
| Loans held for sale |
124 |
|
|
5 |
|
|
NM |
|
68 |
|
|
3 |
|
|
NM |
Loans and leases: 2 |
|
|
|
|
|
|
|
|
|
|
|
| Commercial |
31,327 |
|
|
1,383 |
|
|
5.90 |
|
|
30,553 |
|
|
1,383 |
|
|
6.05 |
|
| Commercial real estate |
13,593 |
|
|
673 |
|
|
6.61 |
|
|
13,538 |
|
|
734 |
|
|
7.24 |
|
| Consumer |
15,378 |
|
|
591 |
|
|
5.14 |
|
|
14,198 |
|
|
548 |
|
|
5.15 |
|
| Total loans and leases |
60,298 |
|
|
2,647 |
|
|
5.87 |
|
|
58,289 |
|
|
2,665 |
|
|
6.11 |
|
| Total interest-earning assets |
83,116 |
|
|
3,178 |
|
|
5.11 |
|
|
82,204 |
|
|
3,264 |
|
|
5.30 |
|
| Cash and due from banks |
703 |
|
|
|
|
|
|
701 |
|
|
|
|
|
| Allowance for credit losses on loans and debt securities |
(691) |
|
|
|
|
|
|
(693) |
|
|
|
|
|
| Goodwill and intangibles |
1,082 |
|
|
|
|
|
|
1,056 |
|
|
|
|
|
| Other assets |
5,317 |
|
|
|
|
|
|
5,305 |
|
|
|
|
|
| Total assets |
$ |
89,527 |
|
|
|
|
|
|
$ |
88,573 |
|
|
|
|
|
| LIABILITIES AND SHAREHOLDERS’ EQUITY |
|
|
|
|
|
|
|
|
|
|
| Interest-bearing deposits: |
|
|
|
|
|
|
|
|
|
|
|
| Savings and money market |
$ |
39,256 |
|
|
$ |
637 |
|
|
2.17 |
% |
|
$ |
38,471 |
|
|
$ |
785 |
|
|
2.73 |
% |
| Time |
10,601 |
|
|
314 |
|
|
3.96 |
|
|
10,601 |
|
|
384 |
|
|
4.83 |
|
|
|
|
|
|
|
|
|
|
|
|
|
| Total interest-bearing deposits |
49,857 |
|
|
951 |
|
|
2.55 |
|
|
49,072 |
|
|
1,169 |
|
|
3.18 |
|
| Borrowed funds: |
|
|
|
|
|
|
|
|
|
|
|
Federal funds and security repurchase agreements |
1,279 |
|
|
41 |
|
|
4.34 |
|
|
1,328 |
|
|
53 |
|
|
5.37 |
|
| Other short-term borrowings |
4,685 |
|
|
157 |
|
|
4.49 |
|
|
4,910 |
|
|
181 |
|
|
4.94 |
|
| Long-term debt |
1,045 |
|
|
50 |
|
|
6.29 |
|
|
544 |
|
|
25 |
|
|
5.96 |
|
| Total borrowed funds |
7,009 |
|
|
248 |
|
|
4.73 |
|
|
6,782 |
|
|
259 |
|
|
5.11 |
|
| Total interest-bearing liabilities |
56,866 |
|
|
1,199 |
|
|
2.82 |
|
|
55,854 |
|
|
1,428 |
|
|
3.41 |
|
| Noninterest-bearing demand deposits |
24,637 |
|
|
|
|
|
|
25,136 |
|
|
|
|
|
| Other liabilities |
1,571 |
|
|
|
|
|
|
1,650 |
|
|
|
|
|
| Total liabilities |
83,074 |
|
|
|
|
|
|
82,640 |
|
|
|
|
|
| Shareholders’ equity: |
|
|
|
|
|
|
|
|
|
|
|
| Preferred equity |
66 |
|
|
|
|
|
|
440 |
|
|
|
|
|
| Common equity |
6,387 |
|
|
|
|
|
|
5,493 |
|
|
|
|
|
| Total shareholders’ equity |
6,453 |
|
|
|
|
|
|
5,933 |
|
|
|
|
|
| Total liabilities and shareholders’ equity |
$ |
89,527 |
|
|
|
|
|
|
$ |
88,573 |
|
|
|
|
|
| Spread on average interest-bearing funds |
|
|
|
|
2.29 |
% |
|
|
|
|
|
1.89 |
% |
| Net impact of noninterest-bearing sources of funds |
|
|
|
|
0.89 |
% |
|
|
|
|
|
1.09 |
% |
Net interest margin |
|
|
$ |
1,979 |
|
|
3.18 |
% |
|
|
|
$ |
1,836 |
|
|
2.98 |
% |
Memo: total cost of deposits |
$ |
74,494 |
|
|
951 |
|
|
1.71 |
% |
|
$ |
74,208 |
|
|
1,169 |
|
|
2.10 |
% |
| Memo: total deposits and interest-bearing liabilities |
$ |
81,503 |
|
|
1,199 |
|
|
1.98 |
% |
|
$ |
80,990 |
|
|
1,428 |
|
|
2.34 |
% |
1 Taxable-equivalent rates used where applicable.
2 Net of unamortized purchase premiums, discounts, and deferred loan fees and costs.
ZIONS BANCORPORATION, NATIONAL ASSOCIATION AND SUBSIDIARIES
The Allowance and Provision for Credit Losses
The allowance for credit losses (“ACL”) comprises both the allowance for loan and lease losses (“ALLL”) and the reserve for unfunded lending commitments (“RULC”). The ALLL represents the estimated current expected credit losses related to the loan and lease portfolio as of the balance sheet date. The RULC represents the estimated reserve for current expected credit losses associated with off-balance sheet commitments. Changes in the ALLL and RULC, net of charge-offs and recoveries, are recorded as the provision for loan and lease losses and the provision for unfunded lending commitments, respectively, on the consolidated statement of income. The ACL for debt securities is estimated separately from loans and is included in “Investment securities” on the consolidated balance sheet.

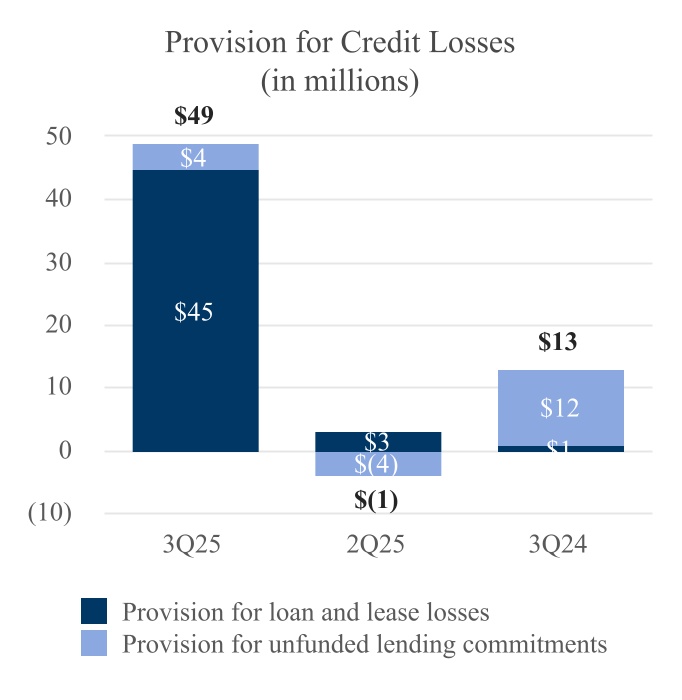
The ACL was $725 million at September 30, 2025, compared with $736 million at September 30, 2024. The year-over-year decrease in the ACL primarily reflects lower reserves associated with commercial real estate (“CRE”) portfolio-specific risks, partially offset by more adverse economic scenarios and increased growth in loans and commitments. The ratio of ACL to total loans and leases was 1.20% at September 30, 2025, compared with 1.25% at September 30, 2024. The following schedule illustrates the primary drivers of changes in the ACL compared with the prior year period.
ZIONS BANCORPORATION, NATIONAL ASSOCIATION AND SUBSIDIARIES
To estimate current expected losses, we use econometric loss models that incorporate multiple economic scenarios, ranging from optimistic to baseline to stressed economic conditions. The outcomes of these scenarios are weighted to derive the credit loss estimate. Management may adjust these scenario weightings based on their assessment of prevailing conditions and reasonable and supportable forecasts.
The second bar in the schedule above reflects changes in economic forecasts and current economic conditions, incorporating management’s judgment regarding the weighting of these forecasts during the current quarter. These changes resulted in a $26 million increase in the ACL from the prior year quarter, primarily due to the incorporation of more adverse economic scenarios.
The third bar captures changes in credit quality factors, including risk grade migration, portfolio-specific risks, and specific reserves on loans. Collectively, these factors contributed to a $60 million decrease in the ACL, largely driven by reduced CRE portfolio-specific risks. This decrease was partially offset by a full reserve of the $10 million remaining balance established in connection with the previously disclosed credit losses involving two related commercial loans.
The fourth bar represents changes in the composition of the loan portfolio, including shifts in loan balances and mix, the aging of the portfolio, and other qualitative risk factors. These changes resulted in a $23 million increase in the ACL, primarily driven by $1.4 billion in period-end loan growth, partially offset by changes in the mix of the loan portfolio.
The provision for credit losses, which includes both the provision for loan and lease losses and the provision for unfunded lending commitments, was $49 million in the third quarter of 2025, compared with $13 million in the third quarter of 2024. The year-over-year increase was due to the previously disclosed credit losses involving two related commercial loans. The provision for securities losses was less than $1 million during both the third quarters of 2025 and 2024.
For more information regarding the methodology used to determine the appropriate levels of the ALLL and RULC, see “Credit Risk Management” on page 22 and Note 6 in our 2024 Form 10-K.
ZIONS BANCORPORATION, NATIONAL ASSOCIATION AND SUBSIDIARIES
Noninterest Income
Noninterest income is comprised of revenue generated from products and services that typically do not bear an associated interest rate or yield. It is categorized as either customer-related or noncustomer-related. Customer-related noninterest income excludes items such as securities gains and losses, dividends, and insurance-related income.
Noninterest income accounted for 22% of total net revenue (sum of net interest income plus noninterest income) in both the third quarters of 2025 and 2024. It increased $17 million, or 10%, for the three months ended September 30, and $43 million, or 8%, for the nine months ended September 30, 2025, relative to the same prior year period. The following schedule presents a comparison of the major components of noninterest income:
NONINTEREST INCOME
|
|
|
|
|
|
|
|
|
|
|
|
|
|
|
|
|
|
|
|
|
|
|
|
|
|
|
|
|
|
|
|
|
|
|
|
|
|
|
|
|
|
|
|
|
|
|
|
|
Three Months Ended
September 30, |
|
Amount
change |
|
Percent
change |
|
Nine Months Ended
September 30, |
|
Amount
change |
|
Percent
change |
| (Dollar amounts in millions) |
2025 |
|
2024 |
|
|
2025 |
|
2024 |
|
|
|
|
|
|
|
|
|
|
|
|
|
|
|
|
|
Commercial account fees |
$ |
47 |
|
|
$ |
46 |
|
|
$ |
1 |
|
|
2 |
% |
|
$ |
138 |
|
|
$ |
135 |
|
|
$ |
3 |
|
|
2 |
% |
Card fees |
24 |
|
|
24 |
|
|
— |
|
|
— |
|
|
71 |
|
|
72 |
|
|
(1) |
|
|
(1) |
|
| Retail and business banking fees |
19 |
|
|
18 |
|
|
1 |
|
|
6 |
|
|
55 |
|
|
50 |
|
|
5 |
|
|
10 |
|
| Loan-related fees and income |
20 |
|
|
17 |
|
|
3 |
|
|
18 |
|
|
56 |
|
|
50 |
|
|
6 |
|
|
12 |
|
Capital markets fees and income 1 |
24 |
|
|
25 |
|
|
(1) |
|
|
(4) |
|
|
79 |
|
|
70 |
|
|
9 |
|
|
13 |
|
| Wealth management fees |
14 |
|
|
14 |
|
|
— |
|
|
— |
|
|
43 |
|
|
44 |
|
|
(1) |
|
|
(2) |
|
| Other customer-related fees |
15 |
|
|
14 |
|
|
1 |
|
|
7 |
|
|
43 |
|
|
42 |
|
|
1 |
|
|
2 |
|
Customer-related noninterest income |
163 |
|
|
158 |
|
|
5 |
|
|
3 |
|
|
485 |
|
|
463 |
|
|
22 |
|
|
5 |
|
| Dividends and other income |
15 |
|
|
5 |
|
|
10 |
|
|
NM |
|
34 |
|
|
33 |
|
|
1 |
|
|
3 |
|
| Securities gains (losses), net |
11 |
|
|
9 |
|
|
2 |
|
|
22 |
|
|
31 |
|
|
11 |
|
|
20 |
|
|
NM |
| Noncustomer-related noninterest income |
26 |
|
|
14 |
|
|
12 |
|
|
86 |
|
|
65 |
|
|
44 |
|
|
21 |
|
|
48 |
|
Total noninterest income |
$ |
189 |
|
|
$ |
172 |
|
|
$ |
17 |
|
|
10 |
|
|
$ |
550 |
|
|
$ |
507 |
|
|
$ |
43 |
|
|
8 |
|
Adjusted customer-related noninterest income 2 |
$ |
174 |
|
|
$ |
161 |
|
|
$ |
13 |
|
|
8 |
% |
|
$ |
496 |
|
|
$ |
466 |
|
|
$ |
30 |
|
|
6 |
% |
1 Effective the first quarter of 2025, capital markets fees and income included the net CVA, which was previously disclosed under noncustomer-related noninterest income as fair value and nonhedge derivative income. For the three and nine months ended September 30, 2025, the net CVA was a loss of $11 million. This loss was primarily driven by an update to our valuation methodology, in addition to changes in other market factors. For the three and nine months ended September 30, 2024, the net CVA was a loss of $3 million.
2 Net of CVA. For information on non-GAAP financial measures, see page 41.
Customer-related Noninterest Income
Customer-related noninterest income increased $5 million, or 3%, compared with the prior year period. This growth was primarily driven by a $3 million increase in loan-related fees and income, largely resulting from increased mortgage loan sales activity. Excluding the impact of the net CVA loss, capital markets fees and income increased $7 million, or 25%, from the prior year period, benefiting from increased loan syndication activity and higher customer swap fee revenue.
For the nine months ended September 30, 2025, customer-related noninterest income increased $22 million, or 5%, relative to the same prior year period. Excluding the net CVA loss, capital markets fees and income increased $17 million, or 23%, primarily due to higher swap fees, investment banking advisory fees, and loan syndication fees. Loan-related fees and income increased $6 million, reflecting the same drivers noted above. Retail and business banking fees increased $5 million, mainly due to higher overdraft and deposit service fees. Commercial account fees increased $3 million, largely as a result of higher account analysis fees.
ZIONS BANCORPORATION, NATIONAL ASSOCIATION AND SUBSIDIARIES
Noncustomer-related Noninterest Income
Noncustomer-related noninterest income increased $12 million, or 86%, compared with the prior year period. This growth was primarily driven by a $10 million increase in dividends and other income, mainly attributable to a $6 million gain on the sale of a bank-owned property and higher dividends received on FHLB stock.
For the nine months ended September 30, 2025, noncustomer-related noninterest income increased $21 million, or 48%, relative to the same prior year period. This increase was largely attributable to valuation adjustments in our Small Business Investment Company (“SBIC”) investment portfolio. Notably, in the second quarter of 2025, we recognized an $11 million unrealized gain following the successful initial public offering (“IPO”) of one of our SBIC investments, FatPipe, Inc. This investment will continue to be marked to market until our shares, which are subject to a minimum 180-day lock-up period from the IPO, are fully divested.
Noninterest Expense
The following schedule presents a comparison of the major components of noninterest expense:
NONINTEREST EXPENSE
|
|
|
|
|
|
|
|
|
|
|
|
|
|
|
|
|
|
|
|
|
|
|
|
|
|
|
|
|
|
|
|
|
|
|
|
|
|
|
|
|
|
|
|
|
|
|
|
|
Three Months Ended
September 30, |
|
Amount
change |
|
Percent
change |
|
Nine Months Ended
September 30, |
|
Amount
change |
|
Percent
change |
| (Dollar amounts in millions) |
2025 |
|
2024 |
|
|
2025 |
|
2024 |
|
|
|
|
|
|
|
|
|
|
|
|
|
|
|
|
|
| Salaries and employee benefits |
$ |
337 |
|
|
$ |
317 |
|
|
$ |
20 |
|
|
6 |
% |
|
$ |
1,015 |
|
|
$ |
966 |
|
|
$ |
49 |
|
|
5 |
% |
| Technology, telecom, and information processing |
70 |
|
|
66 |
|
|
4 |
|
|
6 |
|
|
205 |
|
|
194 |
|
|
11 |
|
|
6 |
|
| Occupancy and equipment, net |
42 |
|
|
40 |
|
|
2 |
|
|
5 |
|
|
123 |
|
|
119 |
|
|
4 |
|
|
3 |
|
| Professional and legal services |
14 |
|
|
14 |
|
|
— |
|
|
— |
|
|
40 |
|
|
47 |
|
|
(7) |
|
|
(15) |
|
| Marketing and business development |
11 |
|
|
12 |
|
|
(1) |
|
|
(8) |
|
|
34 |
|
|
35 |
|
|
(1) |
|
|
(3) |
|
| Deposit insurance and regulatory expense |
16 |
|
|
19 |
|
|
(3) |
|
|
(16) |
|
|
58 |
|
|
74 |
|
|
(16) |
|
|
(22) |
|
| Credit-related expense |
6 |
|
|
6 |
|
|
— |
|
|
— |
|
|
18 |
|
|
19 |
|
|
(1) |
|
|
(5) |
|
| Other real estate expense, net |
— |
|
|
— |
|
|
— |
|
|
NM |
|
— |
|
|
(1) |
|
|
1 |
|
|
NM |
| Other |
31 |
|
|
28 |
|
|
3 |
|
|
11 |
|
|
99 |
|
|
84 |
|
|
15 |
|
|
18 |
|
Total noninterest expense |
$ |
527 |
|
|
$ |
502 |
|
|
$ |
25 |
|
|
5 |
|
|
$ |
1,592 |
|
|
$ |
1,537 |
|
|
$ |
55 |
|
|
4 |
|
Adjusted noninterest expense (non-GAAP) |
$ |
520 |
|
|
$ |
499 |
|
|
$ |
21 |
|
|
4 |
% |
|
$ |
1,574 |
|
|
$ |
1,516 |
|
|
$ |
58 |
|
|
4 |
% |
Noninterest expense increased $25 million, or 5%, relative to the prior year quarter. Salaries and employee benefits expense increased $20 million, primarily due to higher severance and base salaries, along with increased incentive compensation accruals reflecting improved profitability. Technology, telecom, and information processing expense increased $4 million, largely due to higher costs associated with application software, licensing, and maintenance.
Adjusted noninterest expense increased $21 million, or 4%. The efficiency ratio improved to 59.6%, compared with 62.5%, reflecting positive operating leverage as adjusted pre-provision net revenue increased $53 million, or 18%. For more information on non-GAAP financial measures, see page 41.
For the nine months ended September 30, 2025, noninterest expense increased $55 million, or 4%, relative to the same prior year period. Salaries and employee benefits expense increased $49 million, mainly due to the same factors previously noted. Other noninterest expense increased $15 million, driven by higher subscription costs, the impairment of certain long-lived assets, increased legal reserves, and a success fee accrual associated with the IPO of an SBIC investment. Technology, telecom, and information processing expense increased $11 million, reflecting the same drivers noted above. These increases were partially offset by a $16 million reduction in deposit insurance and regulatory expense, attributable to the Federal Deposit Insurance Corporation (“FDIC”) special assessment accrual in the same prior year period, and a $7 million decline in professional and legal services, mainly due to reduced technology-related consulting expenses.
ZIONS BANCORPORATION, NATIONAL ASSOCIATION AND SUBSIDIARIES
Technology Spend
We invest in technology initiatives designed to improve our products and services, increase our operational efficiency, and enable us to remain competitive. We report these investments as technology spend, which includes the following:
•Technology, telecom, and information processing expense — includes current period expenses presented on the consolidated statement of income related to application software licensing and maintenance, telecommunications, and data processing, less related amortization and depreciation of capitalized technology investments;
•Other technology-related expense — includes related noncapitalized salaries and employee benefits, occupancy and equipment, and professional and legal services; and
•Technology investments — includes capitalized technology infrastructure equipment, hardware, and software (both purchased and internally developed).
The following schedule presents the composition of our technology spend:
TECHNOLOGY SPEND
|
|
|
|
|
|
|
|
|
|
|
|
|
|
|
|
|
|
|
|
|
|
|
|
|
|
|
|
|
|
|
|
|
|
|
|
|
|
|
|
|
|
|
|
|
|
|
|
|
Three Months Ended
September 30, |
|
Amount
change |
|
Percent
change |
|
Nine Months Ended
September 30, |
|
Amount
change |
|
Percent
change |
| (Dollar amounts in millions) |
2025 |
|
2024 |
|
|
2025 |
|
2024 |
|
|
|
|
|
|
|
|
|
|
|
|
|
|
|
|
|
| Technology, telecom, and information processing expense |
$ |
70 |
|
|
$ |
66 |
|
|
$ |
4 |
|
|
6 |
% |
|
$ |
205 |
|
|
$ |
194 |
|
|
$ |
11 |
|
|
6 |
% |
| Less: related amortization and depreciation |
(20) |
|
|
(19) |
|
|
(1) |
|
|
5 |
|
|
(58) |
|
|
(59) |
|
|
1 |
|
|
(2) |
|
| Other technology-related expense |
64 |
|
|
62 |
|
|
2 |
|
|
3 |
|
|
186 |
|
|
188 |
|
|
(2) |
|
|
(1) |
|
| Capitalized technology investments |
17 |
|
|
7 |
|
|
10 |
|
|
NM |
|
46 |
|
|
26 |
|
|
20 |
|
|
77 |
|
Total technology spend |
$ |
131 |
|
|
$ |
116 |
|
|
$ |
15 |
|
|
13 |
|
|
$ |
379 |
|
|
$ |
349 |
|
|
$ |
30 |
|
|
9 |
|
Total technology spend increased $15 million, or 13%, compared with the same prior year quarter. This increase was driven by higher capitalized technology investments associated with lending and customer-focused technology initiatives. In addition, technology, telecom, and information processing expense increased, largely reflecting the previously noted increases in application software, licensing, and maintenance costs.
Income Taxes
The following schedule summarizes the income tax expense and effective tax rates for the periods presented:
INCOME TAXES
|
|
|
|
|
|
|
|
|
|
|
|
|
|
|
|
|
|
|
|
|
|
|
|
|
Three Months Ended
September 30, |
|
Nine Months Ended
September 30, |
| (Dollar amounts in millions) |
2025 |
|
2024 |
|
2025 |
|
2024 |
|
|
|
|
|
|
|
|
| Income before income taxes |
$ |
285 |
|
|
$ |
277 |
|
|
$ |
836 |
|
|
$ |
742 |
|
| Income tax expense |
63 |
|
|
63 |
|
|
200 |
|
|
174 |
|
| Effective tax rate |
22.1 |
% |
|
22.7 |
% |
|
23.9 |
% |
|
23.5 |
% |
The effective tax rate was 22.1% and 22.7% for the three months ended September 30, 2025 and 2024, respectively. For more information about the factors that impacted the income tax rates, as well as details on deferred income tax assets and liabilities, see Note 12 of the Notes to Consolidated Financial Statements.
Preferred Stock Dividends
Preferred stock dividends totaled $1 million and $10 million for the third quarters of 2025 and 2024, respectively. The year-over-year decrease was due to the redemption of the outstanding shares of our Series G, I, and J preferred stock during the fourth quarter of 2024.
ZIONS BANCORPORATION, NATIONAL ASSOCIATION AND SUBSIDIARIES
BALANCE SHEET ANALYSIS
Interest-Earning Assets
Interest-earning assets—which include loans and leases, investment securities, and money market investments—carry associated interest rates or yields. We strive to maintain a high level of interest-earning assets relative to total assets. For more information regarding average balances, the associated revenue generated, and the corresponding yields of these assets, see the Average Balance Sheet on page 11.
Investment Securities Portfolio
We invest in securities primarily to provide balance sheet liquidity. The portfolio largely consists of securities that can be readily converted to cash or used to generate liquidity through secured borrowing agreements, without the need to sell the securities. Our investment securities portfolio also helps to balance the inherent interest rate mismatch between loans and deposits, thereby helping to preserve the economic value of shareholders’ equity. The estimated deposit duration at September 30, 2025 was assumed to be longer than the loan duration (including swaps). At September 30, 2025, the estimated duration of the investment securities portfolio, which measures price sensitivity to interest rate changes, was 3.7 years, compared with 3.4 years at December 31, 2024, primarily due to revised prepayment assumptions on certain securities.
For more information about our borrowing capacity associated with the investment securities portfolio and how we manage our liquidity risk, refer to the “Liquidity Risk Management” section on page 38. For more information on fair value measurements and the accounting for our investment securities portfolio, refer to Note 3 and Note 5 of the Notes to Consolidated Financial Statements.
The following schedule presents the major components of our investment securities portfolio:
INVESTMENT SECURITIES PORTFOLIO
|
|
|
|
|
|
|
|
|
|
|
|
|
|
|
|
|
|
|
|
|
|
|
|
|
|
|
|
|
|
|
|
|
|
|
|
|
September 30, 2025 |
|
December 31, 2024 |
| (In millions) |
Par Value |
|
Amortized
cost |
|
Fair
value |
|
Par Value |
|
Amortized
cost |
|
Fair
value |
| Available-for-sale |
|
|
|
|
|
|
|
|
|
|
|
| U.S. Treasury securities |
$ |
1,400 |
|
|
$ |
1,401 |
|
|
$ |
1,311 |
|
|
$ |
780 |
|
|
$ |
781 |
|
|
$ |
662 |
|
| U.S. Government agencies and corporations: |
|
|
|
|
|
|
|
|
|
|
|
| Agency securities |
353 |
|
|
349 |
|
|
332 |
|
|
446 |
|
|
441 |
|
|
415 |
|
| Agency guaranteed mortgage-backed securities |
7,193 |
|
|
7,208 |
|
|
6,171 |
|
|
7,656 |
|
|
7,713 |
|
|
6,451 |
|
| Small Business Administration loan-backed securities |
352 |
|
|
374 |
|
|
358 |
|
|
427 |
|
|
455 |
|
|
434 |
|
| Municipal securities |
948 |
|
|
1,022 |
|
|
973 |
|
|
1,096 |
|
|
1,186 |
|
|
1,108 |
|
| Other debt securities |
25 |
|
|
25 |
|
|
25 |
|
|
25 |
|
|
25 |
|
|
25 |
|
| Total available-for-sale |
10,271 |
|
|
10,379 |
|
|
9,170 |
|
|
10,430 |
|
|
10,601 |
|
|
9,095 |
|
| Held-to-maturity |
|
|
|
|
|
|
|
|
|
|
|
| U.S. Government agencies and corporations: |
|
|
|
|
|
|
|
|
|
|
|
| Agency securities |
139 |
|
|
139 |
|
|
135 |
|
|
148 |
|
|
148 |
|
|
140 |
|
| Agency guaranteed mortgage-backed securities |
10,248 |
|
|
8,643 |
|
|
8,704 |
|
|
10,983 |
|
|
9,202 |
|
|
8,941 |
|
| Municipal securities |
277 |
|
|
277 |
|
|
267 |
|
|
319 |
|
|
319 |
|
|
301 |
|
| Total held-to-maturity |
10,664 |
|
|
9,059 |
|
|
9,106 |
|
|
11,450 |
|
|
9,669 |
|
|
9,382 |
|
|
|
|
|
|
|
|
|
|
|
|
|
|
|
|
|
|
|
|
|
|
|
|
|
| Total investment securities |
$ |
20,935 |
|
|
$ |
19,438 |
|
|
$ |
18,276 |
|
|
$ |
21,880 |
|
|
$ |
20,270 |
|
|
$ |
18,477 |
|
The amortized cost of total investment securities declined $832 million, or 4%, from December 31, 2024, primarily due to principal reductions, net of reinvestments. At both September 30, 2025 and December 31, 2024, approximately 7% of the portfolio consisted of floating-rate instruments. Additionally, at September 30, 2025, we had active pay-fixed interest rate swaps with an aggregate notional amount of $4.5 billion. These swaps are designated as fair value hedges of fixed-rate available-for-sale (“AFS”) securities and effectively convert the fixed interest income on the hedged portion of the securities to a floating rate.
ZIONS BANCORPORATION, NATIONAL ASSOCIATION AND SUBSIDIARIES
At September 30, 2025, our AFS investment securities portfolio included approximately $108 million in net premium, distributed across various security categories. Taxable-equivalent premium amortization for these investment securities totaled $12 million for the third quarter of 2025, compared with $14 million in the same prior year period.
For more information regarding our investment securities portfolio, swaps, and related unrealized gains and losses, refer to the “Interest Rate Risk Management” section on page 35, the “Capital Management” section on page 39, and Note 5 of the Notes to Consolidated Financial Statements.
Municipal Investments and Extensions of Credit
We support our communities by offering a range of financial products and services to state and local governments (“municipalities”), including deposit services, lending, and investment banking services. Additionally, we invest in securities issued by municipal entities. Our municipal lending portfolio generally includes obligations that are repaid from, or secured by, the general funds or pledged revenues of municipalities, as well as by real estate or equipment. It also includes loans extended to private commercial and 501(c)(3) not-for-profit organizations that utilize a pass-through municipal structure to benefit from favorable tax treatment.
The following schedule presents our total investments and extensions of credit to municipalities:
MUNICIPAL INVESTMENTS AND EXTENSIONS OF CREDIT
|
|
|
|
|
|
|
|
|
|
|
|
| (In millions) |
September 30,
2025 |
|
December 31,
2024 |
|
|
|
|
| Loans and leases |
$ |
4,341 |
|
|
$ |
4,364 |
|
| Unfunded lending commitments |
398 |
|
|
524 |
|
| Available-for-sale securities |
973 |
|
|
1,108 |
|
| Held-to-maturity securities |
277 |
|
|
319 |
|
| Trading securities |
134 |
|
|
35 |
|
Total |
$ |
6,123 |
|
|
$ |
6,350 |
|
Our municipal loans and securities are primarily concentrated within our geographic footprint. At September 30, 2025, approximately $2 million of municipal loans and leases were on nonaccrual, compared with $11 million at December 31, 2024. These nonaccrual loans were extended to private commercial entities utilizing a pass-through municipal structure to obtain favorable tax treatment.
Municipal securities are internally risk-graded, using methodologies aligned with those applied to loans, with grading frameworks tailored to the size and nature of the credit exposure. These internal risk grades—Pass, Special Mention, and Substandard—are consistent with published regulatory risk classifications. At September 30, 2025, all municipal securities were rated as Pass. For additional information regarding the credit quality of our municipal loans and securities, see Notes 5 and 6 of the Notes to Consolidated Financial Statements.
Loan and Lease Portfolio
We provide a wide range of lending products to commercial customers, primarily small- and medium-sized businesses, as well as other products secured by commercial real estate. Additionally, we provide various retail banking products and services to consumers and small businesses.
The following schedule presents the composition of our loan and lease portfolio:
ZIONS BANCORPORATION, NATIONAL ASSOCIATION AND SUBSIDIARIES
LOAN AND LEASE PORTFOLIO
|
|
|
|
|
|
|
|
|
|
|
|
|
|
|
|
|
|
|
|
|
|
|
|
|
September 30, 2025 |
|
December 31, 2024 |
| (Dollar amounts in millions) |
Amount |
|
% of
total loans |
|
Amount |
|
% of
total loans |
| Commercial: |
|
|
|
|
|
|
|
| Commercial and industrial |
$ |
17,222 |
|
|
28.6 |
% |
|
$ |
16,891 |
|
|
28.4 |
% |
| Owner-occupied |
9,267 |
|
|
15.4 |
|
|
9,333 |
|
|
15.7 |
|
| Municipal |
4,341 |
|
|
7.2 |
|
|
4,364 |
|
|
7.4 |
|
| Leasing |
349 |
|
|
0.6 |
|
|
377 |
|
|
0.6 |
|
| Total commercial |
31,179 |
|
|
51.8 |
|
|
30,965 |
|
|
52.1 |
|
| Commercial real estate: |
|
|
|
|
|
|
|
| Term |
11,008 |
|
|
18.2 |
|
|
10,703 |
|
|
18.0 |
|
| Construction and land development |
2,469 |
|
|
4.1 |
|
|
2,774 |
|
|
4.7 |
|
| Total commercial real estate |
13,477 |
|
|
22.3 |
|
|
13,477 |
|
|
22.7 |
|
| Consumer: |
|
|
|
|
|
|
|
| 1-4 family residential |
10,423 |
|
|
17.2 |
|
|
9,939 |
|
|
16.7 |
|
| Home equity credit line |
3,848 |
|
|
6.4 |
|
|
3,641 |
|
|
6.1 |
|
| Construction and other consumer real estate |
769 |
|
|
1.3 |
|
|
810 |
|
|
1.4 |
|
| Bankcard and other revolving plans |
477 |
|
|
0.8 |
|
|
457 |
|
|
0.8 |
|
| Other |
129 |
|
|
0.2 |
|
|
121 |
|
|
0.2 |
|
| Total consumer |
15,646 |
|
|
25.9 |
|
|
14,968 |
|
|
25.2 |
|
| Total loans and leases |
$ |
60,302 |
|
|
100.0 |
% |
|
$ |
59,410 |
|
|
100.0 |
% |
During the first nine months of 2025, the loan and lease portfolio increased $892 million, or 2%, to $60.3 billion at September 30, 2025. This growth was primarily driven by increases in the consumer 1-4 family residential mortgage, commercial and industrial, and term commercial real estate loan portfolios. The ratio of loans and leases to total assets was 68% at September 30, 2025, compared with 67% at December 31, 2024. Commercial and industrial loans remained the largest loan segment, representing 29% and 28% of total loans for the same respective periods.
Other Noninterest-Bearing Investments
Other noninterest-bearing investments consist of equity investments held primarily for capital appreciation, dividends, or to meet certain regulatory requirements. The following schedule presents our related investments.
OTHER NONINTEREST-BEARING INVESTMENTS
|
|
|
|
|
|
|
|
|
|
|
|
|
|
|
|
|
|
|
|
|
|
|
|
| (Dollar amounts in millions) |
September 30,
2025 |
|
December 31,
2024 |
|
Amount change |
|
Percent change |
|
|
|
|
|
|
|
|
| Bank-owned life insurance |
$ |
571 |
|
|
$ |
562 |
|
|
$ |
9 |
|
|
2 |
% |
| Federal Home Loan Bank stock |
145 |
|
|
124 |
|
|
21 |
|
|
17 |
|
| Federal Reserve stock |
54 |
|
|
65 |
|
|
(11) |
|
|
(17) |
|
| Farmer Mac stock |
30 |
|
|
28 |
|
|
2 |
|
|
7 |
|
| SBIC investments |
252 |
|
|
204 |
|
|
48 |
|
|
24 |
|
| Other |
46 |
|
|
37 |
|
|
9 |
|
|
24 |
|
| Total other noninterest-bearing investments |
$ |
1,098 |
|
|
$ |
1,020 |
|
|
$ |
78 |
|
|
8 |
|
Other noninterest-bearing investments increased $78 million, or 8%, during the first nine months of 2025. This growth was primarily attributable to higher balances in our SBIC investment portfolio and increased holdings of FHLB stock.
The SBIC investment portfolio increased $48 million, largely driven by new investments and valuation adjustments on related investments. The increase in FHLB stock was due to higher FHLB borrowings. To maintain borrowing capacity, we are required to hold FHLB stock equivalent to approximately 4-5% of our outstanding FHLB borrowings.
ZIONS BANCORPORATION, NATIONAL ASSOCIATION AND SUBSIDIARIES
Premises, Equipment, and Software
In July 2024, we successfully completed the final phase of a multi-year project to replace our core loan and deposit banking systems. As a result, we transitioned substantially all commercial, commercial real estate, and non-mortgage consumer loans, as well as deposit accounts, to a modern, integrated core platform. We continue to invest in additional lending, deposit, and other customer-focused technology initiatives aimed at further modernizing our systems, improving customer experiences, and enhancing operational performance.
The following schedule summarizes the capitalized costs associated with the core system replacement project, which are amortized using a useful life of ten years:
CAPITALIZED COSTS ASSOCIATED WITH THE CORE SYSTEM REPLACEMENT PROJECT
|
|
|
|
|
|
|
|
|
|
|
|
|
|
|
|
|
|
|
|
|
|
|
|
|
September 30, 2025 |
| (In millions) |
Phase 1 |
|
Phase 2 |
|
Phase 3 |
|
Total |
|
|
|
|
|
|
|
|
| Total amount of capitalized costs, less accumulated amortization |
$ |
10 |
|
|
$ |
29 |
|
|
$ |
191 |
|
|
$ |
230 |
|
| End of scheduled amortization period |
Q2 2027 |
|
Q1 2029 |
|
Q2 2033 |
|
|
Deposits
Deposits are our primary funding source. The following schedule presents the composition of our deposit portfolio:
DEPOSIT PORTFOLIO
|
|
|
|
|
|
|
|
|
|
|
|
|
|
|
|
|
|
|
|
|
|
|
|
|
|
|
|
|
|
|
|
|
|
September 30, 2025 |
|
|
|
December 31, 2024 |
|
|
|
| (Dollar amounts in millions) |
Amount |
|
% of
total
deposits |
|
|
|
|
|
Amount |
|
% of
total
deposits |
|
|
|
|
|
| Deposits by type |
|
|
|
|
|
|
|
|
|
|
|
|
|
|
|
|
| Noninterest-bearing demand |
$ |
26,133 |
|
|
34.9 |
% |
|
|
|
|
|
$ |
24,704 |
|
|
32.4 |
% |
|
|
|
|
|
| Interest-bearing: |
|
|
|
|
|
|
|
|
|
|
|
|
|
|
|
|
| Savings and money market |
38,689 |
|
|
51.7 |
|
|
|
|
|
|
40,037 |
|
|
52.5 |
|
|
|
|
|
|
| Time |
6,232 |
|
|
8.3 |
|
|
|
|
|
|
6,448 |
|
|
8.5 |
|
|
|
|
|
|
| Brokered |
3,824 |
|
|
5.1 |
|
|
|
|
|
|
5,034 |
|
|
6.6 |
|
|
|
|
|
|
| Total interest-bearing |
48,745 |
|
|
65.1 |
|
|
|
|
|
|
51,519 |
|
|
67.6 |
|
|
|
|
|
|
| Total deposits |
$ |
74,878 |
|
|
100.0 |
% |
|
|
|
|
|
$ |
76,223 |
|
|
100.0 |
% |
|
|
|
|
|
| Deposit-related metrics |
|
|
|
|
|
|
|
|
|
|
|
|
|
|
|
|
| Estimated amount of insured deposits |
$ |
41,290 |
|
|
55 |
% |
|
|
|
|
|
$ |
41,836 |
|
|
55 |
% |
|
|
|
|
|
| Estimated amount of uninsured deposits |
33,588 |
|
|
45 |
|
|
|
|
|
|
34,387 |
|
|
45 |
|
|
|
|
|
|
Estimated amount of collateralized deposits 1 |
2,686 |
|
|
4 |
|
|
|
|
|
|
3,199 |
|
|
4 |
|
|
|
|
|
|
| Loan-to-deposit ratio |
81% |
|
|
|
|
|
|
|
78% |
|
|
|
|
|
|
|
1 Includes both insured and uninsured deposits.
Total deposits declined $1.3 billion, or 2%, from December 31, 2024. Interest-bearing deposits decreased $2.8 billion, primarily due to the migration of a consumer interest-bearing product into a new noninterest-bearing offering, as well as a reduction in brokered deposits. This decline was partially offset by a $1.4 billion increase in noninterest-bearing demand deposits, mainly driven by the aforementioned product migration. At September 30, 2025, customer deposits (excluding brokered deposits) totaled $71.1 billion, compared with $71.2 billion at December 31, 2024.
At September 30, 2025, the total estimated amount of uninsured deposits was $33.6 billion, or 45% of total deposits, compared with $34.4 billion, or 45%, at December 31, 2024. The loan-to-deposit ratio was 81%, compared with 78% for the same periods. For additional information on liquidity, including the ratio of available liquidity to uninsured deposits, see “Liquidity Risk Management” on page 38.
ZIONS BANCORPORATION, NATIONAL ASSOCIATION AND SUBSIDIARIES
RISK MANAGEMENT
Risk management is a core component to our operations and a critical factor in achieving our strategic objectives. We employ various strategies to prudently manage the risks inherent in our business, including credit risk, market and interest rate risk, liquidity risk, strategic and business risk, operational risk, technology risk, cybersecurity risk, capital/financial reporting risk, legal/compliance risk (including regulatory risk), and reputational risk. Oversight of these risks is conducted through various management committees, with the Enterprise Risk Management Committee serving as the focal point. For a more comprehensive discussion of these risks, see “Risk Factors” in our 2024 Form 10-K.
Credit Risk Management
Credit risk is the possibility of loss from the failure of a borrower, guarantor, or another obligor to fully perform under the terms of a credit-related contract. Credit risk arises primarily from our lending activities and off-balance sheet credit instruments.
Our credit policies, credit risk management, and credit examination functions collectively support the oversight of credit risk. We emphasize strong underwriting standards and the early detection of potential problem credits to develop and implement timely action plans, thereby minimizing potential losses. These formal credit policies and procedures provide a framework for consistent underwriting and sound credit decisions at the local banking affiliate level. Our policies include standards for sensitivity and scenario analysis to assess the resilience of borrowers, especially during periods of uncertain or adverse economic conditions. Additionally, we require borrowers to provide evidence of insurance for properties used as collateral, with coverage and levels appropriate to the specific credit.
Our business activity is conducted primarily within the geographic footprint of our banking affiliates. We strive to avoid the risk of undue concentrations of credit in any particular industry, collateral type, location, or with any individual customer or counterparty. For a more comprehensive discussion of our credit risk management, see “Credit Risk Management” in our 2024 Form 10-K.
U.S. Government Agency Guaranteed Loans
We participate in various guaranteed lending programs sponsored by United States (“U.S.”) government agencies, including the U.S. Small Business Administration (“SBA”), Federal Housing Authority, U.S. Department of Veterans Affairs, Export-Import Bank of the U.S., and the U.S. Department of Agriculture. At September 30, 2025, $613 million of related loans were guaranteed, primarily by the SBA.
The following schedule presents the composition of our U.S. government agency guaranteed loans:
U.S. GOVERNMENT AGENCY GUARANTEED LOANS
|
|
|
|
|
|
|
|
|
|
|
|
|
|
|
|
|
|
|
|
|
|
|
|
|
September 30, 2025 |
|
December 31, 2024 |
| (Dollar amounts in millions) |
Amount |
|
Percent
guaranteed |
|
Amount |
|
Percent
guaranteed |
|
|
|
|
|
|
|
|
| Commercial |
$ |
761 |
|
|
77 |
% |
|
$ |
687 |
|
|
78 |
% |
| Commercial real estate |
31 |
|
|
74 |
|
|
25 |
|
|
76 |
|
| Consumer |
4 |
|
|
100 |
|
|
4 |
|
|
100 |
|
| Total loans |
$ |
796 |
|
|
77 |
|
|
$ |
716 |
|
|
78 |
|
ZIONS BANCORPORATION, NATIONAL ASSOCIATION AND SUBSIDIARIES
Commercial Lending
The following schedule presents the composition of our commercial lending portfolio:
COMMERCIAL LENDING PORTFOLIO
|
|
|
|
|
|
|
|
|
|
|
|
|
|
|
|
|
|
|
|
|
|
|
|
|
|
|
|
|
|
|
|
|
|
|
|
|
September 30, 2025 |
|
December 31, 2024 |
|
|
|
|
| (Dollar amounts in millions) |
Amount |
|
% of total
commercial loans |
|
Amount |
|
% of total
commercial loans |
|
Amount change |
|
Percent change |
| Commercial: |
|
|
|
|
|
|
|
|
|
|
|
| Commercial and industrial |
$ |
17,222 |
|
|
55.3 |
% |
|
$ |
16,891 |
|
|
54.6 |
% |
|
$ |
331 |
|
|
2.0 |
% |
| Owner-occupied |
9,267 |
|
|
29.7 |
|
|
9,333 |
|
|
30.1 |
|
|
(66) |
|
|
(0.7) |
|
| Municipal |
4,341 |
|
|
13.9 |
|
|
4,364 |
|
|
14.1 |
|
|
(23) |
|
|
(0.5) |
|
| Leasing |
349 |
|
|
1.1 |
|
|
377 |
|
|
1.2 |
|
|
(28) |
|
|
(7.4) |
|
| Total commercial |
$ |
31,179 |
|
|
100.0 |
% |
|
$ |
30,965 |
|
|
100.0 |
% |
|
$ |
214 |
|
|
0.7 |
|
|
|
|
|
|
|
|
|
|
|
|
|
|
|
|
|
|
|
|
|
|
|
|
|
|
|
|
|
|
|
|
|
|
|
|
|
|
|
|
|
|
|
|
|
|
|
|
|
|
|
|
|
|
|
|
|
|
|
|
|
|
|
|
|
|
|
|
|
|
|
|
|
|
|
|
|
|
|
|
|
|
|
|
|
|
|
|
|
|
|
|
|
|
|
|
|
|
|
|
|
|
|
|
|
|
|
|
|
|
|
|
|
|
|
|
|
|
|
|
|
|
|
|
|
|
|
|
|
|
|
|
|
|
|
|
|
|
|
|
|
|
|
|
|
Our commercial loans encompass a diverse range of industries and generally mature within one to five years, with amortization schedules determined by the underlying collateral and guarantees. These loans are typically structured as seasonal, term, working capital, or bridge loans, and are offered as revolving and non-revolving lines of credit, amortizing term loans, guidance facilities, and single-payment loans. They include covenants that require borrowers to provide regular financial reporting to monitor business performance and assess leverage, debt service coverage, and liquidity.
The underwriting process for commercial loans primarily involves analyzing management, financial performance, industry, sponsorship (if applicable), and transaction structure. Credit enhancements are generally provided by collateral and guarantees from the owners or sponsors. Prospective cash flows are subjected to various downside scenario analyses, including revenue decline, margin compression, and interest rate fluctuations.
The following schedule presents the geographic distribution of our commercial lending portfolio, with geographies based on the location of the primary borrower:
COMMERCIAL LENDING BY GEOGRAPHY
|
|
|
|
|
|
|
|
|
|
|
|
|
|
|
|
|
|
|
|
|
|
|
|
|
|
|
|
|
|
|
|
|
|
|
|
|
|
|
|
|
September 30, 2025 |
|
December 31, 2024 |
| (Dollar amounts in millions) |
Amount |
|
% of
total |
|
Nonaccrual loans |
|
|
|
Amount |
|
% of
total |
|
Nonaccrual loans |
|
|
|
|
|
|
|
|
|
|
|
|
|
|
|
|
|
|
| Commercial: |
|
|
|
|
|
|
|
|
|
|
|
|
|
|
|
| Arizona |
$ |
2,250 |
|
|
7.2 |
% |
|
$ |
4 |
|
|
|
|
$ |
2,202 |
|
|
7.1 |
% |
|
$ |
5 |
|
|
|
| California |
6,215 |
|
|
19.9 |
|
|
73 |
|
|
|
|
6,190 |
|
|
20.0 |
|
|
58 |
|
|
|
| Colorado |
1,727 |
|
|
5.5 |
|
|
5 |
|
|
|
|
1,892 |
|
|
6.1 |
|
|
17 |
|
|
|
| Nevada |
1,366 |
|
|
4.4 |
|
|
3 |
|
|
|
|
1,336 |
|
|
4.3 |
|
|
11 |
|
|
|
| Texas |
7,574 |
|
|
24.3 |
|
|
33 |
|
|
|
|
7,367 |
|
|
23.8 |
|
|
47 |
|
|
|
| Utah/Idaho |
6,503 |
|
|
20.9 |
|
|
24 |
|
|
|
|
6,309 |
|
|
20.4 |
|
|
6 |
|
|
|
| Washington/Oregon |
1,429 |
|
|
4.6 |
|
|
9 |
|
|
|
|
1,338 |
|
|
4.3 |
|
|
10 |
|
|
|
Other 1 |
4,115 |
|
|
13.2 |
|
|
2 |
|
|
|
|
4,331 |
|
|
14.0 |
|
|
4 |
|
|
|
| Total commercial |
$ |
31,179 |
|
|
100.0 |
% |
|
$ |
153 |
|
|
|
|
$ |
30,965 |
|
|
100.0 |
% |
|
$ |
158 |
|
|
|
1 No other geography exceeds 2.0% and 2.6% for September 30, 2025 and December 31, 2024, respectively.
ZIONS BANCORPORATION, NATIONAL ASSOCIATION AND SUBSIDIARIES
The following schedule presents the industry distribution of our commercial lending portfolio, classified based on the North American Industry Classification System:
COMMERCIAL LENDING BY INDUSTRY
|
|
|
|
|
|
|
|
|
|
|
|
|
|
|
|
|
|
|
|
|
|
|
|
|
|
|
|
|
|
|
|
|
|
|
|
|
|
|
|
|
September 30, 2025 |
|
December 31, 2024 |
| (Dollar amounts in millions) |
Amount |
|
% of
total |
|
Nonaccrual loans |
|
|
|
Amount |
|
% of
total |
|
Nonaccrual loans |
|
|
|
|
|
|
|
|
|
|
|
|
|
|
|
|
|
|
| Real estate, rental, and leasing |
$ |
3,346 |
|
|
10.7 |
% |
|
$ |
36 |
|
|
|
|
$ |
3,083 |
|
|
10.0 |
% |
|
$ |
7 |
|
|
|
| Retail trade |
2,889 |
|
|
9.3 |
|
|
2 |
|
|
|
|
2,873 |
|
|
9.3 |
|
|
7 |
|
|
|
| Manufacturing |
2,392 |
|
|
7.7 |
|
|
20 |
|
|
|
|
2,322 |
|
|
7.5 |
|
|
7 |
|
|
|
| Finance and insurance |
2,374 |
|
|
7.6 |
|
|
11 |
|
|
|
|
2,762 |
|
|
8.9 |
|
|
1 |
|
|
|
| Healthcare and social assistance |
2,334 |
|
|
7.5 |
|
|
7 |
|
|
|
|
2,541 |
|
|
8.2 |
|
|
34 |
|
|
|
| Wholesale trade |
2,159 |
|
|
6.9 |
|
|
1 |
|
|
|
|
1,909 |
|
|
6.2 |
|
|
2 |
|
|
|
| Public administration |
1,954 |
|
|
6.3 |
|
|
— |
|
|
|
|
2,106 |
|
|
6.8 |
|
|
— |
|
|
|
| Hospitality and food services |
1,535 |
|
|
4.9 |
|
|
3 |
|
|
|
|
1,352 |
|
|
4.4 |
|
|
2 |
|
|
|
| Transportation and warehousing |
1,508 |
|
|
4.8 |
|
|
7 |
|
|
|
|
1,589 |
|
|
5.1 |
|
|
7 |
|
|
|
Utilities 1 |
1,491 |
|
|
4.8 |
|
|
3 |
|
|
|
|
1,389 |
|
|
4.5 |
|
|
2 |
|
|
|
| Construction |
1,446 |
|
|
4.6 |
|
|
12 |
|
|
|
|
1,335 |
|
|
4.3 |
|
|
26 |
|
|
|
| Educational services |
1,293 |
|
|
4.2 |
|
|
— |
|
|
|
|
1,292 |
|
|
4.2 |
|
|
— |
|
|
|
| Other Services (except Public administration) |
1,160 |
|
|
3.7 |
|
|
2 |
|
|
|
|
1,069 |
|
|
3.4 |
|
|
3 |
|
|
|
| Mining, quarrying, and oil and gas extraction |
1,093 |
|
|
3.5 |
|
|
— |
|
|
|
|
1,178 |
|
|
3.8 |
|
|
— |
|
|
|
| Professional, scientific, and technical services |
1,061 |
|
|
3.4 |
|
|
3 |
|
|
|
|
1,057 |
|
|
3.4 |
|
|
25 |
|
|
|
Other 2 |
3,144 |
|
|
10.1 |
|
|
46 |
|
|
|
|
3,108 |
|
|
10.0 |
|
|
35 |
|
|
|
| Total |
$ |
31,179 |
|
|
100.0 |
% |
|
$ |
153 |
|
|
|
|
$ |
30,965 |
|
|
100.0 |
% |
|
$ |
158 |
|
|
|
1 Includes primarily utilities, power, and renewable energy.
2 No other industry group exceeds 3.1% and 3.4% for September 30, 2025 and December 31, 2024, respectively.
As previously noted, our commercial lending portfolio is well-diversified across both geographic regions and industry sectors. In light of increased investor interest in loans extended to nondepository financial institutions (“NDFIs”), we provide the following information regarding these exposures within our commercial lending portfolio.
Loans to Nondepository Financial Institutions (NDFIs)
NDFIs encompass a wide range of financial entities that provide services similar to those of traditional banking institutions, but do not accept public deposits and are not generally subject to oversight by federal banking regulators. We provide financing to NDFIs, including mortgage intermediaries, business development companies (“BDCs”), private equity funds, consumer credit platforms, and other financial entities.
We regularly monitor NDFI exposures through borrower-level hold limits, perform stress testing of underlying portfolios, verify compliance with applicable regulatory requirements, review portfolio quality, and assess liquidity and capital adequacy.
Our NDFI portfolio is diversified across various lending segments and asset classes, including:
•Mortgage credit intermediaries — Loans to mortgage companies engaged in residential or commercial mortgage origination and servicing; special purpose entities supporting mortgage-related securitization activities, such as real estate investment trusts (“REITs”) and collateralized debt obligations.
•Business credit intermediaries — Loans to finance companies, direct lenders, private debt funds, equipment leasing companies, BDCs, SBICs, senior loan funds, and other nonbank business lenders.
•Private equity funds — Capital call commitment and subscription-based facilities extended to private equity, venture capital, and other general partnership funds.
ZIONS BANCORPORATION, NATIONAL ASSOCIATION AND SUBSIDIARIES
•Consumer credit intermediaries — Loans to nonbank consumer secured and unsecured lending platforms, as well as special purposes entities, finance companies, direct lenders, private debt funds, equipment leasing companies, or other financial intermediaries whose underlying assets primarily consist of consumer loans.
•Other — Loans to insurance companies, investment banks, broker-dealers, publicly-listed investment funds, hedge funds, family offices, and other investment firms and financial vehicles.
At September 30, 2025, total loans to NDFIs amounted to approximately $2.0 billion, representing 6.5% of total commercial loans and 3.4% of total loans. This compares with $2.4 billion, or 7.6% of total commercial loans and 4.0% of total loans, at December 31, 2024.
The following schedule presents the composition of our NDFI lending portfolio:
NDFI LENDING PORTFOLIO
|
|
|
|
|
|
|
|
|
|
|
|
|
|
|
|
|
|
|
|
|
|
|
|
|
|
|
|
|
|
|
|
|
|
|
|
|
|
|
|
|
September 30, 2025 |
|
December 31, 2024 |
| (Dollar amounts in millions) |
Amount |
|
% of
total |
|
Nonaccrual loans |
|
|
|
Amount |
|
% of
total |
|
Nonaccrual loans |
|
|
|
|
|
|
|
|
|
|
|
|
|
|
|
|
|
|
| Mortgage credit intermediaries |
$ |
389 |
|
|
19.1 |
% |
|
$ |
10 |
|
|
|
|
$ |
559 |
|
|
23.8 |
% |
|
$ |
— |
|
|
|
| Business credit intermediaries |
556 |
|
|
27.3 |
|
|
— |
|
|
|
|
489 |
|
|
20.8 |
|
|
1 |
|
|
|
| Private equity funds |
133 |
|
|
6.5 |
|
|
— |
|
|
|
|
189 |
|
|
8.0 |
|
|
— |
|
|
|
| Consumer credit intermediaries |
345 |
|
|
17.0 |
|
|
— |
|
|
|
|
349 |
|
|
14.8 |
|
|
— |
|
|
|
| Other financial institutions |
614 |
|
|
30.1 |
|
|
— |
|
|
|
|
767 |
|
|
32.6 |
|
|
— |
|
|
|
| Total NDFI portfolio |
$ |
2,037 |
|
|
100.0 |
% |
|
$ |
10 |
|
|
|
|
$ |
2,353 |
|
|
100.0 |
% |
|
$ |
1 |
|
|
|
The following schedule presents NDFI loan credit quality metrics:
NDFI LOAN CREDIT QUALITY
|
|
|
|
|
|
|
|
|
|
|
|
| (Dollar amounts in millions) |
September 30, 2025 |
|
December 31, 2024 |
|
|
|
|
|
|
|
|
|
|
|
|
|
|
|
|
| Credit quality metrics |
|
|
|
| Criticized loan ratio |
1.0 |
% |
|
5.5 |
% |
| Classified loan ratio |
1.0 |
% |
|
5.5 |
% |
| Nonaccrual loan ratio |
0.5 |
% |
|
— |
% |
| Delinquency ratio |
— |
% |
|
— |
% |
Annualized ratio of NDFI net charge-offs 1 (recoveries) to average loans |
9.1 |
% |
|
— |
% |
| Ratio of allowance for credit losses to NDFI loans, at period end |
1.23 |
% |
|
0.64 |
% |
1 Total NDFI net charge-offs for the third quarter of 2025 included only the previously discussed $50 million charge-off associated with the revolving lines of credit extended to two related commercial borrowers to finance the origination and purchase of commercial and residential mortgages.
Commercial Real Estate Lending
The following schedule presents the composition of our commercial real estate lending portfolio:
COMMERCIAL REAL ESTATE LENDING PORTFOLIO
|
|
|
|
|
|
|
|
|
|
|
|
|
|
|
|
|
|
|
|
|
|
|
|
|
|
|
|
|
|
|
|
|
|
|
|
|
September 30, 2025 |
|
December 31, 2024 |
|
|
|
|
| (Dollar amounts in millions) |
Amount |
|
% of total
CRE loans |
|
Amount |
|
% of total
CRE loans |
|
Amount change |
|
Percent change |
| Commercial real estate: |
|
|
|
|
|
|
|
|
|
|
|
| Term |
$ |
11,008 |
|
|
81.7 |
% |
|
$ |
10,703 |
|
|
79.4 |
% |
|
$ |
305 |
|
|
2.8 |
% |
| Construction and land development |
2,469 |
|
|
18.3 |
|
|
2,774 |
|
|
20.6 |
|
|
(305) |
|
|
(11.0) |
|
| Total commercial real estate |
$ |
13,477 |
|
|
100.0 |
% |
|
$ |
13,477 |
|
|
100.0 |
% |
|
$ |
— |
|
|
— |
|
ZIONS BANCORPORATION, NATIONAL ASSOCIATION AND SUBSIDIARIES
Term CRE loans typically mature within three to seven years and may include full, partial, and non-recourse guarantee structures. Standard term CRE loan structures feature annually tested operating covenants that require loan rebalancing based on minimum debt service coverage, debt yield, or loan-to-value (“LTV”) ratios. Construction and land development loans generally mature in 18 to 36 months and contain full or partial recourse guarantee structures, with one- to five-year extension options or roll-to-permanent options that often convert into term loans.
Underwriting for commercial properties primarily focuses on the economic viability of the project, with significant consideration given to the creditworthiness and experience of the sponsor. We generally require that the owner’s equity be invested prior to any advances. Loan agreements often include remargining requirements (equity infusions required upon a decline in the value or cash flow of the collateral) and sponsor guarantees.
As part of our disciplined underwriting and collateral evaluation practices, real estate appraisals are typically obtained when extending credit secured by commercial real estate. In some instances, automated valuation services or internal evaluations may be used. Appraisals are ordered and reviewed prior to loan closing, and new appraisals or evaluations are generally initiated when market conditions suggest a potential decline in collateral value, or when a loan is modified, renewed, or demonstrates signs of credit deterioration. CRE LTV ratios are calculated by dividing the outstanding loan balance by the estimated collateral value based on the most recent appraisal. At September 30, 2025, the weighted average LTV ratio for our term CRE portfolio was less than 60%.
For a more comprehensive discussion of CRE loans and our underwriting, see “Commercial Real Estate Loans” in our 2024 Form 10-K.
The following schedule presents the geographic distribution of our commercial real estate lending portfolio, based on the location of the primary collateral.
COMMERCIAL REAL ESTATE LENDING BY GEOGRAPHY
|
|
|
|
|
|
|
|
|
|
|
|
|
|
|
|
|
|
|
|
|
|
|
|
|
|
|
|
|
|
|
|
|
|
|
|
|
|
|
|
|
September 30, 2025 |
|
December 31, 2024 |
| (Dollar amounts in millions) |
Amount |
|
% of
total |
|
Nonaccrual loans |
|
|
|
Amount |
|
% of
total |
|
Nonaccrual loans |
|
|
| Commercial real estate: |
|
|
|
|
|
|
|
|
|
|
|
|
|
|
|
| Arizona |
$ |
1,652 |
|
|
12.3 |
% |
|
$ |
— |
|
|
|
|
$ |
1,801 |
|
|
13.4 |
% |
|
$ |
— |
|
|
|
| California |
3,615 |
|
|
26.8 |
|
|
45 |
|
|
|
|
3,569 |
|
|
26.5 |
|
|
50 |
|
|
|
| Colorado |
728 |
|
|
5.4 |
|
|
16 |
|
|
|
|
666 |
|
|
4.9 |
|
|
— |
|
|
|
| Nevada |
1,059 |
|
|
7.9 |
|
|
— |
|
|
|
|
1,104 |
|
|
8.2 |
|
|
— |
|
|
|
| Texas |
2,619 |
|
|
19.4 |
|
|
9 |
|
|
|
|
2,596 |
|
|
19.2 |
|
|
8 |
|
|
|
| Utah/Idaho |
2,342 |
|
|
17.4 |
|
|
— |
|
|
|
|
2,170 |
|
|
16.1 |
|
|
— |
|
|
|
| Washington/Oregon |
1,117 |
|
|
8.3 |
|
|
— |
|
|
|
|
1,090 |
|
|
8.1 |
|
|
— |
|
|
|
| Other |
345 |
|
|
2.5 |
|
|
— |
|
|
|
|
481 |
|
|
3.6 |
|
|
1 |
|
|
|
| Total commercial real estate |
$ |
13,477 |
|
|
100.0 |
% |
|
$ |
70 |
|
|
|
|
$ |
13,477 |
|
|
100.0 |
% |
|
$ |
59 |
|
|
|
The following schedule presents our commercial real estate lending portfolio by the type of collateral:
ZIONS BANCORPORATION, NATIONAL ASSOCIATION AND SUBSIDIARIES
COMMERCIAL REAL ESTATE LENDING BY COLLATERAL TYPE
|
|
|
|
|
|
|
|
|
|
|
|
|
|
|
|
|
|
|
|
|
|
|
|
|
|
|
|
|
|
|
|
|
|
|
|
|
|
|
|
|
September 30, 2025 |
|
December 31, 2024 |
| (Dollar amounts in millions) |
Amount |
|
% of
total |
|
Nonaccrual loans |
|
|
|
Amount |
|
% of
total |
|
Nonaccrual loans |
|
|
| Commercial property |
|
|
|
|
|
|
|
|
|
|
|
|
|
|
|
| Multifamily |
$ |
3,889 |
|
|
28.9 |
% |
|
$ |
— |
|
|
|
|
$ |
4,007 |
|
|
29.7 |
% |
|
$ |
1 |
|
|
|
| Industrial |
3,034 |
|
|
22.5 |
|
|
— |
|
|
|
|
2,954 |
|
|
21.9 |
|
|
— |
|
|
|
| Office |
1,708 |
|
|
12.7 |
|
|
61 |
|
|
|
|
1,812 |
|
|
13.5 |
|
|
50 |
|
|
|
| Retail |
1,603 |
|
|
11.9 |
|
|
— |
|
|
|
|
1,533 |
|
|
11.4 |
|
|
— |
|
|
|
| Hospitality |
660 |
|
|
4.9 |
|
|
9 |
|
|
|
|
625 |
|
|
4.6 |
|
|
8 |
|
|
|
| Land |
253 |
|
|
1.9 |
|
|
— |
|
|
|
|
261 |
|
|
1.9 |
|
|
— |
|
|
|
Other 1 |
1,547 |
|
|
11.5 |
|
|
— |
|
|
|
|
1,644 |
|
|
12.2 |
|
|
— |
|
|
|
Residential property 2 |
|
|
|
|
|
|
|
|
|
|
|
|
|
|
|
| Single family |
394 |
|
|
2.9 |
|
|
— |
|
|
|
|
330 |
|
|
2.5 |
|
|
— |
|
|
|
| Land |
100 |
|
|
0.7 |
|
|
— |
|
|
|
|
110 |
|
|
0.8 |
|
|
— |
|
|
|
| Condo/Townhome |
22 |
|
|
0.2 |
|
|
— |
|
|
|
|
17 |
|
|
0.1 |
|
|
— |
|
|
|
Other 1 |
267 |
|
|
1.9 |
|
|
— |
|
|
|
|
184 |
|
|
1.4 |
|
|
— |
|
|
|
| Total |
$ |
13,477 |
|
|
100.0 |
% |
|
$ |
70 |
|
|
|
|
$ |
13,477 |
|
|
100.0 |
% |
|
$ |
59 |
|
|
|
1 Included in the total amount of the “Other” commercial and residential categories was approximately $378 million and $342 million of unsecured loans at September 30, 2025 and December 31, 2024, respectively.
2 Residential property consists primarily of loans provided to commercial homebuilders for land, lot, and single-family housing developments.
As previously discussed, our commercial real estate lending portfolio is diversified across geography and collateral type, with the largest concentration in multifamily properties. Given investor interest in multifamily, industrial, and office collateral types, we provide additional analysis of these segments of our CRE portfolio below.
Multifamily CRE
At September 30, 2025 and December 31, 2024, our multifamily CRE loan portfolio totaled $3.9 billion and $4.0 billion, representing 29% and 30% of the total CRE loan portfolio, respectively. Approximately 38% of our multifamily CRE loan portfolio is scheduled to mature within the next 12 months. We believe that substantially all of these borrowers will be able to refinance at maturity through the Bank or other lenders, due to the cash flows from the properties, acceptable LTVs, equity levels, and guarantor support.
The following schedule presents the composition of our multifamily CRE loan portfolio and other related credit quality metrics:
MULTIFAMILY CRE LOAN PORTFOLIO
|
|
|
|
|
|
|
|
|
|
|
|
| (Dollar amounts in millions) |
September 30,
2025 |
|
December 31, 2024 |
| Multifamily CRE |
|
|
|
| Term |
$ |
2,932 |
|
|
$ |
2,918 |
|
| Construction and land development |
957 |
|
|
1,089 |
|
| Total multifamily CRE |
$ |
3,889 |
|
|
$ |
4,007 |
|
| Credit quality metrics |
|
|
|
| Criticized loan ratio |
16.7 |
% |
|
21.5 |
% |
| Classified loan ratio |
13.0 |
% |
|
18.8 |
% |
| Nonaccrual loan ratio |
— |
% |
|
— |
% |
| Delinquency ratio |
— |
% |
|
— |
% |
| Annualized ratio of multifamily CRE net charge-offs (recoveries) to average loans |
— |
% |
|
— |
% |
| Ratio of allowance for credit losses to multifamily CRE loans, at period end |
2.06 |
% |
|
2.55 |
% |
| Weighted average LTV for multifamily term CRE loans |
54 |
% |
|
57 |
% |
ZIONS BANCORPORATION, NATIONAL ASSOCIATION AND SUBSIDIARIES
The following schedules present our multifamily CRE loan portfolio, categorized by collateral location for the periods presented:
MULTIFAMILY CRE LOAN PORTFOLIO BY COLLATERAL LOCATION
|
|
|
|
|
|
|
|
|
|
|
|
|
|
|
|
|
|
|
|
|
|
|
|
|
|
|
|
|
|
|
|
|
|
|
|
|
September 30, 2025 |
|
|
Loan Type |
|
|
|
|
|
|
|
|
| (Dollar amounts in millions) |
|
Term |
|
Construction and land development |
|
Total |
|
% of
total |
|
Nonaccrual loans |
|
|
| Multifamily CRE |
|
|
|
|
|
|
|
|
|
|
|
|
| Arizona |
|
$ |
225 |
|
|
$ |
111 |
|
|
$ |
336 |
|
|
8.6 |
% |
|
$ |
— |
|
|
|
| California |
|
802 |
|
|
176 |
|
|
978 |
|
|
25.2 |
|
|
— |
|
|
|
| Colorado |
|
93 |
|
|
132 |
|
|
225 |
|
|
5.8 |
|
|
— |
|
|
|
| Nevada |
|
198 |
|
|
36 |
|
|
234 |
|
|
6.0 |
|
|
— |
|
|
|
| Texas |
|
903 |
|
|
210 |
|
|
1,113 |
|
|
28.6 |
|
|
— |
|
|
|
| Utah/Idaho |
|
410 |
|
|
202 |
|
|
612 |
|
|
15.7 |
|
|
— |
|
|
|
| Washington/Oregon |
|
240 |
|
|
90 |
|
|
330 |
|
|
8.5 |
|
|
— |
|
|
|
Other 1 |
|
61 |
|
|
— |
|
|
61 |
|
|
1.6 |
|
|
— |
|
|
|
| Total multifamily CRE |
|
$ |
2,932 |
|
|
$ |
957 |
|
|
$ |
3,889 |
|
|
100.0 |
% |
|
$ |
— |
|
|
|
|
|
|
|
|
|
|
|
|
|
|
|
|
|
|
|
|
|
|
|
|
|
|
|
|
|
|
|
|
|
|
|
|
|
|
|
|
December 31, 2024 |
|
|
Loan Type |
|
|
|
|
|
|
|
|
| (Dollar amounts in millions) |
|
Term |
|
Construction and land development |
|
Total |
|
% of
total |
|
Nonaccrual loans |
|
|
| Multifamily CRE |
|
|
|
|
|
|
|
|
|
|
|
|
| Arizona |
|
$ |
364 |
|
|
$ |
142 |
|
|
$ |
506 |
|
|
12.6 |
% |
|
$ |
— |
|
|
|
| California |
|
850 |
|
|
172 |
|
|
1,022 |
|
|
25.5 |
|
|
1 |
|
|
|
| Colorado |
|
91 |
|
|
101 |
|
|
192 |
|
|
4.8 |
|
|
— |
|
|
|
| Nevada |
|
188 |
|
|
99 |
|
|
287 |
|
|
7.2 |
|
|
— |
|
|
|
| Texas |
|
808 |
|
|
310 |
|
|
1,118 |
|
|
27.9 |
|
|
— |
|
|
|
| Utah/Idaho |
|
320 |
|
|
134 |
|
|
454 |
|
|
11.3 |
|
|
— |
|
|
|
| Washington/Oregon |
|
234 |
|
|
130 |
|
|
364 |
|
|
9.1 |
|
|
— |
|
|
|
Other 1 |
|
63 |
|
|
1 |
|
|
64 |
|
|
1.6 |
|
|
— |
|
|
|
| Total multifamily CRE |
|
$ |
2,918 |
|
|
$ |
1,089 |
|
|
$ |
4,007 |
|
|
100.0 |
% |
|
$ |
1 |
|
|
|
1 Other included $55 million of multifamily loans with collateral located in New Mexico at both September 30, 2025 and December 31, 2024.
Industrial CRE
At both September 30, 2025 and December 31, 2024, our industrial CRE loan portfolio totaled $3.0 billion, representing 23% and 22% of the total CRE loan portfolio, respectively. Approximately 35% of the industrial CRE loan portfolio is scheduled to mature within the next 12 months. We believe that substantially all of these borrowers will be able to refinance at maturity through the Bank or other lenders, due to the cash flows from the properties, acceptable LTVs, equity levels, and guarantor support.
The following schedule presents the composition of our industrial CRE loan portfolio and other related credit quality metrics:
ZIONS BANCORPORATION, NATIONAL ASSOCIATION AND SUBSIDIARIES
INDUSTRIAL CRE LOAN PORTFOLIO
|
|
|
|
|
|
|
|
|
|
|
|
| (Dollar amounts in millions) |
September 30, 2025 |
|
December 31, 2024 |
| Industrial CRE |
|
|
|
| Term |
$ |
2,667 |
|
|
$ |
2,462 |
|
| Construction and land development |
367 |
|
|
492 |
|
| Total industrial CRE |
$ |
3,034 |
|
|
$ |
2,954 |
|
| Credit quality metrics |
|
|
|
| Criticized loan ratio |
13.7 |
% |
|
14.6 |
% |
| Classified loan ratio |
13.2 |
% |
|
12.8 |
% |
| Nonaccrual loan ratio |
— |
% |
|
— |
% |
| Delinquency ratio |
0.6 |
% |
|
— |
% |
| Annualized ratio of industrial CRE net charge-offs (recoveries) to average loans |
— |
% |
|
— |
% |
| Ratio of allowance for credit losses to industrial CRE loans, at period end |
1.35 |
% |
|
2.30 |
% |
| Weighted average LTV for industrial term CRE loans |
52 |
% |
|
53 |
% |
The following schedules present our industrial CRE loan portfolio, categorized by collateral location for the periods presented:
INDUSTRIAL CRE LOAN PORTFOLIO BY COLLATERAL LOCATION
|
|
|
|
|
|
|
|
|
|
|
|
|
|
|
|
|
|
|
|
|
|
|
|
|
|
|
|
|
|
|
|
|
|
|
|
|
September 30, 2025 |
|
|
Loan Type |
|
|
|
|
|
|
|
|
| (Dollar amounts in millions) |
|
Term |
|
Construction and land development |
|
Total |
|
% of
total |
|
Nonaccrual loans |
|
|
Industrial CRE |
|
|
|
|
|
|
|
|
|
|
|
|
| Arizona |
|
$ |
418 |
|
|
$ |
20 |
|
|
$ |
438 |
|
|
14.4 |
% |
|
$ |
— |
|
|
|
| California |
|
860 |
|
|
67 |
|
|
927 |
|
|
30.6 |
|
|
— |
|
|
|
| Colorado |
|
78 |
|
|
10 |
|
|
88 |
|
|
2.9 |
|
|
— |
|
|
|
| Nevada |
|
233 |
|
|
57 |
|
|
290 |
|
|
9.6 |
|
|
— |
|
|
|
| Texas |
|
447 |
|
|
43 |
|
|
490 |
|
|
16.2 |
|
|
— |
|
|
|
| Utah/Idaho |
|
358 |
|
|
120 |
|
|
478 |
|
|
15.7 |
|
|
— |
|
|
|
| Washington/Oregon |
|
221 |
|
|
50 |
|
|
271 |
|
|
8.9 |
|
|
— |
|
|
|
Other 1 |
|
52 |
|
|
— |
|
|
52 |
|
|
1.7 |
|
|
— |
|
|
|
| Total industrial CRE |
|
$ |
2,667 |
|
|
$ |
367 |
|
|
$ |
3,034 |
|
|
100.0 |
% |
|
$ |
— |
|
|
|
|
|
|
|
|
|
|
|
|
|
|
|
|
|
|
|
|
|
|
|
|
|
|
|
|
|
|
|
|
|
|
|
|
|
|
|
|
December 31, 2024 |
|
|
Loan Type |
|
|
|
|
|
|
|
|
| (Dollar amounts in millions) |
|
Term |
|
Construction and land development |
|
Total |
|
% of
total |
|
Nonaccrual loans |
|
|
Industrial CRE |
|
|
|
|
|
|
|
|
|
|
|
|
| Arizona |
|
$ |
374 |
|
|
$ |
33 |
|
|
$ |
407 |
|
|
13.8 |
% |
|
$ |
— |
|
|
|
| California |
|
730 |
|
|
189 |
|
|
919 |
|
|
31.1 |
|
|
— |
|
|
|
| Colorado |
|
58 |
|
|
1 |
|
|
59 |
|
|
2.0 |
|
|
— |
|
|
|
| Nevada |
|
241 |
|
|
108 |
|
|
349 |
|
|
11.8 |
|
|
— |
|
|
|
| Texas |
|
453 |
|
|
42 |
|
|
495 |
|
|
16.8 |
|
|
— |
|
|
|
| Utah/Idaho |
|
350 |
|
|
83 |
|
|
433 |
|
|
14.7 |
|
|
— |
|
|
|
| Washington/Oregon |
|
201 |
|
|
36 |
|
|
237 |
|
|
8.0 |
|
|
— |
|
|
|
Other 1 |
|
55 |
|
|
— |
|
|
55 |
|
|
1.8 |
|
|
— |
|
|
|
| Total industrial CRE |
|
$ |
2,462 |
|
|
$ |
492 |
|
|
$ |
2,954 |
|
|
100.0 |
% |
|
$ |
— |
|
|
|
1 Other included $31 million of industrial loans with collateral located in Virginia at both September 30, 2025 and December 31, 2024.
ZIONS BANCORPORATION, NATIONAL ASSOCIATION AND SUBSIDIARIES
Office CRE
At September 30, 2025 and December 31, 2024, our office CRE loan portfolio totaled $1.7 billion and $1.8 billion, respectively, representing 13% of the total CRE loan portfolio for both periods. Approximately 28% of the office CRE loan portfolio is scheduled to mature in the next 12 months. We believe that substantially all of these borrowers will be able to refinance at maturity through the Bank or other lenders, due to the cash flows from the properties, acceptable LTVs, equity levels, and guarantor support.
The following schedule presents the composition of our office CRE loan portfolio and other related credit quality metrics:
OFFICE CRE LOAN PORTFOLIO
|
|
|
|
|
|
|
|
|
|
|
|
| (Dollar amounts in millions) |
September 30, 2025 |
|
December 31, 2024 |
| Office CRE |
|
|
|
| Term |
$ |
1,689 |
|
|
$ |
1,697 |
|
| Construction and land development |
19 |
|
|
115 |
|
| Total office CRE |
$ |
1,708 |
|
|
$ |
1,812 |
|
| Credit quality metrics |
|
|
|
| Criticized loan ratio |
13.6 |
% |
|
14.5 |
% |
| Classified loan ratio |
13.5 |
% |
|
12.8 |
% |
| Nonaccrual loan ratio |
3.6 |
% |
|
2.8 |
% |
| Delinquency ratio |
2.3 |
% |
|
1.4 |
% |
| Annualized ratio of office CRE net charge-offs (recoveries) to average loans |
0.6 |
% |
|
0.3 |
% |
|
|
|
|
| Ratio of allowance for credit losses to office CRE loans, at period end |
3.22 |
% |
|
3.92 |
% |
| Weighted average LTV for office term CRE loans |
58 |
% |
|
56 |
% |
The following schedules present our office CRE loan portfolio, categorized by collateral location for the periods presented:
OFFICE CRE LOAN PORTFOLIO BY COLLATERAL LOCATION
|
|
|
|
|
|
|
|
|
|
|
|
|
|
|
|
|
|
|
|
|
|
|
|
|
|
|
|
|
|
|
|
|
|
|
|
|
September 30, 2025 |
|
|
Loan Type |
|
|
|
|
|
|
|
|
| (Dollar amounts in millions) |
|
Term |
|
Construction and land development |
|
Total |
|
% of
total |
|
Nonaccrual loans |
|
|
| Office CRE |
|
|
|
|
|
|
|
|
|
|
|
|
| Arizona |
|
$ |
263 |
|
|
$ |
— |
|
|
$ |
263 |
|
|
15.4 |
% |
|
$ |
— |
|
|
|
| California |
|
297 |
|
|
5 |
|
|
302 |
|
|
17.7 |
|
|
45 |
|
|
|
| Colorado |
|
57 |
|
|
— |
|
|
57 |
|
|
3.3 |
|
|
16 |
|
|
|
| Nevada |
|
87 |
|
|
— |
|
|
87 |
|
|
5.1 |
|
|
— |
|
|
|
| Texas |
|
173 |
|
|
— |
|
|
173 |
|
|
10.1 |
|
|
— |
|
|
|
| Utah/Idaho |
|
477 |
|
|
14 |
|
|
491 |
|
|
28.8 |
|
|
— |
|
|
|
| Washington/Oregon |
|
325 |
|
|
— |
|
|
325 |
|
|
19.0 |
|
|
— |
|
|
|
| Other |
|
10 |
|
|
— |
|
|
10 |
|
|
0.6 |
|
|
— |
|
|
|
| Total office CRE |
|
$ |
1,689 |
|
|
$ |
19 |
|
|
$ |
1,708 |
|
|
100.0 |
% |
|
$ |
61 |
|
|
|
ZIONS BANCORPORATION, NATIONAL ASSOCIATION AND SUBSIDIARIES
|
|
|
|
|
|
|
|
|
|
|
|
|
|
|
|
|
|
|
|
|
|
|
|
|
|
|
|
|
|
|
|
|
|
|
|
|
December 31, 2024 |
|
|
Loan Type |
|
|
|
|
|
|
|
|
| (Dollar amounts in millions) |
|
Term |
|
Construction and land development |
|
Total |
|
% of
total |
|
Nonaccrual loans |
|
|
| Office CRE |
|
|
|
|
|
|
|
|
|
|
|
|
| Arizona |
|
$ |
255 |
|
|
$ |
— |
|
|
$ |
255 |
|
|
14.1 |
% |
|
$ |
— |
|
|
|
| California |
|
328 |
|
|
38 |
|
|
366 |
|
|
20.2 |
|
|
49 |
|
|
|
| Colorado |
|
58 |
|
|
— |
|
|
58 |
|
|
3.2 |
|
|
— |
|
|
|
| Nevada |
|
77 |
|
|
11 |
|
|
88 |
|
|
4.9 |
|
|
— |
|
|
|
| Texas |
|
186 |
|
|
7 |
|
|
193 |
|
|
10.6 |
|
|
1 |
|
|
|
| Utah/Idaho |
|
482 |
|
|
34 |
|
|
516 |
|
|
28.5 |
|
|
— |
|
|
|
| Washington/Oregon |
|
283 |
|
|
25 |
|
|
308 |
|
|
17.0 |
|
|
— |
|
|
|
| Other |
|
28 |
|
|
— |
|
|
28 |
|
|
1.5 |
|
|
— |
|
|
|
| Total office CRE |
|
$ |
1,697 |
|
|
$ |
115 |
|
|
$ |
1,812 |
|
|
100.0 |
% |
|
$ |
50 |
|
|
|
Consumer Lending
The following schedule presents the composition of our consumer lending portfolio:
CONSUMER LENDING PORTFOLIO
|
|
|
|
|
|
|
|
|
|
|
|
|
|
|
|
|
|
|
|
|
|
|
|
|
|
|
|
|
|
|
|
|
|
|
|
|
September 30, 2025 |
|
December 31, 2024 |
|
|
|
|
| (Dollar amounts in millions) |
Amount |
|
% of total
consumer loans |
|
Amount |
|
% of total
consumer loans |
|
Amount change |
|
Percent change |
| Consumer: |
|
|
|
|
|
|
|
|
|
|
|
| 1-4 family residential |
$ |
10,423 |
|
|
66.6 |
% |
|
$ |
9,939 |
|
|
66.4 |
% |
|
$ |
484 |
|
|
4.9 |
% |
| Home equity credit line |
3,848 |
|
|
24.6 |
|
|
3,641 |
|
|
24.3 |
|
|
207 |
|
|
5.7 |
|
| Construction and other consumer real estate |
769 |
|
|
4.9 |
|
|
810 |
|
|
5.4 |
|
|
(41) |
|
|
(5.1) |
|
| Bankcard and other revolving plans |
477 |
|
|
3.0 |
|
|
457 |
|
|
3.1 |
|
|
20 |
|
|
4.4 |
|
| Other |
129 |
|
|
0.9 |
|
|
121 |
|
|
0.8 |
|
|
8 |
|
|
6.6 |
|
| Total consumer |
$ |
15,646 |
|
|
100.0 |
% |
|
$ |
14,968 |
|
|
100.0 |
% |
|
$ |
678 |
|
|
4.5 |
|
1-4 Family Residential Mortgages
We originate first-lien residential home mortgage loans considered to be of prime quality. At September 30, 2025, our 1-4 family residential mortgage loan portfolio totaled $10.4 billion, representing 67% of our total consumer loan portfolio, compared with $9.9 billion, or 66%, at December 31, 2024. The increase was partly due to the acquisition of consumer loans associated with the purchase of four FirstBank Coachella Valley, California branches in late March 2025.
At September 30, 2025 and December 31, 2024, approximately 89% and 90%, respectively, of our 1-4 family residential mortgage loan portfolio consisted of variable-rate loans. We generally retain variable-rate loans in our loan portfolio and sell conforming fixed-rate loans to third parties, including the Federal National Mortgage Association and the Federal Home Loan Mortgage Corporation. In connection with these sales, we provide customary representations and warranties affirming that the loans satisfy specified underwriting standards and collateral documentation requirements.
Home Equity Credit Lines
We also originate home equity credit lines (“HECLs”). At September 30, 2025 and December 31, 2024, our HECL portfolio totaled $3.8 billion and $3.6 billion, respectively. Approximately 34% and 37% of our HECLs were secured by first liens for the same respective time periods.
At September 30, 2025, loans representing less than 1% of the outstanding balance in the HECL portfolio were estimated to have combined loan-to-value (“CLTV”) ratios above 100%. An estimated CLTV ratio is the ratio of our loan plus any prior lien amounts divided by the estimated current collateral value. At origination, underwriting standards for the HECL portfolio generally include a maximum 80% CLTV with a Fair Isaac Corporation (“FICO”) credit score greater than 700.
ZIONS BANCORPORATION, NATIONAL ASSOCIATION AND SUBSIDIARIES
At September 30, 2025, approximately 93% of our HECL portfolio was still in the draw period, and about 22% of those loans were scheduled to begin amortizing within the next five years. We believe the risk of loss and borrower default in the event of a loan becoming fully amortizing and the effect of significant interest rate changes is low, given the rate shock analysis performed at origination. The ratio of HECL net charge-offs (recoveries) for the trailing twelve months to average balances at September 30, 2025 and December 31, 2024, was 0.01% and 0.00%, respectively. For additional information on the credit quality of our HECL portfolio, see Note 6 of the Notes to Consolidated Financial Statements.
The following schedule presents the geographic distribution of our consumer lending portfolio, based on the location of the primary borrower.
CONSUMER LENDING BY GEOGRAPHY
|
|
|
|
|
|
|
|
|
|
|
|
|
|
|
|
|
|
|
|
|
|
|
|
|
|
|
|
|
|
|
|
|
|
|
|
|
|
|
|
|
September 30, 2025 |
|
December 31, 2024 |
| (Dollar amounts in millions) |
Amount |
|
% of
total |
|
Nonaccrual loans |
|
|
|
Amount |
|
% of
total |
|
Nonaccrual loans |
|
|
| Consumer |
|
|
|
|
|
|
|
|
|
|
|
|
|
|
|
| Arizona |
$ |
1,433 |
|
|
9.2 |
% |
|
$ |
7 |
|
|
|
|
$ |
1,365 |
|
|
9.1 |
% |
|
$ |
5 |
|
|
|
| California |
3,563 |
|
|
22.8 |
|
|
15 |
|
|
|
|
3,159 |
|
|
21.1 |
|
|
14 |
|
|
|
| Colorado |
1,393 |
|
|
8.9 |
|
|
12 |
|
|
|
|
1,353 |
|
|
9.1 |
|
|
7 |
|
|
|
| Nevada |
1,349 |
|
|
8.6 |
|
|
12 |
|
|
|
|
1,328 |
|
|
8.9 |
|
|
10 |
|
|
|
| Texas |
3,655 |
|
|
23.4 |
|
|
25 |
|
|
|
|
3,657 |
|
|
24.4 |
|
|
25 |
|
|
|
| Utah/Idaho |
3,521 |
|
|
22.5 |
|
|
17 |
|
|
|
|
3,430 |
|
|
22.9 |
|
|
14 |
|
|
|
| Washington/Oregon |
297 |
|
|
1.9 |
|
|
4 |
|
|
|
|
237 |
|
|
1.6 |
|
|
— |
|
|
|
| Other |
435 |
|
|
2.7 |
|
|
3 |
|
|
|
|
439 |
|
|
2.9 |
|
|
5 |
|
|
|
| Total consumer |
$ |
15,646 |
|
|
100.0 |
% |
|
$ |
95 |
|
|
|
|
$ |
14,968 |
|
|
100.0 |
% |
|
$ |
80 |
|
|
|
Credit Quality
We monitor credit quality by analyzing various factors, including nonperforming status, internal risk grades, and net charge-offs, all of which are used in our overall evaluation of the adequacy of our ACL. For more information on these factors and the ACL, see Note 6 of the Notes to Consolidated Financial Statements.
Nonperforming Assets
Nonperforming assets include nonaccrual loans and other real estate owned (“OREO”), or foreclosed properties. The following schedule presents the composition of our nonperforming assets:
NONPERFORMING ASSETS
|
|
|
|
|
|
|
|
|
|
|
|
|
|
| (Dollar amounts in millions) |
September 30,
2025 |
|
|
|
December 31,
2024 |
|
|
|
|
|
|
Nonaccrual loans 1 |
$ |
319 |
|
|
|
|
$ |
297 |
|
Other real estate owned 2 |
5 |
|
|
|
|
1 |
|
| Total nonperforming assets |
$ |
324 |
|
|
|
|
$ |
298 |
|
Ratio of nonperforming assets to net loans and leases1 and other real estate owned 2 |
0.54 |
% |
|
|
|
0.50 |
% |
| Accruing loans past due 90 days or more |
$ |
5 |
|
|
|
|
$ |
18 |
|
Ratio of accruing loans past due 90 days or more to loans and leases 1 |
0.01 |
% |
|
|
|
0.03 |
% |
Nonaccrual loans1 and accruing loans past due 90 days or more |
$ |
324 |
|
|
|
|
$ |
315 |
|
Ratio of nonperforming assets1 and accruing loans past due 90 days or more to loans and leases1 and other real estate owned 2 |
0.54 |
% |
|
|
|
0.53 |
% |
| Accruing loans past due 30-89 days |
$ |
69 |
|
|
|
|
$ |
57 |
|
|
|
|
|
|
|
|
|
|
|
|
|
Ratio of nonaccrual loans1 current as to principal and interest payments |
54.2 |
% |
|
|
|
61.7 |
% |
1 Includes loans held for sale.
2 Does not include banking premises held for sale.
ZIONS BANCORPORATION, NATIONAL ASSOCIATION AND SUBSIDIARIES
Nonperforming assets totaled $324 million, or 0.54% of total loans and leases and other real estate owned at September 30, 2025, compared with $298 million, or 0.50%, at December 31, 2024. For more information about nonaccrual loans, see Note 6 of the Notes to Consolidated Financial Statements.
Classified Loans
Classified loans are considered loans with well-defined weaknesses and are assigned using our internal risk grade definitions of substandard and doubtful, which are consistent with regulatory risk classifications. The following schedule presents our classified loans by loan segment:
CLASSIFIED LOANS
|
|
|
|
|
|
|
|
|
|
|
|
|
|
| (Dollar amounts in millions) |
September 30,
2025 |
|
|
|
December 31,
2024 |
|
|
|
|
|
|
Commercial |
$ |
971 |
|
|
|
|
$ |
1,130 |
|
| Commercial real estate |
1,337 |
|
|
|
|
1,651 |
|
| Consumer |
107 |
|
|
|
|
89 |
|
| Total classified loans |
$ |
2,415 |
|
|
|
|
$ |
2,870 |
|
| Ratio of classified loans to total loans and leases |
4.00 |
% |
|
|
|
4.83 |
% |
|
|
|
|
|
|
|
|
|
|
|
|
|
|
|
|
|
|
|
|
|
|
|
|
|
|
|
|
|
|
|
|
|
|
|
|
|
|
|
|
|
|
|
|
|
|
|
|
Classified loans totaled $2.4 billion and decreased $455 million when compared with December 31, 2024. Approximately 55% of our classified loans are in the CRE loan portfolio. The loss content of our CRE loan portfolio continues to be mitigated by strong underwriting, supported by significant borrower equity and guarantor support, resulting in relatively stable CRE nonperforming assets and low net loan charge-offs.
Allowance for Credit Losses
The ACL, which consists of the ALLL and the RULC, represents our estimate of current expected credit losses related to the loan and lease portfolio and unfunded lending commitments as of the balance sheet date.
We estimate current expected credit losses by incorporating historical credit loss experience, prevailing economic conditions, and economic forecasts, which collectively inform the quantitative component of our ACL. Additionally, we consider qualitative and environmental factors that may indicate actual losses could differ from levels estimated by our quantitative models. The impact of these factors on our ACL may vary from quarter to quarter. Because economic forecasts may not always align with observed credit quality trends, changes in the ACL may not necessarily correspond directionally with changes in credit quality.
During the first nine months of 2025, the qualitative portion of the ACL decreased primarily due to a reduction in CRE portfolio-specific risks. This led us to assign lesser weight to stressed economic assumptions for the CRE portfolio.
For additional information on the ACL and credit trends experienced in each portfolio segment, see “The Allowance and Provision for Credit Losses” section on page 13 and Note 6 of the Notes to Consolidated Financial Statements.
ZIONS BANCORPORATION, NATIONAL ASSOCIATION AND SUBSIDIARIES
The following schedule presents the components of the ACL and credit-related balances and metrics:
ACL AND CREDIT-RELATED BALANCES AND METRICS
|
|
|
|
|
|
|
|
|
|
|
|
|
|
|
|
|
|
| (Dollar amounts in millions) |
Nine Months Ended
September 30, 2025 |
|
Twelve Months Ended
December 31, 2024 |
|
Nine Months Ended
September 30, 2024 |
|
|
|
|
|
|
| Loans and leases outstanding |
$ |
60,302 |
|
|
$ |
59,410 |
|
|
$ |
58,884 |
|
| Average loans and leases outstanding: |
|
|
|
|
|
| Commercial |
31,327 |
|
|
30,671 |
|
|
30,553 |
|
| Commercial real estate |
13,593 |
|
|
13,532 |
|
|
13,538 |
|
| Consumer |
15,378 |
|
|
14,344 |
|
|
14,198 |
|
| Total average loans and leases outstanding |
$ |
60,298 |
|
|
$ |
58,547 |
|
|
$ |
58,289 |
|
| Allowance for loan and lease losses: |
|
|
|
|
|
| Balance at beginning of period |
$ |
696 |
|
|
$ |
684 |
|
|
$ |
684 |
|
| Provision for loan losses |
65 |
|
|
72 |
|
|
34 |
|
| Charge-offs: |
|
|
|
|
|
| Commercial |
92 |
|
|
68 |
|
|
30 |
|
| Commercial real estate |
4 |
|
|
11 |
|
|
11 |
|
| Consumer |
11 |
|
|
12 |
|
|
9 |
|
| Total |
107 |
|
|
91 |
|
|
50 |
|
| Recoveries: |
|
|
|
|
|
| Commercial |
21 |
|
|
23 |
|
|
19 |
|
| Commercial real estate |
1 |
|
|
3 |
|
|
3 |
|
| Consumer |
3 |
|
|
5 |
|
|
4 |
|
| Total |
25 |
|
|
31 |
|
|
26 |
|
| Net loan and lease charge-offs |
82 |
|
|
60 |
|
|
24 |
|
| Balance at end of period |
$ |
679 |
|
|
$ |
696 |
|
|
$ |
694 |
|
| Reserve for unfunded lending commitments: |
|
|
|
|
|
| Balance at beginning of period |
$ |
45 |
|
|
$ |
45 |
|
|
$ |
45 |
|
| Provision for unfunded lending commitments |
1 |
|
|
— |
|
|
(3) |
|
| Balance at end of period |
$ |
46 |
|
|
$ |
45 |
|
|
$ |
42 |
|
| Total allowance for credit losses: |
|
|
|
|
|
| Allowance for loan and lease losses |
$ |
679 |
|
|
$ |
696 |
|
|
$ |
694 |
|
| Reserve for unfunded lending commitments |
46 |
|
|
45 |
|
|
42 |
|
| Total allowance for credit losses |
$ |
725 |
|
|
$ |
741 |
|
|
$ |
736 |
|
|
|
|
|
|
|
| Ratio of allowance for credit losses to net loans and leases, at period end |
1.20 |
% |
|
1.25 |
% |
|
1.25 |
% |
| Ratio of allowance for credit losses to nonaccrual loans, at period end |
227 |
% |
|
249 |
% |
|
203 |
% |
| Ratio of allowance for credit losses to nonaccrual loans and accruing loans past due 90 days or more, at period end |
224 |
% |
|
235 |
% |
|
199 |
% |
Ratio of total net charge-offs to average loans and leases 1 |
0.18 |
% |
|
0.10 |
% |
|
0.05 |
% |
Ratio of commercial net charge-offs to average commercial loans 1 |
0.30 |
% |
|
0.15 |
% |
|
0.05 |
% |
Ratio of commercial real estate net charge-offs to average commercial real estate loans 1 |
0.03 |
% |
|
0.06 |
% |
|
0.08 |
% |
Ratio of consumer net charge-offs to average consumer loans 1 |
0.07 |
% |
|
0.05 |
% |
|
0.05 |
% |
1 Ratios are annualized for the periods presented, except for the period representing the full twelve months.
ZIONS BANCORPORATION, NATIONAL ASSOCIATION AND SUBSIDIARIES
Interest Rate and Market Risk Management
Interest rate and market risk refer to the potential for adverse impacts on current or future earnings and capital arising from changes in interest rates and other market conditions. Given our involvement in transactions with a broad range of financial instruments, we are inherently exposed to these risks. For more information regarding our interest rate and market risk management practices, see “Interest Rate and Market Risk Management” in our 2024 Form 10-K.
We actively manage our exposure to interest rate fluctuations by positioning the balance sheet to reduce volatility in both net interest income and the economic value of equity (“EVE”). Given that a significant portion of our balance sheet funding is derived from non-maturity deposit products, we rely on behavioral models and assumptions to forecast the sensitivity of earnings to interest rate movements. These models and assumptions are subject to ongoing performance monitoring.
When observed deposit behavior diverges from model expectations, the models are updated accordingly, with greater emphasis placed on recently observed behavior. All model changes are independently reviewed by our Model Risk Management function.
Our deposit-behavior models incorporate assumptions about the correlation between the rates paid on interest-bearing deposits and fluctuations in average benchmark interest rates. This is commonly referred to as “deposit beta.” Certificates of deposit are typically modeled with a higher degree of correlation, whereas interest-bearing checking accounts are assumed to exhibit a lower sensitivity to rate changes.
Many consumer and business deposit accounts have historically demonstrated stability and limited sensitivity to rate changes, resulting in a longer duration relative to our loan portfolio. As a result, our balance sheet has typically been “asset-sensitive,” meaning that assets are expected to reprice more quickly or more significantly than our liabilities. Measures of asset sensitivity are particularly influenced by changes in deposit modeling assumptions.
To manage interest rate risk, we regularly employ a combination of interest rate swaps, investments in fixed-rate securities, and funding strategies. Collectively, these tools help moderate the expected sensitivity of net interest income and EVE to changes in interest rates.
The following schedule presents deposit duration assumptions discussed previously:
DEPOSIT ASSUMPTIONS
|
|
|
|
|
|
|
|
|
|
|
|
|
|
|
|
|
|
|
|
|
|
|
|
|
|
|
|
|
|
|
|
|
|
|
|
|
|
|
|
|
September 30, 2025 |
|
December 31, 2024 |
| Product |
|
Effective duration
(-200 bps) |
|
Effective duration (unchanged) |
|
Effective duration
(+200 bps) |
|
Effective duration
(-200 bps) |
|
Effective duration (unchanged) |
|
Effective duration
(+200 bps) |
|
|
|
|
|
|
|
|
|
|
|
|
|
| Demand deposits |
|
4.5% |
|
3.8% |
|
3.3% |
|
4.2% |
|
3.5% |
|
2.9% |
| Money market |
|
2.1% |
|
1.6% |
|
1.4% |
|
1.9% |
|
1.6% |
|
1.4% |
| Savings and interest-bearing checking |
|
2.2% |
|
1.8% |
|
1.7% |
|
2.1% |
|
1.8% |
|
1.6% |
As previously discussed, we utilize derivative instruments to manage interest rate risk. The following schedule presents derivatives designated in qualifying hedging relationships at September 30, 2025. It includes the average outstanding derivative notional amounts for each reporting period presented and the weighted-average fixed rates paid or received across cash flow and fair value hedge categories. For more information regarding our hedge accounting strategies and the impact of these hedging relationships on interest income and expense, see Note 7 of the Notes to Consolidated Financial Statements.
ZIONS BANCORPORATION, NATIONAL ASSOCIATION AND SUBSIDIARIES
DERIVATIVES DESIGNATED IN QUALIFYING HEDGING RELATIONSHIPS
|
|
|
|
|
|
|
|
|
|
|
|
|
|
|
|
|
|
|
|
|
|
|
|
|
|
|
|
|
|
|
|
|
|
|
|
|
|
|
|
|
|
|
|
|
|
|
|
|
|
|
|
|
|
|
|
|
|
|
|
|
|
|
|
|
|
|
|
|
2025 |
|
2026 |
|
2027 |
|
4Q27 - 3Q28 |
|
4Q28 - 3Q29 |
|
|
|
|
|
|
|
|
| (Dollar amounts in millions) |
Fourth Quarter |
|
First Quarter |
|
Second Quarter |
|
Third Quarter |
|
Fourth Quarter |
|
First Quarter |
|
Second Quarter |
|
Third Quarter |
|
|
|
|
|
|
|
|
|
|
| Cash flow hedges |
|
|
|
|
|
|
|
|
|
|
|
|
|
|
|
|
|
|
|
|
|
|
|
|
|
|
|
Cash flow hedges of assets 1 |
|
|
|
|
|
|
|
|
|
|
|
|
|
|
|
|
|
|
|
|
|
|
|
|
|
|
|
| Average outstanding notional |
$ |
1,199 |
|
$ |
1,034 |
|
$ |
1,000 |
|
$ |
1,000 |
|
$ |
1,000 |
|
$ |
934 |
|
$ |
778 |
|
$ |
598 |
|
$ |
342 |
|
$ |
145 |
|
|
|
|
|
|
|
|
| Weighted-average fixed-rate received |
3.04 |
% |
|
3.10 |
% |
|
3.15 |
% |
|
3.15 |
% |
|
3.15 |
% |
|
3.25 |
% |
|
3.28 |
% |
|
3.21 |
% |
|
3.83 |
% |
|
3.82 |
% |
|
|
|
|
|
|
|
|
|
|
|
|
|
|
|
|
|
|
|
|
|
|
|
|
|
|
|
|
|
|
|
|
|
|
|
|
|
2025 |
|
2026 |
|
2027 |
|
2028 |
|
2029 |
|
2030 |
|
2031 |
|
2032 |
|
2033 |
|
2034 |
|
|
|
|
|
|
|
|
| Fair value hedges |
|
|
|
|
|
|
|
|
|
|
|
|
|
|
|
|
|
|
|
|
|
|
|
|
|
|
|
Fair value hedges of debt 2 |
|
|
|
|
|
|
|
|
|
|
|
|
|
|
|
|
|
|
|
|
|
|
|
|
|
|
|
| Average outstanding notional |
$ |
1,000 |
|
$ |
1,000 |
|
$ |
814 |
|
$ |
500 |
|
$ |
500 |
|
$ |
500 |
|
$ |
500 |
|
$ |
500 |
|
$ |
500 |
|
$ |
441 |
|
|
|
|
|
|
|
|
| Weighted-average fixed-rate received |
2.30 |
% |
|
2.30 |
% |
|
2.72 |
% |
|
3.93 |
% |
|
3.93 |
% |
|
3.93 |
% |
|
3.93 |
% |
|
3.93 |
% |
|
3.93 |
% |
|
3.93 |
% |
|
|
|
|
|
|
|
|
Fair value hedges of assets 3 |
|
|
|
|
|
|
|
|
|
|
|
|
|
|
|
|
|
|
|
|
|
|
|
|
|
|
|
| Average outstanding notional |
$ |
5,478 |
|
$ |
5,471 |
|
$ |
5,455 |
|
$ |
4,625 |
|
$ |
3,393 |
|
$ |
2,224 |
|
$ |
1,796 |
|
$ |
1,644 |
|
$ |
1,517 |
|
$ |
1,338 |
|
|
|
|
|
|
|
|
| Weighted-average fixed-rate paid |
3.76 |
% |
|
3.76 |
% |
|
3.61 |
% |
|
3.26 |
% |
|
3.10 |
% |
|
2.90 |
% |
|
2.76 |
% |
|
2.70 |
% |
|
2.65 |
% |
|
2.75 |
% |
|
|
|
|
|
|
|
|
|
|
|
|
|
|
|
|
|
|
|
|
|
|
|
|
|
|
|
|
|
|
|
|
|
|
|
|
|
|
|
|
|
|
|
|
|
|
|
|
|
|
|
|
|
|
|
|
|
|
|
|
|
|
|
|
|
|
|
|
|
|
|
|
|
|
|
|
|
|
|
|
|
|
|
|
|
|
|
|
|
|
|
|
|
|
|
|
|
|
|
|
|
|
|
|
|
|
|
|
|
|
|
|
|
|
|
|
|
|
|
|
|
|
|
|
|
|
|
|
|
|
|
|
|
|
|
|
|
|
|
|
|
|
|
|
|
|
|
|
|
|
|
|
|
|
|
|
|
|
|
|
|
|
|
|
|
|
|
|
|
|
|
|
|
|
|
|
|
|
|
|
|
|
|
|
|
|
|
|
|
|
|
|
|
|
|
|
|
|
|
|
|
|
|
|
1 Cash flow hedges of assets consist of receive-fixed swaps hedging pools of floating-rate loans.
2 Fair value debt hedges consist of receive-fixed swaps that hedge fixed-rate subordinated and senior debts.
3 Fair value asset hedges consist of pay-fixed swaps that hedge fixed-rate AFS securities and fixed-rate commercial loans.
At September 30, 2025, we had $48 million of net losses deferred in accumulated other comprehensive income (“AOCI”) related to terminated cash flow hedges. These deferred amounts are amortized into interest income on a straight-line basis over the original maturity periods of the respective hedges, provided the forecasted transactions are expected to occur. For more information regarding amounts deferred in AOCI from terminated cash flow hedges, see “Interest Rate and Market Risk Management” in our 2024 Form 10-K.
Earnings at Risk (EaR) and Economic Value of Equity (EVE)
Incorporating our deposit assumptions and the impact of derivatives designated in qualifying hedging relationships, the following schedule presents our earnings at risk (“EaR”), defined as the percentage change in projected 12-month net interest income, and the estimated percentage change in EVE. Both EaR and EVE are based on a static balance sheet and reflect instantaneous, parallel shifts in interest rates ranging from -200 to +200 bps. These metrics are intended to illustrate the sensitivity of net interest income and equity value to changes in interest rates across a range of scenarios and should not be interpreted as forecasts of expected net interest income.
INCOME SIMULATION – CHANGE IN NET INTEREST INCOME AND CHANGE IN ECONOMIC VALUE OF EQUITY
|
|
|
|
|
|
|
|
|
|
|
|
|
|
|
|
|
|
|
|
|
|
|
|
|
|
|
|
|
|
|
|
|
|
|
|
|
|
|
|
|
|
|
|
|
|
|
|
|
|
|
|
|
|
|
|
|
|
|
|
|
|
|
|
|
September 30, 2025 |
|
December 31, 2024 |
|
|
Parallel shift in rates (in bps) |
|
Parallel shift in rates (in bps) |
| Repricing scenario |
|
-200 |
|
-100 |
|
0 |
|
+100 |
|
+200 |
|
-200 |
|
-100 |
|
0 |
|
+100 |
|
+200 |
|
|
|
|
|
|
|
|
|
|
|
|
|
|
|
|
|
|
|
|
|
|
Earnings at Risk
(EaR)
|
|
(9.7) |
% |
|
(4.9) |
% |
|
— |
% |
|
4.9 |
% |
|
9.7 |
% |
|
(8.9) |
% |
|
(4.5) |
% |
|
— |
% |
|
4.4 |
% |
|
8.7 |
% |
|
Economic Value of Equity
(EVE)
|
|
(1.2) |
% |
|
(0.2) |
% |
|
— |
% |
|
(0.8) |
% |
|
(2.1) |
% |
|
0.1 |
% |
|
0.6 |
% |
|
— |
% |
|
(1.7) |
% |
|
(3.6) |
% |
Asset sensitivity, as measured by EaR, increased during the first nine months of 2025, primarily due to shifts in the composition of deposit balances. Under current deposit assumptions, interest rate risk remains within established policy limits. For interest-bearing deposits with indeterminable maturities, the weighted average modeled beta was 50%.
ZIONS BANCORPORATION, NATIONAL ASSOCIATION AND SUBSIDIARIES
Prepayment assumptions play a critical role in the management of interest rate risk. Certain assets within our portfolio, such as 1-4 family residential mortgages and mortgage-backed securities, are subject to borrower-driven prepayments, which can significantly affect projected cash flows. At September 30, 2025 and December 31, 2024, estimated lifetime prepayment speeds for loans were 15.2% and 13.7%, respectively, reflecting a decline in mortgage rates. For mortgage-backed securities, estimated prepayment speeds were 7.1% and 7.0% for the same respective periods.
Our EaR analysis primarily evaluates the impact of parallel rate shocks across the term structure of benchmark interest rates. Additionally, we perform non-parallel rate shock scenarios to identify potential risks that may not be captured under parallel rate assumptions. In these non-parallel rate scenarios, the most significant effects on EaR typically stem from movements in short-term interest rates.
EaR has inherent limitations in capturing anticipated changes in net interest income in changing interest rate environments, primarily due to timing mismatches in the repricing behavior of assets and liabilities. To address this, we provide measures of “latent” and “emergent” interest rate sensitivity, which compare current-quarter net interest income with projected net interest income for the same quarter one year forward. Unlike EaR, which assesses net interest income variability over a 12-month horizon, latent and emergent sensitivity metrics provide additional insight into near-term earnings dynamics amid changing rate conditions. As previously noted, these measures are intended to illustrate the sensitivity of net interest income and equity value to changes in interest rates across a range of scenarios and should not be interpreted as forecasts of expected net interest income.
Latent interest rate sensitivity captures anticipated changes in net interest income driven by prior interest rate movements that have not yet been fully reflected in current revenue but are expected to materialize in the near term assuming no changes in interest rates and a static balance sheet. Latent sensitivity is projected to increase net interest income by approximately 8.0% in the third quarter of 2026, compared with the third quarter of 2025.
Emergent interest rate sensitivity reflects the projected incremental changes in net interest income resulting from future interest rate movements, measured relative to the latent level of net interest income. Assuming interest rates follow the forward curve as of September 30, 2025, emergent sensitivity is modeled to reduce net interest income by approximately 6.6% from the latent level, yielding a cumulative increase of 1.4% in net interest income in the third quarter of 2026, relative to the third quarter of 2025. Under a parallel interest rate shock of +/- 100 bps to the implied forward rate path, cumulative net interest income sensitivity is projected to range between -1.9% and 4.7%.
Our strategic focus on business banking plays a significant role in our asset-liability management approach. At September 30, 2025, $28.8 billion of commercial and CRE loans were scheduled to reprice within the next six months. To manage the interest rate exposure associated with these variable-rate loans, we had $1.3 billion in notional of receive-fixed swaps designated as cash flow hedges. Additionally, at September 30, 2025, $4.4 billion in variable-rate consumer loans were also scheduled to reprice within the same period. The impact of interest rate floors on asset sensitivity for both commercial and consumer loan portfolios is currently insignificant in the higher interest rate environment. For additional information regarding derivative instruments, see Notes 3 and 7 of the Notes to Consolidated Financial Statements.
Fixed Income
We are subject to market risk arising from fluctuations in the fair value of financial instruments, including trading securities and interest rate swaps used to hedge interest rate exposure. Our underwriting activities include municipal and corporate securities, and we actively trade in municipal, agency, and U.S. Treasury securities. These activities expose us to potential losses resulting from adverse price movements in fixed-income markets.
Changes in the fair value of AFS securities and interest rate swaps that qualify as cash flow hedges are recognized in AOCI each reporting period. For additional information on investment securities and AOCI, refer to the “Capital Management” section on page 39. For more information on the accounting treatment of investment securities, see Note 5 of the Notes to Consolidated Financial Statements.
ZIONS BANCORPORATION, NATIONAL ASSOCIATION AND SUBSIDIARIES
Equity Investments
Through our equity investment activities, we hold both publicly traded equity securities and non-marketable equity securities in governmental entities and institutions, such as the FRB and the FHLB. For more information regarding our equity investments, see “Interest Rate and Market Risk Management” in our 2024 Form 10-K.
We hold investments primarily in pre-public companies, largely through a variety of SBIC funds. This investment strategy is designed to support the financing, growth, and expansion of diverse businesses, generally within our geographic footprint. At September 30, 2025 and December 31, 2024, our equity exposure to these investments totaled approximately $252 million and $204 million, respectively.
From time to time, companies within our SBIC portfolio may complete an IPO, which introduces additional market risk due to post-IPO lock-up restrictions. During the second quarter of 2025, one of our SBIC investments, FatPipe, Inc., successfully completed an IPO. This investment will be marked-to-market until our shares, which are subject to a minimum 180-day lock-up period from the IPO, are fully divested. For more information regarding the valuation of our SBIC investments, see Note 3 of the Notes to Consolidated Financial Statements.
Liquidity Risk Management
Liquidity refers to our ability to meet cash, contractual, and collateral obligations while effectively managing both anticipated and unanticipated cash flow requirements without negatively impacting our operations or financial strength. We manage liquidity to provide funding for customer credit needs, financial and contractual commitments, and other corporate activities. Our primary sources of liquidity include deposits, borrowings, equity, and the repayment or sale of assets such as loans and investment securities. Investment securities are primarily held as a source of contingent liquidity and are generally comprised of instruments that can be readily converted to cash through secured borrowing arrangements, with the securities pledged as collateral. For more information on our liquidity risk management practices, see “Liquidity Risk Management” in our 2024 Form 10-K.
For the first nine months of 2025, the primary sources of cash included a decrease in investment securities, a decrease in money market investments, and net cash provided by operating activities. The primary uses of cash during the same period included a decrease in deposits, an increase in loans and leases, and dividends paid on common and preferred stock. Cash payments for interest, reflected in operating expenses, totaled $1.2 billion and $1.4 billion for the first nine months of 2025 and 2024, respectively.
The FHLB and FRB continue to serve as key sources of contingent liquidity and funding. As a member of the FHLB of Des Moines, we have the ability to borrow against eligible loans and securities to meet liquidity and funding requirements. To maintain our borrowing capacity, we are required to maintain investments in both FHLB and FRB stock. At September 30, 2025, our total investment in FHLB and FRB stock was $145 million and $54 million, respectively, compared with $124 million and $65 million at December 31, 2024.
At September 30, 2025, loans with a carrying value of $25.0 billion and $17.6 billion were pledged at the FHLB and FRB, respectively, as collateral for current and potential borrowings, compared with $23.4 billion and $17.0 billion at December 31, 2024.
At September 30, 2025 and December 31, 2024, investment securities with carrying values of $17.4 billion and $17.9 billion, respectively, were pledged as collateral to support potential borrowings. These pledged securities included $8.5 billion and $8.7 billion, respectively, designated for available use through the Fixed Income Clearing Corporation's General Collateral Finance (“GCF”) program and other repo programs; $4.5 billion and $4.7 billion pledged to the FRB and FHLB; and $4.4 billion and $4.5 billion pledged to secure public and trust deposits, advances, and other collateralized obligations.
A significant portion of these pledged assets are unencumbered, but are pledged to provide immediate access to contingency sources of funds. The following schedule presents our total available liquidity, including unused collateralized borrowing capacity:
ZIONS BANCORPORATION, NATIONAL ASSOCIATION AND SUBSIDIARIES
AVAILABLE LIQUIDITY
|
|
|
|
|
|
|
|
|
|
|
|
|
|
|
|
|
|
|
|
|
|
|
|
|
|
|
|
|
|
|
|
|
|
|
|
|
|
|
|
|
|
|
|
|
|
|
|
|
|
|
|
|
September 30, 2025 |
|
December 31, 2024 |
| (Dollar amounts in billions) |
FHLB |
|
FRB 1 |
|
GCF 2 |
|
|
|
Total |
|
FHLB |
|
FRB 1 |
|
GCF 2 |
|
|
|
Total |
|
|
|
|
|
|
|
|
|
|
|
|
|
|
|
|
|
|
|
|
|
|
|
|
|
|
|
|
|
|
|
|
|
|
|
|
|
|
|
|
|
|
|
|
|
|
|
|
|
|
|
|
|
|
|
|
|
|
|
|
| Total borrowing capacity |
$ |
15.5 |
|
|
$ |
18.1 |
|
|
$ |
8.6 |
|
|
|
|
$ |
42.2 |
|
|
$ |
14.6 |
|
|
$ |
17.7 |
|
|
$ |
8.6 |
|
|
|
|
$ |
40.9 |
|
| Borrowings outstanding |
3.0 |
|
|
— |
|
|
— |
|
|
|
|
3.0 |
|
|
2.6 |
|
|
— |
|
|
0.3 |
|
|
|
|
2.9 |
|
| Remaining capacity, at period end |
$ |
12.5 |
|
|
$ |
18.1 |
|
|
$ |
8.6 |
|
|
|
|
$ |
39.2 |
|
|
$ |
12.0 |
|
|
$ |
17.7 |
|
|
$ |
8.3 |
|
|
|
|
$ |
38.0 |
|
|
|
|
|
|
|
|
|
|
|
|
|
|
|
|
|
|
|
|
|
| Cash and due from banks |
|
|
|
|
|
|
|
$ |
0.8 |
|
|
|
|
|
|
|
|
|
|
$ |
0.7 |
|
Interest-bearing deposits 3 |
|
|
|
|
|
|
|
2.4 |
|
|
|
|
|
|
|
|
|
|
2.9 |
|
| Total available liquidity |
|
|
|
$ |
42.4 |
|
|
|
|
|
|
|
|
|
|
$ |
41.6 |
|
| Ratio of available liquidity to uninsured deposits |
|
|
|
|
|
|
|
|
126% |
|
|
|
|
|
|
|
|
|
121% |
1 Represents borrowing capacity and borrowings outstanding at the Federal Reserve Bank discount window.
2 Includes $852 million and $915 million pledged for available use through other repo programs for the periods presented.
3 Represents funds deposited by the Bank primarily at the Federal Reserve Bank.
At September 30, 2025, our total available liquidity was $42.4 billion, compared with $41.6 billion at December 31, 2024. At September 30, 2025, our sources of liquidity exceeded the estimated amount of uninsured deposits of $33.6 billion without the need to sell any investment securities.
Credit Ratings
General financial market and economic conditions affect our access to, and the cost of, external financing. Our ability to access funding markets is also directly influenced by the credit ratings assigned to us by various rating agencies. These ratings not only impact the costs associated with borrowings, but also influence the sources from which we can borrow. All credit rating agencies currently rate our debt at an investment-grade level.
The following schedule presents our credit ratings:
|
|
|
|
|
|
|
|
|
|
|
|
|
|
|
|
|
|
|
|
|
|
|
|
|
|
|
| CREDIT RATINGS |
|
|
|
|
|
|
| as of October 31, 2025: |
| Rating agency |
|
Outlook |
|
Long-term issuer/senior
debt rating |
|
Subordinated debt rating |
|
Short-term debt rating |
|
|
|
|
|
|
|
|
|
| Kroll |
|
Stable |
|
A- |
|
BBB+ |
|
K2 |
| S&P |
|
Negative |
|
BBB+ |
|
BBB |
|
NR |
| Fitch |
|
Stable |
|
BBB+ |
|
BBB |
|
F2 |
| Moody's |
|
Stable |
|
Baa2 |
|
NR |
|
P2 |
Capital Management
A strong capital position is essential to achieve our key corporate objectives, ensure continued profitability, and foster depositor and investor confidence. We strive to (1) maintain sufficient capital to support the current needs and growth of our businesses, consistent with our assessment of their potential to create value for shareholders, and (2) fulfill our responsibilities to depositors and bondholders while managing capital distributions to shareholders through dividends and common stock repurchases.
We utilize stress testing as an important tool to inform our decisions on the appropriate level of capital to maintain, based on hypothetically stressed economic conditions, including the FRB’s supervisory severely adverse scenario. The timing and amount of capital actions depend on various factors, including our financial performance, business needs, prevailing and anticipated economic conditions, and the results of our internal stress testing, as well as approval from the Board of Directors (“Board”) and the Office of the Comptroller of the Currency (“OCC”). Shares may be repurchased occasionally in the open market or through privately negotiated transactions. For a more comprehensive discussion of our capital risk management, see “Capital Management” in our 2024 Form 10-K.
ZIONS BANCORPORATION, NATIONAL ASSOCIATION AND SUBSIDIARIES
SHAREHOLDERS' EQUITY
|
|
|
|
|
|
|
|
|
|
|
|
|
|
|
|
|
|
|
|
|
|
|
|
| (Dollar amounts in millions) |
September 30,
2025 |
|
December 31,
2024 |
|
Amount change |
|
Percent change |
| Shareholders’ equity: |
|
|
|
|
|
|
|
Preferred stock |
$ |
66 |
|
|
$ |
66 |
|
|
$ |
— |
|
|
— |
% |
Common stock and additional paid-in capital |
1,721 |
|
|
1,737 |
|
|
(16) |
|
|
(1) |
|
Retained earnings |
7,134 |
|
|
6,701 |
|
|
433 |
|
|
6 |
|
| Accumulated other comprehensive loss |
(2,056) |
|
|
(2,380) |
|
|
324 |
|
|
14 |
|
| Total shareholders' equity |
$ |
6,865 |
|
|
$ |
6,124 |
|
|
$ |
741 |
|
|
12 |
|
Total shareholders’ equity increased $741 million, or 12%, to $6.9 billion at September 30, 2025, compared with $6.1 billion at December 31, 2024. Common stock and additional paid-in capital decreased $16 million, primarily due to common stock repurchases. During the first quarter of 2025, we repurchased 0.8 million common shares outstanding for $41 million, which includes common shares acquired through our publicly announced plans and those acquired in connection with our stock compensation plan.
At September 30, 2025, the AOCI balance reflected a net loss of $2.1 billion, primarily attributable to a decline in the fair value of fixed-rate AFS securities driven by changes in interest rates. This amount includes $1.7 billion ($1.2 billion after tax) of unrealized losses associated with securities previously transferred from AFS to held-to-maturity (“HTM”). Compared with December 31, 2024, AOCI improved $324 million, primarily due to $142 million related to paydowns on AFS securities, and $137 million in unrealized loss amortization associated with the securities transferred from AFS to HTM. Additionally, AOCI was impacted by a $45 million decrease in unrealized losses and other adjustments associated with derivative instruments used for risk management purposes. The improvement in AOCI had a positive impact on our tangible book value per common share. We use pay-fixed, receive-floating interest rate swaps designated as hedges of our AFS securities to reduce the volatility of our AOCI balance. For more information about these swaps, see Note 7 of the Notes to Consolidated Financial Statements.
Absent any sales or credit impairment of the AFS securities, the unrealized losses will not be recognized in earnings. We do not intend to sell any securities with unrealized losses. Although changes in AOCI are reflected in shareholders’ equity, they are currently excluded from regulatory capital, and therefore do not impact our regulatory ratios. For more information on our investment securities portfolio and related unrealized gains and losses, see Note 5 of the Notes to Consolidated Financial Statements.
CAPITAL DISTRIBUTIONS
|
|
|
|
|
|
|
|
|
|
|
|
|
|
|
|
|
|
|
|
|
|
|
|
|
|
|
|
|
|
|
Three Months Ended
September 30, |
|
Nine Months Ended
September 30, |
|
|
|
|
|
|
| (In millions, except share amounts) |
2025 |
|
2024 |
|
2025 |
|
2024 |
|
|
|
|
|
|
| Capital distributions: |
|
|
|
|
|
|
|
|
|
|
|
|
|
| Preferred dividends paid |
$ |
1 |
|
$ |
10 |
|
$ |
3 |
|
$ |
31 |
|
|
|
|
|
|
|
|
|
|
|
|
|
|
|
|
|
|
|
|
| Total capital distributed to preferred shareholders |
1 |
|
10 |
|
3 |
|
31 |
|
|
|
|
|
|
| Common dividends paid |
67 |
|
61 |
|
196 |
|
184 |
|
|
|
|
|
|
Bank common stock repurchased 1 |
— |
|
— |
|
41 |
|
35 |
|
|
|
|
|
|
| Total capital distributed to common shareholders |
67 |
|
61 |
|
237 |
|
219 |
|
|
|
|
|
|
| Total capital distributed to preferred and common shareholders |
$ |
68 |
|
$ |
71 |
|
$ |
240 |
|
$ |
250 |
|
|
|
|
|
|
Weighted average diluted common shares outstanding (in thousands) |
147,125 |
|
|
147,150 |
|
|
147,175 |
|
|
147,202 |
|
|
|
|
|
|
|
| Common shares outstanding, at period end (in thousands) |
147,640 |
|
|
147,699 |
|
|
147,640 |
|
|
147,699 |
|
|
|
|
|
|
|
1 Includes amounts related to common shares acquired through our publicly announced plans and those acquired in connection with our stock compensation plan. These shares were acquired from employees to cover their payroll taxes and stock option exercise costs upon the exercise of stock options.
Pursuant to the OCC’s “Earnings Limitation Rule,” dividend payments are limited to the sum of net income for the current fiscal year and retained earnings for the two preceding years, unless prior approval is obtained from the OCC to exceed this threshold.
ZIONS BANCORPORATION, NATIONAL ASSOCIATION AND SUBSIDIARIES
As of October 1, 2025, we had $1.3 billion in retained net profits available for distribution.
During the third quarter of 2025, we paid $1 million in dividends on preferred stock, compared with $10 million during the same prior year period. The decrease was due to the full redemption of the outstanding shares of our Series G, I, and J preferred stock in the fourth quarter of 2024.
During the third quarter of 2025, we paid $67 million in dividends on common stock, or $0.45 per share, compared with $61 million, or $0.41 per share, during the third quarter of 2024. In October 2025, the Board declared a quarterly dividend of $0.45 per common share, payable on November 20, 2025 to shareholders of record at the close of business on November 13, 2025. For additional information about our capital management actions, see Note 9 of the Notes to Consolidated Financial Statements.
Basel III
We are subject to Basel III capital requirements, which include certain minimum regulatory capital ratios. At September 30, 2025, we exceeded all capital adequacy requirements under the Basel III capital rules. Based on our internal stress testing and other assessments of capital adequacy, we believe our capital levels sufficiently exceed both internal and regulatory requirements for well-capitalized banks. For more information about our compliance with the Basel III capital requirements, see “Supervision and Regulation” and Note 15 of our 2024 Form 10-K.
The following schedule presents our capital amounts, capital ratios, and other selected performance ratios:
CAPITAL AMOUNTS AND RATIOS
|
|
|
|
|
|
|
|
|
|
|
|
|
|
|
|
|
|
| (Dollar amounts in millions) |
September 30,
2025 |
|
December 31,
2024 |
|
September 30,
2024 |
Basel III risk-based capital amounts: |
|
|
|
|
|
| Common equity tier 1 capital |
$ |
7,734 |
|
|
$ |
7,363 |
|
|
$ |
7,206 |
|
| Tier 1 risk-based |
7,800 |
|
|
7,430 |
|
|
7,646 |
|
| Total risk-based |
9,404 |
|
|
9,026 |
|
|
8,890 |
|
| Risk-weighted assets |
68,648 |
|
|
67,685 |
|
|
67,305 |
|
| Basel III risk-based capital ratios: |
|
|
|
|
|
| Common equity tier 1 capital ratio |
11.3 |
% |
|
10.9 |
% |
|
10.7 |
% |
| Tier 1 risk-based ratio |
11.4 |
% |
|
11.0 |
% |
|
11.4 |
% |
| Total risk-based ratio |
13.7 |
% |
|
13.3 |
% |
|
13.2 |
% |
| Tier 1 leverage ratio |
8.8 |
% |
|
8.3 |
% |
|
8.6 |
% |
| Other ratios: |
|
|
|
|
|
| Average equity to average assets (three months ended) |
7.5 |
% |
|
7.2 |
% |
|
6.9 |
% |
| Return on average common equity (three months ended) |
13.3 |
% |
|
13.2 |
% |
|
14.1 |
% |
Return on average tangible common equity (three months ended) 1 |
16.0 |
% |
|
16.0 |
% |
|
17.4 |
% |
Tangible equity ratio 1 |
6.6 |
% |
|
5.8 |
% |
|
6.2 |
% |
Tangible common equity ratio 1 |
6.5 |
% |
|
5.7 |
% |
|
5.7 |
% |
1 See “Non-GAAP Financial Measures” on page 41 for more information regarding these ratios.
At September 30, 2025, our common equity tier 1 (“CET1”) capital totaled $7.7 billion, an increase of 7%, compared with $7.2 billion in the prior year period. The CET1 capital ratio improved to 11.3%, compared with 10.7%. Tangible book value per common share increased $5.52, or 17%, to $38.64, mainly due to an increase in retained earnings and reduced unrealized losses in AOCI. See the section below for more information regarding non-GAAP financial measures.
NON-GAAP FINANCIAL MEASURES
This Form 10-Q presents non-GAAP financial measures, in addition to generally accepted accounting principles (“GAAP”) financial measures. The adjustments to reconcile from the applicable GAAP financial measures to the non-GAAP financial measures are presented in the following schedules. We consider these adjustments to be relevant to ongoing operating results and provide a meaningful basis for period-to-period comparisons. We use these non-GAAP financial measures to assess our performance and financial position.
ZIONS BANCORPORATION, NATIONAL ASSOCIATION AND SUBSIDIARIES
We believe that presenting these non-GAAP financial measures allows investors to assess our performance on the same basis as that applied by our management and the financial services industry.
Non-GAAP financial measures have inherent limitations and are not necessarily comparable to similar financial measures that may be presented by other financial services companies. Although non-GAAP financial measures are frequently used by stakeholders to evaluate a company, they have limitations as an analytical tool and should not be considered in isolation or as a substitute for analysis of results reported under GAAP.
Tangible Common Equity and Related Measures
Tangible common equity and related measures are non-GAAP measures that exclude the impact of intangible assets and their related amortization. We believe these non-GAAP measures provide useful information about our use of shareholders’ equity and provide a basis for evaluating the performance of a business more consistently, whether acquired or developed internally.
RETURN ON AVERAGE TANGIBLE COMMON EQUITY (NON-GAAP)
|
|
|
|
|
|
|
|
|
|
|
|
|
|
|
|
|
|
|
|
|
|
|
|
|
Three Months Ended |
| (Dollar amounts in millions) |
|
September 30,
2025 |
|
June 30,
2025 |
|
|
|
September 30,
2024 |
|
|
|
|
|
|
|
|
|
Net earnings applicable to common shareholders (GAAP) |
|
$ |
221 |
|
|
$ |
243 |
|
|
|
|
$ |
204 |
|
| Adjustment, net of tax: |
|
|
|
|
|
|
|
|
| Amortization of core deposit and other intangibles |
|
2 |
|
|
2 |
|
|
|
|
1 |
|
Net earnings applicable to common shareholders, net of tax |
(a) |
$ |
223 |
|
|
$ |
245 |
|
|
|
|
$ |
205 |
|
| Average common equity (GAAP) |
|
$ |
6,616 |
|
|
$ |
6,357 |
|
|
|
|
$ |
5,738 |
|
| Average goodwill and intangibles |
|
(1,095) |
|
|
(1,097) |
|
|
|
|
(1,054) |
|
|
|
|
|
|
|
|
|
|
| Average tangible common equity (non-GAAP) |
(b) |
$ |
5,521 |
|
|
$ |
5,260 |
|
|
|
|
$ |
4,684 |
|
| Number of days in quarter |
(c) |
92 |
|
|
91 |
|
|
|
|
92 |
|
| Number of days in year |
(d) |
365 |
|
|
365 |
|
|
|
|
366 |
|
Return on average tangible common equity (non-GAAP) 1 |
(a/b/c)*d |
16.0 |
% |
|
18.7 |
% |
|
|
|
17.4 |
% |
1 Excluding the effect of AOCI from average tangible common equity would result in associated returns of 11.5%, 13.1%, and 11.4% for the periods presented, respectively.
TANGIBLE EQUITY RATIO, TANGIBLE COMMON EQUITY RATIO, AND TANGIBLE BOOK VALUE PER COMMON SHARE (ALL NON-GAAP MEASURES)
|
|
|
|
|
|
|
|
|
|
|
|
|
|
|
|
|
|
|
|
|
|
|
| (Dollar amounts in millions, except shares and per share amounts) |
|
September 30,
2025 |
|
June 30,
2025 |
|
|
|
September 30,
2024 |
|
|
|
|
|
|
|
|
|
| Total shareholders’ equity (GAAP) |
|
$ |
6,865 |
|
|
$ |
6,596 |
|
|
|
|
$ |
6,385 |
|
| Goodwill and intangibles |
|
(1,094) |
|
|
(1,096) |
|
|
|
|
(1,053) |
|
|
|
|
|
|
|
|
|
|
| Tangible equity (non-GAAP) |
(a) |
5,771 |
|
|
5,500 |
|
|
|
|
5,332 |
|
| Preferred stock |
|
(66) |
|
|
(66) |
|
|
|
|
(440) |
|
| Tangible common equity (non-GAAP) |
(b) |
$ |
5,705 |
|
|
$ |
5,434 |
|
|
|
|
$ |
4,892 |
|
| Total assets (GAAP) |
|
$ |
88,533 |
|
|
$ |
88,893 |
|
|
|
|
$ |
87,032 |
|
| Goodwill and intangibles |
|
(1,094) |
|
|
(1,096) |
|
|
|
|
(1,053) |
|
|
|
|
|
|
|
|
|
|
| Tangible assets (non-GAAP) |
(c) |
$ |
87,439 |
|
|
$ |
87,797 |
|
|
|
|
$ |
85,979 |
|
| Common shares outstanding (in thousands) |
(d) |
147,640 |
|
|
147,603 |
|
|
|
|
147,699 |
|
| Tangible equity ratio (non-GAAP) |
(a/c) |
6.6 |
% |
|
6.3 |
% |
|
|
|
6.2 |
% |
| Tangible common equity ratio (non-GAAP) |
(b/c) |
6.5 |
% |
|
6.2 |
% |
|
|
|
5.7 |
% |
| Tangible book value per common share (non-GAAP) |
(b/d) |
$ |
38.64 |
|
|
$ |
36.81 |
|
|
|
|
$ |
33.12 |
|
ZIONS BANCORPORATION, NATIONAL ASSOCIATION AND SUBSIDIARIES
Efficiency Ratio and Adjusted Pre-Provision Net Revenue
The efficiency ratio is a measure of operating expense relative to revenue. We believe the efficiency ratio provides useful information regarding the cost of generating revenue. We make adjustments to exclude certain items that are not generally expected to recur frequently, as identified in the subsequent schedule. We believe these adjustments allow for more consistent comparability across periods. Adjusted noninterest expense provides a measure as to how we are managing our expenses. Adjusted pre-provision net revenue enables management and others to assess our ability to generate capital. Taxable-equivalent net interest income allows us to assess the comparability of revenue arising from both taxable and tax-exempt sources.
EFFICIENCY RATIO (NON-GAAP) AND ADJUSTED PRE-PROVISION NET REVENUE (NON-GAAP)
|
|
|
|
|
|
|
|
|
|
|
|
|
|
|
|
|
|
|
|
|
|
|
|
|
|
|
|
|
|
|
|
|
|
|
|
|
|
|
|
|
Three Months Ended |
|
Nine Months Ended |
|
Year Ended |
| (Dollar amounts in millions) |
|
September 30,
2025 |
|
June 30,
2025 |
|
September 30,
2024 |
|
September 30,
2025 |
|
September 30,
2024 |
|
December 31,
2024 |
|
|
|
|
|
|
|
|
|
|
|
|
|
| Noninterest expense (GAAP) |
(a) |
$ |
527 |
|
|
$ |
527 |
|
|
$ |
502 |
|
|
$ |
1,592 |
|
|
$ |
1,537 |
|
|
$ |
2,046 |
|
| Adjustments: |
|
|
|
|
|
|
|
|
|
|
|
|
Severance costs |
|
6 |
|
|
2 |
|
|
1 |
|
|
11 |
|
|
2 |
|
|
3 |
|
Other real estate expense, net |
|
— |
|
|
— |
|
|
— |
|
|
— |
|
|
(1) |
|
|
(1) |
|
Amortization of core deposit and other intangibles |
|
2 |
|
|
2 |
|
|
2 |
|
|
6 |
|
|
5 |
|
|
7 |
|
|
|
|
|
|
|
|
|
|
|
|
|
|
| SBIC investment success fee accrual |
|
1 |
|
|
2 |
|
|
— |
|
|
3 |
|
|
1 |
|
|
1 |
|
| FDIC special assessment |
|
(2) |
|
|
— |
|
|
— |
|
|
(2) |
|
|
14 |
|
|
11 |
|
Total adjustments |
(b) |
7 |
|
|
6 |
|
|
3 |
|
|
18 |
|
|
21 |
|
|
21 |
|
Adjusted noninterest expense (non-GAAP) |
(c)=(a-b) |
$ |
520 |
|
|
$ |
521 |
|
|
$ |
499 |
|
|
$ |
1,574 |
|
|
$ |
1,516 |
|
|
$ |
2,025 |
|
| Net interest income (GAAP) |
(d) |
$ |
672 |
|
|
$ |
648 |
|
|
$ |
620 |
|
|
$ |
1,944 |
|
|
$ |
1,803 |
|
|
$ |
2,430 |
|
Fully taxable-equivalent adjustments |
(e) |
11 |
|
|
13 |
|
|
12 |
|
|
35 |
|
|
33 |
|
|
45 |
|
Taxable-equivalent net interest income (non-GAAP) |
(f)=(d+e) |
683 |
|
|
661 |
|
|
632 |
|
|
1,979 |
|
|
1,836 |
|
|
2,475 |
|
| Customer-related noninterest income (non-GAAP) |
(g) |
163 |
|
|
164 |
|
|
158 |
|
|
485 |
|
|
463 |
|
|
639 |
|
Net credit valuation adjustment (CVA) 1 |
(h) |
(11) |
|
|
— |
|
|
(3) |
|
|
(11) |
|
|
(3) |
|
|
— |
|
Adjusted customer-related noninterest income (non-GAAP) |
(i)=(g-h) |
174 |
|
|
164 |
|
|
161 |
|
|
496 |
|
|
466 |
|
|
639 |
|
Noncustomer-related noninterest income (GAAP) |
(j) |
26 |
|
|
26 |
|
|
14 |
|
|
65 |
|
|
44 |
|
|
61 |
|
Securities gains (losses), net |
(k) |
11 |
|
|
14 |
|
|
9 |
|
|
31 |
|
|
11 |
|
|
19 |
|
Adjusted noncustomer-related noninterest income (non-GAAP) |
(l)=(j-k) |
15 |
|
|
12 |
|
|
5 |
|
|
34 |
|
|
33 |
|
|
42 |
|
| Combined income (non-GAAP) |
(m)=
(f+g+j) |
$ |
872 |
|
|
$ |
851 |
|
|
$ |
804 |
|
|
$ |
2,529 |
|
|
$ |
2,343 |
|
|
$ |
3,175 |
|
Adjusted taxable-equivalent revenue (non-GAAP) |
(n)=
(f+i+l) |
872 |
|
|
837 |
|
|
798 |
|
|
2,509 |
|
|
2,335 |
|
|
3,156 |
|
Pre-provision net revenue (non-GAAP) |
(m)-(a) |
$ |
345 |
|
|
$ |
324 |
|
|
$ |
302 |
|
|
$ |
937 |
|
|
$ |
806 |
|
|
$ |
1,129 |
|
| Adjusted PPNR (non-GAAP) |
(n)-(c) |
352 |
|
|
316 |
|
|
299 |
|
|
935 |
|
|
819 |
|
|
1,131 |
|
| Efficiency ratio (non-GAAP) |
(c/n) |
59.6 |
% |
|
62.2 |
% |
|
62.5 |
% |
|
62.7 |
% |
|
64.9 |
% |
|
64.2 |
% |
1 Effective the first quarter of 2025, capital markets fees and income included the net CVA, which was previously disclosed under noncustomer-related noninterest income as fair value and nonhedge derivative income.
ZIONS BANCORPORATION, NATIONAL ASSOCIATION AND SUBSIDIARIES
ITEM 1. FINANCIAL STATEMENTS (Unaudited)
CONSOLIDATED BALANCE SHEETS
|
|
|
|
|
|
|
|
|
|
|
|
| (In millions, shares in thousands) |
September 30,
2025 |
|
December 31,
2024 |
| (Unaudited) |
|
|
| ASSETS |
|
|
|
| Cash and due from banks |
$ |
771 |
|
|
$ |
651 |
|
| Money market investments: |
|
|
|
| Interest-bearing deposits |
2,395 |
|
|
2,850 |
|
| Federal funds sold and securities purchased under agreements to resell |
1,008 |
|
|
1,453 |
|
| Trading securities, at fair value |
134 |
|
|
35 |
|
| Investment securities: |
|
|
|
| Available-for-sale, at fair value |
9,170 |
|
|
9,095 |
|
Held-to-maturity, at amortized cost (fair value: $9,106 and $9,382) |
9,059 |
|
|
9,669 |
|
|
|
|
|
| Total investment securities |
18,229 |
|
|
18,764 |
|
Loans held for sale (includes $126 and $25 of loans carried at fair value) |
215 |
|
|
74 |
|
| Loans and leases, net of unearned income and fees |
60,302 |
|
|
59,410 |
|
| Allowance for loan and lease losses |
679 |
|
|
696 |
|
| Loans held for investment, net of allowance |
59,623 |
|
|
58,714 |
|
| Other noninterest-bearing investments |
1,098 |
|
|
1,020 |
|
| Premises, equipment and software, net |
1,358 |
|
|
1,366 |
|
| Goodwill and intangibles |
1,094 |
|
|
1,052 |
|
| Other real estate owned |
5 |
|
|
1 |
|
| Other assets |
2,603 |
|
|
2,795 |
|
| Total assets |
$ |
88,533 |
|
|
$ |
88,775 |
|
| LIABILITIES AND SHAREHOLDERS’ EQUITY |
|
|
|
| Deposits: |
|
|
|
| Noninterest-bearing demand |
$ |
26,133 |
|
|
$ |
24,704 |
|
| Interest-bearing: |
|
|
|
| Savings and money market |
38,689 |
|
|
40,037 |
|
| Time |
10,056 |
|
|
11,482 |
|
|
|
|
|
| Total deposits |
74,878 |
|
|
76,223 |
|
| Federal funds and other short-term borrowings |
3,757 |
|
|
3,832 |
|
| Long-term debt |
1,473 |
|
|
950 |
|
| Reserve for unfunded lending commitments |
46 |
|
|
45 |
|
| Other liabilities |
1,514 |
|
|
1,601 |
|
| Total liabilities |
81,668 |
|
|
82,651 |
|
| Shareholders’ equity: |
|
|
|
Preferred stock, without par value; authorized 4,400 shares |
66 |
|
|
66 |
|
Common stock ($0.001 par value; authorized 350,000 shares; issued and outstanding 147,640 and 147,871 shares) and additional paid-in capital |
1,721 |
|
|
1,737 |
|
| Retained earnings |
7,134 |
|
|
6,701 |
|
| Accumulated other comprehensive income (loss) |
(2,056) |
|
|
(2,380) |
|
|
|
|
|
|
|
|
|
| Total shareholders’ equity |
6,865 |
|
|
6,124 |
|
| Total liabilities and shareholders’ equity |
$ |
88,533 |
|
|
$ |
88,775 |
|
See accompanying notes to consolidated financial statements.
ZIONS BANCORPORATION, NATIONAL ASSOCIATION AND SUBSIDIARIES
CONSOLIDATED STATEMENTS OF INCOME
|
|
|
|
|
|
|
|
|
|
|
|
|
|
|
|
|
|
|
|
|
|
|
|
| (Unaudited) |
Three Months Ended
September 30, |
|
Nine Months Ended
September 30, |
| (In millions, except shares and per share amounts) |
2025 |
|
2024 |
|
2025 |
|
2024 |
| Interest income: |
|
|
|
|
|
|
|
| Interest and fees on loans |
$ |
898 |
|
|
$ |
899 |
|
|
$ |
2,623 |
|
|
$ |
2,641 |
|
| Interest on money market investments |
41 |
|
|
67 |
|
|
144 |
|
|
170 |
|
| Interest on securities |
125 |
|
|
138 |
|
|
376 |
|
|
420 |
|
| Total interest income |
1,064 |
|
|
1,104 |
|
|
3,143 |
|
|
3,231 |
|
| Interest expense: |
|
|
|
|
|
|
|
| Interest on deposits |
313 |
|
|
403 |
|
|
951 |
|
|
1,169 |
|
| Interest on short- and long-term borrowings |
79 |
|
|
81 |
|
|
248 |
|
|
259 |
|
| Total interest expense |
392 |
|
|
484 |
|
|
1,199 |
|
|
1,428 |
|
| Net interest income |
672 |
|
|
620 |
|
|
1,944 |
|
|
1,803 |
|
| Provision for credit losses: |
|
|
|
|
|
|
|
| Provision for loan and lease losses |
45 |
|
|
1 |
|
|
65 |
|
|
34 |
|
| Provision for unfunded lending commitments |
4 |
|
|
12 |
|
|
1 |
|
|
(3) |
|
|
|
|
|
|
|
|
|
| Total provision for credit losses |
49 |
|
|
13 |
|
|
66 |
|
|
31 |
|
| Net interest income after provision for credit losses |
623 |
|
|
607 |
|
|
1,878 |
|
|
1,772 |
|
| Noninterest income: |
|
|
|
|
|
|
|
| Commercial account fees |
47 |
|
|
46 |
|
|
138 |
|
|
135 |
|
| Card fees |
24 |
|
|
24 |
|
|
71 |
|
|
72 |
|
| Retail and business banking fees |
19 |
|
|
18 |
|
|
55 |
|
|
50 |
|
| Loan-related fees and income |
20 |
|
|
17 |
|
|
56 |
|
|
50 |
|
| Capital markets fees and income |
24 |
|
|
25 |
|
|
79 |
|
|
70 |
|
| Wealth management fees |
14 |
|
|
14 |
|
|
43 |
|
|
44 |
|
| Other customer-related fees |
15 |
|
|
14 |
|
|
43 |
|
|
42 |
|
| Customer-related noninterest income |
163 |
|
|
158 |
|
|
485 |
|
|
463 |
|
| Dividends and other income |
15 |
|
|
5 |
|
|
34 |
|
|
33 |
|
| Securities gains (losses), net |
11 |
|
|
9 |
|
|
31 |
|
|
11 |
|
| Total noninterest income |
189 |
|
|
172 |
|
|
550 |
|
|
507 |
|
| Noninterest expense: |
|
|
|
|
|
|
|
| Salaries and employee benefits |
337 |
|
|
317 |
|
|
1,015 |
|
|
966 |
|
| Technology, telecom, and information processing |
70 |
|
|
66 |
|
|
205 |
|
|
194 |
|
| Occupancy and equipment, net |
42 |
|
|
40 |
|
|
123 |
|
|
119 |
|
| Professional and legal services |
14 |
|
|
14 |
|
|
40 |
|
|
47 |
|
| Marketing and business development |
11 |
|
|
12 |
|
|
34 |
|
|
35 |
|
| Deposit insurance and regulatory expense |
16 |
|
|
19 |
|
|
58 |
|
|
74 |
|
| Credit-related expense |
6 |
|
|
6 |
|
|
18 |
|
|
19 |
|
| Other real estate expense, net |
— |
|
|
— |
|
|
— |
|
|
(1) |
|
| Other |
31 |
|
|
28 |
|
|
99 |
|
|
84 |
|
| Total noninterest expense |
527 |
|
|
502 |
|
|
1,592 |
|
|
1,537 |
|
| Income before income taxes |
285 |
|
|
277 |
|
|
836 |
|
|
742 |
|
| Income taxes |
63 |
|
|
63 |
|
|
200 |
|
|
174 |
|
| Net income |
222 |
|
|
214 |
|
|
636 |
|
|
568 |
|
|
|
|
|
|
|
|
|
|
|
|
|
|
|
|
|
| Preferred stock dividends |
(1) |
|
|
(10) |
|
|
(3) |
|
|
(31) |
|
|
|
|
|
|
|
|
|
| Net earnings applicable to common shareholders |
$ |
221 |
|
|
$ |
204 |
|
|
$ |
633 |
|
|
$ |
537 |
|
| Weighted average common shares outstanding during the period: |
|
|
|
|
|
|
|
| Basic shares (in thousands) |
147,045 |
|
|
147,138 |
|
|
147,136 |
|
|
147,197 |
|
| Diluted shares (in thousands) |
147,125 |
|
|
147,150 |
|
|
147,175 |
|
|
147,202 |
|
| Net earnings per common share: |
|
|
|
|
|
|
|
| Basic |
$ |
1.48 |
|
|
$ |
1.37 |
|
|
$ |
4.25 |
|
|
$ |
3.61 |
|
| Diluted |
1.48 |
|
|
1.37 |
|
|
4.25 |
|
|
3.61 |
|
See accompanying notes to consolidated financial statements.
ZIONS BANCORPORATION, NATIONAL ASSOCIATION AND SUBSIDIARIES
CONSOLIDATED STATEMENTS OF COMPREHENSIVE INCOME
(Unaudited)
|
|
|
|
|
|
|
|
|
|
|
|
|
|
|
|
|
|
|
|
|
|
|
|
|
Three Months Ended
September 30, |
|
Nine Months Ended
September 30, |
| (In millions) |
2025 |
|
2024 |
|
2025 |
|
2024 |
|
|
|
|
|
|
|
|
| Net income for the period |
$ |
222 |
|
|
$ |
214 |
|
|
$ |
636 |
|
|
$ |
568 |
|
| Other comprehensive income, net of tax: |
|
|
|
|
|
|
|
| Net change in unrealized gains on investment securities |
50 |
|
|
139 |
|
|
142 |
|
|
137 |
|
| Unrealized loss amortization associated with the securities transferred from AFS to HTM |
47 |
|
|
51 |
|
|
137 |
|
|
147 |
|
| Net change in cash flow hedge derivatives |
11 |
|
|
23 |
|
|
45 |
|
|
71 |
|
| Net change in other |
— |
|
|
— |
|
|
— |
|
|
1 |
|
| Other comprehensive income, net of tax |
108 |
|
|
213 |
|
|
324 |
|
|
356 |
|
| Comprehensive income |
$ |
330 |
|
|
$ |
427 |
|
|
$ |
960 |
|
|
$ |
924 |
|
See accompanying notes to consolidated financial statements.
CONSOLIDATED STATEMENTS OF CHANGES IN SHAREHOLDERS’ EQUITY
(Unaudited)
|
|
|
|
|
|
|
|
|
|
|
|
|
|
|
|
|
|
|
|
|
|
|
|
|
|
|
|
|
|
|
|
|
|
|
|
(In millions, except shares
and per share amounts) |
Preferred
stock |
|
Common stock shares
(in thousands)
|
|
Accumulated paid-in capital |
|
Retained earnings |
|
Accumulated other
comprehensive income (loss) |
|
Total
shareholders’ equity |
|
|
|
|
|
|
|
|
|
|
|
|
|
|
|
|
| Balance at June 30, 2025 |
$ |
66 |
|
|
147,603 |
|
|
$ |
1,713 |
|
|
$ |
6,981 |
|
|
$ |
(2,164) |
|
|
$ |
6,596 |
|
| Net income for the period |
— |
|
|
— |
|
|
— |
|
|
222 |
|
|
— |
|
|
222 |
|
Other comprehensive income, net of tax |
— |
|
|
— |
|
|
— |
|
|
— |
|
|
108 |
|
|
108 |
|
Bank common stock repurchased |
— |
|
|
(2) |
|
|
— |
|
|
— |
|
|
— |
|
|
— |
|
Net activity under employee plans and related tax benefits |
— |
|
|
39 |
|
|
8 |
|
|
— |
|
|
— |
|
|
8 |
|
| Dividends on preferred stock |
— |
|
|
— |
|
|
— |
|
|
(1) |
|
|
— |
|
|
(1) |
|
Dividends on common stock, $0.45 per share |
— |
|
|
— |
|
|
— |
|
|
(67) |
|
|
— |
|
|
(67) |
|
| Change in deferred compensation |
— |
|
|
— |
|
|
— |
|
|
(1) |
|
|
— |
|
|
(1) |
|
| Balance at September 30, 2025 |
$ |
66 |
|
|
147,640 |
|
|
$ |
1,721 |
|
|
$ |
7,134 |
|
|
$ |
(2,056) |
|
|
$ |
6,865 |
|
|
|
|
|
|
|
|
|
|
|
|
|
| Balance at June 30, 2024 |
$ |
440 |
|
|
147,684 |
|
|
$ |
1,713 |
|
|
$ |
6,421 |
|
|
$ |
(2,549) |
|
|
$ |
6,025 |
|
| Net income for the period |
— |
|
|
— |
|
|
— |
|
|
214 |
|
|
— |
|
|
214 |
|
Other comprehensive income, net of tax |
— |
|
|
— |
|
|
— |
|
|
— |
|
|
213 |
|
|
213 |
|
|
|
|
|
|
|
|
|
|
|
|
|
Bank common stock repurchased |
— |
|
|
(3) |
|
|
— |
|
|
— |
|
|
— |
|
|
— |
|
Net activity under employee plans and related tax benefits |
— |
|
|
18 |
|
|
4 |
|
|
— |
|
|
— |
|
|
4 |
|
| Dividends on preferred stock |
— |
|
|
— |
|
|
— |
|
|
(10) |
|
|
— |
|
|
(10) |
|
Dividends on common stock, $0.41 per share |
— |
|
|
— |
|
|
— |
|
|
(61) |
|
|
— |
|
|
(61) |
|
|
|
|
|
|
|
|
|
|
|
|
|
| Balance at September 30, 2024 |
$ |
440 |
|
|
147,699 |
|
|
$ |
1,717 |
|
|
$ |
6,564 |
|
|
$ |
(2,336) |
|
|
$ |
6,385 |
|
ZIONS BANCORPORATION, NATIONAL ASSOCIATION AND SUBSIDIARIES
|
|
|
|
|
|
|
|
|
|
|
|
|
|
|
|
|
|
|
|
|
|
|
|
|
|
|
|
|
|
|
|
|
|
|
|
(In millions, except shares
and per share amounts) |
Preferred
stock |
|
Common stock shares
(in thousands)
|
|
Accumulated paid-in capital |
|
Retained earnings |
|
Accumulated other
comprehensive income (loss) |
|
Total
shareholders’ equity |
|
|
|
|
|
|
|
|
|
|
|
|
|
|
|
|
| Balance at December 31, 2024 |
$ |
66 |
|
|
147,871 |
|
|
$ |
1,737 |
|
|
$ |
6,701 |
|
|
$ |
(2,380) |
|
|
$ |
6,124 |
|
| Net income for the period |
— |
|
|
— |
|
|
— |
|
|
636 |
|
|
— |
|
|
636 |
|
Other comprehensive income, net of tax |
— |
|
|
— |
|
|
— |
|
|
— |
|
|
324 |
|
|
324 |
|
|
|
|
|
|
|
|
|
|
|
|
|
Bank common stock repurchased |
— |
|
|
(773) |
|
|
(41) |
|
|
— |
|
|
— |
|
|
(41) |
|
Net activity under employee plans and related tax benefits |
— |
|
|
542 |
|
25 |
|
|
— |
|
|
— |
|
|
25 |
|
| Dividends on preferred stock |
— |
|
|
— |
|
|
— |
|
|
(3) |
|
|
— |
|
|
(3) |
|
Dividends on common stock, $1.31 per share |
— |
|
|
— |
|
|
— |
|
|
(196) |
|
|
— |
|
|
(196) |
|
| Change in deferred compensation |
— |
|
|
— |
|
|
— |
|
|
(4) |
|
|
— |
|
|
(4) |
|
| Balance at September 30, 2025 |
$ |
66 |
|
|
147,640 |
|
|
$ |
1,721 |
|
|
$ |
7,134 |
|
|
$ |
(2,056) |
|
|
$ |
6,865 |
|
|
|
|
|
|
|
|
|
|
|
|
|
| Balance at December 31, 2023 |
$ |
440 |
|
|
148,153 |
|
|
$ |
1,731 |
|
|
$ |
6,212 |
|
|
$ |
(2,692) |
|
|
$ |
5,691 |
|
| Net income for the period |
— |
|
|
— |
|
|
— |
|
|
568 |
|
|
— |
|
|
568 |
|
Other comprehensive income, net of tax |
— |
|
|
— |
|
|
— |
|
|
— |
|
|
356 |
|
|
356 |
|
|
|
|
|
|
|
|
|
|
|
|
|
Bank common stock repurchased |
— |
|
|
(893) |
|
|
(35) |
|
|
— |
|
|
— |
|
|
(35) |
|
Net activity under employee plans and related tax benefits |
— |
|
|
439 |
|
|
21 |
|
|
— |
|
|
— |
|
|
21 |
|
| Dividends on preferred stock |
— |
|
|
— |
|
|
— |
|
|
(31) |
|
|
— |
|
|
(31) |
|
Dividends on common stock, $1.23 per share |
— |
|
|
— |
|
|
— |
|
|
(184) |
|
|
— |
|
|
(184) |
|
| Change in deferred compensation |
— |
|
|
— |
|
|
— |
|
|
(1) |
|
|
— |
|
|
(1) |
|
| Balance at September 30, 2024 |
$ |
440 |
|
|
147,699 |
|
|
$ |
1,717 |
|
|
$ |
6,564 |
|
|
$ |
(2,336) |
|
|
$ |
6,385 |
|
See accompanying notes to consolidated financial statements.
ZIONS BANCORPORATION, NATIONAL ASSOCIATION AND SUBSIDIARIES
CONSOLIDATED STATEMENTS OF CASH FLOWS
(Unaudited)
|
|
|
|
|
|
|
|
|
|
|
|
|
|
|
| (In millions) |
|
Nine Months Ended
September 30, |
|
|
|
2025 |
|
2024 |
| CASH FLOWS FROM OPERATING ACTIVITIES |
|
|
|
|
|
|
| Net income for the period |
|
|
|
$ |
636 |
|
|
$ |
568 |
|
Adjustments to reconcile net income to net cash provided by operating activities: |
|
|
|
|
|
|
|
|
|
|
|
|
|
Provision for credit losses |
|
|
|
66 |
|
|
31 |
|
Depreciation and amortization |
|
|
|
87 |
|
|
95 |
|
Share-based compensation |
|
|
|
29 |
|
|
28 |
|
Deferred income tax expense |
|
|
|
40 |
|
|
3 |
|
Net increase in trading securities |
|
|
|
(99) |
|
|
(20) |
|
Net decrease (increase) in loans held for sale |
|
|
|
(79) |
|
|
2 |
|
Change in other liabilities |
|
|
|
(114) |
|
|
(188) |
|
Change in other assets |
|
|
|
46 |
|
|
136 |
|
Other, net |
|
|
|
(57) |
|
|
(24) |
|
| Net cash provided by operating activities |
|
|
|
555 |
|
|
631 |
|
| CASH FLOWS FROM INVESTING ACTIVITIES |
|
|
|
|
|
|
| Net decrease in money market investments |
|
|
|
900 |
|
|
186 |
|
| Proceeds from maturities and paydowns of investment securities held-to-maturity |
|
|
|
814 |
|
|
776 |
|
| Purchases of investment securities held-to-maturity |
|
|
|
(27) |
|
|
(62) |
|
| Proceeds from sales, maturities, and paydowns of investment securities available-for-sale |
|
|
|
1,279 |
|
|
1,527 |
|
| Purchases of investment securities available-for-sale |
|
|
|
(1,082) |
|
|
(528) |
|
| Net change in loans and leases |
|
|
|
(555) |
|
|
(1,130) |
|
| Purchases and sales of other noninterest-bearing investments |
|
|
|
(36) |
|
|
21 |
|
| Purchases of premises and equipment |
|
|
|
(83) |
|
|
(69) |
|
| Acquisition of California branches, net of cash acquired |
|
|
|
191 |
|
|
— |
|
Other, net |
|
|
|
(12) |
|
|
5 |
|
| Net cash provided by investing activities |
|
|
|
1,389 |
|
|
726 |
|
| CASH FLOWS FROM FINANCING ACTIVITIES |
|
|
|
|
|
|
| Net increase (decrease) in deposits |
|
|
|
(2,003) |
|
|
757 |
|
| Net change in short-term borrowed funds |
|
|
|
(75) |
|
|
(1,460) |
|
|
|
|
|
|
|
|
|
|
|
|
|
|
|
|
|
|
|
|
|
|
| Proceeds from the issuance of long-term debt |
|
|
|
498 |
|
|
— |
|
|
|
|
|
|
|
|
|
|
|
|
|
|
|
| Proceeds from the issuance of common stock |
|
|
|
6 |
|
|
1 |
|
| Dividends paid on common and preferred stock |
|
|
|
(199) |
|
|
(215) |
|
| Bank common stock repurchased |
|
|
|
(41) |
|
|
(35) |
|
| Other, net |
|
|
|
(10) |
|
|
(7) |
|
| Net cash used in financing activities |
|
|
|
(1,824) |
|
|
(959) |
|
| Net increase in cash and due from banks |
|
|
|
120 |
|
|
398 |
|
| Cash and due from banks at beginning of period |
|
|
|
651 |
|
|
716 |
|
| Cash and due from banks at end of period |
|
|
|
$ |
771 |
|
|
$ |
1,114 |
|
| Cash paid for interest |
|
|
|
$ |
1,202 |
|
|
$ |
1,423 |
|
| Net cash paid for income taxes |
|
|
|
173 |
|
|
131 |
|
Noncash activities: |
|
|
|
|
|
|
|
|
|
|
|
|
|
| Loans held for investment reclassified to loans held for sale, net |
|
|
|
106 |
|
|
144 |
|
| Deposits acquired in purchase of California branches (at time of purchase) |
|
|
|
657 |
|
|
— |
|
| Loans acquired in purchase of California branches, net (at time of purchase) |
|
|
|
423 |
|
|
— |
|
See accompanying notes to consolidated financial statements.
ZIONS BANCORPORATION, NATIONAL ASSOCIATION AND SUBSIDIARIES
NOTES TO CONSOLIDATED FINANCIAL STATEMENTS
(Unaudited)
September 30, 2025
1. BASIS OF PRESENTATION
Zions Bancorporation, National Association (“Zions Bancorporation, N.A.,” “the Bank,” “we,” “our,” “us”) is a bank headquartered in Salt Lake City, Utah. We provide a wide range of banking products and related services in 11 Western and Southwestern states through seven separately managed affiliates: Zions Bank in Utah, Idaho, and Wyoming; California Bank & Trust (“CB&T”); Amegy Bank (“Amegy”) in Texas; National Bank of Arizona (“NBAZ”); Nevada State Bank (“NSB”); Vectra Bank Colorado (“Vectra”) in Colorado and New Mexico; and The Commerce Bank of Washington (“TCBW”), which operates under that name in Washington and under The Commerce Bank of Oregon in Oregon.
The consolidated financial statements include our accounts and those of our majority-owned, consolidated subsidiaries. This also includes our wholly-owned subsidiaries, such as ZMFU II, Inc., which is utilized for our municipal lending business, and Zions Direct, Inc., a registered broker-dealer under the Exchange Act, among other subsidiaries.
Investments in which we have the ability to exercise significant influence over the operating and financial policies of the investee are accounted for using the equity method. All intercompany accounts and transactions have been eliminated in consolidation. Assets held in an agency or fiduciary capacity are excluded from the consolidated financial statements.
The accompanying unaudited consolidated financial statements of Zions Bancorporation, N.A., and its majority-owned subsidiaries have been prepared in accordance with United States (“U.S.”) generally accepted accounting principles (“GAAP”) for interim financial information and with the instructions to Form 10-Q and Article 10 of Regulation S-X. Accordingly, they do not include all of the information and footnotes required by GAAP for complete financial statements. In the opinion of management, all normal and recurring adjustments considered necessary for a fair presentation have been included. References to GAAP, including standards promulgated by the Financial Accounting Standards Board (“FASB”), are made according to sections of the Accounting Standards Codification.
The results of operations for the three and nine months ended September 30, 2025 and 2024 are not necessarily indicative of the results that may be expected in future periods. In preparing the consolidated financial statements, we are required to make estimates and assumptions that affect the amounts reported in the consolidated financial statements and accompanying Notes. Actual results could differ from those estimates. For further information, refer to the consolidated financial statements and accompanying Notes included in our 2024 Form 10-K.
We evaluated events that occurred between September 30, 2025 and the date the consolidated financial statements were issued, and determined that there were no material events requiring adjustments to our consolidated financial statements or significant disclosure in the accompanying Notes.
ZIONS BANCORPORATION, NATIONAL ASSOCIATION AND SUBSIDIARIES
2. RECENT ACCOUNTING PRONOUNCEMENTS
|
|
|
|
|
|
|
|
|
|
|
|
|
|
|
|
|
|
|
|
|
Standard |
|
Description |
|
Effective date |
|
Effect on the financial statements or other significant matters |
|
|
|
|
|
|
|
Standards not yet adopted by the Bank as of September 30, 2025 |
|
|
|
|
|
|
|
|
ASU 2024-03,
Income Statement—Reporting Comprehensive Income—Expense Disaggregation Disclosures (Subtopic 220-40)
|
|
This accounting standards update (“ASU”) requires additional disclosures of certain costs and expenses in both interim and annual reporting periods, including:
•Amounts of employee compensation, depreciation, and intangible asset amortization included in certain expense lines presented on the face of the income statement within continuing operations.
•A qualitative description of the amounts remaining in relevant expense captions that are not separately disaggregated quantitatively.
•The Bank's definition and amount of selling costs.
|
|
Annual periods beginning January 1, 2027; Interim periods beginning January 1, 2028 |
|
The overall effect of this standard is not expected to have a material impact on our consolidated financial statements. |
|
ASU 2025-06, Intangibles—Goodwill and Other—Internal-Use Software
(Subtopic 350-40)
|
|
This ASU modernizes the accounting treatment for internal-use software to better reflect current development practices, including agile and iterative approaches. Key provisions include:
•Elimination of Prescriptive Project Stages: The guidance no longer requires classification of costs by development phase, thereby removing rigid stage-based criteria.
•Capitalization Criteria: Capitalization of eligible software development costs commences once management has both authorized and committed to funding the project, and it is probable that the project will be completed. This assessment must consider any significant development uncertainties, such as the inclusion of novel or unproven functionalities and whether performance requirements are subject to substantial revision.
•Updated Disclosure Requirements: Disclosure obligations are now aligned with those outlined in Subtopic 360-10, Property, Plant, and Equipment. Requirements under Subtopic 350-30 are no longer applicable.
|
|
Annual and interim periods beginning after December 15, 2027.
|
|
The overall effect of this standard is not expected to have a material impact on our consolidated financial statements. |
| Standards adopted by the Bank during 2025 |
|
|
|
|
|
|
|
ASU 2023-09, Income Taxes (Topic 740): Improvements to Income Tax Disclosures |
|
This ASU requires additional detailed information to improve the usefulness of income tax disclosures. This includes providing detailed annual disclosures on rate reconciliation and income taxes paid for specific categories and when certain quantitative thresholds are met. |
|
Annual periods beginning January 1, 2025 |
|
The overall effect of this standard is not expected to have a material impact on our consolidated financial statements. |
3. FAIR VALUE
Fair value is defined as the price that would be received to sell an asset or paid to transfer a liability (i.e., the exit price) in the principal or most advantageous market for the asset or liability in an orderly transaction between market participants on the measurement date. For more information about our valuation methodologies for assets and liabilities measured at fair value, as well as the fair value hierarchy, see Note 3 of our 2024 Form 10-K.
ZIONS BANCORPORATION, NATIONAL ASSOCIATION AND SUBSIDIARIES
Fair Value Hierarchy
The following schedule presents assets and liabilities measured at fair value on a recurring basis:
|
|
|
|
|
|
|
|
|
|
|
|
|
|
|
|
|
|
|
|
|
|
|
|
| (In millions) |
September 30, 2025 |
| Level 1 |
|
Level 2 |
|
Level 3 |
|
Total |
| ASSETS |
|
|
|
|
|
|
|
| Trading securities |
$ |
— |
|
|
$ |
134 |
|
|
$ |
— |
|
|
$ |
134 |
|
Available-for-sale securities: |
|
|
|
|
|
|
|
| U.S. Treasury, agencies, and corporations |
1,311 |
|
|
6,861 |
|
|
— |
|
|
8,172 |
|
| Municipal securities |
— |
|
|
973 |
|
|
— |
|
|
973 |
|
| Other debt securities |
— |
|
|
25 |
|
|
— |
|
|
25 |
|
| Total available-for-sale |
1,311 |
|
|
7,859 |
|
|
— |
|
|
9,170 |
|
| Loans held for sale |
— |
|
|
126 |
|
|
— |
|
|
126 |
|
| Other noninterest-bearing investments: |
|
|
|
|
|
|
|
| Bank-owned life insurance |
— |
|
|
571 |
|
|
— |
|
|
571 |
|
Private equity investments 1 |
11 |
|
|
— |
|
|
135 |
|
|
146 |
|
| Other assets: |
|
|
|
|
|
|
|
| Agriculture loan servicing |
— |
|
|
— |
|
|
19 |
|
|
19 |
|
| Deferred compensation plan assets |
152 |
|
|
— |
|
|
— |
|
|
152 |
|
| Derivatives |
— |
|
|
353 |
|
|
— |
|
|
353 |
|
| Total assets |
$ |
1,474 |
|
|
$ |
9,043 |
|
|
$ |
154 |
|
|
$ |
10,671 |
|
| LIABILITIES |
|
|
|
|
|
|
|
| Fed funds and other short-term borrowings: |
|
|
|
|
|
|
|
| Securities sold, not yet purchased |
$ |
252 |
|
|
$ |
— |
|
|
$ |
— |
|
|
$ |
252 |
|
| Other liabilities: |
|
|
|
|
|
|
|
| Derivatives |
— |
|
|
257 |
|
|
— |
|
|
257 |
|
| Total liabilities |
$ |
252 |
|
|
$ |
257 |
|
|
$ |
— |
|
|
$ |
509 |
|
|
|
|
|
|
|
|
|
|
|
|
|
|
|
|
|
|
|
|
|
|
|
|
|
| (In millions) |
December 31, 2024 |
| Level 1 |
|
Level 2 |
|
Level 3 |
|
Total |
| ASSETS |
|
|
|
|
|
|
|
| Trading securities |
$ |
— |
|
|
$ |
35 |
|
|
$ |
— |
|
|
$ |
35 |
|
Available-for-sale securities: |
|
|
|
|
|
|
|
| U.S. Treasury, agencies, and corporations |
662 |
|
|
7,300 |
|
|
— |
|
|
7,962 |
|
| Municipal securities |
— |
|
|
1,108 |
|
|
— |
|
|
1,108 |
|
| Other debt securities |
— |
|
|
25 |
|
|
— |
|
|
25 |
|
| Total available-for-sale |
662 |
|
|
8,433 |
|
|
— |
|
|
9,095 |
|
| Loans held for sale |
— |
|
|
25 |
|
|
— |
|
|
25 |
|
| Other noninterest-bearing investments: |
|
|
|
|
|
|
|
| Bank-owned life insurance |
— |
|
|
562 |
|
|
— |
|
|
562 |
|
Private equity investments 1 |
3 |
|
|
— |
|
|
105 |
|
|
108 |
|
| Other assets: |
|
|
|
|
|
|
|
| Agriculture loan servicing |
— |
|
|
— |
|
|
20 |
|
|
20 |
|
| Deferred compensation plan assets |
149 |
|
|
— |
|
|
— |
|
|
149 |
|
| Derivatives |
— |
|
|
446 |
|
|
— |
|
|
446 |
|
| Total assets |
$ |
814 |
|
|
$ |
9,501 |
|
|
$ |
125 |
|
|
$ |
10,440 |
|
| LIABILITIES |
|
|
|
|
|
|
|
| Fed funds and other short-term borrowings: |
|
|
|
|
|
|
|
| Securities sold, not yet purchased |
$ |
21 |
|
|
$ |
— |
|
|
$ |
— |
|
|
$ |
21 |
|
| Other liabilities: |
|
|
|
|
|
|
|
| Derivatives |
— |
|
|
350 |
|
|
— |
|
|
350 |
|
| Total liabilities |
$ |
21 |
|
|
$ |
350 |
|
|
$ |
— |
|
|
$ |
371 |
|
1 The Level 1 private equity investments (“PEIs”) generally relate to the portion of our Small Business Investment Company (“SBIC”) investments and other similar investments that are publicly traded.
ZIONS BANCORPORATION, NATIONAL ASSOCIATION AND SUBSIDIARIES
Fair Value Option for Certain Loans Held for Sale
We have elected to apply the fair value option to certain commercial real estate (“CRE”) loans designated for sale to third-party conduits for securitization and hedged with derivative instruments. This election reduces accounting volatility that would otherwise arise from the mismatch between measuring loans held for sale at the lower of cost or fair value and derivatives at fair value, without requiring the application of hedge accounting. These loans are included in “Loans held for sale” on the consolidated balance sheet. Associated fair value gains and losses are included in “Capital markets fees and income” on the consolidated statement of income, while accrued interest is included in “Interest and fees on loans.”
At September 30, 2025 and December 31, 2024, we had $126 million and $25 million, respectively, of loans measured at fair value, with corresponding unpaid principal balance of $124 million and $26 million. During the first nine months of 2025 and 2024, we recognized approximately $6 million and $10 million, respectively, in net gains from loan sales and valuation adjustments related to loans measured at fair value and the associated derivatives.
Level 3 Valuations
Our Level 3 financial instruments include PEIs and agriculture loan servicing. For additional information regarding our Level 3 financial instruments, including the methods and significant assumptions used to estimate their fair value, see Note 3 of our 2024 Form 10-K.
Roll-forward of Level 3 Fair Value Measurements
The following schedule presents a roll-forward of assets and liabilities that are measured at fair value on a recurring basis using Level 3 inputs:
|
|
|
|
|
|
|
|
|
|
|
|
|
|
|
|
|
|
|
|
|
|
|
|
|
|
|
|
|
|
|
|
|
|
|
|
|
|
|
|
|
|
|
|
|
|
|
|
|
Level 3 Instruments |
|
Three Months Ended
September 30, 2025 |
|
Three Months Ended
September 30, 2024 |
|
Nine Months Ended
September 30, 2025 |
|
Nine Months Ended
September 30, 2024 |
| (In millions) |
Private equity investments |
|
Ag loan servicing |
|
Private equity investments |
|
Ag loan servicing |
|
Private equity investments |
|
Ag loan servicing |
|
Private equity investments |
|
Ag loan servicing |
|
|
|
|
|
|
|
|
|
|
|
|
|
|
|
|
Balance at beginning of period |
$ |
116 |
|
|
$ |
20 |
|
|
$ |
101 |
|
|
$ |
20 |
|
|
$ |
105 |
|
|
$ |
20 |
|
|
$ |
92 |
|
|
$ |
19 |
|
| Unrealized securities gains, net |
12 |
|
|
— |
|
|
5 |
|
|
— |
|
|
36 |
|
|
— |
|
|
7 |
|
|
— |
|
| Other noninterest income |
— |
|
|
(1) |
|
|
— |
|
|
(1) |
|
|
— |
|
|
(1) |
|
|
— |
|
|
— |
|
| Purchases |
7 |
|
|
— |
|
|
1 |
|
|
— |
|
|
12 |
|
|
— |
|
|
10 |
|
|
— |
|
| Cost of investments sold |
— |
|
|
— |
|
|
(2) |
|
|
— |
|
|
(6) |
|
|
— |
|
|
(4) |
|
|
— |
|
|
|
|
|
|
|
|
|
|
|
|
|
|
|
|
|
| Transfers out |
— |
|
|
— |
|
|
— |
|
|
— |
|
|
(12) |
|
|
— |
|
|
— |
|
|
— |
|
Balance at end of period |
$ |
135 |
|
|
$ |
19 |
|
|
$ |
105 |
|
|
$ |
19 |
|
|
$ |
135 |
|
|
$ |
19 |
|
|
$ |
105 |
|
|
$ |
19 |
|
The roll-forward of Level 3 instruments includes the following realized gains and losses recognized in “Securities gains (losses), net” on the consolidated statement of income for the periods presented:
|
|
|
|
|
|
|
|
|
|
|
|
|
|
|
|
|
|
|
|
|
|
|
|
| (In millions) |
Three Months Ended |
|
Nine Months Ended |
September 30,
2025 |
|
September 30,
2024 |
|
September 30,
2025 |
|
September 30,
2024 |
|
|
|
|
|
|
|
|
|
|
|
|
|
|
|
|
| Securities gains (losses), net |
$ |
— |
|
|
$ |
(2) |
|
|
$ |
(5) |
|
|
$ |
(1) |
|
|
|
|
|
|
|
|
|
Nonrecurring Fair Value Measurements
Certain assets and liabilities may be measured at fair value on a nonrecurring basis. These include impaired loans measured at the fair value of the underlying collateral, other real estate owned (“OREO”), and equity investments without readily determinable fair values. Nonrecurring fair value adjustments generally arise from observable price changes for such equity investments, write-downs of individual assets, or the application of lower of cost or fair value accounting. At September 30, 2025, we had $22 million in collateral-dependent loans measured at fair value. During the third quarter of 2025, we recognized $6 million in losses related to fair value changes for these loans.
ZIONS BANCORPORATION, NATIONAL ASSOCIATION AND SUBSIDIARIES
For additional information on assets and liabilities measured at fair value on a nonrecurring basis, see Note 3 of our 2024 Form 10-K.
Fair Value of Certain Financial Instruments
The following schedule presents the carrying values and estimated fair values of certain financial instruments:
|
|
|
|
|
|
|
|
|
|
|
|
|
|
|
|
|
|
|
|
|
|
|
|
|
|
|
|
|
|
|
|
|
|
|
|
|
| |
September 30, 2025 |
|
December 31, 2024 |
|
| (In millions) |
Carrying
value |
|
Fair value |
|
Level |
|
Carrying
value |
|
Fair value |
|
Level |
|
| Financial assets: |
|
|
|
|
|
|
|
|
|
|
|
|
| Held-to-maturity investment securities |
$ |
9,059 |
|
|
$ |
9,106 |
|
|
2 |
|
$ |
9,669 |
|
|
$ |
9,382 |
|
|
2 |
|
Loans and leases (including loans held for sale), net of allowance |
59,838 |
|
|
58,075 |
|
|
3 |
|
58,788 |
|
|
57,130 |
|
|
3 |
|
| Financial liabilities: |
|
|
|
|
|
|
|
|
|
|
|
|
| Time deposits |
10,056 |
|
|
9,985 |
|
|
2 |
|
11,482 |
|
|
11,468 |
|
|
2 |
|
|
|
|
|
|
|
|
|
|
|
|
|
|
|
|
|
|
|
|
|
|
|
|
|
|
|
| Long-term debt |
1,473 |
|
|
1,506 |
|
|
2 |
|
950 |
|
|
950 |
|
|
2 |
|
The preceding schedule excludes certain financial instruments that are recorded at fair value on a recurring basis, as well as certain financial assets and liabilities for which the carrying value approximates fair value. For additional information regarding the financial instruments included within the scope of this disclosure, along with the valuation methodologies and significant assumptions used in estimating their fair values, see Note 3 of our 2024 Form 10-K.
4. OFFSETTING ASSETS AND LIABILITIES
The following schedule presents gross and net information for selected financial instruments on the balance sheet:
|
|
|
|
|
|
|
|
|
|
|
|
|
|
|
|
|
|
|
|
|
|
|
|
|
|
|
|
|
|
|
|
|
|
|
|
|
|
|
|
|
September 30, 2025 |
|
|
|
|
|
|
|
|
Gross amounts not offset on the balance sheet |
|
|
| (In millions) |
|
Gross amounts recognized |
|
Gross amounts offset on the balance sheet |
|
Net amounts presented on the balance sheet |
|
Financial instruments |
|
Cash collateral received/pledged |
|
Net amount |
| Assets: |
|
|
|
|
|
|
|
|
|
|
|
|
Federal funds sold and securities purchased under agreements to resell |
|
$ |
1,008 |
|
|
$ |
— |
|
|
$ |
1,008 |
|
|
$ |
— |
|
|
$ |
— |
|
|
$ |
1,008 |
|
| Derivatives (included in Other assets) |
|
353 |
|
|
— |
|
|
353 |
|
|
(58) |
|
|
(209) |
|
|
86 |
|
| Total assets |
|
$ |
1,361 |
|
|
$ |
— |
|
|
$ |
1,361 |
|
|
$ |
(58) |
|
|
$ |
(209) |
|
|
$ |
1,094 |
|
| Liabilities: |
|
|
|
|
|
|
|
|
|
|
|
|
Federal funds and other short-term borrowings |
|
$ |
3,757 |
|
|
$ |
— |
|
|
$ |
3,757 |
|
|
$ |
— |
|
|
$ |
— |
|
|
$ |
3,757 |
|
Derivatives (included in Other liabilities) |
|
257 |
|
|
— |
|
|
257 |
|
|
(58) |
|
|
(24) |
|
|
175 |
|
| Total liabilities |
|
$ |
4,014 |
|
|
$ |
— |
|
|
$ |
4,014 |
|
|
$ |
(58) |
|
|
$ |
(24) |
|
|
$ |
3,932 |
|
ZIONS BANCORPORATION, NATIONAL ASSOCIATION AND SUBSIDIARIES
|
|
|
|
|
|
|
|
|
|
|
|
|
|
|
|
|
|
|
|
|
|
|
|
|
|
|
|
|
|
|
|
|
|
|
|
|
|
|
|
|
December 31, 2024 |
|
|
|
|
|
|
|
|
Gross amounts not offset on the balance sheet |
|
|
| (In millions) |
|
Gross amounts recognized |
|
Gross amounts offset on the balance sheet |
|
Net amounts presented on the balance sheet |
|
Financial instruments |
|
Cash collateral received/pledged |
|
Net amount |
| Assets: |
|
|
|
|
|
|
|
|
|
|
|
|
Federal funds sold and securities purchased under agreements to resell |
|
$ |
1,453 |
|
|
$ |
— |
|
|
$ |
1,453 |
|
|
$ |
— |
|
|
$ |
— |
|
|
$ |
1,453 |
|
| Derivatives (included in Other assets) |
|
446 |
|
|
— |
|
|
446 |
|
|
(19) |
|
|
(404) |
|
|
23 |
|
| Total assets |
|
$ |
1,899 |
|
|
$ |
— |
|
|
$ |
1,899 |
|
|
$ |
(19) |
|
|
$ |
(404) |
|
|
$ |
1,476 |
|
| Liabilities: |
|
|
|
|
|
|
|
|
|
|
|
|
Federal funds and other short-term borrowings |
|
$ |
3,832 |
|
|
$ |
— |
|
|
$ |
3,832 |
|
|
$ |
— |
|
|
$ |
— |
|
|
$ |
3,832 |
|
Derivatives (included in Other liabilities) |
|
350 |
|
|
— |
|
|
350 |
|
|
(19) |
|
|
(3) |
|
|
328 |
|
| Total liabilities |
|
$ |
4,182 |
|
|
$ |
— |
|
|
$ |
4,182 |
|
|
$ |
(19) |
|
|
$ |
(3) |
|
|
$ |
4,160 |
|
Security repurchase and reverse repurchase agreements are offset on the consolidated balance sheet according to master netting agreements, when applicable. Security repurchase agreements are included in “Federal funds and other short-term borrowings” on the consolidated balance sheet. Derivative instruments may also be offset under their master netting agreements; however, for accounting purposes, they are presented on a gross basis on the consolidated balance sheet. For more information regarding derivative instruments, see Note 7.
5. INVESTMENT SECURITIES
Investment Securities
We classify our investment securities as either available-for-sale (“AFS”) or held-to-maturity (“HTM”). AFS securities, which primarily consist of debt securities used to manage liquidity and interest rate risk and to generate interest income, are measured at fair value. Unrealized gains and losses from AFS securities, net of applicable taxes, are recorded in other comprehensive income. HTM securities are those that management has both the intent and ability to hold until maturity and are carried at amortized cost. This amount reflects the original investment cost, adjusted for the amortization or accretion of any purchase premiums or discounts, as well as any impairment losses, including credit-related impairment. Gains or losses on the sale of investment securities are recognized in noninterest income using the specific identification method.
The carrying values of our investment securities exclude accrued interest receivables of $57 million and $60 million at September 30, 2025 and December 31, 2024, respectively. These receivables are included in “Other assets” on the consolidated balance sheet.
Investment securities with a carrying value of $17.4 billion and $17.9 billion were pledged as collateral for potential borrowings at September 30, 2025 and December 31, 2024, respectively.
When a security is transferred from AFS to HTM, the difference between its amortized cost basis and fair value at the date of transfer is amortized as a yield adjustment through interest income. The fair value at the date of transfer results in either a premium or discount to the amortized cost basis of the HTM securities. The amortization of unrealized gains or losses reported in accumulated other comprehensive income (“AOCI”) will offset the effect of the amortization of the premium or discount in interest income created by the transfer. The discount associated with securities previously transferred from AFS to HTM was $1.7 billion ($1.2 billion after tax) at September 30, 2025, compared with $1.8 billion ($1.4 billion after tax) at December 31, 2024.
For additional information regarding our fair value estimation process and the accounting treatment of our investment securities, see Notes 3 and 5, respectively, of our 2024 Form 10-K.
ZIONS BANCORPORATION, NATIONAL ASSOCIATION AND SUBSIDIARIES
The following schedule presents the amortized cost and estimated fair values of our AFS and HTM securities:
|
|
|
|
|
|
|
|
|
|
|
|
|
|
|
|
|
|
|
|
|
|
|
|
|
September 30, 2025 |
| (In millions) |
Amortized
cost |
|
Gross unrealized gains 1 |
|
Gross unrealized losses |
|
Estimated
fair value |
| Available-for-sale |
|
|
|
|
|
|
|
| U.S. Treasury securities |
$ |
1,401 |
|
|
$ |
15 |
|
|
$ |
105 |
|
|
$ |
1,311 |
|
| U.S. Government agencies and corporations: |
|
|
|
|
|
|
|
| Agency securities |
349 |
|
|
— |
|
|
17 |
|
|
332 |
|
| Agency guaranteed mortgage-backed securities |
7,208 |
|
|
4 |
|
|
1,041 |
|
|
6,171 |
|
| Small Business Administration loan-backed securities |
374 |
|
|
— |
|
|
16 |
|
|
358 |
|
| Municipal securities |
1,022 |
|
|
— |
|
|
49 |
|
|
973 |
|
| Other debt securities |
25 |
|
|
— |
|
|
— |
|
|
25 |
|
| Total available-for-sale |
10,379 |
|
|
19 |
|
|
1,228 |
|
|
9,170 |
|
| Held-to-maturity |
|
|
|
|
|
|
|
| U.S. Government agencies and corporations: |
|
|
|
|
|
|
|
| Agency securities |
139 |
|
|
— |
|
|
4 |
|
|
135 |
|
| Agency guaranteed mortgage-backed securities |
8,643 |
|
|
89 |
|
|
28 |
|
|
8,704 |
|
| Municipal securities |
277 |
|
|
— |
|
|
10 |
|
|
267 |
|
| Total held-to-maturity |
9,059 |
|
|
89 |
|
|
42 |
|
|
9,106 |
|
| Total investment securities |
$ |
19,438 |
|
|
$ |
108 |
|
|
$ |
1,270 |
|
|
$ |
18,276 |
|
|
|
|
|
|
|
|
|
|
|
|
|
|
|
|
|
|
|
|
|
|
|
|
|
|
December 31, 2024 |
| (In millions) |
Amortized
cost |
|
Gross unrealized gains 1 |
|
Gross unrealized losses |
|
Estimated
fair value |
| Available-for-sale |
|
|
|
|
|
|
|
| U.S. Treasury securities |
$ |
781 |
|
|
$ |
— |
|
|
$ |
119 |
|
|
$ |
662 |
|
| U.S. Government agencies and corporations: |
|
|
|
|
|
|
|
| Agency securities |
441 |
|
|
— |
|
|
26 |
|
|
415 |
|
| Agency guaranteed mortgage-backed securities |
7,713 |
|
|
1 |
|
|
1,263 |
|
|
6,451 |
|
| Small Business Administration loan-backed securities |
455 |
|
|
— |
|
|
21 |
|
|
434 |
|
| Municipal securities |
1,186 |
|
|
— |
|
|
78 |
|
|
1,108 |
|
| Other debt securities |
25 |
|
|
— |
|
|
— |
|
|
25 |
|
| Total available-for-sale |
10,601 |
|
|
1 |
|
|
1,507 |
|
|
9,095 |
|
| Held-to-maturity |
|
|
|
|
|
|
|
| U.S. Government agencies and corporations: |
|
|
|
|
|
|
|
| Agency securities |
148 |
|
|
— |
|
|
8 |
|
|
140 |
|
| Agency guaranteed mortgage-backed securities |
9,202 |
|
|
2 |
|
|
263 |
|
|
8,941 |
|
| Municipal securities |
319 |
|
|
— |
|
|
18 |
|
|
301 |
|
| Total held-to-maturity |
9,669 |
|
|
2 |
|
|
289 |
|
|
9,382 |
|
| Total investment securities |
$ |
20,270 |
|
|
$ |
3 |
|
|
$ |
1,796 |
|
|
$ |
18,477 |
|
1 Gross unrealized gains for the respective AFS security categories without values were individually less than $1 million.
ZIONS BANCORPORATION, NATIONAL ASSOCIATION AND SUBSIDIARIES
The following schedule presents gross unrealized losses for AFS securities and the estimated fair value, categorized by the length of time the securities have been in an unrealized loss position:
|
|
|
|
|
|
|
|
|
|
|
|
|
|
|
|
|
|
|
|
|
|
|
|
|
|
|
|
|
|
|
|
|
|
|
|
|
September 30, 2025 |
|
Less than 12 months |
|
12 months or more |
|
Total |
| (In millions) |
Gross
unrealized
losses |
|
Estimated
fair
value |
|
Gross
unrealized
losses |
|
Estimated
fair
value |
|
Gross
unrealized
losses |
|
Estimated
fair
value |
|
|
|
|
|
|
|
|
|
|
|
|
|
|
|
|
|
|
|
|
|
|
|
|
|
|
|
|
|
|
|
|
|
|
|
|
|
|
|
|
|
|
|
|
|
|
|
|
|
|
|
|
|
|
|
|
|
|
|
|
|
|
|
|
|
|
|
|
|
|
|
|
| Available-for-sale |
|
|
|
|
|
|
|
|
|
|
|
| U.S. Treasury securities |
$ |
— |
|
|
$ |
— |
|
|
$ |
105 |
|
|
$ |
296 |
|
|
$ |
105 |
|
|
$ |
296 |
|
| U.S. Government agencies and corporations: |
|
|
|
|
|
|
|
|
|
|
|
| Agency securities |
— |
|
|
7 |
|
|
17 |
|
|
320 |
|
|
17 |
|
|
327 |
|
| Agency guaranteed mortgage-backed securities |
— |
|
|
6 |
|
|
1,041 |
|
|
5,846 |
|
|
1,041 |
|
|
5,852 |
|
| Small Business Administration loan-backed securities |
— |
|
|
32 |
|
|
16 |
|
|
321 |
|
|
16 |
|
|
353 |
|
| Municipal securities |
— |
|
|
86 |
|
|
49 |
|
|
813 |
|
|
49 |
|
|
899 |
|
|
|
|
|
|
|
|
|
|
|
|
|
|
|
|
|
|
|
|
|
|
|
|
|
|
|
|
|
|
|
|
|
|
|
|
|
|
|
|
|
|
|
|
|
|
|
|
|
|
|
|
|
|
|
|
|
|
|
|
|
|
|
|
|
|
|
|
|
|
|
|
|
|
|
|
|
|
|
|
|
|
|
|
|
|
|
|
|
|
|
|
|
|
|
|
|
|
|
|
|
|
|
|
|
|
|
|
|
| Total available-for-sale investment securities |
$ |
— |
|
|
$ |
131 |
|
|
$ |
1,228 |
|
|
$ |
7,596 |
|
|
$ |
1,228 |
|
|
$ |
7,727 |
|
|
|
|
|
|
|
|
|
|
|
|
|
|
|
|
|
|
|
|
|
|
|
|
|
|
|
|
|
|
|
|
|
|
|
|
|
|
December 31, 2024 |
|
Less than 12 months |
|
12 months or more |
|
Total |
| (In millions) |
Gross
unrealized
losses |
|
Estimated
fair
value |
|
Gross
unrealized
losses |
|
Estimated
fair
value |
|
Gross
unrealized
losses |
|
Estimated
fair
value |
|
|
|
|
|
|
|
|
|
|
|
|
|
|
|
|
|
|
|
|
|
|
|
|
|
|
|
|
|
|
|
|
|
|
|
|
|
|
|
|
|
|
|
|
|
|
|
|
|
|
|
|
|
|
|
|
|
|
|
|
|
|
|
|
|
|
|
|
|
|
|
|
| Available-for-sale |
|
|
|
|
|
|
|
|
|
|
|
| U.S. Treasury securities |
$ |
3 |
|
|
$ |
198 |
|
|
$ |
116 |
|
|
$ |
285 |
|
|
$ |
119 |
|
|
$ |
483 |
|
| U.S. Government agencies and corporations: |
|
|
|
|
|
|
|
|
|
|
|
| Agency securities |
— |
|
|
3 |
|
|
26 |
|
|
403 |
|
|
26 |
|
|
406 |
|
| Agency guaranteed mortgage-backed securities |
— |
|
|
86 |
|
|
1,263 |
|
|
6,171 |
|
|
1,263 |
|
|
6,257 |
|
| Small Business Administration loan-backed securities |
— |
|
|
35 |
|
|
21 |
|
|
387 |
|
|
21 |
|
|
422 |
|
| Municipal securities |
— |
|
|
68 |
|
|
78 |
|
|
984 |
|
|
78 |
|
|
1,052 |
|
|
|
|
|
|
|
|
|
|
|
|
|
|
|
|
|
|
|
|
|
|
|
|
|
|
|
|
|
|
|
|
|
|
|
|
|
|
|
|
|
|
|
|
|
|
|
|
|
|
|
|
|
|
|
|
|
|
|
|
|
|
|
|
|
|
|
|
|
|
|
|
|
|
|
|
|
|
|
|
|
|
|
|
|
|
|
|
|
|
|
|
|
|
|
|
|
|
|
|
|
|
|
|
|
|
|
|
|
| Total available-for-sale investment securities |
$ |
3 |
|
|
$ |
390 |
|
|
$ |
1,504 |
|
|
$ |
8,230 |
|
|
$ |
1,507 |
|
|
$ |
8,620 |
|
At September 30, 2025 and December 31, 2024, the number of AFS investment securities in an unrealized loss position was 2,135 and 2,534, respectively.
There were no gross realized gains or losses from sales of AFS investment securities for the three and nine months ended September 30, 2025 and 2024.
The following schedule presents interest income categorized by investment security type:
|
|
|
|
|
|
|
|
|
|
|
|
|
|
|
|
|
|
|
|
|
|
|
|
|
|
|
|
|
|
|
|
|
|
|
|
|
Three Months Ended September 30, |
|
2025 |
|
2024 |
| (In millions) |
Taxable |
|
Nontaxable |
|
Total |
|
Taxable |
|
Nontaxable |
|
Total |
|
|
|
|
|
|
|
|
|
|
|
|
| Available-for-sale |
$ |
66 |
|
|
$ |
7 |
|
|
$ |
73 |
|
|
$ |
75 |
|
|
$ |
8 |
|
|
$ |
83 |
|
| Held-to-maturity |
49 |
|
|
2 |
|
|
51 |
|
|
54 |
|
|
1 |
|
|
55 |
|
| Total investment securities |
$ |
115 |
|
|
$ |
9 |
|
|
$ |
124 |
|
|
$ |
129 |
|
|
$ |
9 |
|
|
$ |
138 |
|
|
|
|
|
|
|
|
|
|
|
|
|
|
|
|
|
|
|
|
|
|
|
|
|
|
|
|
|
|
|
|
|
|
|
|
|
|
Nine Months Ended September 30, |
|
2025 |
|
2024 |
| (In millions) |
Taxable |
|
Nontaxable |
|
Total |
|
Taxable |
|
Nontaxable |
|
Total |
|
|
|
|
|
|
|
|
|
|
|
|
| Available-for-sale |
$ |
196 |
|
|
$ |
21 |
|
|
$ |
217 |
|
|
$ |
227 |
|
|
$ |
24 |
|
|
$ |
251 |
|
| Held-to-maturity |
151 |
|
|
4 |
|
|
155 |
|
|
165 |
|
|
3 |
|
|
168 |
|
| Total investment securities |
$ |
347 |
|
|
$ |
25 |
|
|
$ |
372 |
|
|
$ |
392 |
|
|
$ |
27 |
|
|
$ |
419 |
|
ZIONS BANCORPORATION, NATIONAL ASSOCIATION AND SUBSIDIARIES
Maturities
The following schedule presents the amortized cost and weighted average yields of debt securities, categorized by the remaining contractual maturity of principal payments at September 30, 2025. The schedule does not reflect the impact of interest rate resets or fair value hedges. Additionally, the remaining contractual principal maturities presented do not represent the portfolio's duration, as they do not incorporate expected prepayments or amortization, which generally result in measured durations that are shorter than contractual maturities.
|
|
|
|
|
|
|
|
|
|
|
|
|
|
|
|
|
|
|
|
|
|
|
|
|
|
|
|
|
|
|
|
|
|
|
|
|
|
|
|
|
|
|
|
|
|
|
|
|
|
|
|
|
|
|
|
|
|
|
|
|
September 30, 2025 |
|
Total
debt securities |
|
Due in one year or less |
|
Due after one year through five years |
|
Due after five years through ten years |
|
Due after ten years |
| (Dollar amounts in millions) |
Amortized cost |
|
Average yield |
|
Amortized cost |
|
Average yield |
|
Amortized cost |
|
Average yield |
|
Amortized cost |
|
Average yield |
|
Amortized cost |
|
Average yield |
| Available-for-sale |
|
|
|
|
|
|
|
|
|
|
|
|
|
|
|
|
|
|
|
| U.S. Treasury securities |
$ |
1,401 |
|
|
3.69 |
% |
|
$ |
100 |
|
|
4.04 |
% |
|
$ |
201 |
|
|
3.99 |
% |
|
$ |
699 |
|
|
4.33 |
% |
|
$ |
401 |
|
|
2.35 |
% |
| U.S. Government agencies and corporations: |
|
|
|
|
|
|
|
|
|
|
|
|
|
|
| Agency securities |
349 |
|
|
3.18 |
|
|
32 |
|
|
2.78 |
|
|
55 |
|
|
3.91 |
|
|
163 |
|
|
2.96 |
|
|
99 |
|
|
3.28 |
|
| Agency guaranteed mortgage-backed securities |
7,208 |
|
|
2.04 |
|
|
7 |
|
|
1.27 |
|
|
96 |
|
|
2.00 |
|
|
1,478 |
|
|
2.02 |
|
|
5,627 |
|
|
2.05 |
|
| Small Business Administration loan-backed securities |
374 |
|
|
4.58 |
|
|
— |
|
|
— |
|
|
10 |
|
|
5.94 |
|
|
110 |
|
|
3.81 |
|
|
254 |
|
|
4.87 |
|
Municipal securities 1 |
1,022 |
|
|
2.14 |
|
|
117 |
|
|
3.17 |
|
|
309 |
|
|
2.16 |
|
|
580 |
|
|
1.91 |
|
|
16 |
|
|
2.43 |
|
| Other debt securities |
25 |
|
|
8.15 |
|
|
— |
|
|
— |
|
|
10 |
|
|
9.51 |
|
|
— |
|
|
— |
|
|
15 |
|
|
7.25 |
|
Total available-for-sale securities |
10,379 |
|
|
2.42 |
|
|
256 |
|
|
3.41 |
|
|
681 |
|
|
2.98 |
|
|
3,030 |
|
|
2.65 |
|
|
6,412 |
|
|
2.21 |
|
| Held-to-maturity |
|
|
|
|
|
|
|
|
|
|
|
|
|
|
|
|
|
|
|
| U.S. Government agencies and corporations: |
|
|
|
|
|
|
|
|
|
|
|
|
|
|
| Agency securities |
139 |
|
|
4.15 |
|
|
— |
|
|
— |
|
|
— |
|
|
— |
|
|
77 |
|
|
3.46 |
|
|
62 |
|
|
5.01 |
|
Agency guaranteed mortgage-backed securities |
8,643 |
|
|
1.84 |
|
|
— |
|
|
— |
|
|
28 |
|
|
1.46 |
|
|
11 |
|
|
2.70 |
|
|
8,604 |
|
|
1.84 |
|
Municipal securities 1 |
277 |
|
|
3.26 |
|
|
27 |
|
|
2.47 |
|
|
131 |
|
|
2.90 |
|
|
112 |
|
|
3.71 |
|
|
7 |
|
|
5.93 |
|
| Total held-to-maturity securities |
9,059 |
|
|
1.92 |
|
|
27 |
|
|
2.47 |
|
|
159 |
|
|
2.65 |
|
|
200 |
|
|
3.56 |
|
|
8,673 |
|
|
1.86 |
|
| Total investment securities |
$ |
19,438 |
|
|
2.18 |
|
|
$ |
283 |
|
|
3.32 |
|
|
$ |
840 |
|
|
2.92 |
|
|
$ |
3,230 |
|
|
2.71 |
|
|
$ |
15,085 |
|
|
2.01 |
|
1 The yields on tax-exempt securities are calculated on a tax-equivalent basis.
Impairment
On a quarterly basis, we review our investment securities portfolio to assess potential impairment on an individual security level. For additional information regarding our impairment assessment methodology and related accounting policies applicable to investment securities, see Note 5 of our 2024 Form 10-K.
AFS Impairment
No impairment losses were recognized on our AFS investment securities portfolio during the first nine months of either 2025 or 2024. The unrealized losses primarily reflect the impact of higher interest rates following the purchase of the securities and are not attributable to credit-related factors. Accordingly, absent any future sales, we expect to recover the full principal value of these securities upon maturity. At September 30, 2025, we did not intend to sell any securities in an unrealized loss position, nor do we believe it is more likely than not that we would be required to sell such securities prior to recovering their amortized cost basis.
ZIONS BANCORPORATION, NATIONAL ASSOCIATION AND SUBSIDIARIES
HTM Impairment
For HTM securities, the allowance for credit losses (“ACL”) is evaluated using the same methodology applied to loans and leases measured at amortized cost, as described in Note 6. At September 30, 2025, the ACL for HTM securities was less than $1 million. All HTM securities were assigned a credit quality rating of “Pass,” with none classified as past due.
6. LOANS, LEASES, AND ALLOWANCE FOR CREDIT LOSSES
Loans, Leases, and Loans Held for Sale
The following schedule presents our loan and lease portfolio according to major portfolio segment and specific class:
|
|
|
|
|
|
|
|
|
|
|
|
| (In millions) |
September 30,
2025 |
|
December 31,
2024 |
|
|
|
|
| Loans held for sale |
$ |
215 |
|
|
$ |
74 |
|
| Commercial: |
|
|
|
| Commercial and industrial |
$ |
17,222 |
|
|
$ |
16,891 |
|
| Owner-occupied |
9,267 |
|
|
9,333 |
|
| Municipal |
4,341 |
|
|
4,364 |
|
| Leasing |
349 |
|
|
377 |
|
| Total commercial |
31,179 |
|
|
30,965 |
|
| Commercial real estate: |
|
|
|
| Term |
11,008 |
|
|
10,703 |
|
| Construction and land development |
2,469 |
|
|
2,774 |
|
| Total commercial real estate |
13,477 |
|
|
13,477 |
|
| Consumer: |
|
|
|
| 1-4 family residential |
10,423 |
|
|
9,939 |
|
| Home equity credit line |
3,848 |
|
|
3,641 |
|
| Construction and other consumer real estate |
769 |
|
|
810 |
|
| Bankcard and other revolving plans |
477 |
|
|
457 |
|
| Other |
129 |
|
|
121 |
|
| Total consumer |
15,646 |
|
|
14,968 |
|
|
|
|
|
Total loans and leases |
$ |
60,302 |
|
|
$ |
59,410 |
|
Loans and leases classified as held for investment are measured and presented at their amortized cost basis, which includes net unamortized purchase premiums, discounts, and deferred loan fees and costs totaling $56 million and $43 million at September 30, 2025 and December 31, 2024, respectively. The amortized cost basis of the loans does not include accrued interest receivables of $278 million and $281 million at September 30, 2025 and December 31, 2024, respectively. These receivables are included in “Other assets” on the consolidated balance sheet.
Municipal loans typically consist of obligations that are repaid from, or secured by, the general funds or pledged revenues of municipalities, as well as by real estate or equipment. This portfolio also includes loans extended to private commercial and 501(c)(3) not-for-profit organizations that utilize a pass-through municipal structure to benefit from favorable tax treatment.
Land acquisition and development loans included in the construction and land development loan portfolio were $234 million at September 30, 2025 and $260 million at December 31, 2024.
Loans with a carrying value of $42.6 billion at September 30, 2025 and $40.4 billion at December 31, 2024 have been pledged at the Federal Reserve (“FRB”) and the Federal Home Loan Bank (“FHLB”) of Des Moines as collateral for current and potential borrowings.
Loans held for sale are measured individually at fair value or the lower of cost or fair value and primarily consist of CRE loans sold into securitization entities, and conforming residential mortgages generally sold to U.S. government agencies.
ZIONS BANCORPORATION, NATIONAL ASSOCIATION AND SUBSIDIARIES
The following schedule presents loans added to, or sold from, the held for sale category during the periods presented:
|
|
|
|
|
|
|
|
|
|
|
|
|
|
|
|
|
|
|
|
|
|
|
|
|
Three Months Ended
September 30, |
|
Nine Months Ended
September 30, |
| (In millions) |
2025 |
|
2024 |
|
2025 |
|
2024 |
|
|
|
|
|
|
|
|
| Loans added to held for sale |
$ |
267 |
|
|
$ |
289 |
|
|
$ |
715 |
|
|
$ |
688 |
|
| Loans sold from held for sale |
222 |
|
|
304 |
|
|
572 |
|
|
644 |
|
Occasionally, we have continuing involvement in sold loans through retained servicing rights or guarantees. At September 30, 2025 and December 31, 2024, the principal balance of sold loans for which we retained servicing rights was approximately $702 million and $615 million, respectively. Income generated from sold loans, excluding servicing, totaled $4 million and $9 million for the three and nine months ended September 30, 2025, respectively, and $2 million and $5 million for the corresponding periods in 2024.
Allowance for Credit Losses
The allowance for credit losses (“ACL”), which consists of the allowance for loan and lease losses (“ALLL”) and the reserve for unfunded lending commitments (“RULC”), represents our estimate of current expected credit losses related to the loan and lease portfolio and unfunded lending commitments as of the balance sheet date. For additional information regarding our policies and methodologies used to estimate the ACL, see Note 6 of our 2024 Form 10-K.
The ACL on AFS and HTM debt securities is estimated independently from the ACL on loans. For HTM securities, the ACL is evaluated using the same methodology applied to loans and leases measured at amortized cost. For more information regarding our methodology used to estimate the ACL on AFS and HTM debt securities, see Note 5 of our 2024 Form 10-K.
Changes in the ACL are summarized as follows:
|
|
|
|
|
|
|
|
|
|
|
|
|
|
|
|
|
|
|
|
|
|
|
|
|
Three Months Ended September 30, 2025 |
| (In millions) |
Commercial |
|
Commercial real estate |
|
Consumer |
|
Total |
| Allowance for loan losses |
|
|
|
|
|
|
|
| Balance at beginning of period |
$ |
361 |
|
|
$ |
230 |
|
|
$ |
99 |
|
|
$ |
690 |
|
| Provision for loan losses |
57 |
|
|
(11) |
|
|
(1) |
|
|
45 |
|
| Gross loan and lease charge-offs |
61 |
|
|
3 |
|
|
3 |
|
|
67 |
|
| Recoveries |
9 |
|
|
1 |
|
|
1 |
|
|
11 |
|
| Net loan and lease charge-offs (recoveries) |
52 |
|
|
2 |
|
|
2 |
|
|
56 |
|
| Balance at end of period |
$ |
366 |
|
|
$ |
217 |
|
|
$ |
96 |
|
|
$ |
679 |
|
| Reserve for unfunded lending commitments |
|
|
|
|
|
|
|
|
|
|
|
|
|
|
|
|
|
|
|
|
|
|
|
| Balance at beginning of period |
$ |
22 |
|
|
$ |
12 |
|
|
$ |
8 |
|
|
$ |
42 |
|
| Provision for unfunded lending commitments |
1 |
|
|
4 |
|
|
(1) |
|
|
4 |
|
| Balance at end of period |
$ |
23 |
|
|
$ |
16 |
|
|
$ |
7 |
|
|
$ |
46 |
|
| Total allowance for credit losses at end of period |
|
|
|
|
|
|
|
| Allowance for loan losses |
$ |
366 |
|
|
$ |
217 |
|
|
$ |
96 |
|
|
$ |
679 |
|
| Reserve for unfunded lending commitments |
23 |
|
|
16 |
|
|
7 |
|
|
46 |
|
| Total allowance for credit losses |
$ |
389 |
|
|
$ |
233 |
|
|
$ |
103 |
|
|
$ |
725 |
|
ZIONS BANCORPORATION, NATIONAL ASSOCIATION AND SUBSIDIARIES
|
|
|
|
|
|
|
|
|
|
|
|
|
|
|
|
|
|
|
|
|
|
|
|
|
Nine Months Ended September 30, 2025 |
| (In millions) |
Commercial |
|
Commercial real estate |
|
Consumer |
|
Total |
| Allowance for loan losses |
|
|
|
|
|
|
|
| Balance at beginning of period |
$ |
308 |
|
|
$ |
300 |
|
|
$ |
88 |
|
|
$ |
696 |
|
| Provision for loan losses |
129 |
|
|
(80) |
|
|
16 |
|
|
65 |
|
| Gross loan and lease charge-offs |
92 |
|
|
4 |
|
|
11 |
|
|
107 |
|
| Recoveries |
21 |
|
|
1 |
|
|
3 |
|
|
25 |
|
| Net loan and lease charge-offs (recoveries) |
71 |
|
|
3 |
|
|
8 |
|
|
82 |
|
| Balance at end of period |
$ |
366 |
|
|
$ |
217 |
|
|
$ |
96 |
|
|
$ |
679 |
|
| Reserve for unfunded lending commitments |
|
|
|
|
|
|
|
| Balance at beginning of period |
$ |
26 |
|
|
$ |
11 |
|
|
$ |
8 |
|
|
$ |
45 |
|
| Provision for unfunded lending commitments |
(3) |
|
|
5 |
|
|
(1) |
|
|
1 |
|
| Balance at end of period |
$ |
23 |
|
|
$ |
16 |
|
|
$ |
7 |
|
|
$ |
46 |
|
| Total allowance for credit losses at end of period |
|
|
|
|
|
|
|
| Allowance for loan losses |
$ |
366 |
|
|
$ |
217 |
|
|
$ |
96 |
|
|
$ |
679 |
|
| Reserve for unfunded lending commitments |
23 |
|
|
16 |
|
|
7 |
|
|
46 |
|
| Total allowance for credit losses |
$ |
389 |
|
|
$ |
233 |
|
|
$ |
103 |
|
|
$ |
725 |
|
|
|
|
|
|
|
|
|
|
|
|
|
|
|
|
|
|
|
|
|
|
|
|
|
|
Three Months Ended September 30, 2024 |
| (In millions) |
Commercial |
|
Commercial real estate |
|
Consumer |
|
Total |
| Allowance for loan losses |
|
|
|
|
|
|
|
| Balance at beginning of period |
$ |
302 |
|
|
$ |
300 |
|
|
$ |
94 |
|
|
$ |
696 |
|
| Provision for loan losses |
7 |
|
|
(13) |
|
|
7 |
|
|
1 |
|
| Gross loan and lease charge-offs |
12 |
|
|
— |
|
|
3 |
|
|
15 |
|
| Recoveries |
9 |
|
|
2 |
|
|
1 |
|
|
12 |
|
| Net loan and lease charge-offs (recoveries) |
3 |
|
|
(2) |
|
|
2 |
|
|
3 |
|
| Balance at end of period |
$ |
306 |
|
|
$ |
289 |
|
|
$ |
99 |
|
|
$ |
694 |
|
| Reserve for unfunded lending commitments |
|
|
|
|
|
|
|
|
|
|
|
|
|
|
|
|
|
|
|
|
|
|
|
| Balance at beginning of period |
$ |
16 |
|
|
$ |
7 |
|
|
$ |
7 |
|
|
$ |
30 |
|
| Provision for unfunded lending commitments |
4 |
|
|
5 |
|
|
3 |
|
|
12 |
|
| Balance at end of period |
$ |
20 |
|
|
$ |
12 |
|
|
$ |
10 |
|
|
$ |
42 |
|
| Total allowance for credit losses at end of period |
|
|
|
|
|
|
|
| Allowance for loan losses |
$ |
306 |
|
|
$ |
289 |
|
|
$ |
99 |
|
|
$ |
694 |
|
| Reserve for unfunded lending commitments |
20 |
|
|
12 |
|
|
10 |
|
|
42 |
|
| Total allowance for credit losses |
$ |
326 |
|
|
$ |
301 |
|
|
$ |
109 |
|
|
$ |
736 |
|
ZIONS BANCORPORATION, NATIONAL ASSOCIATION AND SUBSIDIARIES
|
|
|
|
|
|
|
|
|
|
|
|
|
|
|
|
|
|
|
|
|
|
|
|
|
Nine Months Ended September 30, 2024 |
| (In millions) |
Commercial |
|
Commercial real estate |
|
Consumer |
|
Total |
| Allowance for loan losses |
|
|
|
|
|
|
|
| Balance at beginning of period |
$ |
302 |
|
|
$ |
241 |
|
|
$ |
141 |
|
|
$ |
684 |
|
| Provision for loan losses |
15 |
|
|
56 |
|
|
(37) |
|
|
34 |
|
| Gross loan and lease charge-offs |
30 |
|
|
11 |
|
|
9 |
|
|
50 |
|
| Recoveries |
19 |
|
|
3 |
|
|
4 |
|
|
26 |
|
| Net loan and lease charge-offs (recoveries) |
11 |
|
|
8 |
|
|
5 |
|
|
24 |
|
| Balance at end of period |
$ |
306 |
|
|
$ |
289 |
|
|
$ |
99 |
|
|
$ |
694 |
|
| Reserve for unfunded lending commitments |
|
|
|
|
|
|
|
| Balance at beginning of period |
$ |
19 |
|
|
$ |
17 |
|
|
$ |
9 |
|
|
$ |
45 |
|
| Provision for unfunded lending commitments |
1 |
|
|
(5) |
|
|
1 |
|
|
(3) |
|
| Balance at end of period |
$ |
20 |
|
|
$ |
12 |
|
|
$ |
10 |
|
|
$ |
42 |
|
| Total allowance for credit losses at end of period |
|
|
|
|
|
|
|
| Allowance for loan losses |
$ |
306 |
|
|
$ |
289 |
|
|
$ |
99 |
|
|
$ |
694 |
|
| Reserve for unfunded lending commitments |
20 |
|
|
12 |
|
|
10 |
|
|
42 |
|
| Total allowance for credit losses |
$ |
326 |
|
|
$ |
301 |
|
|
$ |
109 |
|
|
$ |
736 |
|
Nonaccrual Loans
Loans are generally placed on nonaccrual status when the full collection of principal and interest is not expected, or when the loan is 90 days or more past due with respect to principal or interest, unless it is both well-secured and in the process of collection. We consider several factors when placing a loan on nonaccrual status, including delinquency status, collateral valuation, borrower or guarantor financial condition, bankruptcy status, and other indicators that suggest uncertainty regarding the full and timely recovery of principal and interest.
A nonaccrual loan may be returned to accrual status when the following conditions are met: (1) all delinquent principal and interest have been brought current in accordance with the loan agreement; (2) the loan, if secured, is well secured; (3) the borrower has made timely payments under the contractual terms for a minimum of six months; and (4) a credit analysis indicates reasonable assurance of the borrower's ability and willingness to continue making payments.
The following schedule presents the amortized cost basis of loans on nonaccrual:
|
|
|
|
|
|
|
|
|
|
|
|
|
|
|
|
|
|
|
|
|
|
|
|
|
September 30, 2025 |
|
Amortized cost basis |
|
Total amortized cost basis |
|
|
| (In millions) |
with no allowance |
|
with allowance |
|
|
Related allowance |
|
|
|
|
|
|
|
|
|
|
|
|
|
|
|
|
| Commercial: |
|
|
|
|
|
|
|
| Commercial and industrial |
$ |
50 |
|
|
$ |
57 |
|
|
$ |
107 |
|
|
$ |
22 |
|
| Owner-occupied |
13 |
|
|
27 |
|
|
40 |
|
|
2 |
|
| Municipal |
— |
|
|
2 |
|
|
2 |
|
|
— |
|
| Leasing |
— |
|
|
4 |
|
|
4 |
|
|
1 |
|
| Total commercial |
63 |
|
|
90 |
|
|
153 |
|
|
25 |
|
| Commercial real estate: |
|
|
|
|
|
|
|
| Term |
1 |
|
|
69 |
|
|
70 |
|
|
3 |
|
|
|
|
|
|
|
|
|
| Total commercial real estate |
1 |
|
|
69 |
|
|
70 |
|
|
3 |
|
| Consumer: |
|
|
|
|
|
|
|
| 1-4 family residential |
11 |
|
|
52 |
|
|
63 |
|
|
4 |
|
| Home equity credit line |
— |
|
|
32 |
|
|
32 |
|
|
7 |
|
|
|
|
|
|
|
|
|
| Bankcard and other revolving plans |
— |
|
|
1 |
|
|
1 |
|
|
1 |
|
|
|
|
|
|
|
|
|
| Total consumer |
11 |
|
|
85 |
|
|
96 |
|
|
12 |
|
| Total |
$ |
75 |
|
|
$ |
244 |
|
|
$ |
319 |
|
|
$ |
40 |
|
ZIONS BANCORPORATION, NATIONAL ASSOCIATION AND SUBSIDIARIES
|
|
|
|
|
|
|
|
|
|
|
|
|
|
|
|
|
|
|
|
|
|
|
|
|
December 31, 2024 |
|
Amortized cost basis |
|
Total amortized cost basis |
|
|
| (In millions) |
with no allowance |
|
with allowance |
|
|
Related allowance |
|
|
|
|
|
|
|
|
|
|
|
|
|
|
|
|
|
|
|
|
|
|
|
|
| Commercial: |
|
|
|
|
|
|
|
| Commercial and industrial |
$ |
45 |
|
|
$ |
69 |
|
|
$ |
114 |
|
|
$ |
19 |
|
| Owner-occupied |
18 |
|
|
13 |
|
|
31 |
|
|
1 |
|
| Municipal |
5 |
|
|
6 |
|
|
11 |
|
|
2 |
|
| Leasing |
— |
|
|
2 |
|
|
2 |
|
|
1 |
|
| Total commercial |
68 |
|
|
90 |
|
|
158 |
|
|
23 |
|
| Commercial real estate: |
|
|
|
|
|
|
|
| Term |
27 |
|
|
32 |
|
|
59 |
|
|
4 |
|
|
|
|
|
|
|
|
|
| Total commercial real estate |
27 |
|
|
32 |
|
|
59 |
|
|
4 |
|
| Consumer: |
|
|
|
|
|
|
|
| 1-4 family residential |
12 |
|
|
37 |
|
|
49 |
|
|
4 |
|
| Home equity credit line |
5 |
|
|
25 |
|
|
30 |
|
|
5 |
|
|
|
|
|
|
|
|
|
| Bankcard and other revolving plans |
— |
|
|
1 |
|
|
1 |
|
|
1 |
|
|
|
|
|
|
|
|
|
| Total consumer |
17 |
|
|
63 |
|
|
80 |
|
|
10 |
|
| Total |
$ |
112 |
|
|
$ |
185 |
|
|
$ |
297 |
|
|
$ |
37 |
|
For accruing loans, interest is accrued, and interest payments are recognized as interest income in accordance with the contractual terms of the loan agreement. For nonaccruing loans, the accrual of interest is discontinued, and any previously accrued but uncollected interest is promptly reversed from interest income, generally within one month. Payments received on nonaccrual loans are not recognized as interest income, but are applied to reduce the outstanding principal balance. However, when the collectability of the amortized cost basis of a nonaccrual loan is no longer in doubt, interest payments may be recognized as interest income on a cash basis. For the three and nine months ended September 30, 2025 and 2024, no interest income was recognized on a cash basis for nonaccrual loans.
The following schedule presents the amount of accrued interest receivables reversed from interest income, categorized by loan portfolio segment during the periods presented:
|
|
|
|
|
|
|
|
|
|
|
|
|
|
|
|
|
|
|
|
|
|
|
|
|
Three Months Ended
September 30, |
|
Nine Months Ended
September 30, |
| (In millions) |
2025 |
|
2024 |
|
2025 |
|
2024 |
|
|
|
|
|
|
|
|
| Commercial |
$ |
4 |
|
|
$ |
5 |
|
|
$ |
5 |
|
|
$ |
10 |
|
| Commercial real estate |
1 |
|
|
1 |
|
|
4 |
|
|
4 |
|
| Consumer |
1 |
|
|
1 |
|
|
3 |
|
|
3 |
|
| Total |
$ |
6 |
|
|
$ |
7 |
|
|
$ |
12 |
|
|
$ |
17 |
|
Past Due Loans
Closed-end loans with payments scheduled monthly are reported as past due when the borrower is in arrears for two or more monthly payments. Similarly, open-end credits, such as bankcard and other revolving credit plans, are reported as past due when the minimum payment has not been made for two or more billing cycles. Other multi-payment obligations (i.e., quarterly, semi-annual, etc.), single payment, and demand notes, are reported as past due when either principal or interest is due and unpaid for a period of 30 days or more.
ZIONS BANCORPORATION, NATIONAL ASSOCIATION AND SUBSIDIARIES
Past due loans (accruing and nonaccruing) are summarized as follows:
|
|
|
|
|
|
|
|
|
|
|
|
|
|
|
|
|
|
|
|
|
|
|
|
|
|
|
|
|
|
|
|
|
|
|
|
|
|
|
|
|
|
|
September 30, 2025 |
| (In millions) |
Current |
|
30-89 days
past due |
|
90+ days
past due |
|
Total
past due |
|
Total
loans |
|
Accruing
loans
90+ days
past due |
|
Nonaccrual
loans
that are
current 1
|
|
|
|
|
|
|
|
|
|
|
|
|
|
|
| Commercial: |
|
|
|
|
|
|
|
|
|
|
|
|
|
| Commercial and industrial |
$ |
17,188 |
|
|
$ |
18 |
|
|
$ |
16 |
|
|
$ |
34 |
|
|
$ |
17,222 |
|
|
$ |
3 |
|
|
$ |
92 |
|
| Owner-occupied |
9,231 |
|
|
17 |
|
|
19 |
|
|
36 |
|
|
9,267 |
|
|
— |
|
|
15 |
|
| Municipal |
4,341 |
|
|
— |
|
|
— |
|
|
— |
|
|
4,341 |
|
|
— |
|
|
2 |
|
| Leasing |
347 |
|
|
1 |
|
|
1 |
|
|
2 |
|
|
349 |
|
|
— |
|
|
2 |
|
| Total commercial |
31,107 |
|
|
36 |
|
|
36 |
|
|
72 |
|
|
31,179 |
|
|
3 |
|
|
111 |
|
| Commercial real estate: |
|
|
|
|
|
|
|
|
|
|
|
|
|
Term |
10,941 |
|
|
35 |
|
|
32 |
|
|
67 |
|
|
11,008 |
|
|
1 |
|
|
23 |
|
| Construction and land development |
2,469 |
|
|
— |
|
|
— |
|
|
— |
|
|
2,469 |
|
|
— |
|
|
— |
|
| Total commercial real estate |
13,410 |
|
|
35 |
|
|
32 |
|
|
67 |
|
|
13,477 |
|
|
1 |
|
|
23 |
|
| Consumer: |
|
|
|
|
|
|
|
|
|
|
|
|
|
| 1-4 family residential |
10,374 |
|
|
12 |
|
|
37 |
|
|
49 |
|
|
10,423 |
|
|
— |
|
|
23 |
|
| Home equity credit line |
3,820 |
|
|
16 |
|
|
12 |
|
|
28 |
|
|
3,848 |
|
|
— |
|
|
15 |
|
Construction and other consumer real estate |
768 |
|
|
1 |
|
|
— |
|
|
1 |
|
|
769 |
|
|
— |
|
|
— |
|
Bankcard and other revolving plans |
473 |
|
|
3 |
|
|
1 |
|
|
4 |
|
|
477 |
|
|
1 |
|
|
— |
|
| Other |
129 |
|
|
— |
|
|
— |
|
|
— |
|
|
129 |
|
|
— |
|
|
1 |
|
| Total consumer |
15,564 |
|
|
32 |
|
|
50 |
|
|
82 |
|
|
15,646 |
|
|
1 |
|
|
39 |
|
| Total |
$ |
60,081 |
|
|
$ |
103 |
|
|
$ |
118 |
|
|
$ |
221 |
|
|
$ |
60,302 |
|
|
$ |
5 |
|
|
$ |
173 |
|
|
|
|
|
|
|
|
|
|
|
|
|
|
|
|
|
|
|
|
|
|
|
|
|
|
|
|
|
|
|
|
|
|
|
|
|
|
|
|
|
|
|
|
December 31, 2024 |
| (In millions) |
Current |
|
30-89 days
past due |
|
90+ days
past due |
|
Total
past due |
|
Total
loans |
|
Accruing
loans
90+ days
past due |
|
Nonaccrual
loans
that are
current 1
|
|
|
|
|
|
|
|
|
|
|
|
|
|
|
| Commercial: |
|
|
|
|
|
|
|
|
|
|
|
|
|
| Commercial and industrial |
$ |
16,857 |
|
|
$ |
20 |
|
|
$ |
14 |
|
|
$ |
34 |
|
|
$ |
16,891 |
|
|
$ |
1 |
|
|
$ |
98 |
|
| Owner-occupied |
9,309 |
|
|
10 |
|
|
14 |
|
|
24 |
|
|
9,333 |
|
|
3 |
|
|
16 |
|
| Municipal |
4,348 |
|
|
6 |
|
|
10 |
|
|
16 |
|
|
4,364 |
|
|
10 |
|
|
11 |
|
| Leasing |
377 |
|
|
— |
|
|
— |
|
|
— |
|
|
377 |
|
|
— |
|
|
2 |
|
| Total commercial |
30,891 |
|
|
36 |
|
|
38 |
|
|
74 |
|
|
30,965 |
|
|
14 |
|
|
127 |
|
| Commercial real estate: |
|
|
|
|
|
|
|
|
|
|
|
|
|
Term |
10,667 |
|
|
2 |
|
|
34 |
|
|
36 |
|
|
10,703 |
|
|
3 |
|
|
28 |
|
| Construction and land development |
2,774 |
|
|
— |
|
|
— |
|
|
— |
|
|
2,774 |
|
|
— |
|
|
— |
|
| Total commercial real estate |
13,441 |
|
|
2 |
|
|
34 |
|
|
36 |
|
|
13,477 |
|
|
3 |
|
|
28 |
|
| Consumer: |
|
|
|
|
|
|
|
|
|
|
|
|
|
| 1-4 family residential |
9,896 |
|
|
16 |
|
|
27 |
|
|
43 |
|
|
9,939 |
|
|
— |
|
|
15 |
|
| Home equity credit line |
3,609 |
|
|
20 |
|
|
12 |
|
|
32 |
|
|
3,641 |
|
|
— |
|
|
13 |
|
Construction and other consumer real estate |
810 |
|
|
— |
|
|
— |
|
|
— |
|
|
810 |
|
|
— |
|
|
— |
|
Bankcard and other revolving plans |
453 |
|
|
2 |
|
|
2 |
|
|
4 |
|
|
457 |
|
|
1 |
|
|
— |
|
| Other |
121 |
|
|
— |
|
|
— |
|
|
— |
|
|
121 |
|
|
— |
|
|
— |
|
| Total consumer |
14,889 |
|
|
38 |
|
|
41 |
|
|
79 |
|
|
14,968 |
|
|
1 |
|
|
28 |
|
| Total |
$ |
59,221 |
|
|
$ |
76 |
|
|
$ |
113 |
|
|
$ |
189 |
|
|
$ |
59,410 |
|
|
$ |
18 |
|
|
$ |
183 |
|
1 Represents nonaccrual loans that are not past due more than 30 days; however, full payment of principal and interest is not expected.
ZIONS BANCORPORATION, NATIONAL ASSOCIATION AND SUBSIDIARIES
Credit Quality Indicators
In addition to the nonaccrual and past due criteria, we also analyze loans using loan risk-grading systems, which vary based on the size and type of credit risk exposure. The internal risk grades assigned to loans follow our definition of Pass, Special Mention, Substandard, and Doubtful, which align with published regulatory risk classifications.
Definitions of Pass, Special Mention, Substandard, and Doubtful are summarized as follows:
•Pass — A Pass asset is higher-quality and does not fit any of the other categories described below. The likelihood of loss is considered low.
•Special Mention — A Special Mention asset has potential weaknesses that warrant management’s close attention. If left uncorrected, these potential weaknesses may result in deterioration of the repayment prospects for the asset or our credit position at some future date.
•Substandard — A Substandard asset is inadequately protected by the current sound worth and paying capacity of the obligor or the collateral pledged, if any. Assets classified as Substandard have well-defined weaknesses and are characterized by the distinct possibility that we may sustain some loss if deficiencies are not corrected.
•Doubtful — A Doubtful asset has all the weaknesses inherent in a Substandard asset, with the added characteristics that the weaknesses make collection or liquidation in full highly questionable and improbable.
The amount of loans classified as Doubtful totaled $10 million at September 30, 2025, compared with $14 million at December 31, 2024, and are included in the nonaccrual balances in the schedule below.
For commercial and CRE loans with commitments greater than $1 million, we assign one of multiple grades within the Pass classification or one of the previously described risk classifications. We assess our internal risk grades quarterly, or as soon as we identify information that affects the credit risk of the loan.
For consumer loans and for commercial and CRE loans with commitments of $1 million or less, we generally assign internal risk grades similar to those previously described based on automated rules that consider refreshed credit scores, payment performance, and other risk indicators. These loans are generally assigned either a Pass, Special Mention, or Substandard grade, and are reviewed as we identify information that might warrant a grade change.
The following schedule presents the amortized cost basis of loans and leases categorized by year of origination and by credit quality classification as monitored by management. Loans that have been modified resulting in substantially different terms than the original loan are included in the period in which the modification occurred.
ZIONS BANCORPORATION, NATIONAL ASSOCIATION AND SUBSIDIARIES
|
|
|
|
|
|
|
|
|
|
|
|
|
|
|
|
|
|
|
|
|
|
|
|
|
|
|
|
|
|
|
September 30, 2025 |
|
Term loans |
Revolving loans amortized cost basis |
Revolving loans converted to term loans amortized cost basis |
|
|
Amortized cost basis by year of origination |
|
| (In millions) |
2025 |
2024 |
2023 |
2022 |
2021 |
Prior |
Total |
| Commercial: |
|
|
|
|
|
|
|
|
|
| Commercial and industrial |
|
|
|
|
|
|
|
|
|
| Pass |
$ |
2,491 |
|
$ |
2,136 |
|
$ |
1,453 |
|
$ |
1,014 |
|
$ |
434 |
|
$ |
749 |
|
$ |
8,082 |
|
$ |
149 |
|
$ |
16,508 |
|
| Special Mention |
10 |
|
58 |
|
7 |
|
2 |
|
11 |
|
14 |
|
87 |
|
5 |
|
194 |
|
| Accruing Substandard |
1 |
|
60 |
|
59 |
|
70 |
|
19 |
|
31 |
|
162 |
|
11 |
|
413 |
|
| Nonaccrual |
4 |
|
4 |
|
3 |
|
39 |
|
3 |
|
6 |
|
21 |
|
27 |
|
107 |
|
| Total commercial and industrial |
2,506 |
|
2,258 |
|
1,522 |
|
1,125 |
|
467 |
|
800 |
|
8,352 |
|
192 |
|
17,222 |
|
| Owner-occupied |
|
|
|
|
|
|
|
|
|
| Pass |
809 |
|
1,323 |
|
757 |
|
1,457 |
|
1,506 |
|
2,651 |
|
237 |
|
50 |
|
8,790 |
|
| Special Mention |
2 |
|
2 |
|
— |
|
11 |
|
12 |
|
24 |
|
— |
|
1 |
|
52 |
|
| Accruing Substandard |
11 |
|
24 |
|
17 |
|
112 |
|
93 |
|
101 |
|
24 |
|
3 |
|
385 |
|
| Nonaccrual |
6 |
|
7 |
|
2 |
|
6 |
|
2 |
|
15 |
|
2 |
|
— |
|
40 |
|
| Total owner-occupied |
828 |
|
1,356 |
|
776 |
|
1,586 |
|
1,613 |
|
2,791 |
|
263 |
|
54 |
|
9,267 |
|
| Municipal |
|
|
|
|
|
|
|
|
|
| Pass |
350 |
|
624 |
|
422 |
|
869 |
|
886 |
|
1,124 |
|
2 |
|
41 |
|
4,318 |
|
| Special Mention |
— |
|
3 |
|
— |
|
— |
|
— |
|
— |
|
— |
|
— |
|
3 |
|
| Accruing Substandard |
— |
|
— |
|
— |
|
— |
|
— |
|
18 |
|
— |
|
— |
|
18 |
|
| Nonaccrual |
— |
|
— |
|
— |
|
— |
|
2 |
|
— |
|
— |
|
— |
|
2 |
|
| Total municipal |
350 |
|
627 |
|
422 |
|
869 |
|
888 |
|
1,142 |
|
2 |
|
41 |
|
4,341 |
|
| Leasing |
|
|
|
|
|
|
|
|
|
| Pass |
46 |
|
95 |
|
63 |
|
78 |
|
18 |
|
30 |
|
— |
|
— |
|
330 |
|
| Special Mention |
— |
|
— |
|
— |
|
— |
|
— |
|
— |
|
— |
|
— |
|
— |
|
| Accruing Substandard |
— |
|
1 |
|
2 |
|
10 |
|
1 |
|
1 |
|
— |
|
— |
|
15 |
|
| Nonaccrual |
— |
|
1 |
|
1 |
|
2 |
|
— |
|
— |
|
— |
|
— |
|
4 |
|
| Total leasing |
46 |
|
97 |
|
66 |
|
90 |
|
19 |
|
31 |
|
— |
|
— |
|
349 |
|
| Total commercial |
3,730 |
|
4,338 |
|
2,786 |
|
3,670 |
|
2,987 |
|
4,764 |
|
8,617 |
|
287 |
|
31,179 |
|
| Commercial real estate: |
|
|
|
|
|
|
|
|
|
| Term |
|
|
|
|
|
|
|
| Pass |
1,954 |
|
1,301 |
|
1,174 |
|
1,788 |
|
1,102 |
|
1,951 |
|
268 |
|
154 |
|
9,692 |
|
| Special Mention |
9 |
|
13 |
|
10 |
|
99 |
|
— |
|
1 |
|
— |
|
— |
|
132 |
|
| Accruing Substandard |
270 |
|
101 |
|
135 |
|
388 |
|
78 |
|
61 |
|
27 |
|
54 |
|
1,114 |
|
| Nonaccrual |
22 |
|
— |
|
16 |
|
22 |
|
— |
|
10 |
|
— |
|
— |
|
70 |
|
| Total term |
2,255 |
|
1,415 |
|
1,335 |
|
2,297 |
|
1,180 |
|
2,023 |
|
295 |
|
208 |
|
11,008 |
|
| Construction and land development |
|
|
|
|
|
|
|
|
| Pass |
293 |
|
530 |
|
513 |
|
127 |
|
1 |
|
2 |
|
739 |
|
41 |
|
2,246 |
|
| Special Mention |
— |
|
1 |
|
36 |
|
32 |
|
— |
|
— |
|
— |
|
— |
|
69 |
|
| Accruing Substandard |
51 |
|
8 |
|
47 |
|
48 |
|
— |
|
— |
|
— |
|
— |
|
154 |
|
| Nonaccrual |
— |
|
— |
|
— |
|
— |
|
— |
|
— |
|
— |
|
— |
|
— |
|
| Total construction and land development |
344 |
|
539 |
|
596 |
|
207 |
|
1 |
|
2 |
|
739 |
|
41 |
|
2,469 |
|
| Total commercial real estate |
2,599 |
|
1,954 |
|
1,931 |
|
2,504 |
|
1,181 |
|
2,025 |
|
1,034 |
|
249 |
|
13,477 |
|
ZIONS BANCORPORATION, NATIONAL ASSOCIATION AND SUBSIDIARIES
|
|
|
|
|
|
|
|
|
|
|
|
|
|
|
|
|
|
|
|
|
|
|
|
|
|
|
|
|
|
|
September 30, 2025 |
|
Term loans |
Revolving loans amortized cost basis |
Revolving loans converted to term loans amortized cost basis |
|
|
Amortized cost basis by year of origination |
|
| (In millions) |
2025 |
2024 |
2023 |
2022 |
2021 |
Prior |
Total |
|
|
|
|
|
|
|
|
|
|
|
|
|
|
|
|
|
|
|
|
|
|
|
|
|
|
|
|
|
|
|
|
|
|
|
|
|
|
|
|
|
|
|
|
|
|
|
|
|
|
|
|
|
|
|
|
|
|
|
|
|
|
|
|
|
|
|
|
|
|
|
|
|
|
|
|
|
|
|
|
|
|
|
|
|
|
|
|
|
|
|
|
|
|
|
|
|
|
|
|
|
|
|
|
|
|
|
|
|
|
|
|
|
|
|
|
|
|
|
|
|
|
|
|
|
|
|
|
|
|
|
|
|
|
|
|
|
|
| Consumer: |
|
|
|
|
|
|
|
|
|
| 1-4 family residential |
|
|
|
|
|
|
|
|
|
| Pass |
$ |
595 |
|
$ |
966 |
|
$ |
921 |
|
$ |
3,135 |
|
$ |
1,844 |
|
$ |
2,898 |
|
$ |
— |
|
$ |
— |
|
$ |
10,359 |
|
| Special Mention |
— |
|
— |
|
— |
|
— |
|
— |
|
— |
|
— |
|
— |
|
— |
|
| Accruing Substandard |
— |
|
— |
|
— |
|
— |
|
— |
|
1 |
|
— |
|
— |
|
1 |
|
| Nonaccrual |
1 |
|
2 |
|
5 |
|
13 |
|
14 |
|
28 |
|
— |
|
— |
|
63 |
|
| Total 1-4 family residential |
596 |
|
968 |
|
926 |
|
3,148 |
|
1,858 |
|
2,927 |
|
— |
|
— |
|
10,423 |
|
| Home equity credit line |
|
|
|
|
|
|
|
|
|
| Pass |
— |
|
— |
|
— |
|
— |
|
— |
|
— |
|
3,702 |
|
106 |
|
3,808 |
|
| Special Mention |
— |
|
— |
|
— |
|
— |
|
— |
|
— |
|
— |
|
— |
|
— |
|
| Accruing Substandard |
— |
|
— |
|
— |
|
— |
|
— |
|
— |
|
8 |
|
— |
|
8 |
|
| Nonaccrual |
— |
|
— |
|
— |
|
— |
|
— |
|
— |
|
28 |
|
4 |
|
32 |
|
| Total home equity credit line |
— |
|
— |
|
— |
|
— |
|
— |
|
— |
|
3,738 |
|
110 |
|
3,848 |
|
| Construction and other consumer real estate |
|
|
|
|
|
|
|
| Pass |
147 |
|
336 |
|
108 |
|
170 |
|
6 |
|
2 |
|
— |
|
— |
|
769 |
|
| Special Mention |
— |
|
— |
|
— |
|
— |
|
— |
|
— |
|
— |
|
— |
|
— |
|
| Accruing Substandard |
— |
|
— |
|
— |
|
— |
|
— |
|
— |
|
— |
|
— |
|
— |
|
| Nonaccrual |
— |
|
— |
|
— |
|
— |
|
— |
|
— |
|
— |
|
— |
|
— |
|
| Total construction and other consumer real estate |
147 |
|
336 |
|
108 |
|
170 |
|
6 |
|
2 |
|
— |
|
— |
|
769 |
|
| Bankcard and other revolving plans |
|
|
|
|
|
|
|
|
| Pass |
— |
|
— |
|
— |
|
— |
|
— |
|
— |
|
474 |
|
— |
|
474 |
|
| Special Mention |
— |
|
— |
|
— |
|
— |
|
— |
|
— |
|
— |
|
— |
|
— |
|
| Accruing Substandard |
— |
|
— |
|
— |
|
— |
|
— |
|
— |
|
2 |
|
— |
|
2 |
|
| Nonaccrual |
— |
|
— |
|
— |
|
— |
|
— |
|
— |
|
1 |
|
— |
|
1 |
|
| Total bankcard and other revolving plans |
— |
|
— |
|
— |
|
— |
|
— |
|
— |
|
477 |
|
— |
|
477 |
|
| Other consumer |
|
|
|
|
|
|
|
|
|
| Pass |
58 |
|
30 |
|
22 |
|
13 |
|
4 |
|
2 |
|
— |
|
— |
|
129 |
|
| Special Mention |
— |
|
— |
|
— |
|
— |
|
— |
|
— |
|
— |
|
— |
|
— |
|
| Accruing Substandard |
— |
|
— |
|
— |
|
— |
|
— |
|
— |
|
— |
|
— |
|
— |
|
| Nonaccrual |
— |
|
— |
|
— |
|
— |
|
— |
|
— |
|
— |
|
— |
|
— |
|
| Total other consumer |
58 |
|
30 |
|
22 |
|
13 |
|
4 |
|
2 |
|
— |
|
— |
|
129 |
|
| Total consumer |
801 |
|
1,334 |
|
1,056 |
|
3,331 |
|
1,868 |
|
2,931 |
|
4,215 |
|
110 |
|
15,646 |
|
| Total loans |
$ |
7,130 |
|
$ |
7,626 |
|
$ |
5,773 |
|
$ |
9,505 |
|
$ |
6,036 |
|
$ |
9,720 |
|
$ |
13,866 |
|
$ |
646 |
|
$ |
60,302 |
|
ZIONS BANCORPORATION, NATIONAL ASSOCIATION AND SUBSIDIARIES
|
|
|
|
|
|
|
|
|
|
|
|
|
|
|
|
|
|
|
|
|
|
|
|
|
|
|
|
|
|
|
December 31, 2024 |
|
Term loans |
Revolving loans amortized cost basis |
Revolving loans converted to term loans amortized cost basis |
|
|
Amortized cost basis by year of origination |
|
| (In millions) |
2024 |
2023 |
2022 |
2021 |
2020 |
Prior |
Total |
| Commercial: |
|
|
|
|
|
|
|
|
|
| Commercial and industrial |
|
|
|
|
|
|
|
|
|
| Pass |
$ |
2,479 |
|
$ |
1,951 |
|
$ |
1,504 |
|
$ |
759 |
|
$ |
387 |
|
$ |
679 |
|
$ |
8,043 |
|
$ |
150 |
|
$ |
15,952 |
|
| Special Mention |
37 |
|
24 |
|
47 |
|
8 |
|
2 |
|
34 |
|
85 |
|
5 |
|
242 |
|
| Accruing Substandard |
53 |
|
43 |
|
200 |
|
26 |
|
28 |
|
21 |
|
200 |
|
12 |
|
583 |
|
| Nonaccrual |
7 |
|
13 |
|
31 |
|
17 |
|
1 |
|
4 |
|
38 |
|
3 |
|
114 |
|
| Total commercial and industrial |
2,576 |
|
2,031 |
|
1,782 |
|
810 |
|
418 |
|
738 |
|
8,366 |
|
170 |
|
16,891 |
|
| Owner-occupied |
|
|
|
|
|
|
|
|
|
| Pass |
1,346 |
|
907 |
|
1,606 |
|
1,657 |
|
900 |
|
2,097 |
|
234 |
|
47 |
|
8,794 |
|
| Special Mention |
38 |
|
— |
|
38 |
|
31 |
|
2 |
|
18 |
|
18 |
|
1 |
|
146 |
|
| Accruing Substandard |
23 |
|
28 |
|
75 |
|
66 |
|
25 |
|
133 |
|
7 |
|
5 |
|
362 |
|
| Nonaccrual |
5 |
|
1 |
|
4 |
|
1 |
|
— |
|
15 |
|
5 |
|
— |
|
31 |
|
| Total owner-occupied |
1,412 |
|
936 |
|
1,723 |
|
1,755 |
|
927 |
|
2,263 |
|
264 |
|
53 |
|
9,333 |
|
| Municipal |
|
|
|
|
|
|
|
|
|
| Pass |
604 |
|
498 |
|
939 |
|
960 |
|
553 |
|
753 |
|
— |
|
29 |
|
4,336 |
|
| Special Mention |
— |
|
— |
|
— |
|
— |
|
— |
|
— |
|
— |
|
— |
|
— |
|
| Accruing Substandard |
10 |
|
4 |
|
— |
|
— |
|
— |
|
3 |
|
— |
|
— |
|
17 |
|
| Nonaccrual |
3 |
|
— |
|
— |
|
5 |
|
— |
|
3 |
|
— |
|
— |
|
11 |
|
| Total municipal |
617 |
|
502 |
|
939 |
|
965 |
|
553 |
|
759 |
|
— |
|
29 |
|
4,364 |
|
| Leasing |
|
|
|
|
|
|
|
|
|
| Pass |
109 |
|
79 |
|
94 |
|
26 |
|
12 |
|
36 |
|
— |
|
— |
|
356 |
|
| Special Mention |
— |
|
— |
|
2 |
|
— |
|
— |
|
— |
|
— |
|
— |
|
2 |
|
| Accruing Substandard |
1 |
|
3 |
|
10 |
|
2 |
|
1 |
|
— |
|
— |
|
— |
|
17 |
|
| Nonaccrual |
— |
|
1 |
|
1 |
|
— |
|
— |
|
— |
|
— |
|
— |
|
2 |
|
| Total leasing |
110 |
|
83 |
|
107 |
|
28 |
|
13 |
|
36 |
|
— |
|
— |
|
377 |
|
| Total commercial |
4,715 |
|
3,552 |
|
4,551 |
|
3,558 |
|
1,911 |
|
3,796 |
|
8,630 |
|
252 |
|
30,965 |
|
| Commercial real estate: |
|
|
|
|
|
|
|
|
|
| Term |
|
|
|
|
|
|
|
| Pass |
1,687 |
|
1,198 |
|
2,093 |
|
1,278 |
|
1,053 |
|
1,608 |
|
254 |
|
175 |
|
9,346 |
|
| Special Mention |
48 |
|
— |
|
87 |
|
— |
|
— |
|
5 |
|
— |
|
— |
|
140 |
|
| Accruing Substandard |
298 |
|
105 |
|
443 |
|
144 |
|
13 |
|
102 |
|
27 |
|
26 |
|
1,158 |
|
| Nonaccrual |
— |
|
— |
|
23 |
|
— |
|
— |
|
10 |
|
— |
|
26 |
|
59 |
|
| Total term |
2,033 |
|
1,303 |
|
2,646 |
|
1,422 |
|
1,066 |
|
1,725 |
|
281 |
|
227 |
|
10,703 |
|
| Construction and land development |
|
|
|
|
|
|
|
|
| Pass |
361 |
|
701 |
|
445 |
|
4 |
|
1 |
|
9 |
|
680 |
|
52 |
|
2,253 |
|
| Special Mention |
— |
|
22 |
|
21 |
|
17 |
|
— |
|
— |
|
— |
|
25 |
|
85 |
|
| Accruing Substandard |
57 |
|
52 |
|
249 |
|
78 |
|
— |
|
— |
|
— |
|
— |
|
436 |
|
| Nonaccrual |
— |
|
— |
|
— |
|
— |
|
— |
|
— |
|
— |
|
— |
|
— |
|
| Total construction and land development |
418 |
|
775 |
|
715 |
|
99 |
|
1 |
|
9 |
|
680 |
|
77 |
|
2,774 |
|
| Total commercial real estate |
2,451 |
|
2,078 |
|
3,361 |
|
1,521 |
|
1,067 |
|
1,734 |
|
961 |
|
304 |
|
13,477 |
|
ZIONS BANCORPORATION, NATIONAL ASSOCIATION AND SUBSIDIARIES
|
|
|
|
|
|
|
|
|
|
|
|
|
|
|
|
|
|
|
|
|
|
|
|
|
|
|
|
|
|
|
December 31, 2024 |
|
Term loans |
Revolving loans amortized cost basis |
Revolving loans converted to term loans amortized cost basis |
|
|
Amortized cost basis by year of origination |
|
| (In millions) |
2024 |
2023 |
2022 |
2021 |
2020 |
Prior |
Total |
|
|
|
|
|
|
|
|
|
|
|
|
|
|
|
|
|
|
|
|
|
|
|
|
|
|
|
|
|
|
|
|
|
|
|
|
|
|
|
|
|
|
|
|
|
|
|
|
|
|
|
|
|
|
|
|
|
|
|
|
|
|
|
|
|
|
|
|
|
|
|
|
|
|
|
|
|
|
|
|
|
|
|
|
|
|
|
|
|
|
|
|
|
|
|
|
|
|
|
|
|
|
|
|
|
|
|
|
|
|
|
|
|
|
|
|
|
|
|
|
|
|
|
|
|
|
|
|
|
|
|
|
|
|
|
|
|
|
| Consumer: |
|
|
|
|
|
|
|
|
|
| 1-4 family residential |
|
|
|
|
|
|
|
|
|
| Pass |
$ |
1,062 |
|
$ |
870 |
|
$ |
2,959 |
|
$ |
1,877 |
|
$ |
925 |
|
$ |
2,197 |
|
$ |
— |
|
$ |
— |
|
$ |
9,890 |
|
| Special Mention |
— |
|
— |
|
— |
|
— |
|
— |
|
— |
|
— |
|
— |
|
— |
|
| Accruing Substandard |
— |
|
— |
|
— |
|
— |
|
— |
|
— |
|
— |
|
— |
|
— |
|
| Nonaccrual |
— |
|
3 |
|
8 |
|
9 |
|
2 |
|
27 |
|
— |
|
— |
|
49 |
|
| Total 1-4 family residential |
1,062 |
|
873 |
|
2,967 |
|
1,886 |
|
927 |
|
2,224 |
|
— |
|
— |
|
9,939 |
|
| Home equity credit line |
|
|
|
|
|
|
|
|
|
| Pass |
— |
|
— |
|
— |
|
— |
|
— |
|
— |
|
3,506 |
|
99 |
|
3,605 |
|
| Special Mention |
— |
|
— |
|
— |
|
— |
|
— |
|
— |
|
— |
|
— |
|
— |
|
| Accruing Substandard |
— |
|
— |
|
— |
|
— |
|
— |
|
— |
|
6 |
|
— |
|
6 |
|
| Nonaccrual |
— |
|
— |
|
— |
|
— |
|
— |
|
— |
|
22 |
|
8 |
|
30 |
|
| Total home equity credit line |
— |
|
— |
|
— |
|
— |
|
— |
|
— |
|
3,534 |
|
107 |
|
3,641 |
|
| Construction and other consumer real estate |
|
|
|
|
|
|
|
| Pass |
157 |
|
191 |
|
420 |
|
34 |
|
5 |
|
3 |
|
— |
|
— |
|
810 |
|
| Special Mention |
— |
|
— |
|
— |
|
— |
|
— |
|
— |
|
— |
|
— |
|
— |
|
| Accruing Substandard |
— |
|
— |
|
— |
|
— |
|
— |
|
— |
|
— |
|
— |
|
— |
|
| Nonaccrual |
— |
|
— |
|
— |
|
— |
|
— |
|
— |
|
— |
|
— |
|
— |
|
| Total construction and other consumer real estate |
157 |
|
191 |
|
420 |
|
34 |
|
5 |
|
3 |
|
— |
|
— |
|
810 |
|
| Bankcard and other revolving plans |
|
|
|
|
|
|
|
|
| Pass |
— |
|
— |
|
— |
|
— |
|
— |
|
— |
|
453 |
|
1 |
|
454 |
|
| Special Mention |
— |
|
— |
|
— |
|
— |
|
— |
|
— |
|
— |
|
— |
|
— |
|
| Accruing Substandard |
— |
|
— |
|
— |
|
— |
|
— |
|
— |
|
2 |
|
— |
|
2 |
|
| Nonaccrual |
— |
|
— |
|
— |
|
— |
|
— |
|
— |
|
1 |
|
— |
|
1 |
|
| Total bankcard and other revolving plans |
— |
|
— |
|
— |
|
— |
|
— |
|
— |
|
456 |
|
1 |
|
457 |
|
| Other consumer |
|
|
|
|
|
|
|
|
|
| Pass |
52 |
|
35 |
|
22 |
|
8 |
|
2 |
|
2 |
|
— |
|
— |
|
121 |
|
| Special Mention |
— |
|
— |
|
— |
|
— |
|
— |
|
— |
|
— |
|
— |
|
— |
|
| Accruing Substandard |
— |
|
— |
|
— |
|
— |
|
— |
|
— |
|
— |
|
— |
|
— |
|
| Nonaccrual |
— |
|
— |
|
— |
|
— |
|
— |
|
— |
|
— |
|
— |
|
— |
|
| Total other consumer |
52 |
|
35 |
|
22 |
|
8 |
|
2 |
|
2 |
|
— |
|
— |
|
121 |
|
| Total consumer |
1,271 |
|
1,099 |
|
3,409 |
|
1,928 |
|
934 |
|
2,229 |
|
3,990 |
|
108 |
|
14,968 |
|
| Total loans |
$ |
8,437 |
|
$ |
6,729 |
|
$ |
11,321 |
|
$ |
7,007 |
|
$ |
3,912 |
|
$ |
7,759 |
|
$ |
13,581 |
|
$ |
664 |
|
$ |
59,410 |
|
ZIONS BANCORPORATION, NATIONAL ASSOCIATION AND SUBSIDIARIES
The following schedules present gross charge-offs by year of loan origination for the periods presented.
|
|
|
|
|
|
|
|
|
|
|
|
|
|
|
|
|
|
|
|
|
|
|
|
|
|
|
|
|
|
|
Three Months Ended September 30, 2025 |
|
Term loans |
Revolving loans
gross charge-offs |
Revolving loans converted to term loans gross charge-offs |
|
|
Gross charge-offs by year of loan origination |
|
| (In millions) |
2025 |
2024 |
2023 |
2022 |
2021 |
Prior |
Total |
| Commercial: |
|
|
|
|
|
|
|
|
|
| Commercial and industrial |
$ |
— |
|
$ |
1 |
|
$ |
— |
|
$ |
1 |
|
$ |
— |
|
$ |
1 |
|
$ |
55 |
|
$ |
— |
|
$ |
58 |
|
|
|
|
|
|
|
|
|
|
|
| Municipal |
— |
|
— |
|
— |
|
— |
|
3 |
|
— |
|
— |
|
— |
|
3 |
|
|
|
|
|
|
|
|
|
|
|
| Total commercial |
— |
|
1 |
|
— |
|
1 |
|
3 |
|
1 |
|
55 |
|
— |
|
61 |
|
| Commercial real estate: |
|
|
|
|
|
|
|
|
|
| Term |
— |
|
— |
|
3 |
|
— |
|
— |
|
— |
|
— |
|
— |
|
3 |
|
|
|
|
|
|
|
|
|
|
|
|
|
|
|
|
|
|
|
|
|
| Consumer: |
|
|
|
|
|
|
|
|
|
|
|
|
|
|
|
|
|
|
|
|
|
|
|
|
|
|
|
|
|
|
|
|
|
|
|
|
|
|
|
| Bankcard and other revolving plans |
— |
|
— |
|
— |
|
— |
|
— |
|
— |
|
2 |
|
— |
|
2 |
|
| Other |
— |
|
— |
|
— |
|
— |
|
— |
|
1 |
|
— |
|
— |
|
1 |
|
| Total consumer |
— |
|
— |
|
— |
|
— |
|
— |
|
1 |
|
2 |
|
— |
|
3 |
|
| Total gross charge-offs |
$ |
— |
|
$ |
1 |
|
$ |
3 |
|
$ |
1 |
|
$ |
3 |
|
$ |
2 |
|
$ |
57 |
|
$ |
— |
|
$ |
67 |
|
|
|
|
|
|
|
|
|
|
|
|
Nine Months Ended September 30, 2025 |
|
Term loans |
Revolving loans
gross charge-offs |
Revolving loans converted to term loans gross charge-offs |
|
|
Gross charge-offs by year of loan origination |
|
| (In millions) |
2025 |
2024 |
2023 |
2022 |
2021 |
Prior |
Total |
| Commercial: |
|
|
|
|
|
|
|
|
|
| Commercial and industrial |
$ |
— |
|
$ |
2 |
|
$ |
2 |
|
$ |
2 |
|
$ |
3 |
|
$ |
12 |
|
$ |
68 |
|
$ |
— |
|
$ |
89 |
|
|
|
|
|
|
|
|
|
|
|
| Municipal |
— |
|
— |
|
— |
|
— |
|
3 |
|
— |
|
— |
|
— |
|
3 |
|
| Leasing |
— |
|
— |
|
— |
|
— |
|
— |
|
— |
|
— |
|
— |
|
— |
|
| Total commercial |
— |
|
2 |
|
2 |
|
2 |
|
6 |
|
12 |
|
68 |
|
— |
|
92 |
|
| Commercial real estate: |
|
|
|
|
|
|
|
|
|
| Term |
1 |
|
— |
|
3 |
|
— |
|
— |
|
— |
|
— |
|
— |
|
4 |
|
|
|
|
|
|
|
|
|
|
|
|
|
|
|
|
|
|
|
|
|
| Consumer: |
|
|
|
|
|
|
|
|
|
| 1-4 family residential |
— |
|
— |
|
— |
|
— |
|
1 |
|
2 |
|
— |
|
— |
|
3 |
|
| Home equity credit line |
— |
|
— |
|
— |
|
— |
|
— |
|
— |
|
1 |
|
— |
|
1 |
|
|
|
|
|
|
|
|
|
|
|
| Bankcard and other revolving plans |
— |
|
— |
|
— |
|
— |
|
— |
|
— |
|
6 |
|
— |
|
6 |
|
| Other |
— |
|
— |
|
— |
|
— |
|
— |
|
1 |
|
— |
|
— |
|
1 |
|
| Total consumer |
— |
|
— |
|
— |
|
— |
|
1 |
|
3 |
|
7 |
|
— |
|
11 |
|
| Total gross charge-offs |
$ |
1 |
|
$ |
2 |
|
$ |
5 |
|
$ |
2 |
|
$ |
7 |
|
$ |
15 |
|
$ |
75 |
|
$ |
— |
|
$ |
107 |
|
ZIONS BANCORPORATION, NATIONAL ASSOCIATION AND SUBSIDIARIES
|
|
|
|
|
|
|
|
|
|
|
|
|
|
|
|
|
|
|
|
|
|
|
|
|
|
|
|
|
|
|
Three Months Ended September 30, 2024 |
|
Term loans |
Revolving loans
gross charge-offs |
Revolving loans converted to term loans gross charge-offs |
|
|
Gross charge-offs by year of loan origination |
|
| (In millions) |
2024 |
2023 |
2022 |
2021 |
2020 |
Prior |
Total |
| Commercial: |
|
|
|
|
|
|
|
|
|
| Commercial and industrial |
$ |
— |
|
$ |
1 |
|
$ |
4 |
|
$ |
— |
|
$ |
— |
|
$ |
1 |
|
$ |
4 |
|
$ |
1 |
|
$ |
11 |
|
| Owner-occupied |
— |
|
— |
|
1 |
|
— |
|
— |
|
— |
|
— |
|
— |
|
1 |
|
|
|
|
|
|
|
|
|
|
|
|
|
|
|
|
|
|
|
|
|
| Total commercial |
— |
|
1 |
|
5 |
|
— |
|
— |
|
1 |
|
4 |
|
1 |
|
12 |
|
|
|
|
|
|
|
|
|
|
|
|
|
|
|
|
|
|
|
|
|
|
|
|
|
|
|
|
|
|
|
|
|
|
|
|
|
|
|
|
|
| Consumer: |
|
|
|
|
|
|
|
|
|
|
|
|
|
|
|
|
|
|
|
| Home equity credit line |
— |
|
— |
|
— |
|
— |
|
— |
|
— |
|
1 |
|
— |
|
1 |
|
|
|
|
|
|
|
|
|
|
|
| Bankcard and other revolving plans |
— |
|
— |
|
— |
|
— |
|
— |
|
— |
|
2 |
|
— |
|
2 |
|
|
|
|
|
|
|
|
|
|
|
| Total consumer |
— |
|
— |
|
— |
|
— |
|
— |
|
— |
|
3 |
|
— |
|
3 |
|
| Total gross charge-offs |
$ |
— |
|
$ |
1 |
|
$ |
5 |
|
$ |
— |
|
$ |
— |
|
$ |
1 |
|
$ |
7 |
|
$ |
1 |
|
$ |
15 |
|
|
|
|
|
|
|
|
|
|
|
|
Nine Months Ended September 30, 2024 |
|
Term loans |
Revolving loans
gross charge-offs |
Revolving loans converted to term loans gross charge-offs |
|
|
Gross charge-offs by year of loan origination |
|
| (In millions) |
2024 |
2023 |
2022 |
2021 |
2020 |
Prior |
Total |
| Commercial: |
|
|
|
|
|
|
|
|
|
| Commercial and industrial |
$ |
— |
|
$ |
3 |
|
$ |
8 |
|
$ |
2 |
|
$ |
— |
|
$ |
4 |
|
$ |
10 |
|
$ |
2 |
|
$ |
29 |
|
| Owner occupied |
— |
|
— |
|
1 |
|
— |
|
— |
|
— |
|
— |
|
— |
|
1 |
|
|
|
|
|
|
|
|
|
|
|
|
|
|
|
|
|
|
|
|
|
| Total commercial |
— |
|
3 |
|
9 |
|
2 |
|
— |
|
4 |
|
10 |
|
2 |
|
30 |
|
| Commercial real estate: |
|
|
|
|
|
|
|
|
|
| Term |
— |
|
7 |
|
4 |
|
— |
|
— |
|
— |
|
— |
|
— |
|
11 |
|
|
|
|
|
|
|
|
|
|
|
|
|
|
|
|
|
|
|
|
|
| Consumer: |
|
|
|
|
|
|
|
|
|
| 1-4 family residential |
— |
|
— |
|
— |
|
— |
|
— |
|
1 |
|
— |
|
— |
|
1 |
|
| Home equity credit line |
— |
|
— |
|
— |
|
— |
|
— |
|
— |
|
1 |
|
— |
|
1 |
|
|
|
|
|
|
|
|
|
|
|
| Bankcard and other revolving plans |
— |
|
— |
|
— |
|
— |
|
— |
|
— |
|
6 |
|
— |
|
6 |
|
| Other |
— |
|
— |
|
— |
|
— |
|
— |
|
1 |
|
— |
|
— |
|
1 |
|
| Total consumer |
— |
|
— |
|
— |
|
— |
|
— |
|
2 |
|
7 |
|
— |
|
9 |
|
| Total gross charge-offs |
$ |
— |
|
$ |
10 |
|
$ |
13 |
|
$ |
2 |
|
$ |
— |
|
$ |
6 |
|
$ |
17 |
|
$ |
2 |
|
$ |
50 |
|
Loan Modifications
Loans may be modified in the normal course of business for competitive reasons or to strengthen our collateral position. Loan modifications may also occur when the borrower experiences financial difficulty and needs temporary or permanent relief from the original contractual terms of the loan. For loans that have been modified with a borrower experiencing financial difficulty, we use the same credit loss estimation methods that we use for the rest of the loan portfolio. These methods incorporate the post-modification loan terms, as well as defaults and charge-offs associated with historical modified loans. All nonaccruing loans more than $1 million are evaluated individually, regardless of modification.
We consider many factors in determining whether to agree to a loan modification and we seek a solution that will both minimize potential loss to us and attempt to help the borrower. We evaluate borrowers’ current and forecasted future cash flows, their ability and willingness to make current contractual or proposed modified payments, the value of the underlying collateral (if applicable), the possibility of obtaining additional security or guarantees, and the potential costs related to a repossession or foreclosure and the subsequent sale of the collateral.
ZIONS BANCORPORATION, NATIONAL ASSOCIATION AND SUBSIDIARIES
A modified loan on nonaccrual will generally remain on nonaccrual until the borrower has proven the ability to perform under the modified structure for a minimum of six months, and there is evidence that such payments can and are likely to continue as agreed. Performance prior to the modification, or significant events that coincide with the modification, are included in assessing whether the borrower can meet the new terms and may result in the loan being returned to accrual at the time of modification or after a shorter performance period. If the borrower’s ability to meet the revised payment schedule is uncertain, the loan remains on nonaccrual.
On an ongoing basis, we monitor the performance of all modified loans in accordance with their modified terms. For the three and nine months ended September 30, 2025, the amortized cost of modified loans that experienced a payment default within 12 months of modification and remained in default at period end was approximately $2 million and $4 million, respectively. For the three and nine months ended September 30, 2024, the corresponding amounts were $5 million for both periods.
The amortized cost of loans to borrowers experiencing financial difficulty that were modified during the period, by loan class and modification type, is summarized in the following schedule:
|
|
|
|
|
|
|
|
|
|
|
|
|
|
|
|
|
|
|
|
|
|
|
|
|
|
|
|
|
|
|
|
|
|
|
|
|
|
|
|
|
|
|
|
|
Three Months Ended September 30, 2025 |
|
Amortized cost associated with
the following modification types: |
|
|
|
|
| (Dollar amounts in millions) |
Interest
rate reduction |
|
Maturity
or term
extension |
|
Principal
forgiveness |
|
Payment
deferral |
|
|
|
Multiple modification types 1 |
|
Total 2 |
|
Percentage of total loans 3 |
| Commercial: |
|
|
|
|
|
|
|
|
|
|
|
|
|
|
|
| Commercial and industrial |
$ |
— |
|
|
$ |
58 |
|
|
$ |
— |
|
|
$ |
— |
|
|
|
|
$ |
— |
|
|
$ |
58 |
|
|
0.3 |
% |
| Owner-occupied |
— |
|
|
23 |
|
|
— |
|
|
— |
|
|
|
|
— |
|
|
23 |
|
|
0.2 |
|
|
|
|
|
|
|
|
|
|
|
|
|
|
|
|
|
| Total commercial |
— |
|
|
81 |
|
|
— |
|
|
— |
|
|
|
|
— |
|
|
81 |
|
|
0.3 |
|
| Commercial real estate: |
|
|
|
|
|
|
|
|
|
|
|
|
|
|
|
Term |
— |
|
|
128 |
|
|
— |
|
|
— |
|
|
|
|
— |
|
|
128 |
|
|
1.2 |
|
Construction and land development |
— |
|
|
1 |
|
|
— |
|
|
— |
|
|
|
|
— |
|
|
1 |
|
|
— |
|
| Total commercial real estate |
— |
|
|
129 |
|
|
— |
|
|
— |
|
|
|
|
— |
|
|
129 |
|
|
1.0 |
|
| Consumer: |
|
|
|
|
|
|
|
|
|
|
|
|
|
|
|
| 1-4 family residential |
— |
|
|
— |
|
|
2 |
|
|
— |
|
|
|
|
4 |
|
|
6 |
|
|
0.1 |
|
|
|
|
|
|
|
|
|
|
|
|
|
|
|
|
|
|
|
|
|
|
|
|
|
|
|
|
|
|
|
|
|
|
|
|
|
|
|
|
|
|
|
|
|
|
|
|
|
|
|
|
|
|
|
|
|
|
|
|
|
|
|
|
|
|
|
|
|
|
|
|
|
|
|
|
|
|
|
|
|
| Total |
$ |
— |
|
|
$ |
210 |
|
|
$ |
2 |
|
|
$ |
— |
|
|
|
|
$ |
4 |
|
|
$ |
216 |
|
|
0.4 |
|
|
|
|
|
|
|
|
|
|
|
|
|
|
|
|
|
|
|
|
|
|
|
|
|
|
|
|
|
|
|
|
|
|
|
|
|
|
|
|
|
|
|
|
Nine Months Ended September 30, 2025 |
|
Amortized cost associated with
the following modification types: |
|
|
|
|
| (Dollar amounts in millions) |
Interest
rate reduction |
|
Maturity
or term
extension |
|
Principal
forgiveness |
|
Payment
deferral |
|
Multiple modification types 1 |
|
Total 2 |
|
Percentage of total loans 3 |
| Commercial: |
|
|
|
|
|
|
|
|
|
|
|
|
|
| Commercial and industrial |
$ |
— |
|
|
$ |
106 |
|
|
$ |
— |
|
|
$ |
— |
|
|
$ |
— |
|
|
$ |
106 |
|
|
0.6 |
% |
| Owner-occupied |
— |
|
|
25 |
|
|
— |
|
|
— |
|
|
— |
|
|
25 |
|
|
0.3 |
|
|
|
|
|
|
|
|
|
|
|
|
|
|
|
| Total commercial |
— |
|
|
131 |
|
|
— |
|
|
— |
|
|
— |
|
|
131 |
|
|
0.4 |
|
| Commercial real estate: |
|
|
|
|
|
|
|
|
|
|
|
|
|
Term |
— |
|
|
322 |
|
|
— |
|
|
8 |
|
|
7 |
|
|
337 |
|
|
3.1 |
|
Construction and land development |
— |
|
|
26 |
|
|
— |
|
|
— |
|
|
— |
|
|
26 |
|
|
1.1 |
|
| Total commercial real estate |
— |
|
|
348 |
|
|
— |
|
|
8 |
|
|
7 |
|
|
363 |
|
|
2.7 |
|
| Consumer: |
|
|
|
|
|
|
|
|
|
|
|
|
|
| 1-4 family residential |
— |
|
|
— |
|
|
2 |
|
|
— |
|
|
7 |
|
|
9 |
|
|
0.1 |
|
| Home equity credit line |
— |
|
|
— |
|
|
— |
|
|
— |
|
|
1 |
|
|
1 |
|
|
— |
|
|
|
|
|
|
|
|
|
|
|
|
|
|
|
|
|
|
|
|
|
|
|
|
|
|
|
|
|
|
|
|
|
|
|
|
|
|
|
|
|
|
|
| Total consumer |
— |
|
|
— |
|
|
2 |
|
|
— |
|
|
8 |
|
|
10 |
|
|
0.1 |
|
| Total |
$ |
— |
|
|
$ |
479 |
|
|
$ |
2 |
|
|
$ |
8 |
|
|
$ |
15 |
|
|
$ |
504 |
|
|
0.8 |
|
ZIONS BANCORPORATION, NATIONAL ASSOCIATION AND SUBSIDIARIES
|
|
|
|
|
|
|
|
|
|
|
|
|
|
|
|
|
|
|
|
|
|
|
|
|
|
|
|
|
|
|
|
|
|
|
|
|
|
|
|
|
|
|
|
|
Three Months Ended September 30, 2024 |
|
Amortized cost associated with
the following modification types: |
|
|
|
|
| (Dollar amounts in millions) |
Interest
rate reduction |
|
Maturity
or term
extension |
|
Principal
forgiveness |
|
Payment
deferral |
|
|
|
Multiple modification types 1 |
|
Total 2 |
|
Percentage of total loans 3 |
| Commercial: |
|
|
|
|
|
|
|
|
|
|
|
|
|
|
|
| Commercial and industrial |
$ |
9 |
|
|
$ |
11 |
|
|
$ |
— |
|
|
$ |
1 |
|
|
|
|
$ |
13 |
|
|
$ |
34 |
|
|
0.2 |
% |
|
|
|
|
|
|
|
|
|
|
|
|
|
|
|
|
|
|
|
|
|
|
|
|
|
|
|
|
|
|
|
|
|
|
|
|
|
|
|
|
|
|
|
|
|
|
|
|
| Commercial real estate: |
|
|
|
|
|
|
|
|
|
|
|
|
|
|
|
Term |
— |
|
|
33 |
|
|
— |
|
|
— |
|
|
|
|
36 |
|
|
69 |
|
|
0.6 |
|
Construction and land development |
— |
|
|
5 |
|
|
— |
|
|
— |
|
|
|
|
— |
|
|
5 |
|
|
0.2 |
|
| Total commercial real estate |
— |
|
|
38 |
|
|
— |
|
|
— |
|
|
|
|
36 |
|
|
74 |
|
|
0.5 |
|
|
|
|
|
|
|
|
|
|
|
|
|
|
|
|
|
|
|
|
|
|
|
|
|
|
|
|
|
|
|
|
|
|
|
|
|
|
|
|
|
|
|
|
|
|
|
|
|
|
|
|
|
|
|
|
|
|
|
|
|
|
|
|
|
|
|
|
|
|
|
|
|
|
|
|
|
|
|
|
|
|
|
|
|
|
|
|
|
|
|
|
|
|
|
|
|
|
|
|
|
|
|
|
|
|
|
|
|
|
|
|
|
| Total |
$ |
9 |
|
|
$ |
49 |
|
|
$ |
— |
|
|
$ |
1 |
|
|
|
|
$ |
49 |
|
|
$ |
108 |
|
|
0.2 |
|
|
|
|
|
|
|
|
|
|
|
|
|
|
|
|
|
|
|
|
|
|
|
|
|
|
|
|
|
|
|
|
|
|
|
|
|
|
|
|
|
|
|
|
Nine Months Ended September 30, 2024 |
|
Amortized cost associated with
the following modification types: |
|
|
|
|
| (Dollar amounts in millions) |
Interest
rate reduction |
|
Maturity
or term
extension |
|
Principal
forgiveness |
|
Payment
deferral |
|
Multiple modification types 1 |
|
Total 2 |
|
Percentage of total loans 3 |
| Commercial: |
|
|
|
|
|
|
|
|
|
|
|
|
|
| Commercial and industrial |
$ |
9 |
|
|
$ |
44 |
|
|
$ |
— |
|
|
$ |
2 |
|
|
$ |
22 |
|
|
$ |
77 |
|
|
0.5 |
% |
| Owner-occupied |
— |
|
|
1 |
|
|
— |
|
|
— |
|
|
— |
|
|
1 |
|
|
— |
|
| Municipal |
— |
|
|
3 |
|
|
— |
|
|
— |
|
|
— |
|
|
3 |
|
|
0.1 |
|
| Total commercial |
9 |
|
|
48 |
|
|
— |
|
|
2 |
|
|
22 |
|
|
81 |
|
|
0.3 |
|
| Commercial real estate: |
|
|
|
|
|
|
|
|
|
|
|
|
|
Term |
— |
|
|
110 |
|
|
— |
|
|
— |
|
|
36 |
|
|
146 |
|
|
1.4 |
|
Construction and land development |
— |
|
|
7 |
|
|
— |
|
|
— |
|
|
— |
|
|
7 |
|
|
0.2 |
|
| Total commercial real estate |
— |
|
|
117 |
|
|
— |
|
|
— |
|
|
36 |
|
|
153 |
|
|
1.1 |
|
| Consumer: |
|
|
|
|
|
|
|
|
|
|
|
|
|
| 1-4 family residential |
— |
|
|
— |
|
|
2 |
|
|
— |
|
|
2 |
|
|
4 |
|
|
— |
|
| Home equity credit line |
— |
|
|
— |
|
|
— |
|
|
— |
|
|
1 |
|
|
1 |
|
|
— |
|
|
|
|
|
|
|
|
|
|
|
|
|
|
|
|
|
|
|
|
|
|
|
|
|
|
|
|
|
| Other |
— |
|
|
1 |
|
|
— |
|
|
— |
|
|
— |
|
|
1 |
|
|
0.8 |
|
| Total consumer |
— |
|
|
1 |
|
|
2 |
|
|
— |
|
|
3 |
|
|
6 |
|
|
— |
|
| Total |
$ |
9 |
|
|
$ |
166 |
|
|
$ |
2 |
|
|
$ |
2 |
|
|
$ |
61 |
|
|
$ |
240 |
|
|
0.4 |
|
1 Includes modifications that resulted from a combination of interest rate reduction, maturity or term extension, principal forgiveness, and payment deferral modifications.
2 Unfunded lending commitments related to loans modified to borrowers experiencing financial difficulty totaled $29 million and $8 million at September 30, 2025 and September 30, 2024, respectively.
3 Amounts less than 0.05% are rounded to zero.
ZIONS BANCORPORATION, NATIONAL ASSOCIATION AND SUBSIDIARIES
The financial impact of loan modifications to borrowers experiencing financial difficulty is summarized in the following schedules:
|
|
|
|
|
|
|
|
|
|
|
|
|
|
|
|
|
|
|
|
|
|
|
|
|
|
|
|
|
|
|
|
|
Three Months Ended
September 30, 2025 |
|
Nine Months Ended
September 30, 2025 |
|
|
|
Weighted-average interest rate reduction (in percentage points) |
|
Weighted-average term extension
(in months) |
|
Weighted-average interest rate reduction (in percentage points) |
|
Weighted-average term extension
(in months) |
|
|
|
|
|
|
|
|
| Commercial: |
|
|
|
|
|
|
|
|
|
|
|
|
|
|
|
| Commercial and industrial |
— |
% |
|
8 |
|
— |
% |
|
10 |
|
|
|
|
|
|
|
|
| Owner-occupied |
— |
|
|
3 |
|
— |
|
|
19 |
|
|
|
|
|
|
|
|
|
|
|
|
|
|
|
|
|
|
|
|
|
|
|
|
|
|
|
|
|
|
|
|
|
|
|
|
|
|
|
|
| Total commercial |
— |
|
|
7 |
|
— |
|
|
11 |
|
|
|
|
|
|
|
|
| Commercial real estate: |
|
|
|
|
|
|
|
|
|
|
|
|
|
|
|
Term |
— |
|
|
8 |
|
0.1 |
|
|
12 |
|
|
|
|
|
|
|
|
| Construction and land development |
— |
|
|
3 |
|
— |
|
|
8 |
|
|
|
|
|
|
|
|
| Total commercial real estate |
— |
|
|
8 |
|
0.1 |
|
|
12 |
|
|
|
|
|
|
|
|
Consumer:1 |
|
|
|
|
|
|
|
|
|
|
|
|
|
|
|
| 1-4 family residential |
— |
|
|
11 |
|
0.9 |
|
|
7 |
|
|
|
|
|
|
|
|
| Home equity credit line |
— |
|
|
0 |
|
2.8 |
|
|
43 |
|
|
|
|
|
|
|
|
|
|
|
|
|
|
|
|
|
|
|
|
|
|
|
|
|
|
|
|
|
|
|
|
|
|
|
|
|
|
|
|
|
|
|
|
|
|
|
|
|
|
|
|
|
|
|
|
| Total consumer |
— |
|
|
11 |
|
2.4 |
|
|
9 |
|
|
|
|
|
|
|
|
| Total weighted average financial impact |
— |
|
|
7 |
|
0.3 |
|
|
11 |
|
|
|
|
|
|
|
|
|
|
|
|
|
|
|
|
|
|
|
|
|
|
|
|
|
|
|
|
|
|
|
|
|
Three Months Ended
September 30, 2024 |
|
Nine Months Ended
September 30, 2024 |
|
Weighted-average interest rate reduction (in percentage points) |
|
Weighted-average term extension
(in months) |
|
Weighted-average interest rate reduction (in percentage points) |
|
Weighted-average term extension
(in months) |
| Commercial: |
|
|
|
|
|
|
|
| Commercial and industrial |
0.3 |
% |
|
5 |
|
0.4 |
% |
|
7 |
| Owner-occupied |
— |
|
|
0 |
|
— |
|
|
3 |
| Municipal |
— |
|
|
0 |
|
— |
|
|
61 |
|
|
|
|
|
|
|
|
| Total commercial |
0.3 |
|
|
5 |
|
0.4 |
|
|
9 |
| Commercial real estate: |
|
|
|
|
|
|
|
Term |
0.2 |
|
|
3 |
|
0.2 |
|
|
10 |
| Construction and land development |
— |
|
|
8 |
|
— |
|
|
1 |
| Total commercial real estate |
0.2 |
|
|
8 |
|
0.2 |
|
|
10 |
Consumer:1 |
|
|
|
|
|
|
|
| 1-4 family residential |
— |
|
|
0 |
|
1.3 |
|
|
78 |
| Home equity credit line |
— |
|
|
0 |
|
6.8 |
|
|
44 |
|
|
|
|
|
|
|
|
|
|
|
|
|
|
|
|
| Other |
— |
|
|
0 |
|
— |
|
|
71 |
| Total consumer |
— |
|
|
0 |
|
8.0 |
|
|
67 |
| Total weighted average financial impact |
0.3 |
|
|
7 |
|
0.4 |
|
|
11 |
1 Primarily relates to a small number of loans within each consumer loan class.
For the three and nine months ended September 30, 2025, loan modifications granted to borrowers experiencing financial difficulty resulted in approximately $2 million in principal forgiveness across the total loan portfolio, compared with less than $1 million during the corresponding periods in 2024.
ZIONS BANCORPORATION, NATIONAL ASSOCIATION AND SUBSIDIARIES
The following schedule presents the aging of loans to borrowers experiencing financial difficulty that were modified on or after October 1, 2024 through September 30, 2025, presented by portfolio segment and loan class:
|
|
|
|
|
|
|
|
|
|
|
|
|
|
|
|
|
|
|
|
|
|
|
|
|
|
|
|
|
|
|
September 30, 2025 |
| (In millions) |
Current |
|
30-89 days
past due |
|
90+ days
past due |
|
Total
past due |
|
Total
amortized cost of loans |
|
|
|
|
|
|
|
|
|
|
| Commercial: |
|
|
|
|
|
|
|
|
|
| Commercial and industrial |
$ |
104 |
|
|
$ |
2 |
|
|
$ |
— |
|
|
$ |
2 |
|
|
$ |
106 |
|
| Owner-occupied |
32 |
|
|
— |
|
|
1 |
|
|
1 |
|
|
33 |
|
|
|
|
|
|
|
|
|
|
|
|
|
|
|
|
|
|
|
|
|
| Total commercial |
136 |
|
|
2 |
|
|
1 |
|
|
3 |
|
|
139 |
|
| Commercial real estate: |
|
|
|
|
|
|
|
|
|
| Term |
352 |
|
|
18 |
|
|
10 |
|
|
28 |
|
|
380 |
|
| Construction and land development |
26 |
|
|
— |
|
|
— |
|
|
— |
|
|
26 |
|
| Total commercial real estate |
378 |
|
|
18 |
|
|
10 |
|
|
28 |
|
|
406 |
|
| Consumer: |
|
|
|
|
|
|
|
|
|
| 1-4 family residential |
10 |
|
|
1 |
|
|
1 |
|
|
2 |
|
|
12 |
|
| Home equity credit line |
1 |
|
|
1 |
|
|
— |
|
|
1 |
|
|
2 |
|
|
|
|
|
|
|
|
|
|
|
|
|
|
|
|
|
|
|
|
|
|
|
|
|
|
|
|
|
|
|
| Total consumer |
11 |
|
|
2 |
|
|
1 |
|
|
3 |
|
|
14 |
|
| Total |
$ |
525 |
|
|
$ |
22 |
|
|
$ |
12 |
|
|
$ |
34 |
|
|
$ |
559 |
|
The following schedule presents the aging of loans to borrowers experiencing financial difficulty that were modified on or after October 1, 2023 through September 30, 2024, presented by portfolio segment and loan class:
|
|
|
|
|
|
|
|
|
|
|
|
|
|
|
|
|
|
|
|
|
|
|
|
|
|
|
|
|
|
|
September 30, 2024 |
| (In millions) |
Current |
|
30-89 days
past due |
|
90+ days
past due |
|
Total
past due |
|
Total
amortized cost of loans |
|
|
|
|
|
|
|
|
|
|
| Commercial: |
|
|
|
|
|
|
|
|
|
| Commercial and industrial |
$ |
76 |
|
|
$ |
4 |
|
|
$ |
3 |
|
|
$ |
7 |
|
|
$ |
83 |
|
| Owner-occupied |
6 |
|
|
— |
|
|
— |
|
|
— |
|
|
6 |
|
| Municipal |
3 |
|
|
8 |
|
|
— |
|
|
8 |
|
|
11 |
|
|
|
|
|
|
|
|
|
|
|
| Total commercial |
85 |
|
|
12 |
|
|
3 |
|
|
15 |
|
|
100 |
|
| Commercial real estate: |
|
|
|
|
|
|
|
|
|
| Term |
170 |
|
|
— |
|
|
5 |
|
|
5 |
|
|
175 |
|
| Construction and land development |
24 |
|
|
— |
|
|
2 |
|
|
2 |
|
|
26 |
|
| Total commercial real estate |
194 |
|
|
— |
|
|
7 |
|
|
7 |
|
|
201 |
|
| Consumer: |
|
|
|
|
|
|
|
|
|
| 1-4 family residential |
4 |
|
|
— |
|
|
— |
|
|
— |
|
|
4 |
|
| Home equity credit line |
1 |
|
|
— |
|
|
— |
|
|
— |
|
|
1 |
|
|
|
|
|
|
|
|
|
|
|
|
|
|
|
|
|
|
|
|
|
| Other |
1 |
|
|
— |
|
|
— |
|
|
— |
|
|
1 |
|
| Total consumer |
6 |
|
|
— |
|
|
— |
|
|
— |
|
|
6 |
|
| Total |
$ |
285 |
|
|
$ |
12 |
|
|
$ |
10 |
|
|
$ |
22 |
|
|
$ |
307 |
|
Collateral-Dependent Loans
When a loan is individually evaluated for expected credit losses, we estimate a specific reserve for the loan based on (1) the projected present value of the loan’s future cash flows discounted at the loan’s effective interest rate, (2) the observable market price of the loan, or (3) the fair value of the loan’s underlying collateral.
Select information on loans for which the borrower is experiencing financial difficulties and repayment is expected to be provided substantially through the operation or sale of the underlying collateral, including the type of collateral and the extent to which the collateral secures the loans, is summarized as follows:
ZIONS BANCORPORATION, NATIONAL ASSOCIATION AND SUBSIDIARIES
|
|
|
|
|
|
|
|
|
|
|
|
|
|
|
|
|
|
|
September 30, 2025 |
| (Dollar amounts in millions) |
Amortized cost |
|
Major types of collateral |
|
Weighted average LTV 1 |
| Commercial: |
|
|
|
|
|
| Commercial and industrial |
$ |
3 |
|
|
Single family residential |
|
75% |
| Owner-occupied |
11 |
|
|
Industrial building |
|
69% |
| Municipal |
2 |
|
|
Multifamily apartments |
|
97% |
|
|
|
|
|
|
|
|
|
|
|
|
| Commercial real estate: |
|
|
|
|
|
| Term |
61 |
|
|
Office building |
|
98% |
|
|
|
|
|
|
|
|
|
|
|
|
| Consumer: |
|
|
|
|
|
| 1-4 family residential |
3 |
|
|
Single family residential |
|
42% |
|
|
|
|
|
|
|
|
|
|
|
|
| Total |
$ |
80 |
|
|
|
|
|
|
|
|
|
|
|
|
|
|
|
|
|
|
|
|
|
|
|
|
December 31, 2024 |
| (Dollar amounts in millions) |
Amortized cost |
|
Major types of collateral |
|
Weighted average LTV 1 |
| Commercial: |
|
|
|
|
|
|
|
|
|
|
|
| Owner occupied |
$ |
6 |
|
|
Retail facility |
|
64% |
| Municipal |
5 |
|
|
Multifamily apartments |
|
174% |
|
|
|
|
|
|
|
|
|
|
|
|
| Commercial real estate: |
|
|
|
|
|
| Term |
49 |
|
|
Office building |
|
98% |
|
|
|
|
|
|
|
|
|
|
|
|
| Consumer: |
|
|
|
|
|
| 1-4 family residential |
3 |
|
|
Single family residential |
|
38% |
| Home equity credit line |
3 |
|
|
Single family residential |
|
29% |
|
|
|
|
|
|
|
|
|
|
|
|
|
|
|
|
|
|
|
|
|
|
|
|
| Total |
$ |
66 |
|
|
|
|
|
1 The fair value is based on the most recent appraisal or other collateral evaluation.
Foreclosed Residential Real Estate
The balance of foreclosed residential real estate property was $1 million at September 30, 2025, compared with less than $1 million at December 31, 2024. The amortized cost basis of consumer mortgage loans collateralized by residential real estate property that were in the process of foreclosure was $21 million and $14 million for the same periods, respectively.
7. DERIVATIVE INSTRUMENTS AND HEDGING ACTIVITIES
Objectives and Accounting
Our primary objective in utilizing derivative instruments is to manage interest rate risk. Derivatives serve as a strategic tool to mitigate volatility in interest income, interest expense, earnings, and capital by adjusting our sensitivity to various market risks. Specifically, we employ derivatives to stabilize forecasted interest income from variable-rate assets and to modify the coupon or duration of fixed-rate financial assets or liabilities when appropriate. Additionally, we offer derivative solutions to assist customers in managing their own risk exposures.
We designate certain derivatives under U.S. GAAP as hedging instruments for specific risks and are subject to documentation and effectiveness testing requirements. However, not all derivatives used in our risk management activities qualify for hedge accounting. Those not designated as accounting hedges are primarily utilized to economically manage exposure to certain market risks, including interest rate and foreign exchange movements. These instruments are not used for speculative purposes and either do not require hedge accounting to reflect their economic impact appropriately in our financial statements or do not meet the criteria for hedge accounting. For more information about our use of and accounting policies for derivative instruments, see Note 7 of our 2024 Form 10-K.
Collateral and Credit Risk
Credit risk associated with derivatives arises from the potential for counterparty nonperformance. To date, we have not experienced significant losses due to counterparty default. For more information on how counterparty credit risk is incorporated into derivative valuations, see Note 3 of our 2024 Form 10-K.
ZIONS BANCORPORATION, NATIONAL ASSOCIATION AND SUBSIDIARIES
For additional discussion on collateral and related credit risk for derivative contracts, see Note 7 of our 2024 Form 10-K.
Certain derivative contracts may require us to pledge collateral for derivatives in a net liability position at a given balance sheet date. These contracts include credit risk-related contingent features, such as maintaining a minimum debt credit rating. If such a feature is triggered, e.g., a downgrade of our credit rating, we may be required to pledge additional collateral. Historically, counterparties have not always exercised their contractual right to demand additional collateral.
At September 30, 2025, the fair value of our derivative liabilities was $257 million. To satisfy variation margin requirements, we pledged $24 million in cash collateral in the ordinary course of business. Additionally, we pledged $200 million in U.S. Treasuries to meet initial margin requirements with certain dealer counterparties and central clearing houses. A one-notch downgrade in our credit rating by either Standard & Poor’s (“S&P”) or Moody’s at September 30, 2025 would likely not result in a requirement to pledge additional collateral. Centrally cleared derivatives do not contain credit risk-related features that would require additional collateral in the event of a credit rating downgrade.
We assess counterparty credit risk through the calculation of a credit valuation adjustment (“CVA”), which reflects the value of nonperformance risk for both our counterparties and the Bank. The fair value of derivatives includes a net CVA, which reduced the fair value of derivative assets by $3 million at September 30, 2025, and reduced the fair value of derivative liabilities by $9 million at December 31, 2024. The net CVA is included in “Capital markets fees and income” on the consolidated statement of income.
Derivative Amounts
The following schedule presents derivative notional amounts and recorded gross fair values at September 30, 2025 and December 31, 2024:
|
|
|
|
|
|
|
|
|
|
|
|
|
|
|
|
|
|
|
|
|
|
|
|
|
|
|
|
|
|
|
|
|
|
|
|
|
September 30, 2025 |
|
December 31, 2024 |
|
Notional
amount |
|
Fair value |
|
Notional
amount |
|
Fair value |
| (In millions) |
Other
assets |
|
Other
liabilities |
|
Other
assets |
|
Other
liabilities |
| Derivatives designated as accounting hedges: |
|
|
|
|
|
|
|
|
|
|
|
| Cash flow hedges: |
|
|
|
|
|
|
|
|
|
|
|
|
|
|
|
|
|
|
|
|
|
|
|
Hedges of floating-rate assets |
$ |
1,250 |
|
|
$ |
7 |
|
|
$ |
— |
|
|
$ |
550 |
|
|
$ |
— |
|
|
$ |
2 |
|
| Hedges of floating-rate liabilities |
— |
|
|
— |
|
|
— |
|
|
500 |
|
|
— |
|
|
— |
|
| Fair value hedges: |
|
|
|
|
|
|
|
|
|
|
|
Hedges of fixed-rate assets 1 |
7,479 |
|
|
77 |
|
|
— |
|
|
4,668 |
|
|
93 |
|
|
— |
|
| Hedges of fixed-rate liabilities |
1,000 |
|
|
— |
|
|
— |
|
|
500 |
|
|
— |
|
|
— |
|
| Total derivatives designated as accounting hedges |
9,729 |
|
|
84 |
|
|
— |
|
|
6,218 |
|
|
93 |
|
|
2 |
|
Derivatives not designated as accounting hedges: 2 |
|
|
|
|
|
|
|
|
|
|
|
| Customer interest rate derivatives |
19,067 |
|
|
263 |
|
|
255 |
|
|
16,833 |
|
|
348 |
|
|
346 |
|
| Customer commodity derivatives |
205 |
|
|
1 |
|
|
1 |
|
|
— |
|
|
— |
|
|
— |
|
| Other interest rate derivatives |
1,259 |
|
|
2 |
|
|
— |
|
|
1,105 |
|
|
1 |
|
|
— |
|
Foreign exchange derivatives 3 |
579 |
|
|
3 |
|
|
1 |
|
|
373 |
|
|
4 |
|
|
2 |
|
| Purchased credit derivatives |
60 |
|
|
— |
|
|
— |
|
|
24 |
|
|
— |
|
|
— |
|
Total derivatives not designated as accounting hedges |
21,170 |
|
|
269 |
|
|
257 |
|
|
18,335 |
|
|
353 |
|
|
348 |
|
| Total derivatives |
$ |
30,899 |
|
|
$ |
353 |
|
|
$ |
257 |
|
|
$ |
24,553 |
|
|
$ |
446 |
|
|
$ |
350 |
|
1 Includes forward-starting swaps that are not yet effective.
2 We provide certain borrowers with access to over-the-counter derivatives. To manage the associated exposures, we typically enter into offsetting derivative transactions with dealers or central clearing houses, which include terms that closely mirror those of the original borrower transactions. Notional amounts for derivatives that are not designated as accounting hedges include both customer-facing derivatives and offsetting dealer-facing derivatives.
3 Includes both spot and forward FX trades.
ZIONS BANCORPORATION, NATIONAL ASSOCIATION AND SUBSIDIARIES
The following schedules present the gains and losses from derivative instruments designated as cash flow and fair value hedges, either deferred in AOCI or recognized in earnings for the three and nine months ended September 30, 2025 and 2024:
|
|
|
|
|
|
|
|
|
|
|
|
|
|
|
|
|
|
|
|
|
|
|
|
|
|
|
|
|
|
|
|
|
|
|
|
|
|
|
|
|
Three Months Ended September 30, 2025 |
|
Three Months Ended September 30, 2024 |
|
|
| (In millions) |
Effective portion of derivative gain (loss) deferred in AOCI |
|
|
|
Amount of gain (loss) reclassified from AOCI into income |
|
Interest on fair value hedges |
|
Effective portion of derivative gain (loss) deferred in AOCI |
|
Amount of gain (loss) reclassified from AOCI into income |
|
Interest on fair value hedges |
|
|
Cash flow hedges: 1 |
|
|
|
|
|
|
|
|
|
|
|
|
|
|
|
|
|
|
|
|
|
|
|
|
|
|
|
|
|
|
|
| Hedges of floating-rate assets |
$ |
— |
|
|
|
|
$ |
(15) |
|
|
$ |
— |
|
|
$ |
5 |
|
|
$ |
(30) |
|
|
$ |
— |
|
|
|
| Hedges of floating-rate liabilities |
— |
|
|
|
|
— |
|
|
— |
|
|
(2) |
|
|
2 |
|
|
— |
|
|
|
Fair value hedges: 2 |
|
|
|
|
|
|
|
|
|
|
|
|
|
|
|
| Hedges of fixed-rate assets |
— |
|
|
|
|
— |
|
|
15 |
|
|
— |
|
|
— |
|
|
24 |
|
|
|
| Hedges of fixed-rate liabilities |
— |
|
|
|
|
— |
|
|
(3) |
|
|
— |
|
|
— |
|
|
(2) |
|
|
|
|
|
|
|
|
|
|
|
|
|
|
|
|
|
|
|
|
|
|
|
|
|
|
|
|
|
|
|
|
|
|
|
Total derivatives designated as accounting hedges |
$ |
— |
|
|
|
|
$ |
(15) |
|
|
$ |
12 |
|
|
$ |
3 |
|
|
$ |
(28) |
|
|
$ |
22 |
|
|
|
|
|
|
|
|
|
|
|
|
|
|
|
|
|
|
|
|
|
|
|
|
|
|
|
|
|
|
|
|
|
|
|
|
|
|
|
|
|
|
|
|
Nine Months Ended September 30, 2025 |
|
Nine Months Ended September 30, 2024 |
|
|
| (In millions) |
Effective portion of derivative gain (loss) deferred in AOCI |
|
|
|
Amount of gain (loss) reclassified from AOCI into income |
|
Interest on fair value hedges |
|
Effective portion of derivative gain (loss) deferred in AOCI |
|
Amount of gain (loss) reclassified from AOCI into income |
|
Interest on fair value hedges |
|
|
Cash flow hedges: 1 |
|
|
|
|
|
|
|
|
|
|
|
|
|
|
|
|
|
|
|
|
|
|
|
|
|
|
|
|
|
|
|
| Hedges of floating-rate assets |
$ |
8 |
|
|
|
|
$ |
(53) |
|
|
$ |
— |
|
|
$ |
(2) |
|
|
$ |
(99) |
|
|
$ |
— |
|
|
|
|
|
|
|
|
|
|
|
|
|
|
|
|
|
|
|
| Hedges of floating-rate liabilities |
— |
|
|
|
|
1 |
|
|
— |
|
|
3 |
|
|
6 |
|
|
— |
|
|
|
Fair value hedges: 2 |
|
|
|
|
|
|
|
|
|
|
|
|
|
|
|
| Hedges of fixed-rate assets |
— |
|
|
|
|
— |
|
|
42 |
|
|
— |
|
|
— |
|
|
70 |
|
|
|
|
|
|
|
|
|
|
|
|
|
|
|
|
|
|
|
| Hedges of fixed-rate liabilities |
— |
|
|
|
|
— |
|
|
(8) |
|
|
— |
|
|
— |
|
|
(5) |
|
|
|
|
|
|
|
|
|
|
|
|
|
|
|
|
|
|
|
Total derivatives designated as accounting hedges |
$ |
8 |
|
|
|
|
$ |
(52) |
|
|
$ |
34 |
|
|
$ |
1 |
|
|
$ |
(93) |
|
|
$ |
65 |
|
|
|
1 For the 12-month period following September 30, 2025, we estimate that approximately $37 million in net losses from both active and terminated cash flow hedges will be reclassified from AOCI into interest income. At September 30, 2025, approximately $48 million in losses related to terminated cash flow hedges remained deferred in AOCI. These deferred losses are expected to be fully reclassified into earnings by October 2027.
2 At September 30, 2025 and 2024, we recorded cumulative unamortized basis adjustments from terminated fair value hedges of debt totaling $34 million and $41 million, respectively. Additionally, we maintained $3 million in cumulative unamortized basis adjustments from terminated fair value hedges of assets at both reporting dates. The interest amounts associated with fair value hedges, as presented above, include the amortization of these remaining unamortized basis adjustments.
The following schedule presents the amount of gains (losses) recognized from derivatives not designated as
accounting hedges:
|
|
|
|
|
|
|
|
|
|
|
|
|
|
|
|
|
|
|
|
|
|
|
|
|
Other Noninterest Income/(Expense) |
| (In millions) |
Three Months Ended September 30, 2025 |
|
Nine Months Ended September 30, 2025 |
|
Three Months Ended September 30, 2024 |
|
Nine Months Ended September 30, 2024 |
Derivatives not designated as accounting hedges: |
|
|
|
|
|
|
|
Customer-facing interest rate derivatives |
$ |
(2) |
|
|
$ |
16 |
|
|
$ |
4 |
|
|
$ |
17 |
|
|
|
|
|
|
|
|
|
| Other interest rate derivatives |
1 |
|
|
1 |
|
|
(2) |
|
|
(1) |
|
| Foreign exchange derivatives |
8 |
|
|
22 |
|
|
8 |
|
|
22 |
|
| Purchased credit derivatives |
— |
|
|
(1) |
|
|
— |
|
|
— |
|
Total derivatives not designated as accounting hedges |
$ |
7 |
|
|
$ |
38 |
|
|
$ |
10 |
|
|
$ |
38 |
|
ZIONS BANCORPORATION, NATIONAL ASSOCIATION AND SUBSIDIARIES
The following schedule presents derivatives used in fair value hedge accounting relationships, including the pre-tax gains and losses recognized on both the derivatives and the corresponding hedged items for the periods presented:
|
|
|
|
|
|
|
|
|
|
|
|
|
|
|
|
|
|
|
|
|
|
|
|
|
|
|
|
|
|
|
|
|
|
|
|
|
|
|
|
|
Gains (losses) recorded in income |
|
|
|
|
|
Three Months Ended September 30, 2025 |
|
Three Months Ended September 30, 2024 |
|
|
|
|
| (In millions) |
Derivatives |
|
Hedged items |
|
Total income statement impact |
|
Derivatives |
|
Hedged items |
|
Total income statement impact |
|
|
|
|
|
|
|
|
|
|
|
|
|
|
|
|
|
|
|
|
Hedges of fixed-rate assets 1, 2 |
$ |
(15) |
|
|
$ |
15 |
|
|
$ |
— |
|
|
$ |
(166) |
|
|
$ |
166 |
|
|
$ |
— |
|
|
|
|
|
Hedges of fixed-rate liabilities 1, 2 |
3 |
|
|
(3) |
|
|
— |
|
|
— |
|
|
— |
|
|
— |
|
|
|
|
|
|
|
|
|
|
|
|
|
|
|
|
|
|
|
|
|
|
|
|
|
|
|
|
|
|
|
|
|
|
|
|
|
|
|
|
|
|
Gains (losses) recorded in income |
|
Nine Months Ended September 30, 2025 |
|
Nine Months Ended September 30, 2024 |
| (In millions) |
Derivatives |
|
Hedged items |
|
Total income statement impact |
|
Derivatives |
|
Hedged items |
|
Total income statement impact |
|
|
|
|
|
|
|
|
|
|
|
|
Hedges of fixed-rate assets 1, 2 |
$ |
(130) |
|
|
$ |
130 |
|
|
$ |
— |
|
|
$ |
(47) |
|
|
$ |
47 |
|
|
$ |
— |
|
Hedges of fixed-rate liabilities 1, 2 |
19 |
|
|
(19) |
|
|
— |
|
|
— |
|
|
— |
|
|
— |
|
1 Includes hedges of benchmark interest rate risk for fixed-rate long-term debt, AFS securities, and commercial loans. Gains and losses were recorded in interest income or expense, consistent with the hedged items.
2 The income/expense for derivatives does not reflect interest income/expense from periodic accruals and payments to be consistent with the presentation of the gains (losses) on the hedged items.
The following schedule presents information regarding basis adjustments for hedged items in fair value hedging relationships:
|
|
|
|
|
|
|
|
|
|
|
|
|
|
|
|
|
|
|
|
|
|
|
|
|
|
|
|
|
|
|
|
|
|
|
|
|
Par value of hedged items |
|
Carrying amount of the hedged items 1 |
|
Cumulative amount of fair value hedging adjustment included in the carrying amount of the hedged items |
| (In millions) |
September 30,
2025 |
|
December 31, 2024 |
|
September 30,
2025 |
|
December 31, 2024 |
|
September 30,
2025 |
|
December 31, 2024 |
|
|
|
|
|
|
|
|
|
|
|
|
Hedges of fixed-rate assets 1, 2 |
$ |
11,494 |
|
|
$ |
11,388 |
|
|
$ |
11,333 |
|
|
$ |
11,099 |
|
|
$ |
(161) |
|
|
$ |
(289) |
|
Hedges of fixed-rate liabilities 1 |
(1,000) |
|
|
(500) |
|
|
(1,012) |
|
|
(493) |
|
|
(12) |
|
|
7 |
|
|
|
|
|
|
|
|
|
|
|
|
|
|
|
|
|
|
|
|
|
|
|
|
|
1 Carrying amounts exclude (1) issuance and purchase discounts or premiums, (2) unamortized issuance and acquisition costs, and (3) amounts related to terminated fair value hedges.
2 At September 30, 2025, the amortized cost basis of assets designated using the portfolio layer method was $9.5 billion; the cumulative basis adjustment associated with these hedging relationships was $35 million; and the notional amounts of the designated accounting hedges were $5.6 billion.
8. LEASES
We have operating and finance leases for branches, data centers, and corporate offices, including our headquarters in Salt Lake City, Utah. At September 30, 2025, we had 408 branches, with 278 owned and 130 leased. The remaining maturities of our lease commitments range from the year 2025 to 2062, with some lease arrangements including options to extend or terminate the leases.
Leases with terms longer than twelve months are reported as a lease liability with a corresponding right-of-use (“ROU”) asset. ROU assets for operating leases and finance leases are included in “Other assets” and “Premises, equipment and software, net” on the consolidated balance sheet, respectively. The corresponding liabilities for those leases are included in “Other liabilities” and “Long-term debt,” respectively. For more information about our lease policies, see Note 8 of our 2024 Form 10-K.
ZIONS BANCORPORATION, NATIONAL ASSOCIATION AND SUBSIDIARIES
The following schedule presents ROU assets and lease liabilities with the associated weighted average remaining life and discount rate:
|
|
|
|
|
|
|
|
|
|
|
|
| (In millions) |
September 30,
2025 |
|
December 31, 2024 |
| Operating leases |
|
|
|
| ROU assets, net of amortization |
$ |
205 |
|
$ |
188 |
| Lease liabilities |
256 |
|
240 |
| Finance leases |
|
|
|
| ROU assets, net of amortization |
3 |
|
3 |
| Lease liabilities |
3 |
|
4 |
| Weighted average remaining lease term (years) |
|
|
|
| Operating leases |
9.6 |
|
9.9 |
| Finance leases |
14.9 |
|
15.6 |
| Weighted average discount rate |
|
|
|
| Operating leases |
4.0 |
% |
|
3.8 |
% |
| Finance leases |
3.1 |
% |
|
3.1 |
% |
The following schedule presents additional information related to lease expense:
|
|
|
|
|
|
|
|
|
|
|
|
|
|
|
|
|
|
|
|
|
|
|
|
|
Three Months Ended September 30, |
|
Nine Months Ended September 30, |
| (In millions) |
2025 |
|
2024 |
|
2025 |
|
2024 |
| Lease expense: |
|
|
|
|
|
|
|
| Operating lease expense |
$ |
10 |
|
|
$ |
10 |
|
|
$ |
30 |
|
|
$ |
30 |
|
|
|
|
|
|
|
|
|
|
|
|
|
|
|
|
|
|
|
|
|
|
|
|
|
|
|
|
|
|
|
|
|
|
|
|
|
|
|
|
|
Other expenses associated with operating leases 1 |
17 |
|
|
16 |
|
|
48 |
|
|
46 |
|
|
|
|
|
|
|
|
|
| Total lease expense |
$ |
27 |
|
|
$ |
26 |
|
|
$ |
78 |
|
|
$ |
76 |
|
| Related cash disbursements for operating leases |
$ |
10 |
|
|
$ |
11 |
|
|
$ |
31 |
|
|
$ |
33 |
|
1 Other expenses primarily include property taxes and building and property maintenance.
The following schedule presents the total contractual undiscounted lease payments for operating lease liabilities by expected due date for each of the next five years:
|
|
|
|
|
|
| (In millions) |
Total undiscounted lease payments |
|
|
2025 1 |
$ |
11 |
|
| 2026 |
41 |
|
| 2027 |
32 |
|
| 2028 |
34 |
|
| 2029 |
30 |
|
| Thereafter |
166 |
|
| Total lease payments |
314 |
|
| Less imputed interest |
58 |
|
| Total |
$ |
256 |
|
1 Represents contractual maturities remaining in 2025.
We enter into certain lease agreements as the lessor of real estate, including bank-owned and subleased properties, to generate cash flow. This activity includes leasing vacant suites within buildings that we partially occupy. Operating lease income totaled $4 million and $3 million for the third quarter of 2025 and 2024, respectively, and $11 million and $10 million for the first nine months of 2025 and 2024, respectively.
At September 30, 2025 and December 31, 2024, we originated equipment leases classified as sales-type or direct-financing leases totaling $349 million and $377 million, respectively. Income from these leases was $5 million for both the third quarters of 2025 and 2024, and $14 million for both the first nine months of 2025 and 2024.
ZIONS BANCORPORATION, NATIONAL ASSOCIATION AND SUBSIDIARIES
9. LONG-TERM DEBT AND SHAREHOLDERS’ EQUITY
Long-Term Debt
The long-term debt carrying values presented on the consolidated balance sheet represent the par value of the debt, adjusted for any unamortized premium or discount, unamortized debt issuance costs, and fair value hedge basis adjustments. During the third quarter of 2025, we issued $500 million in 4.70% Fixed-to-Floating Senior Notes with a maturity date of August 18, 2028.
The following schedule presents the components of our long-term debt:
LONG-TERM DEBT
|
|
|
|
|
|
|
|
|
|
|
|
|
|
|
|
| (In millions) |
September 30,
2025 |
|
December 31, 2024 |
|
|
|
|
|
|
|
|
|
|
|
|
Subordinated notes 1 |
$ |
971 |
|
|
$ |
946 |
|
|
|
|
|
| Senior notes |
499 |
|
|
— |
|
|
|
|
|
| Finance lease obligations |
3 |
|
|
4 |
|
|
|
|
|
| Total |
$ |
1,473 |
|
|
$ |
950 |
|
|
|
|
|
1 The change in the subordinated note balance is primarily due to fair value hedge basis adjustments. See also Note 7.
Shareholders' Equity
Our common stock is traded on the National Association of Securities Dealers Automated Quotations (“NASDAQ”) Global Select Market. At September 30, 2025, there were 147.6 million shares of $0.001 par value common stock outstanding. Common stock and additional paid-in capital was $1.7 billion at both September 30, 2025 and December 31, 2024.
At September 30, 2025, the AOCI balance reflected a net loss of $2.1 billion, primarily attributable to a decline in the fair value of fixed-rate AFS securities as a result of changes in interest rates. This amount includes $1.7 billion ($1.2 billion after tax) of unrealized losses associated with securities previously transferred from AFS to HTM. The following schedule presents the changes in AOCI by major component:
|
|
|
|
|
|
|
|
|
|
|
|
|
|
|
|
|
|
|
|
|
|
|
|
| (In millions) |
Net unrealized gains (losses) on investment securities |
|
Net unrealized gains (losses) on derivatives and other |
|
Pension and post-retirement |
|
Total |
| Nine Months Ended September 30, 2025 |
|
|
|
|
|
|
|
| Balance at December 31, 2024 |
$ |
(2,301) |
|
|
$ |
(78) |
|
|
$ |
(1) |
|
|
$ |
(2,380) |
|
Other comprehensive income before reclassifications, net of tax |
142 |
|
|
6 |
|
|
— |
|
|
148 |
|
| Amounts reclassified from AOCI, net of tax |
137 |
|
|
39 |
|
|
— |
|
|
176 |
|
| Other comprehensive income |
279 |
|
|
45 |
|
|
— |
|
|
324 |
|
| Balance at September 30, 2025 |
$ |
(2,022) |
|
|
$ |
(33) |
|
|
$ |
(1) |
|
|
$ |
(2,056) |
|
Income tax expense included in other comprehensive income |
$ |
91 |
|
|
$ |
15 |
|
|
$ |
— |
|
|
$ |
106 |
|
| Nine Months Ended September 30, 2024 |
|
|
|
|
|
|
|
| Balance at December 31, 2023 |
$ |
(2,526) |
|
|
$ |
(165) |
|
|
$ |
(1) |
|
|
$ |
(2,692) |
|
Other comprehensive income before reclassifications, net of tax |
137 |
|
|
2 |
|
|
— |
|
|
139 |
|
| Amounts reclassified from AOCI, net of tax |
147 |
|
|
70 |
|
|
— |
|
|
217 |
|
| Other comprehensive income |
284 |
|
|
72 |
|
|
— |
|
|
356 |
|
| Balance at September 30, 2024 |
$ |
(2,242) |
|
|
$ |
(93) |
|
|
$ |
(1) |
|
|
$ |
(2,336) |
|
Income tax expense included in other comprehensive income |
$ |
93 |
|
|
$ |
24 |
|
|
$ |
— |
|
|
$ |
117 |
|
ZIONS BANCORPORATION, NATIONAL ASSOCIATION AND SUBSIDIARIES
|
|
|
|
|
|
|
|
|
|
|
|
|
|
|
|
|
|
|
|
|
|
|
|
|
|
|
|
|
|
|
|
|
|
|
|
|
Amounts reclassified from AOCI |
|
|
|
|
| (In millions) |
|
Three Months Ended
September 30, |
|
Nine Months Ended
September 30, |
|
|
|
| AOCI components |
|
2025 |
|
2024 |
|
2025 |
|
2024 |
|
|
Affected line item on statement of income |
|
|
|
|
|
|
|
|
|
|
|
|
|
|
|
|
|
|
|
|
|
|
|
|
|
|
|
|
|
|
|
|
|
|
|
|
|
|
|
|
|
|
|
|
|
|
|
|
|
|
|
|
|
|
|
|
|
|
|
|
|
|
|
|
|
Net unrealized gains (losses) on investment securities |
|
$ |
(62) |
|
|
$ |
(67) |
|
|
$ |
(182) |
|
|
$ |
(195) |
|
|
|
|
Securities gains (losses), net |
| Less: Income tax expense (benefit) |
|
(15) |
|
|
(16) |
|
|
(45) |
|
|
(48) |
|
|
|
|
|
| Total |
|
$ |
(47) |
|
|
$ |
(51) |
|
|
$ |
(137) |
|
|
$ |
(147) |
|
|
|
|
|
|
|
|
|
|
|
|
|
|
|
|
|
|
|
|
|
|
|
|
|
|
|
|
|
|
|
|
|
|
|
|
|
|
|
|
|
|
|
|
Net unrealized gains (losses) on derivative instruments and other |
|
$ |
(15) |
|
|
$ |
(28) |
|
|
$ |
(52) |
|
|
$ |
(93) |
|
|
|
|
Interest and fees on loans; Interest on short- and long-term borrowings |
| Less: Income tax expense (benefit) |
|
(4) |
|
|
(7) |
|
|
(13) |
|
|
(23) |
|
|
|
|
|
| Total |
|
$ |
(11) |
|
|
$ |
(21) |
|
|
$ |
(39) |
|
|
$ |
(70) |
|
|
|
|
|
10. COMMITMENTS, GUARANTEES, AND CONTINGENT LIABILITIES
Commitments and Guarantees
We utilize various financial instruments, including loan commitments, commercial letters of credit, and standby letters of credit, to support our customers’ financing needs. These instruments expose us to varying degrees of credit, liquidity, and interest rate risk that are not fully reflected on the consolidated balance sheet. The associated credit risk is evaluated and recorded as a reserve for unfunded lending commitments, which is presented separately on the consolidated balance sheet.
The following schedule presents the contractual amounts related to off-balance sheet financial instruments used to support our customers’ financing needs:
|
|
|
|
|
|
|
|
|
|
|
|
| (In millions) |
September 30,
2025 |
|
December 31, 2024 |
|
|
|
|
Unfunded lending commitments 1 |
$ |
29,383 |
|
|
$ |
28,767 |
|
| Standby letters of credit: |
|
|
|
| Financial |
622 |
|
|
574 |
|
| Performance |
293 |
|
|
262 |
|
| Commercial letters of credit |
39 |
|
|
15 |
|
|
|
|
|
| Total unfunded commitments |
$ |
30,337 |
|
|
$ |
29,618 |
|
1 Net of participations.
For more information about these commitments and guarantees including their terms and collateral requirements, see Note 16 of our 2024 Form 10-K.
Legal Matters
We are involved in various legal proceedings or governmental inquiries, which may include litigation in court, arbitral proceedings, investigations, examinations, and other actions initiated or considered by governmental and self-regulatory agencies. Litigation may pertain to lending, deposit and other customer relationships, supplier and contractual issues, employee matters, intellectual property matters, personal injuries and torts, regulatory and legal compliance, and other matters. While most matters involve individual claims, we are also subject to putative class action claims and similar broader claims. Proceedings, investigations, examinations, and other actions initiated or considered by governmental and self-regulatory agencies may relate to our banking, investment advisory, trust, securities, and other products and services; and our customers’ involvement in money laundering, fraud, securities violations and other illicit activities or our policies and practices concerning such customer activities. Additionally, these actions may pertain to our compliance with the broad range of banking, securities and other applicable laws and regulations. At any given time, we may be responding to subpoenas, requests for documents, data, and testimony relating to these matters and engaging in discussions to resolve them.
ZIONS BANCORPORATION, NATIONAL ASSOCIATION AND SUBSIDIARIES
At September 30, 2025, we were subject to the following material litigation:
•Two civil cases, Lifescan, Inc. and Johnson & Johnson Health Care Services v. Jeffrey C. Smith, et. al., brought against us in the United States District Court for the District of New Jersey in December 2017, and Roche Diagnostics and Roche Diabetes Care Inc. v. Jeffrey C. Smith, et. al., brought against us in the United States District Court for the District of New Jersey in March 2019. In these cases, certain manufacturers and distributors of medical products seek to hold us liable for allegedly fraudulent practices of a borrower of the Bank who filed for bankruptcy protection in 2017. Discovery is substantially complete for most parties. However, final rulings on certain dispositive motions remain outstanding, and other dispositive motions have yet to be filed or ruled upon. A court-ordered mediation is expected to occur in late 2025. Both cases have been set for trial in April 2027.
•Cayon and Reesor v. Zions Bancorporation, N.A. is an arbitration matter pending before Judicial Arbitration and Mediation Services. The claimants have asserted claims for unpaid overtime, meal and rest break violations, and failure to reimburse work-related expenses. They have also initiated a related action under the California Private Attorneys General Act (“PAGA”). The parties have reached a preliminary agreement to resolve the individual and collective claims raised in the arbitration and the related PAGA action. The settlement remains subject to final documentation and court approval.
Based on our current knowledge, we believe that our estimated liability for litigation and other legal actions and claims, as reflected in our accruals and determined in accordance with applicable accounting guidance, is adequate. We also believe that any liabilities in excess of the amounts currently accrued, if any, arising from litigation and other legal actions and claims for which an estimate is possible, will not have a material impact on our financial condition, results of operations, or cash flows. However, given the significant uncertainties involved in these matters, and the potentially large or indeterminate damages sought in some cases, an adverse outcome in one or more of these matters could materially affect our financial condition, results of operations, or cash flows for any given reporting period.
Any estimate or determination regarding the future resolution of litigation, arbitration, governmental or self-regulatory examinations, investigations or similar matters is inherently uncertain and involves significant judgment. This is particularly true in the early stages of a legal matter, when legal issues and facts have not been fully articulated, reviewed, analyzed, and vetted through discovery, trial or hearing preparation, substantive and productive mediation or settlement discussions, or other actions. It is also especially true for class actions and similar claims involving multiple defendants, matters with complex procedural requirements or substantive issues, novel legal theories, and examinations, investigations, and other actions conducted or brought by governmental and self-regulatory agencies, where the normal adjudicative process is not applicable. As a result, we are often unable to determine whether a favorable or unfavorable outcome is remote, reasonably likely, or probable, or to estimate the amount or range of a probable or reasonably likely loss, until relatively late in the course of a legal matter, sometimes not until a number of years have elapsed. Consequently, our judgments and estimates relating to claims will change over time in light of developments, and actual outcomes will differ from our estimates. These differences may be material.
For more information regarding our accounting for legal matters, see Note 16 of our 2024 Form 10-K.
11. REVENUE FROM CONTRACTS WITH CUSTOMERS
Noninterest income and revenue from contracts with customers are recognized when control of the promised goods or services is transferred to customers, in an amount that reflects the consideration to which we expect to be entitled in exchange for those goods or services. We recognize noninterest income from certain contracts with customers upon satisfaction of the related contractual performance obligations. For more information regarding revenue from contracts with customers, see Note 17 of our 2024 Form 10-K.
ZIONS BANCORPORATION, NATIONAL ASSOCIATION AND SUBSIDIARIES
Disaggregation of Revenue
The following schedule presents revenue from contracts with customers and provides a reconciliation to total noninterest income by operating business segment for the three months ended September 30, 2025 and 2024. Customer-related noninterest income from other sources represents revenue earned from customers that is not within the scope of the applicable accounting guidance for revenue from contracts with customers.
|
|
|
|
|
|
|
|
|
|
|
|
|
|
|
|
|
|
|
|
|
|
|
|
|
|
|
|
|
|
|
|
|
|
|
|
|
Zions Bank |
|
CB&T |
|
Amegy |
| (In millions) |
2025 |
|
2024 |
|
2025 |
|
2024 |
|
2025 |
|
2024 |
|
|
|
|
|
|
|
|
|
|
|
|
Commercial account fees |
$ |
15 |
|
|
$ |
15 |
|
|
$ |
8 |
|
|
$ |
8 |
|
|
$ |
15 |
|
|
$ |
15 |
|
Card fees 1 |
12 |
|
|
12 |
|
|
4 |
|
|
5 |
|
|
8 |
|
|
8 |
|
Retail and business banking fees |
6 |
|
|
5 |
|
|
4 |
|
|
3 |
|
|
4 |
|
|
4 |
|
|
|
|
|
|
|
|
|
|
|
|
|
Capital markets fees and income 2 |
— |
|
|
— |
|
|
1 |
|
|
— |
|
|
— |
|
|
— |
|
| Wealth management fees |
4 |
|
|
5 |
|
|
2 |
|
|
1 |
|
|
5 |
|
|
4 |
|
| Other customer-related fees |
2 |
|
|
2 |
|
|
2 |
|
|
2 |
|
|
1 |
|
|
1 |
|
Total noninterest income from contracts with customers |
39 |
|
|
39 |
|
|
21 |
|
|
19 |
|
|
33 |
|
|
32 |
|
Customer-related noninterest income from other sources |
10 |
|
|
7 |
|
|
9 |
|
|
10 |
|
|
13 |
|
|
10 |
|
Total customer-related noninterest income |
49 |
|
|
46 |
|
|
30 |
|
|
29 |
|
|
46 |
|
|
42 |
|
Noncustomer-related noninterest income |
— |
|
|
— |
|
|
1 |
|
|
2 |
|
|
3 |
|
|
2 |
|
Total noninterest income |
$ |
49 |
|
|
$ |
46 |
|
|
$ |
31 |
|
|
$ |
31 |
|
|
$ |
49 |
|
|
$ |
44 |
|
|
|
|
|
|
|
|
|
|
|
|
|
|
|
|
|
|
|
|
|
|
|
|
|
|
|
|
|
|
|
|
|
|
|
|
|
|
|
|
|
|
|
|
|
|
|
|
|
|
NBAZ |
|
NSB |
|
Vectra |
| (In millions) |
2025 |
|
2024 |
|
2025 |
|
2024 |
|
2025 |
|
2024 |
|
|
|
|
|
|
|
|
|
|
|
|
Commercial account fees |
$ |
3 |
|
|
$ |
3 |
|
|
$ |
3 |
|
|
$ |
3 |
|
|
$ |
2 |
|
|
$ |
2 |
|
Card fees 1 |
4 |
|
|
4 |
|
|
4 |
|
|
4 |
|
|
2 |
|
|
2 |
|
Retail and business banking fees |
2 |
|
|
2 |
|
|
3 |
|
|
3 |
|
|
1 |
|
|
1 |
|
|
|
|
|
|
|
|
|
|
|
|
|
Capital markets fees and income 2 |
— |
|
|
— |
|
|
— |
|
|
— |
|
|
1 |
|
|
— |
|
| Wealth management fees |
1 |
|
|
1 |
|
|
2 |
|
|
2 |
|
|
1 |
|
|
1 |
|
| Other customer-related fees |
— |
|
|
— |
|
|
— |
|
|
— |
|
|
1 |
|
|
1 |
|
Total noninterest income from contracts with customers |
10 |
|
|
10 |
|
|
12 |
|
|
12 |
|
|
8 |
|
|
7 |
|
Customer-related noninterest income from other sources |
2 |
|
|
1 |
|
|
1 |
|
|
— |
|
|
1 |
|
|
— |
|
Total customer-related noninterest income |
12 |
|
|
11 |
|
|
13 |
|
|
12 |
|
|
9 |
|
|
7 |
|
Noncustomer-related noninterest income |
— |
|
|
— |
|
|
— |
|
|
— |
|
|
— |
|
|
— |
|
Total noninterest income |
$ |
12 |
|
|
$ |
11 |
|
|
$ |
13 |
|
|
$ |
12 |
|
|
$ |
9 |
|
|
$ |
7 |
|
|
|
|
|
|
|
|
|
|
|
|
|
|
|
|
|
|
|
|
|
|
|
|
|
|
|
|
|
|
|
|
|
|
|
|
|
|
|
|
|
|
|
|
|
|
|
|
|
|
TCBW |
|
Other |
|
Consolidated Bank |
| (In millions) |
2025 |
|
2024 |
|
2025 |
|
2024 |
|
2025 |
|
2024 |
|
|
|
|
|
|
|
|
|
|
|
|
Commercial account fees |
$ |
1 |
|
|
$ |
1 |
|
|
$ |
— |
|
|
$ |
(1) |
|
|
$ |
47 |
|
|
$ |
46 |
|
Card fees 1 |
— |
|
|
— |
|
|
1 |
|
|
1 |
|
|
35 |
|
|
36 |
|
Retail and business banking fees |
— |
|
|
— |
|
|
(1) |
|
|
(1) |
|
|
19 |
|
|
17 |
|
|
|
|
|
|
|
|
|
|
|
|
|
Capital markets fees and income 2 |
— |
|
|
— |
|
|
2 |
|
|
2 |
|
|
4 |
|
|
2 |
|
| Wealth management fees |
— |
|
|
— |
|
|
(2) |
|
|
(1) |
|
|
13 |
|
|
13 |
|
| Other customer-related fees |
— |
|
|
— |
|
|
9 |
|
|
8 |
|
|
15 |
|
|
14 |
|
Total noninterest income from contracts with customers |
1 |
|
|
1 |
|
|
9 |
|
|
8 |
|
|
133 |
|
|
128 |
|
Customer-related noninterest income from other sources |
1 |
|
|
1 |
|
|
(7) |
|
|
4 |
|
|
30 |
|
|
33 |
|
Total customer-related noninterest income |
2 |
|
|
2 |
|
|
2 |
|
|
12 |
|
|
163 |
|
|
161 |
|
Noncustomer-related noninterest income |
— |
|
|
— |
|
|
22 |
|
|
7 |
|
|
26 |
|
|
11 |
|
Total noninterest income |
$ |
2 |
|
|
$ |
2 |
|
|
$ |
24 |
|
|
$ |
19 |
|
|
$ |
189 |
|
|
$ |
172 |
|
|
|
|
|
|
|
|
|
|
|
|
|
|
|
|
|
|
|
|
|
|
|
|
|
|
|
|
|
|
|
|
|
|
|
|
|
1 Card fees exclude costs associated with reward programs that are netted against interchange fees, as these costs fall outside the scope of the applicable accounting guidance for revenue from contracts with customers.
2 Capital markets fees and income excludes revenue related to real estate capital markets, swaps, loan syndications, foreign exchange activities, and the net CVA, as these items are not within the scope of the applicable accounting guidance for revenue from contracts with customers.
ZIONS BANCORPORATION, NATIONAL ASSOCIATION AND SUBSIDIARIES
The following schedule presents revenue from contracts with customers and provides a reconciliation to total noninterest income by operating business segment for the nine months ended September 30, 2025 and 2024. Customer-related noninterest income from other sources represents revenue from customers that falls outside the scope of the applicable accounting guidance for revenue from contracts with customers.
|
|
|
|
|
|
|
|
|
|
|
|
|
|
|
|
|
|
|
|
|
|
|
|
|
|
|
|
|
|
|
|
|
|
|
|
|
Zions Bank |
|
CB&T |
|
Amegy |
| (In millions) |
2025 |
|
2024 |
|
2025 |
|
2024 |
|
2025 |
|
2024 |
|
|
|
|
|
|
|
|
|
|
|
|
Commercial account fees |
$ |
45 |
|
|
$ |
42 |
|
|
$ |
24 |
|
|
$ |
23 |
|
|
$ |
46 |
|
|
$ |
44 |
|
Card fees 1 |
37 |
|
|
38 |
|
|
13 |
|
|
14 |
|
|
22 |
|
|
23 |
|
Retail and business banking fees |
16 |
|
|
14 |
|
|
10 |
|
|
9 |
|
|
11 |
|
|
10 |
|
|
|
|
|
|
|
|
|
|
|
|
|
Capital markets fees and income 2 |
— |
|
|
— |
|
|
2 |
|
|
— |
|
|
9 |
|
|
— |
|
| Wealth management fees |
12 |
|
|
16 |
|
|
4 |
|
|
3 |
|
|
13 |
|
|
13 |
|
| Other customer-related fees |
6 |
|
|
7 |
|
|
6 |
|
|
6 |
|
|
4 |
|
|
5 |
|
Total noninterest income from contracts with customers |
116 |
|
|
117 |
|
|
59 |
|
|
55 |
|
|
105 |
|
|
95 |
|
Customer-related noninterest income from other sources |
23 |
|
|
16 |
|
|
28 |
|
|
26 |
|
|
27 |
|
|
25 |
|
Total customer-related noninterest income |
139 |
|
|
133 |
|
|
87 |
|
|
81 |
|
|
132 |
|
|
120 |
|
Noncustomer-related noninterest income |
2 |
|
|
3 |
|
|
4 |
|
|
6 |
|
|
8 |
|
|
8 |
|
Total noninterest income |
$ |
141 |
|
|
$ |
136 |
|
|
$ |
91 |
|
|
$ |
87 |
|
|
$ |
140 |
|
|
$ |
128 |
|
|
|
|
|
|
|
|
|
|
|
|
|
|
|
|
|
|
|
|
|
|
|
|
|
|
|
|
|
|
|
|
|
|
|
|
|
|
|
|
|
|
|
|
|
|
|
|
|
|
NBAZ |
|
NSB |
|
Vectra |
| (In millions) |
2025 |
|
2024 |
|
2025 |
|
2024 |
|
2025 |
|
2024 |
|
|
|
|
|
|
|
|
|
|
|
|
Commercial account fees |
$ |
7 |
|
|
$ |
8 |
|
|
$ |
9 |
|
|
$ |
10 |
|
|
$ |
5 |
|
|
$ |
5 |
|
Card fees 1 |
11 |
|
|
11 |
|
|
12 |
|
|
12 |
|
|
7 |
|
|
8 |
|
Retail and business banking fees |
7 |
|
|
6 |
|
|
8 |
|
|
7 |
|
|
3 |
|
|
3 |
|
|
|
|
|
|
|
|
|
|
|
|
|
Capital markets fees and income 2 |
— |
|
|
— |
|
|
— |
|
|
— |
|
|
1 |
|
|
— |
|
| Wealth management fees |
3 |
|
|
3 |
|
|
5 |
|
|
4 |
|
|
1 |
|
|
1 |
|
| Other customer-related fees |
1 |
|
|
1 |
|
|
1 |
|
|
1 |
|
|
4 |
|
|
3 |
|
Total noninterest income from contracts with customers |
29 |
|
|
29 |
|
|
35 |
|
|
34 |
|
|
21 |
|
|
20 |
|
Customer-related noninterest income from other sources |
3 |
|
|
2 |
|
|
3 |
|
|
1 |
|
|
4 |
|
|
— |
|
Total customer-related noninterest income |
32 |
|
|
31 |
|
|
38 |
|
|
35 |
|
|
25 |
|
|
20 |
|
Noncustomer-related noninterest income |
(1) |
|
|
— |
|
|
— |
|
|
5 |
|
|
3 |
|
|
— |
|
Total noninterest income |
$ |
31 |
|
|
$ |
31 |
|
|
$ |
38 |
|
|
$ |
40 |
|
|
$ |
28 |
|
|
$ |
20 |
|
|
|
|
|
|
|
|
|
|
|
|
|
|
|
|
|
|
|
|
|
|
|
|
|
|
|
|
|
|
|
|
|
|
|
|
|
|
|
|
|
|
|
|
|
|
|
|
|
|
TCBW |
|
Other |
|
Consolidated Bank |
| (In millions) |
2025 |
|
2024 |
|
2025 |
|
2024 |
|
2025 |
|
2024 |
|
|
|
|
|
|
|
|
|
|
|
|
Commercial account fees |
$ |
2 |
|
|
$ |
2 |
|
|
$ |
— |
|
|
$ |
1 |
|
|
$ |
138 |
|
|
$ |
135 |
|
Card fees 1 |
1 |
|
|
1 |
|
|
2 |
|
|
1 |
|
|
105 |
|
|
108 |
|
Retail and business banking fees |
— |
|
|
— |
|
|
(1) |
|
|
1 |
|
|
54 |
|
|
50 |
|
|
|
|
|
|
|
|
|
|
|
|
|
Capital markets fees and income 2 |
— |
|
|
— |
|
|
4 |
|
|
4 |
|
|
16 |
|
|
4 |
|
| Wealth management fees |
— |
|
|
— |
|
|
2 |
|
|
— |
|
|
40 |
|
|
40 |
|
| Other customer-related fees |
1 |
|
|
1 |
|
|
20 |
|
|
17 |
|
|
43 |
|
|
41 |
|
Total noninterest income from contracts with customers |
4 |
|
|
4 |
|
|
27 |
|
|
24 |
|
|
396 |
|
|
378 |
|
Customer-related noninterest income from other sources |
2 |
|
|
2 |
|
|
(1) |
|
|
16 |
|
|
89 |
|
|
88 |
|
Total customer-related noninterest income |
6 |
|
|
6 |
|
|
26 |
|
|
40 |
|
|
485 |
|
|
466 |
|
Noncustomer-related noninterest income |
— |
|
|
— |
|
|
49 |
|
|
19 |
|
|
65 |
|
|
41 |
|
Total noninterest income |
$ |
6 |
|
|
$ |
6 |
|
|
$ |
75 |
|
|
$ |
59 |
|
|
$ |
550 |
|
|
$ |
507 |
|
|
|
|
|
|
|
|
|
|
|
|
|
|
|
|
|
|
|
|
|
|
|
|
|
|
|
|
|
|
|
|
|
|
|
|
|
1 Card fees exclude costs associated with reward programs that are netted against interchange fees, as these costs are not within the scope of applicable accounting guidance for revenue from contracts with customers.
2 Capital markets fees and income excludes revenue related to real estate capital markets, swaps, loan syndications, foreign exchange activities, and the net CVA, as these items are not within the scope of the applicable accounting guidance for revenue from contracts with customers.
ZIONS BANCORPORATION, NATIONAL ASSOCIATION AND SUBSIDIARIES
Revenue from contracts with customers did not result in the recognition of significant contract assets and liabilities. Contract receivables are included in “Other assets” on the consolidated balance sheet. Payment terms vary by the nature of the services provided; however, the time between the satisfaction of performance obligations and receipt of payment is generally not significant.
12. INCOME TAXES
The effective income tax rate was 22.1% for the third quarter of 2025, compared with 22.7% for the third quarter of 2024. For the nine months ended September 30, the effective tax rates were 23.9% in 2025 and 23.5% in 2024. The tax rates during these periods were increased by the nondeductibility of certain Federal Deposit Insurance Corporation (“FDIC”) premiums, specific executive compensation, and other fringe benefits. While the FDIC insurance premiums are not deductible for tax purposes, FDIC special assessments are tax deductible. Conversely, the tax rates were reduced by nontaxable municipal interest income and nontaxable income from certain bank-owned life insurance policies.
The tax rates for the nine months ended September 30, 2025 were further impacted by the enactment of new state tax legislation across multiple jurisdictions during the first and second quarters of 2025. These legislative changes required a revaluation of our net deferred tax asset (“DTA”), which primarily arises from unrealized losses in AOCI on certain securities.
At September 30, 2025 and December 31, 2024, our net DTA totaled $756 million and $904 million, respectively. The net DTA or deferred tax liability (“DTL”) is included in either “Other assets” or “Other liabilities,” respectively, on the consolidated balance sheet.
We regularly evaluate DTAs to determine whether a valuation allowance is required, applying a “more-likely-than-not” threshold for realization. Based on this evaluation, management concluded that no valuation allowance was required at both September 30, 2025 and December 31, 2024.
13. NET EARNINGS PER COMMON SHARE
The following schedule presents basic and diluted net earnings per common share based on the weighted average outstanding shares:
|
|
|
|
|
|
|
|
|
|
|
|
|
|
|
|
|
|
|
|
|
|
|
|
|
Three Months Ended
September 30, |
|
Nine Months Ended
September 30, |
| (In millions, except shares and per share amounts) |
2025 |
|
2024 |
|
2025 |
|
2024 |
| Basic: |
|
|
|
|
|
|
|
| Net income |
$ |
222 |
|
|
$ |
214 |
|
|
$ |
636 |
|
|
$ |
568 |
|
| Less common and preferred dividends |
68 |
|
|
71 |
|
|
199 |
|
|
215 |
|
|
|
|
|
|
|
|
|
| Undistributed earnings |
154 |
|
|
143 |
|
|
437 |
|
|
353 |
|
| Less undistributed earnings applicable to nonvested shares |
2 |
|
|
2 |
|
|
5 |
|
|
4 |
|
| Undistributed earnings applicable to common shares |
152 |
|
|
141 |
|
|
432 |
|
|
349 |
|
| Distributed earnings applicable to common shares |
66 |
|
|
61 |
|
|
193 |
|
|
182 |
|
| Total earnings applicable to common shares |
$ |
218 |
|
|
$ |
202 |
|
|
$ |
625 |
|
|
$ |
531 |
|
| Weighted average common shares outstanding (in thousands) |
147,045 |
|
|
147,138 |
|
|
147,136 |
|
|
147,197 |
|
| Net earnings per common share |
$ |
1.48 |
|
|
$ |
1.37 |
|
|
$ |
4.25 |
|
|
$ |
3.61 |
|
| Diluted: |
|
|
|
|
|
|
|
| Total earnings applicable to common shares |
$ |
218 |
|
|
$ |
202 |
|
|
$ |
625 |
|
|
$ |
531 |
|
| Weighted average common shares outstanding (in thousands) |
147,045 |
|
|
147,138 |
|
|
147,136 |
|
|
147,197 |
|
|
|
|
|
|
|
|
|
|
|
|
|
|
|
|
|
| Dilutive effect of stock options (in thousands) |
80 |
|
|
12 |
|
|
39 |
|
|
5 |
|
| Weighted average diluted common shares outstanding (in thousands) |
147,125 |
|
|
147,150 |
|
|
147,175 |
|
|
147,202 |
|
| Net earnings per common share |
$ |
1.48 |
|
|
$ |
1.37 |
|
|
$ |
4.25 |
|
|
$ |
3.61 |
|
ZIONS BANCORPORATION, NATIONAL ASSOCIATION AND SUBSIDIARIES
The following schedule presents the weighted average stock awards that were anti-dilutive and not included in the calculation of diluted earnings per share:
|
|
|
|
|
|
|
|
|
|
|
|
|
|
|
|
|
|
|
|
|
|
|
|
|
Three Months Ended
September 30, |
|
Nine Months Ended
September 30, |
| (In thousands) |
2025 |
|
2024 |
|
2025 |
|
2024 |
|
|
|
|
|
|
|
|
| Restricted stock and restricted stock units |
1,837 |
|
|
1,696 |
|
|
1,795 |
|
|
1,652 |
|
| Stock options |
207 |
|
|
1,065 |
|
|
473 |
|
|
1,338 |
|
14. OPERATING SEGMENT INFORMATION
We manage our operations with a focus on geographic area, primarily in the states of Arizona, California, Colorado, Idaho, Nevada, New Mexico, Oregon, Texas, Utah, Washington, and Wyoming. We conduct our operations primarily through seven separately managed affiliate banks, each with its own local branding and management team: Zions Bank, California Bank & Trust, Amegy Bank, National Bank of Arizona, Nevada State Bank, Vectra Bank Colorado, and The Commerce Bank of Washington. These affiliate banks comprise our primary operating segments. We emphasize local authority, responsibility, pricing, and customization of certain products to maximize customer satisfaction, strengthen community relations, and improve profitability and shareholder returns.
At September 30, 2025, Zions Bank operated 93 branches in Utah, 25 branches in Idaho, and one branch in Wyoming. CB&T operated 77 branches in California, including the four FirstBank Coachella Valley, California branches we acquired in late March 2025. Amegy operated 76 branches in Texas. NBAZ operated 56 branches in Arizona. NSB operated 43 branches in Nevada. Vectra operated 33 branches in Colorado and one branch in New Mexico. TCBW operated two branches in Washington and one branch in Oregon. During the first nine months of 2025, all of the Bank's assets and revenues were located in or derived from operations within the United States.
We focus on serving customers in the communities where we operate. Each of our operating segments offers a wide range of banking products and related services, delivered digitally or through other channels. These include primarily commercial and small business banking, capital markets and investment banking, commercial real estate lending, retail banking, and wealth management.
Our affiliate banks are supported by an enterprise operating segment, referred to as the “Other” segment, which provides governance and risk management, allocates capital, establishes strategic objectives, and includes centralized technology, back-office functions, and certain lines of business not operated through our affiliate banks. The costs of centrally provided services are allocated to the operating segments based on estimated or actual usage of those services. Capital is allocated according to the risk-weighted assets held by each segment. We use an internal funds transfer pricing (“FTP”) allocation process to report the results of operations for each segment. This process is subject to ongoing changes and refinements. The total average loans and deposits for the operating segments include minor intercompany amounts and may also include deposits with the “Other” segment. Transactions between segments are primarily conducted at fair value, with profits eliminated for consolidated reporting purposes.
We evaluate performance and allocate resources primarily based on income or loss from operations before income taxes. The accounting policies of the operating segments align with those in the Notes to Consolidated Financial Statements.
The chief operating decision maker (“CODM”) is our Chairman and Chief Executive Officer. The CODM regularly receives certain segment information, including net interest income, noninterest income, significant noninterest expenses, and income or loss from operations before income taxes. This information is used to evaluate performance and allocate resources for each segment.
ZIONS BANCORPORATION, NATIONAL ASSOCIATION AND SUBSIDIARIES
The following schedule presents selected operating segment information that is regularly provided to the CODM to evaluate performance and allocate resources for the three months ended September 30, 2025 and 2024:
|
|
|
|
|
|
|
|
|
|
|
|
|
|
|
|
|
|
|
|
|
|
|
|
|
|
|
|
|
|
|
|
|
|
|
|
|
Zions Bank |
|
CB&T |
|
Amegy |
| (In millions) |
2025 |
|
2024 |
|
2025 |
|
2024 |
|
2025 |
|
2024 |
| SELECTED INCOME STATEMENT DATA |
|
|
|
|
|
|
|
|
|
|
|
Net interest income 1 |
$ |
191 |
|
|
$ |
174 |
|
|
$ |
168 |
|
|
$ |
155 |
|
|
$ |
143 |
|
|
$ |
128 |
|
| Provision for credit losses |
2 |
|
|
11 |
|
|
55 |
|
|
— |
|
|
2 |
|
|
4 |
|
| Net interest income after provision for credit losses |
189 |
|
|
163 |
|
|
113 |
|
|
155 |
|
|
141 |
|
|
124 |
|
| Noninterest income |
49 |
|
|
46 |
|
|
31 |
|
|
31 |
|
|
49 |
|
|
44 |
|
| Noninterest expense: |
|
|
|
|
|
|
|
|
|
|
|
| Salaries and employee benefits |
35 |
|
|
34 |
|
|
34 |
|
|
31 |
|
|
28 |
|
|
27 |
|
| Technology, telecom, and information processing |
3 |
|
|
4 |
|
|
1 |
|
|
1 |
|
|
2 |
|
|
2 |
|
| Occupancy and equipment, net |
7 |
|
|
6 |
|
|
9 |
|
|
8 |
|
|
8 |
|
|
8 |
|
Other direct expenses 2 |
12 |
|
|
16 |
|
|
10 |
|
|
9 |
|
|
12 |
|
|
12 |
|
| Indirect/allocated expenses |
83 |
|
|
80 |
|
|
56 |
|
|
50 |
|
|
66 |
|
|
62 |
|
| Total noninterest expense |
140 |
|
|
140 |
|
|
110 |
|
|
99 |
|
|
116 |
|
|
111 |
|
| Income (loss) before taxes |
$ |
98 |
|
|
$ |
69 |
|
|
$ |
34 |
|
|
$ |
87 |
|
|
$ |
74 |
|
|
$ |
57 |
|
| SELECTED AVERAGE BALANCE SHEET DATA |
|
|
|
|
|
|
|
|
|
|
|
| Total average loans |
$ |
15,230 |
|
|
$ |
14,762 |
|
|
$ |
15,255 |
|
|
$ |
14,315 |
|
|
$ |
14,317 |
|
|
$ |
13,531 |
|
| Total average deposits |
21,108 |
|
|
21,386 |
|
|
15,656 |
|
|
14,643 |
|
|
14,559 |
|
|
14,633 |
|
|
|
|
|
|
|
|
|
|
|
|
|
|
NBAZ |
|
NSB |
|
Vectra |
| (In millions) |
2025 |
|
2024 |
|
2025 |
|
2024 |
|
2025 |
|
2024 |
| SELECTED INCOME STATEMENT DATA |
|
|
|
|
|
|
|
|
|
|
|
Net interest income 1 |
$ |
66 |
|
|
$ |
63 |
|
|
$ |
54 |
|
|
$ |
52 |
|
|
$ |
35 |
|
|
$ |
38 |
|
| Provision for credit losses |
(3) |
|
|
7 |
|
|
(6) |
|
|
(14) |
|
|
(6) |
|
|
2 |
|
| Net interest income after provision for credit losses |
69 |
|
|
56 |
|
|
60 |
|
|
66 |
|
|
41 |
|
|
36 |
|
| Noninterest income |
12 |
|
|
11 |
|
|
13 |
|
|
12 |
|
|
9 |
|
|
7 |
|
| Noninterest expense: |
|
|
|
|
|
|
|
|
|
|
|
| Salaries and employee benefits |
13 |
|
|
13 |
|
|
11 |
|
|
11 |
|
|
10 |
|
|
10 |
|
| Technology, telecom, and information processing |
1 |
|
|
1 |
|
|
2 |
|
|
1 |
|
|
1 |
|
|
1 |
|
| Occupancy and equipment, net |
3 |
|
|
3 |
|
|
3 |
|
|
3 |
|
|
3 |
|
|
3 |
|
Other direct expenses 2 |
6 |
|
|
7 |
|
|
5 |
|
|
6 |
|
|
4 |
|
|
3 |
|
| Indirect/allocated expenses |
26 |
|
|
25 |
|
|
24 |
|
|
23 |
|
|
16 |
|
|
17 |
|
| Total noninterest expense |
49 |
|
|
49 |
|
|
45 |
|
|
44 |
|
|
34 |
|
|
34 |
|
| Income (loss) before taxes |
$ |
32 |
|
|
$ |
18 |
|
|
$ |
28 |
|
|
$ |
34 |
|
|
$ |
16 |
|
|
$ |
9 |
|
| SELECTED AVERAGE BALANCE SHEET DATA |
|
|
|
|
|
|
|
|
|
|
|
| Total average loans |
$ |
5,545 |
|
|
$ |
5,647 |
|
|
$ |
3,736 |
|
|
$ |
3,520 |
|
|
$ |
3,825 |
|
|
$ |
4,106 |
|
| Total average deposits |
6,863 |
|
|
6,904 |
|
|
7,038 |
|
|
7,156 |
|
|
3,396 |
|
|
3,531 |
|
|
|
|
|
|
|
|
|
|
|
|
|
ZIONS BANCORPORATION, NATIONAL ASSOCIATION AND SUBSIDIARIES
|
|
|
|
|
|
|
|
|
|
|
|
|
|
|
|
|
|
|
|
|
|
|
|
|
|
|
|
|
|
|
|
|
|
|
|
|
TCBW |
|
Other |
|
Consolidated Bank |
| (In millions) |
2025 |
|
2024 |
|
2025 |
|
2024 |
|
2025 |
|
2024 |
| SELECTED INCOME STATEMENT DATA |
|
|
|
|
|
|
|
|
|
|
|
Net interest income 1 |
$ |
18 |
|
|
$ |
16 |
|
|
$ |
(3) |
|
|
$ |
(6) |
|
|
$ |
672 |
|
|
$ |
620 |
|
| Provision for credit losses |
4 |
|
|
3 |
|
|
1 |
|
|
— |
|
|
49 |
|
|
13 |
|
| Net interest income after provision for credit losses |
14 |
|
|
13 |
|
|
(4) |
|
|
(6) |
|
|
623 |
|
|
607 |
|
| Noninterest income |
2 |
|
|
2 |
|
|
24 |
|
|
19 |
|
|
189 |
|
|
172 |
|
| Noninterest expense: |
|
|
|
|
|
|
|
|
|
|
|
| Salaries and employee benefits |
3 |
|
|
3 |
|
|
203 |
|
|
188 |
|
|
337 |
|
|
317 |
|
| Technology, telecom, and information processing |
1 |
|
|
— |
|
|
59 |
|
|
56 |
|
|
70 |
|
|
66 |
|
| Occupancy and equipment, net |
1 |
|
|
1 |
|
|
8 |
|
|
8 |
|
|
42 |
|
|
40 |
|
Other direct expenses 2 |
1 |
|
|
1 |
|
|
28 |
|
|
25 |
|
|
78 |
|
|
79 |
|
| Indirect/allocated expenses |
4 |
|
|
3 |
|
|
(275) |
|
|
(260) |
|
|
— |
|
|
— |
|
| Total noninterest expense |
10 |
|
|
8 |
|
|
23 |
|
|
17 |
|
|
527 |
|
|
502 |
|
| Income (loss) before taxes |
$ |
6 |
|
|
$ |
7 |
|
|
$ |
(3) |
|
|
$ |
(4) |
|
|
$ |
285 |
|
|
$ |
277 |
|
| SELECTED AVERAGE BALANCE SHEET DATA |
|
|
|
|
|
|
|
|
|
|
|
| Total average loans |
$ |
2,012 |
|
|
$ |
1,833 |
|
|
$ |
866 |
|
|
$ |
951 |
|
|
$ |
60,786 |
|
|
$ |
58,665 |
|
| Total average deposits |
1,139 |
|
|
1,148 |
|
|
4,544 |
|
|
5,628 |
|
|
74,303 |
|
|
75,029 |
|
1 Interest income is shown net of interest expense consistent with the information regularly provided to the CODM and used to evaluate segment performance.
2 Includes expenses such as professional and legal services, marketing and business development, deposit insurance and regulatory expense, credit-related expense, other real estate expense, and other noninterest expense.
The following schedule presents selected operating segment information that is regularly provided to the CODM to evaluate performance and allocate resources for the nine months ended September 30, 2025 and 2024:
|
|
|
|
|
|
|
|
|
|
|
|
|
|
|
|
|
|
|
|
|
|
|
|
|
|
|
|
|
|
|
|
|
|
|
|
|
Zions Bank |
|
CB&T |
|
Amegy |
| (In millions) |
2025 |
|
2024 |
|
2025 |
|
2024 |
|
2025 |
|
2024 |
| SELECTED INCOME STATEMENT DATA |
|
|
|
|
|
|
|
|
|
|
|
Net interest income 1 |
$ |
549 |
|
|
$ |
506 |
|
|
$ |
481 |
|
|
$ |
448 |
|
|
$ |
412 |
|
|
$ |
355 |
|
| Provision for credit losses |
15 |
|
|
(7) |
|
|
47 |
|
|
17 |
|
|
15 |
|
|
22 |
|
Net interest income after provision for credit losses |
534 |
|
|
513 |
|
|
434 |
|
|
431 |
|
|
397 |
|
|
333 |
|
| Noninterest income |
141 |
|
|
136 |
|
|
91 |
|
|
87 |
|
|
140 |
|
|
128 |
|
| Noninterest expense: |
|
|
|
|
|
|
|
|
|
|
|
| Salaries and employee benefits |
105 |
|
|
105 |
|
|
101 |
|
|
95 |
|
|
87 |
|
|
82 |
|
| Technology, telecom, and information processing |
11 |
|
|
11 |
|
|
4 |
|
|
4 |
|
|
6 |
|
|
6 |
|
| Occupancy and equipment, net |
20 |
|
|
20 |
|
|
25 |
|
|
24 |
|
|
25 |
|
|
24 |
|
Other direct expenses 2 |
46 |
|
|
55 |
|
|
31 |
|
|
32 |
|
|
37 |
|
|
42 |
|
| Indirect/allocated expenses |
244 |
|
|
245 |
|
|
162 |
|
|
149 |
|
|
193 |
|
|
186 |
|
| Total noninterest expense |
426 |
|
|
436 |
|
|
323 |
|
|
304 |
|
|
348 |
|
|
340 |
|
Income (loss) before taxes |
$ |
249 |
|
|
$ |
213 |
|
|
$ |
202 |
|
|
$ |
214 |
|
|
$ |
189 |
|
|
$ |
121 |
|
| SELECTED AVERAGE BALANCE SHEET DATA |
|
|
|
|
|
|
|
|
|
|
|
| Total average loans |
$ |
15,026 |
|
|
$ |
14,792 |
|
|
$ |
15,037 |
|
|
$ |
14,203 |
|
|
$ |
14,144 |
|
|
$ |
13,331 |
|
| Total average deposits |
21,048 |
|
|
21,010 |
|
|
15,166 |
|
|
14,530 |
|
|
14,647 |
|
|
14,705 |
|
|
|
|
|
|
|
|
|
|
|
|
|
ZIONS BANCORPORATION, NATIONAL ASSOCIATION AND SUBSIDIARIES
|
|
|
|
|
|
|
|
|
|
|
|
|
|
|
|
|
|
|
|
|
|
|
|
|
|
|
|
|
|
|
|
|
|
|
|
|
NBAZ |
|
NSB |
|
Vectra |
| (In millions) |
2025 |
|
2024 |
|
2025 |
|
2024 |
|
2025 |
|
2024 |
| SELECTED INCOME STATEMENT DATA |
|
|
|
|
|
|
|
|
|
|
|
Net interest income 1 |
$ |
194 |
|
|
$ |
185 |
|
|
$ |
160 |
|
|
$ |
150 |
|
|
$ |
106 |
|
|
$ |
109 |
|
| Provision for credit losses |
(15) |
|
|
11 |
|
|
(2) |
|
|
(12) |
|
|
3 |
|
|
(4) |
|
Net interest income after provision for credit losses |
209 |
|
|
174 |
|
|
162 |
|
|
162 |
|
|
103 |
|
|
113 |
|
| Noninterest income |
31 |
|
|
31 |
|
|
38 |
|
|
40 |
|
|
28 |
|
|
20 |
|
| Noninterest expense: |
|
|
|
|
|
|
|
|
|
|
|
| Salaries and employee benefits |
40 |
|
|
40 |
|
|
34 |
|
|
35 |
|
|
30 |
|
|
30 |
|
| Technology, telecom, and information processing |
3 |
|
|
3 |
|
|
4 |
|
|
4 |
|
|
2 |
|
|
2 |
|
| Occupancy and equipment, net |
8 |
|
|
8 |
|
|
8 |
|
|
8 |
|
|
9 |
|
|
9 |
|
Other direct expenses 2 |
20 |
|
|
21 |
|
|
14 |
|
|
16 |
|
|
10 |
|
|
11 |
|
| Indirect/allocated expenses |
77 |
|
|
76 |
|
|
71 |
|
|
70 |
|
|
51 |
|
|
52 |
|
| Total noninterest expense |
148 |
|
|
148 |
|
|
131 |
|
|
133 |
|
|
102 |
|
|
104 |
|
Income (loss) before taxes |
$ |
92 |
|
|
$ |
57 |
|
|
$ |
69 |
|
|
$ |
69 |
|
|
$ |
29 |
|
|
$ |
29 |
|
| SELECTED AVERAGE BALANCE SHEET DATA |
|
|
|
|
|
|
|
|
|
|
|
| Total average loans |
$ |
5,606 |
|
|
$ |
5,631 |
|
|
$ |
3,711 |
|
|
$ |
3,525 |
|
|
$ |
3,872 |
|
|
$ |
4,078 |
|
| Total average deposits |
6,891 |
|
|
6,897 |
|
|
7,112 |
|
|
7,187 |
|
|
3,400 |
|
|
3,486 |
|
|
|
|
|
|
|
|
|
|
|
|
|
|
TCBW |
|
Other |
|
Consolidated Bank |
| (In millions) |
2025 |
|
2024 |
|
2025 |
|
2024 |
|
2025 |
|
2024 |
| SELECTED INCOME STATEMENT DATA |
|
|
|
|
|
|
|
|
|
|
|
Net interest income 1 |
$ |
52 |
|
|
$ |
45 |
|
|
$ |
(10) |
|
|
$ |
5 |
|
|
$ |
1,944 |
|
|
$ |
1,803 |
|
| Provision for credit losses |
2 |
|
|
6 |
|
|
1 |
|
|
(2) |
|
|
66 |
|
|
31 |
|
Net interest income after provision for credit losses |
50 |
|
|
39 |
|
|
(11) |
|
|
7 |
|
|
1,878 |
|
|
1,772 |
|
| Noninterest income |
6 |
|
|
6 |
|
|
75 |
|
|
59 |
|
|
550 |
|
|
507 |
|
| Noninterest expense: |
|
|
|
|
|
|
|
|
|
|
|
| Salaries and employee benefits |
10 |
|
|
9 |
|
|
608 |
|
|
570 |
|
|
1,015 |
|
|
966 |
|
| Technology, telecom, and information processing |
1 |
|
|
1 |
|
|
174 |
|
|
163 |
|
|
205 |
|
|
194 |
|
| Occupancy and equipment, net |
2 |
|
|
2 |
|
|
26 |
|
|
24 |
|
|
123 |
|
|
119 |
|
Other direct expenses 2 |
4 |
|
|
4 |
|
|
87 |
|
|
77 |
|
|
249 |
|
|
258 |
|
| Indirect/allocated expenses |
11 |
|
|
8 |
|
|
(809) |
|
|
(786) |
|
|
— |
|
|
— |
|
| Total noninterest expense |
28 |
|
|
24 |
|
|
86 |
|
|
48 |
|
|
1,592 |
|
|
1,537 |
|
Income (loss) before taxes |
$ |
28 |
|
|
$ |
21 |
|
|
$ |
(22) |
|
|
$ |
18 |
|
|
$ |
836 |
|
|
$ |
742 |
|
| SELECTED AVERAGE BALANCE SHEET DATA |
|
|
|
|
|
|
|
|
|
|
|
| Total average loans |
$ |
1,999 |
|
|
$ |
1,772 |
|
|
$ |
903 |
|
|
$ |
957 |
|
|
$ |
60,298 |
|
|
$ |
58,289 |
|
| Total average deposits |
1,140 |
|
|
1,126 |
|
|
5,090 |
|
|
5,267 |
|
|
74,494 |
|
|
74,208 |
|
1 Interest income is shown net of interest expense consistent with the information regularly provided to the CODM and used to evaluate segment performance.
2 Includes expenses such as professional and legal services, marketing and business development, deposit insurance and regulatory expense, credit-related expense, other real estate expense, and other noninterest expense.
ITEM 3. QUANTITATIVE AND QUALITATIVE DISCLOSURES ABOUT MARKET RISK
Our most significant risks include interest rate and market risk, which are closely monitored by management as previously discussed. For more information regarding interest rate and market risk, see the “Interest Rate and Market Risk Management” section in this Form 10-Q.
ZIONS BANCORPORATION, NATIONAL ASSOCIATION AND SUBSIDIARIES
ITEM 4. CONTROLS AND PROCEDURES
Our management, including our Chief Executive Officer and Chief Financial Officer, has evaluated the effectiveness of our disclosure controls and procedures at September 30, 2025. Based on that evaluation, our Chief Executive Officer and Chief Financial Officer concluded that our disclosure controls and procedures were effective at September 30, 2025. There were no changes in our internal control over financial reporting during the third quarter of 2025 that have materially affected, or are reasonably likely to materially affect, our internal control over financial reporting.
PART II. OTHER INFORMATION
ITEM 1. LEGAL PROCEEDINGS
The information contained in Note 10 of the Notes to Consolidated Financial Statements is incorporated by reference herein.
ITEM 1A. RISK FACTORS
There have been no material changes to the risk factors as previously disclosed in Part I, Item 1A. Risk Factors in our 2024 Form 10-K.
ITEM 2. UNREGISTERED SALES OF EQUITY SECURITIES AND USE OF PROCEEDS
|
|
|
|
|
|
|
|
|
|
|
|
|
|
|
|
|
|
|
|
|
|
|
|
|
| Period |
|
Total number
of shares
purchased 1
|
|
Average
price paid
per share |
|
Total number of shares purchased as part of publicly announced plans or programs |
|
|
|
|
|
|
|
|
|
|
|
|
|
| July |
|
— |
|
|
$ |
— |
|
|
— |
|
|
|
|
|
| August |
|
590 |
|
|
$ |
54.83 |
|
|
— |
|
|
|
|
|
| September |
|
1,286 |
|
|
$ |
57.19 |
|
|
— |
|
|
|
|
|
Third quarter 2025 |
|
1,876 |
|
|
$ |
56.45 |
|
|
— |
|
|
|
|
|
1 Includes amounts related to common shares acquired in connection with our stock compensation plan. These shares were acquired from employees to cover their payroll taxes and stock option exercise costs upon the exercise of stock options.
ITEM 5. OTHER INFORMATION
None of our directors or officers have adopted, modified, or terminated a Rule 10b5-1(c) trading arrangement during the three months ended September 30, 2025. Our directors and officers participate in certain of our benefits plans such as our Omnibus Incentive Plan and Payshelter 401(k) and Employee Stock Ownership Plan, and may from time to time make elections to have shares withheld to cover withholding taxes or pay the exercise price of options granted thereunder, which elections may be designed to satisfy the affirmative defense conditions of Rule 10b5-1 under the Exchange Act or may constitute non-Rule 10b5-1 trading arrangements as defined in Item 408(c) of Regulation S-K.
ZIONS BANCORPORATION, NATIONAL ASSOCIATION AND SUBSIDIARIES
ITEM 6. EXHIBITS
a.Exhibits
|
|
|
|
|
|
|
|
|
|
|
|
Exhibit
Number |
|
Description |
|
|
|
|
|
|
|
Second Amended and Restated Articles of Association of Zions Bancorporation, National Association, incorporated by reference to Exhibit 3.1 of Form 8-K filed on October 2, 2018. |
* |
|
|
|
|
|
|
Second Amended and Restated Bylaws of Zions Bancorporation, National Association, incorporated by reference to Exhibit 3.2 of Form 8-K filed on April 4, 2019. |
* |
|
|
|
|
|
|
Zions Bancorporation 2025-2027 Value Sharing Plan (filed herewith). |
|
|
|
|
|
|
|
Certification by Chief Executive Officer required by Rules 13a-15(f) and 15d-15(f) under the Securities Exchange Act of 1934 (filed herewith). |
|
|
|
|
|
|
|
Certification by Chief Financial Officer required by Rules 13a-15(f) and 15d-15(f) under the Securities Exchange Act of 1934 (filed herewith). |
|
|
|
|
|
|
|
Certification by Chief Executive Officer and Chief Financial Officer required by Sections 13(a) or 15(d), as applicable, of the Securities Exchange Act of 1934 (15 U.S.C. 78m) and 18 U.S.C. Section 1350 (furnished herewith). |
|
|
|
|
|
| 101 |
|
Pursuant to Rules 405 and 406 of Regulation S-T, the following information is formatted in Inline XBRL (i) the Consolidated Balance Sheets as of September 30, 2025 and December 31, 2024, (ii) the Consolidated Statements of Income for the three and nine months ended September 30, 2025 and September 30, 2024, (iii) the Consolidated Statements of Comprehensive Income for the three and nine months ended September 30, 2025 and September 30, 2024, (iv) the Consolidated Statements of Changes in Shareholders’ Equity for the three and nine months ended September 30, 2025 and September 30, 2024, (v) the Consolidated Statements of Cash Flows for the nine months ended September 30, 2025 and September 30, 2024, and (vi) the Notes to Consolidated Financial Statements (filed herewith). |
|
|
|
|
|
| 104 |
|
The cover page from this Quarterly Report on Form 10-Q, formatted as Inline XBRL. |
|
* Incorporated by reference
Pursuant to Item 601(b)(4)(iii)(A) of Regulation S-K, copies of certain instruments defining the rights of holders of long-term debt are not filed. We agree to furnish a copy thereof to the Securities and Exchange Commission and the Office of the Comptroller of the Currency upon request.
ZIONS BANCORPORATION, NATIONAL ASSOCIATION AND SUBSIDIARIES
SIGNATURES
Pursuant to the requirements of the Securities Exchange Act of 1934, the registrant has duly caused this report to be signed on its behalf by the undersigned thereunto duly authorized.
|
|
|
|
| ZIONS BANCORPORATION, NATIONAL ASSOCIATION |
|
| /s/ Harris H. Simmons |
Harris H. Simmons, Chairman and
Chief Executive Officer |
|
| /s/ R. Ryan Richards |
| R. Ryan Richards, Executive Vice President and Chief Financial Officer |
Date: November 6, 2025
EX-10.1
2
exh101-2025x27vspplandocxb.htm
EX-10.1 - 2025-2027 VSP PLAN
Document
Zions Bancorporation
2025-2027 Enterprise Value Sharing Plan
Objective: The purpose of the 2025-2027 Zions Bancorporation Enterprise Value Sharing Plan (the “Plan”) is to provide a three-year cash incentive plan for selected employees of Zions Bancorporation (the “Company”). It is designed to create long-term shareholder value by focusing the Participant’s attention on achieving superior results relative to financial objectives, credit quality and other important initiatives over a three-year period.
Eligibility: Selected employees of the Company (“Participants”) as determined by the Zions Bancorporation management team and approved by the Board of Directors (the “Board”) or its Compensation Committee (the “Committee”), or by the Company’s CEO, under authority delegated by the Committee.
Effective Date: January 1, 2025 through December 31, 2027 (the “Award Period”) with performance measured over the time period from January 1, 2025 to December 31, 2027 (the “Performance Period”)
Payment of Awards: Subject to limitations enumerated in the “Other Administrative Provisions” section of the Plan, the incentive awards, if any, earned under this Plan will be paid within ninety days after the end of the Award Period.
Plan Administrator: The Plan is to be governed and interpreted by the Committee.
How the Plan Works:
1)Establishment of Award Fund
An Award Fund will be established, the size of which will be determined by the Committee. The Committee will evaluate the Company’s overall performance against both absolute and relative measures.
The three absolute performance measures are:
1.)Zions Bancorporation’s pre-provision net revenue (“PPNR”) growth over the three-year period with 2022 used as the base year (25% weight). For the 2025-2027 performance period, target is set by multiplying the base year PPNR by a 3.20 multiple and threshold performance is set by multiplying the base year PPNR by a 3.00 multiple.
2.)Zions Bancorporation’s net charge-offs/average loans measured over the three-year performance period (15% weight). This ratio is calculated by dividing the three-year cumulative net charge-off result by the three-year cumulative average loan balance. For the 2025-2027 performance period, target performance is set at 20bp and threshold performance is set at 50bp.
3.)Zions Bancorporation’s (credit spread + managed core fee income)/risk-weighted assets measured over the three-year period (10% weight). This ratio is calculated by dividing the three-year aggregate (credit spread + managed core fee income) figure by the three-year aggregate risk-weighted asset figure. For the 2025-2027 performance period, the target performance ratio is set at 100% and the threshold performance ratio is set at 80%.
The two relative performance measures are:
1.)Zions Bancorporation’s average annual adjusted EPS growth relative to peer companies; the percentile ranking will be calculated each year for three years and a simple average of these three percentile rankings will be taken at the end of the performance period (25% weight); and,
2.)Zions Bancorporation’s adjusted return on tangible assets relative to peer companies; the percentile ranking will be calculated each year for three years and a simple average of these percentile rankings will be taken at the end of the performance period (25% weight)
The Committee will determine a per unit award value based on these performance measures (see above) and their weights, as more fully defined in Section 5 and Appendix I.
2)Participation Units
Each Participant designated by the Committee shall be awarded a specific number of Participation Units (“Units”), representing a pro-rata claim, in proportion to the total number of authorized Units, on any Award Fund established under this Plan during the Award Period.
3)Value Determination:
Shortly following the conclusion of the 36-month performance period, the final per-unit value will be multiplied by the total number of units awarded to each Participant to determine their individual final award value.
4)Final Cash Settlement of Value:
The final award value amount, if any, will be settled in cash during the first quarter of 2027.
5)Definitions of Factors:
A.Pre-Provision Net Revenue Growth (PPNR) (25% weight):
I.Measured at the enterprise level
II.PPNR = adjusted taxable-equivalent revenue less adjusted noninterest expense as disclosed in the Company’s 10-K
III.Measured over a single three-year performance period with 2024 as the baseline year and will be reset for organizational changes that may occur
B.Net Charge-Offs to Average Loans (15% weight)
I.Measured at the enterprise level
II.Measured as an average over a three-year performance period
C.(Credit Spread + Managed Core Fee Income)/Risk Weighted Assets (10% weight)
I.Measured at the enterprise level
II.Computed by taking the sum of loan credit spread income (including municipal loans treated as securities) and managed core fee income and dividing this result by the related risk-weighted earning assets.
III.Measured over a three-year performance period with 2024 as the baseline year
IV.Removes the interest rate volatility associated with deposit transfer pricing and disincentivizes low margin/high capital business
V.Includes municipal securities held to maturity
D.Average Annual Growth in Adjusted EPS (25% weight)
I.Year-over-year growth is measured at the enterprise level and is relative to results at peer banks in Zions’ Custom Peer Group over three one-year performance periods to allow for changes in the peer group; where the loss provision is replaced by actual net charge-offs
II.Payout is determined by computing the Average Annual adjusted EPS Growth percentile ranking and assigning a payout value to this result each year using a pre-established funding scale with the final payout value computed by taking a simple average of the adjusted EPS Growth component values for 2025, 2025, and 2027
E.Adjusted Return on Tangible Assets (25% weight)
I.Net Income/Average Tangible Assets; where the loss provision is replaced by actual net charge-offs
II.Measured at the enterprise level and is relative to results at peer banks in Zions’ Custom Peer Group over three one-year performance periods to allow for changes in the peer group
III.Payout is determined by computing the ROA percentile ranking and assigning a payout value to this result each year using a pre-established funding scale with the final ROA component payout value computed by taking a simple average of the ROTA component values for 2025, 2025, and 2027
Adjusted EPS Growth and Adjusted ROTA may be adjusted for items including, but not limited to, amortization and impairment of intangible assets, pension termination-related expense, and other items with the approval of the Compensation Committee
6)Other Administrative Provisions
A.This is a discretionary Plan governed and interpreted by the Committee, whose decisions shall be final. The intent of the Plan is to fairly reward Participants for increasing shareholder value. If any adjustments need to be made to allow this Plan to accomplish its purpose, the Committee in its sole discretion can make those adjustments.
B.The Committee may, at its sole discretion, alter the terms of the Plan at any time during an Award Period.
C.Participants will not vest in any benefits available under the Plan until any payments hereunder are made after the conclusion of the Award Period.
D.A Participant must be employed by the Company or one of its affiliates at the time payment is made in order to receive a payout of Participant’s Unit award and if Participant ceases to be so employed at any time Participant’s Unit award shall automatically be forfeited and cancelled without consideration and without further action by Participant; provided, however, that
I.In the event of Participant’s termination by the Company or an affiliate, management or, if Participant is a member of the Executive Management Committee (or “EMC”), the Committee shall have the discretion to make a “Pro-Rate Adjustment” to Participant’s unit award, provided further that notwithstanding the foregoing any such adjusted Unit award shall automatically be forfeited and cancelled without consideration and without further action by Participant immediately upon (a) Participant’s commencement of, or agreement to commence, employment with or provision of services (whether as a director, consultant or otherwise) to another company that is in the financial services industry unless such employment or provision of services is specifically approved by management or the Committee, as the case may be, (b) Participant making any derogatory or damaging statements (verbally, in writing or otherwise) about the Company or any of its affiliates, the management or the board of directors of the Company or any affiliate, the products, services or business condition of the Company or any affiliate in any
public way to anyone who could make those statements public or to customers of, vendors to or counterparties of the Company or any affiliate, or (c) Participant violating any duty of confidentiality owed to the Company or its affiliates under the policies or procedures of the Company and its affiliates, including the Company’s employee handbook, code of conduct and similar materials, or under federal or state law, or Participant misappropriating or misusing any proprietary information or assets of the Company and its affiliates, including intellectual property rights; and
II.In the event of Participant’s “Termination of Employment” by reason of Participant’s Retirement, death or Disability, the Participant (or his/her estate) shall be entitled to receive a payment under the Plan after the conclusion of the Award Period. For purposes of this Plan, the terms “Termination of Employment,” “Retirement” and “Disability” shall have the meanings assigned to them in the form of Standard Restricted Stock Unit Award Agreement used by the Company in making annual equity awards to employees.
E.The Company shall retain the right to withhold payment of incentives otherwise earned under this Plan to any individual Participant or to all Participants as a group in the event of a significant deterioration in the Company’s or the Bank’s financial condition, if so required by regulatory authorities, or for any other reason considered valid by the Board in its sole discretion including but not limited to those set out in the Company’s Incentive Compensation Clawback Policy as in effect at any time during or subsequent to the Award Period.
F.The terms of this plan are subject to and limited by applicable law, including, without limitation, the Sarbanes Oxley Act of 2002, the Dodd-Frank Act, and regulations or guidance issued by regulatory agencies.
G.Designation as a Participant in the Plan does not create a contract of employment for any specified time, nor shall such act to alter or amend the Company’s “at-will” policy of employment.
H.In the event a Participant transfers within Zions Bancorporation during the Award Period, management or, if Participant is a member of the EMC, the Committee shall have the discretion to maintain such Participant’s full Unit award under this plan, to divide and allocate such full award between Zions entities with which Participant has been employed during the Award Period or to transfer and allocate such award to a single other Zions entity with which Participant has been employed during the Award Period (and to make corresponding adjustments to Award Funds).
I.In the event of a change in control of the Company (as defined in the Company’s Change in Control Agreements), payments shall be made subject to the terms of the Change in Control agreements for all VSP participants and in accordance with other plan provisions.
J.This document is intended to provide a guideline for the creation and distribution of incentive compensation. Nothing herein creates a contractual obligation binding on the Board or the Committee, and no Participant shall have any legal rights with respect to an Award until such Award is distributed.
APPENDIX I
The VSP Scorecard detailed below will be used to determine per unit values for the 2025-2027 Plan
EX-31.1
3
exh311certofceo10-q20250930.htm
CERTIFICATION BY CEO
Document
EXHIBIT 31.1
CERTIFICATION
Principal Executive Officer
I, Harris H. Simmons, certify that:
1.I have reviewed this quarterly report on Form 10-Q of Zions Bancorporation, National Association;
2.Based on my knowledge, this report does not contain any untrue statement of a material fact or omit to state a material fact necessary to make the statements made, in light of the circumstances under which such statements were made, not misleading with respect to the period covered by this report;
3.Based on my knowledge, the financial statements, and other financial information included in this report, fairly present in all material respects the financial condition, results of operations and cash flows of the registrant as of, and for, the periods presented in this report;
4.The registrant’s other certifying officer and I are responsible for establishing and maintaining disclosure controls and procedures (as defined in Exchange Act Rules 13a-15(e) and 15d-15(e)) and internal control over financial reporting (as defined in Exchange Act Rules 13a-15(f) and 15d-15(f)) for the registrant and have:
a)Designed such disclosure controls and procedures, or caused such disclosure controls and procedures to be designed under our supervision, to ensure that material information relating to the registrant, including its consolidated subsidiaries, is made known to us by others within those entities, particularly during the period in which this report is being prepared;
b)Designed such internal control over financial reporting, or caused such internal control over financial reporting to be designed under our supervision, to provide reasonable assurance regarding the reliability of financial reporting and the preparation of financial statements for external purposes in accordance with generally accepted accounting principles;
c)Evaluated the effectiveness of the registrant’s disclosure controls and procedures and presented in this report our conclusions about the effectiveness of the disclosure controls and procedures, as of the end of the period covered by this report based on such evaluation; and
d)Disclosed in this report any change in the registrant’s internal control over financial reporting that occurred during the registrant’s most recent fiscal quarter (the registrant’s fourth fiscal quarter in the case of an annual report) that has materially affected, or is reasonably likely to materially affect, the registrant’s internal control over financial reporting; and
5.The registrant’s other certifying officer and I have disclosed, based on our most recent evaluation of internal control over financial reporting, to the registrant’s auditors and the audit committee of the registrant’s board of directors (or persons performing the equivalent functions):
a)All significant deficiencies and material weaknesses in the design or operation of internal control over financial reporting which are reasonably likely to adversely affect the registrant’s ability to record, process, summarize and report financial information; and
b)Any fraud, whether or not material, that involves management or other employees who have a significant role in the registrant’s internal control over financial reporting.
Date: November 6, 2025
|
|
|
|
|
|
|
/s/ Harris H. Simmons |
|
Harris H. Simmons, Chairman and Chief Executive Officer |
EX-31.2
4
exh312certofcfo10-q20250930.htm
CERTIFICATION BY CFO
Document
EXHIBIT 31.2
CERTIFICATION
Principal Financial Officer
I, R. Ryan Richards, certify that:
1.I have reviewed this quarterly report on Form 10-Q of Zions Bancorporation, National Association;
2.Based on my knowledge, this report does not contain any untrue statement of a material fact or omit to state a material fact necessary to make the statements made, in light of the circumstances under which such statements were made, not misleading with respect to the period covered by this report;
3.Based on my knowledge, the financial statements, and other financial information included in this report, fairly present in all material respects the financial condition, results of operations and cash flows of the registrant as of, and for, the periods presented in this report;
4.The registrant’s other certifying officer and I are responsible for establishing and maintaining disclosure controls and procedures (as defined in Exchange Act Rules 13a-15(e) and 15d-15(e)) and internal control over financial reporting (as defined in Exchange Act Rules 13a-15(f) and 15d-15(f)) for the registrant and have:
a)Designed such disclosure controls and procedures, or caused such disclosure controls and procedures to be designed under our supervision, to ensure that material information relating to the registrant, including its consolidated subsidiaries, is made known to us by others within those entities, particularly during the period in which this report is being prepared;
b)Designed such internal control over financial reporting, or caused such internal control over financial reporting to be designed under our supervision, to provide reasonable assurance regarding the reliability of financial reporting and the preparation of financial statements for external purposes in accordance with generally accepted accounting principles;
c)Evaluated the effectiveness of the registrant’s disclosure controls and procedures and presented in this report our conclusions about the effectiveness of the disclosure controls and procedures, as of the end of the period covered by this report based on such evaluation; and
d)Disclosed in this report any change in the registrant’s internal control over financial reporting that occurred during the registrant’s most recent fiscal quarter (the registrant’s fourth fiscal quarter in the case of an annual report) that has materially affected, or is reasonably likely to materially affect, the registrant’s internal control over financial reporting; and
5.The registrant’s other certifying officer and I have disclosed, based on our most recent evaluation of internal control over financial reporting, to the registrant’s auditors and the audit committee of the registrant’s board of directors (or persons performing the equivalent functions):
a)All significant deficiencies and material weaknesses in the design or operation of internal control over financial reporting which are reasonably likely to adversely affect the registrant’s ability to record, process, summarize and report financial information; and
b)Any fraud, whether or not material, that involves management or other employees who have a significant role in the registrant’s internal control over financial reporting.
Date: November 6, 2025
|
|
|
|
|
|
|
/s/ R. Ryan Richards |
|
R. Ryan Richards, Executive Vice President and Chief Financial Officer |
EX-32
5
exh32certofceocfo20250930.htm
CERTIFICATION BY CEO AND CFO
Document
EXHIBIT 32
CERTIFICATION
Pursuant to Section 906 of the Sarbanes-Oxley Act of 2002, 18 U.S.C. §1350, the undersigned officers of Zions Bancorporation, National Association (the “Bank”) hereby certify that, to the best of their knowledge, the Bank’s Quarterly Report for the three months ended September 30, 2025 (the “Report”) fully complies with the requirements of Section 13(a) or 15(d), as applicable, of the Securities Exchange Act of 1934 (15 U.S.C. 78m) and that the information contained in the Report fairly presents, in all material respects, the financial condition and results of operations of the Bank.
Date: November 6, 2025
|
|
|
|
|
|
|
|
|
|
/s/ Harris H. Simmons |
|
Name: |
Harris H. Simmons |
|
Title: |
Chairman and Chief Executive Officer |
|
|
|
|
/s/ R. Ryan Richards |
|
Name: |
R. Ryan Richards |
|
Title: |
Executive Vice President and Chief Financial Officer |
The foregoing certification is being furnished solely pursuant to 18 U.S.C. §1350 and is not being filed as part of the Report or as a separate disclosure document.