株探米国株
日本語 英語
エドガーで原本を確認する
0000109380false00001093802025-04-212025-04-210000109380exch:XNASus-gaap:CommonStockMember2025-04-212025-04-210000109380exch:XNYSus-gaap:SeriesAPreferredStockMember2025-04-212025-04-21

UNITED STATES
SECURITIES AND EXCHANGE COMMISSION
Washington, D.C. 20549
FORM 8-K
CURRENT REPORT
Pursuant to Section 13 OR 15(d) of the Securities Exchange Act of 1934

Date of Report (date of earliest event reported)  April 21, 2025

ZIONS BANCORPORATION, NATIONAL ASSOCIATION
(Exact name of registrant as specified in its charter)
United States of America
001-12307
87-0189025
(State or other jurisdiction of incorporation or organization)
(Commission File Number)
(IRS Employer Identification No.)
One South Main,
Salt Lake City,
Utah
84133-1109
(Address of Principal Executive Offices)
(Zip Code)

Registrant's telephone number, including area code (801) 844-8208
Former name or former address, if changed since last report

Check the appropriate box below if the Form 8-K filing is intended to simultaneously satisfy the filing obligation of the registrant under any of the following provisions:

☐ Written communications pursuant to Rule 425 under the Securities Act (17 CFR 230.425)
☐ Soliciting material pursuant to Rule 14a-12 under the Exchange Act (17 CFR 240.14a-12)
☐ Pre-commencement communications pursuant to Rule 14d-2(b) under the Exchange Act (17 CFR 240.14d-2(b))
☐ Pre-commencement communications pursuant to Rule 13e-4(c) under the Exchange Act (17 CFR 240.13e-4(c))

Securities registered pursuant to Section 12(b) of the Act:
Title of Each Class Trading Symbols Name of Each Exchange on Which Registered
Common Stock, par value $0.001 ZION The NASDAQ Stock Market, LLC
Depositary Shares each representing a 1/40th ownership interest in a share of:
   Series A Floating-Rate Non-Cumulative Perpetual Preferred Stock ZIONP The NASDAQ Stock Market, LLC

Indicate by check mark whether the registrant is an emerging growth company as defined in Rule 405 of the Securities Act of 1933 (§230.405 of this chapter) or Rule 12b-2 of the Securities Exchange Act of 1934 (§240.12b-2 of this chapter).
Emerging growth company ☐

If an emerging growth company, indicate by check mark if the registrant has elected not to use the extended transition period for complying with any new or revised financial accounting standards provided pursuant to Section 13(a) of the Exchange Act. ☐


Item 2.02    Results of Operations and Financial Condition.

On April 21, 2025, Zions Bancorporation, National Association (“the Bank”) announced its financial results for the quarter ended March 31, 2025 and its intent to host a conference call to discuss such results at 5:30 p.m. Eastern Time on April 21, 2025. The press release announcing the financial results for the quarter ended March 31, 2025 is furnished as Exhibit 99.1 and incorporated herein by reference. A presentation to be used in conjunction with the conference call regarding the Bank’s first quarter financial results is furnished as Exhibit 99.2 and incorporated herein by reference.
The information in this Current Report on Form 8-K, including the exhibits, is furnished pursuant to Item 2.02 and shall not be deemed “filed” for the purposes of Section 18 of the Securities Exchange Act of 1934, as amended, or otherwise subject to the liabilities under that Section. Furthermore, the information in this Current Report on Form 8-K, including the exhibits, shall not be deemed to be incorporated by reference into the filings of the Bank under the Securities Act of 1933, as amended.

Item 9.01    Financial Statements and Exhibits.

Exhibits.

The following exhibits are furnished as part of this Current Report on Form 8-K:
Exhibit Number Description
Press Release dated April 21, 2025 (furnished herewith).
Earnings Release Presentation dated April 21, 2025 (furnished herewith).
101 Cover Page Interactive Data File - the cover page XBRL tags are embedded within the Inline XBRL document.
104 The cover page from this Current Report on form 8-K, formatted as Inline XBRL.


SIGNATURES

Pursuant to the requirements of the Securities Exchange Act of 1934, the registrant has duly caused this report to be signed on its behalf by the undersigned hereunto duly authorized.
  
ZIONS BANCORPORATION, NATIONAL ASSOCIATION
By: /s/ R. Ryan Richards
Name:    R. Ryan Richards
Title:      Executive Vice President and Chief Financial Officer
Date: April 21, 2025


EX-99.1 2 exh991earningsrelease20250.htm EX-99.1 Document

Zions Bancorporation, N.A.
One South Main
Salt Lake City, UT 84133
April 21, 2025
zions2020630-er.jpg
www.zionsbancorporation.com
First Quarter 2025 Financial Results: FOR IMMEDIATE RELEASE
Investor Contact: Shannon Drage (801) 844-8208
Media Contact: Rob Brough (801) 844-7979
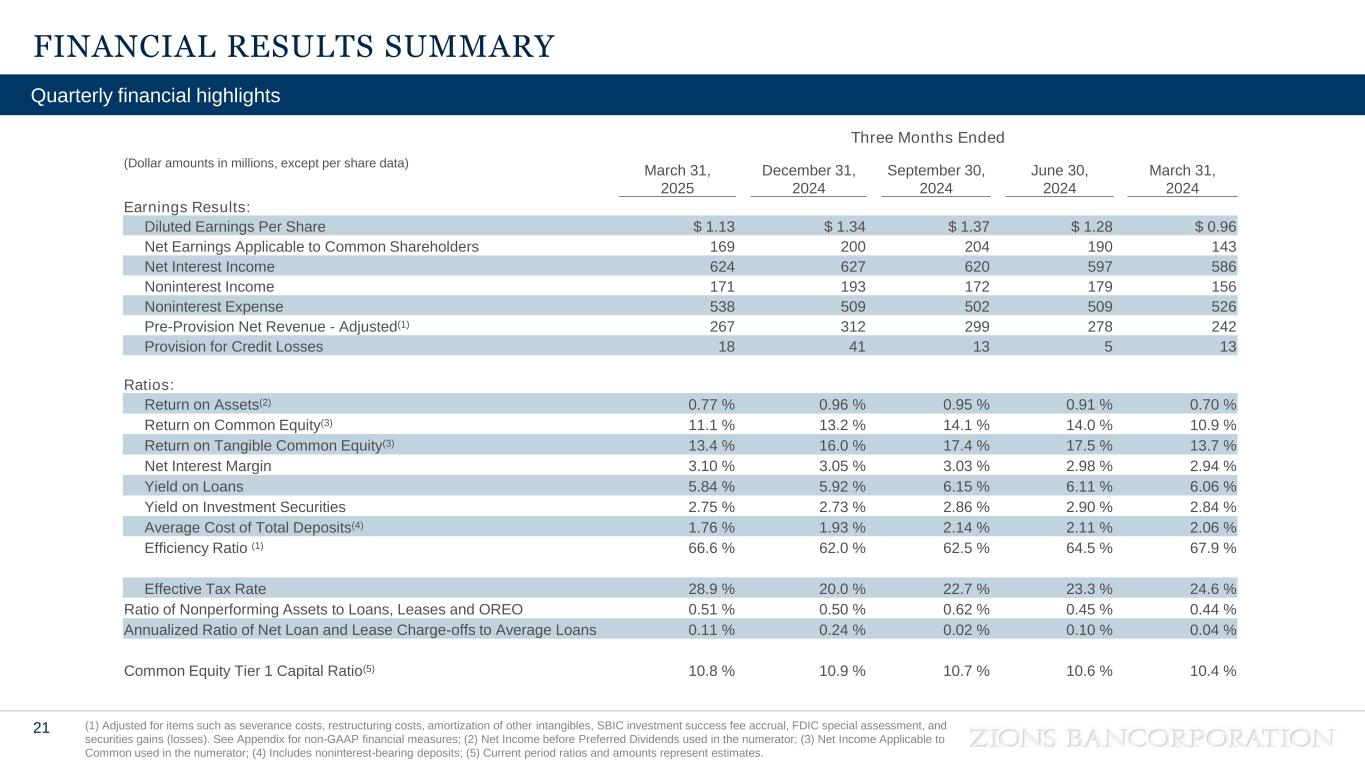
Zions Bancorporation, N.A. reports: 1Q25 Net Earnings of $169 million, diluted EPS of $1.13
compared with 1Q24 Net Earnings of $143 million, diluted EPS of $0.96,
and 4Q24 Net Earnings of $200 million, diluted EPS of $1.34
FIRST QUARTER RESULTS
$1.13 $169 million 3.10% 10.8%
Net earnings per diluted
common share
Net earnings Net interest margin (“NIM”) Estimated common equity
tier 1 ratio
FIRST QUARTER HIGHLIGHTS¹
Net Interest Income and NIM
Net interest income was $624 million, up 6%
NIM was 3.10%, compared with 2.94%
Operating Performance
Pre-provision net revenue² ("PPNR") was $268 million, up 19%; adjusted PPNR² was $267 million, up 10%
Customer-related noninterest income was $158 million, up 4%
Noninterest expense was $538 million, up 2%; adjusted noninterest expense² was $533 million, up 4%
Loans and Credit Quality
Loans and leases were $59.9 billion, up 3%
The provision for credit losses was $18 million, compared with $13 million
The annualized ratio of net loan and lease charge-offs to average loans and leases was 0.11%, compared with 0.04%
Nonperforming assets3 were $307 million, or 0.51% of loans and leases and other real estate owned, compared with $254 million, or 0.44%
Classified loans were $2.9 billion, or 4.8% of loans and leases, compared with $966 million, or 1.7%
Deposits and Borrowed Funds
Total deposits were $75.7 billion, up 2%; customer deposits (excluding brokered deposits) were $70.9 billion, up 1%
Short-term borrowings, primarily consisting of secured borrowings, were $3.5 billion, down 29%
Capital
The estimated CET1 capital ratio was 10.8%, compared with 10.4%
Notable Items
Additional income tax expense of $16 million, or $0.11 per share, due to revaluation of DTAs resulting from new state tax legislation
CEO COMMENTARY
Harris H. Simmons, Chairman and CEO of Zions Bancorporation, commented, “First quarter net income and earnings per share increased 18% from last year’s period, to $169 million and $1.13, respectively. This reflects a 16 basis point increase in the net interest margin and a 10% increase in adjusted pre-provision net revenue. The results also reflect an $0.11 per share charge to income tax expense resulting from a beneficial Utah tax law change on securities portfolio income, requiring a revaluation of our deferred tax assets, primarily those associated with accumulated other comprehensive income. Most of this charge is expected to accrete back into income over the life of the securities that gave rise to these deferred tax assets. The tax law change will additionally reduce the tax on securities income in future periods.”
Mr. Simmons continued, “In late March we completed the acquisition of four branches in California’s Coachella Valley from FirstBank of Denver, Colorado, adding approximately $630 million in deposits and $420 million in loans. We look forward to serving these new customers of our affiliate, California Bank & Trust.”
Mr. Simmons concluded, “Credit quality remained in very good shape during the quarter, with nonperforming assets stable compared with last quarter at 0.51% of loans and leases and annualized net charge-offs of 0.11% of loans and leases. At the same time, the outlook for the economy is perhaps more uncertain than it’s been in a number of years, clouded by the very real potential for negative impacts from tariffs and trade policy, both here and abroad. We are nevertheless confident that our credit culture and practices and our strong reserves position us to manage through possible turbulence that might materialize in coming quarters.”
OPERATING PERFORMANCE2
(In millions) Three Months Ended
March 31,
2025 2024
Adjusted PPNR $ 267 $ 242
Net charge-offs (recoveries) $ 16 $ 6
Efficiency ratio 66.6  % 67.9  %
Weighted average diluted shares 147.4  147.3 
1 Comparisons noted in the bullet points are calculated for the current quarter compared with the same prior year period unless otherwise specified. The effective tax rate was 28.9% at March 31, 2025, compared with 24.6% at March 31, 2024, primarily due to a required revaluation of deferred tax assets resulting from new state tax legislation enacted during the quarter.
2 For information on non-GAAP financial measures, see pages 17-18.
3 Does not include banking premises held for sale.


ZIONS BANCORPORATION, N.A.
Press Release – Page 2


Comparisons noted in the sections below are calculated for the current quarter versus the same prior year period unless otherwise specified. Growth rates of 100% or more are considered not meaningful (“NM”) as they generally reflect a low starting point.
RESULTS OF OPERATIONS
Net Interest Income and Margin
1Q25 - 4Q24 1Q25 - 1Q24
(In millions) 1Q25 4Q24 1Q24 $ % $ %
Interest and fees on loans $ 850 $ 873 $ 865 $ (23) (3) % $ (15) (2) %
Interest on money market investments 53 60 47 (7) (12) 13 
Interest on securities 125 129 142 (4) (3) (17) (12)
Total interest income
1,028 1,062 1,054 (34) (3) (26) (2)
Interest on deposits 326 371 376 (45) (12) (50) (13)
Interest on short- and long-term borrowings 78 64 92 14  22  (14) (15)
Total interest expense
404 435 468 (31) (7) (64) (14)
Net interest income
$ 624 $ 627 $ 586 $ (3) —  $ 38 
bps bps
Yield on interest-earning assets1
5.08  % 5.13  % 5.25  % (5) (17)
Rate paid on total deposits and interest-bearing liabilities1
2.01  % 2.12  % 2.34  % (11) (33)
Cost of deposits1
1.76  % 1.93  % 2.06  % (17) (30)
Net interest margin1
3.10  % 3.05  % 2.94  % 16 
1 Taxable-equivalent rates used where applicable.
Net interest income increased $38 million, or 6%, in the first quarter of 2025, relative to the prior year period, primarily as a result of lower funding costs. Additionally, net interest income benefited from a favorable mix change in average interest-earning assets, driven by growth in average loans and money market investments, and a decline in average securities. The net interest margin improved to 3.10%, compared with 2.94%.
The yield, net of hedging activity, on average interest-earning assets was 5.08% in the first quarter of 2025, compared with 5.25% in the prior year period. The net yield on average loans and leases decreased 22 basis points to 5.84%, and the net yield on average securities decreased 9 basis points to 2.75% in the first quarter of 2025.
The rate paid on total deposits and interest-bearing liabilities was 2.01%, compared with 2.34% in the prior year quarter, and the total cost of deposits was 1.76%, compared with 2.06%, reflecting the lower interest rate environment, partially offset by a mix change from noninterest-bearing to interest-bearing products.
Average interest-earning assets increased $1.4 billion, or 2% from the prior year quarter. This growth was driven by a $1.7 billion increase in average loans and leases and a $1.3 billion increase in average money market investments, partially offset by a $1.7 billion decline in average securities, primarily due to principal reductions.
Average interest-bearing liabilities increased $2.3 billion, or 4%, from the prior year quarter. This increase was primarily driven by a $2.9 billion increase in average interest-bearing deposits, partially offset by a $570 million decrease in average borrowed funds.


ZIONS BANCORPORATION, N.A.
Press Release – Page 3


Noninterest Income
1Q25 - 4Q24 1Q25 - 1Q24
(In millions) 1Q25 4Q24 1Q24 $ % $ %
Commercial account fees $ 45  $ 47  $ 44  $ (2) (4) % $ %
Card fees 23  24  23  (1) (4) —  — 
Retail and business banking fees 17  17  16  —  — 
Loan-related fees and income 17  20  15  (3) (15) 13 
Capital markets fees and income 1
27  40  25  (13) (33)
Wealth management fees 15  14  15  —  — 
Other customer-related fees 14  14  14  —  —  —  — 
Customer-related noninterest income 158  176  152  (18) (10)
Dividends and other income (2) (22) 17 
Securities gains (losses), net (2) (2) (25) NM
Noncustomer-related noninterest income 13  17  (4) (24) NM
Total noninterest income
$ 171  $ 193  $ 156  $ (22) (11) $ 15  10 
1 Effective for the first quarter of 2025, capital markets fees and income includes fair value and nonhedge derivative income (loss) of less than one million, $3 million, and $1 million for the three months ended March 31, 2025, December 31, 2024, and March 31, 2024, respectively. These amounts were previously disclosed under noncustomer-related noninterest income. No other income statement line items or ratios were affected by these changes and reclassifications. Prior period amounts have been reclassified for comparative purposes.
Customer-related noninterest income increased $6 million, or 4%, compared with the prior year period. This growth was largely driven by higher loan-related fees and income, as well as improved capital markets fees and income, primarily due to increased investment banking advisory fees.
Noncustomer-related noninterest income increased $9 million, compared with the prior year period, primarily due to an $8 million increase in net securities gains. This increase was largely attributable to valuation adjustments in our Small Business Investment Company (“SBIC”) investment portfolio and a $4 million valuation loss associated with one of our equity investments in the prior year period.
Noninterest Expense
1Q25 - 4Q24 1Q25 - 1Q24
(In millions) 1Q25 4Q24 1Q24 $ % $ %
Salaries and employee benefits $ 342  $ 321  $ 331  $ 21  % $ 11  %
Technology, telecom, and information processing 70  66  62  13 
Occupancy and equipment, net 41  42  39  (1) (2)
Professional and legal services 13  17  16  (4) (24) (3) (19)
Marketing and business development 11  10  10  10  10 
Deposit insurance and regulatory expense 22  17  34  29  (12) (35)
Credit-related expense —  —  (1) (14)
Other 33  30  27  10  22 
Total noninterest expense
$ 538  $ 509  $ 526  $ 29  $ 12 
Adjusted noninterest expense 1
$ 533  $ 509  $ 511  $ 24  $ 22 
1 For information on non-GAAP financial measures, see pages 17-18.
Noninterest expense increased $12 million, or 2%, compared with the prior year quarter. Salaries and employee benefits expense increased $11 million, primarily due to higher incentive compensation, benefits, and severance expenses. Technology, telecom, and information processing expense increased $8 million, mainly due to higher application software, license, and maintenance expenses. Other noninterest expense increased $6 million, partly due to a $3 million impairment of certain long-lived assets. These increases were partially offset by a $12 million decrease in Press Release – Page 4


ZIONS BANCORPORATION, N.A.


deposit insurance and regulatory expense, primarily due to a $13 million accrual associated with an updated FDIC special assessment estimate during the prior year quarter.
Adjusted noninterest expense increased $22 million, or 4%. The efficiency ratio was 66.6%, compared with 67.9%, as the increase in adjusted taxable-equivalent revenue outpaced the increase in adjusted noninterest expense. For information on non-GAAP financial measures, see pages 17-18.
BALANCE SHEET ANALYSIS
Investment Securities
1Q25 - 4Q24 1Q25 - 1Q24
(In millions) 1Q25 4Q24 1Q24 $ % $ %
Investment securities:
Available-for-sale, at fair value $ 9,223  $ 9,095  $ 9,931  $ 128  % $ (708) (7) %
Held-to-maturity, at amortized cost 9,481  9,669  10,209  (188) (2) (728) (7)
Total investment securities, net of allowance $ 18,704  $ 18,764  $ 20,140  $ (60) —  $ (1,436) (7)
Total investment securities decreased $1.4 billion, or 7%, to $18.7 billion at March 31, 2025, primarily due to principal reductions. We invest in securities to manage liquidity and interest rate risk, and to generate interest income. Our portfolio mainly consists of securities that can readily provide cash and liquidity through secured borrowing agreements, eliminating the need to sell the securities. Our fixed-rate securities portfolio helps balance the inherent interest rate mismatch between loans and deposits, thereby protecting the economic value of shareholders' equity.
Loans and Leases
1Q25 - 4Q24 1Q25 - 1Q24
(In millions) 1Q25 4Q24 1Q24 $ % $ %
Loans held for sale $ 112  $ 74  $ 12  $ 38  51  % $ 100  NM
Loans and leases:
Commercial
$ 31,010  $ 30,965  $ 30,479  $ 45  —  $ 531  %
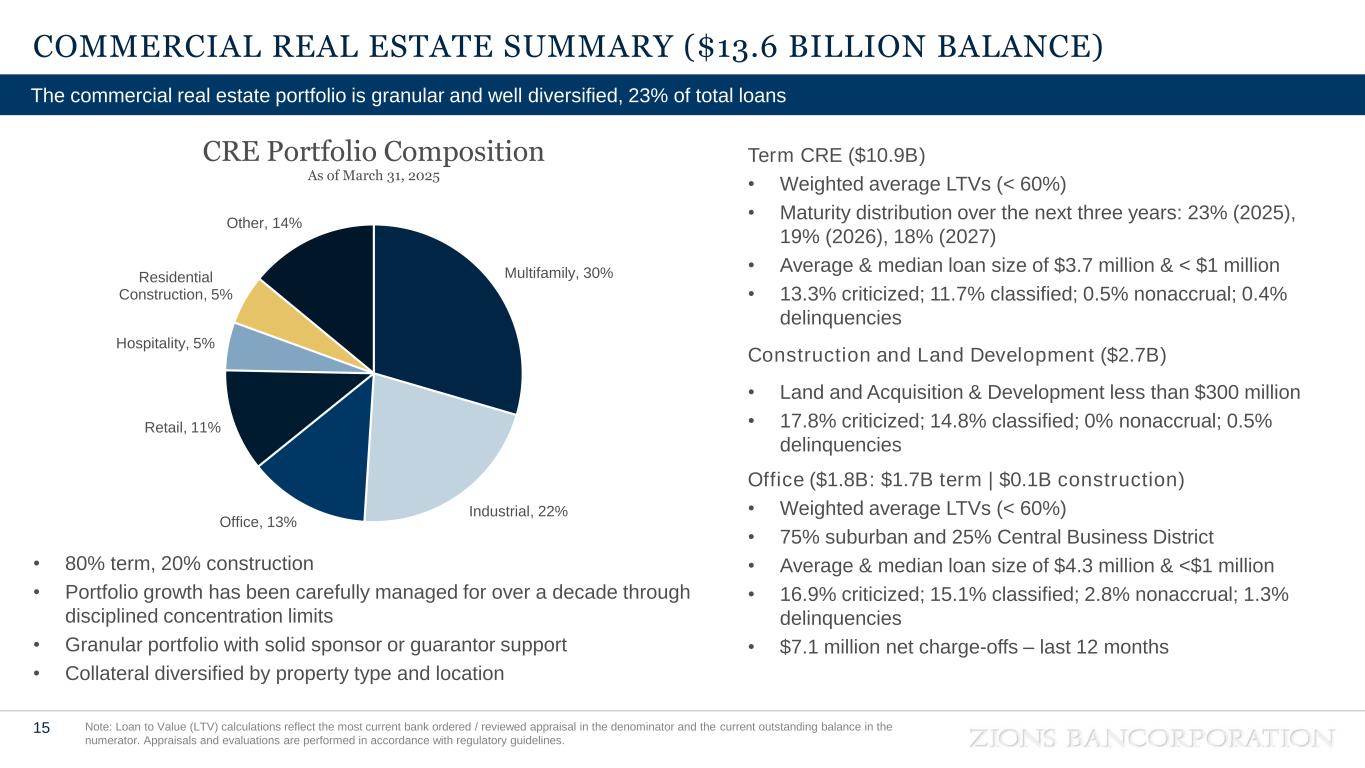
Commercial real estate
13,593  13,477  13,578  116  15  — 
Consumer
15,338  14,968  14,052  370  1,286 
Loans and leases, net of unearned income and fees 59,941  59,410  58,109  531  1,832 
Less allowance for loan losses
697  696  699  —  (2) — 
Loans and leases held for investment, net of allowance
$ 59,244  $ 58,714  $ 57,410  $ 530  $ 1,834 
Unfunded lending commitments $ 29,526  $ 29,618  $ 29,490  $ (92) —  $ 36  — 
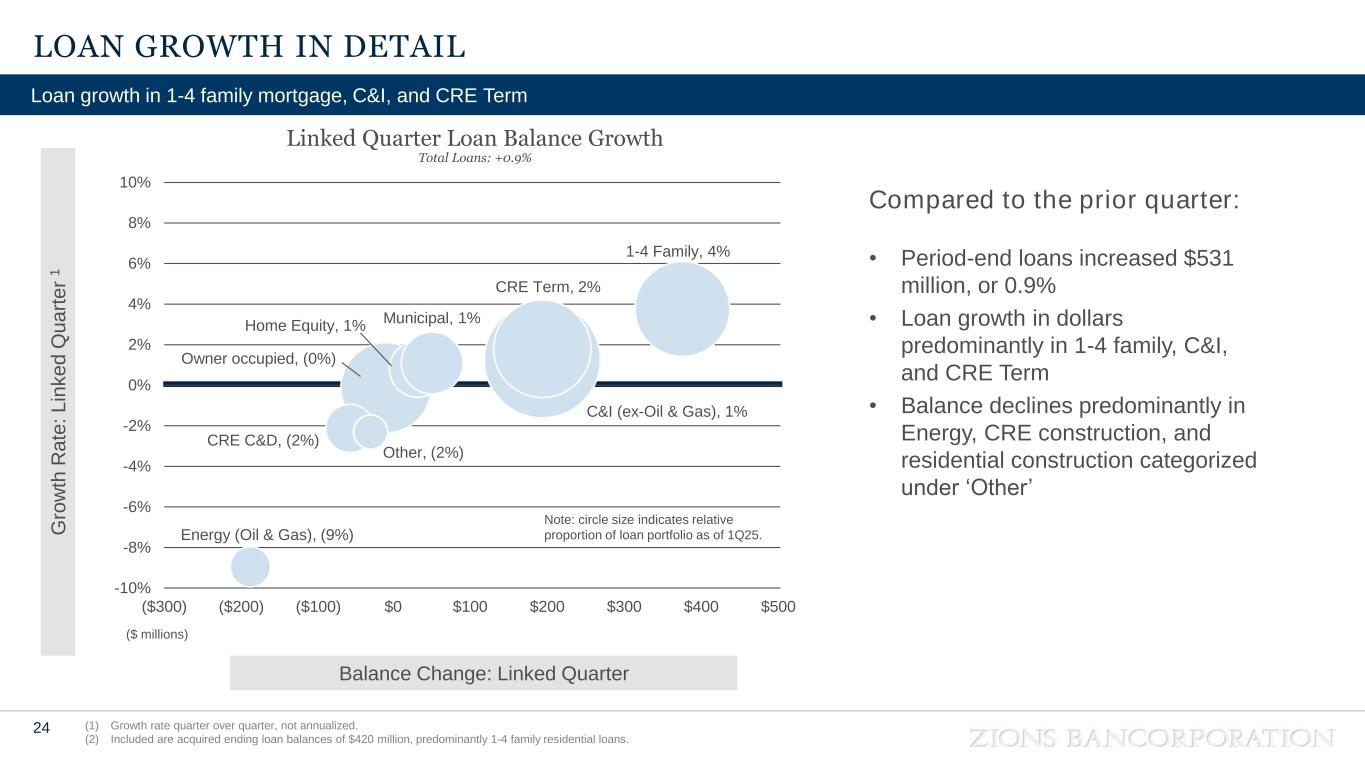
Loans and leases, net of unearned income and fees, increased $1.8 billion, or 3%, to $59.9 billion, relative to the prior year quarter. Consumer loans increased $1.3 billion from the prior year quarter, primarily in the 1-4 family residential loan portfolio, and commercial loans increased $531 million, primarily in the commercial and industrial loan portfolio.
At March 31, 2025, total loans and leases included approximately $420 million of consumer and commercial loan balances acquired from the purchase of four FirstBank Coachella Valley, California branches during the first quarter of 2025.


ZIONS BANCORPORATION, N.A.
Press Release – Page 5


Credit Quality
1Q25 - 4Q24 1Q25 - 1Q24
(In millions) 1Q25 4Q24 1Q24 $ % $ %
Provision for credit losses $ 18 $ 41 $ 13 $ (23) (56) % $ 38  %
Allowance for credit losses 743 741 736 — 
Net loan and lease charge-offs (recoveries) 16 36 6 (20) (56) 10  NM
Nonperforming assets 307 298 254 53  21 
Classified loans 2,891 2,870 966 21  1,925  NM
1Q25 4Q24 1Q24 bps bps
Ratio of ACL to loans and leases outstanding, at period end 1.24  % 1.25  % 1.27  % (1) (3)
Annualized ratio of net loan and lease charge-offs (recoveries) to average loans 0.11  % 0.24  % 0.04  % (13)
Ratio of nonperforming assets to loans and leases and other real estate owned 0.51  % 0.50  % 0.44  %
Ratio of classified loans to total loans and leases 4.82  % 4.83  % 1.66  % (1) 316 
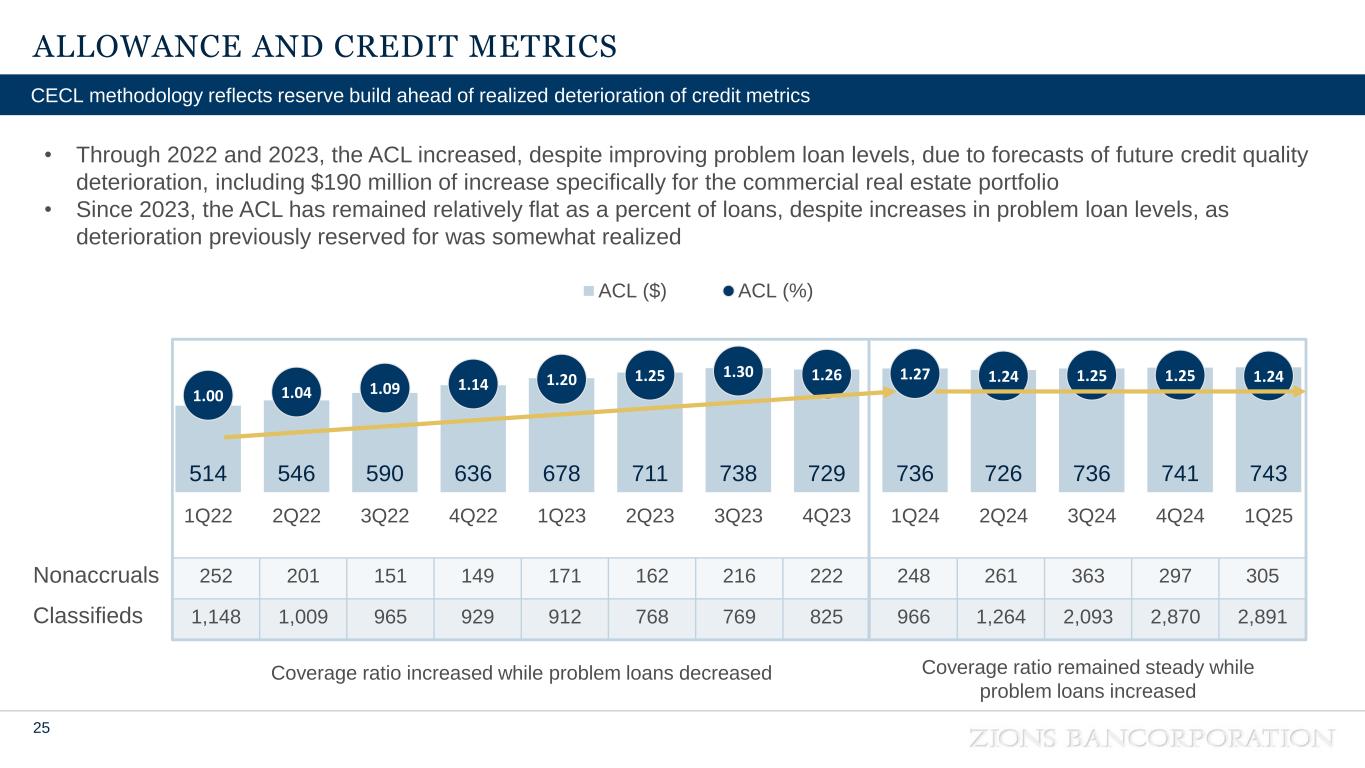
During the first quarter of 2025, we recorded an $18 million provision for credit losses, compared with a provision of $13 million during the prior year period. The allowance for credit losses (“ACL”) was $743 million at March 31, 2025, compared with $736 million at March 31, 2024. The increase in the ACL primarily reflects credit quality deterioration and loan growth, partially offset by lower reserves associated with portfolio-specific risks, including commercial real estate (“CRE”), improvements in economic forecasts, and changes in loan portfolio composition. The ratio of ACL to total loans and leases was 1.24% at March 31, 2025, compared with 1.27% at March 31, 2024.
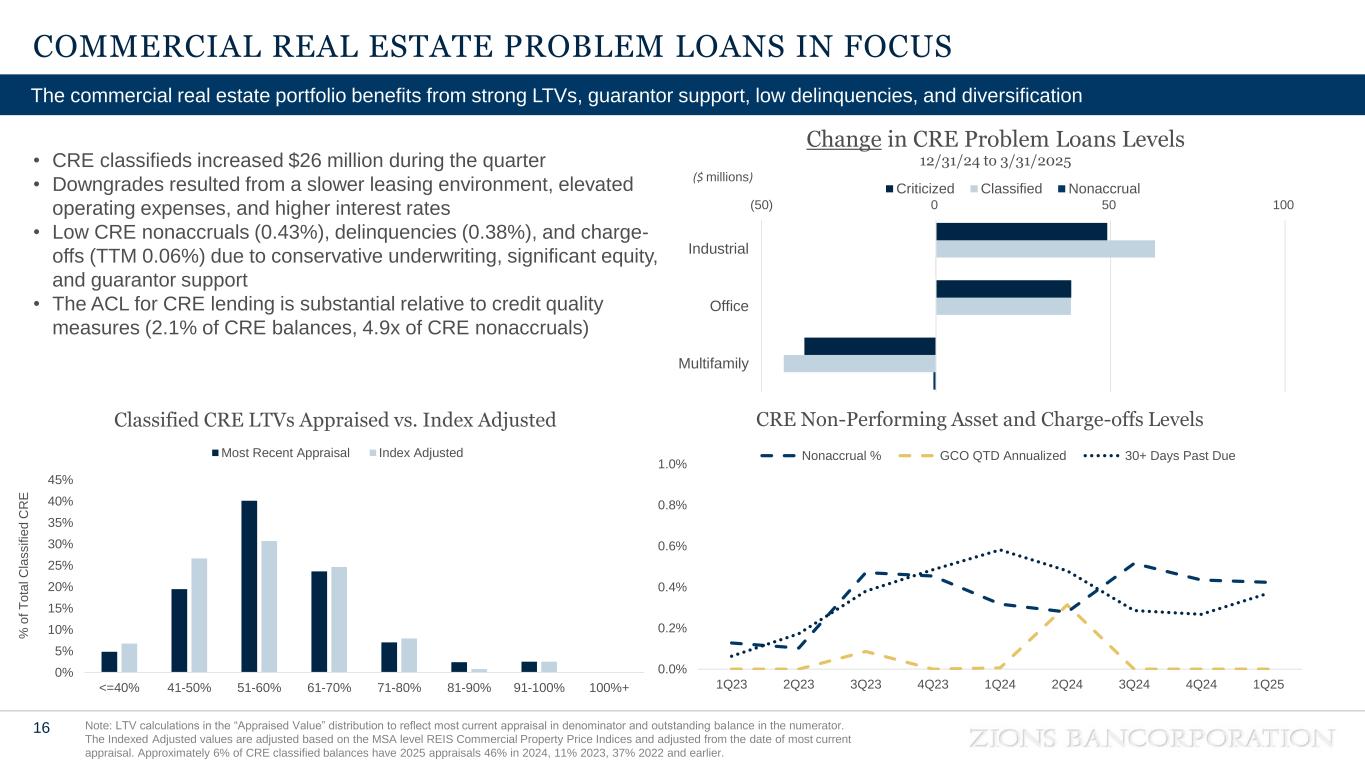
Net loan and lease charge-offs totaled $16 million, compared with $6 million in the prior year quarter, and included an $8 million charge-off on one commercial and industrial loan. Nonperforming assets totaled $307 million, or 0.51% of total loans and leases and other real estate owned, compared with $254 million, or 0.44%. The increase in nonperforming assets was primarily due to a small number of loans in the term CRE, consumer 1-4 family residential, and commercial and industrial portfolios.
Classified loans totaled $2.9 billion, or 4.82% of total loans and leases, compared with $966 million, or 1.66%, in the prior year period. The increase in classified loans was primarily in the multifamily and industrial CRE loan portfolios, largely due to an increased emphasis in risk grading on current cash flows, and less emphasis on the adequacy of collateral values and the strength of guarantors and sponsors. Additionally, weaker performance in the 2021, 2022, and 2023 construction loan vintages contributed to the increase, as borrowers missed projections due to longer-than-anticipated lease-up periods, rent concessions, elevated costs, and higher interest rates. The loss content of our CRE loan portfolio continues to be mitigated by strong underwriting, supported by significant borrower equity and guarantor support, resulting in relatively stable CRE nonperforming assets.


ZIONS BANCORPORATION, N.A.
Press Release – Page 6


Deposits and Borrowed Funds
1Q25 - 4Q24 1Q25 - 1Q24
(In millions) 1Q25 4Q24 1Q24 $ % $ %
Deposits:
Noninterest-bearing demand $ 24,792  $ 24,704  $ 25,137  $ 88  —  % $ (345) (1) %
Interest-bearing:
Savings and money market 39,860  40,037  38,835  (177) —  1,025 
Time 6,269  6,448  5,972  (179) (3) 297 
Brokered 4,771  5,034  4,293  (263) (5) 478  11 
Total interest-bearing 50,900  51,519  49,100  (619) (1) 1,800 
Total deposits $ 75,692  $ 76,223  $ 74,237  $ (531) (1) $ 1,455 
Borrowed funds:
Federal funds purchased and other short-term borrowings $ 3,476  $ 3,832  $ 4,895  $ (356) (9) $ (1,419) (29)
Long-term debt 964  950  544  14  420  77 
Total borrowed funds $ 4,440  $ 4,782  $ 5,439  $ (342) (7) $ (999) (18)
Total deposits increased $1.5 billion, or 2%, compared with the prior year quarter. Interest-bearing deposits increased $1.8 billion, partially offset by a $345 million decrease in noninterest-bearing demand deposits. At March 31, 2025, total deposits included approximately $630 million of deposit balances acquired from the purchase of four FirstBank Coachella Valley, California branches during the first quarter of 2025.
At March 31, 2025, customer deposits (excluding brokered deposits) totaled $70.9 billion, compared with $69.9 billion at March 31, 2024, and included approximately $6.7 billion and $7.5 billion of reciprocal deposits, respectively. Our loan-to-deposit ratio was 79%, compared with 78% in the prior year quarter.
Total borrowed funds, primarily consisting of secured borrowings, decreased $1.0 billion, or 18%, from the prior year quarter. This decrease was driven by a $1.4 billion reduction in security repurchase agreements and FRB short-term advances, partially offset by a $420 million increase in long-term debt. The increase in long-term debt was due to the issuance of $500 million of 6.82% Fixed-to-Floating Subordinated Notes, partially offset by the redemption of $88 million of 6.95% Fixed-to-Floating Subordinated Notes during the fourth quarter of 2024.


ZIONS BANCORPORATION, N.A.
Press Release – Page 7


Shareholders’ Equity
1Q25 - 4Q24 1Q25 - 1Q24
(In millions, except share data) 1Q25 4Q24 1Q24 $ % $ %
Shareholders’ equity:
Preferred stock
$ 66 $ 66 $ 440 $ —  —  % $ (374) (85) %
Common stock and additional paid-in capital
1,706 1,737 1,705 (31) (2) — 
Retained earnings
6,805 6,701 6,293 104  512 
Accumulated other comprehensive income (loss) (2,250) (2,380) (2,609) 130  359  14 
Total shareholders’ equity $ 6,327 $ 6,124 $ 5,829 $ 203  $ 498 
Capital distributions:
Common dividends paid $ 65 $ 64 $ 61 $ $
Bank common stock repurchased 1
41 35 41  NM 17 
Total capital distributed to common shareholders $ 106 $ 64 $ 96 $ 42  66  $ 10  10 
shares % shares %
Weighted average diluted common shares outstanding (in thousands)
147,387  147,329  147,343  58  —  % 44  —  %
Common shares outstanding, at period end (in thousands) 147,567  147,871  147,653  (304) —  (86) — 
1 Includes amounts related to common shares acquired through our publicly announced plans and those acquired in connection with our stock compensation plan. These shares were acquired from employees to cover their payroll taxes and stock option exercise costs upon the exercise of stock options.
Preferred stock decreased $374 million due to the redemption of the outstanding shares of our Series G, I, and J preferred stock during the fourth quarter of 2024. The common stock dividend was $0.43 per share, compared with $0.41 per share during the first quarter of 2024.
Common shares outstanding decreased 0.1 million from the first quarter of 2024, primarily due to common stock repurchases. During the first quarter of 2025, we repurchased 0.8 million common shares outstanding for $41 million, compared with 0.9 million common shares repurchased for $35 million during the prior year period.
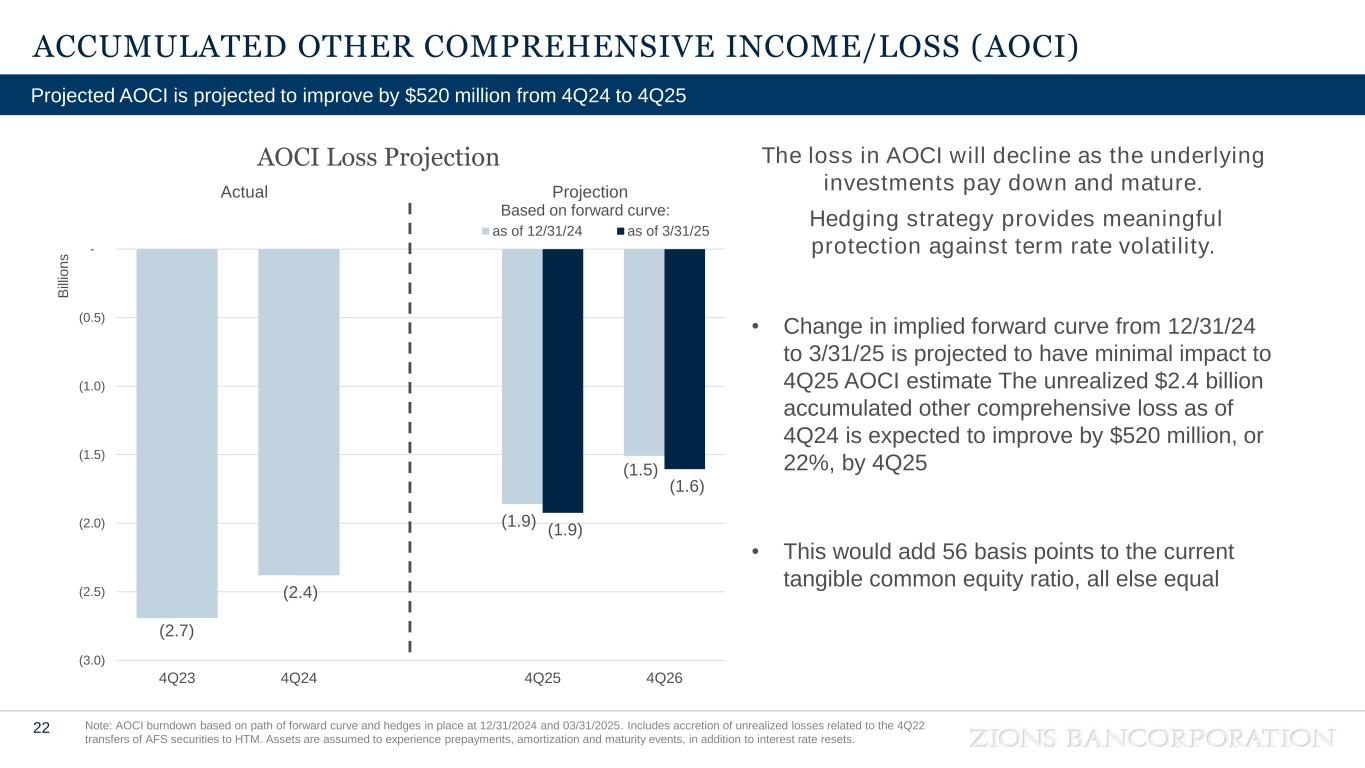
Accumulated other comprehensive income (loss) (“AOCI”) was a loss of $2.3 billion at March 31, 2025, an improvement of $359 million when compared with a loss of $2.6 billion at March 31, 2024. The AOCI loss largely reflects a decline in the fair value of fixed-rate available-for-sale securities as a result of changes in interest rates. Absent any sales or credit impairment of these securities, the unrealized losses will not be recognized in earnings. We do not intend to sell any securities with unrealized losses. Although changes in AOCI are reflected in shareholders’ equity, they are currently excluded from regulatory capital, and therefore do not impact our regulatory capital ratios.
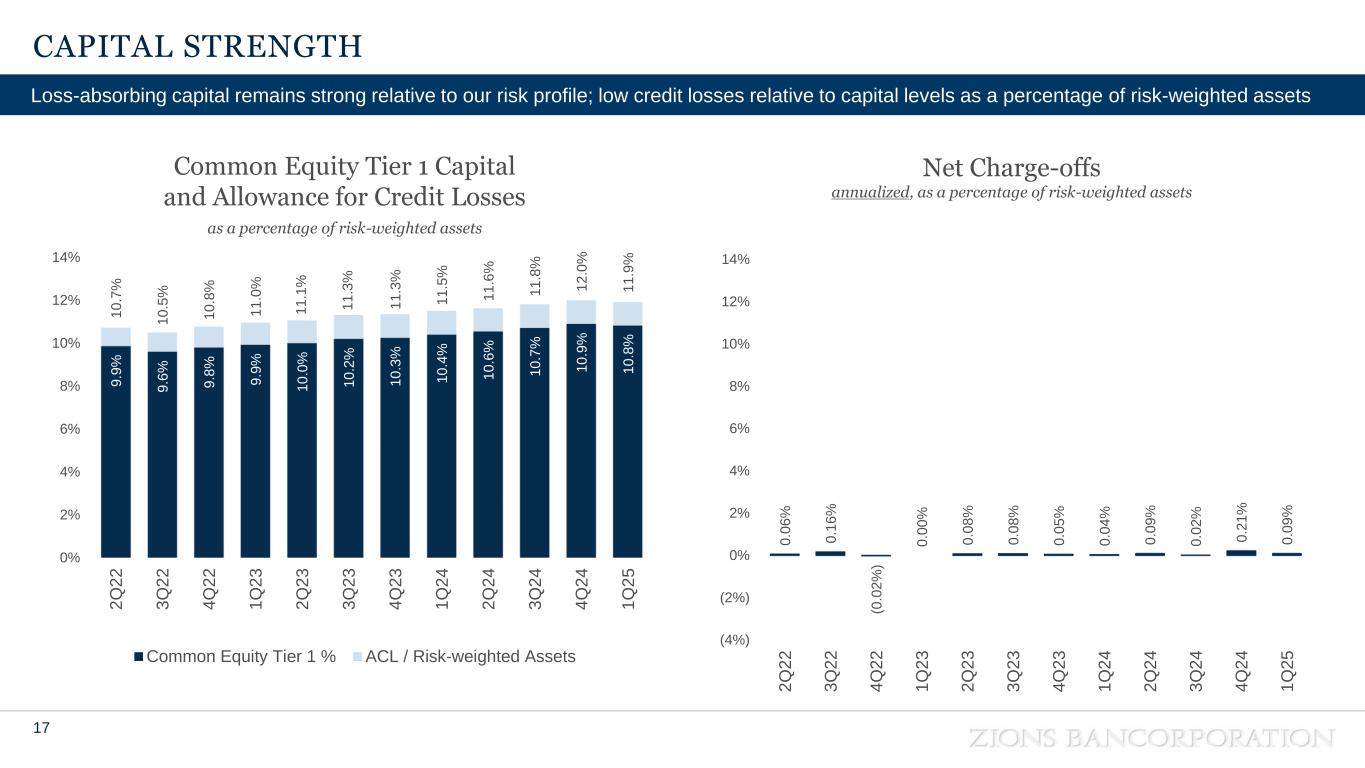
Estimated common equity tier 1 (“CET1”) capital was $7.4 billion, an increase of 7%, compared with $6.9 billion in the prior year period. The estimated CET1 capital ratio was 10.8%, compared with 10.4%. Tangible book value per common share increased to $34.95, compared with $29.34, primarily due to an increase in retained earnings and reduced unrealized losses in AOCI. For more information on non-GAAP financial measures, see pages 17-18.


ZIONS BANCORPORATION, N.A.
Press Release – Page 8


Supplemental Presentation and Conference Call
Zions has posted a supplemental presentation to its website, which will be used to discuss the first quarter results at 5:30 p.m. ET on April 21, 2025. Media representatives, analysts, investors, and the public are invited to join this discussion by calling (877) 709-8150 (domestic and international) and using the meeting number 13753109, or via on-demand webcast. A link to the webcast will be available on the Zions Bancorporation website at www.zionsbancorporation.com. The webcast of the conference call will also be archived and available for 30 days.
About Zions Bancorporation, N.A.
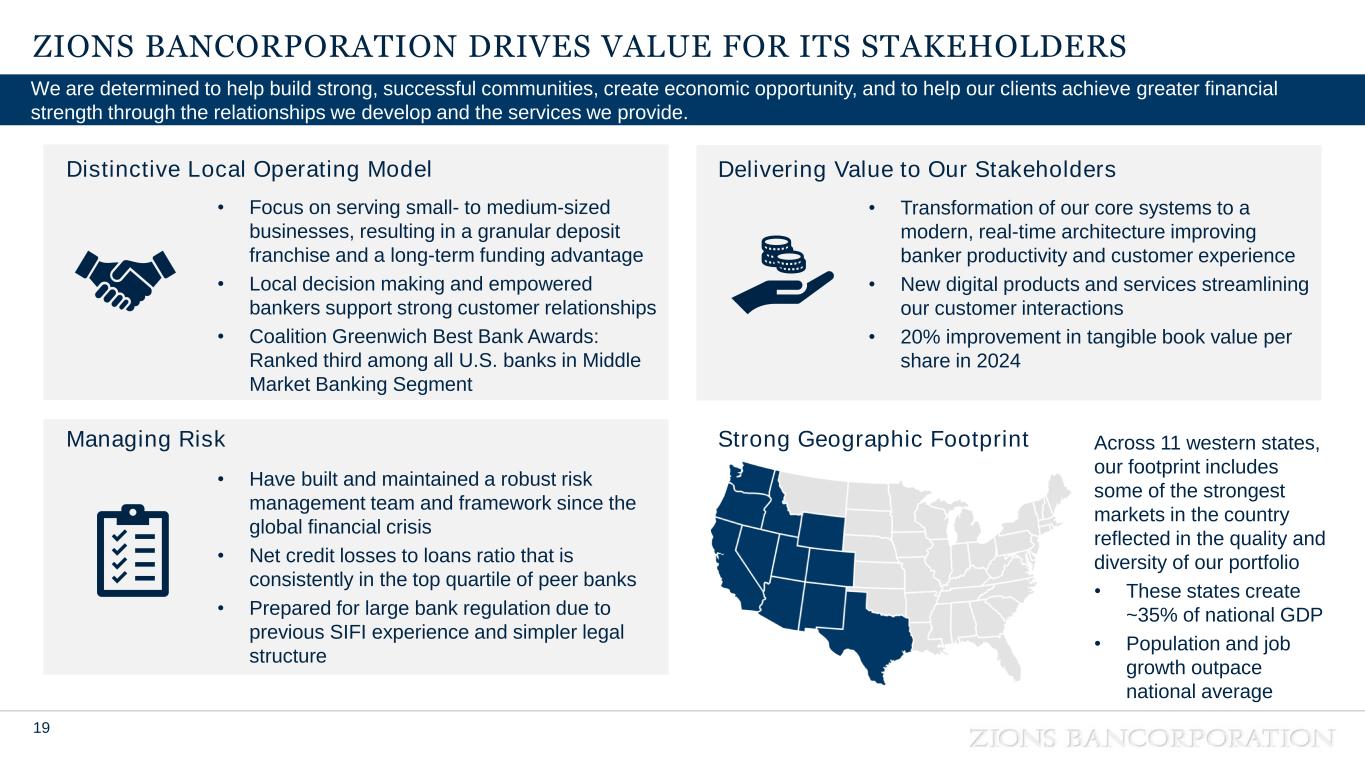
Zions Bancorporation, N.A. is one of the nation's premier financial services companies with annual net revenue of $3.1 billion in 2024, and total assets of approximately $89 billion at December 31, 2024. Zions operates under local management teams and distinct brands in 11 western states: Arizona, California, Colorado, Idaho, Nevada, New Mexico, Oregon, Texas, Utah, Washington, and Wyoming. The Bank is a consistent recipient of national and state-wide customer survey awards in small- and middle-market banking, as well as a leader in public finance advisory services and Small Business Administration lending. In addition, Zions is included in the S&P MidCap 400 and NASDAQ Financial 100 indices. Investor information and links to local banking brands can be accessed at www.zionsbancorporation.com.
Forward-Looking Information
This earnings release includes “forward-looking statements” as that term is defined in the Private Securities Litigation Reform Act of 1995. These statements are based on management’s current expectations and assumptions regarding future events or determinations, all of which are subject to known and unknown risks, uncertainties, and other factors that may cause our actual results, performance or achievements, industry trends, and results or regulatory outcomes to differ materially from those expressed or implied. Forward-looking statements include, among others:
•Statements with respect to the beliefs, plans, objectives, goals, targets, commitments, designs, guidelines, expectations, anticipations, and future financial condition, results of operations, and performance of Zions Bancorporation, National Association, and its subsidiaries (collectively “Zions Bancorporation, N.A.,” “the Bank,” “we,” “our,” “us”); and
•Statements preceded or followed by, or that include the words “may,” “might,” “can,” “continue,” “could,” “should,” “would,” “believe,” “anticipate,” “estimate,” “forecasts,” “expect,” “intend,” “target,” “commit,” “design,” “plan,” “projects,” “will,” and the negative thereof and similar words and expressions.
Forward-looking statements are not guarantees and should not be relied upon as representing management’s views as of any subsequent date. Actual results and outcomes may differ materially from those presented. Although the following list is not comprehensive, key factors that may cause material differences include:
•The quality and composition of our loan and investment securities portfolios and the quality and composition of our deposits;
•Changes in general industry, political, and economic conditions, including elevated inflation, economic slowdown or recession, or other economic challenges; imposition of tariffs and resulting market volatility and uncertainty, including the effects on supply chains and revenues for us and our customers; changes in interest and reference rates, which could adversely affect our revenue and expenses, the value of assets and liabilities, and the availability and cost of capital and liquidity; and deterioration in economic conditions that may result in increased loan and lease losses;
•Political developments, including transitions in administration and shifts in congressional control that result in significant disruptions and changes in the size, scope, and effectiveness of the government and its agencies and services;
•The effects of newly enacted and proposed regulations affecting us and the banking industry, as well as changes and uncertainties in the interpretation, enforcement, and applicability of laws and fiscal, monetary, regulatory, trade, and tax policies; Press Release – Page 9


ZIONS BANCORPORATION, N.A.


•Actions taken by governments, agencies, central banks, and similar organizations, including those that result in decreases in revenue, increases in regulatory bank fees, insurance assessments, and capital standards; and other regulatory requirements;
•Judicial, regulatory and administrative inquiries, investigations, examinations or proceedings and the outcomes thereof that create uncertainty for, or are adverse to us or, the banking industry;
•Changes in our credit ratings;
•Our ability to innovate and otherwise address competitive pressures and other factors that may affect aspects of our business, such as pricing, relevance of, and demand for, our products and services, and our ability to recruit and retain talent;
•The potential for both positive and disruptive impacts of technological advancements, such as digital currencies and commerce, blockchain, artificial intelligence, quantum and cloud computing, and other innovations affecting us and the banking industry;
•Our ability to complete projects and initiatives and execute our strategic plans, manage our risks, control compensation and other expenses, and achieve our business objectives;
•Our ability to develop and maintain technology, information security systems, and controls designed to guard against fraud, cybersecurity, and privacy risks and related incidents;
•Our ability to provide adequate oversight of our suppliers to help us prevent or mitigate effects upon us and our customers of inadequate performance, systems failures, or cyber and other incidents by, or affecting, third parties upon whom we rely for the delivery of various products and services;
•The effects of wars, domestic and international trade policies and disputes, geopolitical conflicts, and other local, national, or international disasters, crises, or conflicts that may occur in the future;
•Natural disasters, pandemics, wildfires, catastrophic events, and other emergencies and incidents, and their impact on our and our customers’ operations, business, and communities, including the increasing difficulty in, and the expense of, obtaining property, auto, business, and other insurance products;
•Governmental and social responses to environmental, social, and governance issues, including those with respect to climate change and diversity;
•Securities and capital markets behavior, including volatility and changes in market liquidity and our ability to raise capital;
•The possibility that our recorded goodwill could become impaired, which may have an adverse impact on our earnings and shareholders’ equity;
•The impact of bank closures or adverse developments at other banks on general investor sentiment regarding the stability and liquidity of banks;
•Adverse news and other expressions of negative public opinion whether directed at us, other banks, the banking industry, or otherwise that may adversely affect our reputation and that of the banking industry generally;
•Protracted congressional negotiations regarding government funding and other issues, including those that add to the national debt, increase the possibility of government shutdowns, downgrades in United States (“U.S.”) credit ratings, or other economic disruptions; and
•Other assumptions, risks, or uncertainties described in this earnings release, and other SEC filings.
We caution against undue reliance on forward-looking statements, which reflect our views only as of their date of issuance. Except as required by law, we specifically disclaim any obligation to update any factors or publicly announce revisions to forward-looking statements to reflect future events or developments.


ZIONS BANCORPORATION, N.A.
Press Release – Page 10


FINANCIAL HIGHLIGHTS
(Unaudited)
Three Months Ended
(In millions, except share, per share, and ratio data) March 31,
2025
December 31,
2024
September 30,
2024
June 30,
2024
March 31,
2024
BALANCE SHEET 1
Loans held for investment, net of allowance $ 59,244 $ 58,714 $ 58,190 $ 57,719 $ 57,410
Total assets 87,992 88,775 87,032 87,606 87,060
Deposits 75,692 76,223 75,718 73,770 74,237
Total shareholders’ equity 6,327 6,124 6,385 6,025 5,829
STATEMENT OF INCOME
Net earnings applicable to common shareholders
$ 169 $ 200 $ 204 $ 190 $ 143
Net interest income 624 627 620 597 586
Taxable-equivalent net interest income 2
635 639 632 608 596
Total noninterest income 171 193 172 179 156
Total noninterest expense 538 509 502 509 526
Pre-provision net revenue 2
268 323 302 278 226
Adjusted pre-provision net revenue 2
267 312 299 278 242
Provision for credit losses 18 41 13 5 13
SHARE AND PER COMMON SHARE AMOUNTS
Net earnings per diluted common share $ 1.13 $ 1.34 $ 1.37 $ 1.28 $ 0.96
Dividends 0.43 0.43 0.41 0.41 0.41
Book value per common share 1
42.43 40.97 40.25 37.82 36.50
Tangible book value per common share 1, 2
34.95 33.85 33.12 30.67 29.34
Weighted average share price 53.64 54.60 47.13 42.01 41.03
Weighted average diluted common shares outstanding (in thousands)
147,387 147,329 147,150 147,120 147,343
Common shares outstanding (in thousands) 1
147,567 147,871 147,699 147,684 147,653
SELECTED RATIOS AND OTHER DATA
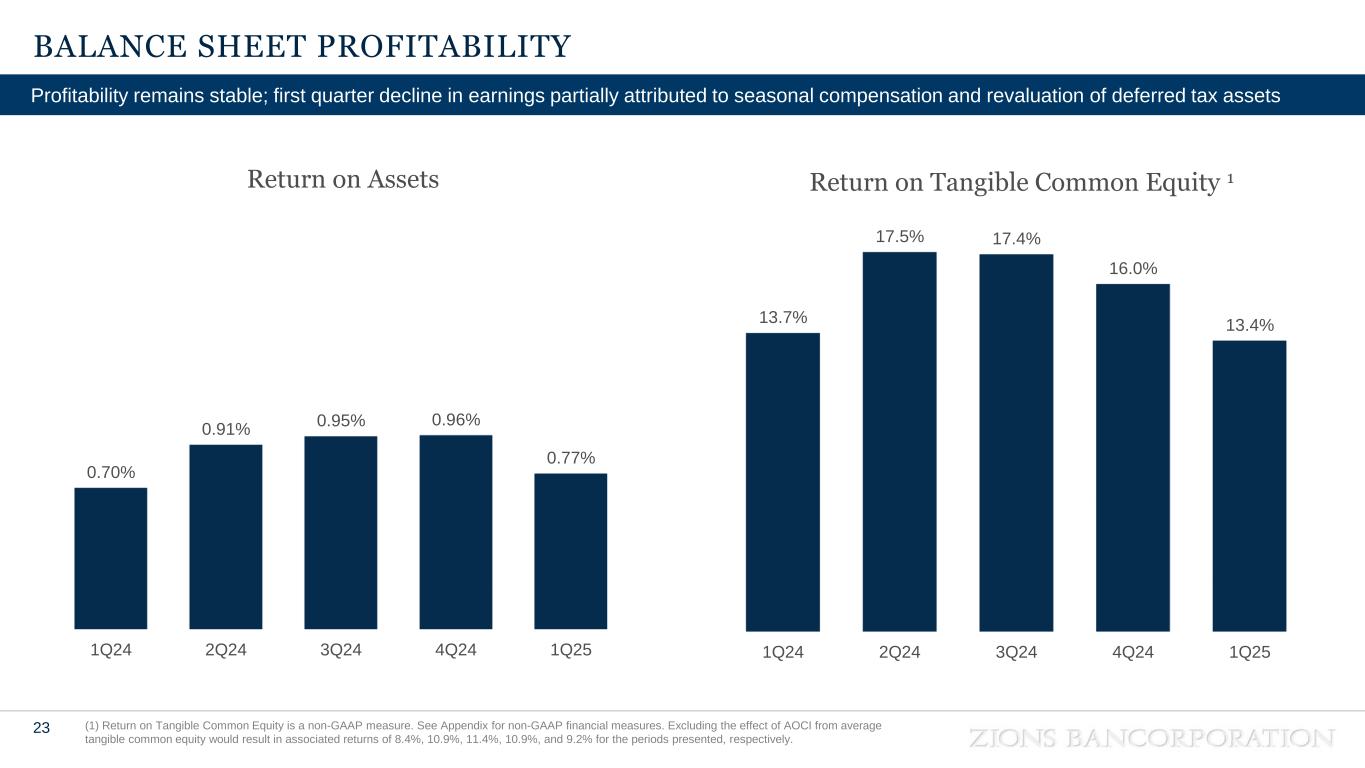
Return on average assets 0.77  % 0.96  % 0.95  % 0.91  % 0.70  %
Return on average common equity 11.1  % 13.2  % 14.1  % 14.0  % 10.9  %
Return on average tangible common equity 2
13.4  % 16.0  % 17.4  % 17.5  % 13.7  %
Net interest margin 3.10  % 3.05  % 3.03  % 2.98  % 2.94  %
Cost of deposits 1.76  % 1.93  % 2.14  % 2.11  % 2.06  %
Efficiency ratio 2
66.6  % 62.0  % 62.5  % 64.5  % 67.9  %
Effective tax rate 3
28.9  % 20.0  % 22.7  % 23.3  % 24.6  %
Ratio of nonperforming assets to loans and leases and other real estate owned
0.51  % 0.50  % 0.62  % 0.45  % 0.44  %
Annualized ratio of net loan and lease charge-offs to average loans 0.11  % 0.24  % 0.02  % 0.10  % 0.04  %
Ratio of total allowance for credit losses to loans and leases outstanding 1
1.24  % 1.25  % 1.25  % 1.24  % 1.27  %
Full-time equivalent employees
9,392 9,406 9,503 9,696 9,708
CAPITAL RATIOS AND DATA 1
Tangible common equity ratio 2
5.9  % 5.7  % 5.7  % 5.2  % 5.0  %
Common equity tier 1 capital 4
$ 7,379 $ 7,363 $ 7,206 $ 7,057 $ 6,920
Risk-weighted assets 4
$ 68,096 $ 67,685 $ 67,305 $ 66,885 $ 66,824
Common equity tier 1 capital ratio 4
10.8  % 10.9  % 10.7  % 10.6  % 10.4  %
Tier 1 risk-based capital ratio 4
10.9  % 11.0  % 11.4  % 11.2  % 11.0  %
Total risk-based capital ratio 4
13.3  % 13.3  % 13.2  % 13.1  % 12.9  %
Tier 1 leverage ratio 4
8.4  % 8.3  % 8.6  % 8.5  % 8.4  %
1 At period end.
2 For information on non-GAAP financial measures, see pages 17-18.
3 The increase in the effective tax rate at March 31, 2025 was the result of a revaluation of deferred tax assets due to newly enacted state tax legislation.
4 Current period ratios and amounts represent estimates.


ZIONS BANCORPORATION, N.A.
Press Release – Page 11


CONSOLIDATED BALANCE SHEETS
(In millions, shares in thousands) March 31,
2025
December 31,
2024
September 30,
2024
June 30,
2024
March 31,
2024
(Unaudited) (Unaudited) (Unaudited) (Unaudited)
ASSETS
Cash and due from banks $ 833  $ 651  $ 1,114  $ 717  $ 709 
Money market investments:
Interest-bearing deposits 1,980  2,850  1,253  2,276  1,688 
Federal funds sold and securities purchased under agreements to resell 936  1,453  986  936  894 
Trading securities, at fair value 64  35  68  24  59 
Investment securities:
Available-for-sale, at fair value 9,223  9,095  9,495  9,483  9,931 
Held-to-maturity1, at amortized cost
9,481  9,669  9,857  10,065  10,209 
Total investment securities, net of allowance 18,704  18,764  19,352  19,548  20,140 
Loans held for sale2
112  74  97  112  12 
Loans and leases, net of unearned income and fees 59,941  59,410  58,884  58,415  58,109 
Less allowance for loan losses 697  696  694  696  699 
Loans held for investment, net of allowance 59,244  58,714  58,190  57,719  57,410 
Other noninterest-bearing investments 1,045  1,020  946  987  922 
Premises, equipment, and software, net 1,362  1,366  1,372  1,383  1,396 
Goodwill and intangibles 1,104  1,052  1,053  1,055  1,057 
Other real estate owned
Other assets 2,606  2,795  2,596  2,845  2,767 
Total assets $ 87,992  $ 88,775  $ 87,032  $ 87,606  $ 87,060 
LIABILITIES AND SHAREHOLDERS’ EQUITY
Deposits:
Noninterest-bearing demand $ 24,792  $ 24,704  $ 24,973  $ 24,731  $ 25,137 
Interest-bearing:
Savings and money market 39,860  40,037  39,242  38,596  38,879 
Time 11,040  11,482  11,503  10,443  10,221 
Total deposits 75,692  76,223  75,718  73,770  74,237 
Federal funds and other short-term borrowings 3,476  3,832  2,919  5,651  4,895 
Long-term debt 964  950  548  546  544 
Reserve for unfunded lending commitments 46  45  42  30  37 
Other liabilities 1,487  1,601  1,420  1,584  1,518 
Total liabilities 81,665  82,651  80,647  81,581  81,231 
Shareholders’ equity:
Preferred stock, without par value; authorized 4,400 shares 66  66  440  440  440 
Common stock3 ($0.001 par value; authorized 350,000 shares) and additional paid-in capital
1,706  1,737  1,717  1,713  1,705 
Retained earnings 6,805  6,701  6,564  6,421  6,293 
Accumulated other comprehensive income (loss) (2,250) (2,380) (2,336) (2,549) (2,609)
Total shareholders’ equity 6,327  6,124  6,385  6,025  5,829 
Total liabilities and shareholders’ equity $ 87,992  $ 88,775  $ 87,032  $ 87,606  $ 87,060 
1 Held-to-maturity (fair value)
$ 9,400  $ 9,382  $ 10,024  $ 9,891  $ 10,105 
2 Loans held for sale (carried at fair value)
62  25  58  58  — 
3 Common shares (issued and outstanding)
147,567  147,871  147,699  147,684  147,653 


ZIONS BANCORPORATION, N.A.
Press Release – Page 12


CONSOLIDATED STATEMENTS OF INCOME
(Unaudited) Three Months Ended
(In millions, except share and per share amounts) March 31,
2025
December 31,
2024
September 30,
2024
June 30,
2024
March 31,
2024
Interest income:
Interest and fees on loans $ 850  $ 873  $ 899  $ 877  $ 865 
Interest on money market investments 53  60  67  56  47 
Interest on securities 125  129  138  140  142 
Total interest income 1,028  1,062  1,104  1,073  1,054 
Interest expense:
Interest on deposits 326  371  403  390  376 
Interest on short- and long-term borrowings 78  64  81  86  92 
Total interest expense 404  435  484  476  468 
Net interest income 624  627  620  597  586 
Provision for credit losses:
Provision for loan losses 17  38  12  21 
Provision for unfunded lending commitments 12  (7) (8)
Total provision for credit losses 18  41  13  13 
Net interest income after provision for credit losses 606  586  607  592  573 
Noninterest income:
Commercial account fees 45  47  46  45  44 
Card fees 23  24  24  25  23 
Retail and business banking fees 17  17  18  16  16 
Loan-related fees and income 17  20  17  18  15 
Capital markets fees and income 27  40  25  20  25 
Wealth management fees 15  14  14  15  15 
Other customer-related fees 14  14  14  14  14 
Customer-related noninterest income 158  176  158  153  152 
Dividends and other income 22 
Securities gains (losses), net (2)
Total noninterest income 171  193  172  179  156 
Noninterest expense:
Salaries and employee benefits 342  321  317  318  331 
Technology, telecom, and information processing 70  66  66  66  62 
Occupancy and equipment, net 41  42  40  40  39 
Professional and legal services 13  17  14  17  16 
Marketing and business development 11  10  12  13  10 
Deposit insurance and regulatory expense 22  17  19  21  34 
Credit-related expense
Other real estate expense, net —  —  —  (1) — 
Other 33  30  28  29  27 
Total noninterest expense 538  509  502  509  526 
Income before income taxes 239  270  277  262  203 
Income taxes 69  54  63  61  50 
Net income 170  216  214  201  153 
Preferred stock dividends (1) (10) (10) (11) (10)
Preferred stock redemption —  (6) —  —  — 
Net earnings applicable to common shareholders $ 169  $ 200  $ 204  $ 190  $ 143 
Weighted average common shares outstanding during the period:
Basic shares (in thousands) 147,321  147,247  147,138  147,115  147,338 
Diluted shares (in thousands) 147,387  147,329  147,150  147,120  147,343 
Net earnings per common share:
Basic $ 1.13  $ 1.34  $ 1.37  $ 1.28  $ 0.96 
Diluted 1.13  1.34  1.37  1.28  0.96 


ZIONS BANCORPORATION, N.A.
Press Release – Page 13


Loan Balances Held for Investment by Portfolio Type
(Unaudited)
(In millions) March 31,
2025
December 31,
2024
September 30,
2024
June 30,
2024
March 31,
2024
Commercial:
Commercial and industrial $ 16,900  $ 16,891  $ 16,757  $ 16,622  $ 16,519 
Owner occupied 9,321  9,333  9,381  9,236  9,295 
Municipal 4,412  4,364  4,270  4,263  4,277 
Leasing 377  377  377  390  388 
Total commercial 31,010  30,965  30,785  30,511  30,479 
Commercial real estate:
Term 10,878  10,703  10,650  10,824  10,892 
Construction and land development 2,715  2,774  2,833  2,725  2,686 
Total commercial real estate 13,593  13,477  13,483  13,549  13,578 
Consumer:
1-4 family residential 10,312  9,939  9,489  9,153  8,778 
Home equity credit line 3,670  3,641  3,543  3,468  3,382 
Construction and other consumer real estate 762  810  997  1,139  1,321 
Bankcard and other revolving plans 472  457  461  466  439 
Other 122  121  126  129  132 
Total consumer 15,338  14,968  14,616  14,355  14,052 
Total loans and leases $ 59,941  $ 59,410  $ 58,884  $ 58,415  $ 58,109 

Nonperforming Assets
(Unaudited)
(In millions) March 31,
2025
December 31,
2024
September 30,
2024
June 30,
2024
March 31,
2024
Nonaccrual loans 1
$ 305  $ 297  $ 363  $ 261  $ 248 
Other real estate owned 2
Total nonperforming assets $ 307  $ 298  $ 368  $ 265  $ 254 
Ratio of nonperforming assets to loans1 and leases and other real estate owned 2
0.51  % 0.50  % 0.62  % 0.45  % 0.44  %
Accruing loans past due 90 days or more $ 13  $ 18  $ $ $
Ratio of accruing loans past due 90 days or more to loans1 and leases
0.02  % 0.03  % 0.01  % 0.01  % 0.01  %
Nonaccrual loans and accruing loans past due 90 days or more
$ 318  $ 315  $ 370  $ 267  $ 251 
Ratio of nonperforming assets1 and accruing loans 90 days or more past due to loans and leases and other real estate owned
0.53  % 0.53  % 0.64  % 0.46  % 0.44  %
Accruing loans past due 30-89 days $ 105  $ 57  $ 89  $ 114  $ 77 
Classified loans 2,891  2,870  2,093  1,264  966 
Ratio of classified loans to total loans and leases 4.82  % 4.83  % 3.55  % 2.16  % 1.66  %
1 Includes loans held for sale.
2 Does not include banking premises held for sale.


ZIONS BANCORPORATION, N.A.
Press Release – Page 14


Allowance for Credit Losses
(Unaudited)
Three Months Ended
(In millions) March 31,
2025
December 31,
2024
September 30,
2024
June 30,
2024
March 31,
2024
Allowance for Loan and Lease Losses
Balance at beginning of period $ 696  $ 694  $ 696  $ 699  $ 684 
Provision for loan losses 17  38  12  21 
Loan and lease charge-offs 24  41  15  21  14 
Less: Recoveries 12 
Net loan and lease charge-offs (recoveries) 16  36  15 
Balance at end of period $ 697  $ 696  $ 694  $ 696  $ 699 
Ratio of allowance for loan losses to loans1 and leases, at period end
1.16  % 1.17  % 1.18  % 1.19  % 1.20  %
Ratio of allowance for loan losses to nonaccrual loans1 at period end
229  % 234  % 191  % 267  % 282  %
Annualized ratio of net loan and lease charge-offs (recoveries) to average loans 0.11  % 0.24  % 0.02  % 0.10  % 0.04  %
Reserve for Unfunded Lending Commitments
Balance at beginning of period $ 45  $ 42  $ 30  $ 37  $ 45 
Provision for unfunded lending commitments 12  (7) (8)
Balance at end of period $ 46  $ 45  $ 42  $ 30  $ 37 
Allowance for Credit Losses
Allowance for loan losses $ 697  $ 696  $ 694  $ 696  $ 699 
Reserve for unfunded lending commitments 46  45  42  30  37 
Total allowance for credit losses $ 743  $ 741  $ 736  $ 726  $ 736 
Ratio of ACL to loans1 and leases outstanding, at period end
1.24  % 1.25  % 1.25  % 1.24  % 1.27  %
1 Does not include loans held for sale.


ZIONS BANCORPORATION, N.A.
Press Release – Page 15


Nonaccrual Loans by Portfolio Type
(Unaudited)
(In millions) March 31,
2025
December 31,
2024
September 30,
2024
June 30,
2024
March 31,
2024
Commercial:
Commercial and industrial $ 121  $ 114  $ 173  $ 111  $ 110 
Owner occupied 25  31  29  28  20 
Municipal 10  11  11  — 
Leasing
Total commercial 158  158  215  147  132 
Commercial real estate:
Term 58  59  67  35  42 
Construction and land development —  — 
Total commercial real estate 58  59  69  37  43 
Consumer:
1-4 family residential 56  49  47  46  44 
Home equity credit line 32  30  30  29  27 
Bankcard and other revolving plans
Other —  — 
Total consumer 89  80  79  77  73 
Total nonaccrual loans $ 305  $ 297  $ 363  $ 261  $ 248 

Net Charge-Offs by Portfolio Type
(Unaudited)
(In millions) March 31,
2025
December 31,
2024
September 30,
2024
June 30,
2024
March 31,
2024
Commercial:
Commercial and industrial $ 13  $ 35  $ $ $
Owner occupied (1) (1) —  —  — 
Total commercial 12  34 
Commercial real estate:
Term —  —  (2) 11  — 
Construction and land development —  —  —  —  (1)
Total commercial real estate —  —  (2) 11  (1)
Consumer:
1-4 family residential —  —  (1)
Bankcard and other revolving plans
Other —  —  — 
Total consumer loans — 
Total net charge-offs (recoveries) $ 16  $ 36  $ $ 15  $


ZIONS BANCORPORATION, N.A.
Press Release – Page 16


CONSOLIDATED AVERAGE BALANCE SHEETS, YIELDS AND RATES
(Unaudited) Three Months Ended
March 31, 2025 December 31, 2024 March 31, 2024
(In millions) Average balance
Yield/
Rate 1
Average balance
Yield/
Rate 1
Average balance
Yield/
Rate 1
ASSETS
Money market investments:
Interest-bearing deposits $ 1,632  4.59  % $ 2,059  4.87  % $ 1,447  5.71  %
Federal funds sold and securities purchased under agreements to resell 2,971  4.70  % 2,698  5.10  % 1,826  5.89  %
Total money market investments 4,603  4.66  % 4,757  5.00  % 3,273  5.81  %
Trading securities 25  4.01  % 40  4.37  % 33  4.27  %
Investment securities:
Available-for-sale 9,101  3.27  % 9,310  3.26  % 10,067  3.45  %
Held-to-maturity 9,555  2.25  % 9,739  2.22  % 10,277  2.25  %
Total investment securities 18,656  2.75  % 19,049  2.73  % 20,344  2.84  %
Loans held for sale 83  NM 76  NM 56  NM
Loans and leases:2
Commercial 31,033  5.86  % 31,020  5.89  % 30,482  5.95  %
Commercial real estate 13,557  6.59  % 13,514  6.86  % 13,504  7.29  %
Consumer 15,045  5.12  % 14,781  5.10  % 13,921  5.10  %
Total loans and leases 59,635  5.84  % 59,315  5.92  % 57,907  6.06  %
Total interest-earning assets 83,002  5.08  % 83,237  5.13  % 81,613  5.25  %
Cash and due from banks 705  751  710 
Allowance for credit losses on loans and debt securities (692) (674) (685)
Goodwill and intangibles 1,052  1,053  1,058 
Other assets 5,376  5,202  5,274 
Total assets $ 89,443  $ 89,569  $ 87,970 
LIABILITIES AND SHAREHOLDERS’ EQUITY
Interest-bearing deposits:
Savings and money market $ 39,646  2.18  % $ 39,765  2.37  % $ 38,044  2.73  %
Time 11,024  4.15  % 11,780  4.54  % 9,777  4.81  %
Total interest-bearing deposits 50,670  2.61  % 51,545  2.87  % 47,821  3.16  %
Borrowed funds:
Federal funds purchased and security repurchase agreements
1,721  4.36  % 1,251  4.64  % 1,748  5.38  %
Other short-term borrowings 3,976  4.52  % 3,114  4.72  % 4,931  4.98  %
Long-term debt 955  6.38  % 767  6.32  % 543  5.99  %
Total borrowed funds 6,652  4.74  % 5,132  4.94  % 7,222  5.15  %
Total interest-bearing liabilities 57,322  2.85  % 56,677  3.05  % 55,043  3.42  %
Noninterest-bearing demand deposits 24,249  24,858  25,537 
Other liabilities 1,624  1,623  1,661 
Total liabilities 83,195  83,158  82,241 
Shareholders’ equity:
Preferred equity 66  375  440 
Common equity 6,182  6,036  5,289 
Total shareholders’ equity 6,248  6,411  5,729 
Total liabilities and shareholders’ equity $ 89,443  $ 89,569  $ 87,970 
Spread on average interest-bearing funds 2.23  % 2.08  % 1.83  %
Impact of net noninterest-bearing sources of funds 0.87  % 0.97  % 1.11  %
Net interest margin 3.10  % 3.05  % 2.94  %
Memo: total cost of deposits 1.76  % 1.93  % 2.06  %
Memo: total deposits and interest-bearing liabilities $ 81,571  2.01  % $ 81,535  2.12  % $ 80,580  2.34  %
1 Taxable-equivalent rates used where applicable.
2 Net of unamortized purchase premiums, discounts, and deferred loan fees and costs.


ZIONS BANCORPORATION, N.A.
Press Release – Page 17


NON-GAAP FINANCIAL MEASURES
(Unaudited)
This press release presents non-GAAP financial measures, in addition to GAAP financial measures. The adjustments to reconcile from the applicable GAAP financial measures to the non-GAAP financial measures are presented in the following schedules. We consider these adjustments to be relevant to ongoing operating results and provide a meaningful basis for period-to-period comparisons. We use these non-GAAP financial measures to assess our performance and financial position. We believe that presenting these non-GAAP financial measures allows investors to assess our performance on the same basis as that applied by our management and the financial services industry.
Non-GAAP financial measures have inherent limitations and are not necessarily comparable to similar financial measures that may be presented by other financial services companies. Although non-GAAP financial measures are frequently used by stakeholders to evaluate a company, they have limitations as an analytical tool and should not be considered in isolation or as a substitute for analysis of results reported under GAAP.
Tangible Common Equity and Related Measures
Tangible common equity and related measures are non-GAAP measures that exclude the impact of intangible assets and their related amortization. We believe these non-GAAP measures provide useful information about our use of shareholders’ equity and provide a basis for evaluating the performance of a business more consistently, whether acquired or developed internally.
RETURN ON AVERAGE TANGIBLE COMMON EQUITY (NON-GAAP)
Three Months Ended
(Dollar amounts in millions) March 31,
2025
December 31,
2024
September 30,
2024
June 30,
2024
March 31,
2024
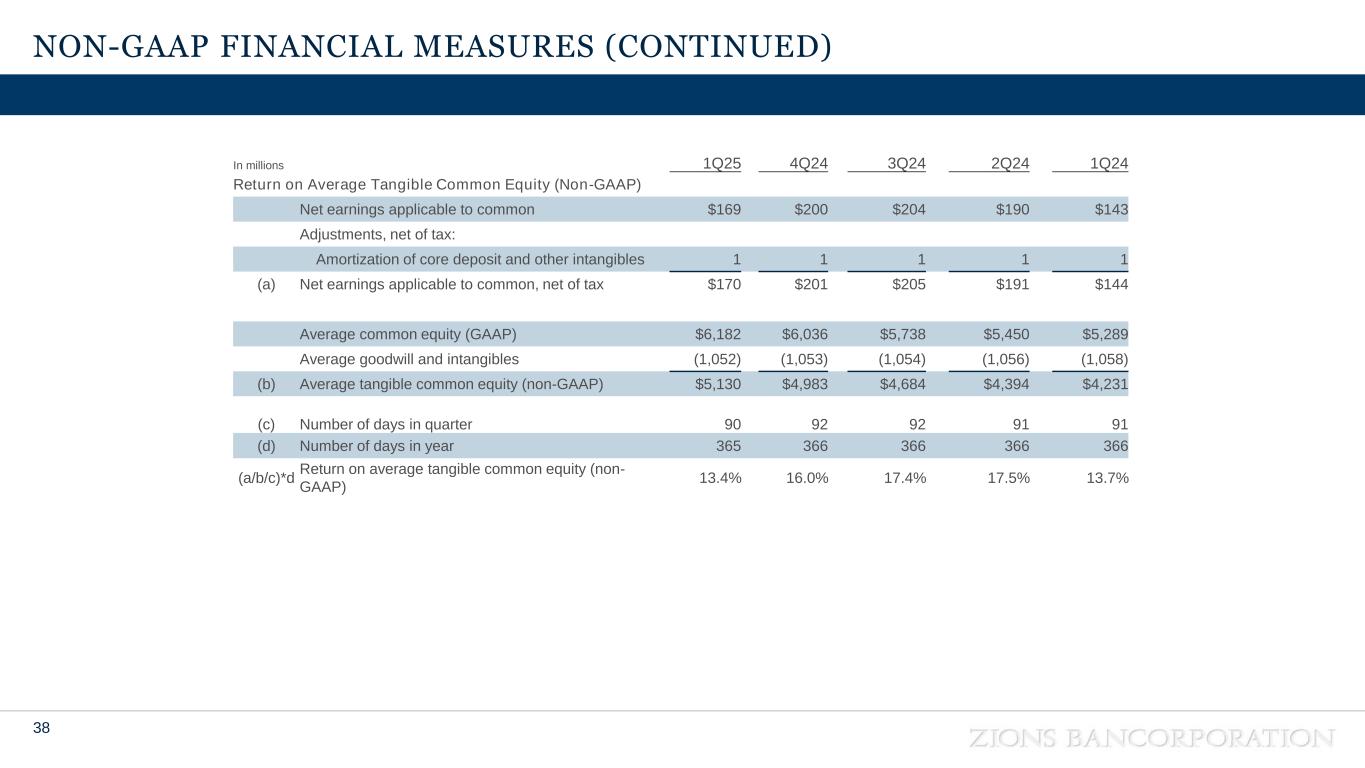
Net earnings applicable to common shareholders (GAAP) $ 169  $ 200  $ 204  $ 190  $ 143 
Adjustments, net of tax:
Amortization of core deposit and other intangibles
Adjusted net earnings applicable to common shareholders, net of tax (a) $ 170  $ 201  $ 205  $ 191  $ 144 
Average common equity (GAAP) $ 6,182  $ 6,036  $ 5,738  $ 5,450  $ 5,289 
Average goodwill and intangibles (1,052) (1,053) (1,054) (1,056) (1,058)
Average tangible common equity (non-GAAP) (b) $ 5,130  $ 4,983  $ 4,684  $ 4,394  $ 4,231 
Number of days in quarter (c) 90  92  92  91  91 
Number of days in year (d) 365  366  366  366  366 
Return on average tangible common equity (non-GAAP) 1
(a/b/c)*d 13.4  % 16.0  % 17.4  % 17.5  % 13.7  %
1 Excluding the effect of AOCI from average tangible common equity would result in associated returns of 9.2%, 10.9%, 11.4%, 10.9%, and 8.4% for the respective periods presented.


ZIONS BANCORPORATION, N.A.
Press Release – Page 18


TANGIBLE EQUITY RATIO, TANGIBLE COMMON EQUITY RATIO, AND TANGIBLE BOOK VALUE PER COMMON SHARE (ALL NON-GAAP MEASURES)
(Dollar amounts in millions, except per share amounts) March 31,
2025
December 31,
2024
September 30,
2024
June 30,
2024
March 31,
2024
Total shareholders’ equity (GAAP) $ 6,327  $ 6,124  $ 6,385  $ 6,025  $ 5,829 
Goodwill and intangibles (1,104) (1,052) (1,053) (1,055) (1,057)
Tangible equity (non-GAAP) (a) 5,223  5,072  5,332  4,970  4,772 
Preferred stock (66) (66) (440) (440) (440)
Tangible common equity (non-GAAP) (b) $ 5,157  $ 5,006  $ 4,892  $ 4,530  $ 4,332 
Total assets (GAAP) $ 87,992  $ 88,775  $ 87,032  $ 87,606  $ 87,060 
Goodwill and intangibles (1,104) (1,052) (1,053) (1,055) (1,057)
Tangible assets (non-GAAP) (c) $ 86,888  $ 87,723  $ 85,979  $ 86,551  $ 86,003 
Common shares outstanding (in thousands) (d) 147,567  147,871  147,699  147,684  147,653 
Tangible equity ratio (non-GAAP) (a/c) 6.0  % 5.8  % 6.2  % 5.7  % 5.5  %
Tangible common equity ratio (non-GAAP) (b/c) 5.9  % 5.7  % 5.7  % 5.2  % 5.0  %
Tangible book value per common share (non-GAAP) (b/d) $ 34.95  $ 33.85  $ 33.12  $ 30.67  $ 29.34 
Efficiency Ratio and Adjusted Pre-Provision Net Revenue
The efficiency ratio is a measure of operating expense relative to revenue. We believe the efficiency ratio provides useful information regarding the cost of generating revenue. We make adjustments to exclude certain items that are not generally expected to recur frequently, as identified in the subsequent schedule. We believe these adjustments allow for more consistent comparability across periods. Adjusted noninterest expense provides a measure as to how we are managing our expenses. Adjusted pre-provision net revenue enables management and others to assess our ability to generate capital. Taxable-equivalent net interest income allows us to assess the comparability of revenue arising from both taxable and tax-exempt sources.
EFFICIENCY RATIO (NON-GAAP) AND ADJUSTED PRE-PROVISION NET REVENUE (NON-GAAP)
Three Months Ended
(Dollar amounts in millions) March 31,
2025
December 31,
2024
September 30,
2024
June 30,
2024
March 31,
2024
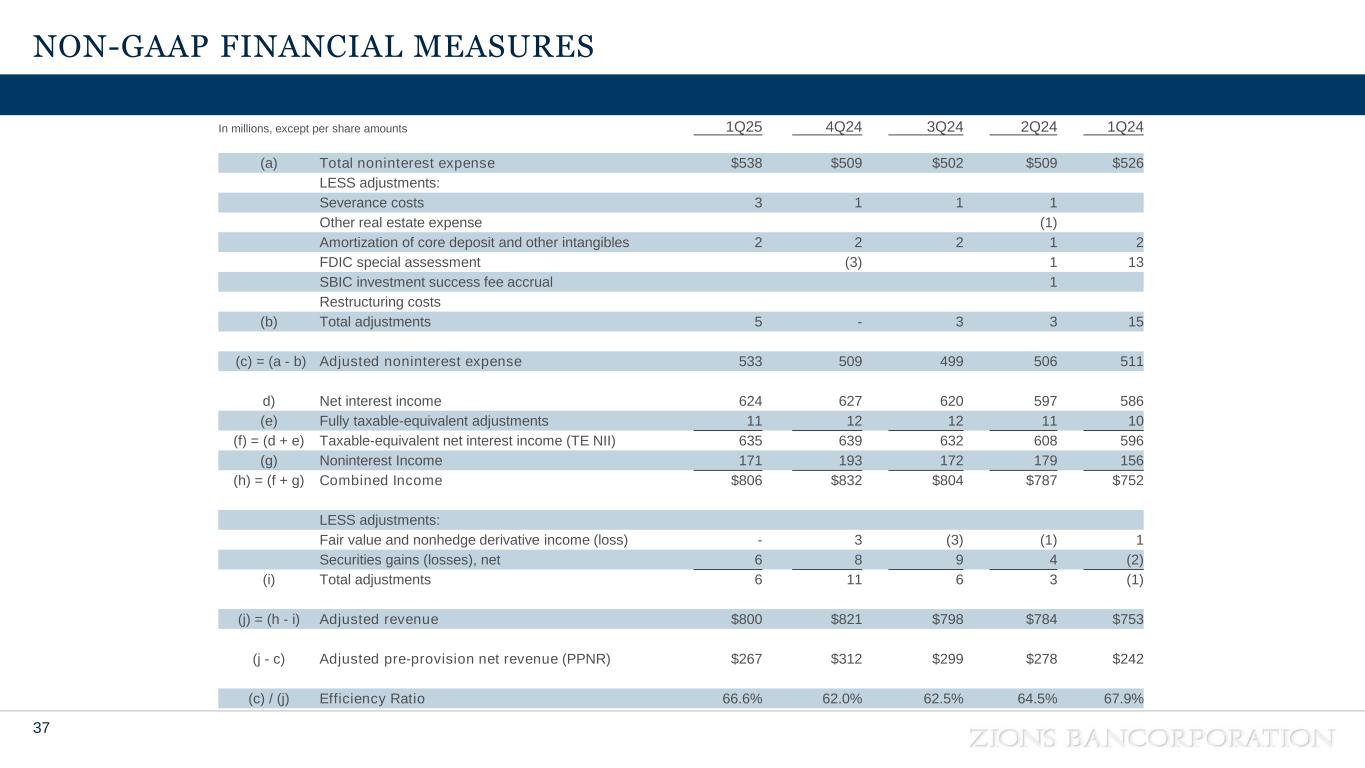
Noninterest expense (GAAP) (a) $ 538  $ 509  $ 502  $ 509  $ 526 
Adjustments:
Severance costs — 
Other real estate expense, net —  —  —  (1) — 
Amortization of core deposit and other intangibles
SBIC investment success fee accrual —  —  —  — 
FDIC special assessment —  (3) —  13 
Total adjustments (b) —  15 
Adjusted noninterest expense (non-GAAP) (c)=(a-b) $ 533  $ 509  $ 499  $ 506  $ 511 
Net interest income (GAAP) (d) $ 624  $ 627  $ 620  $ 597  $ 586 
Fully taxable-equivalent adjustments (e) 11  12  12  11  10 
Taxable-equivalent net interest income (non-GAAP) (f)=(d+e) 635  639  632  608  596 
Noninterest income (GAAP) (g) 171  193  172  179  156 
Combined income (non-GAAP) (h)=(f+g) 806  832  804  787  752 
Adjustments:
Fair value and nonhedge derivative income (loss) —  (3) (1)
Securities gains (losses), net (2)
Total adjustments (i) 11  (1)
Adjusted taxable-equivalent revenue (non-GAAP) (j)=(h-i) $ 800  $ 821  $ 798  $ 784  $ 753 
Pre-provision net revenue (PPNR) (non-GAAP) (h)-(a) $ 268  $ 323  $ 302  $ 278  $ 226 
Adjusted PPNR (non-GAAP) (j)-(c) 267  312  299  278  242 
Efficiency ratio (non-GAAP) 1
(c/j) 66.6  % 62.0  % 62.5  % 64.5  % 67.9  %
1 Excluding both the $9 million gain on sale of our Enterprise Retirement Solutions business and the $4 million gain on sale of a bank-owned property (recorded in dividends and other income), the efficiency ratio for the three months ended June 30, 2024 would have been 65.6%.

EX-99.2 3 earningspresentation-202.htm EX-99.2 earningspresentation-202
ZIONSFIRST QUARTER 2025 A p r i l 2 1 , 2 0 2 5 Financial Review


FORWARD-LOOKING STATEMENTS; USE OF NON-GAAP FINANCIAL MEASURES 2 Forward Looking Information This presentation includes “forward-looking statements” as that term is defined in the Private Securities Litigation Reform Act of 1995. These statements are based on management’s current expectations and assumptions regarding future events or determinations, all of which are subject to known and unknown risks, uncertainties, and other factors that may cause our actual results, performance or achievements, industry trends, and results or regulatory outcomes to differ materially from those expressed or implied. Forward-looking statements include, among others: Statements with respect to the beliefs, plans, objectives, goals, targets, commitments, designs, guidelines, expectations, anticipations, and future financial condition, results of operations, and performance of Zions Bancorporation, National Association and its subsidiaries (collectively “Zions Bancorporation, N.A.,” “the Bank,” “we,” “our,” “us”); and Statements preceded or followed by, or that include the words “may,” “might,” “can,” “continue,” “could,” “should,” “would,” “believe,” “anticipate,” “estimate,” “forecasts,” “expect,” “intend,” “target,” “commit,” “design,” “plan,” “projects,” “will,” and the negative thereof and similar words and expressions. Forward-looking statements are not guarantees and should not be relied upon as representing management’s views as of any subsequent date. Actual results and outcomes may differ materially from those presented. Although the following list is not comprehensive, key factors that may cause material differences include: The quality and composition of our loan and investment securities portfolios and the quality and composition of our deposits; Changes in general industry, political, and economic conditions, including elevated inflation, economic slowdown or recession, or other economic challenges; imposition of tariffs and resulting market volatility and uncertainty, including the effects on supply chains and revenues for us and our customers; changes in interest and reference rates, which could adversely affect our revenue and expenses, the value of assets and liabilities, and the availability and cost of capital and liquidity; and deterioration in economic conditions that may result in increased loan and lease losses; Political developments, including transitions in administration and shifts in congressional control that result in significant disruptions and changes in the size, scope, and effectiveness of the government, its agencies and services; The effects of newly enacted and proposed regulations affecting us and the banking industry, as well as changes and uncertainties in the interpretation, enforcement, and applicability of laws and fiscal, monetary, regulatory, trade, and tax policies; Actions taken by governments, agencies, central banks, and similar organizations, including those that result in decreases in revenue, increases in regulatory bank fees, insurance assessments, and capital standards; and other regulatory requirements; Judicial, regulatory and administrative inquiries, investigations, examinations or proceedings and the outcomes thereof that create uncertainty for, or are adverse to us or, the banking industry; Changes in our credit ratings; Our ability to innovate and otherwise address competitive pressures and other factors that may affect aspects of our business, such as pricing, relevance of, and demand for, our products and services, and our ability to recruit and retain talent; The potential for both positive and disruptive impacts of technological advancements, such as digital currencies and commerce, blockchain, artificial intelligence, quantum and cloud computing, and other innovations affecting us and the banking industry; Our ability to complete projects and initiatives and execute our strategic plans, manage our risks, control compensation and other expenses, and achieve our business objectives; Our ability to develop and maintain technology, information security systems, and controls designed to guard against fraud, cybersecurity, and privacy risks and related incidents; Our ability to provide adequate oversight of our suppliers to help us prevent or mitigate effects upon us and our customers of inadequate performance, systems failures, or cyber and other incidents by, or affecting, third parties upon whom we rely for the delivery of various products and services; The effects of wars, domestic and international trade policies and disputes, geopolitical conflicts, and other local, national, or international disasters, crises, or conflicts that may occur in the future; Natural disasters, pandemics, wildfires, catastrophic events, and other emergencies and incidents, and their impact on our and our customers’ operations, business, and communities, including the increasing difficulty in, and the expense of, obtaining property, auto, business, and other insurance products; Governmental and social responses to environmental, social, and governance issues, including those with respect to climate change and diversity; Securities and capital markets behavior, including volatility and changes in market liquidity and our ability to raise capital; The possibility that our recorded goodwill could become impaired, which may have an adverse impact on our earnings and shareholders’ equity; The impact of bank closures or adverse developments at other banks on general investor sen timent regarding the stability and liquidity of banks; Adverse news and other expressions of negative public opinion whether directed at us, other banks, the banking industry, or otherwise that may adversely affect our reputation and that of the banking industry generally; Protracted congressional negotiations regarding government funding and other issues, including those that add to the national debt, increase the possibility of government shutdowns, downgrades in United States (“U.S.”) credit ratings, or other economic disruptions; and Other assumptions, risks, or uncertainties described in this earnings release, and other SEC filings. We caution against the undue reliance on forward-looking statements, which reflect our views only as of their date of issuance. Except as required by law, we specifically disclaim any obligation to update any factors or publicly announce revisions to forward-looking statements to reflect future events or developments. Use of Non-GAAP Financial Measures: This document contains several references to non-GAAP measures, including but not limited to, pre-provision net revenue and the “efficiency ratio,” which are common industry terms used by investors and financial services analysts. Certain of these non-GAAP measures are key inputs into Zions’ management compensation and are used in Zions’ strategic goals that have been and may continue to be articulated to investors. Therefore, the use of such non-GAAP measures are believed by management to be of substantial interest to the consumers of these financial disclosures and are used prominently throughout the disclosures. A reconciliation of the difference between such measures and GAAP financials is provided within the document, and users of this document are encouraged to carefully review this reconciliation.


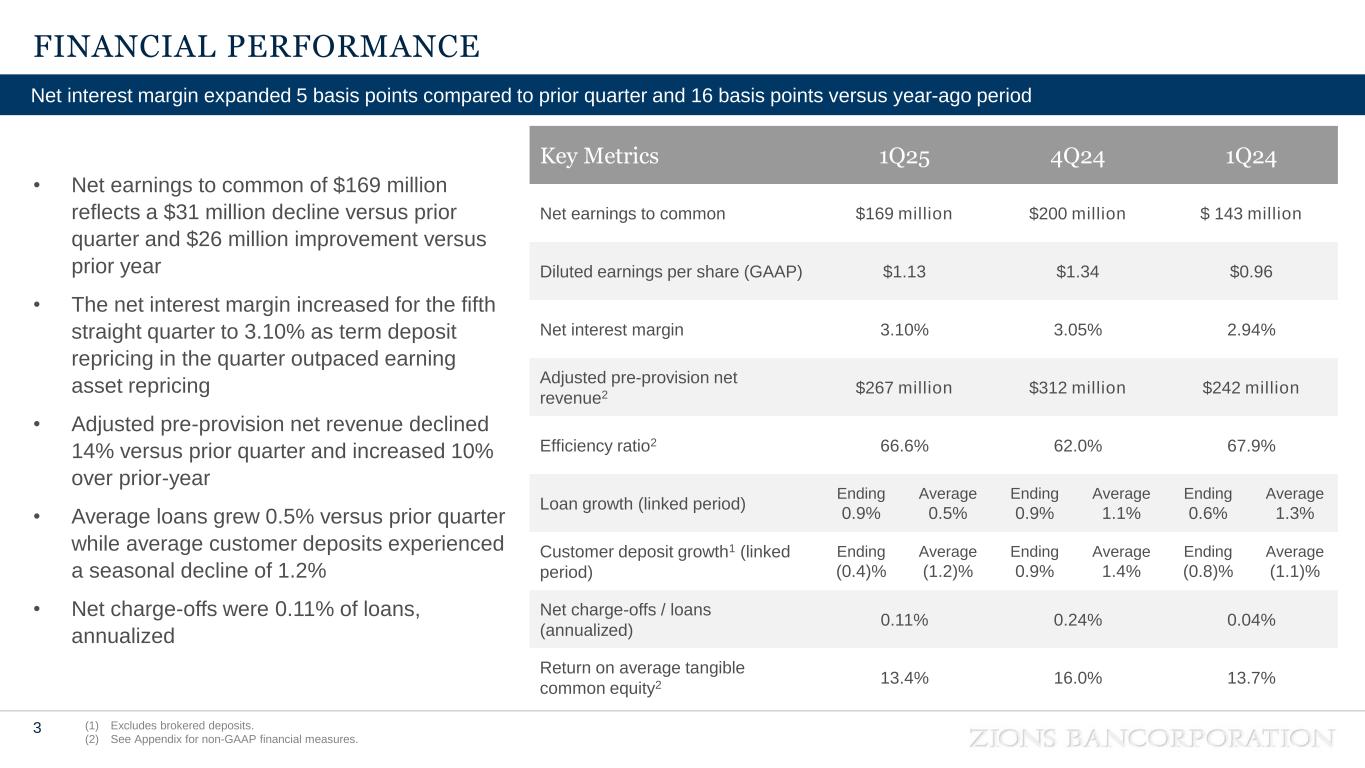
Net interest margin expanded 5 basis points compared to prior quarter and 16 basis points versus year-ago period FINANCIAL PERFORMANCE 3 (1) Excludes brokered deposits. (2) See Appendix for non-GAAP financial measures. • Net earnings to common of $169 million reflects a $31 million decline versus prior quarter and $26 million improvement versus prior year • The net interest margin increased for the fifth straight quarter to 3.10% as term deposit repricing in the quarter outpaced earning asset repricing • Adjusted pre-provision net revenue declined 14% versus prior quarter and increased 10% over prior-year • Average loans grew 0.5% versus prior quarter while average customer deposits experienced a seasonal decline of 1.2% • Net charge-offs were 0.11% of loans, annualized Key Metrics 1Q25 4Q24 1Q24 Net earnings to common $169 million $200 million $ 143 million Diluted earnings per share (GAAP) $1.13 $1.34 $0.96 Net interest margin 3.10% 3.05% 2.94% Adjusted pre-provision net revenue2 $267 million $312 million $242 million Efficiency ratio2 66.6% 62.0% 67.9% Loan growth (linked period) Ending 0.9% Average 0.5% Ending 0.9% Average 1.1% Ending 0.6% Average 1.3% Customer deposit growth1 (linked period) Ending (0.4)% Average (1.2)% Ending 0.9% Average 1.4% Ending (0.8)% Average (1.1)% Net charge-offs / loans (annualized) 0.11% 0.24% 0.04% Return on average tangible common equity2 13.4% 16.0% 13.7%


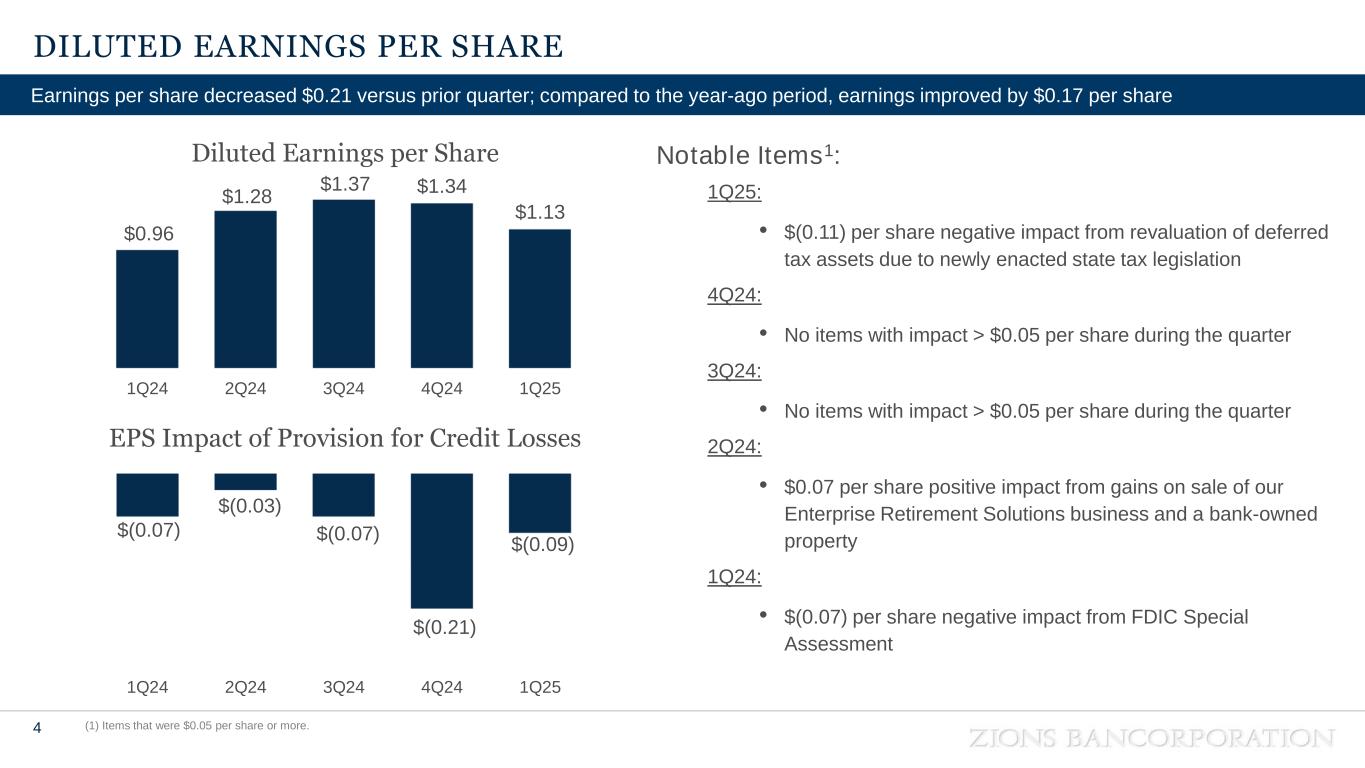
DILUTED EARNINGS PER SHARE 4 (1) Items that were $0.05 per share or more. Earnings per share decreased $0.21 versus prior quarter; compared to the year-ago period, earnings improved by $0.17 per share Diluted Earnings per Share EPS Impact of Provision for Credit Losses Notable Items1: 1Q25: • $(0.11) per share negative impact from revaluation of deferred tax assets due to newly enacted state tax legislation 4Q24: • No items with impact > $0.05 per share during the quarter 3Q24: • No items with impact > $0.05 per share during the quarter 2Q24: • $0.07 per share positive impact from gains on sale of our Enterprise Retirement Solutions business and a bank-owned property 1Q24: • $(0.07) per share negative impact from FDIC Special Assessment $0.96 $1.28 $1.37 $1.34 $1.13 1Q24 2Q24 3Q24 4Q24 1Q25 $(0.07) $(0.03) $(0.07) $(0.21) $(0.09) 1Q24 2Q24 3Q24 4Q24 1Q25


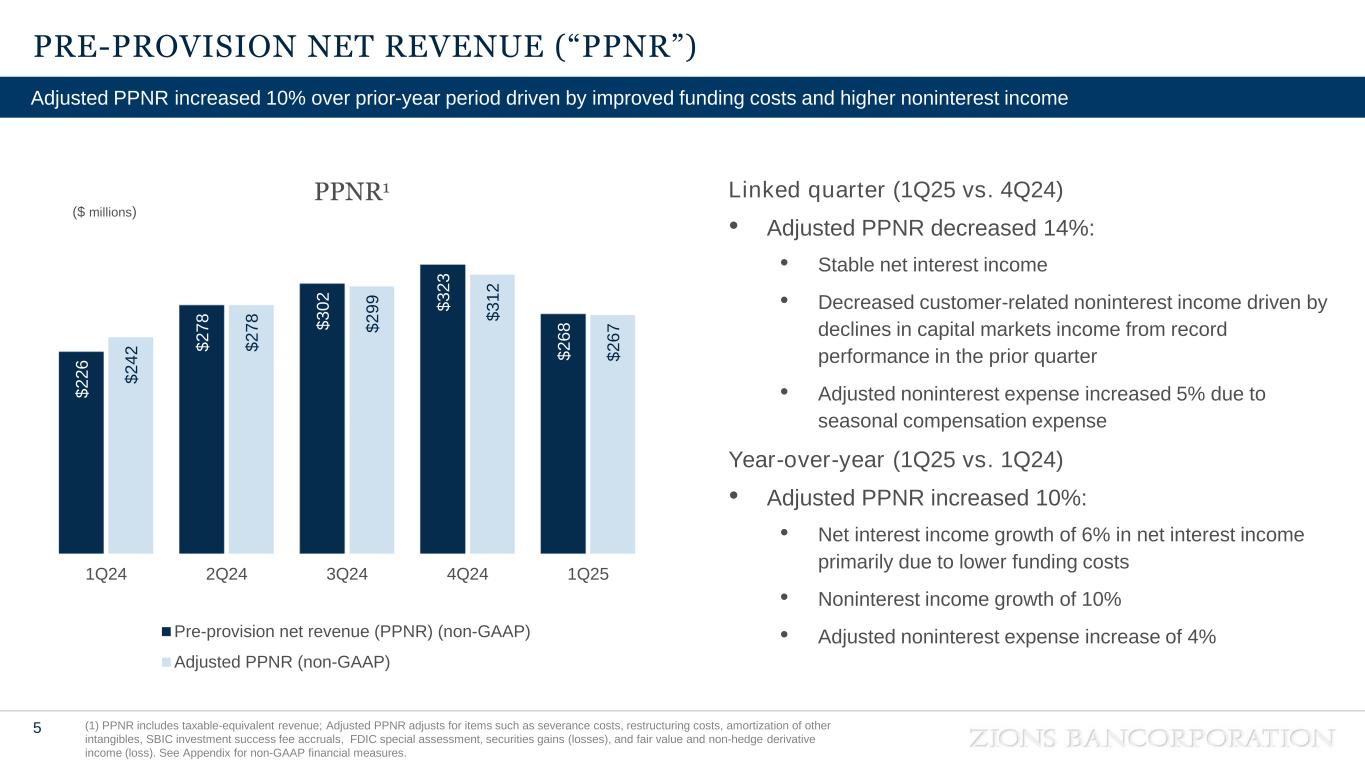
PRE-PROVISION NET REVENUE (“PPNR”) 5 (1) PPNR includes taxable-equivalent revenue; Adjusted PPNR adjusts for items such as severance costs, restructuring costs, amortization of other intangibles, SBIC investment success fee accruals, FDIC special assessment, securities gains (losses), and fair value and non-hedge derivative income (loss). See Appendix for non-GAAP financial measures. Adjusted PPNR increased 10% over prior-year period driven by improved funding costs and higher noninterest income Linked quarter (1Q25 vs. 4Q24) • Adjusted PPNR decreased 14%: • Stable net interest income • Decreased customer-related noninterest income driven by declines in capital markets income from record performance in the prior quarter • Adjusted noninterest expense increased 5% due to seasonal compensation expense Year-over-year (1Q25 vs. 1Q24) • Adjusted PPNR increased 10%: • Net interest income growth of 6% in net interest income primarily due to lower funding costs • Noninterest income growth of 10% • Adjusted noninterest expense increase of 4% $ 2 2 6 $ 2 7 8 $ 3 0 2 $ 3 2 3 $ 2 6 8 $ 2 4 2 $ 2 7 8 $ 2 9 9 $ 3 1 2 $ 2 6 7 1Q24 2Q24 3Q24 4Q24 1Q25 Pre-provision net revenue (PPNR) (non-GAAP) Adjusted PPNR (non-GAAP) PPNR1 ($ millions)


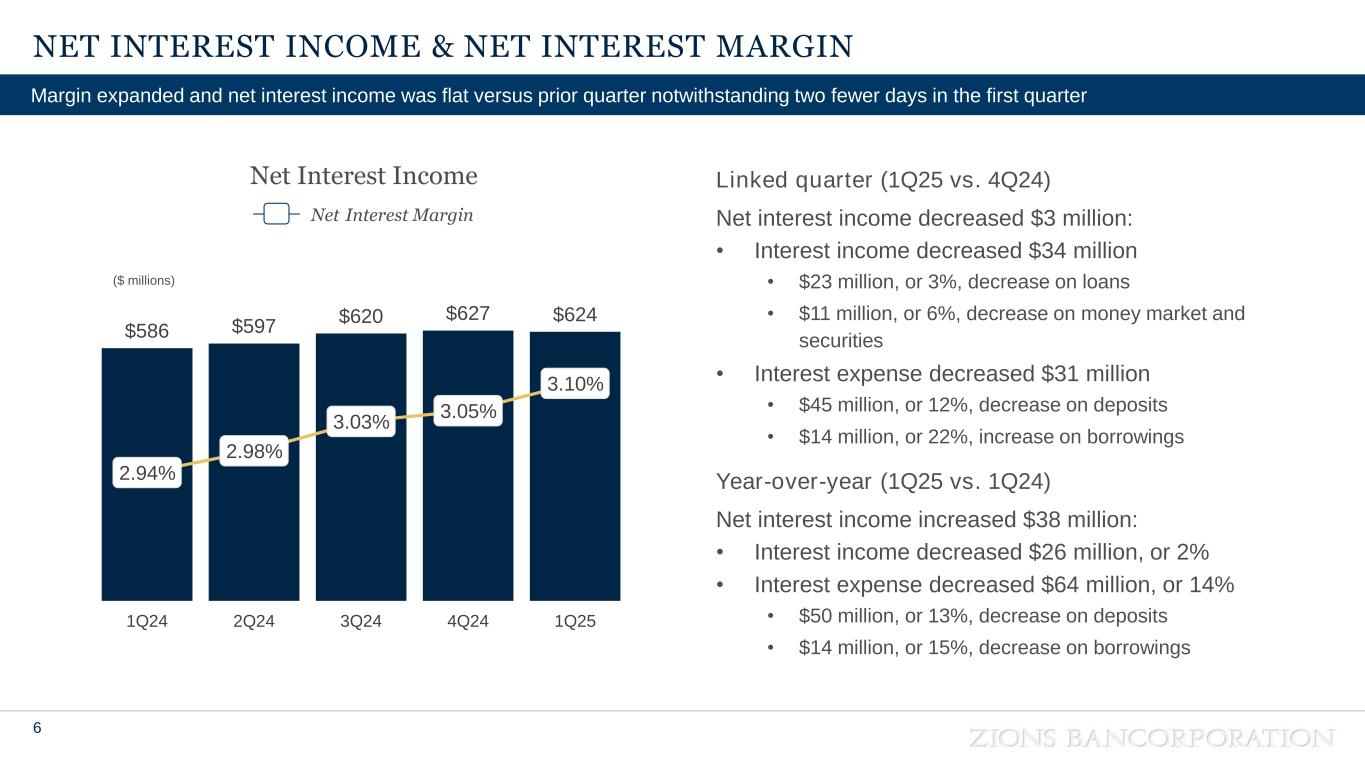
NET INTEREST INCOME & NET INTEREST MARGIN 6 Margin expanded and net interest income was flat versus prior quarter notwithstanding two fewer days in the first quarter $586 $597 $620 $627 $624 2.94% 2.98% 3.03% 3.05% 3.10% 2.70% 2.80% 2.90% 3.00% 3.10% 3.20% 3.30% $0 1Q24 2Q24 3Q24 4Q24 1Q25 Net Interest Income Net Interest Margin ($ millions) Linked quarter (1Q25 vs. 4Q24) Net interest income decreased $3 million: • Interest income decreased $34 million • $23 million, or 3%, decrease on loans • $11 million, or 6%, decrease on money market and securities • Interest expense decreased $31 million • $45 million, or 12%, decrease on deposits • $14 million, or 22%, increase on borrowings Year-over-year (1Q25 vs. 1Q24) Net interest income increased $38 million: • Interest income decreased $26 million, or 2% • Interest expense decreased $64 million, or 14% • $50 million, or 13%, decrease on deposits • $14 million, or 15%, decrease on borrowings


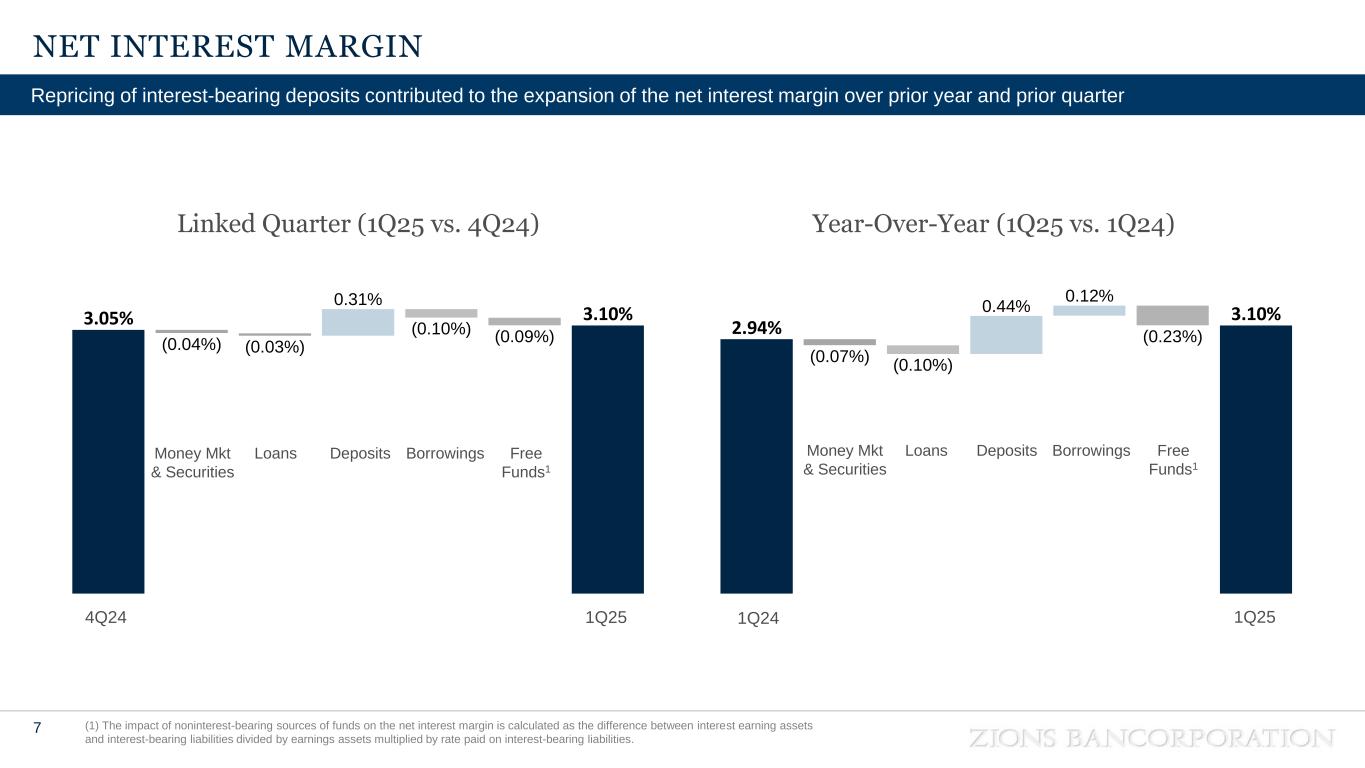
(0.07%) (0.10%) 0.44% 0.12% (0.23%) 2.94% 3.10% (0.04%) (0.03%) 0.31% (0.10%) (0.09%) 3.05% 3.10% NET INTEREST MARGIN 7 (1) The impact of noninterest-bearing sources of funds on the net interest margin is calculated as the difference between interest earning assets and interest-bearing liabilities divided by earnings assets multiplied by rate paid on interest-bearing liabilities. Repricing of interest-bearing deposits contributed to the expansion of the net interest margin over prior year and prior quarter Year-Over-Year (1Q25 vs. 1Q24)Linked Quarter (1Q25 vs. 4Q24) Loans DepositsMoney Mkt & Securities Borrowings Free Funds1 Loans DepositsMoney Mkt & Securities Borrowings Free Funds1 1Q24 1Q254Q24 1Q25


NONINTEREST INCOME AND REVENUE 8 (1) Reflects total customer-related noninterest income, which excludes dividends and other income and net securities gains (losses). (2) Adjusted revenue is the sum of taxable-equivalent net interest income and noninterest income less adjustments. See Appendix for non-GAAP financial measures. (3) Effective this quarter, customer-related fee income includes fair value and nonhedge derivative income (loss) in capital markets fees, which was previously disclosed under noncustomer-related noninterest income. Prior period amounts have been reclassified, and this income component continues to be excluded from adjusted revenues See Appendix for non-GAAP financial measures. Customer-related noninterest income increased 4% versus prior year period, largely from higher loan-related fees and improved capital markets fees $152 $153 $158 $176 $158 1Q24 2Q24 3Q24 4Q24 1Q25 Customer-Related Noninterest Income 1,3 ($ millions) $ 7 4 2 $ 7 7 6 $ 7 9 2 $ 8 2 0 $ 7 9 5 $ 7 5 3 $ 7 8 4 $ 7 9 8 $ 8 2 1 $ 8 0 0 1Q24 2Q24 3Q24 4Q24 1Q25 Total Revenue (GAAP) Adjusted Revenue (Non-GAAP) Total Revenue 2,3 ($ millions)


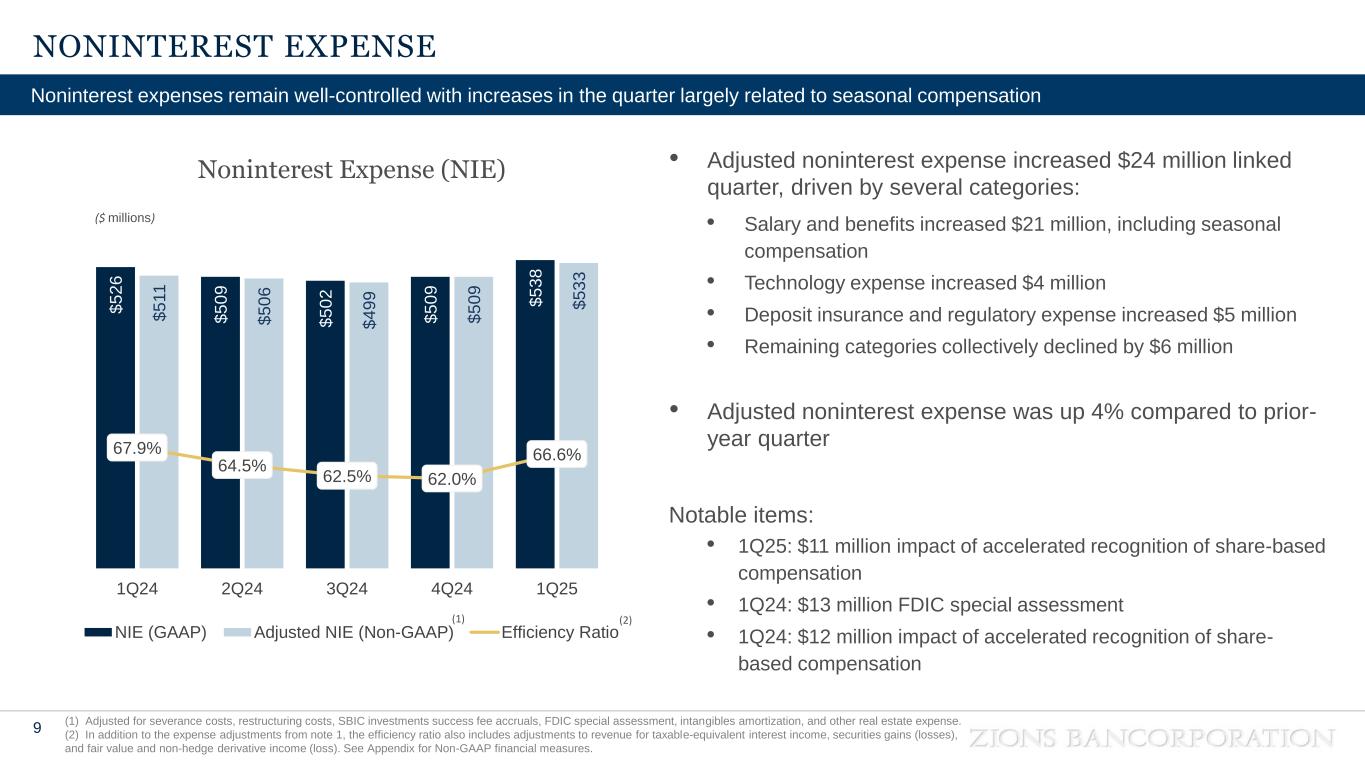
NONINTEREST EXPENSE 9 (1) Adjusted for severance costs, restructuring costs, SBIC investments success fee accruals, FDIC special assessment, intangibles amortization, and other real estate expense. (2) In addition to the expense adjustments from note 1, the efficiency ratio also includes adjustments to revenue for taxable-equivalent interest income, securities gains (losses), and fair value and non-hedge derivative income (loss). See Appendix for Non-GAAP financial measures. Noninterest expenses remain well-controlled with increases in the quarter largely related to seasonal compensation • Adjusted noninterest expense increased $24 million linked quarter, driven by several categories: • Salary and benefits increased $21 million, including seasonal compensation • Technology expense increased $4 million • Deposit insurance and regulatory expense increased $5 million • Remaining categories collectively declined by $6 million • Adjusted noninterest expense was up 4% compared to prior- year quarter Notable items: • 1Q25: $11 million impact of accelerated recognition of share-based compensation • 1Q24: $13 million FDIC special assessment • 1Q24: $12 million impact of accelerated recognition of share- based compensation $ 5 2 6 $ 5 0 9 $ 5 0 2 $ 5 0 9 $ 5 3 8 $ 5 1 1 $ 5 0 6 $ 4 9 9 $ 5 0 9 $ 5 3 3 67.9% 64.5% 62.5% 62.0% 66.6% 1Q24 2Q24 3Q24 4Q24 1Q25 NIE (GAAP) Adjusted NIE (Non-GAAP) Efficiency Ratio ($ millions) Noninterest Expense (NIE) (1) (2)


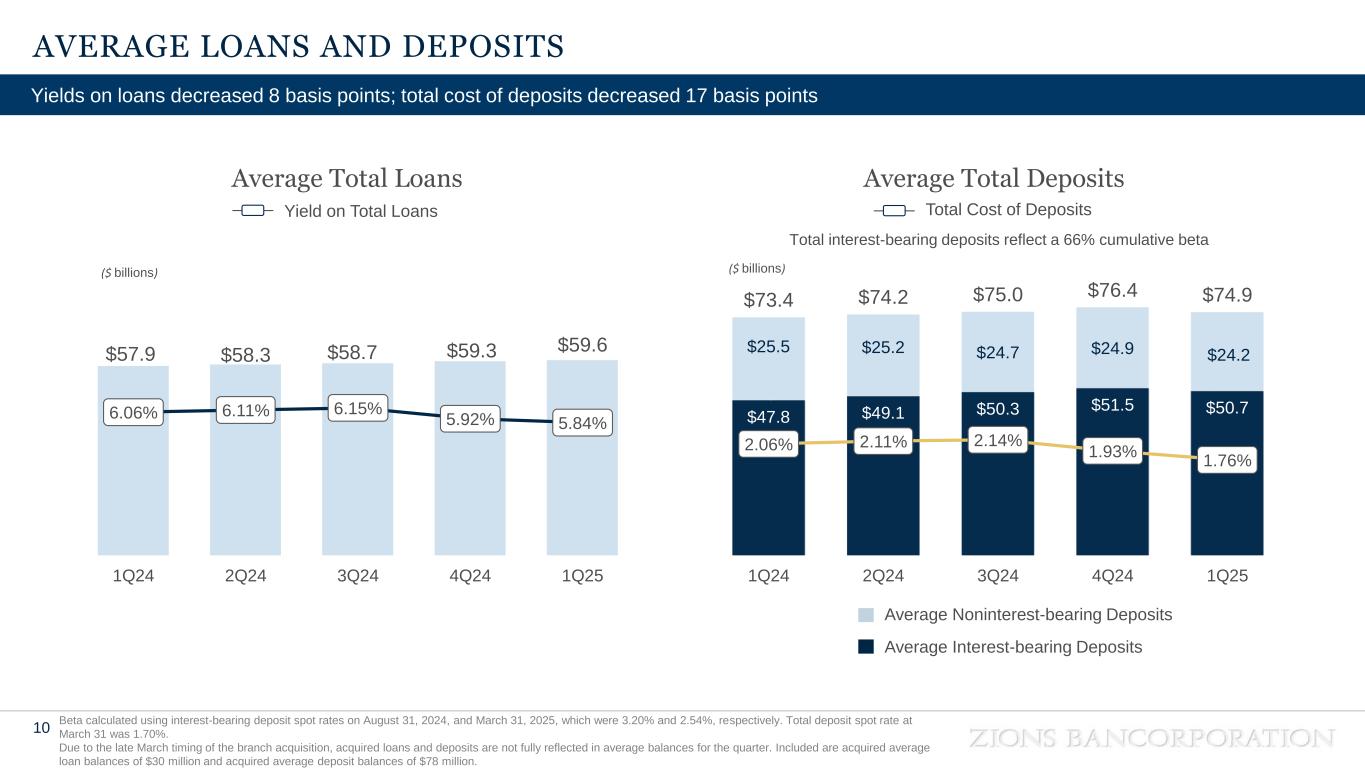
$57.9 $58.3 $58.7 $59.3 $59.6 6.06% 6.11% 6.15% 5.92% 5.84% 1Q24 2Q24 3Q24 4Q24 1Q25 ($ billions) AVERAGE LOANS AND DEPOSITS 10 Beta calculated using interest-bearing deposit spot rates on August 31, 2024, and March 31, 2025, which were 3.20% and 2.54%, respectively. Total deposit spot rate at March 31 was 1.70%. Due to the late March timing of the branch acquisition, acquired loans and deposits are not fully reflected in average balances for the quarter. Included are acquired average loan balances of $30 million and acquired average deposit balances of $78 million. Yields on loans decreased 8 basis points; total cost of deposits decreased 17 basis points Average Total Loans Yield on Total Loans Average Total Deposits Total Cost of Deposits $47.8 $49.1 $50.3 $51.5 $50.7 $25.5 $25.2 $24.7 $24.9 $24.2 $73.4 $74.2 $75.0 $76.4 $74.9 2.06% 2.11% 2.14% 1.93% 1.76% 1Q24 2Q24 3Q24 4Q24 1Q25 ($ billions) Average Noninterest-bearing Deposits Average Interest-bearing Deposits Total interest-bearing deposits reflect a 66% cumulative beta


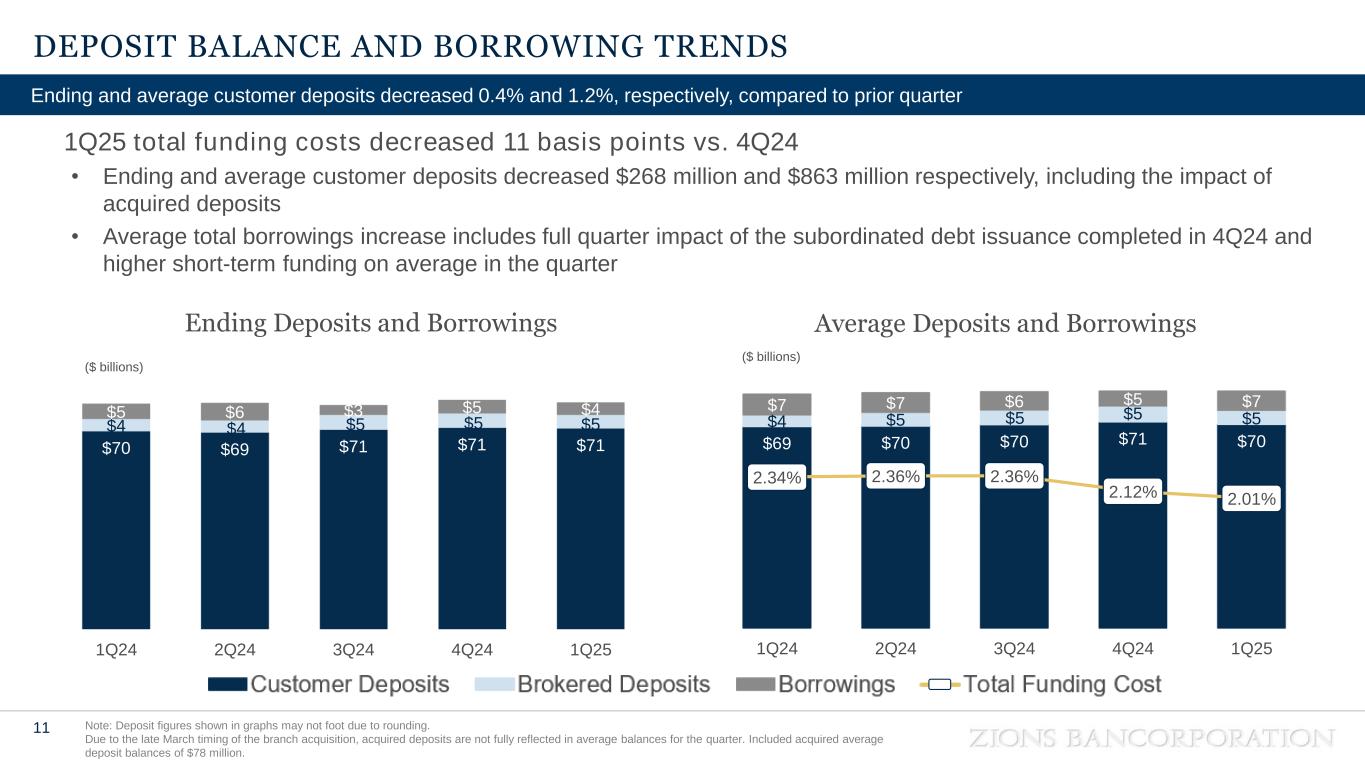
$70 $69 $71 $71 $71 $4 $4 $5 $5 $5 $5 $6 $3 $5 $4 - 10 20 30 40 50 60 70 80 90 100 1Q24 2Q24 3Q24 4Q24 1Q25 $69 $70 $70 $71 $70 $4 $5 $5 $5 $5 $7 $7 $6 $5 $7 2.34% 2.36% 2.36% 2.12% 2.01% 0.00% 0.50% 1.00% 1.50% 2.00% 2.50% 3.00% 3.50% 4.00% 4.50% - 10 20 30 40 50 60 70 80 90 100 1Q24 2Q24 3Q24 4Q24 1Q25 DEPOSIT BALANCE AND BORROWING TRENDS 11 Note: Deposit figures shown in graphs may not foot due to rounding. Due to the late March timing of the branch acquisition, acquired deposits are not fully reflected in average balances for the quarter. Included acquired average deposit balances of $78 million. Ending and average customer deposits decreased 0.4% and 1.2%, respectively, compared to prior quarter 1Q25 total funding costs decreased 11 basis points vs. 4Q24 • Ending and average customer deposits decreased $268 million and $863 million respectively, including the impact of acquired deposits • Average total borrowings increase includes full quarter impact of the subordinated debt issuance completed in 4Q24 and higher short-term funding on average in the quarter Average Deposits and Borrowings ($ billions) Ending Deposits and Borrowings ($ billions)


TOTAL INVESTMENT SECURITIES & MONEY MARKET INVESTMENTS 12 The bank has strong on-balance sheet liquidity The investment securities portfolio is designed to be a storehouse of balance sheet liquidity • Principal and prepayment-related cash flows from investment securities were $743 million for the quarter, offset by reinvestment of $478 million • The composition of the investment securities portfolio allows for deep on-balance sheet liquidity through the repo market • Approximately 90% of investment securities are U.S. Government and U.S. Government Agency/ GSE securities The investment securities portfolio is also used to balance interest rate risk • The estimated deposit duration at March 31, 2025 was assumed to be longer than the loan duration (including swaps); the investment securities portfolio balanced this mismatch • The estimated price sensitivity of the investment securities portfolio (including the impact of fair value hedges) was 4.0 years, compared to 3.6 years from the prior-year quarter Total Investment Securities and Money Market Investments (period-end balances) $20.1 $19.5 $19.4 $18.8 $18.7 $2.6 $3.2 $2.2 $4.3 $2.9 1Q24 2Q24 3Q24 4Q24 1Q25 Total Investment Securities Money Market Investments 28% 28% 27% 28% 26% % of earning assets ($ b ill io n s )


NET INTEREST INCOME – RATE SENSITIVITY 13 The rate path implied by the forward curve reflects modest asset sensitivity; net interest income is modeled to increase Interest Rate Impacts on Net Interest Income1 (1) Assumes no change in the size or composition of the earning assets excluding derivative hedge activity but does assume a change in composition of deposits (a lesser proportion of noninterest-bearing relative to total deposits). (2) This analysis presents latent interest rate sensitivity which reflects future changes in net interest income (“NII”) based upon past rate movements that have yet to be fully realized in revenue, and emergent interest rate sensitivity reflecting changes to NII based upon future rate movements implied by the forward rate curve at 3/31/2025. Net Interest Income Sensitivity 2.1% 4.6% 6.6% -100 bps Implied Rate Path +100 bps 1Q26 vs. 1Q25 Reflects continued asset and CD repricing and assumes $1.7 billion of noninterest-bearing demand deposit migration to higher-cost products; 49% cumulative total deposit beta Latent2 Emergent2 Implied The estimated impact of future rate changes from market implied rates reduces net interest income by 4.3% versus the latent scenario. This assumes a Fed Funds Target of 3.75% at 1Q26 8.9% (4.3%) 4.6% The combined impact of latent and emergent sensitivities is modeled to be 4.6% in 1Q26 relative to 1Q25; 38% cumulative total deposit beta -100 and +100 parallel interest rate shocks suggest moderate rate sensitivity between +2.1% and +6.6%


CREDIT QUALITY 14 Classified loan balances stabilizing as expected while nonperforming asset and net charge-off ratios remain low Key Credit Metrics • Net charge-offs relative to average loans: • 0.11% annualized in 1Q25 • 0.12% over the last 12 months • 0.51%: NPAs / loans + OREO • NPA balance increased $9 million in 1Q25 from 4Q24 • 4.8%: Classified loans / total loans • Classified balance increased $21 million in 1Q25 from 4Q24, driven largely by loans in the commercial real estate portfolio • 6.0%: Criticized loans / total loans • Criticized balance increased $116 million in 1Q25 from 4Q24, driven by loans in the commercial real estate and commercial & industrial portfolios Allowance for Credit Losses • 1.24% of total loans and leases, down one basis points from the previous quarter Credit Quality Ratios 3.3% 3.8% 4.5% 5.9% 6.0% 0.4% 0.5% 0.6% 0.5% 0.5% 1.7% 2.2% 3.6% 4.8% 4.8% 1Q24 2Q24 3Q24 4Q24 1Q25 Criticized / Loans NPAs / Loans + OREO Classified / Loans 282% 267% 191% 234% 229% 1.27% 1.24% 1.25% 1.25% 1.24% 1Q24 2Q24 3Q24 4Q24 1Q25 ALLL / Nonaccrual loans ACL / Loans


COMMERCIAL REAL ESTATE SUMMARY ($13.6 BILLION BALANCE) 15 Note: Loan to Value (LTV) calculations reflect the most current bank ordered / reviewed appraisal in the denominator and the current outstanding balance in the numerator. Appraisals and evaluations are performed in accordance with regulatory guidelines. The commercial real estate portfolio is granular and well diversified, 23% of total loans Term CRE ($10.9B) • Weighted average LTVs (< 60%) • Maturity distribution over the next three years: 23% (2025), 19% (2026), 18% (2027) • Average & median loan size of $3.7 million & < $1 million • 13.3% criticized; 11.7% classified; 0.5% nonaccrual; 0.4% delinquencies Construction and Land Development ($2.7B) • Land and Acquisition & Development less than $300 million • 17.8% criticized; 14.8% classified; 0% nonaccrual; 0.5% delinquencies Office ($1.8B: $1.7B term | $0.1B construction) • Weighted average LTVs (< 60%) • 75% suburban and 25% Central Business District • Average & median loan size of $4.3 million & <$1 million • 16.9% criticized; 15.1% classified; 2.8% nonaccrual; 1.3% delinquencies • $7.1 million net charge-offs – last 12 months • 80% term, 20% construction • Portfolio growth has been carefully managed for over a decade through disciplined concentration limits • Granular portfolio with solid sponsor or guarantor support • Collateral diversified by property type and location Multifamily, 30% Industrial, 22% Office, 13% Retail, 11% Hospitality, 5% Residential Construction, 5% Other, 14% CRE Portfolio Composition As of March 31, 2025


 
(50) 0 50 100 Industrial Office Multifamily Change in CRE Problem Loans Levels 12/31/24 to 3/31/2025 Criticized Classified Nonaccrual COMMERCIAL REAL ESTATE PROBLEM LOANS IN FOCUS 16 Note: LTV calculations in the “Appraised Value” distribution to reflect most current appraisal in denominator and outstanding balance in the numerator. The Indexed Adjusted values are adjusted based on the MSA level REIS Commercial Property Price Indices and adjusted from the date of most current appraisal. Approximately 6% of CRE classified balances have 2025 appraisals 46% in 2024, 11% 2023, 37% 2022 and earlier. The commercial real estate portfolio benefits from strong LTVs, guarantor support, low delinquencies, and diversification • CRE classifieds increased $26 million during the quarter • Downgrades resulted from a slower leasing environment, elevated operating expenses, and higher interest rates • Low CRE nonaccruals (0.43%), delinquencies (0.38%), and charge- offs (TTM 0.06%) due to conservative underwriting, significant equity, and guarantor support • The ACL for CRE lending is substantial relative to credit quality measures (2.1% of CRE balances, 4.9x of CRE nonaccruals) ($ millions) 0% 5% 10% 15% 20% 25% 30% 35% 40% 45% <=40% 41-50% 51-60% 61-70% 71-80% 81-90% 91-100% 100%+ % o f T o ta l C la s s if ie d C R E Classified CRE LTVs Appraised vs. Index Adjusted Most Recent Appraisal Index Adjusted 0.0% 0.2% 0.4% 0.6% 0.8% 1.0% 1Q23 2Q23 3Q23 4Q23 1Q24 2Q24 3Q24 4Q24 1Q25 CRE Non-Performing Asset and Charge-offs Levels Nonaccrual % GCO QTD Annualized 30+ Days Past Due


CAPITAL STRENGTH 17 Loss-absorbing capital remains strong relative to our risk profile; low credit losses relative to capital levels as a percentage of risk-weighted assets Net Charge-offs annualized, as a percentage of risk-weighted assets 0 .0 6 % 0 .1 6 % (0 .0 2 % ) 0 .0 0 % 0 .0 8 % 0 .0 8 % 0 .0 5 % 0 .0 4 % 0 .0 9 % 0 .0 2 % 0 .2 1 % 0 .0 9 % (4%) (2%) 0% 2% 4% 6% 8% 10% 12% 14% 2 Q 2 2 3 Q 2 2 4 Q 2 2 1 Q 2 3 2 Q 2 3 3 Q 2 3 4 Q 2 3 1 Q 2 4 2 Q 2 4 3 Q 2 4 4 Q 2 4 1 Q 2 5 Common Equity Tier 1 Capital and Allowance for Credit Losses as a percentage of risk-weighted assets 9 .9 % 9 .6 % 9 .8 % 9 .9 % 1 0 .0 % 1 0 .2 % 1 0 .3 % 1 0 .4 % 1 0 .6 % 1 0 .7 % 1 0 .9 % 1 0 .8 % 1 0 .7 % 1 0 .5 % 1 0 .8 % 1 1 .0 % 1 1 .1 % 1 1 .3 % 1 1 .3 % 1 1 .5 % 1 1 .6 % 1 1 .8 % 1 2 .0 % 1 1 .9 % 0% 2% 4% 6% 8% 10% 12% 14% 2 Q 2 2 3 Q 2 2 4 Q 2 2 1 Q 2 3 2 Q 2 3 3 Q 2 3 4 Q 2 3 1 Q 2 4 2 Q 2 4 3 Q 2 4 4 Q 2 4 1 Q 2 5 Common Equity Tier 1 % ACL / Risk-weighted Assets


FINANCIAL OUTLOOK (1Q 2026E VS. 1Q 2025A) 18 Outlook provided as of April 21, 2025 Outlook Comments Stable to Slightly Increasing ▪ Commercial loans are expected to grow (with slower near-term growth related to economic uncertainty) partially offset by managed declines in CRE and mortgage as payoffs are expected to outpace originations Slightly to Moderately Increasing ▪ Net interest income growth expected from earning asset remix and growth, aided by customer deposit growth and downward repricing of interest-bearing liabilities Slightly to Moderately Increasing ▪ Customer-related noninterest income growth is expected across a broad range of fee categories driven by increases in customer activity Slightly to Moderately Increasing ▪ Technology costs, increased marketing, and continued investments in revenue- generating businesses expected to put mild pressure on noninterest expense; positive operating leverage expected Increasing Organically ▪ Continued building of equity through retained earnings and AOCI accretion Customer-Related Noninterest Income Loan Balances (period-end) Net Interest Income Common Equity Adjusted Noninterest Expense These statements are based on management’s current expectations and assumptions regarding future events or determinations, all of which are subject to known and unknown risks, uncertainties, and other factors including, but not limited to, the imposition of tariffs and resulting market volatility which may cause our actual results, performance or achievements, industry trends, and results or regulatory outcomes to differ materially from those expressed or implied.


ZIONS BANCORPORATION DRIVES VALUE FOR ITS STAKEHOLDERS 19 We are determined to help build strong, successful communities, create economic opportunity, and to help our clients achieve greater financial strength through the relationships we develop and the services we provide. Distinctive Local Operating Model Managing Risk Delivering Value to Our Stakeholders • Transformation of our core systems to a modern, real-time architecture improving banker productivity and customer experience • New digital products and services streamlining our customer interactions • 20% improvement in tangible book value per share in 2024 • Focus on serving small- to medium-sized businesses, resulting in a granular deposit franchise and a long-term funding advantage • Local decision making and empowered bankers support strong customer relationships • Coalition Greenwich Best Bank Awards: Ranked third among all U.S. banks in Middle Market Banking Segment • Have built and maintained a robust risk management team and framework since the global financial crisis • Net credit losses to loans ratio that is consistently in the top quartile of peer banks • Prepared for large bank regulation due to previous SIFI experience and simpler legal structure Across 11 western states, our footprint includes some of the strongest markets in the country reflected in the quality and diversity of our portfolio • These states create ~35% of national GDP • Population and job growth outpace national average Strong Geographic Footprint


APPENDIX 20 • Financial Results Summary • Accumulated Other Comprehensive Income (AOCI) • Balance Sheet Profitability • Loan Growth by Type • Allowance and Credit Metrics • Earning Asset Repricing • Interest Rate Swaps • Interest Rate Sensitivity – Parallel Shock Analysis • Loan Loss Severity (NCOs as a percentage of nonaccrual loans) • Credit Metrics: Commercial Real Estate • Customer-Related Fee Income Growth • Coalition Greenwich Customer Satisfaction • Non-GAAP Financial Measures


FINANCIAL RESULTS SUMMARY 21 (1) Adjusted for items such as severance costs, restructuring costs, amortization of other intangibles, SBIC investment success fee accrual, FDIC special assessment, and securities gains (losses). See Appendix for non-GAAP financial measures; (2) Net Income before Preferred Dividends used in the numerator; (3) Net Income Applicable to Common used in the numerator; (4) Includes noninterest-bearing deposits; (5) Current period ratios and amounts represent estimates. Quarterly financial highlights Three Months Ended (Dollar amounts in millions, except per share data) March 31, 2025 December 31, 2024 September 30, 2024 June 30, 2024 March 31, 2024 Earnings Results: Diluted Earnings Per Share $ 1.13 $ 1.34 $ 1.37 $ 1.28 $ 0.96 Net Earnings Applicable to Common Shareholders 169 200 204 190 143 Net Interest Income 624 627 620 597 586 Noninterest Income 171 193 172 179 156 Noninterest Expense 538 509 502 509 526 Pre-Provision Net Revenue - Adjusted(1) 267 312 299 278 242 Provision for Credit Losses 18 41 13 5 13 Ratios: Return on Assets(2) 0.77 % 0.96 % 0.95 % 0.91 % 0.70 % Return on Common Equity(3) 11.1 % 13.2 % 14.1 % 14.0 % 10.9 % Return on Tangible Common Equity(3) 13.4 % 16.0 % 17.4 % 17.5 % 13.7 % Net Interest Margin 3.10 % 3.05 % 3.03 % 2.98 % 2.94 % Yield on Loans 5.84 % 5.92 % 6.15 % 6.11 % 6.06 % Yield on Investment Securities 2.75 % 2.73 % 2.86 % 2.90 % 2.84 % Average Cost of Total Deposits(4) 1.76 % 1.93 % 2.14 % 2.11 % 2.06 % Efficiency Ratio (1) 66.6 % 62.0 % 62.5 % 64.5 % 67.9 % Effective Tax Rate 28.9 % 20.0 % 22.7 % 23.3 % 24.6 % Ratio of Nonperforming Assets to Loans, Leases and OREO 0.51 % 0.50 % 0.62 % 0.45 % 0.44 % Annualized Ratio of Net Loan and Lease Charge-offs to Average Loans 0.11 % 0.24 % 0.02 % 0.10 % 0.04 % Common Equity Tier 1 Capital Ratio(5) 10.8 % 10.9 % 10.7 % 10.6 % 10.4 %


(1.9) (1.5) (2.7) (2.4) (1.9) (1.6) (3.0) (2.5) (2.0) (1.5) (1.0) (0.5) - 4Q23 4Q24 4Q25 4Q26 B ill io n s as of 12/31/24 as of 3/31/25 ACCUMULATED OTHER COMPREHENSIVE INCOME/LOSS (AOCI) 22 Note: AOCI burndown based on path of forward curve and hedges in place at 12/31/2024 and 03/31/2025. Includes accretion of unrealized losses related to the 4Q22 transfers of AFS securities to HTM. Assets are assumed to experience prepayments, amortization and maturity events, in addition to interest rate resets. Projected AOCI is projected to improve by $520 million from 4Q24 to 4Q25 The loss in AOCI will decline as the underlying investments pay down and mature. Hedging strategy provides meaningful protection against term rate volatility. • Change in implied forward curve from 12/31/24 to 3/31/25 is projected to have minimal impact to 4Q25 AOCI estimate The unrealized $2.4 billion accumulated other comprehensive loss as of 4Q24 is expected to improve by $520 million, or 22%, by 4Q25 • This would add 56 basis points to the current tangible common equity ratio, all else equal AOCI Loss Projection Actual Projection Based on forward curve:


BALANCE SHEET PROFITABILITY 23 (1) Return on Tangible Common Equity is a non-GAAP measure. See Appendix for non-GAAP financial measures. Excluding the effect of AOCI from average tangible common equity would result in associated returns of 8.4%, 10.9%, 11.4%, 10.9%, and 9.2% for the periods presented, respectively. Profitability remains stable; first quarter decline in earnings partially attributed to seasonal compensation and revaluation of deferred tax assets 0.70% 0.91% 0.95% 0.96% 0.77% 1Q24 2Q24 3Q24 4Q24 1Q25 13.7% 17.5% 17.4% 16.0% 13.4% 1Q24 2Q24 3Q24 4Q24 1Q25 Return on Assets Return on Tangible Common Equity 1


LOAN GROWTH IN DETAIL 24 (1) Growth rate quarter over quarter, not annualized. (2) Included are acquired ending loan balances of $420 million, predominantly 1-4 family residential loans. Loan growth in 1-4 family mortgage, C&I, and CRE Term Compared to the prior quarter: • Period-end loans increased $531 million, or 0.9% • Loan growth in dollars predominantly in 1-4 family, C&I, and CRE Term • Balance declines predominantly in Energy, CRE construction, and residential construction categorized under ‘Other’ Linked Quarter Loan Balance Growth Total Loans: +0.9% G ro w th R a te : L in k e d Q u a rt e r 1 Balance Change: Linked Quarter C&I (ex-Oil & Gas), 1% Owner occupied, (0%) CRE C&D, (2%) CRE Term, 2% Home Equity, 1% 1-4 Family, 4% Energy (Oil & Gas), (9%) Municipal, 1% Other, (2%) -10% -8% -6% -4% -2% 0% 2% 4% 6% 8% 10% ($300) ($200) ($100) $0 $100 $200 $300 $400 $500 Note: circle size indicates relative proportion of loan portfolio as of 1Q25. ($ millions)


ALLOWANCE AND CREDIT METRICS 25 CECL methodology reflects reserve build ahead of realized deterioration of credit metrics 514 546 590 636 678 711 738 729 736 726 736 741 743 1.00 1.04 1.09 1.14 1.20 1.25 1.30 1.26 1.27 1.24 1.25 1.25 1.24 1Q22 2Q22 3Q22 4Q22 1Q23 2Q23 3Q23 4Q23 1Q24 2Q24 3Q24 4Q24 1Q25 ACL ($) ACL (%) • Through 2022 and 2023, the ACL increased, despite improving problem loan levels, due to forecasts of future credit quality deterioration, including $190 million of increase specifically for the commercial real estate portfolio • Since 2023, the ACL has remained relatively flat as a percent of loans, despite increases in problem loan levels, as deterioration previously reserved for was somewhat realized 252 201 151 149 171 162 216 222 248 261 363 297 305 1,148 1,009 965 929 912 768 769 825 966 1,264 2,093 2,870 2,891 Nonaccruals Classifieds Coverage ratio remained steady while problem loans increased Coverage ratio increased while problem loans decreased


SIMULATED REPRICING EXPECTATIONS: EARNING ASSETS & LOANS 26 (1) Assets are assumed to experience prepayments, amortization and maturity events, in addition to interest rate resets. A substantial portion of earning assets reset within one year with additional resets in later periods 53% 9% 9% 7% 10% 12% 53% 9% 11% 7% 8% 12% ≤ 3m 4-12m 1-2 yrs 2-3 yrs 3-5 yrs > 5 yrs P e rc e n t o f L o a n s Loans: Rate Reset / Maturity Profile1 Loans After Hedging 45% 8% 9% 7% 11% 20% 48% 8% 10% 7% 7% 20% ≤ 3m 4-12m 1-2 yrs 2-3 yrs 3-5 yrs > 5 yrs P e rc e n t o f E a rn in g A s s e ts Earning Assets After Hedging Earning Assets: Rate Reset / Maturity Profile1


INTEREST RATE SWAPS AT MARCH 31, 2025 27 Swaps are used to balance our interest rate sensitivity to income and value Receive-Fixed Hedges1 (pay floating rate) Pay-Fixed Rate Hedges2 (receive floating rate) (1) Received-fixed hedges consist of hedging pools of floating rate loans or received-fixed swaps on subordinated debt. (2) Pay-fixed hedges consist of fair value swaps hedging fixed-rate AFS securities and fixed-rate commercial loans or short-term debt hedges on rolling FHLB advances. Interest rate sensitivity is managed in part with portfolio interest rate hedges1 • In the first quarter, we added $200 million of cash flow hedge swaps with an average fixed rate of 4.11% and $300 million of fair value hedge swaps with an average fixed rate of 4.10%. 1,050 1,250 1,250 1,250 1,200 1,008 908 3.36 3.48 3.48 3.48 3.49 3.68 3.90 0 200 400 600 800 1,000 1,200 1,400 4Q24 1Q25 2Q25 3Q25 4Q25 2026 2027 Average Outstanding ($B) Average Fixed Rate Received (%) 5,168 5,467 5,133 4,967 4,967 4,967 4,967 3.31 3.33 3.31 3.29 3.29 3.29 3.29 0 1,000 2,000 3,000 4,000 5,000 6,000 4Q24 1Q25 2Q25 3Q25 4Q25 2026 2027 Average Outstanding ($B) Average Fixed Rate Paid (%) $ B ill io n s


INTEREST RATE SENSITIVITY – PARALLEL RATE SHOCKS 28 (1) 12-month forward simulated impact of an instantaneous and parallel change in interest rates and assumes no change in the size or composition of the earning assets excluding derivative hedge activity but does assume a change in composition of deposits (a lesser proportion of noninterest-bearing relative to total deposits). Standard parallel rate shocks suggest asset sensitivity (9%) (4%) 4% 9% (8%) (4%) 5% 8% −200 bps −100 bps +100 bps +200 bps Simulated Net Interest Income Sensitivity 1 as of 12/31/2024 as of 3/31/2025


LOAN LOSS SEVERITY 29 Source: S&P Capital IQ. Calculated using the average of annualized quarterly results. When problems arise, Zions generally experiences less severe loan losses due to strong collateral and underwriting practices 1 1 % 1 7 % 1 9 % 2 1 % 2 2 % 2 3 % 2 5 % 3 1 % 3 9 % 4 4 % 4 6 % 4 7 % 5 1 % 5 4 % 5 7 % 5 7 % 6 2 % 7 7 % W A L M T B Z IO N B O K F C M A F H N C A D E W B S W T F C E W B C K E Y C F G H B A N S N V R F F IT B C F R P N F P C O L B Annualized NCOs / Nonaccrual Loans Five Year Average (2020Q1 – 2024Q4) Annualized NCOs / Nonaccrual Loans Fifteen Year Average (2010Q1 – 2024Q4) 1 6 % 1 8 % 1 9 % 1 9 % 2 1 % 2 6 % 2 6 % 3 1 % 4 0 % 4 2 % 4 3 % 4 4 % 4 7 % 5 2 % 5 3 % 5 3 % 5 4 % 6 7 % B O K F W A L M T B Z IO N C A D E F H N C M A W B S C F G C F R E W B C W T F C K E Y R F H B A N P N F P S N V F IT B C O L B > 1 0 0 % > 1 0 0 %


2.7 2.7 2.8 2.8 2.7 10.9 10.8 10.6 10.7 10.9 1Q24 2Q24 3Q24 4Q24 1Q25 Construction Balances Term Balances IN-DEPTH REVIEW: COMMERCIAL REAL ESTATE 30 Data is updated through 1Q25. LTV calculations in the “Appraised Value” distribution to reflect most current appraisal in denominator and outstanding balance in the numerator. The Indexed Adjusted values are adjusted based on the MSA level REIS Commercial Property Price Indices and adjusted from the date of most current appraisal. Limited tail loan-to-value risk in portfolio; controlled CRE growth Term WAVG LTV % of CRE Term % of CRE Construction Multifamily 55% 28% 49% Industrial / Warehouse 51% 22% 24% Office 55% 16% 6% Retail 47% 13% 3% Hospitality 46% 6% 1% Zions has modest “tail risk” in its CRE portfolio Total CRE Problem Loan Trends as a percentage of total CRE loans ($ b ill io n s ) Balance Trends 0.6 1.3 0.5 0.1 0.1 2.5 2.1 1.9 1.0 3.4 0.0 2.0 4.0 6.0 8.0 10.0 12.0 14.0 16.0 2025 2026 2027 2028 2029+ Maturities Construction Balances Term Balances 0% 5% 10% 15% 20% 25% 30% 35% 40% <=40% 41-50% 51-60% 61-70% 71-80% 81-90% 91-100% 100%+ Most Recent Appraisal Index Adjusted 0% 5% 10% 15% 20% 25% 1Q23 2Q23 3Q23 4Q23 1Q24 2Q24 3Q24 4Q24 1Q25 Criticized % Classified % Nonaccrual % GCO QTD Annualized Term CRE LTVs Appraised vs. Indexed


DISCIPLINED COMMERCIAL REAL ESTATE GROWTH 31 Data as of December 31, 2024; peer growth rates are normalized for significant acquisitions. Commercial real estate loan growth lags peers due to continued exercise of concentration risk discipline Zions has exercised caution in CRE concentrations for more than a decade and in underwriting standards for many decades. • Key factors for consideration in credit risk within CRE • Measured and disciplined growth compared to peers • Significant borrower equity – conservative LTVs • Disciplined underwriting on debt service coverage • Diversified by geography and asset class • Limited exposure to land 0 50 100 150 200 250 300 350 4 Q 1 5 4 Q 1 6 4 Q 1 7 4 Q 1 8 4 Q 1 9 4 Q 2 0 4 Q 2 1 4 Q 2 2 4 Q 2 3 4 Q 2 4 ZION Peer Top Quartile Peer Bottom Quartile Indexed: 1Q15 = 100 Commercial Real Estate Excluding Owner Occupied


0.2 0.1 0.1 0.1 0.1 1.8 1.8 1.8 1.7 1.7 1Q24 2Q24 3Q24 4Q24 1Q25 Balance Trends Construction Balances Term Balances 0.1 0.4 0.3 0.4 0.1 0.5 0.0 0.5 1.0 1.5 2.0 2.5 2025 2026 2027 2028 2029+ Maturities Construction Balances Term Balances 0% 5% 10% 15% 20% 25% 30% 35% 40% <=40% 41-50% 51-60% 61-70% 71-80% 81-90% 91-100% 100%+ Most Recent Appraisal Index Adjusted IN-DEPTH REVIEW: CRE OFFICE ($1.8 BILLION BALANCE) 32 Data updated through 1Q25. (1) Based on loans > $2.0 million - 90% of portfolio. LTV calculations in the “Appraised Value” distribution to reflect most current appraisal in denominator and outstanding balance in the numerator. The Indexed Adjusted values are adjusted based on the MSA level REIS Commercial Property Price Indices and adjusted from the date of most current appraisal. CRE Office portfolio is 13% of total CRE exposure; 3% of total loans; charge-offs remain limited • Allowance for credit losses: 3.7% of balances / 22% of criticized balances • 8% decrease in balances year-over-year via payoffs, loan rebalance, amortization • Increase in office criticized due to tenant vacancy in multi tenant buildings and value add properties undergoing lease up • Despite increase in criticized, nonaccruals remain low at 2.7% • Median loan size: <$1 million; average loan size: $4.3 million • 36% variable rate with swap, 15% fixed rate, 49% variable rate w/o swap • 32% of total office exposure has a maturity date in the next 12 months Office Problem Loan Trends as a percentage of total office loans ($ b ill io n s ) When values are updated based on indexed / current values, office exposure continues to benefit from low LTVs at origination CRE Office Term LTVs Appraised vs. Indexed 0% 5% 10% 15% 20% 25% 1Q23 2Q23 3Q23 4Q23 1Q24 2Q24 3Q24 4Q24 1Q25 Criticized % Classified % Nonaccrual % GCO QTD Annualized


IN-DEPTH REVIEW: CRE OFFICE ($1.8 BILLION BALANCE) 33 Data is updated through 1Q25. (1) Portfolio metrics based on loans > $2.0 million – 90% of portfolio. Zions’ office collateral is diversified geographically, has limited exposure to CBD offices, and majority of building sizes < 200 thousand sq ft Office Collateral Summary • By State: UT 28%,CA 19%, WA 17%, AZ 14%, TX 11%, all other 11% • By MSA: Seattle 15%, Phoenix 12%, SLC 11%, Provo 8%, Los Angeles 7%, all other MSA’s < 5% • Stabilized term office portfolio is 90% leased (weighted average)1 • 75% suburban, 25% central business district1 • 40% of portfolio is credit tenant leased1 • 66% multi-tenant office, 34% single tenant1 • Over 80% of single tenant buildings are leased to credit tenants 1 • Collateral size: 66% of exposure secured by buildings < 200 thousand sq ft ($ m ill io n s ) - 100 200 300 400 500 600 <50 50-100 100-200 200-300 300-400 400-500 500+ Single / Multi Tenancy by Office Collateral Size Multi Tenant Single Tenant 17% 41% 49% 28% 3% 48% 22% 14% 83% 59% 51% 72% 97% 52% 78% 86% $58 $77 $79 $186 $255 $278 $328 $403 CO NV ID TX AZ WA CA UT Term CRE Office By State, CBD / Suburban ($MM's) CBD Suburban CRE Office LTVs Appraised vs. Indexed


1.0 1.0 1.1 1.1 1.0 2.9 2.8 2.8 2.9 3.1 1Q24 2Q24 3Q24 4Q24 1Q25 Balance Trends Construction Balances Term Balances 0.1 0.6 0.1 0.1 0.0 0.9 0.8 0.4 0.1 0.7 0.0 1.0 2.0 3.0 4.0 2025 2026 2027 2028 2029+ Maturities Construction Balances Term Balances 0% 5% 10% 15% 20% 25% 30% 35% 40% 45% <=40% 41-50% 51-60% 61-70% 71-80% 81-90% 91-100% 100%+ Most Recent Appraisal Index Adjusted CRE Multifamily Term LTVs Appraised vs. Indexed IN-DEPTH REVIEW: CRE MULTIFAMILY ($4.0 BILLION BALANCE) 34 Data is updated through 1Q25. LTV calculations in the “Appraised Value” distribution to reflect most current appraisal in denominator and outstanding balance in the numerator. The Indexed Adjusted values are adjusted based on the MSA level REIS Commercial Property Price Indices and adjusted from the date of most current appraisal. CRE multifamily portfolio is 30% of total CRE exposure; 7% of total loan exposure • Allowance for credit losses: 2.3% of total multifamily balances / 11% of criticized balances – no charge offs in last 12 months • 8% increase in balances year-over-year – construction loans funding up • Increase in criticized levels from longer lease up timelines and construction delays but nonaccruals (0.0%) and delinquencies (0.32%) remain low • 75% term, 25% construction • Median loan size: $1 million; average loan size: $5.8 million • 18% variable rate with swap, 11% fixed rate, 71% variable rate w/o swap • By State – 27% TX, 26% CA, 13% AZ, 12% UT, 22% all other Multifamily Problem Loan Trends as a percentage of total multifamily loans When values are updated based on indexed / current values, office exposure continues to benefit from low LTVs at origination ($ b ill io n s ) 0% 5% 10% 15% 20% 25% 1Q23 2Q23 3Q23 4Q23 1Q24 2Q24 3Q24 4Q24 1Q25 Criticized % Classified % Nonaccrual % GCO QTD Annualized


0.6 0.5 0.5 0.5 0.5 2.6 2.5 2.5 2.5 2.4 1Q24 2Q24 3Q24 4Q24 1Q25 Balance Trends Construction Balances Term Balances 0.1 0.3 0.1 0.6 0.5 0.5 0.2 0.7 0.0 0.5 1.0 1.5 2.0 2.5 3.0 2025 2026 2027 2028 2029+ Maturities Construction Balances Term Balances IN-DEPTH REVIEW: CRE INDUSTRIAL ($2.9 BILLION BALANCE) 35 Data is updated through 1Q25. LTV calculations in the “Appraised Value” distribution to reflect most current appraisal in denominator and outstanding balance in the numerator. The Indexed Adjusted values are adjusted based on the MSA level REIS Commercial Property Price Indices and adjusted from the date of most current appraisal. CRE Industrial portfolio is 22% of total CRE exposure; 5% of total loan exposure • Allowance for credit losses: 2.2% of balances / 13% of criticized balances • 8% decrease in balances year-over-year via payoffs, loan rebalance, amortization • Increase in criticized levels from longer lease up timelines and construction delays but nonaccruals (0.0%) and delinquencies (0.1%) remain low • 83% term, 17% construction • Median loan size: $1.5 million; average loan size: $4.5 million • 19% variable rate with swap, 11% fixed rate, 70% variable rate w/o swap • By State – 32% CA, 17% TX, 15% UT, 14% AZ, 10% NV, 12% all other Industrial Problem Loan Trends as a percentage of total industrial loans ($ b ill io n s ) When values are updated based on indexed / current values, office exposure continues to benefit from low LTVs at origination CRE Industrial Term LTVs Appraised vs. Indexed 0% 5% 10% 15% 20% 25% 1Q23 2Q23 3Q23 4Q23 1Q24 2Q24 3Q24 4Q24 1Q25 Criticized % Classified % Nonaccrual % GCO QTD Annualized 0% 10% 20% 30% 40% 50% <=40% 41-50% 51-60% 61-70% 71-80% 81-90% 91-100% 100%+ Most Recent Appraisal Index Adjusted


CUSTOMER SATISFACTION: THIRD IN MIDDLE MARKET COALITION GREENWIC H BEST BANK AWARDS 36 Source: Coalition Greenwich Voice of Client – 2024 Market Tracking Program. * Excellent Citations are a "5" on a 5-point scale from "5" excellent to "1" poor ** NPS Range: World Class 70+; Excellent 50+; Very Good 30+; Good 0 - 30; Needs Improvement (100) - 0 Zions compares favorably to global competitors (JP Morgan, Bank of America, Wells Fargo, US Bank) Coalition Greenwich Best Bank Awards • Ranked third among all U.S. banks for Middle Market with 12 Best Bank Awards • One of only four U.S. banks to average 15 or more wins overall since the inception of the awards in 2009 • Received strong evaluations in overall customer satisfaction, values long-term relationships, and ease of doing business. Middle Market (Revenue of $10MM-$500MM) Zions Bancorp Major Bank Competitors (Avg. Score) Highest Major Bank Competitor's Score Zions’ Rank Overall Satisfaction – Customers 59 45 50 1st Bank You Can Trust 71 47 52 1st Values Long-Term Relationships 65 51 56 1st Ease of Doing Business 59 46 51 1st Digital Product Capabilities 56 38 45 1st Overall Customer Satisfaction with Bankers 69 52 54 1st Net Promoter Score** 63 45 53 1st Coalition Greenwich Customer Satisfaction % Excellent Citations*


NON-GAAP FINANCIAL MEASURES 37 In millions, except per share amounts 1Q25 4Q24 3Q24 2Q24 1Q24 (a) Total noninterest expense $538 $509 $502 $509 $526 LESS adjustments: Severance costs 3 1 1 1 Other real estate expense (1) Amortization of core deposit and other intangibles 2 2 2 1 2 FDIC special assessment (3) 1 13 SBIC investment success fee accrual 1 Restructuring costs (b) Total adjustments 5 - 3 3 15 (c) = (a - b) Adjusted noninterest expense 533 509 499 506 511 d) Net interest income 624 627 620 597 586 (e) Fully taxable-equivalent adjustments 11 12 12 11 10 (f) = (d + e) Taxable-equivalent net interest income (TE NII) 635 639 632 608 596 (g) Noninterest Income 171 193 172 179 156 (h) = (f + g) Combined Income $806 $832 $804 $787 $752 LESS adjustments: Fair value and nonhedge derivative income (loss) - 3 (3) (1) 1 Securities gains (losses), net 6 8 9 4 (2) (i) Total adjustments 6 11 6 3 (1) (j) = (h - i) Adjusted revenue $800 $821 $798 $784 $753 (j - c) Adjusted pre-provision net revenue (PPNR) $267 $312 $299 $278 $242 (c) / (j) Efficiency Ratio 66.6% 62.0% 62.5% 64.5% 67.9%


NON-GAAP FINANCIAL MEASURES (CONTINUED) 38 In millions 1Q25 4Q24 3Q24 2Q24 1Q24 Return on Average Tangible Common Equity (Non-GAAP) Net earnings applicable to common $169 $200 $204 $190 $143 Adjustments, net of tax: Amortization of core deposit and other intangibles 1 1 1 1 1 (a) Net earnings applicable to common, net of tax $170 $201 $205 $191 $144 Average common equity (GAAP) $6,182 $6,036 $5,738 $5,450 $5,289 Average goodwill and intangibles (1,052) (1,053) (1,054) (1,056) (1,058) (b) Average tangible common equity (non-GAAP) $5,130 $4,983 $4,684 $4,394 $4,231 (c) Number of days in quarter 90 92 92 91 91 (d) Number of days in year 365 366 366 366 366 (a/b/c)*d Return on average tangible common equity (non- GAAP) 13.4% 16.0% 17.4% 17.5% 13.7%


z i o n s b a n c o r p o ra t i o n . c o m