false2023FY0000109380http://fasb.org/us-gaap/2023#AccountingStandardsUpdate202202MemberP3YP3Yhttp://fasb.org/us-gaap/2023#DebtAndEquitySecuritiesGainLosshttp://fasb.org/us-gaap/2023#DebtAndEquitySecuritiesGainLosshttp://fasb.org/us-gaap/2023#OtherNoninterestExpensehttp://fasb.org/us-gaap/2023#OtherNoninterestExpense0http://fasb.org/us-gaap/2023#OtherAssetshttp://fasb.org/us-gaap/2023#OtherLiabilitieshttp://fasb.org/us-gaap/2023#OtherAssetshttp://fasb.org/us-gaap/2023#OtherLiabilitieshttp://fasb.org/us-gaap/2023#OtherAssetshttp://fasb.org/us-gaap/2023#OtherAssetshttp://fasb.org/us-gaap/2023#OtherAssetshttp://fasb.org/us-gaap/2023#OtherAssetshttp://fasb.org/us-gaap/2023#PropertyPlantAndEquipmentAndFinanceLeaseRightOfUseAssetAfterAccumulatedDepreciationAndAmortizationhttp://fasb.org/us-gaap/2023#PropertyPlantAndEquipmentAndFinanceLeaseRightOfUseAssetAfterAccumulatedDepreciationAndAmortizationhttp://fasb.org/us-gaap/2023#OtherLiabilitieshttp://fasb.org/us-gaap/2023#OtherLiabilitieshttp://fasb.org/us-gaap/2023#LongTermDebthttp://fasb.org/us-gaap/2023#LongTermDebt0.02500001093802023-01-012023-12-310000109380us-gaap:CommonStockMember2023-01-012023-12-310000109380zions:SeriesAFloatingRateNonCumulativePerpetualPreferredStockMember2023-01-012023-12-310000109380zions:SeriesGFixedFloatingRateNonCumulativePerpetualPreferredStockMember2023-01-012023-12-310000109380zions:FixedToFloatingRateSubordinatedNotesMember2023-01-012023-12-3100001093802023-06-30iso4217:USD00001093802024-02-05xbrli:shares00001093802023-12-3100001093802022-12-31iso4217:USDxbrli:shares00001093802022-01-012022-12-3100001093802021-01-012021-12-310000109380us-gaap:PreferredStockMember2020-12-310000109380us-gaap:CommonStockMember2020-12-310000109380us-gaap:AdditionalPaidInCapitalMember2020-12-310000109380us-gaap:RetainedEarningsMember2020-12-310000109380us-gaap:AccumulatedOtherComprehensiveIncomeMember2020-12-3100001093802020-12-310000109380us-gaap:RetainedEarningsMember2021-01-012021-12-310000109380us-gaap:AccumulatedOtherComprehensiveIncomeMember2021-01-012021-12-310000109380us-gaap:CommonStockMember2021-01-012021-12-310000109380us-gaap:AdditionalPaidInCapitalMember2021-01-012021-12-310000109380us-gaap:PreferredStockMember2021-01-012021-12-310000109380us-gaap:PreferredStockMember2021-12-310000109380us-gaap:CommonStockMember2021-12-310000109380us-gaap:AdditionalPaidInCapitalMember2021-12-310000109380us-gaap:RetainedEarningsMember2021-12-310000109380us-gaap:AccumulatedOtherComprehensiveIncomeMember2021-12-3100001093802021-12-310000109380us-gaap:RetainedEarningsMember2022-01-012022-12-310000109380us-gaap:AccumulatedOtherComprehensiveIncomeMember2022-01-012022-12-310000109380us-gaap:CommonStockMember2022-01-012022-12-310000109380us-gaap:AdditionalPaidInCapitalMember2022-01-012022-12-310000109380us-gaap:PreferredStockMember2022-12-310000109380us-gaap:CommonStockMember2022-12-310000109380us-gaap:AdditionalPaidInCapitalMember2022-12-310000109380us-gaap:RetainedEarningsMember2022-12-310000109380us-gaap:AccumulatedOtherComprehensiveIncomeMember2022-12-310000109380us-gaap:RetainedEarningsMember2023-01-012023-12-310000109380srt:CumulativeEffectPeriodOfAdoptionAdjustmentMemberus-gaap:RetainedEarningsMember2022-12-310000109380srt:CumulativeEffectPeriodOfAdoptionAdjustmentMember2022-12-310000109380us-gaap:AccumulatedOtherComprehensiveIncomeMember2023-01-012023-12-310000109380us-gaap:CommonStockMember2023-01-012023-12-310000109380us-gaap:AdditionalPaidInCapitalMember2023-01-012023-12-310000109380us-gaap:PreferredStockMember2023-12-310000109380us-gaap:CommonStockMember2023-12-310000109380us-gaap:AdditionalPaidInCapitalMember2023-12-310000109380us-gaap:RetainedEarningsMember2023-12-310000109380us-gaap:AccumulatedOtherComprehensiveIncomeMember2023-12-31zions:statezions:segment0000109380srt:MinimumMember2023-01-012023-12-310000109380srt:MinimumMemberus-gaap:BuildingMember2023-12-310000109380srt:MaximumMemberus-gaap:BuildingMember2023-12-310000109380srt:MinimumMemberus-gaap:FurnitureAndFixturesMember2023-12-310000109380srt:MaximumMemberus-gaap:FurnitureAndFixturesMember2023-12-310000109380srt:MinimumMemberus-gaap:SoftwareAndSoftwareDevelopmentCostsMember2023-12-310000109380us-gaap:SoftwareAndSoftwareDevelopmentCostsMembersrt:MaximumMember2023-12-31xbrli:pure0000109380us-gaap:FairValueInputsLevel1Memberus-gaap:USTreasurySecuritiesMember2023-12-310000109380us-gaap:FairValueInputsLevel2Memberus-gaap:USTreasurySecuritiesMember2023-12-310000109380us-gaap:FairValueInputsLevel3Memberus-gaap:USTreasurySecuritiesMember2023-12-310000109380us-gaap:USTreasurySecuritiesMember2023-12-310000109380us-gaap:FairValueInputsLevel1Memberus-gaap:USStatesAndPoliticalSubdivisionsMember2023-12-310000109380us-gaap:FairValueInputsLevel2Memberus-gaap:USStatesAndPoliticalSubdivisionsMember2023-12-310000109380us-gaap:FairValueInputsLevel3Memberus-gaap:USStatesAndPoliticalSubdivisionsMember2023-12-310000109380us-gaap:USStatesAndPoliticalSubdivisionsMember2023-12-310000109380us-gaap:FairValueInputsLevel1Memberus-gaap:OtherDebtSecuritiesMember2023-12-310000109380us-gaap:FairValueInputsLevel2Memberus-gaap:OtherDebtSecuritiesMember2023-12-310000109380us-gaap:FairValueInputsLevel3Memberus-gaap:OtherDebtSecuritiesMember2023-12-310000109380us-gaap:OtherDebtSecuritiesMember2023-12-310000109380us-gaap:FairValueInputsLevel1Member2023-12-310000109380us-gaap:FairValueInputsLevel2Member2023-12-310000109380us-gaap:FairValueInputsLevel3Member2023-12-310000109380us-gaap:FairValueInputsLevel1Memberzions:BankownedlifeinsuranceMember2023-12-310000109380zions:BankownedlifeinsuranceMemberus-gaap:FairValueInputsLevel2Member2023-12-310000109380zions:BankownedlifeinsuranceMemberus-gaap:FairValueInputsLevel3Member2023-12-310000109380zions:BankownedlifeinsuranceMember2023-12-310000109380us-gaap:FairValueInputsLevel1Memberus-gaap:PrivateEquityFundsMember2023-12-310000109380us-gaap:PrivateEquityFundsMemberus-gaap:FairValueInputsLevel2Member2023-12-310000109380us-gaap:FairValueInputsLevel3Memberus-gaap:PrivateEquityFundsMember2023-12-310000109380us-gaap:PrivateEquityFundsMember2023-12-310000109380us-gaap:DeferredCompensationArrangementWithIndividualByTypeOfCompensationPensionAndOtherPostretirementBenefitsMemberus-gaap:FairValueInputsLevel1Member2023-12-310000109380us-gaap:DeferredCompensationArrangementWithIndividualByTypeOfCompensationPensionAndOtherPostretirementBenefitsMemberus-gaap:FairValueInputsLevel2Member2023-12-310000109380us-gaap:DeferredCompensationArrangementWithIndividualByTypeOfCompensationPensionAndOtherPostretirementBenefitsMemberus-gaap:FairValueInputsLevel3Member2023-12-310000109380us-gaap:DeferredCompensationArrangementWithIndividualByTypeOfCompensationPensionAndOtherPostretirementBenefitsMember2023-12-310000109380us-gaap:FairValueInputsLevel1Memberus-gaap:DerivativeMember2023-12-310000109380us-gaap:FairValueInputsLevel2Memberus-gaap:DerivativeMember2023-12-310000109380us-gaap:FairValueInputsLevel3Memberus-gaap:DerivativeMember2023-12-310000109380us-gaap:DerivativeMember2023-12-310000109380us-gaap:FairValueInputsLevel1Memberus-gaap:USTreasurySecuritiesMember2022-12-310000109380us-gaap:FairValueInputsLevel2Memberus-gaap:USTreasurySecuritiesMember2022-12-310000109380us-gaap:FairValueInputsLevel3Memberus-gaap:USTreasurySecuritiesMember2022-12-310000109380us-gaap:USTreasurySecuritiesMember2022-12-310000109380us-gaap:FairValueInputsLevel1Memberus-gaap:USStatesAndPoliticalSubdivisionsMember2022-12-310000109380us-gaap:FairValueInputsLevel2Memberus-gaap:USStatesAndPoliticalSubdivisionsMember2022-12-310000109380us-gaap:FairValueInputsLevel3Memberus-gaap:USStatesAndPoliticalSubdivisionsMember2022-12-310000109380us-gaap:USStatesAndPoliticalSubdivisionsMember2022-12-310000109380us-gaap:FairValueInputsLevel1Memberus-gaap:OtherDebtSecuritiesMember2022-12-310000109380us-gaap:FairValueInputsLevel2Memberus-gaap:OtherDebtSecuritiesMember2022-12-310000109380us-gaap:FairValueInputsLevel3Memberus-gaap:OtherDebtSecuritiesMember2022-12-310000109380us-gaap:OtherDebtSecuritiesMember2022-12-310000109380us-gaap:FairValueInputsLevel1Member2022-12-310000109380us-gaap:FairValueInputsLevel2Member2022-12-310000109380us-gaap:FairValueInputsLevel3Member2022-12-310000109380us-gaap:FairValueInputsLevel1Memberzions:BankownedlifeinsuranceMember2022-12-310000109380zions:BankownedlifeinsuranceMemberus-gaap:FairValueInputsLevel2Member2022-12-310000109380zions:BankownedlifeinsuranceMemberus-gaap:FairValueInputsLevel3Member2022-12-310000109380zions:BankownedlifeinsuranceMember2022-12-310000109380us-gaap:FairValueInputsLevel1Memberus-gaap:PrivateEquityFundsMember2022-12-310000109380us-gaap:PrivateEquityFundsMemberus-gaap:FairValueInputsLevel2Member2022-12-310000109380us-gaap:FairValueInputsLevel3Memberus-gaap:PrivateEquityFundsMember2022-12-310000109380us-gaap:PrivateEquityFundsMember2022-12-310000109380us-gaap:DeferredCompensationArrangementWithIndividualByTypeOfCompensationPensionAndOtherPostretirementBenefitsMemberus-gaap:FairValueInputsLevel1Member2022-12-310000109380us-gaap:DeferredCompensationArrangementWithIndividualByTypeOfCompensationPensionAndOtherPostretirementBenefitsMemberus-gaap:FairValueInputsLevel2Member2022-12-310000109380us-gaap:DeferredCompensationArrangementWithIndividualByTypeOfCompensationPensionAndOtherPostretirementBenefitsMemberus-gaap:FairValueInputsLevel3Member2022-12-310000109380us-gaap:DeferredCompensationArrangementWithIndividualByTypeOfCompensationPensionAndOtherPostretirementBenefitsMember2022-12-310000109380us-gaap:FairValueInputsLevel1Memberus-gaap:DerivativeMember2022-12-310000109380us-gaap:FairValueInputsLevel2Memberus-gaap:DerivativeMember2022-12-310000109380us-gaap:FairValueInputsLevel3Memberus-gaap:DerivativeMember2022-12-310000109380us-gaap:DerivativeMember2022-12-310000109380us-gaap:PrivateEquityFundsMemberus-gaap:FairValueInputsLevel3Member2022-12-310000109380us-gaap:ServicingContractsMemberus-gaap:FairValueInputsLevel3Member2022-12-310000109380us-gaap:PrivateEquityFundsMemberus-gaap:FairValueInputsLevel3Member2021-12-310000109380us-gaap:ServicingContractsMemberus-gaap:FairValueInputsLevel3Member2021-12-310000109380us-gaap:PrivateEquityFundsMemberus-gaap:FairValueInputsLevel3Member2020-12-310000109380us-gaap:ServicingContractsMemberus-gaap:FairValueInputsLevel3Member2020-12-310000109380zions:DebtAndEquitySecuritiesUnrealizedGainLossMember2022-01-012022-12-310000109380zions:DebtAndEquitySecuritiesUnrealizedGainLossMember2023-01-012023-12-310000109380us-gaap:PrivateEquityFundsMemberus-gaap:FairValueInputsLevel3Memberzions:DebtAndEquitySecuritiesUnrealizedGainLossMember2023-01-012023-12-310000109380us-gaap:ServicingContractsMemberus-gaap:FairValueInputsLevel3Memberzions:DebtAndEquitySecuritiesUnrealizedGainLossMember2023-01-012023-12-310000109380us-gaap:PrivateEquityFundsMemberus-gaap:FairValueInputsLevel3Memberzions:DebtAndEquitySecuritiesUnrealizedGainLossMember2022-01-012022-12-310000109380us-gaap:ServicingContractsMemberus-gaap:FairValueInputsLevel3Memberzions:DebtAndEquitySecuritiesUnrealizedGainLossMember2022-01-012022-12-310000109380us-gaap:PrivateEquityFundsMemberus-gaap:FairValueInputsLevel3Memberzions:DebtAndEquitySecuritiesUnrealizedGainLossMember2021-01-012021-12-310000109380us-gaap:ServicingContractsMemberus-gaap:FairValueInputsLevel3Memberzions:DebtAndEquitySecuritiesUnrealizedGainLossMember2021-01-012021-12-310000109380zions:OtherNoninterestExpenseMember2023-01-012023-12-310000109380zions:OtherNoninterestExpenseMember2022-01-012022-12-310000109380us-gaap:PrivateEquityFundsMemberus-gaap:FairValueInputsLevel3Memberzions:OtherNoninterestExpenseMember2023-01-012023-12-310000109380us-gaap:ServicingContractsMemberus-gaap:FairValueInputsLevel3Memberzions:OtherNoninterestExpenseMember2023-01-012023-12-310000109380us-gaap:PrivateEquityFundsMemberus-gaap:FairValueInputsLevel3Memberzions:OtherNoninterestExpenseMember2022-01-012022-12-310000109380us-gaap:ServicingContractsMemberus-gaap:FairValueInputsLevel3Memberzions:OtherNoninterestExpenseMember2022-01-012022-12-310000109380us-gaap:PrivateEquityFundsMemberus-gaap:FairValueInputsLevel3Memberzions:OtherNoninterestExpenseMember2021-01-012021-12-310000109380us-gaap:ServicingContractsMemberus-gaap:FairValueInputsLevel3Memberzions:OtherNoninterestExpenseMember2021-01-012021-12-310000109380us-gaap:PrivateEquityFundsMemberus-gaap:FairValueInputsLevel3Member2023-01-012023-12-310000109380us-gaap:ServicingContractsMemberus-gaap:FairValueInputsLevel3Member2023-01-012023-12-310000109380us-gaap:PrivateEquityFundsMemberus-gaap:FairValueInputsLevel3Member2022-01-012022-12-310000109380us-gaap:ServicingContractsMemberus-gaap:FairValueInputsLevel3Member2022-01-012022-12-310000109380us-gaap:PrivateEquityFundsMemberus-gaap:FairValueInputsLevel3Member2021-01-012021-12-310000109380us-gaap:ServicingContractsMemberus-gaap:FairValueInputsLevel3Member2021-01-012021-12-310000109380us-gaap:PrivateEquityFundsMemberus-gaap:FairValueInputsLevel3Member2023-12-310000109380us-gaap:ServicingContractsMemberus-gaap:FairValueInputsLevel3Member2023-12-310000109380us-gaap:FairValueInputsLevel3Member2023-01-012023-12-310000109380us-gaap:FairValueInputsLevel3Member2022-01-012022-12-310000109380us-gaap:FairValueInputsLevel3Member2021-01-012021-12-310000109380zions:CollateralDependentLoansMemberus-gaap:FairValueMeasurementsNonrecurringMemberus-gaap:FairValueInputsLevel2Member2023-12-310000109380us-gaap:CarryingReportedAmountFairValueDisclosureMemberus-gaap:FairValueInputsLevel2Member2023-12-310000109380us-gaap:FairValueInputsLevel2Memberus-gaap:EstimateOfFairValueFairValueDisclosureMember2023-12-310000109380us-gaap:CarryingReportedAmountFairValueDisclosureMemberus-gaap:FairValueInputsLevel2Member2022-12-310000109380us-gaap:FairValueInputsLevel2Memberus-gaap:EstimateOfFairValueFairValueDisclosureMember2022-12-310000109380us-gaap:FairValueInputsLevel3Memberus-gaap:CarryingReportedAmountFairValueDisclosureMember2023-12-310000109380us-gaap:FairValueInputsLevel3Memberus-gaap:EstimateOfFairValueFairValueDisclosureMember2023-12-310000109380us-gaap:FairValueInputsLevel3Memberus-gaap:CarryingReportedAmountFairValueDisclosureMember2022-12-310000109380us-gaap:FairValueInputsLevel3Memberus-gaap:EstimateOfFairValueFairValueDisclosureMember2022-12-310000109380zions:LoansHeldForSaleMember2023-12-310000109380zions:CollateralDependentLoansMemberus-gaap:FairValueMeasurementsNonrecurringMemberus-gaap:FairValueInputsLevel2Member2023-01-012023-12-310000109380us-gaap:AgencySecuritiesMember2023-12-310000109380zions:AgencyGuaranteedMortgageBackedSecuritiesMember2023-12-310000109380zions:SmallBusinessAdministrationLoanBackedSecuritiesMember2023-12-310000109380zions:AvailableforsaleOtherdebtsecuritiesMember2023-12-310000109380zions:AvailableForSaleUnrealizedGainsOtherMember2023-12-310000109380us-gaap:AgencySecuritiesMember2022-12-310000109380zions:AgencyGuaranteedMortgageBackedSecuritiesMember2022-12-310000109380zions:SmallBusinessAdministrationLoanBackedSecuritiesMember2022-12-310000109380zions:AvailableforsaleOtherdebtsecuritiesMember2022-12-310000109380zions:AvailableForSaleUnrealizedGainsOtherMember2022-12-3100001093802022-10-012022-12-310000109380zions:AvailableforsaleUnrealizedlossesOtherMember2023-12-310000109380zions:AvailableforsaleUnrealizedlossesOtherMember2022-12-31zions:security0000109380zions:TaxableMember2023-01-012023-12-310000109380zions:NontaxableMember2023-01-012023-12-310000109380zions:TaxableMember2022-01-012022-12-310000109380zions:NontaxableMember2022-01-012022-12-310000109380zions:TaxableMember2021-01-012021-12-310000109380zions:NontaxableMember2021-01-012021-12-310000109380us-gaap:CommercialPortfolioSegmentMemberzions:CommercialAndIndustrialMember2023-12-310000109380us-gaap:CommercialPortfolioSegmentMemberzions:CommercialAndIndustrialMember2022-12-310000109380us-gaap:CommercialPortfolioSegmentMemberus-gaap:FinanceLeasesPortfolioSegmentMember2023-12-310000109380us-gaap:CommercialPortfolioSegmentMemberus-gaap:FinanceLeasesPortfolioSegmentMember2022-12-310000109380us-gaap:CommercialPortfolioSegmentMemberzions:OwnerOccupiedMember2023-12-310000109380us-gaap:CommercialPortfolioSegmentMemberzions:OwnerOccupiedMember2022-12-310000109380zions:MunicipalMemberus-gaap:CommercialPortfolioSegmentMember2023-12-310000109380zions:MunicipalMemberus-gaap:CommercialPortfolioSegmentMember2022-12-310000109380us-gaap:CommercialPortfolioSegmentMember2023-12-310000109380us-gaap:CommercialPortfolioSegmentMember2022-12-310000109380zions:ConstructionAndLandDevelopmentMemberus-gaap:CommercialRealEstatePortfolioSegmentMember2023-12-310000109380zions:ConstructionAndLandDevelopmentMemberus-gaap:CommercialRealEstatePortfolioSegmentMember2022-12-310000109380zions:TermMemberus-gaap:CommercialRealEstatePortfolioSegmentMember2023-12-310000109380zions:TermMemberus-gaap:CommercialRealEstatePortfolioSegmentMember2022-12-310000109380us-gaap:CommercialRealEstatePortfolioSegmentMember2023-12-310000109380us-gaap:CommercialRealEstatePortfolioSegmentMember2022-12-310000109380us-gaap:HomeEquityMemberus-gaap:ConsumerPortfolioSegmentMember2023-12-310000109380us-gaap:HomeEquityMemberus-gaap:ConsumerPortfolioSegmentMember2022-12-310000109380us-gaap:ConsumerPortfolioSegmentMemberzions:OneThroughFourFamilyResidentialMember2023-12-310000109380us-gaap:ConsumerPortfolioSegmentMemberzions:OneThroughFourFamilyResidentialMember2022-12-310000109380us-gaap:ConsumerPortfolioSegmentMemberzions:ConstructionAndOtherConsumerRealEstateMember2023-12-310000109380us-gaap:ConsumerPortfolioSegmentMemberzions:ConstructionAndOtherConsumerRealEstateMember2022-12-310000109380us-gaap:ConsumerPortfolioSegmentMemberzions:BankcardAndOtherRevolvingPlansMember2023-12-310000109380us-gaap:ConsumerPortfolioSegmentMemberzions:BankcardAndOtherRevolvingPlansMember2022-12-310000109380zions:OtherConsumerLoansMemberus-gaap:ConsumerPortfolioSegmentMember2023-12-310000109380zions:OtherConsumerLoansMemberus-gaap:ConsumerPortfolioSegmentMember2022-12-310000109380us-gaap:ConsumerPortfolioSegmentMember2023-12-310000109380us-gaap:ConsumerPortfolioSegmentMember2022-12-310000109380zions:PPPMember2023-12-310000109380zions:PPPMember2022-12-310000109380zions:LandAcquisitionAndDevelopmentMemberus-gaap:CommercialRealEstatePortfolioSegmentMember2023-12-310000109380zions:LandAcquisitionAndDevelopmentMemberus-gaap:CommercialRealEstatePortfolioSegmentMember2022-12-310000109380us-gaap:AssetPledgedAsCollateralWithoutRightMember2023-12-310000109380us-gaap:AssetPledgedAsCollateralWithoutRightMember2022-12-310000109380us-gaap:CommercialMortgageBackedSecuritiesMember2023-12-310000109380us-gaap:CommercialRealEstatePortfolioSegmentMember2023-01-012023-12-310000109380us-gaap:ConsumerPortfolioSegmentMember2023-01-012023-12-310000109380us-gaap:ConsumerPortfolioSegmentMemberzions:ClosedEndConsumerLoanMember2023-01-012023-12-310000109380us-gaap:CommercialPortfolioSegmentMembersrt:CumulativeEffectPeriodOfAdoptionAdjustmentMember2022-12-310000109380srt:CumulativeEffectPeriodOfAdoptionAdjustmentMemberus-gaap:CommercialRealEstatePortfolioSegmentMember2022-12-310000109380us-gaap:ConsumerPortfolioSegmentMembersrt:CumulativeEffectPeriodOfAdoptionAdjustmentMember2022-12-310000109380us-gaap:CommercialPortfolioSegmentMembersrt:CumulativeEffectPeriodOfAdoptionAdjustedBalanceMember2022-12-310000109380us-gaap:CommercialRealEstatePortfolioSegmentMembersrt:CumulativeEffectPeriodOfAdoptionAdjustedBalanceMember2022-12-310000109380us-gaap:ConsumerPortfolioSegmentMembersrt:CumulativeEffectPeriodOfAdoptionAdjustedBalanceMember2022-12-310000109380srt:CumulativeEffectPeriodOfAdoptionAdjustedBalanceMember2022-12-310000109380us-gaap:CommercialPortfolioSegmentMember2023-01-012023-12-310000109380us-gaap:CommercialPortfolioSegmentMember2021-12-310000109380us-gaap:CommercialRealEstatePortfolioSegmentMember2021-12-310000109380us-gaap:ConsumerPortfolioSegmentMember2021-12-310000109380us-gaap:CommercialPortfolioSegmentMember2022-01-012022-12-310000109380us-gaap:CommercialRealEstatePortfolioSegmentMember2022-01-012022-12-310000109380us-gaap:ConsumerPortfolioSegmentMember2022-01-012022-12-310000109380us-gaap:CommercialPortfolioSegmentMember2021-01-012021-12-310000109380us-gaap:CommercialRealEstatePortfolioSegmentMember2021-01-012021-12-310000109380us-gaap:ConsumerPortfolioSegmentMember2021-01-012021-12-310000109380us-gaap:FinancialAssetNotPastDueMemberus-gaap:CommercialPortfolioSegmentMemberzions:CommercialAndIndustrialMember2023-12-310000109380us-gaap:CommercialPortfolioSegmentMemberzions:CommercialAndIndustrialMemberzions:FinancialAsset30To89DaysPastDueMember2023-12-310000109380us-gaap:CommercialPortfolioSegmentMemberus-gaap:FinancingReceivablesEqualToGreaterThan90DaysPastDueMemberzions:CommercialAndIndustrialMember2023-12-310000109380us-gaap:CommercialPortfolioSegmentMemberus-gaap:FinancialAssetPastDueMemberzions:CommercialAndIndustrialMember2023-12-310000109380us-gaap:CommercialPortfolioSegmentMemberzions:CommercialAndIndustrialMemberus-gaap:FinancingReceivables1To29DaysPastDueMember2023-12-310000109380us-gaap:FinancialAssetNotPastDueMemberus-gaap:CommercialPortfolioSegmentMemberus-gaap:FinanceLeasesPortfolioSegmentMember2023-12-310000109380us-gaap:CommercialPortfolioSegmentMemberzions:FinancialAsset30To89DaysPastDueMemberus-gaap:FinanceLeasesPortfolioSegmentMember2023-12-310000109380us-gaap:CommercialPortfolioSegmentMemberus-gaap:FinancingReceivablesEqualToGreaterThan90DaysPastDueMemberus-gaap:FinanceLeasesPortfolioSegmentMember2023-12-310000109380us-gaap:CommercialPortfolioSegmentMemberus-gaap:FinancialAssetPastDueMemberus-gaap:FinanceLeasesPortfolioSegmentMember2023-12-310000109380us-gaap:CommercialPortfolioSegmentMemberus-gaap:FinancingReceivables1To29DaysPastDueMemberus-gaap:FinanceLeasesPortfolioSegmentMember2023-12-310000109380us-gaap:FinancialAssetNotPastDueMemberus-gaap:CommercialPortfolioSegmentMemberzions:OwnerOccupiedMember2023-12-310000109380us-gaap:CommercialPortfolioSegmentMemberzions:OwnerOccupiedMemberzions:FinancialAsset30To89DaysPastDueMember2023-12-310000109380us-gaap:CommercialPortfolioSegmentMemberus-gaap:FinancingReceivablesEqualToGreaterThan90DaysPastDueMemberzions:OwnerOccupiedMember2023-12-310000109380us-gaap:CommercialPortfolioSegmentMemberus-gaap:FinancialAssetPastDueMemberzions:OwnerOccupiedMember2023-12-310000109380us-gaap:CommercialPortfolioSegmentMemberzions:OwnerOccupiedMemberus-gaap:FinancingReceivables1To29DaysPastDueMember2023-12-310000109380us-gaap:FinancialAssetNotPastDueMemberus-gaap:CommercialPortfolioSegmentMemberzions:MunicipalMember2023-12-310000109380us-gaap:CommercialPortfolioSegmentMemberzions:MunicipalMemberzions:FinancialAsset30To89DaysPastDueMember2023-12-310000109380us-gaap:CommercialPortfolioSegmentMemberzions:MunicipalMemberus-gaap:FinancingReceivablesEqualToGreaterThan90DaysPastDueMember2023-12-310000109380us-gaap:CommercialPortfolioSegmentMemberzions:MunicipalMemberus-gaap:FinancialAssetPastDueMember2023-12-310000109380us-gaap:CommercialPortfolioSegmentMemberzions:MunicipalMemberus-gaap:FinancingReceivables1To29DaysPastDueMember2023-12-310000109380us-gaap:FinancialAssetNotPastDueMemberus-gaap:CommercialPortfolioSegmentMember2023-12-310000109380us-gaap:CommercialPortfolioSegmentMemberzions:FinancialAsset30To89DaysPastDueMember2023-12-310000109380us-gaap:CommercialPortfolioSegmentMemberus-gaap:FinancingReceivablesEqualToGreaterThan90DaysPastDueMember2023-12-310000109380us-gaap:CommercialPortfolioSegmentMemberus-gaap:FinancialAssetPastDueMember2023-12-310000109380us-gaap:CommercialPortfolioSegmentMemberus-gaap:FinancingReceivables1To29DaysPastDueMember2023-12-310000109380us-gaap:FinancialAssetNotPastDueMemberzions:ConstructionAndLandDevelopmentMemberus-gaap:CommercialRealEstatePortfolioSegmentMember2023-12-310000109380zions:ConstructionAndLandDevelopmentMemberzions:FinancialAsset30To89DaysPastDueMemberus-gaap:CommercialRealEstatePortfolioSegmentMember2023-12-310000109380zions:ConstructionAndLandDevelopmentMemberus-gaap:FinancingReceivablesEqualToGreaterThan90DaysPastDueMemberus-gaap:CommercialRealEstatePortfolioSegmentMember2023-12-310000109380zions:ConstructionAndLandDevelopmentMemberus-gaap:FinancialAssetPastDueMemberus-gaap:CommercialRealEstatePortfolioSegmentMember2023-12-310000109380zions:ConstructionAndLandDevelopmentMemberus-gaap:FinancingReceivables1To29DaysPastDueMemberus-gaap:CommercialRealEstatePortfolioSegmentMember2023-12-310000109380us-gaap:FinancialAssetNotPastDueMemberzions:TermMemberus-gaap:CommercialRealEstatePortfolioSegmentMember2023-12-310000109380zions:TermMemberzions:FinancialAsset30To89DaysPastDueMemberus-gaap:CommercialRealEstatePortfolioSegmentMember2023-12-310000109380us-gaap:FinancingReceivablesEqualToGreaterThan90DaysPastDueMemberzions:TermMemberus-gaap:CommercialRealEstatePortfolioSegmentMember2023-12-310000109380us-gaap:FinancialAssetPastDueMemberzions:TermMemberus-gaap:CommercialRealEstatePortfolioSegmentMember2023-12-310000109380zions:TermMemberus-gaap:FinancingReceivables1To29DaysPastDueMemberus-gaap:CommercialRealEstatePortfolioSegmentMember2023-12-310000109380us-gaap:FinancialAssetNotPastDueMemberus-gaap:CommercialRealEstatePortfolioSegmentMember2023-12-310000109380zions:FinancialAsset30To89DaysPastDueMemberus-gaap:CommercialRealEstatePortfolioSegmentMember2023-12-310000109380us-gaap:FinancingReceivablesEqualToGreaterThan90DaysPastDueMemberus-gaap:CommercialRealEstatePortfolioSegmentMember2023-12-310000109380us-gaap:FinancialAssetPastDueMemberus-gaap:CommercialRealEstatePortfolioSegmentMember2023-12-310000109380us-gaap:FinancingReceivables1To29DaysPastDueMemberus-gaap:CommercialRealEstatePortfolioSegmentMember2023-12-310000109380us-gaap:HomeEquityMemberus-gaap:FinancialAssetNotPastDueMemberus-gaap:ConsumerPortfolioSegmentMember2023-12-310000109380us-gaap:HomeEquityMemberus-gaap:ConsumerPortfolioSegmentMemberzions:FinancialAsset30To89DaysPastDueMember2023-12-310000109380us-gaap:HomeEquityMemberus-gaap:ConsumerPortfolioSegmentMemberus-gaap:FinancingReceivablesEqualToGreaterThan90DaysPastDueMember2023-12-310000109380us-gaap:HomeEquityMemberus-gaap:ConsumerPortfolioSegmentMemberus-gaap:FinancialAssetPastDueMember2023-12-310000109380us-gaap:HomeEquityMemberus-gaap:ConsumerPortfolioSegmentMemberus-gaap:FinancingReceivables1To29DaysPastDueMember2023-12-310000109380us-gaap:FinancialAssetNotPastDueMemberus-gaap:ConsumerPortfolioSegmentMemberzions:OneThroughFourFamilyResidentialMember2023-12-310000109380us-gaap:ConsumerPortfolioSegmentMemberzions:OneThroughFourFamilyResidentialMemberzions:FinancialAsset30To89DaysPastDueMember2023-12-310000109380us-gaap:ConsumerPortfolioSegmentMemberus-gaap:FinancingReceivablesEqualToGreaterThan90DaysPastDueMemberzions:OneThroughFourFamilyResidentialMember2023-12-310000109380us-gaap:ConsumerPortfolioSegmentMemberzions:OneThroughFourFamilyResidentialMemberus-gaap:FinancialAssetPastDueMember2023-12-310000109380us-gaap:ConsumerPortfolioSegmentMemberzions:OneThroughFourFamilyResidentialMemberus-gaap:FinancingReceivables1To29DaysPastDueMember2023-12-310000109380us-gaap:FinancialAssetNotPastDueMemberus-gaap:ConsumerPortfolioSegmentMemberzions:ConstructionAndOtherConsumerRealEstateMember2023-12-310000109380us-gaap:ConsumerPortfolioSegmentMemberzions:FinancialAsset30To89DaysPastDueMemberzions:ConstructionAndOtherConsumerRealEstateMember2023-12-310000109380us-gaap:ConsumerPortfolioSegmentMemberus-gaap:FinancingReceivablesEqualToGreaterThan90DaysPastDueMemberzions:ConstructionAndOtherConsumerRealEstateMember2023-12-310000109380us-gaap:ConsumerPortfolioSegmentMemberus-gaap:FinancialAssetPastDueMemberzions:ConstructionAndOtherConsumerRealEstateMember2023-12-310000109380us-gaap:ConsumerPortfolioSegmentMemberus-gaap:FinancingReceivables1To29DaysPastDueMemberzions:ConstructionAndOtherConsumerRealEstateMember2023-12-310000109380us-gaap:FinancialAssetNotPastDueMemberus-gaap:ConsumerPortfolioSegmentMemberzions:BankcardAndOtherRevolvingPlansMember2023-12-310000109380us-gaap:ConsumerPortfolioSegmentMemberzions:FinancialAsset30To89DaysPastDueMemberzions:BankcardAndOtherRevolvingPlansMember2023-12-310000109380us-gaap:ConsumerPortfolioSegmentMemberus-gaap:FinancingReceivablesEqualToGreaterThan90DaysPastDueMemberzions:BankcardAndOtherRevolvingPlansMember2023-12-310000109380us-gaap:ConsumerPortfolioSegmentMemberus-gaap:FinancialAssetPastDueMemberzions:BankcardAndOtherRevolvingPlansMember2023-12-310000109380us-gaap:ConsumerPortfolioSegmentMemberus-gaap:FinancingReceivables1To29DaysPastDueMemberzions:BankcardAndOtherRevolvingPlansMember2023-12-310000109380zions:OtherConsumerLoansMemberus-gaap:FinancialAssetNotPastDueMemberus-gaap:ConsumerPortfolioSegmentMember2023-12-310000109380zions:OtherConsumerLoansMemberus-gaap:ConsumerPortfolioSegmentMemberzions:FinancialAsset30To89DaysPastDueMember2023-12-310000109380zions:OtherConsumerLoansMemberus-gaap:ConsumerPortfolioSegmentMemberus-gaap:FinancingReceivablesEqualToGreaterThan90DaysPastDueMember2023-12-310000109380zions:OtherConsumerLoansMemberus-gaap:ConsumerPortfolioSegmentMemberus-gaap:FinancialAssetPastDueMember2023-12-310000109380zions:OtherConsumerLoansMemberus-gaap:ConsumerPortfolioSegmentMemberus-gaap:FinancingReceivables1To29DaysPastDueMember2023-12-310000109380us-gaap:FinancialAssetNotPastDueMemberus-gaap:ConsumerPortfolioSegmentMember2023-12-310000109380us-gaap:ConsumerPortfolioSegmentMemberzions:FinancialAsset30To89DaysPastDueMember2023-12-310000109380us-gaap:ConsumerPortfolioSegmentMemberus-gaap:FinancingReceivablesEqualToGreaterThan90DaysPastDueMember2023-12-310000109380us-gaap:ConsumerPortfolioSegmentMemberus-gaap:FinancialAssetPastDueMember2023-12-310000109380us-gaap:ConsumerPortfolioSegmentMemberus-gaap:FinancingReceivables1To29DaysPastDueMember2023-12-310000109380us-gaap:FinancialAssetNotPastDueMember2023-12-310000109380zions:FinancialAsset30To89DaysPastDueMember2023-12-310000109380us-gaap:FinancingReceivablesEqualToGreaterThan90DaysPastDueMember2023-12-310000109380us-gaap:FinancialAssetPastDueMember2023-12-310000109380us-gaap:FinancingReceivables1To29DaysPastDueMember2023-12-310000109380us-gaap:FinancialAssetNotPastDueMemberus-gaap:CommercialPortfolioSegmentMemberzions:CommercialAndIndustrialMember2022-12-310000109380us-gaap:CommercialPortfolioSegmentMemberzions:CommercialAndIndustrialMemberzions:FinancialAsset30To89DaysPastDueMember2022-12-310000109380us-gaap:CommercialPortfolioSegmentMemberus-gaap:FinancingReceivablesEqualToGreaterThan90DaysPastDueMemberzions:CommercialAndIndustrialMember2022-12-310000109380us-gaap:CommercialPortfolioSegmentMemberus-gaap:FinancialAssetPastDueMemberzions:CommercialAndIndustrialMember2022-12-310000109380us-gaap:CommercialPortfolioSegmentMemberzions:CommercialAndIndustrialMemberus-gaap:FinancingReceivables1To29DaysPastDueMember2022-12-310000109380us-gaap:FinancialAssetNotPastDueMemberus-gaap:CommercialPortfolioSegmentMemberus-gaap:FinanceLeasesPortfolioSegmentMember2022-12-310000109380us-gaap:CommercialPortfolioSegmentMemberzions:FinancialAsset30To89DaysPastDueMemberus-gaap:FinanceLeasesPortfolioSegmentMember2022-12-310000109380us-gaap:CommercialPortfolioSegmentMemberus-gaap:FinancingReceivablesEqualToGreaterThan90DaysPastDueMemberus-gaap:FinanceLeasesPortfolioSegmentMember2022-12-310000109380us-gaap:CommercialPortfolioSegmentMemberus-gaap:FinancialAssetPastDueMemberus-gaap:FinanceLeasesPortfolioSegmentMember2022-12-310000109380us-gaap:CommercialPortfolioSegmentMemberus-gaap:FinancingReceivables1To29DaysPastDueMemberus-gaap:FinanceLeasesPortfolioSegmentMember2022-12-310000109380us-gaap:FinancialAssetNotPastDueMemberus-gaap:CommercialPortfolioSegmentMemberzions:OwnerOccupiedMember2022-12-310000109380us-gaap:CommercialPortfolioSegmentMemberzions:OwnerOccupiedMemberzions:FinancialAsset30To89DaysPastDueMember2022-12-310000109380us-gaap:CommercialPortfolioSegmentMemberus-gaap:FinancingReceivablesEqualToGreaterThan90DaysPastDueMemberzions:OwnerOccupiedMember2022-12-310000109380us-gaap:CommercialPortfolioSegmentMemberus-gaap:FinancialAssetPastDueMemberzions:OwnerOccupiedMember2022-12-310000109380us-gaap:CommercialPortfolioSegmentMemberzions:OwnerOccupiedMemberus-gaap:FinancingReceivables1To29DaysPastDueMember2022-12-310000109380us-gaap:FinancialAssetNotPastDueMemberus-gaap:CommercialPortfolioSegmentMemberzions:MunicipalMember2022-12-310000109380us-gaap:CommercialPortfolioSegmentMemberzions:MunicipalMemberzions:FinancialAsset30To89DaysPastDueMember2022-12-310000109380us-gaap:CommercialPortfolioSegmentMemberzions:MunicipalMemberus-gaap:FinancingReceivablesEqualToGreaterThan90DaysPastDueMember2022-12-310000109380us-gaap:CommercialPortfolioSegmentMemberzions:MunicipalMemberus-gaap:FinancialAssetPastDueMember2022-12-310000109380us-gaap:CommercialPortfolioSegmentMemberzions:MunicipalMemberus-gaap:FinancingReceivables1To29DaysPastDueMember2022-12-310000109380us-gaap:FinancialAssetNotPastDueMemberus-gaap:CommercialPortfolioSegmentMember2022-12-310000109380us-gaap:CommercialPortfolioSegmentMemberzions:FinancialAsset30To89DaysPastDueMember2022-12-310000109380us-gaap:CommercialPortfolioSegmentMemberus-gaap:FinancingReceivablesEqualToGreaterThan90DaysPastDueMember2022-12-310000109380us-gaap:CommercialPortfolioSegmentMemberus-gaap:FinancialAssetPastDueMember2022-12-310000109380us-gaap:CommercialPortfolioSegmentMemberus-gaap:FinancingReceivables1To29DaysPastDueMember2022-12-310000109380us-gaap:FinancialAssetNotPastDueMemberzions:ConstructionAndLandDevelopmentMemberus-gaap:CommercialRealEstatePortfolioSegmentMember2022-12-310000109380zions:ConstructionAndLandDevelopmentMemberzions:FinancialAsset30To89DaysPastDueMemberus-gaap:CommercialRealEstatePortfolioSegmentMember2022-12-310000109380zions:ConstructionAndLandDevelopmentMemberus-gaap:FinancingReceivablesEqualToGreaterThan90DaysPastDueMemberus-gaap:CommercialRealEstatePortfolioSegmentMember2022-12-310000109380zions:ConstructionAndLandDevelopmentMemberus-gaap:FinancialAssetPastDueMemberus-gaap:CommercialRealEstatePortfolioSegmentMember2022-12-310000109380zions:ConstructionAndLandDevelopmentMemberus-gaap:FinancingReceivables1To29DaysPastDueMemberus-gaap:CommercialRealEstatePortfolioSegmentMember2022-12-310000109380us-gaap:FinancialAssetNotPastDueMemberzions:TermMemberus-gaap:CommercialRealEstatePortfolioSegmentMember2022-12-310000109380zions:TermMemberzions:FinancialAsset30To89DaysPastDueMemberus-gaap:CommercialRealEstatePortfolioSegmentMember2022-12-310000109380us-gaap:FinancingReceivablesEqualToGreaterThan90DaysPastDueMemberzions:TermMemberus-gaap:CommercialRealEstatePortfolioSegmentMember2022-12-310000109380us-gaap:FinancialAssetPastDueMemberzions:TermMemberus-gaap:CommercialRealEstatePortfolioSegmentMember2022-12-310000109380zions:TermMemberus-gaap:FinancingReceivables1To29DaysPastDueMemberus-gaap:CommercialRealEstatePortfolioSegmentMember2022-12-310000109380us-gaap:FinancialAssetNotPastDueMemberus-gaap:CommercialRealEstatePortfolioSegmentMember2022-12-310000109380zions:FinancialAsset30To89DaysPastDueMemberus-gaap:CommercialRealEstatePortfolioSegmentMember2022-12-310000109380us-gaap:FinancingReceivablesEqualToGreaterThan90DaysPastDueMemberus-gaap:CommercialRealEstatePortfolioSegmentMember2022-12-310000109380us-gaap:FinancialAssetPastDueMemberus-gaap:CommercialRealEstatePortfolioSegmentMember2022-12-310000109380us-gaap:FinancingReceivables1To29DaysPastDueMemberus-gaap:CommercialRealEstatePortfolioSegmentMember2022-12-310000109380us-gaap:HomeEquityMemberus-gaap:FinancialAssetNotPastDueMemberus-gaap:ConsumerPortfolioSegmentMember2022-12-310000109380us-gaap:HomeEquityMemberus-gaap:ConsumerPortfolioSegmentMemberzions:FinancialAsset30To89DaysPastDueMember2022-12-310000109380us-gaap:HomeEquityMemberus-gaap:ConsumerPortfolioSegmentMemberus-gaap:FinancingReceivablesEqualToGreaterThan90DaysPastDueMember2022-12-310000109380us-gaap:HomeEquityMemberus-gaap:ConsumerPortfolioSegmentMemberus-gaap:FinancialAssetPastDueMember2022-12-310000109380us-gaap:HomeEquityMemberus-gaap:ConsumerPortfolioSegmentMemberus-gaap:FinancingReceivables1To29DaysPastDueMember2022-12-310000109380us-gaap:FinancialAssetNotPastDueMemberus-gaap:ConsumerPortfolioSegmentMemberzions:OneThroughFourFamilyResidentialMember2022-12-310000109380us-gaap:ConsumerPortfolioSegmentMemberzions:OneThroughFourFamilyResidentialMemberzions:FinancialAsset30To89DaysPastDueMember2022-12-310000109380us-gaap:ConsumerPortfolioSegmentMemberus-gaap:FinancingReceivablesEqualToGreaterThan90DaysPastDueMemberzions:OneThroughFourFamilyResidentialMember2022-12-310000109380us-gaap:ConsumerPortfolioSegmentMemberzions:OneThroughFourFamilyResidentialMemberus-gaap:FinancialAssetPastDueMember2022-12-310000109380us-gaap:ConsumerPortfolioSegmentMemberzions:OneThroughFourFamilyResidentialMemberus-gaap:FinancingReceivables1To29DaysPastDueMember2022-12-310000109380us-gaap:FinancialAssetNotPastDueMemberus-gaap:ConsumerPortfolioSegmentMemberzions:ConstructionAndOtherConsumerRealEstateMember2022-12-310000109380us-gaap:ConsumerPortfolioSegmentMemberzions:FinancialAsset30To89DaysPastDueMemberzions:ConstructionAndOtherConsumerRealEstateMember2022-12-310000109380us-gaap:ConsumerPortfolioSegmentMemberus-gaap:FinancingReceivablesEqualToGreaterThan90DaysPastDueMemberzions:ConstructionAndOtherConsumerRealEstateMember2022-12-310000109380us-gaap:ConsumerPortfolioSegmentMemberus-gaap:FinancialAssetPastDueMemberzions:ConstructionAndOtherConsumerRealEstateMember2022-12-310000109380us-gaap:ConsumerPortfolioSegmentMemberus-gaap:FinancingReceivables1To29DaysPastDueMemberzions:ConstructionAndOtherConsumerRealEstateMember2022-12-310000109380us-gaap:FinancialAssetNotPastDueMemberus-gaap:ConsumerPortfolioSegmentMemberzions:BankcardAndOtherRevolvingPlansMember2022-12-310000109380us-gaap:ConsumerPortfolioSegmentMemberzions:FinancialAsset30To89DaysPastDueMemberzions:BankcardAndOtherRevolvingPlansMember2022-12-310000109380us-gaap:ConsumerPortfolioSegmentMemberus-gaap:FinancingReceivablesEqualToGreaterThan90DaysPastDueMemberzions:BankcardAndOtherRevolvingPlansMember2022-12-310000109380us-gaap:ConsumerPortfolioSegmentMemberus-gaap:FinancialAssetPastDueMemberzions:BankcardAndOtherRevolvingPlansMember2022-12-310000109380us-gaap:ConsumerPortfolioSegmentMemberus-gaap:FinancingReceivables1To29DaysPastDueMemberzions:BankcardAndOtherRevolvingPlansMember2022-12-310000109380zions:OtherConsumerLoansMemberus-gaap:FinancialAssetNotPastDueMemberus-gaap:ConsumerPortfolioSegmentMember2022-12-310000109380zions:OtherConsumerLoansMemberus-gaap:ConsumerPortfolioSegmentMemberzions:FinancialAsset30To89DaysPastDueMember2022-12-310000109380zions:OtherConsumerLoansMemberus-gaap:ConsumerPortfolioSegmentMemberus-gaap:FinancingReceivablesEqualToGreaterThan90DaysPastDueMember2022-12-310000109380zions:OtherConsumerLoansMemberus-gaap:ConsumerPortfolioSegmentMemberus-gaap:FinancialAssetPastDueMember2022-12-310000109380zions:OtherConsumerLoansMemberus-gaap:ConsumerPortfolioSegmentMemberus-gaap:FinancingReceivables1To29DaysPastDueMember2022-12-310000109380us-gaap:FinancialAssetNotPastDueMemberus-gaap:ConsumerPortfolioSegmentMember2022-12-310000109380us-gaap:ConsumerPortfolioSegmentMemberzions:FinancialAsset30To89DaysPastDueMember2022-12-310000109380us-gaap:ConsumerPortfolioSegmentMemberus-gaap:FinancingReceivablesEqualToGreaterThan90DaysPastDueMember2022-12-310000109380us-gaap:ConsumerPortfolioSegmentMemberus-gaap:FinancialAssetPastDueMember2022-12-310000109380us-gaap:ConsumerPortfolioSegmentMemberus-gaap:FinancingReceivables1To29DaysPastDueMember2022-12-310000109380us-gaap:FinancialAssetNotPastDueMember2022-12-310000109380zions:FinancialAsset30To89DaysPastDueMember2022-12-310000109380us-gaap:FinancingReceivablesEqualToGreaterThan90DaysPastDueMember2022-12-310000109380us-gaap:FinancialAssetPastDueMember2022-12-310000109380us-gaap:FinancingReceivables1To29DaysPastDueMember2022-12-310000109380us-gaap:DoubtfulMember2023-12-310000109380us-gaap:DoubtfulMember2022-12-310000109380us-gaap:CommercialPortfolioSegmentMemberzions:CommercialAndIndustrialMemberus-gaap:PassMember2023-12-310000109380us-gaap:CommercialPortfolioSegmentMemberzions:CommercialAndIndustrialMemberus-gaap:SpecialMentionMember2023-12-310000109380us-gaap:CommercialPortfolioSegmentMemberzions:CommercialAndIndustrialMemberzions:AccruingSubstandardMember2023-12-310000109380zions:NonaccrualMemberus-gaap:CommercialPortfolioSegmentMemberzions:CommercialAndIndustrialMember2023-12-310000109380us-gaap:CommercialPortfolioSegmentMemberzions:CommercialAndIndustrialMember2023-01-012023-12-310000109380us-gaap:CommercialPortfolioSegmentMemberus-gaap:FinanceLeasesPortfolioSegmentMemberus-gaap:PassMember2023-12-310000109380us-gaap:CommercialPortfolioSegmentMemberus-gaap:SpecialMentionMemberus-gaap:FinanceLeasesPortfolioSegmentMember2023-12-310000109380us-gaap:CommercialPortfolioSegmentMemberzions:AccruingSubstandardMemberus-gaap:FinanceLeasesPortfolioSegmentMember2023-12-310000109380zions:NonaccrualMemberus-gaap:CommercialPortfolioSegmentMemberus-gaap:FinanceLeasesPortfolioSegmentMember2023-12-310000109380us-gaap:CommercialPortfolioSegmentMemberus-gaap:FinanceLeasesPortfolioSegmentMember2023-01-012023-12-310000109380us-gaap:CommercialPortfolioSegmentMemberzions:OwnerOccupiedMemberus-gaap:PassMember2023-12-310000109380us-gaap:CommercialPortfolioSegmentMemberzions:OwnerOccupiedMemberus-gaap:SpecialMentionMember2023-12-310000109380us-gaap:CommercialPortfolioSegmentMemberzions:OwnerOccupiedMemberzions:AccruingSubstandardMember2023-12-310000109380zions:NonaccrualMemberus-gaap:CommercialPortfolioSegmentMemberzions:OwnerOccupiedMember2023-12-310000109380us-gaap:CommercialPortfolioSegmentMemberzions:OwnerOccupiedMember2023-01-012023-12-310000109380us-gaap:CommercialPortfolioSegmentMemberzions:MunicipalMemberus-gaap:PassMember2023-12-310000109380us-gaap:CommercialPortfolioSegmentMemberzions:MunicipalMemberus-gaap:SpecialMentionMember2023-12-310000109380us-gaap:CommercialPortfolioSegmentMemberzions:MunicipalMemberzions:AccruingSubstandardMember2023-12-310000109380zions:NonaccrualMemberus-gaap:CommercialPortfolioSegmentMemberzions:MunicipalMember2023-12-310000109380zions:MunicipalMemberus-gaap:CommercialPortfolioSegmentMember2023-01-012023-12-310000109380zions:ConstructionAndLandDevelopmentMemberus-gaap:CommercialRealEstatePortfolioSegmentMemberus-gaap:PassMember2023-12-310000109380zions:ConstructionAndLandDevelopmentMemberus-gaap:SpecialMentionMemberus-gaap:CommercialRealEstatePortfolioSegmentMember2023-12-310000109380zions:ConstructionAndLandDevelopmentMemberzions:AccruingSubstandardMemberus-gaap:CommercialRealEstatePortfolioSegmentMember2023-12-310000109380zions:NonaccrualMemberzions:ConstructionAndLandDevelopmentMemberus-gaap:CommercialRealEstatePortfolioSegmentMember2023-12-310000109380zions:ConstructionAndLandDevelopmentMemberus-gaap:CommercialRealEstatePortfolioSegmentMember2023-01-012023-12-310000109380zions:TermMemberus-gaap:CommercialRealEstatePortfolioSegmentMemberus-gaap:PassMember2023-12-310000109380zions:TermMemberus-gaap:SpecialMentionMemberus-gaap:CommercialRealEstatePortfolioSegmentMember2023-12-310000109380zions:TermMemberzions:AccruingSubstandardMemberus-gaap:CommercialRealEstatePortfolioSegmentMember2023-12-310000109380zions:NonaccrualMemberzions:TermMemberus-gaap:CommercialRealEstatePortfolioSegmentMember2023-12-310000109380zions:TermMemberus-gaap:CommercialRealEstatePortfolioSegmentMember2023-01-012023-12-310000109380us-gaap:HomeEquityMemberus-gaap:ConsumerPortfolioSegmentMemberus-gaap:PassMember2023-12-310000109380us-gaap:HomeEquityMemberus-gaap:ConsumerPortfolioSegmentMemberus-gaap:SpecialMentionMember2023-12-310000109380us-gaap:HomeEquityMemberus-gaap:ConsumerPortfolioSegmentMemberzions:AccruingSubstandardMember2023-12-310000109380us-gaap:HomeEquityMemberzions:NonaccrualMemberus-gaap:ConsumerPortfolioSegmentMember2023-12-310000109380us-gaap:HomeEquityMemberus-gaap:ConsumerPortfolioSegmentMember2023-01-012023-12-310000109380us-gaap:ConsumerPortfolioSegmentMemberzions:OneThroughFourFamilyResidentialMemberus-gaap:PassMember2023-12-310000109380us-gaap:ConsumerPortfolioSegmentMemberzions:OneThroughFourFamilyResidentialMemberus-gaap:SpecialMentionMember2023-12-310000109380us-gaap:ConsumerPortfolioSegmentMemberzions:OneThroughFourFamilyResidentialMemberzions:AccruingSubstandardMember2023-12-310000109380zions:NonaccrualMemberus-gaap:ConsumerPortfolioSegmentMemberzions:OneThroughFourFamilyResidentialMember2023-12-310000109380us-gaap:ConsumerPortfolioSegmentMemberzions:OneThroughFourFamilyResidentialMember2023-01-012023-12-310000109380us-gaap:ConsumerPortfolioSegmentMemberzions:ConstructionAndOtherConsumerRealEstateMemberus-gaap:PassMember2023-12-310000109380us-gaap:ConsumerPortfolioSegmentMemberus-gaap:SpecialMentionMemberzions:ConstructionAndOtherConsumerRealEstateMember2023-12-310000109380us-gaap:ConsumerPortfolioSegmentMemberzions:AccruingSubstandardMemberzions:ConstructionAndOtherConsumerRealEstateMember2023-12-310000109380zions:NonaccrualMemberus-gaap:ConsumerPortfolioSegmentMemberzions:ConstructionAndOtherConsumerRealEstateMember2023-12-310000109380us-gaap:ConsumerPortfolioSegmentMemberzions:ConstructionAndOtherConsumerRealEstateMember2023-01-012023-12-310000109380us-gaap:ConsumerPortfolioSegmentMemberus-gaap:PassMemberzions:BankcardAndOtherRevolvingPlansMember2023-12-310000109380us-gaap:ConsumerPortfolioSegmentMemberus-gaap:SpecialMentionMemberzions:BankcardAndOtherRevolvingPlansMember2023-12-310000109380us-gaap:ConsumerPortfolioSegmentMemberzions:AccruingSubstandardMemberzions:BankcardAndOtherRevolvingPlansMember2023-12-310000109380zions:NonaccrualMemberus-gaap:ConsumerPortfolioSegmentMemberzions:BankcardAndOtherRevolvingPlansMember2023-12-310000109380us-gaap:ConsumerPortfolioSegmentMemberzions:BankcardAndOtherRevolvingPlansMember2023-01-012023-12-310000109380zions:OtherConsumerLoansMemberus-gaap:ConsumerPortfolioSegmentMemberus-gaap:PassMember2023-12-310000109380zions:OtherConsumerLoansMemberus-gaap:ConsumerPortfolioSegmentMemberus-gaap:SpecialMentionMember2023-12-310000109380zions:OtherConsumerLoansMemberus-gaap:ConsumerPortfolioSegmentMemberzions:AccruingSubstandardMember2023-12-310000109380zions:OtherConsumerLoansMemberzions:NonaccrualMemberus-gaap:ConsumerPortfolioSegmentMember2023-12-310000109380zions:OtherConsumerLoansMemberus-gaap:ConsumerPortfolioSegmentMember2023-01-012023-12-310000109380us-gaap:CommercialPortfolioSegmentMemberzions:CommercialAndIndustrialMemberus-gaap:PassMember2022-12-310000109380us-gaap:CommercialPortfolioSegmentMemberzions:CommercialAndIndustrialMemberus-gaap:SpecialMentionMember2022-12-310000109380us-gaap:CommercialPortfolioSegmentMemberzions:CommercialAndIndustrialMemberzions:AccruingSubstandardMember2022-12-310000109380zions:NonaccrualMemberus-gaap:CommercialPortfolioSegmentMemberzions:CommercialAndIndustrialMember2022-12-310000109380us-gaap:CommercialPortfolioSegmentMemberus-gaap:FinanceLeasesPortfolioSegmentMemberus-gaap:PassMember2022-12-310000109380us-gaap:CommercialPortfolioSegmentMemberus-gaap:SpecialMentionMemberus-gaap:FinanceLeasesPortfolioSegmentMember2022-12-310000109380us-gaap:CommercialPortfolioSegmentMemberzions:AccruingSubstandardMemberus-gaap:FinanceLeasesPortfolioSegmentMember2022-12-310000109380zions:NonaccrualMemberus-gaap:CommercialPortfolioSegmentMemberus-gaap:FinanceLeasesPortfolioSegmentMember2022-12-310000109380us-gaap:CommercialPortfolioSegmentMemberzions:OwnerOccupiedMemberus-gaap:PassMember2022-12-310000109380us-gaap:CommercialPortfolioSegmentMemberzions:OwnerOccupiedMemberus-gaap:SpecialMentionMember2022-12-310000109380us-gaap:CommercialPortfolioSegmentMemberzions:OwnerOccupiedMemberzions:AccruingSubstandardMember2022-12-310000109380zions:NonaccrualMemberus-gaap:CommercialPortfolioSegmentMemberzions:OwnerOccupiedMember2022-12-310000109380us-gaap:CommercialPortfolioSegmentMemberzions:MunicipalMemberus-gaap:PassMember2022-12-310000109380us-gaap:CommercialPortfolioSegmentMemberzions:MunicipalMemberus-gaap:SpecialMentionMember2022-12-310000109380us-gaap:CommercialPortfolioSegmentMemberzions:MunicipalMemberzions:AccruingSubstandardMember2022-12-310000109380zions:NonaccrualMemberus-gaap:CommercialPortfolioSegmentMemberzions:MunicipalMember2022-12-310000109380zions:ConstructionAndLandDevelopmentMemberus-gaap:CommercialRealEstatePortfolioSegmentMemberus-gaap:PassMember2022-12-310000109380zions:ConstructionAndLandDevelopmentMemberus-gaap:SpecialMentionMemberus-gaap:CommercialRealEstatePortfolioSegmentMember2022-12-310000109380zions:ConstructionAndLandDevelopmentMemberzions:AccruingSubstandardMemberus-gaap:CommercialRealEstatePortfolioSegmentMember2022-12-310000109380zions:NonaccrualMemberzions:ConstructionAndLandDevelopmentMemberus-gaap:CommercialRealEstatePortfolioSegmentMember2022-12-310000109380zions:TermMemberus-gaap:CommercialRealEstatePortfolioSegmentMemberus-gaap:PassMember2022-12-310000109380zions:TermMemberus-gaap:SpecialMentionMemberus-gaap:CommercialRealEstatePortfolioSegmentMember2022-12-310000109380zions:TermMemberzions:AccruingSubstandardMemberus-gaap:CommercialRealEstatePortfolioSegmentMember2022-12-310000109380zions:NonaccrualMemberzions:TermMemberus-gaap:CommercialRealEstatePortfolioSegmentMember2022-12-310000109380us-gaap:HomeEquityMemberus-gaap:ConsumerPortfolioSegmentMemberus-gaap:PassMember2022-12-310000109380us-gaap:HomeEquityMemberus-gaap:ConsumerPortfolioSegmentMemberus-gaap:SpecialMentionMember2022-12-310000109380us-gaap:HomeEquityMemberus-gaap:ConsumerPortfolioSegmentMemberzions:AccruingSubstandardMember2022-12-310000109380us-gaap:HomeEquityMemberzions:NonaccrualMemberus-gaap:ConsumerPortfolioSegmentMember2022-12-310000109380us-gaap:ConsumerPortfolioSegmentMemberzions:OneThroughFourFamilyResidentialMemberus-gaap:PassMember2022-12-310000109380us-gaap:ConsumerPortfolioSegmentMemberzions:OneThroughFourFamilyResidentialMemberus-gaap:SpecialMentionMember2022-12-310000109380us-gaap:ConsumerPortfolioSegmentMemberzions:OneThroughFourFamilyResidentialMemberzions:AccruingSubstandardMember2022-12-310000109380zions:NonaccrualMemberus-gaap:ConsumerPortfolioSegmentMemberzions:OneThroughFourFamilyResidentialMember2022-12-310000109380us-gaap:ConsumerPortfolioSegmentMemberzions:ConstructionAndOtherConsumerRealEstateMemberus-gaap:PassMember2022-12-310000109380us-gaap:ConsumerPortfolioSegmentMemberus-gaap:SpecialMentionMemberzions:ConstructionAndOtherConsumerRealEstateMember2022-12-310000109380us-gaap:ConsumerPortfolioSegmentMemberzions:AccruingSubstandardMemberzions:ConstructionAndOtherConsumerRealEstateMember2022-12-310000109380zions:NonaccrualMemberus-gaap:ConsumerPortfolioSegmentMemberzions:ConstructionAndOtherConsumerRealEstateMember2022-12-310000109380us-gaap:ConsumerPortfolioSegmentMemberus-gaap:PassMemberzions:BankcardAndOtherRevolvingPlansMember2022-12-310000109380us-gaap:ConsumerPortfolioSegmentMemberus-gaap:SpecialMentionMemberzions:BankcardAndOtherRevolvingPlansMember2022-12-310000109380us-gaap:ConsumerPortfolioSegmentMemberzions:AccruingSubstandardMemberzions:BankcardAndOtherRevolvingPlansMember2022-12-310000109380zions:NonaccrualMemberus-gaap:ConsumerPortfolioSegmentMemberzions:BankcardAndOtherRevolvingPlansMember2022-12-310000109380zions:OtherConsumerLoansMemberus-gaap:ConsumerPortfolioSegmentMemberus-gaap:PassMember2022-12-310000109380zions:OtherConsumerLoansMemberus-gaap:ConsumerPortfolioSegmentMemberus-gaap:SpecialMentionMember2022-12-310000109380zions:OtherConsumerLoansMemberus-gaap:ConsumerPortfolioSegmentMemberzions:AccruingSubstandardMember2022-12-310000109380zions:OtherConsumerLoansMemberzions:NonaccrualMemberus-gaap:ConsumerPortfolioSegmentMember2022-12-310000109380us-gaap:PaymentDeferralMemberzions:FinancingReceivableNonaccruingMember2023-01-012023-12-310000109380us-gaap:CommercialPortfolioSegmentMemberus-gaap:ContractualInterestRateReductionMemberzions:CommercialAndIndustrialMember2023-01-012023-12-310000109380us-gaap:CommercialPortfolioSegmentMemberzions:CommercialAndIndustrialMemberus-gaap:ExtendedMaturityMember2023-01-012023-12-310000109380us-gaap:PrincipalForgivenessMemberus-gaap:CommercialPortfolioSegmentMemberzions:CommercialAndIndustrialMember2023-01-012023-12-310000109380us-gaap:CommercialPortfolioSegmentMemberzions:CommercialAndIndustrialMemberus-gaap:PaymentDeferralMember2023-01-012023-12-310000109380us-gaap:CommercialPortfolioSegmentMemberzions:CommercialAndIndustrialMemberzions:MultipleModificationTypesMember2023-01-012023-12-310000109380us-gaap:CommercialPortfolioSegmentMemberus-gaap:ContractualInterestRateReductionMemberzions:OwnerOccupiedMember2023-01-012023-12-310000109380us-gaap:CommercialPortfolioSegmentMemberzions:OwnerOccupiedMemberus-gaap:ExtendedMaturityMember2023-01-012023-12-310000109380us-gaap:PrincipalForgivenessMemberus-gaap:CommercialPortfolioSegmentMemberzions:OwnerOccupiedMember2023-01-012023-12-310000109380us-gaap:CommercialPortfolioSegmentMemberus-gaap:PaymentDeferralMemberzions:OwnerOccupiedMember2023-01-012023-12-310000109380us-gaap:CommercialPortfolioSegmentMemberzions:OwnerOccupiedMemberzions:MultipleModificationTypesMember2023-01-012023-12-310000109380us-gaap:CommercialPortfolioSegmentMemberzions:MunicipalMemberus-gaap:ContractualInterestRateReductionMember2023-01-012023-12-310000109380us-gaap:CommercialPortfolioSegmentMemberzions:MunicipalMemberus-gaap:ExtendedMaturityMember2023-01-012023-12-310000109380us-gaap:PrincipalForgivenessMemberus-gaap:CommercialPortfolioSegmentMemberzions:MunicipalMember2023-01-012023-12-310000109380us-gaap:CommercialPortfolioSegmentMemberzions:MunicipalMemberus-gaap:PaymentDeferralMember2023-01-012023-12-310000109380us-gaap:CommercialPortfolioSegmentMemberzions:MunicipalMemberzions:MultipleModificationTypesMember2023-01-012023-12-310000109380us-gaap:CommercialPortfolioSegmentMemberus-gaap:ContractualInterestRateReductionMember2023-01-012023-12-310000109380us-gaap:CommercialPortfolioSegmentMemberus-gaap:ExtendedMaturityMember2023-01-012023-12-310000109380us-gaap:PrincipalForgivenessMemberus-gaap:CommercialPortfolioSegmentMember2023-01-012023-12-310000109380us-gaap:CommercialPortfolioSegmentMemberus-gaap:PaymentDeferralMember2023-01-012023-12-310000109380us-gaap:CommercialPortfolioSegmentMemberzions:MultipleModificationTypesMember2023-01-012023-12-310000109380zions:ConstructionAndLandDevelopmentMemberus-gaap:ContractualInterestRateReductionMemberus-gaap:CommercialRealEstatePortfolioSegmentMember2023-01-012023-12-310000109380zions:ConstructionAndLandDevelopmentMemberus-gaap:ExtendedMaturityMemberus-gaap:CommercialRealEstatePortfolioSegmentMember2023-01-012023-12-310000109380zions:ConstructionAndLandDevelopmentMemberus-gaap:PrincipalForgivenessMemberus-gaap:CommercialRealEstatePortfolioSegmentMember2023-01-012023-12-310000109380zions:ConstructionAndLandDevelopmentMemberus-gaap:PaymentDeferralMemberus-gaap:CommercialRealEstatePortfolioSegmentMember2023-01-012023-12-310000109380zions:ConstructionAndLandDevelopmentMemberus-gaap:CommercialRealEstatePortfolioSegmentMemberzions:MultipleModificationTypesMember2023-01-012023-12-310000109380us-gaap:ContractualInterestRateReductionMemberzions:TermMemberus-gaap:CommercialRealEstatePortfolioSegmentMember2023-01-012023-12-310000109380zions:TermMemberus-gaap:ExtendedMaturityMemberus-gaap:CommercialRealEstatePortfolioSegmentMember2023-01-012023-12-310000109380us-gaap:PrincipalForgivenessMemberzions:TermMemberus-gaap:CommercialRealEstatePortfolioSegmentMember2023-01-012023-12-310000109380us-gaap:PaymentDeferralMemberzions:TermMemberus-gaap:CommercialRealEstatePortfolioSegmentMember2023-01-012023-12-310000109380zions:TermMemberus-gaap:CommercialRealEstatePortfolioSegmentMemberzions:MultipleModificationTypesMember2023-01-012023-12-310000109380us-gaap:ContractualInterestRateReductionMemberus-gaap:CommercialRealEstatePortfolioSegmentMember2023-01-012023-12-310000109380us-gaap:ExtendedMaturityMemberus-gaap:CommercialRealEstatePortfolioSegmentMember2023-01-012023-12-310000109380us-gaap:PrincipalForgivenessMemberus-gaap:CommercialRealEstatePortfolioSegmentMember2023-01-012023-12-310000109380us-gaap:PaymentDeferralMemberus-gaap:CommercialRealEstatePortfolioSegmentMember2023-01-012023-12-310000109380us-gaap:CommercialRealEstatePortfolioSegmentMemberzions:MultipleModificationTypesMember2023-01-012023-12-310000109380us-gaap:ConsumerPortfolioSegmentMemberus-gaap:ContractualInterestRateReductionMemberzions:OneThroughFourFamilyResidentialMember2023-01-012023-12-310000109380us-gaap:ConsumerPortfolioSegmentMemberzions:OneThroughFourFamilyResidentialMemberus-gaap:ExtendedMaturityMember2023-01-012023-12-310000109380us-gaap:PrincipalForgivenessMemberus-gaap:ConsumerPortfolioSegmentMemberzions:OneThroughFourFamilyResidentialMember2023-01-012023-12-310000109380us-gaap:ConsumerPortfolioSegmentMemberzions:OneThroughFourFamilyResidentialMemberus-gaap:PaymentDeferralMember2023-01-012023-12-310000109380us-gaap:ConsumerPortfolioSegmentMemberzions:OneThroughFourFamilyResidentialMemberzions:MultipleModificationTypesMember2023-01-012023-12-310000109380us-gaap:ConsumerPortfolioSegmentMemberus-gaap:ContractualInterestRateReductionMemberzions:BankcardAndOtherRevolvingPlansMember2023-01-012023-12-310000109380us-gaap:ConsumerPortfolioSegmentMemberus-gaap:ExtendedMaturityMemberzions:BankcardAndOtherRevolvingPlansMember2023-01-012023-12-310000109380us-gaap:PrincipalForgivenessMemberus-gaap:ConsumerPortfolioSegmentMemberzions:BankcardAndOtherRevolvingPlansMember2023-01-012023-12-310000109380us-gaap:ConsumerPortfolioSegmentMemberus-gaap:PaymentDeferralMemberzions:BankcardAndOtherRevolvingPlansMember2023-01-012023-12-310000109380us-gaap:ConsumerPortfolioSegmentMemberzions:BankcardAndOtherRevolvingPlansMemberzions:MultipleModificationTypesMember2023-01-012023-12-310000109380us-gaap:ConsumerPortfolioSegmentMemberus-gaap:ContractualInterestRateReductionMember2023-01-012023-12-310000109380us-gaap:ConsumerPortfolioSegmentMemberus-gaap:ExtendedMaturityMember2023-01-012023-12-310000109380us-gaap:PrincipalForgivenessMemberus-gaap:ConsumerPortfolioSegmentMember2023-01-012023-12-310000109380us-gaap:ConsumerPortfolioSegmentMemberus-gaap:PaymentDeferralMember2023-01-012023-12-310000109380us-gaap:ConsumerPortfolioSegmentMemberzions:MultipleModificationTypesMember2023-01-012023-12-310000109380us-gaap:ContractualInterestRateReductionMember2023-01-012023-12-310000109380us-gaap:ExtendedMaturityMember2023-01-012023-12-310000109380us-gaap:PrincipalForgivenessMember2023-01-012023-12-310000109380us-gaap:PaymentDeferralMember2023-01-012023-12-310000109380zions:MultipleModificationTypesMember2023-01-012023-12-31utr:M0000109380us-gaap:CommercialPortfolioSegmentMemberzions:InterestRateBelowMarketMemberzions:CommercialAndIndustrialMemberzions:FinancingReceivableAccruingMember2022-01-012022-12-310000109380zions:MaturityOrTermExtensionMemberus-gaap:CommercialPortfolioSegmentMemberzions:CommercialAndIndustrialMemberzions:FinancingReceivableAccruingMember2022-01-012022-12-310000109380us-gaap:PrincipalForgivenessMemberus-gaap:CommercialPortfolioSegmentMemberzions:CommercialAndIndustrialMemberzions:FinancingReceivableAccruingMember2022-01-012022-12-310000109380us-gaap:CommercialPortfolioSegmentMemberzions:CommercialAndIndustrialMemberus-gaap:PaymentDeferralMemberzions:FinancingReceivableAccruingMember2022-01-012022-12-310000109380us-gaap:CommercialPortfolioSegmentMemberzions:CommercialAndIndustrialMemberzions:OtherRecordedInvestmentResultingFromFollowingModificationMemberzions:FinancingReceivableAccruingMember2022-01-012022-12-310000109380us-gaap:CommercialPortfolioSegmentMemberzions:CommercialAndIndustrialMemberzions:FinancingReceivableAccruingMemberzions:MultipleModificationTypesMember2022-01-012022-12-310000109380us-gaap:CommercialPortfolioSegmentMemberzions:CommercialAndIndustrialMemberzions:FinancingReceivableAccruingMember2022-01-012022-12-310000109380us-gaap:CommercialPortfolioSegmentMemberzions:InterestRateBelowMarketMemberzions:OwnerOccupiedMemberzions:FinancingReceivableAccruingMember2022-01-012022-12-310000109380zions:MaturityOrTermExtensionMemberus-gaap:CommercialPortfolioSegmentMemberzions:OwnerOccupiedMemberzions:FinancingReceivableAccruingMember2022-01-012022-12-310000109380us-gaap:PrincipalForgivenessMemberus-gaap:CommercialPortfolioSegmentMemberzions:OwnerOccupiedMemberzions:FinancingReceivableAccruingMember2022-01-012022-12-310000109380us-gaap:CommercialPortfolioSegmentMemberus-gaap:PaymentDeferralMemberzions:OwnerOccupiedMemberzions:FinancingReceivableAccruingMember2022-01-012022-12-310000109380us-gaap:CommercialPortfolioSegmentMemberzions:OwnerOccupiedMemberzions:OtherRecordedInvestmentResultingFromFollowingModificationMemberzions:FinancingReceivableAccruingMember2022-01-012022-12-310000109380us-gaap:CommercialPortfolioSegmentMemberzions:OwnerOccupiedMemberzions:FinancingReceivableAccruingMemberzions:MultipleModificationTypesMember2022-01-012022-12-310000109380us-gaap:CommercialPortfolioSegmentMemberzions:OwnerOccupiedMemberzions:FinancingReceivableAccruingMember2022-01-012022-12-310000109380us-gaap:CommercialPortfolioSegmentMemberzions:InterestRateBelowMarketMemberzions:FinancingReceivableAccruingMember2022-01-012022-12-310000109380zions:MaturityOrTermExtensionMemberus-gaap:CommercialPortfolioSegmentMemberzions:FinancingReceivableAccruingMember2022-01-012022-12-310000109380us-gaap:PrincipalForgivenessMemberus-gaap:CommercialPortfolioSegmentMemberzions:FinancingReceivableAccruingMember2022-01-012022-12-310000109380us-gaap:CommercialPortfolioSegmentMemberus-gaap:PaymentDeferralMemberzions:FinancingReceivableAccruingMember2022-01-012022-12-310000109380us-gaap:CommercialPortfolioSegmentMemberzions:OtherRecordedInvestmentResultingFromFollowingModificationMemberzions:FinancingReceivableAccruingMember2022-01-012022-12-310000109380us-gaap:CommercialPortfolioSegmentMemberzions:FinancingReceivableAccruingMemberzions:MultipleModificationTypesMember2022-01-012022-12-310000109380us-gaap:CommercialPortfolioSegmentMemberzions:FinancingReceivableAccruingMember2022-01-012022-12-310000109380zions:ConstructionAndLandDevelopmentMemberzions:InterestRateBelowMarketMemberus-gaap:CommercialRealEstatePortfolioSegmentMemberzions:FinancingReceivableAccruingMember2022-01-012022-12-310000109380zions:ConstructionAndLandDevelopmentMemberzions:MaturityOrTermExtensionMemberus-gaap:CommercialRealEstatePortfolioSegmentMemberzions:FinancingReceivableAccruingMember2022-01-012022-12-310000109380zions:ConstructionAndLandDevelopmentMemberus-gaap:PrincipalForgivenessMemberus-gaap:CommercialRealEstatePortfolioSegmentMemberzions:FinancingReceivableAccruingMember2022-01-012022-12-310000109380zions:ConstructionAndLandDevelopmentMemberus-gaap:PaymentDeferralMemberus-gaap:CommercialRealEstatePortfolioSegmentMemberzions:FinancingReceivableAccruingMember2022-01-012022-12-310000109380zions:ConstructionAndLandDevelopmentMemberzions:OtherRecordedInvestmentResultingFromFollowingModificationMemberus-gaap:CommercialRealEstatePortfolioSegmentMemberzions:FinancingReceivableAccruingMember2022-01-012022-12-310000109380zions:ConstructionAndLandDevelopmentMemberus-gaap:CommercialRealEstatePortfolioSegmentMemberzions:FinancingReceivableAccruingMemberzions:MultipleModificationTypesMember2022-01-012022-12-310000109380zions:ConstructionAndLandDevelopmentMemberus-gaap:CommercialRealEstatePortfolioSegmentMemberzions:FinancingReceivableAccruingMember2022-01-012022-12-310000109380zions:InterestRateBelowMarketMemberzions:TermMemberus-gaap:CommercialRealEstatePortfolioSegmentMemberzions:FinancingReceivableAccruingMember2022-01-012022-12-310000109380zions:MaturityOrTermExtensionMemberzions:TermMemberus-gaap:CommercialRealEstatePortfolioSegmentMemberzions:FinancingReceivableAccruingMember2022-01-012022-12-310000109380us-gaap:PrincipalForgivenessMemberzions:TermMemberus-gaap:CommercialRealEstatePortfolioSegmentMemberzions:FinancingReceivableAccruingMember2022-01-012022-12-310000109380us-gaap:PaymentDeferralMemberzions:TermMemberus-gaap:CommercialRealEstatePortfolioSegmentMemberzions:FinancingReceivableAccruingMember2022-01-012022-12-310000109380zions:OtherRecordedInvestmentResultingFromFollowingModificationMemberzions:TermMemberus-gaap:CommercialRealEstatePortfolioSegmentMemberzions:FinancingReceivableAccruingMember2022-01-012022-12-310000109380zions:TermMemberus-gaap:CommercialRealEstatePortfolioSegmentMemberzions:FinancingReceivableAccruingMemberzions:MultipleModificationTypesMember2022-01-012022-12-310000109380zions:TermMemberus-gaap:CommercialRealEstatePortfolioSegmentMemberzions:FinancingReceivableAccruingMember2022-01-012022-12-310000109380zions:InterestRateBelowMarketMemberus-gaap:CommercialRealEstatePortfolioSegmentMemberzions:FinancingReceivableAccruingMember2022-01-012022-12-310000109380zions:MaturityOrTermExtensionMemberus-gaap:CommercialRealEstatePortfolioSegmentMemberzions:FinancingReceivableAccruingMember2022-01-012022-12-310000109380us-gaap:PrincipalForgivenessMemberus-gaap:CommercialRealEstatePortfolioSegmentMemberzions:FinancingReceivableAccruingMember2022-01-012022-12-310000109380us-gaap:PaymentDeferralMemberus-gaap:CommercialRealEstatePortfolioSegmentMemberzions:FinancingReceivableAccruingMember2022-01-012022-12-310000109380zions:OtherRecordedInvestmentResultingFromFollowingModificationMemberus-gaap:CommercialRealEstatePortfolioSegmentMemberzions:FinancingReceivableAccruingMember2022-01-012022-12-310000109380us-gaap:CommercialRealEstatePortfolioSegmentMemberzions:FinancingReceivableAccruingMemberzions:MultipleModificationTypesMember2022-01-012022-12-310000109380us-gaap:CommercialRealEstatePortfolioSegmentMemberzions:FinancingReceivableAccruingMember2022-01-012022-12-310000109380us-gaap:HomeEquityMemberus-gaap:ConsumerPortfolioSegmentMemberzions:InterestRateBelowMarketMemberzions:FinancingReceivableAccruingMember2022-01-012022-12-310000109380us-gaap:HomeEquityMemberzions:MaturityOrTermExtensionMemberus-gaap:ConsumerPortfolioSegmentMemberzions:FinancingReceivableAccruingMember2022-01-012022-12-310000109380us-gaap:HomeEquityMemberus-gaap:PrincipalForgivenessMemberus-gaap:ConsumerPortfolioSegmentMemberzions:FinancingReceivableAccruingMember2022-01-012022-12-310000109380us-gaap:HomeEquityMemberus-gaap:ConsumerPortfolioSegmentMemberus-gaap:PaymentDeferralMemberzions:FinancingReceivableAccruingMember2022-01-012022-12-310000109380us-gaap:HomeEquityMemberus-gaap:ConsumerPortfolioSegmentMemberzions:OtherRecordedInvestmentResultingFromFollowingModificationMemberzions:FinancingReceivableAccruingMember2022-01-012022-12-310000109380us-gaap:HomeEquityMemberus-gaap:ConsumerPortfolioSegmentMemberzions:FinancingReceivableAccruingMemberzions:MultipleModificationTypesMember2022-01-012022-12-310000109380us-gaap:HomeEquityMemberus-gaap:ConsumerPortfolioSegmentMemberzions:FinancingReceivableAccruingMember2022-01-012022-12-310000109380us-gaap:ConsumerPortfolioSegmentMemberzions:InterestRateBelowMarketMemberzions:OneThroughFourFamilyResidentialMemberzions:FinancingReceivableAccruingMember2022-01-012022-12-310000109380zions:MaturityOrTermExtensionMemberus-gaap:ConsumerPortfolioSegmentMemberzions:OneThroughFourFamilyResidentialMemberzions:FinancingReceivableAccruingMember2022-01-012022-12-310000109380us-gaap:PrincipalForgivenessMemberus-gaap:ConsumerPortfolioSegmentMemberzions:OneThroughFourFamilyResidentialMemberzions:FinancingReceivableAccruingMember2022-01-012022-12-310000109380us-gaap:ConsumerPortfolioSegmentMemberzions:OneThroughFourFamilyResidentialMemberus-gaap:PaymentDeferralMemberzions:FinancingReceivableAccruingMember2022-01-012022-12-310000109380us-gaap:ConsumerPortfolioSegmentMemberzions:OneThroughFourFamilyResidentialMemberzions:OtherRecordedInvestmentResultingFromFollowingModificationMemberzions:FinancingReceivableAccruingMember2022-01-012022-12-310000109380us-gaap:ConsumerPortfolioSegmentMemberzions:OneThroughFourFamilyResidentialMemberzions:FinancingReceivableAccruingMemberzions:MultipleModificationTypesMember2022-01-012022-12-310000109380us-gaap:ConsumerPortfolioSegmentMemberzions:OneThroughFourFamilyResidentialMemberzions:FinancingReceivableAccruingMember2022-01-012022-12-310000109380us-gaap:ConsumerPortfolioSegmentMemberzions:InterestRateBelowMarketMemberzions:FinancingReceivableAccruingMember2022-01-012022-12-310000109380zions:MaturityOrTermExtensionMemberus-gaap:ConsumerPortfolioSegmentMemberzions:FinancingReceivableAccruingMember2022-01-012022-12-310000109380us-gaap:PrincipalForgivenessMemberus-gaap:ConsumerPortfolioSegmentMemberzions:FinancingReceivableAccruingMember2022-01-012022-12-310000109380us-gaap:ConsumerPortfolioSegmentMemberus-gaap:PaymentDeferralMemberzions:FinancingReceivableAccruingMember2022-01-012022-12-310000109380us-gaap:ConsumerPortfolioSegmentMemberzions:OtherRecordedInvestmentResultingFromFollowingModificationMemberzions:FinancingReceivableAccruingMember2022-01-012022-12-310000109380us-gaap:ConsumerPortfolioSegmentMemberzions:FinancingReceivableAccruingMemberzions:MultipleModificationTypesMember2022-01-012022-12-310000109380us-gaap:ConsumerPortfolioSegmentMemberzions:FinancingReceivableAccruingMember2022-01-012022-12-310000109380zions:InterestRateBelowMarketMemberzions:FinancingReceivableAccruingMember2022-01-012022-12-310000109380zions:MaturityOrTermExtensionMemberzions:FinancingReceivableAccruingMember2022-01-012022-12-310000109380us-gaap:PrincipalForgivenessMemberzions:FinancingReceivableAccruingMember2022-01-012022-12-310000109380us-gaap:PaymentDeferralMemberzions:FinancingReceivableAccruingMember2022-01-012022-12-310000109380zions:OtherRecordedInvestmentResultingFromFollowingModificationMemberzions:FinancingReceivableAccruingMember2022-01-012022-12-310000109380zions:FinancingReceivableAccruingMemberzions:MultipleModificationTypesMember2022-01-012022-12-310000109380zions:FinancingReceivableAccruingMember2022-01-012022-12-310000109380us-gaap:CommercialPortfolioSegmentMemberzions:InterestRateBelowMarketMemberzions:CommercialAndIndustrialMemberzions:FinancingReceivableNonaccruingMember2022-01-012022-12-310000109380zions:MaturityOrTermExtensionMemberus-gaap:CommercialPortfolioSegmentMemberzions:CommercialAndIndustrialMemberzions:FinancingReceivableNonaccruingMember2022-01-012022-12-310000109380us-gaap:PrincipalForgivenessMemberus-gaap:CommercialPortfolioSegmentMemberzions:CommercialAndIndustrialMemberzions:FinancingReceivableNonaccruingMember2022-01-012022-12-310000109380us-gaap:CommercialPortfolioSegmentMemberzions:CommercialAndIndustrialMemberus-gaap:PaymentDeferralMemberzions:FinancingReceivableNonaccruingMember2022-01-012022-12-310000109380us-gaap:CommercialPortfolioSegmentMemberzions:CommercialAndIndustrialMemberzions:OtherRecordedInvestmentResultingFromFollowingModificationMemberzions:FinancingReceivableNonaccruingMember2022-01-012022-12-310000109380us-gaap:CommercialPortfolioSegmentMemberzions:CommercialAndIndustrialMemberzions:FinancingReceivableNonaccruingMemberzions:MultipleModificationTypesMember2022-01-012022-12-310000109380us-gaap:CommercialPortfolioSegmentMemberzions:CommercialAndIndustrialMemberzions:FinancingReceivableNonaccruingMember2022-01-012022-12-310000109380us-gaap:CommercialPortfolioSegmentMemberzions:InterestRateBelowMarketMemberzions:OwnerOccupiedMemberzions:FinancingReceivableNonaccruingMember2022-01-012022-12-310000109380zions:MaturityOrTermExtensionMemberus-gaap:CommercialPortfolioSegmentMemberzions:OwnerOccupiedMemberzions:FinancingReceivableNonaccruingMember2022-01-012022-12-310000109380us-gaap:PrincipalForgivenessMemberus-gaap:CommercialPortfolioSegmentMemberzions:OwnerOccupiedMemberzions:FinancingReceivableNonaccruingMember2022-01-012022-12-310000109380us-gaap:CommercialPortfolioSegmentMemberus-gaap:PaymentDeferralMemberzions:OwnerOccupiedMemberzions:FinancingReceivableNonaccruingMember2022-01-012022-12-310000109380us-gaap:CommercialPortfolioSegmentMemberzions:OwnerOccupiedMemberzions:OtherRecordedInvestmentResultingFromFollowingModificationMemberzions:FinancingReceivableNonaccruingMember2022-01-012022-12-310000109380us-gaap:CommercialPortfolioSegmentMemberzions:OwnerOccupiedMemberzions:FinancingReceivableNonaccruingMemberzions:MultipleModificationTypesMember2022-01-012022-12-310000109380us-gaap:CommercialPortfolioSegmentMemberzions:OwnerOccupiedMemberzions:FinancingReceivableNonaccruingMember2022-01-012022-12-310000109380us-gaap:CommercialPortfolioSegmentMemberzions:InterestRateBelowMarketMemberzions:FinancingReceivableNonaccruingMember2022-01-012022-12-310000109380zions:MaturityOrTermExtensionMemberus-gaap:CommercialPortfolioSegmentMemberzions:FinancingReceivableNonaccruingMember2022-01-012022-12-310000109380us-gaap:PrincipalForgivenessMemberus-gaap:CommercialPortfolioSegmentMemberzions:FinancingReceivableNonaccruingMember2022-01-012022-12-310000109380us-gaap:CommercialPortfolioSegmentMemberus-gaap:PaymentDeferralMemberzions:FinancingReceivableNonaccruingMember2022-01-012022-12-310000109380us-gaap:CommercialPortfolioSegmentMemberzions:OtherRecordedInvestmentResultingFromFollowingModificationMemberzions:FinancingReceivableNonaccruingMember2022-01-012022-12-310000109380us-gaap:CommercialPortfolioSegmentMemberzions:FinancingReceivableNonaccruingMemberzions:MultipleModificationTypesMember2022-01-012022-12-310000109380us-gaap:CommercialPortfolioSegmentMemberzions:FinancingReceivableNonaccruingMember2022-01-012022-12-310000109380zions:InterestRateBelowMarketMemberzions:TermMemberus-gaap:CommercialRealEstatePortfolioSegmentMemberzions:FinancingReceivableNonaccruingMember2022-01-012022-12-310000109380zions:MaturityOrTermExtensionMemberzions:TermMemberus-gaap:CommercialRealEstatePortfolioSegmentMemberzions:FinancingReceivableNonaccruingMember2022-01-012022-12-310000109380us-gaap:PrincipalForgivenessMemberzions:TermMemberus-gaap:CommercialRealEstatePortfolioSegmentMemberzions:FinancingReceivableNonaccruingMember2022-01-012022-12-310000109380us-gaap:PaymentDeferralMemberzions:TermMemberus-gaap:CommercialRealEstatePortfolioSegmentMemberzions:FinancingReceivableNonaccruingMember2022-01-012022-12-310000109380zions:OtherRecordedInvestmentResultingFromFollowingModificationMemberzions:TermMemberus-gaap:CommercialRealEstatePortfolioSegmentMemberzions:FinancingReceivableNonaccruingMember2022-01-012022-12-310000109380zions:TermMemberus-gaap:CommercialRealEstatePortfolioSegmentMemberzions:FinancingReceivableNonaccruingMemberzions:MultipleModificationTypesMember2022-01-012022-12-310000109380zions:TermMemberus-gaap:CommercialRealEstatePortfolioSegmentMemberzions:FinancingReceivableNonaccruingMember2022-01-012022-12-310000109380zions:InterestRateBelowMarketMemberus-gaap:CommercialRealEstatePortfolioSegmentMemberzions:FinancingReceivableNonaccruingMember2022-01-012022-12-310000109380zions:MaturityOrTermExtensionMemberus-gaap:CommercialRealEstatePortfolioSegmentMemberzions:FinancingReceivableNonaccruingMember2022-01-012022-12-310000109380us-gaap:PrincipalForgivenessMemberus-gaap:CommercialRealEstatePortfolioSegmentMemberzions:FinancingReceivableNonaccruingMember2022-01-012022-12-310000109380us-gaap:PaymentDeferralMemberus-gaap:CommercialRealEstatePortfolioSegmentMemberzions:FinancingReceivableNonaccruingMember2022-01-012022-12-310000109380zions:OtherRecordedInvestmentResultingFromFollowingModificationMemberus-gaap:CommercialRealEstatePortfolioSegmentMemberzions:FinancingReceivableNonaccruingMember2022-01-012022-12-310000109380us-gaap:CommercialRealEstatePortfolioSegmentMemberzions:FinancingReceivableNonaccruingMemberzions:MultipleModificationTypesMember2022-01-012022-12-310000109380us-gaap:CommercialRealEstatePortfolioSegmentMemberzions:FinancingReceivableNonaccruingMember2022-01-012022-12-310000109380us-gaap:HomeEquityMemberus-gaap:ConsumerPortfolioSegmentMemberzions:InterestRateBelowMarketMemberzions:FinancingReceivableNonaccruingMember2022-01-012022-12-310000109380us-gaap:HomeEquityMemberzions:MaturityOrTermExtensionMemberus-gaap:ConsumerPortfolioSegmentMemberzions:FinancingReceivableNonaccruingMember2022-01-012022-12-310000109380us-gaap:HomeEquityMemberus-gaap:PrincipalForgivenessMemberus-gaap:ConsumerPortfolioSegmentMemberzions:FinancingReceivableNonaccruingMember2022-01-012022-12-310000109380us-gaap:HomeEquityMemberus-gaap:ConsumerPortfolioSegmentMemberus-gaap:PaymentDeferralMemberzions:FinancingReceivableNonaccruingMember2022-01-012022-12-310000109380us-gaap:HomeEquityMemberus-gaap:ConsumerPortfolioSegmentMemberzions:OtherRecordedInvestmentResultingFromFollowingModificationMemberzions:FinancingReceivableNonaccruingMember2022-01-012022-12-310000109380us-gaap:HomeEquityMemberus-gaap:ConsumerPortfolioSegmentMemberzions:FinancingReceivableNonaccruingMemberzions:MultipleModificationTypesMember2022-01-012022-12-310000109380us-gaap:HomeEquityMemberus-gaap:ConsumerPortfolioSegmentMemberzions:FinancingReceivableNonaccruingMember2022-01-012022-12-310000109380us-gaap:ConsumerPortfolioSegmentMemberzions:InterestRateBelowMarketMemberzions:OneThroughFourFamilyResidentialMemberzions:FinancingReceivableNonaccruingMember2022-01-012022-12-310000109380zions:MaturityOrTermExtensionMemberus-gaap:ConsumerPortfolioSegmentMemberzions:OneThroughFourFamilyResidentialMemberzions:FinancingReceivableNonaccruingMember2022-01-012022-12-310000109380us-gaap:PrincipalForgivenessMemberus-gaap:ConsumerPortfolioSegmentMemberzions:OneThroughFourFamilyResidentialMemberzions:FinancingReceivableNonaccruingMember2022-01-012022-12-310000109380us-gaap:ConsumerPortfolioSegmentMemberzions:OneThroughFourFamilyResidentialMemberus-gaap:PaymentDeferralMemberzions:FinancingReceivableNonaccruingMember2022-01-012022-12-310000109380us-gaap:ConsumerPortfolioSegmentMemberzions:OneThroughFourFamilyResidentialMemberzions:OtherRecordedInvestmentResultingFromFollowingModificationMemberzions:FinancingReceivableNonaccruingMember2022-01-012022-12-310000109380us-gaap:ConsumerPortfolioSegmentMemberzions:OneThroughFourFamilyResidentialMemberzions:FinancingReceivableNonaccruingMemberzions:MultipleModificationTypesMember2022-01-012022-12-310000109380us-gaap:ConsumerPortfolioSegmentMemberzions:OneThroughFourFamilyResidentialMemberzions:FinancingReceivableNonaccruingMember2022-01-012022-12-310000109380us-gaap:ConsumerPortfolioSegmentMemberzions:InterestRateBelowMarketMemberzions:FinancingReceivableNonaccruingMember2022-01-012022-12-310000109380zions:MaturityOrTermExtensionMemberus-gaap:ConsumerPortfolioSegmentMemberzions:FinancingReceivableNonaccruingMember2022-01-012022-12-310000109380us-gaap:PrincipalForgivenessMemberus-gaap:ConsumerPortfolioSegmentMemberzions:FinancingReceivableNonaccruingMember2022-01-012022-12-310000109380us-gaap:ConsumerPortfolioSegmentMemberus-gaap:PaymentDeferralMemberzions:FinancingReceivableNonaccruingMember2022-01-012022-12-310000109380us-gaap:ConsumerPortfolioSegmentMemberzions:OtherRecordedInvestmentResultingFromFollowingModificationMemberzions:FinancingReceivableNonaccruingMember2022-01-012022-12-310000109380us-gaap:ConsumerPortfolioSegmentMemberzions:FinancingReceivableNonaccruingMemberzions:MultipleModificationTypesMember2022-01-012022-12-310000109380us-gaap:ConsumerPortfolioSegmentMemberzions:FinancingReceivableNonaccruingMember2022-01-012022-12-310000109380zions:InterestRateBelowMarketMemberzions:FinancingReceivableNonaccruingMember2022-01-012022-12-310000109380zions:MaturityOrTermExtensionMemberzions:FinancingReceivableNonaccruingMember2022-01-012022-12-310000109380us-gaap:PrincipalForgivenessMemberzions:FinancingReceivableNonaccruingMember2022-01-012022-12-310000109380us-gaap:PaymentDeferralMemberzions:FinancingReceivableNonaccruingMember2022-01-012022-12-310000109380zions:OtherRecordedInvestmentResultingFromFollowingModificationMemberzions:FinancingReceivableNonaccruingMember2022-01-012022-12-310000109380zions:FinancingReceivableNonaccruingMemberzions:MultipleModificationTypesMember2022-01-012022-12-310000109380zions:FinancingReceivableNonaccruingMember2022-01-012022-12-310000109380zions:InterestRateBelowMarketMember2022-01-012022-12-310000109380zions:MaturityOrTermExtensionMember2022-01-012022-12-310000109380us-gaap:PrincipalForgivenessMember2022-01-012022-12-310000109380us-gaap:PaymentDeferralMember2022-01-012022-12-310000109380zions:OtherRecordedInvestmentResultingFromFollowingModificationMember2022-01-012022-12-310000109380zions:MultipleModificationTypesMember2022-01-012022-12-310000109380us-gaap:InterestRateBelowMarketReductionMember2022-12-310000109380us-gaap:CommercialPortfolioSegmentMemberus-gaap:CommercialRealEstateMemberzions:OwnerOccupiedMember2023-12-310000109380zions:HospitalMemberus-gaap:CommercialPortfolioSegmentMemberzions:OwnerOccupiedMember2023-12-310000109380srt:OfficeBuildingMemberzions:ConstructionAndLandDevelopmentMemberus-gaap:CommercialRealEstatePortfolioSegmentMember2023-12-310000109380zions:TermMemberzions:MultifamilyRetailMemberus-gaap:CommercialRealEstatePortfolioSegmentMember2023-12-310000109380srt:OfficeBuildingMemberzions:TermMemberus-gaap:CommercialRealEstatePortfolioSegmentMember2023-12-310000109380us-gaap:CommercialPortfolioSegmentMemberus-gaap:CommercialRealEstateMemberzions:OwnerOccupiedMember2022-12-310000109380zions:TermMemberzions:MultifamilyRetailMemberus-gaap:CommercialRealEstatePortfolioSegmentMember2022-12-310000109380us-gaap:HomeEquityMemberus-gaap:ConsumerPortfolioSegmentMemberzions:SingleFamilyResidentialMember2022-12-310000109380us-gaap:ConsumerPortfolioSegmentMemberzions:SingleFamilyResidentialMemberzions:OneThroughFourFamilyResidentialMember2022-12-310000109380zions:SubordinatedNotesInterestRate325PercentMember2023-12-310000109380zions:PayFixedReceiveFloatingSwapMemberus-gaap:DesignatedAsHedgingInstrumentMemberus-gaap:FairValueHedgingMember2023-09-300000109380us-gaap:CashFlowHedgingMemberus-gaap:DesignatedAsHedgingInstrumentMemberzions:PayFixedInterestRateSwapMember2023-09-300000109380us-gaap:DesignatedAsHedgingInstrumentMemberzions:AssetHedgePayFixedReceiveFloatingInterestRateSwapMemberus-gaap:FairValueHedgingMember2023-12-310000109380us-gaap:CashFlowHedgingMemberus-gaap:DesignatedAsHedgingInstrumentMemberus-gaap:InterestRateSwapMember2023-12-310000109380us-gaap:CashFlowHedgingMember2023-12-310000109380us-gaap:InterestRateContractMemberus-gaap:CashFlowHedgingMemberus-gaap:DesignatedAsHedgingInstrumentMember2023-12-310000109380us-gaap:CashFlowHedgingMemberus-gaap:DesignatedAsHedgingInstrumentMemberus-gaap:OtherAssetsMemberus-gaap:InterestRateSwapMember2023-12-310000109380us-gaap:CashFlowHedgingMemberus-gaap:OtherLiabilitiesMemberus-gaap:DesignatedAsHedgingInstrumentMemberus-gaap:InterestRateSwapMember2023-12-310000109380us-gaap:CashFlowHedgingMemberus-gaap:DesignatedAsHedgingInstrumentMemberus-gaap:InterestRateSwapMember2022-12-310000109380us-gaap:CashFlowHedgingMemberus-gaap:DesignatedAsHedgingInstrumentMemberus-gaap:OtherAssetsMemberus-gaap:InterestRateSwapMember2022-12-310000109380us-gaap:CashFlowHedgingMemberus-gaap:OtherLiabilitiesMemberus-gaap:DesignatedAsHedgingInstrumentMemberus-gaap:InterestRateSwapMember2022-12-310000109380us-gaap:InterestRateContractMemberus-gaap:CashFlowHedgingMemberus-gaap:DesignatedAsHedgingInstrumentMemberus-gaap:OtherAssetsMember2023-12-310000109380us-gaap:InterestRateContractMemberus-gaap:CashFlowHedgingMemberus-gaap:OtherLiabilitiesMemberus-gaap:DesignatedAsHedgingInstrumentMember2023-12-310000109380us-gaap:InterestRateContractMemberus-gaap:CashFlowHedgingMemberus-gaap:DesignatedAsHedgingInstrumentMember2022-12-310000109380us-gaap:InterestRateContractMemberus-gaap:CashFlowHedgingMemberus-gaap:DesignatedAsHedgingInstrumentMemberus-gaap:OtherAssetsMember2022-12-310000109380us-gaap:InterestRateContractMemberus-gaap:CashFlowHedgingMemberus-gaap:OtherLiabilitiesMemberus-gaap:DesignatedAsHedgingInstrumentMember2022-12-310000109380us-gaap:DesignatedAsHedgingInstrumentMemberus-gaap:InterestRateSwapMemberus-gaap:FairValueHedgingMember2023-12-310000109380us-gaap:DesignatedAsHedgingInstrumentMemberus-gaap:OtherAssetsMemberus-gaap:InterestRateSwapMemberus-gaap:FairValueHedgingMember2023-12-310000109380us-gaap:OtherLiabilitiesMemberus-gaap:DesignatedAsHedgingInstrumentMemberus-gaap:InterestRateSwapMemberus-gaap:FairValueHedgingMember2023-12-310000109380us-gaap:DesignatedAsHedgingInstrumentMemberus-gaap:InterestRateSwapMemberus-gaap:FairValueHedgingMember2022-12-310000109380us-gaap:DesignatedAsHedgingInstrumentMemberus-gaap:OtherAssetsMemberus-gaap:InterestRateSwapMemberus-gaap:FairValueHedgingMember2022-12-310000109380us-gaap:OtherLiabilitiesMemberus-gaap:DesignatedAsHedgingInstrumentMemberus-gaap:InterestRateSwapMemberus-gaap:FairValueHedgingMember2022-12-310000109380us-gaap:DesignatedAsHedgingInstrumentMemberzions:AssetHedgePayFixedInterestRateSwapMemberus-gaap:FairValueHedgingMember2023-12-310000109380us-gaap:DesignatedAsHedgingInstrumentMemberzions:AssetHedgePayFixedInterestRateSwapMemberus-gaap:OtherAssetsMemberus-gaap:FairValueHedgingMember2023-12-310000109380us-gaap:OtherLiabilitiesMemberus-gaap:DesignatedAsHedgingInstrumentMemberzions:AssetHedgePayFixedInterestRateSwapMemberus-gaap:FairValueHedgingMember2023-12-310000109380us-gaap:DesignatedAsHedgingInstrumentMemberzions:AssetHedgePayFixedInterestRateSwapMemberus-gaap:FairValueHedgingMember2022-12-310000109380us-gaap:DesignatedAsHedgingInstrumentMemberzions:AssetHedgePayFixedInterestRateSwapMemberus-gaap:OtherAssetsMemberus-gaap:FairValueHedgingMember2022-12-310000109380us-gaap:OtherLiabilitiesMemberus-gaap:DesignatedAsHedgingInstrumentMemberzions:AssetHedgePayFixedInterestRateSwapMemberus-gaap:FairValueHedgingMember2022-12-310000109380us-gaap:DesignatedAsHedgingInstrumentMember2023-12-310000109380us-gaap:DesignatedAsHedgingInstrumentMemberus-gaap:OtherAssetsMember2023-12-310000109380us-gaap:OtherLiabilitiesMemberus-gaap:DesignatedAsHedgingInstrumentMember2023-12-310000109380us-gaap:DesignatedAsHedgingInstrumentMember2022-12-310000109380us-gaap:DesignatedAsHedgingInstrumentMemberus-gaap:OtherAssetsMember2022-12-310000109380us-gaap:OtherLiabilitiesMemberus-gaap:DesignatedAsHedgingInstrumentMember2022-12-310000109380zions:InterestRateSwapsForCustomersMemberus-gaap:NondesignatedMember2023-12-310000109380zions:InterestRateSwapsForCustomersMemberus-gaap:OtherAssetsMemberus-gaap:NondesignatedMember2023-12-310000109380zions:InterestRateSwapsForCustomersMemberus-gaap:OtherLiabilitiesMemberus-gaap:NondesignatedMember2023-12-310000109380zions:InterestRateSwapsForCustomersMemberus-gaap:NondesignatedMember2022-12-310000109380zions:InterestRateSwapsForCustomersMemberus-gaap:OtherAssetsMemberus-gaap:NondesignatedMember2022-12-310000109380zions:InterestRateSwapsForCustomersMemberus-gaap:OtherLiabilitiesMemberus-gaap:NondesignatedMember2022-12-310000109380us-gaap:OtherContractMemberus-gaap:NondesignatedMember2023-12-310000109380us-gaap:OtherContractMemberus-gaap:OtherAssetsMemberus-gaap:NondesignatedMember2023-12-310000109380us-gaap:OtherContractMemberus-gaap:OtherLiabilitiesMemberus-gaap:NondesignatedMember2023-12-310000109380us-gaap:OtherContractMemberus-gaap:NondesignatedMember2022-12-310000109380us-gaap:OtherContractMemberus-gaap:OtherAssetsMemberus-gaap:NondesignatedMember2022-12-310000109380us-gaap:OtherContractMemberus-gaap:OtherLiabilitiesMemberus-gaap:NondesignatedMember2022-12-310000109380us-gaap:ForeignExchangeContractMemberus-gaap:NondesignatedMember2023-12-310000109380us-gaap:ForeignExchangeContractMemberus-gaap:OtherAssetsMemberus-gaap:NondesignatedMember2023-12-310000109380us-gaap:ForeignExchangeContractMemberus-gaap:OtherLiabilitiesMemberus-gaap:NondesignatedMember2023-12-310000109380us-gaap:ForeignExchangeContractMemberus-gaap:NondesignatedMember2022-12-310000109380us-gaap:ForeignExchangeContractMemberus-gaap:OtherAssetsMemberus-gaap:NondesignatedMember2022-12-310000109380us-gaap:ForeignExchangeContractMemberus-gaap:OtherLiabilitiesMemberus-gaap:NondesignatedMember2022-12-310000109380zions:PurchasedCreditDerivativeMemberus-gaap:NondesignatedMember2023-12-310000109380zions:PurchasedCreditDerivativeMemberus-gaap:OtherAssetsMemberus-gaap:NondesignatedMember2023-12-310000109380us-gaap:OtherLiabilitiesMemberzions:PurchasedCreditDerivativeMemberus-gaap:NondesignatedMember2023-12-310000109380zions:PurchasedCreditDerivativeMemberus-gaap:NondesignatedMember2022-12-310000109380zions:PurchasedCreditDerivativeMemberus-gaap:OtherAssetsMemberus-gaap:NondesignatedMember2022-12-310000109380us-gaap:OtherLiabilitiesMemberzions:PurchasedCreditDerivativeMemberus-gaap:NondesignatedMember2022-12-310000109380us-gaap:NondesignatedMember2023-12-310000109380us-gaap:OtherAssetsMemberus-gaap:NondesignatedMember2023-12-310000109380us-gaap:OtherLiabilitiesMemberus-gaap:NondesignatedMember2023-12-310000109380us-gaap:NondesignatedMember2022-12-310000109380us-gaap:OtherAssetsMemberus-gaap:NondesignatedMember2022-12-310000109380us-gaap:OtherLiabilitiesMemberus-gaap:NondesignatedMember2022-12-310000109380us-gaap:OtherAssetsMember2023-12-310000109380us-gaap:OtherLiabilitiesMember2023-12-310000109380us-gaap:OtherAssetsMember2022-12-310000109380us-gaap:OtherLiabilitiesMember2022-12-310000109380us-gaap:CashFlowHedgingMemberus-gaap:DesignatedAsHedgingInstrumentMemberus-gaap:InterestRateFloorMember2023-01-012023-12-310000109380us-gaap:CashFlowHedgingMemberus-gaap:DesignatedAsHedgingInstrumentMemberus-gaap:InterestRateSwapMember2023-01-012023-12-310000109380us-gaap:InterestRateContractMemberus-gaap:CashFlowHedgingMemberus-gaap:DesignatedAsHedgingInstrumentMember2023-01-012023-12-310000109380us-gaap:InterestRateContractMemberus-gaap:DesignatedAsHedgingInstrumentMemberus-gaap:FairValueHedgingMember2023-01-012023-12-310000109380zions:TerminatedSwapsOnLongTermDebtMemberus-gaap:DesignatedAsHedgingInstrumentMemberus-gaap:FairValueHedgingMember2023-01-012023-12-310000109380us-gaap:DesignatedAsHedgingInstrumentMemberzions:AssetHedgePayFixedInterestRateSwapMemberus-gaap:FairValueHedgingMember2023-01-012023-12-310000109380zions:TerminatedSwapsOnAssetHedgesMemberus-gaap:DesignatedAsHedgingInstrumentMemberus-gaap:FairValueHedgingMember2023-01-012023-12-310000109380us-gaap:DesignatedAsHedgingInstrumentMember2023-01-012023-12-310000109380us-gaap:CashFlowHedgingMemberus-gaap:DesignatedAsHedgingInstrumentMemberus-gaap:InterestRateFloorMember2022-01-012022-12-310000109380us-gaap:CashFlowHedgingMemberus-gaap:DesignatedAsHedgingInstrumentMemberus-gaap:InterestRateSwapMember2022-01-012022-12-310000109380us-gaap:InterestRateContractMemberus-gaap:DesignatedAsHedgingInstrumentMemberus-gaap:FairValueHedgingMember2022-01-012022-12-310000109380zions:TerminatedSwapsOnLongTermDebtMemberus-gaap:DesignatedAsHedgingInstrumentMemberus-gaap:FairValueHedgingMember2022-01-012022-12-310000109380us-gaap:DesignatedAsHedgingInstrumentMemberzions:AssetHedgePayFixedInterestRateSwapMemberus-gaap:FairValueHedgingMember2022-01-012022-12-310000109380zions:TerminatedSwapsOnAssetHedgesMemberus-gaap:DesignatedAsHedgingInstrumentMemberus-gaap:FairValueHedgingMember2022-01-012022-12-310000109380us-gaap:DesignatedAsHedgingInstrumentMember2022-01-012022-12-310000109380us-gaap:DesignatedAsHedgingInstrumentMemberus-gaap:FairValueHedgingMember2023-12-310000109380us-gaap:CashFlowHedgingMemberus-gaap:DesignatedAsHedgingInstrumentMember2023-12-310000109380us-gaap:DesignatedAsHedgingInstrumentMemberus-gaap:FairValueHedgingMember2022-12-310000109380us-gaap:CashFlowHedgingMemberus-gaap:DesignatedAsHedgingInstrumentMember2022-12-310000109380zions:InterestRateSwapsForCustomersMemberus-gaap:NondesignatedMember2023-01-012023-12-310000109380zions:InterestRateSwapsForCustomersMemberus-gaap:NondesignatedMember2022-01-012022-12-310000109380us-gaap:OtherContractMemberus-gaap:NondesignatedMember2023-01-012023-12-310000109380us-gaap:OtherContractMemberus-gaap:NondesignatedMember2022-01-012022-12-310000109380us-gaap:ForeignExchangeContractMemberus-gaap:NondesignatedMember2023-01-012023-12-310000109380us-gaap:ForeignExchangeContractMemberus-gaap:NondesignatedMember2022-01-012022-12-310000109380zions:PurchasedCreditDerivativeMemberus-gaap:NondesignatedMember2023-01-012023-12-310000109380zions:PurchasedCreditDerivativeMemberus-gaap:NondesignatedMember2022-01-012022-12-310000109380us-gaap:NondesignatedMember2023-01-012023-12-310000109380us-gaap:NondesignatedMember2022-01-012022-12-310000109380us-gaap:InterestRateSwapMember2023-01-012023-12-310000109380us-gaap:InterestRateSwapMember2022-01-012022-12-310000109380zions:AssetHedgePayFixedInterestRateSwapMember2023-01-012023-12-310000109380zions:AssetHedgePayFixedInterestRateSwapMember2022-01-012022-12-310000109380us-gaap:FairValueHedgingMember2023-12-310000109380us-gaap:FairValueHedgingMember2022-12-31zions:branch0000109380zions:AmegyCorporationSegmentMember2023-12-310000109380zions:AmegyCorporationSegmentMember2022-12-310000109380zions:CaliforniaBankAndTrustSegmentMember2023-12-310000109380zions:CaliforniaBankAndTrustSegmentMember2022-12-310000109380zions:ZionsBankSegmentMember2023-12-310000109380zions:ZionsBankSegmentMember2022-12-310000109380zions:NevadaStateBankSegmentMember2023-12-310000109380zions:NevadaStateBankSegmentMember2022-12-310000109380us-gaap:FederalHomeLoanBankAdvancesMember2023-01-012023-12-310000109380us-gaap:FederalHomeLoanBankAdvancesMember2022-01-012022-12-310000109380us-gaap:FederalHomeLoanBankAdvancesMember2023-12-310000109380us-gaap:FederalHomeLoanBankAdvancesMember2022-12-310000109380us-gaap:FederalFundsPurchasedMember2023-12-310000109380us-gaap:FederalFundsPurchasedMember2022-12-310000109380us-gaap:SecuritiesSoldUnderAgreementsToRepurchaseMember2023-12-310000109380us-gaap:SecuritiesSoldUnderAgreementsToRepurchaseMember2022-12-310000109380zions:SwapMarginCollateralMember2023-12-310000109380zions:SwapMarginCollateralMember2022-12-310000109380zions:SwapMarginCollateralMember2022-01-012022-12-310000109380us-gaap:FederalReserveBankAdvancesMember2023-12-310000109380us-gaap:FederalReserveBankAdvancesMember2022-12-310000109380us-gaap:FederalFundsPurchasedAndSecuritiesSoldUnderAgreementsToRepurchaseMember2023-01-012023-12-310000109380zions:SeniorNotes350Memberus-gaap:SeniorNotesMember2023-01-012023-03-310000109380zions:SeniorNoteInterestRate450Memberus-gaap:SeniorNotesMember2023-06-300000109380us-gaap:SubordinatedDebtMemberzions:SubordinatedNotesInterestRate6.95PercentMember2023-12-310000109380zions:SubordinatedNotesInterestRate6.95PercentMember2023-12-310000109380us-gaap:SubordinatedDebtMemberzions:SubordinatedNotesInterestRate325PercentMember2023-12-310000109380zions:SecuredOvernightFinancingRateSOFROvernightIndexSwapRate1Member2023-01-012023-12-310000109380us-gaap:ParentMemberus-gaap:SeriesAPreferredStockMember2023-12-310000109380us-gaap:ParentMemberus-gaap:SeriesAPreferredStockMember2022-12-310000109380us-gaap:ParentMemberus-gaap:SeriesAPreferredStockMember2023-01-012023-12-310000109380zions:SecuredOvernightFinancingRateSOFROvernightIndexSwapRate1Memberus-gaap:SeriesAPreferredStockMember2023-01-012023-12-310000109380us-gaap:SeriesGPreferredStockMemberus-gaap:ParentMember2023-12-310000109380us-gaap:SeriesGPreferredStockMemberus-gaap:ParentMember2022-12-310000109380zions:SecuredOvernightFinancingRateSOFROvernightIndexSwapRate1Memberus-gaap:SeriesGPreferredStockMember2023-01-012023-12-310000109380us-gaap:SeriesGPreferredStockMemberus-gaap:ParentMember2023-01-012023-12-310000109380us-gaap:ParentMemberzions:SeriesIPreferredStockMember2023-12-310000109380us-gaap:ParentMemberzions:SeriesIPreferredStockMember2022-12-310000109380zions:SecuredOvernightFinancingRateSOFROvernightIndexSwapRate1Memberzions:SeriesIPreferredStockMember2023-01-012023-12-310000109380us-gaap:ParentMemberzions:SeriesIPreferredStockMember2023-01-012023-12-310000109380zions:SeriesJPreferredStockMemberus-gaap:ParentMember2023-12-310000109380zions:SeriesJPreferredStockMemberus-gaap:ParentMember2022-12-310000109380zions:SecuredOvernightFinancingRateSOFROvernightIndexSwapRate1Memberzions:SeriesJPreferredStockMember2023-01-012023-12-310000109380zions:SeriesJPreferredStockMemberus-gaap:ParentMember2023-01-012023-12-3100001093802023-02-012023-02-230000109380us-gaap:SubsequentEventMember2024-02-012024-02-220000109380us-gaap:AccumulatedNetUnrealizedInvestmentGainLossMember2022-12-310000109380us-gaap:AccumulatedGainLossNetCashFlowHedgeParentMember2022-12-310000109380us-gaap:AccumulatedDefinedBenefitPlansAdjustmentMember2022-12-310000109380us-gaap:AccumulatedNetUnrealizedInvestmentGainLossMember2023-01-012023-12-310000109380us-gaap:AccumulatedGainLossNetCashFlowHedgeParentMember2023-01-012023-12-310000109380us-gaap:AccumulatedDefinedBenefitPlansAdjustmentMember2023-01-012023-12-310000109380us-gaap:AccumulatedNetUnrealizedInvestmentGainLossMember2023-12-310000109380us-gaap:AccumulatedGainLossNetCashFlowHedgeParentMember2023-12-310000109380us-gaap:AccumulatedDefinedBenefitPlansAdjustmentMember2023-12-310000109380us-gaap:AccumulatedNetUnrealizedInvestmentGainLossMember2021-12-310000109380us-gaap:AccumulatedGainLossNetCashFlowHedgeParentMember2021-12-310000109380us-gaap:AccumulatedDefinedBenefitPlansAdjustmentMember2021-12-310000109380us-gaap:AccumulatedNetUnrealizedInvestmentGainLossMember2022-01-012022-12-310000109380us-gaap:AccumulatedGainLossNetCashFlowHedgeParentMember2022-01-012022-12-310000109380us-gaap:AccumulatedDefinedBenefitPlansAdjustmentMember2022-01-012022-12-310000109380us-gaap:AccumulatedNetUnrealizedInvestmentGainLossMemberus-gaap:ReclassificationOutOfAccumulatedOtherComprehensiveIncomeMember2023-01-012023-12-310000109380us-gaap:AccumulatedNetUnrealizedInvestmentGainLossMemberus-gaap:ReclassificationOutOfAccumulatedOtherComprehensiveIncomeMember2022-01-012022-12-310000109380us-gaap:AccumulatedNetUnrealizedInvestmentGainLossMemberus-gaap:ReclassificationOutOfAccumulatedOtherComprehensiveIncomeMember2021-01-012021-12-310000109380us-gaap:AccumulatedGainLossNetCashFlowHedgeParentMemberus-gaap:ReclassificationOutOfAccumulatedOtherComprehensiveIncomeMember2023-01-012023-12-310000109380us-gaap:AccumulatedGainLossNetCashFlowHedgeParentMemberus-gaap:ReclassificationOutOfAccumulatedOtherComprehensiveIncomeMember2022-01-012022-12-310000109380us-gaap:AccumulatedGainLossNetCashFlowHedgeParentMemberus-gaap:ReclassificationOutOfAccumulatedOtherComprehensiveIncomeMember2021-01-012021-12-310000109380us-gaap:StandbyLettersOfCreditMember2023-12-310000109380us-gaap:StandbyLettersOfCreditMember2022-12-310000109380us-gaap:PerformanceGuaranteeMember2023-12-310000109380us-gaap:PerformanceGuaranteeMember2022-12-310000109380srt:MaximumMember2023-01-012023-12-31zions:case0000109380srt:MinimumMember2023-12-310000109380srt:MaximumMember2023-12-310000109380zions:ProductsAndServicesInterestIncomeOnLoansAndSecuritiesMemberus-gaap:RevenueFromContractWithCustomerMemberus-gaap:ProductConcentrationRiskMember2023-01-012023-12-310000109380us-gaap:OperatingSegmentsMemberzions:ProductsAndServicesCommercialAccountFeesMemberzions:ZionsBankSegmentMember2023-01-012023-12-310000109380us-gaap:OperatingSegmentsMemberzions:ProductsAndServicesCommercialAccountFeesMemberzions:ZionsBankSegmentMember2022-01-012022-12-310000109380us-gaap:OperatingSegmentsMemberzions:ProductsAndServicesCommercialAccountFeesMemberzions:ZionsBankSegmentMember2021-01-012021-12-310000109380us-gaap:OperatingSegmentsMemberzions:CaliforniaBankAndTrustSegmentMemberzions:ProductsAndServicesCommercialAccountFeesMember2023-01-012023-12-310000109380us-gaap:OperatingSegmentsMemberzions:CaliforniaBankAndTrustSegmentMemberzions:ProductsAndServicesCommercialAccountFeesMember2022-01-012022-12-310000109380us-gaap:OperatingSegmentsMemberzions:CaliforniaBankAndTrustSegmentMemberzions:ProductsAndServicesCommercialAccountFeesMember2021-01-012021-12-310000109380zions:AmegyCorporationSegmentMemberus-gaap:OperatingSegmentsMemberzions:ProductsAndServicesCommercialAccountFeesMember2023-01-012023-12-310000109380zions:AmegyCorporationSegmentMemberus-gaap:OperatingSegmentsMemberzions:ProductsAndServicesCommercialAccountFeesMember2022-01-012022-12-310000109380zions:AmegyCorporationSegmentMemberus-gaap:OperatingSegmentsMemberzions:ProductsAndServicesCommercialAccountFeesMember2021-01-012021-12-310000109380zions:ProductsAndServicesCardFeesMemberus-gaap:OperatingSegmentsMemberzions:ZionsBankSegmentMember2023-01-012023-12-310000109380zions:ProductsAndServicesCardFeesMemberus-gaap:OperatingSegmentsMemberzions:ZionsBankSegmentMember2022-01-012022-12-310000109380zions:ProductsAndServicesCardFeesMemberus-gaap:OperatingSegmentsMemberzions:ZionsBankSegmentMember2021-01-012021-12-310000109380zions:ProductsAndServicesCardFeesMemberus-gaap:OperatingSegmentsMemberzions:CaliforniaBankAndTrustSegmentMember2023-01-012023-12-310000109380zions:ProductsAndServicesCardFeesMemberus-gaap:OperatingSegmentsMemberzions:CaliforniaBankAndTrustSegmentMember2022-01-012022-12-310000109380zions:ProductsAndServicesCardFeesMemberus-gaap:OperatingSegmentsMemberzions:CaliforniaBankAndTrustSegmentMember2021-01-012021-12-310000109380zions:AmegyCorporationSegmentMemberzions:ProductsAndServicesCardFeesMemberus-gaap:OperatingSegmentsMember2023-01-012023-12-310000109380zions:AmegyCorporationSegmentMemberzions:ProductsAndServicesCardFeesMemberus-gaap:OperatingSegmentsMember2022-01-012022-12-310000109380zions:AmegyCorporationSegmentMemberzions:ProductsAndServicesCardFeesMemberus-gaap:OperatingSegmentsMember2021-01-012021-12-310000109380us-gaap:OperatingSegmentsMemberzions:ProductsAndServicesRetailAndBusinessBankingFeesMemberzions:ZionsBankSegmentMember2023-01-012023-12-310000109380us-gaap:OperatingSegmentsMemberzions:ProductsAndServicesRetailAndBusinessBankingFeesMemberzions:ZionsBankSegmentMember2022-01-012022-12-310000109380us-gaap:OperatingSegmentsMemberzions:ProductsAndServicesRetailAndBusinessBankingFeesMemberzions:ZionsBankSegmentMember2021-01-012021-12-310000109380us-gaap:OperatingSegmentsMemberzions:ProductsAndServicesRetailAndBusinessBankingFeesMemberzions:CaliforniaBankAndTrustSegmentMember2023-01-012023-12-310000109380us-gaap:OperatingSegmentsMemberzions:ProductsAndServicesRetailAndBusinessBankingFeesMemberzions:CaliforniaBankAndTrustSegmentMember2022-01-012022-12-310000109380us-gaap:OperatingSegmentsMemberzions:ProductsAndServicesRetailAndBusinessBankingFeesMemberzions:CaliforniaBankAndTrustSegmentMember2021-01-012021-12-310000109380zions:AmegyCorporationSegmentMemberus-gaap:OperatingSegmentsMemberzions:ProductsAndServicesRetailAndBusinessBankingFeesMember2023-01-012023-12-310000109380zions:AmegyCorporationSegmentMemberus-gaap:OperatingSegmentsMemberzions:ProductsAndServicesRetailAndBusinessBankingFeesMember2022-01-012022-12-310000109380zions:AmegyCorporationSegmentMemberus-gaap:OperatingSegmentsMemberzions:ProductsAndServicesRetailAndBusinessBankingFeesMember2021-01-012021-12-310000109380us-gaap:OperatingSegmentsMemberzions:ZionsBankSegmentMemberzions:ProductsAndServicesCapitalMarketsFeesMember2023-01-012023-12-310000109380us-gaap:OperatingSegmentsMemberzions:ZionsBankSegmentMemberzions:ProductsAndServicesCapitalMarketsFeesMember2022-01-012022-12-310000109380us-gaap:OperatingSegmentsMemberzions:ZionsBankSegmentMemberzions:ProductsAndServicesCapitalMarketsFeesMember2021-01-012021-12-310000109380us-gaap:OperatingSegmentsMemberzions:CaliforniaBankAndTrustSegmentMemberzions:ProductsAndServicesCapitalMarketsFeesMember2023-01-012023-12-310000109380us-gaap:OperatingSegmentsMemberzions:CaliforniaBankAndTrustSegmentMemberzions:ProductsAndServicesCapitalMarketsFeesMember2022-01-012022-12-310000109380us-gaap:OperatingSegmentsMemberzions:CaliforniaBankAndTrustSegmentMemberzions:ProductsAndServicesCapitalMarketsFeesMember2021-01-012021-12-310000109380zions:AmegyCorporationSegmentMemberus-gaap:OperatingSegmentsMemberzions:ProductsAndServicesCapitalMarketsFeesMember2023-01-012023-12-310000109380zions:AmegyCorporationSegmentMemberus-gaap:OperatingSegmentsMemberzions:ProductsAndServicesCapitalMarketsFeesMember2022-01-012022-12-310000109380zions:AmegyCorporationSegmentMemberus-gaap:OperatingSegmentsMemberzions:ProductsAndServicesCapitalMarketsFeesMember2021-01-012021-12-310000109380zions:ProductsAndServicesWealthManagementFeesMemberus-gaap:OperatingSegmentsMemberzions:ZionsBankSegmentMember2023-01-012023-12-310000109380zions:ProductsAndServicesWealthManagementFeesMemberus-gaap:OperatingSegmentsMemberzions:ZionsBankSegmentMember2022-01-012022-12-310000109380zions:ProductsAndServicesWealthManagementFeesMemberus-gaap:OperatingSegmentsMemberzions:ZionsBankSegmentMember2021-01-012021-12-310000109380zions:ProductsAndServicesWealthManagementFeesMemberus-gaap:OperatingSegmentsMemberzions:CaliforniaBankAndTrustSegmentMember2023-01-012023-12-310000109380zions:ProductsAndServicesWealthManagementFeesMemberus-gaap:OperatingSegmentsMemberzions:CaliforniaBankAndTrustSegmentMember2022-01-012022-12-310000109380zions:ProductsAndServicesWealthManagementFeesMemberus-gaap:OperatingSegmentsMemberzions:CaliforniaBankAndTrustSegmentMember2021-01-012021-12-310000109380zions:AmegyCorporationSegmentMemberzions:ProductsAndServicesWealthManagementFeesMemberus-gaap:OperatingSegmentsMember2023-01-012023-12-310000109380zions:AmegyCorporationSegmentMemberzions:ProductsAndServicesWealthManagementFeesMemberus-gaap:OperatingSegmentsMember2022-01-012022-12-310000109380zions:AmegyCorporationSegmentMemberzions:ProductsAndServicesWealthManagementFeesMemberus-gaap:OperatingSegmentsMember2021-01-012021-12-310000109380us-gaap:OperatingSegmentsMemberzions:ZionsBankSegmentMemberzions:ProductsAndServicesOtherCustomerRelatedFeesMember2023-01-012023-12-310000109380us-gaap:OperatingSegmentsMemberzions:ZionsBankSegmentMemberzions:ProductsAndServicesOtherCustomerRelatedFeesMember2022-01-012022-12-310000109380us-gaap:OperatingSegmentsMemberzions:ZionsBankSegmentMemberzions:ProductsAndServicesOtherCustomerRelatedFeesMember2021-01-012021-12-310000109380us-gaap:OperatingSegmentsMemberzions:CaliforniaBankAndTrustSegmentMemberzions:ProductsAndServicesOtherCustomerRelatedFeesMember2023-01-012023-12-310000109380us-gaap:OperatingSegmentsMemberzions:CaliforniaBankAndTrustSegmentMemberzions:ProductsAndServicesOtherCustomerRelatedFeesMember2022-01-012022-12-310000109380us-gaap:OperatingSegmentsMemberzions:CaliforniaBankAndTrustSegmentMemberzions:ProductsAndServicesOtherCustomerRelatedFeesMember2021-01-012021-12-310000109380zions:AmegyCorporationSegmentMemberus-gaap:OperatingSegmentsMemberzions:ProductsAndServicesOtherCustomerRelatedFeesMember2023-01-012023-12-310000109380zions:AmegyCorporationSegmentMemberus-gaap:OperatingSegmentsMemberzions:ProductsAndServicesOtherCustomerRelatedFeesMember2022-01-012022-12-310000109380zions:AmegyCorporationSegmentMemberus-gaap:OperatingSegmentsMemberzions:ProductsAndServicesOtherCustomerRelatedFeesMember2021-01-012021-12-310000109380us-gaap:OperatingSegmentsMemberzions:ZionsBankSegmentMember2023-01-012023-12-310000109380us-gaap:OperatingSegmentsMemberzions:ZionsBankSegmentMember2022-01-012022-12-310000109380us-gaap:OperatingSegmentsMemberzions:ZionsBankSegmentMember2021-01-012021-12-310000109380us-gaap:OperatingSegmentsMemberzions:CaliforniaBankAndTrustSegmentMember2023-01-012023-12-310000109380us-gaap:OperatingSegmentsMemberzions:CaliforniaBankAndTrustSegmentMember2022-01-012022-12-310000109380us-gaap:OperatingSegmentsMemberzions:CaliforniaBankAndTrustSegmentMember2021-01-012021-12-310000109380zions:AmegyCorporationSegmentMemberus-gaap:OperatingSegmentsMember2023-01-012023-12-310000109380zions:AmegyCorporationSegmentMemberus-gaap:OperatingSegmentsMember2022-01-012022-12-310000109380zions:AmegyCorporationSegmentMemberus-gaap:OperatingSegmentsMember2021-01-012021-12-310000109380us-gaap:OperatingSegmentsMemberzions:ProductsAndServicesCommercialAccountFeesMemberzions:NationalBankOfArizonaSegmentMember2023-01-012023-12-310000109380us-gaap:OperatingSegmentsMemberzions:ProductsAndServicesCommercialAccountFeesMemberzions:NationalBankOfArizonaSegmentMember2022-01-012022-12-310000109380us-gaap:OperatingSegmentsMemberzions:ProductsAndServicesCommercialAccountFeesMemberzions:NationalBankOfArizonaSegmentMember2021-01-012021-12-310000109380us-gaap:OperatingSegmentsMemberzions:ProductsAndServicesCommercialAccountFeesMemberzions:NevadaStateBankSegmentMember2023-01-012023-12-310000109380us-gaap:OperatingSegmentsMemberzions:ProductsAndServicesCommercialAccountFeesMemberzions:NevadaStateBankSegmentMember2022-01-012022-12-310000109380us-gaap:OperatingSegmentsMemberzions:ProductsAndServicesCommercialAccountFeesMemberzions:NevadaStateBankSegmentMember2021-01-012021-12-310000109380us-gaap:OperatingSegmentsMemberzions:ProductsAndServicesCommercialAccountFeesMemberzions:VectraBankColoradoSegmentMember2023-01-012023-12-310000109380us-gaap:OperatingSegmentsMemberzions:ProductsAndServicesCommercialAccountFeesMemberzions:VectraBankColoradoSegmentMember2022-01-012022-12-310000109380us-gaap:OperatingSegmentsMemberzions:ProductsAndServicesCommercialAccountFeesMemberzions:VectraBankColoradoSegmentMember2021-01-012021-12-310000109380zions:ProductsAndServicesCardFeesMemberus-gaap:OperatingSegmentsMemberzions:NationalBankOfArizonaSegmentMember2023-01-012023-12-310000109380zions:ProductsAndServicesCardFeesMemberus-gaap:OperatingSegmentsMemberzions:NationalBankOfArizonaSegmentMember2022-01-012022-12-310000109380zions:ProductsAndServicesCardFeesMemberus-gaap:OperatingSegmentsMemberzions:NationalBankOfArizonaSegmentMember2021-01-012021-12-310000109380zions:ProductsAndServicesCardFeesMemberus-gaap:OperatingSegmentsMemberzions:NevadaStateBankSegmentMember2023-01-012023-12-310000109380zions:ProductsAndServicesCardFeesMemberus-gaap:OperatingSegmentsMemberzions:NevadaStateBankSegmentMember2022-01-012022-12-310000109380zions:ProductsAndServicesCardFeesMemberus-gaap:OperatingSegmentsMemberzions:NevadaStateBankSegmentMember2021-01-012021-12-310000109380zions:ProductsAndServicesCardFeesMemberus-gaap:OperatingSegmentsMemberzions:VectraBankColoradoSegmentMember2023-01-012023-12-310000109380zions:ProductsAndServicesCardFeesMemberus-gaap:OperatingSegmentsMemberzions:VectraBankColoradoSegmentMember2022-01-012022-12-310000109380zions:ProductsAndServicesCardFeesMemberus-gaap:OperatingSegmentsMemberzions:VectraBankColoradoSegmentMember2021-01-012021-12-310000109380us-gaap:OperatingSegmentsMemberzions:ProductsAndServicesRetailAndBusinessBankingFeesMemberzions:NationalBankOfArizonaSegmentMember2023-01-012023-12-310000109380us-gaap:OperatingSegmentsMemberzions:ProductsAndServicesRetailAndBusinessBankingFeesMemberzions:NationalBankOfArizonaSegmentMember2022-01-012022-12-310000109380us-gaap:OperatingSegmentsMemberzions:ProductsAndServicesRetailAndBusinessBankingFeesMemberzions:NationalBankOfArizonaSegmentMember2021-01-012021-12-310000109380us-gaap:OperatingSegmentsMemberzions:ProductsAndServicesRetailAndBusinessBankingFeesMemberzions:NevadaStateBankSegmentMember2023-01-012023-12-310000109380us-gaap:OperatingSegmentsMemberzions:ProductsAndServicesRetailAndBusinessBankingFeesMemberzions:NevadaStateBankSegmentMember2022-01-012022-12-310000109380us-gaap:OperatingSegmentsMemberzions:ProductsAndServicesRetailAndBusinessBankingFeesMemberzions:NevadaStateBankSegmentMember2021-01-012021-12-310000109380us-gaap:OperatingSegmentsMemberzions:ProductsAndServicesRetailAndBusinessBankingFeesMemberzions:VectraBankColoradoSegmentMember2023-01-012023-12-310000109380us-gaap:OperatingSegmentsMemberzions:ProductsAndServicesRetailAndBusinessBankingFeesMemberzions:VectraBankColoradoSegmentMember2022-01-012022-12-310000109380us-gaap:OperatingSegmentsMemberzions:ProductsAndServicesRetailAndBusinessBankingFeesMemberzions:VectraBankColoradoSegmentMember2021-01-012021-12-310000109380us-gaap:OperatingSegmentsMemberzions:NationalBankOfArizonaSegmentMemberzions:ProductsAndServicesCapitalMarketsFeesMember2023-01-012023-12-310000109380us-gaap:OperatingSegmentsMemberzions:NationalBankOfArizonaSegmentMemberzions:ProductsAndServicesCapitalMarketsFeesMember2022-01-012022-12-310000109380us-gaap:OperatingSegmentsMemberzions:NationalBankOfArizonaSegmentMemberzions:ProductsAndServicesCapitalMarketsFeesMember2021-01-012021-12-310000109380us-gaap:OperatingSegmentsMemberzions:NevadaStateBankSegmentMemberzions:ProductsAndServicesCapitalMarketsFeesMember2023-01-012023-12-310000109380us-gaap:OperatingSegmentsMemberzions:NevadaStateBankSegmentMemberzions:ProductsAndServicesCapitalMarketsFeesMember2022-01-012022-12-310000109380us-gaap:OperatingSegmentsMemberzions:NevadaStateBankSegmentMemberzions:ProductsAndServicesCapitalMarketsFeesMember2021-01-012021-12-310000109380us-gaap:OperatingSegmentsMemberzions:VectraBankColoradoSegmentMemberzions:ProductsAndServicesCapitalMarketsFeesMember2023-01-012023-12-310000109380us-gaap:OperatingSegmentsMemberzions:VectraBankColoradoSegmentMemberzions:ProductsAndServicesCapitalMarketsFeesMember2022-01-012022-12-310000109380us-gaap:OperatingSegmentsMemberzions:VectraBankColoradoSegmentMemberzions:ProductsAndServicesCapitalMarketsFeesMember2021-01-012021-12-310000109380zions:ProductsAndServicesWealthManagementFeesMemberus-gaap:OperatingSegmentsMemberzions:NationalBankOfArizonaSegmentMember2023-01-012023-12-310000109380zions:ProductsAndServicesWealthManagementFeesMemberus-gaap:OperatingSegmentsMemberzions:NationalBankOfArizonaSegmentMember2022-01-012022-12-310000109380zions:ProductsAndServicesWealthManagementFeesMemberus-gaap:OperatingSegmentsMemberzions:NationalBankOfArizonaSegmentMember2021-01-012021-12-310000109380zions:ProductsAndServicesWealthManagementFeesMemberus-gaap:OperatingSegmentsMemberzions:NevadaStateBankSegmentMember2023-01-012023-12-310000109380zions:ProductsAndServicesWealthManagementFeesMemberus-gaap:OperatingSegmentsMemberzions:NevadaStateBankSegmentMember2022-01-012022-12-310000109380zions:ProductsAndServicesWealthManagementFeesMemberus-gaap:OperatingSegmentsMemberzions:NevadaStateBankSegmentMember2021-01-012021-12-310000109380zions:ProductsAndServicesWealthManagementFeesMemberus-gaap:OperatingSegmentsMemberzions:VectraBankColoradoSegmentMember2023-01-012023-12-310000109380zions:ProductsAndServicesWealthManagementFeesMemberus-gaap:OperatingSegmentsMemberzions:VectraBankColoradoSegmentMember2022-01-012022-12-310000109380zions:ProductsAndServicesWealthManagementFeesMemberus-gaap:OperatingSegmentsMemberzions:VectraBankColoradoSegmentMember2021-01-012021-12-310000109380us-gaap:OperatingSegmentsMemberzions:NationalBankOfArizonaSegmentMemberzions:ProductsAndServicesOtherCustomerRelatedFeesMember2023-01-012023-12-310000109380us-gaap:OperatingSegmentsMemberzions:NationalBankOfArizonaSegmentMemberzions:ProductsAndServicesOtherCustomerRelatedFeesMember2022-01-012022-12-310000109380us-gaap:OperatingSegmentsMemberzions:NationalBankOfArizonaSegmentMemberzions:ProductsAndServicesOtherCustomerRelatedFeesMember2021-01-012021-12-310000109380us-gaap:OperatingSegmentsMemberzions:NevadaStateBankSegmentMemberzions:ProductsAndServicesOtherCustomerRelatedFeesMember2023-01-012023-12-310000109380us-gaap:OperatingSegmentsMemberzions:NevadaStateBankSegmentMemberzions:ProductsAndServicesOtherCustomerRelatedFeesMember2022-01-012022-12-310000109380us-gaap:OperatingSegmentsMemberzions:NevadaStateBankSegmentMemberzions:ProductsAndServicesOtherCustomerRelatedFeesMember2021-01-012021-12-310000109380us-gaap:OperatingSegmentsMemberzions:ProductsAndServicesOtherCustomerRelatedFeesMemberzions:VectraBankColoradoSegmentMember2023-01-012023-12-310000109380us-gaap:OperatingSegmentsMemberzions:ProductsAndServicesOtherCustomerRelatedFeesMemberzions:VectraBankColoradoSegmentMember2022-01-012022-12-310000109380us-gaap:OperatingSegmentsMemberzions:ProductsAndServicesOtherCustomerRelatedFeesMemberzions:VectraBankColoradoSegmentMember2021-01-012021-12-310000109380us-gaap:OperatingSegmentsMemberzions:NationalBankOfArizonaSegmentMember2023-01-012023-12-310000109380us-gaap:OperatingSegmentsMemberzions:NationalBankOfArizonaSegmentMember2022-01-012022-12-310000109380us-gaap:OperatingSegmentsMemberzions:NationalBankOfArizonaSegmentMember2021-01-012021-12-310000109380us-gaap:OperatingSegmentsMemberzions:NevadaStateBankSegmentMember2023-01-012023-12-310000109380us-gaap:OperatingSegmentsMemberzions:NevadaStateBankSegmentMember2022-01-012022-12-310000109380us-gaap:OperatingSegmentsMemberzions:NevadaStateBankSegmentMember2021-01-012021-12-310000109380us-gaap:OperatingSegmentsMemberzions:VectraBankColoradoSegmentMember2023-01-012023-12-310000109380us-gaap:OperatingSegmentsMemberzions:VectraBankColoradoSegmentMember2022-01-012022-12-310000109380us-gaap:OperatingSegmentsMemberzions:VectraBankColoradoSegmentMember2021-01-012021-12-310000109380us-gaap:OperatingSegmentsMemberzions:ProductsAndServicesCommercialAccountFeesMemberzions:CommerceBankOfWashingtonSegmentMember2023-01-012023-12-310000109380us-gaap:OperatingSegmentsMemberzions:ProductsAndServicesCommercialAccountFeesMemberzions:CommerceBankOfWashingtonSegmentMember2022-01-012022-12-310000109380us-gaap:OperatingSegmentsMemberzions:ProductsAndServicesCommercialAccountFeesMemberzions:CommerceBankOfWashingtonSegmentMember2021-01-012021-12-310000109380zions:ProductsAndServicesCommercialAccountFeesMemberzions:CorporateReconcilingItemsAndEliminationsMember2023-01-012023-12-310000109380zions:ProductsAndServicesCommercialAccountFeesMemberzions:CorporateReconcilingItemsAndEliminationsMember2022-01-012022-12-310000109380zions:ProductsAndServicesCommercialAccountFeesMemberzions:CorporateReconcilingItemsAndEliminationsMember2021-01-012021-12-310000109380zions:ProductsAndServicesCommercialAccountFeesMember2023-01-012023-12-310000109380zions:ProductsAndServicesCommercialAccountFeesMember2022-01-012022-12-310000109380zions:ProductsAndServicesCommercialAccountFeesMember2021-01-012021-12-310000109380zions:ProductsAndServicesCardFeesMemberus-gaap:OperatingSegmentsMemberzions:CommerceBankOfWashingtonSegmentMember2023-01-012023-12-310000109380zions:ProductsAndServicesCardFeesMemberus-gaap:OperatingSegmentsMemberzions:CommerceBankOfWashingtonSegmentMember2022-01-012022-12-310000109380zions:ProductsAndServicesCardFeesMemberus-gaap:OperatingSegmentsMemberzions:CommerceBankOfWashingtonSegmentMember2021-01-012021-12-310000109380zions:ProductsAndServicesCardFeesMemberzions:CorporateReconcilingItemsAndEliminationsMember2023-01-012023-12-310000109380zions:ProductsAndServicesCardFeesMemberzions:CorporateReconcilingItemsAndEliminationsMember2022-01-012022-12-310000109380zions:ProductsAndServicesCardFeesMemberzions:CorporateReconcilingItemsAndEliminationsMember2021-01-012021-12-310000109380zions:ProductsAndServicesCardFeesMember2023-01-012023-12-310000109380zions:ProductsAndServicesCardFeesMember2022-01-012022-12-310000109380zions:ProductsAndServicesCardFeesMember2021-01-012021-12-310000109380us-gaap:OperatingSegmentsMemberzions:ProductsAndServicesRetailAndBusinessBankingFeesMemberzions:CommerceBankOfWashingtonSegmentMember2023-01-012023-12-310000109380us-gaap:OperatingSegmentsMemberzions:ProductsAndServicesRetailAndBusinessBankingFeesMemberzions:CommerceBankOfWashingtonSegmentMember2022-01-012022-12-310000109380us-gaap:OperatingSegmentsMemberzions:ProductsAndServicesRetailAndBusinessBankingFeesMemberzions:CommerceBankOfWashingtonSegmentMember2021-01-012021-12-310000109380zions:ProductsAndServicesRetailAndBusinessBankingFeesMemberzions:CorporateReconcilingItemsAndEliminationsMember2023-01-012023-12-310000109380zions:ProductsAndServicesRetailAndBusinessBankingFeesMemberzions:CorporateReconcilingItemsAndEliminationsMember2022-01-012022-12-310000109380zions:ProductsAndServicesRetailAndBusinessBankingFeesMemberzions:CorporateReconcilingItemsAndEliminationsMember2021-01-012021-12-310000109380zions:ProductsAndServicesRetailAndBusinessBankingFeesMember2023-01-012023-12-310000109380zions:ProductsAndServicesRetailAndBusinessBankingFeesMember2022-01-012022-12-310000109380zions:ProductsAndServicesRetailAndBusinessBankingFeesMember2021-01-012021-12-310000109380us-gaap:OperatingSegmentsMemberzions:CommerceBankOfWashingtonSegmentMemberzions:ProductsAndServicesCapitalMarketsFeesMember2023-01-012023-12-310000109380us-gaap:OperatingSegmentsMemberzions:CommerceBankOfWashingtonSegmentMemberzions:ProductsAndServicesCapitalMarketsFeesMember2022-01-012022-12-310000109380us-gaap:OperatingSegmentsMemberzions:CommerceBankOfWashingtonSegmentMemberzions:ProductsAndServicesCapitalMarketsFeesMember2021-01-012021-12-310000109380zions:CorporateReconcilingItemsAndEliminationsMemberzions:ProductsAndServicesCapitalMarketsFeesMember2023-01-012023-12-310000109380zions:CorporateReconcilingItemsAndEliminationsMemberzions:ProductsAndServicesCapitalMarketsFeesMember2022-01-012022-12-310000109380zions:CorporateReconcilingItemsAndEliminationsMemberzions:ProductsAndServicesCapitalMarketsFeesMember2021-01-012021-12-310000109380zions:ProductsAndServicesCapitalMarketsFeesMember2023-01-012023-12-310000109380zions:ProductsAndServicesCapitalMarketsFeesMember2022-01-012022-12-310000109380zions:ProductsAndServicesCapitalMarketsFeesMember2021-01-012021-12-310000109380zions:ProductsAndServicesWealthManagementFeesMemberus-gaap:OperatingSegmentsMemberzions:CommerceBankOfWashingtonSegmentMember2023-01-012023-12-310000109380zions:ProductsAndServicesWealthManagementFeesMemberus-gaap:OperatingSegmentsMemberzions:CommerceBankOfWashingtonSegmentMember2022-01-012022-12-310000109380zions:ProductsAndServicesWealthManagementFeesMemberus-gaap:OperatingSegmentsMemberzions:CommerceBankOfWashingtonSegmentMember2021-01-012021-12-310000109380zions:ProductsAndServicesWealthManagementFeesMemberzions:CorporateReconcilingItemsAndEliminationsMember2023-01-012023-12-310000109380zions:ProductsAndServicesWealthManagementFeesMemberzions:CorporateReconcilingItemsAndEliminationsMember2022-01-012022-12-310000109380zions:ProductsAndServicesWealthManagementFeesMemberzions:CorporateReconcilingItemsAndEliminationsMember2021-01-012021-12-310000109380zions:ProductsAndServicesWealthManagementFeesMember2023-01-012023-12-310000109380zions:ProductsAndServicesWealthManagementFeesMember2022-01-012022-12-310000109380zions:ProductsAndServicesWealthManagementFeesMember2021-01-012021-12-310000109380us-gaap:OperatingSegmentsMemberzions:CommerceBankOfWashingtonSegmentMemberzions:ProductsAndServicesOtherCustomerRelatedFeesMember2023-01-012023-12-310000109380us-gaap:OperatingSegmentsMemberzions:CommerceBankOfWashingtonSegmentMemberzions:ProductsAndServicesOtherCustomerRelatedFeesMember2022-01-012022-12-310000109380us-gaap:OperatingSegmentsMemberzions:CommerceBankOfWashingtonSegmentMemberzions:ProductsAndServicesOtherCustomerRelatedFeesMember2021-01-012021-12-310000109380zions:CorporateReconcilingItemsAndEliminationsMemberzions:ProductsAndServicesOtherCustomerRelatedFeesMember2023-01-012023-12-310000109380zions:CorporateReconcilingItemsAndEliminationsMemberzions:ProductsAndServicesOtherCustomerRelatedFeesMember2022-01-012022-12-310000109380zions:CorporateReconcilingItemsAndEliminationsMemberzions:ProductsAndServicesOtherCustomerRelatedFeesMember2021-01-012021-12-310000109380zions:ProductsAndServicesOtherCustomerRelatedFeesMember2023-01-012023-12-310000109380zions:ProductsAndServicesOtherCustomerRelatedFeesMember2022-01-012022-12-310000109380zions:ProductsAndServicesOtherCustomerRelatedFeesMember2021-01-012021-12-310000109380us-gaap:OperatingSegmentsMemberzions:CommerceBankOfWashingtonSegmentMember2023-01-012023-12-310000109380us-gaap:OperatingSegmentsMemberzions:CommerceBankOfWashingtonSegmentMember2022-01-012022-12-310000109380us-gaap:OperatingSegmentsMemberzions:CommerceBankOfWashingtonSegmentMember2021-01-012021-12-310000109380zions:CorporateReconcilingItemsAndEliminationsMember2023-01-012023-12-310000109380zions:CorporateReconcilingItemsAndEliminationsMember2022-01-012022-12-310000109380zions:CorporateReconcilingItemsAndEliminationsMember2021-01-012021-12-310000109380us-gaap:SupplementalEmployeeRetirementPlanDefinedBenefitMember2023-12-310000109380us-gaap:SupplementalEmployeeRetirementPlanDefinedBenefitMember2022-12-310000109380us-gaap:OtherPostretirementBenefitPlansDefinedBenefitMember2022-12-310000109380us-gaap:OtherPostretirementBenefitPlansDefinedBenefitMember2023-12-310000109380us-gaap:EmployeeStockOptionMember2023-01-012023-12-310000109380zions:ExercisePriceRangeZeroPointThreeTwoToNineteenPointNineNineMember2023-01-012023-12-310000109380zions:ExercisePriceRangeZeroPointThreeTwoToNineteenPointNineNineMember2023-12-310000109380zions:ExercisePriceRangeTwentyFivePointZeroZeroToTwentyNinePointNineNineMember2023-01-012023-12-310000109380zions:ExercisePriceRangeTwentyFivePointZeroZeroToTwentyNinePointNineNineMember2023-12-310000109380zions:ExercisePriceRangeFortyPointZeroZeroToFortyFourPointNineNineMember2023-01-012023-12-310000109380zions:ExercisePriceRangeFortyPointZeroZeroToFortyFourPointNineNineMember2023-12-310000109380zions:ExercisePriceRangeFortyFivePointZeroZeroToFortyNinePointNineNineMember2023-01-012023-12-310000109380zions:ExercisePriceRangeFortyFivePointZeroZeroToFortyNinePointNineNineMember2023-12-310000109380zions:ExercisePriceRangeFiftyPointZeroZeroToFiftyNinePointNineNineMember2023-01-012023-12-310000109380zions:ExercisePriceRangeFiftyPointZeroZeroToFiftyNinePointNineNineMember2023-12-310000109380zions:ExercisePriceRangeSitxyPointZeroZeroToSeventyThreePointTwoTwoMember2023-01-012023-12-310000109380zions:ExercisePriceRangeSitxyPointZeroZeroToSeventyThreePointTwoTwoMember2023-12-310000109380us-gaap:EmployeeStockOptionMember2022-01-012022-12-310000109380us-gaap:RestrictedStockMember2023-01-012023-12-310000109380us-gaap:RestrictedStockUnitsRSUMember2023-12-310000109380us-gaap:RestrictedStockUnitsRSUMember2023-01-012023-12-310000109380us-gaap:RestrictedStockUnitsRSUMembersrt:DirectorMember2023-01-012023-12-310000109380us-gaap:RestrictedStockUnitsRSUMembersrt:DirectorMember2022-01-012022-12-310000109380us-gaap:RestrictedStockUnitsRSUMembersrt:DirectorMember2021-01-012021-12-310000109380us-gaap:RestrictedStockMember2020-12-310000109380us-gaap:RestrictedStockMember2021-01-012021-12-310000109380us-gaap:RestrictedStockMember2021-12-310000109380us-gaap:RestrictedStockMember2022-01-012022-12-310000109380us-gaap:RestrictedStockMember2022-12-310000109380us-gaap:RestrictedStockMember2023-12-310000109380us-gaap:RestrictedStockUnitsRSUMember2020-12-310000109380us-gaap:RestrictedStockUnitsRSUMember2021-01-012021-12-310000109380us-gaap:RestrictedStockUnitsRSUMember2021-12-310000109380us-gaap:RestrictedStockUnitsRSUMember2022-01-012022-12-310000109380us-gaap:RestrictedStockUnitsRSUMember2022-12-310000109380zions:RestrictedStockAndRestrictedStockUnitsRSUsMember2023-01-012023-12-310000109380zions:RestrictedStockAndRestrictedStockUnitsRSUsMember2022-01-012022-12-310000109380zions:RestrictedStockAndRestrictedStockUnitsRSUsMember2021-01-012021-12-310000109380us-gaap:EmployeeStockOptionMember2023-01-012023-12-310000109380us-gaap:EmployeeStockOptionMember2022-01-012022-12-310000109380us-gaap:EmployeeStockOptionMember2021-01-012021-12-310000109380stpr:UTzions:ZionsBankSegmentMember2023-12-310000109380zions:ZionsBankSegmentMemberstpr:ID2023-12-310000109380stpr:WYzions:ZionsBankSegmentMember2023-12-310000109380stpr:CAzions:CaliforniaBankAndTrustSegmentMember2023-12-310000109380stpr:TXzions:AmegyCorporationSegmentMember2023-12-310000109380stpr:AZzions:NationalBankOfArizonaSegmentMember2023-12-310000109380stpr:NVzions:NevadaStateBankSegmentMember2023-12-310000109380stpr:COzions:VectraBankColoradoSegmentMember2023-12-310000109380stpr:NMzions:VectraBankColoradoSegmentMember2023-12-310000109380stpr:WAzions:CommerceBankOfWashingtonSegmentMember2023-12-310000109380stpr:ORzions:CommerceBankOfWashingtonSegmentMember2023-12-310000109380stpr:NVzions:NevadaStateBankSegmentMember2022-07-012022-07-3100001093802022-07-012022-07-3100001093802023-10-012023-12-3100001093802023-07-012023-09-3000001093802023-04-012023-06-3000001093802023-01-012023-03-3100001093802022-07-012022-09-3000001093802022-04-012022-06-3000001093802022-01-012022-03-31
UNITED STATES
SECURITIES AND EXCHANGE COMMISSION
Washington, D.C. 20549
FORM 10-K
☒ ANNUAL REPORT PURSUANT TO SECTION 13 OR 15(d) OF THE SECURITIES EXCHANGE ACT OF 1934
For the fiscal year ended December 31, 2023
OR
☐ TRANSITION REPORT PURSUANT TO SECTION 13 OR 15(d) OF THE SECURITIES EXCHANGE ACT OF 1934
For the transition period from __________ to __________
COMMISSION FILE NUMBER 001-12307
ZIONS BANCORPORATION, NATIONAL ASSOCIATION
(Exact name of registrant as specified in its charter)
|
|
|
|
|
|
United States of America |
87-0189025 |
(State or other jurisdiction of
incorporation or organization) |
(IRS Employer
Identification Number) |
One South Main, Salt Lake City, Utah |
84133-1109 |
| (Address of principal executive offices) |
(Zip Code) |
Registrant’s telephone number, including area code: (801) 844-8208
Securities registered pursuant to Section 12(b) of the Act:
|
|
|
|
|
|
|
|
|
| Title of Each Class |
Trading Symbols |
Name of Each Exchange on Which Registered |
Common Stock, par value $0.001 |
ZION |
The NASDAQ Stock Market LLC |
| Depositary Shares each representing a 1/40th ownership interest in a share of: |
|
|
Series A Floating-Rate Non-Cumulative Perpetual Preferred Stock |
ZIONP |
The NASDAQ Stock Market LLC |
Series G Fixed/Floating-Rate Non-Cumulative Perpetual Preferred Stock |
ZIONO |
The NASDAQ Stock Market LLC |
|
|
|
6.95% Fixed-to-Floating Rate Subordinated Notes due September 15, 2028 |
ZIONL |
The NASDAQ Stock Market LLC |
Securities registered pursuant to Section 12(g) of the Act: None.
•Indicate by check mark if the registrant is a well-known seasoned issuer, as defined in Rule 405 of the Securities Act. Yes ☒ No ¨
•Indicate by check mark if the registrant is not required to file reports pursuant to Section 13 or Section 15(d) of the Act. Yes ¨ No ☒
•Indicate by check mark whether the registrant (1) has filed all reports required to be filed by Section 13 or 15(d) of the Securities Exchange Act of 1934 during the preceding 12 months (or for such shorter period that the registrant was required to file such reports), and (2) has been subject to such filing requirements for the past 90 days. Yes ý No ¨
•Indicate by check mark whether the registrant has submitted electronically every Interactive Data File required to be submitted pursuant to Rule 405 of Regulation S-T (§232.405 of this chapter) during the preceding 12 months (or for such shorter period that the registrant was required to submit such files). Yes ý No ¨
•Indicate by check mark whether the registrant is a large accelerated filer, an accelerated filer, a non-accelerated filer, a smaller reporting company, or an emerging growth company. See the definitions of “large accelerated filer,” “accelerated filer,” “smaller reporting company,” and “emerging growth company” in Rule 12b-2 of the Exchange Act.
Large accelerated filer ý Accelerated filer ☐ Non-accelerated filer ☐ Smaller reporting company ☐ Emerging growth company ☐
•If an emerging growth company, indicate by check mark if the registrant has elected not to use the extended transition period for complying with any new or revised financial accounting standards provided pursuant to Section 13(a) of the Exchange Act. ¨
•Indicate by check mark whether the registrant has filed a report on and attestation to its management’s assessment of the effectiveness of its internal control over financial reporting under Section 404(b) of the Sarbanes-Oxley Act (15 U.S.C. 7262(b)) by the registered public accounting firm that prepared or issued its audit report. ý
•If securities are registered pursuant to Section 12(b) of the Act, indicate by check mark whether the financial statements of the registrant included in the filing reflect the correction of an error to previously issued financial statements. ☐
•Indicate by check mark whether any of those error corrections are restatements that required a recovery analysis of incentive-based compensation received by any of the registrant’s executive officers during the relevant recovery period pursuant to §240.10D-1(b). ☐
•Indicate by check mark whether the registrant is a shell company (as defined in Rule 12b-2 of the Exchange Act). Yes ¨ No ý
Aggregate Market Value of Common Stock Held by Non-affiliates at June 30, 2023 $3,892,923,377
Number of Common Shares Outstanding at February 5, 2024 148,155,311 shares
Documents Incorporated by Reference:
Part III: Items 10-14 — Proxy Statement for the 2024 Annual Meeting of Shareholders to be held April 26, 2024.
ZIONS BANCORPORATION, NATIONAL ASSOCIATION AND SUBSIDIARIES
TABLE OF CONTENTS
ZIONS BANCORPORATION, NATIONAL ASSOCIATION AND SUBSIDIARIES
GLOSSARY OF ACRONYMS AND ABBREVIATIONS
|
|
|
|
|
|
|
|
|
|
|
|
| ACL |
Allowance for Credit Losses |
FRB |
Federal Reserve Board |
| AFS |
Available-for-Sale |
FTP |
Funds Transfer Pricing |
| AI |
Artificial Intelligence |
GAAP |
Generally Accepted Accounting Principles |
| ALCO |
Asset/Liability Committee |
GCF |
General Collateral Funding |
| ALLL |
Allowance for Loan and Lease Losses |
GDP |
Gross Domestic Product |
| Amegy |
Amegy Bank, a division of Zions Bancorporation, National Association |
HECL |
Home Equity Credit Line |
| AOCI |
Accumulated Other Comprehensive Income |
HTM |
Held-to-Maturity |
| ASC |
Accounting Standards Codification |
IPO |
Initial Public Offering |
| ASU |
Accounting Standards Update |
IRS |
Internal Revenue Service |
| ATM |
Automated Teller Machine |
ISDA |
International Swaps and Derivative Association |
| BOLI |
Bank-Owned Life Insurance |
KBW |
Keefe, Bruyette & Woods, Inc. |
| bps |
Basis Points |
KRX |
KBW Regional Bank Index |
| BTFP |
Bank Term Funding Program |
LIBOR |
London Interbank Offered Rate |
| CB&T |
California Bank & Trust, a division of Zions Bancorporation, National Association |
LIHTC |
Low-Income Housing Tax Credit |
| CECL |
Current Expected Credit Loss |
MD&A |
Management’s Discussion and Analysis |
| CET1 |
Common Equity Tier 1 (Basel III) |
Municipalities |
State and Local Governments |
| CFPB |
Consumer Financial Protection Bureau |
NAICS |
North American Industry Classification System |
| CISO |
Chief Information Security Officer |
NASDAQ |
National Association of Securities Dealers Automated Quotations |
| CLTV |
Combined Loan-to-Value Ratio |
NAV |
Net Asset Value |
| CMBS |
Commercial Mortgage-Backed Security |
NBAZ |
National Bank of Arizona, a division of Zions Bancorporation, National Association |
| CMC |
Capital Management Committee |
NIM |
Net Interest Margin |
| CODM |
Chief Operating Decision Maker |
NM |
Not Meaningful |
| COSO |
Committee of Sponsoring Organizations of the Treadway Commission |
NSB |
Nevada State Bank, a division of Zions Bancorporation, National Association |
| CRA |
Community Reinvestment Act |
OCC |
Office of the Comptroller of the Currency |
| CRE |
Commercial Real Estate |
OCI |
Other Comprehensive Income |
| CSA |
Credit Support Annex |
OREO |
Other Real Estate Owned |
| CSV |
Cash Surrender Value |
PAM |
Proportional Amortization Method |
| CTOO |
Chief Technology and Operations Officer |
PCAOB |
Public Company Accounting Oversight Board |
| CVA |
Credit Valuation Adjustment |
PEI |
Private Equity Investment |
| Dodd-Frank Act |
Dodd-Frank Wall Street Reform and Consumer Protection Act |
PPNR |
Pre-provision Net Revenue |
| DTA |
Deferred Tax Asset |
PPP |
Paycheck Protection Program |
| DTL |
Deferred Tax Liability |
ROC |
Risk Oversight Committee |
| EaR |
Earnings at Risk |
ROU |
Right-of-Use |
| EPS |
Earnings per Share |
RSU |
Restricted Stock Unit |
| ERM |
Enterprise Risk Management |
RULC |
Reserve for Unfunded Lending Commitments |
| ERMC |
Enterprise Risk Management Committee |
S&P |
Standard and Poor’s |
| ETO |
Enterprise and Technology Operations |
SBA |
U.S. Small Business Administration |
| EVE |
Economic Value of Equity at Risk |
SBIC |
Small Business Investment Company |
| FAMC |
Federal Agricultural Mortgage Corporation, or “Farmer Mac” |
SEC |
Securities and Exchange Commission |
| FASB |
Financial Accounting Standards Board |
SOFR |
Secured Overnight Financing Rate |
| FDIC |
Federal Deposit Insurance Corporation |
TCBW |
The Commerce Bank of Washington, a division of Zions Bancorporation, National Association |
| FDICIA |
Federal Deposit Insurance Corporation Improvement Act |
TDR |
Troubled Debt Restructuring |
| FHLB |
Federal Home Loan Bank |
U.S. |
United States |
| FICO |
Fair Isaac Corporation |
Vectra |
Vectra Bank Colorado, a division of Zions Bancorporation, National Association |
| FINRA |
Financial Industry Regulatory Authority |
VIE |
Variable Interest Entity |
| Fintech |
Financial Technology Company |
Zions Bank |
Zions Bank, a division of Zions Bancorporation, National Association |
ZIONS BANCORPORATION, NATIONAL ASSOCIATION AND SUBSIDIARIES
PART I
FORWARD-LOOKING INFORMATION
This annual report includes “forward-looking statements” as that term is defined in the Private Securities Litigation Reform Act of 1995. These statements are based on management’s current expectations and assumptions regarding future events or determinations, all of which are subject to known and unknown risks, uncertainties, and other factors that may cause our actual results, performance or achievements, industry trends, and results or regulatory outcomes to differ materially from those expressed or implied. Forward-looking statements include, among others:
•Statements with respect to the beliefs, plans, objectives, goals, targets, commitments, designs, guidelines, expectations, anticipations, and future financial condition, results of operations and performance of Zions Bancorporation, National Association and its subsidiaries (collectively “Zions Bancorporation, N.A.,” “the Bank,” “we,” “our,” “us”); and
•Statements preceded or followed by, or that include the words “may,” “might,” “can,” “continue,” “could,” “should,” “would,” “believe,” “anticipate,” “estimate,” “forecasts,” “expect,” “intend,” “target,” “commit,” “design,” “plan,” “projects,” “will,” and the negative thereof and similar words and expressions.
Forward-looking statements are not guarantees, nor should they be relied upon as representing management’s views as of any subsequent date. Actual results and outcomes may differ materially from those presented. Although the following list is not comprehensive, important factors that may cause material differences include:
•The quality and composition of our loan and securities portfolios and the quality and composition of our deposits;
•Changes in general industry, political and economic conditions, including continued elevated inflation, economic slowdown or recession, or other economic challenges; changes in interest and reference rates, which could adversely affect our revenue and expenses, the value of assets and liabilities, and the availability and cost of capital and liquidity; deterioration in economic conditions that may result in increased loan and leases losses;
•The impact of bank closures or adverse developments at other banks on general investor sentiment regarding the stability and liquidity of banks;
•Competitive pressures and other factors that may affect aspects of our business, such as pricing and demand for our products and services, our ability to recruit and retain talent, and the impact of technological advancements, digital commerce, artificial intelligence, and other innovations affecting the banking industry;
•Our ability to complete projects and initiatives and execute on our strategic plans, manage our risks, control compensation and other expenses, and achieve our business objectives;
•Our ability to develop and maintain technology, information security systems and controls designed to guard against fraud, cybersecurity, and privacy risks;
•Our ability to provide adequate oversight of our suppliers or prevent inadequate performance by third parties upon whom we rely for the delivery of various products and services;
•Natural disasters, pandemics, catastrophic events and other emergencies and incidents and their impact on our and our customer’s operations and business and communities, including the increasing difficulty in, and the expense of, obtaining property, auto, business, and other insurance products;
•Governmental and social responses to environmental, social, and governance issues, including those with respect to climate change;
•Securities and capital markets behavior, including volatility and changes in market liquidity and our ability to raise capital;
•The possibility that our recorded goodwill could become impaired, which may have an adverse impact on our earnings and shareholders’ equity, but not on our regulatory capital;
ZIONS BANCORPORATION, NATIONAL ASSOCIATION AND SUBSIDIARIES
•The effects of newly enacted and proposed regulations affecting us and the banking industry, as well as changes and uncertainties in applicable laws, and fiscal, monetary, regulatory, trade, and tax policies, and actions taken by governments, agencies, central banks, and similar organizations, including those that result in decreases in revenue; increases in bank fees, insurance assessments and capital standards; and other regulatory requirements;
•Adverse news and other expressions of negative public opinion whether directed at us, other banks, the banking industry, or otherwise that may adversely affect our reputation and that of the banking industry generally;
•Protracted congressional negotiations and political stalemates regarding government funding and other issues, including those that increase the possibility of government shutdowns, downgrades in United States (“U.S.”) credit ratings, or other economic disruptions; and
•The effects of wars and geopolitical conflicts, such as the ongoing war between Russia and Ukraine and the conflicts in the Middle East, and other local, national, or international disasters, crises, or conflicts that may occur in the future.
We caution against the undue reliance on forward-looking statements, which reflect our views only as of the date they are made. Except to the extent required by law, we specifically disclaim any obligation to update any factors or to publicly announce the revisions to any forward-looking statements to reflect future events or developments.
ITEM 1. BUSINESS
DESCRIPTION OF BUSINESS
Zions Bancorporation, National Association (“Zions Bancorporation, N.A.,” “the Bank,” “we,” “our,” “us”) is a bank headquartered in Salt Lake City, Utah with annual net revenue (net interest income and noninterest income) of $3.1 billion in 2023, and total assets of approximately $87 billion at December 31, 2023. We provide a wide range of banking products and related services, primarily in the states of Arizona, California, Colorado, Idaho, Nevada, New Mexico, Oregon, Texas, Utah, Washington, and Wyoming. We had more than one million customers at year-end 2023, served by 407 branches and various online, mobile, and digital offerings. We had 9,679 full-time equivalent employees at December 31, 2023.
We conduct our operations primarily through seven separately managed and geographically defined bank divisions, which we refer to as “affiliates,” or “affiliate banks,” each with its own local branding and management team. These affiliate banks comprise our primary business segments as referred to throughout this document. We emphasize local authority, responsibility, pricing, and customization of certain products that are designed to maximize customer satisfaction and strengthen community relations. Our affiliate banks are supported by an enterprise operating segment (referred to as the “Other” segment) that provides governance and risk management, allocates capital, establishes strategic objectives, and includes centralized technology, back-office functions, and certain lines of business not operated through our affiliate banks. For more information about our segments, see “Business Segment Results” in Management’s Discussion and Analysis (“MD&A”) on page 42 and Note 22 of the Notes to Consolidated Financial Statements.
PRODUCTS AND SERVICES
We focus on serving customers in the communities in which we operate. Our experienced bankers strive to develop long-lasting relationships with our customers by providing competitive products and award-winning service. Building and sustaining these relationships is essential to understanding and meeting our customers’ needs. Some of the products and services we provide, whether delivered digitally or by other means, include:
•Commercial and small business banking. We serve a wide range of commercial customers, generally small- and medium-sized businesses. Products and services we provide to our commercial and small business banking customers include:
◦Commercial and industrial and owner-occupied lending and leasing;
◦Municipal and public finance services;
◦Depository account and cash management services; ◦Commercial and small business cards, as well as merchant processing services;
ZIONS BANCORPORATION, NATIONAL ASSOCIATION AND SUBSIDIARIES
◦Corporate trust services; and
◦Correspondent banking and international lending services.
•Capital markets and investment banking. We provide customized financing solutions to help our customers raise capital efficiently, execute strategic transactions, and manage exposure to financial markets. Capital markets products and services include:
◦Loan syndications;
◦Foreign exchange services and interest rate derivatives;
◦Fixed income securities underwriting;
◦Advisory and capital raising;
◦Commercial mortgage-backed security (“CMBS”) conduit lending; and
◦Power and project financing.
•Commercial real estate lending. We provide lending products secured by commercial real estate to borrowers that include:
◦Term and construction/land development financing, including the following collateral types:
▪Commercial multi-family, industrial, and office; and
▪Residential single-family, community development, and affordable housing.
•Retail banking. We provide quality retail banking products and services to our customers that include:
◦Residential mortgages;
◦Home equity lines of credit;
◦Personal lines of credit and installment consumer loans;
◦Depository account services;
◦Consumer cards; and
◦Personal trust services.
•Wealth management. We offer various wealth management products and services to customers. Our planning-driven offerings, combined with high-touch service and sophisticated asset management capabilities, have resulted in continued growth in assets under management. Additional offerings to our wealth management customers include:
◦Investment management services;
◦Fiduciary and estate services; and
◦Advanced business succession and estate planning services.
COMPETITION
We operate in a highly competitive environment. Our most direct competition for loans, deposits, and other banking services generally comes from other commercial banks, credit unions, financial technology companies (“fintechs”), and private credit or debt funds. Some of these financial institutions do not have a physical presence in our market footprint, but solicit business via the internet and other means. We also compete with finance companies, mutual fund companies, insurance companies, brokerage firms, securities dealers, investment banking companies, other nontraditional lending and banking companies, and a variety of other types of companies. Some of our competitors may have fewer regulatory constraints, greater ability to develop, implement, and offer technologies and other innovative financial services, and lower-cost structures, taxes, and regulatory burdens.
Our key differentiators include the quality of service delivered, our local community knowledge, convenience of branch and office locations, a wide range of products and services offered, and the overall relationships with our customers. We strive to compete effectively in all of these areas to remain successful.
ZIONS BANCORPORATION, NATIONAL ASSOCIATION AND SUBSIDIARIES
SUPERVISION AND REGULATION
The banking and financial services business in which we engage is highly regulated. Such regulation is intended to promote the stability of banking and financial companies and to protect the interests of customers, depositors, and communities. Although banks and their customers benefit from many of these regulations, in some cases, they may not be aligned with, or intended to protect, the interests of our shareholders or creditors. Banking laws and regulations have given financial regulators expanded powers over many aspects of the financial services industry, which have reduced, and may continue to reduce, returns earned by shareholders. Furthermore, changes in applicable laws or regulations, and in their application by regulatory agencies cannot be predicted and may have a material effect on our business and results.
General
We are subject to the provisions of the National Bank Act and other statutes governing national banks, as well as the rules and regulations of the Office of the Comptroller of the Currency (“OCC”), the Consumer Financial Protection Bureau (“CFPB”), and the Federal Deposit Insurance Corporation (“FDIC”). We, as well as some of our subsidiaries, are also subject to regulation by other federal and state agencies. These regulatory agencies may exert considerable influence over our activities through their supervisory and examination roles. Our brokerage and investment advisory subsidiaries are regulated by the Securities and Exchange Commission (“SEC”), Financial Industry Regulatory Authority (“FINRA”), and state securities regulators.
The National Bank Act
Our corporate affairs are governed by the National Bank Act, and related regulations are administered by the OCC. With respect to securities matters, we are not subject to the Securities Act of 1933 (“Securities Act”), but are subject to OCC regulations governing securities offerings. Our common stock and certain other securities are registered under the Securities and Exchange Act of 1934 (“Exchange Act”), which vests the OCC with the power to administer and enforce certain sections of the Exchange Act applicable to national banks, though we continue to make filings required by the Exchange Act with the SEC as a voluntary filer. These statutory and regulatory frameworks are not as well-developed as the corporate and securities law frameworks applicable to many other publicly held companies.
The National Bank Act provides that under certain circumstances the common stock of a national bank is assessable, i.e., holders may be subject to a levy for more funds if so determined by the OCC. The OCC has confirmed that under the applicable provisions of the National Bank Act, assessability is limited to the par value of a national bank’s stock. Our common stock has a par value of $0.001. In addition, according to the OCC, it has not exercised its authority to levy assessments since 1933 and views the assessability authority as a mechanism for addressing capital deficiency that has long been overtaken by developments in statute and regulation, including supervisory and enforcement authorities requiring an institution to maintain capital at a particular level.
Capital Standards – Basel Framework
At December 31, 2023, we exceeded all capital adequacy requirements under the Basel III capital rules, which include certain risk-based capital and leverage ratio requirements prescribed by the OCC. The Basel III capital rules define the components of capital and other factors, such as risk weights, affecting banking institutions’ regulatory capital ratios.
The Basel III capital rules require us to maintain certain minimum capital ratios, as well as a 2.5% “capital conservation buffer,” which is designed to absorb losses during periods of economic stress, composed entirely of common equity Tier 1 (“CET1”). Financial institutions with a ratio of CET1 to risk-weighted assets above the minimum, but below the capital conservation buffer, face constraints on dividends, equity repurchases, and compensation based on the amount of the shortfall. The severity of the constraint depends on the amount of the shortfall and the institution’s “eligible retained income,” which is defined as four quarters of trailing net income, net of distributions and associated tax effects not already reflected in net income. For more information about our capital ratios, see “Capital Management” in MD&A on page 72.
ZIONS BANCORPORATION, NATIONAL ASSOCIATION AND SUBSIDIARIES
Prompt Corrective Action
The Federal Deposit Insurance Corporation Improvement Act (“FDICIA”) requires each federal banking agency to take prompt corrective action to resolve identified problems of insured depository institutions, including, but not limited to, those that fall below one or more prescribed minimum capital ratios. Pursuant to FDICIA, the FDIC promulgated regulations defining the following five categories in which an insured depository institution will be placed, based on the level of its capital ratios: well-capitalized, adequately capitalized, under-capitalized, significantly under-capitalized, and critically under-capitalized.
Under the prompt corrective action provisions of FDICIA as modified by the Basel III capital rules, an insured depository institution will generally be classified as well-capitalized if it has a CET1 ratio of at least 6.5%, a Tier 1 risk-based capital ratio of at least 8%, a total risk-based capital ratio of at least 10%, and a Tier 1 leverage ratio of at least 5%. An insured depository institution will generally be classified as under-capitalized if it has a CET1 ratio less than 4.5%, a Tier 1 risk-based capital ratio less than 6%, a total risk-based capital ratio less than 8%, and a Tier 1 leverage ratio less than 4%.
An institution that is classified as well-capitalized, adequately capitalized, or under-capitalized, may be treated as though it were in the next lower capital category if the appropriate federal banking agency, after notice and opportunity for hearing, determines that an unsafe or unsound condition or an unsafe or unsound practice warrants such treatment. At each successive lower capital category, an insured depository institution is subject to more restrictions and prohibitions, including restrictions on growth, interest rates paid on deposits, the acceptance of brokered deposits, and restrictions or prohibitions on the payment of dividends. Furthermore, if a bank is classified in one of the under-capitalized categories, it is required to submit a capital restoration plan to the federal banking regulator.
The following schedule presents minimum capital ratio and capital conservation buffer requirements, our capital ratios at December 31, 2023, and the minimum requirements to be well-capitalized:
Schedule 1
MINIMUM CAPITAL RATIO AND CAPITAL CONSERVATION BUFFER REQUIREMENTS
|
|
|
|
|
|
|
|
|
|
|
|
|
|
|
|
|
|
|
|
December 31, 2023 |
Minimum requirement to be “well-capitalized” |
|
Minimum capital requirement |
Capital conservation buffer |
Minimum capital ratio requirement with capital conservation buffer |
|
Current capital
ratio |
|
|
|
|
|
|
|
| CET1 to risk-weighted assets |
4.5 |
% |
2.5 |
% |
7.0 |
% |
|
10.3 |
% |
6.5 |
% |
| Tier 1 capital (i.e., CET1 plus additional Tier 1 capital) to risk-weighted assets |
6.0 |
|
2.5 |
|
8.5 |
|
|
10.9 |
|
8.0 |
|
| Total capital (i.e., Tier 1 capital plus Tier 2 capital) to risk-weighted assets |
8.0 |
|
2.5 |
|
10.5 |
|
|
12.8 |
|
10.0 |
|
| Tier 1 capital to average consolidated assets (known as the “Tier 1 leverage ratio”) |
4.0 |
|
N/A |
4.0 |
|
|
8.3 |
|
5.0 |
|
Recent Regulatory Developments
Basel III Endgame
On July 27, 2023, bank regulators issued a proposal to implement the Basel Committee on Banking Supervision’s finalization of the post-crisis bank regulatory capital reforms. The proposal, commonly referred to as the “Basel III Endgame,” would significantly revise the capital requirements applicable to large banking organizations, defined as those with total assets of $100 billion or more. The proposal is subject to a three-year phase-in period for certain aspects of the proposal, and would be effective beginning July 1, 2025. At December 31, 2023, we had $87.2 billion in total assets and do not currently qualify as a large banking organization. We are evaluating the potential future impact of the proposal, as we expect it is more likely than not we would become subject to this proposal in the future, were it to be finalized in its current form.
ZIONS BANCORPORATION, NATIONAL ASSOCIATION AND SUBSIDIARIES
Under the proposal, if at such time we were to increase our total assets to $100 billion or more, we would, among other things, be required to (1) include certain components of accumulated other comprehensive income (“AOCI”) in regulatory capital and be subject to increased limitations on deferred tax assets (“DTAs”) as a percent of CET1, (2) hold capital for operational risk and market risk, and (3) calculate risk-based capital ratios under both the standardized approach and the expanded risk-based approach.
Long-term Debt
On August 29, 2023, bank regulators issued a proposal that would expand a long-term debt requirement to all banks with total assets of $100 billion or more. The proposed rule would require these banks to have a minimum outstanding amount of eligible long-term debt that is the greatest of (1) 6% of total risk-weighted assets, (2) 2.5% of total leverage exposure, and (3) 3.5% of average total assets. In the event we were to increase our total assets to $100 billion or more, we would have a three-year implementation period to issue debt and meet the other requirements under the proposal. At December 31, 2023, if enacted as proposed, the estimated amount of incremental debt that would be implied by the proposal (based on our asset size at year end) would be approximately $3.5 billion over the three year phase-in period. We expect that the issuance of incremental debt would replace other sources of funding.
Resolution Planning
Additionally, on August 29, 2023, the FDIC issued a proposal that would revise the requirements for resolution planning (“living wills”) for banks in two asset categories. Under the proposal, banks with total assets of $100 billion or more would be required to submit more detailed living wills, while banks with total assets between $50 billion and $100 billion would submit more limited information filings, in each case filed biennially beginning in 2025.
FDIC Special Assessment
In November 2023, the FDIC issued a final rule to implement a special assessment pursuant to a systemic risk determination to recover the costs associated with protecting uninsured depositors following the closures of Silicon Valley Bank and Signature Bank in early 2023. Using an assessment base equal to the estimated amount of uninsured deposits above $5 billion at December 31, 2022, the FDIC is expected to collect the special assessment from banks at an annual rate of approximately 13.4 basis points (“bps”) for an anticipated eight quarterly assessment periods, beginning with the first quarterly assessment period of 2024. At December 31, 2023, our estimated impact of the special assessment was approximately $90 million, which we recorded in deposit insurance and regulatory expense during the fourth quarter of 2023.
Capital Planning and Stress Testing
We utilize stress testing as an important mechanism to inform our decisions on the appropriate level of capital, based upon actual and hypothetically stressed economic conditions, which are comparable in severity to the scenarios published by the Federal Reserve Board (“FRB”). Our recent internal stress test included hypothetical scenarios that reflected (1) high inflation, (2) increased losses on commercial loans due to inflation and supply chain disruptions, (3) declining commercial property values, (4) increased losses on consumer loans due to falling home prices, (5) rising unemployment, and (6) other current economic, financial, and social disruptions. The results of our stress test indicated that we would maintain capital ratios in excess of regulatory minimum and capital conservation buffer requirements throughout the nine-quarter horizon for the hypothetical stress test.
Liquidity
We utilize internal liquidity stress tests as a primary tool for establishing and managing liquidity guidelines including, but not limited to, holdings of investment securities and other liquid assets, levels of readily available contingency funding, concentrations of funding sources, and the maturity profile of liabilities. At December 31, 2023, we had sources of liquidity that exceeded our uninsured deposits without the need to sell any investment securities. We continue to actively manage our deposit base and associated deposit costs in response to the higher interest rate environment. For more information about our liquidity profile, see “Liquidity Risk Management” in MD&A on page 67.
ZIONS BANCORPORATION, NATIONAL ASSOCIATION AND SUBSIDIARIES
Financial Privacy and Cybersecurity
The federal legislature and federal banking regulators have implemented laws and rules governing the use of consumer information by banks and other financial institutions, including provisions of the Gramm-Leach-Bliley Act. These laws and rules limit the ability of banks and other financial institutions to disclose nonpublic information about consumers to unaffiliated third parties, require financial institutions to disclose privacy policies to consumers and, in some circumstances, allow consumers to prevent disclosure of certain personal information to an unaffiliated third party. These laws and regulations also affect how consumer information is transmitted through diversified financial companies and conveyed to outside vendors. In addition, consumers may prevent disclosure of certain information among affiliated companies that is assembled or used to determine eligibility for a product or service, such as that shown on consumer credit reports and asset and income information from applications. Consumers also have the option to direct banks and other financial institutions not to share information about transactions and experiences with affiliated companies for the purpose of marketing products or services. Federal law makes it a criminal offense, except in limited circumstances, to obtain or attempt to obtain customer information of a financial nature by fraudulent or deceptive means.
Federal and state regulators have been increasingly active in implementing privacy and cybersecurity standards and regulations. For example, recently effective SEC rules now require timely disclosure of material cybersecurity incidents and description of cybersecurity risk management, strategy, and governance. Additionally, during the past several years, a growing number of states, including those in which we conduct business, have enacted, or are considering enacting, laws and regulations granting consumers enhanced privacy rights and control over personal information, establishing or modifying data breach notification requirements, and requiring certain financial institutions to implement detailed and prescriptive cybersecurity programs. Data and cybersecurity laws and regulations are evolving rapidly and remain a focus of state and federal regulators.
Other Regulations and Proposals
We are subject to a wide range of other requirements and restrictions contained in both federal and state laws. These regulations and other proposals include, but are not limited to, the following:
•Limitations on dividends payable to shareholders. Our ability to pay dividends on both our common and preferred stock is subject to regulatory restrictions. See Note 15 of the Notes to Consolidated Financial Statements for additional information.
•Safety and soundness standards prescribed in the FDICIA, including standards related to internal controls, information systems, internal audit, loan documentation, credit underwriting, interest rate exposure, asset growth and compensation, as well as other operational and management standards deemed appropriate by the federal banking agencies.
•Requirements for approval of acquisitions and restrictions on other activities. The National Bank Act requires regulatory and shareholder approval of all mergers between a national bank and another national or state bank and does not allow for the direct merger into a national bank of an unaffiliated nonbank. See further discussion in “Risk Factors.” Other laws and regulations governing national banks contain similar provisions concerning acquisitions and activities.
•Limits on interchange fees imposed under the Dodd-Frank Act, including a set of rules requiring that interchange transaction fees for electronic debit transactions be reasonable and proportional to certain costs associated with processing the transactions. In addition, the Federal Reserve has proposed revising Regulation II to lower debit interchange fees by almost 30% and institute a biennial review of the cap without accompanying public comment. If this proposal passes, it could reduce our fee income by approximately $10 million or more per year.
•Limitations on the dollar amount of loans made to a borrower and its affiliates.
•Limitations on transactions with affiliates.
•Restrictions on the nature and amount of any investments and ability to underwrite certain types of securities (e.g., common equity).
•Requirements for opening and closing of branches.
ZIONS BANCORPORATION, NATIONAL ASSOCIATION AND SUBSIDIARIES
•A number of federal and state consumer protection laws, including fair lending and truth in lending requirements, to provide equal access to credit and to protect consumers in credit transactions. In addition, as a bank with $10 billion or more in assets, we are subject to examination and primary enforcement authority with respect to consumer financial laws by the CFPB, which has broad rule making, supervisory, and enforcement powers under various federal consumer financial protection laws. These rules and regulations often have the effect of reducing bank revenues and returns earned by shareholders. As an example, the CFPB recently proposed extending certain truth in lending requirements to overdraft fees and placing other restrictions on various fees routinely charged by banks in exchange for providing financial services to customers.
•Community Reinvestment Act (“CRA”) requirements. The CRA requires banks to help serve the credit needs in their communities, including providing credit to low- and moderate-income individuals. If we fail to adequately serve our communities, penalties may be imposed including denials of applications to add branches, relocate, add subsidiaries and affiliates, and merge with or purchase other financial institutions. Banking agencies recently finalized rules that completely overhaul the evaluation framework used by regulators to assess a bank’s performance under and compliance with these requirements, which may make it more difficult for banks to achieve satisfactory ratings. The potential impact of these new rules on the Bank and the industry as a whole is currently under review.
•Requirements regarding the time, manner, and form of compensation given to key executives and other personnel receiving incentive compensation, including requirements related to the SEC’s 2022 rule on pay versus performance disclosures, and recently finalized rules regarding the clawback of executive pay in certain circumstances involving accounting restatements. These restrictions include documentation and governance, deferral, risk-balancing, and the aforementioned clawback requirements. Any deficiencies in compensation practices may be incorporated into supervisory ratings, which can affect our ability to make acquisitions or engage in certain other activities, or could result in regulatory enforcement actions.
•Anti-money laundering regulations. The Bank Secrecy Act, Title III of the Uniting and Strengthening of America by Providing Appropriate Tools Required to Intercept and Obstruct Terrorism Act of 2001 (“USA Patriot Act”), and other federal laws require financial institutions to assist U.S. government agencies in detecting and preventing money laundering and other illegal acts by maintaining policies, procedures and controls designed to detect and report money laundering, terrorist financing, and other suspicious activity.
•Tax laws of the U.S., its states, and other jurisdictions where we conduct business.
We are also subject to the Sarbanes-Oxley Act of 2002, certain provisions of the Dodd-Frank Act, and other federal and state laws and regulations which address, among other matters, corporate governance, auditing and accounting, internal controls over financial reporting, and enhanced and timely disclosure of corporate information.
Sustainability standards and related concerns, including those related to global climate change, continue to evolve and have become more prominent in recent years. We are closely monitoring developments in standards published by sustainability interest groups and organizations, as well as proposed regulatory initiatives and expectations relating to these issues. Although we believe the way we do business has been and is consistent with many of these standards and expectations, we strive to enhance our business practices by incorporating sustainability recommendations that we believe will benefit our investors, customers, employees, and communities.
In addition to proposed and evolving rulemaking by federal regulators, such as the SEC’s proposed rule on climate-related disclosures and the bank regulatory agencies’ recently issued principles designed to provide a framework for large financial institutions to manage exposure to climate-related financial risks, many states have adopted, or are considering, laws that address climate and social issues. For example, the state of California recently passed sweeping climate-related disclosure laws that will require large entities doing business in the state, including the Bank, to measure and disclose greenhouse gas emissions and report on their climate-related risks. These laws will increase our compliance costs and may include provisions that conflict with other state and federal regulations, or limit our ability to conduct business in certain jurisdictions. We publish an annual Corporate Responsibility Report that provides a summary of how we address these issues. The report is available on our website.
ZIONS BANCORPORATION, NATIONAL ASSOCIATION AND SUBSIDIARIES
Corporate Governance
Our Board of Directors (“Board”) has overseen management’s establishment of a comprehensive system of corporate governance and risk management practices. This system includes frameworks, policies, and guidelines such as the following:
•Corporate Governance Guidelines;
•A Code of Business Conduct and Ethics for Employees;
•A Director’s Code of Conduct;
•A Risk Management Framework;
•A Related Party Transaction Policy;
•Incentive Compensation Recoupment and Clawback Policies;
•Stock Ownership and Retention Guidelines;
•An Insider Trading Policy; and
•Charters for our Executive, Audit, Risk Oversight, Compensation, and Nominating and Corporate Governance Committees.
More information on our corporate governance practices is available on our website at zionsbancorporation.com. Our website is not part of this Form 10-K.
HUMAN CAPITAL MANAGEMENT
We are proud of our employees who bring their unique, diverse talents to work each day. We are committed to identifying, recognizing, and creating fulfilling opportunities for our employees, and rewarding them for their contributions to our success.
During 2023, we continued to enhance certain benefits for our employees to adapt to the changing practices of the labor market. Recent changes include more flexibility with paid time off, more health care plan alternatives, and greater access to mental health benefits.
We had 9,679 full-time equivalent employees at December 31, 2023. The following schedule presents certain demographic attributes of our workforce as self-identified by our employees:
Schedule 2
|
|
|
|
|
|
|
|
|
|
|
|
|
|
|
|
|
|
|
|
|
|
|
|
|
December 31, 2023 |
|
Women |
|
People of Color |
|
Disabled |
|
Veterans |
| Employee Roles |
|
|
|
|
|
|
|
| Management |
52% |
|
29% |
|
9% |
|
2% |
| Non-management |
60% |
|
40% |
|
10% |
|
2% |
| All employees |
58% |
|
38% |
|
10% |
|
2% |
The following objectives and initiatives are integral to our human capital management efforts:
Cultivating an environment where people are respected and valued, and where individual and cultural differences are embraced
We believe that (1) our performance is stronger when we are able to draw upon the talents and experience of a diverse team of employees, and (2) in-person exchange of ideas and viewpoints, in both formal and informal settings, improves productivity and supports a strong corporate culture while still offering flexibility to balance personal needs.
ZIONS BANCORPORATION, NATIONAL ASSOCIATION AND SUBSIDIARIES
We endeavor to provide opportunities for growth, development, and leadership to every employee. We are committed to continue this focus on ensuring that we have a workplace where all are treated fairly in accordance with their qualifications and abilities, and that the Bank is a place where everyone counts.
We strive to build a workplace where we embrace differences — in points of view and in national origin, language, race, disability, ethnicity, gender, age, religion, sexual orientation, gender identity, socioeconomic status, veteran status, and family structures. Our Everyone Counts Council coordinates the related efforts of our affiliates and enterprise groups, and advises executive management on goals and recommendations for ongoing improvement. Our efforts include employee business forums, mental health initiatives, and a broad range of employee and regional events. Throughout the organization, the employee business forums foster a sense of community and enable greater connectivity and support among employees through meetings and discussions, which are open to all employees and offer networking and connections to the communities in which we operate.
We use analytics, recruiting outreach efforts, and manager training to reach a diverse, qualified group of potential applicants to secure a high-performing workforce drawn from all segments of society. To identify qualified candidates, our recruiting team partners with community organizations, schools, and governmental entities that support marginalized and underserved communities in our footprint. Our annual Corporate Responsibility Report, which is published on our website, highlights several achievements in this area, such as our Banker Development Program, which attracts and advances undergraduates and early career professionals.
Attracting, developing, and retaining talent for long-term success
We are committed to (1) attracting, developing, and retaining the most qualified individuals who reflect the diversity of the available workforce and markets in which we operate, (2) helping our employees grow in their careers, and (3) actively building a pipeline of talent for future leadership opportunities. As we attract and hire talent, we proactively consider the demand for competencies that will be needed within the workforce of the future.
Consistent with our strategic objectives, we invest in training our employees and providing them the tools and resources to build their capabilities. We offer more than 1,500 virtual, in-person, expert-led, and pre-recorded or self-paced learning options for employees to create custom learning plans for personal and professional development. In 2023, we hosted more than 1,000 training experiences to support employees, build new skills, or to assist in career advancement. We offer new manager programs, tuition reimbursement, education sponsorship opportunities, job shadowing, coaching, and formal mentoring programs. Our talent development program and individual development plans focus on education, experience, and exposure to help create well-rounded, highly skilled, and successful employees.
We are also mindful of the continued competition for talent in the labor market. We continue to analyze relevant metrics related to employee recruiting and turnover, which has and will continue to impact wages and flexible work arrangements.
Recognizing, engaging, and rewarding our employees
Our comprehensive rewards and recognition programs are designed to reward high performance, improve retention, and enhance the employee experience through recognition and growth opportunities. We provide meaningful upside opportunities for those who take accountability for business objectives that help us deliver superior results while reducing risk.
We routinely assess pay equity among employees across our organization by analyzing potential disparities in pay based on gender, minority status, and other factors. These actions help us compensate employees fairly. On a biennial basis, we enlist the services of an independent third party to review our pay equity. Results of the most recent review revealed that after adjusting for relevant variables such as education, experience, performance, and geography, there were no meaningful differences in pay levels among men, women, and people of color. We remain committed to fair and equitable compensation for all our employees.
Our employees provide regular feedback through enterprise outreach and engagement forums, which include quarterly leadership calls, biannual employee opinion surveys, and targeted focus groups. These forums for employee input continue to help strengthen working relationships with managers, improve clarity of organizational purpose and goals, and reinforce our Guiding Principles and Code of Business Conduct and Ethics.
ZIONS BANCORPORATION, NATIONAL ASSOCIATION AND SUBSIDIARIES
We value work-life balance and strive to create a work environment that supports our employees with mental, physical, social, and financial wellness. Some of our key benefits include the following:
•Corporate match for our 401(k) plan of 4.5% of an employee’s salary and incentive compensation;
•Annual profit-sharing contributions;
•Health care plan options including behavioral health, wellness, and autism spectrum disorder services;
•Expanded mental health coverage, including coaching and clinical therapy sessions;
•Preventive prescription drug coverage not subject to deductibles;
•Paid parental leave program;
•Adoption assistance program; and
•Paid time off for various community service activities and other volunteer opportunities.
ITEM 1A. RISK FACTORS
We generate revenue and grow our businesses by taking prudent and appropriately priced and managed risks. These risks are outlined in our Risk Management Framework. Our Board has established an Audit Committee, a Compensation Committee, a Risk Oversight Committee (“ROC”), and appointed an Enterprise Risk Management Committee (“ERMC”) to oversee and implement the Risk Management Framework. The ERMC is comprised of senior management and is chaired by the Chief Risk Officer. These committees monitor the following risk areas: credit risk, interest rate and market risk; liquidity risk; strategic and business risk; operational risk; technology risk; cybersecurity risk; capital/financial reporting risk; legal/compliance risk (including regulatory risk); and reputational risk, as outlined in our risk taxonomy. We have developed policies, procedures, and controls designed to address these risks, but there can be no certainty that our actions will be effective to prevent or limit the effects of these risks on our business or performance. Although not comprehensive, risk factors that are material to us are described below.
CREDIT RISK
Credit quality has adversely affected us in the past and may adversely affect us in the future.
Credit risk is one of our most significant risks. Rising interest rates, increased market volatility, or a decline in the strength of the U.S. economy in general or the local economies in which we conduct operations could result in, among other things, deterioration in credit quality and reduced demand for credit, including a resultant adverse effect on the income from our loan and investment portfolios, an increase in charge-offs, and an increase in the allowance for credit losses (“ACL”).
We have concentration of risk from counterparties and risk in our loan portfolio, including, but not limited to, loans secured by real estate, oil and gas-related lending, and leveraged and enterprise value lending, which may have unique risk characteristics that may adversely affect our results.
Concentrations of risk from counterparties could adversely affect us, and risk across our loan and investment securities portfolios could pose significant additional credit risk to us due to similar exposures between the two asset types. Concentrations with counterparties on derivative or securities financing transactions could pose additional credit risk.
We engage in commercial real estate (“CRE”) term and construction lending, primarily in our Western states footprint. Certain CRE collateral types, particularly office CRE, continue to experience increased vacancy rates, declining property values, and pressures from rising interest rates, which could result in increased delinquencies and defaults. We also engage in oil and gas-related lending, and we provide leveraged and enterprise value loans across our entire footprint. Certain of these loans may be subject to specific risks, including governmental and social responses to environmental issues and climate change, volatility, and potential significant and prolonged declines in collateral-values and activity levels.
ZIONS BANCORPORATION, NATIONAL ASSOCIATION AND SUBSIDIARIES
Any decline in these portfolios could cause increased credit losses and reduced loan demand, which could adversely affect our business and that of our customers. We may have other unidentified risks in our loan portfolio.
Our business is highly correlated to local economic conditions in a specific geographic region of the U.S.
We provide a wide range of banking products and related services through our local management teams and unique brands in Arizona, California, Colorado, Idaho, Nevada, New Mexico, Oregon, Texas, Utah, Washington, and Wyoming. At December 31, 2023, loan balances associated with our banking operations in Utah, Idaho, Texas, and California comprised 77%, 69%, and 70% of the commercial, CRE, and consumer lending portfolios, respectively. As a result of this geographic concentration, our financial performance depends largely upon economic conditions in these market areas. Accordingly, deterioration in economic conditions, including those caused by climate change or natural disasters, may specifically affect these states, and could result in higher credit losses and significantly affect our consolidated operations and financial results.
For information about our lending exposure to various industries and how we manage credit risk, see “Credit Risk Management” in MD&A on page 54.
INTEREST RATE AND MARKET RISK
We could be negatively affected by adverse economic conditions.
Adverse economic conditions pose significant risks to our business, including our loan and investment portfolios, capital levels, results of operations, and financial condition. A slowing economy and uncertainty related to inflationary pressures, including related changes in monetary and fiscal policies and actions, rising interest rates, and decreased values of our fixed-rate assets, can increase these risks and lead to lower demand for loans, higher credit losses, and lower fee income, among other negative effects.
Failure to effectively manage our interest rate risk could adversely affect our results.
Net interest income is the largest component of our revenue. Factors beyond our control can significantly influence the interest rate environment and increase our risk. These factors include changes in the prevailing interest rate environment, competitive pricing pressures for our loans and deposits, adverse shifts in the mix of deposits and other funding sources, and volatile market interest rates resulting from general economic conditions and the policies of governmental and regulatory agencies, in particular the FRB. Most components of our balance sheet are sensitive to rising and falling rates, and mismatches in rate sensitivity between assets and liabilities may result in unanticipated changes in both asset and liability values and related income and expense. Additionally, asset and liability values may be significantly impacted by customer behavior, as customers may choose to withdraw certain deposits or prepay certain loans at any time, which may significantly affect our expected cash flows.
For information about how we manage interest rate risk and market risk, see “Interest Rate and Market Risk Management” in MD&A on page 63.
LIQUIDITY RISK
Changes in levels and sources of liquidity and capital, including the resulting effects of recent events in the banking industry, may limit our operations and potential growth.
Our primary source of liquidity is deposits from our customers, which may be impacted by market-related forces such as increased competition for these deposits and a variety of other factors. Deposits across the banking industry have fluctuated in recent quarters in large part due to the increased interest rate environment and prominent bank closures. We, like many other banks, experienced deposit outflows as customers spread deposits among several different banks to maximize their amount of FDIC insurance, moved deposits to institutions offering higher rates or removed deposits from the U.S. financial system entirely. Since the FDIC insurance limit is not inflation-indexed and has not increased since 2008, the percent of our and other regional bank uninsured deposits has steadily increased, and may continue to increase without additional congressional action to increase the FDIC insurance limits.
ZIONS BANCORPORATION, NATIONAL ASSOCIATION AND SUBSIDIARIES
Although our deposit levels have increased during the latter half of 2023, our cost of funds has also increased, primarily as a result of declining noninterest-bearing deposits, growth in interest-bearing deposits, and a higher interest rate environment. The potential for greater volatility and further increased costs remains, particularly if there is negative news surrounding the banking industry or perceived risks regarding bank safety and soundness. In such an environment, some depositors may be more likely to believe that there is greater safety in maintaining large, uninsured deposits at banks deemed “too big to fail,” which may contribute to further deposit runoff and increased deposit costs of community and regional institutions, including the Bank. If we are unable to continue to fund assets through customer bank deposits or access other funding sources on favorable terms, or if we experience continued increases in borrowing costs or FDIC insurance assessments, or otherwise fail to manage liquidity effectively, our liquidity, operating margins, financial condition, and results of operations may be materially and adversely affected.
The Federal Reserve’s tightened monetary policy has contributed to a decline in the value of our fixed-rate loans and investment securities that are pledged as collateral to support short-term borrowings. Other economic conditions may also affect (or continue to affect) our liquidity and efforts to manage associated risks. The Federal Home Loan Bank (“FHLB”) system and Federal Reserve have been, and continue to be, a significant source of additional liquidity and funding. Changes in FHLB or Federal Reserve funding programs could adversely affect our liquidity and management of associated risks.
We and the holders of our securities could be adversely affected by unfavorable rating actions from rating agencies.
We access capital markets to augment our funding. This access is affected by the ratings assigned to us by rating agencies. The rates we pay on our securities are also influenced by, among other things, the credit ratings that we and our securities receive from recognized rating agencies. Ratings downgrades to us or our securities could increase our costs or otherwise have a negative effect on our liquidity position, financial condition, or the market prices of our securities.
For information about how we manage liquidity risk, including rating agency actions, see “Liquidity Risk Management” in MD&A on page 67.
STRATEGIC AND BUSINESS RISK
Problems encountered by other financial institutions could adversely affect financial markets generally and have indirect adverse effects on us.
The soundness and stability of many financial institutions may be closely interrelated as a result of credit, trading, clearing, or other relationships between the institutions. As a result, concerns about, or a default or threatened default by, one institution could lead to significant market-wide liquidity and credit problems, losses, or defaults by other institutions. This is sometimes referred to as “systemic risk” and may adversely affect financial intermediaries, such as clearing agencies, clearing houses, banks, securities firms, and exchanges, with which we interact on a daily basis, and therefore, could adversely affect us. This phenomenon has been evident in the recent events affecting the banking industry (such as the prominent bank closures), as financial institutions like us have been impacted by concerns regarding the soundness or creditworthiness of other financial institutions or reports of the risk of systemic deterioration in asset classes, such as commercial real estate. This has caused substantial and cascading disruptions within the financial markets and deposits environment, increased expenses, reduced bank fees, and adversely impacted the market price and volatility of our common stock.
We may not be able to hire or retain qualified personnel or effectively promote our corporate culture, and recruiting and compensation costs may increase as a result of changes in the workplace, marketplace, economy, and regulatory environment.
Our ability to execute our strategy, provide services, and remain competitive may suffer if we are unable to recruit or retain qualified people, or if the costs of employee compensation and benefits increase substantially. Bank regulatory agencies have published regulations and guidance that limit the manner and amount of compensation that banking organizations provide to employees. These regulations and guidance may adversely affect our ability to attract and retain key personnel. Some of these limitations may not apply to institutions with which we compete for talent, in particular, as we are more frequently competing for personnel with financial technology providers and other entities that may not have the same limitations on compensation as we do.
ZIONS BANCORPORATION, NATIONAL ASSOCIATION AND SUBSIDIARIES
If we were to suffer such adverse effects with respect to our employees, our business, financial condition and results of operations could be adversely or materially affected.
Our ability to retain talent may also be adversely affected by changes in the economy and workforce trends, priorities, migration, modes of delivery and other considerations, such as the increased ability of employees to work from anywhere in many industries. This growth in remote work and other changing priorities and benefits has led to an increase in compensation and related expenses and workplace challenges, such as fewer opportunities for face-to-face interactions, training and mentoring new employees, promoting a cohesive corporate culture, and increased competition for experienced labor, especially in high-demand and highly skilled categories. Inflationary pressures have also increased our compensation costs and are likely to continue to do so in the future.
We have made, and are continuing to make, significant changes that include, among other things, organizational restructurings, efficiency initiatives, and replacement or upgrades of technology systems to improve our operating efficiency and control environment. The ultimate success and completion of these changes, and their effects on us, may vary significantly from intended results, which could materially adversely affect us.
We continue to invest in a variety of strategic projects designed to improve our products and services and to simplify how we do business. These initiatives and other significant changes continue to be implemented and are in various stages of completion. By their very nature, projections of duration, cost, expected savings, expected efficiencies, and related items are subject to change and significant variability. There can be no certainty that we will achieve the expected benefits or other intended results associated with these projects.
We could be adversely affected by our ability to develop, adopt, implement, and deliver technology advancements.
Our ability to remain competitive is increasingly dependent upon our ability to maintain critical technological capabilities, and to identify and develop new, value-added products for existing and future customers. These technological competitive pressures arise from both traditional banking and nontraditional sources. Larger banks may have greater resources and economies of scale attendant to maintaining existing capabilities and developing digital and other technologies. Fintechs and other technology platform companies continue to emerge and compete with traditional financial institutions across a wide variety of products and services. Industry experimentation with, and adoption of, artificial intelligence (“AI”), the expansion of blockchain technologies, and digital currencies, including the potential creation and adoption of central bank digital currencies, present similar risks. Our failure to remain technologically competitive could impede our competitive market position and reduce customer satisfaction, product accessibility, and relevance.
OPERATIONAL RISK
Our operations could be disrupted by the effects of new and ongoing projects and initiatives.
We may encounter significant operational disruptions arising from our numerous projects and initiatives. These may include significant time delays, cost overruns, loss of key people, technological problems, and processing failures. We may also experience operational disruptions due to capacity constraints, service level failures and inadequate performance, and certain replacement costs. Any or all of these issues could result in disruptions to our systems, processes, control environment, procedures, employees, and customers. The ultimate effect of any significant disruption to our business could subject us to additional regulatory scrutiny or expose us to civil litigation and possible financial liability, any of which could materially affect us, including our control environment, operating efficiency, and results of operations.
We could be adversely affected by failure in our internal controls.
Because of their inherent limitations, our internal controls may not prevent or detect the risk of operational failures, misstatements in our financial statements, or capital arising from inadequate or failed internal processes or systems, human errors or misconduct, or other adverse external events. A failure in our internal controls could have a significant negative impact not only on our earnings, but also on the perception that customers, regulators, and investors may have of us and adversely affect our business and our stock price.
ZIONS BANCORPORATION, NATIONAL ASSOCIATION AND SUBSIDIARIES
We could be adversely affected by internal and external fraud schemes.
Attempts to commit fraud both internally and externally are becoming increasingly more sophisticated and may increase in an adverse economic environment. We have experienced losses in the past as a result of these attempts and schemes and may not be able to identify, prevent, or otherwise mitigate all instances of fraud in the future that have the potential to result in material losses. These attempts may go undetected by the systems and procedures that we have in place to monitor our operations.
Climate-related and other catastrophic events including, but not limited to, hurricanes, tornadoes, earthquakes, fires, floods, prolonged drought, and pandemics may adversely affect us, our customers, and the general economy, financial and capital markets, and specific industries.
The occurrence of pandemics, natural disasters, and other climate-related or catastrophic events could materially and adversely affect our operations and financial results. We have significant operations and customers in Utah, Texas, California, and other regions where natural and other disasters have occurred, and are likely to continue to occur. These regions are known for being vulnerable to natural disasters and other risks, such as hurricanes, tornadoes, earthquakes, fires, floods, prolonged droughts, and other weather-related events, some of which may be exacerbated by climate change and become more frequent and intense. These types of catastrophic events at times have posed physical risks to our property and have disrupted the local economy, our business, and customers, including decreased access to insurance and other services. In addition, catastrophic events occurring in other regions of the world may have an impact on us and our customers.
We use models in the management of the Bank. There is risk that these models are inaccurate in various ways, which may cause us to make suboptimal decisions.
We rely on models in the management of the Bank. For example, we use models to inform our estimate of the allowance for credit losses, to manage interest rate and liquidity risk, to project stress losses in various segments of our loan and investment portfolios, and to project net revenue under stress. Models are inherently imperfect and cannot perfectly predict outcomes. Management decisions that are largely informed by such models, therefore, may be suboptimal. For example, with the recent prominent bank closures during the first half of 2023, customer deposit behavior deviated from modeled behaviors, and as a result, we redeveloped our deposit models, which are currently used by management. For more information about our deposit models, see “Interest Rate and Market Risk Management” in MD&A on page 63.
We outsource various operations to third-party vendors, which could adversely impact our business and operational performance.
We rely on various vendors to perform operational activities to conduct our business. Although there are benefits in entering into these relationships, there are risks associated with such activities. Our operational controls and third-party management programs may not provide adequate oversight and control. Inadequate performance by third parties can adversely affect our ability to deliver products and services to our customers and conduct our business. Replacing or finding alternatives for vendors who do not perform adequately can be difficult and costly, and may also adversely impact our customers and other operations, particularly when circumstances require us to make changes under tight time constraints. Many of our vendors have experienced adverse effects upon their operations, supply chains, personnel, and businesses arising from inflationary pressures, wars and geopolitical conflicts, cyber vulnerabilities, and other events, all of which can impact our operations as well.
For information about how we manage operational risk, see “Operational, Technology, and Cybersecurity Risk Management” in MD&A on page 70.
ZIONS BANCORPORATION, NATIONAL ASSOCIATION AND SUBSIDIARIES
TECHNOLOGY RISK
We could be adversely impacted by system vulnerabilities, failures, or outages impacting operations and customer services such as online and mobile banking.
We rely on various information technology systems that work together in supporting internal operations and customer services. Vulnerabilities in, or a failure or outage of, one or many of these systems could impact the ability to perform internal operations and provide services to customers, such as online banking, mobile banking, remote deposit capture, treasury and payment services, and other services dependent on system processing. These risks increase as systems and software approach the end of their useful life or require more frequent updates and modifications. We cannot guarantee that such occurrences will not have a significant operational or customer impact.
For information regarding risks associated with the replacement or upgrades of our core technology systems, see “Strategic and Business Risk” in Risk Factors on page 16. For information about how we manage technology risk, see “Operational, Technology, and Cybersecurity Risk Management” in MD&A on page 70.
CYBERSECURITY RISK
We are subject to a variety of information system failure and cybersecurity risks that could adversely affect our business and financial performance.
We rely heavily on communications and information systems to conduct our business. We process and maintain on our systems certain information that is confidential, proprietary, personal, or otherwise sensitive, including financial and other confidential business information. We, our customers, and other financial institutions with which we interact, are subject to ongoing, continuous attempts by threat actors, such as organized cybercrime, hackers, and state-sponsored organizations to penetrate key systems. Information security risks for us and other large financial institutions have increased significantly in recent years, in part because of the proliferation of new technologies, the ubiquity of internet connections, and the increased sophistication and activities of threat actors. The types of attacks these threat actors may use include, but are not limited to: exploiting customer or system vulnerabilities or misconfigurations, deceiving employees through email phishing or social engineering, and compromising any of our suppliers.
Third parties, including our suppliers and their subcontractors, also present operational and information security risks to us, including security incidents or failures of their own systems and downstream systems. In incidents involving third parties, we may not be informed promptly of any effect on our services or our data, or be able to participate in any related investigation, notification, or remediation that occurs. The possibility of third-party or employee error, failure to follow security procedures, or malfeasance also presents these risks.
As cybersecurity threats continue to evolve, we will be required to expend additional resources to continue to modify or enhance our defenses or to investigate or remediate any information security vulnerabilities. We, and our third-party suppliers, have experienced cybersecurity incidents in the past that have not had material impact to our data, customers, or operations, but there can be no assurance that any such failure, interruption, or significant security breach will not occur in the future, or, if any future occurrences will be adequately addressed. It is impossible to determine the severity or potential effects of these incidents with any certainty.
System enhancements and updates may also create risks associated with implementing new systems and integrating them with existing ones. Due to the complexity and interconnectedness of information technology systems, the process of enhancing our defenses itself can create a risk of systems disruptions and security issues. We may face additional risks to the extent our hardware and software providers are unable to deliver patches and updates to mitigate vulnerabilities or we are unable to implement patches in a timely manner, particularly when a vulnerability is being actively exploited by threat actors. We have devoted and will continue to devote significant resources to the security of our computer systems, but they may still be vulnerable to these threats and our efforts may subsequently be deemed to have been inadequate by regulators or courts. The occurrence of any failure, interruption or security incident to our information systems or those of our third-party suppliers could interfere with or disrupt our operations and services, damage our reputation, result in a loss of customer business, subject us to additional regulatory scrutiny, expose us to civil litigation and financial liability, or otherwise result in material adverse consequences on us.
ZIONS BANCORPORATION, NATIONAL ASSOCIATION AND SUBSIDIARIES
For information about how we manage cybersecurity risk, see Part I, Item 1C. Cybersecurity on page 24.
CAPITAL/FINANCIAL REPORTING RISK
Internal stress testing and capital management, as well as provisions of the National Bank Act and OCC regulations, may limit our ability to increase dividends, repurchase shares of our stock, and access the capital markets.
We utilize stress testing as an important mechanism to inform our decisions on the appropriate level of capital, based upon actual and hypothetically stressed economic conditions. The stress testing and other applicable regulatory requirements may, among other things, require us to increase our capital levels, limit our dividends or other capital distributions to shareholders, modify our business strategies, or decrease our exposure to various asset classes. Under the National Bank Act and OCC regulations, certain capital transactions, including share repurchases, are subject to the approval of the OCC. These requirements may limit our ability to respond to and take advantage of market developments.
Regulatory requirements, economic and other circumstances may require us to raise capital at times or in amounts that are unfavorable to us.
We maintain certain risk-based and leverage capital ratios, as required by our banking regulators, which can change depending upon general economic conditions, as well as the particular conditions, risk profiles, and our growth plans. Compliance with capital requirements may limit our ability to expand and has required, and may require, us to raise additional capital or retain earnings that could otherwise be distributed to shareholders. These uncertainties and risks, including those created by legislative and regulatory change and uncertainties, such as recent regulatory proposals that would significantly revise the capital requirements and expand long-term debt requirements applicable to large banking organizations, may increase our cost of capital and other financing costs. For more information about these regulatory proposals, see “Recent Regulatory Developments” in Supervision and Regulation on page 8.
We could be adversely affected by accounting, financial reporting, and regulatory compliance risk.
We are exposed to accounting, financial reporting, and regulatory compliance risk. Significant estimates, judgments, and interpretations of complex and changing accounting and regulatory policies are required to properly account for the products and services we provide to our customers. Changes in our accounting policies or accounting standards could materially affect how we report our financial results and conditions. The level of regulatory compliance oversight continues to be heightened. Identification, interpretation, and implementation of complex and changing accounting standards, as well as compliance with regulatory requirements, pose an ongoing risk.
The value of our goodwill may decline in the future.
If the fair value of a reporting unit is determined to be less than its carrying value, we may have to take a charge related to the impairment of our goodwill. Such a charge could result from, among other factors, weakening in the economic environment, a decline in the performance of the reporting unit, or new legislative or regulatory changes not anticipated in management’s expectations.
We may not be able to fully realize our deferred tax assets, which could adversely affect our operating results and financial performance.
At December 31, 2023, we had a net deferred tax asset of $1.0 billion. The accounting treatment for realization of deferred tax assets is complex and requires judgment. Our ability to fully realize our deferred tax asset could be reduced in the future if our estimates of future taxable income from our operations, future reversals of existing deferred tax liabilities (“DTLs”), or tax planning strategies do not support the realization of our deferred tax asset.
ZIONS BANCORPORATION, NATIONAL ASSOCIATION AND SUBSIDIARIES
Changes in applicable tax laws, regulations, macroeconomic conditions, or market conditions may adversely affect our financial results, and there can be no assurance that we will be able to fully realize our deferred tax assets.
For information about how we manage capital, see “Capital Management” in MD&A on page 72.
LEGAL/COMPLIANCE RISK
Laws and regulations applicable to us and the financial services industry impose significant limitations on our business activities and subject us to increased regulation and additional costs.
We, and the entire financial services industry, have incurred, and will continue to incur, substantial costs related to personnel, systems, consulting, and other activities in order to comply with banking regulations. See “Supervision and Regulation” on page 7 for further information about the regulations applicable to us and the financial services industry generally.
Regulators, the U.S. Congress, state legislatures, and other governing or consultative bodies continue to enact rules, laws, and policies to regulate the financial services industry and public companies, including laws that are designed to promote, protect, or penalize certain activities or industries and their access to financial services. We are, and may in the future become, subject to these laws by offering our products and services to certain industries or in certain locations. The nature of these laws and regulations and their effect on our future business and performance cannot be predicted.
There can be no assurance that any or all of these regulatory changes or actions will ultimately be enacted. However, if enacted, some of these proposals could adversely affect us by, among other things: impacting after-tax returns earned by financial services firms in general; limiting our ability to grow; increasing FDIC insurance assessments, taxes or fees on our funding or activities; limiting the range of products and services that we could offer; and requiring us to raise capital at inopportune times.
Political developments may also result in substantial changes in tax, international trade, immigration, and other policies. The extent and timing of any such changes are uncertain, as are the potential direct and indirect impacts, whether beneficial or adverse. Regulations and laws may be modified or repealed, and new legislation may be enacted that will affect us and our subsidiaries. The ultimate impact of these proposals cannot be predicted as it is unclear which, if any, may be enacted.
Tax laws, regulations, and case law may change due to legislative, administrative, and judicial changes that could adversely impact our business and financial performance.
We are subject to the income tax laws of the U.S., its states, and other jurisdictions where we conduct business. These laws are complex and subject to different interpretations by the taxpayer and the various taxing authorities. In determining the provision for income taxes, management makes judgments and estimates about the application of these inherently complex laws, related regulations, and case law. In the process of preparing our tax returns, management attempts to make reasonable interpretations of the tax laws. These interpretations are subject to challenge by the tax authorities upon audit or to reinterpretation based on management’s ongoing assessment of facts and evolving case law. Changes in tax laws, regulations, or case law may result in an adverse impact to our effective tax rate, tax obligations, and financial results. Additionally, challenges made by tax authorities during an audit may result in adjustments to our tax return filings, resulting in similar adverse impacts to our financial position.
We could be adversely affected by legal and governmental proceedings.
We are subject to risks associated with legal claims, litigation, and regulatory and other government proceedings. Our exposure to these proceedings may increase as a result of stresses on customers, counterparties, and others arising from the past or current economic environments, more frequent claims and actions resulting from fraud schemes perpetrated by or involving our customers, new regulations promulgated under recently enacted statutes, the creation of new examination and enforcement bodies, and enforcement and legal actions against banking organizations. Any such matters may result in material adverse consequences to our results of operations, financial condition or ability to conduct our business, including adverse judgments, settlements, fines, penalties (e.g., civil money penalties under applicable banking laws), injunctions, restrictions on our business activities, or other relief.
ZIONS BANCORPORATION, NATIONAL ASSOCIATION AND SUBSIDIARIES
We maintain insurance coverage to mitigate the financial risk of defense costs, settlements, and awards, but the coverage is subject to deductibles and limits of coverage. Our involvement in any such matters, even if the matters are ultimately determined in our favor, could also cause significant harm to our reputation and divert management attention from the operation of our business. In general, the amounts paid by financial institutions in settlement of proceedings or investigations, have been increasing dramatically. This has affected and will continue to adversely affect (1) our ability to obtain insurance coverage for certain claims, (2) our deductible levels, and (3) the cost of premiums associated with our coverage. Consequently, our financial results are subject to greater risk of adverse outcomes from legal claims.
Due to the difficulty in predicting the timing of, and damages or penalties associated with, the resolution of legal claims, it is possible that adverse financial impacts from litigation could occur sporadically and could be significant. In addition, any enforcement matters could impact our supervisory and CRA ratings, which may restrict or limit our activities.
The corporate and securities laws applicable to us are not as well-developed as those applicable to a state-chartered corporation, which may impact our ability to effect corporate transactions in an efficient and optimal manner.
Our corporate affairs are governed by the National Bank Act, and related regulations are administered by the OCC. As to securities laws, the OCC maintains its own securities offering framework applicable to national banks and their securities offerings, and our compliance with the Exchange Act is governed and enforced by the OCC.
State corporate codes, including that of Utah, are widely recognized, updated by legislative action from time-to-time, and may be based on and influenced by model statutes. The federal securities law regime established by the Securities Act and the Exchange Act and the SEC’s extensive and well-developed framework thereunder are widely used by public companies. The OCC’s statutory and regulatory frameworks have been used by publicly traded banking organizations relatively rarely and are not as well-developed as the corporate and securities law frameworks applicable to other public corporations. While certain specific risks associated with operating under these frameworks are described below, unless and until these frameworks are further developed and established over time, the uncertainty of how these frameworks might apply to any given corporate or securities matters may prevent us from effecting transactions in an efficient and optimal manner or perhaps at all.
Differences between the National Bank Act and state law requirements regarding mergers could hinder our ability to execute acquisitions as efficiently and advantageously as bank holding companies or other financial institutions.
Unlike state corporate law, the National Bank Act requires shareholder approval of all mergers between a national bank and another national or state bank and does not allow for exceptions in the case of various “minor” mergers, such as a parent company’s merger with a subsidiary or an acquirer’s merger with an unaffiliated entity in which the shares issued by the acquirer do not exceed a designated percentage. The National Bank Act and related regulations may also complicate the structuring of certain nonbank acquisitions.
These differences could adversely affect the ability of the Bank and other banks registered under the National Bank Act to efficiently consummate acquisition transactions. In addition, such differences could make us less competitive as a potential acquirer in certain circumstances given that our acquisition proposal may be conditioned on shareholder approval while our competitors’ proposals will not have such a condition.
We are subject to restrictions on permissible activities that would limit the types of business we may conduct and that may make acquisitions of other financial companies more challenging.
Under applicable laws and regulations, bank holding companies and banks are generally limited to business activities and investments that are related to banking or are financial in nature. The range of permissible financial activities is set forth in the Gramm-Leach-Bliley Act and is more limited for banks than for bank holding company organizations. The differences relate mainly to insurance underwriting (but not insurance agency activities) and merchant banking (but not broker-dealer and investment advisory activities).
ZIONS BANCORPORATION, NATIONAL ASSOCIATION AND SUBSIDIARIES
The fact that we do not have a bank holding company could make future acquisitions of financial institutions with such operations more challenging.
REPUTATIONAL RISK
We are presented with various reputational risk issues that could stem from operational, regulatory, compliance, and legal risks.
Any of the aforementioned risks may give rise to adverse publicity and other expressions of negative public opinion, increased regulatory scrutiny, and damaged relationships among other reputational risks.
OTHER RISKS
The Russian invasion of Ukraine, the conflicts in the Middle East, other geopolitical conflicts, and retaliatory measures imposed by the U.S. and other countries, including the responses to such measures, may cause significant disruptions to domestic and foreign economies and markets.
The Russia-Ukraine war and the conflicts in the Middle East, along with other geopolitical conflicts, have created new risks for global markets, trade, economic conditions, cybersecurity, and similar concerns. For example, these conflicts could affect the availability and price of commodities and products, adversely affecting supply chains and increasing inflationary pressures; the value of currencies, interest rates, and other components of financial markets; and lead to increased risks of events such as cyberattacks that could result in severe costs and disruptions to governmental entities and companies and their operations. The impact of these conflicts and retaliatory measures is continually evolving and cannot be predicted with certainty. It is likely that these conflicts will continue to affect the global political order and global and domestic markets for a substantial period of time, regardless of when these conflicts end.
While these events have not materially interrupted our operations, these or future developments resulting from these conflicts, such as cyberattacks on the U.S., the Bank, our customers, or our suppliers, could make it difficult to conduct business.
Sustainability-related risk developments could lead or require us to restrict or modify some of our business activities.
Expectations of investors and regulators could, over time, lead us to restrict or modify some of our business practices. In addition, our business practices could be adversely affected by laws and regulations enacted or promulgated by federal, state, and local governments that relate to environmental and social issues. For example, in 2022 and 2023, certain states passed, or considered passing, laws prohibiting financial institutions from restricting the services that they provide to certain types of businesses if the institutions also conduct business with governmental entities in such states. Depending on how these laws are worded and implemented, they could adversely affect our ability to manage risk. These laws and rules related to environmental and social issues may include provisions that conflict with other state and federal regulations and may increase our costs or limit our ability to conduct business in certain jurisdictions.
Heightened regulatory and social focus on climate change may place additional requirements on public companies, including financial institutions, regarding the measurement, management, and disclosure of climate-related risks and associated lending and investment activities. For example, the state of California recently passed sweeping climate-related disclosure laws that will require large entities doing business in the state, including the Bank, to measure and disclose greenhouse gas emissions and report on their climate-related risks. These new laws, which will require initial disclosures as early as 2026, impose disclosure obligations on companies that in certain respects exceed those previously proposed by the SEC. These new laws may result in higher regulatory, compliance, credit, and reputational risks and costs. In addition, the transition to a lower-carbon economy could subject us to other risks, such as through our customers’ exposure to volatility in commodity prices, increased insurance costs or inability to access insurance, and changes in the market for carbon-related products and services.
ZIONS BANCORPORATION, NATIONAL ASSOCIATION AND SUBSIDIARIES
Protracted congressional negotiations and political stalemates in Washington, D.C. regarding government funding and other issues may introduce additional volatility in the U.S. economy including capital and credit markets and the banking industry in particular.
The U.S. government is currently funded through early March 2024 as a result of a series of continuing resolutions that provide short-term appropriations. Democrat and Republican lawmakers are at a stalemate, and efforts to pass spending bills for long-term government funding have been complicated, increasing the risk of an eventual government shutdown. Any such shutdown may result in further U.S. credit rating downgrades or defaults, and may introduce additional volatility in the U.S. economy, including capital and credit markets and the banking industry in particular; cause disruptions in the financial markets; impact interest rates; and result in other potential unforeseen consequences. In any such event, the Bank’s liquidity, operating margins, financial condition, and results of operations may be materially and adversely affected.
ITEM 1B. UNRESOLVED STAFF COMMENTS
There are no unresolved written comments that were received from SEC or OCC staff 180 days or more before the end of our fiscal year relating to our periodic or current reports filed under the Exchange Act.
ITEM 1C. CYBERSECURITY
Cybersecurity risk is the risk of adverse impacts to the confidentiality, integrity, and availability of data owned, stored, or processed by the Bank or the accompanying information systems. The number and sophistication of attempts to disrupt or penetrate our systems, and those of our suppliers — sometimes referred to as hacking, cybersecurity fraud, cyberattacks, or other similar names — continues to grow.
Cybersecurity risk is overseen by the Board and the Bank’s multiple lines of defense, including front-line bankers and operations teams, Enterprise Risk Management (“ERM”), and internal audit. Information security risk is managed in accordance with an established ERM framework, which includes elements such as key risk indicators, enterprise standards, controls, and self-assessments that comply with established ERM policies. These elements are regularly assessed, measured, and reported to Board-level and Bank senior management-level risk committees, and those committees review such reports.
As set forth in its charter, the ROC has the responsibility to review reports from management relating to enterprise-wide risk management efforts, including cybersecurity risks. As part of that oversight, the ROC performs an annual review and approval of information security policies and programs, and receives regular updates on key risk indicators, threat trends, risk remediation activities, and operational events. The ROC periodically provides reports regarding this oversight to the Board. Management uses multiple real-time and interval-based monitoring and reporting mechanisms to detect and respond to cybersecurity incidents. Documented escalation procedures are tested regularly as part of tabletop exercises and other activities and include notification to executive management during qualifying cybersecurity incidents.
Management positions directly responsible for assessing, measuring, and managing cybersecurity risks include the Chief Information Security Officer (“CISO”) and the Chief Technology and Operations Officer (“CTOO”). The current CISO has more than 20 years of technology leadership experience, including a significant period directly leading cybersecurity efforts, and holds multiple industry certifications. The CTOO has more than 25 years of audit, risk, operations, and technology leadership experience, including prior assignments as the Bank’s Chief Audit Executive and Director of Bank Operations. The CISO and CTOO regularly report information about cybersecurity risks to the Board or a committee of the Board.
We engage multiple independent third parties or cyber experts to assess information security programs and practices, including, but not limited to, framework maturity assessments, blind penetration testing, technology health checks, cyber skill and staffing assessments, externally facilitated tabletop exercises, external cyber legal counsel briefings, and strategic assessments. Findings from these assessments are regularly reviewed with management and the ROC. Additionally, we participate in various cybersecurity industry forums and have access to law enforcement analysis regarding current threats.
ZIONS BANCORPORATION, NATIONAL ASSOCIATION AND SUBSIDIARIES
Our supply chain risk management practices include risk assessments of suppliers, including with respect to cybersecurity. We monitor our suppliers using commercially available services that provide real-time security scoring of supplier technology services, threat intelligence, financial intelligence, geopolitical risk intelligence, and other considerations related to cybersecurity. Reviews are also regularly performed to monitor changes in suppliers’ cybersecurity risk posture. Continuous threat intelligence monitoring is also performed to identify potential cybersecurity incidents involving third parties. We strive to negotiate appropriate provisions with respect to cybersecurity in our contracts with suppliers.
When a cybersecurity incident occurs, whether detected internally or from third-party cybersecurity incidents, we evaluate the incident for criticality and potential materiality and disclosure across a range of contributing indicators, including service availability, impact to operations, reputational impact, regulatory and legal considerations, data sensitivity, and direct financial impact. The potential impact of the incident, individually or in aggregate, is evaluated by the CISO continuously across these criteria. We have escalation procedures to notify members of senior and executive management, the Board (or an applicable subset), and regulators in a timely manner based on the criticality and materiality of the cybersecurity incident.
To date, risks from cybersecurity threats, including as a result of any previous cybersecurity incidents, have not materially affected us, including our business strategy, results of operations, or financial condition. At December 31, 2023, management has assessed known cybersecurity incidents for potential materiality and disclosure using formal documented processes and has determined that there have been no material cybersecurity incidents, individually or in aggregate. We may nevertheless be unsuccessful in the future in preventing or mitigating a cybersecurity incident that could have a material adverse effect on us.
For additional discussion regarding cybersecurity risks, see “Cybersecurity Risk” in Risk Factors on page 19.
ITEM 2. PROPERTIES
At December 31, 2023, we operated 407 branches, of which 278 are owned and 129 are leased. We also lease our headquarters in Salt Lake City, Utah. The annual rentals under long-term leases for leased premises are determined under various formulas and factors, including operating costs, maintenance, and taxes. For additional information regarding leases and rental payments, see Note 8 of the Notes to Consolidated Financial Statements.
ITEM 3. LEGAL PROCEEDINGS
The information contained in Note 16 of the Notes to Consolidated Financial Statements is incorporated by reference herein.
ITEM 4. MINE SAFETY DISCLOSURES
None.
ZIONS BANCORPORATION, NATIONAL ASSOCIATION AND SUBSIDIARIES
PART II
ITEM 5. MARKET FOR REGISTRANT’S COMMON EQUITY, RELATED STOCKHOLDER MATTERS AND ISSUER PURCHASES OF EQUITY SECURITIES
PREFERRED STOCK
We have 4.4 million authorized shares of preferred stock without par value and with a liquidation preference of $1,000 per share. As of December 31, 2023, 66,139, 138,390, 98,555, and 136,368 of preferred shares series A, G, I, and J respectively, are outstanding. See Note 14 of the Notes to Consolidated Financial Statements for further information regarding our preferred stock.
COMMON STOCK
Market Information
Our common stock is traded on the National Association of Securities Dealers Automated Quotations (“NASDAQ”) Global Select Market under the symbol “ZION.” The closing price of our common stock on NASDAQ was $38.87 per share on February 5, 2024.
Equity Capital and Dividends
As of February 5, 2024, there were 3,530 shareholders of record of our common stock. In February 2024, the Board declared a dividend of $0.41 per common share payable on February 22, 2024 to shareholders of record at the close of business on February 15, 2024.
Share Repurchases
During the first quarter of 2023, we repurchased 0.9 million common shares outstanding for $50 million at an average price of $52.82 per share. We did not repurchase common shares during the second, third, or fourth quarters of 2023.
In February 2024, the Board approved a plan to repurchase up to $35 million of common shares outstanding during the fiscal year 2024. In February 2024, we repurchased 0.9 million common shares outstanding for $35 million at an average price of $39.32. For more information regarding our common stock activity, see the Consolidated Statement of Changes in Shareholders’ Equity on page 87.
The following schedule summarizes our share repurchases for the year ended December 31, 2023:
Schedule 3
2023 SHARE REPURCHASES
|
|
|
|
|
|
|
|
|
|
|
|
|
|
|
|
|
|
|
|
|
|
|
|
|
|
|
|
|
|
|
|
|
|
|
|
|
|
|
| Period |
|
Total number
of shares
purchased 1
|
|
Average
price paid
per share |
|
Shares purchased as part of publicly announced plans |
|
|
|
|
|
|
|
|
|
|
|
|
|
|
|
|
|
|
|
|
|
|
|
|
|
|
|
| First quarter |
|
953,080 |
|
|
$ |
52.82 |
|
|
|
946,644 |
|
|
|
|
|
|
|
|
|
|
|
|
|
|
| Second quarter |
|
— |
|
|
— |
|
|
|
— |
|
|
|
|
|
|
|
|
|
|
|
|
|
|
| Third quarter |
|
— |
|
|
— |
|
|
|
— |
|
|
|
|
|
|
|
|
|
|
|
|
|
|
| October |
|
— |
|
|
— |
|
|
|
— |
|
|
|
|
|
|
|
|
|
|
|
|
|
|
November |
|
— |
|
|
— |
|
|
|
— |
|
|
|
|
|
|
|
|
|
|
|
|
|
|
| December |
|
18,851 |
|
|
45.59 |
|
|
|
— |
|
|
|
|
|
|
|
|
|
|
|
|
|
|
| Fourth quarter total |
|
18,851 |
|
|
45.59 |
|
|
|
— |
|
|
|
|
|
|
|
|
|
|
|
|
|
|
| Total 2023 |
|
971,931 |
|
|
$ |
52.68 |
|
|
|
946,644 |
|
|
|
|
|
|
|
|
|
|
|
|
|
|
1 Includes common shares acquired in connection with our stock compensation plan. Shares were acquired from employees to pay for their payroll taxes and stock option exercise cost upon the exercise of stock options.
ZIONS BANCORPORATION, NATIONAL ASSOCIATION AND SUBSIDIARIES
Performance Graph
The following stock performance graph compares the five-year cumulative total return of our common stock with the Standard and Poor’s (“S&P”) 500 Index and the Keefe, Bruyette & Woods, Inc. (“KBW”) Regional Bank Index (“KRX”). The KRX is a modified market capitalization-weighted regional bank and thrift stock index developed and published by KBW, a nationally recognized brokerage and investment banking firm specializing in bank stocks. The index is composed of 50 geographically diverse stocks representing regional banks or thrifts. The stock performance graph is based upon an initial investment of $100 on December 31, 2018 and assumes reinvestment of dividends.
PERFORMANCE GRAPH FOR ZIONS BANCORPORATION, N.A.
INDEXED COMPARISON OF 5-YEAR CUMULATIVE TOTAL RETURN
|
|
|
|
|
|
|
|
|
|
|
|
|
|
|
|
|
|
|
|
|
|
|
|
|
|
|
|
|
|
|
|
|
|
|
|
|
2018 |
|
2019 |
|
2020 |
|
2021 |
|
2022 |
|
2023 |
|
|
|
|
|
|
|
|
|
|
|
|
| Zions Bancorporation, N.A. |
100.0 |
|
|
131.1 |
|
|
113.8 |
|
|
169.7 |
|
|
127.2 |
|
|
119.0 |
|
| KRX Regional Bank Index |
100.0 |
|
|
123.9 |
|
|
113.1 |
|
|
154.6 |
|
|
143.9 |
|
|
143.3 |
|
| S&P 500 |
100.0 |
|
|
131.5 |
|
|
155.7 |
|
|
200.3 |
|
|
164.0 |
|
|
207.0 |
|
SECURITIES AUTHORIZED FOR ISSUANCE UNDER EQUITY COMPENSATION PLANS
The information contained in Item 12 of this Form 10-K is incorporated by reference herein.
ITEM 6. RESERVED
ZIONS BANCORPORATION, NATIONAL ASSOCIATION AND SUBSIDIARIES
ITEM 7. MANAGEMENT’S DISCUSSION AND ANALYSIS OF FINANCIAL CONDITION AND RESULTS OF OPERATIONS
Key Corporate Objectives
We conduct our operations primarily through seven separately managed and geographically defined affiliates, each with its own local branding and management team. Our affiliate banks are supported by an enterprise operating segment (referred to as the “Other” segment) that provides governance and risk management, allocates capital, establishes strategic objectives, and includes centralized technology, back-office functions, and certain lines of business not operated through our affiliate banks.
We focus our efforts and resources to achieve our strategic growth and profitability objectives. This includes providing high-quality products and services and deepening relationships with our small business, commercial, and consumer customers. Serving as a trusted advisor for our business customers and supporting their operational needs generally affords us a major source of relatively stable deposits.
We strive to achieve balanced growth of customers, pre-provision net revenue (“PPNR”), profitability, and shareholder returns. We focus on five strategic growth areas: small business, commercial, affluent, capital markets, and consumer.
To facilitate the achievement of our growth and profitability objectives, we invest in the following five key areas, referred to as “strategic enablers”:
•People and Empowerment — we invest in training our employees and providing them the tools and resources to build their capabilities;
•Technology — we invest in innovative technologies that will make us more efficient and enable us to remain competitive;
•Operational Excellence — we invest in and support ongoing improvements in how we safely and securely deliver value to our customers;
•Risk Management — we engage in risk management practices to ensure prudent risk-taking and appropriate oversight; and
•Data and Analytics — we invest in relevant enterprise data and analytic tools to support local execution and prudent decision making.
RESULTS OF OPERATIONS
During 2023, the banking industry experienced significant changes in market conditions, including a higher interest rate environment, significant fluctuations in deposit levels, and broad weakness in bank valuations due in large part to several regional banks being closed and placed into receivership with the FDIC. We employed the following strategic actions during the year as a complement to our existing, well-established risk management practices:
•Generated customer deposit growth through a combination of competitive interest rates, customer outreach, and expanded utilization of reciprocal deposit programs in order to increase the availability of FDIC insurance;
•Actively managed the balance sheet through an earning-asset mix change toward higher-yielding loans, while reducing the size of our lower-yielding securities and money market positions;
•Increased total available liquidity sources, which far exceeded our level of uninsured deposits, and included the expanded use of existing collateralized funding lines;
•Actively managed our interest rate and market risk exposures through a rebalancing of our hedges for both available-for-sale (“AFS”) securities and commercial loans;
•Remained committed to controlling expenses, including active personnel management, while continuing to invest in technology;
ZIONS BANCORPORATION, NATIONAL ASSOCIATION AND SUBSIDIARIES
•Maintained strong credit performance, including low net charge-offs; and
•Further strengthened our regulatory capital position through increased retained earnings and suspended share repurchase programs (beginning the second quarter of 2023 through the end of the year).
Our Financial Performance
This section and other sections provide information about our recent financial performance. For more information about our results of operations for 2022 compared with 2021, see the respective sections in MD&A included in our 2022 Form 10-K.
|
|
|
|
|
|
|
|
|
|
|
|
|
|
|
|
|
|
|
|
|
|
Net Earnings Applicable to Common Shareholders
(in millions)
|
|
Diluted EPS |
|
Adjusted PPNR
(in millions)
|
|
Efficiency ratio |
Our financial performance for 2023 relative to the prior year reflected an increase in deposits, lower net interest income, stabilization of the net interest margin (“NIM”), loan growth, and strong credit quality, as well as higher noninterest expense and provision for credit losses.
•Net interest income decreased $82 million, or 3%, as higher earning asset yields were offset by rising funding costs. The NIM decreased slightly to 3.02%, compared with 3.06%. Net interest income was also impacted by a reduction in interest-earning assets and an increase in interest-bearing liabilities.
◦Average interest-earning assets decreased $1.7 billion, or 2%, driven by declines in average securities and average money market investments, partially offset by an increase in average loans and leases.
◦Total loans and leases increased $2.1 billion, or 4%, primarily due to growth in the consumer 1-4 family residential mortgage, commercial real estate term, and commercial and industrial loan portfolios.
◦Average interest-bearing liabilities increased $9.7 billion, or 23%, primarily due to increases in average interest-bearing deposits and average borrowed funds. These increases were offset by a decrease of $10.2 billion, or 26%, in average noninterest-bearing deposits, as customers migrated to interest-bearing products in response to the higher interest rate environment.
◦Total deposits increased $3.3 billion, or 5%, primarily due to a $12.8 billion increase in interest-bearing deposits, partially offset by a $9.5 billion decrease in noninterest-bearing demand deposits. Customer deposits (excluding brokered deposits) remained relatively stable at $70.5 billion and included approximately $6.8 billion of reciprocal deposit products. The loan-to-deposit ratio remained flat at 77%.
•The provision for credit losses was $132 million in 2023, compared with $122 million in 2022.
ZIONS BANCORPORATION, NATIONAL ASSOCIATION AND SUBSIDIARIES
•Customer-related noninterest income increased $6 million, or 1%, primarily due to increases in commercial account fees and wealth management fees, partially offset by a decrease in retail and business banking fees resulting from a change in our overdraft and non-sufficient funds practices effected during the third quarter of 2022. Increases in noncustomer-related noninterest income were due largely to an increase in dividends on FHLB stock, as well as the gain on sale of a bank-owned property in the second quarter of 2023.
•Noninterest expense increased $219 million, or 12%, primarily due to an increase in deposit insurance and regulatory expense, driven largely by a $90 million accrual associated with the FDIC special assessment in the fourth quarter of 2023. Noninterest expense was also impacted by higher salaries and benefits (including severance) and technology, telecom, and information processing expenses.
•Credit quality remained strong, as net loan and lease charge-offs were $36 million, or 0.06% of average loans in 2023, compared with net charge-offs of $39 million, or 0.07% of average loans, in 2022. Classified loans decreased $104 million, or 11%. Nonperforming assets increased $79 million, or 53%, primarily due to one commercial and industrial loan totaling $31 million, and two suburban office commercial real estate loans totaling $46 million.
The following schedule presents additional selected financial highlights:
ZIONS BANCORPORATION, NATIONAL ASSOCIATION AND SUBSIDIARIES
Schedule 4
SELECTED FINANCIAL HIGHLIGHTS
|
|
|
|
|
|
|
|
|
|
|
|
|
|
|
|
|
|
|
|
|
|
|
|
|
|
|
|
| (Dollar amounts in millions, except per share amounts) |
2023/2022 Change |
|
2023 |
|
2022 |
|
2021 |
|
|
|
|
| For the Year |
|
|
|
|
|
|
|
|
|
|
|
| Net interest income |
(3) |
% |
|
$ |
2,438 |
|
$ |
2,520 |
|
$ |
2,208 |
|
|
|
|
| Noninterest income |
7 |
% |
|
677 |
|
632 |
|
703 |
|
|
|
|
| Total net revenue |
(1) |
% |
|
3,115 |
|
3,152 |
|
2,911 |
|
|
|
|
| Provision for credit losses |
8 |
% |
|
132 |
|
122 |
|
(276) |
|
|
|
|
| Noninterest expense |
12 |
% |
|
2,097 |
|
1,878 |
|
1,741 |
|
|
|
|
Pre-provision net revenue 1 |
(19) |
% |
|
1,059 |
|
1,311 |
|
1,202 |
|
|
|
|
|
|
|
|
|
|
|
|
|
|
|
|
|
|
|
|
|
|
|
|
|
|
|
|
| Net income |
(25) |
% |
|
680 |
|
907 |
|
1,129 |
|
|
|
|
|
|
|
|
|
|
|
|
|
|
|
|
|
|
|
|
|
|
|
|
|
|
|
|
| Net earnings applicable to common shareholders |
(26) |
% |
|
648 |
|
878 |
|
1,100 |
|
|
|
|
| Per Common Share |
|
|
|
|
|
|
|
|
|
|
|
| Net earnings – diluted |
(25) |
% |
|
4.35 |
|
5.79 |
|
6.79 |
|
|
|
|
|
|
|
|
|
|
|
|
|
|
|
|
Tangible book value at year-end 1 |
24 |
% |
|
28.30 |
|
22.79 |
|
39.62 |
|
|
|
|
| Market price – end |
(11) |
% |
|
43.87 |
|
49.16 |
|
63.16 |
|
|
|
|
| Market price – high |
(27) |
% |
|
55.20 |
|
75.44 |
|
68.25 |
|
|
|
|
| Market price – low |
(60) |
% |
|
18.26 |
|
45.21 |
|
42.12 |
|
|
|
|
| At Year-End |
|
|
|
|
|
|
|
|
|
|
|
| Assets |
(3) |
% |
|
87,203 |
|
89,545 |
|
93,200 |
|
|
|
|
| Loans and leases, net of unearned income and fees |
4 |
% |
|
57,779 |
|
55,653 |
|
50,851 |
|
|
|
|
| Deposits |
5 |
% |
|
74,961 |
|
71,652 |
|
82,789 |
|
|
|
|
|
|
|
|
|
|
|
|
|
|
|
|
|
|
|
|
|
|
|
|
|
|
|
|
|
|
|
|
|
|
|
|
|
|
|
|
| Common equity |
18 |
% |
|
5,251 |
|
4,453 |
|
7,023 |
|
|
|
|
|
|
|
|
|
|
|
|
|
|
|
|
| Performance Ratios |
|
|
|
|
|
|
|
|
|
|
|
| Return on average assets |
|
|
0.77% |
|
1.01% |
|
1.29% |
|
|
|
|
| Return on average common equity |
|
|
13.4% |
|
16.0% |
|
14.9% |
|
|
|
|
Return on average tangible common equity 1 |
|
|
17.3% |
|
19.8% |
|
17.3% |
|
|
|
|
| Net interest margin |
|
|
3.02% |
|
3.06% |
|
2.72% |
|
|
|
|
| Net charge-offs to average loans and leases |
|
|
0.06% |
|
0.07% |
|
0.01% |
|
|
|
|
| Total allowance for credit losses to loans and leases outstanding |
|
|
1.26% |
|
1.14% |
|
1.09% |
|
|
|
|
| Capital Ratios at Year-End |
|
|
|
|
|
|
|
|
|
|
|
|
|
|
|
|
|
|
|
|
|
|
|
Common equity Tier 1 capital |
|
|
10.3% |
|
9.8% |
|
10.2% |
|
|
|
|
Tier 1 leverage |
|
|
8.3% |
|
7.7% |
|
7.2% |
|
|
|
|
|
|
|
|
|
|
|
|
|
|
|
|
|
|
|
|
|
|
|
|
|
|
|
|
Tangible common equity 1 |
|
|
4.9% |
|
3.8% |
|
6.5% |
|
|
|
|
|
|
|
|
|
|
|
|
|
|
|
|
| Other Selected Information |
|
|
|
|
|
|
|
|
|
|
|
|
Weighted average diluted common shares outstanding
(in thousands)
|
(2) |
% |
|
147,756 |
|
150,271 |
|
160,234 |
|
|
|
|
Bank common shares repurchased (in thousands) |
(73) |
% |
|
947 |
|
3,563 |
|
13,497 |
|
|
|
|
| Dividends declared |
4 |
% |
|
$ |
1.64 |
|
$ |
1.58 |
|
$ |
1.44 |
|
|
|
|
Common dividend payout ratio 2 |
|
|
37.8% |
|
27.3% |
|
21.1% |
|
|
|
|
Capital distributed as a percentage of net earnings applicable to common shareholders 3 |
|
|
46% |
|
50% |
|
94% |
|
|
|
|
Efficiency ratio 1 |
|
|
62.9% |
|
58.8% |
|
60.8% |
|
|
|
|
|
|
|
|
|
|
|
|
|
|
|
|
|
|
|
|
|
|
|
|
|
|
|
|
1 See “Non-GAAP Financial Measures” on page 77 for more information.
2 The common dividend payout ratio is equal to common dividends paid divided by net earnings applicable to common shareholders.
3 This ratio is the common dividends paid plus share repurchases for the year, divided by net earnings applicable to common shareholders.
ZIONS BANCORPORATION, NATIONAL ASSOCIATION AND SUBSIDIARIES
Net Interest Income and Net Interest Margin
Net interest income is the difference between interest earned on interest-earning assets and interest paid on interest-bearing liabilities, and represented 78% and 80% of our net revenue (net interest income plus noninterest income) during 2023 and 2022, respectively. The NIM is calculated as net interest income as a percent of average interest-earning assets.
Schedule 5
NET INTEREST INCOME AND NET INTEREST MARGIN
|
|
|
|
|
|
|
|
|
|
|
|
|
|
|
|
|
|
|
|
|
|
|
|
|
|
|
|
|
|
|
|
|
|
|
|
|
|
|
|
|
|
|
|
|
Amount change |
|
Percent change |
|
|
|
Amount change |
|
Percent change |
|
|
| (Dollar amounts in millions) |
2023 |
|
|
|
2022 |
|
|
|
2021 |
|
|
|
|
|
|
|
|
|
|
|
|
|
|
| Interest and fees on loans |
$ |
3,196 |
|
$ |
1,084 |
|
|
51 |
% |
|
$ |
2,112 |
|
$ |
177 |
|
|
9 |
% |
|
$ |
1,935 |
| Interest on money market investments |
188 |
|
107 |
|
|
NM |
|
81 |
|
60 |
|
|
NM |
|
21 |
| Interest on securities |
563 |
|
51 |
|
|
10 |
|
|
512 |
|
201 |
|
|
65 |
|
|
311 |
| Total interest income |
3,947 |
|
1,242 |
|
|
46 |
|
|
2,705 |
|
438 |
|
|
19 |
|
|
2,267 |
| Interest on deposits |
1,063 |
|
993 |
|
|
NM |
|
70 |
|
40 |
|
|
NM |
|
30 |
| Interest on short- and long-term borrowings |
446 |
|
331 |
|
|
NM |
|
115 |
|
86 |
|
|
NM |
|
29 |
| Total interest expense |
1,509 |
|
1,324 |
|
|
NM |
|
185 |
|
126 |
|
|
NM |
|
59 |
| Net interest income |
$ |
2,438 |
|
$ |
(82) |
|
|
(3) |
|
|
$ |
2,520 |
|
$ |
312 |
|
|
14 |
|
|
$ |
2,208 |
|
|
|
|
|
|
|
|
|
|
|
|
|
|
| Average interest-earning assets |
$ |
81,984 |
|
$ |
(1,654) |
|
|
(2) |
% |
|
$ |
83,638 |
|
$ |
1,371 |
|
|
2 |
% |
|
$ |
82,267 |
| Average interest-bearing liabilities |
51,876 |
|
9,738 |
|
|
23 |
% |
|
42,138 |
|
1,388 |
|
|
3 |
% |
|
40,750 |
|
|
|
bps |
|
|
|
|
|
bps |
|
|
|
|
Yield on interest-earning assets 1 |
4.86 |
% |
|
158 |
|
|
|
|
3.28 |
% |
|
49 |
|
|
|
|
2.79 |
% |
Rate paid on total deposits and interest-bearing liabilities 1 |
1.87 |
% |
|
164 |
|
|
|
|
0.23 |
% |
|
16 |
|
|
|
|
0.07 |
% |
Cost of total deposits 1 |
1.46 |
% |
|
137 |
|
|
|
|
0.09 |
% |
|
5 |
|
|
|
|
0.04 |
% |
Net interest margin 1 |
3.02 |
% |
|
(4) |
|
|
|
|
3.06 |
% |
|
34 |
|
|
|
|
2.72 |
% |
1 Taxable-equivalent rates used where applicable.
Net interest income decreased $82 million, or 3%, in 2023, relative to the prior year, as higher earning asset yields were offset by higher funding costs. The NIM was 3.02%, compared with 3.06%.
The yield on average interest-earning assets was 4.86% in 2023, an increase of 158 basis points, reflecting higher interest rates and a favorable mix change to higher yielding assets. The yield on average loans and leases increased 163 basis points to 5.69% in 2023, compared with 4.06% in 2022, reflecting the higher interest rate environment. The yield on average securities increased 58 basis points to 2.64% in 2023.
The rate paid on average interest-bearing liabilities was 2.91% in 2023, compared with 0.44% in the prior year, and the cost of total deposits was 1.46%, compared with 0.09% in the prior year, also reflecting the higher interest rate environment, and the impact of the change in deposit composition away from noninterest-bearing deposits. The rate paid on total borrowed funds was 5.11%, compared with 3.27%, for the same time periods.
Net interest income was also impacted by a reduction in interest-earning assets and an increase in interest-bearing liabilities. Average interest-earning assets decreased $1.7 billion, or 2%, from the prior year, driven by declines in average securities and average money market investments. The decrease in average securities was primarily due to principal reductions. These decreases were partially offset by an increase of $4.1 billion in average loans and leases.
Average interest-bearing liabilities increased $9.7 billion, or 23%, primarily due to increases in average interest-bearing deposits and average borrowed funds. These increases were offset by a decline of $10.2 billion, or 26%, in average noninterest-bearing deposits, as customers migrated to interest-bearing products in response to the higher interest rate environment.
ZIONS BANCORPORATION, NATIONAL ASSOCIATION AND SUBSIDIARIES
The following charts further illustrate the changes in average interest-earning assets and average interest-bearing liabilities:
Average loans and leases increased $4.1 billion, or 8%, to $56.7 billion, primarily due to growth in average consumer and commercial loans. Average securities decreased $3.8 billion, or 15%, to $21.7 billion, primarily due to principal reductions. During the fourth quarter of 2022, we transferred approximately $10.7 billion fair value ($13.1 billion amortized cost) of mortgage-backed AFS securities to the held-to-maturity (“HTM”) category.
Average deposits decreased $5.6 billion, or 7%, to $72.9 billion, driven largely by the reduction in noninterest-bearing deposits. Average noninterest-bearing deposits as a percentage of total deposits decreased to 41% in 2023, compared with 51% during 2022. Our loan-to-deposit ratio was 77%, compared with 78% in the prior year.
ZIONS BANCORPORATION, NATIONAL ASSOCIATION AND SUBSIDIARIES
Average borrowed funds, consisting primarily of secured borrowings, increased $5.2 billion, or 149%, to $8.7 billion, due largely to a shift in wholesale funding needs as a result of fluctuations in deposit levels during 2023.
For more information on our investment securities portfolio and borrowed funds and how we manage liquidity risk, refer to the “Investment Securities Portfolio” section on page 46 and the “Liquidity Risk Management” section on page 67. For further discussion of the effects of market rates on net interest income and how we manage interest rate risk, refer to the “Interest Rate and Market Risk Management” section on page 63.
The following schedule summarizes the average balances, the amount of interest earned or paid, and the applicable yields for interest-earning assets and the costs of interest-bearing liabilities:
ZIONS BANCORPORATION, NATIONAL ASSOCIATION AND SUBSIDIARIES
Schedule 6
AVERAGE BALANCE SHEETS, YIELDS, AND RATES
|
|
|
|
|
|
|
|
|
|
|
|
|
|
|
|
|
|
|
|
|
|
|
|
|
|
|
|
|
|
|
|
|
|
|
|
|
Year Ended December 31, |
|
2023 |
|
2022 |
|
2021 |
| (In millions) |
Average balance |
Interest |
Yield/
Rate 1
|
|
Average balance |
Interest |
Yield/
Rate 1
|
|
Average balance |
Interest |
Yield/
Rate 1
|
| ASSETS |
|
|
|
|
|
|
|
|
|
|
|
| Money market investments: |
|
|
|
|
|
|
|
|
|
|
|
| Interest-bearing deposits |
$ |
2,163 |
|
$ |
112 |
|
5.18 |
% |
|
$ |
3,066 |
|
$ |
27 |
|
0.87 |
% |
|
$ |
8,917 |
|
$ |
12 |
|
0.14 |
% |
| Federal funds sold and securities purchased under agreements to resell |
1,358 |
|
76 |
|
5.57 |
|
|
2,482 |
|
54 |
|
2.16 |
|
|
2,129 |
|
9 |
|
0.40 |
|
| Total money market investments |
3,521 |
|
188 |
|
5.33 |
|
|
5,548 |
|
81 |
|
1.45 |
|
|
11,046 |
|
21 |
|
0.19 |
|
| Securities: |
|
|
|
|
|
|
|
|
|
|
|
| Held-to-maturity |
10,731 |
|
240 |
|
2.24 |
|
|
1,999 |
|
47 |
|
2.36 |
|
|
562 |
|
17 |
|
2.97 |
|
| Available-for-sale |
10,900 |
|
331 |
|
3.03 |
|
|
23,132 |
|
461 |
|
1.99 |
|
|
18,365 |
|
292 |
|
1.59 |
|
| Trading account |
53 |
|
1 |
|
2.86 |
|
|
322 |
|
16 |
|
4.79 |
|
|
246 |
|
11 |
|
4.43 |
|
| Total securities |
21,684 |
|
572 |
|
2.64 |
|
|
25,453 |
|
524 |
|
2.06 |
|
|
19,173 |
|
320 |
|
1.67 |
|
| Loans held for sale |
39 |
|
2 |
|
5.95 |
|
|
39 |
|
1 |
|
2.57 |
|
|
65 |
|
1 |
|
2.35 |
|
Loans and leases: 2 |
|
|
|
|
|
|
|
|
|
|
|
| Commercial |
30,519 |
|
1,679 |
|
5.50 |
|
|
29,225 |
|
1,194 |
|
4.09 |
|
|
29,580 |
|
1,185 |
|
4.01 |
|
| Commercial real estate |
13,023 |
|
908 |
|
6.98 |
|
|
12,251 |
|
544 |
|
4.44 |
|
|
12,136 |
|
418 |
|
3.44 |
|
| Consumer |
13,198 |
|
639 |
|
4.84 |
|
|
11,122 |
|
398 |
|
3.58 |
|
|
10,267 |
|
354 |
|
3.44 |
|
| Total loans and leases |
56,740 |
|
3,226 |
|
5.69 |
|
|
52,598 |
|
2,136 |
|
4.06 |
|
|
51,983 |
|
1,957 |
|
3.76 |
|
| Total interest-earning assets |
81,984 |
|
3,988 |
|
4.86 |
|
|
83,638 |
|
2,742 |
|
3.28 |
|
|
82,267 |
|
2,299 |
|
2.79 |
|
| Cash and due from banks |
662 |
|
|
|
|
621 |
|
|
|
|
605 |
|
|
|
| Allowance for credit losses on loans and debt securities |
(632) |
|
|
|
|
(514) |
|
|
|
|
(612) |
|
|
|
| Goodwill and intangibles |
1,062 |
|
|
|
|
1,022 |
|
|
|
|
1,015 |
|
|
|
| Other assets |
5,579 |
|
|
|
|
4,908 |
|
|
|
|
4,122 |
|
|
|
| Total assets |
$ |
88,655 |
|
|
|
|
$ |
89,675 |
|
|
|
|
$ |
87,397 |
|
|
|
| LIABILITIES AND SHAREHOLDERS’ EQUITY |
|
|
|
|
|
|
|
|
|
|
| Interest-bearing deposits: |
|
|
|
|
|
|
|
|
|
|
|
| Savings and money market |
$ |
34,135 |
|
$ |
650 |
|
1.90 |
|
|
$ |
37,045 |
|
$ |
61 |
|
0.16 |
|
|
$ |
36,717 |
|
$ |
21 |
|
0.06 |
|
| Time |
9,028 |
|
413 |
|
4.58 |
|
|
1,594 |
|
9 |
|
0.58 |
|
|
2,020 |
|
9 |
|
0.41 |
|
|
|
|
|
|
|
|
|
|
|
|
|
| Total interest-bearing deposits |
43,163 |
|
1,063 |
|
2.46 |
|
|
38,639 |
|
70 |
|
0.18 |
|
|
38,737 |
|
30 |
|
0.08 |
|
| Borrowed funds: |
|
|
|
|
|
|
|
|
|
|
|
| Federal funds purchased and security repurchase agreements |
3,380 |
|
169 |
|
4.98 |
|
|
1,531 |
|
38 |
|
2.49 |
|
|
797 |
|
1 |
|
0.07 |
|
| Other short-term borrowings |
4,741 |
|
241 |
|
5.08 |
|
|
1,263 |
|
46 |
|
3.65 |
|
|
5 |
|
— |
|
0.04 |
|
| Long-term debt |
592 |
|
36 |
|
6.09 |
|
|
705 |
|
31 |
|
4.28 |
|
|
1,211 |
|
28 |
|
2.36 |
|
| Total borrowed funds |
8,713 |
|
446 |
|
5.11 |
|
|
3,499 |
|
115 |
|
3.27 |
|
|
2,013 |
|
29 |
|
1.45 |
|
| Total interest-bearing funds |
51,876 |
|
1,509 |
|
2.91 |
|
|
42,138 |
|
185 |
|
0.44 |
|
|
40,750 |
|
59 |
|
0.14 |
|
| Noninterest-bearing demand deposits |
29,703 |
|
|
|
|
39,890 |
|
|
|
|
37,520 |
|
|
|
|
|
|
|
|
|
|
|
|
|
|
|
| Other liabilities |
1,797 |
|
|
|
|
1,735 |
|
|
|
|
1,259 |
|
|
|
| Total liabilities |
83,376 |
|
|
|
|
83,763 |
|
|
|
|
79,529 |
|
|
|
| Shareholders’ equity: |
|
|
|
|
|
|
|
|
|
|
|
| Preferred equity |
440 |
|
|
|
|
440 |
|
|
|
|
497 |
|
|
|
| Common equity |
4,839 |
|
|
|
|
5,472 |
|
|
|
|
7,371 |
|
|
|
|
|
|
|
|
|
|
|
|
|
|
|
|
|
|
|
|
|
|
|
|
|
|
|
| Total shareholders’ equity |
5,279 |
|
|
|
|
5,912 |
|
|
|
|
7,868 |
|
|
|
| Total liabilities and shareholders’ equity |
$ |
88,655 |
|
|
|
|
$ |
89,675 |
|
|
|
|
$ |
87,397 |
|
|
|
| Spread on average interest-bearing funds |
|
|
1.95 |
% |
|
|
|
2.84 |
% |
|
|
|
2.65 |
% |
| Impact of net noninterest-bearing sources of funds |
|
|
1.07 |
% |
|
|
|
0.22 |
% |
|
|
|
0.07 |
% |
| Net interest margin |
|
$ |
2,479 |
|
3.02 |
% |
|
|
$ |
2,557 |
|
3.06 |
% |
|
|
$ |
2,240 |
|
2.72 |
% |
| Memo: total cost of deposits |
|
|
1.46 |
% |
|
|
|
0.09 |
% |
|
|
|
0.04 |
% |
| Memo: total deposits and interest-bearing liabilities |
81,579 |
|
1,509 |
|
1.87 |
% |
|
82,028 |
|
185 |
|
0.23 |
% |
|
78,270 |
|
59 |
|
0.07 |
% |
1 Taxable-equivalent rates used where applicable.
2 Net of unamortized purchase premiums, discounts, and deferred loan fees and costs. Loans include nonaccrual and restructured loans.
ZIONS BANCORPORATION, NATIONAL ASSOCIATION AND SUBSIDIARIES
The following schedule presents year-over-year changes in net interest income on a fully taxable-equivalent basis for the years indicated. For purposes of calculating the yields in this schedule, the average loan balances also include the principal amounts of nonaccrual and restructured loans. Interest payments received on nonaccrual loans are not recognized into interest income, but are applied as a reduction to the principal outstanding. In addition, interest on modified loans is generally accrued at the modified rates.
In the analysis of changes in taxable-equivalent net interest income attributed to volume and rate, changes are allocated to volume with the following exceptions: when volume and rate both increase, the variance is allocated proportionately to both volume and rate; when the rate increases and volume decreases, the variance is allocated to rate.
Schedule 7
ANALYSIS OF CHANGES IN TAXABLE-EQUIVALENT NET INTEREST INCOME
|
|
|
|
|
|
|
|
|
|
|
|
|
|
|
|
|
|
|
|
|
|
|
|
|
|
|
|
|
|
|
|
|
|
|
|
|
2023 over 2022 |
|
2022 over 2021 |
|
Changes due to |
|
Total changes |
|
Changes due to |
|
Total changes |
| (In millions) |
Volume |
|
Rate1 |
|
|
Volume |
|
Rate1 |
|
| INTEREST-EARNING ASSETS |
|
|
|
|
|
|
|
|
|
|
|
| Money market investments: |
|
|
|
|
|
|
|
|
|
|
|
| Interest-bearing deposits |
$ |
(8) |
|
|
$ |
93 |
|
|
$ |
85 |
|
|
$ |
(8) |
|
|
$ |
23 |
|
|
$ |
15 |
|
| Federal funds sold and securities purchased under agreements to resell |
(25) |
|
|
47 |
|
|
22 |
|
|
1 |
|
|
44 |
|
|
45 |
|
| Total money market investments |
(33) |
|
|
140 |
|
|
107 |
|
|
(7) |
|
|
67 |
|
|
60 |
|
| Securities: |
|
|
|
|
|
|
|
|
|
|
|
| Held-to-maturity |
195 |
|
|
(2) |
|
|
193 |
|
|
34 |
|
|
(4) |
|
|
30 |
|
| Available-for-sale |
(244) |
|
|
114 |
|
|
(130) |
|
|
86 |
|
|
83 |
|
|
169 |
|
| Trading account |
(8) |
|
|
(7) |
|
|
(15) |
|
|
4 |
|
|
1 |
|
|
5 |
|
| Total securities |
(57) |
|
|
105 |
|
|
48 |
|
|
124 |
|
|
80 |
|
|
204 |
|
| Loans held for sale |
— |
|
|
1 |
|
|
1 |
|
|
— |
|
|
— |
|
|
— |
|
Loans and leases2 |
|
|
|
|
|
|
|
|
|
|
|
| Commercial |
56 |
|
|
429 |
|
|
485 |
|
|
(59) |
|
|
68 |
|
|
9 |
|
| Commercial real estate |
36 |
|
|
328 |
|
|
364 |
|
|
3 |
|
|
123 |
|
|
126 |
|
| Consumer |
84 |
|
|
157 |
|
|
241 |
|
|
30 |
|
|
14 |
|
|
44 |
|
| Total loans and leases |
176 |
|
|
914 |
|
|
1,090 |
|
|
(26) |
|
|
205 |
|
|
179 |
|
| Total interest-earning assets |
86 |
|
|
1,160 |
|
|
1,246 |
|
|
91 |
|
|
352 |
|
|
443 |
|
| INTEREST-BEARING LIABILITIES |
|
|
|
|
|
|
|
|
|
|
|
| Interest-bearing deposits: |
|
|
|
|
|
|
|
|
|
|
|
| Saving and money market |
(6) |
|
|
595 |
|
|
589 |
|
|
1 |
|
|
39 |
|
|
40 |
|
| Time |
163 |
|
|
241 |
|
|
404 |
|
|
(2) |
|
|
2 |
|
|
— |
|
|
|
|
|
|
|
|
|
|
|
|
|
| Total interest-bearing deposits |
157 |
|
|
836 |
|
|
993 |
|
|
(1) |
|
|
41 |
|
|
40 |
|
| Borrowed funds: |
|
|
|
|
|
|
|
|
|
|
|
| Federal funds purchased and security repurchase agreements |
72 |
|
|
59 |
|
|
131 |
|
|
— |
|
|
37 |
|
|
37 |
|
| Other short-term borrowings |
171 |
|
|
24 |
|
|
195 |
|
|
34 |
|
|
12 |
|
|
46 |
|
| Long-term debt |
(6) |
|
|
11 |
|
|
5 |
|
|
(11) |
|
|
14 |
|
|
3 |
|
| Total borrowed funds |
237 |
|
|
94 |
|
|
331 |
|
|
23 |
|
|
63 |
|
|
86 |
|
| Total interest-bearing liabilities |
394 |
|
|
930 |
|
|
1,324 |
|
|
22 |
|
|
104 |
|
|
126 |
|
| Change in taxable-equivalent net interest income |
$ |
(308) |
|
|
$ |
230 |
|
|
$ |
(78) |
|
|
$ |
69 |
|
|
$ |
248 |
|
|
$ |
317 |
|
1 Taxable-equivalent rates used where applicable.
2 Net of unearned income and fees, net of related costs. Loans include nonaccrual and modified loans.
ZIONS BANCORPORATION, NATIONAL ASSOCIATION AND SUBSIDIARIES
Provision for Credit Losses
The allowance for credit losses (“ACL”) is the combination of both the allowance for loan and lease losses (“ALLL”) and the reserve for unfunded lending commitments (“RULC”). The ALLL represents the estimated current expected credit losses related to the loan and lease portfolio as of the balance sheet date. The RULC represents the estimated reserve for current expected credit losses associated with off-balance sheet commitments. Changes in the ALLL and RULC, net of charge-offs and recoveries, are recorded as the provision for loan and lease losses and the provision for unfunded lending commitments, respectively, on the consolidated statement of income. The ACL for debt securities is estimated separately from loans and is included in “Investment securities” on the consolidated balance sheet.
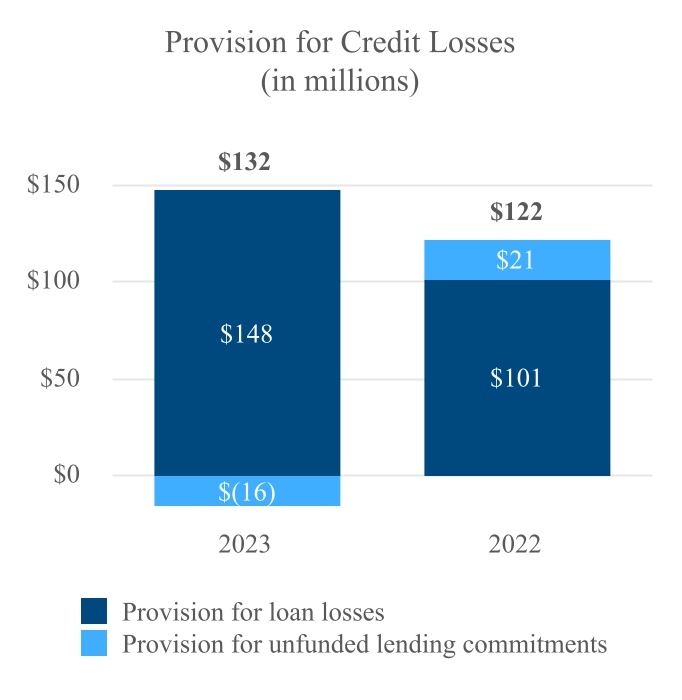
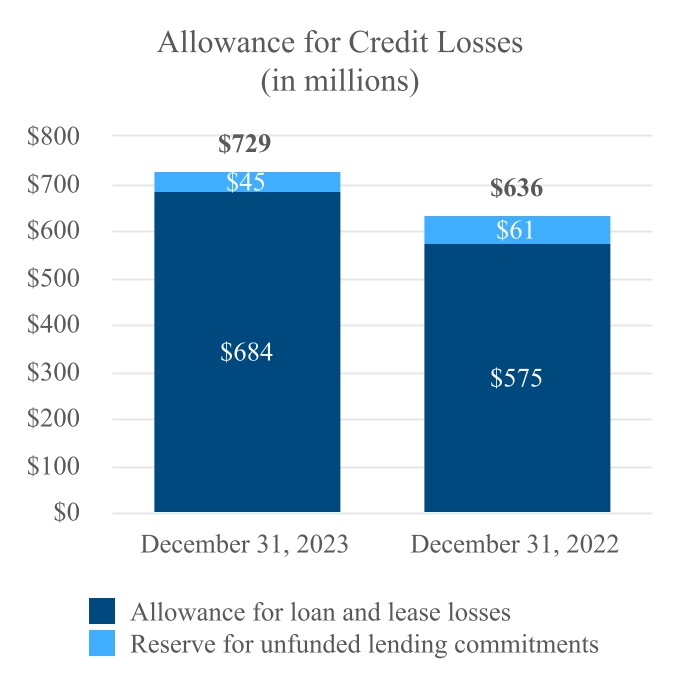
The provision for credit losses, which is the combination of both the provision for loan and lease losses and the provision for unfunded lending commitments, was $132 million in 2023, compared with $122 million in 2022.
The ACL was $729 million at December 31, 2023, compared with $636 million at December 31, 2022. The increase in the ACL reflects incremental reserves associated with portfolio-specific risks including commercial real estate, as well as deterioration in economic forecasts. The ratio of ACL to total loans and leases was 1.26% at December 31, 2023, compared with 1.14% at December 31, 2022. The provision for securities losses was less than $1 million during 2023 and 2022.
ZIONS BANCORPORATION, NATIONAL ASSOCIATION AND SUBSIDIARIES
The bar chart above illustrates the broad categories of change in the ACL from the prior year period. The second bar represents changes in economic forecasts and current economic conditions, which increased the ACL by $33 million from the prior year period.
The third bar represents changes in credit quality factors and includes risk-grade migration, portfolio-specific risks, and specific reserves against loans, which, when combined, increased the ACL by $84 million, driven largely by an increased focus on certain portfolio-specific risks, including commercial real estate.
The fourth bar represents loan portfolio changes, driven primarily by changes in loan balances and composition, the aging of the portfolio, and other qualitative risk factors; all of which resulted in a $24 million decrease in the ACL.
See “Credit Risk Management” on page 54 and Note 6 of the Notes to Consolidated Financial Statements for more information on how we determine the appropriate level of the ALLL and the RULC.
Noninterest Income
Noninterest income represents revenue we earn from products and services that generally have no associated interest rate or yield and is classified as either customer-related or noncustomer-related. Customer-related noninterest income excludes items such as securities gains and losses, dividends, insurance-related income, and mark-to-market adjustments on certain derivatives.
Total noninterest income increased $45 million, or 7%, in 2023, relative to the prior year. Noninterest income accounted for 22% and 20% of net revenue during 2023 and 2022, respectively. The following schedule presents a comparison of the major components of noninterest income:
ZIONS BANCORPORATION, NATIONAL ASSOCIATION AND SUBSIDIARIES
Schedule 8
NONINTEREST INCOME
|
|
|
|
|
|
|
|
|
|
|
|
|
|
|
|
|
|
|
|
|
|
|
|
|
|
|
|
|
|
|
|
|
|
|
|
|
|
|
|
|
|
| (Dollar amounts in millions) |
2023 |
|
Amount change |
|
Percent change |
|
2022 |
|
Amount change |
|
Percent change |
|
2021 |
|
|
|
|
|
|
|
|
|
|
|
|
|
|
| Commercial account fees |
$ |
174 |
|
|
$ |
15 |
|
|
9 |
% |
|
$ |
159 |
|
|
$ |
22 |
|
|
16 |
% |
|
$ |
137 |
|
| Card fees |
101 |
|
|
(3) |
|
|
(3) |
|
|
104 |
|
|
9 |
|
|
9 |
|
|
95 |
|
| Retail and business banking fees |
66 |
|
|
(7) |
|
|
(10) |
|
|
73 |
|
|
(1) |
|
|
(1) |
|
|
74 |
|
| Loan-related fees and income |
79 |
|
|
(1) |
|
|
(1) |
|
|
80 |
|
|
(15) |
|
|
(16) |
|
|
95 |
|
| Capital markets fees |
81 |
|
|
(2) |
|
|
(2) |
|
|
83 |
|
|
13 |
|
|
19 |
|
|
70 |
|
| Wealth management fees |
58 |
|
|
3 |
|
|
5 |
|
|
55 |
|
|
5 |
|
|
10 |
|
|
50 |
|
| Other customer-related fees |
61 |
|
|
1 |
|
|
2 |
|
|
60 |
|
|
6 |
|
|
11 |
|
|
54 |
|
| Customer-related noninterest income |
620 |
|
|
6 |
|
|
1 |
% |
|
614 |
|
|
39 |
|
|
7 |
% |
|
575 |
|
|
|
|
|
|
|
|
|
|
|
|
|
|
|
| Fair value and nonhedge derivative income (loss) |
(4) |
|
|
(20) |
|
|
NM |
|
16 |
|
|
2 |
|
|
14 |
|
|
14 |
|
| Dividends and other income |
57 |
|
|
40 |
|
|
NM |
|
17 |
|
|
(26) |
|
|
(60) |
|
|
43 |
|
| Securities gains (losses), net |
4 |
|
|
19 |
|
|
NM |
|
(15) |
|
|
(86) |
|
|
NM |
|
71 |
|
| Noncustomer-related noninterest income |
57 |
|
|
39 |
|
|
NM |
|
18 |
|
|
(110) |
|
|
(86) |
|
|
128 |
|
| Total noninterest income |
$ |
677 |
|
|
$ |
45 |
|
|
7 |
% |
|
$ |
632 |
|
|
$ |
(71) |
|
|
(10) |
% |
|
$ |
703 |
|
Customer-related Noninterest Income
Consistent with our key corporate objectives, we continue to deepen existing relationships with our commercial, small business, capital markets, affluent, and retail customers by providing high-quality treasury management products, capital market solutions, wealth management advisory services, and depository account services.
Total customer-related noninterest income increased $6 million, or 1%, in 2023, relative to the prior year. Key drivers impacting customer-related revenue included:
•Commercial account fees increased $15 million or 9%, driven by increases in treasury management sweep income, account analysis fees, and bankcard merchant fees.
•Wealth management fee income increased $3 million, or 5%, reflecting growth in assets and increased wealth and advisory services. Our assets under management were $13.3 billion at December 31, 2023.
•Retail and business banking fees decreased $7 million, or 10%, primarily due to changes in our overdraft and non-sufficient funds practices, which were effected in the third quarter of 2022.
•Card fees decreased $3 million, or 3%, due to declines in commercial and business bankcard interchange fees.
•Capital markets fees decreased $2 million, or 2%, primarily due to reduced customer swap and loan syndication fees.
Noncustomer-related Noninterest Income
Total noncustomer-related noninterest income increased $39 million in 2023. Dividends and other income increased $40 million, primarily due to higher dividends on FHLB stock resulting from increased average FHLB activity stock and an increase in the associated dividend rate, when compared with the prior year, as well as a gain on sale of a bank-owned property in the second quarter of 2023. Net securities gains increased $19 million, due largely to higher losses recorded during the prior year in our Small Business Investment Company (“SBIC”) investment portfolio. Fair value and nonhedge derivative income decreased $20 million, primarily due to larger gains during the prior year related to credit valuation adjustments (“CVA”) on client-related interest rate swaps.
ZIONS BANCORPORATION, NATIONAL ASSOCIATION AND SUBSIDIARIES
Noninterest Expense
The following schedule presents a comparison of the major components of noninterest expense:
Schedule 9
NONINTEREST EXPENSE
|
|
|
|
|
|
|
|
|
|
|
|
|
|
|
|
|
|
|
|
|
|
|
|
|
|
|
|
|
|
|
|
|
|
|
|
|
|
|
|
|
|
| (Dollar amounts in millions) |
2023 |
|
Amount change |
|
Percent change |
|
2022 |
|
Amount change |
|
Percent change |
|
2021 |
|
|
|
|
|
|
|
|
|
|
|
|
|
|
| Salaries and employee benefits |
$ |
1,275 |
|
|
$ |
40 |
|
|
3 |
% |
|
$ |
1,235 |
|
|
$ |
108 |
|
|
10 |
% |
|
$ |
1,127 |
|
| Technology, telecom, and information processing |
240 |
|
|
31 |
|
|
15 |
|
|
209 |
|
|
10 |
|
|
5 |
|
|
199 |
|
| Occupancy and equipment, net |
160 |
|
|
8 |
|
|
5 |
|
|
152 |
|
|
(1) |
|
|
(1) |
|
|
153 |
|
| Professional and legal services |
62 |
|
|
5 |
|
|
9 |
|
|
57 |
|
|
(15) |
|
|
(21) |
|
|
72 |
|
| Marketing and business development |
46 |
|
|
7 |
|
|
18 |
|
|
39 |
|
|
(4) |
|
|
(9) |
|
|
43 |
|
| Deposit insurance and regulatory expense |
169 |
|
|
119 |
|
|
NM |
|
50 |
|
|
16 |
|
|
47 |
|
|
34 |
|
| Credit-related expense |
26 |
|
|
(4) |
|
|
(13) |
|
|
30 |
|
|
4 |
|
|
15 |
|
|
26 |
|
| Other real estate expense, net |
— |
|
|
(1) |
|
|
NM |
|
1 |
|
|
1 |
|
|
NM |
|
— |
|
| Other |
119 |
|
|
14 |
|
|
13 |
|
|
105 |
|
|
18 |
|
|
21 |
|
|
87 |
|
| Total noninterest expense |
$ |
2,097 |
|
|
$ |
219 |
|
|
12 |
% |
|
$ |
1,878 |
|
|
$ |
137 |
|
|
8 |
% |
|
$ |
1,741 |
|
| Adjusted noninterest expense (non-GAAP) |
$ |
1,986 |
|
|
$ |
110 |
|
|
6 |
% |
|
$ |
1,876 |
|
|
$ |
139 |
|
|
8 |
% |
|
$ |
1,737 |
|
Noninterest expense increased $219 million, or 12%, in 2023, relative to the prior year, primarily due to a $119 million increase in deposit insurance and regulatory expense, driven largely by a $90 million accrual associated with the FDIC special assessment during the fourth quarter of 2023, as well as an increased FDIC insurance base rate beginning in 2023.
In November 2023, the FDIC issued a final rule to implement a special assessment pursuant to a systemic risk determination to recover the costs associated with protecting uninsured depositors following the closures of Silicon Valley Bank and Signature Bank in early 2023. Using an assessment base equal to the estimated amount of uninsured deposits above $5 billion at December 31, 2022, the FDIC is expected to collect a tax-deductible special assessment from banks at an annual rate of approximately 13.4 bps for an anticipated eight quarterly assessment periods, beginning with the first quarter of 2024.
Salaries and benefits expense represented approximately 61% and 66% of total noninterest expense during 2023 and 2022, respectively. The following schedule presents the major components of salaries and employee benefits expense:
Schedule 10
SALARIES AND EMPLOYEE BENEFITS
|
|
|
|
|
|
|
|
|
|
|
|
|
|
|
|
|
|
|
|
|
|
|
|
|
|
|
|
|
|
|
|
|
|
|
|
|
|
|
|
|
|
| (Dollar amounts in millions) |
2023 |
|
Amount/quantity change |
|
Percent change |
|
2022 |
|
Amount/quantity change |
|
Percent change |
|
2021 |
|
|
|
|
|
|
|
|
|
|
|
|
|
|
| Salaries and bonuses |
$ |
1,057 |
|
|
$ |
29 |
|
|
3 |
% |
|
$ |
1,028 |
|
|
$ |
93 |
|
|
10 |
% |
|
$ |
935 |
|
| Employee benefits: |
|
|
|
|
|
|
|
|
|
|
|
|
|
| Employee health and insurance |
100 |
|
|
7 |
|
|
8 |
|
|
93 |
|
|
10 |
|
|
12 |
|
|
83 |
|
| Retirement and profit sharing |
51 |
|
|
(1) |
|
|
(2) |
|
|
52 |
|
|
(5) |
|
|
(9) |
|
|
57 |
|
| Payroll taxes and other fringe benefits |
67 |
|
|
5 |
|
|
8 |
|
|
62 |
|
|
10 |
|
|
19 |
|
|
52 |
|
| Total employee benefits |
218 |
|
|
11 |
|
|
5 |
|
|
207 |
|
|
15 |
|
|
8 |
|
|
192 |
|
| Total salaries and employee benefits |
$ |
1,275 |
|
|
$ |
40 |
|
|
3 |
% |
|
$ |
1,235 |
|
|
$ |
108 |
|
|
10 |
% |
|
$ |
1,127 |
|
|
|
|
|
|
|
|
|
|
|
|
|
|
|
| Full-time equivalent employees at December 31, |
9,679 |
|
|
(310) |
|
|
(3) |
% |
|
9,989 |
|
|
304 |
|
|
3 |
% |
|
9,685 |
|
ZIONS BANCORPORATION, NATIONAL ASSOCIATION AND SUBSIDIARIES
Total salaries and benefits expense increased $40 million, or 3%, primarily due to the ongoing impact of inflationary and competitive labor market pressures on wages and benefits, a decline in deferred salaries related to fewer loan originations and reduced software development activities, and an increase in severance expense. These increases were partially offset by a decrease in incentive compensation accruals. We had 9,679 full-time equivalent employees at December 31, 2023, a decrease of approximately 3% relative to the prior year.
Technology, telecom, and information processing expense increased $31 million, or 15%, primarily due to increases in software amortization expenses associated with the replacement of our core loan and deposit banking system, as well as other related application software, license, and maintenance expenses, reflecting our ongoing investments in strategic technology initiatives designed to improve our products and services and to simplify how we do business. For further discussion on the replacement of our core loan and deposit banking system, see “Premises, Equipment, and Software” on page 52.
The efficiency ratio was 62.9%, compared with 58.8%, primarily due to a decline in adjusted taxable-equivalent revenue. For information on non-GAAP financial measures, see page 77.
Technology Spend
Consistent with our strategic objectives, we invest in technologies that will make us more efficient and enable us to remain competitive. We generally consider these investments as technology spend, which represents expenditures associated with technology-related investments, operations, systems, and infrastructure, and includes current period expenses presented on the consolidated statement of income, as well as capitalized investments, net of related amortization and depreciation, presented on the consolidated balance sheet. Technology spend is reported as a combination of the following:
•Technology, telecom, and information processing expense — includes expenses related to application software licensing and maintenance, related amortization, telecommunications, and data processing;
•Other technology-related expense — includes related noncapitalized salaries and employee benefits, occupancy and equipment, and professional and legal services; and
•Technology investments — includes capitalized technology infrastructure equipment, hardware, and purchased or internally developed software, less related amortization or depreciation.
The following schedule presents the composition of our technology spend:
Schedule 11
TECHNOLOGY SPEND
|
|
|
|
|
|
|
|
|
|
|
|
|
|
|
|
|
|
|
|
|
|
|
|
|
|
|
|
|
|
|
|
|
|
|
|
|
December 31 |
|
|
|
Amount
change |
|
Percent
change |
|
|
|
|
|
|
| (In millions) |
2023 |
|
2022 |
|
|
|
|
|
|
|
|
|
|
|
|
|
|
|
|
|
|
|
|
|
|
|
|
|
|
|
|
|
|
| Technology, telecom, and information processing expense |
$ |
240 |
|
|
$ |
209 |
|
|
|
|
|
|
$ |
31 |
|
|
15 |
% |
|
|
|
|
|
|
|
|
| Other technology-related expense |
232 |
|
|
206 |
|
|
|
|
|
|
26 |
|
|
13 |
|
|
|
|
|
|
|
|
|
| Technology investments |
82 |
|
|
90 |
|
|
|
|
|
|
(8) |
|
|
(9) |
|
|
|
|
|
|
|
|
|
| Less: related amortization and depreciation |
(71) |
|
|
(54) |
|
|
|
|
|
|
(17) |
|
|
31 |
|
|
|
|
|
|
|
|
|
Total technology spend |
$ |
483 |
|
|
$ |
451 |
|
|
|
|
|
|
$ |
32 |
|
|
7 |
% |
|
|
|
|
|
|
|
|
Total technology spend increased $32 million, or 7%, relative to the prior year, driven largely by the aforementioned increases in technology, telecom, and information processing expense, as well as higher technology-related compensation and investments in resiliency.
ZIONS BANCORPORATION, NATIONAL ASSOCIATION AND SUBSIDIARIES
Income Taxes
The following schedule summarizes the income tax expense and effective tax rates for the periods presented:
Schedule 12
INCOME TAXES
|
|
|
|
|
|
|
|
|
|
|
|
|
|
|
|
|
|
|
| (Dollar amounts in millions) |
2023 |
|
2022 |
|
2021 |
|
|
|
|
|
|
|
|
| Income before income taxes |
$ |
886 |
|
|
$ |
1,152 |
|
|
$ |
1,446 |
|
|
| Income tax expense |
206 |
|
|
245 |
|
|
317 |
|
|
| Effective tax rate |
23.3 |
% |
|
21.3 |
% |
|
21.9 |
% |
|
The effective tax rates for the periods presented above were decreased by nontaxable municipal interest income and nontaxable income from certain bank-owned life insurance (“BOLI”), and were increased by the nondeductibility of certain FDIC premiums, certain executive compensation, and other fringe benefits. The increase in the effective tax rate for 2023 was primarily due to higher FDIC premium expense (regular FDIC insurance premiums are non-deductible) and interest expense related to tax-exempt income. Additionally, investments in technology initiatives, low-income housing, and municipal securities during 2023, 2022, and 2021, generated tax credits and nontaxable income that benefited the effective tax rate for each respective year.
We had a net DTA of $1.0 billion and $1.1 billion at December 31, 2023 and 2022, respectively. The decrease in the net DTA was driven largely by a decrease in unrealized losses in AOCI associated with investment securities and derivative instruments and a reduction of certain capitalized expenses for tax purposes. These decreases were partially offset by an increase in the provision for credit losses during 2023.
We had no valuation allowance at December 31, 2023 and December 31, 2022. See Note 20 of the Notes to Consolidated Financial Statements for more information about the factors that impacted our effective tax rate, significant components of our DTAs and DTLs, and unrecognized tax benefits for uncertain tax positions.
Preferred Stock Dividends
Preferred stock dividends totaled $32 million in 2023, and $29 million in both 2022 and 2021. See further details in Note 14 of the Notes to Consolidated Financial Statements.
Business Segment Results
We manage our operations through seven affiliate banks located in different geographic markets, each with its own local branding and management team. These affiliate banks comprise our primary business segments and include: Zions Bank, California Bank & Trust (“CB&T”), Amegy Bank (“Amegy”), National Bank of Arizona (“NBAZ”), Nevada State Bank (“NSB”), Vectra Bank Colorado (“Vectra”), and The Commerce Bank of Washington (“TCBW”). We emphasize local authority, responsibility, pricing, and customization of certain products that are designed to maximize customer satisfaction, strengthen community relations, and improve profitability and shareholder returns. Our affiliate banks are supported by an enterprise operating segment (referred to as the “Other” segment) that provides governance and risk management, allocates capital, establishes strategic objectives, and includes centralized technology, back-office functions, and certain lines of business not operated through our affiliate banks.
We allocate the cost of centrally provided services to the business segments based upon estimated or actual usage of those services. We also allocate capital based on the risk-weighted assets held at each business segment. We use an internal funds transfer pricing (“FTP”) allocation process to report results of operations for business segments. This process is subject to change and refinement over time. For more performance information related to our business segments, including the Other segment, see Note 22 of the Notes to Consolidated Financial Statements.
The following schedule summarizes selected financial information of our business segments. Ratios are calculated based on amounts in thousands.
ZIONS BANCORPORATION, NATIONAL ASSOCIATION AND SUBSIDIARIES
Schedule 13
SELECTED SEGMENT INFORMATION
|
|
|
|
|
|
|
|
|
|
|
|
|
|
|
|
|
|
|
|
|
|
|
|
|
|
|
|
|
|
|
|
|
|
|
|
| (Dollar amounts in millions) |
Zions Bank |
|
CB&T |
|
Amegy |
| 2023 |
2022 |
2021 |
|
2023 |
2022 |
2021 |
|
2023 |
2022 |
2021 |
| KEY FINANCIAL INFORMATION |
|
|
|
|
|
|
|
|
|
|
| Total average loans |
$ |
14,298 |
$ |
13,277 |
$ |
13,198 |
|
$ |
14,128 |
$ |
13,129 |
$ |
12,892 |
|
$ |
12,851 |
$ |
12,110 |
$ |
12,189 |
| Total average deposits |
20,233 |
24,317 |
23,588 |
|
14,253 |
16,160 |
15,796 |
|
13,569 |
15,735 |
15,496 |
| Income before income taxes |
311 |
387 |
380 |
|
282 |
314 |
405 |
|
218 |
311 |
362 |
| CREDIT QUALITY |
|
|
|
|
|
|
|
|
|
|
|
| Provision for credit losses |
$ |
20 |
$ |
43 |
$ |
(26) |
|
$ |
44 |
$ |
49 |
$ |
(78) |
|
$ |
15 |
$ |
5 |
$ |
(96) |
| Net loan and lease charge-offs (recoveries) |
19 |
29 |
— |
|
10 |
3 |
— |
|
5 |
3 |
2 |
Ratio of net charge-offs to average loans and leases |
0.13 |
% |
0.22 |
% |
— |
% |
|
0.07 |
% |
0.02 |
% |
— |
% |
|
0.04 |
% |
0.02 |
% |
0.02 |
% |
| Allowance for credit losses |
$ |
157 |
$ |
155 |
$ |
142 |
|
$ |
162 |
$ |
122 |
$ |
90 |
|
$ |
139 |
$ |
122 |
$ |
128 |
Ratio of allowance for credit losses to net loans and leases, at year-end |
1.10 |
% |
1.17 |
% |
1.08 |
% |
|
1.15 |
% |
0.93 |
% |
0.70 |
% |
|
1.08 |
% |
1.01 |
% |
1.05 |
% |
| Nonperforming assets |
$ |
26 |
$ |
36 |
$ |
84 |
|
$ |
82 |
$ |
25 |
$ |
41 |
|
$ |
35 |
$ |
59 |
$ |
90 |
Ratio of nonperforming assets to net loans and leases and other real estate owned |
0.18 |
% |
0.26 |
% |
0.65 |
% |
|
0.58 |
% |
0.18 |
% |
0.32 |
% |
|
0.27 |
% |
0.46 |
% |
0.77 |
% |
|
|
|
|
|
|
|
|
|
|
|
|
|
|
|
|
|
|
|
|
|
|
|
|
|
|
|
|
|
|
|
|
|
|
|
|
|
|
|
|
|
|
|
|
|
|
|
|
|
|
|
|
|
|
|
|
|
|
|
|
|
|
|
|
|
|
|
|
|
|
|
|
| (Dollar amounts in millions) |
NBAZ |
|
NSB |
|
Vectra |
|
TCBW |
| 2023 |
2022 |
2021 |
|
2023 |
2022 |
2021 |
|
2023 |
2022 |
2021 |
|
2023 |
2022 |
2021 |
| KEY FINANCIAL INFORMATION |
|
|
|
|
|
|
|
|
|
|
|
|
| Total average loans |
$ |
5,318 |
$ |
4,911 |
$ |
4,849 |
|
$ |
3,392 |
$ |
2,987 |
$ |
3,015 |
|
$ |
4,004 |
$ |
3,632 |
$ |
3,414 |
|
$ |
1,705 |
$ |
1,630 |
$ |
1,569 |
| Total average deposits |
7,008 |
8,035 |
7,288 |
|
6,964 |
7,436 |
6,691 |
|
3,482 |
4,109 |
4,386 |
|
1,196 |
1,571 |
1,537 |
Income before income taxes |
107 |
111 |
126 |
|
23 |
76 |
89 |
|
34 |
55 |
67 |
|
38 |
45 |
41 |
| CREDIT QUALITY |
|
|
|
|
|
|
|
|
|
|
|
|
|
|
|
Provision for credit losses |
$ |
4 |
$ |
11 |
$ |
(27) |
|
$ |
42 |
$ |
4 |
$ |
(35) |
|
$ |
7 |
$ |
9 |
$ |
(12) |
|
$ |
2 |
$ |
1 |
$ |
(3) |
Net loan and lease charge-offs (recoveries) |
1 |
(1) |
(1) |
|
3 |
(2) |
1 |
|
2 |
9 |
— |
|
— |
— |
1 |
Ratio of net charge-offs to average loans and leases |
0.02 |
% |
(0.02) |
% |
(0.02) |
% |
|
0.09 |
% |
(0.07) |
% |
0.03 |
% |
|
0.05 |
% |
0.25 |
% |
— |
% |
|
— |
% |
— |
% |
0.06 |
% |
Allowance for credit losses |
$ |
54 |
$ |
40 |
$ |
38 |
|
$ |
66 |
$ |
27 |
$ |
26 |
|
$ |
45 |
$ |
36 |
$ |
37 |
|
$ |
11 |
$ |
9 |
$ |
8 |
Ratio of allowance for credit losses to net loans and leases, at year-end |
1.02% |
0.81% |
0.79% |
|
1.95% |
0.90% |
0.86% |
|
1.12% |
0.99% |
1.08% |
|
0.65% |
0.55% |
0.51% |
Nonperforming assets |
$ |
12 |
$ |
6 |
$ |
11 |
|
$ |
46 |
$ |
9 |
$ |
24 |
|
$ |
16 |
$ |
14 |
$ |
18 |
|
$ |
8 |
$ |
— |
$ |
1 |
Ratio of nonperforming assets to net loans and leases and other real estate owned |
0.21% |
0.12% |
0.24% |
|
1.34% |
0.27% |
0.85% |
|
0.40% |
0.36% |
0.53% |
|
0.46% |
—% |
0.06% |
|
|
|
|
|
|
|
|
|
|
|
|
|
|
|
|
|
|
|
|
|
|
|
|
|
|
|
|
|
|
|
|
All references below to domestic deposits by state are based on FDIC deposit market share data for full-service institutions with at least three branches at June 30, 2023.
Zions Bank
Zions Bank is headquartered in Salt Lake City, Utah, and conducts operations in Utah, Idaho, and Wyoming. As measured by domestic deposits in these states, Zions Bank was the largest full-service commercial bank in Utah and the fifth largest in Idaho.
ZIONS BANCORPORATION, NATIONAL ASSOCIATION AND SUBSIDIARIES
Zions Bank’s income before income taxes decreased $76 million, or 20%, during 2023. The decrease was due to a $45 million decrease in net interest income and a $62 million increase in noninterest expense, partially offset by a $23 million decrease in the provision for credit losses and an $8 million increase in noninterest income. The loan portfolio increased $852 million during 2023, including increases of $557 million and $424 million in consumer and commercial loans, respectively, and a decrease of $129 million in CRE loans. The ratio of ACL to net loans and leases decreased to 1.10% at December 31, 2023, compared with 1.17%. Nonperforming assets decreased $10 million, or 28%, from the prior year. Total deposits decreased 3% in 2023.
California Bank & Trust
California Bank & Trust is headquartered in San Diego, California. As measured by domestic deposits in the state, CB&T was the 17th largest full-service commercial bank in California.
CB&T’s income before income taxes decreased $32 million, or 10%, during 2023. The decrease was due to a $48 million increase in noninterest expense, partially offset by an $8 million increase in noninterest income, a $5 million decrease in the provision for credit losses, and a $3 million increase in net interest income. The loan portfolio increased $291 million during 2023, including increases of $243 million and $164 million in consumer and CRE loans, respectively, and a decrease of $116 million in commercial loans. The ratio of ACL to net loans and leases increased to 1.15% at December 31, 2023, compared with 0.93%. Nonperforming assets increased $57 million from the prior year, driven largely by two suburban office commercial real estate loans totaling $46 million. Total deposits increased 2% in 2023.
Amegy Bank
Amegy Bank is headquartered in Houston, Texas. As measured by domestic deposits in the state, Amegy was the 9th largest full-service commercial bank in Texas.
Amegy’s income before income taxes decreased $93 million, or 30%, during 2023. The decrease was due to a $60 million decrease in net interest income, a $49 million increase in noninterest expense, and a $10 million increase in the provision for credit losses, partially offset by a $26 million increase in noninterest income. The loan portfolio increased $237 million during 2023, including increases of $171 million and $156 million in CRE and consumer loans, respectively, and a decrease of $90 million in commercial loans. The ratio of ACL to net loans and leases increased to 1.08% at December 31, 2023, compared with 1.01%. Nonperforming assets decreased $24 million, or 41%, from the prior year. Total deposits increased 9% in 2023.
National Bank of Arizona
National Bank of Arizona is headquartered in Phoenix, Arizona. As measured by domestic deposits in the state, NBAZ was the fifth largest full-service commercial bank in Arizona.
NBAZ’s income before income taxes decreased $4 million, or 4%, during 2023. The decrease was due to a $22 million increase in noninterest expense and an $8 million decrease in noninterest income, partially offset by a $19 million increase in net interest income and a $7 million decrease in the provision for credit losses. The loan portfolio increased $509 million during 2023, including increases of $259 million, $177 million, and $73 million in CRE, consumer, and commercial loans, respectively. The ratio of ACL to net loans and leases increased to 1.02% at December 31, 2023, compared with 0.81%. Nonperforming assets increased $6 million from the prior year. Total deposits decreased 6% in 2023.
Nevada State Bank
Nevada State Bank is headquartered in Las Vegas, Nevada. As measured by domestic deposits in the state, NSB was the fifth largest full-service commercial bank in Nevada.
NSB’s income before income taxes decreased $53 million, or 70%, during 2023. The decrease was due to a $38 million increase in the provision for credit losses, a $20 million increase in noninterest expense, and a $3 million decrease in noninterest income, partially offset by an $8 million increase in net interest income. The loan portfolio increased $158 million during 2023, including increases of $104 million and $56 million in consumer and CRE loans, respectively, and a decrease of $2 million in commercial loans.
ZIONS BANCORPORATION, NATIONAL ASSOCIATION AND SUBSIDIARIES
The ratio of ACL to net loans and leases increased to 1.95% at December 31, 2023, compared with 0.90%. Nonperforming assets increased $37 million from the prior year. Total deposits increased 1% in 2023.
In July 2022, NSB purchased three Northern Nevada City National Bank branches and their associated deposit, credit card, and loan accounts. In addition to the three branches, the purchase included approximately $430 million in deposits and $95 million in commercial and consumer loans.
Vectra Bank Colorado
Vectra Bank Colorado is headquartered in Denver, Colorado. As measured by domestic deposits in the state, Vectra was the 14th largest full-service commercial bank in Colorado.
Vectra’s income before income taxes decreased $21 million, or 38%, during 2023. The decrease was due to a $17 million increase in noninterest expense, a $3 million decrease in noninterest income, and a $3 million decrease in net interest income, partially offset by a $2 million decrease in the provision for credit losses. The loan portfolio increased $114 million during 2023, including increases of $160 million and $43 million in consumer and CRE loans, respectively, and a decrease of $89 million in commercial loans. The ratio of ACL to net loans and leases increased to 1.12% at December 31, 2023, compared with 0.99%. Nonperforming assets increased $2 million, or 14%, from the prior year. Total deposits decreased 9% in 2023.
The Commerce Bank of Washington
The Commerce Bank of Washington is headquartered in Seattle, Washington, and operates in Washington under The Commerce Bank of Washington name and in Portland, Oregon, under The Commerce Bank of Oregon name. The FDIC deposit market share data at June 30, 2023 for TCBW in Washington and Oregon was not meaningful.
TCBW’s income before income taxes decreased $7 million, or 16%, during 2023. The decrease was due to a $3 million increase in noninterest expense, a $3 million decrease in net interest income, and a $1 million increase in the provision for credit losses. The loan portfolio decreased $14 million during 2023, including a decrease of $83 million in commercial loans, partially offset by increases of $68 million and $1 million in CRE and consumer loans, respectively. The ratio of ACL to net loans and leases increased to 0.65% at December 31, 2023, compared with 0.55%. Nonperforming assets increased $8 million from the prior year. Total deposits decreased 23% in 2023.
BALANCE SHEET ANALYSIS
Interest-earning Assets
Interest-earning assets have associated interest rates or yields, and generally consist of loans and leases, securities, and money market investments. We strive to maintain a high level of interest-earning assets relative to total assets. For more information regarding the average balances, associated revenue generated, and the respective yields of our interest-earning assets, see Schedule 6 on page 35.
ZIONS BANCORPORATION, NATIONAL ASSOCIATION AND SUBSIDIARIES
AVERAGE NET LOANS, SECURITIES, AND MONEY MARKET INVESTMENTS
(at December 31)
Investment Securities Portfolio
We invest in securities to actively manage liquidity and interest rate risk and to generate interest income. We primarily own securities that can readily provide us cash and liquidity through secured borrowing agreements without the need to sell the securities. We also manage the duration of our investment securities portfolio to help balance the inherent interest rate mismatch between loans and deposits, and to protect the economic value of shareholders’ equity. At December 31, 2023, the estimated duration of our securities portfolio decreased to 3.6 percent, compared with 4.1 percent at December 31, 2022, primarily due to the addition of fair value hedges of fixed-rate securities during the second quarter of 2023.
For information about our borrowing capacity associated with the investment securities portfolio and how we manage our liquidity risk, refer to the “Liquidity Risk Management” section on page 67. See also Note 3 and Note 5 of the Notes to Consolidated Financial Statements for more information on fair value measurements and the accounting for our investment securities portfolio.
ZIONS BANCORPORATION, NATIONAL ASSOCIATION AND SUBSIDIARIES
Schedule 14
INVESTMENT SECURITIES PORTFOLIO
|
|
|
|
|
|
|
|
|
|
|
|
|
|
|
|
|
|
|
|
|
|
|
|
|
|
|
|
|
|
|
|
|
|
|
|
|
December 31, 2023 |
|
December 31, 2022 |
| (In millions) |
Par Value |
|
Amortized
cost |
|
Fair
value |
|
Par Value |
|
Amortized
cost |
|
Fair
value |
| Held-to-maturity |
|
|
|
|
|
|
|
|
|
|
|
| U.S. Government agencies and corporations: |
|
|
|
|
|
|
|
|
|
|
|
| Agency securities |
$ |
93 |
|
|
$ |
93 |
|
|
$ |
87 |
|
|
$ |
100 |
|
|
$ |
100 |
|
|
$ |
93 |
|
Agency guaranteed mortgage-backed securities 1 |
11,966 |
|
|
9,935 |
|
|
10,041 |
|
|
12,921 |
|
|
10,621 |
|
|
10,772 |
|
| Municipal securities |
354 |
|
|
354 |
|
|
338 |
|
|
404 |
|
|
405 |
|
|
374 |
|
| Total held-to-maturity |
12,413 |
|
|
10,382 |
|
|
10,466 |
|
|
13,425 |
|
|
11,126 |
|
|
11,239 |
|
| Available-for-sale |
|
|
|
|
|
|
|
|
|
|
|
| U.S. Treasury securities |
585 |
|
|
585 |
|
|
492 |
|
|
555 |
|
|
557 |
|
|
393 |
|
| U.S. Government agencies and corporations: |
|
|
|
|
|
|
|
|
|
|
|
| Agency securities |
669 |
|
|
663 |
|
|
630 |
|
|
790 |
|
|
782 |
|
|
736 |
|
| Agency guaranteed mortgage-backed securities |
8,460 |
|
|
8,530 |
|
|
7,291 |
|
|
9,566 |
|
|
9,652 |
|
|
8,367 |
|
| Small Business Administration loan-backed securities |
535 |
|
|
571 |
|
|
546 |
|
|
691 |
|
|
740 |
|
|
712 |
|
| Municipal securities |
1,269 |
|
|
1,385 |
|
|
1,318 |
|
|
1,571 |
|
|
1,732 |
|
|
1,634 |
|
| Other debt securities |
25 |
|
|
25 |
|
|
23 |
|
|
75 |
|
|
75 |
|
|
73 |
|
| Total available-for-sale |
11,543 |
|
|
11,759 |
|
|
10,300 |
|
|
13,248 |
|
|
13,538 |
|
|
11,915 |
|
|
|
|
|
|
|
|
|
|
|
|
|
|
|
|
|
|
|
|
|
|
|
|
|
| Total HTM and AFS investment securities |
$ |
23,956 |
|
|
$ |
22,141 |
|
|
$ |
20,766 |
|
|
$ |
26,673 |
|
|
$ |
24,664 |
|
|
$ |
23,154 |
|
1 During the fourth quarter of 2022, we transferred approximately $10.7 billion fair value ($13.1 billion amortized cost) of mortgage-backed AFS securities to the HTM category. The transfer of these securities from AFS to HTM at fair value resulted in a discount to the amortized cost basis of the HTM securities equivalent to the $2.4 billion ($1.8 billion after tax) of unrealized losses in AOCI attributable to these securities. The amortization of the unrealized losses will offset the effect of the accretion of the discount created by the transfer. At December 31, 2023, the unamortized discount on the HTM securities totaled approximately $2.1 billion ($1.5 billion after tax).
The amortized cost of total HTM and AFS investment securities decreased $2.5 billion, or 10%, during 2023, primarily due to principal reductions. Approximately 7.0% and 8.0% of the total HTM and AFS investment securities were floating-rate instruments at December 31, 2023 and 2022, respectively. Additionally, at December 31, 2023, we had a total of $3.6 billion of pay-fixed swaps held as fair value hedges against fixed-rate AFS securities that effectively convert the fixed interest income to a floating rate on the hedged portion of the securities.
At December 31, 2023, the AFS investment securities portfolio included approximately $216 million of net premium that was distributed across the various security categories. Total taxable-equivalent premium amortization for these investment securities was $75 million in 2023, compared with $103 million in 2022.
In addition to HTM and AFS securities, we also have a trading securities portfolio, comprised of municipal securities, which totaled $48 million at December 31, 2023. The trading securities portfolio at December 31, 2022 was $465 million and included $71 million of municipal securities and $394 million of money market mutual funds available for customer sweeps. Beginning in the first quarter of 2023, sweep-related balances were included in “Money market investments” on the consolidated balance sheet.
Refer to the “Interest Rate Risk Management” section on page 63, the “Capital Management” section on page 72, and Note 5 of the Notes to Consolidated Financial Statements for more discussion regarding our investment securities portfolio, swaps, and related unrealized gains and losses.
ZIONS BANCORPORATION, NATIONAL ASSOCIATION AND SUBSIDIARIES
Municipal Investments and Extensions of Credit
We support our communities by providing products and services to state and local governments (“municipalities”), including deposit services, loans, and investment banking services. We also invest in securities issued by municipalities. Our municipal lending products generally include loans in which the debt service is repaid from general funds or pledged revenues of the municipal entity, or to private commercial entities or 501(c)(3) not-for-profit entities utilizing a pass-through municipal entity to achieve favorable tax treatment.
The following schedule summarizes our total investments and extensions of credit to municipalities:
Schedule 15
MUNICIPAL INVESTMENTS AND EXTENSIONS OF CREDIT
|
|
|
|
|
|
|
|
|
|
|
|
|
December 31, |
| (In millions) |
2023 |
|
2022 |
|
|
|
|
| Loans and leases |
$ |
4,302 |
|
|
$ |
4,361 |
|
| Held-to-maturity – municipal securities |
354 |
|
|
405 |
|
| Available-for-sale – municipal securities |
1,318 |
|
|
1,634 |
|
| Trading account – municipal securities |
48 |
|
|
71 |
|
| Unfunded lending commitments |
231 |
|
|
406 |
|
| Total |
$ |
6,253 |
|
|
$ |
6,877 |
|
Our municipal loans and securities are primarily associated with municipalities located within our geographic footprint. The municipal loan and lease portfolio is primarily secured by general obligations of municipal entities. Other types of collateral also include real estate, revenue pledges, or equipment. At December 31, 2023, we had no municipal loans on nonaccrual.
Municipal securities are internally graded, similar to loans, using risk-grading systems which vary based on the size and type of credit risk exposure. The internal risk grades assigned to our municipal securities follow our definitions of Pass, Special Mention, and Substandard, which are consistent with published definitions of regulatory risk classifications. At December 31, 2023, all municipal securities were graded as Pass. See Notes 5 and 6 of the Notes to Consolidated Financial Statements for additional information about the credit quality of these municipal loans and securities.
Loan and Lease Portfolio
We provide a wide range of lending products to commercial customers, generally small- and medium-sized businesses. We also provide various retail lending products and services to consumers and small businesses. The following schedule presents the composition of our loan and lease portfolio:
ZIONS BANCORPORATION, NATIONAL ASSOCIATION AND SUBSIDIARIES
Schedule 16
LOAN AND LEASE PORTFOLIO
|
|
|
|
|
|
|
|
|
|
|
|
|
|
|
|
|
|
|
|
|
|
|
|
| |
December 31, 2023 |
|
December 31, 2022 |
| (Dollar amounts in millions) |
Amount |
|
% of
total loans |
|
Amount |
|
% of
total loans |
| Commercial: |
|
|
|
|
|
|
|
Commercial and industrial 1 |
$ |
16,684 |
|
|
28.9 |
% |
|
$ |
16,377 |
|
|
29.5 |
% |
| Leasing |
383 |
|
|
0.7 |
|
|
386 |
|
|
0.7 |
|
| Owner-occupied |
9,219 |
|
|
16.0 |
|
|
9,371 |
|
|
16.8 |
|
| Municipal |
4,302 |
|
|
7.4 |
|
|
4,361 |
|
|
7.8 |
|
| Total commercial |
30,588 |
|
|
53.0 |
|
|
30,495 |
|
|
54.8 |
|
| Commercial real estate: |
|
|
|
|
|
|
|
| Construction and land development |
2,669 |
|
|
4.6 |
|
|
2,513 |
|
|
4.5 |
|
| Term |
10,702 |
|
|
18.5 |
|
|
10,226 |
|
|
18.4 |
|
| Total commercial real estate |
13,371 |
|
|
23.1 |
|
|
12,739 |
|
|
22.9 |
|
| Consumer: |
|
|
|
|
|
|
|
| Home equity credit line |
3,356 |
|
|
5.8 |
|
|
3,377 |
|
|
6.1 |
|
| 1-4 family residential |
8,415 |
|
|
14.6 |
|
|
7,286 |
|
|
13.1 |
|
| Construction and other consumer real estate |
1,442 |
|
|
2.5 |
|
|
1,161 |
|
|
2.1 |
|
| Bankcard and other revolving plans |
474 |
|
|
0.8 |
|
|
471 |
|
|
0.8 |
|
| Other |
133 |
|
|
0.2 |
|
|
124 |
|
|
0.2 |
|
| Total consumer |
13,820 |
|
|
23.9 |
|
|
12,419 |
|
|
22.3 |
|
| Total loans and leases |
$ |
57,779 |
|
|
100.0 |
% |
|
$ |
55,653 |
|
|
100.0 |
% |
1 Commercial and industrial loan balances include Paycheck Protection Program (“PPP”) loans of $77 million and $197 million for the respective periods presented.
At December 31, 2023 and December 31, 2022, the ratio of loans and leases to total assets was 66% and 62%, respectively. The largest loan category was commercial and industrial loans, which constituted 29% and 30% of our total loan portfolio for the same respective periods.
During 2023, the loan and lease portfolio increased $2.1 billion, or 4%, to $57.8 billion. Consumer loans increased $1.4 billion, primarily in the 1-4 family residential and consumer construction loan portfolios, and commercial real estate loans increased $0.6 billion, primarily in the multi-family and industrial term loan portfolios. Funding of construction lending commitments and a slower pace of loan payoffs contributed to growth in both the consumer and CRE portfolios.
The following schedule presents the contractual maturity distribution of our loan and lease portfolio:
ZIONS BANCORPORATION, NATIONAL ASSOCIATION AND SUBSIDIARIES
Schedule 17
LOAN AND LEASE PORTFOLIO BY CONTRACTUAL MATURITY
|
|
|
|
|
|
|
|
|
|
|
|
|
|
|
|
|
|
|
|
|
|
|
|
|
|
|
|
|
|
|
|
|
|
|
|
|
|
|
|
|
December 31, 2023 |
|
|
| (In millions) |
One year or less |
|
One year through five years |
|
Five years through fifteen years |
|
Over fifteen years |
|
Total |
|
|
|
|
|
|
|
|
|
|
| Commercial: |
|
|
|
|
|
|
|
|
|
|
|
|
|
|
|
|
|
|
|
| Commercial and industrial |
$ |
3,332 |
|
|
$ |
11,113 |
|
|
$ |
2,188 |
|
|
$ |
51 |
|
|
$ |
16,684 |
|
|
|
|
|
|
|
|
|
|
|
| Leasing |
27 |
|
|
264 |
|
|
92 |
|
|
— |
|
|
383 |
|
|
|
|
|
|
|
|
|
|
|
| Owner-occupied |
419 |
|
|
1,795 |
|
|
5,461 |
|
|
1,544 |
|
|
9,219 |
|
|
|
|
|
|
|
|
|
|
|
| Municipal |
306 |
|
|
640 |
|
|
2,436 |
|
|
920 |
|
|
4,302 |
|
|
|
|
|
|
|
|
|
|
|
| Total commercial |
4,084 |
|
|
13,812 |
|
|
10,177 |
|
|
2,515 |
|
|
30,588 |
|
|
|
|
|
|
|
|
|
|
|
| Commercial real estate: |
|
|
|
|
|
|
|
|
|
|
|
|
|
|
|
|
|
|
|
Construction and land development |
1,089 |
|
|
1,442 |
|
|
88 |
|
|
50 |
|
|
2,669 |
|
|
|
|
|
|
|
|
|
|
|
| Term |
2,407 |
|
|
5,762 |
|
|
2,390 |
|
|
143 |
|
|
10,702 |
|
|
|
|
|
|
|
|
|
|
|
| Total commercial real estate |
3,496 |
|
|
7,204 |
|
|
2,478 |
|
|
193 |
|
|
13,371 |
|
|
|
|
|
|
|
|
|
|
|
| Consumer: |
|
|
|
|
|
|
|
|
|
|
|
|
|
|
|
|
|
|
|
| Home equity credit line |
1 |
|
|
5 |
|
|
70 |
|
|
3,280 |
|
|
3,356 |
|
|
|
|
|
|
|
|
|
|
|
| 1-4 family residential |
8 |
|
|
32 |
|
|
171 |
|
|
8,204 |
|
|
8,415 |
|
|
|
|
|
|
|
|
|
|
|
Construction and other consumer real estate |
— |
|
|
1 |
|
|
20 |
|
|
1,421 |
|
|
1,442 |
|
|
|
|
|
|
|
|
|
|
|
Bankcard and other revolving plans |
320 |
|
|
154 |
|
|
— |
|
|
— |
|
|
474 |
|
|
|
|
|
|
|
|
|
|
|
| Other |
17 |
|
|
82 |
|
|
34 |
|
|
— |
|
|
133 |
|
|
|
|
|
|
|
|
|
|
|
| Total consumer |
346 |
|
|
274 |
|
|
295 |
|
|
12,905 |
|
|
13,820 |
|
|
|
|
|
|
|
|
|
|
|
| Total loans and leases |
$ |
7,926 |
|
|
$ |
21,290 |
|
|
$ |
12,950 |
|
|
$ |
15,613 |
|
|
$ |
57,779 |
|
|
|
|
|
|
|
|
|
|
|
Our loans and leases have predetermined (fixed) or variable interest rates. The following schedule presents the interest rate composition of our loan and lease portfolio with a contractual maturity date over one year, and does not include the effect of any interest rate swaps associated with the loan portfolio. For more information on our interest rate risk management, see “Interest Rate Risk” on page 63.
ZIONS BANCORPORATION, NATIONAL ASSOCIATION AND SUBSIDIARIES
Schedule 18
LOAN AND LEASE PORTFOLIO WITH CONTRACTUAL MATURITIES OVER ONE YEAR BY INTEREST RATE TYPE
|
|
|
|
|
|
|
|
|
|
|
|
|
|
|
|
|
|
|
|
|
|
|
|
|
December 31, 2023 |
|
|
|
Loans with contractual maturities over one year |
|
|
| (In millions) |
Predetermined (fixed) interest rates |
|
Variable interest rates |
|
Total |
|
|
|
|
|
|
| Commercial: |
|
|
|
|
|
|
|
|
|
|
|
| Commercial and industrial |
$ |
2,550 |
|
|
$ |
10,802 |
|
|
$ |
13,352 |
|
|
|
|
|
|
|
| Leasing |
356 |
|
|
— |
|
|
356 |
|
|
|
|
|
|
|
| Owner-occupied |
3,178 |
|
|
5,622 |
|
|
8,800 |
|
|
|
|
|
|
|
| Municipal |
3,282 |
|
|
714 |
|
|
3,996 |
|
|
|
|
|
|
|
| Total commercial |
9,366 |
|
|
17,138 |
|
|
26,504 |
|
|
|
|
|
|
|
| Commercial real estate: |
|
|
|
|
|
|
|
|
|
|
|
Construction and land development |
50 |
|
|
1,530 |
|
|
1,580 |
|
|
|
|
|
|
|
| Term |
1,774 |
|
|
6,521 |
|
|
8,295 |
|
|
|
|
|
|
|
| Total commercial real estate |
1,824 |
|
|
8,051 |
|
|
9,875 |
|
|
|
|
|
|
|
| Consumer: |
|
|
|
|
|
|
|
|
|
|
|
| Home equity credit line |
196 |
|
|
3,159 |
|
|
3,355 |
|
|
|
|
|
|
|
| 1-4 family residential |
609 |
|
|
7,798 |
|
|
8,407 |
|
|
|
|
|
|
|
Construction and other consumer real estate |
— |
|
|
1,442 |
|
|
1,442 |
|
|
|
|
|
|
|
Bankcard and other revolving plans |
2 |
|
|
152 |
|
|
154 |
|
|
|
|
|
|
|
| Other |
115 |
|
|
1 |
|
|
116 |
|
|
|
|
|
|
|
| Total consumer |
922 |
|
|
12,552 |
|
|
13,474 |
|
|
|
|
|
|
|
| Total loans and leases |
$ |
12,112 |
|
|
$ |
37,741 |
|
|
$ |
49,853 |
|
|
|
|
|
|
|
Other Noninterest-bearing Investments
Other noninterest-bearing investments are equity investments that are held primarily for capital appreciation, dividends, or for certain regulatory requirements. The following schedule summarizes our related investments.
Schedule 19
OTHER NONINTEREST-BEARING INVESTMENTS
|
|
|
|
|
|
|
|
|
|
|
|
|
|
|
|
|
|
|
|
|
|
|
|
|
December 31, |
|
Amount change |
|
Percent change |
| (Dollar amounts in millions) |
2023 |
|
2022 |
|
|
|
|
|
|
|
|
|
|
| Bank-owned life insurance |
$ |
553 |
|
|
$ |
546 |
|
|
$ |
7 |
|
|
1 |
% |
| Federal Home Loan Bank stock |
79 |
|
|
294 |
|
|
(215) |
|
|
NM |
| Federal Reserve stock |
65 |
|
|
68 |
|
|
(3) |
|
|
(4) |
|
| Farmer Mac stock |
24 |
|
|
19 |
|
|
5 |
|
|
26 |
|
| SBIC investments |
190 |
|
|
172 |
|
|
18 |
|
|
10 |
|
| Other |
39 |
|
|
31 |
|
|
8 |
|
|
26 |
|
| Total other noninterest-bearing investments |
$ |
950 |
|
|
$ |
1,130 |
|
|
$ |
(180) |
|
|
(16) |
% |
Total other noninterest-bearing investments decreased $180 million, or 16%, during 2023, primarily due to a $215 million decrease in FHLB stock. We are required to invest approximately 4% of our FHLB borrowings in FHLB activity stock to maintain our borrowing capacity. The decrease in period-end FHLB activity stock was primarily due to a shift in wholesale funding needs as a result of the increase in interest-bearing deposits and the decrease in interest-earning assets.
ZIONS BANCORPORATION, NATIONAL ASSOCIATION AND SUBSIDIARIES
Visa Class B Shares
In 2007, we received 460,153 non-transferable Class B shares of Visa, Inc. in connection with a restructuring and public offering by Visa U.S.A. As a member of Visa U.S.A., we received the Class B shares based on our interest in Visa U.S.A. and did not pay anything to acquire the shares. On September 13, 2023, Visa, Inc. announced its intent to engage with common stockholders on a potential proposal that would result in the release of certain transfer restrictions on a portion of Visa Class B common stock. On January 23, 2024, the proposal was approved by a majority of Class A, B, and C common stockholders, which would provide us the option to convert up to 50% of our Class B shares to freely transferable Visa Class A common shares upon terms and conditions more fully described in the public filings of Visa, Inc. The closing price of a Visa Class A common share was $260.35 at December 31, 2023. In light of uncertainties associated with certain ongoing litigation matters involving Visa and the details of the aforementioned proposal, the ultimate timing and impact of us exercising this option, including any gain contingency, is unknown.
Premises, Equipment, and Software
We are in the final phase of a three-phase project to replace our core loan and deposit banking systems. This final phase includes the replacement of our deposit banking systems through multiple affiliate bank conversions, the first of which was successfully completed in the second quarter of 2023. Our experience with the initial conversion led to enhanced processes, trainings, and product offerings, which resulted in a delay of subsequent planned conversions. We expect to complete the remaining conversions in 2024.
The following schedule summarizes the capitalized costs associated with our core system replacement project, which are depreciated using a useful life of ten years:
Schedule 20
CAPITALIZED COSTS ASSOCIATED WITH THE CORE SYSTEM REPLACEMENT PROJECT
|
|
|
|
|
|
|
|
|
|
|
|
|
|
|
|
|
|
|
|
|
|
|
|
|
December 31, 2023 |
| (In millions) |
Phase 1 |
|
Phase 2 |
|
Phase 3 |
|
Total |
|
|
|
|
|
|
|
|
| Total amount of capitalized costs, less accumulated amortization |
$ |
21 |
|
|
$ |
45 |
|
|
$ |
227 |
|
|
$ |
293 |
|
Deposits
Deposits are our primary funding source. In recent years, we experienced a significant influx of deposits, which was impacted by considerable fiscal and monetary policy decisions. During 2022, with the withdrawal of stimulus by the federal government, our deposits began to decline. This trend accelerated with prominent bank closures during the first quarter of 2023 and abated during the second quarter of 2023. As shown below, total deposits increased 5% during 2023. The following schedule presents the composition of our deposit portfolio:
ZIONS BANCORPORATION, NATIONAL ASSOCIATION AND SUBSIDIARIES
Schedule 21
DEPOSIT PORTFOLIO
|
|
|
|
|
|
|
|
|
|
|
|
|
|
|
|
|
|
|
|
|
|
|
|
|
|
|
|
|
|
|
|
|
|
|
|
|
|
|
|
|
December 31, 2023 |
|
|
|
|
December 31, 2022 |
|
|
|
| (Dollar amounts in millions) |
|
Amount |
|
% of
total
deposits |
|
|
|
|
|
|
|
|
Amount |
|
% of
total
deposits |
|
|
|
|
|
| Deposits by type |
|
|
|
|
|
|
|
|
|
|
|
|
|
|
|
|
|
|
|
|
| Noninterest-bearing demand |
|
$ |
26,244 |
|
|
35.0 |
% |
|
|
|
|
|
|
|
|
$ |
35,777 |
|
|
49.9 |
% |
|
|
|
|
|
| Interest-bearing: |
|
|
|
|
|
|
|
|
|
|
|
|
|
|
|
|
|
|
|
|
| Savings and money market |
|
38,663 |
|
|
51.6 |
|
|
|
|
|
|
|
|
|
33,474 |
|
|
46.7 |
|
|
|
|
|
|
| Time |
|
5,619 |
|
|
7.5 |
|
|
|
|
|
|
|
|
|
1,484 |
|
|
2.1 |
|
|
|
|
|
|
| Brokered |
|
4,435 |
|
|
5.9 |
|
|
|
|
|
|
|
|
|
917 |
|
|
1.3 |
|
|
|
|
|
|
| Total deposits |
|
$ |
74,961 |
|
|
100.0 |
% |
|
|
|
|
|
|
|
|
$ |
71,652 |
|
|
100.0 |
% |
|
|
|
|
|
| Deposit-related metrics |
|
|
|
|
|
|
|
|
|
|
|
|
|
|
|
|
|
|
|
|
| Estimated amount of insured deposits |
|
$ |
41,777 |
|
|
56 |
% |
|
|
|
|
|
|
|
|
$ |
33,589 |
|
|
47 |
% |
|
|
|
|
|
| Estimated amount of uninsured deposits |
|
33,184 |
|
|
44 |
% |
|
|
|
|
|
|
|
|
38,063 |
|
|
53 |
% |
|
|
|
|
|
Estimated amount of collateralized deposits 1 |
|
$ |
3,979 |
|
|
5 |
% |
|
|
|
|
|
|
|
|
$ |
2,861 |
|
|
4 |
% |
|
|
|
|
|
| Loan-to-deposit ratio |
|
77% |
|
|
|
|
|
|
|
|
|
|
78% |
|
|
|
|
|
|
|
1 Includes both insured and uninsured deposits.
Total deposits increased $3.3 billion, or 5%, in 2023. Interest-bearing deposits increased $12.8 billion, or 36%, and were partially offset by a decrease of $9.5 billion, or 27%, in noninterest-bearing demand deposits, as customers migrated to interest-bearing products in response to the higher interest rate environment. Our noninterest-bearing deposits are generally more valuable in a rising interest rate environment, creating meaningful economic value that is not fully reflected on our balance sheet since core deposits and related intangible assets are not recorded at fair value for accounting purposes.
At December 31, 2023, customer deposits (excluding brokered deposits) totaled $70.5 billion and included approximately $6.8 billion of reciprocal deposit products, where we distributed our customers’ deposits in a placement network to increase their FDIC insurance, and in return, we received a matching amount of deposits from other network banks.
At December 31, 2023, the total estimated amount of uninsured deposits was $33.2 billion, or 44%, of total deposits, compared with $38.1 billion, or 53%, of total deposits at December 31, 2022, respectively. Our loan-to-deposit ratio was 77%, compared with 78% for the same respective time periods.
See “Liquidity Risk Management” on page 67 for additional information on liquidity, including the ratio of available liquidity to uninsured deposits.
RISK MANAGEMENT
We engage in risk management practices to ensure prudent risk-taking and appropriate oversight. Risk management is an integral part of our operations and an essential determinant of our overall performance as one of our key strategic objectives.
We utilize the three lines of defense approach to risk management with responsibilities for each line of defense defined in our Risk Management Framework. The first line of defense represents units and functions throughout the Bank engaged in activities related to revenue generation, expense reduction, operational support, and technology services. These units and functions are accountable for owning and managing the risks associated with these activities. The second line of defense represents functions responsible for independently assessing and overseeing risk management activities. The third line of defense is our internal audit function that provides independent assessment of the effectiveness of the first and second lines of defense.
ZIONS BANCORPORATION, NATIONAL ASSOCIATION AND SUBSIDIARIES
In support of management’s efforts, the Board has established certain committees to oversee our risk management processes. The Audit Committee oversees financial reporting risk, and the ROC oversees the other risk management processes. The ROC meets on a regular basis to monitor and review ERM activities. As required by its charter, the ROC provides oversight for various ERM activities and approves ERM policies and activities as detailed in the ROC charter.
We employ various strategies to reduce the risks to which our operations are exposed, including credit risk, market and interest rate risk, liquidity risk, strategic and business risk, operational risk, technology risk, cybersecurity risk, capital/financial reporting risk, legal/compliance risk (including regulatory risk), and reputational risk. These risks are overseen by various management committees of which the Enterprise Risk Management Committee is the focal point.
Credit Risk Management
Credit risk is the possibility of loss from the failure of a borrower, guarantor, or another obligor to fully perform under the terms of a credit-related contract. Credit risk arises primarily from our lending activities, as well as from off-balance sheet credit instruments. The Board, through the ROC, is responsible for approving key credit policies. The ROC also oversees and monitors adherence to these policies and the credit risk appetite as defined in the Risk Management Framework. The Board has delegated responsibility for managing credit risk and approving changes to credit policies to the Chief Credit Officer, who chairs the Credit Risk Committee.
Credit policies, credit risk management, and credit examination functions inform and support the oversight of credit risk. Our credit policies emphasize strong underwriting standards and early detection of potential problem credits in order to develop and implement action plans on a timely basis to mitigate potential losses. These formal credit policies and procedures provide us with a framework for consistent underwriting and a basis for sound credit decisions at the local banking affiliate level. Policies include standards for sensitivity and scenario analyses that assess the resilience of the borrower, including the borrower’s ability to service the loan in a rising interest rate environment.
Our credit policies and practices are also designed to help manage potential risks, including those arising from environmental issues. Environmental risk related to our lending practices is primarily covered in our environmental credit policy and by our environmental subject matter experts and management. The extent of environmental due diligence performed by our environmental risk team is based on the risks identified at each property and the loan amount. The extension of credit to certain borrowers, or those connected with certain activities, may be restricted or require escalated approval, by policy, because of various environmental risks.
Our credit risk management function is separate from the lending function and strengthens control over, and the independent evaluation of, credit activities. In addition, we have a well-defined set of standards for evaluating our loan portfolio, and we utilize a comprehensive loan risk-grading system to determine the risk potential in the portfolio.
The internal credit examination department, which is independent of the lending function, periodically conducts examinations of our lending departments and credit activities. These examinations are designed to review credit quality, adequacy of documentation, appropriate loan risk-grading administration, and compliance with credit policies. Credit examinations related to the ACL are reported to both the Audit Committee and the ROC.
Our business activity is conducted primarily within the geographic footprint of our banking affiliates. We strive to avoid the risk of undue concentrations of credit in any particular industry, collateral type, location, or with any individual customer or counterparty. We have adopted and adhere to concentration limits on certain commercial industries, including leveraged lending, municipal lending, oil and gas-related lending, and various types of CRE lending, particularly construction and land development and office lending. Concentration limits are regularly monitored and revised as necessary.
ZIONS BANCORPORATION, NATIONAL ASSOCIATION AND SUBSIDIARIES
U.S. Government Agency Guaranteed Loans
We participate in various guaranteed lending programs sponsored by U.S. government agencies, such as the U.S. Small Business Administration (“SBA”), Federal Housing Authority, U.S. Department of Veterans Affairs, Export-Import Bank of the U.S., and the U.S. Department of Agriculture. At December 31, 2023, $554 million of related loans were guaranteed, primarily by the SBA, and included $77 million of Paycheck Protection Program (“PPP”) loans. The following schedule presents the composition of U.S. government agency guaranteed loans:
Schedule 22
U.S. GOVERNMENT AGENCY GUARANTEED LOANS
|
|
|
|
|
|
|
|
|
|
|
|
|
|
|
|
|
|
|
|
|
|
|
|
| (Dollar amounts in millions) |
December 31,
2023 |
|
Percent
guaranteed |
|
December 31,
2022 |
|
Percent
guaranteed |
|
|
|
|
|
|
|
|
| Commercial |
$ |
664 |
|
|
80 |
% |
|
$ |
753 |
|
|
83 |
% |
| Commercial real estate |
24 |
|
|
79 |
|
|
21 |
|
|
76 |
|
| Consumer |
4 |
|
|
100 |
|
|
5 |
|
|
100 |
|
| Total loans |
$ |
692 |
|
|
80 |
% |
|
$ |
779 |
|
|
83 |
% |
Commercial Lending
The following schedule provides information regarding lending exposures to certain industries in our commercial lending portfolio:
Schedule 23
COMMERCIAL LENDING BY INDUSTRY GROUP 1
|
|
|
|
|
|
|
|
|
|
|
|
|
|
|
|
|
|
|
|
|
|
|
|
|
December 31, 2023 |
|
December 31, 2022 |
| (Dollar amounts in millions) |
Amount |
|
Percent |
|
Amount |
|
Percent |
|
|
|
|
|
|
|
|
| Retail trade |
$ |
2,995 |
|
|
9.8 |
% |
|
$ |
2,751 |
|
|
9.0 |
% |
| Real estate, rental and leasing |
2,946 |
|
|
9.6 |
|
|
2,802 |
|
|
9.2 |
|
| Finance and insurance |
2,918 |
|
|
9.5 |
|
|
2,992 |
|
|
9.8 |
|
| Healthcare and social assistance |
2,527 |
|
|
8.3 |
|
|
2,373 |
|
|
7.8 |
|
| Public Administration |
2,279 |
|
|
7.5 |
|
|
2,366 |
|
|
7.8 |
|
| Manufacturing |
2,190 |
|
|
7.2 |
|
|
2,387 |
|
|
7.8 |
|
| Wholesale trade |
1,850 |
|
|
6.0 |
|
|
1,880 |
|
|
6.2 |
|
| Transportation and warehousing |
1,499 |
|
|
4.9 |
|
|
1,464 |
|
|
4.8 |
|
Utilities 2 |
1,409 |
|
|
4.6 |
|
|
1,418 |
|
|
4.6 |
|
| Construction |
1,355 |
|
|
4.4 |
|
|
1,355 |
|
|
4.4 |
|
| Educational services |
1,298 |
|
|
4.2 |
|
|
1,302 |
|
|
4.3 |
|
| Hospitality and food services |
1,180 |
|
|
3.9 |
|
|
1,238 |
|
|
4.1 |
|
| Mining, quarrying, and oil and gas extraction |
1,133 |
|
|
3.7 |
|
|
1,349 |
|
|
4.4 |
|
| Other Services (except Public Administration) |
1,047 |
|
|
3.4 |
|
|
1,041 |
|
|
3.4 |
|
| Professional, scientific, and technical services |
1,010 |
|
|
3.3 |
|
|
995 |
|
|
3.3 |
|
Other 3 |
2,952 |
|
|
9.7 |
|
|
2,782 |
|
|
9.1 |
|
| Total |
$ |
30,588 |
|
|
100.0 |
% |
|
$ |
30,495 |
|
|
100.0 |
% |
1 Industry groups are determined by North American Industry Classification System (“NAICS”) codes.
2 Includes primarily utilities, power, and renewable energy.
3 At December 31, 2023, no other industry group individually exceeded 3.3%.
Commercial Real Estate Loans
At December 31, 2023 and 2022, our CRE loan portfolio totaled $13.4 billion and $12.7 billion, respectively, representing 23% of the total loan portfolio for both periods. The majority of our CRE loans are secured by real estate primarily located within our geographic footprint.
ZIONS BANCORPORATION, NATIONAL ASSOCIATION AND SUBSIDIARIES
The following schedule presents the geographic distribution of our CRE loan portfolio based on the location of the primary collateral:
Schedule 24
COMMERCIAL REAL ESTATE LENDING BY COLLATERAL LOCATION
|
|
|
|
|
|
|
|
|
|
|
|
|
|
|
|
|
|
|
|
|
|
|
|
|
December 31, 2023 |
|
December 31, 2022 |
| (Dollar amounts in millions) |
Amount |
|
Percent |
|
Amount |
|
Percent |
|
|
|
|
|
|
|
|
| Arizona |
$ |
1,726 |
|
|
12.9 |
% |
|
$ |
1,521 |
|
|
11.9 |
% |
| California |
3,865 |
|
|
28.9 |
|
|
3,805 |
|
|
29.9 |
|
| Colorado |
709 |
|
|
5.3 |
|
|
637 |
|
|
5.0 |
|
| Nevada |
1,072 |
|
|
8.0 |
|
|
910 |
|
|
7.1 |
|
| Texas |
2,385 |
|
|
17.8 |
|
|
2,139 |
|
|
16.8 |
|
| Utah/Idaho |
2,214 |
|
|
16.6 |
|
|
2,397 |
|
|
18.8 |
|
| Washington/Oregon |
1,004 |
|
|
7.5 |
|
|
899 |
|
|
7.1 |
|
| Other |
396 |
|
|
3.0 |
|
|
431 |
|
|
3.4 |
|
| Total CRE |
$ |
13,371 |
|
|
100.0 |
% |
|
$ |
12,739 |
|
|
100.0 |
% |
Term CRE loans generally mature within a three- to seven-year period and consist of full, partial, and non-recourse guarantee structures. Typical term CRE loan structures include annually tested operating covenants that require loan rebalancing based on minimum debt service coverage, debt yield, or loan-to-value tests. Construction and land development loans generally mature in 18 to 36 months and contain full or partial recourse guarantee structures with one- to five-year extension options or roll-to-perm options that often result in term loans. At December 31, 2023, approximately 83% of our CRE loan portfolio was variable-rate, and approximately 22% of these variable-rate loans were swapped to a fixed rate.
The following schedule provides information regarding lending exposures to certain collateral types in our commercial real estate lending portfolio:
Schedule 25
COMMERCIAL REAL ESTATE LENDING BY COLLATERAL TYPE
|
|
|
|
|
|
|
|
|
|
|
|
|
|
|
|
|
|
|
|
|
|
|
|
|
December 31, 2023 |
|
December 31, 2022 |
| (Dollar amounts in millions) |
Amount |
|
Percent |
|
Amount |
|
Percent |
| Commercial property |
|
|
|
|
|
|
|
| Multi-family |
$ |
3,709 |
|
|
27.7 |
% |
|
$ |
3,068 |
|
|
24.1 |
% |
| Industrial |
3,062 |
|
|
22.9 |
|
|
2,509 |
|
|
19.7 |
|
| Office |
1,984 |
|
|
14.8 |
|
|
2,281 |
|
|
17.9 |
|
| Retail |
1,503 |
|
|
11.2 |
|
|
1,529 |
|
|
12.0 |
|
| Hospitality |
688 |
|
|
5.2 |
|
|
695 |
|
|
5.4 |
|
| Land |
211 |
|
|
1.6 |
|
|
276 |
|
|
2.2 |
|
Other 1 |
1,682 |
|
|
12.6 |
|
|
1,728 |
|
|
13.5 |
|
Residential property 2 |
|
|
|
|
|
|
|
| Single family |
287 |
|
|
2.1 |
|
|
340 |
|
|
2.7 |
|
| Land |
90 |
|
|
0.7 |
|
|
75 |
|
|
0.6 |
|
| Condo/Townhome |
37 |
|
|
0.3 |
|
|
13 |
|
|
0.1 |
|
Other 1 |
118 |
|
|
0.9 |
|
|
225 |
|
|
1.8 |
|
| Total |
$ |
13,371 |
|
|
100.0 |
% |
|
$ |
12,739 |
|
|
100.0 |
% |
1 Included in the total amount of the “Other” category was approximately $202 million and $301 million of unsecured loans at December 31, 2023 and 2022, respectively.
2 Residential property collateral type consists primarily of loans provided to commercial homebuilders for single-family housing developments, land and lots, and condo/townhome developments.
ZIONS BANCORPORATION, NATIONAL ASSOCIATION AND SUBSIDIARIES
Underwriting on commercial properties is primarily based on the economic viability of the project with significant consideration given to the creditworthiness and experience of the sponsor. We generally require that the owner’s equity be injected prior to any advances. Re-margining requirements (required equity infusions upon a decline in value or cash flow of the collateral) are often included in the loan agreement along with guarantees of the sponsor.
Within the residential construction and development sector, many of the requirements previously mentioned, such as creditworthiness and experience of the developer, up-front injection of the developer’s equity, principal curtailment requirements, and the viability of the project are also important in underwriting a residential development loan. Consideration is given to the expected market acceptance of the product, location, strength of the developer, and the ability of the developer to stay within budget. Progress inspections by qualified independent inspectors are routinely performed before disbursing loan funds. Advance rates will vary based on the collateral, viability of the project, and the creditworthiness of the sponsor, with exceptions granted on a case-by-case basis.
Real estate appraisals are performed in accordance with regulatory guidelines and are validated independently of the loan officer and the borrower, generally by our internal appraisal review team. In some cases, reports from automated valuation services are used or internal evaluations are performed. A new appraisal or evaluation is required when a loan deteriorates to a certain level of credit weakness.
Loan agreements require regular reporting of financial information on the project and the sponsor in addition to lease schedules, rent rolls and, on construction projects, independent progress inspection reports. We monitor this financial information to ensure adherence to covenants set forth in the loan agreement.
The existence of a guarantee that improves the likelihood of repayment is taken into consideration when evaluating CRE loans for expected losses. If guarantor support is quantifiable and documented, it is considered in the potential cash flows and liquidity available for debt repayment. Our expected loss methodology also considers these sources of repayment. In general, we obtain and evaluate updated financial information for the guarantor as part of our determination to extend credit. The quality and frequency of financial reporting collected and analyzed varies depending on the contractual requirements for reporting, the size of the transaction, and the strength of the guarantor.
In the event of default, we pursue any and all available sources of repayment, including from collateral and guarantors. A number of factors are considered when deciding whether to pursue a guarantor, including, but not limited to, the value and liquidity of other sources of repayment (collateral), the financial strength and liquidity of the guarantor, possible statutory limitations, and the overall cost of pursuing a guarantee versus the amount we are likely to recover.
Our CRE portfolio is diversified across geography and collateral type, with the largest concentration in multi-family. We provide additional analysis of our office CRE portfolio below in view of increased investor interest in that collateral type in recent periods.
Office CRE loan portfolio
At December 31, 2023 and December 31, 2022, our office CRE loan portfolio totaled $2.0 billion and $2.3 billion, representing 15% and 18% of the total CRE loan portfolio, respectively. Approximately 26% of the office CRE loan portfolio is scheduled to mature in the next 12 months. The following schedule presents the composition of our office CRE loan portfolio and other related credit quality metrics:
ZIONS BANCORPORATION, NATIONAL ASSOCIATION AND SUBSIDIARIES
Schedule 26
OFFICE CRE LOAN PORTFOLIO
|
|
|
|
|
|
|
|
|
|
|
|
| (Dollar amounts in millions) |
December 31, 2023 |
|
December 31, 2022 |
| Office CRE |
|
|
|
| Construction and land development |
$ |
191 |
|
|
$ |
208 |
|
| Term |
1,793 |
|
|
2,073 |
|
| Total office CRE |
$ |
1,984 |
|
|
$ |
2,281 |
|
| Credit quality metrics |
|
|
|
| Criticized loan ratio |
11.9 |
% |
|
7.2 |
% |
| Classified loan ratio |
8.9 |
% |
|
5.8 |
% |
| Nonaccrual loan ratio |
2.4 |
% |
|
— |
% |
| Delinquency ratio |
2.3 |
% |
|
1.5 |
% |
| Ratio of net loan and lease charge-offs |
0.2 |
% |
|
— |
% |
| Ratio of allowance for credit losses to office CRE loans, at period end |
3.80 |
% |
|
1.36 |
% |
The following schedules present our office CRE loan portfolio by collateral location for the periods presented:
Schedule 27
OFFICE CRE LOAN PORTFOLIO BY COLLATERAL LOCATION
|
|
|
|
|
|
|
|
|
|
|
|
|
|
|
|
|
|
|
|
|
|
|
|
|
|
|
|
|
|
|
|
|
|
|
|
|
|
|
|
|
|
|
|
|
|
|
|
|
|
|
|
|
|
|
|
|
| (Dollar amounts in millions) |
|
December 31, 2023 |
|
Collateral Location |
|
|
| Loan type |
|
Arizona |
|
California |
|
Colorado |
|
Nevada |
|
Texas |
|
Utah/
Idaho |
|
Wash-ington |
|
Other 1 |
|
Total |
| Office CRE |
|
|
|
|
|
|
|
|
|
|
|
|
|
|
|
|
|
|
| Construction and land development |
|
$ |
— |
|
|
$ |
64 |
|
|
$ |
— |
|
|
$ |
2 |
|
|
$ |
22 |
|
|
$ |
29 |
|
|
$ |
74 |
|
|
$ |
— |
|
|
$ |
191 |
|
| Term |
|
281 |
|
|
412 |
|
|
92 |
|
|
86 |
|
|
179 |
|
|
488 |
|
|
226 |
|
|
29 |
|
|
1,793 |
|
Total Office CRE |
|
$ |
281 |
|
|
$ |
476 |
|
|
$ |
92 |
|
|
$ |
88 |
|
|
$ |
201 |
|
|
$ |
517 |
|
|
$ |
300 |
|
|
$ |
29 |
|
|
$ |
1,984 |
|
| % of total |
|
14.2 |
% |
|
24.0 |
% |
|
4.6 |
% |
|
4.4 |
% |
|
10.1 |
% |
|
26.1 |
% |
|
15.1 |
% |
|
1.5 |
% |
|
100.0 |
% |
|
|
|
|
|
|
|
|
|
|
|
|
|
|
|
|
|
|
|
|
|
|
|
|
|
|
|
|
|
|
|
|
|
|
|
|
|
|
|
|
|
|
|
|
|
|
|
|
|
|
|
|
|
|
|
|
|
|
|
|
|
|
|
|
|
|
|
|
|
|
|
|
|
|
|
|
|
|
|
|
|
|
|
|
|
|
|
|
|
|
|
|
|
|
|
|
|
|
|
|
|
|
|
|
|
|
|
|
|
|
|
|
|
|
|
|
|
|
|
|
|
|
|
|
|
|
|
|
|
|
|
|
|
|
|
|
|
|
|
|
|
|
|
|
|
|
|
|
|
|
|
|
|
|
|
|
|
|
|
|
|
|
|
|
|
|
|
|
|
|
|
|
|
|
|
|
|
|
|
|
|
|
|
|
|
|
|
|
|
|
| (Dollar amounts in millions) |
|
December 31, 2022 |
|
Collateral Location |
|
|
| Loan type |
|
Arizona |
|
California |
|
Colorado |
|
Nevada |
|
Texas |
|
Utah/
Idaho |
|
Wash-ington |
|
Other 1 |
|
Total |
| Office CRE |
|
|
|
|
|
|
|
|
|
|
|
|
|
|
|
|
|
|
| Construction and land development |
|
$ |
8 |
|
|
$ |
79 |
|
|
$ |
— |
|
|
$ |
2 |
|
|
$ |
— |
|
|
$ |
18 |
|
|
$ |
101 |
|
|
$ |
— |
|
|
$ |
208 |
|
| Term |
|
295 |
|
|
525 |
|
|
97 |
|
|
99 |
|
|
217 |
|
|
613 |
|
|
195 |
|
|
32 |
|
|
2,073 |
|
Total Office CRE |
|
$ |
303 |
|
|
$ |
604 |
|
|
$ |
97 |
|
|
$ |
101 |
|
|
$ |
217 |
|
|
$ |
631 |
|
|
$ |
296 |
|
|
$ |
32 |
|
|
$ |
2,281 |
|
| % of total |
|
13.1 |
% |
|
27.0 |
% |
|
4.3 |
% |
|
4.3 |
% |
|
9.6 |
% |
|
26.8 |
% |
|
13.5 |
% |
|
1.4 |
% |
|
100.0 |
% |
|
|
|
|
|
|
|
|
|
|
|
|
|
|
|
|
|
|
|
|
|
|
|
|
|
|
|
|
|
|
|
|
|
|
|
|
|
|
|
|
|
|
|
|
|
|
|
|
|
|
|
|
|
|
|
|
|
|
|
|
|
|
|
|
|
|
|
|
|
|
|
|
|
|
|
|
|
|
|
|
|
|
|
|
|
|
|
|
|
|
|
|
|
|
|
|
|
|
|
|
|
|
|
|
|
|
|
|
|
|
|
|
|
|
|
|
|
|
|
|
|
|
|
|
|
|
|
|
|
|
|
|
|
1 No other geography exceeds $17 million and $18 million at December 31, 2023 and December 31, 2022, respectively.
Consumer Loans
We originate first-lien residential home mortgages considered to be of prime quality. We generally hold variable-rate loans in our portfolio and sell “conforming” fixed-rate loans to third parties, including Federal National Mortgage Association and Federal Home Loan Mortgage Corporation, for which we make representations and warranties that the loans meet certain underwriting and collateral documentation standards.
During 2023, consumer loans increased $1.4 billion, primarily in the 1-4 family residential and consumer construction loan portfolios. Increased funding of construction lending commitments contributed to growth in these portfolios, although the rate of growth slowed in the latter half of the year.
ZIONS BANCORPORATION, NATIONAL ASSOCIATION AND SUBSIDIARIES
We also originate home equity credit lines (“HECLs”). At December 31, 2023 and December 31, 2022, our HECL portfolio totaled $3.4 billion for both periods. Approximately 39% and 44% of our HECLs are secured by first liens for the same respective time periods.
At December 31, 2023, loans representing less than 1% of the outstanding balance in the HECL portfolio were estimated to have combined loan-to-value (“CLTV”) ratios above 100%. An estimated CLTV ratio is the ratio of our loan plus any prior lien amounts divided by the estimated current collateral value. At origination, underwriting standards for the HECL portfolio generally include a maximum 80% CLTV with a Fair Isaac Corporation (“FICO”) credit score greater than 700.
Approximately 90% of our HECL portfolio is still in the draw period, and about 18% of those loans are scheduled to begin amortizing within the next five years. We believe the risk of loss and borrower default in the event of a loan becoming fully amortizing and the effect of significant interest rate changes is low, given the rate shock analysis performed at origination. The ratio of HECL net charge-offs (recoveries) for the trailing twelve months to average balances at December 31, 2023 and December 31, 2022, was 0.05% and (0.03)%, respectively. See Note 6 of the Notes to Consolidated Financial Statements for additional information on the credit quality of the HECL portfolio.
Nonperforming Assets
Nonperforming assets include nonaccrual loans and other real estate owned (“OREO”) or foreclosed properties. The following schedule presents our nonperforming assets:
ZIONS BANCORPORATION, NATIONAL ASSOCIATION AND SUBSIDIARIES
Schedule 28
NONPERFORMING ASSETS
|
|
|
|
|
|
|
|
|
|
|
|
|
|
|
|
|
|
|
|
| (Dollar amounts in millions) |
December 31, |
|
|
|
|
|
|
|
|
|
2023 |
|
2022 |
|
|
|
|
|
|
|
|
| Nonaccrual loans: |
|
|
|
|
|
|
|
|
|
|
|
| Loans held for sale |
$ |
— |
|
|
$ |
— |
|
|
|
|
|
|
|
|
|
| Commercial: |
|
|
|
|
|
|
|
|
|
|
|
| Commercial and industrial |
82 |
|
|
63 |
|
|
|
|
|
|
|
|
|
| Leasing |
2 |
|
|
— |
|
|
|
|
|
|
|
|
|
| Owner-occupied |
20 |
|
|
24 |
|
|
|
|
|
|
|
|
|
| Municipal |
— |
|
|
— |
|
|
|
|
|
|
|
|
|
| Commercial real estate: |
|
|
|
|
|
|
|
|
|
|
|
| Construction and land development |
22 |
|
|
— |
|
|
|
|
|
|
|
|
|
| Term |
39 |
|
|
14 |
|
|
|
|
|
|
|
|
|
| Consumer: |
|
|
|
|
|
|
|
|
|
|
|
| Real estate |
57 |
|
|
48 |
|
|
|
|
|
|
|
|
|
| Other |
— |
|
|
— |
|
|
|
|
|
|
|
|
|
| Nonaccrual loans |
222 |
|
|
149 |
|
|
|
|
|
|
|
|
|
Other real estate owned 1: |
|
|
|
|
|
|
|
|
|
|
|
| Commercial: |
|
|
|
|
|
|
|
|
|
|
|
| Commercial properties |
4 |
|
|
— |
|
|
|
|
|
|
|
|
|
| Developed land |
— |
|
|
— |
|
|
|
|
|
|
|
|
|
| Land |
2 |
|
|
— |
|
|
|
|
|
|
|
|
|
| Residential: |
|
|
|
|
|
|
|
|
|
|
|
| 1-4 family |
— |
|
|
— |
|
|
|
|
|
|
|
|
|
|
|
|
|
|
|
|
|
|
|
|
|
|
|
|
|
|
|
|
|
|
|
|
|
| Other real estate owned |
6 |
|
|
— |
|
|
|
|
|
|
|
|
|
| Total nonperforming assets |
$ |
228 |
|
|
$ |
149 |
|
|
|
|
|
|
|
|
|
| Accruing loans past due 90 days or more: |
|
|
|
|
|
|
|
|
|
|
|
| Commercial: |
$ |
2 |
|
|
$ |
5 |
|
|
|
|
|
|
|
|
|
| Commercial real estate |
— |
|
|
— |
|
|
|
|
|
|
|
|
|
| Consumer |
1 |
|
|
1 |
|
|
|
|
|
|
|
|
|
| Total |
$ |
3 |
|
|
$ |
6 |
|
|
|
|
|
|
|
|
|
Ratio of nonaccrual loans to net loans and leases 2 |
0.38 |
% |
|
0.27 |
% |
|
|
|
|
|
|
|
|
Ratio of nonperforming assets to net loans and leases2 and other real estate owned |
0.39 |
% |
|
0.27 |
% |
|
|
|
|
|
|
|
|
Ratio of accruing loans past due 90 days or more to net loans and leases 2 |
0.01 |
% |
|
0.01 |
% |
|
|
|
|
|
|
|
|
1 Does not include banking premises held for sale.
2 Includes loans held for sale.
Nonperforming assets as a percentage of loans and leases and OREO increased to 0.39% at December 31, 2023, compared with 0.27% at December 31, 2022. Total nonaccrual loans increased $73 million, or 49%, during 2023, primarily due to one commercial and industrial loan totaling $31 million, and two suburban office commercial real estate loans totaling $46 million. See Note 6 of the Notes to Consolidated Financial Statements for more information on nonaccrual loans.
ZIONS BANCORPORATION, NATIONAL ASSOCIATION AND SUBSIDIARIES
Loan Modifications
Loans may be modified in the normal course of business for competitive reasons or to strengthen our collateral position. Loan modifications may also occur when the borrower experiences financial difficulty and needs temporary or permanent relief from the original contractual terms of the loan.
On January 1, 2023, we adopted Accounting Standards Update (“ASU”) 2022-02, Financial Instruments—Credit Losses (Topic 326): Troubled Debt Restructurings and Vintage Disclosures, which eliminated the recognition and measurement of troubled debt restructurings (“TDRs”) and their related disclosures. ASU 2022-02 requires enhanced disclosures for loan modifications to borrowers experiencing financial difficulty. During 2023, loans that have been modified to accommodate a borrower experiencing financial difficulties totaled $264 million.
If a modified loan is on nonaccrual and performs for at least six months according to the modified terms, and an analysis of the customer’s financial condition indicates that we are reasonably assured of repayment of the modified principal and interest, the loan may be returned to accrual status. The borrower’s payment performance prior to and following the modification is taken into account to determine whether a loan should be returned to accrual status.
Schedule 29
ACCRUING AND NONACCRUING MODIFIED LOANS TO BORROWERS EXPERIENCING FINANCIAL DIFFICULTY
|
|
|
|
|
|
|
|
| (In millions) |
December 31,
2023 |
|
|
|
|
|
|
| Modified loans – accruing |
$ |
247 |
|
|
|
| Modified loans – nonaccruing |
17 |
|
|
|
| Total |
$ |
264 |
|
|
|
For additional information regarding loan modifications to borrowers experiencing financial difficulty, including information related to TDRs prior to our adoption of ASU 2022-02, see Note 6 of the Notes to Consolidated Financial Statements.
Allowance for Credit Losses
The ACL includes the ALLL and the RULC. The ACL represents our estimate of current expected credit losses related to the loan and lease portfolio and unfunded lending commitments as of the balance sheet date. To determine the adequacy of the allowance, our loan and lease portfolio is segmented based on loan type.
The RULC is a reserve for potential losses associated with off-balance sheet commitments and is included in “Other liabilities” on the consolidated balance sheet. Any related increases or decreases in the reserve are included in “Provision for unfunded lending commitments” on the consolidated statement of income.
The following schedules present the changes in, and allocation of, the ACL:
ZIONS BANCORPORATION, NATIONAL ASSOCIATION AND SUBSIDIARIES
Schedule 30
CHANGES IN THE ALLOWANCE FOR CREDIT LOSSES
|
|
|
|
|
|
|
|
|
|
|
|
|
|
|
|
|
|
|
|
|
|
|
|
|
Year Ended December 31, |
|
|
|
|
|
|
| (Dollar amounts in millions) |
2023 |
|
2022 |
|
2021 |
|
|
|
|
|
|
|
|
|
|
|
|
|
|
|
|
|
|
| Loans and leases outstanding, |
$ |
57,779 |
|
$ |
55,653 |
|
$ |
50,851 |
|
|
|
|
|
|
| Average loans and leases outstanding: |
|
|
|
|
|
|
|
|
|
|
|
| Commercial |
30,519 |
|
29,225 |
|
29,580 |
|
|
|
|
|
|
| Commercial real estate |
13,023 |
|
12,251 |
|
12,136 |
|
|
|
|
|
|
| Consumer |
13,198 |
|
11,122 |
|
10,267 |
|
|
|
|
|
|
| Total average loans and leases outstanding |
$ |
56,740 |
|
$ |
52,598 |
|
$ |
51,983 |
|
|
|
|
|
|
| Allowance for loan and lease losses: |
|
|
|
|
|
|
|
|
|
|
|
Balance at beginning of year 1, 2 |
$ |
572 |
|
|
$ |
513 |
|
|
$ |
777 |
|
|
|
|
|
|
|
| Provision for loan losses |
148 |
|
|
101 |
|
|
(258) |
|
|
|
|
|
|
|
| Charge-offs: |
|
|
|
|
|
|
|
|
|
|
|
| Commercial |
45 |
|
|
72 |
|
|
35 |
|
|
|
|
|
|
|
| Commercial real estate |
3 |
|
|
— |
|
|
— |
|
|
|
|
|
|
|
| Consumer |
14 |
|
|
10 |
|
|
13 |
|
|
|
|
|
|
|
| Total |
62 |
|
|
82 |
|
|
48 |
|
|
|
|
|
|
|
| Recoveries: |
|
|
|
|
|
|
|
|
|
|
|
| Commercial |
20 |
|
|
32 |
|
|
29 |
|
|
|
|
|
|
|
| Commercial real estate |
— |
|
|
— |
|
|
3 |
|
|
|
|
|
|
|
| Consumer |
6 |
|
|
11 |
|
|
10 |
|
|
|
|
|
|
|
| Total |
26 |
|
|
43 |
|
|
42 |
|
|
|
|
|
|
|
| Net loan and lease charge-offs |
36 |
|
|
39 |
|
|
6 |
|
|
|
|
|
|
|
| Balance at end of year |
$ |
684 |
|
|
$ |
575 |
|
|
$ |
513 |
|
|
|
|
|
|
|
| Reserve for unfunded lending commitments: |
|
|
|
|
|
|
|
|
|
|
|
Balance at beginning of year 1, 2 |
$ |
61 |
|
|
$ |
40 |
|
|
$ |
58 |
|
|
|
|
|
|
|
| Provision for unfunded lending commitments |
(16) |
|
|
21 |
|
|
(18) |
|
|
|
|
|
|
|
| Balance at end of year |
$ |
45 |
|
|
$ |
61 |
|
|
$ |
40 |
|
|
|
|
|
|
|
| Total allowance for credit losses: |
|
|
|
|
|
|
|
|
|
|
|
| Allowance for loan and lease losses |
$ |
684 |
|
|
$ |
575 |
|
|
$ |
513 |
|
|
|
|
|
|
|
| Reserve for unfunded lending commitments |
45 |
|
|
61 |
|
|
40 |
|
|
|
|
|
|
|
| Total allowance for credit losses |
$ |
729 |
|
|
$ |
636 |
|
|
$ |
553 |
|
|
|
|
|
|
|
|
|
|
|
|
|
|
|
|
|
|
|
| Ratio of allowance for credit losses to net loans and leases |
1.26 |
% |
|
1.14 |
% |
|
1.09 |
% |
|
|
|
|
|
|
| Ratio of allowance for credit losses to nonaccrual loans |
328 |
% |
|
427 |
% |
|
204 |
% |
|
|
|
|
|
|
| Ratio of allowance for credit losses to nonaccrual loans and accruing loans past due 90 days or more |
324 |
% |
|
410 |
% |
|
198 |
% |
|
|
|
|
|
|
| Ratio of total net charge-offs to average total loans and leases |
0.06 |
% |
|
0.07 |
% |
|
0.01 |
% |
|
|
|
|
|
|
| Ratio of commercial net charge-offs to average commercial loans |
0.08 |
% |
|
0.14 |
% |
|
0.02 |
% |
|
|
|
|
|
|
| Ratio of commercial real estate net charge-offs to average commercial real estate loans |
0.02 |
% |
|
— |
% |
|
(0.02) |
% |
|
|
|
|
|
|
| Ratio of consumer net charge-offs to average consumer loans |
0.06 |
% |
|
(0.01) |
% |
|
0.03 |
% |
|
|
|
|
|
|
1 Beginning balances at January 1, 2020 for the allowance for loan and lease losses and reserve for unfunded lending commitments do not agree to their respective ending balances at December 31, 2019 because of the adoption of the CECL accounting standard.
2 The beginning balance at January 1, 2023 for the allowance for loan and lease losses and reserve for unfunded lending commitments do not agree to the ending balance at December 31, 2022 because of the adoption of the new accounting standard related to loan modifications to borrowers experiencing financial difficulties.
ZIONS BANCORPORATION, NATIONAL ASSOCIATION AND SUBSIDIARIES
Schedule 31
ALLOCATION OF THE ALLOWANCE FOR CREDIT LOSSES
|
|
|
|
|
|
|
|
|
|
|
|
|
|
|
|
|
|
|
|
|
|
|
|
|
|
|
|
|
|
|
|
|
|
|
|
|
|
|
|
|
|
|
|
|
|
|
|
|
|
|
December 31, |
|
|
|
|
|
|
|
|
|
|
|
|
|
|
|
2023 |
|
2022 |
|
2021 |
|
|
|
|
|
|
| (Dollar amounts in millions) |
% of total loans |
|
Allocation of ACL |
|
% of total loans |
|
Allocation of ACL |
|
% of total loans |
|
Allocation of ACL |
|
|
|
|
|
|
|
|
|
|
|
|
| Loan segment |
|
|
|
|
|
|
|
|
|
|
|
|
|
|
|
|
|
|
|
|
|
|
|
|
|
| Commercial |
53.0 |
% |
|
$ |
321 |
|
|
54.8 |
% |
|
$ |
316 |
|
|
55.9 |
% |
|
$ |
330 |
|
|
|
|
|
|
|
|
|
|
|
|
|
|
|
Commercial real estate |
23.1 |
|
|
258 |
|
|
22.9 |
|
|
189 |
|
|
24.0 |
|
|
118 |
|
|
|
|
|
|
|
|
|
|
|
|
|
|
|
| Consumer |
23.9 |
|
|
150 |
|
|
22.3 |
|
|
131 |
|
|
20.1 |
|
|
105 |
|
|
|
|
|
|
|
|
|
|
|
|
|
|
|
| Total |
100.0 |
% |
|
$ |
729 |
|
|
100.0 |
% |
|
$ |
636 |
|
|
100.0 |
% |
|
$ |
553 |
|
|
|
|
|
|
|
|
|
|
|
|
|
|
|
The total ACL increased to $729 million in 2023, from $636 million in 2022. The increase in the ACL reflects incremental reserves associated with portfolio-specific risks including commercial real estate, as well as deterioration in economic forecasts. Due to the adoption of the current expected credit loss (“CECL”) standard in 2020, the ACL is not comparable to periods presented prior to that period.
See Note 6 of the Notes to Consolidated Financial Statements for additional information related to the ACL and credit trends experienced in each portfolio segment.
Interest Rate and Market Risk Management
Interest rate risk is the potential for reduced net interest income and other rate-sensitive income resulting from adverse changes in the level of interest rates. Market risk is the potential for loss arising from adverse changes in the fair value of fixed-income securities, equity securities, other earning assets, and derivative financial instruments as a result of changes in interest rates or other factors. Because we engage in transactions involving various financial products, we are exposed to both interest rate risk and market risk.
Our Board approves the key policies relating to the management of our financial risk, including interest rate and market risk management. The Board has delegated the responsibility of managing our interest rate and market risk to the Asset/Liability Committee (“ALCO”), which consists of members of management. ALCO establishes and periodically revises policy limits and reviews with the ROC the limits and limit exceptions reported by management.
Interest Rate Risk
We strive to position the Bank for interest rate changes and manage the balance sheet sensitivity to reduce the volatility of both net interest income and economic value of equity (“EVE”). With a higher interest rate environment and the prominent bank closures during the first half of 2023, customer deposit behavior deviated from the trend of relatively low interest rates over the prior 15 years. As a result, customers have been more inclined to (1) move deposits to nonbanking products, such as money market mutual funds, that offer higher interest rates, (2) reduce their balances in noninterest-bearing accounts, or (3) move deposits to other banks deemed “too big to fail,” or those banks having a perceived lower risk of failure. These recently observed changes in deposit behavior caused us to redevelop our deposit models used in managing interest rate risk, giving more weight to recently observed behavior. These model redevelopments increased the deposit beta for interest-bearing products and increased the percentage of noninterest-bearing deposits that migrate to interest-bearing products. Changes to models are independently reviewed by our Model Risk Management function. Management believes these redeveloped deposit models are more likely to reflect future behavior of deposits, and therefore we manage our interest rate risk exposure on that basis.
ZIONS BANCORPORATION, NATIONAL ASSOCIATION AND SUBSIDIARIES
We generally have granular deposit funding, and much of this funding has an indeterminable life with no maturity, and can be withdrawn at any time. Because most deposits come from household and business accounts, their duration is generally longer than the duration of our loan portfolio. As such, we are naturally “asset-sensitive” — meaning that our assets are expected to reprice faster or more significantly than our liabilities. We regularly use interest rate swaps, investment in fixed-rate securities, and funding strategies to manage our interest rate risk. These strategies collectively have muted the expected sensitivity of net interest income to changes in interest rates. Asset sensitivity measures depend upon the assumptions we use for deposit runoff and repricing behavior. As interest rates rise, we expect some customers to move balances from demand deposits to interest-bearing accounts such as money market, savings, or certificates of deposit. Our models are particularly sensitive to the assumption about the rate of such migration.
We also assume a correlation, referred to as a “deposit beta,” with respect to interest-bearing deposits, wherein the rates paid to customers change at a different pace when compared with changes in average benchmark interest rates. Generally, certificates of deposit are assumed to have a high correlation, while interest-bearing checking accounts are assumed to have a lower correlation. The following schedule presents deposit duration assumptions discussed previously:
Schedule 32
DEPOSIT ASSUMPTIONS
|
|
|
|
|
|
|
|
|
|
|
|
|
|
|
|
|
|
|
|
|
|
|
|
|
|
|
|
|
|
|
|
|
|
|
|
|
December 31, 2023 |
|
December 31, 2022 |
|
|
|
|
|
|
|
| Product |
|
|
|
|
|
Effective duration (unchanged) |
|
Effective duration
(+200 bps) |
|
Effective duration (unchanged) |
|
Effective duration
(+200 bps) |
|
|
|
|
|
|
|
|
|
|
|
|
|
| Demand deposits |
|
|
|
|
|
3.5% |
|
3.2% |
|
3.6% |
|
3.5% |
| Money market |
|
|
|
|
|
1.5% |
|
1.4% |
|
2.3% |
|
2.0% |
| Savings and interest-bearing checking |
|
|
|
|
|
2.2% |
|
1.9% |
|
3.1% |
|
2.8% |
The effective duration of the deposits has shortened considerably due to faster deposit repricing.
As noted previously, we utilize derivatives to manage interest rate risk. The following schedule presents derivatives that are designated in qualifying hedging relationships at December 31, 2023. Included are the average outstanding derivative notional amounts for each period presented and the weighted average fixed-rate paid or received for each category of cash flow and fair value hedge. Fair value hedges of assets include $2.5 billion in notional of hedges of AFS securities designated under the portfolio layer method that were added during the second quarter of 2023. See Note 7 of the Notes to Consolidated Financial Statements for additional information regarding the impact of these hedging relationships on interest income and expense.
ZIONS BANCORPORATION, NATIONAL ASSOCIATION AND SUBSIDIARIES
Schedule 33
DERIVATIVES DESIGNATED IN QUALIFYING HEDGING RELATIONSHIPS
|
|
|
|
|
|
|
|
|
|
|
|
|
|
|
|
|
|
|
|
|
|
|
|
|
|
|
|
|
|
|
|
|
|
|
|
|
|
|
|
|
|
|
|
|
|
|
|
|
|
|
|
|
|
|
|
|
|
|
|
|
|
|
|
|
|
|
|
|
2024 |
|
2025 |
|
2026 |
|
2027 |
|
|
|
|
|
|
|
|
| (Dollar amounts in millions) |
First Quarter |
|
Second Quarter |
|
Third Quarter |
|
Fourth Quarter |
|
First Quarter |
|
Second Quarter |
|
Third Quarter |
|
Fourth Quarter |
|
|
|
|
|
|
|
|
|
|
| Cash flow hedges |
|
|
|
|
|
|
|
|
|
|
|
|
|
|
|
|
|
|
|
|
|
|
|
|
|
|
|
Cash flow hedges of assets 1 |
|
|
|
|
|
|
|
|
|
|
|
|
|
|
|
|
|
|
|
|
|
|
|
|
|
|
|
| Average outstanding notional |
$ |
1,017 |
|
$ |
683 |
|
$ |
350 |
|
$ |
350 |
|
$ |
350 |
|
$ |
350 |
|
$ |
350 |
|
$ |
300 |
|
$ |
108 |
|
$ |
100 |
|
|
|
|
|
|
|
|
| Weighted-average fixed-rate received |
2.50 |
% |
|
2.55 |
% |
|
2.34 |
% |
|
2.34 |
% |
|
2.34 |
% |
|
2.34 |
% |
|
2.34 |
% |
|
2.13 |
% |
|
1.65 |
% |
|
1.65 |
% |
|
|
|
|
|
|
|
|
Cash flow hedges of liabilities 2 |
|
|
|
|
|
|
|
|
|
|
|
|
|
|
|
|
|
|
|
|
|
|
|
|
|
|
|
| Average outstanding notional |
$ |
500 |
|
$ |
500 |
|
$ |
500 |
|
$ |
500 |
|
$ |
500 |
|
$ |
500 |
|
$ |
— |
|
$ |
— |
|
$ |
— |
|
$ |
— |
|
|
|
|
|
|
|
|
| Weighted-average fixed-rate paid |
3.67 |
% |
|
3.67 |
% |
|
3.67 |
% |
|
3.67 |
% |
|
3.67 |
% |
|
3.67 |
% |
|
— |
% |
|
— |
% |
|
— |
% |
|
— |
% |
|
|
|
|
|
|
|
|
|
2024 |
|
2025 |
|
2026 |
|
2027 |
|
2028 |
|
2029 |
|
2030 |
|
2031 |
|
2032 |
|
2033 |
|
|
|
|
|
|
|
|
| Fair value hedges |
|
|
|
|
|
|
|
|
|
|
|
|
|
|
|
|
|
|
|
|
|
|
|
|
|
|
|
|
|
|
|
|
|
|
|
|
|
|
|
|
|
|
|
|
|
|
|
|
|
|
|
|
|
|
|
|
|
|
|
|
|
|
|
|
|
|
|
|
|
|
|
|
|
|
|
|
|
|
|
|
|
|
|
|
|
|
|
|
|
|
|
|
|
|
|
|
|
|
|
|
|
|
|
|
|
|
|
|
|
|
|
Fair value hedges of assets 3 |
|
|
|
|
|
|
|
|
|
|
|
|
|
|
|
|
|
|
|
|
|
|
|
|
|
|
|
| Average outstanding notional |
$ |
4,444 |
|
$ |
4,558 |
|
$ |
4,562 |
|
$ |
4,558 |
|
$ |
2,428 |
|
$ |
1,049 |
|
$ |
1,044 |
|
$ |
1,037 |
|
$ |
1,001 |
|
$ |
973 |
|
|
|
|
|
|
|
|
| Weighted-average fixed-rate paid |
3.24 |
% |
|
3.21 |
% |
|
3.21 |
% |
|
3.21 |
% |
|
2.47 |
% |
|
1.84 |
% |
|
1.83 |
% |
|
1.83 |
% |
|
1.83 |
% |
|
1.82 |
% |
|
|
|
|
|
|
|
|
|
|
|
|
|
|
|
|
|
|
|
|
|
|
|
|
|
|
|
|
|
|
|
|
|
|
|
|
|
|
|
|
|
|
|
|
|
|
|
|
|
|
|
|
|
|
|
|
|
|
|
|
|
|
|
|
|
|
|
|
|
|
|
|
|
|
|
|
|
|
|
|
|
|
|
|
|
|
|
|
|
|
|
|
|
|
|
|
|
|
|
|
|
|
|
|
|
|
|
|
|
|
|
|
|
|
|
|
|
|
|
|
1 Cash flow hedges of assets consist of receive-fixed swaps hedging pools of floating-rate loans. The longest dated cash flow hedge matures in February 2027. Amounts for 2027 have not been prorated to reflect this hedge maturing during the period.
2 Cash flow hedges of liabilities consists of a pay-fixed swaps hedging rolling FHLB advances. This swap matures in May of 2025.
3 Fair value asset hedges consist of pay-fixed swaps hedging fixed-rate AFS securities and fixed-rate commercial loans, as further discussed in Note 7 of the Notes to Consolidated Financial Statements. Increasing notional amounts are due to forward starting swaps.
At December 31, 2023, we had receive-fixed interest rate swaps with an aggregate notional amount of $1.5 billion designated as cash flow hedges of the variability of interest receipts on floating-rate commercial loans. During 2023, we terminated receive-fixed swaps with an aggregate notional amount of $5.0 billion. At December 31, 2023, we had $201 million of net losses deferred in AOCI related to terminated cash flow hedges. Amounts deferred in AOCI from terminated cash flow hedges will be amortized into interest income on a straight-line basis through the original maturity dates of the hedges as long as the hedged forecasted transactions continue to be expected to occur.
The following schedule summarizes amounts deferred in AOCI related to terminated cash flow hedges that will be fully reclassified into interest income by the fourth quarter of 2027:
Schedule 34
SCHEDULED OCI AMORTIZATION FOR TERMINATED CASH FLOW HEDGES
|
|
|
|
|
|
|
|
|
|
|
|
|
|
|
|
|
|
|
|
|
|
|
|
|
|
|
|
|
|
|
|
|
|
|
|
|
|
|
|
|
|
|
|
|
|
|
|
|
|
|
|
|
|
|
|
|
|
|
|
|
2024 |
|
2025 |
|
2026 |
|
2027 |
| (Dollar amounts in millions) |
First Quarter |
|
Second Quarter |
|
Third Quarter |
|
Fourth Quarter |
|
First Quarter |
|
Second Quarter |
|
Third Quarter |
|
Fourth Quarter |
|
|
| Cash flow hedges |
|
|
|
|
|
|
|
|
|
|
|
|
|
|
|
|
|
|
|
| Cash flow hedges of assets |
|
|
|
|
|
|
|
|
|
|
|
|
|
|
|
|
|
|
|
| Periodic amortization of deferred gains (losses) |
$ |
(28) |
|
$ |
(28) |
|
$ |
(28) |
|
$ |
(23) |
|
$ |
(18) |
|
$ |
(16) |
|
$ |
(13) |
|
$ |
(11) |
|
$ |
(29) |
|
$ |
(8) |
|
|
|
|
|
|
|
|
|
|
|
|
|
|
|
|
|
|
|
|
Earnings at Risk (EaR) and Economic Value of Equity (EVE)
Incorporating our deposit assumptions and the impact of derivatives in qualifying hedging relationships previously discussed, the following schedule presents earnings at risk (“EaR”), or the percentage change in 12-month forward-looking net interest income, and our estimated percentage change in EVE. Both EaR and EVE are based on a static balance sheet size under parallel interest rate changes ranging from -100 bps to +300 bps. These measures highlight the sensitivity to changes in interest rates across various scenarios; the outcomes are not intended to be forecasts of expected net interest income.
ZIONS BANCORPORATION, NATIONAL ASSOCIATION AND SUBSIDIARIES
Schedule 35
INCOME SIMULATION – CHANGE IN NET INTEREST INCOME AND CHANGE IN ECONOMIC VALUE OF EQUITY
|
|
|
|
|
|
|
|
|
|
|
|
|
|
|
|
|
|
|
|
|
|
|
|
|
|
|
|
|
|
|
|
|
|
|
|
|
|
|
|
|
|
|
|
|
|
|
|
|
|
|
|
|
|
|
|
|
|
|
|
|
|
|
|
|
December 31, 2023 |
|
December 31, 2022 |
|
|
Parallel shift in rates (in bps) |
|
Parallel shift in rates (in bps) |
| Repricing scenario |
|
-100 |
|
0 |
|
+100 |
|
+200 |
|
+300 |
|
-100 |
|
0 |
|
+100 |
|
+200 |
|
+300 |
|
|
|
|
|
|
|
|
|
|
|
|
|
|
|
|
|
|
|
|
Earnings at Risk
(EaR)
|
|
(2.5) |
% |
|
— |
% |
|
2.4 |
% |
|
4.9 |
% |
|
7.4 |
% |
|
(2.4) |
% |
|
— |
% |
|
2.4 |
% |
|
4.8 |
% |
|
7.1 |
% |
|
Economic Value of Equity
(EVE)
|
|
2.8 |
% |
|
— |
% |
|
(1.4) |
% |
|
(3.3) |
% |
|
(5.2) |
% |
|
2.0 |
% |
|
— |
% |
|
(1.1) |
% |
|
(2.3) |
% |
|
(3.7) |
% |
|
|
|
|
|
|
|
|
|
|
|
|
|
|
|
|
|
|
|
|
|
|
|
|
|
|
|
|
|
|
|
|
|
|
|
|
|
|
|
|
|
|
|
|
|
|
|
|
|
|
|
|
|
|
|
|
|
|
|
|
|
|
|
|
|
|
|
|
|
|
|
|
|
|
|
|
|
|
|
|
|
|
The asset sensitivity, as measured by EaR, increased slightly during 2023, primarily due to an increase in pay-fixed interest rate swap notional, partially offset by deposit migration from low beta products (e.g., checking accounts) to high beta products (e.g., money market accounts). Under our current deposit assumptions, interest rate risk remains within policy limits. For interest-bearing deposits with indeterminable maturities, the weighted average modeled beta is 53%.
Prepayment assumptions are an important factor in how we manage interest rate risk. Certain assets in our portfolio, such as 1-4 family residential mortgages and mortgage-backed securities, can be prepaid at any time by the borrower, which may significantly affect our expected cash flows. At December 31, 2023, lifetime prepayment speeds on loans and mortgage-backed securities were estimated to be 8.7% and 6.1%, respectively.
The EaR analysis focuses on parallel rate shocks across the term structure of benchmark interest rates. In a non-parallel rate scenario where shorter-term rates increase slightly, but the ten-year rate increases by 200 bps, the increase in EaR would be approximately 50 percent larger than the change associated with the parallel +200 bps rate change.
EaR has inherent limitations in describing expected changes in net interest income in rapidly changing interest rate environments due to a lag in asset and liability repricing behavior. As such, we expect net interest income to change due to “latent” and “emergent” interest rate sensitivity. Unlike EaR, which measures net interest income over 12 months, latent and emergent interest rate sensitivity explains changes in current quarter net interest income, compared with expected net interest income in the same quarter one year forward.
Latent interest rate sensitivity refers to future changes in net interest income based upon past rate movements that have yet to be fully recognized in revenue, but will be recognized over the near term. We expect latent sensitivity to increase net interest income by approximately 1% at December 31, 2024, compared with December 31, 2023.
Emergent interest rate sensitivity refers to future changes in net interest income based upon future interest rate movements and is measured from the latent level of net interest income. If interest rates rise consistent with the forward curve at December 31, 2023, we expect emergent sensitivity to increase net interest income by approximately 1% from the latent sensitivity level, for a cumulative 2% increase in net interest income.
Our focus on business banking also plays a significant role in determining the nature of our asset-liability management posture. At December 31, 2023, $26.3 billion of our commercial lending and CRE loan balances were scheduled to reprice in the next six months. For these variable-rate loans, we have executed $1.5 billion of cash flow hedges by receiving fixed rates on interest rate swaps. At December 31, 2023, we also had $3.7 billion of variable-rate consumer loans scheduled to reprice in the next six months. The impact on asset sensitivity from commercial or consumer loans with floors has become insignificant as rates have risen. See Notes 3 and 7 of the Notes to Consolidated Financial Statements for additional information regarding derivative instruments.
ZIONS BANCORPORATION, NATIONAL ASSOCIATION AND SUBSIDIARIES
LIBOR Transition
The London Interbank Offered Rate (“LIBOR”) was phased out globally, and banks migrated to alternative reference rates by June 30, 2023. We implemented processes, procedures, and systems to mitigate contract risk. We believe we have remediated our LIBOR exposure through fallback language, replacement indices, and reliance upon the provisions under the LIBOR Act.
Market Risk — Fixed Income
We are exposed to market risk through changes in fair value. This includes market risk for trading securities and for interest rate swaps used to hedge interest rate risk. We underwrite municipal and corporate securities. We also trade municipal, agency, and treasury securities. This underwriting and trading activity exposes us to a risk of loss arising from adverse changes in the prices of these fixed-income securities.
Changes in the fair value of AFS securities and in interest rate swaps that qualify as cash flow hedges are included in AOCI for each financial reporting period. During 2023, the $66 million after-tax decrease in AOCI loss related to investment securities was driven largely by paydowns on the AFS securities. For more discussion regarding investment securities and AOCI, see the “Capital Management” section on page 72. See also Note 5 of the Notes to Consolidated Financial Statements for further information regarding the accounting for investment securities.
Market Risk — Equity Investments
Through our equity investment activities, we own equity securities that are publicly traded. In addition, we own equity securities in governmental entities and companies, e.g., FRB and the FHLB, that are not publicly traded. Equity investments may be accounted for at cost less impairment and adjusted for observable price changes, fair value, the equity method, or proportional or full consolidation methods of accounting, depending on our ownership position and degree of influence over the investees’ business. Regardless of the accounting method, the values of our investments are subject to fluctuation. Because the fair value of these securities may fall below the cost at which we acquired them, we are exposed to the possibility of loss. Equity investments in private and public companies are evaluated, monitored, and approved by members of management in our Equity Investments Committee and Securities Valuation Committee.
We hold both direct and indirect investments in predominantly pre-public companies, primarily through various SBIC venture capital funds as a strategy to provide beneficial financing, growth, and expansion opportunities to diverse businesses generally in communities within our geographic footprint. Our equity exposure to these investments was approximately $190 million and $172 million at December 31, 2023 and December 31, 2022, respectively. On occasion, some of the companies within our SBIC portfolio may issue an initial public offering (“IPO”). In this case, the fund is generally subject to a lockout period before we can liquidate the investment, which can introduce additional market risk. See Note 3 of the Notes to Consolidated Financial Statements for additional information regarding the valuation of our SBIC investments.
Liquidity Risk Management
Liquidity refers to our ability to meet our cash, contractual, and collateral obligations, and to manage both expected and unexpected cash flows without adversely impacting our operations or financial strength. We manage our liquidity to provide funds for our customers’ credit needs, our anticipated financial and contractual obligations, and other corporate activities. Sources of liquidity include deposits, borrowings, and equity. Our investment securities are primarily held as a source of contingent liquidity. We generally own securities that can readily provide us with cash and liquidity through secured borrowing agreements with securities pledged as collateral.
Our Treasury group manages our liquidity and funding, with oversight by ALCO. The Treasurer is responsible for recommending changes to existing funding plans and our policies related to liquidity and funding. These recommendations are submitted for approval to ALCO, and changes to the policies are also approved by the ERMC and the Board. We maintain and regularly test a contingency funding plan to identify sources and uses of liquidity. Our Board-approved liquidity policy requires us to monitor and maintain adequate liquidity, diversify funding positions, and anticipate future funding needs. In accordance with this policy, we monitor our liquidity positions by conducting various stress tests and evaluating certain liquid asset measurements, such as a 30-day liquidity coverage ratio.
ZIONS BANCORPORATION, NATIONAL ASSOCIATION AND SUBSIDIARIES
We perform regular liquidity stress tests and assess our portfolio of highly liquid assets (sufficient to cover 30-day funding needs under stress scenarios). These stress tests include projections of funding maturities, uses of funds, and assumptions of deposit runoff. The assumptions consider the size of deposit account, operational nature of deposits, type of depositor, and concentrations of funding sources including large depositors and aggregate levels of uncollateralized deposits exceeding insured levels. Concentrated funding sources are given large runoff factors up to 100% in projecting stressed funding needs. Our liquidity stress testing considers multiple timeframes ranging from overnight to 12 months. Our liquidity policy requires us to maintain sufficient on-balance sheet liquidity in the form of FRB reserve balance and other highly liquid assets to meet stressed outflow assumptions.
We have a dedicated funding desk that monitors real-time inflows and outflows of our FRB account, and we have tools, including ready access to repo markets and FHLB advances, to manage intraday liquidity. FHLB borrowings are “open-term,” allowing us the ability to retain or return funds based on our liquidity needs. We pledge a large portion of our highly liquid investment securities portfolio through the General Collateral Funding (“GCF”) repo program. Through this program, high-quality collateral is pledged, and program participants exchange funds anonymously, which allows for near instant access to funding during market hours.
Additionally, we have pledged collateral to the FRB’s primary credit facility (or discount window) and the Bank Term Funding Program (“BTFP”), which provide additional contingent funding sources outside the normal operating hours of the FHLB and the GCF program. The BTFP offers loans of up to one year in length to eligible depository institutions pledging U.S. Treasuries, agency debt and government mortgage-backed securities, and other qualifying assets as collateral. Unlike other funding sources, borrowing capacity under the BTFP is based on the par value, not the fair value, of collateral. Advances can be requested under the program through mid-March 2024.
During 2023, the primary sources of cash came from an increase in deposits, a decrease in investment securities, and net decrease in money market investments. Uses of cash during the same period primarily included a decrease in short-term borrowings, an increase in loans and leases, and dividends paid on common and preferred stock. Cash payments for interest reflected in operating expenses were $1.4 billion and $160 million during 2023 and 2022, respectively.
The FHLB and FRB have been, and continue to be, a significant source of back-up liquidity and funding. We are a member of the FHLB of Des Moines, which allows member banks to borrow against eligible loans and securities to satisfy liquidity and funding requirements. We are required to invest in FHLB and FRB stock to maintain our borrowing capacity. At December 31, 2023, our total investment in FHLB and FRB stock was $79 million and $65 million, respectively, compared with $294 million and $68 million at December 31, 2022. Average FHLB activity stock holdings in 2023 was $179 million, compared with $61 million in 2022, which contributed to the increase in dividends on FHLB activity stock during the year.
At December 31, 2023, loans with a carrying value of $24.8 billion and $11.5 billion, compared with $23.7 billion and $3.9 billion at December 31, 2022, were pledged at the FHLB and FRB, respectively, as collateral for current and potential borrowings.
At December 31, 2023 and December 31, 2022, investment securities with a carrying value of $20.5 billion and $13.5 billion, respectively, were pledged as collateral for potential borrowings. For the same time periods, these pledges included $9.5 billion and $8.3 billion for available use through the GCF repo program, $5.5 billion and $1.0 billion to the FRB, and $5.5 billion and $4.2 billion to secure collateralized public and trust deposits, advances, and for other purposes.
A large portion of these pledged assets are unencumbered, but are pledged to provide immediate access to contingency sources of funds. The following schedule presents our total available liquidity including unused collateralized borrowing capacity:
ZIONS BANCORPORATION, NATIONAL ASSOCIATION AND SUBSIDIARIES
Schedule 36
AVAILABLE LIQUIDITY
|
|
|
|
|
|
|
|
|
|
|
|
|
|
|
|
|
|
|
|
|
|
|
|
|
|
|
|
|
|
|
|
|
|
|
|
|
|
|
|
|
|
|
|
|
|
|
|
|
|
|
|
|
|
|
|
|
|
|
|
|
December 31, 2023 |
|
December 31, 2022 |
| (Dollar amounts in billions) |
FHLB |
|
FRB |
|
GCF |
|
BTFP |
|
Total |
|
FHLB |
|
FRB |
|
GCF |
|
BTFP |
|
Total |
|
|
|
|
|
|
|
|
|
|
|
|
|
|
|
|
|
|
|
|
|
|
|
|
|
|
|
|
|
|
|
|
|
|
|
|
|
|
|
|
|
|
|
|
|
|
|
|
|
|
|
|
|
|
|
|
|
|
|
|
| Total borrowing capacity |
$ |
16.6 |
|
|
$ |
9.8 |
|
|
$ |
9.6 |
|
|
$ |
5.8 |
|
|
$ |
41.8 |
|
|
$ |
16.6 |
|
|
$ |
4.0 |
|
|
$ |
8.4 |
|
|
$ |
— |
|
|
$ |
29.0 |
|
| Borrowings outstanding |
1.6 |
|
|
— |
|
|
1.8 |
|
|
— |
|
|
3.4 |
|
|
7.2 |
|
|
— |
|
|
2.7 |
|
|
— |
|
|
9.9 |
|
| Remaining capacity, at period end |
$ |
15.0 |
|
|
$ |
9.8 |
|
|
$ |
7.8 |
|
|
$ |
5.8 |
|
|
$ |
38.4 |
|
|
$ |
9.4 |
|
|
$ |
4.0 |
|
|
$ |
5.7 |
|
|
$ |
— |
|
|
$ |
19.1 |
|
|
|
|
|
|
|
|
|
|
|
|
|
|
|
|
|
|
|
|
|
| Cash and due from banks |
|
|
|
|
|
|
|
0.7 |
|
|
|
|
|
|
|
|
|
|
0.7 |
|
Interest-bearing deposits 1 |
|
|
|
|
|
|
|
1.5 |
|
|
|
|
|
|
|
|
|
|
1.3 |
|
| Total available liquidity |
|
|
|
$ |
40.6 |
|
|
|
|
|
|
|
|
|
|
$ |
21.1 |
|
| Ratio of available liquidity to uninsured deposits |
|
|
|
|
|
|
|
|
122 |
% |
|
|
|
|
|
|
|
|
|
56 |
% |
1 Represents funds deposited by the Bank primarily at the Federal Reserve Bank.
At December 31, 2023 and December 31, 2022, our total available liquidity was $40.6 billion, compared with $21.1 billion, respectively. At December 31, 2023, we had sources of liquidity that exceeded our uninsured deposits without the need to sell any investment securities.
Credit Ratings
General financial market and economic conditions impact our access to, and cost of, external financing. Access to funding markets is also directly affected by the credit ratings we receive from various rating agencies. The ratings not only influence the costs associated with borrowings, but can also influence the sources of the borrowings. All of the credit rating agencies rate our debt at an investment-grade level.
The following schedule presents our credit ratings:
Schedule 37
CREDIT RATINGS
|
|
|
|
|
|
|
|
|
|
|
|
|
|
|
|
|
|
|
|
|
|
|
|
|
|
|
| as of January 31, 2024: |
| Rating agency |
|
Outlook |
|
Long-term issuer/senior
debt rating |
|
Subordinated debt rating |
|
Short-term debt rating |
|
|
|
|
|
|
|
|
|
| Kroll |
|
Stable |
|
A- |
|
BBB+ |
|
K2 |
| S&P |
|
Negative |
|
BBB+ |
|
BBB |
|
NR |
| Fitch |
|
Stable |
|
BBB+ |
|
BBB |
|
F2 |
| Moody’s |
|
Stable |
|
Baa2 |
|
NR |
|
P2 |
Uncertainties in the banking industry during 2023 resulted in ratings pressure for a number of banks, including Zions. As a result, the credit rating agencies took the following actions related to our issuer, debt, and deposit ratings:
•In April 2023, Moody’s downgraded our long-term issuer rating to Baa2 from Baa1, our short-term debt rating to P2 from P1, and changed their outlook on our long-term deposit and issuer ratings to “Stable” from “Ratings under review.”
•In May 2023, S&P changed their outlook on our long-term deposit and issuer ratings to “Negative” from “Stable.”
•In October 2023, Fitch downgraded our short-term debt rating to F2 from F1.
•In November 2023, Kroll changed their outlook on our long-term deposit and issuer ratings to “Stable” from “Positive.”
ZIONS BANCORPORATION, NATIONAL ASSOCIATION AND SUBSIDIARIES
We may, from time to time, issue additional preferred stock, senior or subordinated notes, or other forms of capital or debt instruments, depending on our capital, funding, asset-liability management, or other needs as market conditions warrant. These additional issuances may be subject to required regulatory approvals. We believe that our sources of available liquidity are adequate to meet all reasonably foreseeable short- and intermediate-term demands.
For more information about a recent regulatory proposal that would expand long-term debt requirements and impact our sources of available liquidity, see “Recent Regulatory Developments” on page 8 in Supervision and Regulation.
Contractual Obligations
The following schedule summarizes our contractual obligations at December 31, 2023:
Schedule 38
CONTRACTUAL OBLIGATIONS
|
|
|
|
|
|
|
|
|
|
|
|
|
|
|
|
|
|
|
|
|
|
|
|
|
|
|
|
|
|
|
|
|
|
|
|
| (In millions) |
One year or less |
|
Over one year through three years |
|
Over three years through five years |
|
Over five years |
|
Indeterminable maturity 1 |
|
Total |
|
|
|
|
|
|
|
|
|
|
|
|
| Deposits |
$ |
9,798 |
|
|
$ |
155 |
|
|
$ |
42 |
|
|
$ |
1 |
|
|
$ |
64,965 |
|
|
$ |
74,961 |
|
| Unfunded lending commitments |
7,995 |
|
|
8,372 |
|
|
3,512 |
|
|
9,061 |
|
|
— |
|
|
28,940 |
|
| Standby letters of credit: |
|
|
|
|
|
|
|
|
|
|
|
| Financial |
548 |
|
|
— |
|
|
— |
|
|
— |
|
|
— |
|
|
548 |
|
| Performance |
206 |
|
|
— |
|
|
— |
|
|
— |
|
|
— |
|
|
206 |
|
| Commercial letters of credit |
22 |
|
|
— |
|
|
— |
|
|
— |
|
|
— |
|
|
22 |
|
Mortgage-backed security purchase agreements 2 |
— |
|
|
— |
|
|
— |
|
|
66 |
|
|
— |
|
|
66 |
|
Commitments to make venture and other noninterest-bearing investments 3 |
— |
|
|
— |
|
|
— |
|
|
— |
|
|
62 |
|
|
62 |
|
| Federal funds and other short-term borrowings |
4,379 |
|
|
— |
|
|
— |
|
|
— |
|
|
— |
|
|
4,379 |
|
Long-term debt 4 |
— |
|
|
— |
|
|
88 |
|
|
500 |
|
|
— |
|
|
588 |
|
| Operating leases |
42 |
|
|
67 |
|
|
40 |
|
|
83 |
|
|
— |
|
|
232 |
|
| Total contractual obligations |
$ |
22,990 |
|
|
$ |
8,594 |
|
|
$ |
3,682 |
|
|
$ |
9,711 |
|
|
$ |
65,027 |
|
|
$ |
110,004 |
|
1 Indeterminable maturity deposits include noninterest-bearing demand, savings, and money market deposits.
2 Represents agreements with Farmer Mac to purchase securities backed by certain agricultural mortgage loans.
3 Commitments to make venture and other noninterest-bearing investments do not have defined maturity dates. They are due upon demand and may be drawn immediately. Therefore, these commitments are shown as having indeterminable maturities.
4 The values presented do not reflect the impact of associated fair value hedges.
In addition to the commitments specifically noted in the schedule above, we enter into a number of contractual commitments in the ordinary course of business. These include software licensing and maintenance, telecommunications services, facilities maintenance and equipment servicing, supplies purchasing, and other goods and services used in the operation of our business. Some of these contracts are renewable or cancellable annually or in shorter time intervals. To secure favorable pricing concessions, we may also commit to contracts that may extend several years.
We enter into derivative contracts that may require us to pay cash, depending on changes in interest rates. These contracts are measured at fair value on the balance sheet, reflecting the net present value of the expected future cash receipts and payments based on market interest rates. See Note 7 of the Notes to Consolidated Financial Statements for further information on derivative contracts.
Operational, Technology, and Cybersecurity Risk Management
Operational Risk Management
Operational risk is the risk to current or anticipated earnings or capital arising from inadequate or failed internal processes or systems, human errors or misconduct, or adverse external events. ERM assists employees, management, and the Board with assessing, measuring, managing, and monitoring this risk in accordance with our Risk Management Framework.
ZIONS BANCORPORATION, NATIONAL ASSOCIATION AND SUBSIDIARIES
For example, we have documented control self-assessments related to financial reporting under the 2013 framework issued by the Committee of Sponsoring Organizations of the Treadway Commission (“COSO”) and the FDICIA.
We have instituted a number of measures to manage our operational risk, including, but not limited to: (1) transactional documentation requirements; (2) systems and procedures to monitor transactions and positions; (3) systems and procedures to detect and mitigate attempts to commit fraud, penetrate our systems, access customer data, or deny normal access to those systems to our legitimate customers; (4) regulatory compliance reviews; and (5) periodic reviews by our Compliance Risk Management, Internal Audit, Operational Risk Management, and Credit Examination departments. Reconciliation procedures have been established to ensure that data processing systems consistently and accurately capture critical data. In addition, the Data Governance department provides additional oversight of data integrity and data availability. Further, we maintain disaster recovery and business continuity plans for operational support in the event of natural or other disasters. We also mitigate certain operational risks through the purchase of insurance, including errors and omissions and professional liability insurance.
We continually strive to improve our operational risk management, including enhancement of risk identification, risk and control self-assessments, business process mappings, regular tests of controls, and anti-fraud measures, which are reported on a regular basis to enterprise management committees. Key measures have been established in line with our Risk Management Framework to increase oversight by ERM and Operational Risk Management through the strengthening of new initiative reviews and enhancements to enterprise supply chain and vendor risk management. We also continue to review and enhance our Enterprise Business Continuity and Enterprise Security programs.
Significant enhancements have also been made to governance, technology, and reporting, including the establishment of Policy and Committee Governance programs; the implementation of a governance, risk, and control system to manage and integrate business processes, risks, controls, assessments, and control testing; and the creation of an Enterprise Risk Profile. In addition, our Enterprise Exam Management department has standardized our response and reporting, and increased our effectiveness and efficiencies with regulatory examination, communications, and issues management.
Technology Risk Management
Technology risk is the risk of adverse impact to business operations and customers due to reduced or denied availability or inadequate value delivery related to technology-related applications, infrastructure, strategy, or processes. We make significant investments to enhance our technology capabilities and to mitigate the risk from outdated and unsupported technologies (technical debt). This includes updating core banking systems, as well as introducing new digital customer-facing capabilities. Technology projects, initiatives, and operations are governed by a change management framework that assesses the activities and risk within our business processes to limit disruption and resource constraints. New, expanded, or modified products and services, as well as new lines of business, change initiatives, and other risks are regularly reviewed and approved by the Change, Initiatives, and Technology Committee. This Committee includes, among other senior executives, the Chief Executive Officer, Chief Financial Officer, Chief Operating Officer, CTOO, and Chief Risk Officer. Initiative risk and change impact from the framework are reported to the ROC.
Technology governance exists at the operational level within our Enterprise and Technology Operations (“ETO”) division to help ensure safety, soundness, operational resiliency, and compliance with our technology policies. ETO management regularly participates in enterprise architecture review boards and technology risk committees to assess ongoing objectives related to enterprise standards compliance and strategic alignment, end-of-life, audit, risk and compliance issue management, and asset management. Thresholds are defined to escalate associated risks to the attention of the ERMC and ROC committees as appropriate.
ZIONS BANCORPORATION, NATIONAL ASSOCIATION AND SUBSIDIARIES
Cybersecurity Risk Management
Cybersecurity risk is the risk of adverse impacts to the confidentiality, integrity, and availability of data owned, stored, or processed by the Bank. For information about how we manage cybersecurity risk, see Part I, Item 1C. Cybersecurity on page 24.
Capital Management
The Board is responsible for approving key policies associated with capital management. The Board has delegated responsibility of managing our capital risk to the Capital Management Committee (“CMC”), which is chaired by the Chief Financial Officer, consists of members of management, and whose primary responsibility is to recommend and administer the approved capital policies that govern our capital management. Other major CMC responsibilities include:
•Setting overall capital targets within the Board-approved Capital Policy, monitoring performance compared with our Capital Policy limits, and recommending changes to capital including dividends, common stock issuances and repurchases, subordinated debt, and changes in major strategies to maintain ourselves at well-capitalized levels;
•Maintaining an adequate capital cushion to withstand adverse stress events while continuing to meet the borrowing needs of our customers, and to provide reasonable assurance of continued access to wholesale funding, consistent with fiduciary responsibilities to depositors and bondholders; and
•Reviewing our credit agency ratings.
A strong capital position is vital to the achievement of our key corporate objectives, our continued profitability, and to promoting depositor and investor confidence. We seek to (1) maintain sufficient capital to support the current needs and growth of our businesses, consistent with our assessment of their potential to create value for shareholders, and (2) fulfill responsibilities to depositors and bondholders while managing capital distributions to shareholders through dividends and repurchases of common stock.
We utilize stress testing as an important mechanism to inform our decisions on the appropriate level of capital, based upon actual and hypothetically stressed economic conditions, which are comparable in severity to the scenarios published by the FRB. The timing and amount of capital actions are subject to various factors, including our financial performance, business needs, prevailing and anticipated economic conditions, and the results of our internal stress testing, as well as Board and OCC approval. Shares may be repurchased occasionally in the open market or through privately negotiated transactions.
Schedule 39
SHAREHOLDERS’ EQUITY
|
|
|
|
|
|
|
|
|
|
|
|
|
|
|
|
|
|
|
|
|
|
|
|
| (Dollar amounts in millions) |
December 31,
2023 |
|
December 31,
2022 |
|
Amount change |
|
Percent change |
| Shareholders’ equity: |
|
|
|
|
|
|
|
| Preferred stock |
$ |
440 |
|
|
$ |
440 |
|
|
$ |
— |
|
|
— |
% |
| Common stock and additional paid-in capital |
1,731 |
|
|
1,754 |
|
|
(23) |
|
|
(1) |
|
| Retained earnings |
6,212 |
|
|
5,811 |
|
|
401 |
|
|
7 |
|
| Accumulated other comprehensive income |
(2,692) |
|
|
(3,112) |
|
|
420 |
|
|
13 |
|
Total shareholders’ equity |
$ |
5,691 |
|
|
$ |
4,893 |
|
|
$ |
798 |
|
|
16 |
% |
Total shareholders’ equity increased $798 million, or 16% to $5.7 billion at December 31, 2023, compared with $4.9 billion at December 31, 2022. Common stock and additional paid-in capital decreased $23 million. During the first quarter of 2023, we repurchased 0.9 million common shares outstanding for $50 million. As the macroeconomic environment remained uncertain, we suspended our share repurchase program and did not repurchase common shares during the second, third, or fourth quarters of 2023. During 2022, we repurchased 3.6 million common shares outstanding for $200 million.
ZIONS BANCORPORATION, NATIONAL ASSOCIATION AND SUBSIDIARIES
In February 2024, the Board approved a plan to repurchase up to $35 million of common shares outstanding during the fiscal year 2024. In February 2024, we repurchased 0.9 million common shares outstanding for $35 million at an average price of $39.32.
The AOCI loss was $2.7 billion at December 31, 2023, and primarily reflects declines in the fair value of fixed-rate available-for-sale securities as a result of changes in interest rates. When compared to the prior year end, AOCI improved $420 million during 2023, driven largely by $208 million in unrealized loss amortization associated with the securities transferred from AFS to HTM during the fourth quarter of 2022, and $66 million primarily related to paydowns on AFS securities. AOCI was also impacted by a $145 million increase in unrealized gains and other adjustments associated with derivative instruments used for risk management purposes. Absent any sales or credit impairment of the AFS securities, the unrealized losses will not be recognized in earnings. We do not intend to sell any securities with unrealized losses. Although changes in AOCI are reflected in shareholders’ equity, they are excluded from regulatory capital, and therefore do not impact our regulatory ratios.
Bank regulators recently issued a proposal to implement Basel III Endgame, which would significantly revise certain capital requirements, such as the inclusion of unrealized gains and losses on AFS debt securities in regulatory capital, and would potentially impact our current and future capital planning, including share repurchase activity. For more information about the regulatory proposals, see “Recent Regulatory Developments” in Supervision and Regulation on page 8. For more discussion on our investment securities portfolio and related unrealized gains and losses, see Note 5 of the Notes to Consolidated Financial Statements.
Schedule 40
CAPITAL DISTRIBUTIONS
|
|
|
|
|
|
|
|
|
|
|
|
| (In millions, except share data) |
2023 |
|
2022 |
| Capital distributions: |
|
|
|
| Preferred dividends paid |
$ |
32 |
|
$ |
29 |
|
|
|
|
| Total capital distributed to preferred shareholders |
32 |
|
29 |
| Common dividends paid |
245 |
|
240 |
Bank common stock repurchased 1 |
51 |
|
202 |
| Total capital distributed to common shareholders |
296 |
|
442 |
| Total capital distributed to preferred and common shareholders |
$ |
328 |
|
$ |
471 |
| Weighted average diluted common shares outstanding (in thousands) |
147,756 |
|
150,271 |
| Common shares outstanding, at year-end (in thousands) |
148,153 |
|
148,664 |
1 Includes amounts related to the common shares acquired from our publicly announced plans and those acquired in connection with our stock compensation plan. Shares were acquired from employees to pay for their payroll taxes and stock option exercise cost upon the exercise of stock options.
Pursuant to the OCC’s “Earnings Limitation Rule,” our dividend payments are restricted to an amount equal to the sum of the total of (1) our net income for that year, and (2) retained earnings for the preceding two years, unless the OCC approves the declaration and payment of dividends in excess of such amount. As of January 1, 2024, we had $1.0 billion of retained net profits available for distribution.
We paid dividends on preferred stock of $32 million in 2023, compared with $29 million in 2022. We paid dividends on common stock of $245 million, or $1.64 per share, in 2023, compared with $240 million, or $1.58 per share, in 2022. In February 2024, the Board declared a quarterly dividend of $0.41 per common share payable on February 22, 2024, to shareholders of record at the close of business on February 15, 2024.
Basel III
We are subject to Basel III capital requirements that include certain minimum regulatory capital ratios. At December 31, 2023, we exceeded all capital adequacy requirements under the Basel III capital rules. Based on our internal stress testing and other assessments of capital adequacy, we believe we hold capital sufficiently in excess of internal and regulatory requirements for well-capitalized banks. See the “Supervision and Regulation” section on page 7 and Note 15 of the Notes to Consolidated Financial Statements for more information about Basel III capital requirements.
ZIONS BANCORPORATION, NATIONAL ASSOCIATION AND SUBSIDIARIES
The following schedule presents our capital amounts, capital ratios, and other selected performance ratios:
Schedule 41
CAPITAL AMOUNTS AND RATIOS
|
|
|
|
|
|
|
|
|
|
|
|
|
|
|
|
|
|
| (Dollar amounts in millions) |
December 31,
2023 |
|
December 31,
2022 |
|
December 31,
2021 |
Basel III risk-based capital amounts: |
|
|
|
|
|
| Common equity Tier 1 capital |
$ |
6,863 |
|
|
$ |
6,481 |
|
|
$ |
6,068 |
|
| Tier 1 risk-based |
7,303 |
|
|
6,921 |
|
|
6,508 |
|
| Total risk-based |
8,553 |
|
|
8,077 |
|
|
7,652 |
|
| Risk-weighted assets |
66,934 |
|
|
66,111 |
|
|
59,604 |
|
| Basel III risk-based capital ratios: |
|
|
|
|
|
| Common equity Tier 1 capital |
10.3 |
% |
|
9.8 |
% |
|
10.2 |
% |
| Tier 1 risk-based |
10.9 |
% |
|
10.5 |
% |
|
10.9 |
% |
| Total risk-based |
12.8 |
% |
|
12.2 |
% |
|
12.8 |
% |
| Tier 1 leverage |
8.3 |
% |
|
7.7 |
% |
|
7.2 |
% |
| Other ratios: |
|
|
|
|
|
| Average equity to average assets |
6.0 |
% |
|
6.6 |
% |
|
9.0 |
% |
| Return on average common equity |
13.4 |
% |
|
16.0 |
% |
|
14.9 |
% |
Return on average tangible common equity 1 |
17.3 |
% |
|
19.8 |
% |
|
17.3 |
% |
Tangible equity ratio 1 |
5.4 |
% |
|
4.3 |
% |
|
7.0 |
% |
Tangible common equity ratio 1 |
4.9 |
% |
|
3.8 |
% |
|
6.5 |
% |
1 See “Non-GAAP Financial Measures” on page 77 for more information regarding these ratios.
During the latter half of 2023, federal bank regulators issued certain proposals applicable to large banking organizations that would significantly revise the capital requirements, expand long-term debt requirements, and revise requirements for resolution planning. For more information about these regulatory proposals, see “Recent Regulatory Developments” in Supervision and Regulation on page 8.
CRITICAL ACCOUNTING POLICIES AND SIGNIFICANT ESTIMATES
Note 1 of the Notes to Consolidated Financial Statements contains a summary of our significant accounting policies. Certain accounting policies that we consider critical are described below because their related balances and estimates are significant to the financial statements. Any changes to these amounts, including changes in estimates, may also be significant to the financial statements. We believe that an understanding of these policies, along with the related estimates we are required to make in recording our financial transactions, is important to have a complete picture of our financial condition. Additionally, in making these estimates, we are required to make complex and subjective judgments, many of which include a high degree of uncertainty. We discuss these critical accounting policies and related estimates below.
We have included, where applicable in this document, sensitivity schedules and other examples to demonstrate the impact of the changes in estimates made for various financial transactions. The sensitivities in these schedules and examples are hypothetical and should be viewed with caution. Changes in estimates are based on variations in assumptions and are not subject to simple extrapolation, as the relationship of the change in the assumption to the change in the amount of the estimate may not be linear. In addition, the effect of a variation in one assumption is likely to cause changes in other assumptions, which could potentially magnify or counteract the sensitivities.
Allowance for Credit Losses
The ACL includes the ALLL and the RULC and represents our estimate of current expected credit losses related to the loan and lease portfolio and unfunded lending commitments as of the balance sheet date. The ACL for our AFS and HTM debt securities portfolio is estimated separately from loans and is not presented separately on the consolidated balance sheet due to immateriality.
ZIONS BANCORPORATION, NATIONAL ASSOCIATION AND SUBSIDIARIES
The ACL for debt securities was less than $1 million at both December 31, 2023 and 2022.
The ACL may change significantly each period because the ACL is subject to economic forecasts that may change materially from period to period. We believe that our methodology for determining an appropriate level for the ACL adequately addresses the various components that could potentially result in credit losses. Any unfavorable differences between the actual outcome of credit-related events and our estimates could require an additional provision for credit losses.
The ACL is calculated based on quantitative models and management’s qualitative judgment based on many factors over the life of loan. The primary assumptions of the quantitative model are the economic forecast, the length of the reasonable and supportable forecast period, the length of the reversion period, prepayment rates, and the credit quality of the portfolio. The quantitative ACL estimate is based on losses under multiple economic scenarios that reflect optimistic, baseline, and stressed economic conditions. Management uses qualitative judgment to adjust scenario weights to more closely reflect management’s assessments of current conditions and reasonable and supportable forecasts.
If the ACL was evaluated on the baseline economic scenario rather than weighting multiple scenarios, the quantitatively determined amount of the ACL at December 31, 2023 would decrease by approximately $138 million. Additionally, if the probability of default risk-grade for all pass-graded loans was immediately downgraded one grade on our internal risk-grading scale, the quantitatively determined amount of the ACL at December 31, 2023 would increase by approximately $51 million. These sensitivity analyses are hypothetical and have been provided only to indicate the potential impact that changes in economic forecasts and changes in risk-grades may have on the ACL estimate. See Note 6 of the Notes to Consolidated Financial Statements for more information on the processes and methodologies used to estimate the ACL.
Fair Value Estimates
We measure certain assets and liabilities at fair value. Fair value is the price that would be received to sell an asset or paid to transfer a liability in an orderly transaction between market participants. To increase consistency and comparability in fair value measurements, we prioritize valuation inputs in accordance with a three-level hierarchy: (1) observable inputs that reflect quoted prices in active markets, (2) inputs other than quoted prices with observable market data, and (3) unobservable data such as our own data.
When observable market prices are not available, fair value is estimated using modeling techniques such as discounted cash flow analysis. These modeling techniques use assumptions that market participants would consider in pricing the asset or the liability.
The selection and weighting of the various fair value techniques may result in a fair value higher or lower than the carrying value of the item being valued. Considerable judgment may be involved in determining the amount that is most representative of fair value.
For assets and liabilities measured at fair value, our policy is to maximize the use of observable inputs, when available, and minimize the use of unobservable inputs when estimating fair value. In certain cases, when market observable inputs for model-based valuation techniques may not be readily available, we are required to make judgments about the assumptions that we believe market participants would consider in estimating the fair value of financial instruments. The models used to estimate fair value are regularly evaluated by management for relevance under current facts and circumstances. Changes in market conditions may reduce the availability of quoted prices or observable data. For example, reduced liquidity in the capital markets or changes in secondary market activities could result in observable market inputs becoming unavailable.
Fair value is used on a recurring basis for certain assets and liabilities in which fair value is the primary measure of accounting. Fair value is used on a nonrecurring basis for certain assets or liabilities to determine any impairment or for disclosure purposes.
ZIONS BANCORPORATION, NATIONAL ASSOCIATION AND SUBSIDIARIES
AFS securities are valued using several methodologies, which depend on the nature of the security, availability of current market information, and other factors. AFS securities in an unrealized loss position are formally reviewed on a quarterly basis for the presence of credit impairment. If we have the intent to sell an identified security, or it is more likely than not we will be required to sell the security before recovery of its amortized cost basis, we first recognize an identified impairment. If we do not have the intent to sell a security, and it is more likely than not that we will not be required to sell a security prior to recovery of its amortized cost basis, then we determine whether there is any impairment attributable to credit-related factors. Credit-related impairment is recognized as an allowance. Full or partial write-offs of an AFS security are recorded in the period in which the security is deemed to be uncollectible.
While certain assets and liabilities are measured at fair value, such as our AFS securities, the majority of our assets and liabilities are not adjusted for changes in fair value. This asymmetrical accounting creates volatility in AOCI and equity.
Notes 1, 3, 5, 7, and 10 of the Notes to Consolidated Financial Statements and the “Investment Securities Portfolio” on page 46 contain further information regarding the use of fair value estimates.
Goodwill
Goodwill is recorded at fair value in the financial statements of a reporting unit at the time of its acquisition and is subsequently evaluated at least annually for impairment.
We perform an evaluation during the fourth quarter of each year, or more frequently if events or circumstances indicate that the carrying value exceeds fair value. We may elect to perform a qualitative analysis to determine if it is more likely than not that the fair value of a reporting unit is less than its carrying amount. If the carrying amount is more likely than not to exceed its fair value, additional quantitative analysis is performed to determine the amount of goodwill impairment. If the fair value is less than the carrying value, an impairment is recorded for the difference. Goodwill impairment does not impact our regulatory capital ratios or tangible common equity ratio.
To determine the fair value of a reporting unit, we use (1) a market value approach that incorporates comparable publicly traded commercial banks, and (2) an income method that consists of a discounted present value of management’s estimates of future cash flows.
Critical assumptions used as part of these methods include:
•Selection of comparable publicly traded companies based on location, size, and business focus and composition;
•Selection of market comparable acquisition transactions, if available, based on location, size, business focus and composition, and date of the transaction;
•The discount rate, which is based on our estimate of the cost of equity capital;
•The projections of future earnings and cash flows of the reporting unit;
•The relative weight given to the valuations derived by the two methods described previously; and
•The control premium associated with reporting units.
Since estimates are an integral part of the impairment test computations, changes in these estimates could have a significant impact on our reporting units’ fair value and the goodwill impairment amount, if any. Estimates include economic conditions, which impact the assumptions related to interest and growth rates, loss rates, and imputed cost of equity capital. Additional factors that may significantly affect the estimates include, among others, competitive forces, customer behaviors and attrition, loan losses, changes in growth trends, cost structures and technology, changes in equity market values and merger and acquisition valuations, and changes in industry conditions.
We performed our annual goodwill impairment evaluation, effective October 1, 2023. We concluded that none of our reporting units were impaired. Furthermore, the evaluation process determined that the fair values of Amegy, CB&T, Zions Bank, and NSB exceeded their carrying values by 38%, 70%, 80%, and 139%, respectively. Additionally, we performed a hypothetical sensitivity analysis on the discount rate assumption to evaluate the impact of an adverse change to this assumption.
ZIONS BANCORPORATION, NATIONAL ASSOCIATION AND SUBSIDIARIES
If the discount rate applied to future earnings was increased by 100 bps, the fair values of Amegy, CB&T, Zions Bank, and NSB would exceed their carrying values by 32%, 60%, 63%, and 124%, respectively.
RECENT ACCOUNTING PRONOUNCEMENTS AND DEVELOPMENTS
Note 2 of the Notes to Consolidated Financial Statements discusses recently issued accounting pronouncements that we are, or will be, required to adopt. Also described is our expectation of the impact these new accounting pronouncements will have, to the extent they are material, on our financial condition or results of operations.
NON-GAAP FINANCIAL MEASURES
This Form 10-K presents non-GAAP financial measures in addition to GAAP financial measures. The adjustments to reconcile from the applicable GAAP financial measures to the non-GAAP financial measures are presented in the following schedules. We consider these adjustments to be relevant to ongoing operating results and provide a meaningful basis for period-to-period comparisons. We use these non-GAAP financial measures to assess our performance and financial position. We believe that presenting these non-GAAP financial measures allows investors to assess our performance on the same basis as that applied by our management and the financial services industry.
Non-GAAP financial measures have inherent limitations and are not necessarily comparable to similar financial measures that may be presented by other financial services companies. Although non-GAAP financial measures are frequently used by stakeholders to evaluate a company, they have limitations as an analytical tool and should not be considered in isolation or as a substitute for analysis of results reported under GAAP.
Tangible Common Equity and Related Measures
Tangible common equity and related measures are non-GAAP measures that exclude the impact of intangible assets and their related amortization. We believe these non-GAAP measures provide useful information about our use of shareholders’ equity and provide a basis for evaluating the performance of a business more consistently, whether acquired or developed internally.
Schedule 42
RETURN ON AVERAGE TANGIBLE COMMON EQUITY (NON-GAAP)
|
|
|
|
|
|
|
|
|
|
|
|
|
|
|
|
|
|
|
|
|
|
|
Year Ended December 31, |
| (Dollar amounts in millions) |
|
2023 |
|
2022 |
|
2021 |
|
|
|
|
|
|
|
| Net earnings applicable to common shareholders (GAAP) |
|
$ |
648 |
|
|
$ |
878 |
|
|
$ |
1,100 |
|
| Adjustment, net of tax: |
|
|
|
|
|
|
| Amortization of core deposit and other intangibles |
|
5 |
|
|
1 |
|
|
1 |
|
| Net earnings applicable to common shareholders, net of tax |
(a) |
$ |
653 |
|
|
$ |
879 |
|
|
$ |
1,101 |
|
| Average common equity (GAAP) |
|
$ |
4,839 |
|
|
$ |
5,472 |
|
|
$ |
7,371 |
|
| Average goodwill and intangibles |
|
(1,062) |
|
|
(1,022) |
|
|
(1,015) |
|
|
|
|
|
|
|
|
| Average tangible common equity (non-GAAP) |
(b) |
$ |
3,777 |
|
|
$ |
4,450 |
|
|
$ |
6,356 |
|
Return on average tangible common equity (non-GAAP) 1 |
(a/b) |
17.3 |
% |
|
19.8 |
% |
|
17.3 |
% |
1 Excluding the effect of AOCI from average tangible common equity would result in associated returns of 9.7%, 13.9%, and 17.8% for the periods presented, respectively.
ZIONS BANCORPORATION, NATIONAL ASSOCIATION AND SUBSIDIARIES
Schedule 43
TANGIBLE EQUITY RATIO, TANGIBLE COMMON EQUITY RATIO, AND TANGIBLE BOOK VALUE PER COMMON SHARE (ALL NON-GAAP MEASURES)
|
|
|
|
|
|
|
|
|
|
|
|
|
|
|
|
|
|
|
|
|
| (Dollar amounts in millions, except per share amounts) |
|
December 31, |
|
2023 |
|
2022 |
|
2021 |
|
|
|
|
|
|
|
| Total shareholders’ equity (GAAP) |
|
$ |
5,691 |
|
$ |
4,893 |
|
$ |
7,463 |
| Goodwill and intangibles |
|
(1,059) |
|
(1,065) |
|
(1,015) |
|
|
|
|
|
|
|
| Tangible equity (non-GAAP) |
(a) |
4,632 |
|
3,828 |
|
6,448 |
| Preferred stock |
|
(440) |
|
(440) |
|
(440) |
| Tangible common equity (non-GAAP) |
(b) |
$ |
4,192 |
|
$ |
3,388 |
|
$ |
6,008 |
| Total assets (GAAP) |
|
$ |
87,203 |
|
$ |
89,545 |
|
$ |
93,200 |
| Goodwill and intangibles |
|
(1,059) |
|
(1,065) |
|
(1,015) |
|
|
|
|
|
|
|
| Tangible assets (non-GAAP) |
(c) |
$ |
86,144 |
|
$ |
88,480 |
|
$ |
92,185 |
| Common shares outstanding (in thousands) |
(d) |
148,153 |
|
148,664 |
|
151,625 |
| Tangible equity ratio (non-GAAP) |
(a/c) |
5.4 |
% |
|
4.3 |
% |
|
7.0 |
% |
| Tangible common equity ratio (non-GAAP) |
(b/c) |
4.9 |
% |
|
3.8 |
% |
|
6.5 |
% |
| Tangible book value per common share (non-GAAP) |
(b/d) |
$28.30 |
|
$22.79 |
|
$39.62 |
Efficiency Ratio and Adjusted Pre-Provision Net Revenue
The efficiency ratio is a measure of operating expense relative to revenue. We believe the efficiency ratio provides useful information regarding the cost of generating revenue. We make adjustments to exclude certain items that are not generally expected to recur frequently, as identified in the subsequent schedule, which we believe allow for more consistent comparability across periods. Adjusted noninterest expense provides a measure as to how we are managing our expenses. Adjusted pre-provision net revenue enables management and others to assess our ability to generate capital. Taxable-equivalent net interest income allows us to assess the comparability of revenue arising from both taxable and tax-exempt sources.
ZIONS BANCORPORATION, NATIONAL ASSOCIATION AND SUBSIDIARIES
Schedule 44
EFFICIENCY RATIO (NON-GAAP) AND ADJUSTED PRE-PROVISION NET REVENUE (NON-GAAP)
|
|
|
|
|
|
|
|
|
|
|
|
|
|
|
|
|
|
|
|
|
| (Dollar amounts in millions) |
|
2023 |
|
2022 |
|
2021 |
|
|
|
|
|
|
|
| Noninterest expense (GAAP) |
(a) |
$ |
2,097 |
|
|
$ |
1,878 |
|
|
$ |
1,741 |
|
| Adjustments: |
|
|
|
|
|
|
| Severance costs |
|
14 |
|
|
1 |
|
|
1 |
|
| Other real estate expense, net |
|
— |
|
|
1 |
|
|
— |
|
|
|
|
|
|
|
|
| Amortization of core deposit and other intangibles |
|
6 |
|
|
1 |
|
|
1 |
|
| Restructuring costs |
|
1 |
|
|
— |
|
|
— |
|
Pension termination-related expense (income) 1 |
|
— |
|
|
— |
|
|
(5) |
|
SBIC investment success fee accrual 2 |
|
— |
|
|
(1) |
|
|
7 |
|
| FDIC special assessment |
|
90 |
|
|
— |
|
|
— |
|
| Total adjustments |
(b) |
111 |
|
|
2 |
|
|
4 |
|
| Adjusted noninterest expense (non-GAAP) |
(a-b)=(c) |
$ |
1,986 |
|
|
$ |
1,876 |
|
|
$ |
1,737 |
|
|
|
|
|
|
|
|
| Net interest income (GAAP) |
(d) |
$ |
2,438 |
|
|
$ |
2,520 |
|
|
$ |
2,208 |
|
| Fully taxable-equivalent adjustments |
(e) |
41 |
|
|
37 |
|
|
32 |
|
| Taxable-equivalent net interest income (non-GAAP) |
(d+e)=(f) |
2,479 |
|
|
2,557 |
|
|
2,240 |
|
| Noninterest income (GAAP) |
(g) |
677 |
|
|
632 |
|
|
703 |
|
| Combined income (non-GAAP) |
(f+g)=(h) |
3,156 |
|
|
3,189 |
|
|
2,943 |
|
| Adjustments: |
|
|
|
|
|
|
| Fair value and nonhedge derivative gain (loss) |
|
(4) |
|
|
16 |
|
|
14 |
|
| Securities gains (losses), net |
|
4 |
|
|
(15) |
|
|
71 |
|
| Total adjustments |
(i) |
— |
|
|
1 |
|
|
85 |
|
| Adjusted taxable-equivalent revenue (non-GAAP) |
(h-i)=(j) |
$ |
3,156 |
|
|
$ |
3,188 |
|
|
$ |
2,858 |
|
|
|
|
|
|
|
|
| Pre-provision net revenue (non-GAAP) |
(h)-(a) |
$ |
1,059 |
|
|
$ |
1,311 |
|
|
$ |
1,202 |
|
Adjusted pre-provision net revenue (non-GAAP) |
(j-c) |
1,170 |
|
|
1,312 |
|
|
1,121 |
|
Efficiency ratio (non-GAAP) 3 |
(c/j) |
62.9 |
% |
|
58.8 |
% |
|
60.8 |
% |
1 Represents a subsequent valuation adjustment related to the termination of our defined benefit pension plan in 2020.
2 The success fee accrual is associated with the gains and losses from our SBIC investments, which are excluded from the efficiency ratio through securities gains (losses), net.
3 Including the one-time $90 million accrual associated with the FDIC special assessment recorded in deposit insurance and regulatory expense during the fourth quarter of 2023, the efficiency ratio for 2023 would have been 65.8%.
ITEM 7A. QUANTITATIVE AND QUALITATIVE DISCLOSURES ABOUT MARKET RISK
Information required by this Item is included in “Interest Rate and Market Risk Management” in MD&A beginning on page 63, and is hereby incorporated by reference.
ITEM 8. FINANCIAL STATEMENTS AND SUPPLEMENTARY DATA
ZIONS BANCORPORATION, NATIONAL ASSOCIATION AND SUBSIDIARIES
REPORT ON MANAGEMENT’S ASSESSMENT OF INTERNAL CONTROL OVER FINANCIAL REPORTING
The management of Zions Bancorporation, N.A is responsible for establishing and maintaining adequate internal control over financial reporting as defined by Exchange Act Rules 13a-15 and 15d-15.
Because of its inherent limitations, internal control over financial reporting may not prevent or detect misstatements. Also, projections of any evaluation of effectiveness to future periods are subject to the risk that controls may become inadequate because of changes in conditions, or that the degree of compliance with the policies or procedures may deteriorate. Although any system of internal control can be compromised by human error or intentional circumvention of required procedures, we believe our system provides reasonable assurance that financial transactions are recorded and reported properly, providing an adequate basis for reliable financial statements.
Our management has used the criteria established in Internal Control – Integrated Framework (2013 framework) issued by the Committee of Sponsoring Organizations of the Treadway Commission (“COSO”) to evaluate the effectiveness of our internal control over financial reporting.
Our management has assessed the effectiveness of our internal control over financial reporting as of December 31, 2023, and has concluded that such internal control over financial reporting is effective. There are no material weaknesses in our internal control over financial reporting that have been identified by our management.
Ernst & Young LLP, an independent registered public accounting firm, has audited our consolidated financial statements for the year ended December 31, 2023, and has also issued an attestation report, which is included herein, on internal control over financial reporting in accordance with the standards of the Public Company Accounting Oversight Board (“PCAOB”).
ZIONS BANCORPORATION, NATIONAL ASSOCIATION AND SUBSIDIARIES
REPORTS OF ERNST & YOUNG LLP, INDEPENDENT REGISTERED PUBLIC ACCOUNTING FIRM (PCAOB ID: 42)
REPORT ON INTERNAL CONTROL OVER FINANCIAL REPORTING
To the Shareholders and the Board of Directors of Zions Bancorporation, National Association
Opinion on Internal Control Over Financial Reporting
We have audited Zions Bancorporation, National Association’s (“the Bank”) internal control over financial reporting as of December 31, 2023, based on criteria established in Internal Control — Integrated Framework issued by the Committee of Sponsoring Organizations of the Treadway Commission (2013 framework) (“the COSO criteria”). In our opinion, the Bank maintained, in all material respects, effective internal control over financial reporting as of December 31, 2023, based on the COSO criteria.
We also have audited, in accordance with the standards of the Public Company Accounting Oversight Board (United States) (“PCAOB”), the 2023 consolidated financial statements of the Bank and our report dated February 23, 2024, expressed an unqualified opinion thereon.
Basis for Opinion
The Bank’s management is responsible for maintaining effective internal control over financial reporting and for its assessment of the effectiveness of internal control over financial reporting included in the accompanying Report on Management’s Assessment of Internal Control over Financial Reporting. Our responsibility is to express an opinion on the Bank’s internal control over financial reporting based on our audit. We are a public accounting firm registered with the PCAOB and are required to be independent with respect to the Bank in accordance with the U.S. federal securities laws and the applicable rules and regulations of the Securities and Exchange Commission and the PCAOB.
We conducted our audit in accordance with the standards of the PCAOB. Those standards require that we plan and perform the audit to obtain reasonable assurance about whether effective internal control over financial reporting was maintained in all material respects.
Our audit included obtaining an understanding of internal control over financial reporting, assessing the risk that a material weakness exists, testing and evaluating the design and operating effectiveness of internal control based on the assessed risk, and performing such other procedures as we considered necessary in the circumstances. We believe that our audit provides a reasonable basis for our opinion.
Definition and Limitations of Internal Control Over Financial Reporting
A company’s internal control over financial reporting is a process designed to provide reasonable assurance regarding the reliability of financial reporting and the preparation of financial statements for external purposes in accordance with generally accepted accounting principles. A company’s internal control over financial reporting includes those policies and procedures that (1) pertain to the maintenance of records that, in reasonable detail, accurately and fairly reflect the transactions and dispositions of the assets of the company; (2) provide reasonable assurance that transactions are recorded as necessary to permit preparation of financial statements in accordance with generally accepted accounting principles, and that receipts and expenditures of the company are being made only in accordance with authorizations of management and directors of the company; and (3) provide reasonable assurance regarding prevention or timely detection of unauthorized acquisition, use, or disposition of the company’s assets that could have a material effect on the financial statements.
Because of its inherent limitations, internal control over financial reporting may not prevent or detect misstatements. Also, projections of any evaluation of effectiveness to future periods are subject to the risk that controls may become inadequate because of changes in conditions, or that the degree of compliance with the policies or procedures may deteriorate.
/s/ Ernst & Young LLP
Salt Lake City, Utah
February 23, 2024
ZIONS BANCORPORATION, NATIONAL ASSOCIATION AND SUBSIDIARIES
REPORT ON CONSOLIDATED FINANCIAL STATEMENTS
To the Shareholders and the Board of Directors of Zions Bancorporation, National Association
Opinion on the Financial Statements
We have audited the accompanying consolidated balance sheets of Zions Bancorporation, National Association (“the Bank”) as of December 31, 2023 and 2022, the related consolidated statements of income, comprehensive income (loss), changes in shareholders’ equity, and cash flows for each of the three years in the period ended December 31, 2023, and the related notes (collectively referred to as the “consolidated financial statements”). In our opinion, the consolidated financial statements present fairly, in all material respects, the financial position of the Bank at December 31, 2023 and 2022, and the results of its operations and its cash flows for each of the three years in the period ended December 31, 2023, in conformity with U.S. generally accepted accounting principles.
We also have audited, in accordance with the standards of the Public Company Accounting Oversight Board (United States) (“PCAOB”), the Bank’s internal control over financial reporting as of December 31, 2023, based on criteria established in Internal Control-Integrated Framework issued by the Committee of Sponsoring Organizations of the Treadway Commission (2013 framework), and our report dated February 23, 2024 expressed an unqualified opinion thereon.
Basis for Opinion
These financial statements are the responsibility of the Bank’s management. Our responsibility is to express an opinion on the Bank’s financial statements based on our audits. We are a public accounting firm registered with the PCAOB and are required to be independent with respect to the Bank in accordance with the U.S. federal securities laws and the applicable rules and regulations of the Securities and Exchange Commission and the PCAOB.
We conducted our audits in accordance with the standards of the PCAOB. Those standards require that we plan and perform the audit to obtain reasonable assurance about whether the financial statements are free of material misstatement, whether due to error or fraud. Our audits included performing procedures to assess the risks of material misstatement of the financial statements, whether due to error or fraud, and performing procedures that respond to those risks. Such procedures included examining, on a test basis, evidence regarding the amounts and disclosures in the financial statements. Our audits also included evaluating the accounting principles used and significant estimates made by management, as well as evaluating the overall presentation of the financial statements. We believe that our audits provide a reasonable basis for our opinion.
Critical Audit Matter
The critical audit matter communicated below is a matter arising from the current period audit of the financial statements that was communicated or required to be communicated to the audit committee and that: (1) relates to accounts or disclosures that are material to the financial statements and (2) involved our especially challenging, subjective or complex judgments. The communication of the critical audit matter does not alter in any way our opinion on the consolidated financial statements, taken as a whole, and we are not, by communicating the critical audit matter below, providing a separate opinion on the critical audit matter or on the account and the disclosures to which it relates.
ZIONS BANCORPORATION, NATIONAL ASSOCIATION AND SUBSIDIARIES
Allowance for loan and lease losses
|
|
|
|
|
|
| Description of the Matter |
The Bank’s loan and lease portfolio and the associated allowance for loan and lease losses (ALLL), were $57.8 billion and $684 million as of December 31, 2023, respectively. The provision for loan and lease losses was $148 million for the year ended December 31, 2023.
As discussed in Note 1 and 6 to the consolidated financial statements, the ALLL represented the Bank’s estimate of current expected credit losses over the contractual remaining life of the loan and lease portfolio as of the consolidated balance sheet date. Management’s ALLL estimate includes quantitative calculations based on the statistical analysis of historical loss experience dependent on weighted economic scenarios and other loan-level characteristics forecasted over a reasonable period, losses estimated using historical loss experience for periods outside the reasonable economic forecast period (collectively the quantitative portion), supplemented with qualitative adjustments that bring the ALLL to the level management deemed appropriate based on factors that are not fully considered in the quantitative analysis. The statistical analysis of historical loss experience was derived from credit loss models used to determine the quantitative portion of the ALLL. Judgment was required by management to determine the weightings of the economic scenarios and the magnitude of the impact of the qualitative adjustments to the ALLL.
Auditing management’s ALLL estimate is complex due to the judgment used to weigh the economic scenarios and the judgment involved in determining the magnitude of the impact of the various risk factors used to derive the qualitative adjustments to the ALLL.
|
|
|
| How We Addressed the Matter in Our Audit |
We obtained an understanding, evaluated the design, and tested the operating effectiveness of controls that address the risk of material misstatement in determining the weightings of the economic scenarios and in determining the impact of the qualitative adjustments to the ALLL. We tested controls over the Bank’s ALLL governance process, model development and model risk management as it relates to the credit loss models used in the ALLL process. Such testing included testing controls over model governance, controls over data input into the models, and controls over model calculation accuracy and observing key management meetings where weightings of the economic scenarios and the magnitude of qualitative adjustments are reviewed and approved. |
|
|
|
To test the reasonableness of the weightings of the economic scenarios, our procedures consisted of obtaining an understanding of the forecasted economic scenarios used, including agreeing the economic scenarios to third party published data and economic scenarios developed from market information as well as evaluating management’s methodology. We also performed analytical procedures and sensitivity analyses on the weightings of the economic scenarios and searched for and evaluated information that corroborated or contradicted these weightings. |
|
|
|
Regarding the completeness of qualitative adjustments identified and incorporated into measuring the ALLL, we evaluated the potential impact of imprecision in the credit loss models and emerging risks related to changes in the economic environment impacting the Bank’s loan and lease portfolio. We also evaluated and tested internal and external data used in the qualitative adjustments by agreeing significant inputs and underlying data to internal and external sources. |
|
|
|
Further, we assessed whether the total amount of the ALLL estimate was consistent with the Bank’s historical loss information, peer bank information, credit quality statistics, subsequent events and transactions, and publicly observable indicators of macroeconomic financial conditions and whether the total ALLL amount was reflective of current expected losses in the loan and lease portfolio as of the consolidated balance sheet date. |
/s/ Ernst & Young LLP
We have served as the Bank’s auditor since 2000.
Salt Lake City, Utah
February 23, 2024
ZIONS BANCORPORATION, NATIONAL ASSOCIATION AND SUBSIDIARIES
CONSOLIDATED BALANCE SHEETS
|
|
|
|
|
|
|
|
|
|
|
|
| (In millions, shares in thousands) |
December 31, |
| 2023 |
|
2022 |
| ASSETS |
|
|
|
| Cash and due from banks |
$ |
716 |
|
|
$ |
657 |
|
| Money market investments: |
|
|
|
| Interest-bearing deposits |
1,488 |
|
|
1,340 |
|
| Federal funds sold and securities purchased under agreements to resell |
937 |
|
|
2,426 |
|
| Investment securities: |
|
|
|
Held-to-maturity, at amortized cost (fair value $10,466 and $11,239) |
10,382 |
|
|
11,126 |
|
| Available-for-sale, at fair value |
10,300 |
|
|
11,915 |
|
| Trading account, at fair value |
48 |
|
|
465 |
|
| Total investment securities |
20,730 |
|
|
23,506 |
|
| Loans held for sale |
53 |
|
|
8 |
|
| Loans and leases, net of unearned income and fees |
57,779 |
|
|
55,653 |
|
| Less allowance for loan and lease losses |
684 |
|
|
575 |
|
| Loans, net of allowance |
57,095 |
|
|
55,078 |
|
| Other noninterest-bearing investments |
950 |
|
|
1,130 |
|
| Premises, equipment and software, net |
1,400 |
|
|
1,408 |
|
| Goodwill and intangibles |
1,059 |
|
|
1,065 |
|
| Other real estate owned |
6 |
|
|
3 |
|
| Other assets |
2,769 |
|
|
2,924 |
|
| Total assets |
$ |
87,203 |
|
|
$ |
89,545 |
|
| LIABILITIES AND SHAREHOLDERS’ EQUITY |
|
|
|
| Deposits: |
|
|
|
| Noninterest-bearing demand |
$ |
26,244 |
|
|
$ |
35,777 |
|
| Interest-bearing: |
|
|
|
| Savings and money market |
38,721 |
|
|
33,566 |
|
| Time |
9,996 |
|
|
2,309 |
|
|
|
|
|
| Total deposits |
74,961 |
|
|
71,652 |
|
| Federal funds and other short-term borrowings |
4,379 |
|
|
10,417 |
|
| Long-term debt |
542 |
|
|
651 |
|
| Reserve for unfunded lending commitments |
45 |
|
|
61 |
|
| Other liabilities |
1,585 |
|
|
1,871 |
|
| Total liabilities |
81,512 |
|
|
84,652 |
|
| Shareholders’ equity: |
|
|
|
Preferred stock, without par value; authorized 4,400 shares |
440 |
|
|
440 |
|
Common stock ($0.001 par value; authorized 350,000 shares; issued and outstanding 148,153 and 148,664 shares and additional paid-in capital) |
1,731 |
|
|
1,754 |
|
| Retained earnings |
6,212 |
|
|
5,811 |
|
| Accumulated other comprehensive income |
(2,692) |
|
|
(3,112) |
|
|
|
|
|
|
|
|
|
| Total shareholders’ equity |
5,691 |
|
|
4,893 |
|
| Total liabilities and shareholders’ equity |
$ |
87,203 |
|
|
$ |
89,545 |
|
See accompanying notes to consolidated financial statements.
ZIONS BANCORPORATION, NATIONAL ASSOCIATION AND SUBSIDIARIES
CONSOLIDATED STATEMENTS OF INCOME
|
|
|
|
|
|
|
|
|
|
|
|
|
|
|
|
|
|
| (In millions, except shares and per share amounts) |
Year Ended December 31, |
| 2023 |
|
2022 |
|
2021 |
| Interest income: |
|
|
|
|
|
| Interest and fees on loans |
$ |
3,196 |
|
|
$ |
2,112 |
|
|
$ |
1,935 |
|
| Interest on money market investments |
188 |
|
|
81 |
|
|
21 |
|
| Interest on securities |
563 |
|
|
512 |
|
|
311 |
|
| Total interest income |
3,947 |
|
|
2,705 |
|
|
2,267 |
|
| Interest expense: |
|
|
|
|
|
| Interest on deposits |
1,063 |
|
|
70 |
|
|
30 |
|
| Interest on short- and long-term borrowings |
446 |
|
|
115 |
|
|
29 |
|
| Total interest expense |
1,509 |
|
|
185 |
|
|
59 |
|
| Net interest income |
2,438 |
|
|
2,520 |
|
|
2,208 |
|
| Provision for credit losses: |
|
|
|
|
|
| Provision for loan losses |
148 |
|
|
101 |
|
|
(258) |
|
| Provision for unfunded lending commitments |
(16) |
|
|
21 |
|
|
(18) |
|
| Total provision for credit losses |
132 |
|
|
122 |
|
|
(276) |
|
| Net interest income after provision for credit losses |
2,306 |
|
|
2,398 |
|
|
2,484 |
|
| Noninterest income: |
|
|
|
|
|
| Commercial account fees |
174 |
|
|
159 |
|
|
137 |
|
| Card fees |
101 |
|
|
104 |
|
|
95 |
|
| Retail and business banking fees |
66 |
|
|
73 |
|
|
74 |
|
| Loan-related fees and income |
79 |
|
|
80 |
|
|
95 |
|
| Capital markets fees |
81 |
|
|
83 |
|
|
70 |
|
| Wealth management fees |
58 |
|
|
55 |
|
|
50 |
|
|
|
|
|
|
|
| Other customer-related fees |
61 |
|
|
60 |
|
|
54 |
|
| Customer-related noninterest income |
620 |
|
|
614 |
|
|
575 |
|
| Fair value and nonhedge derivative income (loss) |
(4) |
|
|
16 |
|
|
14 |
|
| Dividends and other income |
57 |
|
|
17 |
|
|
43 |
|
| Securities gains (losses), net |
4 |
|
|
(15) |
|
|
71 |
|
| Total noninterest income |
677 |
|
|
632 |
|
|
703 |
|
| Noninterest expense: |
|
|
|
|
|
| Salaries and employee benefits |
1,275 |
|
|
1,235 |
|
|
1,127 |
|
| Technology, telecom, and information processing |
240 |
|
|
209 |
|
|
199 |
|
| Occupancy and equipment, net |
160 |
|
|
152 |
|
|
153 |
|
| Professional and legal services |
62 |
|
|
57 |
|
|
72 |
|
| Marketing and business development |
46 |
|
|
39 |
|
|
43 |
|
| Deposit insurance and regulatory expense |
169 |
|
|
50 |
|
|
34 |
|
| Credit-related expense |
26 |
|
|
30 |
|
|
26 |
|
| Other real estate expense, net |
— |
|
|
1 |
|
|
— |
|
| Other |
119 |
|
|
105 |
|
|
87 |
|
| Total noninterest expense |
2,097 |
|
|
1,878 |
|
|
1,741 |
|
| Income before income taxes |
886 |
|
|
1,152 |
|
|
1,446 |
|
| Income taxes |
206 |
|
|
245 |
|
|
317 |
|
| Net income |
680 |
|
|
907 |
|
|
1,129 |
|
|
|
|
|
|
|
|
|
|
|
|
|
| Preferred stock dividends |
(32) |
|
|
(29) |
|
|
(29) |
|
|
|
|
|
|
|
| Net earnings applicable to common shareholders |
$ |
648 |
|
|
$ |
878 |
|
|
$ |
1,100 |
|
| Weighted average common shares outstanding during the year: |
|
|
|
|
|
| Basic shares (in thousands) |
147,748 |
|
|
150,064 |
|
|
159,913 |
|
| Diluted shares (in thousands) |
147,756 |
|
|
150,271 |
|
|
160,234 |
|
| Net earnings per common share: |
|
|
|
|
|
| Basic |
$ |
4.35 |
|
|
$ |
5.80 |
|
|
$ |
6.80 |
|
| Diluted |
4.35 |
|
|
5.79 |
|
|
6.79 |
|
See accompanying notes to consolidated financial statements.
ZIONS BANCORPORATION, NATIONAL ASSOCIATION AND SUBSIDIARIES
CONSOLIDATED STATEMENTS OF COMPREHENSIVE INCOME (LOSS)
|
|
|
|
|
|
|
|
|
|
|
|
|
|
|
|
|
|
| (In millions) |
Year Ended December 31, |
| 2023 |
|
2022 |
|
2021 |
|
|
|
|
|
|
| Net income |
$ |
680 |
|
|
$ |
907 |
|
|
$ |
1,129 |
|
| Other comprehensive income (loss), net of tax: |
|
|
|
|
|
| Net unrealized holding gains (losses) on investment securities |
66 |
|
|
(2,762) |
|
|
(336) |
|
| Unrealized loss amortization associated with the securities transferred from AFS to HTM |
208 |
|
|
40 |
|
|
— |
|
Net unrealized gains (losses) on other noninterest-bearing investments |
1 |
|
|
(2) |
|
|
3 |
|
Net unrealized holding gains (losses) on derivative instruments |
21 |
|
|
(330) |
|
|
(26) |
|
Reclassification adjustment for decrease (increase) in interest income recognized in earnings on derivative instruments |
124 |
|
|
21 |
|
|
(46) |
|
Pension and post-retirement |
— |
|
|
1 |
|
|
— |
|
|
|
|
|
|
|
| Other comprehensive income (loss), net of tax |
420 |
|
|
(3,032) |
|
|
(405) |
|
| Comprehensive income (loss) |
$ |
1,100 |
|
|
$ |
(2,125) |
|
|
$ |
724 |
|
See accompanying notes to consolidated financial statements.
ZIONS BANCORPORATION, NATIONAL ASSOCIATION AND SUBSIDIARIES
CONSOLIDATED STATEMENTS OF CHANGES IN SHAREHOLDERS’ EQUITY
|
|
|
|
|
|
|
|
|
|
|
|
|
|
|
|
|
|
|
|
|
|
|
|
|
|
|
|
|
|
|
|
|
|
|
|
|
|
(In millions, except shares
and per share amounts) |
Preferred
stock |
|
Common stock shares
(in thousands)
|
|
|
|
Accumulated paid-in capital |
|
Retained earnings |
|
Accumulated
other
comprehensive income (loss) |
|
Total
shareholders’ equity |
|
|
|
|
|
|
|
|
|
|
|
|
|
|
|
|
|
|
|
|
| Balance at December 31, 2020 |
$ |
566 |
|
|
164,090 |
|
|
|
|
$ |
2,686 |
|
|
$ |
4,309 |
|
|
$ |
325 |
|
|
$ |
7,886 |
|
Net income |
|
|
|
|
|
|
|
|
1,129 |
|
|
|
|
1,129 |
|
|
|
|
|
|
|
|
|
|
|
|
|
|
|
|
|
|
|
|
|
|
|
|
|
|
|
|
|
Other comprehensive loss, net of tax |
|
|
|
|
|
|
|
|
|
|
(405) |
|
|
(405) |
|
|
|
|
|
|
|
|
|
|
|
|
|
|
|
Bank common stock repurchased |
|
|
(13,521) |
|
|
|
|
(800) |
|
|
|
|
|
|
(800) |
|
| Preferred stock redemption |
(126) |
|
|
|
|
|
|
3 |
|
(3) |
|
|
|
|
(126) |
|
Net activity under employee plans and related tax benefits |
|
|
1,056 |
|
|
|
|
39 |
|
|
|
|
|
39 |
|
Dividends on preferred stock |
|
|
|
|
|
|
|
|
(29) |
|
|
|
|
(29) |
|
Dividends on common stock, $1.44 per share |
|
|
|
|
|
|
|
|
(232) |
|
|
|
|
(232) |
|
| Change in deferred compensation |
|
|
|
|
|
|
|
|
1 |
|
|
|
|
1 |
|
| Balance at December 31, 2021 |
440 |
|
|
151,625 |
|
|
|
|
1,928 |
|
|
5,175 |
|
|
(80) |
|
|
7,463 |
|
Net income |
|
|
|
|
|
|
|
|
907 |
|
|
|
|
907 |
|
|
|
|
|
|
|
|
|
|
|
|
|
|
|
Other comprehensive loss, net of tax |
|
|
|
|
|
|
|
|
|
|
(3,032) |
|
|
(3,032) |
|
Bank common stock repurchased |
|
|
(3,581) |
|
|
|
|
(202) |
|
|
|
|
|
|
(202) |
|
|
|
|
|
|
|
|
|
|
|
|
|
|
|
Net activity under employee plans and related tax benefits |
|
|
620 |
|
|
|
|
28 |
|
|
|
|
|
28 |
|
Dividends on preferred stock |
|
|
|
|
|
|
|
|
(29) |
|
|
|
|
(29) |
|
Dividends on common stock, $1.58 per share |
|
|
|
|
|
|
|
|
(240) |
|
|
|
|
(240) |
|
| Change in deferred compensation |
|
|
|
|
|
|
|
|
(2) |
|
|
|
|
(2) |
|
| Balance at December 31, 2022 |
440 |
|
|
148,664 |
|
|
|
|
1,754 |
|
|
5,811 |
|
|
(3,112) |
|
|
4,893 |
|
Net income |
|
|
|
|
|
|
|
|
680 |
|
|
|
|
680 |
|
Cumulative effect adjustment, adoption of ASU 2022-02, Financial Instruments - Credit Losses: Troubled Debt Restructurings |
|
|
|
|
|
|
|
|
2 |
|
|
|
|
2 |
|
Other comprehensive income, net of tax |
|
|
|
|
|
|
|
|
|
|
420 |
|
|
420 |
|
Bank common stock repurchased |
|
|
(972) |
|
|
|
|
(51) |
|
|
|
|
|
|
(51) |
|
|
|
|
|
|
|
|
|
|
|
|
|
|
|
Net activity under employee plans and related tax benefits |
|
|
461 |
|
|
|
|
28 |
|
|
|
|
|
|
28 |
|
Dividends on preferred stock |
|
|
|
|
|
|
|
|
(32) |
|
|
|
|
(32) |
|
Dividends on common stock, $1.64 per share |
|
|
|
|
|
|
|
|
(245) |
|
|
|
|
(245) |
|
| Change in deferred compensation |
|
|
|
|
|
|
|
|
(4) |
|
|
|
|
(4) |
|
| Balance at December 31, 2023 |
$ |
440 |
|
|
148,153 |
|
|
|
|
$ |
1,731 |
|
|
$ |
6,212 |
|
|
$ |
(2,692) |
|
|
$ |
5,691 |
|
See accompanying notes to consolidated financial statements.
ZIONS BANCORPORATION, NATIONAL ASSOCIATION AND SUBSIDIARIES
CONSOLIDATED STATEMENTS OF CASH FLOWS
|
|
|
|
|
|
|
|
|
|
|
|
|
|
|
|
|
|
| (In millions) |
Year Ended December 31, |
| 2023 |
|
2022 |
|
2021 |
| CASH FLOWS FROM OPERATING ACTIVITIES |
|
|
|
|
|
| Net income |
$ |
680 |
|
|
$ |
907 |
|
|
$ |
1,129 |
|
| Adjustments to reconcile net income to net cash provided by operating activities: |
|
|
|
|
|
Provision for credit losses |
132 |
|
|
122 |
|
|
(276) |
|
Depreciation and amortization |
140 |
|
|
110 |
|
|
(14) |
|
Share-based compensation |
33 |
|
|
30 |
|
|
28 |
|
Deferred income tax expense (benefit) |
(9) |
|
|
(43) |
|
|
32 |
|
Net decrease (increase) in trading securities |
22 |
|
|
(93) |
|
|
(107) |
|
Net decrease (increase) in loans held for sale |
(40) |
|
|
48 |
|
|
14 |
|
Change in other liabilities |
(299) |
|
|
892 |
|
|
13 |
|
Change in other assets |
169 |
|
|
(457) |
|
|
(78) |
|
Other, net |
57 |
|
|
(46) |
|
|
(112) |
|
| Net cash provided by operating activities |
885 |
|
|
1,470 |
|
|
629 |
|
| CASH FLOWS FROM INVESTING ACTIVITIES |
|
|
|
|
|
| Net decrease (increase) in money market investments |
1,736 |
|
|
8,650 |
|
|
(5,577) |
|
| Proceeds from maturities and paydowns of investment securities held-to-maturity |
1,052 |
|
|
445 |
|
|
457 |
|
| Purchases of investment securities held-to-maturity |
(41) |
|
|
(399) |
|
|
(262) |
|
|
Proceeds from sales, maturities, and paydowns of investment securities
available-for-sale
|
2,337 |
|
|
3,309 |
|
|
4,748 |
|
| Purchases of investment securities available-for-sale |
(666) |
|
|
(5,829) |
|
|
(13,647) |
|
| Net change in loans and leases |
(2,103) |
|
|
(4,628) |
|
|
2,814 |
|
| Purchases and sales of other noninterest-bearing investments |
183 |
|
|
(298) |
|
|
63 |
|
| Purchases of premises and equipment |
(113) |
|
|
(190) |
|
|
(206) |
|
| Acquisition of Nevada branches, net of cash acquired |
— |
|
|
318 |
|
|
— |
|
Other, net |
(15) |
|
|
27 |
|
|
31 |
|
| Net cash provided by (used in) investing activities |
2,370 |
|
|
1,405 |
|
|
(11,579) |
|
| CASH FLOWS FROM FINANCING ACTIVITIES |
|
|
|
|
|
| Net increase (decrease) in deposits |
3,309 |
|
|
(11,567) |
|
|
13,136 |
|
| Net change in short-term funds borrowed |
(6,038) |
|
|
9,514 |
|
|
(669) |
|
|
|
|
|
|
|
|
|
|
|
|
|
| Cash paid for preferred stock redemption |
— |
|
|
— |
|
|
(126) |
|
| Redemption of long-term debt |
(128) |
|
|
(290) |
|
|
(286) |
|
|
|
|
|
|
|
| Proceeds from the issuance of common stock |
3 |
|
|
9 |
|
|
21 |
|
| Dividends paid on common and preferred stock |
(282) |
|
|
(269) |
|
|
(261) |
|
| Bank common stock repurchased |
(51) |
|
|
(202) |
|
|
(800) |
|
| Other, net |
(9) |
|
|
(8) |
|
|
(13) |
|
| Net cash provided by (used in) financing activities |
(3,196) |
|
|
(2,813) |
|
|
11,002 |
|
| Net increase in cash and due from banks |
59 |
|
|
62 |
|
|
52 |
|
| Cash and due from banks at beginning of year |
657 |
|
|
595 |
|
|
543 |
|
| Cash and due from banks at end of year |
$ |
716 |
|
|
$ |
657 |
|
|
$ |
595 |
|
|
|
|
|
|
|
| Cash paid for interest |
$ |
1,368 |
|
|
$ |
160 |
|
|
$ |
81 |
|
| Net cash paid for income taxes |
255 |
|
|
21 |
|
|
442 |
|
Noncash activities: |
|
|
|
|
|
| Loans held for investment transferred to other real estate owned |
— |
|
|
— |
|
|
25 |
|
| Loans held for investment reclassified to loans held for sale, net |
68 |
|
|
114 |
|
|
120 |
|
| Trading securities reclassified to money market investments |
395 |
|
|
— |
|
|
— |
|
Investment securities available-for-sale transferred to held-to-maturity, at amortized cost (fair value $10,691) |
— |
|
|
13,097 |
|
|
— |
|
| Deposits acquired in purchase of Nevada branches |
— |
|
|
430 |
|
|
— |
|
| Loans acquired in purchase of Nevada branches, net |
— |
|
|
95 |
|
|
— |
|
See accompanying notes to consolidated financial statements.
ZIONS BANCORPORATION, NATIONAL ASSOCIATION AND SUBSIDIARIES
NOTES TO CONSOLIDATED FINANCIAL STATEMENTS
December 31, 2023
1.SUMMARY OF SIGNIFICANT ACCOUNTING POLICIES
Business
Zions Bancorporation, National Association (“Zions Bancorporation, N.A.,” “the Bank,” “we,” “our,” “us”) is a bank headquartered in Salt Lake City, Utah. We provide a wide range of banking products and related services in 11 Western and Southwestern states through seven separately managed affiliates: Zions Bank in Utah, Idaho, and Wyoming; California Bank & Trust (“CB&T”); Amegy Bank (“Amegy”) in Texas; National Bank of Arizona (“NBAZ”); Nevada State Bank (“NSB”); Vectra Bank Colorado (“Vectra”) in Colorado and New Mexico; and The Commerce Bank of Washington (“TCBW”) which operates under that name in Washington and under The Commerce Bank of Oregon in Oregon.
Basis of Financial Statement Presentation and Principles of Consolidation
The consolidated financial statements include our accounts and those of our majority-owned, consolidated subsidiaries. Unconsolidated investments where we have the ability to exercise significant influence over the operating and financial policies of the respective investee are accounted for using the equity method of accounting. All intercompany accounts and transactions have been eliminated in consolidation. Assets held in an agency or fiduciary capacity are not included in the consolidated financial statements.
The consolidated financial statements have been prepared in accordance with United States (“U.S.”) generally accepted accounting principles (“GAAP”) and prevailing practices within the financial services industry. References to GAAP, including standards promulgated by the Financial Accounting Standards Board (“FASB”), are made according to sections of the Accounting Standards Codification (“ASC”).
In preparing the consolidated financial statements, we are required to make estimates and assumptions that affect the amounts reported in the financial statements and accompanying notes. Actual results could differ from those estimates.
Subsequent Events
We evaluated events that occurred between December 31, 2023 and the date the accompanying financial statements were issued, and determined that there were no material events that would require adjustments to our consolidated financial statements or significant disclosure in the accompanying Notes.
Variable Interest Entities
A variable interest entity (“VIE”) is consolidated when we are the primary beneficiary of the VIE. Current accounting guidance requires continuous analysis to determine the primary beneficiary of a VIE. At the commencement of our involvement, and periodically thereafter, we consider our consolidation conclusions for all entities with which we are involved. At December 31, 2023, and 2022, we had no VIEs that have been consolidated in our financial statements.
Statement of Cash Flows
For purposes of presentation on the consolidated statements of cash flows, “cash and cash equivalents” are defined as those amounts included in “Cash and due from banks” on the consolidated balance sheets.
Fair Value Estimates
We measure many of our assets and liabilities on a fair value basis. Fair value is the price that would be received to sell an asset or paid to transfer a liability in an orderly transaction between market participants. To increase consistency and comparability in fair value measurements, we prioritize valuation inputs in accordance with a three-level hierarchy. We prioritize quoted prices in active markets and minimize reliance on unobservable inputs when possible. When observable market prices are not available, fair value is estimated using modeling techniques requiring professional judgment to estimate the appropriate fair value. We believe we use assumptions that market participants would consider in pricing the asset or the liability.
ZIONS BANCORPORATION, NATIONAL ASSOCIATION AND SUBSIDIARIES
Changes in market conditions may reduce the availability of quoted prices or observable data. See Note 3 for further information regarding the use of fair value estimates.
Securities Purchased Under Agreements to Resell
Securities purchased under agreements to resell represent overnight and term agreements with the majority maturing within 30 days. These agreements are generally treated as collateralized financing transactions and are carried at amounts at which the securities were acquired plus accrued interest. We, or in some instances third parties on our behalf, take possession of the underlying securities. The fair value of such securities is monitored throughout the contract term to ensure that asset values remain sufficient to protect against counterparty default. We are permitted by contract to sell or repledge certain securities that we accept as collateral for securities purchased under agreements to resell. If sold, our obligation to return the collateral is recorded as “securities sold, not yet purchased” and included as a liability in “Federal funds and other short-term borrowings” on the consolidated balance sheet. At December 31, 2023, and 2022, we held $877 million and $2.3 billion of securities for which we were permitted by contract to sell or repledge, respectively. Securities purchased under agreements to resell averaged $1.3 billion and $2.4 billion during 2023 and 2022, and the maximum amount outstanding at any month-end during those same time periods was $2.0 billion and $2.7 billion, respectively.
Investment Securities
We classify our investment securities according to their purpose and holding period. Gains or losses on the sale of securities are recognized using the specific identification method and recorded in noninterest income.
Held-to-maturity (“HTM”) debt securities are carried at amortized cost with purchase discounts or premiums accreted or amortized into interest income over the contractual life of the security. We have the intent and ability to hold such securities until maturity. For HTM securities, the allowance for credit losses (“ACL”) is assessed consistent with the approach described in Note 6 for loans carried at amortized cost.
Available-for-sale (“AFS”) securities are measured at fair value and generally consist of debt securities held for investment. Unrealized gains and losses of AFS securities, after applicable taxes, are recorded as a component of other comprehensive income (“OCI”). AFS securities in an unrealized loss position are formally reviewed on a quarterly basis for the presence of credit impairment. If we have the intent to sell an identified security, or it is more likely than not we will be required to sell the security before recovery of its amortized cost basis, we write the amortized cost down to the security’s fair value at the reporting date through earnings. If we have the intent and ability to hold the securities, they are analyzed to determine whether any impairment was attributable to credit-related factors. If a credit impairment is determined to exist, then we measure the amount of credit loss and recognize an allowance for the credit loss. In measuring the credit loss, we generally compare the present value of cash flows expected to be collected from the security to the amortized cost basis of the security. These cash flows are credit adjusted using, among other things, assumptions for default probability and loss severity. Certain other inputs, such as prepayment rate assumptions, are also utilized. In addition, certain internal models may be utilized. To determine the credit-related portion of impairment, we use the security-specific effective interest rate when estimating the present value of cash flows. If the present value of cash flows is less than the amortized cost basis of the security, then this amount is recorded as an allowance for credit loss, limited to the amount that the fair value is less than the amortized cost basis (i.e., the credit impairment cannot result in the security being carried at an amount lower than its fair value). The process, methodology, and factors considered to evaluate securities for impairment are described further in Note 5. See also Note 3 for further information regarding the measurement of our investment securities at fair value.
When a security is transferred from AFS to HTM, the difference between its amortized cost basis and fair value at the date of transfer is amortized as a yield adjustment through interest income, and the fair value at the date of transfer results in either a premium or discount to the amortized cost basis of the HTM securities. The amortization of unrealized losses reported in accumulated other comprehensive income (“AOCI”) will offset the effect of the amortization of the premium or discount in interest income that is created by the transfer.
ZIONS BANCORPORATION, NATIONAL ASSOCIATION AND SUBSIDIARIES
Leases
All leases with lease terms greater than twelve months are reported as a lease liability with a corresponding right-of-use (“ROU”) asset. We include ROU assets for operating leases and finance leases in “Other assets,” and “Premises, equipment and software, net” on the consolidated balance sheet, respectively. The corresponding liabilities for those leases are included in “Other liabilities,” and “Long-term debt” on the consolidated balance sheet, respectively. See Note 8 for further information regarding the accounting for leases.
Loans
Loans are reported at their amortized cost basis, which includes the principal amount outstanding, net of unamortized purchase premiums, discounts, and deferred loan fees and costs, which are amortized into interest income over the life of the loan using the interest method.
At the time of origination, we generally determine whether loans are held for investment or held for sale. We may subsequently change our intent for a loan or group of loans and reclassify them accordingly. Loans held for sale are carried at the lower of aggregate cost or fair value. A valuation allowance is recorded when cost exceeds fair value based on reviews at the time of reclassification and periodically thereafter. Associated gains and losses are calculated based on the difference between sales proceeds and carrying value, and are included in “Loan-related fees and income” on the consolidated statement of income.
We evaluate loans throughout their lives for indications of credit deterioration, which may impact the loan status, risk-grading, and potentially impact the accounting for that loan. Loan status categories include past due as to contractual payments, accruing or nonaccruing, and modified or restructured, including troubled debt restructurings (“TDRs”), which were no longer identified after the adoption of Accounting Standards Update (“ASU”) 2022-02, Financial Instruments—Credit Losses (Topic 326): Troubled Debt Restructurings and Vintage Disclosures, beginning January 1, 2023 as discussed in Note 2. Our accounting policies for loans and our estimation of the related ACL are described further in Note 6.
In the ordinary course of business, we may syndicate portions of loans or transfer portions of loans under participation agreements to manage credit risk and our portfolio concentration. We evaluate the loan participations to determine if they meet the appropriate accounting guidance to qualify as sales. Certain purchased loans require separate accounting procedures that are also described in Note 6.
We elect the fair value option for certain commercial real estate (“CRE”) loans that are intended for sale or securitization and are hedged with derivative instruments, as described further in Note 3.
Allowance for Credit Losses
The ACL, which consists of the allowance for loan and lease losses (“ALLL”) and the reserve for unfunded lending commitments (“RULC”), represents our estimate of current expected credit losses related to the loan and lease portfolio and unfunded lending commitments as of the balance sheet date. The ACL for debt securities is estimated separately from loans. See Note 6 for further discussion of our estimation process for the ACL.
Other Noninterest-bearing Investments
These investments include private equity investments (“PEIs”), venture capital securities, securities acquired for various debt and regulatory requirements, bank-owned life insurance (“BOLI”), and certain other noninterest-bearing investments. See further discussion in Note 3.
Certain PEIs and venture capital securities are accounted for under the equity method when we are able to exercise significant influence over the operating and financial policies of the investee. Equity investments in PEIs that do not give us significant influence are reported at fair value, unless there is not a readily determinable fair value. We have elected to measure PEIs without readily determinable fair values at cost less impairment (if any), plus or minus observable price changes from an identical or similar investment of the same issuer, referred to as the “measurement alternative.”
ZIONS BANCORPORATION, NATIONAL ASSOCIATION AND SUBSIDIARIES
Periodic reviews are conducted for impairment by comparing carrying values with estimates of fair value. Changes in fair value, impairment losses, and gains and losses from sales are included in “Securities gains (losses), net” on the consolidated statement of income.
BOLI is accounted for at fair value based on the cash surrender values (“CSVs”) of the general account insurance policies.
Premises, Equipment, and Software
Premises, equipment, and software are reported at cost, net of accumulated depreciation and amortization. Depreciation, computed primarily on the straight-line method, is charged to operations over the estimated useful lives of the properties, generally 25 to 40 years for buildings, three to 10 years for furniture and equipment, and three to 10 years for software, including capitalized costs related to our technology initiatives. Leasehold improvements are amortized over the terms of the respective leases (including any extension options that are reasonably certain to be exercised) or the estimated useful lives of the improvements, whichever is shorter. Premises, equipment, and software are evaluated for impairment on a periodic basis.
Goodwill and Intangible Assets
Goodwill is recorded at fair value at the time of its acquisition and is subsequently evaluated for impairment annually, or more frequently if conditions warrant.
Business Combinations
Business combinations are accounted for under the acquisition method of accounting. Upon initially obtaining control, we recognize 100% of all acquired assets and all assumed liabilities, regardless of the percentage owned. The assets and liabilities are recorded at their estimated fair values, with goodwill being recorded when such fair values are less than the cost of acquisition. Certain transaction and restructuring costs are expensed as incurred. Changes to estimated fair values from a business combination are recognized as an adjustment to goodwill over the measurement period, which cannot exceed one year from the acquisition date. Results of operations of acquired businesses are included on our statement of income from the date of acquisition.
Other Real Estate Owned
Other real estate owned (“OREO”) consists primarily of commercial and residential real estate acquired in partial or total satisfaction of loan obligations. Amounts are recorded initially at fair value (less estimated selling costs) based on recent property appraisals at the time of transfer and subsequently at the lower of cost or fair value (less estimated selling costs).
Derivative Instruments
We use derivative instruments such as swaps and purchased and sold options as an important tool in managing our asset and liability sensitivities to remain within our stated interest rate risk thresholds. Their use allows us to adjust and align our mix of fixed- and floating-rate assets and liabilities to manage interest income and expense volatility, the duration of our assets and liabilities, and other metrics, such as the economic value of equity, by synthetically converting variable-rate assets to fixed-rate, or synthetically converting variable-rate assets and liabilities to fixed rate, or synthetically converting fixed-rate assets and funding instruments to floating rates.
We also execute both interest rate and short-term foreign currency derivative instruments with our commercial banking customers to facilitate their risk management objectives. These derivatives are hedged by entering into offsetting derivatives with third parties such that we minimize our net risk exposure as a result of such transactions. We record all derivatives at fair value, and they are included in “Other assets” or “Other liabilities” on the consolidated balance sheet.
The accounting for the change in value of a derivative depends on whether or not the transaction has been designated and qualifies for hedge accounting. Derivatives that are not designated as hedges are reported and measured at fair value through earnings. See Note 7 for more information.
ZIONS BANCORPORATION, NATIONAL ASSOCIATION AND SUBSIDIARIES
Derivatives Designated in Qualifying Hedging Relationships
We apply hedge accounting to certain derivatives executed for risk management purposes, primarily interest rate risk. To qualify for hedge accounting, a derivative must be highly effective at reducing the risk associated with the exposure being hedged and the hedging relationship must be formally documented. We primarily use regression analysis to assess the effectiveness of each hedging relationship, unless the hedge qualifies for other methods of assessing effectiveness (e.g., shortcut or critical terms match), both at inception and on an ongoing basis. We designate derivatives as fair value and cash flow hedges for accounting purposes. See Note 7 for more information regarding the accounting for derivatives designated as hedging instruments.
Commitments and Letters of Credit
In the ordinary course of business, we enter into loan commitments, commercial letters of credit, and standby letters of credit. Such financial instruments are recorded in the financial statements when they are funded. The credit risk associated with these commitments is evaluated in a manner similar to the ALLL. The RULC is presented separately on the consolidated balance sheet.
Revenue Recognition
Revenue from contracts with customers is recognized when control of the promised goods or services is transferred to our customers, in an amount that reflects the consideration we expect to be entitled to in exchange for those goods or services. See Note 17 for further information regarding how we recognize revenue for contracts with customers.
Share-based Compensation
Share-based compensation generally includes grants of stock options, restricted stock, restricted stock units (“RSUs”), and other awards to employees and nonemployee directors. We record compensation expense based on the grant-date value of the associated share-based awards. See further discussion in Note 19.
Income Taxes
Deferred tax assets (“DTAs”) and deferred tax liabilities (“DTLs”) are determined based on temporary differences between financial statement asset and liability amounts and their respective tax basis, and are measured using enacted tax laws and rates. The effect of a change in tax rates on DTAs and DTLs is recognized into income in the period that includes the enactment date. DTAs are recognized insofar that management deems it more likely than not that they will be realized. Unrecognized tax benefits for uncertain tax positions primarily relate to tax credits on technology initiatives. See Note 20 for more information about the factors that impacted our effective tax rate, significant components of our DTAs and DTLs, including our assessment regarding valuation allowances and unrecognized tax benefits for uncertain tax positions.
Net Earnings Per Common Share
Net earnings per common share is based on net earnings applicable to common shareholders, which is net of preferred stock dividends. Basic net earnings per common share is based on the weighted average outstanding common shares during each year. Unvested share-based awards with rights to receive nonforfeitable dividends are considered participating securities and are included in the computation of basic earnings per share. Diluted net earnings per common share is based on the weighted average outstanding common shares during each year, including common stock equivalents. Stock options, restricted stock, RSUs, and stock warrants are converted to common stock equivalents using the more dilutive of the treasury stock method or the two-class method. Diluted net earnings per common share excludes common stock equivalents whose effect is antidilutive. See further discussion in Note 21.
ZIONS BANCORPORATION, NATIONAL ASSOCIATION AND SUBSIDIARIES
2. RECENT ACCOUNTING PRONOUNCEMENTS
|
|
|
|
|
|
|
|
|
|
|
|
|
|
|
|
|
|
|
|
|
Standard |
|
Description |
|
Effective date |
|
Effect on the financial statements or other significant matters |
|
|
|
|
|
|
|
| Standards not yet adopted by the Bank as of December 31, 2023 |
|
|
|
|
|
|
|
|
ASU 2022-03,
Fair Value Measurement (Topic 820): Fair Value Measurement of Equity Securities Subject to Contractual Sale Restrictions
|
|
This ASU clarifies that contractual restrictions prohibiting the sale of an equity security are not considered part of the unit of account of the equity security, and therefore, are not considered in measuring fair value. The amendments clarify that an entity cannot recognize and measure a contractual sale restriction as a separate unit of account. The amendments in this ASU also require additional qualitative and quantitative disclosures for equity securities subject to contractual sale restrictions.
|
|
January 1, 2024 |
|
The requirements of this ASU are consistent with our current treatment of equity securities subject to contractual sale restrictions and are not expected to impact the fair value measurements of these securities.
The overall effect of this standard is not expected to have a material impact on our financial statements.
|
|
|
|
|
|
|
|
|
ASU 2023-02,
Investments—Equity Method and Joint Ventures (Topic 323): Accounting for Investments in Tax Credit Structures Using the Proportional Amortization Method (a consensus of the Emerging Issues Task Force)
|
|
This ASU expands the optional use of the proportional amortization method (“PAM”), previously limited to investments in low-income housing tax credit (“LIHTC”) structures, to any eligible equity investments made primarily for the purpose of receiving income tax credit and other tax benefits when certain criteria are met. PAM results in the cost of the investment being amortized in proportion to the income tax credits and other income tax benefits received, with the amortization of the investment and the income tax credits being presented net on the consolidated statement of income as a component of income tax expense (benefit).
This ASU allows for an accounting policy election to apply PAM on a tax-credit-program-by-tax-credit-program basis. The ASU also includes additional disclosure requirements about equity investments accounted for using PAM. |
|
January 1, 2024 |
|
We do not currently have any additional equity investments that are eligible for PAM under the provisions of this ASU.
The overall effect of this standard is not expected to have a material impact on our financial statements.
|
|
|
|
|
|
|
|
ASU 2023-07, Segment Reporting (Topic 280): Improvements to Reportable Segment Disclosures |
|
This ASU expands operating segment disclosures and requires all segment disclosures to be reported in both annual and interim periods. The new standard requires disclosure of the following:
•Significant segment expenses that are regularly provided to the chief operating decision maker (“CODM”) for reportable segments;
•The title and position of the CODM as well as how the CODM uses the reported measure(s) of profit and loss to assess segment performance; and
•“Other segment items” by reportable segment and a description of its composition.
|
|
Annual periods beginning January 1, 2024; Interim periods beginning January 1, 2025 |
|
The overall effect of this standard is not expected to have a material impact on our financial statements.
|
|
|
|
|
|
|
|
ZIONS BANCORPORATION, NATIONAL ASSOCIATION AND SUBSIDIARIES
|
|
|
|
|
|
|
|
|
|
|
|
|
|
|
|
|
|
|
|
|
ASU 2023-09, Income Taxes (Topic 740): Improvements to Income Tax Disclosures |
|
This ASU expands tax disclosures to provide more information to better assess how an entity’s operations and related tax risks and tax planning and opportunities affect its tax rate and prospects for future cash flows. The enhancements in this ASU require that an entity disaggregate income taxes paid and income (or loss) from continuing operations before tax expense (or benefit), and income tax expense (or benefit) from continuing operations.
The new standard requires disclosure of specific categories in the rate reconciliation and provide additional information for reconciling items that meet a quantitative threshold.
|
|
January 1, 2025 |
|
We are evaluating the disclosure requirements. The overall effect of this standard is not expected to have a material impact on our financial statements.
|
|
|
|
|
|
|
|
|
|
|
|
|
|
|
|
|
|
|
|
|
|
|
|
|
|
|
|
|
|
|
|
|
|
|
|
|
|
|
|
|
|
|
| Standards adopted by the Bank in 2023 |
|
|
|
|
|
|
|
|
ASU 2022-02,
Financial Instruments—Credit Losses (Topic 326): Troubled Debt Restructurings and Vintage Disclosures
|
|
This ASU eliminated the recognition and measurement guidance on troubled debt restructurings for creditors that have adopted ASC 326 (“CECL”), and eliminated certain previously required TDR disclosures while expanding disclosures about loan modifications for borrowers experiencing financial difficulty. The new standard also required public companies to present gross write-offs (on a year-to-date basis for interim-period disclosures) by year of origination in their vintage disclosures.
|
|
January 1, 2023 |
|
We adopted the guidance in the new standard on January 1, 2023. The adoption of this standard did not have a material effect on our financial statements. |
3. FAIR VALUE
Fair Value Measurement
Fair value is defined as the exchange price that would be received for an asset or paid to transfer a liability (an exit price) in the principal or most advantageous market for the asset or liability in an orderly transaction between market participants on the measurement date. To measure fair value, a hierarchy has been established that prioritizes the use of observable inputs over unobservable inputs. This hierarchy uses the following three levels of inputs to measure the fair value of assets and liabilities:
•Level 1 — Quoted prices in active markets for identical assets or liabilities that we have the ability to access;
•Level 2 — Observable inputs other than Level 1, including quoted prices for similar assets or liabilities in active markets, quoted prices for identical or similar assets or liabilities in less active markets, observable inputs other than quoted prices that are used in the valuation of an asset or liability, and inputs that are derived principally from or corroborated by observable market data by correlation or other means; and
•Level 3 — Unobservable inputs supported by little or no market activity for financial instruments whose value is determined by pricing models, discounted cash flow methodologies or similar techniques, as well as instruments for which the determination of fair value requires significant management judgment or estimation.
The level in the fair value hierarchy within which the fair value measurement is classified is determined based on the lowest level input that is significant to the fair value measurement in its entirety. Market activity is presumed to be orderly in the absence of evidence of forced or disorderly sales. Applicable accounting guidance precludes the use of blockage factors or liquidity adjustments due to the quantity of securities held by an entity.
ZIONS BANCORPORATION, NATIONAL ASSOCIATION AND SUBSIDIARIES
We measure certain assets and liabilities at fair value on a recurring basis when fair value is the primary measure for accounting. Fair value is used on a nonrecurring basis to measure certain assets, such as the application of lower of cost or fair value accounting and the recognition of impairment on assets. Fair value is also used when providing required disclosures for certain financial instruments.
Fair Value Policies and Procedures
We have various policies, processes, and controls in place to ensure that fair values are reasonably developed, reviewed, and approved for use. Our Securities Valuation Committee, comprised of executive management, reviews and approves on a quarterly basis the key components of fair value measurements, including critical valuation assumptions for Level 3 measurements. Our Model Risk Management Group conducts model validations, including internal models, and sets policies and procedures for revalidation, including the timing of revalidation.
Third-party Service Providers
We use a third-party pricing service to measure fair value for substantially all of our Level 2 AFS securities. Fair value measurements for other Level 2 AFS securities generally use inputs corroborated by market data and include standard discounted cash flow analyses.
For Level 2 securities, the third-party pricing service provides documentation on an ongoing basis that presents market data, including detailed pricing information and market reference data. The documentation includes benchmark yields, reported trades, broker-dealer quotes, issuer spreads, two-sided markets, benchmark securities, bids, offers, and reference data, including information from the vendor trading platform. We review, test, and validate this information on a regular basis.
The following describes the hierarchy designations, valuation methodologies and key inputs to measure fair value on a recurring basis for designated financial instruments:
Available-for-Sale
•U.S. Treasury, Agencies and Corporations — U.S. Treasury securities measured using quoted market prices are classified in Level 1. U.S. agency and corporate securities measured using observable market inputs are classified in Level 2.
•Municipal Securities — Municipal securities are measured using observable market inputs and are classified in Level 2.
•Other Debt Securities — Other debt securities are measured using quoted prices for similar securities and are classified in Level 2.
Trading
Trading securities are measured using observable market inputs and are classified in Level 1 and Level 2.
Bank-owned Life Insurance
BOLI is measured according to the CSV of the insurance policies. Nearly all policies are general account policies with CSVs based on our claims on the assets of the insurance companies. The insurance companies’ investments include predominantly fixed-income securities consisting of investment-grade corporate bonds and various types of mortgage instruments. Management regularly reviews its BOLI investment performance, including concentrations among insurance providers and classifies BOLI balances in Level 2.
Private Equity Investments
PEIs measured at fair value on a recurring basis are generally classified in Level 3 because related measurements include unobservable inputs. Key assumptions and considerations include current and projected financial performance, recent financing activities, economic and market conditions, market comparable companies, market liquidity, and other factors. The majority of these PEIs are held in our Small Business Investment Company (“SBIC”) and are early-stage venture investments. These investments are reviewed at least quarterly by the Securities Valuation Committee and whenever a new round of financing occurs. Some of these investments may be measured using multiples of operating performance.
ZIONS BANCORPORATION, NATIONAL ASSOCIATION AND SUBSIDIARIES
The Equity Investments Committee reviews periodic financial information for these investments, including audited financial statements when available. On occasion, PEIs may become publicly traded and are measured in Level 1. Certain restrictions may apply for the redemption of these investments.
Agriculture Loan Servicing
We service agriculture loans approved and funded by Federal Agricultural Mortgage Corporation (“FAMC”), and provide this servicing under an agreement with FAMC for the loans it owns. The servicing assets are measured at fair value, which represents our projection of the present value of net future cash flows. Because related measurements include unobservable inputs, these assets are classified in Level 3.
Loans held for sale
We have elected the fair value option for certain commercial real estate loans that are intended for sale to a third-party conduit for securitization. These loans are measured at fair value using observable market prices for mortgage-backed securities with similar collateral. The value of the loans incorporates adjustments for differences between the securities and the value of the underlying loans due to credit quality, portfolio composition, and liquidity. Valuations of loans measured at fair value are generally classified in Level 2 in the fair value hierarchy because their pricing is largely based on observable market inputs.
Deferred Compensation Plan Assets
Invested assets in the deferred compensation plan consist of shares of registered investment companies. These mutual funds are valued using quoted market prices, which represents the net asset value (“NAV”) of shares held by the plan at the end of the period. As such, these assets are classified in Level 1.
Derivatives
Exchange-traded derivatives, including foreign currency exchange contracts, are generally classified in Level 1 because they are traded in active markets. Over-the-counter derivatives, consisting primarily of interest rate swaps and options, are generally classified in Level 2 as the related fair values are obtained from third-party services that utilize observable market inputs. Observable market inputs include yield curves, foreign exchange rates, commodity prices, option volatility, counterparty credit risk, and other related data. Valuations include credit valuation adjustments (“CVAs”) to reflect nonperformance risk for both us and our counterparties. CVAs are determined generally by applying a credit spread to the total expected exposure (net of any collateral) of the derivative.
Securities Sold, Not Yet Purchased
Securities sold, not yet purchased, are included in “Federal funds and other short-term borrowings” on the consolidated balance sheet, and are measured using quoted market prices and are generally classified in Level 1. If market prices for identical securities are not available, quoted prices for similar securities are used with the related balances classified in Level 2.
ZIONS BANCORPORATION, NATIONAL ASSOCIATION AND SUBSIDIARIES
Fair Value Hierarchy
The following schedule presents assets and liabilities measured at fair value on a recurring basis:
|
|
|
|
|
|
|
|
|
|
|
|
|
|
|
|
|
|
|
|
|
|
|
|
| (In millions) |
December 31, 2023 |
|
Level 1 |
|
Level 2 |
|
Level 3 |
|
Total |
| ASSETS |
|
|
|
|
|
|
|
| Available-for-sale securities: |
|
|
|
|
|
|
|
| U.S. Treasury, agencies, and corporations |
$ |
492 |
|
|
$ |
8,467 |
|
|
$ |
— |
|
|
$ |
8,959 |
|
| Municipal securities |
|
|
1,318 |
|
|
|
|
1,318 |
|
| Other debt securities |
|
|
23 |
|
|
|
|
23 |
|
|
|
|
|
|
|
|
|
| Total available-for-sale |
492 |
|
|
9,808 |
|
|
— |
|
|
10,300 |
|
| Trading securities |
|
|
48 |
|
|
|
|
48 |
|
| Other noninterest-bearing investments: |
|
|
|
|
|
|
|
| Bank-owned life insurance |
|
|
553 |
|
|
|
|
553 |
|
Private equity investments 1 |
3 |
|
|
|
|
92 |
|
|
95 |
|
| Other assets: |
|
|
|
|
|
|
|
| Agriculture loan servicing |
|
|
|
|
19 |
|
|
19 |
|
| Loans held for sale |
|
|
43 |
|
|
|
|
43 |
|
| Deferred compensation plan assets |
124 |
|
|
|
|
|
|
124 |
|
| Derivatives |
|
|
420 |
|
|
|
|
420 |
|
| Total assets |
$ |
619 |
|
|
$ |
10,872 |
|
|
$ |
111 |
|
|
$ |
11,602 |
|
| LIABILITIES |
|
|
|
|
|
|
|
| Securities sold, not yet purchased |
$ |
65 |
|
|
$ |
— |
|
|
$ |
— |
|
|
$ |
65 |
|
| Other liabilities: |
|
|
|
|
|
|
|
|
|
|
|
|
|
|
|
| Derivatives |
|
|
333 |
|
|
|
|
333 |
|
| Total liabilities |
$ |
65 |
|
|
$ |
333 |
|
|
$ |
— |
|
|
$ |
398 |
|
1 The level 1 PEIs relate to the portion of our SBIC investments that are publicly traded.
|
|
|
|
|
|
|
|
|
|
|
|
|
|
|
|
|
|
|
|
|
|
|
|
| (In millions) |
December 31, 2022 |
|
Level 1 |
|
Level 2 |
|
Level 3 |
|
Total |
| ASSETS |
|
|
|
|
|
|
|
| Available-for-sale securities: |
|
|
|
|
|
|
|
| U.S. Treasury, agencies, and corporations |
$ |
393 |
|
|
$ |
9,815 |
|
|
$ |
— |
|
|
$ |
10,208 |
|
| Municipal securities |
|
|
1,634 |
|
|
|
|
1,634 |
|
| Other debt securities |
|
|
73 |
|
|
|
|
73 |
|
|
|
|
|
|
|
|
|
| Total available-for-sale |
393 |
|
|
11,522 |
|
|
— |
|
|
11,915 |
|
| Trading securities |
395 |
|
|
70 |
|
|
|
|
465 |
|
| Other noninterest-bearing investments: |
|
|
|
|
|
|
|
| Bank-owned life insurance |
|
|
546 |
|
|
|
|
546 |
|
Private equity investments 1 |
4 |
|
|
|
|
81 |
|
|
85 |
|
| Other assets: |
|
|
|
|
|
|
|
| Agriculture loan servicing |
|
|
|
|
14 |
|
|
14 |
|
| Deferred compensation plan assets |
114 |
|
|
|
|
|
|
114 |
|
| Derivatives |
|
|
386 |
|
|
|
|
386 |
|
| Total assets |
$ |
906 |
|
|
$ |
12,524 |
|
|
$ |
95 |
|
|
$ |
13,525 |
|
| LIABILITIES |
|
|
|
|
|
|
|
| Securities sold, not yet purchased |
$ |
187 |
|
|
$ |
— |
|
|
$ |
— |
|
|
$ |
187 |
|
| Other liabilities: |
|
|
|
|
|
|
|
| Derivatives |
|
|
451 |
|
|
|
|
451 |
|
| Total liabilities |
$ |
187 |
|
|
$ |
451 |
|
|
$ |
— |
|
|
$ |
638 |
|
1 The level 1 PEIs relate to the portion of our SBIC investments that are publicly traded.
ZIONS BANCORPORATION, NATIONAL ASSOCIATION AND SUBSIDIARIES
Roll-forward of Level 3 Fair Value Measurements
The following schedule presents a roll-forward of assets and liabilities that are measured at fair value on a recurring basis using Level 3 inputs:
|
|
|
|
|
|
|
|
|
|
|
|
|
|
|
|
|
|
|
|
|
|
|
|
|
|
|
|
|
|
|
|
|
|
|
|
| |
Level 3 Instruments |
|
December 31, 2023 |
|
December 31, 2022 |
|
December 31, 2021 |
| (In millions) |
Private
equity
investments |
|
Ag loan servicing |
|
Private
equity
investments |
|
Ag loan servicing |
|
Private
equity
investments |
|
Ag loan servicing |
|
|
|
|
|
|
|
|
|
|
|
|
| Balance at beginning of year |
$ |
81 |
|
|
$ |
14 |
|
|
$ |
66 |
|
|
$ |
12 |
|
|
$ |
80 |
|
|
$ |
16 |
|
|
|
|
|
|
|
|
|
|
|
|
|
| Unrealized securities gains (losses), net |
(2) |
|
|
— |
|
|
3 |
|
|
— |
|
|
71 |
|
|
— |
|
Other noninterest income (expense) 1 |
— |
|
|
5 |
|
|
— |
|
|
2 |
|
|
— |
|
|
(3) |
|
| Purchases |
14 |
|
|
— |
|
|
16 |
|
|
— |
|
|
17 |
|
|
— |
|
| Cost of investments sold |
(1) |
|
|
— |
|
|
(3) |
|
|
— |
|
|
(24) |
|
|
— |
|
| Redemptions and paydowns |
— |
|
|
— |
|
|
— |
|
|
— |
|
|
— |
|
|
(1) |
|
Transfers out 2 |
— |
|
|
— |
|
|
(1) |
|
|
— |
|
|
(78) |
|
|
— |
|
| Balance at end of year |
$ |
92 |
|
|
$ |
19 |
|
|
$ |
81 |
|
|
$ |
14 |
|
|
$ |
66 |
|
|
$ |
12 |
|
1 Represents the valuation adjustments related to the agricultural loan servicing asset.
2 Represents the transfer of SBIC investments out of Level 3 and into Level 1 because they are publicly traded.
The roll-forward of Level 3 instruments includes the following realized gains and losses included in “Securities gains (losses), net” on the consolidated statement of income for the periods presented:
|
|
|
|
|
|
|
|
|
|
|
|
|
|
|
|
|
|
| (In millions) |
Year Ended December 31, |
| 2023 |
|
2022 |
|
2021 |
|
|
|
|
|
|
|
|
|
|
|
|
| Securities gains (losses), net |
$ |
(1) |
|
|
$ |
(2) |
|
|
$ |
31 |
|
|
|
|
|
|
|
Nonrecurring Fair Value Measurements
Certain assets and liabilities may be recorded at fair value on a nonrecurring basis, including impaired loans that have been measured based on the fair value of the underlying collateral, OREO, and equity investments without readily determinable fair values. Nonrecurring fair value adjustments generally include changes in value resulting from observable price changes for equity investments without readily determinable fair values, write-downs of individual assets, or the application of lower of cost or fair value accounting. At December 31, 2023, we had an insignificant amount of assets or liabilities that had fair value changes measured on a nonrecurring basis.
Loans that are collateral dependent were measured at the lower of amortized cost or the fair value of the collateral. OREO was measured initially at fair value based on collateral appraisals at the time of transfer and subsequently at the lower of cost or fair value (less any selling costs). Measurement of fair value for collateral-dependent loans and OREO was based on third-party appraisals that utilize one or more valuation techniques (income, market and/or cost approaches). Any adjustments to calculated fair value were made based on recently completed and validated third-party appraisals, third-party appraisal services, automated valuation services, or our informed judgment. Automated valuation services may be used primarily for residential properties when values from any of the previous methods were not available within 90 days of the balance sheet date. These services use models based on market, economic, and demographic values. At December 31, 2023, we had less than $1 million of collateral-dependent loans classified in Level 2, and we recognized an insignificant amount of losses from fair value changes related to these loans.
ZIONS BANCORPORATION, NATIONAL ASSOCIATION AND SUBSIDIARIES
Fair Value of Certain Financial Instruments
The following schedule presents the carrying values and estimated fair values of certain financial instruments:
|
|
|
|
|
|
|
|
|
|
|
|
|
|
|
|
|
|
|
|
|
|
|
|
|
|
|
|
|
|
|
|
|
|
|
|
| |
December 31, 2023 |
|
December 31, 2022 |
| (In millions) |
Carrying
value |
|
Fair value |
|
Level |
|
Carrying
value |
|
Fair value |
|
Level |
| Financial assets: |
|
|
|
|
|
|
|
|
|
|
|
Held-to-maturity investment securities |
$ |
10,382 |
|
|
$ |
10,466 |
|
|
2 |
|
$ |
11,126 |
|
|
$ |
11,239 |
|
|
2 |
Loans and leases (including loans held for sale), net of allowance |
57,148 |
|
|
54,832 |
|
|
3 |
|
55,086 |
|
|
53,093 |
|
|
3 |
| Financial liabilities: |
|
|
|
|
|
|
|
|
|
|
|
| Time deposits |
9,996 |
|
|
9,964 |
|
|
2 |
|
2,309 |
|
|
2,269 |
|
|
2 |
|
|
|
|
|
|
|
|
|
|
|
|
|
|
|
|
|
|
|
|
|
|
|
|
| Long-term debt |
542 |
|
|
494 |
|
|
2 |
|
651 |
|
|
635 |
|
|
2 |
The preceding schedule does not include certain financial instruments that are recorded at fair value on a recurring basis, as well as certain financial assets and liabilities for which the carrying value approximates fair value, such as cash and due from banks; money market investments; demand, savings, and money market deposits; federal funds purchased and other short-term borrowings; and security repurchase agreements. The estimated fair value of demand, savings and money market deposits is the amount payable on demand at the reporting date. Carrying value is used because the accounts have no stated maturity, the customer has the ability to withdraw funds immediately, and there is generally negligible credit risk. Instruments for which carrying value approximates fair value are generally classified in Level 2 in the fair value hierarchy because their pricing is largely based on observable market inputs. Time and foreign deposits are measured at fair value by discounting future cash flows using the applicable yield curve to the given maturity dates. Long-term debt is measured at fair value based on actual market trades (i.e., an asset value) when available, or discounting cash flows to maturity using the applicable yield curve adjusted for credit spreads.
For loans measured at amortized cost, fair value is estimated for disclosure purposes by discounting future cash flows using the applicable yield curve adjusted by a factor that is derived from analyzing recent loan originations and combined with a liquidity premium inherent in the loan. These future cash flows are then reduced by the estimated life-of-the-loan aggregate credit losses in the loan portfolio. The methods used to measure fair value for HTM securities was previously described.
These fair value disclosures represent our best estimates based on relevant market information. Fair value estimates are based on judgments regarding current economic conditions, future expected loss experience, risk characteristics of the various instruments, and other factors. These estimates are subjective in nature, involve uncertainties and matters of significant judgment, and cannot be determined with precision. Changes in these methodologies and assumptions would significantly affect the estimates.
Fair Value Option for Certain Loans Held for Sale
During the second quarter of 2023, we elected the fair value option for certain commercial real estate loans that are intended for sale to a third-party conduit for securitization and are hedged with derivative instruments. Electing the fair value option reduces the accounting volatility that would otherwise result from the asymmetry created by accounting for the loans held for sale at the lower of cost or fair value and the derivatives at fair value without the complexity of applying hedge accounting. These loans are included in “Loans held for sale” on the consolidated balance sheet, and associated gains and losses are included in “Capital markets fees” on the consolidated statement of income. At December 31, 2023, we had $43 million of loans measured at fair value ($43 million par value). During 2023, we recognized approximately $4 million of net gains from valuation adjustments of loans carried at fair value and the associated derivatives.
ZIONS BANCORPORATION, NATIONAL ASSOCIATION AND SUBSIDIARIES
4. OFFSETTING ASSETS AND LIABILITIES
The following schedule presents gross and net information for selected financial instruments on the balance sheet:
|
|
|
|
|
|
|
|
|
|
|
|
|
|
|
|
|
|
|
|
|
|
|
|
|
|
|
|
|
|
|
|
|
|
|
|
|
|
|
|
|
December 31, 2023 |
| (In millions) |
|
|
|
|
|
|
|
Gross amounts not offset on the balance sheet |
|
|
| Description |
|
Gross amounts recognized |
|
Gross amounts offset on the balance sheet |
|
Net amounts presented on the balance sheet |
|
Financial instruments |
|
Cash collateral received/pledged |
|
Net amount |
| Assets: |
|
|
|
|
|
|
|
|
|
|
|
|
Federal funds sold and securities purchased under agreements to resell |
|
$ |
1,170 |
|
|
$ |
(233) |
|
|
$ |
937 |
|
|
$ |
— |
|
|
$ |
— |
|
|
$ |
937 |
|
Derivatives (included in Other assets) |
|
420 |
|
|
— |
|
|
420 |
|
|
(31) |
|
|
(357) |
|
|
32 |
|
| Total assets |
|
$ |
1,590 |
|
|
$ |
(233) |
|
|
$ |
1,357 |
|
|
$ |
(31) |
|
|
$ |
(357) |
|
|
$ |
969 |
|
| Liabilities: |
|
|
|
|
|
|
|
|
|
|
|
|
Federal funds and other short-term borrowings |
|
$ |
4,612 |
|
|
$ |
(233) |
|
|
$ |
4,379 |
|
|
$ |
— |
|
|
$ |
— |
|
|
$ |
4,379 |
|
Derivatives (included in Other liabilities) |
|
333 |
|
|
— |
|
|
333 |
|
|
(31) |
|
|
(1) |
|
|
301 |
|
| Total liabilities |
|
$ |
4,945 |
|
|
$ |
(233) |
|
|
$ |
4,712 |
|
|
$ |
(31) |
|
|
$ |
(1) |
|
|
$ |
4,680 |
|
|
|
|
|
|
|
|
|
|
|
|
|
|
|
|
|
|
|
|
|
|
|
|
|
|
|
|
|
|
|
|
|
|
|
|
|
|
|
|
|
|
December 31, 2022 |
| (In millions) |
|
|
|
|
|
|
|
Gross amounts not offset on the balance sheet |
|
|
| Description |
|
Gross amounts recognized |
|
Gross amounts offset on the balance sheet |
|
Net amounts presented on the balance sheet |
|
Financial instruments |
|
Cash collateral received/pledged |
|
Net amount |
| Assets: |
|
|
|
|
|
|
|
|
|
|
|
|
Federal funds sold and securities purchased under agreements to resell |
|
$ |
2,451 |
|
|
$ |
(25) |
|
|
$ |
2,426 |
|
|
$ |
— |
|
|
$ |
— |
|
|
$ |
2,426 |
|
Derivatives (included in Other assets) |
|
386 |
|
|
— |
|
|
386 |
|
|
(10) |
|
|
(367) |
|
|
9 |
|
| Total assets |
|
$ |
2,837 |
|
|
$ |
(25) |
|
|
$ |
2,812 |
|
|
$ |
(10) |
|
|
$ |
(367) |
|
|
$ |
2,435 |
|
| Liabilities: |
|
|
|
|
|
|
|
|
|
|
|
|
Federal funds and other short-term borrowings |
|
$ |
10,442 |
|
|
$ |
(25) |
|
|
$ |
10,417 |
|
|
$ |
— |
|
|
$ |
— |
|
|
$ |
10,417 |
|
Derivatives (included in Other liabilities) |
|
451 |
|
|
— |
|
|
451 |
|
|
(10) |
|
|
— |
|
|
441 |
|
| Total liabilities |
|
$ |
10,893 |
|
|
$ |
(25) |
|
|
$ |
10,868 |
|
|
$ |
(10) |
|
|
$ |
— |
|
|
$ |
10,858 |
|
Security repurchase and reverse repurchase agreements are offset, when applicable, on the balance sheet according to master netting agreements. Security repurchase agreements are included in “Federal funds and other short-term borrowings.” on the consolidated balance sheet. Derivative instruments may be offset under their master netting agreements; however, for accounting purposes, we present these items on a gross basis on our balance sheet. See Note 7 for further information regarding derivative instruments.
ZIONS BANCORPORATION, NATIONAL ASSOCIATION AND SUBSIDIARIES
5. INVESTMENTS
Investment Securities
Investment securities are classified as HTM, AFS, or trading. HTM securities, which management has the intent and ability to hold until maturity, are carried at amortized cost. The amortized cost amounts represent the original cost of the investments, adjusted for related amortization or accretion of any purchase premiums or discounts, and for any impairment losses, including credit-related impairment. AFS securities are carried at fair value, and changes in fair value (unrealized gains and losses) are reported as net increases or decreases to AOCI, net of related taxes. Trading securities are measured at fair value with gains and losses recognized in current period earnings.
The carrying values of our securities do not include accrued interest receivables of $65 million and $75 million at December 31, 2023, and 2022, respectively. These receivables are included in “Other assets” on the consolidated balance sheet. The purchase premiums for callable debt securities classified as HTM or AFS are amortized into interest income at an effective yield to the earliest call date. The purchase premiums and discounts for all other HTM and AFS securities are recorded as interest income over the contractual life of the security using the effective yield method. As principal prepayments are received on securities, a proportionate amount of the related premium or discount is recognized in income so that the effective yield on the remaining portion of the security continues unchanged. See Note 3 for more information about the process to estimate fair value for investment securities.
When a security is transferred from AFS to HTM, the difference between its amortized cost basis and fair value at the date of transfer is amortized as a yield adjustment through interest income, and the fair value at the date of transfer results in either a premium or discount to the amortized cost basis of the HTM securities. The amortization of unrealized gains or losses reported in AOCI will offset the effect of the amortization of the premium or discount in interest income that is created by the transfer.
The following schedules present the amortized cost and estimated fair values of our HTM and AFS securities:
|
|
|
|
|
|
|
|
|
|
|
|
|
|
|
|
|
|
|
|
|
|
|
|
|
December 31, 2023 |
| (In millions) |
Amortized
cost |
|
Gross
unrealized
gains 1
|
|
Gross
unrealized
losses |
|
Estimated
fair value |
| Held-to-maturity |
|
|
|
|
|
|
|
| U.S. Government agencies and corporations: |
|
|
|
|
|
|
|
| Agency securities |
$ |
93 |
|
|
$ |
— |
|
|
$ |
6 |
|
|
$ |
87 |
|
| Agency guaranteed mortgage-backed securities |
9,935 |
|
|
156 |
|
50 |
|
10,041 |
|
| Municipal securities |
354 |
|
|
— |
|
|
16 |
|
|
338 |
|
| Total held-to-maturity |
10,382 |
|
|
156 |
|
|
72 |
|
|
10,466 |
|
| Available-for-sale |
|
|
|
|
|
|
|
| U.S. Treasury securities |
585 |
|
|
— |
|
|
93 |
|
|
492 |
|
| U.S. Government agencies and corporations: |
|
|
|
|
|
|
|
| Agency securities |
663 |
|
|
— |
|
|
33 |
|
|
630 |
|
| Agency guaranteed mortgage-backed securities |
8,530 |
|
|
— |
|
|
1,239 |
|
|
7,291 |
|
| Small Business Administration loan-backed securities |
571 |
|
|
— |
|
|
25 |
|
|
546 |
|
| Municipal securities |
1,385 |
|
|
— |
|
|
67 |
|
|
1,318 |
|
| Other |
25 |
|
|
— |
|
|
2 |
|
|
23 |
|
|
|
|
|
|
|
|
|
|
|
|
|
|
|
|
|
| Total available-for-sale |
11,759 |
|
|
— |
|
|
1,459 |
|
|
10,300 |
|
| Total HTM and AFS investment securities |
$ |
22,141 |
|
|
$ |
156 |
|
|
$ |
1,531 |
|
|
$ |
20,766 |
|
1 Gross unrealized gains for the respective AFS security categories were individually less than $1 million.
ZIONS BANCORPORATION, NATIONAL ASSOCIATION AND SUBSIDIARIES
|
|
|
|
|
|
|
|
|
|
|
|
|
|
|
|
|
|
|
|
|
|
|
|
|
December 31, 2022 |
| (In millions) |
Amortized
cost |
|
Gross unrealized gains |
|
Gross unrealized losses |
|
Estimated
fair value |
| Held-to-maturity |
|
|
|
|
|
|
|
| U.S. Government agencies and corporations: |
|
|
|
|
|
|
|
| Agency securities |
$ |
100 |
|
|
$ |
— |
|
|
$ |
7 |
|
|
$ |
93 |
|
| Agency guaranteed mortgage-backed securities |
10,621 |
|
|
165 |
|
|
14 |
|
|
10,772 |
|
| Municipal securities |
405 |
|
|
— |
|
|
31 |
|
|
374 |
|
| Total held-to-maturity |
11,126 |
|
|
165 |
|
|
52 |
|
|
11,239 |
|
| Available-for-sale |
|
|
|
|
|
|
|
| U.S. Treasury securities |
557 |
|
|
— |
|
|
164 |
|
|
393 |
|
| U.S. Government agencies and corporations: |
|
|
|
|
|
|
|
| Agency securities |
782 |
|
|
— |
|
|
46 |
|
|
736 |
|
Agency guaranteed mortgage-backed securities 1 |
9,652 |
|
|
— |
|
|
1,285 |
|
|
8,367 |
|
| Small Business Administration loan-backed securities |
740 |
|
|
1 |
|
|
29 |
|
|
712 |
|
| Municipal securities |
1,732 |
|
|
1 |
|
|
99 |
|
|
1,634 |
|
Other 1 |
75 |
|
|
— |
|
|
2 |
|
|
73 |
|
| Total available-for-sale |
13,538 |
|
|
2 |
|
|
1,625 |
|
|
11,915 |
|
| Total HTM and AFS investment securities |
$ |
24,664 |
|
|
$ |
167 |
|
|
$ |
1,677 |
|
|
$ |
23,154 |
|
1 Gross unrealized gains for these security categories were less than $1 million.
During the fourth quarter of 2022, we transferred approximately $10.7 billion fair value ($13.1 billion amortized cost) of mortgage-backed AFS securities to HTM. The transfer of these securities resulted in a discount to the amortized cost basis of the HTM securities equivalent to the $2.4 billion ($1.8 billion after tax) of unrealized losses in AOCI attributable to these securities. The amortization of the unrealized losses will offset the effect of the accretion of the discount created by the transfer. At December 31, 2023, the unamortized discount on the HTM securities totaled approximately $2.1 billion ($1.5 billion after tax).
Maturities
The following schedule presents the amortized cost and weighted average yields of debt securities by contractual maturity of principal payments at December 31, 2023. This schedule does not reflect the duration of the portfolio, which would incorporate amortization, expected prepayments, interest rate resets, and fair value hedges; the effects of which result in measured durations shorter than contractual maturities.
ZIONS BANCORPORATION, NATIONAL ASSOCIATION AND SUBSIDIARIES
|
|
|
|
|
|
|
|
|
|
|
|
|
|
|
|
|
|
|
|
|
|
|
|
|
|
|
|
|
|
|
|
|
|
|
|
|
|
|
|
|
|
|
|
|
|
|
|
|
|
|
|
|
|
|
|
|
|
|
|
|
December 31, 2023 |
|
Total debt securities |
|
Due in one year or less |
|
Due after one year through five years |
|
Due after five years through ten years |
|
Due after ten years |
| (Dollar amounts in millions) |
Amortized cost |
|
Average yield |
|
Amortized cost |
|
Average yield |
|
Amortized cost |
|
Average yield |
|
Amortized cost |
|
Average yield |
|
Amortized cost |
|
Average yield |
| Held-to-maturity |
|
|
|
|
|
|
|
|
|
|
|
|
|
|
|
|
|
|
|
| U.S. Government agencies and corporations: |
|
|
|
|
|
|
|
|
|
|
|
|
|
|
|
|
|
|
|
| Agency securities |
$ |
93 |
|
|
3.55 |
% |
|
$ |
— |
|
|
— |
% |
|
$ |
— |
|
|
— |
% |
|
$ |
— |
|
|
— |
% |
|
$ |
93 |
|
|
3.55 |
% |
Agency guaranteed mortgage-backed securities |
9,935 |
|
|
1.85 |
|
|
— |
|
|
— |
|
|
— |
|
|
— |
|
|
45 |
|
|
1.94 |
|
|
9,890 |
|
|
1.85 |
|
Municipal securities 1 |
354 |
|
|
3.15 |
|
|
26 |
|
|
2.70 |
|
|
127 |
|
|
3.00 |
|
|
166 |
|
|
3.36 |
|
|
35 |
|
|
3.08 |
|
| Total held-to-maturity securities |
10,382 |
|
|
1.91 |
|
|
26 |
|
|
2.70 |
|
|
127 |
|
|
3.00 |
|
|
211 |
|
|
3.06 |
|
|
10,018 |
|
|
1.87 |
|
| Available-for-sale |
|
|
|
|
|
|
|
|
|
|
|
|
|
|
|
|
|
|
|
| U.S. Treasury securities |
585 |
|
|
3.26 |
|
|
184 |
|
|
5.24 |
|
|
— |
|
|
— |
|
|
— |
|
|
— |
|
|
401 |
|
|
2.35 |
|
U.S. Government agencies and corporations: |
|
|
|
|
|
|
|
|
|
|
|
|
|
|
|
|
|
|
|
| Agency securities |
663 |
|
|
2.63 |
|
|
116 |
|
|
0.93 |
|
|
154 |
|
|
3.16 |
|
|
207 |
|
|
2.73 |
|
|
186 |
|
|
3.15 |
|
Agency guaranteed mortgage-backed securities |
8,530 |
|
|
2.01 |
|
|
3 |
|
|
1.40 |
|
|
174 |
|
|
1.63 |
|
|
1,459 |
|
|
2.11 |
|
|
6,894 |
|
|
2.00 |
|
Small Business Administration loan-backed securities |
571 |
|
|
5.54 |
|
|
1 |
|
|
5.33 |
|
|
22 |
|
|
6.33 |
|
|
141 |
|
|
4.40 |
|
|
407 |
|
|
5.89 |
|
Municipal securities 1 |
1,385 |
|
|
2.18 |
|
|
138 |
|
|
2.54 |
|
|
432 |
|
|
2.63 |
|
|
717 |
|
|
1.84 |
|
|
98 |
|
|
2.22 |
|
| Other debt securities |
25 |
|
|
8.77 |
|
|
— |
|
|
— |
|
|
— |
|
|
— |
|
|
10 |
|
|
9.50 |
|
|
15 |
|
|
8.28 |
|
|
|
|
|
|
|
|
|
|
|
|
|
|
|
|
|
|
|
|
|
|
|
|
|
|
|
|
|
|
|
|
|
|
|
|
|
|
|
|
|
| Total available-for-sale securities |
11,759 |
|
|
2.32 |
|
|
442 |
|
|
3.24 |
|
|
782 |
|
|
2.61 |
|
|
2,534 |
|
|
2.24 |
|
|
8,001 |
|
|
2.26 |
|
| Total HTM and AFS investment securities |
$ |
22,141 |
|
|
2.13 |
% |
|
$ |
468 |
|
|
3.21 |
% |
|
$ |
909 |
|
|
2.67 |
% |
|
$ |
2,745 |
|
|
2.30 |
% |
|
$ |
18,019 |
|
|
2.04 |
% |
1 The yields on tax-exempt securities are calculated on a tax-equivalent basis.
The following schedule presents gross unrealized losses for AFS securities and the estimated fair value by length of time the securities have been in an unrealized loss position:
|
|
|
|
|
|
|
|
|
|
|
|
|
|
|
|
|
|
|
|
|
|
|
|
|
|
|
|
|
|
|
|
|
|
|
|
|
December 31, 2023 |
|
Less than 12 months |
|
12 months or more |
|
Total |
| (In millions) |
Gross
unrealized
losses |
|
Estimated
fair
value |
|
Gross
unrealized
losses |
|
Estimated
fair
value |
|
Gross
unrealized
losses |
|
Estimated
fair
value |
| Available-for-sale |
|
|
|
|
|
|
|
|
|
|
|
| U.S. Treasury securities |
$ |
— |
|
|
$ |
— |
|
|
$ |
93 |
|
|
$ |
308 |
|
|
$ |
93 |
|
|
$ |
308 |
|
| U.S. Government agencies and corporations: |
|
|
|
|
|
|
|
|
|
|
|
| Agency securities |
— |
|
|
5 |
|
|
33 |
|
|
605 |
|
|
33 |
|
|
610 |
|
| Agency guaranteed mortgage-backed securities |
71 |
|
|
312 |
|
|
1,168 |
|
|
6,902 |
|
|
1,239 |
|
|
7,214 |
|
| Small Business Administration loan-backed securities |
— |
|
|
4 |
|
|
25 |
|
|
484 |
|
|
25 |
|
|
488 |
|
| Municipal securities |
2 |
|
|
229 |
|
|
65 |
|
|
1,061 |
|
|
67 |
|
|
1,290 |
|
| Other |
— |
|
|
— |
|
|
2 |
|
|
13 |
|
|
2 |
|
|
13 |
|
|
|
|
|
|
|
|
|
|
|
|
|
|
|
|
|
|
|
|
|
|
|
|
|
|
|
|
|
|
|
|
|
|
|
|
|
|
|
|
|
|
|
|
|
|
|
|
|
|
|
|
|
|
|
|
|
|
|
|
|
|
|
|
|
|
|
|
|
|
|
|
|
|
|
|
|
|
|
|
|
|
|
|
|
| Total available-for-sale investment securities |
$ |
73 |
|
|
$ |
550 |
|
|
$ |
1,386 |
|
|
$ |
9,373 |
|
|
$ |
1,459 |
|
|
$ |
9,923 |
|
ZIONS BANCORPORATION, NATIONAL ASSOCIATION AND SUBSIDIARIES
|
|
|
|
|
|
|
|
|
|
|
|
|
|
|
|
|
|
|
|
|
|
|
|
|
|
|
|
|
|
|
|
|
|
|
|
|
December 31, 2022 |
|
Less than 12 months |
|
12 months or more |
|
Total |
| (In millions) |
Gross
unrealized
losses |
|
Estimated
fair
value |
|
Gross
unrealized
losses |
|
Estimated
fair
value |
|
Gross
unrealized
losses |
|
Estimated
fair
value |
| Available-for-sale |
|
|
|
|
|
|
|
|
|
|
|
| U.S. Treasury securities |
$ |
94 |
|
|
$ |
308 |
|
|
$ |
70 |
|
|
$ |
85 |
|
|
$ |
164 |
|
|
$ |
393 |
|
| U.S. Government agencies and corporations: |
|
|
|
|
|
|
|
|
|
|
|
| Agency securities |
39 |
|
|
634 |
|
|
7 |
|
|
102 |
|
|
46 |
|
|
736 |
|
| Agency guaranteed mortgage-backed securities |
447 |
|
|
4,322 |
|
|
838 |
|
|
4,042 |
|
|
1,285 |
|
|
8,364 |
|
| Small Business Administration loan-backed securities |
8 |
|
|
101 |
|
|
21 |
|
|
524 |
|
|
29 |
|
|
625 |
|
| Municipal securities |
63 |
|
|
1,295 |
|
|
36 |
|
|
256 |
|
|
99 |
|
|
1,551 |
|
| Other |
2 |
|
|
13 |
|
|
— |
|
|
— |
|
|
2 |
|
|
13 |
|
|
|
|
|
|
|
|
|
|
|
|
|
|
|
|
|
|
|
|
|
|
|
|
|
|
|
|
|
|
|
|
|
|
|
|
|
|
|
|
|
|
|
|
|
|
|
|
|
|
|
|
|
|
|
|
|
|
|
|
|
|
|
|
|
|
|
|
|
|
|
|
|
|
|
|
|
|
|
|
|
|
|
|
|
| Total available-for-sale investment securities |
$ |
653 |
|
|
$ |
6,673 |
|
|
$ |
972 |
|
|
$ |
5,009 |
|
|
$ |
1,625 |
|
|
$ |
11,682 |
|
At December 31, 2023, and 2022, approximately 2,998 and 3,562 AFS investment securities were in an unrealized loss position, respectively.
Impairment
Ongoing Policy
On a quarterly basis, we review our investment securities portfolio for the presence of impairment on an individual security basis. For AFS securities, when the fair value of a debt security is less than its amortized cost basis at the balance sheet date, we assess for the presence of credit impairment. When determining if the fair value of an investment is less than the amortized cost basis, we have elected to exclude accrued interest from the amortized cost basis of the investment. If we have the intent to sell an identified security, or if it is more likely than not we will be required to sell the security before recovery of its amortized cost basis, we write the amortized cost down to the security’s fair value at the reporting date through earnings.
If we have the intent and ability to hold the securities, we determine whether there is any impairment attributable to credit-related factors. We analyze certain factors, primarily internal and external credit ratings, to determine if the decline in fair value below the amortized cost basis has resulted from a credit loss or other factors. If a credit impairment is determined to exist, then we measure the amount of credit loss and recognize an allowance for the credit loss. In measuring the credit loss, we generally compare the present value of cash flows expected to be collected from the security to the amortized cost basis of the security. These cash flows are credit adjusted using, among other things, assumptions for default probability and loss severity. Certain other inputs, such as prepayment rate assumptions, are also utilized. In addition, certain internal models may be utilized. To determine the credit-related portion of impairment, we use the security-specific effective interest rate when estimating the present value of cash flows. If the present value of cash flows is less than the amortized cost basis of the security, then this amount is recorded as an allowance for credit loss, limited to the amount that the fair value is less than the amortized cost basis (i.e., the credit impairment cannot result in the security being carried at an amount lower than its fair value). The assumptions used to estimate the expected cash flows depend on the particular asset class, structure, and credit rating of the security. Declines in fair value that are not recorded in the allowance are recorded in other comprehensive income, net of applicable taxes.
AFS Impairment
We did not recognize any impairment on our AFS investment securities portfolio during 2023 or 2022. Unrealized losses primarily relate to changes in interest rates subsequent to purchase and are not attributable to credit; as such, absent any future sales, we would expect to receive the full principal value at maturity. At December 31, 2023, we had not initiated any sales of AFS securities, nor did we have an intent to sell any identified securities with unrealized losses. We do not believe it is more likely than not that we would be required to sell such securities before recovery of their amortized cost basis.
ZIONS BANCORPORATION, NATIONAL ASSOCIATION AND SUBSIDIARIES
HTM Impairment
For HTM securities, the ACL is assessed consistent with the approach described in Note 6 for loans and leases measured at amortized cost. At December 31, 2023, the ACL on HTM securities was less than $1 million, all HTM securities were risk-graded as “Pass” in terms of credit quality, and none were considered past due.
Securities Gains and Losses Recognized in Income
The following schedule presents securities gains and losses recognized in income:
|
|
|
|
|
|
|
|
|
|
|
|
|
|
|
|
|
|
|
|
|
|
|
|
|
|
|
|
|
|
|
|
|
|
|
|
|
2023 |
|
2022 |
|
2021 |
| (In millions) |
Gross
gains |
|
Gross
losses |
|
Gross
gains |
|
Gross
losses |
|
Gross
gains |
|
Gross
losses |
|
|
|
|
|
|
|
|
|
|
|
|
|
|
|
|
|
|
|
|
|
|
|
|
| Available-for-sale |
72 |
|
|
72 |
|
|
— |
|
|
— |
|
|
— |
|
|
— |
|
| Trading |
13 |
|
|
11 |
|
|
— |
|
|
— |
|
|
— |
|
|
— |
|
| Other noninterest-bearing investments |
$ |
27 |
|
|
$ |
25 |
|
|
$ |
11 |
|
|
$ |
26 |
|
|
$ |
119 |
|
|
$ |
48 |
|
| Total |
112 |
|
|
108 |
|
|
11 |
|
|
26 |
|
|
119 |
|
|
48 |
|
Net gains (losses) 1 |
|
|
$ |
4 |
|
|
|
|
$ |
(15) |
|
|
|
|
$ |
71 |
|
|
|
|
|
|
|
|
|
|
|
|
|
|
|
|
|
|
|
|
|
|
|
|
|
|
|
|
|
|
|
|
|
|
|
|
|
|
|
|
|
|
|
|
|
|
|
|
|
|
|
|
|
|
|
|
|
|
|
|
|
1 Net gains (losses) are included in “Securities gains (losses), net” on the consolidated statement of income.
The following schedule presents interest income by security type:
|
|
|
|
|
|
|
|
|
|
|
|
|
|
|
|
|
|
|
|
|
|
|
|
|
|
|
|
|
|
|
|
|
|
|
|
|
|
|
|
|
|
|
|
|
|
|
|
|
|
|
|
|
|
| (In millions) |
2023 |
|
2022 |
|
2021 |
| Taxable |
|
Nontaxable |
|
Total |
|
Taxable |
|
Nontaxable |
|
Total |
|
Taxable |
|
Nontaxable |
|
Total |
| Investment securities: |
|
|
|
|
|
|
|
|
|
|
|
|
|
|
|
|
| Held-to-maturity |
$ |
236 |
|
|
$ |
3 |
|
|
$ |
239 |
|
|
$ |
42 |
|
|
$ |
4 |
|
|
$ |
46 |
|
|
$ |
10 |
|
|
$ |
5 |
|
|
$ |
15 |
|
| Available-for-sale |
291 |
|
|
31 |
|
|
322 |
|
|
411 |
|
|
40 |
|
|
451 |
|
|
256 |
|
|
29 |
|
|
285 |
|
| Trading |
— |
|
|
2 |
|
|
2 |
|
|
— |
|
|
15 |
|
|
15 |
|
|
— |
|
|
11 |
|
|
11 |
|
| Total securities |
$ |
527 |
|
|
$ |
36 |
|
|
$ |
563 |
|
|
$ |
453 |
|
|
$ |
59 |
|
|
$ |
512 |
|
|
$ |
266 |
|
|
$ |
45 |
|
|
$ |
311 |
|
ZIONS BANCORPORATION, NATIONAL ASSOCIATION AND SUBSIDIARIES
6. LOANS, LEASES, AND ALLOWANCE FOR CREDIT LOSSES
Loans, Leases, and Loans Held for Sale
Loans and leases are summarized as follows according to major portfolio segment and specific class:
|
|
|
|
|
|
|
|
|
|
|
|
|
December 31, |
| (In millions) |
2023 |
|
2022 |
|
|
|
|
| Loans held for sale |
$ |
53 |
|
|
$ |
8 |
|
| Commercial: |
|
|
|
Commercial and industrial 1 |
$ |
16,684 |
|
|
$ |
16,377 |
|
| Leasing |
383 |
|
|
386 |
|
| Owner-occupied |
9,219 |
|
|
9,371 |
|
| Municipal |
4,302 |
|
|
4,361 |
|
| Total commercial |
30,588 |
|
|
30,495 |
|
| Commercial real estate: |
|
|
|
| Construction and land development |
2,669 |
|
|
2,513 |
|
| Term |
10,702 |
|
|
10,226 |
|
| Total commercial real estate |
13,371 |
|
|
12,739 |
|
| Consumer: |
|
|
|
| Home equity credit line |
3,356 |
|
|
3,377 |
|
| 1-4 family residential |
8,415 |
|
|
7,286 |
|
| Construction and other consumer real estate |
1,442 |
|
|
1,161 |
|
| Bankcard and other revolving plans |
474 |
|
|
471 |
|
| Other |
133 |
|
|
124 |
|
| Total consumer |
13,820 |
|
|
12,419 |
|
Total loans and leases |
$ |
57,779 |
|
|
$ |
55,653 |
|
1 Commercial and industrial loan balances include Paycheck Protection Program (“PPP”) loans of $77 million and $197 million for the respective periods presented.
Loans and leases are measured and presented at their amortized cost basis, which includes net unamortized purchase premiums, discounts, and deferred loan fees and costs totaling $37 million and $49 million at December 31, 2023, and December 31, 2022, respectively. Amortized cost basis does not include accrued interest receivables of $299 million and $247 million at December 31, 2023, and December 31, 2022, respectively. These receivables are included in “Other assets” on the consolidated balance sheet.
Municipal loans generally include loans to state and local governments (“municipalities”) with the debt service being repaid from general funds or pledged revenues of the municipal entity, or to private commercial entities or 501(c)(3) not-for-profit entities utilizing a pass-through municipal entity to achieve favorable tax treatment.
Land acquisition and development loans included in the construction and land development loan portfolio were $219 million at December 31, 2023 and $262 million at December 31, 2022.
Loans with a carrying value of approximately $36.3 billion at December 31, 2023, and $27.6 billion at December 31, 2022, have been pledged at the Federal Reserve and the Federal Home Loan Bank (“FHLB”) of Des Moines as collateral for current and potential borrowings.
At the time of origination, we determine the classification of loans as either held for investment or held for sale. Loans held for sale are measured individually at fair value or the lower of cost or fair value and primarily consist of (1) CRE loans that are sold into securitization entities, and (2) conforming residential mortgages that are generally sold to U.S. government agencies.
ZIONS BANCORPORATION, NATIONAL ASSOCIATION AND SUBSIDIARIES
The following schedule presents loans added to, or sold from, the held for sale category during the periods presented:
|
|
|
|
|
|
|
|
|
|
|
|
|
|
|
|
|
|
|
Twelve Months Ended
December 31, |
| (In millions) |
2023 |
|
2022 |
|
2021 |
|
|
|
|
|
|
| Loans added to held for sale |
$ |
678 |
|
|
$ |
659 |
|
|
$ |
1,700 |
|
| Loans sold from held for sale |
632 |
|
|
716 |
|
|
1,683 |
|
Occasionally, we have continuing involvement in the sold loans in the form of servicing rights or guarantees. The principal balance of sold loans for which we have retained servicing was approximately $0.4 billion at December 31, 2023, and $3.5 billion at December 31, 2022. During the third quarter of 2023, we sold the servicing rights related to $3.0 billion of mortgage loans. Income from loans sold, excluding servicing, was $16 million in 2023, $14 million in 2022, and $34 million in 2021.
Allowance for Credit Losses
The ACL, which consists of the ALLL and the RULC, represents our estimate of current expected credit losses related to the loan and lease portfolio and unfunded lending commitments as of the balance sheet date. The ACL for AFS and HTM debt securities is estimated separately from loans. For HTM securities, the ACL is assessed consistent with the approach for loans carried at amortized cost. See Note 5 for further discussion on our assessment of expected credit losses on AFS securities and disclosures related to AFS and HTM securities.
The ACL reflects our best estimate of credit losses and is calculated using the loan’s amortized cost basis (principal balance, net of unamortized premiums, discounts, and deferred fees and costs). We do not estimate the ACL for accrued interest receivables because we reverse or write-off uncollectible accrued interest receivable balances in a timely manner, generally within one month.
The methodologies we use to estimate the ACL depend upon the type of loan, the age and contractual term of the loan, expected payments (both contractual and estimated prepayments), credit quality indicators, economic forecasts, and the evaluation method (whether individually or collectively evaluated). Loan extensions or renewals are not considered in the ACL unless they are included in the original or modified loan contract and are not unconditionally cancellable.
Losses are charged to the ACL when recognized. Generally, commercial and CRE loans are charged off or charged down when they are determined to be uncollectible in whole or in part, or when 180 days past due, unless the loan is well-secured and in process of collection. Consumer loans are either charged off or charged down to net realizable value no later than the month in which they become 180 days past due. Closed-end consumer loans that are not secured by residential real estate are either charged off or charged down to net realizable value no later than the month in which they become 120 days past due.
We establish the amount of the ACL by analyzing the portfolio at least quarterly, and we adjust the provision for loan losses and unfunded lending commitments to ensure the ACL is at an appropriate level at the balance sheet date. The ACL is determined based on our review of loans that have similar risk characteristics, which are evaluated on a collective basis, as well as loans that do not have similar risk characteristics, which are evaluated on an individual basis.
For commercial and CRE loans with commitments greater than $1 million, we assign internal risk grades using a comprehensive loan grading system based on financial and statistical models, individual credit analysis, and loan officer experience and judgment. The credit quality indicators described subsequently are based on this grading system. Estimated credit losses on all loan segments, including consumer and small commercial and CRE loans with commitments less than or equal to $1 million that are evaluated on a collective basis, are derived from statistical analyses of our historical default and loss experience since January 2008.
ZIONS BANCORPORATION, NATIONAL ASSOCIATION AND SUBSIDIARIES
We estimate current expected credit losses for each loan, which includes considerations of historical credit loss experience, current conditions, and reasonable and supportable forecasts about the future. We use the following two types of credit loss estimation models:
•Econometric loss models, which rely on statistical analyses of our historical loss experience dependent upon economic factors and other loan-level characteristics. Statistically relevant economic factors vary depending upon the type of loan, but include variables such as unemployment, real estate price indices, energy prices, gross domestic product (“GDP”), etc. The models use multiple economic scenarios that reflect optimistic, baseline, and stressed economic conditions. The results derived using these economic scenarios are weighted to produce the credit loss estimate. Management may adjust the weights to reflect management’s assessment of current conditions and reasonable and supportable forecasts.
•Loss models that are based on our long-term average historical credit loss experience since 2008, which rely on statistical analyses of our historical loss experience dependent upon loan-level characteristics.
Credit loss estimates for the first 12 months of a loan’s remaining life are derived using econometric loss models. Over a subsequent 12-month reversion period, we blend the estimated credit losses from the two models on a straight-line basis. For the remaining life of the loan, the estimated credit losses are derived from the long-term average historical credit loss models.
For loans that do not share risk characteristics with other loans, we estimate lifetime expected credit losses on an individual basis. These include nonaccrual loans with a balance greater than $1 million. When a loan is individually evaluated for expected credit losses, we estimate a specific reserve for the loan based on either the projected present value of the loan’s future cash flows discounted at the loan’s effective interest rate, the observable market price of the loan, or the fair value of the loan’s underlying collateral.
When we base the specific reserve on the fair value of the loan’s underlying collateral, we generally charge-off the portion of the balance that is greater than fair value. For these loans, subsequent to the charge-off, if the fair value of the loan’s underlying collateral increases according to an updated appraisal, we establish a negative reserve up to the lesser of the amount of the charge-off or the updated fair value.
The methodologies described previously generally rely on historical loss information to help determine our quantitative portion of the ACL. However, we also consider other qualitative and environmental factors related to current conditions and reasonable and supportable forecasts that may indicate current expected credit losses may differ from the historical information reflected in our quantitative models. Thus, after applying historical loss experience, as described above, we review the quantitative portion of ACL for each segment. We monitor various risk factors that influence our judgment regarding the level of the ACL across the portfolio segments. These factors primarily include:
•Actual and expected changes in international, national, regional, and local economic and business conditions and developments;
•The volume and severity of past due loans, the volume of nonaccrual loans, and the volume and severity of adversely classified or graded loans;
•Lending policies and procedures, including changes in underwriting standards and practices for collection, charge-off, and recovery;
•The experience, ability, and depth of lending management and other relevant staff;
•The nature and volume of the portfolio;
•The quality of the credit review function;
•The existence, growth, and effect of any concentration of credit;
•The effect of other external factors such as regulatory, legal, and technological environments; fiscal and monetary actions; competition; and events such as natural disasters and pandemics.
The magnitude of the impact of these factors on our qualitative assessment of the ACL changes from quarter to quarter according to changes made by management in its assessment of these factors, the extent these factors are already reflected in quantitative loss estimates, and the extent changes in these factors diverge from one to another.
ZIONS BANCORPORATION, NATIONAL ASSOCIATION AND SUBSIDIARIES
We also consider the uncertainty and imprecision inherent in the estimation process when evaluating the ACL.
Off-balance Sheet Credit Exposures
As previously mentioned, we estimate current expected credit losses for off-balance sheet loan commitments, including letters of credit that are not unconditionally cancellable. This estimate uses the same procedures and methodologies described previously for loans and is calculated by taking the difference between the estimated current expected credit loss and the funded balance, if greater than zero.
Changes in the Allowance for Credit Losses
Changes in the ACL are summarized as follows:
|
|
|
|
|
|
|
|
|
|
|
|
|
|
|
|
|
|
|
|
|
|
|
|
|
|
|
December 31, 2023 |
|
(In millions)
|
Commercial |
|
Commercial
real estate |
|
Consumer |
|
|
|
Total |
| Allowance for loan and lease losses |
|
|
|
|
|
|
|
|
|
| Balance at December 31, 2022 |
$ |
300 |
|
|
$ |
156 |
|
|
$ |
119 |
|
|
|
|
$ |
575 |
|
| Adjustment for change in accounting standard |
— |
|
|
(4) |
|
|
1 |
|
|
|
|
(3) |
|
| Balance at beginning of year |
$ |
300 |
|
|
$ |
152 |
|
|
$ |
120 |
|
|
|
|
$ |
572 |
|
| Provision for loan losses |
27 |
|
|
92 |
|
|
29 |
|
|
|
|
148 |
|
| Gross loan and lease charge-offs |
45 |
|
|
3 |
|
|
14 |
|
|
|
|
62 |
|
| Recoveries |
20 |
|
|
— |
|
|
6 |
|
|
|
|
26 |
|
| Net loan and lease charge-offs (recoveries) |
25 |
|
|
3 |
|
|
8 |
|
|
|
|
36 |
|
| Balance at end of year |
$ |
302 |
|
|
$ |
241 |
|
|
$ |
141 |
|
|
|
|
$ |
684 |
|
| Reserve for unfunded lending commitments |
|
|
|
|
|
|
|
|
|
| Balance at beginning of year |
$ |
16 |
|
|
$ |
33 |
|
|
$ |
12 |
|
|
|
|
$ |
61 |
|
| Provision for unfunded lending commitments |
3 |
|
|
(16) |
|
|
(3) |
|
|
|
|
(16) |
|
| Balance at end of year |
$ |
19 |
|
|
$ |
17 |
|
|
$ |
9 |
|
|
|
|
$ |
45 |
|
| Total allowance for credit losses |
|
|
|
|
|
|
|
|
|
| Allowance for loan and lease losses |
$ |
302 |
|
|
$ |
241 |
|
|
$ |
141 |
|
|
|
|
$ |
684 |
|
| Reserve for unfunded lending commitments |
19 |
|
|
17 |
|
|
9 |
|
|
|
|
45 |
|
| Total allowance for credit losses |
$ |
321 |
|
|
$ |
258 |
|
|
$ |
150 |
|
|
|
|
$ |
729 |
|
|
|
|
|
|
|
|
|
|
|
|
|
|
|
|
|
|
|
|
|
|
|
|
|
|
|
|
December 31, 2022 |
| (In millions) |
Commercial |
|
Commercial
real estate |
|
Consumer |
|
|
|
Total |
| Allowance for loan and lease losses |
|
|
|
|
|
|
|
|
|
| Balance at beginning of year |
$ |
311 |
|
|
$ |
107 |
|
|
$ |
95 |
|
|
|
|
$ |
513 |
|
| Provision for loan losses |
29 |
|
|
49 |
|
|
23 |
|
|
|
|
101 |
|
| Gross loan and lease charge-offs |
72 |
|
|
— |
|
|
10 |
|
|
|
|
82 |
|
| Recoveries |
32 |
|
|
— |
|
|
11 |
|
|
|
|
43 |
|
| Net loan and lease charge-offs (recoveries) |
40 |
|
|
— |
|
|
(1) |
|
|
|
|
39 |
|
| Balance at end of year |
$ |
300 |
|
|
$ |
156 |
|
|
$ |
119 |
|
|
|
|
$ |
575 |
|
| Reserve for unfunded lending commitments |
|
|
|
|
|
|
|
|
|
| Balance at beginning of year |
$ |
19 |
|
|
$ |
11 |
|
|
$ |
10 |
|
|
|
|
$ |
40 |
|
| Provision for unfunded lending commitments |
(3) |
|
|
22 |
|
|
2 |
|
|
|
|
21 |
|
| Balance at end of year |
$ |
16 |
|
|
$ |
33 |
|
|
$ |
12 |
|
|
|
|
$ |
61 |
|
| Total allowance for credit losses |
|
|
|
|
|
|
|
|
|
| Allowance for loan and lease losses |
$ |
300 |
|
|
$ |
156 |
|
|
$ |
119 |
|
|
|
|
$ |
575 |
|
| Reserve for unfunded lending commitments |
16 |
|
|
33 |
|
|
12 |
|
|
|
|
61 |
|
| Total allowance for credit losses |
$ |
316 |
|
|
$ |
189 |
|
|
$ |
131 |
|
|
|
|
$ |
636 |
|
ZIONS BANCORPORATION, NATIONAL ASSOCIATION AND SUBSIDIARIES
Nonaccrual Loans
Loans are generally placed on nonaccrual status when payment in full of principal and interest is not expected, or the loan is 90 days or more past due as to principal or interest, unless the loan is both well-secured and in the process of collection. Factors we consider in determining whether a loan is placed on nonaccrual include delinquency status, collateral value, borrower or guarantor financial statement information, bankruptcy status, and other information which would indicate that the full and timely collection of interest and principal is uncertain.
A nonaccrual loan may be returned to accrual status when (1) all delinquent interest and principal become current in accordance with the terms of the loan agreement; (2) the loan, if secured, is well-secured; (3) the borrower has paid according to the contractual terms for a minimum of six months; and (4) an analysis of the borrower indicates a reasonable assurance of the borrower’s ability and willingness to maintain payments. The amortized cost basis of loans on nonaccrual status is summarized as follows:
|
|
|
|
|
|
|
|
|
|
|
|
|
|
|
|
|
|
|
|
|
|
|
|
|
December 31, 2023 |
|
Amortized cost basis |
|
Total amortized cost basis |
|
|
| (In millions) |
with no allowance |
|
with allowance |
|
|
Related allowance |
|
|
|
|
|
|
|
|
|
|
|
|
|
|
|
|
|
|
|
|
|
|
|
|
| Commercial: |
|
|
|
|
|
|
|
| Commercial and industrial |
$ |
11 |
|
|
$ |
71 |
|
|
$ |
82 |
|
|
$ |
30 |
|
| Leasing |
— |
|
|
2 |
|
|
2 |
|
|
1 |
|
| Owner-occupied |
12 |
|
|
8 |
|
|
20 |
|
|
1 |
|
|
|
|
|
|
|
|
|
| Total commercial |
23 |
|
|
81 |
|
|
104 |
|
|
32 |
|
| Commercial real estate: |
|
|
|
|
|
|
|
| Construction and land development |
22 |
|
|
— |
|
|
22 |
|
|
— |
|
| Term |
37 |
|
|
2 |
|
|
39 |
|
|
1 |
|
| Total commercial real estate |
59 |
|
|
2 |
|
|
61 |
|
|
1 |
|
| Consumer: |
|
|
|
|
|
|
|
| Home equity credit line |
1 |
|
|
16 |
|
|
17 |
|
|
5 |
|
| 1-4 family residential |
8 |
|
|
32 |
|
|
40 |
|
|
5 |
|
|
|
|
|
|
|
|
|
|
|
|
|
|
|
|
|
|
|
|
|
|
|
|
|
| Total consumer loans |
9 |
|
|
48 |
|
|
57 |
|
|
10 |
|
| Total |
$ |
91 |
|
|
$ |
131 |
|
|
$ |
222 |
|
|
$ |
43 |
|
|
|
|
|
|
|
|
|
|
|
|
|
|
|
|
|
|
|
|
|
|
|
|
|
|
December 31, 2022 |
|
Amortized cost basis |
|
Total amortized cost basis |
|
|
| (In millions) |
with no allowance |
|
with allowance |
|
|
Related allowance |
|
|
|
|
|
|
|
|
|
|
|
|
|
|
|
|
|
|
|
|
|
|
|
|
| Commercial: |
|
|
|
|
|
|
|
| Commercial and industrial |
$ |
8 |
|
|
$ |
55 |
|
|
$ |
63 |
|
|
$ |
27 |
|
|
|
|
|
|
|
|
|
| Owner-occupied |
13 |
|
|
11 |
|
|
24 |
|
|
1 |
|
|
|
|
|
|
|
|
|
| Total commercial |
21 |
|
|
66 |
|
|
87 |
|
|
28 |
|
| Commercial real estate: |
|
|
|
|
|
|
|
|
|
|
|
|
|
|
|
| Term |
— |
|
|
14 |
|
|
14 |
|
|
2 |
|
| Total commercial real estate |
— |
|
|
14 |
|
|
14 |
|
|
2 |
|
| Consumer: |
|
|
|
|
|
|
|
| Home equity credit line |
1 |
|
|
10 |
|
|
11 |
|
|
2 |
|
| 1-4 family residential |
9 |
|
|
28 |
|
|
37 |
|
|
3 |
|
|
|
|
|
|
|
|
|
|
|
|
|
|
|
|
|
|
|
|
|
|
|
|
|
| Total consumer loans |
10 |
|
|
38 |
|
|
48 |
|
|
5 |
|
| Total |
$ |
31 |
|
|
$ |
118 |
|
|
$ |
149 |
|
|
$ |
35 |
|
ZIONS BANCORPORATION, NATIONAL ASSOCIATION AND SUBSIDIARIES
For accruing loans, interest is accrued and interest payments are recognized into interest income according to the contractual loan agreement. For nonaccruing loans, the accrual of interest is discontinued, any uncollected or accrued interest is reversed from interest income in a timely manner (generally within one month), and any payments received on these loans are not recognized into interest income, but are applied as a reduction to the principal outstanding. When the collectibility of the amortized cost basis for a nonaccrual loan is no longer in doubt, then interest payments may be recognized in interest income on a cash basis. For 2023 and 2022, there was no interest income recognized on a cash basis during the period the loans were on nonaccrual.
The amount of accrued interest receivables reversed from interest income during the periods presented is summarized by loan portfolio segment as follows:
|
|
|
|
|
|
|
|
|
|
|
|
|
|
|
|
|
|
|
Twelve Months Ended
December 31, |
| (In millions) |
2023 |
|
2022 |
|
2021 |
|
|
|
|
|
|
| Commercial |
$ |
10 |
|
|
$ |
12 |
|
|
$ |
15 |
|
| Commercial real estate |
3 |
|
|
1 |
|
|
2 |
|
| Consumer |
2 |
|
|
— |
|
|
— |
|
| Total |
$ |
15 |
|
|
$ |
13 |
|
|
$ |
17 |
|
Past Due Loans
Closed-end loans with payments scheduled monthly are reported as past due when the borrower is in arrears for two or more monthly payments. Similarly, open-end credits, such as bankcard and other revolving credit plans, are reported as past due when the minimum payment has not been made for two or more billing cycles. Other multi-payment obligations (i.e., quarterly, semi-annual, etc.), single payment, and demand notes, are reported as past due when either principal or interest is due and unpaid for a period of 30 days or more.
Past-due loans (accruing and nonaccruing) are summarized as follows:
|
|
|
|
|
|
|
|
|
|
|
|
|
|
|
|
|
|
|
|
|
|
|
|
|
|
|
|
|
|
|
|
|
|
|
|
|
|
|
|
|
|
|
December 31, 2023 |
| (In millions) |
Current |
|
30-89 days
past due |
|
90+ days
past due |
|
Total
past due |
|
Total
loans |
|
Accruing
loans
90+ days
past due |
|
Nonaccrual
loans
that are
current1
|
|
|
|
|
|
|
|
|
|
|
|
|
|
|
|
|
|
|
|
|
|
|
|
|
|
|
|
|
| Commercial: |
|
|
|
|
|
|
|
|
|
|
|
|
|
| Commercial and industrial |
$ |
16,631 |
|
|
$ |
38 |
|
|
$ |
15 |
|
|
$ |
53 |
|
|
$ |
16,684 |
|
|
$ |
1 |
|
|
$ |
65 |
|
| Leasing |
381 |
|
|
2 |
|
|
— |
|
|
2 |
|
|
383 |
|
|
— |
|
|
— |
|
| Owner-occupied |
9,206 |
|
|
11 |
|
|
2 |
|
|
13 |
|
|
9,219 |
|
|
1 |
|
|
18 |
|
| Municipal |
4,301 |
|
|
1 |
|
|
— |
|
|
1 |
|
|
4,302 |
|
|
— |
|
|
— |
|
| Total commercial |
30,519 |
|
|
52 |
|
|
17 |
|
|
69 |
|
|
30,588 |
|
|
2 |
|
|
83 |
|
| Commercial real estate: |
|
|
|
|
|
|
|
|
|
|
|
|
|
Construction and land development |
2,645 |
|
|
2 |
|
|
22 |
|
|
24 |
|
|
2,669 |
|
|
— |
|
|
— |
|
| Term |
10,661 |
|
|
14 |
|
|
27 |
|
|
41 |
|
|
10,702 |
|
|
— |
|
|
3 |
|
| Total commercial real estate |
13,306 |
|
|
16 |
|
|
49 |
|
|
65 |
|
|
13,371 |
|
|
— |
|
|
3 |
|
| Consumer: |
|
|
|
|
|
|
|
|
|
|
|
|
|
| Home equity credit line |
3,334 |
|
|
17 |
|
|
5 |
|
|
22 |
|
|
3,356 |
|
|
— |
|
|
9 |
|
| 1-4 family residential |
8,375 |
|
|
17 |
|
|
23 |
|
|
40 |
|
|
8,415 |
|
|
— |
|
|
13 |
|
Construction and other consumer real estate |
1,442 |
|
|
— |
|
|
— |
|
|
— |
|
|
1,442 |
|
|
|
|
— |
|
Bankcard and other revolving plans |
468 |
|
|
5 |
|
|
1 |
|
|
6 |
|
|
474 |
|
|
1 |
|
|
— |
|
| Other |
132 |
|
|
1 |
|
|
— |
|
|
1 |
|
|
133 |
|
|
— |
|
|
— |
|
| Total consumer loans |
13,751 |
|
|
40 |
|
|
29 |
|
|
69 |
|
|
13,820 |
|
|
1 |
|
|
22 |
|
| Total |
$ |
57,576 |
|
|
$ |
108 |
|
|
$ |
95 |
|
|
$ |
203 |
|
|
$ |
57,779 |
|
|
$ |
3 |
|
|
$ |
108 |
|
ZIONS BANCORPORATION, NATIONAL ASSOCIATION AND SUBSIDIARIES
|
|
|
|
|
|
|
|
|
|
|
|
|
|
|
|
|
|
|
|
|
|
|
|
|
|
|
|
|
|
|
|
|
|
|
|
|
|
|
|
|
|
|
December 31, 2022 |
| (In millions) |
Current |
|
30-89 days
past due |
|
90+ days
past due |
|
Total
past due |
|
Total
loans |
|
Accruing
loans
90+ days
past due |
|
Nonaccrual
loans
that are
current1
|
|
|
|
|
|
|
|
|
|
|
|
|
|
|
|
|
|
|
|
|
|
|
|
|
|
|
|
|
| Commercial: |
|
|
|
|
|
|
|
|
|
|
|
|
|
| Commercial and industrial |
$ |
16,331 |
|
|
$ |
24 |
|
|
$ |
22 |
|
|
$ |
46 |
|
|
$ |
16,377 |
|
|
$ |
4 |
|
|
$ |
45 |
|
| Leasing |
386 |
|
|
— |
|
|
— |
|
|
— |
|
|
386 |
|
|
— |
|
|
— |
|
| Owner-occupied |
9,344 |
|
|
20 |
|
|
7 |
|
|
27 |
|
|
9,371 |
|
|
1 |
|
|
15 |
|
| Municipal |
4,361 |
|
|
— |
|
|
— |
|
|
— |
|
|
4,361 |
|
|
— |
|
|
— |
|
| Total commercial |
30,422 |
|
|
44 |
|
|
29 |
|
|
73 |
|
|
30,495 |
|
|
5 |
|
|
60 |
|
| Commercial real estate: |
|
|
|
|
|
|
|
|
|
|
|
|
|
Construction and land development |
2,511 |
|
|
2 |
|
|
— |
|
|
2 |
|
|
2,513 |
|
|
— |
|
|
— |
|
| Term |
10,179 |
|
|
37 |
|
|
10 |
|
|
47 |
|
|
10,226 |
|
|
— |
|
|
4 |
|
| Total commercial real estate |
12,690 |
|
|
39 |
|
|
10 |
|
|
49 |
|
|
12,739 |
|
|
— |
|
|
4 |
|
| Consumer: |
|
|
|
|
|
|
|
|
|
|
|
|
|
| Home equity credit line |
3,369 |
|
|
5 |
|
|
3 |
|
|
8 |
|
|
3,377 |
|
|
— |
|
|
6 |
|
| 1-4 family residential |
7,258 |
|
|
9 |
|
|
19 |
|
|
28 |
|
|
7,286 |
|
|
— |
|
|
16 |
|
Construction and other consumer real estate |
1,161 |
|
|
— |
|
|
— |
|
|
— |
|
|
1,161 |
|
|
— |
|
|
— |
|
Bankcard and other revolving plans |
467 |
|
|
3 |
|
|
1 |
|
|
4 |
|
|
471 |
|
|
1 |
|
|
— |
|
| Other |
124 |
|
|
— |
|
|
— |
|
|
— |
|
|
124 |
|
|
— |
|
|
— |
|
| Total consumer loans |
12,379 |
|
|
17 |
|
|
23 |
|
|
40 |
|
|
12,419 |
|
|
1 |
|
|
22 |
|
| Total |
$ |
55,491 |
|
|
$ |
100 |
|
|
$ |
62 |
|
|
$ |
162 |
|
|
$ |
55,653 |
|
|
$ |
6 |
|
|
$ |
86 |
|
1 Represents nonaccrual loans that are not past due more than 30 days; however, full payment of principal and interest is not expected.
Credit Quality Indicators
In addition to the nonaccrual and past due criteria, we also analyze loans using loan risk-grading systems, which vary based on the size and type of credit risk exposure. The internal risk-grades assigned to loans follow our definitions of Pass, Special Mention, Substandard, and Doubtful, which are consistent with published definitions of regulatory risk classifications.
Definitions of Pass, Special Mention, Substandard, and Doubtful are summarized as follows:
•Pass — A Pass asset is higher-quality and does not fit any of the other categories described below. The likelihood of loss is considered low.
•Special Mention — A Special Mention asset has potential weaknesses that deserve management’s close attention. If left uncorrected, these potential weaknesses may result in deterioration of the repayment prospects for the asset or in our credit position at some future date.
•Substandard — A Substandard asset is inadequately protected by the current sound worth and paying capacity of the obligor or of the collateral pledged, if any. Assets so classified have well-defined weaknesses and are characterized by the distinct possibility that we may sustain some loss if deficiencies are not corrected.
•Doubtful — A Doubtful asset has all the weaknesses inherent in a Substandard asset with the added characteristics that the weaknesses make collection or liquidation in full highly questionable and improbable.
There were no loans classified as Doubtful at both December 31, 2023, and December 31, 2022.
For commercial and CRE loans with commitments greater than $1 million, we assign one of multiple grades within the Pass classification or one of the risk classifications described previously. We assess our internal risk-grades quarterly, or as soon as we identify information that affects the credit risk of the loan.
ZIONS BANCORPORATION, NATIONAL ASSOCIATION AND SUBSIDIARIES
For consumer loans and for commercial and CRE loans with commitments less than or equal to $1 million, we generally assign internal risk-grades similar to those described previously based on automated rules that depend on refreshed credit scores, payment performance, and other risk indicators. These are generally assigned either a Pass, Special Mention, or Substandard grade, and are reviewed as we identify information that might warrant a grade change.
The following schedule presents the amortized cost basis of loans and leases categorized by year of origination and by credit quality classifications as monitored by management, as well as year-to-date gross charge-offs:
ZIONS BANCORPORATION, NATIONAL ASSOCIATION AND SUBSIDIARIES
|
|
|
|
|
|
|
|
|
|
|
|
|
|
|
|
|
|
|
|
|
|
|
|
|
|
|
|
|
|
|
|
|
|
December 31, 2023 |
|
|
Term Loans |
Revolving loans amortized cost basis |
Revolving loans converted to term loans amortized cost basis |
|
|
|
Amortized cost basis by year of origination |
|
|
| (In millions) |
2023 |
2022 |
2021 |
2020 |
2019 |
Prior |
Total |
|
| Commercial: |
|
|
|
|
|
|
|
|
|
|
| Commercial and industrial |
|
|
|
|
|
|
|
|
|
|
| Pass |
$ |
2,654 |
|
$ |
2,420 |
|
$ |
1,204 |
|
$ |
639 |
|
$ |
494 |
|
$ |
598 |
|
$ |
7,973 |
|
$ |
151 |
|
$ |
16,133 |
|
|
| Special Mention |
8 |
|
98 |
|
34 |
|
2 |
|
20 |
|
37 |
|
103 |
|
— |
|
302 |
|
|
| Accruing Substandard |
11 |
|
18 |
|
7 |
|
2 |
|
19 |
|
8 |
|
99 |
|
3 |
|
167 |
|
|
| Nonaccrual |
5 |
|
36 |
|
1 |
|
2 |
|
11 |
|
1 |
|
21 |
|
5 |
|
82 |
|
|
| Total commercial and industrial |
2,678 |
|
2,572 |
|
1,246 |
|
645 |
|
544 |
|
644 |
|
8,196 |
|
159 |
|
16,684 |
|
|
| Gross charge-offs |
1 |
|
10 |
|
6 |
|
— |
|
— |
|
2 |
|
24 |
|
2 |
|
45 |
|
|
| Leasing |
|
|
|
|
|
|
|
|
|
|
| Pass |
104 |
|
125 |
|
47 |
|
29 |
|
45 |
|
18 |
|
— |
|
— |
|
368 |
|
|
| Special Mention |
2 |
|
9 |
|
1 |
|
1 |
|
— |
|
— |
|
— |
|
— |
|
13 |
|
|
| Accruing Substandard |
— |
|
— |
|
— |
|
— |
|
— |
|
— |
|
— |
|
— |
|
— |
|
|
| Nonaccrual |
— |
|
2 |
|
— |
|
— |
|
— |
|
— |
|
— |
|
— |
|
2 |
|
|
| Total leasing |
106 |
|
136 |
|
48 |
|
30 |
|
45 |
|
18 |
|
— |
|
— |
|
383 |
|
|
| Gross charge-offs |
— |
|
— |
|
— |
|
— |
|
— |
|
— |
|
— |
|
— |
|
— |
|
|
| Owner-occupied |
|
|
|
|
|
|
|
|
|
|
| Pass |
1,080 |
|
1,945 |
|
2,020 |
|
1,002 |
|
721 |
|
1,907 |
|
212 |
|
52 |
|
8,939 |
|
|
| Special Mention |
2 |
|
5 |
|
17 |
|
5 |
|
17 |
|
15 |
|
— |
|
— |
|
61 |
|
|
| Accruing Substandard |
10 |
|
31 |
|
29 |
|
21 |
|
16 |
|
90 |
|
2 |
|
— |
|
199 |
|
|
| Nonaccrual |
— |
|
1 |
|
1 |
|
7 |
|
3 |
|
8 |
|
— |
|
— |
|
20 |
|
|
| Total owner-occupied |
1,092 |
|
1,982 |
|
2,067 |
|
1,035 |
|
757 |
|
2,020 |
|
214 |
|
52 |
|
9,219 |
|
|
| Gross charge-offs |
— |
|
— |
|
— |
|
— |
|
— |
|
— |
|
— |
|
— |
|
— |
|
|
| Municipal |
|
|
|
|
|
|
|
|
|
|
| Pass |
601 |
|
1,080 |
|
1,069 |
|
623 |
|
382 |
|
512 |
|
— |
|
3 |
|
4,270 |
|
|
| Special Mention |
7 |
|
— |
|
— |
|
— |
|
— |
|
6 |
|
— |
|
— |
|
13 |
|
|
| Accruing Substandard |
8 |
|
— |
|
6 |
|
3 |
|
1 |
|
1 |
|
— |
|
— |
|
19 |
|
|
| Nonaccrual |
— |
|
— |
|
— |
|
— |
|
— |
|
— |
|
— |
|
— |
|
— |
|
|
| Total municipal |
616 |
|
1,080 |
|
1,075 |
|
626 |
|
383 |
|
519 |
|
— |
|
3 |
|
4,302 |
|
|
| Gross charge-offs |
— |
|
— |
|
— |
|
— |
|
— |
|
— |
|
— |
|
— |
|
— |
|
|
| Total commercial |
4,492 |
|
5,770 |
|
4,436 |
|
2,336 |
|
1,729 |
|
3,201 |
|
8,410 |
|
214 |
|
30,588 |
|
|
| Total commercial gross charge-offs |
1 |
|
10 |
|
6 |
|
— |
|
— |
|
2 |
|
24 |
|
2 |
|
45 |
|
|
| Commercial real estate: |
|
|
|
|
|
|
|
|
|
|
| Construction and land development |
|
|
|
|
|
|
|
|
| Pass |
553 |
|
938 |
|
355 |
|
56 |
|
7 |
|
4 |
|
518 |
|
127 |
|
2,558 |
|
|
| Special Mention |
— |
|
— |
|
29 |
|
30 |
|
— |
|
— |
|
— |
|
— |
|
59 |
|
|
| Accruing Substandard |
23 |
|
2 |
|
— |
|
5 |
|
— |
|
— |
|
— |
|
— |
|
30 |
|
|
| Nonaccrual |
— |
|
— |
|
— |
|
— |
|
21 |
|
— |
|
1 |
|
— |
|
22 |
|
|
| Total construction and land development |
576 |
|
940 |
|
384 |
|
91 |
|
28 |
|
4 |
|
519 |
|
127 |
|
2,669 |
|
|
| Gross charge-offs |
— |
|
— |
|
— |
|
— |
|
1 |
|
— |
|
— |
|
— |
|
1 |
|
|
| Term |
|
|
|
|
|
|
|
|
|
|
| Pass |
1,861 |
|
2,385 |
|
1,833 |
|
1,449 |
|
804 |
|
1,438 |
|
238 |
|
110 |
|
10,118 |
|
|
| Special Mention |
55 |
|
108 |
|
65 |
|
78 |
|
44 |
|
6 |
|
— |
|
— |
|
356 |
|
|
| Accruing Substandard |
79 |
|
18 |
|
12 |
|
16 |
|
5 |
|
24 |
|
— |
|
35 |
|
189 |
|
|
| Nonaccrual |
— |
|
26 |
|
— |
|
— |
|
3 |
|
10 |
|
— |
|
— |
|
39 |
|
|
| Total term |
1,995 |
|
2,537 |
|
1,910 |
|
1,543 |
|
856 |
|
1,478 |
|
238 |
|
145 |
|
10,702 |
|
|
| Gross charge-offs |
— |
|
2 |
|
— |
|
— |
|
— |
|
— |
|
— |
|
— |
|
2 |
|
|
| Total commercial real estate |
2,571 |
|
3,477 |
|
2,294 |
|
1,634 |
|
884 |
|
1,482 |
|
757 |
|
272 |
|
13,371 |
|
|
| Total commercial real estate gross charge-offs |
— |
|
2 |
|
— |
|
— |
|
1 |
|
— |
|
— |
|
— |
|
3 |
|
|
ZIONS BANCORPORATION, NATIONAL ASSOCIATION AND SUBSIDIARIES
|
|
|
|
|
|
|
|
|
|
|
|
|
|
|
|
|
|
|
|
|
|
|
|
|
|
|
|
|
|
|
|
|
|
December 31, 2023 |
|
|
Term Loans |
Revolving loans amortized cost basis |
Revolving loans converted to term loans amortized cost basis |
|
|
|
Amortized cost basis by year of origination |
|
|
| (In millions) |
2023 |
2022 |
2021 |
2020 |
2019 |
Prior |
Total |
|
|
|
|
|
|
|
|
|
|
|
|
|
|
|
|
|
|
|
|
|
|
|
|
|
|
|
|
|
|
|
|
|
|
|
|
|
|
|
|
|
|
|
|
|
|
|
|
|
|
|
|
|
|
|
|
|
|
|
|
|
|
|
|
|
|
|
|
|
|
|
|
|
|
|
|
|
|
|
|
|
|
|
|
|
|
|
|
|
|
|
|
|
|
|
|
|
|
|
|
|
|
|
|
|
|
|
|
|
|
|
|
|
|
|
|
|
|
|
|
|
|
|
|
|
|
|
|
|
|
|
|
|
|
|
|
|
|
|
|
|
|
|
|
|
|
|
|
|
|
|
|
|
| Consumer: |
|
|
|
|
|
|
|
|
|
|
| Home equity credit line |
|
|
|
|
|
|
|
|
|
|
| Pass |
— |
|
— |
|
— |
|
— |
|
— |
|
— |
|
3,237 |
|
97 |
|
3,334 |
|
|
| Special Mention |
— |
|
— |
|
— |
|
— |
|
— |
|
— |
|
— |
|
— |
|
— |
|
|
| Accruing Substandard |
— |
|
— |
|
— |
|
— |
|
— |
|
— |
|
4 |
|
1 |
|
5 |
|
|
| Nonaccrual |
— |
|
— |
|
— |
|
— |
|
— |
|
— |
|
15 |
|
2 |
|
17 |
|
|
| Total home equity credit line |
— |
|
— |
|
— |
|
— |
|
— |
|
— |
|
3,256 |
|
100 |
|
3,356 |
|
|
| Gross charge-offs |
— |
|
— |
|
— |
|
— |
|
— |
|
— |
|
3 |
|
— |
|
3 |
|
|
| 1-4 family residential |
|
|
|
|
|
|
|
|
|
|
| Pass |
814 |
|
2,264 |
|
1,823 |
|
988 |
|
594 |
|
1,891 |
|
— |
|
— |
|
8,374 |
|
|
| Special Mention |
— |
|
— |
|
— |
|
— |
|
— |
|
— |
|
— |
|
— |
|
— |
|
|
| Accruing Substandard |
— |
|
— |
|
— |
|
— |
|
— |
|
1 |
|
— |
|
— |
|
1 |
|
|
| Nonaccrual |
— |
|
3 |
|
3 |
|
3 |
|
4 |
|
27 |
|
— |
|
— |
|
40 |
|
|
| Total 1-4 family residential |
814 |
|
2,267 |
|
1,826 |
|
991 |
|
598 |
|
1,919 |
|
— |
|
— |
|
8,415 |
|
|
| Gross charge-offs |
— |
|
— |
|
— |
|
— |
|
— |
|
2 |
|
— |
|
— |
|
2 |
|
|
| Construction and other consumer real estate |
|
|
|
|
|
|
|
|
| Pass |
212 |
|
1,002 |
|
200 |
|
15 |
|
7 |
|
6 |
|
— |
|
— |
|
1,442 |
|
|
| Special Mention |
— |
|
— |
|
— |
|
— |
|
— |
|
— |
|
— |
|
— |
|
— |
|
|
| Accruing Substandard |
— |
|
— |
|
— |
|
— |
|
— |
|
— |
|
— |
|
— |
|
— |
|
|
| Nonaccrual |
— |
|
— |
|
— |
|
— |
|
— |
|
— |
|
— |
|
— |
|
— |
|
|
| Total construction and other consumer real estate |
212 |
|
1,002 |
|
200 |
|
15 |
|
7 |
|
6 |
|
— |
|
— |
|
1,442 |
|
|
| Gross charge-offs |
— |
|
— |
|
— |
|
— |
|
— |
|
— |
|
— |
|
— |
|
— |
|
|
| Bankcard and other revolving plans |
|
|
|
|
|
|
|
|
|
| Pass |
— |
|
— |
|
— |
|
— |
|
— |
|
— |
|
471 |
|
1 |
|
472 |
|
|
| Special Mention |
— |
|
— |
|
— |
|
— |
|
— |
|
— |
|
— |
|
— |
|
— |
|
|
| Accruing Substandard |
— |
|
— |
|
— |
|
— |
|
— |
|
— |
|
2 |
|
— |
|
2 |
|
|
| Nonaccrual |
— |
|
— |
|
— |
|
— |
|
— |
|
— |
|
— |
|
— |
|
— |
|
|
| Total bankcard and other revolving plans |
— |
|
— |
|
— |
|
— |
|
— |
|
— |
|
473 |
|
1 |
|
474 |
|
|
| Gross charge-offs |
— |
|
— |
|
— |
|
— |
|
— |
|
— |
|
9 |
|
— |
|
9 |
|
|
| Other consumer |
|
|
|
|
|
|
|
|
|
|
| Pass |
66 |
|
37 |
|
18 |
|
6 |
|
4 |
|
2 |
|
— |
|
— |
|
133 |
|
|
| Special Mention |
— |
|
— |
|
— |
|
— |
|
— |
|
— |
|
— |
|
— |
|
— |
|
|
| Accruing Substandard |
— |
|
— |
|
— |
|
— |
|
— |
|
— |
|
— |
|
— |
|
— |
|
|
| Nonaccrual |
— |
|
— |
|
— |
|
— |
|
— |
|
— |
|
— |
|
— |
|
— |
|
|
| Total other consumer |
66 |
|
37 |
|
18 |
|
6 |
|
4 |
|
2 |
|
— |
|
— |
|
133 |
|
|
| Gross charge-offs |
— |
|
— |
|
— |
|
— |
|
— |
|
— |
|
— |
|
— |
|
— |
|
|
| Total consumer |
1,092 |
|
3,306 |
|
2,044 |
|
1,012 |
|
609 |
|
1,927 |
|
3,729 |
|
101 |
|
13,820 |
|
|
| Total consumer gross charge-offs |
— |
|
— |
|
— |
|
— |
|
— |
|
2 |
|
12 |
|
— |
|
14 |
|
|
| Total loans |
$ |
8,155 |
|
$ |
12,553 |
|
$ |
8,774 |
|
$ |
4,982 |
|
$ |
3,222 |
|
$ |
6,610 |
|
$ |
12,896 |
|
$ |
587 |
|
$ |
57,779 |
|
|
| Total gross charge-offs |
$ |
1 |
|
$ |
12 |
|
$ |
6 |
|
$ |
— |
|
$ |
1 |
|
$ |
4 |
|
$ |
36 |
|
$ |
2 |
|
$ |
62 |
|
|
ZIONS BANCORPORATION, NATIONAL ASSOCIATION AND SUBSIDIARIES
|
|
|
|
|
|
|
|
|
|
|
|
|
|
|
|
|
|
|
|
|
|
|
|
|
|
|
|
|
|
|
|
|
|
December 31, 2022 |
|
|
Term Loans |
Revolving loans amortized cost basis |
Revolving loans converted to term loans amortized cost basis |
|
|
|
Amortized cost basis by year of origination |
|
|
| (In millions) |
2022 |
2021 |
2020 |
2019 |
2018 |
Prior |
Total |
|
| Commercial: |
|
|
|
|
|
|
|
|
|
|
| Commercial and industrial |
|
|
|
|
|
|
|
|
|
|
| Pass |
$ |
3,363 |
|
$ |
1,874 |
|
$ |
979 |
|
$ |
876 |
|
$ |
293 |
|
$ |
264 |
|
$ |
8,054 |
|
$ |
182 |
|
$ |
15,885 |
|
|
| Special Mention |
1 |
|
2 |
|
10 |
|
52 |
|
1 |
|
2 |
|
50 |
|
— |
|
118 |
|
|
| Accruing Substandard |
26 |
|
7 |
|
17 |
|
78 |
|
30 |
|
67 |
|
84 |
|
2 |
|
311 |
|
|
| Nonaccrual |
— |
|
8 |
|
5 |
|
11 |
|
1 |
|
2 |
|
32 |
|
4 |
|
63 |
|
|
| Total commercial and industrial |
3,390 |
|
1,891 |
|
1,011 |
|
1,017 |
|
325 |
|
335 |
|
8,220 |
|
188 |
|
16,377 |
|
|
| Leasing |
|
|
|
|
|
|
|
|
|
|
| Pass |
160 |
|
71 |
|
47 |
|
66 |
|
18 |
|
19 |
|
— |
|
— |
|
381 |
|
|
| Special Mention |
— |
|
— |
|
— |
|
— |
|
— |
|
— |
|
— |
|
— |
|
— |
|
|
| Accruing Substandard |
— |
|
— |
|
— |
|
— |
|
— |
|
5 |
|
— |
|
— |
|
5 |
|
|
| Nonaccrual |
— |
|
— |
|
— |
|
— |
|
— |
|
— |
|
— |
|
— |
|
— |
|
|
| Total leasing |
160 |
|
71 |
|
47 |
|
66 |
|
18 |
|
24 |
|
— |
|
— |
|
386 |
|
|
| Owner-occupied |
|
|
|
|
|
|
|
|
|
|
| Pass |
2,157 |
|
2,285 |
|
1,143 |
|
874 |
|
654 |
|
1,679 |
|
187 |
|
74 |
|
9,053 |
|
|
| Special Mention |
1 |
|
15 |
|
5 |
|
8 |
|
3 |
|
16 |
|
1 |
|
— |
|
49 |
|
|
| Accruing Substandard |
16 |
|
33 |
|
48 |
|
20 |
|
55 |
|
64 |
|
9 |
|
— |
|
245 |
|
|
| Nonaccrual |
1 |
|
1 |
|
2 |
|
4 |
|
5 |
|
10 |
|
1 |
|
— |
|
24 |
|
|
| Total owner-occupied |
2,175 |
|
2,334 |
|
1,198 |
|
906 |
|
717 |
|
1,769 |
|
198 |
|
74 |
|
9,371 |
|
|
| Municipal |
|
|
|
|
|
|
|
|
|
|
| Pass |
1,230 |
|
1,220 |
|
816 |
|
441 |
|
168 |
|
437 |
|
8 |
|
— |
|
4,320 |
|
|
| Special Mention |
32 |
|
6 |
|
— |
|
— |
|
— |
|
— |
|
— |
|
— |
|
38 |
|
|
| Accruing Substandard |
— |
|
— |
|
— |
|
— |
|
— |
|
3 |
|
— |
|
— |
|
3 |
|
|
| Nonaccrual |
— |
|
— |
|
— |
|
— |
|
— |
|
— |
|
— |
|
— |
|
— |
|
|
| Total municipal |
1,262 |
|
1,226 |
|
816 |
|
441 |
|
168 |
|
440 |
|
8 |
|
— |
|
4,361 |
|
|
| Total commercial |
6,987 |
|
5,522 |
|
3,072 |
|
2,430 |
|
1,228 |
|
2,568 |
|
8,426 |
|
262 |
|
30,495 |
|
|
| Commercial real estate: |
|
|
|
|
|
|
|
|
|
|
| Construction and land development |
|
|
|
|
|
|
|
|
| Pass |
548 |
|
671 |
|
455 |
|
81 |
|
2 |
|
2 |
|
617 |
|
96 |
|
2,472 |
|
|
| Special Mention |
1 |
|
1 |
|
— |
|
— |
|
— |
|
— |
|
— |
|
— |
|
2 |
|
|
| Accruing Substandard |
17 |
|
— |
|
— |
|
22 |
|
— |
|
— |
|
— |
|
— |
|
39 |
|
|
| Nonaccrual |
— |
|
— |
|
— |
|
— |
|
— |
|
— |
|
— |
|
— |
|
— |
|
|
| Total construction and land development |
566 |
|
672 |
|
455 |
|
103 |
|
2 |
|
2 |
|
617 |
|
96 |
|
2,513 |
|
|
| Term |
|
|
|
|
|
|
|
|
|
|
| Pass |
2,861 |
|
2,107 |
|
1,686 |
|
1,012 |
|
666 |
|
1,229 |
|
276 |
|
112 |
|
9,949 |
|
|
| Special Mention |
39 |
|
21 |
|
11 |
|
— |
|
4 |
|
1 |
|
— |
|
— |
|
76 |
|
|
| Accruing Substandard |
42 |
|
2 |
|
34 |
|
21 |
|
53 |
|
35 |
|
— |
|
— |
|
187 |
|
|
| Nonaccrual |
— |
|
— |
|
— |
|
4 |
|
1 |
|
9 |
|
— |
|
— |
|
14 |
|
|
| Total term |
2,942 |
|
2,130 |
|
1,731 |
|
1,037 |
|
724 |
|
1,274 |
|
276 |
|
112 |
|
10,226 |
|
|
| Total commercial real estate |
3,508 |
|
2,802 |
|
2,186 |
|
1,140 |
|
726 |
|
1,276 |
|
893 |
|
208 |
|
12,739 |
|
|
ZIONS BANCORPORATION, NATIONAL ASSOCIATION AND SUBSIDIARIES
|
|
|
|
|
|
|
|
|
|
|
|
|
|
|
|
|
|
|
|
|
|
|
|
|
|
|
|
|
|
|
|
|
|
December 31, 2022 |
|
|
Term Loans |
Revolving loans amortized cost basis |
Revolving loans converted to term loans amortized cost basis |
|
|
|
Amortized cost basis by year of origination |
|
|
| (In millions) |
2022 |
2021 |
2020 |
2019 |
2018 |
Prior |
Total |
|
|
|
|
|
|
|
|
|
|
|
|
|
|
|
|
|
|
|
|
|
|
|
|
|
|
|
|
|
|
|
|
|
|
|
|
|
|
|
|
|
|
|
|
|
|
|
|
|
|
|
|
|
|
|
|
|
|
|
|
|
|
|
|
|
|
|
|
|
|
|
|
|
|
|
|
|
|
|
|
|
|
|
|
|
|
|
|
|
|
|
|
|
|
|
|
|
|
|
|
|
|
|
|
|
|
|
|
|
|
|
|
|
|
|
|
|
|
|
|
|
|
|
|
|
|
|
|
|
|
|
|
|
|
|
|
|
|
|
|
|
|
|
|
|
|
|
|
|
|
|
|
|
| Consumer: |
|
|
|
|
|
|
|
|
|
|
| Home equity credit line |
|
|
|
|
|
|
|
|
|
|
| Pass |
— |
|
— |
|
— |
|
— |
|
— |
|
— |
|
3,265 |
|
98 |
|
3,363 |
|
|
| Special Mention |
— |
|
— |
|
— |
|
— |
|
— |
|
— |
|
— |
|
— |
|
— |
|
|
| Accruing Substandard |
— |
|
— |
|
— |
|
— |
|
— |
|
— |
|
3 |
|
— |
|
3 |
|
|
| Nonaccrual |
— |
|
— |
|
— |
|
— |
|
— |
|
— |
|
8 |
|
3 |
|
11 |
|
|
| Total home equity credit line |
— |
|
— |
|
— |
|
— |
|
— |
|
— |
|
3,276 |
|
101 |
|
3,377 |
|
|
| 1-4 family residential |
|
|
|
|
|
|
|
|
|
|
| Pass |
1,913 |
|
1,503 |
|
1,024 |
|
638 |
|
381 |
|
1,788 |
|
— |
|
— |
|
7,247 |
|
|
| Special Mention |
— |
|
— |
|
— |
|
— |
|
— |
|
— |
|
— |
|
— |
|
— |
|
|
| Accruing Substandard |
— |
|
— |
|
— |
|
— |
|
— |
|
2 |
|
— |
|
— |
|
2 |
|
|
| Nonaccrual |
— |
|
2 |
|
2 |
|
4 |
|
3 |
|
26 |
|
— |
|
— |
|
37 |
|
|
| Total 1-4 family residential |
1,913 |
|
1,505 |
|
1,026 |
|
642 |
|
384 |
|
1,816 |
|
— |
|
— |
|
7,286 |
|
|
| Construction and other consumer real estate |
|
|
|
|
|
|
|
|
| Pass |
583 |
|
485 |
|
64 |
|
19 |
|
5 |
|
5 |
|
— |
|
— |
|
1,161 |
|
|
| Special Mention |
— |
|
— |
|
— |
|
— |
|
— |
|
— |
|
— |
|
— |
|
— |
|
|
| Accruing Substandard |
— |
|
— |
|
— |
|
— |
|
— |
|
— |
|
— |
|
— |
|
— |
|
|
| Nonaccrual |
— |
|
— |
|
— |
|
— |
|
— |
|
— |
|
— |
|
— |
|
— |
|
|
| Total construction and other consumer real estate |
583 |
|
485 |
|
64 |
|
19 |
|
5 |
|
5 |
|
— |
|
— |
|
1,161 |
|
|
| Bankcard and other revolving plans |
|
|
|
|
|
|
|
|
|
| Pass |
— |
|
— |
|
— |
|
— |
|
— |
|
— |
|
468 |
|
2 |
|
470 |
|
|
| Special Mention |
— |
|
— |
|
— |
|
— |
|
— |
|
— |
|
— |
|
— |
|
— |
|
|
| Accruing Substandard |
— |
|
— |
|
— |
|
— |
|
— |
|
— |
|
1 |
|
— |
|
1 |
|
|
| Nonaccrual |
— |
|
— |
|
— |
|
— |
|
— |
|
— |
|
— |
|
— |
|
— |
|
|
| Total bankcard and other revolving plans |
— |
|
— |
|
— |
|
— |
|
— |
|
— |
|
469 |
|
2 |
|
471 |
|
|
| Other consumer |
|
|
|
|
|
|
|
|
|
|
| Pass |
68 |
|
30 |
|
12 |
|
8 |
|
4 |
|
2 |
|
— |
|
— |
|
124 |
|
|
| Special Mention |
— |
|
— |
|
— |
|
— |
|
— |
|
— |
|
— |
|
— |
|
— |
|
|
| Accruing Substandard |
— |
|
— |
|
— |
|
— |
|
— |
|
— |
|
— |
|
— |
|
— |
|
|
| Nonaccrual |
— |
|
— |
|
— |
|
— |
|
— |
|
— |
|
— |
|
— |
|
— |
|
|
| Total other consumer |
68 |
|
30 |
|
12 |
|
8 |
|
4 |
|
2 |
|
— |
|
— |
|
124 |
|
|
| Total consumer |
2,564 |
|
2,020 |
|
1,102 |
|
669 |
|
393 |
|
1,823 |
|
3,745 |
|
103 |
|
12,419 |
|
|
| Total loans |
$ |
13,059 |
|
$ |
10,344 |
|
$ |
6,360 |
|
$ |
4,239 |
|
$ |
2,347 |
|
$ |
5,667 |
|
$ |
13,064 |
|
$ |
573 |
|
$ |
55,653 |
|
|
Loan Modifications
On January 1, 2023, we adopted ASU 2022-02, Financial Instruments—Credit Losses (Topic 326): Troubled Debt Restructurings and Vintage Disclosures, which eliminated the recognition and measurement of TDRs and their related disclosures. As a result, we no longer separately measure an allowance for credit losses for TDRs, relying instead on our credit loss estimation models. The adoption of this guidance did not have a material impact on our financial statements.
ZIONS BANCORPORATION, NATIONAL ASSOCIATION AND SUBSIDIARIES
ASU 2022-02 requires enhanced disclosures for loan modifications to borrowers experiencing financial difficulty. Loans may be modified in the normal course of business for competitive reasons or to strengthen our collateral position. Loan modifications may also occur when the borrower experiences financial difficulty and needs temporary or permanent relief from the original contractual terms of the loan. For loans that have been modified with a borrower experiencing financial difficulty, we use the same credit loss estimation methods that we use for the rest of the loan portfolio. These methods incorporate the post-modification loan terms, as well as defaults and charge-offs associated with historical modified loans. All nonaccruing loans more than $1 million are evaluated individually, regardless of modification.
We consider many factors in determining whether to agree to a loan modification and we seek a solution that will both minimize potential loss to us and attempt to help the borrower. We evaluate borrowers’ current and forecasted future cash flows, their ability and willingness to make current contractual or proposed modified payments, the value of the underlying collateral (if applicable), the possibility of obtaining additional security or guarantees, and the potential costs related to a repossession or foreclosure and the subsequent sale of the collateral.
A modified loan on nonaccrual will generally remain on nonaccrual until the borrower has proven the ability to perform under the modified structure for a minimum of six months, and there is evidence that such payments can and are likely to continue as agreed. Performance prior to the modification, or significant events that coincide with the modification, are included in assessing whether the borrower can meet the new terms and may result in the loan being returned to accrual at the time of modification or after a shorter performance period. If the borrower’s ability to meet the revised payment schedule is uncertain, the loan remains on nonaccrual. There were less than $1 million of loans to borrowers experiencing financial difficulty that had a payment default during the twelve months ended December 31, 2023, which were still in default at period end, and were within 12 months or less of being modified.
The amortized cost of loans to borrowers experiencing financial difficulty that were modified during the period, by loan class and modification type, is summarized in the following schedule:
|
|
|
|
|
|
|
|
|
|
|
|
|
|
|
|
|
|
|
|
|
|
|
|
|
|
|
|
|
|
|
|
|
|
|
|
|
|
|
|
|
|
|
|
|
Twelve Months Ended December 31, 2023 |
|
Amortized cost associated with
the following modification types: |
|
|
|
|
| (Dollar amounts in millions) |
Interest
rate reduction |
|
Maturity
or term
extension |
|
Principal
forgiveness |
|
Payment
deferral |
|
|
|
Multiple modification types 1 |
|
Total 2 |
|
Percentage of total loans 3 |
| Commercial: |
|
|
|
|
|
|
|
|
|
|
|
|
|
|
|
| Commercial and industrial |
$ |
— |
|
|
$ |
46 |
|
|
$ |
— |
|
|
$ |
1 |
|
|
|
|
$ |
— |
|
|
$ |
47 |
|
|
0.3 |
% |
| Owner-occupied |
4 |
|
|
9 |
|
|
— |
|
|
1 |
|
|
|
|
— |
|
|
14 |
|
|
0.2 |
|
| Municipal |
— |
|
|
8 |
|
|
— |
|
|
— |
|
|
|
|
— |
|
|
8 |
|
|
0.2 |
|
| Total commercial |
4 |
|
|
63 |
|
|
— |
|
|
2 |
|
|
|
|
— |
|
|
69 |
|
|
0.2 |
|
| Commercial real estate: |
|
|
|
|
|
|
|
|
|
|
|
|
|
|
|
Construction and land development |
— |
|
|
27 |
|
|
— |
|
|
— |
|
|
|
|
— |
|
|
27 |
|
|
1.0 |
|
| Term |
— |
|
|
165 |
|
|
— |
|
|
— |
|
|
|
|
— |
|
|
165 |
|
|
1.5 |
|
| Total commercial real estate |
— |
|
|
192 |
|
|
— |
|
|
— |
|
|
|
|
— |
|
|
192 |
|
|
1.4 |
|
| Consumer: |
|
|
|
|
|
|
|
|
|
|
|
|
|
|
|
|
|
|
|
|
|
|
|
|
|
|
|
|
|
|
|
| 1-4 family residential |
— |
|
|
— |
|
|
1 |
|
|
— |
|
|
|
|
1 |
|
|
2 |
|
|
— |
|
|
|
|
|
|
|
|
|
|
|
|
|
|
|
|
|
Bankcard and other revolving plans |
— |
|
|
1 |
|
|
— |
|
|
— |
|
|
|
|
— |
|
|
1 |
|
|
0.2 |
|
|
|
|
|
|
|
|
|
|
|
|
|
|
|
|
|
| Total consumer loans |
— |
|
|
1 |
|
|
1 |
|
|
— |
|
|
|
|
1 |
|
|
3 |
|
|
— |
|
| Total |
$ |
4 |
|
|
$ |
256 |
|
|
$ |
1 |
|
|
$ |
2 |
|
|
|
|
$ |
1 |
|
|
$ |
264 |
|
|
0.5 |
% |
1 Includes modifications that resulted from a combination of interest rate reduction, maturity or term extension, principal forgiveness, and payment deferral modifications.
2 Unfunded lending commitments related to loans modified to borrowers experiencing financial difficulty totaled $22 million at December 31, 2023.
3 Amounts less than 0.05% are rounded to zero.
ZIONS BANCORPORATION, NATIONAL ASSOCIATION AND SUBSIDIARIES
The financial impact of loan modifications to borrowers experiencing financial difficulty during the twelve months ended December 31, 2023, is summarized in the following schedule:
|
|
|
|
|
|
|
|
|
|
|
|
|
|
|
Twelve Months Ended
December 31, 2023 |
|
Weighted-average interest rate reduction (in percentage points) |
|
Weighted-average term extension
(in months) |
|
|
| Commercial: |
|
|
|
|
|
| Commercial and industrial |
— |
% |
|
13 |
|
|
|
|
|
|
|
|
Owner-occupied 1 |
4.4 |
|
|
18 |
|
|
| Municipal |
— |
|
|
12 |
|
|
| Total commercial |
4.4 |
|
|
14 |
|
|
| Commercial real estate: |
|
|
|
|
|
Construction and land development |
— |
|
|
8 |
|
|
| Term |
— |
|
|
18 |
|
|
| Total commercial real estate |
— |
|
|
16 |
|
|
Consumer: 1 |
|
|
|
|
|
|
|
|
|
|
|
| 1-4 family residential |
— |
|
|
103 |
|
|
|
|
|
|
|
|
Bankcard and other revolving plans |
— |
|
|
50 |
|
|
|
|
|
|
|
|
| Total consumer loans |
— |
|
|
82 |
|
|
| Total weighted average financial impact |
4.4 |
% |
|
16 |
|
|
1 Primarily relates to a small number of loans within each respective loan class.
Loan modifications to borrowers experiencing financial difficulty during the twelve months ended December 31, 2023, resulted in less than $1 million of principal forgiveness for the total loan portfolio for the period.
The following schedule presents the aging of loans to borrowers experiencing financial difficulty that were modified on or after January 1, 2023 (the date we adopted ASU 2022-02) through December 31, 2023, presented by portfolio segment and loan class.
|
|
|
|
|
|
|
|
|
|
|
|
|
|
|
|
|
|
|
|
|
|
|
|
|
|
|
|
|
|
|
December 31, 2023 |
| (In millions) |
Current |
|
30-89 days
past due |
|
90+ days
past due |
|
Total
past due |
|
Total
amortized cost of loans |
|
|
|
|
|
|
|
|
|
|
| Commercial: |
|
|
|
|
|
|
|
|
|
| Commercial and industrial |
$ |
44 |
|
|
$ |
3 |
|
|
$ |
— |
|
|
$ |
3 |
|
|
$ |
47 |
|
|
|
|
|
|
|
|
|
|
|
| Owner-occupied |
13 |
|
|
1 |
|
|
— |
|
|
1 |
|
|
14 |
|
| Municipal |
8 |
|
|
— |
|
|
— |
|
|
— |
|
|
8 |
|
| Total commercial |
65 |
|
|
4 |
|
|
— |
|
|
4 |
|
|
69 |
|
| Commercial real estate: |
|
|
|
|
|
|
|
|
|
Construction and land development |
27 |
|
|
— |
|
|
— |
|
|
— |
|
|
27 |
|
| Term |
156 |
|
|
9 |
|
|
— |
|
|
9 |
|
|
165 |
|
| Total commercial real estate |
183 |
|
|
9 |
|
|
— |
|
|
9 |
|
|
192 |
|
| Consumer: |
|
|
|
|
|
|
|
|
|
|
|
|
|
|
|
|
|
|
|
| 1-4 family residential |
2 |
|
|
— |
|
|
— |
|
|
— |
|
|
2 |
|
|
|
|
|
|
|
|
|
|
|
Bankcard and other revolving plans |
1 |
|
|
— |
|
|
— |
|
|
— |
|
|
1 |
|
|
|
|
|
|
|
|
|
|
|
| Total consumer loans |
3 |
|
|
— |
|
|
— |
|
|
— |
|
|
3 |
|
| Total |
$ |
251 |
|
|
$ |
13 |
|
|
$ |
— |
|
|
$ |
13 |
|
|
$ |
264 |
|
ZIONS BANCORPORATION, NATIONAL ASSOCIATION AND SUBSIDIARIES
Troubled Debt Restructuring Disclosures Prior to Our Adoption of ASU 2022-02
Loans may be modified in the normal course of business for competitive reasons or to strengthen our collateral position. Loan modifications and restructurings may also occur when the borrower experiences financial difficulty and needs temporary or permanent relief from the original contractual terms of the loan. Loans that have been modified to accommodate a borrower who is experiencing financial difficulties, and for which we have granted a concession that we would not otherwise consider, are reported as TDRs.
Consistent with modifications to troubled borrowers discussed in the previous section, we consider many factors in determining whether to agree to a loan modification involving concessions, and we seek a solution that will both minimize potential loss to us and attempt to help the borrower.
TDRs are classified as either accrual or nonaccrual loans. A loan on nonaccrual and restructured as a TDR will remain on nonaccrual status until the borrower has proven the ability to perform under the modified structure for a minimum of six months, and there is evidence that such payments can and are likely to continue as agreed. Performance prior to the restructuring, or significant events that coincide with the restructuring, are included in assessing whether the borrower can meet the new terms and may result in the loan being returned to accrual at the time of restructuring or after a shorter performance period. If the borrower’s ability to meet the revised payment schedule is uncertain, the loan remains classified as a nonaccrual loan. A TDR loan that specifies an interest rate that, at the time of the restructuring, is greater than or equal to the rate we are willing to accept for a new loan with comparable risk may not be reported as a TDR in the calendar years subsequent to the restructuring if it is in compliance with its modified terms.
Loan modifications provided to borrowers experiencing financial difficulties exclusively related to the COVID-19 pandemic, in which we provided certain short-term modifications or payment deferrals, were not classified as TDRs. The TDRs disclosed subsequently do not include these loan modifications. Other loan modifications above and beyond these short-term modifications or payment deferrals were assessed for TDR classification.
ZIONS BANCORPORATION, NATIONAL ASSOCIATION AND SUBSIDIARIES
Information on TDRs, including their amortized cost on an accruing and nonaccruing basis by loan class, and by modification type, is summarized in the following schedules:
|
|
|
|
|
|
|
|
|
|
|
|
|
|
|
|
|
|
|
|
|
|
|
|
|
|
|
|
|
|
|
|
|
|
|
|
|
|
|
|
|
|
|
December 31, 2022 |
|
Amortized cost basis resulting from the following modification types: |
|
|
| (In millions) |
Interest
rate below
market |
|
Maturity
or term
extension |
|
Principal
forgiveness |
|
Payment
deferral |
|
Other1 |
|
Multiple
modification
types2
|
|
Total |
| Accruing |
|
|
|
|
|
|
|
|
|
|
|
|
|
| Commercial: |
|
|
|
|
|
|
|
|
|
|
|
|
|
| Commercial and industrial |
$ |
1 |
|
|
$ |
12 |
|
|
$ |
— |
|
|
$ |
— |
|
|
$ |
9 |
|
|
$ |
28 |
|
|
$ |
50 |
|
| Owner-occupied |
— |
|
|
1 |
|
|
— |
|
|
2 |
|
|
13 |
|
|
12 |
|
|
28 |
|
|
|
|
|
|
|
|
|
|
|
|
|
|
|
| Total commercial |
1 |
|
|
13 |
|
|
— |
|
|
2 |
|
|
22 |
|
|
40 |
|
|
78 |
|
| Commercial real estate: |
|
|
|
|
|
|
|
|
|
|
|
|
|
| Construction and land development |
— |
|
|
— |
|
|
— |
|
|
— |
|
|
— |
|
|
8 |
|
|
8 |
|
| Term |
1 |
|
|
27 |
|
|
— |
|
|
27 |
|
|
28 |
|
|
1 |
|
|
84 |
|
| Total commercial real estate |
1 |
|
|
27 |
|
|
— |
|
|
27 |
|
|
28 |
|
|
9 |
|
|
92 |
|
| Consumer: |
|
|
|
|
|
|
|
|
|
|
|
|
|
| Home equity credit line |
— |
|
|
1 |
|
|
4 |
|
|
— |
|
|
— |
|
|
1 |
|
|
6 |
|
| 1-4 family residential |
2 |
|
|
1 |
|
|
2 |
|
|
— |
|
|
1 |
|
|
15 |
|
|
21 |
|
|
|
|
|
|
|
|
|
|
|
|
|
|
|
|
|
|
|
|
|
|
|
|
|
|
|
|
|
| Total consumer loans |
2 |
|
|
2 |
|
|
6 |
|
|
— |
|
|
1 |
|
|
16 |
|
|
27 |
|
| Total accruing |
$ |
4 |
|
|
$ |
42 |
|
|
$ |
6 |
|
|
$ |
29 |
|
|
$ |
51 |
|
|
$ |
65 |
|
|
$ |
197 |
|
| Nonaccruing |
|
|
|
|
|
|
|
|
|
|
|
|
|
| Commercial: |
|
|
|
|
|
|
|
|
|
|
|
|
|
| Commercial and industrial |
$ |
— |
|
|
$ |
— |
|
|
$ |
— |
|
|
$ |
3 |
|
|
$ |
9 |
|
|
$ |
3 |
|
|
$ |
15 |
|
| Owner-occupied |
4 |
|
|
— |
|
|
— |
|
|
— |
|
|
— |
|
|
4 |
|
|
8 |
|
|
|
|
|
|
|
|
|
|
|
|
|
|
|
| Total commercial |
4 |
|
|
— |
|
|
— |
|
|
3 |
|
|
9 |
|
|
7 |
|
|
23 |
|
| Commercial real estate: |
|
|
|
|
|
|
|
|
|
|
|
|
|
|
|
|
|
|
|
|
|
|
|
|
|
|
|
| Term |
— |
|
|
10 |
|
|
— |
|
|
— |
|
|
— |
|
|
— |
|
|
10 |
|
| Total commercial real estate |
— |
|
|
10 |
|
|
— |
|
|
— |
|
|
— |
|
|
— |
|
|
10 |
|
| Consumer: |
|
|
|
|
|
|
|
|
|
|
|
|
|
| Home equity credit line |
— |
|
|
— |
|
|
1 |
|
|
— |
|
|
— |
|
|
— |
|
|
1 |
|
| 1-4 family residential |
— |
|
|
1 |
|
|
— |
|
|
— |
|
|
1 |
|
|
2 |
|
|
4 |
|
|
|
|
|
|
|
|
|
|
|
|
|
|
|
|
|
|
|
|
|
|
|
|
|
|
|
|
|
| Total consumer loans |
— |
|
|
1 |
|
|
1 |
|
|
— |
|
|
1 |
|
|
2 |
|
|
5 |
|
| Total nonaccruing |
4 |
|
|
11 |
|
|
1 |
|
|
3 |
|
|
10 |
|
|
9 |
|
|
38 |
|
| Total |
$ |
8 |
|
|
$ |
53 |
|
|
$ |
7 |
|
|
$ |
32 |
|
|
$ |
61 |
|
|
$ |
74 |
|
|
$ |
235 |
|
1 Includes TDRs that resulted from other modification types including, but not limited to, a legal judgment awarded on different terms, a bankruptcy plan confirmed on different terms, a settlement that includes the delivery of collateral in exchange for debt reduction, etc.
2 Includes TDRs that resulted from a combination of any of the previous modification types.
Unfunded lending commitments on TDRs totaled $7 million at December 31, 2022.
The total amortized cost of all TDRs in which interest rates were modified below market was $63 million at December 31, 2022. These loans are included in the previous schedule in the columns for interest rate below market and multiple modification types.
The net financial impact on interest income due to interest rate modifications below market for accruing TDRs for the year ended December 31, 2022 was not significant.
On an ongoing basis, we monitor the performance of all TDRs according to their restructured terms. Subsequent payment default is defined in terms of delinquency, when principal or interest payments are past due 90 days or more for commercial loans, or 60 days or more for consumer loans.
ZIONS BANCORPORATION, NATIONAL ASSOCIATION AND SUBSIDIARIES
The amortized cost of accruing and nonaccruing TDRs that had a payment default during the year ended December 31, 2022, and were still in default at period end, and were within 12 months or less of being modified as TDRs was approximately $10 million.
Collateral-dependent Loans
When a loan is individually evaluated for expected credit losses, we estimate a specific reserve for the loan based on the projected present value of the loan’s future cash flows discounted at the loan’s effective interest rate, the observable market price of the loan, or the fair value of the loan’s underlying collateral.
Select information on loans for which the repayment is expected to be provided substantially through the operation or sale of the underlying collateral and the borrower is experiencing financial difficulties, including the type of collateral and the extent to which the collateral secures the loans, is summarized as follows:
|
|
|
|
|
|
|
|
|
|
|
|
|
|
|
|
|
|
|
December 31, 2023 |
| (In millions) |
Amortized Cost |
|
Major Types of Collateral |
|
Weighted Average LTV1 |
| Commercial: |
|
|
|
|
|
|
|
|
|
|
|
|
|
|
|
|
|
| Owner-occupied |
$ |
7 |
|
|
Hospital |
|
17% |
|
|
|
|
|
|
|
|
|
|
|
|
| Commercial real estate: |
|
|
|
|
|
| Construction and land development |
22 |
|
|
Office Building |
|
92% |
| Term |
28 |
|
|
Office Building |
|
87% |
|
|
|
|
|
|
|
|
|
|
|
|
|
|
|
|
|
|
|
|
|
|
|
|
|
|
|
|
|
|
|
|
|
|
|
|
|
|
|
|
|
|
|
|
|
|
|
|
| Total |
$ |
57 |
|
|
|
|
|
|
|
|
|
|
|
|
|
|
|
|
|
|
|
|
|
|
|
|
December 31, 2022 |
| (In millions) |
Amortized Cost |
|
Major Types of Collateral |
|
Weighted Average LTV1 |
| Commercial: |
|
|
|
|
|
|
|
|
|
|
|
|
|
|
|
|
|
| Owner-occupied |
$ |
2 |
|
|
Land, Warehouse |
|
29% |
|
|
|
|
|
|
|
|
|
|
|
|
| Commercial real estate: |
|
|
|
|
|
|
|
|
|
|
|
| Term |
1 |
|
|
Multi-family |
|
55% |
|
|
|
|
|
|
| Consumer: |
|
|
|
|
|
| Home equity credit line |
1 |
|
|
Single family residential |
|
13% |
| 1-4 family residential |
3 |
|
|
Single family residential |
|
41% |
|
|
|
|
|
|
|
|
|
|
|
|
|
|
|
|
|
|
|
|
|
|
|
|
| Total |
$ |
7 |
|
|
|
|
|
1 The fair value is based on the most recent appraisal or other collateral evaluation.
Foreclosed Residential Real Estate
At December 31, 2023, and December 31, 2022, we did not have any foreclosed residential real estate property. The amortized cost basis of consumer mortgage loans collateralized by residential real estate property that are in the process of foreclosure was $11 million and $10 million for the same respective periods.
7. DERIVATIVE INSTRUMENTS AND HEDGING ACTIVITIES
Objectives for Using Derivatives
Our primary objective for using derivatives is to manage risks, primarily interest rate risk. We use derivatives to manage volatility in interest income, interest expense, earnings, and capital by adjusting our interest rate sensitivity to minimize the impact of fluctuations in interest rates. Derivatives are used to stabilize forecasted interest income from variable-rate assets and to modify the coupon or the duration of fixed-rate financial assets or liabilities as we consider advisable. We also assist customers with their risk management needs through the use of derivatives.
Derivatives Related to Interest Rate Risk Management — When we use derivatives as hedges, either for economic or accounting purposes, it is done only to manage identified risks. We apply hedge accounting to certain derivatives executed for risk management purposes. However, we do not apply hedge accounting to all the derivatives involved in our risk management activities. Derivatives not designated as accounting hedges are not speculative and are used to economically manage our exposure to interest rate movements, including offsetting customer-facing derivatives.
ZIONS BANCORPORATION, NATIONAL ASSOCIATION AND SUBSIDIARIES
These derivatives either do not require the use of hedge accounting for their economic impact to be appropriately reflected in our financial statements or they do not meet the strict hedge accounting requirements.
Derivatives Related to Customers — We provide certain borrowers access to over-the-counter interest rate derivatives, which we generally offset with interest rate derivatives executed with dealers or central clearing houses. Other interest rate derivatives that we provide to customers, or use for our own purposes, include mortgage rate locks and forward sale loan commitments. We also provide commercial customers with short-term foreign currency spot trades or forward contracts with maturities that are typically 90 days or less. These trades are also largely offset by foreign currency trades with closely matching terms executed with other dealer counterparties or central clearing houses.
Accounting for Derivatives
We record all derivatives at fair value, and they are included in “Other assets” or “Other liabilities” on the consolidated balance sheet, regardless of the accounting designation of each derivative. We enter into International Swaps and Derivatives Association, Inc. (“ISDA”) master netting agreements, or similar agreements, with substantially all derivative counterparties. Where legally enforceable, these master netting agreements give us, in the event of default or the triggering of other specified contingent events by the counterparty, the right to use cash or liquidate securities held as collateral and to offset receivables and payables with the same counterparty. For purposes of the consolidated balance sheet, we report all derivatives on a gross fair value basis (i.e., we do not offset derivative assets and liabilities and cash collateral held with the same counterparty where we have a legally enforceable master netting agreement). Note 3 discusses the process to estimate fair value for derivatives. The accounting for changes in the fair value of derivatives depends on the intended use of the derivative and the resulting accounting designation. Derivatives used to hedge the exposure to changes in the fair value of assets, liabilities, or firm commitments attributable to interest rates or other eligible risks, are considered fair value hedges. Derivatives used to hedge the exposure to variability in expected future cash flows, or other types of forecasted transactions, are considered cash flow hedges. Changes in the fair value of derivatives that are not part of designated fair value or cash flow hedging relationships are recorded in current period earnings.
Fair Value Hedges — We generally use interest rate swaps designated as fair value hedges to hedge changes in the fair value of fixed-rate assets and liabilities for specific risks (e.g., interest rate risk resulting from changes in a benchmark interest rate). We use both pay-fixed, receive-floating and received-fixed, pay-floating interest rate swaps to effectively convert certain fixed-rate assets and liabilities to floating rates. In qualifying fair value hedges, changes in value of the derivative hedging instrument are recognized in current period earnings in the same line item affected by the hedged item. Similarly, the periodic changes in value of the hedged item, for the risk being hedged, are recognized in current period earnings, thereby offsetting all, or a significant majority, of the change in the value of the derivative hedging instrument. Interest accruals on both the derivative hedging instrument and the hedged item are recorded in the same line item, effectively converting the designated fixed-rate assets or liabilities to a floating rate. Generally, the designated risk being hedged in all of our fair value hedges is the change in fair value of the secured overnight financing rate (“SOFR”) (or alternative rate) benchmark swap rate component of the contractual coupon cash flows of the fixed-rate assets or liabilities. The swaps are structured to match the critical terms of the hedged items, maximizing the economic (and accounting) effectiveness of the hedging relationships and resulting in the expectation that the swaps will be highly effective as a hedging instrument. All interest rate swaps designated as fair value hedges were highly effective and met all other requirements to remain designated and part of qualifying hedge accounting relationships as of the balance sheet date.
Fair Value Hedges of Liabilities — During the second quarter of 2023, we terminated our remaining receive-fixed interest rate swap with a notional amount of $500 million that had been designated in a qualifying fair value hedge relationship of fixed-rate debt. The receive-fixed interest rate swap effectively converted the interest on our fixed-rate debt to floating until it was terminated. Prior to termination, changes in the fair value of derivatives designated as fair value hedges of debt were offset by changes in the fair value of the hedged debt instruments as shown in the schedules on the following pages. The unamortized hedge basis adjustments resulting from the terminated hedging relationship will be amortized over the remaining life of the fixed-rate debt, which matures in 2029.
ZIONS BANCORPORATION, NATIONAL ASSOCIATION AND SUBSIDIARIES
Fair Value Hedges of Assets — During the third quarter of 2023, we entered into new hedges of a defined portfolio of fixed-rate commercial loans using pay-fixed, receive-floating swaps with an aggregate notional amount of $1.0 billion that were designated as fair value hedges under the portfolio layer method described in ASU 2022-01, Derivatives and Hedging (Topic 815): Fair Value Hedging—Portfolio Layer Method. We had an additional $2.5 billion in aggregate notional amount of pay-fixed swaps designated under the portfolio layer method as fair value hedges of a defined portfolio of fixed-rate AFS securities.
At December 31, 2023, we also had pay-fixed, receive-floating interest rate swaps with an aggregate notional amount of $1.1 billion designated as fair value hedges of specifically identified AFS securities. Fair value hedges of fixed-rate assets effectively convert certain fixed interest income to a floating rate on the hedged portion of the assets. Changes in fair value of derivatives designated as fair value hedges of fixed-rate financial assets were largely offset by changes in the value of the hedged assets, as presented in the schedules on the following pages.
Cash Flow Hedges — For derivatives designated and qualifying as cash flow hedges, as long as the hedging relationship continues to qualify for hedge accounting, the entire change in the fair value of the hedging instrument is recorded in OCI and recognized in earnings as the hedged transaction affects earnings. Ineffectiveness is not measured or separately disclosed. Gains or losses on derivatives designated as cash flow hedges are recognized in the same financial statement line item as the hedged transactions. We may use interest rate swaps, options, or a combination of options in our cash flow hedging strategy to eliminate or reduce the variability of interest receipts on floating-rate commercial loans and interest payments on floating rate debt due to changes in any separately identifiable and reliably measurable contractual interest rate index.
At December 31, 2023, we had receive-fixed interest rate swaps with an aggregate notional amount of $1.5 billion designated as cash flow hedges of the variability of interest receipts on floating-rate commercial loans. During 2023, we terminated receive-fixed swaps with an aggregate notional amount of $5.0 billion. At December 31, 2023, we had $201 million of net losses deferred in AOCI related to terminated cash flow hedges. Amounts deferred in AOCI from terminated cash flow hedges will be amortized into interest income on a straight-line basis through the original maturity dates of the hedges as long as the hedged forecasted transactions continue to be expected to occur. Amounts deferred in AOCI related to terminated cash flow hedges will be fully reclassified to interest income by the fourth quarter of 2027. Additionally, at December 31, 2023, we had one pay-fixed interest rate swap with a notional amount of $500 million designated as a cash flow hedge of the variability in the interest payments on certain FHLB advances.
Hedge Effectiveness — We assess the effectiveness of each hedging relationship by comparing the changes in fair value or cash flows on the derivative hedging instrument with the changes in fair value or cash flows on the designated hedged item or transactions for the risk being hedged. If a hedging relationship ceases to qualify for hedge accounting, the relationship is discontinued and future changes in the fair value of the derivative instrument are recognized in current period earnings. For a discontinued or terminated fair value hedging relationship, all remaining basis adjustments to the carrying amount of the hedged item are amortized to interest income or expense over the remaining life of the hedged item consistent with the amortization of other discounts or premiums. Previous balances deferred in AOCI from discontinued or terminated cash flow hedges are reclassified to interest income or expense as the hedged transactions affect earnings or over the originally specified term of the hedging relationship.
Collateral and Credit Risk
Credit risk arises from the possibility of nonperformance by counterparties. No significant losses on derivative instruments have occurred during 2023 as a result of counterparty nonperformance. We reduce our counterparty exposure for derivative contracts by centrally clearing all eligible derivatives and by executing dealer-facing derivative transactions with well-capitalized financial institutions.
For those derivatives that are not centrally cleared, the counterparties are typically financial institutions or our customers. For those that are financial institutions, as noted above, we manage our credit exposure through the use of a Credit Support Annex (“CSA”) to an ISDA master agreement with each counterparty. Eligible collateral types are documented by the CSA and controlled under our general credit policies. Collateral balances are typically monitored on a daily basis.
ZIONS BANCORPORATION, NATIONAL ASSOCIATION AND SUBSIDIARIES
A valuation haircut policy reflects the fact that collateral may fall in value between the date the collateral is called and the date of liquidation or enforcement. At December 31, 2023, all of our collateral held as credit risk mitigation under a CSA was cash.
We offer interest rate swaps to our customers to assist them in managing their exposure to changing interest rates. Upon issuance, all of these customer swaps are offset through closely matching derivative contracts to minimize our interest rate risk exposure resulting from such transactions. Fee income from customer swaps is included in “Capital markets fees” on the consolidated statement of income.
We manage the credit risk associated with customer nonperformance through additional underwriting that includes modeling the credit risk exposure for the swap, shared collateral and guarantee protection applicable to the loan and credit approvals, limits, and monitoring procedures. We measure counterparty credit risk through the calculation of a CVA that captures the value of both the nonperformance risk that we have to our customers and that they have to us. Periodic changes in the net CVA are recorded in current period earnings and included in “Fair value and nonhedge derivative income or loss” on the consolidated statement of income.
Our derivative contracts require us to pledge collateral for derivatives that are in a net liability position. Certain derivative contracts contain credit-risk-related contingent features that include the requirement to maintain a minimum debt credit rating. We may be required to pledge additional collateral if a credit-risk-related feature were triggered, such as a downgrade of our credit rating. However, in past situations, not all counterparties have demanded that additional collateral be pledged when provided for by the contractual terms. At December 31, 2023, the fair value of our derivative liabilities was $333 million, for which we were required to pledge cash collateral of approximately $2 million in the normal course of business. If our credit rating were downgraded one notch by either Standard and Poor’s (“S&P”) or Moody’s at December 31, 2023, there would likely be no additional collateral required to be pledged. Derivatives that are centrally cleared do not have credit-risk-related features that require additional collateral if our credit rating were downgraded.
ZIONS BANCORPORATION, NATIONAL ASSOCIATION AND SUBSIDIARIES
Derivative Amounts
The following schedule presents derivative notional amounts and recorded gross fair values at December 31, 2023 and 2022:
|
|
|
|
|
|
|
|
|
|
|
|
|
|
|
|
|
|
|
|
|
|
|
|
|
|
|
|
|
|
|
|
|
|
|
|
|
December 31, 2023 |
|
December 31, 2022 |
|
Notional
amount |
|
Fair value |
|
Notional
amount |
|
Fair value |
| (In millions) |
Other
assets |
|
Other
liabilities |
|
Other
assets |
|
Other
liabilities |
| Derivatives designated as hedging instruments: |
|
|
|
|
|
|
|
|
|
|
|
| Cash flow hedges of floating-rate assets: |
|
|
|
|
|
|
|
|
|
|
|
|
|
|
|
|
|
|
|
|
|
|
|
Receive-fixed interest rate swaps |
1,450 |
|
|
— |
|
|
— |
|
|
7,633 |
|
|
— |
|
|
1 |
|
| Cash flow hedges of floating rate liabilities: |
|
|
|
|
|
|
|
|
|
|
|
| Pay-fixed interest rate swaps |
500 |
|
|
— |
|
|
— |
|
|
— |
|
|
— |
|
|
— |
|
| Fair value hedges: |
|
|
|
|
|
|
|
|
|
|
|
| Debt hedges: Receive-fixed interest rate swaps |
— |
|
|
— |
|
|
— |
|
|
500 |
|
|
— |
|
|
— |
|
Asset hedges: Pay-fixed interest rate swaps 1 |
4,571 |
|
|
78 |
|
|
— |
|
|
1,228 |
|
|
84 |
|
|
— |
|
| Total derivatives designated as hedging instruments |
6,521 |
|
|
78 |
|
|
— |
|
|
9,361 |
|
|
84 |
|
|
1 |
|
| Derivatives not designated as hedging instruments: |
|
|
|
|
|
|
|
|
|
|
|
Customer interest rate derivatives 2 |
14,375 |
|
|
337 |
|
|
330 |
|
|
13,670 |
|
|
296 |
|
|
443 |
|
| Other interest rate derivatives |
1,001 |
|
|
1 |
|
|
— |
|
|
862 |
|
|
— |
|
|
— |
|
| Foreign exchange derivatives |
216 |
|
|
3 |
|
|
3 |
|
|
605 |
|
|
6 |
|
|
7 |
|
| Purchased credit derivatives |
35 |
|
|
1 |
|
|
— |
|
|
— |
|
|
— |
|
|
— |
|
Total derivatives not designated as hedging instruments |
15,627 |
|
|
342 |
|
|
333 |
|
|
15,137 |
|
|
302 |
|
|
450 |
|
| Total derivatives |
$ |
22,148 |
|
|
$ |
420 |
|
|
$ |
333 |
|
|
$ |
24,498 |
|
|
$ |
386 |
|
|
$ |
451 |
|
1 The notional amount includes forward starting swaps that are not yet effective.
2 Customer interest rate derivatives include both customer-facing derivatives and the offsetting, dealer-facing derivatives. Customer interest rate derivatives include a net CVA of $9 million and $13 million, reducing the fair value amount at December 31, 2023, and December 31, 2022, respectively. These adjustments are required to reflect both our nonperformance risk and that of the respective counterparty.
The following schedules present the amount of gains (losses) from derivative instruments designated as cash flow and fair value hedges that were deferred in OCI or recognized in earnings for years ended December 31, 2023 and 2022:
|
|
|
|
|
|
|
|
|
|
|
|
|
|
|
|
|
|
|
|
|
|
|
|
|
|
|
Year Ended December 31, 2023 |
| (In millions) |
Effective portion of derivative gain/(loss) deferred in AOCI |
|
|
|
Amount of gain/(loss) reclassified from AOCI into income |
|
Net interest income or expense on fair value hedges |
|
Hedge ineffectiveness / AOCI reclass due to missed forecast |
|
|
|
|
|
|
|
|
|
|
Cash flow hedges of floating-rate assets: 1 |
|
|
|
|
|
|
|
|
|
| Purchased interest rate floors |
$ |
— |
|
|
|
|
$ |
— |
|
|
$ |
— |
|
|
$ |
— |
|
| Interest rate swaps |
31 |
|
|
|
|
(170) |
|
|
— |
|
|
— |
|
| Cash flow hedges of floating-rate liabilities: |
|
|
|
|
|
|
|
|
|
| Pay-fixed interest rate swaps |
4 |
|
|
|
|
5 |
|
|
— |
|
|
— |
|
| Fair value hedges of liabilities: |
|
|
|
|
|
|
|
|
|
| Receive-fixed interest rate swaps |
— |
|
|
|
|
— |
|
|
(5) |
|
|
— |
|
Basis amortization on terminated hedges 2, 3 |
— |
|
|
|
|
— |
|
|
(4) |
|
|
— |
|
| Fair value hedges of assets: |
|
|
|
|
|
|
|
|
|
| Pay-fixed interest rate swaps |
— |
|
|
|
|
— |
|
|
57 |
|
|
— |
|
Basis amortization on terminated hedges 2, 3 |
— |
|
|
|
|
— |
|
|
1 |
|
|
— |
|
Total derivatives designated as hedging instruments |
$ |
35 |
|
|
|
|
$ |
(165) |
|
|
$ |
49 |
|
|
$ |
— |
|
ZIONS BANCORPORATION, NATIONAL ASSOCIATION AND SUBSIDIARIES
|
|
|
|
|
|
|
|
|
|
|
|
|
|
|
|
|
|
|
|
|
|
|
|
|
|
|
Year Ended December 31, 2022 |
| (In millions) |
Effective portion of derivative gain/(loss) deferred in AOCI |
|
|
|
Amount of gain/(loss) reclassified from AOCI into income |
|
Net interest income or expense on fair value hedges |
|
Hedge ineffectiveness / AOCI reclass due to missed forecast |
|
|
|
|
|
|
|
|
|
|
Cash flow hedges of floating-rate assets: 1 |
|
|
|
|
|
|
|
|
|
| Purchased interest rate floors |
$ |
— |
|
|
|
|
$ |
2 |
|
|
$ |
— |
|
|
$ |
— |
|
| Interest rate swaps |
(437) |
|
|
|
|
(29) |
|
|
— |
|
|
— |
|
| Fair value hedges of liabilities: |
|
|
|
|
|
|
|
|
|
| Receive-fixed interest rate swaps |
— |
|
|
|
|
— |
|
|
(1) |
|
|
— |
|
Basis amortization on terminated hedges 2, 3 |
— |
|
|
|
|
— |
|
|
1 |
|
|
— |
|
| Fair value hedges of assets: |
|
|
|
|
|
|
|
|
|
| Pay-fixed interest rate swaps |
— |
|
|
|
|
— |
|
|
4 |
|
|
(1) |
|
Basis amortization on terminated hedges 2, 3 |
— |
|
|
|
|
— |
|
|
— |
|
|
— |
|
Total derivatives designated as hedging instruments |
$ |
(437) |
|
|
|
|
$ |
(27) |
|
|
$ |
4 |
|
|
$ |
(1) |
|
1 For the 12 months following December 31, 2023, we estimate that $118 million of net losses from active and terminated cash flow hedges will be reclassified from AOCI into interest income/expense, compared with an estimate of $205 million at December 31, 2022.
2 Adjustment to interest income or expense resulting from the amortization of the basis adjustment from previously terminated hedging relationships.
3 The cumulative unamortized basis adjustment from previously terminated or redesignated fair value hedges at December 31, 2023 was $46 million and $3 million of terminated fair value debt and asset hedges, respectively, compared with zero and $10 million at December 31, 2022.
The following schedule presents the amount of gains (losses) recognized from derivatives not designated as accounting hedges:
|
|
|
|
|
|
|
|
|
|
|
|
|
Other Noninterest
Income/(Expense) |
| (In millions) |
2023 |
|
2022 |
Derivatives not designated as hedging instruments: |
|
|
|
Customer interest rate derivatives |
$ |
17 |
|
|
$ |
43 |
|
| Other interest rate derivatives |
4 |
|
|
— |
|
| Foreign exchange derivatives |
29 |
|
|
29 |
|
| Purchased credit derivatives |
(1) |
|
|
— |
|
Total derivatives not designated as hedging instruments |
$ |
49 |
|
|
$ |
72 |
|
ZIONS BANCORPORATION, NATIONAL ASSOCIATION AND SUBSIDIARIES
The following schedule presents derivatives used in fair value hedge accounting relationships, as well as pre-tax gains/(losses) recorded on such derivatives and the related hedged items for the periods presented:
|
|
|
|
|
|
|
|
|
|
|
|
|
|
|
|
|
|
|
|
|
|
|
|
|
|
|
|
|
|
|
|
|
|
|
|
|
Gain/(loss) recorded in income |
|
Twelve Months Ended
December 31, 2023 |
|
Twelve Months Ended
December 31, 2022 |
| (In millions) |
Derivatives 2 |
|
Hedged items |
|
Total income statement impact |
|
Derivatives 2 |
|
Hedged items |
|
Total income statement impact |
|
|
|
|
|
|
|
|
|
|
|
|
Debt: Receive-fixed interest rate swaps 1,2 |
$ |
14 |
|
|
$ |
(14) |
|
|
$ |
— |
|
|
$ |
(79) |
|
|
$ |
79 |
|
|
$ |
— |
|
Assets: Pay-fixed interest rate swaps 1,2 |
(22) |
|
|
22 |
|
|
— |
|
|
224 |
|
|
(225) |
|
|
(1) |
|
1 Consists of hedges of benchmark interest rate risk of fixed-rate long-term debt and fixed-rate AFS securities. Gains and losses were recorded in interest expense or income consistent with the hedged items.
2 The income/expense for derivatives does not reflect interest income/expense from periodic accruals and payments to be consistent with the presentation of the gains/(losses) on the hedged items. Periodic interest income/expense for fair value hedges is shown in a separate schedule above.
The following schedule provides information regarding basis adjustments for hedged items:
|
|
|
|
|
|
|
|
|
|
|
|
|
|
|
|
|
|
|
|
|
|
|
|
|
|
|
|
|
|
|
|
|
|
|
|
|
Par value of hedged assets/(liabilities) |
|
Carrying amount of the hedged assets/(liabilities) |
|
Cumulative amount of fair value hedging adjustment included in the carrying amount of the hedged assets/(liabilities) |
| (In millions) |
2023 |
|
2022 |
|
2023 |
|
2022 |
|
2023 |
|
2022 |
|
|
|
|
|
|
|
|
|
|
|
|
Long-term fixed-rate debt 1,2 |
$ |
— |
|
|
$ |
(500) |
|
|
$ |
— |
|
|
$ |
(435) |
|
|
$ |
— |
|
|
$ |
65 |
|
Fixed-rate AFS securities 1,3 |
12,389 |
|
|
1,228 |
|
|
12,209 |
|
|
962 |
|
|
(180) |
|
|
(266) |
|
1 Carrying amounts exclude (1) issuance and purchase discounts or premiums, (2) unamortized issuance and acquisition costs, and (3) amounts related to terminated fair value hedges.
2 We terminated the remaining fair value hedge of debt during the second quarter of 2023. The remaining hedge basis adjustments will be amortized over the life of the associated debt.
3 These amounts include the amortized cost basis of defined portfolios of AFS securities and commercial loans used to designate hedging relationships in which the hedged item is the stated amount of assets in the defined portfolio anticipated to be outstanding for the designated hedged period. At December 31, 2023, the amortized cost basis of the defined portfolios used in these hedging relationships was $11.3 billion; the cumulative basis adjustment associated with these hedging relationships was $16 million, and the notional amounts of the designated hedging instruments were $3.5 billion.
8. LEASES
We have operating and finance leases for branches, corporate offices, and data centers. At December 31, 2023, we had 407 branches, of which 278 are owned and 129 are leased. We lease our headquarters in Salt Lake City, Utah. The remaining maturities of our lease commitments range from the year 2024 to 2062, and some lease arrangements include options to extend or terminate the leases.
All leases with lease terms greater than twelve months are reported as a lease liability with a corresponding ROU asset. We include ROU assets for operating leases and finance leases in “Other assets” and “Premises, equipment and software, net” on the consolidated balance sheet, respectively. The corresponding liabilities for those leases are included in “Other liabilities” and “Long-term debt.”
ROU assets and related lease liabilities reflect the present value of the future minimum lease payments over the lease term at commencement date. Because most of our leases do not provide an implicit rate, we use our secured incremental borrowing rate that is commensurate with the lease term when calculating the present value of future payments. The ROU asset also reflects any lease prepayments, initial direct costs, amortization, and certain nonlease components, such as maintenance, utilities, or tax payments. Our lease terms incorporate options to extend or terminate the lease when it is reasonably certain that we will exercise these options.
ZIONS BANCORPORATION, NATIONAL ASSOCIATION AND SUBSIDIARIES
The following schedule presents ROU assets and lease liabilities with associated weighted average remaining life and discount rate:
|
|
|
|
|
|
|
|
|
|
|
|
|
|
|
December 31, |
|
|
| (Dollar amounts in millions) |
2023 |
|
2022 |
|
|
| Operating leases |
|
|
|
|
|
| ROU assets, net of amortization |
$ |
172 |
|
$ |
173 |
|
|
| Lease liabilities |
198 |
|
198 |
|
|
| Finance leases |
|
|
|
|
|
| ROU assets, net of amortization |
3 |
|
4 |
|
|
| Lease liabilities |
4 |
|
4 |
|
|
| Weighted average remaining lease term (years) |
|
|
|
|
|
| Operating leases |
8.7 |
|
8.4 |
|
|
| Finance leases |
16.5 |
|
17.4 |
|
|
| Weighted average discount rate |
|
|
|
|
|
| Operating leases |
3.4 |
% |
|
2.9 |
% |
|
|
| Finance leases |
3.1 |
% |
|
3.1 |
% |
|
|
The following schedule presents additional information related to lease expense:
|
|
|
|
|
|
|
|
|
|
|
|
|
|
|
|
|
|
|
|
|
|
|
Year Ended December 31, |
| (In millions) |
|
|
2023 |
|
2022 |
|
2021 |
| Lease expense: |
|
|
|
|
|
|
|
| Operating lease expense |
|
|
$ |
43 |
|
|
$ |
46 |
|
|
$ |
47 |
|
Other expenses associated with operating leases 1 |
|
|
60 |
|
|
51 |
|
|
50 |
|
| Total lease expense |
|
|
$ |
103 |
|
|
$ |
97 |
|
|
$ |
97 |
|
|
|
|
|
|
|
|
|
| Related cash disbursements for operating leases |
|
|
$ |
49 |
|
|
$ |
50 |
|
|
$ |
50 |
|
1 Other expenses primarily include property taxes and building and property maintenance.
The following schedule presents the total contractual undiscounted lease payments for operating lease liabilities by expected due date for each of the next five years:
|
|
|
|
|
|
| (In millions) |
Total undiscounted lease payments |
|
|
| 2024 |
$ |
43 |
|
| 2025 |
36 |
|
| 2026 |
31 |
|
| 2027 |
22 |
|
| 2028 |
17 |
|
| Thereafter |
85 |
|
| Total lease payments |
$ |
234 |
|
| Less imputed interest |
36 |
|
| Total |
$ |
198 |
|
We enter into certain lease agreements where we are the lessor of real estate. Real estate leases are made from bank-owned and subleased property to generate cash flow from the property, including from leasing vacant suites in which we occupy portions of the building. Operating lease income totaled $14 million during both 2023 and 2022, and $13 million during 2021.
We originated equipment leases, considered to be sales-type leases or direct-financing leases, totaling $383 million and $386 million at December 31, 2023 and 2022, respectively. We recorded income of $16 million, $12 million, and $11 million on these leases during 2023, 2022, and 2021, respectively.
ZIONS BANCORPORATION, NATIONAL ASSOCIATION AND SUBSIDIARIES
9. PREMISES, EQUIPMENT, AND SOFTWARE
Net premises, equipment, and software are summarized as follows:
|
|
|
|
|
|
|
|
|
|
|
|
| (In millions) |
December 31, |
| 2023 |
|
2022 |
|
|
|
|
| Land |
$ |
269 |
|
|
$ |
264 |
|
| Buildings |
959 |
|
|
943 |
|
| Furniture and equipment |
336 |
|
|
346 |
|
| Leasehold improvements |
137 |
|
|
151 |
|
| Software |
749 |
|
|
730 |
|
Total premises, equipment, and software 1 |
2,450 |
|
|
2,434 |
|
| Less accumulated depreciation and amortization |
1,050 |
|
|
1,026 |
|
| Net book value |
$ |
1,400 |
|
|
$ |
1,408 |
|
1 The totals for 2023 and 2022 include $40 million and $298 million, respectively, of costs that have been capitalized, but are not yet depreciating because the respective assets have not been placed in service.
10. GOODWILL AND OTHER INTANGIBLE ASSETS
Goodwill is recorded at fair value at the time of its acquisition and is subsequently evaluated for impairment annually as of October 1, or more frequently if events or circumstances indicate that impairment may exist. Based on the annual impairment evaluation conducted in 2023 and 2022, there was no goodwill impairment in any of our business segments.
The following schedule presents the carrying amount of goodwill for our business segments with goodwill, as well as the balance of our core deposits and other intangible assets, net of related accumulated amortization:
|
|
|
|
|
|
|
|
|
|
|
|
|
December 31, |
| (In millions) |
2023 |
|
2022 |
| Goodwill: |
|
|
|
| Amegy |
$ |
615 |
|
|
$ |
615 |
|
| CB&T |
379 |
|
|
379 |
|
| Zions Bank |
20 |
|
|
20 |
|
| Nevada State Bank |
13 |
|
|
13 |
|
| Total goodwill |
$ |
1,027 |
|
|
$ |
1,027 |
|
| Core deposits and other intangibles, net of accumulated amortization |
32 |
|
|
38 |
|
| Total goodwill and intangibles |
$ |
1,059 |
|
|
$ |
1,065 |
|
11. DEPOSITS
The following schedule presents the composition of our deposits:
|
|
|
|
|
|
|
|
|
|
|
|
|
December 31, |
| (Dollar amounts in millions) |
2023 |
|
2022 |
|
|
|
|
| Noninterest-bearing demand |
$ |
26,244 |
|
|
$ |
35,777 |
|
| Interest-bearing: |
|
|
|
| Savings and money market |
38,721 |
|
|
33,566 |
|
| Time |
9,996 |
|
|
2,309 |
|
| Total deposits |
$ |
74,961 |
|
|
$ |
71,652 |
|
ZIONS BANCORPORATION, NATIONAL ASSOCIATION AND SUBSIDIARIES
At December 31, 2023, the aggregate amount of all time deposits by maturity were as follows:
|
|
|
|
|
|
| (In millions) |
Amount |
|
|
| 2024 |
$ |
9,798 |
|
| 2025 |
117 |
|
| 2026 |
38 |
|
| 2027 |
22 |
|
| 2028 |
20 |
|
| Thereafter |
1 |
|
| Total |
$ |
9,996 |
|
The scheduled maturities of time deposits that exceed $250,000 were as follows:
|
|
|
|
|
|
| (In millions) |
December 31, 2023 |
|
|
| Three months or less |
$ |
576 |
|
| After three months through six months |
1,033 |
|
| After six months through twelve months |
745 |
|
| After twelve months |
57 |
|
| Total |
$ |
2,411 |
|
Deposit overdrafts reclassified as loan balances were $11 million and $21 million at December 31, 2023 and 2022, respectively.
12. SHORT-TERM BORROWINGS
The following schedule presents selected information for FHLB advances and other short-term borrowings:
|
|
|
|
|
|
|
|
|
|
|
|
|
|
| (Dollar amounts in millions) |
2023 |
|
2022 |
|
|
| Federal Home Loan Bank advances |
|
|
|
|
|
| Average amount outstanding |
$ |
4,208 |
|
|
$ |
1,257 |
|
|
|
| Average rate |
5.73 |
% |
|
3.67 |
% |
|
|
| Highest month-end balance |
$ |
11,525 |
|
|
$ |
7,100 |
|
|
|
| Year-end balance |
1,525 |
|
|
7,100 |
|
|
|
| Average rate on outstanding advances at year-end |
5.59 |
% |
|
4.43 |
% |
|
|
| Other short-term borrowings, year-end balances |
|
|
|
|
|
|
|
|
|
|
|
|
|
|
|
|
|
|
|
|
|
|
|
|
|
|
|
|
|
| Federal funds purchased |
$ |
597 |
|
|
$ |
232 |
|
|
|
|
|
|
|
|
|
|
|
|
|
|
|
|
|
|
|
|
|
|
|
|
|
|
|
|
|
|
|
|
|
| Security repurchase agreements |
1,814 |
|
|
2,898 |
|
|
|
|
|
|
|
|
|
|
|
|
|
|
|
| Securities sold, not yet purchased |
65 |
|
|
187 |
|
|
|
Swap margin collateral received 1 |
378 |
|
|
— |
|
|
|
| Total federal funds and other short-term borrowings |
$ |
4,379 |
|
|
$ |
10,417 |
|
|
|
1 At December 31, 2022, swap margin collateral received totaled $368 million and was included in “Other liabilities” on the consolidated balance sheet. Beginning in 2023, these balances were included in “Federal funds and other short-term borrowings” on the consolidated balance sheet.
We pledge loans and investment securities as collateral for current and potential borrowings. We may borrow from the FHLB under lines of credit that are secured by blanket pledge arrangements. We maintain collateral with carrying amounts adjusted for the types of collateral pledged, equal to at least 100% of the outstanding advances. We may also borrow from the Federal Reserve Board (“FRB”) based on the amount of collateral pledged.
A large portion of these pledged assets are unencumbered, but are pledged to provide immediate access to contingency sources of funds. At December 31, 2023, our remaining FHLB and FRB collateralized borrowing capacity was $15.0 billion and $9.8 billion, respectively, compared with $9.4 billion and $4.0 billion at December 31, 2022.
ZIONS BANCORPORATION, NATIONAL ASSOCIATION AND SUBSIDIARIES
Federal funds purchased and security repurchase agreements generally mature in less than 30 days. We execute overnight repurchase agreements with sweep accounts in conjunction with a master repurchase agreement. When this occurs, securities under our control are pledged and interest is paid on the collected balance of the customers’ accounts. For the nonsweep overnight and term repurchase agreements, securities are transferred to the applicable counterparty. In certain instances, the counterparty is contractually entitled to sell or repledge securities accepted as collateral. Of the total security repurchase agreements at December 31, 2023, nearly all were overnight term accounts.
13. LONG-TERM DEBT
Long-term debt is summarized as follows:
|
|
|
|
|
|
|
|
|
|
|
|
|
December 31, |
| (In millions) |
2023 |
|
2022 |
|
|
|
|
| Subordinated notes |
$ |
538 |
|
|
$ |
519 |
|
| Senior notes |
— |
|
|
128 |
|
| Finance lease obligations |
4 |
|
|
4 |
|
| Total |
$ |
542 |
|
|
$ |
651 |
|
The carrying values presented above include the par value of the debt, adjusted for any unamortized premium or discount, unamortized debt issuance costs, and fair value hedge basis adjustments. The decrease in long-term debt from the prior year was primarily due to the maturity of $128 million, 4.50% senior notes during the second quarter of 2023.
During 2023, we terminated the remaining receive-fixed interest rate swap designated as a hedge of the $500 million subordinated notes due in October 2029. The remaining unamortized hedge basis adjustment from the terminated hedging relationship is amortized into earnings through the contractual maturity date of the hedged notes. See Note 7 for more information on derivatives designated as qualifying hedges.
Subordinated Notes
The following schedule presents our subordinated notes outstanding at December 31, 2023:
|
|
|
|
|
|
|
|
|
|
|
|
|
|
|
|
|
|
|
|
|
| (Dollar amounts in millions) |
|
Subordinated notes |
|
|
| Coupon rate |
|
Balance |
|
Par amount |
|
Maturity |
|
|
|
|
|
|
|
| 6.95% |
|
$ |
88 |
|
|
$ |
88 |
|
|
September 2028 |
| 3.25% |
|
450 |
|
|
500 |
|
|
October 2029 |
| Total |
|
$ |
538 |
|
|
$ |
588 |
|
|
|
The 6.95% subordinated notes are unsecured, with interest payable quarterly; the earliest redemption date for these notes was September 15, 2023, after which the interest rate changed to an annual floating rate equal to 3-month Term SOFR + 4.15%. The 3.25% subordinated notes are unsecured, interest is payable semi-annually, and the earliest redemption date is July 29, 2029.
Senior Notes
The senior notes are unsecured, with interest payable semi-annually. They were issued under a shelf registration filed with the Securities and Exchange Commission (“SEC”).
ZIONS BANCORPORATION, NATIONAL ASSOCIATION AND SUBSIDIARIES
Maturities of Long-term Debt
The following schedule presents our long-term debt by maturity for each of the next five years:
|
|
|
|
|
|
| (In millions) |
Par amount 1 |
|
|
| 2024 |
$ |
— |
|
| 2025 |
— |
|
| 2026 |
— |
|
| 2027 |
— |
|
| 2028 |
88 |
|
| Thereafter |
500 |
|
| Total |
$ |
588 |
|
1 Does not include basis adjustments related to terminated or active fair value hedges.
14. SHAREHOLDERS’ EQUITY
Preferred Stock
We have 4.4 million authorized shares of preferred stock without par value and with a liquidation preference of $1,000 per share, or $25 per depositary share. Except for Series I and J, all preferred shares were issued in the form of depositary shares, with each depositary share representing a 1/40th ownership interest in a share of the preferred stock. All preferred shares are registered with the SEC. In addition, Series A and G preferred shares are listed and traded on the National Association of Securities Dealers Automated Quotations (“NASDAQ”) Global Select Market.
Preferred shareholders generally receive asset distributions before common shareholders; however, preferred shareholders have only limited voting rights. Preferred stock dividends reduce earnings applicable to common shareholders and are paid on the 15th day of the months indicated in the following schedule. Dividends are subject to approval by the Board.
The preferred shares are redeemable at our option after the expiration of any applicable redemption restrictions. The redemption amount is computed at the per share liquidation preference plus any declared but unpaid dividends. Redemptions are subject to certain regulatory provisions including satisfying well-capitalized minimum requirements.
The following schedule summarizes key aspects of our preferred stock:
|
|
|
|
|
|
|
|
|
|
|
|
|
|
|
|
|
|
|
|
|
|
|
|
|
|
|
|
|
|
|
|
|
|
|
|
|
|
|
|
|
|
|
|
|
|
| (Dollar amounts in millions) |
Carrying value at
December 31, |
|
Shares at
December 31, 2023 |
|
|
|
Dividends payable |
|
Earliest
redemption date |
|
|
|
|
| 2023 |
|
2022 |
|
Authorized |
|
Outstanding |
|
Rate |
|
|
|
|
|
|
|
|
|
|
|
|
|
|
|
|
|
|
|
|
| Series A |
$ |
67 |
|
|
$ |
67 |
|
|
140,000 |
|
|
66,139 |
|
|
> of 4.0% or
3M Term SOFR + 0.78%
|
|
Qtrly Mar, Jun, Sep, Dec |
|
Dec 15, 2011 |
|
|
|
|
|
|
|
|
|
|
|
|
|
|
|
|
|
|
|
|
|
|
| Series G |
138 |
|
|
138 |
|
|
200,000 |
|
|
138,390 |
|
|
annual floating rate =
3M Term SOFR + 4.50%
|
|
Qtrly Mar, Jun, Sep, Dec |
|
Mar 15, 2023 |
|
|
|
|
|
|
|
|
|
|
|
|
|
|
|
|
|
|
|
|
|
|
| Series I |
99 |
|
|
99 |
|
|
300,893 |
|
|
98,555 |
|
|
annual floating rate =
3M Term SOFR + 4.06%
|
|
Qtrly Mar, Jun, Sep, Dec |
|
Jun 15, 2023 |
|
|
|
|
| Series J |
136 |
|
|
136 |
|
|
195,152 |
|
|
136,368 |
|
|
annual floating rate =
3M Term SOFR + 4.70%
|
|
Qtrly Mar, Jun, Sep, Dec |
|
Sep 15, 2023 |
|
|
|
|
| Total |
$ |
440 |
|
|
$ |
440 |
|
|
|
|
|
|
|
|
|
|
|
|
|
|
|
ZIONS BANCORPORATION, NATIONAL ASSOCIATION AND SUBSIDIARIES
Common Stock
Our common stock is traded on the NASDAQ Global Select Market. At December 31, 2023, we had 148.2 million shares of $0.001 par common stock outstanding. The balance of common stock and additional paid-in-capital was $1.7 billion at December 31, 2023, and decreased $23 million, or 1%, from the prior year, primarily as a result of common stock repurchases during the first quarter of 2023.
During the first quarter of 2023, we repurchased 0.9 million common shares outstanding for $50 million at an average price of $52.82 per share. As the macroeconomic environment remained uncertain, we suspended our share repurchase program and did not repurchase common shares during the second, third, or fourth quarters of 2023. During 2022, we repurchased 3.6 million common shares outstanding for $200 million at an average price of $56.13 per share.
In February 2024, the Board approved a plan to repurchase up to $35 million of common shares outstanding during the fiscal year 2024. In February 2024, we repurchased 0.9 million common shares outstanding for $35 million at an average price of $39.32.
Accumulated Other Comprehensive Income
The AOCI loss was $2.7 billion at December 31, 2023, and primarily reflects declines in the fair value of fixed-rate available-for-sale securities as a result of changes in interest rates.
During the fourth quarter of 2022, we transferred approximately $10.7 billion fair value ($13.1 billion amortized cost) of mortgage-backed AFS securities to the HTM category to reflect our intent for these securities. The amortized cost basis of these securities does not include $2.4 billion of unrealized losses in AOCI that is amortized over the life of the securities. The amortization of the unrealized losses reported in AOCI will offset the effect of the accretion of the discount in interest income that is created by adjusting the amortized cost basis to the securities’ fair value on the date of the transfer. At December 31, 2023, the unamortized discount on the HTM securities totaled approximately $2.1 billion ($1.5 billion after tax).
The following schedule presents the changes in AOCI:
|
|
|
|
|
|
|
|
|
|
|
|
|
|
|
|
|
|
|
|
|
|
|
|
(In millions)
|
Net unrealized gains (losses) on investment securities |
|
Net unrealized gains (losses) on derivatives and other |
|
Pension and post-retirement |
|
Total |
| 2023 |
|
|
|
|
|
|
|
| Balance at December 31, 2022 |
$ |
(2,800) |
|
|
$ |
(311) |
|
|
$ |
(1) |
|
|
$ |
(3,112) |
|
Other comprehensive income before reclassifications, net of tax |
66 |
|
|
22 |
|
|
— |
|
|
88 |
|
| Amounts reclassified from AOCI, net of tax |
208 |
|
|
124 |
|
|
— |
|
|
332 |
|
|
|
|
|
|
|
|
|
| Other comprehensive income |
274 |
|
|
146 |
|
|
— |
|
|
420 |
|
| Balance at December 31, 2023 |
$ |
(2,526) |
|
|
$ |
(165) |
|
|
$ |
(1) |
|
|
$ |
(2,692) |
|
Income tax expense included in other comprehensive income |
$ |
90 |
|
|
$ |
47 |
|
|
$ |
— |
|
|
$ |
137 |
|
| 2022 |
|
|
|
|
|
|
|
| Balance at December 31, 2021 |
$ |
(78) |
|
|
$ |
— |
|
|
$ |
(2) |
|
|
$ |
(80) |
|
Other comprehensive loss before reclassifications, net of tax |
(2,762) |
|
|
(332) |
|
|
1 |
|
|
(3,093) |
|
| Amounts reclassified from AOCI, net of tax |
40 |
|
|
21 |
|
|
— |
|
|
61 |
|
|
|
|
|
|
|
|
|
| Other comprehensive income (loss) |
(2,722) |
|
|
(311) |
|
|
1 |
|
|
(3,032) |
|
| Balance at December 31, 2022 |
$ |
(2,800) |
|
|
$ |
(311) |
|
|
$ |
(1) |
|
|
$ |
(3,112) |
|
Income tax benefit included in other comprehensive loss |
$ |
(888) |
|
|
$ |
(101) |
|
|
$ |
— |
|
|
$ |
(989) |
|
ZIONS BANCORPORATION, NATIONAL ASSOCIATION AND SUBSIDIARIES
|
|
|
|
|
|
|
|
|
|
|
|
|
|
|
|
|
|
|
|
|
|
|
|
|
|
|
|
|
|
|
|
|
|
|
|
|
|
| (In millions) |
|
Amounts reclassified from AOCI 1 |
|
|
Affected line item
on statement of income |
| AOCI components |
|
2023 |
|
2022 |
|
2021 |
|
|
|
|
|
|
|
|
|
|
|
|
|
| Net unrealized gains (losses) on investment securities |
|
$ |
(276) |
|
|
$ |
(53) |
|
|
$ |
— |
|
|
|
|
Securities gains (losses), net |
| Less: Income tax expense (benefit) |
|
(68) |
|
|
(13) |
|
|
— |
|
|
|
|
|
|
|
$ |
(208) |
|
|
$ |
(40) |
|
|
$ |
— |
|
|
|
|
|
Net unrealized gains (losses) on derivative instruments |
|
$ |
(165) |
|
|
$ |
(27) |
|
|
$ |
61 |
|
|
|
|
Interest and fees on loans; Interest on short- and long-term borrowings |
| Less: Income tax expense (benefit) |
|
(41) |
|
|
(6) |
|
|
15 |
|
|
|
|
|
|
|
$ |
(124) |
|
|
$ |
(21) |
|
|
$ |
46 |
|
|
|
|
|
|
|
|
|
|
|
|
|
|
|
|
|
|
|
|
|
|
|
|
|
|
|
|
|
|
|
|
|
|
|
|
|
|
|
|
|
|
|
|
|
|
|
|
|
1 Positive reclassification amounts indicate increases to earnings on the statement of income.
Deferred Compensation
Deferred compensation consists of invested assets, including our common stock, which are held in rabbi trusts for certain employees and directors. The fair value of our common stock was approximately $19 million and $14 million at December 31, 2023 and 2022, respectively. We consolidate the rabbi trust assets and liabilities and include them in “Other assets” and “Other liabilities” on the consolidated balance sheet, respectively. At December 31, 2023 and 2022, associated trust assets totaled approximately $124 million and $114 million, and trust liabilities totaled approximately $143 million and $128 million, respectively.
15. REGULATORY MATTERS
We are subject to various regulatory capital requirements administered by federal banking agencies. Failure to meet minimum capital requirements can initiate certain mandatory — and possibly additional discretionary — actions by regulators that, if undertaken, could have a direct material effect on our financial statements. Under capital adequacy guidelines and the regulatory framework for prompt corrective action, we must meet specific capital guidelines that involve quantitative measures of our assets, liabilities, and certain off-balance sheet items as calculated under regulatory accounting practices. At December 31, 2023 and 2022, we exceeded all capital adequacy requirements under the Basel III capital rules.
Quantitative measures established by regulation to ensure capital adequacy require us to maintain minimum amounts and ratios of common equity Tier 1 (“CET1”) to risk-weighted assets, Tier 1 capital (as defined in the regulations), Total capital, and Tier 1 capital to average assets (Tier 1 leverage ratio). “Well-capitalized” levels are also published as a guideline to evaluate capital positions. At December 31, 2023 and 2022, all of our capital ratios exceeded the “well-capitalized” levels under the regulatory framework for prompt corrective action.
Dividends declared by us may not exceed specified criteria unless otherwise approved by our regulators. When determining dividends, we consider current and historical earning levels, retained earnings, and risk-based and other regulatory capital requirements and limitations.
Our internal stress tests seek to comprehensively measure all risks to which we are exposed, the losses that could result from those risk exposures under adverse scenarios, and our resulting capital levels. These stress tests have both a qualitative and a quantitative component. The qualitative component evaluates our risk identification processes, stress risk modeling, policies, capital planning, governance processes, and other components of a capital adequacy process. The quantitative process subjects our balance sheet and other risk characteristics to stress testing by using our own models.
ZIONS BANCORPORATION, NATIONAL ASSOCIATION AND SUBSIDIARIES
The following schedule presents our capital amounts and ratios and the minimum requirements to be well-capitalized under Basel III at December 31, 2023 and 2022:
|
|
|
|
|
|
|
|
|
|
|
|
|
|
|
|
|
|
|
|
|
|
|
|
| (Dollar amounts in millions) |
December 31, 2023 |
|
Minimum requirement to be “well-capitalized” |
| Amount |
|
Ratio |
|
Amount |
|
Ratio |
Basel III Regulatory Capital Amounts and Ratios |
|
|
|
|
|
|
|
| Common equity Tier 1 capital (to risk-weighted assets) |
$ |
6,863 |
|
|
10.3 |
% |
|
$ |
4,351 |
|
|
6.5 |
% |
| Tier 1 capital (to risk-weighted assets) |
7,303 |
|
|
10.9 |
|
|
5,355 |
|
|
8.0 |
|
| Total capital (to risk-weighted assets) |
8,553 |
|
|
12.8 |
|
|
6,693 |
|
|
10.0 |
|
| Tier 1 leverage ratio |
7,303 |
|
|
8.3 |
|
|
4,379 |
|
|
5.0 |
|
|
|
|
|
|
|
|
|
|
|
|
|
|
|
|
|
|
|
|
|
|
|
|
|
|
December 31, 2022 |
|
Minimum requirement to be “well-capitalized” |
| (Dollar amounts in millions) |
Amount |
|
Ratio |
|
Amount |
|
Ratio |
| Basel III Regulatory Capital Amounts and Ratios |
|
|
|
|
|
|
|
| Common equity Tier 1 capital (to risk-weighted assets) |
$ |
6,481 |
|
|
9.8 |
% |
|
$ |
4,297 |
|
|
6.5 |
% |
| Tier 1 capital (to risk-weighted assets) |
6,921 |
|
|
10.5 |
|
|
5,289 |
|
|
8.0 |
|
| Total capital (to risk-weighted assets) |
8,077 |
|
|
12.2 |
|
|
6,611 |
|
|
10.0 |
|
| Tier 1 leverage ratio |
6,921 |
|
|
7.7 |
|
|
4,472 |
|
|
5.0 |
|
The Basel III capital rules require us to maintain certain minimum capital ratios, as well as a 2.5% “capital conservation buffer,” which is designed to absorb losses during periods of economic stress, composed entirely of CET1, and in excess of the minimum risk-based capital ratios. The following schedule presents the minimum capital ratios and capital conservation buffer requirements, compared with our capital ratios at December 31, 2023:
|
|
|
|
|
|
|
|
|
|
|
|
|
|
|
|
|
December 31, 2023 |
|
Minimum capital requirement |
Capital conservation buffer |
Minimum capital ratio requirement with capital conservation buffer |
|
Current capital
ratio |
|
|
|
|
|
|
| CET1 to risk-weighted assets |
4.5 |
% |
2.5 |
% |
7.0 |
% |
|
10.3 |
% |
| Tier 1 capital (i.e., CET1 plus additional Tier 1 capital) to risk-weighted assets |
6.0 |
|
2.5 |
|
8.5 |
|
|
10.9 |
|
| Total capital (i.e., Tier 1 capital plus Tier 2 capital) to risk-weighted assets |
8.0 |
|
2.5 |
|
10.5 |
|
|
12.8 |
|
| Tier 1 capital to average consolidated assets (known as the “Tier 1 leverage ratio”) |
4.0 |
|
N/A |
4.0 |
|
|
8.3 |
|
Financial institutions with a ratio of CET1 to risk-weighted assets above the minimum but below the capital conservation buffer may face constraints on dividends, equity repurchases, and compensation based on the amount of the shortfall. Our internal triggers and limits under actual conditions and baseline projections are more restrictive than the capital conservation buffer requirements.
16. COMMITMENTS, GUARANTEES, CONTINGENT LIABILITIES, AND RELATED PARTIES
Commitments and Guarantees
We use certain financial instruments, including derivative instruments, in the normal course of business to meet the financing needs of our customers, to reduce our own exposure to fluctuations in interest rates, and to make a market in U.S. government, agency, corporate, and municipal securities. These financial instruments involve, to varying degrees, elements of credit, liquidity, and interest rate risk in excess of the amounts presented on the consolidated balance sheet. See Notes 3 and 7 for more information on derivative instruments.
ZIONS BANCORPORATION, NATIONAL ASSOCIATION AND SUBSIDIARIES
The following schedule presents the contractual amounts related to off-balance sheet financial instruments used to meet the financing needs of our customers:
|
|
|
|
|
|
|
|
|
|
|
|
|
December 31, |
| (In millions) |
2023 |
|
2022 |
|
|
|
|
Unfunded lending commitments 1 |
$ |
28,940 |
|
|
$ |
29,628 |
|
| Standby letters of credit: |
|
|
|
| Financial |
548 |
|
|
667 |
|
| Performance |
206 |
|
|
184 |
|
| Commercial letters of credit |
22 |
|
|
11 |
|
Mortgage-backed security purchase agreements 2 |
66 |
|
|
23 |
|
| Total unfunded commitments |
$ |
29,782 |
|
|
$ |
30,513 |
|
1 Net of participations.
2 Represents agreements with Farmer Mac to purchase securities backed by certain agricultural mortgage loans.
Loan commitments are agreements to lend to a customer subject to specified conditions. Commitments generally have fixed expiration dates or other termination clauses and may require the payment of a fee. The amount of collateral obtained, if deemed necessary by us upon extension of credit, is based on our initial credit evaluation of the counterparty. Types of collateral vary, but may include accounts receivable, inventory, property, plant and equipment, and income-producing properties.
While making loan commitments creates credit risk, a significant portion of such commitments is expected to expire without being drawn upon. At December 31, 2023, we had $8.0 billion of commitments scheduled to expire in 2024. We use the same credit policies and procedures in making loan commitments and conditional obligations as we do for on-balance sheet instruments. These policies and procedures include credit approvals, limits, and ongoing monitoring.
We issue standby and commercial letters of credit as conditional commitments generally to guarantee the performance of a customer to a third party. The guarantees are primarily issued to support public and private borrowing arrangements, including commercial paper, bond financing, and similar transactions. Standby letters of credit include commitments of $754 million expiring in 2024. The credit risk involved in issuing letters of credit is equivalent to the risk involved in extending credit to customers. We generally hold marketable securities and cash equivalents as collateral.
Certain mortgage loans sold have limited recourse provisions for periods ranging from three months to one year. The amount of losses resulting from the exercise of these provisions has not been significant.
Legal Matters
We are involved in various legal proceedings or governmental inquiries, which may include litigation in court and arbitral proceedings, as well as investigations, examinations, and other actions brought or considered by governmental and self-regulatory agencies. Litigation may relate to lending, deposit and other customer relationships, vendor and contractual issues, employee matters, intellectual property matters, personal injuries and torts, regulatory and legal compliance, and other matters. While most matters relate to individual claims, we are also subject to putative class action claims and similar broader claims. Proceedings, investigations, examinations, and other actions brought or considered by governmental and self-regulatory agencies may relate to our banking, investment advisory, trust, securities, and other products and services; our customers’ involvement in money laundering, fraud, securities violations and other illicit activities or our policies and practices relating to such customer activities; and our compliance with the broad range of banking, securities and other laws and regulations applicable to us. At any given time, we may be in the process of responding to subpoenas, requests for documents, data and testimony relating to such matters and engaging in discussions to resolve the matters.
ZIONS BANCORPORATION, NATIONAL ASSOCIATION AND SUBSIDIARIES
At December 31, 2023, we were subject to the following material litigation:
•Two civil cases, Lifescan Inc. and Johnson & Johnson Health Care Services v. Jeffrey C. Smith, et. al., brought against us in the United States District Court for the District of New Jersey in December 2017, and Roche Diagnostics and Roche Diabetes Care Inc. v. Jeffrey C. Smith, et. al., brought against us in the United States District Court for the District of New Jersey in March 2019. In these cases, certain manufacturers and distributors of medical products seek to hold us liable for allegedly fraudulent practices of a borrower of the Bank who filed for bankruptcy protection in 2017. The cases are in discovery phases. Trial for the two cases has been scheduled for November 2024, but may be rescheduled to a later date.
•Sipple v. Zions Bancorporation, N.A., brought against us in the District Court of Clark County, Nevada in February 2021 with respect to foreign transaction fees. This case is in the discovery phase and trial has been scheduled for October 2024. The parties are currently engaged in settlement discussions.
At least quarterly, we review outstanding and new legal matters, utilizing then available information. In accordance with applicable accounting guidance, if we determine that a loss from a matter is probable and the amount of the loss can be reasonably estimated, we establish an accrual for the loss. In the absence of such a determination, no accrual is made. Once established, accruals are adjusted to reflect developments relating to the matters.
In our review, we also assess whether we can determine the range of reasonably possible losses for significant matters in which we are unable to determine that the likelihood of a loss is remote. Because of the difficulty of predicting the outcome of legal matters, discussed subsequently, we are able to meaningfully estimate such a range only for a limited number of matters. Based on information available at December 31, 2023, we estimated that the aggregate range of reasonably possible losses for those matters to be from zero to approximately $10 million in excess of amounts accrued. The matters underlying the estimated range will change from time to time, and actual results may vary significantly from this estimate. Those matters for which a meaningful estimate is not possible are not included within this estimated range and, therefore, this estimated range does not represent our maximum loss exposure.
Based on our current knowledge, we believe that our current estimated liability for litigation and other legal actions and claims, reflected in our accruals and determined in accordance with applicable accounting guidance, is adequate and that liabilities in excess of the amounts currently accrued, if any, arising from litigation and other legal actions and claims for which an estimate as previously described is possible, will not have a material impact on our financial condition, results of operations, or cash flows. However, in light of the significant uncertainties involved in these matters, and the very large or indeterminate damages sought in some of these matters, an adverse outcome in one or more of these matters could be material to our financial condition, results of operations, or cash flows for any given reporting period.
Any estimate or determination relating to the future resolution of litigation, arbitration, governmental or self-regulatory examinations, investigations or actions or similar matters is inherently uncertain and involves significant judgment. This is particularly true in the early stages of a legal matter, when legal issues and facts have not been well articulated, reviewed, analyzed, and vetted through discovery, preparation for trial or hearings, substantive and productive mediation or settlement discussions, or other actions. It is also particularly true with respect to class action and similar claims involving multiple defendants, matters with complex procedural requirements or substantive issues or novel legal theories, and examinations, investigations and other actions conducted or brought by governmental and self-regulatory agencies, in which the normal adjudicative process is not applicable. Accordingly, we are usually unable to determine whether a favorable or unfavorable outcome is remote, reasonably likely, or probable, or to estimate the amount or range of a probable or reasonably likely loss, until relatively late in the course of a legal matter, sometimes not until a number of years have elapsed. Accordingly, our judgments and estimates relating to claims will change from time to time in light of developments, and actual outcomes will differ from our estimates. These differences may be material.
ZIONS BANCORPORATION, NATIONAL ASSOCIATION AND SUBSIDIARIES
Related Party Transactions
We have no material related party transactions requiring disclosure. In the ordinary course of business, we extend credit to related parties, including executive officers, directors, principal shareholders, and their associates and related interests. These related party loans are made in compliance with applicable banking regulations.
17. REVENUE RECOGNITION
We derive our revenue primarily from interest and fees on loans and interest income on securities, which combined represented approximately 81% of our total revenue (interest income plus noninterest income) in 2023. Noninterest income and revenue from contracts with customers is recognized when control of the promised goods or services is transferred to our customers, in an amount that reflects the consideration we expect to be entitled to in exchange for those goods or services. We recognize the incremental cost of obtaining a contract as an expense, when incurred, if the amortization period of the asset that we would have recognized is one year or less. For performance obligations satisfied over time, if we have a right to consideration from a customer in an amount that corresponds directly with the value to the customer of our performance completed to date, we will generally recognize revenue in the amount to which we have a right to invoice. We do not generally disclose information about our remaining performance obligations for those performance obligations that have an original expected duration of one year or less, or where we recognize revenue in the amount to which we have a right to invoice.
The following is a description of revenue from contracts with customers:
Commercial Account Fees
Commercial account fee income is comprised of account analysis fees, merchant fees, and payroll services income. Revenue is recognized as the services are rendered or upon completion of services.
Card Fees
Card fee income includes interchange fees from credit and debit cards, net fees earned from processing card transactions for merchants, and automated teller machine (“ATM”) services. Card fee income is recognized as earned. Reward program costs are recorded when the rewards are earned by the customer and as a reduction to interchange income.
Retail and Business Banking Fees
Retail and business banking fees typically consist of fees charged for providing customers with deposit services. These fees are primarily comprised of insufficient funds fees, noncustomer ATM charges, and other various fees on deposit accounts. Service charges on deposit accounts include fees earned in lieu of compensating balances, and fees earned for performing cash management services and other deposit account services. Service charges on deposit accounts are recognized over the period in which the related service is provided. Treasury management fees are billed monthly based on services rendered for the month.
Capital Markets Fees
Capital markets fees primarily consist of municipal advisory services, customer swap fees, loan syndication fees, and foreign exchange services provided to customers. Revenue is recognized as the services are rendered or upon completion of services.
Wealth Management Fees
Wealth management fees are primarily comprised of wealth management commissions, as well as other portfolio and advisory services. Revenue is recognized as the services are rendered or upon completion of services. Financial planning, fiduciary, and estate services typically have performance obligations that are greater than 12 months, although the amount of future performance obligations are not significant.
Other Customer-related Fees
Other customer-related fees generally consist of miscellaneous income sources, including fees associated with compliance and other support services to pharmacies and healthcare providers; corporate trust fees; other advisory and referral fees; and fees associated with claims and inventory management services for certain customers.
ZIONS BANCORPORATION, NATIONAL ASSOCIATION AND SUBSIDIARIES
Revenue is recognized as the services are rendered or upon completion of services.
Disaggregation of Revenue
The following schedule presents total net revenue by operating business segment:
|
|
|
|
|
|
|
|
|
|
|
|
|
|
|
|
|
|
|
|
|
|
|
|
|
|
|
|
|
|
|
|
|
|
|
|
|
|
|
|
|
|
|
|
|
|
|
|
|
|
|
|
|
|
|
Zions Bank |
|
CB&T |
|
Amegy |
| (In millions) |
2023 |
|
2022 |
|
2021 |
|
2023 |
|
2022 |
|
2021 |
|
2023 |
|
2022 |
|
2021 |
|
|
|
|
|
|
|
|
|
|
|
|
|
|
|
|
|
|
Commercial account fees |
$ |
55 |
|
|
$ |
53 |
|
|
$ |
46 |
|
|
$ |
32 |
|
|
$ |
28 |
|
|
$ |
25 |
|
|
$ |
56 |
|
|
$ |
46 |
|
|
$ |
40 |
|
Card fees |
52 |
|
|
55 |
|
|
58 |
|
|
21 |
|
|
20 |
|
|
17 |
|
|
31 |
|
|
33 |
|
|
29 |
|
Retail and business banking fees |
19 |
|
|
22 |
|
|
22 |
|
|
11 |
|
|
12 |
|
|
12 |
|
|
14 |
|
|
16 |
|
|
15 |
|
|
|
|
|
|
|
|
|
|
|
|
|
|
|
|
|
|
|
Capital markets fees |
— |
|
|
— |
|
|
— |
|
|
— |
|
|
— |
|
|
— |
|
|
— |
|
|
— |
|
|
— |
|
| Wealth management fees |
23 |
|
|
22 |
|
|
21 |
|
|
4 |
|
|
4 |
|
|
5 |
|
|
17 |
|
|
15 |
|
|
13 |
|
| Other customer-related fees |
8 |
|
|
8 |
|
|
7 |
|
|
7 |
|
|
6 |
|
|
4 |
|
|
7 |
|
|
7 |
|
|
6 |
|
Total noninterest income from contracts with customers (ASC 606) |
157 |
|
|
160 |
|
|
154 |
|
|
75 |
|
|
70 |
|
|
63 |
|
|
125 |
|
|
117 |
|
|
103 |
|
Other noninterest income (non-ASC 606 customer-related) |
24 |
|
|
19 |
|
|
21 |
|
|
35 |
|
|
34 |
|
|
34 |
|
|
37 |
|
|
40 |
|
|
36 |
|
Total customer-related noninterest income |
181 |
|
|
179 |
|
|
175 |
|
|
110 |
|
|
104 |
|
|
97 |
|
|
162 |
|
|
157 |
|
|
139 |
|
Other noncustomer-related noninterest income |
11 |
|
|
5 |
|
|
10 |
|
|
6 |
|
|
4 |
|
|
5 |
|
|
22 |
|
|
1 |
|
|
2 |
|
Total noninterest income |
192 |
|
|
184 |
|
|
185 |
|
|
116 |
|
|
108 |
|
|
102 |
|
|
184 |
|
|
158 |
|
|
141 |
|
|
|
|
|
|
|
|
|
|
|
|
|
|
|
|
|
|
|
Net interest income |
696 |
|
|
741 |
|
|
633 |
|
|
598 |
|
|
595 |
|
|
536 |
|
|
453 |
|
|
513 |
|
|
462 |
|
Total net revenue |
$ |
888 |
|
|
$ |
925 |
|
|
$ |
818 |
|
|
$ |
714 |
|
|
$ |
703 |
|
|
$ |
638 |
|
|
$ |
637 |
|
|
$ |
671 |
|
|
$ |
603 |
|
|
|
|
|
|
|
|
|
|
|
|
|
|
|
|
|
|
|
|
|
|
|
|
|
|
|
|
|
|
|
|
|
|
|
|
|
|
|
|
|
|
|
|
|
|
|
|
|
|
|
|
|
|
|
|
NBAZ |
|
NSB |
|
Vectra |
| (In millions) |
2023 |
|
2022 |
|
2021 |
|
2023 |
|
2022 |
|
2021 |
|
2023 |
|
2022 |
|
2021 |
|
|
|
|
|
|
|
|
|
|
|
|
|
|
|
|
|
|
Commercial account fees |
$ |
10 |
|
|
$ |
9 |
|
|
$ |
7 |
|
|
$ |
12 |
|
|
$ |
11 |
|
|
$ |
9 |
|
|
$ |
7 |
|
|
$ |
8 |
|
|
$ |
7 |
|
Card fees |
15 |
|
|
15 |
|
|
11 |
|
|
16 |
|
|
15 |
|
|
12 |
|
|
9 |
|
|
9 |
|
|
6 |
|
Retail and business banking fees |
8 |
|
|
9 |
|
|
9 |
|
|
10 |
|
|
10 |
|
|
10 |
|
|
4 |
|
|
4 |
|
|
4 |
|
|
|
|
|
|
|
|
|
|
|
|
|
|
|
|
|
|
|
Capital markets fees |
— |
|
|
— |
|
|
— |
|
|
— |
|
|
— |
|
|
— |
|
|
— |
|
|
— |
|
|
— |
|
| Wealth management fees |
3 |
|
|
3 |
|
|
3 |
|
|
5 |
|
|
5 |
|
|
4 |
|
|
1 |
|
|
1 |
|
|
2 |
|
| Other customer-related fees |
1 |
|
|
2 |
|
|
1 |
|
|
1 |
|
|
1 |
|
|
1 |
|
|
4 |
|
|
3 |
|
|
2 |
|
Total noninterest income from contracts with customers (ASC 606) |
37 |
|
|
38 |
|
|
31 |
|
|
44 |
|
|
42 |
|
|
36 |
|
|
25 |
|
|
25 |
|
|
21 |
|
Other noninterest income (non-ASC 606 customer-related) |
2 |
|
|
8 |
|
|
13 |
|
|
1 |
|
|
6 |
|
|
14 |
|
|
3 |
|
|
6 |
|
|
12 |
|
Total customer-related noninterest income |
39 |
|
|
46 |
|
|
44 |
|
|
45 |
|
|
48 |
|
|
50 |
|
|
28 |
|
|
31 |
|
|
33 |
|
Other noncustomer-related noninterest income |
1 |
|
|
2 |
|
|
2 |
|
|
— |
|
|
— |
|
|
— |
|
|
— |
|
|
— |
|
|
— |
|
Total noninterest income |
40 |
|
|
48 |
|
|
46 |
|
|
45 |
|
|
48 |
|
|
50 |
|
|
28 |
|
|
31 |
|
|
33 |
|
|
|
|
|
|
|
|
|
|
|
|
|
|
|
|
|
|
|
Net interest income |
260 |
|
|
241 |
|
|
204 |
|
|
191 |
|
|
183 |
|
|
146 |
|
|
150 |
|
|
153 |
|
|
136 |
|
Total net revenue |
$ |
300 |
|
|
$ |
289 |
|
|
$ |
250 |
|
|
$ |
236 |
|
|
$ |
231 |
|
|
$ |
196 |
|
|
$ |
178 |
|
|
$ |
184 |
|
|
$ |
169 |
|
ZIONS BANCORPORATION, NATIONAL ASSOCIATION AND SUBSIDIARIES
|
|
|
|
|
|
|
|
|
|
|
|
|
|
|
|
|
|
|
|
|
|
|
|
|
|
|
|
|
|
|
|
|
|
|
|
|
|
|
|
|
|
|
|
|
|
|
|
|
|
|
|
|
|
|
TCBW |
|
Other |
|
Consolidated Bank |
| (In millions) |
2023 |
|
2022 |
|
2021 |
|
2023 |
|
2022 |
|
2021 |
|
2023 |
|
2022 |
|
2021 |
|
|
|
|
|
|
|
|
|
|
|
|
|
|
|
|
|
|
Commercial account fees |
$ |
2 |
|
|
$ |
2 |
|
|
$ |
2 |
|
|
$ |
— |
|
|
$ |
2 |
|
|
$ |
1 |
|
|
$ |
174 |
|
|
$ |
159 |
|
|
$ |
137 |
|
Card fees |
2 |
|
|
2 |
|
|
1 |
|
|
— |
|
|
— |
|
|
1 |
|
|
146 |
|
|
149 |
|
|
135 |
|
Retail and business banking fees |
— |
|
|
— |
|
|
— |
|
|
— |
|
|
— |
|
|
1 |
|
|
66 |
|
|
73 |
|
|
73 |
|
|
|
|
|
|
|
|
|
|
|
|
|
|
|
|
|
|
|
Capital markets fees |
— |
|
|
— |
|
|
— |
|
|
4 |
|
|
4 |
|
|
6 |
|
|
4 |
|
|
4 |
|
|
6 |
|
| Wealth management fees |
1 |
|
|
— |
|
|
— |
|
|
(1) |
|
|
1 |
|
|
(2) |
|
|
53 |
|
|
51 |
|
|
46 |
|
| Other customer-related fees |
1 |
|
|
1 |
|
|
1 |
|
|
31 |
|
|
31 |
|
|
30 |
|
|
60 |
|
|
59 |
|
|
52 |
|
Total noninterest income from contracts with customers (ASC 606) |
6 |
|
|
5 |
|
|
4 |
|
|
34 |
|
|
38 |
|
|
37 |
|
|
503 |
|
|
495 |
|
|
449 |
|
Other noninterest income (non-ASC 606 customer-related) |
1 |
|
|
2 |
|
|
2 |
|
|
14 |
|
|
4 |
|
|
(6) |
|
|
117 |
|
|
119 |
|
|
126 |
|
Total customer-related noninterest income |
7 |
|
|
7 |
|
|
6 |
|
|
48 |
|
|
42 |
|
|
31 |
|
|
620 |
|
|
614 |
|
|
575 |
|
Other noncustomer-related noninterest income |
— |
|
|
— |
|
|
— |
|
|
17 |
|
|
6 |
|
|
109 |
|
|
57 |
|
|
18 |
|
|
128 |
|
Total noninterest income |
7 |
|
|
7 |
|
|
6 |
|
|
65 |
|
|
48 |
|
|
140 |
|
|
677 |
|
|
632 |
|
|
703 |
|
|
|
|
|
|
|
|
|
|
|
|
|
|
|
|
|
|
|
Net interest income |
60 |
|
|
63 |
|
|
53 |
|
|
30 |
|
|
31 |
|
|
38 |
|
|
2,438 |
|
|
2,520 |
|
|
2,208 |
|
Total net revenue |
$ |
67 |
|
|
$ |
70 |
|
|
$ |
59 |
|
|
$ |
95 |
|
|
$ |
79 |
|
|
$ |
178 |
|
|
$ |
3,115 |
|
|
$ |
3,152 |
|
|
$ |
2,911 |
|
Revenue from contracts with customers did not generate significant contract assets and liabilities. Contract receivables are included in “Other assets” on the consolidated balance sheet. Payment terms vary by services offered, and the timing between completion of performance obligations and payment is generally not significant.
18. RETIREMENT PLANS
Defined Benefit Plans
Supplemental Retirement Plans — These unfunded, nonqualified plans are for certain current and former employees. Each year, our contributions to these plans are made in amounts sufficient to meet benefit payments to plan participants. Our liability for these plans totaled approximately $9 million and $10 million at December 31, 2023, and 2022, respectively.
Post-retirement Plan — This unfunded health care and life insurance plan provides post-retirement benefits to certain former full-time employees who meet minimum age and service requirements. Our contribution toward the retiree medical premium has been permanently frozen at an amount that does not increase in any future year. Each year, our contributions to the plan are made in amounts sufficient to meet the portion of the premiums that are our responsibility. Our liability for this plan was less than $1 million at December 31, 2023 and 2022.
The liability for supplemental retirement and post-retirement benefits is included in “Other liabilities” on the consolidated balance sheet.
Defined Contribution Plan
We offer a 401(k) and employee stock ownership plan under which employees select from several investment alternatives. Employees can contribute up to 80% of their earnings subject to the annual maximum allowed contribution. We match 100% of the first 3% of employee contributions and 50% of the next 3% of employee contributions. Matching contributions to participants totaled $35 million, $33 million, and $32 million in 2023, 2022, and 2021, respectively.
The 401(k) plan also has a noncontributory profit-sharing feature that is discretionary and may range from 0% to 3.5% of eligible compensation based upon our performance according to a formula approved annually by the Board. The profit-sharing expense was $16 million, $19 million, and $24 million in 2023, 2022, and 2021, respectively. The profit-sharing contribution to participants consisted of shares of our common stock purchased in the open market.
ZIONS BANCORPORATION, NATIONAL ASSOCIATION AND SUBSIDIARIES
19. SHARE-BASED COMPENSATION
We have a share-based compensation incentive plan that allows us to grant stock options, restricted stock, RSUs, and other awards to employees and nonemployee directors. Total shares authorized under the plan at December 31, 2023 were 4,300,000, of which 2,747,546 were available for future grants.
All share-based payments to employees, including grants of employee stock options, are recorded as compensation expense based on their grant date values with consideration of service and performance vesting requirements. The value of an equity award is estimated on the grant date using a fair value model without regard to service or performance vesting conditions, but does consider post-vesting restrictions.
We classify all share-based awards as equity instruments. Compensation expense is included in “Salaries and employee benefits” on the consolidated statement of income, and the corresponding equity effect is included in shareholders’ equity. We account for forfeitures of share-based compensation awards as they occur. Substantially all share-based awards of stock options, restricted stock, and RSUs have graded vesting that is recognized on a straight-line basis over the vesting period.
The following schedule presents compensation expense and the related tax benefit for all share-based awards:
|
|
|
|
|
|
|
|
|
|
|
|
|
|
|
|
|
|
| (In millions) |
2023 |
|
2022 |
|
2021 |
|
|
|
|
|
|
| Compensation expense |
$ |
33 |
|
|
$ |
30 |
|
|
$ |
28 |
|
| Reduction of income tax expense |
9 |
|
|
11 |
|
|
11 |
|
At December 31, 2023, compensation expense not yet recognized for nonvested share-based awards was approximately $34 million, which is expected to be recognized over a weighted average period of 2.4 years.
Stock Options
Stock options granted to employees generally vest at the rate of one third each year and expire seven years after the date of grant. For all stock options granted in 2023, 2022, and 2021, we used the Black-Scholes option pricing model to estimate the grant date value of stock options in determining compensation expense. The following schedule summarizes the weighted average value at grant date and the significant assumptions used in applying the Black-Scholes model for options granted:
|
|
|
|
|
|
|
|
|
|
|
|
|
|
|
|
|
|
|
2023 |
|
2022 |
|
2021 |
|
|
|
|
|
|
| Weighted average value for options granted |
$ |
11.23 |
|
|
$ |
15.16 |
|
|
$ |
7.86 |
|
| Weighted average assumptions used: |
|
|
|
|
|
| Expected dividend yield |
3.0 |
% |
|
2.3 |
% |
|
2.5 |
% |
| Expected volatility |
27.0 |
% |
|
27.0 |
% |
|
25.0 |
% |
| Risk-free interest rate |
4.00 |
% |
|
1.98 |
% |
|
0.47 |
% |
| Expected life (in years) |
4.5 |
|
5.0 |
|
5.0 |
The assumptions for expected dividend yield, expected volatility, and expected life reflect management’s judgment and include consideration of historical experience. Expected volatility is based in part on historical volatility. The risk-free interest rate is based on the U.S. Treasury yield curve in effect at the time of grant for periods corresponding with the expected life of the option.
ZIONS BANCORPORATION, NATIONAL ASSOCIATION AND SUBSIDIARIES
The following schedule summarizes our stock option activity for the three years ended December 31, 2023:
|
|
|
|
|
|
|
|
|
|
|
|
|
Number of shares |
|
Weighted average exercise price |
|
|
|
|
| Balance at December 31, 2020 |
1,683,657 |
|
|
$ |
38.26 |
|
| Granted |
345,636 |
|
|
48.65 |
|
| Exercised |
(686,894) |
|
|
31.08 |
|
| Expired |
(7,910) |
|
|
42.16 |
|
| Forfeited |
(6,345) |
|
|
48.04 |
|
| Balance at December 31, 2021 |
1,328,144 |
|
|
44.60 |
|
| Granted |
201,932 |
|
|
73.02 |
|
| Exercised |
(256,004) |
|
|
36.79 |
|
| Expired |
(8,912) |
|
|
37.58 |
|
| Forfeited |
(2,794) |
|
|
57.75 |
|
| Balance at December 31, 2022 |
1,262,366 |
|
|
50.75 |
|
| Granted |
291,005 |
|
|
52.90 |
|
| Exercised |
(95,207) |
|
|
29.67 |
|
| Expired |
(27,948) |
|
|
35.41 |
|
| Forfeited |
(9,838) |
|
|
57.07 |
|
| Balance at December 31, 2023 |
1,420,378 |
|
|
52.83 |
|
| Outstanding stock options exercisable as of: |
|
|
|
| December 31, 2023 |
891,884 |
|
|
$ |
50.36 |
|
| December 31, 2022 |
729,411 |
|
|
46.02 |
|
| December 31, 2021 |
693,883 |
|
|
41.54 |
|
We issue new authorized common shares for the exercise of stock options. The total intrinsic value of stock options exercised was approximately $2 million in 2023, $7 million in 2022, and $16 million in 2021. Cash received from the exercise of stock options was $2 million in 2023, $8 million in 2022, and $20 million in 2021.
The following schedule presents additional selected information on stock options at December 31, 2023:
|
|
|
|
|
|
|
|
|
|
|
|
|
|
|
|
|
|
|
|
|
|
|
|
|
|
|
|
|
|
|
|
|
|
|
|
|
|
|
|
|
Outstanding stock options |
|
Exercisable stock options |
| Exercise price range |
|
Number of shares |
|
Weighted average exercise price |
|
Weighted average remaining contractual life (years) |
|
Number of shares |
|
Weighted average exercise price |
|
|
|
|
|
|
|
|
|
|
|
|
|
$4.15 to $19.99 |
|
5,223 |
|
|
$ |
6.41 |
|
1 |
|
0 |
|
|
5,223 |
|
|
$ |
6.41 |
|
|
|
|
|
|
|
|
|
|
|
|
|
|
$25.00 to $29.99 |
|
452 |
|
|
29.12 |
|
|
|
3.8 |
|
|
452 |
|
|
29.12 |
|
|
|
|
|
|
|
|
|
|
|
|
|
|
$40.00 to $44.99 |
|
73,077 |
|
|
44.18 |
|
|
|
0.2 |
|
|
73,077 |
|
|
44.18 |
|
$45.00 to $49.99 |
|
558,629 |
|
|
47.34 |
|
|
|
3.6 |
|
|
446,660 |
|
|
47.01 |
|
$50.00 to $59.99 |
|
587,155 |
|
|
52.78 |
|
|
|
3.8 |
|
|
301,194 |
|
|
52.67 |
|
$60.00 to $73.22 |
|
195,842 |
|
|
73.19 |
|
|
|
5.0 |
|
|
65,278 |
|
|
73.19 |
|
|
|
|
|
|
|
|
|
|
|
|
|
|
|
|
|
|
|
|
|
|
|
|
|
|
|
|
|
1,420,378 |
|
|
52.83 |
|
1 |
|
3.7 |
|
|
891,884 |
|
|
50.36 |
|
1 The weighted average remaining contractual life excludes 5,223 stock options without a fixed expiration date that were assumed with the Amegy acquisition. They expire between the date of termination and one year from the date of termination, depending upon certain circumstances.
The aggregate intrinsic value of outstanding stock options at December 31, 2023 and 2022 was less than $1 million and $4 million, respectively, while the aggregate intrinsic value of exercisable options was less than $1 million and $3 million at the same respective dates. For exercisable options, the weighted average remaining contractual life was 2.7 years and 2.8 years at December 31, 2023 and 2022, respectively, excluding the stock options previously noted without a fixed expiration date. At December 31, 2023, 528,192 stock options with a weighted average exercise price of $57.01, and a weighted average remaining life of 5.4 years, were expected to vest according to their respective schedules with an aggregate intrinsic value of $0.
ZIONS BANCORPORATION, NATIONAL ASSOCIATION AND SUBSIDIARIES
Restricted Stock and Restricted Stock Units
Restricted stock is common stock with certain restrictions that relate to trading and the possibility of forfeiture. Generally, restricted stock vests over four years. Holders of restricted stock have full voting rights and receive dividend equivalents during the vesting period. In addition, holders of restricted stock can make an election to be subject to income tax on the grant date rather than the vesting date.
RSUs represent rights to one share of common stock for each unit and generally vest over four years. Holders of RSUs receive dividend equivalents during the vesting period, but do not have voting rights. Compensation expense is determined based on the number of restricted shares or RSUs granted and the market price of our common stock at the issue date. During 2023, 2022, and 2021, we granted 39,771, 16,722, and 16,938 RSUs, respectively, to nonemployee directors. The RSUs vested immediately upon grant.
The following schedule summarizes our restricted stock activity for the three years ended December 31, 2023:
|
|
|
|
|
|
|
|
|
|
|
|
|
Number of shares |
|
Weighted average fair value |
|
|
|
|
| Nonvested restricted shares at December 31, 2020 |
57,396 |
|
|
$ |
44.20 |
|
| Issued |
26,083 |
|
|
39.16 |
|
| Vested |
(18,663) |
|
|
43.89 |
|
|
|
|
|
| Nonvested restricted shares at December 31, 2021 |
64,816 |
|
|
42.26 |
|
| Issued |
21,038 |
|
|
60.21 |
|
| Vested |
(25,105) |
|
|
42.66 |
|
|
|
|
|
| Nonvested restricted shares at December 31, 2022 |
60,749 |
|
|
48.31 |
|
| Issued |
— |
|
|
— |
|
| Vested |
(24,978) |
|
|
46.31 |
|
|
|
|
|
| Nonvested restricted shares at December 31, 2023 |
35,771 |
|
|
49.71 |
|
The following schedule summarizes our RSU activity for the three years ended December 31, 2023:
|
|
|
|
|
|
|
|
|
|
|
|
|
Number of restricted stock units |
|
Weighted average fair value |
|
|
|
|
| Restricted stock units at December 31, 2020 |
1,242,321 |
|
|
$ |
46.31 |
|
| Granted |
578,056 |
|
|
47.02 |
|
| Vested |
(505,690) |
|
|
46.51 |
|
| Forfeited |
(40,604) |
|
|
47.97 |
|
| Restricted stock units at December 31, 2021 |
1,274,083 |
|
|
46.49 |
|
| Granted |
433,674 |
|
|
68.07 |
|
| Vested |
(504,358) |
|
|
47.83 |
|
| Forfeited |
(34,306) |
|
|
56.58 |
|
| Restricted stock units at December 31, 2022 |
1,169,093 |
|
|
53.62 |
|
| Granted |
727,019 |
|
|
48.85 |
|
| Vested |
(522,163) |
|
|
48.71 |
|
| Forfeited |
(44,004) |
|
|
56.19 |
|
| Restricted stock units at December 31, 2023 |
1,329,945 |
|
|
52.88 |
|
The total value at grant date of restricted stock and RSUs vested during the year was $27 million in 2023, $25 million in 2022, and $24 million in 2021. At December 31, 2023, 35,771 shares of restricted stock and 881,923 RSUs were expected to vest according to their respective schedules with an aggregate intrinsic value of $2 million and $39 million, respectively.
ZIONS BANCORPORATION, NATIONAL ASSOCIATION AND SUBSIDIARIES
20. INCOME TAXES
The following schedule presents the major components of our income tax expense:
|
|
|
|
|
|
|
|
|
|
|
|
|
|
|
|
|
|
| (In millions) |
2023 |
|
2022 |
|
2021 |
| Federal: |
|
|
|
|
|
| Current |
$ |
168 |
|
|
$ |
236 |
|
|
$ |
230 |
|
| Deferred |
— |
|
|
(38) |
|
|
27 |
|
| Total Federal |
168 |
|
|
198 |
|
|
257 |
|
| State: |
|
|
|
|
|
| Current |
47 |
|
|
52 |
|
|
55 |
|
| Deferred |
(9) |
|
|
(5) |
|
|
5 |
|
| Total State |
38 |
|
|
47 |
|
|
60 |
|
| Total income tax expense |
$ |
206 |
|
|
$ |
245 |
|
|
$ |
317 |
|
The following schedule presents a reconciliation of income tax expense computed at the statutory federal income tax rate of 21% and the actual income tax expense:
|
|
|
|
|
|
|
|
|
|
|
|
|
|
|
|
|
|
| (In millions) |
2023 |
|
2022 |
|
2021 |
|
|
|
|
|
|
| Income tax expense at statutory federal rate |
$ |
186 |
|
|
$ |
242 |
|
|
$ |
304 |
|
| State income taxes including credits, net |
31 |
|
|
38 |
|
|
48 |
|
| Other nondeductible expenses |
29 |
|
|
13 |
|
|
8 |
|
| Nontaxable income |
(41) |
|
|
(40) |
|
|
(36) |
|
| Share-based compensation |
(1) |
|
|
(4) |
|
|
(3) |
|
| Other |
2 |
|
|
(4) |
|
|
(4) |
|
|
|
|
|
|
|
|
|
|
|
|
|
| Total income tax expense |
$ |
206 |
|
|
$ |
245 |
|
|
$ |
317 |
|
ZIONS BANCORPORATION, NATIONAL ASSOCIATION AND SUBSIDIARIES
The net DTA or DTL is included in either “Other assets” or “Other liabilities” on the consolidated balance sheet. The following schedule presents the tax effects of temporary differences that give rise to significant portions of DTAs and DTLs:
|
|
|
|
|
|
|
|
|
|
|
|
| (In millions) |
December 31, |
| 2023 |
|
2022 |
| Gross deferred tax assets: |
|
|
|
| Book loan loss deduction in excess of tax |
$ |
181 |
|
|
$ |
157 |
|
|
|
|
|
| Deferred compensation |
81 |
|
|
83 |
|
|
|
|
|
|
|
|
|
| Security investments and derivative fair value adjustments |
879 |
|
|
1,011 |
|
| Lease liabilities |
50 |
|
|
49 |
|
| Capitalized costs |
37 |
|
|
82 |
|
| Other |
48 |
|
|
29 |
|
| Total deferred tax assets before valuation allowance |
1,276 |
|
|
1,411 |
|
| Valuation allowance |
— |
|
|
— |
|
| Total deferred tax assets |
1,276 |
|
|
1,411 |
|
| Gross deferred tax liabilities: |
|
|
|
|
|
|
|
| Premises and equipment, due to differences in depreciation |
(101) |
|
|
(99) |
|
| Federal Home Loan Bank stock dividends |
(3) |
|
|
(2) |
|
| Leasing operations |
(49) |
|
|
(49) |
|
| Prepaid expenses |
(5) |
|
|
(5) |
|
| Prepaid pension reserves |
— |
|
|
(3) |
|
| Mortgage servicing |
(5) |
|
|
(12) |
|
|
|
|
|
| Deferred loan costs |
(34) |
|
|
(34) |
|
| ROU assets |
(43) |
|
|
(44) |
|
| Qualified opportunity fund deferred gains |
(27) |
|
|
(26) |
|
| Equity investments |
(10) |
|
|
(9) |
|
| Total deferred tax liabilities |
(277) |
|
|
(283) |
|
| Net deferred tax assets (liabilities) |
$ |
999 |
|
|
$ |
1,128 |
|
We have certain fixed-rate AFS securities whose fair value has declined due to increases in benchmark interest rates, resulting in unrealized losses in the AFS portfolio and a corresponding DTA. The sale of these securities could result in significant realized losses, which would require future earnings to utilize the deferred tax assets. We have the ability and intent to hold these securities to recovery.
We evaluate DTAs on a regular basis to determine whether a valuation allowance is required. In conducting this evaluation, we consider all available evidence, both positive and negative, based on the more-likely-than-not criteria that such assets will be realized. This evaluation includes, but is not limited to, the following:
•Future reversals of existing DTLs — These DTLs have a reversal pattern generally consistent with DTAs, and are used to realize the DTAs.
•Tax planning strategies — We have considered prudent and feasible tax planning strategies that we would implement to preserve the value of the DTAs, if necessary.
•Future projected taxable income — We expect future taxable income will offset the reversal of remaining net DTAs.
Based on this evaluation, we concluded that a valuation allowance was not required at December 31, 2023 and December 31, 2022.
At December 31, 2023, the tax effect of remaining net operating loss and tax credit carryforwards was less than $1 million, expiring through 2039.
ZIONS BANCORPORATION, NATIONAL ASSOCIATION AND SUBSIDIARIES
We have a liability for unrecognized tax benefits relating to uncertain tax positions for tax credits on technology initiatives. The following schedule presents a roll-forward of gross unrecognized tax benefits:
|
|
|
|
|
|
|
|
|
|
|
|
|
|
|
|
|
|
| (In millions) |
2023 |
|
2022 |
|
2021 |
|
|
|
|
|
|
| Balance at beginning of year |
$ |
13 |
|
|
$ |
14 |
|
|
$ |
11 |
|
| Tax positions related to current year: |
|
|
|
|
|
| Additions |
2 |
|
|
2 |
|
|
2 |
|
|
|
|
|
|
|
| Tax positions related to prior years: |
|
|
|
|
|
| Additions |
10 |
|
|
— |
|
|
1 |
|
| Reductions |
— |
|
|
(1) |
|
|
— |
|
| Settlements with taxing authorities |
(3) |
|
|
— |
|
|
— |
|
| Lapses in statutes of limitations |
(7) |
|
|
(2) |
|
|
— |
|
| Balance at end of year |
$ |
15 |
|
|
$ |
13 |
|
|
$ |
14 |
|
At December 31, 2023 and 2022, the liability for unrecognized tax benefits included approximately $13 million and $12 million (net of the federal tax benefit on state taxes) that, if recognized, would affect the effective tax rate. The amount of gross unrecognized tax benefits related to tax credits on technology initiatives that may increase or decrease during the 12 months subsequent to December 31, 2023 is dependent on the timing and outcome of various ongoing federal and state examinations. For tax years not currently under examination, the gross unrecognized tax benefits on technology initiatives may decrease by approximately $8 million.
Interest and penalties related to unrecognized tax benefits are included in “Income tax expense” on the statement of income. At December 31, 2023 and 2022, accrued interest and penalties included in “Other liabilities” on the consolidated balance sheet, net of any federal and state tax benefits, totaled approximately $2 million and $1 million, respectively.
We file income tax returns in U.S. federal and various state jurisdictions, and we are no longer subject to income tax examinations for years prior to 2013 for federal and certain state returns.
ZIONS BANCORPORATION, NATIONAL ASSOCIATION AND SUBSIDIARIES
21. NET EARNINGS PER COMMON SHARE
The following schedule summarizes the basic and diluted net earnings per common share based on the weighted average outstanding shares:
|
|
|
|
|
|
|
|
|
|
|
|
|
|
|
|
|
|
| (In millions, except shares and per share amounts) |
2023 |
|
2022 |
|
2021 |
| Basic: |
|
|
|
|
|
| Net income |
$ |
680 |
|
|
$ |
907 |
|
|
$ |
1,129 |
|
| Less common and preferred dividends |
277 |
|
|
269 |
|
|
261 |
|
| Less impact from redemption of preferred stock |
— |
|
|
— |
|
|
3 |
|
| Undistributed earnings |
403 |
|
|
638 |
|
|
865 |
|
| Less undistributed earnings applicable to nonvested shares |
4 |
|
|
5 |
|
|
7 |
|
| Undistributed earnings applicable to common shares |
399 |
|
|
633 |
|
|
858 |
|
| Distributed earnings applicable to common shares |
243 |
|
|
237 |
|
|
230 |
|
| Total earnings applicable to common shares |
$ |
642 |
|
|
$ |
870 |
|
|
$ |
1,088 |
|
| Weighted average common shares outstanding (in thousands) |
147,748 |
|
|
150,064 |
|
|
159,913 |
|
| Net earnings per common share |
$ |
4.35 |
|
|
$ |
5.80 |
|
|
$ |
6.80 |
|
| Diluted: |
|
|
|
|
|
| Total earnings applicable to common shares |
$ |
642 |
|
|
$ |
870 |
|
|
$ |
1,088 |
|
|
|
|
|
|
|
|
|
|
|
|
|
| Weighted average common shares outstanding (in thousands) |
147,748 |
|
|
150,064 |
|
|
159,913 |
|
|
|
|
|
|
|
| Dilutive effect of stock options (in thousands) |
8 |
|
|
207 |
|
|
321 |
|
Weighted average diluted common shares outstanding (in thousands) |
147,756 |
|
|
150,271 |
|
|
160,234 |
|
| Net earnings per common share |
$ |
4.35 |
|
|
$ |
5.79 |
|
|
$ |
6.79 |
|
The following schedule presents the weighted average stock awards that were anti-dilutive and not included in the calculation of diluted earnings per share:
|
|
|
|
|
|
|
|
|
|
|
|
|
|
|
|
|
|
| (In thousands) |
2023 |
|
2022 |
|
2021 |
|
|
|
|
|
|
| Restricted stock and restricted stock units |
$ |
1,383 |
|
|
$ |
1,265 |
|
|
$ |
1,374 |
|
| Stock options |
1,409 |
|
|
178 |
|
|
74 |
|
22. OPERATING SEGMENT INFORMATION
We manage our operations with a primary focus on geographic area. We conduct our operations primarily through seven separately managed affiliate banks, each with its own local branding and management team, including Zions Bank, Amegy Bank, California Bank & Trust, National Bank of Arizona, Nevada State Bank, Vectra Bank Colorado, and The Commerce Bank of Washington. These affiliate banks comprise our primary business segments. Performance assessment and resource allocation are based upon this geographic structure. Our affiliate banks are supported by an enterprise operating segment (referred to as the “Other” segment) that provides governance and risk management, allocates capital, establishes strategic objectives, and includes centralized technology, back-office functions, and certain lines of business not operated through our affiliate banks.
We allocate the cost of centrally provided services to the business segments based upon estimated or actual usage of those services. We also allocate capital based on the risk-weighted assets held at each business segment. We use an internal funds transfer pricing (“FTP”) allocation process to report results of operations for business segments. This process is subject to change and refinement over time. Total average loans and deposits presented for the business segments include insignificant intercompany amounts between business segments and may also include deposits with the “Other” segment.
At December 31, 2023, Zions Bank operated 95 branches in Utah, 25 branches in Idaho, and one branch in Wyoming. CB&T operated 75 branches in California. Amegy operated 75 branches in Texas. NBAZ operated 56 branches in Arizona. NSB operated 43 branches in Nevada. Vectra operated 33 branches in Colorado and one branch in New Mexico. TCBW operated two branches in Washington and one branch in Oregon.
ZIONS BANCORPORATION, NATIONAL ASSOCIATION AND SUBSIDIARIES
In July 2022, NSB completed the purchase of three Northern Nevada City National Bank branches and their associated deposit, credit card, and loan accounts. We acquired approximately $430 million in deposits and $95 million in commercial and consumer loans at the time of the purchase.
Transactions between business segments are primarily conducted at fair value, resulting in profits that are eliminated for reporting consolidated results of operations. The following schedule presents average loans, average deposits, and income before income taxes because we use these metrics when evaluating performance and making decisions pertaining to the business segments. The condensed statement of income identifies the components of income and expense which affect the operating amounts presented in the “Other” segment.
The following schedule presents selected operating segment information:
|
|
|
|
|
|
|
|
|
|
|
|
|
|
|
|
|
|
|
|
|
|
|
|
|
|
|
|
|
|
|
|
|
|
|
|
|
|
|
|
|
|
|
|
|
|
|
|
|
|
|
|
|
|
| (In millions) |
Zions Bank |
|
CB&T |
|
Amegy |
| 2023 |
|
2022 |
|
2021 |
|
2023 |
|
2022 |
|
2021 |
|
2023 |
|
2022 |
|
2021 |
| SELECTED INCOME STATEMENT DATA |
|
|
|
|
|
|
|
|
|
|
|
|
| Net interest income |
$ |
696 |
|
|
$ |
741 |
|
|
$ |
633 |
|
|
$ |
598 |
|
|
$ |
595 |
|
|
$ |
536 |
|
|
$ |
453 |
|
|
$ |
513 |
|
|
$ |
462 |
|
| Provision for credit losses |
20 |
|
|
43 |
|
|
(26) |
|
|
44 |
|
|
49 |
|
|
(78) |
|
|
15 |
|
|
5 |
|
|
(96) |
|
Net interest income after provision for credit losses |
676 |
|
|
698 |
|
|
659 |
|
|
554 |
|
|
546 |
|
|
614 |
|
|
438 |
|
|
508 |
|
|
558 |
|
| Noninterest income |
192 |
|
|
184 |
|
|
185 |
|
|
116 |
|
|
108 |
|
|
102 |
|
|
184 |
|
|
158 |
|
|
141 |
|
| Noninterest expense |
557 |
|
|
495 |
|
|
464 |
|
|
388 |
|
|
340 |
|
|
311 |
|
|
404 |
|
|
355 |
|
|
337 |
|
| Income (loss) before income taxes |
$ |
311 |
|
|
$ |
387 |
|
|
$ |
380 |
|
|
$ |
282 |
|
|
$ |
314 |
|
|
$ |
405 |
|
|
$ |
218 |
|
|
$ |
311 |
|
|
$ |
362 |
|
| SELECTED AVERAGE BALANCE SHEET DATA |
|
|
|
|
|
|
|
|
|
|
|
|
| Total average loans |
$ |
14,298 |
|
|
$ |
13,277 |
|
|
$ |
13,198 |
|
|
$ |
14,128 |
|
|
$ |
13,129 |
|
|
$ |
12,892 |
|
|
$ |
12,851 |
|
|
$ |
12,110 |
|
|
$ |
12,189 |
|
| Total average deposits |
20,233 |
|
|
24,317 |
|
|
23,588 |
|
|
14,253 |
|
|
16,160 |
|
|
15,796 |
|
|
13,569 |
|
|
15,735 |
|
|
15,496 |
|
|
|
|
|
|
|
|
|
|
|
|
|
|
|
|
|
|
|
| (In millions) |
NBAZ |
|
NSB |
|
Vectra |
| 2023 |
|
2022 |
|
2021 |
|
2023 |
|
2022 |
|
2021 |
|
2023 |
|
2022 |
|
2021 |
| SELECTED INCOME STATEMENT DATA |
|
|
|
|
|
|
|
|
|
|
|
|
| Net interest income |
$ |
260 |
|
|
$ |
241 |
|
|
$ |
204 |
|
|
$ |
191 |
|
|
$ |
183 |
|
|
$ |
146 |
|
|
$ |
150 |
|
|
$ |
153 |
|
|
$ |
136 |
|
| Provision for credit losses |
4 |
|
|
11 |
|
|
(27) |
|
|
42 |
|
|
4 |
|
|
(35) |
|
|
7 |
|
|
9 |
|
|
(12) |
|
Net interest income after provision for credit losses |
256 |
|
|
230 |
|
|
231 |
|
|
149 |
|
|
179 |
|
|
181 |
|
|
143 |
|
|
144 |
|
|
148 |
|
| Noninterest income |
40 |
|
|
48 |
|
|
46 |
|
|
45 |
|
|
48 |
|
|
50 |
|
|
28 |
|
|
31 |
|
|
33 |
|
| Noninterest expense |
189 |
|
|
167 |
|
|
151 |
|
|
171 |
|
|
151 |
|
|
142 |
|
|
137 |
|
|
120 |
|
|
114 |
|
| Income (loss) before income taxes |
$ |
107 |
|
|
$ |
111 |
|
|
$ |
126 |
|
|
$ |
23 |
|
|
$ |
76 |
|
|
$ |
89 |
|
|
$ |
34 |
|
|
$ |
55 |
|
|
$ |
67 |
|
| SELECTED AVERAGE BALANCE SHEET DATA |
|
|
|
|
|
|
|
|
|
|
|
|
| Total average loans |
$ |
5,318 |
|
|
$ |
4,911 |
|
|
$ |
4,849 |
|
|
$ |
3,392 |
|
|
$ |
2,987 |
|
|
$ |
3,015 |
|
|
$ |
4,004 |
|
|
$ |
3,632 |
|
|
$ |
3,414 |
|
| Total average deposits |
7,008 |
|
|
8,035 |
|
|
7,288 |
|
|
6,964 |
|
|
7,436 |
|
|
6,691 |
|
|
3,482 |
|
|
4,109 |
|
|
4,386 |
|
| (In millions) |
TCBW |
|
Other |
|
Consolidated Bank |
| 2023 |
|
2022 |
|
2021 |
|
2023 |
|
2022 |
|
2021 |
|
2023 |
|
2022 |
|
2021 |
| SELECTED INCOME STATEMENT DATA |
|
|
|
|
|
|
|
|
|
|
|
|
| Net interest income |
$ |
60 |
|
|
$ |
63 |
|
|
$ |
53 |
|
|
$ |
30 |
|
|
$ |
31 |
|
|
$ |
38 |
|
|
$ |
2,438 |
|
|
$ |
2,520 |
|
|
$ |
2,208 |
|
| Provision for credit losses |
2 |
|
|
1 |
|
|
(3) |
|
|
(2) |
|
|
— |
|
|
1 |
|
|
132 |
|
|
122 |
|
|
(276) |
|
Net interest income after provision for credit losses |
58 |
|
|
62 |
|
|
56 |
|
|
32 |
|
|
31 |
|
|
37 |
|
|
2,306 |
|
|
2,398 |
|
|
2,484 |
|
| Noninterest income |
7 |
|
|
7 |
|
|
6 |
|
|
65 |
|
|
48 |
|
|
140 |
|
|
677 |
|
|
632 |
|
|
703 |
|
| Noninterest expense |
27 |
|
|
24 |
|
|
21 |
|
|
224 |
|
|
226 |
|
|
201 |
|
|
2,097 |
|
|
1,878 |
|
|
1,741 |
|
| Income (loss) before income taxes |
$ |
38 |
|
|
$ |
45 |
|
|
$ |
41 |
|
|
$ |
(127) |
|
|
$ |
(147) |
|
|
$ |
(24) |
|
|
$ |
886 |
|
|
$ |
1,152 |
|
|
$ |
1,446 |
|
| SELECTED AVERAGE BALANCE SHEET DATA |
|
|
|
|
|
|
|
|
|
|
|
|
| Total average loans |
$ |
1,705 |
|
|
$ |
1,630 |
|
|
$ |
1,569 |
|
|
$ |
1,044 |
|
|
$ |
922 |
|
|
$ |
857 |
|
|
$ |
56,740 |
|
|
$ |
52,598 |
|
|
$ |
51,983 |
|
| Total average deposits |
1,196 |
|
|
1,571 |
|
|
1,537 |
|
|
6,161 |
|
|
1,166 |
|
|
1,475 |
|
|
72,866 |
|
|
78,529 |
|
|
76,257 |
|
ZIONS BANCORPORATION, NATIONAL ASSOCIATION AND SUBSIDIARIES
23. QUARTERLY FINANCIAL INFORMATION (UNAUDITED)
The following schedule presents quarterly financial information for 2023 and 2022:
|
|
|
|
|
|
|
|
|
|
|
|
|
|
|
|
|
|
|
|
|
|
|
|
| (In millions, except per share amounts) |
Fourth Quarter |
|
Third Quarter |
|
Second Quarter |
|
First Quarter |
|
| 2023 |
|
|
|
|
|
|
|
| Total interest income |
$ |
1,040 |
|
|
$ |
1,010 |
|
|
$ |
977 |
|
|
$ |
920 |
|
| Net interest income |
583 |
|
|
585 |
|
|
591 |
|
|
679 |
|
| Provision for credit losses |
— |
|
|
41 |
|
|
46 |
|
|
45 |
|
| Noninterest income |
148 |
|
|
180 |
|
|
189 |
|
|
160 |
|
| Noninterest expense |
581 |
|
|
496 |
|
|
508 |
|
|
512 |
|
| Income before income taxes |
150 |
|
|
228 |
|
|
226 |
|
|
282 |
|
| Net income |
126 |
|
|
175 |
|
|
175 |
|
|
204 |
|
| Preferred stock dividends |
10 |
|
|
7 |
|
|
9 |
|
|
6 |
|
|
|
|
|
|
|
|
|
| Net earnings applicable to common shareholders |
116 |
|
|
168 |
|
|
166 |
|
|
198 |
|
| Net earnings per common share: |
|
|
|
|
|
|
|
| Basic |
0.78 |
|
|
1.13 |
|
|
1.11 |
|
|
1.33 |
|
| Diluted |
0.78 |
|
|
1.13 |
|
|
1.11 |
|
|
1.33 |
|
| 2022 |
|
|
|
|
|
|
|
| Total interest income |
$ |
835 |
|
|
$ |
707 |
|
|
$ |
608 |
|
|
$ |
555 |
|
| Net interest income |
720 |
|
|
663 |
|
|
593 |
|
|
544 |
|
| Provision for credit losses |
43 |
|
|
71 |
|
|
41 |
|
|
(33) |
|
| Noninterest income |
153 |
|
|
165 |
|
|
172 |
|
|
142 |
|
| Noninterest expense |
471 |
|
|
479 |
|
|
464 |
|
|
464 |
|
| Income before income taxes |
359 |
|
|
278 |
|
|
260 |
|
|
255 |
|
| Net income |
284 |
|
|
217 |
|
|
203 |
|
|
203 |
|
| Preferred stock dividends |
7 |
|
|
6 |
|
|
8 |
|
|
8 |
|
|
|
|
|
|
|
|
|
| Net earnings applicable to common shareholders |
277 |
|
|
211 |
|
|
195 |
|
|
195 |
|
| Net earnings per common share: |
|
|
|
|
|
|
|
| Basic |
1.84 |
|
|
1.40 |
|
|
1.29 |
|
|
1.27 |
|
| Diluted |
1.84 |
|
|
1.40 |
|
|
1.29 |
|
|
1.27 |
|
ITEM 9. CHANGES IN AND DISAGREEMENTS WITH ACCOUNTANTS ON ACCOUNTING AND FINANCIAL DISCLOSURE
None.
ITEM 9A. CONTROLS AND PROCEDURES
Our management, with the participation of our Chief Executive Officer and Chief Financial Officer, has evaluated the effectiveness of our disclosure controls and procedures as of December 31, 2023. Based on that evaluation, our Chief Executive Officer and Chief Financial Officer concluded that our disclosure controls and procedures were effective as of December 31, 2023. There were no changes in our internal control over financial reporting during the fourth quarter of 2023 that have materially affected, or are reasonably likely to materially affect, our internal control over financial reporting. See “Report on Management’s Assessment of Internal Control over Financial Reporting” included in Item 8 on page 80 for management’s report on the adequacy of internal control over financial reporting. Also see “Report on Internal Control over Financial Reporting” issued by Ernst & Young LLP included in Item 8 on page 81.
ZIONS BANCORPORATION, NATIONAL ASSOCIATION AND SUBSIDIARIES
ITEM 9B. OTHER INFORMATION
We have adopted insider trading policies and procedures governing the purchase, sale, and other dispositions of securities by directors, officers, and non-executive employees that are reasonably designed to promote compliance with insider trading laws, rules, and regulations, and any applicable listing standards.
None of our directors or officers have adopted, modified, or terminated a Rule 10b5-1(c) trading arrangement during the year ended December 31, 2023. Our directors and officers participate in certain of our benefits plans, such as our Omnibus Incentive Plan and Payshelter 401(k) and Employee Stock Ownership Plan, and may from time to time make elections to have shares withheld to cover withholding taxes or pay the exercise price of options granted thereunder. These elections may be designed to satisfy the affirmative defense conditions of Rule 10b5-1 under the Exchange Act or may constitute non-Rule 10b5-1 trading arrangements as defined in Item 408(c) of Regulation S-K.
ITEM 9C. DISCLOSURE REGARDING FOREIGN JURISDICTIONS THAT PREVENT INSPECTIONS
None.
PART III
ITEM 10. DIRECTORS, EXECUTIVE OFFICERS, AND CORPORATE GOVERNANCE
Incorporated by reference from our Proxy Statement to be subsequently filed.
ITEM 11. EXECUTIVE COMPENSATION
Incorporated by reference from our Proxy Statement to be subsequently filed.
ITEM 12. SECURITY OWNERSHIP OF CERTAIN BENEFICIAL OWNERS AND MANAGEMENT AND RELATED STOCKHOLDER MATTERS
Equity Compensation Plan Information
The following schedule provides information as of December 31, 2023 with respect to the shares of our common stock that may be issued under existing equity compensation plans:
|
|
|
|
|
|
|
|
|
|
|
|
|
|
|
|
|
|
|
|
|
|
|
|
|
|
|
|
|
|
|
|
|
|
|
|
|
|
|
|
|
(a) |
|
(b) |
|
(c) |
Plan category 1 |
|
Number of securities to be issued upon exercise of outstanding options, warrants, and rights |
|
Weighted average exercise price of outstanding options, warrants, and rights |
|
Number of securities remaining available for future issuance under equity compensation plans (excluding securities reflected in column (a)) |
|
|
|
|
|
|
|
|
|
|
|
|
|
Equity compensation plan approved by security holders: |
|
|
|
|
|
|
|
|
|
|
|
|
|
|
|
|
|
|
|
|
|
|
|
|
|
Zions Bancorporation, N.A. 2022 Omnibus Incentive Plan |
|
|
1,415,155 |
|
|
|
|
$ |
53.00 |
|
|
|
|
2,747,546 |
|
|
|
|
|
|
|
|
|
|
|
|
|
|
|
|
|
|
|
|
|
|
|
|
|
|
|
|
|
|
|
|
|
|
|
|
|
|
|
1 Column (a) excludes 35,771 shares of unvested restricted stock, and 1,329,945 RSUs (each unit representing the right to one share of common stock). The schedule also excludes 5,223 shares of common stock issuable upon the exercise of stock options, with a weighted average exercise price of $6.41, granted under plans assumed in mergers that are outstanding.
Other information required by Item 12 is incorporated by reference from our Proxy Statement to be subsequently filed.
ITEM 13. CERTAIN RELATIONSHIPS AND RELATED TRANSACTIONS, AND DIRECTOR INDEPENDENCE
Incorporated by reference from our Proxy Statement to be subsequently filed.
ZIONS BANCORPORATION, NATIONAL ASSOCIATION AND SUBSIDIARIES
ITEM 14. PRINCIPAL ACCOUNTANT FEES AND SERVICES
Incorporated by reference from our Proxy Statement to be subsequently filed.
PART IV
ITEM 15. EXHIBITS AND FINANCIAL STATEMENT SCHEDULES
a.(1) Financial statements — The following consolidated financial statements of Zions Bancorporation, N.A. are filed as part of this Form 10-K under Item 8, Financial Statements and Supplementary Data:
Consolidated balance sheets — December 31, 2023 and 2022
Consolidated statements of income — Years ended December 31, 2023, 2022, and 2021
Consolidated statements of comprehensive income — Years ended December 31, 2023, 2022, and 2021
Consolidated statements of changes in shareholders’ equity — Years ended December 31, 2023, 2022, and 2021
Consolidated statements of cash flows — Years ended December 31, 2023, 2022, and 2021
Notes to consolidated financial statements — December 31, 2023
(2) Financial statement schedules — All financial statement schedules for which provision is made in the applicable accounting regulations of the SEC are not required under the related instructions, the required information is contained elsewhere in the Form 10-K, or the schedules are inapplicable and have therefore been omitted.
(3) List of Exhibits:
|
|
|
|
|
|
|
|
|
|
|
|
| Exhibit Number |
|
Description |
|
|
|
|
|
|
|
|
|
|
|
Second Amended and Restated Articles of Association of Zions Bancorporation, National Association, incorporated by reference to Exhibit 3.1 of Form 8-K filed on October 2, 2018. |
* |
|
|
|
|
|
|
Second Amended and Restated Bylaws of Zions Bancorporation, National Association, incorporated by reference to Exhibit 3.2 of Form 8-K filed on April 4, 2019. |
* |
|
|
|
|
|
|
Description of Securities of Zions Bancorporation, National Association, as of December 31, 2023 (filed herewith). |
|
|
|
|
|
|
|
Zions Bancorporation 2021-2023 Value Sharing Plan, incorporated by reference to Exhibit 10.2 of Form 10-Q for the quarter ended June 30, 2022. |
* |
|
|
|
|
|
|
Zions Bancorporation 2023-2025 Value Sharing Plan, incorporated by reference to Exhibit 10.1 of Form 10-Q for the quarter ended March 31, 2023. |
* |
|
|
|
|
|
|
Zions Bancorporation 2021-2023 Value Sharing Plan with conditional incentives, incorporated by reference to Exhibit 10.3 of Form 10-Q for the quarter ended June 30, 2022. |
* |
|
|
|
|
|
|
Zions Bancorporation 2022-2024 Value Sharing Plan, incorporated by reference to Exhibit 10.4 of Form 10-Q for the quarter ended June 30, 2022. |
* |
|
|
|
|
|
|
Zions Bancorporation 2017 Management Incentive Compensation Plan, incorporated by reference to Appendix I of our Proxy Statement dated April 14, 2016. |
* |
|
|
|
|
ZIONS BANCORPORATION, NATIONAL ASSOCIATION AND SUBSIDIARIES
|
|
|
|
|
|
|
|
|
|
|
|
| Exhibit Number |
|
Description |
|
|
|
|
|
|
|
Zions Bancorporation Third Restated and Revised Deferred Compensation Plan, incorporated by reference to Exhibit 10.5 of Form 10-K for the year ended December 31, 2018. |
* |
|
|
|
|
|
|
Zions Bancorporation Fourth Restated Deferred Compensation Plan for Directors, incorporated by reference to Exhibit 10.6 of Form 10-K for the year ended December 31, 2018. |
* |
|
|
|
|
|
|
Amendment to the Zions Bancorporation Fourth Restated Deferred Compensation Plan for Directors, incorporated by reference to Exhibit 10.8 of Form 10-K for the year ended December 31, 2015. |
* |
|
|
|
|
|
|
Amegy Bancorporation, Inc. Fifth Amended and Restated Non-Employee Directors Deferred Fee Plan (Frozen upon merger with Zions Bancorporation in 2005), incorporated by reference to Exhibit 10.8 of Form 10-K for the year ended December 31, 2018. |
* |
|
|
|
|
|
|
Zions Bancorporation Executive Management Pension Plan, incorporated by reference to Exhibit 10.8 of Form 10-K for the year ended December 31, 2020. |
* |
|
|
|
|
|
|
Zions Bancorporation First Restated Excess Benefit Plan, incorporated by reference to Exhibit 10.9 of Form 10-K for the year ended December 31, 2020. |
* |
|
|
|
|
|
|
Amegy Bancorporation 2004 (formerly Southwest Bancorporation of Texas, Inc.) Omnibus Incentive Plan, incorporated by reference to Exhibit 10.38 of Form 10-K for the year ended December 31, 2015. |
* |
|
|
|
|
|
|
Trust Agreement establishing the Zions Bancorporation Deferred Compensation Plan Trust by and between Zions Bancorporation and Cigna Bank & Trust Company, FSB effective October 1, 2002, incorporated by reference to Exhibit 10.12 of Form 10-K for the year ended December 31, 2018. |
* |
|
|
|
|
|
|
Amendment to the Trust Agreement Establishing the Zions Bancorporation Deferred Compensation Plans Trust, effective September 1, 2006, incorporated by reference to Exhibit 10.13 of Form 10-K for the year ended December 31, 2018. |
* |
|
|
|
|
|
|
Amendment to the Trust Agreement establishing the Zions Bancorporation Deferred Compensation Plan Trust by and between Zions Bancorporation and Cigna Bank & Trust Company, FSB substituting Prudential Bank & Trust, FSB as the trustee, incorporated by reference to Exhibit 10.12 of Form 10-K for the year ended December 31, 2016. |
* |
|
|
|
|
|
|
Zions Bancorporation Deferred Compensation Plans Master Trust between Zions Bancorporation and Fidelity Management Trust Company, effective September 1, 2006, incorporated by reference to Exhibit 10.15 of Form 10-K for the year ended December 31, 2018. |
* |
|
|
|
|
|
|
Revised schedule C to Zions Bancorporation Deferred Compensation Plans Master Trust between Zions Bancorporation and Fidelity Management Trust Company, effective September 13, 2006, incorporated by reference to Exhibit 10.16 of Form 10-K for the year ended December 31, 2018. |
* |
|
|
|
|
|
|
Third Amendment to the Trust Agreement between Fidelity Management Trust Company and Zions Bancorporation for the Deferred Compensation Plans, dated June 13, 2012, incorporated by reference to Exhibit 10.17 of Form 10-K for the year ended December 31, 2017. |
* |
|
|
|
|
|
|
Fifth Amendment to the Trust Agreement between Fidelity Management Trust Company and Zions Bancorporation for the Deferred Compensation Plans, incorporated by reference to Exhibit 10.18 of Form 10-K for the year ended December 31, 2018. |
* |
|
|
|
|
ZIONS BANCORPORATION, NATIONAL ASSOCIATION AND SUBSIDIARIES
|
|
|
|
|
|
|
|
|
|
|
|
| Exhibit Number |
|
Description |
|
|
|
|
|
|
|
Sixth Amendment to the Trust Agreement between Fidelity Management Trust Company and Zions Bancorporation for the Deferred Compensation Plans, dated August 17, 2015, incorporated by reference to Exhibit 10.18 of Form 10-K for the year ended December 31, 2020. |
* |
|
|
|
|
|
|
Seventh Amendment to the Trust Agreement between Fidelity Management Trust Company and Zions Bancorporation for the Deferred Compensation Plans, effective September 30, 2018, incorporated by reference to Exhibit 10.2 of Form 10-Q for the quarter ended September 30, 2018. |
* |
|
|
|
|
|
|
Ninth Amendment to the Trust Agreement between Fidelity Management Trust Company and Zions Bancorporation for the Deferred Compensation Plans, effective April 1, 2022, incorporated by reference to Exhibit 10.1 of Form 10-Q for the quarter ended September 30, 2022. |
* |
|
|
|
|
|
|
Zions Bancorporation Payshelter 401(k) and Employee Stock Ownership Plan, Restated and Amended effective January 1, 2007, incorporated by reference to Exhibit 10.3 of Form 10-Q for the quarter ended June 30, 2018. |
* |
|
|
|
|
|
|
Second Amendment to the Zions Bancorporation Payshelter 401(k) and Employee Stock Ownership Plan, dated December 31, 2018, effective January 1, 2019, incorporated by reference to Exhibit 10.27 of Form 10-K for the year ended December 31, 2018. |
* |
|
|
|
|
|
|
Third Amendment to the Zions Bancorporation Payshelter 401(k) and Employee Stock Ownership Plan, dated June 27, 2019, effective September 30, 2018, incorporated by reference to Exhibit 10.1 of Form 10-Q for the quarter ended June 30, 2019. |
* |
|
|
|
|
|
|
Fourth Amendment to the Zions Bancorporation Payshelter 401(k) and Employee Stock Ownership Plan, dated September 11, 2020, effective January 1, 2020, incorporated by reference to Exhibit 10.1 of Form 10-Q for the quarter ended September 30, 2020. |
* |
|
|
|
|
|
|
Fifth Amendment to the Zions Bancorporation Payshelter 401(k) and Employee Stock Ownership Plan, dated September 11, 2020, effective January 1, 2020, incorporated by reference to Exhibit 10.2 of Form 10-Q for the quarter ended September 30, 2020. |
* |
|
|
|
|
|
|
Sixth Amendment to the Zions Bancorporation Payshelter 401(k) and Employee Stock Ownership Plan, dated September 11, 2020, effective October 1, 2020, incorporated by reference to Exhibit 10.3 of Form 10-Q for the quarter ended September 30, 2020. |
* |
|
|
|
|
|
|
Seventh Amendment to the Zions Bancorporation Payshelter 401(k) and Employee Stock Ownership Plan, dated December 23, 2020, effective January 1, 2021, incorporated by reference to Exhibit 10.32 of Form 10-K for the year ended December 31, 2020. |
* |
|
|
|
|
|
|
Eighth Amendment to the Zions Bancorporation Payshelter 401(k) and Employee Stock Ownership Plan, dated December 20, 2022, effective January 1, 2023, incorporated by reference to Exhibit 10.30 of Form 10-K for the year ended December 31, 2022. |
* |
|
|
|
|
|
|
Zions Bancorporation Payshelter 401(k) and Employee Stock Ownership Plan Trust Agreement between Zions Bancorporation and Fidelity Management Trust Company, dated July 3, 2006, incorporated by reference to Exhibit 10.28 of Form 10-K for the year ended December 31, 2018. |
* |
|
|
|
|
|
|
First Amendment to the Zions Bancorporation Payshelter 401(k) and Employee Stock Ownership Plan Trust Agreement between Zions Bancorporation and Fidelity Management Trust Company, dated April 5, 2010, incorporated by reference to Exhibit 10.25 of Form 10-K for the year ended December 31, 2015. |
* |
|
|
|
|
ZIONS BANCORPORATION, NATIONAL ASSOCIATION AND SUBSIDIARIES
|
|
|
|
|
|
|
|
|
|
|
|
| Exhibit Number |
|
Description |
|
|
|
|
|
|
|
Second Amendment to the Zions Bancorporation Payshelter 401(k) and Employee Stock Ownership Plan Trust Agreement between Zions Bancorporation and Fidelity Management Trust Company, dated April 5, 2010, incorporated by reference to Exhibit 10.26 of Form 10-K for the year ended December 31, 2015. |
* |
|
|
|
|
|
|
Third Amendment to the Zions Bancorporation Payshelter 401(k) and Employee Stock Ownership Plan Trust Agreement between Zions Bancorporation and Fidelity Management Trust Company, dated April 30, 2010, incorporated by reference to Exhibit 10.27 of
Form 10-K for the year ended December 31, 2015. |
* |
|
|
|
|
|
|
Fourth Amendment to the Zions Bancorporation Payshelter 401(k) and Employee Stock Ownership Plan Trust Agreement between Zions Bancorporation and Fidelity Management Trust Company, dated October 1, 2014, incorporated by reference to Exhibit 10.37 of Form 10-K for the year ended December 31, 2020. |
* |
|
|
|
|
|
|
Fifth Amendment to the Zions Bancorporation Payshelter 401(k) and Employee Stock Ownership Plan Trust Agreement between Zions Bancorporation and Fidelity Management Trust Company, dated October 1, 2014, incorporated by reference to Exhibit 10.38 of Form 10-K for the year ended December 31, 2020. |
* |
|
|
|
|
|
|
Sixth Amendment to the Zions Bancorporation Payshelter 401(k) and Employee Stock Ownership Plan Trust Agreement between Zions Bancorporation and Fidelity Management Trust Company, dated August 17, 2015, incorporated by reference to Exhibit 10.39 of Form 10-K for the year ended December 31, 2020. |
* |
|
|
|
|
|
|
Seventh Amendment to the Zions Bancorporation Payshelter 401(k) and Employee Stock Ownership Plan Trust Agreement between Zions Bancorporation and Fidelity Management Trust Company, dated April 27, 2016, incorporated by reference to Exhibit 10.31 of
Form 10-K for the year ended December 31, 2016. |
* |
|
|
|
|
|
|
Eighth Amendment to the Zions Bancorporation Payshelter 401(k) and Employee Stock Ownership Plan Trust Agreement between Zions Bancorporation and Fidelity Management Trust Company, effective September 30, 2018, incorporated by reference to Exhibit 10.3 of Form 10-Q for the quarter ended September 30, 2018. |
* |
|
|
|
|
|
|
Ninth Amendment to the Zions Bancorporation Payshelter 401(k) and Employee Stock Ownership Plan Trust Agreement between Zions Bancorporation and Fidelity Management Trust Company, effective October 27, 2020, incorporated by reference to Exhibit 10.1 of Form 10-Q for the quarter ended June 30, 2021. |
* |
|
|
|
|
|
|
Tenth Amendment to the Zions Bancorporation Payshelter 401(k) and Employee Stock Ownership Plan Trust Agreement between Zions Bancorporation and Fidelity Management Trust Company, effective October 1, 2019, incorporated by reference to Exhibit 10.5 of Form 10-Q for the quarter ended June 30, 2022. |
* |
|
|
|
|
|
|
Eleventh Amendment to the Zions Bancorporation Payshelter 401(k) and Employee Stock Ownership Plan Trust Agreement between Zions Bancorporation and Fidelity Management Trust Company, effective November 1, 2020, incorporated by reference to Exhibit 10.6 of Form 10-Q for the quarter ended June 30, 2022. |
* |
|
|
|
|
|
|
Twelfth Amendment to the Zions Bancorporation Payshelter 401(k) and Employee Stock Ownership Plan Trust Agreement between Zions Bancorporation and Fidelity Management Trust Company, effective April 1, 2022, incorporated by reference to Exhibit 10.7 of Form 10-Q for the quarter ended June 30, 2022. |
* |
|
|
|
|
|
|
Zions Bancorporation 2015 Omnibus Incentive Plan, incorporated by reference to Exhibit 10.42 of Form 10-K for the year ended December 31, 2020. |
* |
|
|
|
|
ZIONS BANCORPORATION, NATIONAL ASSOCIATION AND SUBSIDIARIES
|
|
|
|
|
|
|
|
|
|
|
|
| Exhibit Number |
|
Description |
|
|
|
|
|
|
|
Form of Restricted Stock Award Agreement subject to holding requirement, Zions Bancorporation 2015 Omnibus Incentive Plan, incorporated by reference to Exhibit 10.43 of Form 10-K for the year ended December 31, 2020. |
* |
|
|
|
|
|
|
Form of Standard Restricted Stock Award Agreement, Zions Bancorporation 2015 Omnibus Incentive Plan, incorporated by reference to Exhibit 10.44 of Form 10-K for the year ended December 31, 2020. |
* |
|
|
|
|
|
|
Form of Standard Restricted Stock Unit Award Agreement, Zions Bancorporation 2015 Omnibus Incentive Plan, incorporated by reference to Exhibit 10.45 of Form 10-K for the year ended December 31, 2020. |
* |
|
|
|
|
|
|
Form of Restricted Stock Unit Agreement subject to holding requirement, Zions Bancorporation 2015 Omnibus Incentive Plan, incorporated by reference to Exhibit 10.46 of Form 10-K for the year ended December 31, 2020. |
* |
|
|
|
|
|
|
Form of Standard Stock Option Award Agreement, Zions Bancorporation 2015 Omnibus Incentive Plan, incorporated by reference to Exhibit 10.47 of Form 10-K for the year ended December 31, 2020. |
* |
|
|
|
|
|
|
Form of Standard Directors Stock Award Agreement, Zions Bancorporation 2015 Omnibus Incentive Plan, incorporated by reference to Exhibit 10.48 of Form 10-K for the year ended December 31, 2020. |
* |
|
|
|
|
|
|
Zions Bancorporation 2022 Omnibus Incentive Plan, incorporated by reference to Appendix I of Schedule 14A, dated March 17, 2022. |
* |
|
|
|
|
|
|
Form of Standard Restricted Stock Award Agreement, Zions Bancorporation 2022 Omnibus Incentive Plan, incorporated by reference to Exhibit 10.8 of Form 10-Q for the quarter ended June 30, 2022. |
* |
|
|
|
|
|
|
Form of Restricted Stock Award Agreement subject to holding requirement, Zions Bancorporation 2022 Omnibus Incentive Plan, incorporated by reference to Exhibit 10.9 of Form 10-Q for the quarter ended June 30, 2022. |
* |
|
|
|
|
|
|
Form of Standard Restricted Stock Unit Award Agreement, Zions Bancorporation 2022 Omnibus Incentive Plan, incorporated by reference to Exhibit 10.10 of Form 10-Q for the quarter ended June 30, 2022. |
* |
|
|
|
|
|
|
Form of Restricted Stock Unit Award Agreement subject to holding requirement, Zions Bancorporation 2022 Omnibus Incentive Plan, incorporated by reference to Exhibit 10.11 of Form 10-Q for the quarter ended June 30, 2022. |
* |
|
|
|
|
|
|
Form of Standard Stock Option Award Agreement, Zions Bancorporation 2022 Omnibus Incentive Plan, incorporated by reference to Exhibit 10.12 of Form 10-Q for the quarter ended June 30, 2022). |
* |
|
|
|
|
|
|
Form of Standard Directors Stock Award Agreement, Zions Bancorporation 2022 Omnibus Incentive Plan, incorporated by reference to Exhibit 10.13 of Form 10-Q for the quarter ended June 30, 2022. |
* |
|
|
|
|
|
|
Form of Change in Control Agreement between the Bank and Certain Executive Officers, incorporated by reference to Exhibit 10.49 of Form 10-K for the year ended December 31, 2020. |
* |
|
|
|
|
|
|
Form of Change in Control Agreement between the Bank and Dallas E. Haun, dated May 23, 2008, incorporated by reference to Exhibit 10.50 of Form 10-K for the year ended December 31, 2020. |
* |
ZIONS BANCORPORATION, NATIONAL ASSOCIATION AND SUBSIDIARIES
|
|
|
|
|
|
|
|
|
|
|
|
| Exhibit Number |
|
Description |
|
|
|
|
|
|
|
|
|
|
|
List of Subsidiaries of Zions Bancorporation, National Association (filed herewith). |
|
|
|
|
|
|
|
Consent of Independent Registered Public Accounting Firm (filed herewith). |
|
|
|
|
|
|
|
Certification by Chief Executive Officer required by Rules 13a-15(f) and 15d-15(f) under the Securities Exchange Act of 1934 (filed herewith). |
|
|
|
|
|
|
|
Certification by Chief Financial Officer required by Rules 13a-15(f) and 15d-15(f) under the Securities Exchange Act of 1934 (filed herewith). |
|
|
|
|
|
|
|
Certification by Chief Executive Officer and Chief Financial Officer required by Sections 13(a) or 15(d), as applicable, of the Securities Exchange Act of 1934 (15 U.S.C. 78m) and 18 U.S.C. Section 1350 (furnished herewith). |
|
|
|
|
|
|
|
Recoupment policy of Zions Bancorporation, National Association (filed herewith). |
|
|
|
|
|
| 101 |
|
Pursuant to Rules 405 and 406 of Regulation S-T, the following information is formatted in inline XBRL: (i) the Consolidated Balance Sheets as of December 31, 2023 and December 31, 2022, (ii) the Consolidated Statements of Income for the years ended December 31, 2023, December 31, 2022, and December 31, 2021, (iii) the Consolidated Statements of Comprehensive Income for the years ended December 31, 2023, December 31, 2022, and December 31, 2021, (iv) the Consolidated Statements of Changes in Shareholders’ Equity for the years ended December 31, 2023, December 31, 2022, and December 31, 2021, (v) the Consolidated Statements of Cash Flows for the years ended December 31, 2023, December 31, 2022, and December 31, 2021, and (vi) the Notes to Consolidated Financial Statements (filed herewith). |
|
|
|
|
|
| 104 |
|
The cover page from this Form 10-K, formatted as Inline XBRL. |
|
* Incorporated by reference
Pursuant to Item 601(b)(4)(iii)(A) of Regulation S-K, copies of certain instruments defining the rights of holders of long-term debt are not filed. We agree to furnish a copy thereof to the SEC and the OCC upon request.
ITEM 16. FORM 10-K SUMMARY
Not applicable.
ZIONS BANCORPORATION, NATIONAL ASSOCIATION AND SUBSIDIARIES
SIGNATURES
Pursuant to the requirements of Section 13 or 15(d) of the Securities Exchange Act of 1934, the Registrant has duly caused this report to be signed on its behalf by the undersigned, thereunto duly authorized.
February 23, 2024 ZIONS BANCORPORATION, NATIONAL ASSOCIATION
|
|
|
|
|
|
|
|
|
|
By |
/s/ Harris H. Simmons |
|
|
HARRIS H. SIMMONS, Chairman
and Chief Executive Officer |
Pursuant to the requirements of the Securities Exchange Act of 1934, this report has been signed below by the following persons on behalf of the Registrant and in the capacities and on the date indicated.
February 23, 2024
|
|
|
|
|
|
|
|
|
| /s/ Harris H. Simmons |
|
/s/ Paul E. Burdiss |
HARRIS H. SIMMONS, Director, Chairman
and Chief Executive Officer
(Principal Executive Officer) |
|
PAUL E. BURDISS, Executive Vice President
and Chief Financial Officer
(Principal Financial Officer) |
|
|
|
|
|
|
|
|
|
| /s/ R. Ryan Richards |
|
/s/ Maria Contreras-Sweet |
R. RYAN RICHARDS, Controller
(Principal Accounting Officer) |
|
MARIA CONTRERAS-SWEET, Director |
|
|
|
|
|
|
|
|
|
| /s/ Gary L. Crittenden |
|
/s/ Suren K. Gupta |
| GARY L. CRITTENDEN, Director |
|
SUREN K. GUPTA, Director |
|
|
|
|
|
|
|
|
|
| /s/ Claire A. Huang |
|
/s/ Vivian S. Lee |
| CLAIRE A. HUANG, Director |
|
VIVIAN S. LEE, Director |
|
|
|
|
|
|
|
|
|
| /s/ Scott J. McLean |
|
/s/ Edward F. Murphy |
| SCOTT J. MCLEAN, Director |
|
EDWARD F. MURPHY, Director |
|
|
|
|
|
|
|
|
|
| /s/ Stephen D. Quinn |
|
/s/ Aaron B. Skonnard |
| STEPHEN D. QUINN, Director |
|
AARON B. SKONNARD, Director |
|
|
|
|
|
|
|
|
|
| /s/ Barbara A. Yastine |
|
|
| BARBARA A. YASTINE, Director |
|
|
EX-4.1
2
exh41descriptionofsecuriti.htm
DESCRIPTION OF SECURIITES
Document
DESCRIPTION OF SECURITIES
The following is a summary description of certain important terms of securities of Zions Bancorporation, National Association (the “Bank”) that are registered under Section 12 of the Securities Exchange Act, as amended (the “Exchange Act”), as of December 31, 2023. The following summary does not purport to be complete and is qualified in its entirety by reference to the pertinent sections of the Second Amended and Restated Articles of Association of the Bank, dated as of September 30, 2018 (the “Articles”), and the Second Amended and Restated Bylaws of the Bank, dated as of April 1, 2019 (the “Bylaws”), which are incorporated by reference into the Annual Report on Form 10-K of the Bank of which this exhibit is a part.
Unless the context otherwise provides, all references to the Bank in this description refer only to Zions Bancorporation, National Association and do not include its consolidated subsidiaries.
Overview
The Articles authorize the Bank to issue up to 350,000,000 shares of common stock, par value $0.001 per share (“Common Stock”), and up to 4,400,000 shares of preferred stock, no par value per share (“Preferred Stock”).
As of December 31, 2023, of the 4,400,000 shares of Preferred Stock authorized for issuance, the following series and numbers of shares have been designated: (i) 140,000 shares of Series A Preferred Stock, (ii) 1,400,000 shares of Series C Preferred Stock, (iii) 250,000 shares of Series F Preferred Stock, (iv) 200,000 shares of Series G Preferred Stock, (v) 126,222 shares of Series H Preferred Stock, (vi) 300,893 shares of Series I Preferred Stock and (vii) 195,152 shares of Series J Preferred Stock.
As of December 31, 2023, the Common Stock, depositary shares representing an ownership interest in Series A Preferred Stock and Series G Preferred Stock, each as described below, and the 2028 Notes (as defined in “2028 Notes” below) were registered under Section 12 of the Exchange Act.
Common Stock
Summary of Terms of Common Stock
Voting Rights. Unless otherwise provided in the Articles, the Bylaws, applicable provisions of the National Bank Act, the applicable regulations of the Office of the Comptroller of the Currency (the “OCC”) or other applicable law, the holders of Common Stock are entitled to voting rights for the election of directors and for other purposes. Each share of Common Stock entitles the holder thereof to one vote in respect of a matter. Shares of Common Stock do not have cumulative voting rights with respect to any election of directors.
The voting rights of Common Stock are subject to the special voting rights of certain series of Preferred Stock which may entitle the holders of such shares of Preferred Stock to vote in respect of, among other things, the election of directors in the event dividends on such shares are in arrears or any amendment to the Articles, subject to exceptions, that materially and adversely affects the powers, preferences, privileges or rights of such series of Preferred Stock. The voting rights of Common Stock are also subject to the voting rights of any Preferred Stock that may in the future be designated by the board of directors of the Bank (the “Board of Directors”).
Dividend Rights. Subject to the preferential rights of holders of Preferred Stock, holders of Common Stock are entitled to receive dividends if, as and when declared by the Board of Directors out of any funds legally available therefor.
Ranking. The Common Stock ranks junior to the Preferred Stock and all existing and future debt obligations of the Bank.
Liquidation Rights. Holders of Common Stock are entitled to receive, upon any voluntary or involuntary liquidation, dissolution or winding-up of the affairs of the Bank, following the settlement of any claims of creditors and preferences of any series of Preferred Stock, pro rata the net assets of the Bank.
Other Rights. Holders of Common Stock have no preference, conversion, exchange, sinking fund or redemption rights and have no preemptive rights to subscribe for any securities of the Bank or its subsidiaries.
Listing. The Common Stock is listed on the Nasdaq Global Select Market (“Nasdaq”) under the ticker symbol “ZION.”
Transfer Agent and Registrar. The transfer agent and registrar for the Common Stock is Zions Bank.
Certain Anti-Takeover Matters
The Articles and Bylaws include a number of provisions, including those described below, that may have the effect of encouraging persons considering unsolicited tender offers or other unilateral takeover proposals to negotiate with the Board of Directors rather than pursue non-negotiated takeover attempts.
No Cumulative Voting. The Articles and Bylaws do not authorize cumulative voting for directors.
Removal of Directors. The Bylaws provide that the shareholders may, at a meeting called for such purpose, remove any director with or without cause unless the Articles provide that directors may be removed only for cause. In addition, the Articles provide that the removal of any director requires the affirmative vote of the holders of two-thirds of the outstanding shares then entitled to vote at an election of directors.
Shareholder Proposals. A shareholder who intends to nominate a candidate for election to the Board of Directors or to raise new business at an annual meeting of shareholders must deliver timely written notice of such business to the Secretary of the Bank not earlier than the date which is 150 calendar days nor later than the date which is 120 calendar days before the first anniversary of the date of the Bank’s proxy statement to shareholders in respect of the annual meeting of the prior year. However, notwithstanding the foregoing, if the date of the applicable year’s annual meeting has been changed by more than 30 calendar days from the first anniversary of the date of the previous year’s annual meeting, then a shareholder’s notice must be received by the Secretary the later of the close of business on (i) the date which is 120 calendar days before the applicable year’s annual meeting is to be held or (ii) 10 calendar days after the Bank’s first public announcement of the date of the applicable year’s annual meeting of shareholders. Further, in the event that the number of directors to be elected to the Board of Directors at the annual meeting is increased and either all nominees for directors or the increased size of the Board of Directors is not publicly disclosed at least 100 calendar days prior to the first anniversary of the date of the previous year’s annual meeting, then a shareholder proposal in respect of such election will be considered timely with respect to nominees for any new positions created by such increase if delivered to the Secretary of the Bank not later than the close of business on the 10th day following the first date all of such nominees or the size of the increased Board of Directors is publicly disclosed.
Additionally, the notice provisions in the Bylaws require a shareholder desiring to raise new business or nominate any person for election as a director to provide the Bank with certain information regarding such matter. Such requirements may discourage shareholders of the Bank from submitting nomination and proposals.
Restrictions on Certain Business Transactions. Subject to certain exceptions, the Articles provide that certain business transactions with a person who beneficially owns, directly or indirectly, at least 10% of the voting stock of the Bank must be approved by either a majority of the continuing directors or holders of at least 80% of the outstanding voting shares of the Bank. Such business transactions include mergers, consolidations, sales of all or more than 20% of the fair market value of the corporation’s assets, issuance of securities of the corporation, reclassifications that increase voting power of the interested shareholder, or liquidations, spin-offs or dissolution of the Bank. The provisions in the Articles regarding related person transactions may not be repealed or amended unless approved by the affirmative vote of holders of not less than 80% of the outstanding voting stock of the Bank.
Blank Check Preferred Stock. The Articles grant the Board broad power to establish the rights and preferences of authorized and unissued shares of Preferred Stock. Such an issuance of shares of Preferred Stock may have the effect of delaying, deterring or preventing a change in control of the Bank. The existence of authorized but unissued shares of Preferred Stock may enable the Board of Directors to render more difficult or to discourage an attempt to obtain control of the Bank by means of a merger, tender offer, proxy contest or otherwise.
Supermajority Vote for Certain Amendments to the Articles. The Articles provide that the affirmative vote of two-thirds of the outstanding and issued shares entitled by statute to vote shall be required to amend, alter, change or repeal the third paragraph of Article FIFTH (regarding removal of directors), any provision of Article SIXTH (regarding quorum requirement and management authority of the Board of Directors) or Article TENTH (amendment to the Articles) or any other provision if such amendment, alteration, change or repeal would restrict, limit or alter the power or authority of the Board or any other officer or agent of the Bank; would vest any powers of the Bank in any other officer or agent other than the Board, or officers and agents appointed by or under the authority of the Board; would require the approval of any shareholders in order for the Board or any officer or agent to take any action; or would change the number of directors, the quorum requirements for any meeting of the Board, the vote by which it must act in connection with any matter, the manner of calling or conducting meetings of directors, or the place of such meetings.
Series A Depositary Shares
Shares of Series A Preferred Stock are outstanding in the form of depositary shares, with each such depositary share representing a 1/40th ownership interest in a share of Series A Preferred Stock (“Series A Depositary Shares”).
Terms of Series A Depositary Shares
General. Each holder of a Series A Depositary Share is entitled, subject to the terms of the deposit agreement governing the Series A Depositary Shares, to all the rights and preferences of the Series A Preferred Stock represented thereby (including dividend, voting, redemption and liquidation rights) in proportion to the applicable fraction of a share of Series A Preferred Stock represented by such Series A Depositary Share. Each Series A Depositary Share is evidenced by a depositary receipt.
Receipt of Dividends. The depositary will distribute any cash dividends or other cash distributions received in respect of Series A Preferred Stock (see “Terms of Series A Preferred Stock—Dividend Rights” below) to the record holders of Series A Depositary Shares relating to such underlying Series A Preferred Stock. The depositary will distribute any property received by it other than cash to the record holders of Series A Depositary Shares entitled to those distributions, unless it determines that the distribution cannot be made proportionally among those holders or that it is not feasible to make a distribution. In that event, the depositary may, with the approval of the Bank, sell the property and distribute the net proceeds from such sale to holders of Series A Depositary Shares pro rata.
The amounts distributed to holders of Series A Depositary Shares will be reduced by any amounts required to be withheld by the depositary or by the Bank on account of taxes or other governmental charges.
Redemption. In the event the Bank redeems shares of Series A Preferred Stock represented by Series A Depositary Shares (see “Terms of Series A Preferred Stock—Redemption Rights” below), the depositary will redeem, as of the same redemption rate, the number of Series A Depositary Shares representing shares of Series A Preferred Stock so redeemed; provided, however, in the case of any redemption of less than all of the outstanding Series A Depositary Shares, the depositary shares to be redeemed will be selected by the depositary pro rata, by lot, or in such other manner determined by the Bank to be equitable and, in any such case, Series A Depositary Shares will be redeemed only in increments of 40 shares and any multiple thereof.
Voting. When the depositary receives notice of any meeting at which the holders of Series A Preferred Stock are entitled to vote (see “Terms of Series A Preferred Stock—Voting Rights” below), the depositary will mail the information contained in the notice to the record holders of Series A Depositary Shares. Each record holder of Series A Depositary Shares on the record date, which will be the same date as the record date for the Series A Preferred Stock, may instruct the depositary to vote the number of shares of Series A Preferred Stock represented by such holder’s Series A Depositary Shares. To the extent possible, the depositary will vote the number of shares of the Series A Preferred Stock represented by Series A Depositary Shares in accordance with the instructions it receives. If the depositary does not receive specific instructions from the holders of any Series A Depositary Shares, it will vote all shares of Series A Preferred Stock represented thereby proportionately with instructions received to the extent permitted by any applicable regulatory body.
Listing. The Series A Depositary Shares are listed on Nasdaq under the ticker symbol “ZIONP.”
Depositary; Registrar; Calculation Agent. The registrar, depositary and calculation agent of the Series A Depositary Shares is the Bank.
Terms of Series A Preferred Stock
Dividend Rights. Dividends on the liquidation preference of the Series A Preferred Stock of $1,000 are payable quarterly in arrears when, as and if declared by the Board of Directors or a duly authorized committee of the Board of Directors, at a rate per annum equal to the greater of (i) the three-month SOFR plus the statutorily prescribed tenor spread plus 0.52% on the related SOFR determination date,1 or (ii) 4.00%.
The applicable three-month SOFR is determined in accordance with the Articles (as modified by the FRB LIBOR Rule and the LIBOR Act); however, absent manifest error, the determination thereof by the calculation agent for the Series A Preferred Stock will be binding and conclusive.
Dividends on the Series A Preferred Stock are payable on the 15th day of March, June, September and December of each year; provided, however, if such date is not a business day, then the dividend payment date will be the next succeeding business day. The record date for a given dividend on the Series A Preferred Stock is the 1st day of March, June, September or December, as applicable, immediately preceding the payment date.
Dividends on the Series A Preferred Stock are non-cumulative. Accordingly, if no dividend is declared on the Series A Preferred Stock in respect of any dividend period, such dividend will not accrue or be payable, and the Bank will have no obligation to pay dividends in respect of such dividend period, whether or not dividends on the Series A Preferred Stock are declared for any future dividend period.
Ranking. The Series A Preferred Stock ranks:
•senior to the Common Stock and any other class or series of capital stock of the Bank, the terms of which provide that the Series A Preferred Stock ranks senior to such class or series in the payment of dividends or in the distribution of assets on any liquidation, dissolution or winding-up of the affairs of the Bank;
•on par with the Series G Preferred Stock, Series I Preferred Stock, Series J Preferred Stock and any other class or series of capital stock of the Bank, the terms of which provide that the Series A Preferred Stock ranks on par with such class or series in the payment of dividends or in the distribution of assets on any liquidation, dissolution or winding-up of the affairs of the Bank;
•junior to each class or series of capital stock of the Bank, the terms of which provide that the Series A Preferred Stock ranks on par with such class or series in the payment of dividends or in the distribution of assets on any liquidation, dissolution or winding-up of the affairs of the Bank; and
•junior to all existing and future debt obligations of the Bank.
Liquidation Rights. Upon any voluntary or involuntary liquidation, dissolution or winding-up of the affairs of the Bank, holders of Series A Preferred Stock are entitled to receive, out of assets available for distribution to shareholders of the Bank, after satisfaction of liabilities to creditors and subject to the rights of holders of any securities ranking senior to the Series A Preferred Stock, before any distribution of assets is made to holders of Common Stock or any securities ranking junior to the Series A Preferred Stock, a liquidating distribution in the amount of the liquidation preference of $1,000 per share (equivalent to $25 per depositary share) plus declared and unpaid dividends, without accumulation of any undeclared dividends. Holders of the Series A Preferred Stock will not be entitled to receive any other amounts from the Bank after the payment of such liquidating distribution.
If the assets of the Bank are not sufficient to pay the liquidation preferences plus declared and unpaid dividends in full to all holders of the Series A Preferred Stock, the Series G Preferred Stock, the Series I Preferred Stock, the Series J Preferred Stock and all holders of any other shares of capital stock ranking on par with the Series A Preferred Stock, then the amounts paid to the holders of all such parity stock will be paid pro rata in accordance with the respective aggregate liquidating distribution owed to those holders.
Redemption Rights. The Series A Preferred Stock is not subject to any mandatory redemption, sinking fund or other similar provisions. The holders of Preferred Stock (or, for the avoidance of doubt, the holders of Series A Depositary Shares) do not have the right to require the Bank to redeem or repurchase any shares of Series A Preferred Stock.
1 Pursuant to the Federal Reserve System’s final rule (the “FRB LIBOR Rule”) and the Adjustable Interest Rate Act (the “LIBOR Act”), the three-month SOFR plus the statutorily prescribed tenor spread replaces the original LIBOR for all dividends after June 30, 2023.
The Series A Preferred Stock is redeemable at the Bank’s option, in whole or in part, from time to time at a redemption price equal to $1,000 per share (equivalent to $25 per Series A Depositary Share), plus any declared and unpaid dividends, without accumulation of any undeclared dividends. The prior approval of the OCC is required in order for the Bank to repurchase shares of its capital stock, including Series A Preferred Stock.
Voting Rights. Holders of Series A Preferred Stock are entitled to limited voting rights as follows:
•any issuance, authorization or increase in the authorized amount of, or the issuance or authorization of any obligation or security convertible into or evidencing the right to purchase, any class or series of capital stock ranking senior to the Series A Preferred Stock with respect to the payment of dividends or the distribution of assets upon liquidation, dissolution or winding-up of the Bank requires the affirmative vote or consent of the holders of at least two-thirds of all outstanding shares of Series A Preferred Stock and any class or series of Preferred Stock ranking on parity with the Series A Preferred Stock (including the Series G Preferred Stock, Series I Preferred Stock and Series J Preferred Stock), voting together as a class;
•any amendment to the Articles, whether by merger, consolidation or otherwise, that, subject to exceptions set forth in the Articles, materially and adversely affects the powers, preferences, privileges or rights of Series A Preferred Stock, taken as a whole, requires the affirmative vote or consent of the holders of at least two-thirds of all outstanding shares of Series A Preferred Stock; and
•the holders of Series A Preferred Stock are entitled to participate in the election of certain directors in the event the Bank fails to declare and pay certain dividends on the Series A Preferred Stock.
If the Bank fails to declare and pay dividends in respect of the Series A Preferred Stock or any other class or series of voting parity stock (as defined below) in an aggregate amount at least equal to the amount of dividends payable on such class or series at its stated dividend rate for a period of six dividend periods, whether or not for consecutive dividend periods (a “Nonpayment”), then (i) the number of directors then constituting the Board of Directors will be increased by two and (ii) to the extent a Nonpayment exists with respect to such class or series of voting parity stock (which may include the Series A Preferred Stock), the holders of such voting parity stock will be entitled to vote as a single class for the election of the two additional directors (the “Preferred Directors”), but only if the election of such directors would not cause the Bank to violate applicable law, the implementing regulations and guidelines of the OCC or the listing standards of Nasdaq (or any other exchange on which its securities may be listed) or the rules and regulations of any other regulatory or self-regulatory body. As used in this paragraph and the following paragraph, “voting parity stock” means the Series A Preferred Stock and each class or series of preferred stock that ranks on parity with the Series A Preferred Stock as to payment of dividends and has voting rights similar to those described in this section, including the Series G Preferred Stock, Series I Preferred Stock and Series J Preferred Stock.
The Preferred Directors will each be entitled to one vote per director on any matter and, for the avoidance of doubt, in no event will the number of Preferred Directors exceed two.
In the event of a Nonpayment, at the written request of any holder of record of at least 20% of the outstanding shares of any voting parity stock with respect to which a Nonpayment exists (including, if applicable, the Series A Preferred Stock), the Secretary of the Bank will call a special meeting of the holders of all voting parity stock with respect to which a Nonpayment exists for the election of the two directors (unless such request is received less than 90 days before the date fixed for the next annual or special meeting of the shareholders, in which event such election will be held at such next annual or special meeting of shareholders). So long as these voting rights have not ceased, holders of voting parity stock with respect to which a Nonpayment exists (including, if applicable, the Series A Preferred Stock) voting as a single class will continue to elect the Preferred Directors at each subsequent annual meeting.
If and when full dividends on any class or series of voting parity stock as to which a Nonpayment exists or existed have been paid for at least four dividend periods following a Nonpayment, the voting rights in respect of the Preferred Directors will cease with respect to such class or series (subject to revesting in the event of each subsequent Nonpayment). If and when full dividends have been paid for at least four dividend periods on all classes and series of voting parity stock as to which a Nonpayment exists or existed, the term of office of each Preferred Director so elected will immediately terminate and the number of directors on the board of directors will automatically decrease by two.
Any Preferred Director may be removed at any time, with or without cause, by the holders of record of a majority of the outstanding shares of all classes and series of voting parity stock with respect to which a Nonpayment then exists, voting together as a single class. Subject to the termination of the term of the Preferred Directors set forth above, any vacancy in the office of a Preferred Director (other than prior to the initial election of the Preferred Directors) may be filled by the written consent of the Preferred Director remaining in office or, if none remains in office, by a vote of the holders of record of a majority of the outstanding shares of voting parity stock with respect to which a Nonpayment then exists voting as a single class, with the successor to serve until the next annual meeting of shareholders.
Series G Depositary Shares
Shares of Series G Preferred Stock are outstanding in the form of depositary shares, with each such depositary share representing a 1/40th ownership interest in a share of Series G Preferred Stock (“Series G Depositary Shares”).
Terms of Series G Depositary Shares
General. Each holder of a Series G Depositary Share is entitled, subject to the terms of the deposit agreement governing the Series G Depositary Shares, to all the rights and preferences of the Series G Preferred Stock represented thereby (including dividend, voting, redemption and liquidation rights) in proportion to the applicable fraction of a share of Series G Preferred Stock represented by such Series G Depositary Share. Each Series G Depositary Share is evidenced by a depositary receipt.
Receipt of Dividends. The depositary will distribute any cash dividends or other cash distributions received in respect of Series G Preferred Stock (see “Terms of Series G Preferred Stock—Dividend Rights” below) to the record holders of Series G Depositary Shares relating to such underlying Series G Preferred Stock. The depositary will distribute any property received by it other than cash to the record holders of Series G Depositary Shares entitled to those distributions, unless it determines that the distribution cannot be made proportionally among those holders or that it is not feasible to make a distribution. In that event, the depositary may, with the approval of the Bank, sell the property and distribute the net proceeds from such sale to holders of Series G Depositary Shares pro rata.
The amounts distributed to holders of Series G Depositary Shares will be reduced by any amounts required to be withheld by the depositary or by the Bank on account of taxes or other governmental charges.
Redemption. In the event the Bank redeems shares of Series G Preferred Stock represented by Series G Depositary Shares (see “Terms of Series G Preferred Stock—Redemption Rights” below), the depositary will redeem, as of the same redemption rate, the number of Series G Depositary Shares representing shares of Series G Preferred Stock so redeemed; provided, however, in the case of any redemption of less than all of the outstanding Series G Depositary Shares, the depositary shares to be redeemed will be selected by the depositary pro rata, by lot, or in such other manner determined by the Bank to be equitable and, in any such case, Series G Depositary Shares will be redeemed only in increments of 40 shares and any multiple thereof.
Voting. When the depositary receives notice of any meeting at which the holders of Series G Preferred Stock are entitled to vote (see “Terms of Series G Preferred Stock—Voting Rights” below), the depositary will mail the information contained in the notice to the record holders of Series G Depositary Shares. Each record holder of Series G Depositary Shares on the record date, which will be the same date as the record date for the Series G Preferred Stock, may instruct the depositary to vote the number of shares of Series G Preferred Stock represented by such holder’s Series G Depositary Shares. To the extent possible, the depositary will vote the number of shares of the Series G Preferred Stock represented by Series G Depositary Shares in accordance with the instructions it receives. If the depositary does not receive specific instructions from the holders of any Series G Depositary Shares, it will vote all shares of Series G Preferred Stock represented thereby proportionately with instructions received to the extent permitted by any applicable regulatory body.
Listing. The Series G Depositary Shares are listed on Nasdaq under the ticker symbol “ZIONO.”
Depositary; Registrar; Calculation Agent. The registrar, depositary and calculation agent of the Series G Depositary Shares is the Bank.
Terms of Series G Preferred Stock
Dividend Rights. Dividends on the liquidation preference of the Series G Preferred Stock of $1,000 are payable quarterly in arrears when, as and if declared by the Board of Directors or a duly authorized committee of the Board of Directors, at a rate per annum equal to (i) a fixed rate of 6.30% for dividend periods up to and including the dividend period ending on March 14, 2023 and (ii) a floating rate of the three-month SOFR plus the statutorily prescribed tenor spread plus 4.24% for all dividend periods after June 30, 2023.2 The applicable three-month SOFR is determined in accordance with the Articles (as modified by the FRB LIBOR Rule and the LIBOR Act); however, absent manifest error, the determination thereof by the calculation agent for the Series G Preferred Stock will be binding and conclusive.
Dividends on the Series G Preferred Stock are payable on the 15th day of March, June, September and December of each year; provided, however, if such date is not a business day, then the dividend payment date will be the next succeeding business day. The record date for a given dividend on the Series G Preferred Stock is the 1st day of March, June, September or December, as applicable, immediately preceding the payment date.
Dividends on the Series G Preferred Stock are non-cumulative. Accordingly, if no dividend is declared on the Series G Preferred Stock in respect of any dividend period, such dividend will not accrue or be payable, and the Bank will have no obligation to pay dividends in respect of such dividend period, whether or not dividends on the Series G Preferred Stock are declared for any future dividend period.
Ranking. The Series G Preferred Stock ranks:
•senior to the Common Stock and any other class or series of capital stock of the Bank, the terms of which provide that the Series G Preferred Stock ranks senior to such class or series in the payment of dividends or in the distribution of assets on any liquidation, dissolution or winding-up of the affairs of the Bank;
•on par with the Series A Preferred Stock, Series I Preferred Stock, Series J Preferred Stock and any other class or series of capital stock of the Bank, the terms of which provide that the Series G Preferred Stock ranks on par with such class or series in the payment of dividends or in the distribution of assets on any liquidation, dissolution or winding-up of the affairs of the Bank;
•junior to each class or series of capital stock of the Bank, the terms of which provide that the Series G Preferred Stock ranks on par with such class or series in the payment of dividends or in the distribution of assets on any liquidation, dissolution or winding-up of the affairs of the Bank; and
•junior to all existing and future debt obligations of the Bank.
Liquidation Rights. Upon any voluntary or involuntary liquidation, dissolution or winding-up of the affairs of the Bank, holders of Series G Preferred Stock are entitled to receive, out of assets available for distribution to shareholders of the Bank, after satisfaction of liabilities to creditors and subject to the rights of holders of any securities ranking senior to the Series G Preferred Stock, before any distribution of assets is made to holders of Common Stock or any securities ranking junior to the Series G Preferred Stock, a liquidating distribution in the amount of the liquidation preference of $1,000 per share (equivalent to $25 per depositary share) plus declared and unpaid dividends, without accumulation of any undeclared dividends. Holders of the Series G Preferred Stock will not be entitled to receive any other amounts from the Bank after the payment of such liquidating distribution.
2 Pursuant to the FRB LIBOR Rule and the LIBOR Act, the three-month SOFR plus the statutorily prescribed tenor spread replaces the original LIBOR for all dividends after June 30, 2023. For the dividend period between March 14, 2023 and June 30, 2023, the floating rate was the three-month LIBOR plus 4.24%.
If the assets of the Bank are not sufficient to pay the liquidation preferences plus declared and unpaid dividends in full to all holders of the Series A Preferred Stock, the Series G Preferred Stock, the Series I Preferred Stock, the Series J Preferred Stock and all holders of any other shares of capital stock ranking on par with the Series G Preferred Stock, then the amounts paid to the holders of all such parity stock will be paid pro rata in accordance with the respective aggregate liquidating distribution owed to those holders.
Redemption Rights. The Series G Preferred Stock is not subject to any mandatory redemption, sinking fund or other similar provisions. The holders of Preferred Stock (or, for the avoidance of doubt, the holders of Series G Depositary Shares) do not have the right to require the Bank to redeem or repurchase any shares of Series G Preferred Stock.
The Series G Preferred Stock is redeemable at the Bank’s option, in whole or in part, from time to time on or after March 15, 2023 at a redemption price equal to $1,000 per share (equivalent to $25 per Series G Depositary Share), plus any declared and unpaid dividends, without accumulation of any undeclared dividends, and prior to such date in whole upon the occurrence of certain events. The prior approval of the OCC is required in order for the Bank to repurchase shares of its capital stock, including Series G Preferred Stock.
Voting Rights. Holders of Series G Preferred Stock are entitled to limited voting rights as follows:
•any issuance, authorization or increase in the authorized amount of, or the issuance or authorization of any obligation or security convertible into or evidencing the right to purchase, any class or series of capital stock ranking senior to the Series G Preferred Stock with respect to the payment of dividends or the distribution of assets upon liquidation, dissolution or winding-up of the Bank requires the affirmative vote or consent of the holders of at least two-thirds of all outstanding shares of Series G Preferred Stock and any class or series of Preferred Stock ranking on parity with the Series G Preferred Stock (including the Series A Preferred Stock, Series I Preferred Stock and Series J Preferred Stock), voting together as a class;
•any amendment to the Articles, whether by merger, consolidation or otherwise, that, subject to exceptions set forth in the Articles, materially and adversely affects the powers, preferences, privileges or rights of Series G Preferred Stock, taken as a whole, requires the affirmative vote or consent of the holders of at least two-thirds of all outstanding shares of Series G Preferred Stock; and
•the holders of Series G Preferred Stock are entitled to participate in the election of certain directors in the event the Bank fails to declare and pay certain dividends on the Series G Preferred Stock.
If there exists a Nonpayment in respect of the Series G Preferred Stock or any other class or series of voting parity stock (as defined below), then (i) the number of directors then constituting the Board of Directors will be increased by two and (ii) to the extent a Nonpayment exists with respect to such class or series of voting parity stock (which may include the Series G Preferred Stock), the holders of such voting parity stock will be entitled to vote as a single class for the election of the two Preferred Directors, but only if the election of such directors would not cause the Bank to violate applicable law, the implementing regulations and guidelines of the OCC or the listing standards of Nasdaq (or any other exchange on which its securities may be listed) or the rules and regulations of any other regulatory or self-regulatory body. As used in this paragraph and the following paragraph, “voting parity stock” means the Series G Preferred Stock and each class or series of preferred stock that ranks on parity with the Series G Preferred Stock as to payment of dividends and has voting rights similar to those described in this section, including the Series A Preferred Stock, Series I Preferred Stock and Series J Preferred Stock.
The Preferred Directors will each be entitled to one vote per director on any matter and, for the avoidance of doubt, in no event will the number of Preferred Directors exceed two.
In the event of a Nonpayment, at the written request of any holder of record of at least 20% of the outstanding shares of any voting parity stock with respect to which a Nonpayment exists (including, if applicable, the Series G Preferred Stock), the Secretary of the Bank will call a special meeting of the holders of all voting parity stock with respect to which a Nonpayment exists for the election of the two directors (unless such request is received less than 90 days before the date fixed for the next annual or special meeting of the shareholders, in which event such election will be held at such next annual or special meeting of shareholders). So long as these voting rights have not ceased, holders of voting parity stock with respect to which a Nonpayment exists (including, if applicable, the Series G Preferred Stock) voting as a single class will continue to elect the Preferred Directors at each subsequent annual meeting.
If and when full dividends on any class or series of voting parity stock as to which a Nonpayment exists or existed have been paid for at least four dividend periods following a Nonpayment, the voting rights in respect of the Preferred Directors will cease with respect to such class or series (subject to revesting in the event of each subsequent Nonpayment). If and when full dividends have been paid for at least four dividend periods on all classes and series of voting parity stock as to which a Nonpayment exists or existed, the term of office of each Preferred Director so elected will immediately terminate and the number of directors on the board of directors will automatically decrease by two.
Any Preferred Director may be removed at any time, with or without cause, by the holders of record of a majority of the outstanding shares of all classes and series of voting parity stock with respect to which a Nonpayment then exists, voting together as a single class. Subject to the termination of the term of the Preferred Directors set forth above, any vacancy in the office of a Preferred Director (other than prior to the initial election of the Preferred Directors) may be filled by the written consent of the Preferred Director remaining in office or, if none remains in office, by a vote of the holders of record of a majority of the outstanding shares of voting parity stock with respect to which a Nonpayment then exists voting as a single class, with the successor to serve until the next annual meeting of shareholders.
2028 Notes
As of December 31, 2023, there was issued and outstanding $88 million aggregate principal amount of Fixed-to-Floating Rate Subordinated Notes due September 15, 2028 (the “2028 Notes”).
Interest. The 2028 Notes bear interest (i) at a fixed rate per annum equal to 6.95% until but excluding September 15, 2023, and (ii) at a floating rate per annum equal to the three-month SOFR plus the statutorily prescribed tenor spread plus 3.89% from and including September 15, 2023 to but excluding September 15, 2028.3 The applicable three-month SOFR is determined in accordance with the certificates representing the 2028 Notes (as modified by the FRB LIBOR Rule and the LIBOR Act); however, absent manifest error, the determination thereof by the calculation agent for 2028 Notes will be binding and conclusive.
Interest on the 2028 Notes is payable on the 15th day of March, June, September and December of each year; provided, however, if such date is not a business day, then the interest payment date will be the next succeeding business day. Interest on the 2028 Notes is payable to holders of record of as they appear on the books of the Bank on the applicable record date, which will be the 1st of March, June, September or December, as applicable, immediately preceding the respective interest payment date.
Unless all principal of and any premium or interest on senior indebtedness (as defined in “—Ranking” below) has been paid in full, no payment or other distribution may be made in respect of the 2028 Notes:
•in the event of any insolvency or bankruptcy proceedings, or any receivership, liquidation, reorganization, assignment for the benefit of creditors or other similar proceedings or events involving the Bank or its assets;
•(i) in the event and during the continuation of any default in the payment of principal of or premium or interest on any senior indebtedness beyond any applicable grace period or (ii) in the event that any judicial proceeding is pending with respect to any such default; or
•in the event that any 2028 Notes have been declared due and payable before their stated maturity.
Maturity. The 2028 Notes mature on September 15, 2028. Holders of the notes may not accelerate the maturity of the notes, except upon an event of default. See “—Defaults and Events of Default” below.
3 Pursuant to the FRB LIBOR Rule and the LIBOR Act, the three-month SOFR plus the statutorily prescribed tenor spread replaces the original LIBOR for all dividends after June 30, 2023.
Redemption. The Bank may redeem the 2028 Notes in whole or in part on or after September 15, 2023 by paying the principal amount of the 2028 Notes so redeemed plus accrued interest thereon through the date of redemption. The Bank will notify the holder, in writing, of the redemption not less than 30 days nor more than 60 days before the redemption date. There are no sinking funds for the 2028 Notes.
Ranking. The 2028 Notes are unsecured obligations of the Bank and are subordinated in right of payment to all senior indebtedness (as defined below) and effectively subordinated to all existing and future debt and all other liabilities of the subsidiaries of the Bank and, upon the occurrence of certain events of insolvency, will be subordinated to the prior payment in full of all general obligations of the Bank. The indenture under which the 2028 Notes are issued does not limit the ability of the Bank to incur senior indebtedness or general obligations, including indebtedness ranking equally with the 2028 Notes.
“Senior indebtedness” means (i) the principal of, and any premium and interest on, all of indebtedness of the Bank for purchased or borrowed money, whether or not evidenced by securities, notes, debentures, bonds or other similar instruments issued by the Bank; (ii) capital lease obligations of the Bank; (iii) all obligations issued or assumed as the deferred purchase price of property, all conditional sale obligations and all obligations under any conditional sale or title retention agreement, but excluding trade accounts payable in the ordinary course of business; (iv) all obligations in respect of any letters of credit, bankers acceptance, security purchase facilities and similar credit transactions; (v) all obligations in respect of interest rate swap, cap or other agreements, interest rate future or options contracts, currency swap agreements, currency future or option contracts and other similar agreements; (vi) all obligations of the type referred to in (i) through (v) of other persons for the payment of which the Bank is responsible or liable as obligor, guarantor or otherwise; (vii) all obligations of the type referred to (i) through (vi) of other persons secured by any lien on any properties or assets of the Bank; and (viii) any deferrals renewals or extensions of (i) through (vii).
However, “senior indebtedness” does not include:
•the 2028 Notes;
•any indebtedness that by its terms is subordinated to, or ranks on par with, the 2028 Notes; or
•any indebtedness between or among the Bank and its affiliates, including all other debt securities and guarantees in respect of debt securities issued to any trust, or a trustee of such trust, partnership or other entity affiliated with the Bank which is a financing vehicle of the Bank in connection with the issuance by such financing vehicle of capital securities or other securities guaranteed by the Bank pursuant to an instrument that ranks on par with or junior in respect of payment to the 2028 Notes.
Defaults and Events of Default. If the Bank files for bankruptcy or there occurs certain other events of bankruptcy, insolvency or reorganization relating to the Bank (each, an “Event of Default”), and such Event of Default is continuing, either the trustee or the holders of at least 25% in aggregate principal amount of the 2028 Notes may accelerate the maturity of the 2028 Notes. If an Event of Default occurs and is not cured, the trustee must use the degree of care of a prudent person in the conduct of his or her own affairs in the exercise of its powers; however, the trustee will be under no obligation to exercise any of its rights or powers under the indenture governing the 2028 Notes at the request of any holders of 2028 Notes unless they have offered to the trustee reasonable security or indemnity.
If a Default (as defined below) occurs that is not also an Event of Default, neither the trustee nor the holders of the 2028 Notes may act to accelerate the maturity of the 2028 Notes. However, if a Default occurs, the trustee may proceed to enforce any covenant and other rights of the holders of the 2028 Notes, and if the Default relates to the failure of the Bank to make any payment of interest when due and payable and such failure continues for a period of 30 days or such failure is made in the payment of the principal at the maturity of the 2028 Notes, then the trustee may demand payment of the amounts then due and payable and may proceed to prosecute such failure to make sure payments.
A “Default” means (i) the failure to pay principal of or any premium of the 2028 Notes when due; (ii) the failure to pay any interest on the 2028 Notes when due and that failure continues for 30 days; (iii) the failure to perform any other covenant in the indenture governing the 2028 Notes and that failure continues for 60 days after written notice to the Bank by the trustee or the holders of at least 25% in aggregate principal amount of the 2028 Notes; or (iv) any Event of Default.
The Bank must deliver to the trustee, within 120 days after the end of each fiscal year of the Bank, an officers’ certificate stating whether or not, to the best knowledge of the signatories thereof, the Bank is in default in the performance and observance of any of the terms, provisions and conditions of the indenture governing the terms of the 2028 Notes (without regard to any period of grace or requirement of notice provided thereunder) and, if the Bank is in default, specifying all such defaults and their nature and status to the extent known by such signatories.
Modification of Terms. Certain limited modifications of the indenture governing the 2028 Notes may be made without obtaining the consent of the holders of the 2028 Notes, whereas other modifications may be made only with the consent of the holders of 66 2/3% in principal amount of the outstanding 2028 Notes. However, a modification requires the consent of the holder of each outstanding 2028 Note if such modification would:
•change the stated maturity of the principal or interest of the 2028 Notes;
•reduce the principal amount of or interest on the 2028 Notes or change the currency in which the 2028 Notes are payable;
•change the place of payment;
•impair the right to institute suit for the enforcement of any payment on the 2028 Notes on or after their maturity date or redemption date;
•reduce the percentage of holders whose consent is needed to modify the indenture or to waive compliance with certain provisions of the indenture or to waive certain Defaults;
•modify the provisions with respect to subordination of the 2028 Notes in a manner adverse to the holders; or
•modify the provisions dealing with modification and waiver of the indenture.
The holders of 66 2/3% in principal amount of the outstanding 2028 Notes may, on behalf of all holders of 2028 Notes, waive compliance by the Bank with certain restrictive provisions of the indenture. The holders of a majority in principal amount of the outstanding 2028 Notes may, on behalf of all holders of 2028 Notes, waive any past default, except a default in the payment of principal or interest, and defaults in respect of a covenant or provision which cannot be modified or amended without the consent of each holder of 2028 Notes.
Trustee. The trustee for holders of the 2028 Notes is The Bank of New York Mellon Trust Company, N.A.
Calculation and Paying Agent. The calculation and paying agent for the 2028 Notes is the Bank.
EX-21
3
exh21listofsubs20231231.htm
LIST OF SUBSIDIARIES
Document
EXHIBIT 21
LIST OF SUBSIDIARIES
ZIONS BANCORPORATION, NATIONAL ASSOCIATION
AT DECEMBER 31, 2023
|
|
|
|
|
|
SUBSIDIARY |
STATE OR JURISDICTION OF
INCORPORATION/ORGANIZATION |
|
|
| Terra Amica, LLC |
Delaware |
|
|
| Zions Capital Partners, Inc. |
Delaware |
|
|
| Zions Center of Excellence, LLC |
Delaware |
|
|
| Zions Opportunity Fund, Inc. |
Delaware |
|
|
| PPS Data, LLC |
Nevada |
|
|
| Amegy Holding Texas, Inc. |
Texas |
|
|
| Exchange Services L.L.C. |
Utah |
|
|
| Zions Capital Advisors, Inc. |
Utah |
|
|
| Zions Credit Corp. |
Utah |
|
|
| Zions Direct, Inc. |
Utah |
|
|
| Zions Insurance Agency, Inc. |
Utah |
|
|
| Zions Public Finance, Inc. |
Utah |
|
|
| Zions SBIC, LLC |
Utah |
|
|
| ZMFU II, Inc. |
Utah |
|
|
EX-23
4
exh23eyconsent20231231.htm
CONSENT OF INDEPENDENT REGISTERED PUBLIC ACCOUNTING FIRM
Document
EXHIBIT 23
Consent of Independent Registered Public Accounting Firm
We consent to the incorporation by reference in the following Registration Statements:
(i)Registration Statement (Form S-8 No. 333-36205) and related Prospectus pertaining to Zions Bancorporation Employee Investment Savings Plan, now known as the Zions Bancorporation, National Association Payshelter 401(k) and Employee Stock Ownership Plan;
(ii)Registration Statement (Form S-8 No. 333-205422) and related Prospectus pertaining to Zions Bancorporation 2015 Omnibus Incentive Plan;
(iii)Post-effective Amendment No. 1 to Form S-8 Registration Statement No. 333-205422; and
(iv)Registration Statement (Form S-8 No. 333-130222) and related Prospectus pertaining to Amegy Bancorporation 1993 Stock Option and Incentive Plan, and Amegy Bancorporation Amended and Restated Non-Employee Directors Deferred Fee Plan;
of our reports dated February 23, 2024, with respect to the consolidated financial statements of Zions Bancorporation, National Association, and the effectiveness of internal control over financial reporting of Zions Bancorporation, National Association included in this Annual Report (Form 10-K) for the year ended December 31, 2023.
/s/ ERNST & YOUNG LLP
Salt Lake City, Utah
February 23, 2024
EX-31.1
5
exh311certofceo10-k20231231.htm
CERTIFICATION BY CEO
Document
EXHIBIT 31.1
CERTIFICATION
Principal Executive Officer
I, Harris H. Simmons, certify that:
1.I have reviewed this annual report on Form 10-K of Zions Bancorporation;
2.Based on my knowledge, this report does not contain any untrue statement of a material fact or omit to state a material fact necessary to make the statements made, in light of the circumstances under which such statements were made, not misleading with respect to the period covered by this report;
3.Based on my knowledge, the financial statements, and other financial information included in this report, fairly present in all material respects the financial condition, results of operations and cash flows of the registrant as of, and for, the periods presented in this report;
4.The registrant’s other certifying officer and I are responsible for establishing and maintaining disclosure controls and procedures (as defined in Exchange Act Rules 13a-15(e) and 15d-15(e)) and internal control over financial reporting (as defined in Exchange Act Rules 13a-15(f) and 15d-15(f)) for the registrant and have:
a)Designed such disclosure controls and procedures, or caused such disclosure controls and procedures to be designed under our supervision, to ensure that material information relating to the registrant, including its consolidated subsidiaries, is made known to us by others within those entities, particularly during the period in which this report is being prepared;
b)Designed such internal control over financial reporting, or caused such internal control over financial reporting to be designed under our supervision, to provide reasonable assurance regarding the reliability of financial reporting and the preparation of financial statements for external purposes in accordance with generally accepted accounting principles;
c)Evaluated the effectiveness of the registrant’s disclosure controls and procedures and presented in this report our conclusions about the effectiveness of the disclosure controls and procedures, as of the end of the period covered by this report based on such evaluation; and
d)Disclosed in this report any change in the registrant’s internal control over financial reporting that occurred during the registrant’s most recent fiscal quarter (the registrant’s fourth fiscal quarter in the case of an annual report) that has materially affected, or is reasonably likely to materially affect, the registrant’s internal control over financial reporting; and
5.The registrant’s other certifying officer and I have disclosed, based on our most recent evaluation of internal control over financial reporting, to the registrant’s auditors and the audit committee of the registrant’s board of directors (or persons performing the equivalent functions):
a)All significant deficiencies and material weaknesses in the design or operation of internal control over financial reporting which are reasonably likely to adversely affect the registrant’s ability to record, process, summarize and report financial information; and
b)Any fraud, whether or not material, that involves management or other employees who have a significant role in the registrant’s internal control over financial reporting.
Date: February 23, 2024
|
|
|
|
|
|
|
/s/ Harris H. Simmons |
|
Harris H. Simmons, Chairman and Chief Executive Officer |
EX-31.2
6
exh312certofcfo10-k20231231.htm
CERTIFICATION BY CFO
Document
EXHIBIT 31.2
CERTIFICATION
Principal Financial Officer
I, Paul E. Burdiss, certify that:
1.I have reviewed this annual report on Form 10-K of Zions Bancorporation;
2.Based on my knowledge, this report does not contain any untrue statement of a material fact or omit to state a material fact necessary to make the statements made, in light of the circumstances under which such statements were made, not misleading with respect to the period covered by this report;
3.Based on my knowledge, the financial statements, and other financial information included in this report, fairly present in all material respects the financial condition, results of operations and cash flows of the registrant as of, and for, the periods presented in this report;
4.The registrant’s other certifying officer and I are responsible for establishing and maintaining disclosure controls and procedures (as defined in Exchange Act Rules 13a-15(e) and 15d-15(e)) and internal control over financial reporting (as defined in Exchange Act Rules 13a-15(f) and 15d-15(f)) for the registrant and have:
a)Designed such disclosure controls and procedures, or caused such disclosure controls and procedures to be designed under our supervision, to ensure that material information relating to the registrant, including its consolidated subsidiaries, is made known to us by others within those entities, particularly during the period in which this report is being prepared;
b)Designed such internal control over financial reporting, or caused such internal control over financial reporting to be designed under our supervision, to provide reasonable assurance regarding the reliability of financial reporting and the preparation of financial statements for external purposes in accordance with generally accepted accounting principles;
c)Evaluated the effectiveness of the registrant’s disclosure controls and procedures and presented in this report our conclusions about the effectiveness of the disclosure controls and procedures, as of the end of the period covered by this report based on such evaluation; and
d)Disclosed in this report any change in the registrant’s internal control over financial reporting that occurred during the registrant’s most recent fiscal quarter (the registrant’s fourth fiscal quarter in the case of an annual report) that has materially affected, or is reasonably likely to materially affect, the registrant’s internal control over financial reporting; and
5.The registrant’s other certifying officer and I have disclosed, based on our most recent evaluation of internal control over financial reporting, to the registrant’s auditors and the audit committee of the registrant’s board of directors (or persons performing the equivalent functions):
a)All significant deficiencies and material weaknesses in the design or operation of internal control over financial reporting which are reasonably likely to adversely affect the registrant’s ability to record, process, summarize and report financial information; and
b)Any fraud, whether or not material, that involves management or other employees who have a significant role in the registrant’s internal control over financial reporting.
Date: February 23, 2024
|
|
|
|
|
|
|
/s/ Paul E. Burdiss |
|
Paul E. Burdiss, Executive Vice President and
Chief Financial Officer |
EX-32
7
exh32certofceocfo20231231.htm
CERTIFICATION BY CEO AND CFO
Document
EXHIBIT 32
CERTIFICATION
Pursuant to Section 906 of the Sarbanes-Oxley Act of 2002, 18 U.S.C. §1350, the undersigned officers of Zions Bancorporation (the “Bank”) hereby certify that, to the best of their knowledge, the Bank’s Annual Report on Form 10-K for the year ended December 31, 2023 (the “Report”) fully complies with the requirements of Section 13(a) or 15(d), as applicable, of the Securities Exchange Act of 1934 (15 U.S.C. 78m) and that the information contained in the Report fairly presents, in all material respects, the financial condition and results of operations of the Bank.
Date: February 23, 2024
|
|
|
|
|
|
|
|
|
|
/s/ Harris H. Simmons |
|
Name: |
Harris H. Simmons |
|
Title: |
Chairman and Chief Executive Officer |
|
|
|
|
/s/ Paul E. Burdiss |
|
Name: |
Paul E. Burdiss |
|
Title: |
Executive Vice President and Chief Financial Officer |
The foregoing certification is being furnished solely pursuant to 18 U.S.C. §1350 and is not being filed as part of the Report or as a separate disclosure document.
EX-97
8
exh97zionsrecoupmentpolicy.htm
RECOUPMENT POLICY
Document
ZIONS BANCORPORATION, N.A.
RECOUPMENT POLICY
I. BACKGROUND
Zions Bancorporation, N.A. (the “Bank”) has adopted this policy (this “Policy”) to provide for the recovery or “clawback” of certain incentive compensation in the event of a Restatement. This Policy is intended to comply with, and will be interpreted to be consistent with, the requirements of the Nasdaq Stock Market (“Nasdaq”) Listing Rule 5608 (the “Listing Standard”). Certain terms used in this Policy are defined in Section VIII below.
II. STATEMENT OF POLICY
The Bank shall recover reasonably promptly the amount of erroneously awarded Incentive-Based Compensation in the event that the Bank is required to prepare an accounting restatement due to the material noncompliance of the Bank with any financial reporting requirement under the securities laws, including any required accounting restatement to correct an error in previously issued financial statements that is material to the previously issued financial statements, or that would result in a material misstatement if the error were corrected in the current period or left uncorrected in the current period (a “Restatement”).
The Bank shall recover erroneously awarded Incentive-Based Compensation in compliance with this Policy except to the extent provided under Section V below.
III. SCOPE OF POLICY
A. Covered Persons and Recovery Period. This Policy applies to Incentive-Based Compensation received by a person:
•after beginning service as an Executive Officer,
•who served as an Executive Officer at any time during the performance period for that Incentive-Based Compensation,
•while the Bank has a class of securities listed on a national securities exchange, and
•during the three completed fiscal years immediately preceding the date that the Bank is required to prepare a Restatement (the “Recovery Period”).
Notwithstanding this look-back requirement, the Bank is only required to apply this Policy to Incentive-Based Compensation received on or after October 2, 2023.
For purposes of this Policy, Incentive-Based Compensation shall be deemed “received” in the Bank’s fiscal period during which the Financial Reporting Measure (as defined herein) specified in the Incentive-Based Compensation award is attained, even if the payment or grant of the Incentive-Based Compensation occurs after the end of that period.
B. Transition Period. In addition to the Recovery Period, this Policy applies to any transition period (that results from a change in the Bank’s fiscal year) within or immediately following the Recovery Period (a “Transition Period”), provided that a Transition Period between the last day of the Bank’s previous fiscal year end and the first day of the Bank’s new fiscal year that comprises a period of nine to 12 months will be deemed a completed fiscal year.
C. Determining Recovery Period. For purposes of determining the relevant Recovery Period, the date that the Bank is required to prepare the Restatement is the earlier to occur of:
•the date the board of directors of the Bank (the “Board”), a committee of the Board, or the officer or officers of the Bank authorized to take such action if Board action is not required, concludes, or reasonably should have concluded, that the Bank is required to prepare a Restatement, and
•the date a court, regulator, or other legally authorized body directs the Bank to prepare a Restatement.
For clarity, the Bank’s obligation to recover erroneously awarded Incentive-Based Compensation under this Policy is not dependent on if or when a Restatement is filed.
IV. AMOUNT SUBJECT TO RECOVERY
A. Recoverable Amount. The amount of Incentive-Based Compensation subject to recovery under this Policy is the amount of Incentive-Based Compensation received that exceeds the amount of Incentive-Based Compensation that otherwise would have been received had it been determined based on the restated amounts, computed without regard to any taxes paid.
B. Covered Compensation Based on Stock Price or TSR. For Incentive-Based Compensation based on stock price or total shareholder return (“TSR”), where the amount of erroneously awarded Incentive-Based Compensation is not subject to mathematical recalculation directly from the information in a Restatement, the recoverable amount shall be determined by the Executive Compensation Committee of the Bank’s Board of Directors (the “Committee”) based on a reasonable estimate of the effect of the Restatement on the stock price or TSR upon which the Incentive-Based Compensation was received. In such event, the Bank shall maintain documentation of the determination of that reasonable estimate and provide such documentation to Nasdaq.
C. Method of Recovery. The Bank will have discretion in determining how to accomplish recovery of erroneously awarded Incentive-Based Compensation under this Policy, recognizing that different means of recovery may be appropriate in different circumstances.
D. Other Recoupment Rights; Event of Conflict. Any right of recoupment under this Policy is in addition to, and not in lieu of, any other remedies or rights of recoupment that may be available to the Bank and its subsidiaries and affiliates under applicable law or pursuant to the terms of any similar policy or similar provision in any employment agreement, equity award agreement or similar agreement. If any awards are subject to both this Policy and any other right to recoupment under any similar policy or similar provision in any applicable employment agreement, equity award agreement or similar agreement, and there is any conflict between the terms of this Policy and such other policy or provision, then such conflict or inconsistency shall be resolved by giving precedence to this Policy.
V. EXCEPTIONS
The Bank shall recover erroneously awarded Incentive-Based Compensation in compliance with this Policy except to the extent that the conditions set out below are met and the Committee has made a determination that recovery would be impracticable:
A. Direct Expense Exceeds Recoverable Amount. The direct expense paid to a third party to assist in enforcing this Policy would exceed the amount to be recovered; provided, however, that before concluding it would be impracticable to recover any amount of erroneously awarded Incentive-Based Compensation based on expense of enforcement, the Bank shall make a reasonable attempt to recover such erroneously awarded Incentive-Based Compensation, document such reasonable attempt(s) to recover, and provide that documentation to Nasdaq.
B. Recovery from Certain Tax-Qualified Retirement Plans. Recovery would likely cause an otherwise tax-qualified retirement plan, under which benefits are broadly available to employees of the Bank, to fail to meet the requirements of 26 U.S.C. 401(a)(13) or 26 U.S.C. 411(a) and regulations thereunder.
VI. PROHIBITION AGAINST INDEMNIFICATION
Notwithstanding the terms of any indemnification arrangement or insurance policy with any individual covered by this Policy, the Bank shall not indemnify any Executive Officer or former Executive Officer against the loss of erroneously awarded Incentive-Based Compensation, including any payment or reimbursement for the cost of insurance obtained by any such covered individual to fund amounts recoverable under this Policy.
VII. DISCLOSURE
The Bank shall file all disclosures with respect to this Policy and recoveries under this Policy in accordance with the requirements of the U.S. Federal securities laws, including the disclosure required by the applicable Securities and Exchange Commission (“SEC”) filings.
VIII. DEFINITIONS
Unless the context otherwise requires, the following definitions apply for purposes of this Policy:
“Executive Officer” means the Bank’s president, principal financial officer, principal accounting officer (or if there is no such accounting officer, the controller), any vice-president of the Bank in charge of a principal business unit, division, or function (such as sales, administration, or finance), any other officer who performs a policy-making function, or any other person who performs similar policymaking functions for the Bank. Executive officers of the Bank’s subsidiaries, as applicable, are deemed Executive Officers of the Bank if they perform such policy making functions for the Bank. Policy-making function is not intended to include policymaking functions that are not significant. Identification of an Executive Officer for purposes of this Policy will include at a minimum executive officers identified pursuant to 17 CFR 229.401(b).
“Financial Reporting Measures” means any of the following: (i) measures that are determined and presented in accordance with the accounting principles used in preparing the Bank’s financial statements, and any measures that are derived wholly or in part from such measures, (ii) stock price and (iii) TSR. A Financial Reporting Measure need not be presented within the Bank’s financial statements or included in a filing with the SEC.
“Incentive-Based Compensation” means any compensation that is granted, earned, or vested based wholly or in part upon the attainment of a Financial Reporting Measure.
IX. ADMINISTRATION; AMENDMENT; TERMINATION.
All determinations under this Policy will be made by the Committee, including determinations regarding how any recovery under this Policy is effected. Any determinations of the Committee will be final, binding and conclusive and need not be uniform with respect to each individual covered by this Policy.
The Committee may amend this Policy from time to time and may terminate this Policy at any time, in each case in its sole discretion.
X. EFFECTIVENESS; OTHER RECOUPMENT RIGHTS
This Policy shall be effective as of October 28, 2023.