00001071402025FYfalsehttp://wiley.com/20250430#RestructuringAndRelatedCreditsChargeshttp://wiley.com/20250430#RestructuringAndRelatedCreditsChargeshttp://fasb.org/us-gaap/2024#OtherNonoperatingIncomeExpense0.1iso4217:USDxbrli:sharesiso4217:USDxbrli:sharesjwa:segmentxbrli:purejwa:performanceObligationjwa:vote00001071402024-05-012025-04-300000107140jwa:ClassACommonStockParValue100PerShareMember2024-05-012025-04-300000107140jwa:ClassBCommonStockParValue100PerShareMember2024-05-012025-04-3000001071402024-10-310000107140jwa:ClassACommonStockParValue100PerShareMember2025-05-310000107140jwa:ClassBCommonStockParValue100PerShareMember2025-05-3100001071402025-04-3000001071402024-04-300000107140us-gaap:CommonClassAMember2024-04-300000107140us-gaap:CommonClassAMember2025-04-300000107140us-gaap:CommonClassBMember2025-04-300000107140us-gaap:CommonClassBMember2024-04-3000001071402023-05-012024-04-3000001071402022-05-012023-04-3000001071402023-04-3000001071402022-04-300000107140us-gaap:CommonStockMemberus-gaap:CommonClassAMember2022-04-300000107140us-gaap:CommonStockMemberus-gaap:CommonClassBMember2022-04-300000107140us-gaap:AdditionalPaidInCapitalMember2022-04-300000107140us-gaap:RetainedEarningsMember2022-04-300000107140us-gaap:AccumulatedOtherComprehensiveIncomeMember2022-04-300000107140us-gaap:TreasuryStockCommonMember2022-04-300000107140us-gaap:AdditionalPaidInCapitalMember2022-05-012023-04-300000107140us-gaap:RetainedEarningsMember2022-05-012023-04-300000107140us-gaap:TreasuryStockCommonMember2022-05-012023-04-300000107140us-gaap:CommonClassAMember2022-05-012023-04-300000107140us-gaap:RetainedEarningsMemberus-gaap:CommonClassAMember2022-05-012023-04-300000107140us-gaap:CommonClassBMember2022-05-012023-04-300000107140us-gaap:RetainedEarningsMemberus-gaap:CommonClassBMember2022-05-012023-04-300000107140us-gaap:CommonStockMemberus-gaap:CommonClassAMember2022-05-012023-04-300000107140us-gaap:CommonStockMemberus-gaap:CommonClassBMember2022-05-012023-04-300000107140us-gaap:AccumulatedOtherComprehensiveIncomeMember2022-05-012023-04-300000107140us-gaap:CommonStockMemberus-gaap:CommonClassAMember2023-04-300000107140us-gaap:CommonStockMemberus-gaap:CommonClassBMember2023-04-300000107140us-gaap:AdditionalPaidInCapitalMember2023-04-300000107140us-gaap:RetainedEarningsMember2023-04-300000107140us-gaap:AccumulatedOtherComprehensiveIncomeMember2023-04-300000107140us-gaap:TreasuryStockCommonMember2023-04-300000107140us-gaap:AdditionalPaidInCapitalMember2023-05-012024-04-300000107140us-gaap:RetainedEarningsMember2023-05-012024-04-300000107140us-gaap:TreasuryStockCommonMember2023-05-012024-04-300000107140us-gaap:CommonClassAMember2023-05-012024-04-300000107140us-gaap:RetainedEarningsMemberus-gaap:CommonClassAMember2023-05-012024-04-300000107140us-gaap:CommonClassBMember2023-05-012024-04-300000107140us-gaap:RetainedEarningsMemberus-gaap:CommonClassBMember2023-05-012024-04-300000107140us-gaap:CommonStockMemberus-gaap:CommonClassAMember2023-05-012024-04-300000107140us-gaap:CommonStockMemberus-gaap:CommonClassBMember2023-05-012024-04-300000107140us-gaap:AccumulatedOtherComprehensiveIncomeMember2023-05-012024-04-300000107140us-gaap:CommonStockMemberus-gaap:CommonClassAMember2024-04-300000107140us-gaap:CommonStockMemberus-gaap:CommonClassBMember2024-04-300000107140us-gaap:AdditionalPaidInCapitalMember2024-04-300000107140us-gaap:RetainedEarningsMember2024-04-300000107140us-gaap:AccumulatedOtherComprehensiveIncomeMember2024-04-300000107140us-gaap:TreasuryStockCommonMember2024-04-300000107140us-gaap:AdditionalPaidInCapitalMember2024-05-012025-04-300000107140us-gaap:RetainedEarningsMember2024-05-012025-04-300000107140us-gaap:TreasuryStockCommonMember2024-05-012025-04-300000107140us-gaap:CommonClassAMember2024-05-012025-04-300000107140us-gaap:RetainedEarningsMemberus-gaap:CommonClassAMember2024-05-012025-04-300000107140us-gaap:CommonClassBMember2024-05-012025-04-300000107140us-gaap:RetainedEarningsMemberus-gaap:CommonClassBMember2024-05-012025-04-300000107140us-gaap:CommonStockMemberus-gaap:CommonClassAMember2024-05-012025-04-300000107140us-gaap:CommonStockMemberus-gaap:CommonClassBMember2024-05-012025-04-300000107140us-gaap:AccumulatedOtherComprehensiveIncomeMember2024-05-012025-04-300000107140us-gaap:CommonStockMemberus-gaap:CommonClassAMember2025-04-300000107140us-gaap:CommonStockMemberus-gaap:CommonClassBMember2025-04-300000107140us-gaap:AdditionalPaidInCapitalMember2025-04-300000107140us-gaap:RetainedEarningsMember2025-04-300000107140us-gaap:AccumulatedOtherComprehensiveIncomeMember2025-04-300000107140us-gaap:TreasuryStockCommonMember2025-04-300000107140srt:MinimumMemberjwa:BookCompositionCostsMember2024-05-012025-04-300000107140srt:MaximumMemberjwa:BookCompositionCostsMember2024-05-012025-04-300000107140srt:WeightedAverageMemberjwa:OtherProductDevelopmentCostsMember2024-05-012025-04-300000107140us-gaap:CostOfSalesMember2024-05-012025-04-300000107140us-gaap:CostOfSalesMember2023-05-012024-04-300000107140us-gaap:CostOfSalesMember2022-05-012023-04-300000107140us-gaap:GeneralAndAdministrativeExpenseMember2024-05-012025-04-300000107140us-gaap:GeneralAndAdministrativeExpenseMember2023-05-012024-04-300000107140us-gaap:GeneralAndAdministrativeExpenseMember2022-05-012023-04-300000107140srt:MinimumMemberus-gaap:SoftwareAndSoftwareDevelopmentCostsMember2025-04-300000107140srt:MaximumMemberus-gaap:SoftwareAndSoftwareDevelopmentCostsMember2025-04-300000107140srt:MinimumMemberus-gaap:ComputerEquipmentMember2025-04-300000107140srt:MaximumMemberus-gaap:ComputerEquipmentMember2025-04-300000107140srt:MaximumMemberjwa:BuildingAndLeaseholdImprovementsMember2025-04-300000107140srt:MinimumMemberjwa:FurnitureFixturesAndWarehouseEquipmentMember2025-04-300000107140srt:MaximumMemberjwa:FurnitureFixturesAndWarehouseEquipmentMember2025-04-300000107140srt:MinimumMemberus-gaap:SoftwareDevelopmentMember2025-04-300000107140srt:MaximumMemberus-gaap:SoftwareDevelopmentMember2025-04-300000107140us-gaap:ArtisticRelatedIntangibleAssetsMembersrt:WeightedAverageMember2025-04-300000107140us-gaap:CustomerRelationshipsMembersrt:WeightedAverageMember2025-04-300000107140us-gaap:DevelopedTechnologyRightsMember2025-04-300000107140us-gaap:TrademarksAndTradeNamesMembersrt:WeightedAverageMember2025-04-300000107140us-gaap:NoncompeteAgreementsMembersrt:WeightedAverageMember2025-04-300000107140us-gaap:PerformanceSharesMember2024-05-012025-04-300000107140us-gaap:OperatingSegmentsMemberjwa:ResearchPublishingMemberjwa:ResearchSegmentMember2024-05-012025-04-300000107140us-gaap:OperatingSegmentsMemberjwa:ResearchPublishingMemberjwa:ResearchSegmentMember2023-05-012024-04-300000107140us-gaap:OperatingSegmentsMemberjwa:ResearchPublishingMemberjwa:ResearchSegmentMember2022-05-012023-04-300000107140us-gaap:OperatingSegmentsMemberjwa:ResearchSolutionsMemberjwa:ResearchSegmentMember2024-05-012025-04-300000107140us-gaap:OperatingSegmentsMemberjwa:ResearchSolutionsMemberjwa:ResearchSegmentMember2023-05-012024-04-300000107140us-gaap:OperatingSegmentsMemberjwa:ResearchSolutionsMemberjwa:ResearchSegmentMember2022-05-012023-04-300000107140us-gaap:OperatingSegmentsMemberjwa:ResearchSegmentMember2024-05-012025-04-300000107140us-gaap:OperatingSegmentsMemberjwa:ResearchSegmentMember2023-05-012024-04-300000107140us-gaap:OperatingSegmentsMemberjwa:ResearchSegmentMember2022-05-012023-04-300000107140us-gaap:OperatingSegmentsMemberjwa:AcademicMemberjwa:LearningSegmentMember2024-05-012025-04-300000107140us-gaap:OperatingSegmentsMemberjwa:AcademicMemberjwa:LearningSegmentMember2023-05-012024-04-300000107140us-gaap:OperatingSegmentsMemberjwa:AcademicMemberjwa:LearningSegmentMember2022-05-012023-04-300000107140us-gaap:OperatingSegmentsMemberjwa:ProfessionalMemberjwa:LearningSegmentMember2024-05-012025-04-300000107140us-gaap:OperatingSegmentsMemberjwa:ProfessionalMemberjwa:LearningSegmentMember2023-05-012024-04-300000107140us-gaap:OperatingSegmentsMemberjwa:ProfessionalMemberjwa:LearningSegmentMember2022-05-012023-04-300000107140us-gaap:OperatingSegmentsMemberjwa:LearningSegmentMember2024-05-012025-04-300000107140us-gaap:OperatingSegmentsMemberjwa:LearningSegmentMember2023-05-012024-04-300000107140us-gaap:OperatingSegmentsMemberjwa:LearningSegmentMember2022-05-012023-04-300000107140us-gaap:OperatingSegmentsMemberjwa:HeldForSaleOrSoldSegmentMember2024-05-012025-04-300000107140us-gaap:OperatingSegmentsMemberjwa:HeldForSaleOrSoldSegmentMember2023-05-012024-04-300000107140us-gaap:OperatingSegmentsMemberjwa:HeldForSaleOrSoldSegmentMember2022-05-012023-04-300000107140us-gaap:ProductConcentrationRiskMemberjwa:ResearchPublishingMemberus-gaap:RevenueFromContractWithCustomerMember2024-05-012025-04-300000107140jwa:ResearchPublishingMemberjwa:ResearchSegmentMemberjwa:JournalRevenueMember2024-05-012025-04-300000107140jwa:ResearchPublishingMemberjwa:LearningSegmentMemberjwa:JournalRevenueMember2024-05-012025-04-300000107140us-gaap:OperatingSegmentsMemberjwa:ResearchSolutionsProductsAndServicesMemberjwa:ResearchSegmentMember2024-05-012025-04-300000107140us-gaap:ProductConcentrationRiskMemberjwa:EducationPublishingMemberus-gaap:RevenueFromContractWithCustomerMember2024-05-012025-04-300000107140jwa:EducationPublishingMembersrt:MinimumMemberjwa:ResearchSegmentMemberjwa:AtyponPlatformsAndServicesMember2024-05-012025-04-300000107140jwa:EducationPublishingMembersrt:MaximumMemberjwa:ResearchSegmentMemberjwa:AtyponPlatformsAndServicesMember2024-05-012025-04-300000107140us-gaap:OperatingSegmentsMemberjwa:AcademicProductsMemberjwa:LearningSegmentMember2024-05-012025-04-300000107140us-gaap:ProductConcentrationRiskMemberjwa:AcademicProductsMemberus-gaap:RevenueFromContractWithCustomerMember2024-05-012025-04-300000107140us-gaap:ProductConcentrationRiskMemberjwa:DigitalCoursewareMemberus-gaap:RevenueFromContractWithCustomerMember2024-05-012025-04-300000107140us-gaap:OperatingSegmentsMemberjwa:ProfessionalProductsMemberjwa:LearningSegmentMember2024-05-012025-04-300000107140us-gaap:ProductConcentrationRiskMemberjwa:ProfessionalProductsMemberus-gaap:RevenueFromContractWithCustomerMember2024-05-012025-04-300000107140us-gaap:ProductConcentrationRiskMemberjwa:ProfessionalProductsMixMemberus-gaap:RevenueFromContractWithCustomerMember2024-05-012025-04-300000107140us-gaap:DisposalGroupHeldForSaleOrDisposedOfBySaleNotDiscontinuedOperationsMember2024-05-012025-04-3000001071402025-05-012025-04-3000001071402026-05-012025-04-300000107140jwa:CrossKnowledgeMember2024-05-012025-04-300000107140jwa:CrossKnowledgeMember2023-05-012024-04-300000107140jwa:CrossKnowledgeMember2022-05-012023-04-300000107140jwa:WileyEdgeMember2024-05-012025-04-300000107140jwa:WileyEdgeMember2023-05-012024-04-300000107140jwa:WileyEdgeMember2022-05-012023-04-300000107140jwa:UniversityServicesMember2024-05-012025-04-300000107140jwa:UniversityServicesMember2023-05-012024-04-300000107140jwa:UniversityServicesMember2022-05-012023-04-300000107140jwa:TuitionManagerMember2024-05-012025-04-300000107140jwa:TuitionManagerMember2023-05-012024-04-300000107140jwa:TuitionManagerMember2022-05-012023-04-300000107140jwa:TestPrepAndAdvancementCoursesMember2024-05-012025-04-300000107140jwa:TestPrepAndAdvancementCoursesMember2023-05-012024-04-300000107140jwa:TestPrepAndAdvancementCoursesMember2022-05-012023-04-300000107140jwa:SaleOfAssetsMember2024-05-012025-04-300000107140jwa:SaleOfAssetsMember2023-05-012024-04-300000107140jwa:SaleOfAssetsMember2022-05-012023-04-300000107140us-gaap:DisposalGroupDisposedOfBySaleNotDiscontinuedOperationsMemberjwa:CrossKnowledgeMember2025-04-300000107140us-gaap:DisposalGroupDisposedOfBySaleNotDiscontinuedOperationsMemberjwa:CrossKnowledgeMember2024-05-012025-04-300000107140us-gaap:DisposalGroupHeldforsaleNotDiscontinuedOperationsMemberjwa:CrossKnowledgeMember2024-05-012025-04-300000107140us-gaap:DisposalGroupHeldforsaleNotDiscontinuedOperationsMemberjwa:CrossKnowledgeMember2023-05-012024-04-300000107140us-gaap:DisposalGroupDisposedOfBySaleNotDiscontinuedOperationsMemberjwa:WileyEdgeMember2025-04-300000107140us-gaap:DisposalGroupDisposedOfBySaleNotDiscontinuedOperationsMemberjwa:WileyEdgeMember2025-04-302025-04-300000107140jwa:WileyEdgeMemberjwa:EarnoutMemberus-gaap:DisposalGroupDisposedOfBySaleNotDiscontinuedOperationsMember2025-04-300000107140jwa:WileyEdgeMemberjwa:InspiritSellerNoteMemberus-gaap:DisposalGroupDisposedOfBySaleNotDiscontinuedOperationsMember2024-05-310000107140jwa:WileyEdgeMemberjwa:InspiritSellerNoteMemberus-gaap:DisposalGroupDisposedOfBySaleNotDiscontinuedOperationsMember2024-05-312024-05-310000107140jwa:WileyEdgeMemberjwa:EarnoutMemberus-gaap:DisposalGroupDisposedOfBySaleNotDiscontinuedOperationsMember2024-05-310000107140us-gaap:DisposalGroupDisposedOfBySaleNotDiscontinuedOperationsMemberjwa:WileyEdgeMember2025-01-310000107140us-gaap:DisposalGroupDisposedOfBySaleNotDiscontinuedOperationsMemberjwa:WileyEdgeMember2024-05-012025-04-300000107140us-gaap:DisposalGroupHeldforsaleNotDiscontinuedOperationsMemberjwa:WileyEdgeMember2023-05-012024-04-300000107140us-gaap:DisposalGroupDisposedOfBySaleNotDiscontinuedOperationsMemberjwa:UniversityServicesMember2023-05-012024-04-300000107140jwa:UniversityServicesMemberjwa:TVGInvestmentMemberus-gaap:DisposalGroupDisposedOfBySaleNotDiscontinuedOperationsMember2024-01-010000107140jwa:UniversityServicesMemberjwa:EarnoutMemberus-gaap:DisposalGroupDisposedOfBySaleNotDiscontinuedOperationsMember2025-04-300000107140jwa:UniversityServicesMemberus-gaap:PrepaidExpensesAndOtherCurrentAssetsMemberus-gaap:DisposalGroupDisposedOfBySaleNotDiscontinuedOperationsMember2025-04-300000107140jwa:UniversityServicesMemberus-gaap:DisposalGroupDisposedOfBySaleNotDiscontinuedOperationsMemberus-gaap:SubsequentEventMember2025-06-050000107140us-gaap:DisposalGroupDisposedOfBySaleNotDiscontinuedOperationsMemberjwa:UniversityServicesMember2024-05-012025-04-300000107140us-gaap:DisposalGroupDisposedOfBySaleNotDiscontinuedOperationsMemberjwa:TuitionManagerMember2023-05-312023-05-310000107140us-gaap:DisposalGroupDisposedOfBySaleNotDiscontinuedOperationsMemberjwa:TuitionManagerMember2023-05-012024-04-300000107140us-gaap:DisposalGroupDisposedOfBySaleNotDiscontinuedOperationsMemberjwa:TuitionManagerMember2024-05-012025-04-300000107140us-gaap:DisposalGroupDisposedOfBySaleNotDiscontinuedOperationsMemberjwa:WileysEffectiveLearningAndAdvancementCoursesBusinessMember2023-02-282023-04-300000107140us-gaap:DisposalGroupDisposedOfBySaleNotDiscontinuedOperationsMemberjwa:WileysEffectiveLearningAndAdvancementCoursesBusinessMember2023-02-282023-03-310000107140us-gaap:DisposalGroupDisposedOfBySaleNotDiscontinuedOperationsMemberjwa:WileysEffectiveLearningAndAdvancementCoursesBusinessMember2023-04-012023-04-300000107140us-gaap:DisposalGroupHeldforsaleNotDiscontinuedOperationsMemberjwa:CrossKnowledgeMember2024-04-300000107140us-gaap:DisposalGroupHeldforsaleNotDiscontinuedOperationsMemberjwa:WileyEdgeMember2024-04-300000107140us-gaap:DisposalGroupHeldforsaleNotDiscontinuedOperationsMember2024-04-300000107140jwa:SaleOfAssetsMember2024-08-012024-10-310000107140us-gaap:AccumulatedTranslationAdjustmentMember2022-04-300000107140us-gaap:AccumulatedDefinedBenefitPlansAdjustmentNetUnamortizedGainLossMember2022-04-300000107140us-gaap:AccumulatedGainLossNetCashFlowHedgeParentMember2022-04-300000107140us-gaap:AccumulatedTranslationAdjustmentMember2022-05-012023-04-300000107140us-gaap:AccumulatedDefinedBenefitPlansAdjustmentNetUnamortizedGainLossMember2022-05-012023-04-300000107140us-gaap:AccumulatedGainLossNetCashFlowHedgeParentMember2022-05-012023-04-300000107140us-gaap:AccumulatedTranslationAdjustmentMember2023-04-300000107140us-gaap:AccumulatedDefinedBenefitPlansAdjustmentNetUnamortizedGainLossMember2023-04-300000107140us-gaap:AccumulatedGainLossNetCashFlowHedgeParentMember2023-04-300000107140us-gaap:AccumulatedTranslationAdjustmentMember2023-05-012024-04-300000107140us-gaap:AccumulatedDefinedBenefitPlansAdjustmentNetUnamortizedGainLossMember2023-05-012024-04-300000107140us-gaap:AccumulatedGainLossNetCashFlowHedgeParentMember2023-05-012024-04-300000107140us-gaap:AccumulatedTranslationAdjustmentMember2024-04-300000107140us-gaap:AccumulatedDefinedBenefitPlansAdjustmentNetUnamortizedGainLossMember2024-04-300000107140us-gaap:AccumulatedGainLossNetCashFlowHedgeParentMember2024-04-300000107140us-gaap:AccumulatedTranslationAdjustmentMember2024-05-012025-04-300000107140us-gaap:AccumulatedDefinedBenefitPlansAdjustmentNetUnamortizedGainLossMember2024-05-012025-04-300000107140us-gaap:AccumulatedGainLossNetCashFlowHedgeParentMember2024-05-012025-04-300000107140us-gaap:AccumulatedTranslationAdjustmentMember2025-04-300000107140us-gaap:AccumulatedDefinedBenefitPlansAdjustmentNetUnamortizedGainLossMember2025-04-300000107140us-gaap:AccumulatedGainLossNetCashFlowHedgeParentMember2025-04-300000107140jwa:WileyEdgeAndCrossKnowledgeMember2024-05-012025-04-300000107140us-gaap:ReclassificationOutOfAccumulatedOtherComprehensiveIncomeMember2024-05-012025-04-300000107140us-gaap:ReclassificationOutOfAccumulatedOtherComprehensiveIncomeMember2023-05-012024-04-300000107140us-gaap:ReclassificationOutOfAccumulatedOtherComprehensiveIncomeMember2022-05-012023-04-300000107140jwa:GlobalRestructuringProgramMember2024-05-012025-04-300000107140jwa:GlobalRestructuringProgramMemberus-gaap:OperatingSegmentsMemberjwa:ResearchSegmentMember2024-05-012025-04-300000107140jwa:GlobalRestructuringProgramMemberus-gaap:OperatingSegmentsMemberjwa:ResearchSegmentMember2023-05-012024-04-300000107140jwa:GlobalRestructuringProgramMemberus-gaap:OperatingSegmentsMemberjwa:ResearchSegmentMember2022-05-012023-04-300000107140jwa:GlobalRestructuringProgramMemberus-gaap:OperatingSegmentsMemberjwa:ResearchSegmentMember2025-04-300000107140jwa:GlobalRestructuringProgramMemberus-gaap:OperatingSegmentsMemberjwa:LearningSegmentMember2024-05-012025-04-300000107140jwa:GlobalRestructuringProgramMemberus-gaap:OperatingSegmentsMemberjwa:LearningSegmentMember2023-05-012024-04-300000107140jwa:GlobalRestructuringProgramMemberus-gaap:OperatingSegmentsMemberjwa:LearningSegmentMember2022-05-012023-04-300000107140jwa:GlobalRestructuringProgramMemberus-gaap:OperatingSegmentsMemberjwa:LearningSegmentMember2025-04-300000107140jwa:GlobalRestructuringProgramMemberus-gaap:OperatingSegmentsMemberjwa:HeldForSaleOrSoldSegmentMember2024-05-012025-04-300000107140jwa:GlobalRestructuringProgramMemberus-gaap:OperatingSegmentsMemberjwa:HeldForSaleOrSoldSegmentMember2023-05-012024-04-300000107140jwa:GlobalRestructuringProgramMemberus-gaap:OperatingSegmentsMemberjwa:HeldForSaleOrSoldSegmentMember2022-05-012023-04-300000107140jwa:GlobalRestructuringProgramMemberus-gaap:OperatingSegmentsMemberjwa:HeldForSaleOrSoldSegmentMember2025-04-300000107140us-gaap:CorporateNonSegmentMemberjwa:GlobalRestructuringProgramMember2024-05-012025-04-300000107140us-gaap:CorporateNonSegmentMemberjwa:GlobalRestructuringProgramMember2023-05-012024-04-300000107140us-gaap:CorporateNonSegmentMemberjwa:GlobalRestructuringProgramMember2022-05-012023-04-300000107140us-gaap:CorporateNonSegmentMemberjwa:GlobalRestructuringProgramMember2025-04-300000107140jwa:GlobalRestructuringProgramMember2023-05-012024-04-300000107140jwa:GlobalRestructuringProgramMember2022-05-012023-04-300000107140jwa:GlobalRestructuringProgramMember2025-04-300000107140us-gaap:EmployeeSeveranceMemberjwa:GlobalRestructuringProgramMember2024-05-012025-04-300000107140us-gaap:EmployeeSeveranceMemberjwa:GlobalRestructuringProgramMember2023-05-012024-04-300000107140us-gaap:EmployeeSeveranceMemberjwa:GlobalRestructuringProgramMember2022-05-012023-04-300000107140us-gaap:EmployeeSeveranceMemberjwa:GlobalRestructuringProgramMember2025-04-300000107140jwa:ImpairmentOfOperatingLeaseRightOfUseAssetsAndPropertyAndEquipmentMemberjwa:GlobalRestructuringProgramMember2024-05-012025-04-300000107140jwa:ImpairmentOfOperatingLeaseRightOfUseAssetsAndPropertyAndEquipmentMemberjwa:GlobalRestructuringProgramMember2023-05-012024-04-300000107140jwa:ImpairmentOfOperatingLeaseRightOfUseAssetsAndPropertyAndEquipmentMemberjwa:GlobalRestructuringProgramMember2022-05-012023-04-300000107140jwa:ImpairmentOfOperatingLeaseRightOfUseAssetsAndPropertyAndEquipmentMemberjwa:GlobalRestructuringProgramMember2025-04-300000107140jwa:AccelerationOfExpenseRelatedToOperatingLeaseRightOfUseAssetsAndPropertyAndEquipmentMemberjwa:GlobalRestructuringProgramMember2024-05-012025-04-300000107140jwa:AccelerationOfExpenseRelatedToOperatingLeaseRightOfUseAssetsAndPropertyAndEquipmentMemberjwa:GlobalRestructuringProgramMember2023-05-012024-04-300000107140jwa:AccelerationOfExpenseRelatedToOperatingLeaseRightOfUseAssetsAndPropertyAndEquipmentMemberjwa:GlobalRestructuringProgramMember2022-05-012023-04-300000107140jwa:AccelerationOfExpenseRelatedToOperatingLeaseRightOfUseAssetsAndPropertyAndEquipmentMemberjwa:GlobalRestructuringProgramMember2025-04-300000107140us-gaap:FacilityClosingMemberjwa:GlobalRestructuringProgramMember2024-05-012025-04-300000107140us-gaap:FacilityClosingMemberjwa:GlobalRestructuringProgramMember2023-05-012024-04-300000107140us-gaap:FacilityClosingMemberjwa:GlobalRestructuringProgramMember2022-05-012023-04-300000107140us-gaap:FacilityClosingMemberjwa:GlobalRestructuringProgramMember2025-04-300000107140jwa:ConsultingCostsMemberjwa:GlobalRestructuringProgramMember2024-05-012025-04-300000107140jwa:ConsultingCostsMemberjwa:GlobalRestructuringProgramMember2023-05-012024-04-300000107140jwa:ConsultingCostsMemberjwa:GlobalRestructuringProgramMember2022-05-012023-04-300000107140jwa:ConsultingCostsMemberjwa:GlobalRestructuringProgramMember2025-04-300000107140us-gaap:OtherRestructuringMemberjwa:GlobalRestructuringProgramMember2024-05-012025-04-300000107140us-gaap:OtherRestructuringMemberjwa:GlobalRestructuringProgramMember2023-05-012024-04-300000107140us-gaap:OtherRestructuringMemberjwa:GlobalRestructuringProgramMember2022-05-012023-04-300000107140us-gaap:OtherRestructuringMemberjwa:GlobalRestructuringProgramMember2025-04-300000107140jwa:GlobalRestructuringProgramMember2024-04-300000107140jwa:GlobalRestructuringProgramMember2023-04-300000107140us-gaap:EmployeeSeveranceMemberjwa:GlobalRestructuringProgramMember2024-04-300000107140jwa:ConsultingCostsMemberjwa:GlobalRestructuringProgramMember2024-04-300000107140us-gaap:OtherRestructuringMemberjwa:GlobalRestructuringProgramMember2024-04-300000107140jwa:BusinessOptimizationProgramMember2024-05-012025-04-300000107140jwa:BusinessOptimizationProgramMember2023-05-012024-04-300000107140jwa:BusinessOptimizationProgramMember2022-05-012023-04-300000107140jwa:BookCompositionCostsMember2025-04-300000107140jwa:BookCompositionCostsMember2024-04-300000107140jwa:SoftwareCostsMember2025-04-300000107140jwa:SoftwareCostsMember2024-04-300000107140jwa:ContentDevelopmentCostsMember2025-04-300000107140jwa:ContentDevelopmentCostsMember2024-04-300000107140us-gaap:SoftwareDevelopmentMember2025-04-300000107140us-gaap:SoftwareDevelopmentMember2024-04-300000107140us-gaap:ComputerEquipmentMember2025-04-300000107140us-gaap:ComputerEquipmentMember2024-04-300000107140jwa:BuildingAndLeaseholdImprovementsMember2025-04-300000107140jwa:BuildingAndLeaseholdImprovementsMember2024-04-300000107140jwa:FurnitureFixturesAndWarehouseEquipmentMember2025-04-300000107140jwa:FurnitureFixturesAndWarehouseEquipmentMember2024-04-300000107140us-gaap:LandAndLandImprovementsMember2025-04-300000107140us-gaap:LandAndLandImprovementsMember2024-04-300000107140jwa:RestructuringAndRelatedChargesMember2024-05-012025-04-300000107140us-gaap:SellingGeneralAndAdministrativeExpensesMember2023-05-012024-04-300000107140jwa:RestructuringAndRelatedChargesMember2023-05-012024-04-300000107140jwa:ResearchSegmentMember2023-04-300000107140jwa:LearningSegmentMember2023-04-300000107140us-gaap:ReportableSegmentAggregationBeforeOtherOperatingSegmentMember2023-04-300000107140jwa:HeldForSaleOrSoldSegmentMember2023-04-300000107140jwa:ResearchSegmentMember2023-05-012024-04-300000107140jwa:LearningSegmentMember2023-05-012024-04-300000107140us-gaap:ReportableSegmentAggregationBeforeOtherOperatingSegmentMember2023-05-012024-04-300000107140jwa:HeldForSaleOrSoldSegmentMember2023-05-012024-04-300000107140jwa:ResearchSegmentMember2024-04-300000107140jwa:LearningSegmentMember2024-04-300000107140us-gaap:ReportableSegmentAggregationBeforeOtherOperatingSegmentMember2024-04-300000107140jwa:HeldForSaleOrSoldSegmentMember2024-04-300000107140jwa:ResearchSegmentMember2024-05-012025-04-300000107140jwa:LearningSegmentMember2024-05-012025-04-300000107140us-gaap:ReportableSegmentAggregationBeforeOtherOperatingSegmentMember2024-05-012025-04-300000107140jwa:HeldForSaleOrSoldSegmentMember2024-05-012025-04-300000107140jwa:ResearchSegmentMember2025-04-300000107140jwa:LearningSegmentMember2025-04-300000107140us-gaap:ReportableSegmentAggregationBeforeOtherOperatingSegmentMember2025-04-300000107140jwa:HeldForSaleOrSoldSegmentMember2025-04-300000107140jwa:UniversityServicesMember2024-05-012025-04-300000107140jwa:UniversityServicesMember2025-04-300000107140jwa:CrossKnowledgeMember2024-05-012025-04-300000107140jwa:CrossKnowledgeMember2025-04-300000107140us-gaap:DisposalGroupHeldforsaleNotDiscontinuedOperationsMemberjwa:WileyEdgeMember2024-05-012025-04-300000107140us-gaap:DisposalGroupHeldforsaleNotDiscontinuedOperationsMemberjwa:WileyEdgeMember2025-04-300000107140jwa:EducationServicesMember2024-05-012025-04-300000107140jwa:UniversityServicesMember2024-05-012025-04-300000107140us-gaap:ArtisticRelatedIntangibleAssetsMember2025-04-300000107140us-gaap:ArtisticRelatedIntangibleAssetsMember2024-04-300000107140us-gaap:CustomerRelationshipsMember2025-04-300000107140us-gaap:CustomerRelationshipsMember2024-04-300000107140us-gaap:DevelopedTechnologyRightsMember2024-04-300000107140us-gaap:TrademarksAndTradeNamesMember2025-04-300000107140us-gaap:TrademarksAndTradeNamesMember2024-04-300000107140us-gaap:NoncompeteAgreementsMember2025-04-300000107140us-gaap:NoncompeteAgreementsMember2024-04-300000107140us-gaap:TrademarksAndTradeNamesMember2025-04-300000107140us-gaap:TrademarksAndTradeNamesMember2024-04-300000107140us-gaap:ArtisticRelatedIntangibleAssetsMember2025-04-300000107140us-gaap:ArtisticRelatedIntangibleAssetsMember2024-04-300000107140us-gaap:OtherNoncurrentAssetsMember2025-04-300000107140us-gaap:OtherNoncurrentAssetsMember2024-04-300000107140us-gaap:OtherNoncurrentLiabilitiesMember2025-04-300000107140us-gaap:OtherNoncurrentLiabilitiesMember2024-04-300000107140jwa:CapitalizedSoftwareMember2024-04-300000107140us-gaap:StateAndLocalJurisdictionMember2025-04-300000107140us-gaap:StateAndLocalJurisdictionMember2024-05-012025-04-300000107140us-gaap:ForeignCountryMember2025-04-300000107140us-gaap:DomesticCountryMember2025-04-300000107140us-gaap:DomesticCountryMember2024-05-012025-04-300000107140srt:MinimumMemberus-gaap:StateAndLocalJurisdictionMember2024-05-012025-04-300000107140jwa:AmendedAndRestatedRevolvingCreditAgreementMemberjwa:TermLoanAFacilityMember2025-04-300000107140jwa:AmendedAndRestatedRevolvingCreditAgreementMemberjwa:TermLoanAFacilityMember2024-04-300000107140jwa:AmendedAndRestatedRevolvingCreditAgreementMemberus-gaap:RevolvingCreditFacilityMember2025-04-300000107140jwa:AmendedAndRestatedRevolvingCreditAgreementMemberus-gaap:RevolvingCreditFacilityMember2024-04-300000107140jwa:AmendedAndRestatedRevolvingCreditAgreementMemberus-gaap:RevolvingCreditFacilityMember2022-11-302022-11-300000107140jwa:AmendedAndRestatedRevolvingCreditAgreementMemberus-gaap:RevolvingCreditFacilityMember2022-11-300000107140jwa:AmendedAndRestatedRevolvingCreditAgreementMemberjwa:TermLoanAFacilityMember2022-11-302022-11-300000107140jwa:AmendedAndRestatedRevolvingCreditAgreementMemberjwa:TermLoanAFacilityMember2022-11-300000107140jwa:AmendedAndRestatedRevolvingCreditAgreementMemberjwa:RevolvingCreditFacilityThroughMay2024Member2022-11-300000107140jwa:SyndicateBankGroupMemberjwa:AmendedAndRestatedRevolvingCreditAgreementMemberus-gaap:RevolvingCreditFacilityMemberjwa:SOFRSONIAAndEURIBORBasedRatesMembersrt:MinimumMember2022-11-302022-11-300000107140jwa:SyndicateBankGroupMemberjwa:AmendedAndRestatedRevolvingCreditAgreementMemberus-gaap:RevolvingCreditFacilityMemberjwa:SOFRSONIAAndEURIBORBasedRatesMembersrt:MaximumMember2022-11-302022-11-300000107140jwa:SyndicateBankGroupMemberjwa:AmendedAndRestatedRevolvingCreditAgreementMemberus-gaap:RevolvingCreditFacilityMemberus-gaap:BaseRateMembersrt:MinimumMember2022-11-302022-11-300000107140jwa:SyndicateBankGroupMemberjwa:AmendedAndRestatedRevolvingCreditAgreementMemberus-gaap:RevolvingCreditFacilityMemberus-gaap:BaseRateMember2022-11-302022-11-300000107140jwa:AmendedAndRestatedRevolvingCreditAgreementMemberus-gaap:RevolvingCreditFacilityMemberus-gaap:SecuredOvernightFinancingRateSofrMembersrt:MinimumMember2022-11-302022-11-300000107140jwa:AmendedAndRestatedRevolvingCreditAgreementMemberus-gaap:RevolvingCreditFacilityMemberus-gaap:SecuredOvernightFinancingRateSofrMembersrt:MaximumMember2022-11-302022-11-300000107140jwa:SyndicateBankGroupMemberjwa:AmendedAndRestatedRevolvingCreditAgreementMemberus-gaap:RevolvingCreditFacilityMemberus-gaap:FederalFundsEffectiveSwapRateMembersrt:MaximumMember2022-11-302022-11-300000107140jwa:SyndicateBankGroupMemberjwa:AmendedAndRestatedRevolvingCreditAgreementMemberus-gaap:RevolvingCreditFacilityMemberjwa:DailySecuredOvernightFinancingRateSOFRMember2022-11-302022-11-300000107140jwa:SyndicateBankGroupMemberjwa:AmendedAndRestatedRevolvingCreditAgreementMemberus-gaap:RevolvingCreditFacilityMembersrt:MinimumMember2022-11-302022-11-300000107140jwa:SyndicateBankGroupMemberjwa:AmendedAndRestatedRevolvingCreditAgreementMemberus-gaap:RevolvingCreditFacilityMembersrt:MaximumMember2022-11-302022-11-300000107140jwa:SyndicateBankGroupMemberjwa:AmendedAndRestatedRevolvingCreditAgreementMemberus-gaap:RevolvingCreditFacilityMember2022-11-300000107140jwa:AmendedAndRestatedRevolvingCreditAgreementMemberus-gaap:RevolvingCreditFacilityMember2022-11-012023-01-310000107140jwa:AmendedAndRestatedRevolvingCreditAgreementMemberjwa:RevolvingCreditFacilityThroughNovember2027Member2024-05-012025-04-300000107140jwa:AmendedAndRestatedRevolvingCreditAgreementMemberjwa:RevolvingCreditFacilityThroughMay2024Member2024-05-012025-04-300000107140jwa:AmendedAndRestatedRevolvingCreditAgreementMember2024-05-012025-04-300000107140jwa:AmendedAndRestatedRevolvingCreditAgreementMember2023-05-012024-04-300000107140jwa:AmendedAndRestatedRevolvingCreditAgreementMember2022-05-012023-04-300000107140jwa:OtherCreditFacilitiesMemberus-gaap:LineOfCreditMember2025-04-300000107140jwa:OtherCreditFacilitiesMemberus-gaap:LineOfCreditMember2024-04-300000107140us-gaap:LineOfCreditMember2025-04-300000107140us-gaap:LineOfCreditMember2024-05-012025-04-300000107140us-gaap:LineOfCreditMember2023-05-012024-04-300000107140us-gaap:LineOfCreditMember2024-04-300000107140us-gaap:InterestRateSwapMember2024-04-300000107140us-gaap:InterestRateSwapMember2025-04-300000107140us-gaap:InterestRateSwapMember2024-05-012025-04-300000107140us-gaap:InterestRateSwapMember2023-05-012024-04-300000107140us-gaap:InterestRateSwapMember2022-05-012023-04-300000107140us-gaap:InterestExpenseMemberus-gaap:InterestRateSwapMember2024-05-012025-04-300000107140us-gaap:InterestExpenseMemberus-gaap:InterestRateSwapMember2023-05-012024-04-300000107140us-gaap:InterestExpenseMemberus-gaap:InterestRateSwapMember2022-05-012023-04-300000107140srt:MinimumMember2024-05-012025-04-300000107140srt:MaximumMember2024-05-012025-04-300000107140us-gaap:SupplementalEmployeeRetirementPlanDefinedBenefitMember2024-05-012025-04-300000107140country:US2024-05-012025-04-300000107140jwa:CanadaUKMember2024-05-012025-04-300000107140country:US2023-05-012024-04-300000107140jwa:CanadaUKMember2023-05-012024-04-300000107140country:US2022-05-012023-04-300000107140jwa:CanadaUKMember2022-05-012023-04-300000107140jwa:RetirementIndemnityPlanMember2022-05-012023-04-300000107140jwa:RussiaPensionPlanMembercountry:RUsrt:MaximumMember2022-05-012023-04-300000107140country:US2024-04-300000107140jwa:CanadaUKMember2024-04-300000107140country:US2023-04-300000107140jwa:CanadaUKMember2023-04-300000107140country:US2025-04-300000107140jwa:CanadaUKMember2025-04-300000107140us-gaap:DefinedBenefitPlanEquitySecuritiesMember2025-04-300000107140jwa:FixedIncomeSecuritiesAndCashMember2025-04-300000107140us-gaap:FairValueInputsLevel1Membercountry:USjwa:DefinedBenefitPlanEquitySecuritiesNonUSLimitedPartnershipMember2025-04-300000107140us-gaap:FairValueInputsLevel2Membercountry:USjwa:DefinedBenefitPlanEquitySecuritiesNonUSLimitedPartnershipMember2025-04-300000107140us-gaap:FairValueMeasuredAtNetAssetValuePerShareMembercountry:USjwa:DefinedBenefitPlanEquitySecuritiesNonUSLimitedPartnershipMember2025-04-300000107140country:USjwa:DefinedBenefitPlanEquitySecuritiesNonUSLimitedPartnershipMember2025-04-300000107140us-gaap:FairValueInputsLevel1Membercountry:USjwa:DefinedBenefitPlanEquitySecuritiesNonUSLimitedPartnershipMember2024-04-300000107140us-gaap:FairValueInputsLevel2Membercountry:USjwa:DefinedBenefitPlanEquitySecuritiesNonUSLimitedPartnershipMember2024-04-300000107140us-gaap:FairValueMeasuredAtNetAssetValuePerShareMembercountry:USjwa:DefinedBenefitPlanEquitySecuritiesNonUSLimitedPartnershipMember2024-04-300000107140country:USjwa:DefinedBenefitPlanEquitySecuritiesNonUSLimitedPartnershipMember2024-04-300000107140us-gaap:FairValueMeasuredAtNetAssetValuePerShareMembercountry:USus-gaap:FixedIncomeFundsMember2025-04-300000107140country:USus-gaap:FixedIncomeFundsMember2025-04-300000107140us-gaap:FairValueMeasuredAtNetAssetValuePerShareMembercountry:USus-gaap:FixedIncomeFundsMember2024-04-300000107140country:USus-gaap:FixedIncomeFundsMember2024-04-300000107140us-gaap:FairValueInputsLevel1Membercountry:US2025-04-300000107140us-gaap:FairValueInputsLevel2Membercountry:US2025-04-300000107140us-gaap:FairValueMeasuredAtNetAssetValuePerShareMembercountry:US2025-04-300000107140us-gaap:FairValueInputsLevel1Membercountry:US2024-04-300000107140us-gaap:FairValueInputsLevel2Membercountry:US2024-04-300000107140us-gaap:FairValueMeasuredAtNetAssetValuePerShareMembercountry:US2024-04-300000107140us-gaap:FairValueInputsLevel1Memberjwa:CanadaUKMemberus-gaap:DefinedBenefitPlanEquitySecuritiesUsMember2025-04-300000107140us-gaap:FairValueInputsLevel2Memberjwa:CanadaUKMemberus-gaap:DefinedBenefitPlanEquitySecuritiesUsMember2025-04-300000107140jwa:CanadaUKMemberus-gaap:DefinedBenefitPlanEquitySecuritiesUsMember2025-04-300000107140us-gaap:FairValueInputsLevel1Memberjwa:CanadaUKMemberus-gaap:DefinedBenefitPlanEquitySecuritiesUsMember2024-04-300000107140us-gaap:FairValueInputsLevel2Memberjwa:CanadaUKMemberus-gaap:DefinedBenefitPlanEquitySecuritiesUsMember2024-04-300000107140jwa:CanadaUKMemberus-gaap:DefinedBenefitPlanEquitySecuritiesUsMember2024-04-300000107140us-gaap:FairValueInputsLevel1Memberjwa:CanadaUKMemberus-gaap:DefinedBenefitPlanEquitySecuritiesNonUsMember2025-04-300000107140us-gaap:FairValueInputsLevel2Memberjwa:CanadaUKMemberus-gaap:DefinedBenefitPlanEquitySecuritiesNonUsMember2025-04-300000107140jwa:CanadaUKMemberus-gaap:DefinedBenefitPlanEquitySecuritiesNonUsMember2025-04-300000107140us-gaap:FairValueInputsLevel1Memberjwa:CanadaUKMemberus-gaap:DefinedBenefitPlanEquitySecuritiesNonUsMember2024-04-300000107140us-gaap:FairValueInputsLevel2Memberjwa:CanadaUKMemberus-gaap:DefinedBenefitPlanEquitySecuritiesNonUsMember2024-04-300000107140jwa:CanadaUKMemberus-gaap:DefinedBenefitPlanEquitySecuritiesNonUsMember2024-04-300000107140us-gaap:FairValueInputsLevel1Memberjwa:CanadaUKMemberjwa:BalancedManagedFundsMember2025-04-300000107140us-gaap:FairValueInputsLevel2Memberjwa:CanadaUKMemberjwa:BalancedManagedFundsMember2025-04-300000107140jwa:CanadaUKMemberjwa:BalancedManagedFundsMember2025-04-300000107140us-gaap:FairValueInputsLevel1Memberjwa:CanadaUKMemberjwa:BalancedManagedFundsMember2024-04-300000107140us-gaap:FairValueInputsLevel2Memberjwa:CanadaUKMemberjwa:BalancedManagedFundsMember2024-04-300000107140jwa:CanadaUKMemberjwa:BalancedManagedFundsMember2024-04-300000107140us-gaap:FairValueInputsLevel1Memberjwa:CanadaUKMemberus-gaap:FixedIncomeFundsMember2025-04-300000107140us-gaap:FairValueInputsLevel2Memberjwa:CanadaUKMemberus-gaap:FixedIncomeFundsMember2025-04-300000107140jwa:CanadaUKMemberus-gaap:FixedIncomeFundsMember2025-04-300000107140us-gaap:FairValueInputsLevel1Memberjwa:CanadaUKMemberus-gaap:FixedIncomeFundsMember2024-04-300000107140us-gaap:FairValueInputsLevel2Memberjwa:CanadaUKMemberus-gaap:FixedIncomeFundsMember2024-04-300000107140jwa:CanadaUKMemberus-gaap:FixedIncomeFundsMember2024-04-300000107140us-gaap:FairValueInputsLevel1Memberjwa:CanadaUKMemberus-gaap:DefinedBenefitPlanRealEstateMember2025-04-300000107140us-gaap:FairValueInputsLevel2Memberjwa:CanadaUKMemberus-gaap:DefinedBenefitPlanRealEstateMember2025-04-300000107140jwa:CanadaUKMemberus-gaap:DefinedBenefitPlanRealEstateMember2025-04-300000107140us-gaap:FairValueInputsLevel1Memberjwa:CanadaUKMemberus-gaap:DefinedBenefitPlanRealEstateMember2024-04-300000107140us-gaap:FairValueInputsLevel2Memberjwa:CanadaUKMemberus-gaap:DefinedBenefitPlanRealEstateMember2024-04-300000107140jwa:CanadaUKMemberus-gaap:DefinedBenefitPlanRealEstateMember2024-04-300000107140us-gaap:FairValueInputsLevel1Memberjwa:CanadaUKMemberus-gaap:DefinedBenefitPlanCashAndCashEquivalentsMember2025-04-300000107140us-gaap:FairValueInputsLevel2Memberjwa:CanadaUKMemberus-gaap:DefinedBenefitPlanCashAndCashEquivalentsMember2025-04-300000107140jwa:CanadaUKMemberus-gaap:DefinedBenefitPlanCashAndCashEquivalentsMember2025-04-300000107140us-gaap:FairValueInputsLevel1Memberjwa:CanadaUKMemberus-gaap:DefinedBenefitPlanCashAndCashEquivalentsMember2024-04-300000107140us-gaap:FairValueInputsLevel2Memberjwa:CanadaUKMemberus-gaap:DefinedBenefitPlanCashAndCashEquivalentsMember2024-04-300000107140jwa:CanadaUKMemberus-gaap:DefinedBenefitPlanCashAndCashEquivalentsMember2024-04-300000107140us-gaap:FairValueInputsLevel1Memberjwa:CanadaUKMember2025-04-300000107140us-gaap:FairValueInputsLevel2Memberjwa:CanadaUKMember2025-04-300000107140us-gaap:FairValueMeasuredAtNetAssetValuePerShareMemberjwa:CanadaUKMember2025-04-300000107140us-gaap:FairValueInputsLevel1Memberjwa:CanadaUKMember2024-04-300000107140us-gaap:FairValueInputsLevel2Memberjwa:CanadaUKMember2024-04-300000107140us-gaap:FairValueMeasuredAtNetAssetValuePerShareMemberjwa:CanadaUKMember2024-04-300000107140us-gaap:FairValueInputsLevel1Member2025-04-300000107140us-gaap:FairValueInputsLevel2Member2025-04-300000107140us-gaap:FairValueMeasuredAtNetAssetValuePerShareMember2025-04-300000107140us-gaap:FairValueInputsLevel1Member2024-04-300000107140us-gaap:FairValueInputsLevel2Member2024-04-300000107140us-gaap:FairValueMeasuredAtNetAssetValuePerShareMember2024-04-300000107140us-gaap:ForeignPlanMembersrt:MinimumMember2025-04-300000107140us-gaap:OtherPostretirementBenefitPlansDefinedBenefitMember2024-04-300000107140us-gaap:OtherPostretirementBenefitPlansDefinedBenefitMember2025-04-300000107140us-gaap:OtherPostretirementBenefitPlansDefinedBenefitMember2023-05-012024-04-300000107140us-gaap:OtherPostretirementBenefitPlansDefinedBenefitMember2022-05-012023-04-300000107140us-gaap:OtherPostretirementBenefitPlansDefinedBenefitMember2024-05-012025-04-300000107140jwa:KeyEmployeeStockPlan2014Memberus-gaap:CommonClassAMember2025-04-300000107140us-gaap:EmployeeStockOptionMembersrt:MinimumMember2025-04-300000107140us-gaap:EmployeeStockOptionMembersrt:MaximumMember2024-05-012025-04-300000107140us-gaap:EmployeeStockOptionMemberus-gaap:ShareBasedCompensationAwardTrancheOneMember2024-05-012025-04-300000107140us-gaap:EmployeeStockOptionMemberus-gaap:ShareBasedCompensationAwardTrancheTwoMember2024-05-012025-04-300000107140us-gaap:EmployeeStockOptionMemberus-gaap:ShareBasedCompensationAwardTrancheThreeMember2024-05-012025-04-300000107140us-gaap:EmployeeStockOptionMemberjwa:ShareBasedCompensationAwardTrancheFourMember2024-05-012025-04-300000107140us-gaap:EmployeeStockOptionMember2023-05-012024-04-300000107140us-gaap:EmployeeStockOptionMember2022-05-012023-04-300000107140us-gaap:EmployeeStockOptionMember2024-04-300000107140us-gaap:EmployeeStockOptionMember2023-04-300000107140us-gaap:EmployeeStockOptionMember2025-04-300000107140us-gaap:EmployeeStockOptionMember2024-05-012025-04-300000107140jwa:ExercisePriceRange2Member2024-05-012025-04-300000107140jwa:ExercisePriceRange2Member2025-04-300000107140jwa:ExercisePriceRange3Member2024-05-012025-04-300000107140jwa:ExercisePriceRange3Member2025-04-300000107140us-gaap:PerformanceSharesMemberjwa:ShareBasedCompensationAwardTrancheThirteenMemberjwa:KeyEmployeesMember2024-05-012025-04-300000107140us-gaap:RestrictedStockMemberjwa:ShareBasedCompensationAwardTrancheEightMemberjwa:KeyEmployeesMember2024-05-012025-04-300000107140us-gaap:RestrictedStockMember2024-04-300000107140us-gaap:RestrictedStockMember2023-04-300000107140us-gaap:RestrictedStockMember2022-04-300000107140us-gaap:RestrictedStockMember2024-05-012025-04-300000107140us-gaap:RestrictedStockMember2023-05-012024-04-300000107140us-gaap:RestrictedStockMember2022-05-012023-04-300000107140us-gaap:RestrictedStockMember2025-04-3000001071402024-07-080000107140us-gaap:PerformanceSharesMember2024-07-080000107140us-gaap:RestrictedStockUnitsRSUMember2024-07-080000107140us-gaap:RestrictedStockUnitsRSUMember2024-07-082024-07-080000107140us-gaap:RestrictedStockUnitsRSUMemberus-gaap:ShareBasedCompensationAwardTrancheOneMember2024-07-082024-07-080000107140us-gaap:RestrictedStockUnitsRSUMemberus-gaap:ShareBasedCompensationAwardTrancheThreeMember2024-07-082024-07-080000107140us-gaap:RestrictedStockUnitsRSUMemberjwa:ShareBasedCompensationAwardTrancheFourMember2024-07-082024-07-080000107140us-gaap:RestrictedStockUnitsRSUMemberus-gaap:ShareBasedCompensationAwardTrancheTwoMember2024-07-082024-07-080000107140us-gaap:PerformanceSharesMember2024-07-082024-07-080000107140jwa:DirectorStockPlanMembersrt:DirectorMemberus-gaap:CommonClassAMember2024-05-012025-04-300000107140jwa:DirectorStockPlanMembersrt:DirectorMemberus-gaap:CommonClassAMember2023-05-012024-04-300000107140jwa:DirectorStockPlanMembersrt:DirectorMemberus-gaap:CommonClassAMember2022-05-012023-04-300000107140jwa:ShareRepurchaseProgramIn2020Member2020-04-300000107140jwa:ShareRepurchaseProgramIn2020Member2025-04-300000107140us-gaap:CommonClassAMember2023-04-300000107140us-gaap:CommonClassAMember2022-04-300000107140us-gaap:CommonClassBMember2023-04-300000107140us-gaap:CommonClassBMember2022-04-300000107140us-gaap:OperatingSegmentsMember2024-05-012025-04-300000107140us-gaap:OperatingSegmentsMember2023-05-012024-04-300000107140us-gaap:OperatingSegmentsMember2022-05-012023-04-3000001071402022-11-012023-01-3100001071402022-05-012022-07-310000107140us-gaap:CorporateNonSegmentMember2024-05-012025-04-300000107140us-gaap:CorporateNonSegmentMember2023-05-012024-04-300000107140us-gaap:CorporateNonSegmentMember2022-05-012023-04-300000107140country:US2024-05-012025-04-300000107140country:US2023-05-012024-04-300000107140country:US2022-05-012023-04-300000107140country:CN2024-05-012025-04-300000107140country:CN2023-05-012024-04-300000107140country:CN2022-05-012023-04-300000107140country:GB2024-05-012025-04-300000107140country:GB2023-05-012024-04-300000107140country:GB2022-05-012023-04-300000107140country:JP2024-05-012025-04-300000107140country:JP2023-05-012024-04-300000107140country:JP2022-05-012023-04-300000107140country:AU2024-05-012025-04-300000107140country:AU2023-05-012024-04-300000107140country:AU2022-05-012023-04-300000107140jwa:OtherCountriesMember2024-05-012025-04-300000107140jwa:OtherCountriesMember2023-05-012024-04-300000107140jwa:OtherCountriesMember2022-05-012023-04-300000107140country:US2025-04-300000107140country:US2024-04-300000107140country:US2023-04-300000107140country:GB2025-04-300000107140country:GB2024-04-300000107140country:GB2023-04-300000107140jwa:OtherCountriesMember2025-04-300000107140jwa:OtherCountriesMember2024-04-300000107140jwa:OtherCountriesMember2023-04-3000001071402025-02-012025-04-300000107140us-gaap:SalesReturnsAndAllowancesMember2024-04-300000107140us-gaap:SalesReturnsAndAllowancesMember2024-05-012025-04-300000107140us-gaap:SalesReturnsAndAllowancesMember2025-04-300000107140us-gaap:AllowanceForCreditLossMember2024-04-300000107140us-gaap:AllowanceForCreditLossMember2024-05-012025-04-300000107140us-gaap:AllowanceForCreditLossMember2025-04-300000107140us-gaap:InventoryValuationReserveMember2024-04-300000107140us-gaap:InventoryValuationReserveMember2024-05-012025-04-300000107140us-gaap:InventoryValuationReserveMember2025-04-300000107140us-gaap:ValuationAllowanceOfDeferredTaxAssetsMember2024-04-300000107140us-gaap:ValuationAllowanceOfDeferredTaxAssetsMember2024-05-012025-04-300000107140us-gaap:ValuationAllowanceOfDeferredTaxAssetsMember2025-04-300000107140us-gaap:SalesReturnsAndAllowancesMember2023-04-300000107140us-gaap:SalesReturnsAndAllowancesMember2023-05-012024-04-300000107140us-gaap:AllowanceForCreditLossMember2023-04-300000107140us-gaap:AllowanceForCreditLossMember2023-05-012024-04-300000107140us-gaap:InventoryValuationReserveMember2023-04-300000107140us-gaap:InventoryValuationReserveMember2023-05-012024-04-300000107140us-gaap:ValuationAllowanceOfDeferredTaxAssetsMember2023-04-300000107140us-gaap:ValuationAllowanceOfDeferredTaxAssetsMember2023-05-012024-04-300000107140us-gaap:SalesReturnsAndAllowancesMember2022-04-300000107140us-gaap:SalesReturnsAndAllowancesMember2022-05-012023-04-300000107140us-gaap:AllowanceForCreditLossMember2022-04-300000107140us-gaap:AllowanceForCreditLossMember2022-05-012023-04-300000107140us-gaap:InventoryValuationReserveMember2022-04-300000107140us-gaap:InventoryValuationReserveMember2022-05-012023-04-300000107140us-gaap:ValuationAllowanceOfDeferredTaxAssetsMember2022-04-300000107140us-gaap:ValuationAllowanceOfDeferredTaxAssetsMember2022-05-012023-04-30
UNITED STATES
SECURITIES AND EXCHANGE COMMISSION
Washington, DC 20549
FORM 10-K
(Mark One)
|
|
|
|
|
|
| x |
ANNUAL REPORT PURSUANT TO SECTION 13 OR 15(d) OF THE SECURITIES EXCHANGE ACT OF 1934 |
For the fiscal year ended: April 30, 2025
OR
|
|
|
|
|
|
| o |
TRANSITION REPORT PURSUANT TO SECTION 13 OR 15(d) OF THE SECURITIES EXCHANGE ACT OF 1934 |
For the transition period from _________ to _________
Commission file number 001-11507
JOHN WILEY & SONS, INC.
(Exact name of Registrant as specified in its charter)
|
|
|
|
|
|
|
|
|
| New York |
|
13-5593032 |
| State or other jurisdiction of incorporation or organization |
|
I.R.S. Employer Identification No. |
|
|
|
111 River Street, Hoboken, NJ |
|
07030 |
| Address of principal executive offices |
|
Zip Code |
|
|
|
(201) 748-6000 |
| Registrant’s telephone number including area code |
|
|
|
|
|
|
|
|
|
Securities registered pursuant to Section 12(b) of the Act:
Title of each class |
Trading Symbol |
Name of each exchange on which registered |
| Class A Common Stock, par value $1.00 per share |
WLY |
New York Stock Exchange |
| Class B Common Stock, par value $1.00 per share |
WLYB |
New York Stock Exchange |
|
|
|
|
|
|
|
|
|
|
Securities registered pursuant to Section 12(g) of the Act: |
|
|
None |
|
Indicate by check mark if the registrant is a well-known seasoned issuer, as defined in Rule 405 of the Securities Act. Yes x No o
Indicate by check mark if the registrant is not required to file reports pursuant to Section 13 or Section 15(d) of the Act.
Yes o No x
Indicate by check mark whether the registrant (1) has filed all reports required to be filed by Section 13 or 15(d) of the Securities Exchange Act of 1934 during the preceding 12 months (or for such shorter period that the registrant was required to file such reports), and (2) has been subject to such filing requirements for the past 90 days. Yes x No o
Indicate by check mark whether the registrant has submitted electronically every Interactive Data File required to be submitted pursuant to Rule 405 of Regulation S-T (§232.405 of this chapter) during the preceding 12 months (or for such shorter period that the registrant was required to submit such files). Yes x No o
Indicate by check mark whether the registrant is a large accelerated filer, an accelerated filer, a non-accelerated filer, a smaller reporting company, or an emerging growth company. See the definitions of “large accelerated filer,” “accelerated filer,” “smaller reporting company,” and “emerging growth company” in Rule 12b-2 of the Exchange Act.
|
|
|
|
|
|
Large accelerated filer x |
Accelerated filer o |
Non-accelerated filer o |
Smaller reporting company o |
|
Emerging growth company o |
If an emerging growth company, indicate by check mark if the registrant has elected not to use the extended transition period for complying with any new or revised financial accounting standards provided pursuant to Section 13(a) of the Exchange Act. o
Indicate by check mark whether the registrant has filed a report on and attestation to its management’s assessment of the effectiveness of its internal control over financial reporting under Section 404(b) of the Sarbanes-Oxley Act (15 U.S.C. 7262(b)) by the registered public accounting firm that prepared or issued its audit report. x
If securities are registered pursuant to Section 12(b) of the Act, indicate by check mark whether the financial statements of the registrant included in the filing reflect the correction of an error to previously issued financial statements. o
Indicate by check mark whether any of those error corrections are restatements that required a recovery analysis of incentive-based compensation received by any of the registrant’s executive officers during the relevant recovery period pursuant to §240.10D-1(b). o
Indicate by check mark whether the registrant is a shell company (as defined in Rule 12b-2 of the Act). Yes o No x
The aggregate market value of the voting stock held by non-affiliates of the registrant, computed by reference to the closing price as of the last business day of the registrant’s most recently completed second fiscal quarter, October 31, 2024, was approximately $2,055 million. The registrant has no non-voting common stock.
The number of shares outstanding of the registrant’s Class A and Class B Common Stock as of May 31, 2025 was 44,624,949 and 8,768,531 respectively.
DOCUMENTS INCORPORATED BY REFERENCE
Portions of the registrant’s definitive proxy statement for use in connection with its annual meeting of stockholders scheduled to be held on September 25, 2025, are incorporated by reference into Part III of this Annual Report on Form 10-K.
JOHN WILEY & SONS, INC. AND SUBSIDIARIES
FORM 10-K
FOR THE FISCAL YEAR ENDED APRIL 30, 2025
INDEX
Cautionary Notice Regarding Forward-Looking Statements “Safe Harbor” Statement under the Private Securities Litigation Reform Act of 1995:
This report contains “forward-looking statements” within the meaning of the safe harbor provisions of the Private Securities Litigation Reform Act of 1995 concerning our business, consolidated financial condition, and results of operations. The Securities and Exchange Commission (SEC) encourages companies to disclose forward-looking information so that investors can better understand a company’s prospects and make informed investment decisions. Forward-looking statements are subject to risks and uncertainties, many of which are outside our control, which could cause actual results to differ materially from these statements. Therefore, you should not rely on any of these forward-looking statements. Forward-looking statements can be identified by such words as “anticipates,” “believes,” “plan,” “assumes,” “could,” “should,” “estimates,” “expects,” “intends,” “potential,” “seek,” “predict,” “may,” “will,” and similar references to future periods. All statements other than statements of historical facts included in this report regarding our strategies, prospects, financial condition, operations, costs, plans, and objectives are forward-looking statements. Examples of forward-looking statements include, among others, anticipated restructuring charges and savings, operations, performance, and financial condition. Reliance should not be placed on forward-looking statements, as actual results may differ materially from those described in any forward-looking statements. Any such forward-looking statements are based upon many assumptions and estimates that are inherently subject to uncertainties and contingencies, many of which are beyond our control, and are subject to change based on many important factors. Such factors include, but are not limited to (i) the level of investment by Wiley in new technologies and products; (ii) subscriber renewal rates for our journals; (iii) the financial stability and liquidity of journal subscription agents; (iv) the consolidation of book wholesalers and retail accounts; (v) the market position and financial stability of key retailers; (vi) the seasonal nature of our educational business and the impact of the used book market; (vii) worldwide economic and political conditions; (viii) our ability to protect our copyrights and other intellectual property worldwide; (ix) our ability to successfully integrate acquired operations and realize expected opportunities; (x) the ability to realize operating savings over time and in fiscal year 2026 in connection with our multiyear Global Restructuring Program and completed dispositions; (xi) cyber risk and the failure to maintain the integrity of our operational or security systems or infrastructure, or those of third parties with which we do business; (xii) as a result of acquisitions, we have and may record a significant amount of goodwill and other identifiable intangible assets and we may never realize the full carrying value of these assets; (xiii) our ability to leverage artificial intelligence technologies in our products and services, including generative artificial intelligence, large language models, machine learning, and other artificial intelligence tools; and (xiv) other factors detailed from time to time in our filings with the SEC. We undertake no obligation to update or revise any such forward-looking statements to reflect subsequent events or circumstances.
Please refer to Part I, Item 1A, “Risk Factors,” of our Annual Report on Form 10-K for important factors that we believe could cause actual results to differ materially from those in our forward-looking statements. Any forward-looking statement made by us in this report is based only on information currently available to us and speaks only as of the date on which it is made. We undertake no obligation to publicly update any forward-looking statement, whether written or oral, that may be made from time to time, whether as a result of new information, future developments or otherwise.
Non-GAAP Financial Measures:
We present financial information that conforms to Generally Accepted Accounting Principles in the United States of America (US GAAP). We also present financial information that does not conform to US GAAP, which we refer to as non-GAAP.
In this report, we may present the following non-GAAP performance measures:
•Adjusted Earnings Per Share (Adjusted EPS);
•Free Cash Flow less Product Development Spending;
•Adjusted Revenue;
•Adjusted Operating Income and margin;
•Adjusted Income Before Taxes;
•Adjusted Income Tax Provision;
•Adjusted Effective Tax Rate;
•EBITDA (earnings before interest, taxes, depreciation and amortization), Adjusted EBITDA and margin;
•Organic revenue; and
•Results on a constant currency basis.
Management uses these non-GAAP performance measures as supplemental indicators of our operating performance and financial position as well as for internal reporting and forecasting purposes, when publicly providing our outlook, to evaluate our performance and calculate incentive compensation. We present these non-GAAP performance measures in addition to US GAAP financial results because we believe that these non-GAAP performance measures provide useful information to certain investors and financial analysts for operational trends and comparisons over time. The use of these non-GAAP performance measures may also provide a consistent basis to evaluate operating profitability and performance trends by excluding items that we do not consider to be controllable activities for this purpose.
The performance metric used by our chief operating decision maker to evaluate performance of our reportable segments is Adjusted Operating Income. We present both Adjusted Operating Income and Adjusted EBITDA for each of our reportable segments as we believe Adjusted EBITDA provides additional useful information to certain investors and financial analysts for operational trends and comparisons over time. It removes the impact of depreciation and amortization expense, as well as presents a consistent basis to evaluate operating profitability and compare our financial performance to that of our peer companies and competitors.
For example:
•Adjusted EPS, Adjusted Revenue, Adjusted Operating Income, Adjusted Income Before Taxes, Adjusted Income Tax Provision, Adjusted Effective Tax Rate, Adjusted EBITDA, and organic revenue (excluding acquisitions) provide a more comparable basis to analyze operating results and earnings and are measures commonly used by shareholders to measure our performance.
•Free Cash Flow less Product Development Spending helps assess our ability, over the long term, to create value for our shareholders as it represents cash available to repay debt, pay common stock dividends, and fund share repurchases and acquisitions.
•Results on a constant currency basis remove distortion from the effects of foreign currency movements to provide better comparability of our business trends from period to period. We measure our performance excluding the impact of foreign currency (or at constant currency), which means that we apply the same foreign currency exchange rates for the current and equivalent prior period.
In addition, we have historically provided these or similar non-GAAP performance measures and understand that some investors and financial analysts find this information helpful in analyzing our operating margins and net income, and in comparing our financial performance to that of our peer companies and competitors. Based on interactions with investors, we also believe that our non-GAAP performance measures are regarded as useful to our investors as supplemental to our US GAAP financial results, and that there is no confusion regarding the adjustments or our operating performance to our investors due to the comprehensive nature of our disclosures.
Non-GAAP performance measures do not have standardized meanings prescribed by US GAAP and therefore may not be comparable to the calculation of similar measures used by other companies and should not be viewed as alternatives to measures of financial results under US GAAP. The adjusted metrics have limitations as analytical tools, and should not be considered in isolation from, or as a substitute for, US GAAP information. It does not purport to represent any similarly titled US GAAP information and is not an indicator of our performance under US GAAP. Non-GAAP financial metrics that we present may not be comparable with similarly titled measures used by others. Investors are cautioned against placing undue reliance on these non-GAAP measures.
PART I
Item 1. Business
The Company, founded in 1807, was incorporated in the state of New York on January 15, 1904. Throughout this report, when we refer to “Wiley,” the “Company,” “we,” “our,” or “us,” we are referring to John Wiley & Sons, Inc. and all of our subsidiaries, except where the context indicates otherwise.
Please refer to Part II, Item 8, “Financial Statements and Supplementary Data,” for financial information about the Company and its subsidiaries, which is incorporated herein by reference. Also, when we cross reference to a “Note,” we are referring to our “Notes to Consolidated Financial Statements,” in Part II, Item 8, “Financial Statements and Supplementary Data” unless the context indicates otherwise.
Wiley is one of the world’s largest publishers and a global leader in research and learning. The Company's content, services, platforms, and knowledge networks are tailored to meet the evolving needs of its customers and partners, including researchers, students, instructors, professionals, institutions, and corporations. Wiley is a predominantly digital company with 83% of its Adjusted Revenue for fiscal year 2025 generated by digital products and services. For fiscal year 2025, 48% of Adjusted Revenue is recurring which includes revenue that is contractually obligated or set to recur with a high degree of certainty. See Part II, Item 7, “Management’s Discussion and Analysis of Financial Condition and Results of Operations” in the section “Consolidated Results of Operations” of this Annual Report on Form 10-K for the reconciliation of consolidated Revenue to Adjusted Revenue.
We report financial information for the following reportable segments, as well as a Corporate category, which includes certain costs that are not allocated to the reportable segments:
•Research includes the reporting lines of Research Publishing and Research Solutions;
•Learning includes the Academic and Professional reporting lines and consists of publishing, courseware, and assessments.
Wiley also reports a Held for Sale or Sold segment, which primarily includes non-core businesses which were classified as held-for-sale until the date of sale, as well other businesses which were sold as described further below.
Our operations are primarily located in the United States (US) and the United Kingdom (UK), with smaller offices in Sri Lanka, Germany, and India. In the year ended April 30, 2025, approximately 49% of our consolidated revenue was from outside the US.
Wiley’s business strategies are tightly aligned with consistent long-term growth trends, including ever-increasing global research and development (R&D) investment, leading to growth in scientific research output and the number of institutions and researchers worldwide. These strategies include expanding our publishing program and journal portfolio to meet the global demand for peer-reviewed research, driving additional value in our subscription-based models for universities and corporations, volume-based models for open access, content licensing opportunities for applications in science and innovation, and content platform and service offerings for corporations and societies. Learning strategies include selectively scaling high-value digital content, courseware, and assessments to meet targeted opportunities in education and professional development.
Business Segments
Research:
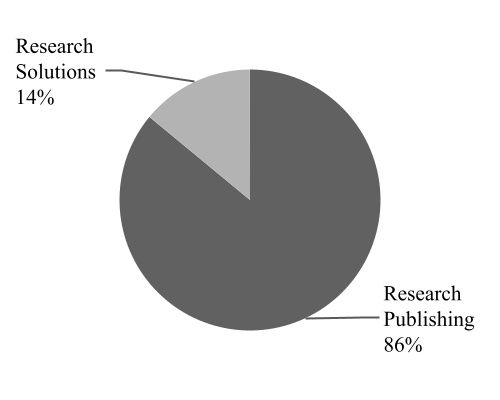
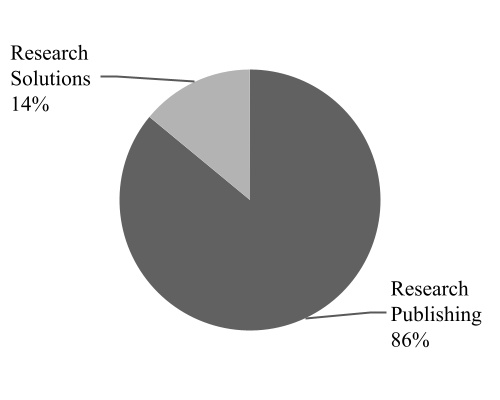
Research’s mission is to support researchers, professionals, and learners in the discovery and use of research knowledge to help them achieve their goals. Research provides over 1,800 scientific, technical, medical, and scholarly journals, as well as related content and services in areas of physical sciences and engineering, health sciences, social sciences and humanities, and life sciences. Research customers include academic, corporate, government, and public libraries, funders of research, researchers, scientists, clinicians, engineers and technologists, scholarly and professional societies, and students and professors. Research products are sold and distributed globally through multiple channels, including direct to research libraries and library consortia via multi-year agreements, through independent subscription agents, and direct to researchers and professional society members, and other customers. For fiscal year 2025, approximately 96% of Research revenue is generated by digital and online products, and services. Publishing centers include Australia, China, Germany, India, the UK, and the US. Research revenue accounted for approximately 64% of our consolidated revenue in the year ended April 30, 2025, with a 32.1% Adjusted EBITDA margin. See Part II, Item 7, “Management’s Discussion and Analysis of Financial Condition and Results of Operations” in the section “Segment Operating Results” of this Annual Report on Form 10-K for further details and for the reconciliation of Adjusted Operating Income to Adjusted EBITDA.
Research revenue by product type includes Research Publishing and Research Solutions. The graphs below present revenue by product type for the years ended April 30, 2025 and 2024:
Key growth strategies for the Research segment include publishing more peer-reviewed research and expanding our journal portfolio, thereby increasing the value of our Journal Subscriptions (pay to read) and Transformational Agreements (pay to read and publish), developing new open access journals and volume-based revenue streams (pay to publish), focusing on high-growth and emerging research markets, licensing our content for innovation in the corporate R&D value chain, and developing new digital products and information services to meet the needs of researchers, authors, societies, and corporate customers.
Research Publishing
Research Publishing generates the majority of its revenue from contracts with its customers in the following revenue streams:
•Journal Subscriptions (pay to read) and Transformational Agreements (pay to read and publish) under multi-year arrangements
•Open Access (pay to publish)
•Licensing and ancillary products
Journal Subscriptions and Transformational Agreements
As of April 30, 2025, we publish over 1,800 academic research journals. We sell Journal Subscriptions directly to thousands of research institutions worldwide through our sales representatives, indirectly through independent subscription agents, through marketing campaigns, and through memberships in professional societies for those journals that are sponsored by societies. Journal Subscriptions are primarily licensed through contracts for digital content available online through our Wiley Online Library platform. Contracts are negotiated by us directly with customers or their subscription agents. Subscription periods typically cover calendar years. Payment for subscription revenue is generally collected in advance.
Transformational Agreements (read and publish) are a subscription-based model that blends Journal Subscriptions and Open Access offerings. For a single fee, a national or regional consortium of libraries pays for in advance and receives full read access to our journal portfolio and the ability to publish under an open access arrangement (articles made freely available and authors maintain copyright). Like Journal Subscriptions, Transformational Agreements involve recurring revenue under multi-year arrangements.
Long-term publishing alliances play a major role in Research Publishing’s success. Approximately 46% of Journal Subscriptions revenue is derived from publication rights that are owned by professional societies and other publishing partners such as research institutions or foundations, and are published by us pursuant to long-term contracts or owned jointly with such entities. These alliances, with many of them being decades-long in duration, bring mutual benefit: The partners gain Wiley’s publishing, marketing, sales, and distribution expertise, while Wiley benefits from being affiliated with prestigious organizations and their members. Societies that sponsor or own such journals generally receive a royalty and/or other financial consideration. We may procure editorial services from such societies on a prenegotiated fee basis. We also enter into agreements with outside independent editors of journals that define their editorial duties and the fees and expenses for their services. Contributors of articles to our journal portfolio transfer publication rights to us or a professional society, as applicable. We publish the journals of many prestigious societies, including the American Cancer Society, the American Heart Association, the American Anthropological Association, the American Geophysical Union, and the German Chemical Society.
Wiley Online Library, our digital content platform for researchers, provides the user with intuitive navigation, enhanced discoverability, expanded functionality, and a range of personalization options. Access to abstracts is free and full content is accessible through licensing agreements or as individual article purchases. Our online publishing platforms provide revenue growth opportunities through new applications and business models, online advertising, deeper market penetration, and individual sales and pay-per-view options. Also note that portions of our content are provided free or at nominal cost to developing nations through partnerships with certain nonprofit organizations.
The annual Clarivate Analytics’ Journal Citation Reports (JCR) are one of the most widely used sources of citation metrics used to analyze the performance of peer-reviewed journals. The most prominent of these metrics, the Impact Factor, is based on the frequency with which an average article is cited in the JCR report year. Alongside other metrics, this makes it an important tool for evaluating a journal’s impact on ongoing research.
Wiley’s performance in the 2024 release of the JCR remains strong, maintaining its top 3 position in terms of citations received. Wiley has 8% of titles, 8% of articles, and 10% of citations.
A total of 1,728 Wiley journals were included in the reports. Wiley journals ranked #1 in 17 categories across 17 of its titles and achieved 265 top-10 category rankings.
Open Access
Under the Open Access business model, accepted research articles are published subject to upfront payment of article publication charges (APCs) and then all open articles are immediately free to access online. Contributors of open access articles retain many rights and typically license their work under terms that permit reuse.
Open Access offers authors choices in how to share and disseminate their work, and it serves the needs of researchers who may be required by their research funder to make articles freely accessible without embargo. APCs are typically paid by the individual author or by the author’s funder, and payments are often mediated by the author’s institution. We provide specific workflows and infrastructure to authors, funders, and institutions to support the requirements of Open Access.
We offer two Open Access publishing models. The first of these is Hybrid Open Access where authors can publish in the majority of our paid subscription journals. The second offering is Gold Open Access, where authors can publish in open access-only journals. All Open Access articles are subject to the same rigorous peer-review process applied to our subscription-based journals. As with our subscription portfolio, a number of the Gold Open Access Journals are published under contract for, or in partnership with, prestigious societies, including the American Geophysical Union, the American Heart Association, and the British Ecological Society. The Open Access portfolio spans life, physical, medical, and social sciences and includes a choice of high impact journals and broad-scope titles that offer a responsive, author-centered service.
Licensing and ancillary products
Licensing and ancillary products includes the licensing of publishing rights, the licensing of content for artificial intelligence (AI) models, individual article sales, and backfile sales. Wiley engages with international publishers and receives licensing revenue from reproductions, translations, and other digital uses of our content. The licensing of content for AI models helps developers improve the accuracy and impact of their models. By accessing Wiley's rich content, developers can train their AI models to better understand and generate human-like text, improving overall performance and accuracy. Through the Article Select and PayPerView programs, we provide fee-based access to non-subscribed journal articles, content, book chapters, and major reference work articles. The Research Publishing business is also a provider of content and services in evidence-based medicine (EBM). Through our alliance with The Cochrane Collaboration, we publish The Cochrane Library, a premier source of high-quality independent evidence to inform healthcare decision-making. Backfile licenses provide access to a historical collection of Wiley journals, generally for a one-time fee.
Research Solutions
Research Solutions generates revenue through content platforms and services that enable corporations and societies to attract and retain customers.
Research Solutions includes advertising (journals and newsletters), sales, and marketing services (knowledge hubs for pharmaceutical companies). Our recruitment platform offers full-service career site management for pharmaceutical companies and other R&D centric corporations. Spectral database licenses grant access to scientific research-based data on microscopy, spectroscopy, bioanalysis, and separation science. Our projects business offers services related to content creation and distribution, an educational platform for health professionals, and digital events and webinars for corporations in health and physical sciences.
We also provide platform and workflow solutions for societies and publishers, including production and content hosting, submissions and peer review support, and editorial and copy editing services. The Atypon® publishing platform for societies and publishers delivers integrated access to more than 11 million articles from over two thousand publishers and societies, as well as around 29,000 online books and hundreds of multivolume reference works, laboratory protocols, and databases.
Learning:
Our Learning segment includes Academic and Professional, whose products and services include scientific, professional, and education print and digital books, digital courseware to support students and instructors, and assessment services for businesses and professionals. Primary categories served include business and leadership, technology, behavioral health, engineering/architecture, science, and professional education. Products are sold to and through brick-and-mortar and online retailers, wholesalers who supply such bookstores, college bookstores, individual practitioners, corporations, distributor networks, and government agencies.
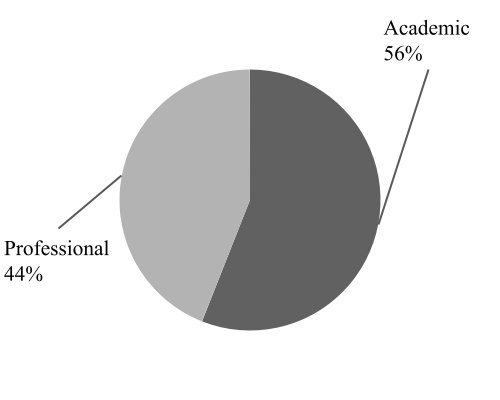
Publishing centers include Australia, Germany, India, the UK, and the US. Learning accounted for approximately 35% of our consolidated revenue in the year ended April 30, 2025, with a 37.4% Adjusted EBITDA margin. See Part II, Item 7, “Management’s Discussion and Analysis of Financial Condition and Results of Operations” in the section “Segment Operating Results” of this Annual Report on Form 10-K for further details and for the reconciliation of Adjusted Operating Income to Adjusted EBITDA. For fiscal year 2025, approximately 60% of Learning revenue is from digital and online products and services.
Learning revenue by product type includes Academic and Professional. The graphs below present revenue by product type for the years ended April 30, 2025 and 2024:
Key strategies for the Learning business include selectively scaling high-value digital content, courseware, and assessments where the Company is seeking content libraries for new licensing opportunities.
Book manuscripts and materials are sourced from authors around the world, utilizing the efforts of an internal editorial staff, external editorial support, and advisory boards. Most materials originate by the authors themselves or as the result of suggestions or solicitations by editors. We enter into agreements that state the terms and conditions under which the materials will be published, the author name in which the copyright will be registered, the basis for any royalties, and other matters. Author compensation models include royalties, which vary depending on the nature of the product and work-for-hire. We may make advance royalty payments against future royalties to authors of certain publications. Royalty advances are reviewed for recoverability and a reserve for loss is maintained, if appropriate.
We continue to add new titles, revise existing titles, and discontinue the sale of others in the normal course of our business. We also create adaptations of original content for specific markets based on customer demand. Our general practice is to revise our textbooks every 3 to 5 years, as warranted, and to revise other titles as appropriate. Subscription-based products are updated on a more frequent basis.
Wiley does not own any printing facilities. We generally contract independent printers and binderies globally for their services, using a variety of suppliers and materials to support our range of needs. As of April 30, 2025, we had one global warehousing and distribution facility remaining, which is in the UK. We have an agreement to outsource our US-based book distribution operations to Cengage Learning, with the continued aim of improving efficiency in our distribution activities and moving to a more variable cost model.
Book sales for Learning are generally made on a returnable basis with certain restrictions. We provide for estimated future returns on sales made during the year based on historical return experience and current market trends.
Academic
Academic generates the majority of its revenue from contracts with its customers in the following revenue streams:
•Print and Digital Publishing
•Digital Courseware
•Licensing and ancillary products
Print and Digital Publishing
Education textbooks, related supplementary material, and digital products are sold primarily to bookstores and online retailers serving educational institutions (primarily colleges and universities) and direct-to-students. We employ sales representatives who call on faculty responsible for adopting books to be used in courses, and on the bookstores that serve such institutions and their students. The textbook business is seasonal, with the majority of textbook sales occurring during the July-through-October and December-through-February periods. There are various channels to drive accessibility for print and digital materials within the higher education market, including used, rental, and inclusive access whereby the cost of digital course content is added to a student's tuition and fees. Technical and Medical (STM) reference books are sold and distributed globally in digital and print formats through multiple channels, including research libraries and library consortia, independent subscription agents, direct sales to professional society members, bookstores, online booksellers, and other customers.
Book content is available online through Wiley Online Library, WileyPLUSTM, zyBooks®, alta®™, and other proprietary platforms. Digital books are delivered to intermediaries, including Amazon, Apple, and Google, for sale to individuals in various industry-standard formats. Digital books are also licensed to libraries through aggregators. Specialized formats for digital textbooks go to distributors servicing the academic market, and digital book collections are sold by subscription through independent third-party aggregators servicing distinct communities. Custom deliverables are provided to corporations, institutions, and associations to educate their employees, generate leads for their products, and extend their brands. Digital content is also used to create online articles, mobile apps, newsletters, and promotional collateral. Continually reusing content improves margins, speeds delivery, and helps satisfy a wide range of evolving customer needs. Our online presence not only enables us to deliver content online, but also to sell more books. Publishing alliances and franchise products are important to our strategy. Education and STM publishing alliance partners include IEEE, American Institute of Chemical Engineers, and many others. The ability to join Wiley’s product development, sales, marketing, distribution, and technology with a partner’s content, technology, and/or brand name has contributed to our success.
Digital Courseware
We offer online learning solutions, including WileyPLUS, an online education platform that is integrated with a digital textbook. The interactive zyBooks platform for STEM disciplines, namely computer science, maximizes learner engagement and retention through demonstration and hands-on learning experiences using question sets, animations, tools, and embedded labs.
Licensing and ancillary products
We engage in co-publishing titles with international publishers and receive licensing revenue from photocopies, reproductions, translations, and digital uses of our content. We also license our Learning content for training and developing AI models. By accessing Wiley's authoritative content, AI developers can train their models to better understand and generate human-like text, improving overall performance and accuracy.
Professional
Professional generates the majority of its revenue from contracts with its customers in the following revenue streams:
•Professional Publishing
•Assessments
•Licensing and ancillary products
Professional Publishing
Professional books, which include business and finance, technology, and other professional categories are sold to brick-and-mortar and online retailers, wholesalers who supply such bookstores, college bookstores, individual practitioners, corporations, and government agencies. We employ sales representatives who call upon independent bookstores, national and regional chain bookstores, wholesalers, and corporations globally. Sales of professional books also result from direct marketing outreach, conferences, and other industry-relevant outreach. Key franchises and brands in the Professional category include Dummies®, Sybex, The Jon Gordon Companies, and Disciplined Entrepreneurship by Bill Aulet. Professional organizations also use our custom professional publications for marketing outreach. This outreach includes customized books written for a specific customer and includes custom cover art, such as imprints, messages, and slogans.
Assessments
Our assessments offerings include soft-skills training solutions delivered to organizational clients and their employees through online digital delivery platforms, either directly or through an authorized distributor network of independent consultants, trainers, and coaches. Wiley’s branded assessment solutions include Everything DiSC®, The Five Behaviors® based on Patrick Lencioni’s perennial bestseller The Five Dysfunctions of a Team, and Leadership Practices Inventory® from Kouzes and Posner’s bestselling The Leadership Challenge, as well as PXT Select®™, a pre-hire selection tool. Our solutions help organizations hire and develop effective managers, leaders, and teams.
Licensing and ancillary products
Licensing and distribution services are made available to other publishers under agency arrangements. Wiley also realizes advertising revenue from branded websites (e.g., Dummies.com) and online applications. We also license our content for AI model training and development, as described above.
Held for Sale or Sold:
Our Held for Sale or Sold segment primarily consists of non-core businesses which were classified as held-for-sale until the date of sale, as well as other businesses which were sold. This primarily includes University Services which was sold on January 1, 2024, Wiley Edge which was sold on May 31, 2024 except its India operations which was sold on August 31, 2024, CrossKnowledge which was sold on August 31, 2024, and other businesses sold in fiscal years 2024 and 2023.
Held for Sale or Sold accounted for approximately 1% of our consolidated revenue in the year ended April 30, 2025, with a (20.6)% Adjusted EBITDA margin. See Part II, Item 7, “Management’s Discussion and Analysis of Financial Condition and Results of Operations” in the section “Segment Operating Results” of this Annual Report on Form 10-K for further details and for the reconciliation of Adjusted Operating Income to Adjusted EBITDA.
CrossKnowledge previously offered online learning and training solutions for global corporations and small and medium-sized enterprises, which were sold on a subscription or fee basis.
Wiley Edge sourced students and professionals for technology and banking services careers and placed them with financial institutions, technology companies, and government agencies.
Human Capital
As of April 30, 2025, we employed approximately 5,200 colleagues worldwide.
We view our colleagues as one of our most significant assets and investments to deliver on our mission and to champion and advocate for our customers who want to make impacts in their fields, their workplaces, and their lives, through knowledge creation, use, and dissemination. Our success depends on our ability to develop, attract, reward, and retain a diverse population of talented, qualified, and highly skilled colleagues at all levels of our organization and across our global workforce. This includes programs, policies, and initiatives that promote inclusion and belonging; talent acquisition; ongoing employee learning and development; competitive compensation and benefits; health and well-being; and emphasis on employee satisfaction and engagement.
Our culture differentiates us as an organization, and our core values define how we work together. We ask colleagues to embody our three values—Learning Champion, Needle Mover, and Courageous Teammate—and assess their performance against these in addition to what they achieve against their goals. These values define who we are as a company and what we stand for.
Our human capital metrics summary as of April 30, 2025:
|
|
|
|
|
|
|
|
|
|
METRIC |
|
Colleagues By Region |
Americas |
38 |
% |
|
APAC |
26 |
% |
|
EMEA |
36 |
% |
| Global Gender Representation |
% Female Colleagues |
57 |
% |
|
% Female Senior Leaders
(Vice President and above)
|
45 |
% |
| US Person of Color (POC) Representation* |
% POC Colleagues |
26 |
% |
|
% POC Senior Leaders
(Vice President and above)
|
19 |
% |
* US POC includes employees who self-identify as Hispanic or Latino, Black or African American, Asian, American Indian or Alaskan Native, Native Hawaiian or other Pacific Islander, Other, or two or more races.
Health & Well-Being
Colleague well-being is at the core of our business, as it is critical we provide tools and resources to help colleagues and their families be healthy, and an environment that allows us to be at our best at work and in life. From a global paid parental leave, an app that supports mental health, and a global giving platform, we provide the tools and resources that meet the needs of our colleagues in maintaining and achieving healthy, physical, emotional, social, career, and financial well-being.
We believe that Wiley’s best work will be done in a flexible workplace which consists of a careful blend of flexible, digitally enabled remote work and purposeful in-person connection and collaboration (Global Work Model). As we continue to evolve Wiley’s Global Work Model, we remain committed to providing our colleagues flexibility while embracing opportunities to come together for meaningful connections. Our approach is intended to support well-being, while maintaining a culture of innovation and creating an equitable experience for all colleagues.
Inclusion and belonging are foundational to our strategy. We believe that an inclusive culture is fundamental to our colleagues’ talent experience. When colleagues feel included and valued, they are more likely to be engaged, productive, and innovative. An inclusive culture also helps to ensure that everyone has an equal opportunity to impact and contribute at Wiley. By prioritizing inclusion and belonging, we can create a more innovative, productive, and engaged workforce that benefits everyone.
We are focused on four Inclusion and Belonging Strategic Pillars—Fostering an Inclusive Community, Enhancing our Foundation, Understanding our People, and Creating Impact Through our Business.
These pillars reflect our Inclusion and Belonging near-term priorities to propel a sustainable, inclusive organization that embodies inclusion throughout our policies, programs, and processes, and fosters an inclusive culture that celebrates the unique contributions of our colleagues and supports human connectivity. In addition, we develop partnerships and launch pilot programs to support communities that are underrepresented in higher education, the workforce, and the field of publishing.
Our Employee Resource Groups help amplify our Inclusion and Belonging priorities through learning, community engagement, and allyship and advocacy.
Careers and Engagement
Investment in colleague development and growth for current and future roles is central to our culture. Our goal is to provide colleagues with learning opportunities and experiences during their journey at Wiley. We help colleagues upskill and thrive by leveraging the power of our internal products and tapping into our external partnerships. We focus on delivering quality curated resources, customized learning paths, and comprehensive development programs. We offer interactive development programs that allow our colleagues to share lessons learned, adopt best practices, and have interactive opportunities with their peers. Through our internal development programs, our colleagues get practical advice on updating their internal resumes, and honing their interviewing skills, and having career conversations with our Talent team. Leveraging Wiley's Everything DiSC assessment tools and resources, our colleagues can better understand themselves and others, creating a common language that makes interactions more collaborative and effective.
Through our Pay@Wiley journey, we continue to enhance our colleague and manager understanding of pay through our education programs and raised transparency by sharing segment in range and publishing our annual global equitable pay study. Recognizing the great work our colleagues do is an important part of our culture. We continue to use Achievers as our recognition platform that is designed so our colleagues can recognize each other to create a culture of recognition and celebrate success. In fiscal year 2025, we had over 31,000 recognitions and introduced the Wiley Impact Award program to recognize top performing colleagues driving an impact on our enterprise goals.
We conduct a talent review annually, focusing on high-performing and high-potential talent, diversity, and succession for our most critical roles. We are committed to identifying, growing, and retaining top talent and ensuring we have the right skills for the future. We establish key development action planning opportunities for each colleague to build bench strength and review development progress and mobility regularly.
Environment
At Wiley, environmental sustainability is an integral part of our operations and corporate strategy. We continue to build on our progress to further reduce greenhouse gas emissions, strengthen partnerships that advance environmental action, and promote responsible stewardship throughout our value chain. We are committed to aligning our practices and reporting to relevant environmental regulations and emerging standards to ensure our actions support broader climate and sustainability goals.
Our climate strategy prioritizes achieving net-zero emissions by 2040. We have established science-based targets, validated by the Science Based Targets initiative (SBTi), to drive emissions reductions across Scopes 1 (direct emissions), 2 (indirect emissions from purchased utilities), and 3 (other indirect emissions within our value chain). We continue to transition our owned and leased offices, distribution center, and warehouse locations toward renewable energy sources, while utilizing Energy Attribute Certificates (EACs) for locations not yet able to access renewable energy directly. Additionally, we are consolidating our office footprint and prioritizing responsible energy management across our operations. Wiley remains aligned with the Business Ambition for 1.5°C campaign, reinforcing our commitment to the urgent need for corporate climate action.
In parallel, we are advancing sustainable publishing and digital innovation to minimize environmental impact. We are promoting digital adoption, optimizing resource use, and enhancing supply chain engagement to uphold responsible standards. We continue to publish content that supports the UN Sustainable Development Goals and reduce print production through initiatives such as print-on-demand, zero-inventory distribution models, and increased digital offerings. Our efforts are guided by our publicly available Environmental Policy and Paper Selection and Use Policy.
Wiley remains committed to building on the progress we have made, evolving our strategy to meet the challenges ahead, and making a positive impact on environmental sustainability.
Financial Information About Business Segments
The information set forth in Part II, Item 8, “Financial Statements and Supplementary Data” in
Note 3, “Revenue Recognition, Contracts with Customers,” and
Note 20, “Segment Information,” of the Notes to Consolidated Financial Statements and Item 7, “Management’s Discussion and Analysis of Financial Condition and Results of Operations” of this Annual Report on Form 10-K are incorporated herein by reference.
Available Information
Our investor site is investors.wiley.com. Our internet address is wiley.com. We make available, free of charge, on or through our investors.wiley.com website, our Annual Reports on Form 10-K, Quarterly Reports on Form 10-Q, Current Reports on Form 8-K, and amendments to those reports that we file or furnish pursuant to Sections 13(a) or 15(d) of the Securities Exchange Act of 1934, or the Exchange Act, as soon as reasonably practicable after we electronically file these materials with, or furnish them to, the SEC. The information contained on, or that may be accessed through our website is not incorporated by reference into, and is not a part of, this Annual Report on Form 10-K.
Item 1A. Risk Factors
Introduction
The risks described below should be carefully considered before making an investment decision. You should carefully consider all the information set forth in this Annual Report on Form 10-K, including the following risk factors, before deciding to invest in any of our securities. This Annual Report on Form 10-K also contains, or may incorporate by reference, forward-looking statements that involve risks and uncertainties. See the “Cautionary Notice Regarding Forward-Looking Statements,” immediately preceding Part I of this Annual Report on Form 10-K. The risks below are not the only risk factors we face. Additional risks not currently known to us or that we presently deem insignificant could impact our consolidated financial position and results of operations. Our businesses, consolidated financial position, and results of operations could be materially adversely affected by any of these risks. The trading price of our securities could decline due to any of these risks, and investors may lose all or part of their investment.
Strategic Risks
Our business may be adversely impacted if we cannot protect our intellectual property.
Our business depends on our intellectual property, including our valuable trademarks and copyrighted content. A substantial portion of our publications are protected by copyright, held either in our name, in the name of the author of the work, or in the name of a sponsoring professional society. Such copyrights protect our exclusive right to publish the work in many countries abroad for specified periods, in most cases the author’s life plus 70 years. We believe the protection and monetization of our proprietary trademarks and copyrighted content, as well as other intellectual property, is critical to our continued success and our competitive position. Our ability to do so is subject to the inherent limitation in protections available under intellectual property laws in the US and other applicable jurisdictions. Unauthorized parties could unlawfully misappropriate our brand, content, technology, and other intellectual property and may continue to do so, and the measures we have taken to protect and enforce our proprietary rights may not be sufficient to fully address or prevent all third-party infringement.
Advancements in technology, including advancements in generative artificial intelligence (collectively, AI Technologies), have made unauthorized copying and wide dissemination of unlicensed content easier. Detection of unauthorized use of our intellectual property and enforcement of our intellectual property rights have become more challenging, in part due to the increasing volume and sophistication of attempts at unauthorized use of our intellectual property, including from generative AI developers. As our business and the presence and impact of bad actors become more global in scope, we may not be able to protect our proprietary rights in a cost-effective manner in other jurisdictions. In addition, intellectual property protection may not be available in every country in which our products and services are distributed or made available through the internet.
If we are unable to protect and enforce our intellectual property rights, we may not succeed in realizing the full value of our assets, our business and profitability may be adversely impacted, and our brand may be tarnished by misuse of our intellectual property.
We may not be able to realize the expected benefits of our growth strategies, which are described in Item 1. Business, which could adversely impact our consolidated financial position and results of operations.
We may not be able to adequately drive publishing output and journal expansion to meet the global demand for peer-reviewed research, nor expand licensing, platform, and service offerings for institutions, corporations, and societies.
Technological developments in artificial intelligence (AI) could disrupt the markets in which we operate and subject us to increased competition, cannibalization, legal and regulatory risks, and compliance costs.
Technological developments in artificial intelligence, including machine learning technology, large language models, and AI Technologies and their current and potential future applications, are rapidly evolving. The full extent of current or future risks related thereto is not possible to predict. AI Technologies could significantly disrupt the markets in which we operate and subject us to increased competition, legal and regulatory risks, which could have a material adverse effect on our business, financial condition, and results of operations. In addition, the sale of new products leveraging AI Technologies may result in the cannibalization of sales for existing products, which may harm our results of operations.
We intend to seek to avail ourselves of the potential benefits, insights, and efficiencies that are available through the use of AI Technologies, which presents a number of potential risks that cannot be fully mitigated. If the content, analyses, or recommendations that AI Technologies assist in producing are, or are alleged to be, deficient, inaccurate, biased, or otherwise problematic, our reputation may be adversely affected. In addition, the introduction of generative AI tools into our business may negatively impact our workplace culture and ability to attract and retain employees if generative AI tools are viewed as displacing workers. Generative AI also presents emerging legal and ethical issues, and terms governing the use of generative AI are subject to change. Accordingly, our use of, or perceptions of the way that we use, generative AI could adversely affect our business, brand, financial condition, or results of operations. There is also a risk that AI Technologies may be misused or misappropriated by our employees and/or third parties engaged.
Further, we may not be able to control how third-party AI Technologies that we choose to use are developed or maintained, or how data we input is used or disclosed, even where we have sought contractual protections with respect to these matters. The misuse or misappropriation of our data could have an adverse impact on our reputation and could subject us to legal and regulatory investigations and/or actions.
Regulations related to AI Technologies may also impose on us certain obligations and costs related to monitoring and compliance. For example, in April 2023, the Federal Trade Commission, US Department of Justice, Consumer Financial Protection Bureau, and US Equal Employment Opportunity Commission released a joint statement on AI demonstrating interest in monitoring the development and use of automated systems and enforcement of their respective laws and regulations. In October 2023, the Presidential Administration signed an executive order that establishes new standards for AI safety and security. In addition to the US regulatory framework, the EU introduced a new regulation applicable to certain AI Technologies and the data used to train, test, and deploy them, which could impose significant requirements on both the providers and deployers of AI Technologies.
Potential reductions in US federal funding for libraries and changes to US higher education policy may adversely affect our business
Our operations and revenue are partially dependent on funding for research and spending by publicly funded institutions, including public libraries, colleges, and universities. The current US administration has recently proposed reductions in US federal funding for the National Institute of Health and other agencies that support research as well as funding for the US Department of Education and other university programs. If these proposals are enacted, our US library customers may experience budget constraints that reduce their ability to license, purchase, or renew our products and services.
Wiley is a global business and enjoys healthy geographic revenue distribution and funding diversity worldwide, but any material and sustained decrease in US public funding for research and education could adversely affect our results of operations over time. We cannot predict the extent to which future US federal budgets or policy changes may impact funding policies in other countries, our customers, or our business, but such actions may have a significant and negative effect on our US market.
Divestitures could adversely affect our business and financial results and may introduce significant risks and uncertainties.
We continually evaluate the performance and strategic fit of all of our businesses and may sell businesses or product lines. We completed the divestiture of our non-core education businesses that no longer aligned with our strategic direction or growth targets, as previously disclosed. While these divestitures have been finalized, certain financial arrangements associated with these transactions, including Sellers Notes and earnout provisions, continue to present potential risks and uncertainties that could adversely affect our business, consolidated financial position, and consolidated results of operations. These post-divestiture financial arrangements require ongoing monitoring and management attention to ensure compliance with agreement terms and to mitigate potential adverse impacts on our financial position. If the buyers of our divested businesses experience operational or financial difficulties, our ability to collect on Sellers Notes or realize anticipated earnout payments could be impaired. See
Note 4, "Acquisitions and Divestitures" for further details.
A reduction in enrollment at colleges and universities could adversely affect the demand for our higher education products.
Enrollment in US colleges and universities can be adversely affected by many factors, including changes in government and private student loan and grant programs, uncertainty about current and future economic conditions, increases in tuition, general decreases in family income and net worth, and low unemployment due to an active job market. In addition, enrollment levels at colleges and universities outside the US are influenced by global and local economic factors, local political conditions, and other factors that make predicting foreign enrollment levels difficult. Reductions in expected levels of enrollment at colleges and universities within the US could adversely affect demand for our higher education offerings, which could adversely impact our consolidated financial position and results of operations.
If we are unable to retain key talent and other colleagues, our consolidated financial condition or results of operations may be adversely affected.
The Company and industry are highly dependent on the loyal engagement of key leaders and colleagues. Loss of talent due to inadequate skills and career path development, or maintaining competitive salaries and benefits could have a significant impact on Company performance.
We are highly dependent on the continued services of key talent who have in-depth market and business knowledge and/or key relationships with business partners. The loss of the services of key talent for any reason and our inability to replace them with suitable candidates quickly or at all, as well as any negative market perception resulting from such loss, could have a material adverse effect on our business, consolidated financial position, and results of operations.
We have a significant investment in our colleagues around the world. We offer competitive salaries and benefits in order to attract and retain the highly skilled workforce needed to sustain and develop new products and services required for growth. Employment costs are affected by competitive market conditions for qualified individuals and factors such as healthcare and retirement benefit costs.
The competitive pressures we face in our business, as well as our ability to retain our business relationships with our authors and professional societies, could adversely affect our consolidated financial position and results of operations.
The contribution of authors and their professional societies is one of the more important elements of the highly competitive publishing business. Success and continued growth depend greatly on developing new products and the means to deliver them in an environment of rapid technological change. Attracting new authors and professional societies while retaining our existing business relationships is critical to our success. If we are unable to retain our existing business relationships with authors and professional societies, this could have an adverse impact on our consolidated financial position and results of operations.
The demand for digital and lower cost books could impact our sales volumes and pricing in an adverse way.
The trend towards digital content has created contraction in the print book retail market which increases the risk of bankruptcy for certain retail customers, potentially leading to the disruption of short-term product supply to consumers, as well as potential bad debt write-offs.
As the market has shifted to digital products, customer expectations for lower-priced products have increased due to customer awareness of reductions in production costs and the availability of free or low-cost digital content and products. Increased customer demand for lower prices could reduce our revenue.
Due to growing student demand for less expensive textbooks, many college bookstores, online retailers, and other entities, offer used or rental textbooks to students at lower prices than new textbooks. The Internet has made the used and rental textbook markets more efficient and has significantly increased student access to used and rental textbooks.
Information Technology Systems and Cybersecurity Risks
Our Company is highly dependent on information technology systems and their business management and customer-facing capabilities, which are critical for the long-term competitive sustainability of the business. If we fail to innovate in response to rapidly evolving technological and market developments, our competitive position may be negatively impacted.
We must continue to invest in technology and other innovations to adapt and add value to our products and services to remain competitive. This is particularly true in the current environment, where investment in new technology is ongoing and there are rapid changes in the products competitors are offering, the products our customers are seeking, and our sales and distribution channels. In some cases, investments will take the form of internal development; in others, they may take the form of an acquisition. There are uncertainties whenever developing or acquiring new products and services, and it is often possible that such new products and services may not be launched, or, if launched, may not be profitable or as profitable as existing products and services. If we are unable to introduce new technologies, products, and services, our ability to be profitable may be adversely affected.
We cannot predict the effect of technological changes on our business. Failure to keep pace with these technological developments or otherwise bring to market products that reflect these technologies could have a material adverse impact on our overall business and results of operations. We may not be successful in anticipating or responding to these developments on a timely and cost-effective basis. Additionally, the effort to gain technological expertise and develop new technologies in our business requires us to incur significant expenses. If we cannot offer new technologies as quickly as our competitors, or if our competitors develop more cost-effective technologies or product offerings, we could experience a material adverse effect on our operating results, growth, and financial condition.
We may be susceptible to information technology risks that may adversely impact our business, consolidated financial position, and results of operations.
Information technology is a key part of our business strategy and operations. As a business strategy, Wiley’s technology enables us to provide customers with new and enhanced products and services and is critical to our success in migrating from print to digital business models. Information technology is also a fundamental component of all our business processes, collecting and reporting business data, and communicating internally and externally with customers, suppliers, employees, and others. We face technological risks associated with digital products and service delivery in our businesses, including with respect to information technology capability, reliability, security, enterprise resource planning, system implementations, and upgrades. Across our businesses, we hold personal data, including that of employees and customers. Failures of our information technology systems and products (including operational failure, natural disaster, computer virus, or cyberattacks) could interrupt the availability of our digital products and services, result in corruption or loss of data or breach in security, and result in liability or reputational damage to our brands and/or adversely impact our consolidated financial position and results of operations.
Management has designed and implemented policies, processes, and controls to mitigate risks of information technology failure and to provide security from unauthorized access to our systems. In addition, we have disaster recovery plans in place to maintain business continuity for our key financial systems. While key financial systems have backup and tested disaster recovery systems, other applications and services have limited backup and recovery procedures which may delay or prevent recovery in case of disaster. The size and complexity of our information technology and information security systems, and those of our third-party vendors with whom we contract, make such systems potentially vulnerable to cyberattacks common to most industries from inadvertent or intentional actions by employees, vendors, or malicious third parties. While we have taken steps to address these risks, there can be no assurance that a system failure, disruption, or data security breach would not adversely affect our business and could have an adverse impact on our consolidated financial position and results of operations.
We are continually improving and upgrading our computer systems and software. We have recently initiated a multiyear enterprise modernization program which includes various projects including the consolidation and transformation of our Research publishing infrastructure, and the future implementation of an updated global enterprise resource planning (ERP) system to integrate and upgrade our operational and financial systems and processes. Implementation of this program and the related projects involves risks and uncertainties.
The risks associated with the transformation of our Research publishing infrastructure could include not realizing our projected business benefits of growing article submissions, reducing the time to publication, facilitating growth in open access with a modern open access payment infrastructure, and reducing the cost per article.
Any disruptions, delays, or deficiencies in the design or implementation of a new ERP system could result in increased costs, disruptions in operations, or delays in the collection of cash from our customers, as well as having an adverse effect on our ability to timely report our financial results, all of which could materially adversely affect our business, consolidated financial position, and results of operations. While we have contingency support available, any major disruptions, while unlikely, may require a longer remediation time. This could impact our ability to process and fulfill orders for those businesses. We currently use a legacy platform with limited support for order management of the global Learning business. Any defects and disruptions in the legacy systems which cannot be addressed in a timely manner could impact our ability to process orders and reconcile financial statements. These legacy platforms are being evaluated as part of the recently initiated enterprise modernization program noted above.
Cyber risk and the failure to maintain the integrity of our operational or security systems or infrastructure, or those of third parties with which we do business, could have a material adverse effect on our business, consolidated financial condition, and results of operations.
The cybersecurity risks we face range from cyberattacks common to most industries, such as the development and deployment of malicious software to gain access to our networks and attempt to steal confidential information, launch distributed denial of service attacks, or attempt other coordinated disruptions, to more advanced threats that target us because of our prominence in the global research and advisory field. Given that our employees work remotely, at least some of the time, which magnifies the importance of the integrity of our remote access security measures.
Like many multinational corporations, we, and some third parties upon which we rely, have experienced cyberattacks on our computer systems and networks in the past and may experience them in the future, likely with more frequency and sophistication and involving a broader range of devices and modes of attack, all of which will increase the difficulty of detecting and successfully defending against them. To date, none have resulted in any material adverse impact to our business, operations, products, services, or customers. Wiley has invested heavily in cybersecurity tools and resources to keep our systems safe. We have implemented various security controls to meet our security obligations, while also defending against constantly evolving security threats. Our security controls help to secure our information systems, including our computer systems, intranet, proprietary websites, email, and other telecommunications and data networks, and we scrutinize the security of outsourced website(s) and service providers prior to retaining their services. However, the security measures implemented by us or by our outside service providers may not be effective, and our systems (and those of our outside service providers) may be vulnerable to theft, loss, damage, and interruption from a number of potential sources and events, including unauthorized access or security breaches, cyberattacks, computer viruses, power loss, or other disruptive events.
The security compliance landscape continues to evolve, requiring us to stay apprised of changes in cybersecurity, privacy laws and regulations, such as the following, but not limited to the European Union General Data Protection Regulation (GDPR), the California Consumer Privacy Act (CCPA), the Brazilian General Data Protection Law (LGPD), and the Chinese Cybersecurity, Data Security and Personal Information Protection laws (PIPL). The UK ceased to be an EU Member State on January 31, 2020, but enacted the UK data protection law. It is unclear how UK data protection laws will continue to develop; however, contractual clauses have been established regulating data transfers to and from the UK. Some countries also are considering or have enacted legislation requiring local storage and processing of data that could increase the cost and complexity of delivering our services.
In addition to new and proposed data protection laws, we also stay apprised and adopt certain security standards required by our clients, such as International Organization for Standardization (ISO), National Institute of Standards and Technology (NIST), and Center for Internet Security (CIS). Recent well-publicized security breaches at other companies have led to enhanced government and regulatory scrutiny of the measures taken by companies to protect against cyberattacks and may in the future result in heightened cybersecurity requirements, including additional regulatory expectations for oversight of vendors and service providers.
A cyberattack could cause delays in initiating or completing sales, impede delivery of our products and services to our clients, disrupt other critical client-facing or business processes, or dislocate our critical internal functions. Additionally, any material breaches or other technology-related catastrophe, or media reports of perceived security vulnerabilities to our systems or those of our third parties, even if no breach has been attempted or has occurred, could cause us to experience reputational harm, loss of customers and revenue, fines, regulatory actions and scrutiny, sanctions or other statutory penalties, litigation, liability for failure to safeguard our customers information, or financial losses that are either not insured against or not fully covered through any insurance maintained by us.
For more information regarding our process for identifying, assessing and managing material risks from cybersecurity threats, refer to
Item 1C. Cybersecurity.
Operational Risks
We may not realize the anticipated cost savings and benefits from, or our business may be disrupted by, our continuous improvement efforts.
We will continue to explore opportunities to develop new business models and enhance the efficiency of our cost and organizational structure. The rapid pace and scope of change increases the risk that not all our strategic initiatives will deliver the expected benefits within the anticipated timeframes. In addition, these efforts may disrupt our business activities, which could adversely affect our consolidated financial position and results of operations.
We continue to restructure and realign our cost base with current and anticipated future market conditions, including our Global Restructuring Program. Significant risks associated with these actions that may impair our ability to achieve the anticipated cost savings or that may disrupt our business, include delays in the implementation of anticipated workforce reductions in highly regulated locations outside of the US, decreases in employee morale, the failure to meet operational targets due to the loss of key employees, and disruptions of third parties to whom we have outsourced certain business functions. In addition, our ability to achieve the anticipated cost savings and other benefits from these actions within the expected timeframe is subject to many estimates and assumptions. These estimates and assumptions are subject to significant economic, competitive, and other uncertainties, some of which are beyond our control. If these estimates and assumptions are incorrect, if we experience delays, or if other unforeseen events occur, our business and consolidated financial position and results of operations could be adversely affected.
We may not realize the anticipated cost savings and processing efficiencies associated with the outsourcing of certain business processes.
We have outsourced certain business functions, principally in technology, content management, printing, warehousing, fulfillment, distribution, collections and returns processing, and certain other transactional processing functions, to third-party service providers to achieve cost savings and efficiencies. If these third-party service providers do not perform effectively, we may not be able to achieve the anticipated cost savings, and depending on the function involved, we may experience business disruption or processing inefficiencies, all with potential adverse effects on our consolidated financial position and results of operations.
Challenges and uncertainties associated with operating in certain global markets has a higher risk due to political instability, economic volatility, crime, terrorism, corruption, social and ethnic unrest, and other factors, which may adversely impact our consolidated financial position and results of operations.
We sell our products to customers in certain sanctioned and previously sanctioned developing markets in accordance with such restrictions. While sales in these markets are not material to our consolidated financial position and results of operations, adverse developments related to the risks associated with these markets may cause actual results to differ from historical and forecasted future consolidated operating results.
We have certain global operations related to software development and technology architecture, digital content production, and system testing services. Due to the political instability within certain regions, there is the potential for future government embargoes and sanctions, which could disrupt our operations in these areas. While we have developed business continuity plans to address these issues, further adverse developments in these regions could have a material impact on our consolidated financial position and results of operations.
In our Research segment, approximately 30% of the articles we published in calendar year 2024 included China-based authors. This compares to the industry percentage which is approximately 32% of articles published in calendar year 2024 which included China-based authors. Any restrictions on exporting intellectual property could adversely affect our business and consolidated financial position and results of operations. Chinese governments and institutions are producing early warning lists of journals published by non-Chinese publishers that have high proportions of Chinese content which could have an impact on future article volumes.
In our journal publishing business, we have a trade concentration and credit risk related to subscription agents, and in our book business the industry has a concentration of customers in national, regional, and online book resellers. Changes in the financial position and liquidity of our subscription agents and customers could adversely impact our consolidated financial position and results of operations.
In the journal publishing business, some subscriptions are sourced through journal subscription agents who, acting as agents for library customers, facilitate ordering by consolidating the subscription orders/billings of each subscriber with various publishers. Cash is generally collected in advance from subscribers by the subscription agents and is principally remitted to us between the months of December and April. Although currently we have minimal credit risk exposure to these agents, future calendar-year subscription receipts from these agents are highly dependent on their financial condition and liquidity.
Subscription agents account for approximately 18% of total annual consolidated revenue, and no one agent accounts for more than 10% of total annual consolidated revenue.
Our book business is not dependent upon a single customer; however, the industry is concentrated in national, regional, and online book resellers. Although no book customer accounts for more than 6% of total consolidated revenue and 9% of accounts receivable at April 30, 2025, the top 10 book customers account for approximately 12% of total consolidated revenue and approximately 24% of accounts receivable at April 30, 2025.
In our Research business, a lack of integrity in our published research could adversely impact our consolidated financial position and results of operations.
We publish research authored by individuals outside our Company. The integrity of that research could be compromised due to the manipulation, misrepresentation, and misconduct by those individuals or other outsiders involved in the publishing process. This activity could adversely impact our open access publishing and article output by causing us to potentially pause publication, retract articles, or halt publication of a journal, which could adversely impact our business and consolidated financial position and results of operations.
Financial Risks
Volatility in the financial markets and a related global economic downturn could impact our ability to access global credit markets and meet our future financing needs.
Changes in global financial markets have not had, nor do we anticipate they will have, a significant impact on our liquidity. We continue to believe that we have the ability to meet our financing needs for the foreseeable future. We typically generate significant operating cash flow from ongoing operations, continue to maintain available cash and other financial assets, retain access to the capital markets, and have available committed lines of credit through our syndicated credit agreement. As market conditions change, we will continue to monitor our liquidity position. However, there can be no assurance that our liquidity or our consolidated financial position and results of operations will not be adversely affected by possible future changes in global financial markets and global economic conditions. Unprecedented market conditions, including illiquid credit markets, volatile equity markets, dramatic fluctuations in foreign currency and interest rates, and economic recession, could have a material adverse effect on our business and future results.
Fluctuations in foreign currency exchange rates and interest rates could materially impact our consolidated financial condition and results of operations.
Non-US revenues, as well as our substantial non-US net assets, expose our consolidated results to volatility from changes in foreign currency exchange rates. The percentage of consolidated revenue for the year ended April 30, 2025, recognized in the following currencies (on an equivalent US dollar basis) were approximately: 51% US dollar, 29% British pound sterling, 11% euro, and 9% other currencies. In addition, our floating interest rate loans and borrowings are subject to risk from changes in interest rates. We may, from time to time, use derivative instruments to hedge such risks. Notwithstanding our efforts to foresee and mitigate the effects of changes in external financial market or economic conditions, we cannot predict with certainty changes in foreign currency exchange rates and interest rates, inflation, or other related factors affecting our business, consolidated financial position, and results of operations.
We may not be able to mitigate the impact of inflation and cost increases, which could have an adverse impact on our consolidated financial position and results of operations.
From time to time, we experience cost increases reflecting, in part, general inflationary factors. There is no guarantee that we can increase selling prices or reduce costs to fully mitigate the effect of inflation on our costs, which may adversely impact our consolidated financial position and results of operations.
As a result of acquisitions, we have and may record a significant amount of goodwill and other identifiable intangible assets, and we may never realize the full carrying value of these assets.
As a result of acquisitions, we recorded a significant amount of goodwill and other identifiable intangible assets. At April 30, 2025, we had $1,121.5 million of goodwill and $595.0 million of intangible assets, of which $124.5 million are indefinite-lived intangible assets, on our Consolidated Statements of Financial Position. The intangible assets are principally composed of content and publishing rights, customer relationships, brands and trademarks, and developed technology. Failure to achieve business objectives and financial projections could result in an asset impairment, which would result in a noncash charge to our consolidated results of operations. Goodwill and intangible assets with indefinite lives are tested for impairment on an annual basis and when events or changes in circumstances indicate that impairment may have occurred. Intangible assets with definite lives, which were $470.5 million at April 30, 2025, are tested for impairment only when events or changes in circumstances indicate that an impairment may have occurred. Determining whether an impairment exists can be difficult as a result of increased uncertainty and current market dynamics and requires management to make significant estimates and judgments. A noncash intangible asset impairment charge could have a material adverse effect on our consolidated financial position and results of operations.
See Note 11, “Goodwill and Intangible Assets” for further information related to goodwill and intangible assets, and the impairment charges recorded in the years ended April 30, 2024 and 2023.
Changes in pension costs and related funding requirements may impact our consolidated financial position and results of operations.
We provide defined benefit pension plans for certain employees worldwide. Our Board of Directors approved amendments to the US, Canada, and UK defined benefit plans that froze the future accumulation of benefits effective June 30, 2013, December 31, 2015, and April 30, 2015, respectively. Due to the sale of CrossKnowledge on August 31, 2024, the retirement benefit pension plan was discharged as of the date of sale and we retain no further obligations for retirement benefits for CrossKnowledge. The funding requirements and costs of these plans are dependent upon various factors, including the actual return on plan assets, discount rates, plan participant population demographics, and changes in global pension regulations. Changes in these factors affect our plan funding, consolidated financial position, and results of operations.
Legal, Regulatory, and Compliance Risks
Changes in laws, tariffs, and regulations, including regulations related to open access, could adversely impact our consolidated financial position and results of operations.
We maintain operations in Asia, Australia, Canada, Europe, South America, the Middle East, and the US. The conduct of our business, including the sourcing of content, distribution, sales, marketing, and advertising, is subject to various laws and regulations administered by governments around the world. Changes in laws, regulations, or government policies, including tax regulations and accounting standards, may adversely affect our future consolidated financial position and results of operations.
The scientific research publishing industry generates much of its revenue from paid customer subscriptions to online and print journal content. There is interest within government, academic, and library communities for such journal content to be made available for free immediately or following a period of embargo after publication, referred to as open access. For instance, certain governments and privately held funding bodies have implemented mandates that require journal articles derived from government-funded research to be made available to the public at no cost immediately or after an embargo period. Open access can be achieved in two ways: Green, which enables authors to publish articles in subscription-based journals and self–archive the author accepted version of the article for free public use immediately or after any embargo period; and Gold, which enables authors to publish their articles in journals that provide immediate free access to the final version of the article on the publisher’s website, and elsewhere under permissive licensing terms, following payment or waiver of an APC. These mandates have the potential to put pressure on subscription-based publications. If such regulations are widely implemented, our consolidated financial position and results of operations could be adversely affected.
To date, many of the governments and national research councils that have taken a position on open access have favored the Green model and have generally specified embargo periods of twelve months. The publishing community generally takes the view that this period should be sufficient to protect subscription revenues, provided that publishers’ platforms offer sufficient added value to the article. Governments in Europe have been more supportive of the Gold model, which thus far is generating incremental revenue for publishers with active open access programs. Many institutions have signed on to the business model which combines the purchasing of subscription content with the purchase of open access publishing for affiliated authors. This development removes an element of risk by fixing revenues from that market, provided that the terms, price, and rate of transition negotiated are acceptable.
Increases in income tax rates, changes in income tax laws or regulations, or unfavorable resolutions of tax matters could have a material adverse impact on our financial results.
We are subject to tax laws in the jurisdictions of the US and numerous other jurisdictions in which we conduct business. Wiley’s results of operations could be adversely affected by a change in the consolidated effective tax rate as a result of a change in a number of factors including the mix of earnings in countries with differing statutory tax rates, the result of audits of previously filed tax returns, the cost of repatriation, or changes in tax laws and regulations and the interpretations thereof in the jurisdictions where we operate.
Many jurisdictions have agreed to a statement in support of the Organization for Economic Co-operation and Development model (OECD) rules that propose a partial global profit reallocation and a global minimum tax rate of 15%. Certain countries, including European Union member states, have enacted legislation incorporating the global minimum tax with effect from 2024 while many others have indicated their intent to adopt, or have adopted, legislation effective in 2025. The OECD and implementing countries are expected to continue to make further revisions to their legislation and release additional guidance. As the legislation becomes effective in countries in which we do business, our taxes could increase and negatively impact our provision for income taxes. This increasingly complex global tax environment has in the past and could continue to increase tax uncertainty, resulting in higher compliance costs and adverse effects on our financial performance.
In addition, we are subject to potential taxes in jurisdictions where we have sales, even though we do not have a physical presence, and these potential taxes could have an impact on our consolidated financial position and results of operations. Economic and political pressures to increase tax revenues in jurisdictions in which we operate, or the adoption of new or reformed tax legislation or regulation, has made and could continue to make resolving tax disputes more difficult. Although we believe our tax estimates are reasonable, the final resolution of tax audits and any related litigation can materially differ from our historical income tax provisions and accruals, resulting in an adverse effect on our financial performance.
A disruption or loss of data sources could limit our collection and use of certain kinds of information, which could adversely impact our communication with our customers.
Several of our businesses rely extensively upon content and data from external sources. Data is obtained from public records, governmental authorities, customers, and other information companies, including competitors. Legal regulations, such as the EU’s GDPR, relating to Internet communications, privacy and data protection, e-commerce, information governance, and use of public records, are becoming more prevalent worldwide. The disruption or loss of data sources, either because of changes in the law or because data suppliers decide not to supply them, may impose limits on our collection and use of certain kinds of information about individuals and our ability to communicate such information effectively with our customers. In addition, GDPR imposes a strict data protection compliance regime with severe penalties of up to 4% of worldwide revenue or €20 million, whichever is greater.
If we fail to maintain proper and effective internal controls, our ability to produce accurate financial statements on a timely basis could be impaired.
We are subject to the reporting requirements of the Securities Exchange Act of 1934, the Sarbanes-Oxley Act (Sarbanes-Oxley Act), and the rules and regulations of the New York Stock Exchange. The Sarbanes-Oxley Act requires, among other things, that we maintain effective disclosure controls and procedures and internal control over financial reporting. We are required to perform system and process evaluations and testing of our internal control over financial reporting to allow management to report on the effectiveness of our internal control over financial reporting in our Annual Report on Form 10-K, as required by Section 404 of the Sarbanes-Oxley Act. This may require us to incur substantial additional professional fees and internal costs to further expand our accounting and finance functions and expend significant management efforts.
We may in the future discover material weaknesses in our system of internal financial and accounting controls and procedures that could result in a material misstatement of our financial statements. In addition, our internal control over financial reporting will not prevent or detect all errors and all fraud. A control system, no matter how well designed and operated, can provide only reasonable, not absolute, assurance that the control system’s objectives will be met. Because of the inherent limitations in all control systems, no evaluation of controls can provide absolute assurance that misstatements due to errors or fraud will not occur, or that all control issues and instances of fraud will be detected.
If we are not able to comply with the requirements of Section 404 of the Sarbanes-Oxley Act in a timely manner, or if we are unable to maintain proper and effective internal controls, we may not be able to produce timely and accurate financial statements. If that were to happen, the market price of our stock could decline, and we could be subject to sanctions or investigations by the SEC or other regulatory authorities.
General Risks
Global economic, market, public health, and geopolitical conditions or other events could negatively impact our consolidated financial positions and results of operations.
We are exposed to risks and uncertainties caused by factors beyond our control, including global economic, public health, and geopolitical conditions. These include economic weakness, softness in consumer and corporate spending, uncertainty and volatility, including the potential for a recession; a competitive labor market and evolving workforce expectations; inflation, rising interest rates; public health crisis, including pandemics; financial stability of the banking industry, and political and sociopolitical uncertainties and conflicts. The potential escalation of trade tensions between the US and China could slow down China's economy, which could impact Research Publishing, accelerate China's move towards Transformational Agreements, lead to caps on APCs and/or pressure to publish in non-US journals, and increase risks related to exchange rate fluctuations. These factors may result in declines and/or volatility in our results or stock price. Our general business strategy may be adversely affected by any such economic downturn, volatile business environment, or continued unpredictable and unstable market conditions. Our business could also be impacted by volatility caused by geopolitical events, such as the conflict in Ukraine. In addition, the actual or perceived effects of a disease outbreak, epidemic, pandemic, or similar widespread public health concern, such as COVID-19, could also materially and adversely affect our results. The future impact that global economic, public health, and geopolitical conditions will have on our business operations and financial results is uncertain and will depend on numerous evolving factors and developments that we are not able to reliably predict or mitigate. It is also possible that these conditions may impact other risks discussed in this section.
Changes in US and foreign government administrative policy, including the imposition of or increases in tariffs and changes to existing trade agreements, and other changes to macroeconomic conditions could have a material adverse effect on global economic conditions and our business, results of operations, and financial condition.
As a result of changes to US and foreign government administrative policy, there may be changes to existing trade agreements, greater restrictions on free trade generally, the imposition of or significant increases in tariffs on goods imported into or exported from the US, and adverse responses by foreign governments to US trade policies, among other possible changes. As the implementation of tariffs is ongoing, more tariffs may be added in the future. These tariffs could have an adverse impact on our business, results of operations, financial condition, and if we are unable to pass such price increases through to our customers, it would likely increase our cost of sales and, as a result, decrease our margins, operating income, and net income.
As of the date of this Annual Report on Form 10-K, discussions remain ongoing in respect of certain trade restrictions and tariffs on imports from Canada, China, Mexico, and Europe, as well as retaliatory tariffs enacted in response to such actions. Any of these factors could depress economic activity and restrict our access to suppliers or customers and, in turn, have a material adverse effect on the business and financial condition of such suppliers and customers or other counterparties we do business with, which in turn would negatively impact our consolidated financial position and results of operations.
The trading price of the shares of our common stock may fluctuate materially, and investors of our common stock could incur substantial losses.
Our stock price may fluctuate materially. The stock market in general has experienced significant volatility that has often been unrelated to the operating performance of companies. As a result of this volatility, investors may not be able to sell their common stock at or above the price paid for the shares. The market price for our common stock may be influenced by many factors, including:
•Actual or anticipated changes in our consolidated operating results;
•Variances between actual consolidated operating results and the expectations of securities analysts, investors, and the financial community;
•Changes in financial estimates by us or by any securities analysts who might cover our stock;
•Conditions or trends in our industry, the stock market, or the economy;
•The level of demand for our stock, the stock market price, and volume fluctuations of comparable companies;
•Announcements by us or our competitors of new product or service offerings, significant acquisitions, strategic partnerships, or divestitures;
•Announcements of investigations or regulatory scrutiny of our operations or lawsuits filed against us;
•Capital commitments;
•Investors’ general perception of the Company and our business;
•Recruitment or departure of key personnel; and
•Sales of our common stock, including sales by our directors and officers or specific stockholders.
Adverse publicity could negatively impact our reputation, which could adversely affect our consolidated financial position and results of operations.
Our professional customers worldwide rely upon many of our publications to perform their jobs. It is imperative that we consistently demonstrate our ability to maintain the integrity of the information included in our publications. Adverse publicity, whether valid or not, may reduce demand for our publications and adversely affect our consolidated financial position and results of operations.
Item 1B. Unresolved Staff Comments
None.
Item 1C. Cybersecurity
Risk Management and Strategy
Wiley is committed to maintaining robust cybersecurity practices to safeguard our operations, data, and stakeholders’ interests. We monitor our cybersecurity landscape and adapt our strategies and governance practices to mitigate risks in this rapidly evolving area.
Wiley adopted the National Institute of Standards and Technology Cybersecurity Framework (NIST-CSF) as a guide for its cybersecurity program to establish and maintain a continuous improvement process for identifying, assessing, and managing cyber risks and cyber-related threats. Informed by the NIST-CSF, we maintain a cybersecurity risk management program that is designed to identify, assess, manage, and mitigate cybersecurity risks and provides a framework for handling cybersecurity threats and incidents, including threats and incidents associated with the use of services provided by third-party service providers. To secure our technology environment, our organization leverages the latest software and security capabilities with a defense-in-depth and layered strategy. We deploy endpoint detection and response, network anomaly detection, and multi-factor authentication across most of our environment. We engage with various third-party consultants as well as utilize various threat intelligence services to assist in our oversight and to identify risks. We require employees with access to our information systems, including all corporate employees and consultants, to undertake annual data protection and cybersecurity training and ongoing phishing simulation exercises. In addition, Wiley’s controls are also monitored and tested on a continuous basis by an external third-party to assess the effectiveness of our cyber program.
Based on the information we have as of the date of this Annual Report on Form 10-K, we do not believe that any cybersecurity incident experienced by the Company has materially affected or is reasonably likely to materially affect Wiley, including our business strategy, results of operations, or financial condition. For additional information about cybersecurity risks, see Item 1A. “Risk Factors.”
Governance
Our Board is responsible for the overall oversight of our enterprise risk management. The Board receives regular updates on the key risks to the organization on a quarterly basis. The Board has delegated oversight of cybersecurity risks to the Audit Committee. The Audit Committee receives quarterly and yearly cybersecurity updates from the Company’s Chief Information & Security Officer (CISO), which includes updates on the Company’s cybersecurity policies and strategies, cyber risks and threats, the status of projects designed to continuously improve the Company’s information security systems, assessments of the Company’s security program, employee training and awareness programs, emerging threat landscape, and engagement with external cybersecurity experts and advisors, as needed.
Management’s Role
Management is responsible for day-to-day risk management activities, including identifying and assessing cybersecurity risks, establishing processes to ensure that potential cybersecurity risk exposures are monitored, implementing appropriate mitigation or remediation measures, and maintaining cybersecurity programs. Risk mitigation strategies and key performance indicators are defined, and tracked, as part of the quarterly internal reporting. The information security team consists of subject matter experts in the fields of security operations, governance risk and compliance (GRC), application security, fraud, identity and access management, and security architecture. Our security operation center (SOC) monitors the prevention, detection, mitigation, and remediation of cybersecurity incidents through a variety of technical and operational measures and regularly reports to our CISO. Our CISO is part of the senior management team and regularly updates the Audit Committee on the company’s cybersecurity program, including cybersecurity risks, incidents, and mitigation strategies.
The information security team is led by the CISO who has 29 years of experience in business risk management and cybersecurity. The information security team has established processes and procedures that guide and enable continuous monitoring, detection, prevention, mitigation, and remediation of cybersecurity incidents. These processes are carried out using various security platforms tools, capabilities, and strategies including tests of our information security program, tabletop exercises, penetration and vulnerability testing, and other exercises to evaluate the effectiveness of our information security program and improve our security measures and planning. Incident response teams within the SOC utilize procedures that identify escalation paths when security events are identified. Incident priorities dictate escalation of events and how they are reported from an incident commander up to the executive leadership team within Wiley as well as to the Board.
Despite our efforts, we cannot eliminate all risks from cybersecurity threats or provide assurances that we have not experienced an undetected cybersecurity incident. The threat landscape is constantly changing and will continue to as new technologies, such as AI, evolve.
Item 2. Properties
We occupy office, warehouse, and distribution facilities in various parts of the world, as listed below (excluding those locations with less than 10,000 square feet of floor area, none of which are considered material property).
Due to the increased use of virtual work arrangements and our various restructuring programs, we exited certain leased office space, subleased certain office spaces, and reduced occupancy at other facilities. In Part II, Item 8, “Financial Statements and Supplementary Data”
see Note 7, “Restructuring and Related Charges,” of the Notes to Consolidated Financial Statements for details of these restructuring programs.
All of the current buildings and the equipment owned or leased are believed to be in good operating condition and are suitable for the conduct of our business.
|
|
|
|
|
|
|
|
|
|
|
|
|
|
|
|
|
|
|
|
|
| Location |
|
Purpose |
|
Owned or Leased |
|
Approx. Sq. Ft. |
| United States: |
|
|
|
|
|
|
| New Jersey |
|
Corporate Headquarters |
|
Leased |
|
247,000 |
| Indiana |
|
Office |
|
Leased |
|
42,000 |
| Massachusetts |
|
Office |
|
Leased |
|
26,000 |
| North Carolina |
|
Office |
|
Leased |
|
12,000 |
|
|
|
|
|
|
|
| International: |
|
|
|
|
|
|
| England |
|
Distribution Centers |
|
Leased |
|
298,000 |
|
|
Offices |
|
Leased |
|
64,000 |
Germany |
|
Office |
|
Owned |
|
104,000 |
|
|
Office |
|
Leased |
|
14,000 |
India |
|
Distribution Centers |
|
Leased |
|
20,000 |
|
|
Office |
|
Leased |
|
25,000 |
| China |
|
Offices |
|
Leased |
|
40,000 |
| Sri Lanka |
|
Office |
|
Leased |
|
26,000 |
| Jordan |
|
Office |
|
Leased |
|
24,000 |
| Brazil |
|
Office |
|
Leased |
|
12,000 |
| Greece |
|
Office |
|
Leased |
|
11,000 |
Item 3. Legal Proceedings
The information set forth in Part II, Item 8, “Financial Statements and Supplementary Data” in
Note 16, “Commitment and Contingencies,” of the Notes to Consolidated Financial Statements is incorporated herein by reference.
We are involved in routine litigation in the ordinary course of our business. In the opinion of management, the ultimate resolution of all pending litigation will not have a material effect upon our consolidated financial position or results of operations.
Item 4. Mine Safety Disclosures
Not applicable.
PART II
Item 5. Market for Registrant’s Common Equity, Related Stockholder Matters, and Issuer Purchases of Equity Securities
Our Class A and Class B shares are listed on the New York Stock Exchange under the symbols WLY and WLYB, respectively.
On a quarterly basis, the Board of Directors considers the payment of cash dividends based upon its review of earnings, our financial position, and other relevant factors. As of May 31, 2025, the approximate number of holders of our Class A and Class B Common Stock were 667 and 42, respectively, based on the holders of record.
During the year ended April 30, 2020, our Board of Directors approved a share repurchase program of $200 million of Class A or B Common Stock. As of April 30, 2025, we had authorization from our Board of Directors to purchase up to $57.4 million that was remaining under this program.
During the fourth quarter of fiscal year 2025, we made the following purchases of Class A and Class B Common Stock under the publicly announced stock repurchase program.
|
|
|
|
|
|
|
|
|
|
|
|
|
|
|
|
|
|
|
|
|
|
|
|
|
|
|
|
|
|
|
Total Number
of Shares Purchased |
|
Average Price
Paid Per Share(1)
|
|
Total Number
of Shares Purchased
as Part of a Publicly
Announced Program |
|
Maximum Number
of Shares that
May Be Purchased
Under the Program |
|
Maximum Dollar Value
of Shares that May Yet
Be Purchased Under
Additional Plans or
Programs
(Dollars in Millions) |
| February 2025 |
— |
|
$ |
— |
|
|
— |
|
— |
|
$ |
82.4 |
|
| March 2025 |
139,467 |
|
44.51 |
|
|
139,467 |
|
— |
|
76.2 |
|
| April 2025 |
435,510 |
|
43.15 |
|
|
435,510 |
|
— |
|
57.4 |
|
| Total |
574,977 |
|
$ |
43.48 |
|
|
574,977 |
|
— |
|
$ |
57.4 |
|
|
|
|
|
|
|
(1) |
Average price per share excludes excise taxes payable on share repurchases. |
Performance Graph
The below graph provides an indicator of the cumulative total return to shareholders of the Company’s Class A Common Stock as compared with the cumulative total return on the Russell 2000, the Dow Jones Publishing Index, and the S&P 400 Midcap, for the period from April 30, 2020 to April 30, 2025. The Company has elected to use the Russell 2000 Index and the S&P 400 Midcap index as its broad equity market indices because it is currently included in these indices. Cumulative total return assumes $100.00 invested on April 30, 2020, and reinvestment of dividends throughout the period.
|
|
|
|
|
|
|
|
|
|
|
|
|
|
|
|
|
|
|
|
|
|
April 30, 2020 |
April 30, 2021 |
April 30, 2022 |
April 30, 2023 |
April 30, 2024 |
April 30, 2025 |
| WLY |
$ |
100.00 |
|
$ |
156.77 |
|
$ |
143.65 |
|
$ |
112.72 |
|
$ |
114.36 |
|
$ |
137.11 |
|
| Russell 2000 |
$ |
100.00 |
|
$ |
174.88 |
|
$ |
145.33 |
|
$ |
139.99 |
|
$ |
158.58 |
|
$ |
159.94 |
|
| Dow Pub |
$ |
100.00 |
|
$ |
166.59 |
|
$ |
148.09 |
|
$ |
140.09 |
|
$ |
173.86 |
|
$ |
205.43 |
|
| S&P 400 |
$ |
100.00 |
|
$ |
167.89 |
|
$ |
156.04 |
|
$ |
158.04 |
|
$ |
184.57 |
|
$ |
186.72 |
|
Item 6. [Reserved]
Item 7. Management’s Discussion and Analysis of Financial Condition and Results of Operations
The information in our Management’s Discussion and Analysis of Financial Condition and Results of Operations (MD&A) should be read together with our Consolidated Financial Statements and related notes set forth in Part II, Item 8, as well as the discussion included in Part I, Item 1, “Business,” “Cautionary Notice Regarding Forward-Looking Statements “Safe Harbor” Statement under the Private Securities Litigation Reform Act of 1995” and “Non-GAAP Financial Measures,” along with Part I, Item 1A, “Risk Factors,” of this Annual Report on Form 10-K. All amounts and percentages are approximate due to rounding and all dollars are in thousands, except per share amounts or where otherwise noted. When we cross-reference to a “Note,” we are referring to our “Notes to Consolidated Financial Statements,” in Part II, Item 8, “Financial Statements and Supplementary Data” unless the context indicates otherwise.
Overview
Wiley is one of the world’s largest publishers and a global leader in research and learning. The Company’s content, services, platforms, and knowledge networks are tailored to meet the evolving needs of its customers and partners, including researchers, students, instructors, professionals, institutions, and corporations. Wiley is a predominantly digital company with 83% of its Adjusted Revenue for the year ended April 30, 2025, generated by digital products and services. For the year ended April 30, 2025, 48% of Adjusted Revenue is recurring which includes revenue that is contractually obligated or set to recur with a high degree of certainty. See below for the reconciliation of consolidated Revenue to Adjusted Revenue.
We report financial information for the following reportable segments, as well as a Corporate category, which includes certain costs that are not allocated to the reportable segments:
•Research includes the reporting lines of Research Publishing and Research Solutions;
•Learning includes the Academic and Professional reporting lines and consists of publishing, courseware, and assessments.
Wiley also reports a Held for Sale or Sold segment, which primarily includes non-core businesses which were classified as held-for-sale until the date of sale, as well other businesses which were sold as described further below.
Through the Research segment, we provide peer-reviewed scientific, technical, and medical (STM) journals, content platforms, and related publishing and audience solutions to academic, corporate, and government customers, academic societies, and individual researchers. The Learning segment provides scientific, professional, and education print and digital books to researchers, professionals, and students, digital courseware for instructors and students, and assessment services to businesses and professionals.
Wiley’s business strategies are tightly aligned with consistent long-term growth trends, including ever-increasing global R&D investment, leading to growth in scientific research output and the number of institutions and researchers worldwide. These strategies include expanding our publishing program and journal portfolio to meet the global demand for peer-reviewed research, driving additional value in our subscription-based models for universities and corporations, volume-based models for open access, content licensing opportunities for applications in science and innovation, and content platform and service offerings for corporations and societies. Learning strategies include selectively scaling high-value digital content, courseware, and assessments to meet targeted opportunities in education and professional development.
Consolidated Results of Operations
FISCAL YEAR 2025 AS COMPARED TO FISCAL YEAR 2024 SUMMARY RESULTS
SUMMARY
•US GAAP Results: Revenue of $1,677.6 million (-10% compared with the prior year due to foregone revenue from divested businesses), Operating income of $221.4 million ($+169.1 million compared with the prior year), and Diluted Earnings per Share of $1.53 (+$5.18 compared with the prior year).
•Adjusted Results at Constant Currency (excluding Held for Sale or Sold segment results): Adjusted Revenue of $1,660.2 million (+3% compared with the prior year), Adjusted Operating Income of $250.5 million (+29%, compared with the prior year), Adjusted EBITDA of $397.7 million (+8% compared with the prior year), and Adjusted EPS of $3.64 (+31% compared with the prior year).
•Net Cash Provided by Operating Activities of $202.6 million ($-5.0 million compared with the prior year), and Free Cash Flow Less Product Development Spending of $125.9 million ($+11.6 million compared with the prior year)
Revenue:
Revenue for the year ended April 30, 2025, decreased $195.4 million, or 10%, as compared with the prior year. On a constant currency basis, revenue decreased 10% as compared with the prior year. Excluding the revenues from the Held for Sale or Sold segment, Adjusted Revenue increased 3% on a constant currency basis. AI license revenue was $40 million in the year ended April 30, 2025 compared to $23 million in the prior year.
Adjusted Revenue
Below is a reconciliation of our consolidated US GAAP Revenue, net to Non-GAAP Adjusted Revenue, net:
|
|
|
|
|
|
|
|
|
|
|
|
|
Year Ended
April 30, |
|
2025 |
|
2024 |
US GAAP Revenue, net |
$ |
1,677,609 |
|
|
$ |
1,872,987 |
|
Less: Held for Sale or Sold Segment (1) |
(17,382) |
|
|
(255,543) |
|
Non-GAAP Adjusted Revenue, net |
$ |
1,660,227 |
|
|
$ |
1,617,444 |
|
|
|
|
|
|
|
| (1) |
Our Adjusted Revenue net excludes the impact of our Held for Sale or Sold segment revenue. |
See the “Segment Operating Results” below for additional details on each segment’s revenue and Adjusted EBITDA performance.
Cost of Sales:
Cost of sales for the year ended April 30, 2025, of $431.4 million, decreased $148.3 million, or 26% as compared with the prior year. On a constant currency basis, cost of sales decreased 26% as compared with the prior year primarily due to the prior year including employee and marketing costs related to the University Services business which was sold on January 1, 2024 and, to a lesser extent, lower employee costs related to the Wiley Edge business which was sold on May 31, 2024.
Excluding the cost of sales from the Held for Sale or Sold segment, cost of sales decreased 1% on a constant currency basis primarily due to lower product development and inventory-related costs, partially offset by higher royalty costs.
Operating and Administrative Expenses:
Operating and administrative expenses for the year ended April 30, 2025, of $947.4 million decreased $66.1 million, or 7%, as compared with the prior year. On a constant currency basis, operating and administrative expenses decreased 7% as compared with the prior year primarily reflecting lower employee related costs and, to a lesser extent, lower depreciation and amortization, partially offset by an increase in enterprise modernization costs.
Excluding the operating and administrative expenses from the Held for Sale or Sold segment, operating and administrative expenses decreased 1% as compared with the prior year on a constant currency basis primarily due to lower depreciation and amortization and, to a lesser extent, employments costs, partially offset by an increase in enterprise modernization costs.
Impairment of Goodwill:
We recorded an impairment of goodwill in the year ended April 30, 2024, of $108.4 million. This charge is reflected in the Impairment of goodwill in the Consolidated Statements of Income (Loss).
Due to the segment realignment in the first quarter of fiscal year 2024, we were required to test goodwill for impairment immediately before and after our segment realignment in accordance with applicable accounting standards. Prior to the realignment, we concluded that the fair value of the University Services reporting unit within the former Academic segment was below its carrying value, which resulted in a pretax noncash goodwill impairment of $11.4 million. University Services was adversely impacted by market conditions and headwinds for online degree programs, which led to a decline in projected enrollments from existing partners, pricing pressures and revenue share concessions, and a decline in new partner additions over both the short-term and long-term which adversely impacted forecasted revenue growth and operating cash flows. Such impairment reduced the goodwill of the University Services reporting unit to zero.
After the realignment, we concluded that the fair value of the CrossKnowledge reporting unit within the Held for Sale or Sold segment was below its carrying value, which resulted in a pretax noncash goodwill impairment of $15.3 million. CrossKnowledge was adversely impacted by a decline in the demand for its offerings, which resulted in lower sales and a decline in average contract value, that adversely impacted forecasted revenue growth and operating cash flows. Such impairment reduced the goodwill of the CrossKnowledge reporting unit to zero.
As a result of signing the agreement to sell Wiley Edge and the decrease in the fair value of the business which was impacted by a decline in placements in the third quarter of fiscal year 2024, we tested the goodwill of the Wiley Edge reporting unit within the Held for Sale or Sold segment for impairment. We concluded that the fair value of the Wiley Edge reporting unit was below its carrying value, which resulted in a pretax noncash goodwill impairment of $81.7 million in the three months ended January 31, 2024. Such impairment reduced the goodwill of the Wiley Edge reporting unit to zero.
See Note 11, “Goodwill and Intangible Assets” for details on these charges.
Restructuring and Related Charges:
We recorded restructuring and related charges in the years ended April 30, 2025 and 2024 of $25.6 million and $63.0 million, respectively. These charges are reflected in the Restructuring and related charges in the Consolidated Statements of Income (Loss).
Global Restructuring Program
Beginning in fiscal year 2023, the Company initiated the Global Restructuring Program which was expanded in fiscal year 2024 to include those actions that will focus Wiley on its leading global position in the development and application of new knowledge and drive greater profitability, growth, and cash flow. We will focus on our strongest and most profitable businesses and large market opportunities in Research and Learning, as well as streamline our organization and rightsize our cost structure to reflect these portfolio actions. Under this program, we reduced our real estate square footage occupancy by approximately 35%.
In the fourth quarter of fiscal year 2025, the program was further extended due to the completion of our divestitures with a focus on optimizing our cost structure, with particular emphasis on aligning our technology costs and other corporate expenses. As a result of these initiatives, this expanded program will include severance related charges, facility-related costs associated with certain properties, and other activities.
Excluding actions related to the Held for Sale or Sold segment, we anticipate to yield annualized cost savings of approximately $100 million, with approximately $80 million of that realized this fiscal year from actions taken starting in fiscal year 2024.
For the years ended April 30, 2025 and 2024, we recorded pretax restructuring charges of $29.4 million and $61.6 million, respectively, related to this program.
See Note 7, “Restructuring and Related Charges” for more details on these charges.
Business Optimization Program
For the years ended April 30, 2025 and 2024, we recorded pretax restructuring credits of $(3.8) million and charges of $1.4 million, respectively, related to this program.
See Note 7, “Restructuring and Related Charges” for more details on these credits and charges.
For the impact of our restructuring programs on diluted earnings (loss) per share, see the section below, “Diluted Earnings (Loss) per Share (EPS).”
Amortization of Intangible Assets:
Amortization of intangible assets was $51.8 million for the year ended April 30, 2025, a decrease of $4.2 million, or 7% as compared with the prior year. On a constant currency basis, amortization of intangible assets decreased 8% as compared with the prior year primarily due to the cessation of amortization for held-for-sale assets and the completion of amortization of certain acquired intangible assets.
See Note 4, “Acquisitions and Divestitures” for more details on these divestitures.
Operating Income, Adjusted Operating Income (OI) and Adjusted EBITDA:
Operating income for the year ended April 30, 2025, of $221.4 million increased $169.1 million, as compared with the prior year. On a constant currency basis, the operating income increase was consistent with the reported increase as compared with the prior year. The increase was primarily due to lower costs of sales, and the $108.4 million impairment of goodwill in the prior year and, to a lesser extent, lower operating and administrative expenses, and restructuring charges, partially offset by a decrease in revenue.
Adjusted OI on a constant currency basis increased 29% as compared with the prior year. The increase in Adjusted OI was primarily due to an increase in Adjusted Revenue and, to a lesser extent, lower operating and administrative expenses.
Adjusted EBITDA on a constant currency basis increased 8% as compared with the prior year primarily due to an increase in Adjusted Revenue, partially offset by higher operating and administrative expenses.
Adjusted OI
Below is a reconciliation of our consolidated US GAAP Operating Income to Non-GAAP Adjusted OI:
|
|
|
|
|
|
|
|
|
|
|
|
|
Year Ended
April 30, |
|
2025 |
|
2024 |
US GAAP Operating Income |
$ |
221,409 |
|
|
$ |
52,261 |
|
| Adjustments: |
|
|
|
Restructuring and related charges |
25,561 |
|
|
63,041 |
|
| Impairment of goodwill |
— |
|
|
108,449 |
|
Held for Sale or Sold segment Adjusted Operating Loss (Income) (1) |
3,578 |
|
|
(28,711) |
|
Non-GAAP Adjusted OI |
$ |
250,548 |
|
|
$ |
195,040 |
|
|
|
|
|
|
|
(1) |
Our Adjusted OI excludes the impact of our Held for Sale or Sold segment Adjusted Operating Loss or (Income). |
Adjusted EBITDA
Below is a reconciliation of our consolidated US GAAP Net Income (Loss) to Non-GAAP EBITDA and Adjusted EBITDA:
|
|
|
|
|
|
|
|
|
|
|
|
|
Year Ended
April 30, |
|
2025 |
|
2024 |
Net Income (Loss) |
$ |
84,161 |
|
|
$ |
(200,319) |
|
| Interest expense |
52,547 |
|
|
49,003 |
|
Provision for income taxes |
58,717 |
|
|
13,272 |
|
| Depreciation and amortization |
147,126 |
|
|
176,989 |
|
| Non-GAAP EBITDA |
342,551 |
|
|
38,945 |
|
| Impairment of goodwill |
— |
|
|
108,449 |
|
Restructuring and related charges |
25,561 |
|
|
63,041 |
|
Net foreign exchange transaction losses |
8,142 |
|
|
2,959 |
|
Net loss on sale of businesses, assets, and impairment charges related to assets held-for-sale |
23,340 |
|
|
183,389 |
|
Other (income) expense, net |
(5,498) |
|
|
3,957 |
|
Held for Sale or Sold segment Adjusted EBITDA (1) |
3,578 |
|
|
(32,148) |
|
| Non-GAAP Adjusted EBITDA |
$ |
397,674 |
|
|
$ |
368,592 |
|
|
|
|
|
|
|
(1) |
Our Non-GAAP Adjusted EBITDA excludes the Held for Sale or Sold segment Non-GAAP Adjusted EBITDA. |
Interest Expense:
Interest expense for the year ended April 30, 2025, was $52.5 million compared with the prior year of $49.0 million. This increase was primarily due to a higher weighted average effective interest rate on borrowings.
Foreign Exchange Transaction (Losses):
Foreign exchange transaction losses were $(8.1) million for the year ended April 30, 2025, and were primarily due to losses on our intercompany accounts receivable and payable balances and, to a lesser extent, losses on our foreign currency denominated third-party receivable and payable balances due to the impact of the change in average foreign exchange rates as compared to the US dollar. In the year ended April 30, 2025, we wrote off an additional net gain of $1.4 million in cumulative translation adjustments from our Russian entity which was formally liquidated in the fourth quarter of fiscal year 2025.
Foreign exchange transaction losses were $(3.0) million for the year ended April 30, 2024, and were primarily due to losses on our foreign currency denominated third-party receivable and payable balances and, to a lesser extent, losses on our intercompany accounts receivable and payable balances due to the impact of the change in average foreign exchange rates as compared to the US dollar. In fiscal year 2023, due to the closure of our operations in Russia, our Russian entity was deemed substantially liquidated. As a result, cumulative translation adjustments associated with that entity were recognized. In the year ended April 30, 2024, we wrote off an additional net gain of $1.0 million in cumulative translation adjustments from our Russian entity.
Net Loss on Sale of Businesses, Assets, and Impairment Charges Related to Assets Held-for-Sale:
For the years ended April 30, 2025 and 2024, we recorded pretax loss on sale of businesses, assets, and impairment charges related to assets held-for-sale as follows:
|
|
|
|
|
|
|
|
|
|
|
|
|
Year Ended
April 30, |
|
2025 |
|
2024 |
| CrossKnowledge |
$ |
4,119 |
|
|
$ |
(55,440) |
|
| Wiley Edge |
(14,852) |
|
|
(19,401) |
|
| University Services |
(12,578) |
|
|
(107,048) |
|
| Tuition Manager |
120 |
|
|
(1,500) |
|
| Sale of assets |
(149) |
|
|
— |
|
Net loss on sale of businesses, assets, and impairment charges related to assets held-for-sale |
$ |
(23,340) |
|
|
$ |
(183,389) |
|
These charges are reflected in Net (loss) gain on sale of businesses, assets, and impairment charges related to assets held-for-sale on our Consolidated Statements of Income (Loss).
On August 31, 2024, we completed the sale of CrossKnowledge which was included in our Held for Sale or Sold segment. The pretax loss on sale was $51.3 million after accounting for the assets sold, liabilities transferred upon sale, transaction costs, and the write-off of cumulative translation adjustments in earnings. In connection with the held-for-sale classification prior to the sale, we recognized cumulative impairment charges of $51.0 million on the remeasurement of the disposal group at the lower of carrying value or fair value less costs to sell, which included $55.4 million recognized in fiscal year 2024. Upon the completion of the sale, we recognized a net gain of $4.1 million in the year ended April 30, 2025, primarily due to subsequent changes in the fair value less costs to sell, as well as changes in the carrying amount of the disposal group.
On May 31, 2024, we completed the sale of Wiley Edge which was included in our Held for Sale or Sold segment, with the exception of its India operations which sold on August 31, 2024. The pretax loss on sale was $34.3 million after accounting for the assets sold, liabilities transferred upon sale, transaction costs, and the write-off of cumulative translation adjustments in earnings. In connection with the held-for-sale classification, during fiscal year 2024, we recognized cumulative impairment charges of $19.4 million on the remeasurement of the disposal group at the lower of carrying value or fair value less costs to sell. Upon the completion of the sale, we recognized a net loss of $14.9 million in the year ended April 30, 2025, primarily due to subsequent changes in the fair value less costs to sell including reducing the fair value of the contingent consideration in the form of an earnout from $15.0 million to zero in the third quarter of fiscal year 2025, partially offset by the sale of the India operations. See
Note 4, "Acquisitions and Divestitures" for further details.
On January 1, 2024, we completed the sale of University Services, which was included in our Held for Sale or Sold segment. On June 5, 2025, Wiley entered into an agreement with Metis Aggregator L.P. and Vistria AP Aggregator, LLC to sell the Seller Note, the fiscal year 2026 University Services Earnout, and the TVG Investment, and agreed with Upper Holdings and Academic Partnerships on the fiscal year 2025 University Services Earnout for total cash consideration of $119.5 million (Sale Agreement), which was fully paid in June 2025. As a result of this Sale Agreement, all amounts due to Wiley in accordance with the University Services Agreement have been settled. In the year ended April 30, 2025, due to the process of selling these assets, as well as third-party customer consents, working capital adjustments, and changes in the costs to sell, we recognized an additional net loss on sale and impairments of assets of $12.6 million.
In the year ended April 30, 2025, there was a reduction in the pretax loss on the sale of our Tuition Manager business previously in our Held for Sale or Sold segment of $0.1 million due to a selling price adjustment for cash received after the closing.
In the year ended April 30, 2025, we sold a facility which was reflected in Technology, property, and equipment, net in our Consolidated Statements of Financial Position which resulted in a pretax loss on sale of $0.2 million.
In the year ended April 30, 2024, we recorded a held-for-sale pretax impairment of $74.8 million which includes $19.4 million for Wiley Edge and $55.4 million for CrossKnowledge. The pretax loss on the sale of University Services and Tuition Manager was $107.0 million and $1.5 million, respectively.
See Note 4, “Acquisitions and Divestitures” for more details on these divestitures.
Other Income (Expense), Net:
Other income, net was $5.5 million for the year ended April 30, 2025 compared with the prior year Other (expense), net of $(4.0) million, an increase of $9.5 million. This change was primarily due to an increase in interest income related to the seller notes as a result of the sale of University Services and Wiley Edge.
See Note 4, “Acquisitions and Divestitures” for more details on these divestitures.
Provision for Income Taxes:
Below is a reconciliation of our US GAAP Income (Loss) Before Taxes to Non-GAAP Adjusted Income Before Taxes:
|
|
|
|
|
|
|
|
|
|
|
|
|
Year Ended
April 30, |
|
2025 |
|
2024 |
US GAAP Income (Loss) Before Taxes |
$ |
142,878 |
|
|
$ |
(187,047) |
|
| Pretax Impact of Adjustments: |
|
|
|
| Impairment of goodwill |
— |
|
|
108,449 |
|
Restructuring and related charges |
25,561 |
|
|
63,041 |
|
| Foreign exchange losses on intercompany transactions, including the write off of certain cumulative translation adjustments |
5,590 |
|
|
1,903 |
|
| Amortization of acquired intangible assets |
51,864 |
|
|
57,874 |
|
Net loss on sale of businesses, assets, and impairment charges related to assets held-for-sale |
23,340 |
|
|
183,389 |
|
Held for Sale or Sold segment Adjusted Income Before Taxes (1) |
3,578 |
|
|
(30,661) |
|
| Non-GAAP Adjusted Income Before Taxes |
$ |
252,811 |
|
|
$ |
196,948 |
|
|
|
|
|
|
|
(1) |
Our Adjusted Income Before Taxes excludes the Adjusted Income Before Taxes of our Held for Sale or Sold segment. |
Below is a reconciliation of our US GAAP Income Tax Provision to Non-GAAP Adjusted Income Tax Provision, including our US GAAP Effective Tax Rate and our Non-GAAP Adjusted Effective Tax Rate:
|
|
|
|
|
|
|
|
|
|
|
|
|
Year Ended
April 30, |
|
2025 |
|
2024 |
| US GAAP Income Tax Provision |
$ |
58,717 |
|
$ |
13,272 |
Income Tax Impact of Adjustments (1): |
|
|
|
| Impairment of goodwill |
— |
|
2,953 |
Restructuring and related charges |
5,947 |
|
15,662 |
| Foreign exchange losses on intercompany transactions, including the write off of certain cumulative translation adjustments |
1,170 |
|
582 |
| Amortization of acquired intangible assets |
10,231 |
|
20,127 |
Net loss on sale of businesses, assets, and impairment charges related to assets held-for-sale |
2,368 |
|
26,908 |
Held for Sale or Sold segment Adjusted Tax Provision (2) |
807 |
|
(7,140) |
| Income Tax Adjustments |
|
|
|
Impact of valuation allowance on the US GAAP effective tax rate (3) |
(26,008) |
|
(30,249) |
Impact of change in certain US state tax rates in 2025 (4) |
(117) |
|
— |
| Non-GAAP Adjusted Income Tax Provision |
$ |
53,115 |
|
$ |
42,115 |
|
|
|
|
| US GAAP Effective Tax Rate |
41.1 |
% |
|
(7.1) |
% |
| Non-GAAP Adjusted Effective Tax Rate |
21.0 |
% |
|
21.4 |
% |
|
|
|
|
|
|
(1) |
For the years ended April 30, 2025 and 2024, substantially all of the tax impact was from deferred taxes. |
(2) |
Our Adjusted Income Tax Provision excludes the Adjusted Tax Provision of our Held for Sale or Sold segment. |
(3) |
In the years ended April 30, 2025 and 2024, there was a $26.0 million and $30.2 million, respectively, impact on the US GAAP effective tax rate due to the valuation allowance on deferred tax assets in the US. |
(4) |
Change in the allocation of state apportionment factors and applicable state tax rates. |
The Company's effective tax rate for the year ended April 30, 2025, was primarily driven by the impact of the US valuation allowance, the rates of tax imposed on income earned in foreign jurisdictions, and state taxes.
In fiscal year 2024, due to temporary differences in the US, our deferred taxes reversed from a net deferred tax liability position to a net deferred tax asset position. Due to losses in the US resulting from impairments, restructuring, and acceleration of amortization expense on capitalized software, we concluded it was more-likely-than-not that all or a portion of our deferred tax asset may not be realized. As a result, we established a valuation allowance of $30.2 million. During fiscal year 2025 we increased this valuation allowance by $26.0 million, because of an increase in the US net deferred tax asset attributable primarily to interest expense disallowance and the capitalization of R&D expenses.
Excluding the restructuring and related charges, impact of valuation allowance, and other adjustments noted in the table above, the Non-GAAP Adjusted Effective Tax Rate for the year ended April 30, 2025, was 21.0%. The Non-GAAP Adjusted Effective Tax Rate for the year ended April 30, 2024, was 21.4%. The decrease in the Non-GAAP Adjusted Effective Tax Rate before these items was primarily due to the mix of earnings by jurisdiction for the year ended April 30, 2025.
Diluted Earnings (Loss) Per Share (EPS):
EPS for the year ended April 30, 2025, was $1.53 per share compared to a loss of $(3.65) per share in the prior year. This increase was primarily due to an increase in operating income, a decrease in the pretax net loss on sale of businesses, assets, and impairment charges related to assets held-for-sale, partially offset by an increase in the provision for income taxes in the year ended April 30, 2025.
Below is a reconciliation of our US GAAP Earnings (Loss) Per Share to Non-GAAP Adjusted EPS. The amount of the pretax and the related income tax impact for the adjustments included in the table below are presented in the section above, “Provision for Income Taxes.”
|
|
|
|
|
|
|
|
|
|
|
|
|
Year Ended
April 30, |
|
2025 |
|
2024 |
US GAAP Earnings (Loss) Per Share |
$ |
1.53 |
|
|
$ |
(3.65) |
|
| Adjustments: |
|
|
|
| Impairment of goodwill |
— |
|
|
1.90 |
|
Restructuring and related charges |
0.36 |
|
|
0.85 |
|
| Foreign exchange losses on intercompany transactions, including the write off of certain cumulative translation adjustments |
0.08 |
|
|
0.02 |
|
| Amortization of acquired intangible assets |
0.76 |
|
|
0.68 |
|
Net loss on sale of businesses, assets, and impairment charges related to assets held-for-sale |
0.38 |
|
|
2.81 |
|
Held for Sale or Sold segment Adjusted Net Loss (Income) (1) |
0.05 |
|
|
(0.42) |
|
| Income tax adjustments |
0.48 |
|
|
0.54 |
|
EPS impact of using weighted-average dilutive shares for adjusted EPS calculation (2) |
— |
|
|
0.05 |
|
| Non-GAAP Adjusted EPS |
$ |
3.64 |
|
|
$ |
2.78 |
|
|
|
|
|
|
|
(1) |
Our Adjusted EPS excludes the Adjusted Net Loss (Income) of our Held for Sale or Sold segment. |
(2) |
Represents the impact of using diluted weighted-average number of common shares outstanding (55.7 million shares for the year ended April 30, 2024) included in the Non-GAAP Adjusted EPS calculation in order to apply the dilutive impact on adjusted net income due to the effect of unvested restricted stock units and other stock awards. This impact occurs when a US GAAP net loss is reported and the effect of using dilutive shares is antidilutive. |
On a constant currency basis, Adjusted EPS increased 31% primarily due to an increase in Adjusted Operating Income and, to a lesser extent, an increase in interest income.
SEGMENT OPERATING RESULTS:
|
|
|
|
|
|
|
|
|
|
|
|
|
|
|
|
|
|
|
|
|
|
|
|
|
Year Ended
April 30, |
|
% Change
Favorable
(Unfavorable) |
|
Constant Currency
% Change
Favorable
(Unfavorable) |
| RESEARCH |
2025 |
|
2024 |
|
|
| Revenue: |
|
|
|
|
|
|
|
Research Publishing |
$ |
922,553 |
|
|
$ |
892,784 |
|
|
3 |
% |
|
3 |
% |
Research Solutions |
152,906 |
|
|
149,921 |
|
|
2 |
% |
|
2 |
% |
| Total Research |
1,075,459 |
|
|
1,042,705 |
|
|
3 |
% |
|
3 |
% |
|
|
|
|
|
|
|
|
| Cost of Sales |
278,867 |
|
|
281,109 |
|
|
1 |
% |
|
1 |
% |
Direct Expenses |
336,484 |
|
|
323,392 |
|
|
(4) |
% |
|
(4) |
% |
Allocated Corporate Expenses |
160,959 |
|
|
155,495 |
|
|
(4) |
% |
|
(3) |
% |
| Amortization of Intangibles |
43,569 |
|
|
44,946 |
|
|
3 |
% |
|
4 |
% |
Adjusted Operating Income |
255,580 |
|
|
237,763 |
|
|
7 |
% |
|
8 |
% |
| Depreciation and Amortization |
89,302 |
|
|
93,422 |
|
|
4 |
% |
|
5 |
% |
| Adjusted EBITDA |
$ |
344,882 |
|
|
$ |
331,185 |
|
|
4 |
% |
|
5 |
% |
| Adjusted EBITDA Margin |
32.1 |
% |
|
31.8 |
% |
|
|
|
|
Revenue:
Research revenue for the year ended April 30, 2025, increased $32.8 million, or 3%, as compared with the prior year. On a constant currency basis, revenue increased 3% as compared with the prior year primarily due to an increase in author-funded open access, institutional models, AI licensing revenue and, to a lesser extent, Research Solutions, partially offset by a decrease in ancillary and print products. The increase in Research Solutions was due to an increase in databases, and content solutions for corporations, partially offset by a decrease in recruitment. Open access article output growth was approximately 16% as compared with the prior year. Research AI licensing revenue for the year ended April 30, 2025 was approximately $11 million.
Adjusted EBITDA:
On a constant currency basis, Adjusted EBITDA increased 5% as compared with the prior year. This increase was primarily due to higher revenue, partially offset by higher employment related costs.
|
|
|
|
|
|
|
|
|
|
|
|
|
|
|
|
|
|
|
|
|
|
|
|
|
Year Ended
April 30, |
|
% Change
Favorable
(Unfavorable) |
|
Constant Currency
% Change Favorable
(Unfavorable) |
LEARNING |
2025 |
|
2024 |
|
|
| Revenue: |
|
|
|
|
|
|
|
Academic |
$ |
333,693 |
|
|
$ |
323,541 |
|
|
3 |
% |
|
3 |
% |
Professional |
251,075 |
|
|
251,198 |
|
|
0 |
% |
|
0 |
% |
Total Learning Revenue |
584,768 |
|
|
574,739 |
|
|
2 |
% |
|
2 |
% |
|
|
|
|
|
|
|
|
| Cost of Sales |
144,758 |
|
|
145,054 |
|
|
0 |
% |
|
0 |
% |
Direct Expenses |
142,204 |
|
|
145,514 |
|
|
2 |
% |
|
2 |
% |
Allocated Corporate Expenses |
114,703 |
|
|
132,394 |
|
|
13 |
% |
|
14 |
% |
| Amortization of Intangibles |
8,253 |
|
|
9,044 |
|
|
9 |
% |
|
9 |
% |
Adjusted Operating Income |
174,850 |
|
|
142,733 |
|
|
23 |
% |
|
22 |
% |
| Depreciation and Amortization |
43,900 |
|
|
57,696 |
|
|
24 |
% |
|
24 |
% |
| Adjusted EBITDA |
$ |
218,750 |
|
|
$ |
200,429 |
|
|
9 |
% |
|
9 |
% |
| Adjusted EBITDA Margin |
37.4 |
% |
|
34.9 |
% |
|
|
|
|
Revenue:
Learning revenue for the year ended April 30, 2025, increased $10.0 million, or 2%, as compared with the prior year. On a constant currency basis, revenue increased 2% as compared with the prior year primarily due to an increase in licensing revenue, including AI revenue, and growth in Academic from steady market conditions, notably student enrollment, the shift to inclusive access, and growth in digital content and courseware, partially offset by a decrease in Academic print book sales and retail channel softness in Professional. Learning AI licensing revenue for the year end April 30, 2025 was $29 million compared to $23 million in the prior year due to demand for Academic and Professional backlisted content.
Adjusted EBITDA:
On a constant currency basis, Adjusted EBITDA increased 9% as compared with the prior year. This increase was primarily due to higher revenue and, to a lesser extent, a decrease in employee costs as a result of recent restructuring actions, and lower technology costs.
|
|
|
|
|
|
|
|
|
|
|
|
|
|
|
|
|
|
|
|
|
|
|
|
|
Year Ended
April 30, |
|
% Change
Favorable
(Unfavorable) |
|
Constant Currency
% Change
Favorable
(Unfavorable) |
HELD FOR SALE OR SOLD |
2025 |
|
2024 |
|
|
Total Held for Sale or Sold Revenue |
$ |
17,382 |
|
|
$ |
255,543 |
|
|
(93) |
% |
|
(93) |
% |
|
|
|
|
|
|
|
|
| Cost of Sales |
7,755 |
|
|
153,559 |
|
|
95 |
% |
|
95 |
% |
Direct Expenses |
10,365 |
|
|
48,127 |
|
|
78 |
% |
|
78 |
% |
Allocated Corporate Expenses |
2,840 |
|
|
23,142 |
|
|
88 |
% |
|
88 |
% |
| Amortization of Intangibles |
— |
|
|
2,004 |
|
|
# |
|
# |
Adjusted Operating Income |
(3,578) |
|
|
28,711 |
|
|
# |
|
# |
| Depreciation and Amortization |
— |
|
|
3,437 |
|
|
# |
|
# |
| Adjusted EBITDA |
$ |
(3,578) |
|
|
$ |
32,148 |
|
|
# |
|
# |
| Adjusted EBITDA Margin |
(20.6) |
% |
|
12.6 |
% |
|
|
|
|
# Not meaningful
Revenue:
Held for Sale or Sold revenue for the year ended April 30, 2025, decreased $238.2 million, or 93%, as compared with the prior year on a reported and constant currency basis as compared with the prior year. This was primarily due to the sale of University Services on January 1, 2024, Wiley Edge on May 31, 2024, with the exception of its India operations which sold on August 31, 2024, and CrossKnowledge on August 31, 2024.
Adjusted EBITDA:
On a constant currency basis, Adjusted EBITDA decreased $35.7 million as compared with the prior year. This decrease was primarily due to the sale of the University Services, Wiley Edge, and CrossKnowledge businesses.
|
|
|
|
|
|
|
|
|
|
|
|
|
|
|
|
|
|
|
|
|
|
|
|
|
Year Ended
April 30, |
|
% Change
Favorable
(Unfavorable) |
|
Constant Currency
% Change
Favorable
(Unfavorable) |
CORPORATE EXPENSES |
2025 |
|
2024 |
|
|
Unallocated Corporate Expenses |
179,882 |
|
|
185,456 |
|
|
3 |
% |
|
3 |
% |
Adjusted Corporate Expenses |
(179,882) |
|
|
(185,456) |
|
|
3 |
% |
|
3 |
% |
| Depreciation and Amortization |
13,924 |
|
|
22,434 |
|
|
38 |
% |
|
38 |
% |
| Adjusted EBITDA |
$ |
(165,958) |
|
|
$ |
(163,022) |
|
|
(2) |
% |
|
(2) |
% |
On a constant currency basis, adjusted corporate expenses of $166.0 million on an Adjusted EBITDA basis increased 2% as compared with the prior year. This was primarily due to an increase in enterprise modernization costs.
FISCAL YEAR 2024 AS COMPARED TO FISCAL YEAR 2023 SUMMARY RESULTS
Discussions of our results of operations for the year ended April 30, 2024, compared to April 30, 2023, have been omitted under this item, but may be found in Part II, Item 7, “Management’s Discussion and Analysis of Financial Condition and Results of Operations” in our Annual Report on Form 10-K for the year ended April 30, 2024, which was filed with the SEC on June 26, 2024.
LIQUIDITY AND CAPITAL RESOURCES:
Principal Sources of Liquidity
We believe that our operating cash flow, together with our revolving credit facilities and other available debt financing, will be adequate to meet our operating, investing, and financing needs in the next twelve months. Operating cash flow provides the primary source of cash to fund operating needs and capital expenditures. Excess operating cash is used to fund shareholder dividends and share repurchases. Other discretionary uses of cash flow include investments and acquisitions to complement and grow our portfolio of businesses. As necessary, we may supplement operating cash flow with debt to fund these activities. The overall cash position of the Company reflects our durable business results and a global cash management strategy that considers liquidity management, economic factors, and tax considerations. Our cash and cash equivalents are maintained at a number of financial institutions. To mitigate the risk of uninsured balances, we select financial institutions based on their credit ratings and financial strength, and we perform ongoing evaluations of these institutions to limit our concentration risk exposure to any financial institution.
As of April 30, 2025, we had cash and cash equivalents of $85.9 million, of which approximately all was located outside the US. Maintenance of these cash and cash equivalent balances outside the US does not have a material impact on the liquidity or capital resources of our operations. We intend to repatriate earnings from our non-US subsidiaries, and to the extent we repatriate these funds to the US, we may be required to pay taxes in various US state and local jurisdictions and withholding or similar taxes in applicable non-US jurisdictions in the periods in which such repatriation occurs. Accordingly, as of April 30, 2025, we have recorded a deferred tax liability of approximately $2.2 million related to the estimated taxes that would be incurred upon repatriating certain non-US earnings to the US.
On November 30, 2022, we entered into the second amendment to the Third Amended and Restated Credit Agreement (collectively, the Amended and Restated CA).
See Note 14, “Debt and Available Credit Facilities” for more details on the amendment. The Amended and Restated CA provided for senior unsecured credit facilities comprised of the following (i) a five-year revolving credit facility in an aggregate principal amount up to $1.115 billion which matures November 2027, (ii) a five-year term loan A facility consisting of $200 million which matures November 2027, and (iii) $185 million aggregate principal amount revolving credit facility which matured in May 2024.
As of April 30, 2025, we had approximately $799.4 million of debt outstanding, net of unamortized issuance costs of $0.4 million, and approximately $500.7 million of unused borrowing capacity under our Amended and Restated CA and other facilities. Our Amended and Restated CA contains certain restrictive covenants related to our consolidated leverage ratio and interest coverage ratio, which we were in compliance with as of April 30, 2025.
Contractual Obligations and Commercial Commitments
A summary of contractual obligations and commercial commitments, excluding unrecognized tax benefits further described in
Note 13, “Income Taxes,” of the Notes to Consolidated Financial Statements, as of April 30, 2025, is as follows:
|
|
|
|
|
|
|
|
|
|
|
|
|
|
|
|
|
|
|
|
|
|
|
|
|
|
|
|
|
|
|
Payments Due by Period
(in millions) |
|
Total |
|
Within
Year 1 |
|
2–3
Years |
|
4–5
Years |
|
After 5
Years |
Total debt(1) |
$ |
799.8 |
|
|
$ |
10.0 |
|
|
$ |
789.8 |
|
|
$ |
— |
|
|
$ |
— |
|
Interest on debt(2) |
94.4 |
|
|
41.0 |
|
|
53.4 |
|
|
— |
|
|
— |
|
| Non-cancellable leases |
122.3 |
|
|
23.1 |
|
|
34.0 |
|
|
29.1 |
|
|
36.1 |
|
| Minimum royalty obligations |
308.5 |
|
|
91.7 |
|
|
134.7 |
|
|
64.3 |
|
|
17.8 |
|
Other operating commitments |
138.7 |
|
|
60.9 |
|
|
57.1 |
|
|
20.7 |
|
|
— |
|
| Total |
$ |
1,463.7 |
|
|
$ |
226.7 |
|
|
$ |
1,069.0 |
|
|
$ |
114.1 |
|
|
$ |
53.9 |
|
|
|
|
|
|
|
| (1) |
Total debt is exclusive of unamortized issuance costs of $0.4 million. |
| (2) |
Interest on debt includes the effect of our interest rate swap agreements and the estimated future interest payments on our unhedged variable rate debt, assuming that the interest rates as of April 30, 2025, remain constant until the maturity of the debt. |
Analysis of Historical Cash Flow
The following table shows the changes in our Consolidated Statements of Cash Flows:
|
|
|
|
|
|
|
|
|
|
|
|
|
Years Ended April 30, |
|
2025 |
|
2024 |
| Net cash provided by operating activities |
$ |
202,591 |
|
|
$ |
207,638 |
|
| Net cash used in investing activities |
(94,018) |
|
|
(106,643) |
|
| Net cash used in financing activities |
(125,330) |
|
|
(107,221) |
|
| Effect of foreign currency exchange rate changes on cash, cash equivalents, and restricted cash |
$ |
3,146 |
|
|
$ |
(1,493) |
|
Cash flow from operations is seasonally a use of cash in the first half of Wiley’s fiscal year principally due to the timing of collections for annual Journal Subscriptions and Transformational Agreements, which typically occurs in the beginning of the second half of our fiscal year.
Free cash flow less product development spending helps assess our ability, over the long term, to create value for our shareholders, as it represents cash available to repay debt, pay common dividends, and fund share repurchases, and acquisitions. Below are the details of Free cash flow less product development spending.
Free Cash Flow Less Product Development Spending:
|
|
|
|
|
|
|
|
|
|
|
|
|
Years Ended April 30, |
|
2025 |
|
2024 |
| Net cash provided by operating activities |
$ |
202,591 |
|
|
$ |
207,638 |
|
| Less: Additions to technology, property and equipment |
(61,473) |
|
|
(76,080) |
|
| Less: Product development spending |
(15,228) |
|
|
(17,262) |
|
| Free cash flow less product development spending |
$ |
125,890 |
|
|
$ |
114,296 |
|
Net Cash Provided By Operating Activities
2025 Compared to 2024
The following is a summary of the $5.0 million change in Net cash provided by operating activities for the year ended April 30, 2025, as compared with the year ended April 30, 2024 (amounts in millions).
|
|
|
|
|
|
Net cash provided by operating activities – Year ended April 30, 2024 |
$ |
207.6 |
|
Net income adjusted for items to reconcile net income to net cash provided by operating activities, which would include such noncash items as depreciation and amortization, net losses on sale of businesses, assets, and impairment charges related to assets held-for-sale, restructuring charges, and the change in deferred taxes |
(18.7) |
|
| Working capital changes: |
|
| Accounts receivable, net and contract liabilities |
11.3 |
|
| Accounts payable and accrued royalties |
46.6 |
|
| Changes in other assets and liabilities |
(44.2) |
|
Net cash provided by operating activities – Year ended April 30, 2025 |
$ |
202.6 |
|
The favorable change in accounts receivable, net and contract liabilities, was primarily due to the timing of collections and billings to customers.
The favorable change in accounts payable and accrued royalties was due to the timing of payments.
The unfavorable changes in other assets and liabilities noted in the table above was primarily due to higher employee related costs which was due to higher annual incentive compensation paid in fiscal year 2025 related to fiscal year 2024 performance, and higher costs related to cloud computing arrangements associated with targeted enterprise modernization work in fiscal year 2025. These cloud computing costs are capitalizable and amortized but included in cash flow from operations rather than cash flow from investing activities. These factors were partially offset by lower restructuring payments in fiscal year 2025.
Our negative working capital (current assets less current liabilities) was $381.0 million and $419.2 million as of April 30, 2025, and April 30, 2024, respectively. The primary driver of the negative working capital is the benefit realized from unearned contract liabilities related to subscriptions for which cash has been collected in advance. The contract liabilities will be recognized as revenue when the products are shipped or made available online to the customers over the term of the subscription. Current liabilities as of April 30, 2025, and as of April 30, 2024 include contract liabilities of $462.7 million and $483.8 million, respectively, primarily related to deferred subscription revenue for which cash was collected in advance.
Cash collected in advance for subscriptions is used by us for a number of purposes, including funding operations, capital expenditures, acquisitions, debt repayments, dividend payments, and share repurchases.
Net Cash Used In Investing Activities
2025 Compared to 2024
Net cash used in investing activities in the year ended April 30, 2025, was $94.0 million compared to $106.6 million in the prior year. The decrease in cash used in investing activities was primarily due to $14.6 million of lower additions for technology, property, and equipment in fiscal year 2025, partially offset by higher net cash transferred in fiscal year 2025 related to the sale of businesses and assets.
See Note 4, “Acquisitions and Divestitures” for more information related to the divestitures that occurred in the years ended April 30, 2025 and 2024.
Net Cash Used In Financing Activities
2025 Compared to 2024
Net cash used in financing activities in the year ended April 30, 2025, was $125.3 million compared to $107.2 million in the year ended April 30, 2024. This increase in cash used was primarily due to lower net debt borrowings of $14.3 million in fiscal year 2025, and a $15.4 million increase in cash used for purchases of treasury shares in fiscal year 2025, partially offset by a $9.1 million change in book overdrafts.
In the years ended April 30, 2025 and 2024, our quarterly dividend to shareholders was $1.41 and $1.40 per share annualized, respectively.
During the year ended April 30, 2020, our Board of Directors approved an additional share repurchase program of $200 million of Class A or B Common Stock. As of April 30, 2025, we had authorization from our Board of Directors to purchase up to $57.4 million that was remaining under this program. During the years ended April 30, 2025 and 2024, we purchased $60.0 million and $45.1 million, respectively, under this program.
The following table summarizes the shares repurchased of Class A and B Common Stock (shares in thousands):
|
|
|
|
|
|
|
|
|
|
|
|
|
Years Ended April 30, |
|
2025 |
|
2024 |
| Shares repurchased – Class A |
1,186 |
|
1,294 |
| Shares repurchased – Class B |
173 |
|
3 |
| Average Price – Class A and Class B |
$ |
44.16 |
|
|
$ |
34.71 |
|
The total amount purchased and the average price per share excludes excise taxes payable on share repurchases and may differ from the share repurchases reflected in Purchases of treasury shares in our Consolidated Statements of Cash Flows.
2024 Compared to 2023
A discussion of changes in our cash flows for the year ended April 30, 2024, compared to the year ended April 30, 2023, has been omitted under this item, but may be found in Part II, Item 7, “Management’s Discussion and Analysis of Financial Condition and Results of Operations - Liquidity and Capital Resources” in our Annual Report on Form 10-K for the year ended April 30, 2024, which was filed with the SEC on June 26, 2024.
RECENTLY ISSUED STATEMENTS OF FINANCIAL ACCOUNTING STANDARDS, ACCOUNTING GUIDANCE, AND DISCLOSURE REQUIREMENTS
We are subject to numerous recently issued statements of financial accounting standards, accounting guidance, and disclosure requirements. The information set forth in Part II, Item 8, “Financial Statements and Supplementary Data” in
Note 2, “Summary of Significant Accounting Policies, Recently Issued and Recently Adopted Accounting Standards,” of the Notes to Consolidated Financial Statements of this Annual Report on Form 10-K is incorporated by reference and describes these new accounting standards.
CRITICAL ACCOUNTING POLICIES AND ESTIMATES:
The preparation of our Consolidated Financial Statements and related disclosures in conformity with US GAAP requires our management to make estimates and assumptions that affect the reported amounts of assets and liabilities, the disclosure of contingent assets and liabilities as of the date of the financial statements, and revenue and expenses during the reporting period. These estimates include, among other items, sales return reserves, allocation of acquisition purchase price to assets acquired and liabilities assumed, assets and liabilities held-for-sale, goodwill and indefinite-lived intangible assets, intangible assets with definite lives and other long-lived assets, and retirement plans. We review these estimates and assumptions periodically using historical experience and other factors and reflect the effects of any revisions on the Consolidated Financial Statements in the period we determine any revisions to be necessary. Actual results could differ from those estimates, which could affect the reported results. In Part II, Item 8, “Financial Statements and Supplementary Data” in
Note 2, “Summary of Significant Accounting Policies, Recently Issued and Recently Adopted Accounting Standards” of the Notes to Consolidated Financial Statements includes a summary of the significant accounting policies and methods used in preparation of our Consolidated Financial Statements. Set forth below is a discussion of our more critical accounting policies and methods.
Revenue Recognition:
In Part II, Item 8, “Financial Statements and Supplementary Data,”
see Note 2, “Summary of Significant Accounting Policies, Recently Issued, and Recently Adopted Accounting Standards” in the section "Summary of Significant Accounting Policies”, and
see Note 3, “Revenue Recognition, Contracts with Customers,” of the Notes to Consolidated Financial Statements for details of our revenue recognition policy.
Sales Return Reserves:
In Part II, Item 8, “Financial Statements and Supplementary Data,”
see Note 2, “Summary of Significant Accounting Policies, Recently Issued, and Recently Adopted Accounting Standards” in the section “Summary of Significant Accounting Policies” of the Notes to Consolidated Financial Statements for details of our sales return reserves.
A one percent change in the estimated sales return rate could affect net income by approximately $2.2 million. A change in the pattern or trends in returns could also affect the estimated allowance.
Allocation of Acquisition Purchase Price to Assets Acquired and Liabilities Assumed:
In connection with acquisitions, we allocate the cost of the acquisition to the assets acquired and the liabilities assumed based on the estimates of fair value for such items, including intangible assets. The excess of the purchase consideration over the fair value of assets acquired and liabilities assumed is recorded as goodwill. The determination of the acquisition date fair value of the assets acquired, and liabilities assumed, requires us to make significant estimates and assumptions, such as, if applicable, forecasted revenue growth rates and operating cash flows, royalty rates, customer attrition rates, obsolescence rates of developed technology, and discount rates. We may use a third-party valuation consultant to assist in the determination of such estimates.
In Part II, Item 8, “Financial Statements and Supplementary Data,”
see Note 4, “Acquisitions and Divestitures” of the Notes to Consolidated Financial Statements for details of our acquisitions.
Assets and Liabilities Held-for-Sale:
In response to changes in market conditions and our ongoing initiatives to simplify our portfolio to drive sustained performance improvement, we may also strategically realign our resources and consider disposing of certain businesses. We classify assets as held-for-sale when management commits to a plan to sell, the assets are available for immediate sale in their present condition, we have initiated an active program to find a buyer, and the sale is probable within one year. Assets must be actively marketed at a reasonable price, and the plan should indicate completion is likely without significant changes.
The disposal group that is classified as held-for-sale is initially measured at the lower of its carrying value or fair value less any costs to sell. The determination of the fair value less costs to sell is based on indicative sales values and may require us to make judgments on significant estimates and assumptions regarding forecasted information such as revenue growth, gross profit, EBITDA, depreciation and amortization, capital expenditures, and discount rates. We may use a third-party valuation consultant to assist in the determination of such estimates. The fair value of a disposal group less any costs to sell is assessed each reporting period it remains classified as held-for-sale and any subsequent change is reported as an adjustment to the carrying value of the disposal group, as long as the new carrying value does not exceed the carrying value of the asset at the time it was initially classified as held-for-sale.
The disposal group's fair value was based on the selling price components in the purchase agreements for University Services and Wiley Edge, which included earnouts. These earnouts were valued using a Monte Carlo simulation and classified as Level 3 in the ASC Topic 820 fair value hierarchy. This method considers the terms of the purchase agreements and our best estimates of forecasted revenue or gross profit for the earnout periods. It simulates a range of possible outcomes based on estimated volatility. The fair value was calculated as the present value of the average potential payouts, using a risk-adjusted discount rate. The earnout amount may change based on final results.
In Part II, Item 8, “Financial Statements and Supplementary Data,”
see Note 4, “Acquisitions and Divestitures” of the Notes to Consolidated Financial Statements for details of our divestitures.
Goodwill and Indefinite-lived Intangible Assets:
Goodwill is reviewed for possible impairment at least annually on a reporting unit level during the fourth quarter of each year. Our annual impairment assessment date is February 1. A review of goodwill may be initiated before or after conducting the annual analysis if events or changes in circumstances indicate the carrying value of goodwill may no longer be recoverable.
A reporting unit is the operating segment unless, at businesses one level below that operating segment – the “component” level, discrete financial information is prepared and regularly reviewed by management, and the component has economic characteristics that are different from the economic characteristics of the other components of the operating segment, in which case the component is the reporting unit.
As part of the annual impairment test, we may elect to first assess qualitative factors to determine whether it is more likely than not that the fair value of a reporting unit is less than its carrying amount. In a qualitative assessment, we would consider the macroeconomic conditions, including any deterioration of general conditions and industry and market conditions, including any deterioration in the environment where the reporting unit operates, increased competition, changes in the products/services and regulatory and political developments, cost of doing business, overall financial performance, including any declining cash flows and performance in relation to planned revenues and earnings in past periods, other relevant reporting unit specific facts, such as changes in management or key personnel or pending litigation, and events affecting the reporting unit, including changes in the carrying value of net assets.
If the results of our qualitative assessment indicate it is more likely than not that the fair value of a reporting unit is less than its carrying amount, we are required to perform a quantitative assessment to determine the fair value of the reporting unit.
Alternatively, if an optional qualitative goodwill impairment assessment is not performed, we may perform a quantitative assessment. Under the quantitative assessment, we compare the fair value of each reporting unit to its carrying value, including the goodwill allocated to the reporting unit. If the fair value of the reporting unit exceeded its carrying value, there would be no indication of impairment. If the fair value of the reporting unit were less than the carrying value, an impairment charge would be recognized for the difference.
We derive an estimate of fair values for each of our reporting units using a combination of an income approach and a market approach. Absent an indication of fair value from a potential buyer or similar specific transactions, we believe that the use of these methods provides a reasonable estimate of a reporting unit’s fair value.
Fair value computed by these methods is arrived at using a number of key assumptions including forecasted revenues and related growth rates, forecasted operating cash flows, the discount rate, and the selection of relevant market multiples of comparable publicly-traded companies with similar characteristics to the reporting unit. There are inherent uncertainties, however, related to these factors and to our judgment in applying them to this analysis. We believe that the combination of these methods provides a reasonable approach to estimate the fair value of our reporting units.
Income Approach Used to Determine Fair Values
The income approach is based upon the present value of expected cash flows. Expected cash flows are converted to present value using factors that consider the timing and risk of the future cash flows. The estimate of cash flows used is prepared on an unleveraged debt-free basis. We use a discount rate that reflects a market-derived weighted average cost of capital. We believe that this approach is appropriate because it provides a fair value estimate based upon the reporting unit’s expected long-term operating and cash flow performance. The projections are based upon our best estimates of forecasted economic and market conditions over the related period including growth rates, expected changes in forecasted operating cash flows, and cash expenditures. Other estimates and assumptions include terminal value long-term growth rates, provisions for income taxes, future capital expenditures, and changes in future cashless, debt-free working capital. Changes in any of these assumptions could materially impact the estimated fair value of our reporting units. Our forecasts take into account the near and long-term expected business performance, considering the long-term market conditions and business trends within the reporting units. However, changes in these assumptions may impact our ability to recover the allocated goodwill in the future. For further discussion of the factors that could result in a change in our assumptions, see “Risk Factors” in this Annual Report on Form 10-K.
Market Approach Used to Determine Fair Values
The market approach estimates the fair value of the reporting unit by applying multiples of operating performance measures to the reporting unit’s operating performance (the Guideline Public Company Method). These multiples are derived from comparable publicly-traded companies with similar investment characteristics to the reporting unit, and such comparable data are reviewed and updated as needed annually. We believe that this approach is appropriate because it provides a fair value estimate using multiples from entities with operations and economic characteristics comparable to our reporting units and Wiley.
The key estimates and assumptions that are used to determine fair value under this market approach include current and forward 12-month revenue and EBITDA results, as applicable, and the selection of the relevant multiples to be applied. Under the Guideline Public Company Method, a control premium, or an amount that a buyer is usually willing to pay over the current market price of a publicly-traded company is considered and applied to the calculated equity values to adjust the public trading value upward for a 100% ownership interest, where applicable.
In order to assess the reasonableness of the calculated fair values of our reporting units, we also compare the sum of the reporting units’ fair values to our market capitalization and calculate an implied control premium (the excess of the sum of the reporting units’ fair values over the market capitalization). We evaluate the control premium by comparing it to control premiums of recent comparable market transactions. If the implied control premium is not reasonable in light of these recent transactions, we will reevaluate our fair value estimates of the reporting units by adjusting the discount rates and/or other assumptions.
If our assumptions and related estimates change in the future, or if we change our reporting unit structure or other events and circumstances change (such as a sustained decrease in the price of our common stock, a decline in current market multiples, a significant adverse change in legal factors or business climates, an adverse action or assessment by a regulator, heightened competition, strategic decisions made in response to economic or competitive conditions, or a more-likely-than-not expectation that a reporting unit or a significant portion of a reporting unit will be sold or disposed of), we may be required to record impairment charges in future periods. Any impairment charges that we may take in the future could be material to our consolidated results of operations and financial condition.
Fiscal Year 2025 and 2024 Annual Goodwill Impairment Test
As of February 1, 2025 and 2024, we completed a qualitative assessment for our annual goodwill impairment test for our reporting units within Research and Learning segments. This assessment included consideration of key factors including macroeconomic conditions, industry and market considerations, cost factors, financial performance, and other relevant entity and reporting unit-specific events. Based on our qualitative assessment, we determined it was not more likely than not that the fair value of any reporting unit was less than its carrying amount. As such, it was not necessary to perform a quantitative test. There have been no significant events or circumstances affecting the valuation of goodwill subsequent to the qualitative assessment performed as of February 1, 2025.
Fiscal Year 2024 Segment Realignment Goodwill Impairment Test
In the first quarter of fiscal year 2024, we began to operate under a new organizational structure, which resulted in a change in our composition of our reportable segments, which resulted in a change in our reporting units. The Learning reportable segment includes two reporting units, Academic and Professional, and the Held for Sale or Sold reportable segment includes three reporting units, University Services, Wiley Edge, and CrossKnowledge. No changes were made to the Research reportable segment. As a result of this realignment, we are required to test goodwill for impairment immediately before and after the realignment. Since there were no changes to the Research reportable segment, no interim impairment test of the Research reportable segment goodwill was required.
Goodwill Impairment Before Realignment
Prior to the realignment, we concluded that the fair value of the Academic Publishing, Talent Development (which includes Wiley Edge) and Professional Learning reporting units were above their carrying values. Therefore, there was no indication of impairment. The carrying value of the University Services reporting unit was above its fair value which resulted in a pretax noncash goodwill impairment of $11.4 million. Such impairment reduced the goodwill of the University Services reporting unit to zero. This charge is reflected in Impairment of goodwill in the Consolidated Statements of Income (Loss).
University Services was adversely impacted by market conditions and headwinds for online degree programs, which lead to a decline in projected enrollments from existing partners, pricing pressures and revenue share concessions, and a decline in new partner additions over both the short-term and long-term which adversely impacted forecasted revenue growth and operating cash flows.
The key assumptions underlying the estimate of the fair value of the University Services reporting unit included the following:
•Future cash flow assumptions – the projections for future cash flows utilized in the model were derived from historical experience and assumptions regarding future growth and profitability of the reporting unit. These projections include forecasted revenues and related growth rates, and forecasted operating cash flows, and are consistent with our operating budget and strategic plan. We applied a compounded annual growth rate of approximately 4.6% for forecasted sales in our projected cash flows through fiscal year 2031. Beyond the forecasted period, a terminal value was determined using a perpetuity growth rate of 3.0% to reflect our estimate of stable and perpetual growth.
•Discount rate based on the weighted average cost of capital (WACC) – the WACC is the rate used to discount the reporting unit’s estimated future cash flows. The WACC is calculated based on a proportionate weighting of the cost of debt and equity. The cost of equity is based on a capital asset pricing model and includes a company-specific risk premium to capture the perceived risks and uncertainties associated with the reporting unit’s projected cash flows. The cost of debt component is calculated based on the after-tax cost of debt of Moody’s Baa-rated corporate bonds. The cost of debt and equity is weighted based on the debt to market capitalization ratio of publicly traded companies with similarities to the University Services reporting unit. The WACC applied to the University Services reporting unit was 17%.
•Valuation Multiples – for the Guideline Public Company Method, we applied relevant current and forward 12-month EBITDA multiples based on an evaluation of multiples of publicly-traded companies with similarities to the University Services reporting unit. The multiples applied ranged from 4.5x to 6.0x EBITDA.
Prior to performing the goodwill impairment test for University Services, we also evaluated the recoverability of long-lived assets of the reporting unit. The carrying value of the long-lived assets that were tested for impairment was approximately $231.0 million. When indicators of impairment are present, we test definite lived and long-lived assets for recoverability by comparing the carrying value of an asset group to an estimate of the future undiscounted cash flows expected to result from the use and eventual disposition of the asset group. We considered the lower-than-expected revenue and forecasted operating cash flows over a sustained period of time, and downward revisions to our cash flow forecasts for this reporting unit to be indicators of impairment for their long-lived assets. Based on the results of the recoverability test, we determined that the undiscounted cash flows of the asset group of the University Services reporting unit exceeded the carrying value. Therefore, there was no impairment.
Goodwill Impairment After Realignment
After the realignment, we concluded that the fair value of the Academic, Professional, and Wiley Edge reporting units was above their carrying values. Therefore, there was no indication of impairment. As noted above, the goodwill of the University Services reporting unit was zero and no further testing of goodwill for impairment was required. The carrying value of the CrossKnowledge reporting unit was above its fair value, which resulted in a pretax noncash goodwill impairment of $15.3 million. This charge is reflected in Impairment of goodwill in the Consolidated Statements of Income (Loss).
CrossKnowledge was adversely impacted by a decline in the demand for its offerings, which resulted in lower sales and a decline in average contract value that adversely impacted forecasted revenue growth and operating cash flows.
The key assumptions underlying the estimate of the fair value of the CrossKnowledge reporting unit included the following:
•Future cash flow assumptions – the projections for future cash flows utilized in the model were derived from historical experience and assumptions regarding future growth and profitability of the reporting unit. These projections include forecasted revenues and related growth rates, and forecasted operating cash flows, and are consistent with our operating budget and strategic plan. We applied a compounded annual growth rate of approximately 3.3% for forecasted sales in our projected cash flows through fiscal year 2032. Beyond the forecasted period, a terminal value was determined using a perpetuity growth rate of 2.0% to reflect our estimate of stable and perpetual growth.
•Discount rate based on the WACC – the WACC is the rate used to discount the reporting unit’s estimated future cash flows. The WACC is calculated based on a proportionate weighting of the cost of debt and equity. The cost of equity is based on a capital asset pricing model and includes a company-specific risk premium to capture the perceived risks and uncertainties associated with the reporting unit’s projected cash flows. The cost of debt component is calculated based on the after-tax cost of debt of Moody’s Baa-rated corporate bonds. The cost of debt and equity is weighted based on the debt to market capitalization ratio of publicly traded companies with similarities to the CrossKnowledge reporting unit. The WACC applied to the CrossKnowledge reporting unit was 16%.
•Valuation Multiples – for the Guideline Public Company Method, we applied relevant current and forward 12-month EBITDA multiples based on an evaluation of multiples of publicly-traded companies with similarities to the CrossKnowledge reporting unit. The multiples applied ranged from 6.0x to 7.0x EBITDA.
Prior to performing the goodwill impairment test for CrossKnowledge, we also evaluated the recoverability of long-lived assets of the reporting unit. The carrying value of the long-lived assets that were tested for impairment was approximately $50.2 million. When indicators of impairment are present, we test definite lived and long-lived assets for recoverability by comparing the carrying value of an asset group to an estimate of the future undiscounted cash flows expected to result from the use and eventual disposition of the asset group. We considered the lower-than-expected revenue and forecasted operating cash flows over a sustained period of time, and downward revisions to our cash flow forecasts for this reporting unit to be indicators of impairment for their long-lived assets. Based on the results of the recoverability test, we determined that the undiscounted cash flows of the asset group of the CrossKnowledge reporting unit exceeded the carrying value. Therefore, there was no impairment.
Wiley Edge Fiscal Year 2024 Interim Impairment Test
As a result of signing the stock and asset purchase agreement (Edge Agreement) with Inspirit Vulcan Bidco Limited, a private limited company incorporated in England & Wales (Inspirit) and the decrease in the fair value of the business which was impacted by a decline in placements in the third quarter of fiscal year 2024, we tested the goodwill of the Wiley Edge reporting unit for impairment. We estimated the fair value of the reporting unit based on the terms and conditions in the Edge Agreement at that time which reflected a selling price that included $10.0 million in cash, $18.3 million in the form of a loan, a fair value estimate for an earnout, and an estimate for a working capital adjustment.
We concluded that the carrying value of the Wiley Edge reporting unit was above its fair value which resulted in a pretax noncash goodwill impairment of approximately $81.7 million in the three months ended January 31, 2024. Such impairment reduced the goodwill of the Wiley Edge reporting unit to zero. This charge is reflected in Impairment of goodwill in the Consolidated Statements of Income (Loss). The impairment was due to subsequent changes in the fair value resulting from the continued progression of the selling process, indications of changes in the consideration for the business, and a decline in placements in the third quarter of fiscal year 2024, as well as changes in the carrying amounts of the disposal group.
As described further above in Part I, Item 7, “Management’s Discussion and Analysis of Financial Condition and Results of Operations” under the caption “Critical Accounting Policies and Estimates - Assets and Liabilities Held-for-Sale” of this Annual Report on Form 10-K, the fair value of the earnout was based on a Monte Carlo simulation.
Prior to performing the goodwill impairment test for Wiley Edge, we also evaluated the recoverability of long-lived assets of the reporting unit. The carrying value of the long-lived assets that were tested for impairment was approximately $141.5 million. We considered the changes in the fair value of the consideration for the business due to the continued progression of the selling process to be an indicator of impairment for its long-lived assets. Based on the results of the recoverability test, we determined that the undiscounted cash flows of the asset group of the Wiley Edge reporting unit exceeded the carrying value. Therefore, there was no impairment.
Fiscal Year 2025 and 2024 Annual Indefinite-lived Intangible Impairment Test
We also review our indefinite-lived intangible assets for impairment annually, which consists of brands and trademarks and certain acquired publishing rights.
For fiscal year 2025 and 2024, we performed a qualitative assessment for our annual indefinite-lived intangible assets impairment test. This assessment included consideration of key factors including macroeconomic conditions, industry and market considerations, cost factors, financial performance, and other relevant entity and reporting unit-specific events. Based on our qualitative assessment, we determined it was not more likely than not that the fair value of any indefinite-lived intangible asset was less than its carrying amount. As such, it was not necessary to perform a quantitative test.
Intangible Assets with Definite Lives and Other Long-Lived Assets:
See Note 2, “Summary of Significant Accounting Policies, Recently Issued, and Recently Adopted Accounting Standards,” in the section “Summary of Significant Accounting Policies” of the Notes to Consolidated Financial Statements for details of definite lived intangible assets and other long-lived assets.
Retirement Plans:
We provide defined benefit pension plans for certain employees worldwide. Our Board of Directors approved amendments to the US, Canada, and UK defined benefit plans that froze the future accumulation of benefits effective June 30, 2013, December 31, 2015, and April 30, 2015, respectively. Under the amendments, no new employees will be permitted to enter these plans and no additional benefits for current participants for future services will be accrued after the effective dates of the amendments.
The accounting for benefit plans is highly dependent on assumptions concerning the outcome of future events and circumstances, including discount rates, long-term return rates on pension plan assets, healthcare cost trends, compensation increases, and other factors. In determining such assumptions, we consult with outside actuaries and other advisors.
The discount rates for the US, Canada, and UK pension plans are based on the derivation of a single-equivalent discount rate using a standard spot rate curve and the timing of expected benefit payments as of the balance sheet date. The spot rate curves are based upon portfolios of corporate bonds rated at Aa or above by a respected rating agency. The discount rate for Germany is based on the expected benefit payments for the sample mixed population plan. The expected long-term rates of return on pension plan assets are estimated using forecasted returns for the asset classifications within the asset portfolio, and a composite return assumption range is determined using a weighted average based on each plan’s target asset allocation percentage. Salary growth and healthcare cost trend assumptions are based on our historical experience and future outlook. While we believe that the assumptions used in these calculations are reasonable, differences in actual experience or changes in assumptions could materially affect the expense and liabilities related to our defined benefit pension plans. A hypothetical one percent increase in the discount rate would increase net income and decrease the accrued pension liability by approximately $1.0 million and $63.4 million, respectively. A one percent decrease in the discount rate would decrease net income and increase the accrued pension liability by approximately $0.6 million and $73.0 million, respectively. A one percent change in the expected long-term rate of return would affect net income by approximately $3.7 million.
Item 7A. Quantitative and Qualitative Disclosures about Market Risk
We are exposed to market risk primarily related to interest rates, foreign exchange, and credit risk. It is our policy to monitor these exposures, and to use derivative financial investments and/or insurance contracts from time to time to reduce fluctuations in earnings and cash flows when it is deemed appropriate to do so. We do not use derivative financial instruments for trading or speculative purposes.
Interest Rates:
From time to time, we may use interest rate swaps, collars, or options to manage our exposure to fluctuations in interest rates. It is management’s intention that the notional amount of interest rate swaps be less than the variable rate loans outstanding during the life of the derivatives.
The information set forth in
Note 15, “Derivative Instruments and Activities,” of the Notes to Consolidated Financial Statements under the caption “Interest Rate Contracts,” is incorporated herein by reference.
On an annual basis, a hypothetical 1% change in interest rates for the $299.8 million of unhedged variable rate debt as of April 30, 2025, would affect net income and cash flow by approximately $2.4 million.
Foreign Exchange Rates:
Fluctuations in the currencies of countries where we operate outside the US may have a significant impact on financial results. We are primarily exposed to movements in British pound sterling, euros, Canadian and Australian dollars, and certain currencies in Asia. The statements of financial position of non-US business units are translated into US dollars using period-end exchange rates for assets and liabilities and the Statements of Income (Loss) are translated into US dollars using weighted-average exchange rates for revenues and expenses. The percentage of consolidated revenue for the year ended April 30, 2025, recognized in the following currencies (on an equivalent US dollar basis) were approximately: 51% US dollar, 29% British pound sterling, 11% euro, and 9% other currencies.
Our significant investments in non-US businesses are exposed to foreign currency risk. Adjustments resulting from translating assets and liabilities are reported as a separate component of Total accumulated other comprehensive loss, net of tax within Total shareholders’ equity under the caption Foreign currency translation adjustment. During the year ended April 30, 2025, we recorded foreign currency translation gains in Total accumulated other comprehensive loss, net of tax of approximately $69.3 million primarily as a result of the fluctuations of the US dollar relative to the British pound sterling and, to a lesser extent, the euro. During the year ended April 30, 2024, we recorded foreign currency translation (losses) in Total accumulated other comprehensive loss, net of tax of approximately $(7.5) million primarily as a result of the fluctuations of the US dollar relative to the euro and, to a lesser extent, the British pound sterling. During the year ended April 30, 2023, we recorded foreign currency translation gains in Total accumulated other comprehensive loss, net of tax of approximately $3.2 million, primarily as a result of the fluctuations of the US dollar relative to the euro and the British pound sterling, partially offset by fluctuations of the US dollar relative to the Australian dollar.
Exchange rate gains or losses related to foreign currency transactions are recognized as transaction gains or losses on the Consolidated Statements of Income (Loss) as incurred. Under certain circumstances, we may enter into derivative financial instruments in the form of foreign currency forward contracts to hedge against specific transactions, including intercompany purchases and loans.
The information set forth in
Note 15, “Derivative Instruments and Activities,” of the Notes to Consolidated Financial Statements under the caption “Foreign Currency Contracts,” is incorporated herein by reference.
Customer Credit Risk:
In the journal publishing business, some subscriptions are sourced through journal subscription agents who, acting as agents for library customers, facilitate ordering by consolidating the subscription orders/billings of each subscriber with various publishers. Cash is generally collected in advance from subscribers by the subscription agents and is principally remitted to us between the months of December and April. Although currently we have minimal credit risk exposure to these agents, future calendar-year subscription receipts from these agents are highly dependent on their financial condition and liquidity. Subscription agents account for approximately 18% of total annual consolidated revenue, and no one agent accounts for more than 10% of total annual consolidated revenue.
Our book business is not dependent upon a single customer; however, the industry is concentrated in national, regional, and online book resellers. Although no book customer accounts for more than 6% of total consolidated revenue and 9% of accounts receivable at April 30, 2025, the top 10 book customers account for approximately 12% of total consolidated revenue and approximately 24% of accounts receivable at April 30, 2025.
Item 8. Financial Statements and Supplementary Data
The following Consolidated Financial Statements and Notes are filed as part of this report.
John Wiley & Sons, Inc. and Subsidiaries
|
|
|
|
|
|
|
|
|
|
|
|
|
|
|
|
|
|
|
|
|
|
|
|
|
|
|
|
|
|
|
|
|
|
|
|
|
|
|
|
|
|
|
|
|
|
|
Restructuring and Related Charges |
|
|
|
|
|
|
|
|
|
|
|
|
|
|
|
|
|
|
|
|
|
|
|
|
|
|
|
|
|
|
|
|
|
|
|
|
|
|
|
|
|
|
|
|
|
|
|
Report of Independent Registered Public Accounting Firm
To the Board of Directors and Shareholders of John Wiley & Sons, Inc.
Opinions on the Financial Statements and Internal Control over Financial Reporting
We have audited the accompanying consolidated statements of financial position of John Wiley & Sons, Inc. and its subsidiaries (the "Company") as of April 30, 2025 and 2024, and the related consolidated statements of income (loss), of comprehensive income (loss), of shareholders' equity and of cash flows for each of the two years in the period ended April 30, 2025, including the related notes and financial statement schedule listed in the accompanying index (collectively referred to as the "consolidated financial statements"). We also have audited the Company's internal control over financial reporting as of April 30, 2025, based on criteria established in Internal Control - Integrated Framework (2013) issued by the Committee of Sponsoring Organizations of the Treadway Commission (COSO).
In our opinion, the consolidated financial statements referred to above present fairly, in all material respects, the financial position of the Company as of April 30, 2025 and 2024, and the results of its operations and its cash flows for each of the two years in the period ended April 30, 2025 in conformity with accounting principles generally accepted in the United States of America. Also in our opinion, the Company maintained, in all material respects, effective internal control over financial reporting as of April 30, 2025, based on criteria established in Internal Control - Integrated Framework (2013) issued by the COSO.
Basis for Opinions
The Company's management is responsible for these consolidated financial statements, for maintaining effective internal control over financial reporting, and for its assessment of the effectiveness of internal control over financial reporting, included in Management’s Report on Internal Control over Financial Reporting appearing under Item 9A. Our responsibility is to express opinions on the Company’s consolidated financial statements and on the Company's internal control over financial reporting based on our audits. We are a public accounting firm registered with the Public Company Accounting Oversight Board (United States) (PCAOB) and are required to be independent with respect to the Company in accordance with the U.S. federal securities laws and the applicable rules and regulations of the Securities and Exchange Commission and the PCAOB.
We conducted our audits in accordance with the standards of the PCAOB. Those standards require that we plan and perform the audits to obtain reasonable assurance about whether the consolidated financial statements are free of material misstatement, whether due to error or fraud, and whether effective internal control over financial reporting was maintained in all material respects.
Our audits of the consolidated financial statements included performing procedures to assess the risks of material misstatement of the consolidated financial statements, whether due to error or fraud, and performing procedures that respond to those risks. Such procedures included examining, on a test basis, evidence regarding the amounts and disclosures in the consolidated financial statements. Our audits also included evaluating the accounting principles used and significant estimates made by management, as well as evaluating the overall presentation of the consolidated financial statements. Our audit of internal control over financial reporting included obtaining an understanding of internal control over financial reporting, assessing the risk that a material weakness exists, and testing and evaluating the design and operating effectiveness of internal control based on the assessed risk. Our audits also included performing such other procedures as we considered necessary in the circumstances. We believe that our audits provide a reasonable basis for our opinions.
Definition and Limitations of Internal Control over Financial Reporting
A company’s internal control over financial reporting is a process designed to provide reasonable assurance regarding the reliability of financial reporting and the preparation of financial statements for external purposes in accordance with generally accepted accounting principles. A company’s internal control over financial reporting includes those policies and procedures that (i) pertain to the maintenance of records that, in reasonable detail, accurately and fairly reflect the transactions and dispositions of the assets of the company; (ii) provide reasonable assurance that transactions are recorded as necessary to permit preparation of financial statements in accordance with generally accepted accounting principles, and that receipts and expenditures of the company are being made only in accordance with authorizations of management and directors of the company; and (iii) provide reasonable assurance regarding prevention or timely detection of unauthorized acquisition, use, or disposition of the company’s assets that could have a material effect on the financial statements.
Because of its inherent limitations, internal control over financial reporting may not prevent or detect misstatements. Also, projections of any evaluation of effectiveness to future periods are subject to the risk that controls may become inadequate because of changes in conditions, or that the degree of compliance with the policies or procedures may deteriorate.
Critical Audit Matters
The critical audit matter communicated below is a matter arising from the current period audit of the consolidated financial statements that was communicated or required to be communicated to the audit committee and that (i) relates to accounts or disclosures that are material to the consolidated financial statements and (ii) involved our especially challenging, subjective, or complex judgments. The communication of critical audit matters does not alter in any way our opinion on the consolidated financial statements, taken as a whole, and we are not, by communicating the critical audit matter below, providing a separate opinion on the critical audit matter or on the accounts or disclosures to which it relates.
Revenue Recognition - Research Subscriptions Revenue
As described in Note 3 to the consolidated financial statements, the Company recorded $922.6 million of research publishing revenue for the year ended April 30, 2025, of which a majority relates to research subscriptions. The majority of research publishing revenue is recognized over time. Journal subscription contracts are negotiated by the Company directly with customers or their subscription agents. Subscription periods typically cover calendar years. In a typical journal subscription sale, there is a written agreement between the Company and the customer that covers multiple years. However, management typically accounts for these agreements as one-year contracts because the enforceable rights under the agreements are subject to an annual confirmation and negotiation process with the customer. The transaction price consists of fixed consideration. Journal subscription revenue is generally collected in advance when the annual license is granted. Transformational agreements (read and publish) blend journal subscription and open access offerings. Generally, for a single fee, a national or regional consortium of libraries pays for and receives full read access to the Company’s journal portfolio and the ability to publish under an open access arrangement.
The principal considerations for our determination that performing procedures relating to revenue recognition for the research subscriptions revenue is a critical audit matter are a high degree of auditor effort in performing procedures and evaluating audit evidence related to the Company’s revenue recognition.
Addressing the matter involved performing procedures and evaluating audit evidence in connection with forming our overall opinion on the consolidated financial statements. These procedures included testing the effectiveness of controls relating to the revenue recognition process, including controls over research subscriptions revenue recognized. These procedures also included, among others (i) testing revenue recognized for a sample of research subscription revenue transactions by obtaining and inspecting source documents, such as sales contracts, invoices, and cash receipts and (ii) confirming a sample of outstanding customer invoice balances as of April 30, 2025 and, for confirmations not returned, obtaining and inspecting source documents, such as sales contracts, invoices, and subsequent cash receipts.
/s/ PricewaterhouseCoopers LLP
New York, New York
June 25, 2025
We have served as the Company’s auditor since 2023.
Report of Independent Registered Public Accounting Firm
To the Shareholders and Board of Directors
John Wiley & Sons, Inc.:
Opinion on the Consolidated Financial Statements
We have audited the accompanying consolidated statements of income (loss), comprehensive income (loss), cash flows, and shareholders’ equity of John Wiley & Sons, Inc. and subsidiaries (the Company) for the year ended April 30, 2023, and the related notes and financial statement schedule II (collectively, the consolidated financial statements). In our opinion, the consolidated financial statements present fairly, in all material respects, the results of the Company’s operations and its cash flows for the year ended April 30, 2023, in conformity with U.S. generally accepted accounting principles.
Basis for Opinion
These consolidated financial statements are the responsibility of the Company’s management. Our responsibility is to express an opinion on these consolidated financial statements based on our audit. We are a public accounting firm registered with the Public Company Accounting Oversight Board (United States) (PCAOB) and are required to be independent with respect to the Company in accordance with the U.S. federal securities laws and the applicable rules and regulations of the Securities and Exchange Commission and the PCAOB.
We conducted our audit in accordance with the standards of the PCAOB. Those standards require that we plan and perform the audit to obtain reasonable assurance about whether the consolidated financial statements are free of material misstatement, whether due to error or fraud. Our audit included performing procedures to assess the risks of material misstatement of the consolidated financial statements, whether due to error or fraud, and performing procedures that respond to those risks. Such procedures included examining, on a test basis, evidence regarding the amounts and disclosures in the consolidated financial statements. Our audit also included evaluating the accounting principles used and significant estimates made by management, as well as evaluating the overall presentation of the consolidated financial statements. We believe that our audit provides a reasonable basis for our opinion.
/s/ KPMG LLP
We served as the Company’s auditor from 2002 to 2023.
New York, New York
June 26, 2023 except for Note 20, as to which the date is June 25, 2025
John Wiley & Sons, Inc. and Subsidiaries
CONSOLIDATED STATEMENTS OF FINANCIAL POSITION
In thousands
|
|
|
|
|
|
|
|
|
|
|
|
|
April 30, |
|
2025 |
|
2024 |
| Assets: |
|
|
|
| Current assets |
|
|
|
| Cash and cash equivalents |
$ |
85,882 |
|
|
$ |
83,249 |
|
| Accounts receivable, net |
228,410 |
|
|
224,198 |
|
| Inventories, net |
22,875 |
|
|
26,219 |
|
| Prepaid expenses and other current assets |
102,717 |
|
|
85,954 |
|
| Current assets held-for-sale |
— |
|
|
34,422 |
|
| Total current assets |
439,884 |
|
|
454,042 |
|
|
|
|
|
| Technology, property, and equipment, net |
162,125 |
|
|
192,438 |
|
| Intangible assets, net |
595,044 |
|
|
615,694 |
|
| Goodwill |
1,121,505 |
|
|
1,091,368 |
|
| Operating lease right-of-use assets |
66,128 |
|
|
69,074 |
|
| Other non-current assets |
306,780 |
|
|
283,719 |
|
| Non-current assets held-for-sale |
— |
|
|
19,160 |
|
| Total assets |
$ |
2,691,466 |
|
|
$ |
2,725,495 |
|
|
|
|
|
| Liabilities and shareholders’ equity: |
|
|
|
| Current liabilities |
|
|
|
| Accounts payable |
$ |
60,948 |
|
|
$ |
55,659 |
|
| Accrued royalties |
109,765 |
|
|
97,173 |
|
| Short-term portion of long-term debt |
10,000 |
|
|
7,500 |
|
| Contract liabilities |
462,693 |
|
|
483,778 |
|
| Accrued employment costs |
93,117 |
|
|
96,980 |
|
| Short-term portion of operating lease liabilities |
18,282 |
|
|
18,294 |
|
| Other accrued liabilities |
66,051 |
|
|
76,266 |
|
| Current liabilities held-for-sale |
— |
|
|
37,632 |
|
| Total current liabilities |
820,856 |
|
|
873,282 |
|
|
|
|
|
| Long-term debt |
789,435 |
|
|
767,096 |
|
| Accrued pension liability |
71,899 |
|
|
70,832 |
|
| Deferred income tax liabilities |
105,145 |
|
|
97,186 |
|
| Operating lease liabilities |
81,482 |
|
|
94,386 |
|
| Other long-term liabilities |
70,443 |
|
|
71,760 |
|
| Long-term liabilities held-for-sale |
— |
|
|
11,237 |
|
| Total liabilities |
1,939,260 |
|
|
1,985,779 |
|
Commitments and contingencies ( Note 16) |
|
|
|
| Shareholders’ equity |
|
|
|
Preferred stock, $1 par value: Authorized – 2 million, Issued – 0 |
— |
|
|
— |
|
Class A common stock, $1 par value: Authorized – 180 million, Issued – 70,312 and 70,259 as of April 30, 2025 and 2024, respectively |
70,312 |
|
|
70,259 |
|
Class B convertible common stock, $1 par value: Authorized – 72 million, Issued – 12,870 and 12,923 as of April 30, 2025 and 2024, respectively |
12,870 |
|
|
12,923 |
|
| Additional paid-in capital |
481,863 |
|
|
474,406 |
|
| Retained earnings |
1,591,168 |
|
|
1,583,348 |
|
| Accumulated other comprehensive loss: |
|
|
|
| Foreign currency translation adjustment |
(264,548) |
|
|
(333,827) |
|
| Unamortized retirement costs, net of tax |
(209,190) |
|
|
(200,922) |
|
Unrealized (loss) gain on interest rate swaps, net of tax |
(5,182) |
|
|
6,310 |
|
| Total accumulated other comprehensive loss, net of tax |
(478,920) |
|
|
(528,439) |
|
Less: treasury shares at cost (Class A – 25,687 and 24,828 as of April 30, 2025 and 2024, respectively, Class B – 4,101 and 3,928 as of April 30, 2025 and 2024, respectively) |
(925,087) |
|
|
(872,781) |
|
| Total shareholders’ equity |
752,206 |
|
|
739,716 |
|
| Total liabilities and shareholders’ equity |
$ |
2,691,466 |
|
|
$ |
2,725,495 |
|
See accompanying Notes to Consolidated Financial Statements.
John Wiley & Sons, Inc. and Subsidiaries
CONSOLIDATED STATEMENTS OF INCOME (LOSS)
Dollars in thousands, except per share information
|
|
|
|
|
|
|
|
|
|
|
|
|
|
|
|
|
|
|
For the Years Ended April 30, |
|
2025 |
|
2024 |
|
2023 |
| Revenue, net |
$ |
1,677,609 |
|
|
$ |
1,872,987 |
|
|
$ |
2,019,900 |
|
|
|
|
|
|
|
| Costs and expenses |
|
|
|
|
|
| Cost of sales |
431,380 |
|
|
579,722 |
|
|
692,541 |
|
| Operating and administrative expenses |
947,437 |
|
|
1,013,520 |
|
|
1,037,399 |
|
| Impairment of goodwill |
— |
|
|
108,449 |
|
|
99,800 |
|
| Restructuring and related charges |
25,561 |
|
|
63,041 |
|
|
49,389 |
|
| Amortization of intangible assets |
51,822 |
|
|
55,994 |
|
|
84,881 |
|
| Total costs and expenses |
1,456,200 |
|
|
1,820,726 |
|
|
1,964,010 |
|
|
|
|
|
|
|
| Operating income |
221,409 |
|
|
52,261 |
|
|
55,890 |
|
|
|
|
|
|
|
| Interest expense |
(52,547) |
|
|
(49,003) |
|
|
(37,745) |
|
Net foreign exchange transaction (losses) gains |
(8,142) |
|
|
(2,959) |
|
|
894 |
|
Net (loss) gain on sale of businesses, assets, and impairment charges related to assets held-for-sale |
(23,340) |
|
|
(183,389) |
|
|
10,177 |
|
Other income (expense), net |
5,498 |
|
|
(3,957) |
|
|
3,884 |
|
|
|
|
|
|
|
| Income (loss) before taxes |
142,878 |
|
|
(187,047) |
|
|
33,100 |
|
| Provision for income taxes |
58,717 |
|
|
13,272 |
|
|
15,867 |
|
|
|
|
|
|
|
| Net income (loss) |
$ |
84,161 |
|
|
$ |
(200,319) |
|
|
$ |
17,233 |
|
|
|
|
|
|
|
| Earnings (loss) per share: |
|
|
|
|
|
| Basic |
$ |
1.56 |
|
|
$ |
(3.65) |
|
|
$ |
0.31 |
|
| Diluted |
$ |
1.53 |
|
|
$ |
(3.65) |
|
|
$ |
0.31 |
|
|
|
|
|
|
|
| Weighted average number of common shares outstanding: |
|
|
|
|
|
| Basic |
54,054 |
|
54,945 |
|
55,558 |
| Diluted |
54,830 |
|
54,945 |
|
56,355 |
See accompanying Notes to Consolidated Financial Statements.
John Wiley & Sons, Inc. and Subsidiaries
CONSOLIDATED STATEMENTS OF COMPREHENSIVE INCOME (LOSS)
Dollars in thousands
|
|
|
|
|
|
|
|
|
|
|
|
|
|
|
|
|
|
|
For the Years Ended April 30, |
|
2025 |
|
2024 |
|
2023 |
| Net income (loss) |
$ |
84,161 |
|
|
$ |
(200,319) |
|
|
$ |
17,233 |
|
|
|
|
|
|
|
Other comprehensive income (loss): |
|
|
|
|
|
| Foreign currency translation adjustment |
69,279 |
|
|
(7,481) |
|
|
3,220 |
|
Unamortized retirement costs, net of tax benefit (expense) of $552, $(2,010), and $5,967, respectively |
(8,268) |
|
|
5,884 |
|
|
(24,580) |
|
Unrealized (loss) gain on interest rate swaps, net of tax benefit (expense) of $1,450, $(663), and $(393), respectively |
(11,492) |
|
|
2,060 |
|
|
604 |
|
Total other comprehensive income (loss) |
49,519 |
|
|
463 |
|
|
(20,756) |
|
|
|
|
|
|
|
Comprehensive income (loss) |
$ |
133,680 |
|
|
$ |
(199,856) |
|
|
$ |
(3,523) |
|
See accompanying Notes to Consolidated Financial Statements.
John Wiley & Sons, Inc. and Subsidiaries
CONSOLIDATED STATEMENTS OF CASH FLOWS
Dollars in thousands
|
|
|
|
|
|
|
|
|
|
|
|
|
|
|
|
|
|
|
For the Years Ended April 30, |
|
2025 |
|
2024 |
|
2023 |
| Operating activities |
|
|
|
|
|
| Net income (loss) |
$ |
84,161 |
|
|
$ |
(200,319) |
|
|
$ |
17,233 |
|
| Adjustments to reconcile net income (loss) to net cash provided by operating activities: |
|
|
|
|
|
| Impairment of goodwill |
— |
|
|
108,449 |
|
|
99,800 |
|
| Net loss (gain) on sale of businesses, assets, and impairment charges related to assets held-for-sale |
23,340 |
|
|
183,389 |
|
|
(10,217) |
|
| Amortization of intangible assets |
51,822 |
|
|
55,994 |
|
|
84,881 |
|
| Amortization of product development assets |
16,610 |
|
|
22,835 |
|
|
32,366 |
|
| Amortization of cloud computing arrangements |
1,081 |
|
|
1,210 |
|
|
807 |
|
| Depreciation and amortization of technology, property, and equipment |
78,694 |
|
|
98,160 |
|
|
96,006 |
|
| Restructuring and related charges |
25,561 |
|
|
63,041 |
|
|
49,389 |
|
| Stock-based compensation expense |
22,222 |
|
|
24,982 |
|
|
26,504 |
|
| Employee retirement plan expense |
31,987 |
|
|
27,844 |
|
|
26,956 |
|
Net foreign exchange transaction losses (gains) |
8,142 |
|
|
2,959 |
|
|
(894) |
|
Other noncash charges (credits) |
13,896 |
|
|
(12,319) |
|
|
(6,319) |
|
| Changes in operating assets and liabilities |
|
|
|
|
|
| Accounts receivable, net |
7,951 |
|
|
(22,062) |
|
|
26,757 |
|
| Inventories, net |
(1,419) |
|
|
5,436 |
|
|
(522) |
|
| Accounts payable and accrued royalties |
8,112 |
|
|
(38,460) |
|
|
22,908 |
|
| Contract liabilities |
(20,009) |
|
|
(1,332) |
|
|
(36,529) |
|
| Restructuring payments |
(22,333) |
|
|
(38,520) |
|
|
(26,599) |
|
| Other accrued liabilities |
(19,929) |
|
|
19,274 |
|
|
(48,787) |
|
| Employee retirement plan contributions |
(38,746) |
|
|
(36,887) |
|
|
(45,985) |
|
| Operating lease liabilities |
(22,209) |
|
|
(25,852) |
|
|
(26,919) |
|
| Other |
(46,343) |
|
|
(30,184) |
|
|
(3,765) |
|
| Net cash provided by operating activities |
202,591 |
|
|
207,638 |
|
|
277,071 |
|
| Investing activities |
|
|
|
|
|
| Product development spending |
(15,228) |
|
|
(17,262) |
|
|
(22,958) |
|
| Additions to technology, property, and equipment |
(61,473) |
|
|
(76,080) |
|
|
(81,155) |
|
| Businesses acquired in purchase transactions, net of cash acquired |
(3,602) |
|
|
(3,116) |
|
|
(7,292) |
|
Net cash (transferred) proceeds related to the sale of businesses and assets |
(7,642) |
|
|
(1,771) |
|
|
15,585 |
|
| Acquisitions of publication rights and other |
(6,073) |
|
|
(8,414) |
|
|
(2,578) |
|
| Net cash used in investing activities |
(94,018) |
|
|
(106,643) |
|
|
(98,398) |
|
| Financing activities |
|
|
|
|
|
| Repayments of long-term debt |
(1,186,371) |
|
|
(1,156,939) |
|
|
(1,044,205) |
|
| Borrowings of long-term debt |
1,199,880 |
|
|
1,184,706 |
|
|
1,005,271 |
|
| Payment of debt issuance costs |
— |
|
|
— |
|
|
(4,493) |
|
| Purchases of treasury shares |
(60,421) |
|
|
(45,050) |
|
|
(35,000) |
|
| Change in book overdrafts |
4,650 |
|
|
(4,472) |
|
|
(4,841) |
|
| Cash dividends |
(76,101) |
|
|
(76,964) |
|
|
(77,298) |
|
| Impact of tax withholding on stock-based compensation and other |
(6,967) |
|
|
(8,502) |
|
|
(8,002) |
|
| Net cash used in financing activities |
(125,330) |
|
|
(107,221) |
|
|
(168,568) |
|
| Effects of exchange rate changes on cash, cash equivalents, and restricted cash |
3,146 |
|
|
(1,493) |
|
|
(3,570) |
|
| Cash reconciliation: |
|
|
|
|
|
| Cash and cash equivalents |
99,441 |
|
|
106,714 |
|
|
100,397 |
|
| Restricted cash included in Prepaid expenses and other current assets |
102 |
|
|
548 |
|
|
330 |
|
| Balance at beginning of year |
99,543 |
|
|
107,262 |
|
|
100,727 |
|
| (Decrease) increase for year |
(13,611) |
|
|
(7,719) |
|
|
6,535 |
|
| Cash and cash equivalents |
85,882 |
|
|
99,441 |
|
|
106,714 |
|
| Restricted cash included in Prepaid expenses and other current assets |
50 |
|
|
102 |
|
|
548 |
|
Balance at end of year(1) |
$ |
85,932 |
|
|
$ |
99,543 |
|
|
$ |
107,262 |
|
| Cash paid during the year for: |
|
|
|
|
|
| Interest |
$ |
51,328 |
|
|
$ |
47,101 |
|
|
$ |
36,130 |
|
| Income taxes, net of refunds |
$ |
53,884 |
|
|
$ |
50,834 |
|
|
$ |
50,891 |
|
|
|
|
|
|
|
(1) |
The balance as of April 30, 2024, includes held-for-sale cash, cash equivalents and restricted cash. See Note 4, “Acquisitions and Divestitures” for further details. |
See accompanying Notes to Consolidated Financial Statements.
John Wiley & Sons, Inc. and Subsidiaries
CONSOLIDATED STATEMENTS OF SHAREHOLDERS’ EQUITY
Dollars in thousands
|
|
|
|
|
|
|
|
|
|
|
|
|
|
|
|
|
|
|
|
|
|
|
|
|
|
|
|
|
|
|
|
|
|
|
|
|
|
|
|
|
|
|
Class A common stock |
|
Class B common stock |
|
Additional
paid-in
capital |
|
Retained
earnings |
|
Accumulated
other
comprehensive
loss, net of tax |
|
Treasury
stock |
|
Total
shareholders’
equity |
| Balance at April 30, 2022 |
$ |
70,226 |
|
|
$ |
12,956 |
|
|
$ |
459,297 |
|
|
$ |
1,921,160 |
|
|
$ |
(508,146) |
|
|
$ |
(813,224) |
|
|
$ |
1,142,269 |
|
|
|
|
|
|
|
|
|
|
|
|
|
|
|
| Restricted shares issued under stock-based compensation plans |
— |
|
|
— |
|
|
(16,152) |
|
|
3 |
|
|
— |
|
|
16,436 |
|
|
287 |
|
| Impact of tax withholding on stock-based compensation and other |
— |
|
|
— |
|
|
137 |
|
|
— |
|
|
— |
|
|
(8,139) |
|
|
(8,002) |
|
| Stock-based compensation expense |
— |
|
|
— |
|
|
26,520 |
|
|
— |
|
|
— |
|
|
— |
|
|
26,520 |
|
| Purchases of treasury shares |
— |
|
|
— |
|
|
— |
|
|
— |
|
|
— |
|
|
(35,000) |
|
|
(35,000) |
|
Class A common stock dividends ($1.39 per share) |
— |
|
|
— |
|
|
— |
|
|
(64,973) |
|
|
— |
|
|
— |
|
|
(64,973) |
|
Class B common stock dividends ($1.39 per share) |
— |
|
|
— |
|
|
— |
|
|
(12,551) |
|
|
— |
|
|
— |
|
|
(12,551) |
|
| Common stock class conversions |
5 |
|
|
(5) |
|
|
— |
|
|
— |
|
|
— |
|
|
— |
|
|
— |
|
| Comprehensive loss, net of tax |
— |
|
|
— |
|
|
— |
|
|
17,233 |
|
|
(20,756) |
|
|
— |
|
|
(3,523) |
|
| Balance at April 30, 2023 |
$ |
70,231 |
|
|
$ |
12,951 |
|
|
$ |
469,802 |
|
|
$ |
1,860,872 |
|
|
$ |
(528,902) |
|
|
$ |
(839,927) |
|
|
$ |
1,045,027 |
|
|
|
|
|
|
|
|
|
|
|
|
|
|
|
| Restricted shares issued under stock-based compensation plans |
— |
|
|
— |
|
|
(20,392) |
|
|
1 |
|
|
— |
|
|
20,698 |
|
|
307 |
|
| Impact of tax withholding on stock-based compensation and other |
— |
|
|
— |
|
|
— |
|
|
— |
|
|
— |
|
|
(8,502) |
|
|
(8,502) |
|
| Stock-based compensation expense |
— |
|
|
— |
|
|
24,996 |
|
|
— |
|
|
— |
|
|
— |
|
|
24,996 |
|
| Purchases of treasury shares |
— |
|
|
— |
|
|
— |
|
|
— |
|
|
— |
|
|
(45,050) |
|
|
(45,050) |
|
Class A common stock dividends ($1.40 per share) |
— |
|
|
— |
|
|
— |
|
|
(64,584) |
|
|
— |
|
|
— |
|
|
(64,584) |
|
Class B common stock dividends ($1.40 per share) |
— |
|
|
— |
|
|
— |
|
|
(12,622) |
|
|
— |
|
|
— |
|
|
(12,622) |
|
| Common stock class conversions |
28 |
|
|
(28) |
|
|
— |
|
|
— |
|
|
— |
|
|
— |
|
|
— |
|
| Comprehensive loss, net of tax |
— |
|
|
— |
|
|
— |
|
|
(200,319) |
|
|
463 |
|
|
— |
|
|
(199,856) |
|
| Balance at April 30, 2024 |
$ |
70,259 |
|
|
$ |
12,923 |
|
|
$ |
474,406 |
|
|
$ |
1,583,348 |
|
|
$ |
(528,439) |
|
|
$ |
(872,781) |
|
|
$ |
739,716 |
|
|
|
|
|
|
|
|
|
|
|
|
|
|
|
| Restricted shares issued under stock-based compensation plans |
— |
|
|
— |
|
|
(14,792) |
|
|
— |
|
|
— |
|
|
15,082 |
|
|
290 |
|
| Impact of tax withholding on stock-based compensation and other |
— |
|
|
— |
|
|
— |
|
|
— |
|
|
— |
|
|
(6,967) |
|
|
(6,967) |
|
| Stock-based compensation expense |
— |
|
|
— |
|
|
22,249 |
|
|
— |
|
|
— |
|
|
— |
|
|
22,249 |
|
| Purchases of treasury shares |
— |
|
|
— |
|
|
— |
|
|
— |
|
|
— |
|
|
(60,421) |
|
|
(60,421) |
|
Class A common stock dividends ($1.41 per share) |
— |
|
|
— |
|
|
— |
|
|
(63,758) |
|
|
— |
|
|
— |
|
|
(63,758) |
|
Class B common stock dividends ($1.41 per share) |
— |
|
|
— |
|
|
— |
|
|
(12,583) |
|
|
— |
|
|
— |
|
|
(12,583) |
|
| Common stock class conversions |
53 |
|
|
(53) |
|
|
— |
|
|
— |
|
|
— |
|
|
— |
|
|
— |
|
Comprehensive income, net of tax |
— |
|
|
— |
|
|
— |
|
|
84,161 |
|
|
49,519 |
|
|
— |
|
|
133,680 |
|
| Balance at April 30, 2025 |
$ |
70,312 |
|
|
$ |
12,870 |
|
|
$ |
481,863 |
|
|
$ |
1,591,168 |
|
|
$ |
(478,920) |
|
|
$ |
(925,087) |
|
|
$ |
752,206 |
|
See accompanying Notes to Consolidated Financial Statements.
John Wiley & Sons, Inc. and Subsidiaries
Notes to Consolidated Financial Statements
Note 1 – Description of Business
The Company, founded in 1807, was incorporated in the state of New York on January 15, 1904. Throughout this report, when we refer to “Wiley,” the “Company,” “we,” “our,” or “us,” we are referring to John Wiley & Sons, Inc. and all our subsidiaries, except where the context indicates otherwise.
Wiley is one of the world’s largest publishers and a global leader in research and learning. The Company's content, services, platforms, and knowledge networks are tailored to meet the evolving needs of its customers and partners, including researchers, students, instructors, professionals, institutions, and corporations.
We report financial information in three reportable segments which include Research, Learning, and Held for Sale or Sold, as well as a Corporate expense category. Through the Research segment, we provide peer-reviewed scientific, technical, and medical (STM) journals, content platforms, and related publishing and audience solutions to academic, corporate, and government customers, academic societies, and individual researchers. The Learning segment provides scientific, professional, and education print and digital books to researchers, professionals, and students, digital courseware for instructors and students and assessment services to businesses and professionals. The Held for Sale or Sold segment primarily consists of non-core businesses which were classified as held-for-sale until the date of sale, as well as other businesses which were sold.
Note 2 – Summary of Significant Accounting Policies, Recently Issued and Recently Adopted Accounting Standards
Summary of Significant Accounting Policies
Basis of Presentation:
Our Consolidated Financial Statements include all the accounts of the Company and our subsidiaries. We have eliminated all intercompany transactions and balances in consolidation. All amounts are presented in United States (US) dollars, unless otherwise specified. All amounts are in thousands, except per share amounts, and are approximate due to rounding.
Reclassifications:
Certain prior year amounts have been reclassified to conform to the current year’s presentation.
Use of Estimates:
The preparation of our Consolidated Financial Statements and related disclosures in conformity with Generally Accepted Accounting Principles in the United States of America (US GAAP) requires our management to make estimates and assumptions that affect the reported amounts of assets and liabilities, the disclosure of contingent assets and liabilities as of the date of the financial statements, and revenue and expenses during the reporting period. These estimates include, among other items, sales return reserves, allocation of acquisition purchase price to assets acquired and liabilities assumed, assets and liabilities held-for-sale, goodwill and indefinite-lived intangible assets, intangible assets with definite lives and other long-lived assets, and retirement plans. We review these estimates and assumptions periodically using historical experience and other factors and reflect the effects of any revisions on the Consolidated Financial Statements in the period we determine any revisions to be necessary. Actual results could differ from those estimates, which could affect the reported results.
Book Overdrafts:
Under our cash management system, a book overdraft balance exists for our primary disbursement accounts. This overdraft represents uncleared checks in excess of cash balances in individual bank accounts. Our funds are transferred from other existing bank account balances or from lines of credit as needed to fund checks presented for payment. As of April 30, 2025 and 2024, book overdrafts of $14.8 million and $10.1 million, respectively, were included in Accounts payable on the Consolidated Statements of Financial Position.
Revenue Recognition:
Revenue from contracts with customers is recognized using a five-step model consisting of the following: (1) identify the contract with a customer, (2) identify the performance obligations in the contract, (3) determine the transaction price, (4) allocate the transaction price to the performance obligations in the contract based on its stand-alone selling price. We use an observable price to determine the stand-alone selling price for separate performance obligations if available or, when not available, an estimate that maximizes the use of observable inputs and faithfully depicts the selling price of the promised goods or services if we sold those goods or services separately to a similar customer in similar circumstances. Suitable methods for estimating the standalone selling price include adjusted market assessment approach, expected cost plus a margin approach, and the residual approach. Any contract discount within the agreement is allocated across all performance obligations unless observable evidence exists that the discount relates to a specific performance obligation or obligations in the contract, and (5) recognize revenue when (or as) we satisfy a performance obligation. Performance obligations are satisfied when we transfer control of a good or service to a customer, which can occur over time or at a point in time. The amount of revenue recognized is based on the consideration to which we expect to be entitled in exchange for those goods or services, including the expected value of variable consideration. The customer’s ability and intent to pay the transaction price is assessed in determining whether a contract exists with the customer. If collectability of substantially all the consideration in a contract is not probable, consideration received is not recognized as revenue unless the consideration is nonrefundable, and we no longer have an obligation to transfer additional goods or services to the customer, or collectability becomes probable.
See Note 3, “Revenue Recognition, Contracts with Customers,” for further details of our revenue recognition policy.
Cash and Cash Equivalents:
Cash and cash equivalents consist of highly liquid investments with an original maturity of three months or less at the time of purchase and are stated at cost, which approximates market value, because of the short-term maturity of the instruments.
Allowance for Credit Losses:
We are exposed to credit losses through our accounts receivable with customers. Accounts receivable, net, is stated at amortized cost net of provision for credit losses. Our methodology to measure the provision for credit losses requires an estimation of loss rates based upon historical loss experience adjusted for factors that are relevant to determining the expected collectability of accounts receivable, such as, delinquency trends, aging behavior of receivables, credit and liquidity indicators for industry groups, customer classes or individual customers, and reasonable and supportable forecasts of the economic and geopolitical conditions that may exist through the contractual life of the asset. Our provision for credit losses is reviewed and revised periodically. Our accounts receivable is evaluated on a pool basis that is based on customer groups with similar risk characteristics. This includes consideration of the following factors to develop these pools: size of the customer, industry, geographical location, historical risk, and types of services or products sold. We write off receivables only when deemed no longer collectible.
We are also exposed to potential credit losses through our notes receivable issued in connection with our divestitures. As of April 30, 2025 and 2024, notes receivable inclusive of interest are $121.5 million and $92.5 million, respectively, and are reflected in Other non-current assets in the Consolidated Statements of Financial Position. We evaluate the collectability of outstanding notes receivable and record an allowance to represent an estimate of future expected credit losses, as applicable. As of April 30, 2025 and 2024, we did not record an allowance on the notes receivable. On June 5, 2025, Wiley entered into an agreement to sell the University Services Seller Note and other assets. The cash consideration was also fully paid in June 2025.
See Note 4, “Acquisitions and Divestitures” for more details on the notes receivable issued in connection with our divestitures and the sale.
Sales Return Reserves:
The process that we use to determine our sales returns and the related reserve provision charged against revenue is based on applying an estimated return rate to current year returnable print book sales. This rate is based upon an analysis of actual historical return experience in the various markets and geographic regions in which we do business. We collect, maintain, and analyze significant amounts of sales returns data for large volumes of homogeneous transactions. This allows us to make reasonable estimates of the amount of future returns. All available data is utilized to identify the returns by market and to which fiscal year the sales returns apply. This enables management to track the returns in detail and identify and react to trends occurring in the marketplace, with the objective of being able to make the most informed judgments possible in setting reserve rates. Associated with the estimated sales return reserves, we also include a related increase to inventory and a reduction to accrued royalties as a result of the expected returns. Print book sales return reserves amounted to a net liability balance of $9.0 million and $14.4 million as of April 30, 2025 and 2024, respectively.
The reserves are reflected in the following accounts of the Consolidated Statements of Financial Position as of April 30:
|
|
|
|
|
|
|
|
|
|
|
|
|
2025 |
|
2024 |
| Increase in Inventories, net |
$ |
4,042 |
|
|
$ |
7,833 |
|
| Decrease in Accrued royalties |
(2,067) |
|
|
(3,112) |
|
| Increase in Contract liabilities |
15,093 |
|
|
25,393 |
|
| Print book sales return reserve net liability balance |
$ |
(8,984) |
|
|
$ |
(14,448) |
|
Inventories:
Inventories are carried at the lower of cost or net realizable value. US book inventories aggregating $10.9 million and $11.4 million at April 30, 2025 and 2024, respectively, are valued using the last-in, first-out (LIFO) method. All other inventories are valued using the first-in, first-out (FIFO) method.
Product Development Assets:
Product development assets consist of book composition costs and other product development costs and are included in Other non-current assets on the Consolidated Statements of Financial Position. Costs associated with developing a book for publication are expensed until the product is determined to be commercially viable. Book composition costs represent the costs incurred to bring an edited commercial manuscript to publication, which include typesetting, proofreading, design, illustration costs, and digital formatting. Book composition costs are capitalized and are generally amortized on a double-declining basis over their estimated useful lives, ranging from 1 to 3 years. Other product development costs represent the costs incurred in developing software, platforms, and digital content to be sold and licensed to third parties. Other product development costs are capitalized and amortized on a straight-line basis over their estimated useful lives. As of April 30, 2025, the weighted average estimated useful life of other product development costs was approximately 3 years.
Royalty Advances:
Royalty advances are capitalized in Other non-current assets on the Consolidated Statements of Financial Position and, upon publication, are expensed as royalties earned based on sales of the published works. Royalty advances are reviewed for recoverability, and a reserve for loss is maintained, if appropriate.
Advertising and Marketing Costs:
Advertising and marketing costs are expensed as incurred. These costs are reflected in the Consolidated Statements of Income (Loss) as follows:
|
|
|
|
|
|
|
|
|
|
|
|
|
|
|
|
|
|
|
For the Years Ended April 30, |
|
2025 |
|
2024 |
|
2023 |
| Advertising and marketing costs |
$ |
31,235 |
|
|
$ |
61,709 |
|
|
$ |
93,385 |
|
Cost of sales(1) |
29 |
|
|
28,809 |
|
|
55,907 |
|
| Operating and administrative expenses |
31,206 |
|
|
32,900 |
|
|
37,478 |
|
|
|
|
|
|
|
(1) |
For the years ended April 30, 2024 and 2023, this includes certain advertising and marketing costs to fulfill performance obligations from contracts with educational institutions incurred by the University Services business, which was sold on January 1, 2024 and previously included in our Held for Sale or Sold segment. |
Technology, Property, and Equipment:
Technology, property, and equipment is recorded at cost, except for property and equipment that have been impaired, for which we reduce the carrying amount to the estimated fair value at the impairment date. Major renewals and improvements are capitalized, while maintenance and repairs are expensed as incurred.
Technology, property, and equipment is depreciated using the straight-line method based upon the following estimated useful lives: Computer Software – 3 to 10 years; Computer Hardware – 3 to 5 years; Buildings and Leasehold Improvements – the lesser of the estimated useful life of the asset up to 40 years or the duration of the lease; Furniture, Fixtures, and Warehouse Equipment – 5 to 10 years.
Costs incurred for computer software internally developed or obtained for internal use are capitalized during the application development stage and expensed as incurred during the preliminary project and post-implementation stages. Costs incurred during the application development stage include costs of materials, services, payroll, and payroll-related costs for employees who are directly associated with the software project. Such costs are amortized over the expected useful life of the related software, which is generally 3 to 5 years. Maintenance, training, and upgrade costs that do not result in additional functionality are expensed as incurred.
Cloud Computing Arrangements:
We incur costs to implement cloud computing arrangements that are hosted by third parties. Costs incurred during the application development stage are capitalized if they consist of internal and external costs directly attributable to developing and configuring the cloud computing software for its intended use. Once a project is substantially complete and ready for its intended use, such costs are amortized using the straight-line method over the term of the cloud computing arrangement in Operating and administrative expenses on the Consolidated Statements of Income (Loss). As of April 30, 2025 and 2024, the unamortized implementation costs related to our cloud computing arrangements were $24.0 million and $3.6 million, respectively, and are reflected in Other non-current assets in our Consolidated Statements of Financial Position. Payments for capitalized implementation costs are included in Net cash provided by operating activities on the Consolidated Statements of Cash Flows.
Allocation of Acquisition Purchase Price to Assets Acquired and Liabilities Assumed:
In connection with acquisitions, we allocate the cost of the acquisition to the assets acquired and the liabilities assumed based on the estimates of fair value for such items, including intangible assets and technology acquired. The excess of the purchase consideration over the fair value of assets acquired and liabilities assumed is recorded as goodwill. The determination of the acquisition-date fair value of the assets acquired, and liabilities assumed, requires us to make significant estimates and assumptions, such as forecasted revenue growth rates and operating cash flows, royalty rates, customer attrition rates, obsolescence rates of developed technology, and discount rates. We may use a third-party valuation consultant to assist in the determination of such estimates.
Assets and Liabilities Held-for-Sale:
We classify assets as held-for-sale when management commits to a plan to sell, the assets are available for immediate sale in their present condition, we have initiated an active program to find a buyer, and the sale is probable within one year. Assets must be actively marketed at a reasonable price, and the plan should indicate completion is likely without significant changes.
Assets classified as held-for-sale are measured at the lower of carrying value or fair value less costs to sell. Fair value determination may involve significant estimates regarding forecasted information and discount rates. Upon classification as held-for-sale, we report the assets and liabilities of the disposal group as held-for-sale in the Consolidated Statements of Financial Position. Any impairment is recognized in Net (loss) gain on sale of businesses, assets, and impairment charges related to assets held-for-sale on the Consolidated Statements of Income (Loss) and is included as a valuation allowance or contra-asset account within Current assets held-for-sale or Non-current assets held-for-sale or both on the Consolidated Statement of Financial Position.
We reassess fair value each reporting period and adjust the carrying value as necessary, without exceeding the original carrying value when first classified as held-for-sale. Gains are only recognized upon actual sale.
Goodwill and Indefinite-lived Intangible Assets:
Goodwill represents the excess of the aggregate of the following: (1) consideration transferred, (2) the fair value of any noncontrolling interest in the acquiree, and (3) if the business combination is achieved in stages, the acquisition-date fair value of our previously held equity interest in the acquiree over the net of the acquisition-date amounts of the identifiable assets acquired and the liabilities assumed.
Indefinite-lived intangible assets primarily consist of brands and trademarks, and publishing rights, and are typically characterized by intellectual property with a long and well-established revenue stream resulting from strong and well-established imprint/brand recognition in the market.
We use the acquisition method of accounting for all business combinations and do not amortize goodwill or intangible assets with indefinite useful lives. Goodwill and intangible assets with indefinite useful lives are tested for possible impairment annually during the fourth quarter of each fiscal year, or more frequently if events or changes in circumstances indicate that the asset might be impaired.
See Note 11, “Goodwill and Intangible Assets” for further details of our policy.
Intangible Assets with Definite Lives and Other Long-Lived Assets:
Definite-lived intangible assets principally consist of content and publishing rights, customer relationships, developed technology, brands and trademarks, and covenants not to compete agreements, and are amortized over their estimated useful lives. The most significant factors in determining the estimated lives of these intangibles are the history and longevity, combined with the strength and pattern of projected cash flows.
Intangible assets with definite lives as of April 30, 2025 are amortized on a straight-line basis over the following weighted average estimated useful lives: content and publishing rights – 26 years, customer relationships – 15 years, developed technology – 7 years, brands and trademarks – 16 years, and covenants not to compete agreements – 4 years.
Assets with definite lives are evaluated for indicators of impairment upon a significant change in the operating or macroeconomic environment. When indicators of impairment are present, we test definite lived and long-lived assets for recoverability by comparing the carrying value of an asset group to an estimate of the future undiscounted cash flows expected to result from the use and eventual disposition of the asset group. In these circumstances, if an evaluation of the projected undiscounted cash flows indicates impairment, the asset is written down to its estimated fair value based on the discounted future cash flows.
Leases:
We have contractual obligations as a lessee with respect to offices, warehouses and distribution centers, automobiles, and office equipment.
See Note 12, “Operating Leases” for further details of our policy.
Employee Benefit Plans:
We provide various defined benefit plans to our employees. We use actuarial assumptions to calculate pension and benefit costs as well as pension assets and liabilities included in the consolidated financial statements.
See Note 17, “Retirement Plans” for further details of our policy.
Income Taxes:
Income taxes are recorded using the asset and liability method. Under this method, deferred income taxes are recognized for temporary differences between the carrying amounts of assets and liabilities for financial reporting purposes and the amounts used for income tax purposes. Deferred taxes are measured using rates the Company expects to apply to taxable income in years in which those temporary differences are expected to reverse. The financial effect of changes in tax laws or rates is accounted for in the period of enactment. Future tax benefits are recognized to the extent that the realization of such benefits is more likely than not. Valuation allowances are established when management determines that it is more likely than not that some or all of a deferred tax asset will not be realized.
From time to time, the Company engages in transactions in which the tax consequences may be subject to uncertainty. Judgment is required in assessing and estimating the tax consequences of these transactions. The Company prepares and files tax returns based on its interpretation of tax laws and regulations. In the normal course of business, the Company’s tax returns are subject to examination by various taxing authorities. Such examinations may result in future tax and interest assessments by these taxing authorities.
In determining the Company’s tax provision for financial reporting purposes, the Company establishes a reserve for uncertain tax positions, unless such positions are determined to be more likely than not of being sustained upon examination based on their technical merits, including the resolution of any appeals or litigation processes. The Company includes interest and, where appropriate, penalties as a component of income tax expense. There is judgment involved in determining whether positions taken on the Company’s tax returns are more likely than not of being sustained, which involve the use of estimates and assumptions with respect to the potential outcome of positions taken on tax returns that may be reviewed by tax authorities.
Derivative Financial Instruments:
From time to time, we enter into foreign exchange forward and interest rate swap contracts as a hedge against foreign currency asset and liability commitments, changes in interest rates, and anticipated transaction exposures, including intercompany purchases. All derivatives are recognized as assets or liabilities and measured at fair value. Derivatives that are not determined to be effective hedges are adjusted to fair value with a corresponding adjustment to earnings. We do not use financial instruments for trading or speculative purposes.
Under FASB Accounting Standards Codification (ASC) Topic 815, “Derivatives and Hedging” (ASC Topic 815), derivative instruments that are designated as cash flow hedges have changes in their fair value recorded initially within Accumulated other comprehensive loss on the Consolidated Statements of Financial Position. As interest expense is recognized based on the variable rate loan agreements, the corresponding deferred gain or loss on the interest rate swaps is reclassified from Accumulated Other Comprehensive Loss to Interest Expense on the Consolidated Statements of Income (Loss). The interest settlement payments associated with the interest rate swap agreements are classified as cash flows from operating activities in the Consolidated Statements of Cash Flows.
For derivative instruments executed with the same counterparty under a master netting arrangement, we do not offset fair value amounts of interest rate swaps in liability positions with the ones in asset positions in the Consolidated Statements of Financial Position.
Foreign Currency Gains/Losses:
We maintain operations in many non-US locations. Assets and liabilities are translated into US dollars using end-of-period exchange rates and revenues, and expenses are translated into US dollars using weighted average rates. Our significant investments in non-US businesses are exposed to foreign currency risk. Foreign currency translation adjustments are reported as a separate component of Accumulated Other Comprehensive Loss within Shareholders’ Equity. Foreign currency transaction gains or losses are recognized on the Consolidated Statements of Income (Loss) as incurred.
Stock-Based Compensation:
We recognize stock-based compensation expense based on the fair value of the stock-based awards on the grant date, reduced by an estimate for future forfeited awards. As such, stock-based compensation expense is only recognized for those awards that are expected to ultimately vest. The fair value of stock-based awards is recognized in net income generally on a straight-line basis over the requisite service period. Stock-based compensation expense associated with performance-based stock awards is based on actual financial results for targets established up to three years in advance, or less. The cumulative effect on current and prior periods of a change in the estimated number of performance share awards, or estimated forfeiture rate, is recognized as an adjustment to earnings in the period of the revision. Judgment was also required in estimating the number of stock-based awards that may be forfeited. If actual results differ significantly from estimates, our stock-based compensation expense and Consolidated Statements of Income (Loss) could be impacted. We accelerate expense on performance-based awards using a graded vesting schedule for employees who meet retirement eligibility requirements prior to the end of the award’s service period.
The grant date fair value for stock options is estimated using the Black-Scholes option-pricing model. The determination of the assumptions used in the Black-Scholes model include the expected life of an option, the expected volatility of our common stock over the estimated life of the option, a risk-free interest rate, and the expected dividend yield.
Fair Value Measurement:
The carrying value of financial assets and liabilities recorded at fair value is measured on a recurring or nonrecurring basis. Financial assets and liabilities measured on a recurring basis are those that are adjusted to fair value at the end of every reporting period. Financial assets and liabilities measured on a non-recurring basis are those that are adjusted to fair value when a significant event occurs.
In accordance with FASB ASC 820, “Fair Value Measurements and Disclosures” (ASC Topic 820), assets and liabilities subject to fair value measurement disclosures are classified according to the three-level fair value hierarchy with respect to the inputs used to determine fair value. The level in which an asset or liability is disclosed within the fair value hierarchy is based on the lowest level input that is significant to the related fair value measurement in its entirety. The levels of input are defined as follows:
•Level 1: Quoted prices unadjusted for identical assets or liabilities in an active market.
•Level 2: Quoted prices for similar assets or liabilities in an active market, quoted prices for identical similar assets or liabilities in markets that are not active, inputs other than quoted prices that are observable and market-corroborated inputs which are derived principally from or corroborated by observable market data.
•Level 3: Unobservable inputs that reflect the entity’s own assumptions which market participants would use in pricing the asset or liability.
Recently Adopted Accounting Standards
Segment Reporting - Improvements to Reportable Segment Disclosures
In November 2023, the Financial Accounting Standards Board (FASB) issued Accounting Standards Update (ASU) 2023-07, “Segment Reporting (Topic 280) - Improvements to Reportable Segment Disclosures.” This ASU improves reportable segment disclosure requirements, primarily through enhanced disclosures about significant segment expenses that are regularly provided to the chief operating decision maker (CODM), the disclosure and description of other segment items, the inclusion of all current annual disclosures about a reportable segment in interim periods, allows for disclosure of multiple measures of a reportable segment's profit or loss, requires disclosure of the CODM's title and position, and requires a description of how the CODM uses reported measures in assessing the performance of reportable segments and in making decisions pertaining to allocation of resources. We adopted ASU 2023-07 for the fiscal year ending April 30, 2025. This standard was applied retrospectively for all periods presented in the financial statements.
See Note 20, “Segment Information” for new disclosures related to significant expenses, the CODM, and other segment items. The adoption did not impact our consolidated financial statements.
Recently Issued Accounting Standards
Disaggregation of Income Statement Expenses
In November 2024, the FASB issued ASU 2024-03, “Income Statement—Reporting Comprehensive Income—Expense Disaggregation Disclosures (Subtopic 220-40), Disaggregation of Income Statement Expenses.” In January 2025, the FASB clarified the effective date of this guidance with the issuance of ASU 2025-01, “Income Statement—Reporting Comprehensive Income—Expense Disaggregation Disclosures (Subtopic 220-40): Clarifying the Effective Date.” This ASU requires disclosure about specific types of expenses included in expense captions, including purchases of inventory, employee compensation, depreciation, amortization, and depletion. This ASU is effective for our annual disclosures starting fiscal year 2028 and interim periods starting in fiscal year 2029. Early adoption is permitted. A public entity should apply the amendments in this ASU on a prospective basis with the option to apply the standard retrospectively. We are currently assessing the impact of the disclosure requirements on our consolidated financial statements.
Improvements to Income Tax Disclosures
In December 2023, the FASB issued ASU 2023-09, “Income Taxes (Topic 740) - Improvements to Income Tax Disclosures.” This ASU enhances the transparency, effectiveness, and comparability of income tax disclosures by requiring consistent categories and greater disaggregation of information related to income tax rate reconciliations and the jurisdictions in which income taxes are paid. This ASU is effective for our annual disclosures starting fiscal year 2026. Early adoption is permitted. A public entity should apply the amendments in this ASU on a prospective basis with the option to apply the standard retrospectively. We are currently assessing the impact of the disclosure requirements on our consolidated financial statements.
Note 3 — Revenue Recognition, Contracts with Customers
Disaggregation of Revenue
The following tables present our revenue from contracts with customers disaggregated by segment and product type.
|
|
|
|
|
|
|
|
|
|
|
|
|
|
|
|
|
|
|
For the Years Ended April 30, |
|
2025 |
|
2024 |
|
2023 |
| Research: |
|
|
|
|
|
| Research Publishing |
$ |
922,553 |
|
|
$ |
892,784 |
|
|
$ |
926,773 |
|
| Research Solutions |
152,906 |
|
|
149,921 |
|
|
153,538 |
|
| Total Research |
1,075,459 |
|
|
1,042,705 |
|
|
1,080,311 |
|
|
|
|
|
|
|
| Learning: |
|
|
|
|
|
| Academic |
333,693 |
|
|
323,541 |
|
|
304,633 |
|
| Professional |
251,075 |
|
|
251,198 |
|
|
241,762 |
|
| Total Learning |
584,768 |
|
|
574,739 |
|
|
546,395 |
|
|
|
|
|
|
|
| Held for Sale or Sold |
17,382 |
|
|
255,543 |
|
|
393,194 |
|
|
|
|
|
|
|
| Total Revenue |
$ |
1,677,609 |
|
|
$ |
1,872,987 |
|
|
$ |
2,019,900 |
|
The following information describes our disaggregation of revenue by segment and product type. Overall, the majority of our revenue is recognized over time.
Research
Total Research revenue was $1,075.5 million in the year ended April 30, 2025. Research products are sold and distributed globally through multiple channels. The majority of revenue generated from Research products is recognized over time.
We disaggregated revenue by Research Publishing and Research Solutions to reflect the different types of products and services provided.
Research Publishing Products
Research Publishing products provide scientific, technical, medical, and scholarly journals, as well as related content and services, to academic, corporate, and government libraries, learned societies, and individual researchers and other professionals. Research Publishing revenue was $922.6 million in the year ended April 30, 2025, and the majority is recognized over time.
In the year ended April 30, 2025, Research Publishing products generated approximately 87% of its revenue from contracts with its customers from Journal Subscriptions (pay to read) and Transformational Agreements (read and publish) under multiyear arrangements, and Open Access (pay to publish). The remaining revenue is from Licensing and ancillary products.
Journal Subscriptions and Transformational Models
Journal Subscription contracts are negotiated by us directly with customers or their subscription agents. Subscription periods typically cover calendar years. In a typical Journal Subscription sale, there is a written agreement between us and our customer that covers multiple years. However, we typically account for these agreements as one-year contracts because our enforceable rights under the agreements are subject to an annual confirmation and negotiation process with the customer.
In Journal Subscriptions, there are generally two performance obligations: a functional intellectual property license with a stand-ready obligation to provide access to new content for one year, which includes online hosting of the content (collectively referred to as Read) which is recognized over time, and a functional intellectual property perpetual license for access to historical journal content (Perpetual License) which is recognized at the point in time when access to the historical content is initially granted. The transaction price consists of fixed consideration. Journal Subscription revenue is generally collected in advance when the annual license is granted.
The total transaction price is allocated to each performance obligation based on its relative standalone selling price using a combination of observable and estimated stand-alone selling prices, which includes the expected cost plus a margin approach. We allocate revenue to the stand-ready obligation to provide access to new content for one year based on its observable standalone selling price to provide the right of access to additional intellectual property. The allocation of revenue to the perpetual licenses for access to historical journal content is done using the expected cost plus a margin approach, as applicable.
Transformational Agreements (read and publish) blend Journal Subscription and Open Access offerings. Generally, for a single fee, a national or regional consortium of libraries pays for and receives full read access to our journal portfolio and the ability to publish under an open access arrangement. Transformational Agreements include multiple performance obligations and depending upon the model, can include a combination of Read which is recognized over time; Perpetual License which is recognized at a point in time; and a publishing right that allows for articles to be published in hybrid and/or gold open access journals, which is recognized point in time or over time depending upon the model. The total transaction price is generally fixed and allocated to each performance obligation based on its relative stand-alone selling price using a combination of observable and estimated stand-alone selling prices. Estimated stand-alone selling prices include the expected cost plus a margin approach, and a residual approach.
Open Access
Under the open access business model, there is generally one performance obligation whereby accepted research articles are published and all open articles are immediately free to access online. The transaction price is fixed based on payment of an article publication charge (APC). Revenue is recognized at a point in time which is upon publication which is when Wiley’s obligation is complete.
Licensing and Ancillary Products
Within licensing the revenue derived from these contracts is primarily comprised of advance payments, including minimum guarantees and sales- or usage-based royalty agreements. Our intellectual property is considered to be functional intellectual property. Due to the stand-ready obligation to provide updates during the subscription period, which is generally an annual period, revenue for the minimum guarantee is recognized on a straight-line basis over the term of the agreement. For our sales- or usage-based royalty agreements, we recognize revenue in the period of usage based on the amounts earned. We record revenue under these arrangements for the amounts due and not yet reported to us based on estimates of the sales or usage of these customers and pursuant to the terms of the contracts. We also have certain licenses whereby we receive a non-refundable minimum guarantee in advance (recorded over time as described above) against a volume-based royalty throughout the term of the agreement. When the cumulative consideration exceeds the minimum guarantee, it is recognized as the subsequent sales or usage occurs. We also license content for artificial intelligence (AI) models at a fixed transaction price and the majority of the revenue is recognized at a point in time which is upon acceptance.
Research Solutions Products and Services
Research Solutions revenue was $152.9 million in the year ended April 30, 2025, and the majority is recognized over time.
In the year ended April 30, 2025, Research Solutions products and services generated approximately 55% of their revenue from contracts with customers that include corporate solutions such as managed services which includes advertising, and full sales and marketing services for publishers and societies; recruitment platform and services; spectral databases; and projects which includes content creation and distribution, digital events, and webinars.
The remainder of the revenue within Research Solutions from contracts with customers includes platform and workflow solutions for societies and publishers, which includes production and content hosting, submissions and peer review support, editorial, and copy editing services. Included within platforms is our Atypon® publishing platform for societies and publishers which includes a single performance obligation for the implementation and hosting of subscription services. The transaction price is fixed which may include price escalators that are fixed increases per year. Revenue is recognized upon the initiation of the subscription period and recognized on a straight-line basis over the time of the contractual period. The duration of these contracts is generally multiyear ranging from 2 to 5 years.
Learning
Total Learning revenue was $584.8 million in the year ended April 30, 2025. We disaggregated revenue by Academic and Professional to reflect the different types of products and services provided.
Academic
Academic products revenue was $333.7 million in the year ended April 30, 2025. Products and services include scientific, professional, and education print and digital books, and digital courseware to libraries, corporations, students, professionals, and researchers. Products are developed for worldwide distribution through multiple channels, including chain and online booksellers, libraries, colleges and universities, corporations, direct to consumer, websites, distributor networks and other online applications.
In the year ended April 30, 2025, Academic products generated approximately 54% of their revenue from contracts with their customers for print and digital publishing, which is recognized at a point in time. Digital Courseware products generate approximately 33% of their revenue from contracts with their customers which is recognized over time. The remainder of their revenues were from Licensing and ancillary products which have a mix of revenue recognized at a point in time and over time.
Print and Digital Publishing
Our performance obligations as they relate to print and digital publishing are primarily book products delivered in both print and digital form which could include single or multiple performance obligations based on the number of print or digital books purchased. Each is represented by an International Standard Book Number (ISBN), with each ISBN representing a performance obligation. Each ISBN has an observable stand-alone selling price as Wiley sells the books separately. This revenue stream also includes variable consideration as it relates to returns for both print and digital books. Revenue is recognized at the point when control of the product transfers, which for print is upon shipment or for digital when fulfillment of the products has been rendered.
Digital Courseware Products
Courseware customers purchase access codes to utilize the product. Revenue is recognized over time in the period from when the access codes are activated over the applicable semester term to which such product relates.
Licensing and Ancillary Products
Revenue derived from our licensing contracts is primarily comprised of advance payments and sales- or usage-based royalties. Revenue for advance payments is recognized at the point in time that the functional intellectual property license is granted. For sales- or usage-based royalties, we record revenue under these arrangements for the amounts due and not yet reported to us based on estimates of the sales or usage of these customers and pursuant to the terms of the contracts. We also have certain licenses whereby we receive a non-refundable minimum guarantee (recognized at a point in time as described above) against a volume-based royalty throughout the term of the agreement. We recognize volume-based royalty income only when cumulative consideration exceeds the minimum guarantee and the subsequent sales or usage occurs. We also license content for AI models at a fixed transaction price and the revenue is recognized at a point in time which is upon acceptance.
Professional
Professional products revenue was $251.1 million in the year ended April 30, 2025. Professional provides learning, development, publishing, and assessment services for businesses and professionals. Our professional publishing produces books, which includes business and finance, technology, professional development for educators, test preparation books and other professional categories, as well as the For Dummies® brand. Products are sold to brick-and-mortar and online retailers, wholesalers who supply such bookstores, college bookstores, individual practitioners, corporations, and government agencies.
In the year ended April 30, 2025, Professional products generated approximately 55% of their revenue from contracts with their customers for professional publishing, which is recognized at a point in time. Our assessments offering in the year ended April 30, 2025 generates approximately 30% of their revenue from contracts with its customers, which has a mix of revenue recognized at a point in time and over time. The remainder of Professional revenues were from Licensing and ancillary revenue streams, which has a mix of revenue recognized at a point in time and over time.
Professional Publishing
Professional publishing has the same performance obligations as Academic print and digital publishing which is described above. Revenue is recognized at the point when control of the product transfers, which for print is upon shipment or for digital when fulfillment of the products has been rendered.
Assessments
Our assessments offering includes high-demand soft-skills training solutions that are delivered to organizational clients through online digital delivery platforms, either directly or through an authorized distributor network of independent consultants, trainers, and coaches. Our assessments product offering includes multiple performance obligations which includes annual memberships which are recognized over time, and the assessments and related products or services which are recognized at a point in time. We allocate revenue based on observable standalone selling prices of each performance obligation.
Licensing and ancillary products
Revenue derived from our licensing contracts is primarily comprised of advance payments and sales- or usage-based royalties. Revenue for advance payments is recognized at the point in time that the functional intellectual property license is granted. For sales- or usage-based royalties, we record revenue under these arrangements for the amounts due and not yet reported to us based on estimates of the sales or usage of these customers and pursuant to the terms of the contracts. We also have certain licenses whereby we receive a non-refundable minimum guarantee (recognized at a point in time as described above) against a volume-based royalty throughout the term of the agreement. We recognize volume-based royalty income only when cumulative consideration exceeds the minimum guarantee and the subsequent sales or usage occurs. We also license our content for AI model training and development as described above.
Held for Sale or Sold
Held for Sale or Sold revenue was $17.4 million in the year ended April 30, 2025.
Wiley Edge was sold on May 31, 2024 with exception of its India operations which sold on August 31, 2024. Wiley Edge previously sourced, trained, and prepared aspiring students and professionals to meet the skill needs of today’s technology careers, and then place them with some of the world’s largest financial institutions, technology companies, and government agencies. Wiley Edge revenue was recognized at the point in time the services were provided to its customers.
CrossKnowledge was sold on August 31, 2024. CrossKnowledge services previously included corporate learning online learning and training solutions for global corporations, universities, and small and medium-sized enterprises sold on a subscription or fee basis. CrossKnowledge revenue was recognized over time.
Held for Sale or Sold also includes the revenue associated with those businesses which were sold in fiscal year 2024 which includes University Services and Tuition Manager, and in fiscal year 2023 includes Wiley’s Efficient Learning test prep portfolio business, and our advancement courses business.
Accounts Receivable, Net and Contract Liability Balances
When consideration is received, or such consideration is unconditionally due, from a customer prior to transferring goods or services to the customer under the terms of a contract, a contract liability is recorded. Contract liabilities are recognized as revenue when, or as, control of the products or services are transferred to the customer and all revenue recognition criteria have been met.
The following table provides information about accounts receivable, net and contract liabilities from contracts with customers.
|
|
|
|
|
|
|
|
|
|
|
|
|
|
|
|
|
|
|
April 30, 2025 |
|
April 30, 2024 |
|
Increase/
(Decrease) |
| Balances from contracts with customers: |
|
|
|
|
|
| Accounts receivable, net |
$ |
228,410 |
|
|
$ |
224,198 |
|
|
$ |
4,212 |
|
Contract liabilities(1) |
462,693 |
|
|
483,778 |
|
|
(21,085) |
|
| Contract liabilities (included in Other long-term liabilities) |
$ |
16,725 |
|
|
$ |
14,819 |
|
|
$ |
1,906 |
|
|
|
|
|
|
|
(1) |
The sales return reserve recorded in Contract liabilities is $15.1 million and $25.4 million as of April 30, 2025 and April 30, 2024, respectively. See Note 2, “Summary of Significant Accounting Policies, Recently Issued, and Recently Adopted Accounting Standards” for further details of the sales return reserve. |
For the years ended April 30, 2025 and 2024, we recognized as revenue substantially all of the current contract liability balance at April 30, 2024 and 2023, respectively.
The decrease in contract liabilities, excluding the sales return reserve, was primarily driven by revenue earned on journal subscription agreements, transformational agreements, and open access, partially offset by renewals of journal subscription agreements, transformational agreements, and open access.
Remaining Performance Obligations included in Contract Liability
As of April 30, 2025, the aggregate amount of the transaction price allocated to the remaining performance obligations is approximately $479.4 million, which includes the sales return reserve of $15.1 million. Excluding the sales return reserve, we expect that approximately $447.6 million will be recognized in the next twelve months with the remaining $16.7 million to be recognized thereafter.
Assets Recognized for the Costs to Fulfill a Contract
Costs to fulfill a contract are directly related to a contract that will be used to satisfy a performance obligation in the future and are expected to be recovered. These costs are amortized on a systematic basis that is consistent with the transfer to the customer of the goods or services to which the asset relates. These types of costs are incurred in Research Solutions services which includes customer specific implementation costs per the terms of the contract.
Our assets associated with incremental costs to fulfill a contract were $2.2 million and $3.1 million at April 30, 2025 and 2024, respectively, and are included within Other non-current assets on our Consolidated Statements of Financial Position.
We recorded amortization expense related to these assets within Cost of sales on the Consolidated Statements of Income (Loss) as follows:
|
|
|
|
|
|
|
|
|
|
|
|
|
|
|
|
|
|
|
For the Years Ended April 30, |
|
2025 |
|
2024 |
|
2023 |
Amortization expense |
$ |
1,385 |
|
|
$ |
4,527 |
|
|
$ |
4,465 |
|
In the years ended April 30, 2024 and 2023 amortization expense for costs to fulfill includes the amortization related to the University Services business which was sold on January 1, 2024.
Sales and value-added taxes are excluded from revenues. Shipping and handling costs, which are primarily incurred within the Learning segment, occur before the transfer of control of the related goods. Therefore, in accordance with the revenue standard, it is not considered a promised service to the customer and would be considered a cost to fulfill our promise to transfer the goods. Costs incurred for third-party shipping and handling are primarily reflected in Operating and administrative expenses on the Consolidated Statements of Income (Loss) and were incurred as follows:
|
|
|
|
|
|
|
|
|
|
|
|
|
|
|
|
|
|
|
For the Years Ended April 30, |
|
2025 |
|
2024 |
|
2023 |
Shipping and handling costs |
$ |
23,644 |
|
|
$ |
25,853 |
|
|
$ |
27,149 |
|
Note 4 – Acquisitions and Divestitures
Acquisitions
Pro forma financial information related to this acquisition has not been provided as it is not material to our consolidated results of operations.
Fiscal Year 2025
On February 3, 2025, we completed the acquisition of an immaterial business included in our Learning segment. The allocation of the total consideration transferred to the assets acquired, including intangible assets and goodwill, and the liabilities assumed will be finalized within the measurement period, which will not exceed one year from the acquisition date.
Divestitures
On June 1, 2023, Wiley’s Board of Directors approved a plan to divest certain businesses that we determined are non-core businesses. Those businesses are University Services, Wiley Edge, and CrossKnowledge. As of the second quarter of fiscal year 2025, we completed our plan to divest these businesses.
On January 1, 2024, we sold University Services. On May 31, 2024, we sold Wiley Edge, with the exception of its India operations, which sold on August 31, 2024. On August 31, 2024, we also sold CrossKnowledge.
In accordance with FASB ASC Topic 205, “Presentation of Financial Statements,” we determined that the divestitures of University Services, Wiley Edge and CrossKnowledge each do not represent a strategic shift that will have a major effect on our consolidated results of operations, and therefore their results of operations were not reported as discontinued operations. We concluded that the businesses met all the requisite held-for-sale criteria as of June 1, 2023. Therefore, the related assets and liabilities were reclassified as held-for-sale on the Consolidated Statements of Financial Position until the date of sale.
For the years ended April 30, 2025, 2024, and 2023, we recorded net pretax (loss) gain on sale of businesses, assets, and impairment charges related to assets held-for-sale as follows:
|
|
|
|
|
|
|
|
|
|
|
|
|
|
|
|
|
|
|
For the Years Ended April 30, |
|
2025 |
|
2024 |
|
2023 |
| CrossKnowledge |
$ |
4,119 |
|
|
$ |
(55,440) |
|
|
$ |
— |
|
| Wiley Edge |
(14,852) |
|
|
(19,401) |
|
|
— |
|
| University Services |
(12,578) |
|
|
(107,048) |
|
|
— |
|
| Tuition Manager |
120 |
|
|
(1,500) |
|
|
— |
|
| Test Prep and Advancement Courses |
— |
|
|
— |
|
|
10,177 |
|
| Sale of assets |
(149) |
|
|
— |
|
|
— |
|
Net (loss) gain on sale of businesses, assets, and impairment charges related to assets held-for-sale |
$ |
(23,340) |
|
|
$ |
(183,389) |
|
|
$ |
10,177 |
|
These charges are reflected in Net (loss) gain on sale of businesses, assets, and impairment charges related to assets held-for-sale on our Consolidated Statements of Income (Loss).
Fiscal Year 2025
CrossKnowledge
On August 31, 2024, we completed the sale of CrossKnowledge, which was included in our Held for Sale or Sold segment, pursuant to a stock and asset purchase agreement (CrossKnowledge Agreement) with MS International Software, LLC, a Delaware limited liability company (MS International). The selling price for CrossKnowledge, which was subsequently updated during the year ended April 30, 2025, had an estimated fair value of $3.0 million.
The pretax loss on sale was $51.3 million after accounting for the assets sold, liabilities transferred upon sale, transaction costs, and the write-off of cumulative translation adjustments in earnings. In connection with the held-for-sale classification prior to the sale, we recognized cumulative impairment charges of $51.0 million on the remeasurement of the disposal group at the lower of carrying value or fair value less costs to sell, which included $55.4 million recognized in fiscal year 2024. Upon the completion of the sale, we recognized a net gain of $4.1 million in the year ended April 30, 2025 primarily due to subsequent changes in the fair value less costs to sell, as well as changes in the carrying amount of the disposal group.
We entered into a transition services agreement to facilitate the transition of the divested business.
Wiley Edge
On May 31, 2024, we completed the sale of Wiley Edge with the exception of its India operations which sold on August 31, 2024, which was included in our Held for Sale or Sold segment, pursuant to a stock and asset purchase agreement (Edge Agreement) with Inspirit Vulcan Bidco Limited, a private limited company incorporated in England & Wales (Inspirit). The selling price for Wiley Edge at the date of sale including India, which was subsequently updated during the year ended April 30, 2025, had a fair value of $23.3 million paid in the form of: (i) cash of $10.0 million, (ii) an unsecured promissory note with an aggregate principal amount of $13.3 million (Inspirit Seller Note), which was subject to customary working capital adjustments, and (iii) additional contingent consideration in the form of an earnout recorded at a fair value of zero based on the gross profit targets during each of the three fiscal years in the period beginning May 1, 2024 and ending April 30, 2027 (Wiley Edge Earnout).
As of April 30, 2025, the Inspirit Seller Note is reflected in Other non-current assets in our Consolidated Statements of Financial Position. The Inspirit Seller Note matures on May 31, 2028 and is prepayable at par plus accrued interest at any time and also if certain conditions are met. The Inspirit Seller Note bears interest at the rate of 8% per annum commencing on May 31, 2024, increasing by 1% per annum each year on the anniversary of issuance. Interest income from the note receivable represents non operating income and is included in Other income (expense), net on the Consolidated Statements of Income (Loss).
The maximum Wiley Edge Earnout amount is $34.0 million. We elected to record the fair value of the Wiley Edge Earnout as of the date of the sale, and will update that fair value as applicable until settled since the Wiley Edge Earnout amount is subject to change based on final results and calculations. The fair value of the Wiley Edge Earnout at the date of the sale was based on a Monte Carlo simulation and was initially valued at $15.0 million. Due to changes in market conditions during the third quarter of fiscal year 2025 that negatively impacted placements and the outlook for the business, the updated gross profit forecast indicated that the gross profit for each of the earnout periods will be below the gross profit targets as defined in the Edge Agreement which would result in zero amount being paid to Wiley in each of the respective periods. As a result, in the third quarter of fiscal year 2025 we reduced the fair value of the Wiley Edge Earnout from $15.0 million at the date of sale to zero.
The pretax loss on sale was $34.3 million after accounting for the assets sold, liabilities transferred upon sale, transaction costs, and the write-off of cumulative translation adjustments in earnings. In connection with the held-for-sale classification, during fiscal year 2024, we recognized cumulative impairment charges of $19.4 million on the remeasurement of the disposal group at the lower of carrying value or fair value less costs to sell. Upon the completion of the sale, we recognized a net loss of $14.9 million in the year ended April 30, 2025 primarily due to subsequent changes in the fair value less costs to sell, partially offset by the sale of the India operations.
We entered into a transition services agreement to facilitate the transition of the divested business.
Fiscal Year 2024
University Services
On January 1, 2024, we completed the sale of University Services, which was included in our Held for Sale or Sold segment, pursuant to a Membership Interest and Asset Purchase Agreement (University Services Agreement) with Academic Partnerships LLC, a Delaware limited liability company (Academic Partnerships), and Education Services Upper Holdings Corp., a Delaware corporation (Upper Holdings). The pretax loss on sale as of April 30, 2024 was $107.0 million, after accounting for the assets sold, liabilities transferred upon sale, and transaction costs.
The selling price for University Services included (i) an unsecured promissory note (University Services Seller Note); (ii) additional contingent consideration in the form of an earnout recorded at fair value based on revenue targets during each of the two fiscal years in the period from May 1, 2024 through April 30, 2026 (University Services Earnout); and (iii) a number of common units of TVG-Academic Partnerships Holdings, LLC, the ultimate parent company of Academic Partnerships equal to 10% of the total common units outstanding accounted for under the cost method minus impairment (TVG Investment).
As of April 30, 2025 in our Consolidated Statements of Financial Position, the aggregate amounts reflected in Other non-current assets for the principal and interest amount of the University Services Seller Note, the TVG Investment, and the long-term portion of the University Services Earnout was $110.0 million. In addition, the short-term portion of the University Services Earnout was $9.5 million reflected in Prepaid expenses and other current assets.
On June 5, 2025, Wiley entered into an agreement with Metis Aggregator L.P. and Vistria AP Aggregator, LLC to sell the Seller Note, the fiscal year 2026 University Services Earnout, and the TVG Investment, and agreed with Upper Holdings and Academic Partnerships on the fiscal year 2025 University Services Earnout for total cash consideration of $119.5 million (Sale Agreement) which was fully paid in June 2025. As a result of this Sale Agreement, all amounts due to Wiley in accordance with the University Services Agreement have been settled.
In the year ended April 30, 2025, due to the process of selling these assets, as well as third-party customer consents, working capital adjustments, and changes in the costs to sell, we recognized an additional net loss on sale and impairments of assets of $12.6 million.
Tuition Manager
On May 31, 2023, we completed the sale of our tuition manager business (Tuition Manager), which was included in our Held for Sale or Sold segment, for a pretax loss on sale of $1.4 million, of which $1.5 million was recognized in the year ended April 30, 2024 and a gain of $0.1 million was recognized in the year ended April 30, 2025 due to additional cash received.
Fiscal Year 2023
Test Prep and Advancement Courses
On February 28, 2023, we completed the sale of Wiley’s Efficient Learning test prep portfolio business. In addition, on March 31, 2023, we completed the sale of our advancement courses business. Both were included in our Held for Sale or Sold segment. Neither disposition constituted a strategic shift, and the impact on our overall operations and financial results was not material. Accordingly, the operations associated with the dispositions are not reported in discontinued operations. The selling price for both dispositions was $16.5 million, which included $15.5 million of cash received net of transaction costs at the date of sale, and $1.0 million of additional cash received after the date of sale. The pretax gain on sale was $10.2 million, after accounting for the assets sold, liabilities transferred upon sale, and transaction costs.
Assets and Liabilities Held-for-Sale
There are no assets or liabilities held-for-sale as of April 30, 2025. The major categories of assets and liabilities that have been classified as held-for-sale on the Consolidated Statement of Financial Position as of April 30, 2024 were as follows:
|
|
|
|
|
|
|
|
|
|
|
|
|
|
|
|
|
|
|
Cross Knowledge |
|
Wiley Edge |
|
Total |
| Assets held-for-sale: |
|
|
|
|
|
| Current assets |
|
|
|
|
|
Cash and cash equivalents (1) |
$ |
6,305 |
|
|
$ |
9,887 |
|
|
$ |
16,192 |
|
| Accounts receivable, net |
12,914 |
|
|
13,897 |
|
|
26,811 |
|
Prepaid expenses and other current assets (1) |
3,780 |
|
|
5,548 |
|
|
9,328 |
|
| Valuation allowance |
(17,909) |
|
|
— |
|
|
(17,909) |
|
| Total current assets held-for-sale |
$ |
5,090 |
|
|
$ |
29,332 |
|
|
$ |
34,422 |
|
| Technology, property and equipment, net |
3,786 |
|
|
2,888 |
|
|
6,674 |
|
| Intangible assets, net |
17,777 |
|
|
34,612 |
|
|
52,389 |
|
| Operating lease right-of-use assets |
1,091 |
|
|
1,008 |
|
|
2,099 |
|
| Other non-current assets |
14,877 |
|
|
53 |
|
|
14,930 |
|
| Valuation allowance |
(37,531) |
|
|
(19,401) |
|
|
(56,932) |
|
| Total non-current assets held-for-sale |
$ |
— |
|
|
$ |
19,160 |
|
|
$ |
19,160 |
|
|
|
|
|
|
|
| Liabilities held-for-sale: |
|
|
|
|
|
| Current liabilities |
|
|
|
|
|
| Accounts payable |
$ |
494 |
|
|
$ |
— |
|
|
$ |
494 |
|
| Accrued royalties |
268 |
|
|
— |
|
|
268 |
|
| Contract liabilities |
16,796 |
|
|
— |
|
|
16,796 |
|
| Accrued employment costs |
7,805 |
|
|
3,990 |
|
|
11,795 |
|
| Short-term portion of operating lease liabilities |
319 |
|
|
468 |
|
|
787 |
|
| Other accrued liabilities |
2,762 |
|
|
4,730 |
|
|
7,492 |
|
| Total current liabilities held-for-sale |
$ |
28,444 |
|
|
$ |
9,188 |
|
|
$ |
37,632 |
|
|
|
|
|
|
|
| Accrued pension liability |
1,037 |
|
|
— |
|
|
1,037 |
|
| Deferred income tax liabilities |
4,420 |
|
|
4,448 |
|
|
8,868 |
|
| Operating lease liabilities |
251 |
|
|
159 |
|
|
410 |
|
| Other long-term liabilities |
694 |
|
|
228 |
|
|
922 |
|
| Total long-term liabilities held-for-sale |
$ |
6,402 |
|
|
$ |
4,835 |
|
|
$ |
11,237 |
|
|
|
|
|
|
|
| (1) |
The following table shows a reconciliation of our cash, cash equivalents, and restricted cash included in current assets held-for-sale in our Consolidated Statement of Financial Position to our Consolidated Statement of Cash Flows for the year ended April 30, 2024: |
|
|
|
|
|
|
| Cash and cash equivalents |
$ |
83,249 |
|
| Restricted cash included in Prepaid expenses and other current assets |
50 |
|
Total cash, cash equivalents, and restricted cash per Consolidated Statement of Financial Position as of April 30, 2024 |
83,299 |
|
| Cash and cash equivalents held-for-sale |
16,192 |
|
| Restricted cash held-for-sale included in Prepaid expenses and other current assets |
52 |
|
Total cash, cash equivalents, and restricted cash held-for-sale as of April 30, 2024 |
16,244 |
|
Total cash, cash equivalents, and restricted cash per Consolidated Statement of Cash Flows for the year ended April 30, 2024 |
$ |
99,543 |
|
Sale of Assets
In the second quarter of fiscal year 2025, we sold a facility which was reflected in Technology, property, and equipment, net in our Consolidated Statements of Financial Position which resulted in a pretax loss on sale of $0.2 million, and we received net cash of $8.5 million.
Note 5 – Reconciliation of Weighted Average Shares Outstanding
Basic earnings (loss) per share is computed by dividing net income (loss) by the weighted average number of common shares outstanding during the period. Diluted earnings (loss) per share further includes any common shares available to be issued upon the exercise of unvested, outstanding restricted stock units and other stock awards if such inclusions would be dilutive. The shares associated with performance-based stock awards (PSU) are considered contingently issuable shares and are included in the diluted weighted average number of common shares outstanding based on when they have met the performance conditions, and when their effect is dilutive. We determine the potentially dilutive common shares for all awards using the treasury stock method.
A reconciliation of the shares used in the computation of earnings (loss) per share follows (shares in thousands):
|
|
|
|
|
|
|
|
|
|
|
|
|
|
|
|
|
|
|
For the Years Ended April 30, |
|
2025 |
|
2024 |
|
2023 |
| Weighted average shares outstanding |
54,054 |
|
54,945 |
|
55,558 |
| Shares used for basic earnings (loss) per share |
54,054 |
|
54,945 |
|
55,558 |
| Dilutive effect of unvested restricted stock units and other stock awards |
776 |
|
— |
|
797 |
| Shares used for diluted earnings (loss) per share |
54,830 |
|
54,945 |
|
56,355 |
| Antidilutive options to purchase Class A common shares, restricted shares, and contingently issuable restricted stock which are excluded from the table above |
509 |
|
1,264 |
|
393 |
In calculating diluted net loss per common share for the year ended April 30, 2024, our diluted weighted average number of common shares outstanding excludes the effect of unvested restricted stock units and other stock awards as the effect was anti-dilutive. This occurs when a net loss is reported and the effect of using dilutive shares is antidilutive.
Note 6 – Accumulated Other Comprehensive Loss
Changes in Accumulated other comprehensive loss by component, net of tax, for the years ended April 30, 2025, 2024, and 2023 were as follows:
|
|
|
|
|
|
|
|
|
|
|
|
|
|
|
|
|
|
|
|
|
|
|
|
|
Foreign
Currency
Translation |
|
Unamortized
Retirement
Costs |
|
Interest
Rate Swaps |
|
Total |
| Balance at April 30, 2022 |
$ |
(329,566) |
|
|
$ |
(182,226) |
|
|
$ |
3,646 |
|
|
$ |
(508,146) |
|
| Other comprehensive income (loss) before reclassifications |
3,220 |
|
|
(29,053) |
|
|
4,385 |
|
|
(21,448) |
|
| Amounts reclassified from Accumulated other comprehensive loss |
— |
|
|
4,473 |
|
|
(3,781) |
|
|
692 |
|
| Total other comprehensive income (loss) |
3,220 |
|
|
(24,580) |
|
|
604 |
|
|
(20,756) |
|
| Balance at April 30, 2023 |
$ |
(326,346) |
|
|
$ |
(206,806) |
|
|
$ |
4,250 |
|
|
$ |
(528,902) |
|
| Other comprehensive (loss) income before reclassifications |
(7,481) |
|
|
(37) |
|
|
11,398 |
|
|
3,880 |
|
| Amounts reclassified from Accumulated other comprehensive loss |
— |
|
|
5,921 |
|
|
(9,338) |
|
|
(3,417) |
|
| Total other comprehensive (loss) income |
(7,481) |
|
|
5,884 |
|
|
2,060 |
|
|
463 |
|
| Balance at April 30, 2024 |
$ |
(333,827) |
|
|
$ |
(200,922) |
|
|
$ |
6,310 |
|
|
$ |
(528,439) |
|
Other comprehensive income (loss) before reclassifications |
46,052 |
|
|
(14,370) |
|
|
(7,912) |
|
|
23,770 |
|
| Amounts reclassified from Accumulated other comprehensive loss |
23,227 |
|
|
6,102 |
|
|
(3,580) |
|
|
25,749 |
|
Total other comprehensive income (loss) |
69,279 |
|
|
(8,268) |
|
|
(11,492) |
|
|
49,519 |
|
| Balance at April 30, 2025 |
$ |
(264,548) |
|
|
$ |
(209,190) |
|
|
$ |
(5,182) |
|
|
$ |
(478,920) |
|
In connection with the sale of Wiley Edge and CrossKnowledge, in the year ended April 30, 2025, we reclassified $23.2 million of cumulative translation adjustments out of Accumulated other comprehensive loss and included in the Net (loss) gain on sale of businesses, assets, and impairment charges related to assets held-for-sale in our Consolidated Statements of Income (Loss).
For the years ended April 30, 2025, 2024, and 2023, pretax actuarial losses included in Unamortized Retirement Costs of approximately $8.1 million, $7.9 million, and $6.0 million, respectively, were amortized from Accumulated other comprehensive loss and recognized as pension and post-retirement benefit (expense) primarily in Operating and administrative expenses and Other income (expense), net on our Consolidated Statements of Income (Loss).
Our policy for releasing the income tax effects from accumulated other comprehensive (loss) income is to release when the corresponding pretax accumulated other comprehensive (loss) income items are reclassified to earnings.
Note 7 – Restructuring and Related Charges
Global Restructuring Program
The Company began a global restructuring program in fiscal year 2023, which aimed to enhance Wiley’s position and drive profitability (Global Restructuring Program) which was expanded in fiscal year 2024. This program included severance related charges for the elimination of certain positions, the exit of certain leased office space, and the reduction of our occupancy at other facilities. Under this program, we reduced our real estate square footage occupancy by approximately 35%.
In the fourth quarter of fiscal year 2025, the program was further extended due to the completion of our divestitures with a focus on optimizing our cost structure, with particular emphasis on aligning our technology costs and other corporate expenses. As a result of these initiatives, this expanded program includes severance related charges, facility-related costs associated with certain properties, and other activities.
The following tables summarize the pretax restructuring charges related to the Global Restructuring Program:
|
|
|
|
|
|
|
|
|
|
|
|
|
|
|
|
|
|
|
|
|
|
|
|
|
For the Years Ended April 30, |
|
Total Charges Incurred to Date |
|
2025 |
|
2024 |
|
2023 |
|
Charges (Credits) by Segment: |
|
|
|
|
|
|
|
| Research |
$ |
10,047 |
|
|
$ |
7,410 |
|
|
$ |
2,413 |
|
|
$ |
19,870 |
|
| Learning |
1,515 |
|
|
11,448 |
|
|
7,804 |
|
|
20,767 |
|
| Held for Sale or Sold |
(117) |
|
|
7,326 |
|
|
5,786 |
|
|
12,995 |
|
Corporate expenses |
17,902 |
|
|
35,370 |
|
|
32,879 |
|
|
86,151 |
|
| Total Restructuring and Related Charges |
$ |
29,347 |
|
|
$ |
61,554 |
|
|
$ |
48,882 |
|
|
$ |
139,783 |
|
|
|
|
|
|
|
|
|
| Charges by Activity: |
|
|
|
|
|
|
|
| Severance and termination benefits |
$ |
20,596 |
|
|
$ |
28,556 |
|
|
$ |
25,827 |
|
|
$ |
74,979 |
|
Impairment of operating lease ROU assets and technology, property and equipment |
656 |
|
|
10,043 |
|
|
12,696 |
|
|
23,395 |
|
Acceleration of expense related to operating lease ROU assets, technology, property and equipment, and intangible assets |
1,786 |
|
|
4,148 |
|
|
2,140 |
|
|
8,074 |
|
| Facility related charges, net |
4,249 |
|
|
4,254 |
|
|
4,150 |
|
|
12,653 |
|
| Consulting costs |
657 |
|
|
8,967 |
|
|
2,285 |
|
|
11,909 |
|
| Other activities |
1,403 |
|
|
5,586 |
|
|
1,784 |
|
|
8,773 |
|
| Total Restructuring and Related Charges |
$ |
29,347 |
|
|
$ |
61,554 |
|
|
$ |
48,882 |
|
|
$ |
139,783 |
|
The severance related charges are for certain employees affected by the reduction in force under this program who are entitled to severance payments and certain termination benefits.
In the years ended April 30, 2024 and 2023, the impairment charges include the impairment of operating lease ROU assets related to certain leases that will be subleased, and the related property and equipment described further below. In the year ended April 30, 2024, these charges were recorded in Corporate Expenses and the Research segment. In the year ended April 30, 2023, these charges were recorded in Corporate Expenses.
Due to the actions taken above, we tested the operating lease ROU assets and the related property and equipment for those being subleased for recoverability by comparing the carrying value of the asset group to an estimate of the future undiscounted cash flows expected to result from the use and eventual disposition of the asset group. Based on the results of the recoverability test, we determined that the undiscounted cash flows of the asset groups were below the carrying values. Therefore, there was an indication of impairment. We then determined the fair value of the asset groups by utilizing the present value of the estimated future cash flows attributable to the assets. The fair value of these operating lease ROU assets and the property and equipment immediately subsequent to the impairment was $8.7 million and $12.1 million in the years ended April 30, 2024 and 2023, respectively, and were categorized as Level 3 within the FASB ASC Topic 820, “Fair Value Measurements” fair value hierarchy.
In addition, in the years ended April 30, 2025 and 2024, the impairment charges include the impairment of certain work-in-process capitalized software because it is no longer probable that the software being developed will be completed, and the work-in-process capitalized software was reported at the lower of its carrying amount or fair value which was zero. In the year ended April 30, 2025 these charges were recorded in the Research segment. In the year ended April 30, 2024, these charges were recorded in the Learning and Research segments, and in Corporate Expenses.
In the years ended April 30, 2024 and 2023, the acceleration of expense includes the acceleration of rent expense associated with operating lease ROU assets related to certain leases that will be abandoned or terminated, and the related depreciation and amortization of property and equipment. In addition, in the years ended April 30, 2025 and 2024, the acceleration of expense includes the acceleration of amortization expense of certain capitalized software as a result of our decision to discontinue the use of those assets. We determined that a revision of the useful lives was warranted, and certain capitalized software was fully amortized over its revised remaining useful life. The acceleration of expense in the year ended April 30, 2025 also includes the acceleration of amortization expense of an intangible asset in our Research segment due to a revision of the useful life which resulted in the asset being fully amortized over its revised remaining useful life.
We incurred ongoing facility-related costs associated with certain properties, consulting costs, and costs for other activities, which includes relocation and other employee related costs.
In fiscal year 2023, due to the political instability and military actions between Russia and Ukraine, we made the decision to close our operations in Russia which primarily consisted of technology development resources. We were substantially complete with our closure as of April 30, 2023, except for the formal liquidation of the Russian legal entity, which we completed in the fourth quarter of fiscal year 2025. Since we were substantially liquidated as of April 30, 2023, we wrote off $1.4 million, $1.0 million, and $1.1 million in the years ended April 30, 2025, 2024, and 2023, respectively, of cumulative translation adjustment gains in earnings. This is reflected in Net foreign exchange transaction (losses) gains in the Consolidated Statements of Income (Loss). Included in the table above are restructuring charges for the years ended April 30, 2025, 2024, and 2023 of $0.9 million, $2.0 million and $8.3 million, respectively, related to these actions.
The following table summarizes the activity for the Global Restructuring Program liability for the year ended April 30, 2025:
|
|
|
|
|
|
|
|
|
|
|
|
|
|
|
|
|
|
|
|
|
|
|
|
|
|
|
|
|
|
|
April 30, 2024 |
|
Charges |
|
Payments |
|
Foreign
Translation
& Other Adjustments
|
|
April 30, 2025 |
| Severance and termination benefits |
$ |
5,396 |
|
|
$ |
20,596 |
|
|
$ |
(18,477) |
|
|
$ |
(893) |
|
|
$ |
6,622 |
|
| Consulting costs |
1,794 |
|
|
657 |
|
|
(1,525) |
|
|
1 |
|
|
927 |
|
| Other activities |
1,879 |
|
|
1,403 |
|
|
(2,331) |
|
|
(662) |
|
|
289 |
|
| Total |
$ |
9,069 |
|
|
$ |
22,656 |
|
|
$ |
(22,333) |
|
|
$ |
(1,554) |
|
|
$ |
7,838 |
|
Approximately $5.6 million of the restructuring liability for accrued severance and termination benefits is reflected in Accrued employment costs and approximately $1.0 million is reflected in Other long-term liabilities on our Consolidated Statements of Financial Position. The liability for consulting costs and other activities is reflected in Other accrued liabilities on our Consolidated Statements of Financial Position.
Business Optimization Program
For the years ended April 30, 2025, 2024, and 2023, we recorded pretax restructuring (credits) charges of $(3.8) million, $1.4 million, and $0.5 million, respectively, related to this program. The net credits in the year ended April 30, 2025 are primarily due to the termination of a portion of a lease that was previously impaired in our Corporate Expenses category.
As of April 30, 2023, we substantially completed this program and we have no restructuring liability outstanding. We currently anticipate immaterial ongoing facility charges and do not anticipate any further material charges related to the Business Optimization Program.
Note 8 – Inventories
Inventories, net consisted of the following at April 30:
|
|
|
|
|
|
|
|
|
|
|
|
|
2025 |
|
2024 |
| Finished goods |
$ |
27,581 |
|
|
$ |
24,295 |
|
| Work-in-process |
632 |
|
|
1,445 |
|
| Paper and other materials |
124 |
|
|
181 |
|
| Total inventories before estimated sales returns and LIFO reserve |
28,337 |
|
|
25,921 |
|
| Inventory value of estimated sales returns |
4,042 |
|
|
7,833 |
|
| LIFO reserve |
(9,504) |
|
|
(7,535) |
|
| Inventories, net |
$ |
22,875 |
|
|
$ |
26,219 |
|
See Note 2, “Summary of Significant Accounting Policies, Recently Issued and Recently Adopted Accounting Standards,” under the caption “Sales Return Reserves,” for a discussion of the Inventory value of estimated sales returns.
Finished goods are net of a reserve for inventory obsolescence of $11.1 million and $11.9 million as of April 30, 2025 and 2024, respectively.
Note 9 – Product Development Assets
Product development assets, net were included in Other non-current assets on the Consolidated Statements of Financial Position and consisted of the following at April 30:
|
|
|
|
|
|
|
|
|
|
|
|
|
2025 |
|
2024 |
| Book composition costs |
$ |
247,442 |
|
|
$ |
213,811 |
|
| Software costs |
50,960 |
|
|
52,415 |
|
| Content development costs |
1,033 |
|
|
596 |
|
| Product development assets, gross |
299,435 |
|
|
266,822 |
|
| Accumulated amortization |
(283,382) |
|
|
(249,183) |
|
| Product development assets, net |
$ |
16,053 |
|
|
$ |
17,639 |
|
The following table details our amortization expense for product development assets, net:
|
|
|
|
|
|
|
|
|
|
|
|
|
|
|
|
|
|
|
For the Years Ended April 30, |
|
2025 |
|
2024 |
|
2023 |
| Amortization expense |
$ |
16,610 |
|
|
$ |
22,835 |
|
|
$ |
32,366 |
|
Product development assets include $3.3 million and $2.3 million of work-in-process as of April 30, 2025 and 2024, respectively, primarily for book composition costs.
Note 10 – Technology, Property, and Equipment
Technology, property, and equipment, net consisted of the following at April 30:
|
|
|
|
|
|
|
|
|
|
|
|
|
2025 |
|
2024 |
| Capitalized software |
$ |
644,900 |
|
|
$ |
601,452 |
|
| Computer hardware |
54,160 |
|
|
53,918 |
|
| Buildings and leasehold improvements |
67,589 |
|
|
82,199 |
|
| Furniture, fixtures, and warehouse equipment |
31,817 |
|
|
31,814 |
|
| Land and land improvements |
860 |
|
|
3,283 |
|
| Technology, property, and equipment, gross |
799,326 |
|
|
772,666 |
|
| Accumulated depreciation and amortization |
(637,201) |
|
|
(580,228) |
|
| Technology, property, and equipment, net |
$ |
162,125 |
|
|
$ |
192,438 |
|
The following table details our depreciation and amortization expense for technology, property, and equipment, net:
|
|
|
|
|
|
|
|
|
|
|
|
|
|
|
|
|
|
|
For the Years Ended April 30, |
|
2025 |
|
2024 |
|
2023 |
| Capitalized software amortization expense |
$ |
65,348 |
|
|
$ |
83,250 |
|
|
$ |
78,441 |
|
| Depreciation and amortization expense, excluding capitalized software |
13,346 |
|
|
14,910 |
|
|
17,565 |
|
| Total depreciation and amortization expense for technology, property and equipment |
$ |
78,694 |
|
|
$ |
98,160 |
|
|
$ |
96,006 |
|
In fiscal years 2025 and 2024, as a result of our decision to discontinue the use of certain capitalized software, we determined that a revision of the useful lives was warranted, and certain capitalized software was fully amortized over its revised remaining useful life. In addition, certain work-in-process capitalized software was impaired since it is no longer probable that the software being developed will be completed, and was reported at the lower of its carrying amount or fair value which was zero.
For the year ended April 30, 2025, the total amount was $1.5 million, which included $0.8 million of accelerated amortization expense and $0.7 million of impairment charges reflected in Restructuring and related charges on our Consolidated Statements of Income (Loss). These charges were recorded in the Research segment.
For the year ended April 2024, the total amount was $20.3 million, which included $15.9 million of accelerated amortization expense reflected in depreciation and amortization in Operating and administrative expenses and $4.4 million of impairment charges reflected in Restructuring and related charges on our Consolidated Statements of Income (Loss). These charges were recorded in the Research and Learning segments as well as Corporate Expenses.
Note 11 – Goodwill and Intangible Assets
Goodwill
The following table summarizes the activity in goodwill by segment as of April 30:
|
|
|
|
|
|
|
|
|
|
|
|
|
|
|
|
|
|
|
|
|
|
|
|
|
|
|
|
|
|
|
Research |
|
Learning |
|
Total excluding Held for Sale or Sold segment |
|
Held for Sale or Sold(1) |
|
Total including Held for Sale or Sold segment |
Balance at April 30, 2023 |
$ |
609,729 |
|
|
$ |
486,025 |
|
|
$ |
1,095,754 |
|
|
$ |
108,296 |
|
|
$ |
1,204,050 |
|
| Impairment |
— |
|
|
— |
|
|
— |
|
|
(108,449) |
|
|
(108,449) |
|
| Foreign Translation Adjustment |
(2,440) |
|
|
(1,946) |
|
|
(4,386) |
|
|
153 |
|
|
(4,233) |
|
| Balance at April 30, 2024 |
607,289 |
|
|
484,079 |
|
|
1,091,368 |
|
|
— |
|
|
1,091,368 |
|
Acquisition(2) |
— |
|
|
1,026 |
|
|
1,026 |
|
|
— |
|
|
1,026 |
|
| Foreign Translation Adjustment |
32,145 |
|
|
(3,034) |
|
|
29,111 |
|
|
— |
|
|
29,111 |
|
Balance at April 30, 2025 |
$ |
639,434 |
|
|
$ |
482,071 |
|
|
$ |
1,121,505 |
|
|
$ |
— |
|
|
$ |
1,121,505 |
|
|
|
|
|
|
|
(1) |
The Held for Sale or Sold goodwill balance as of April 30, 2024 includes accumulated pretax noncash goodwill impairments of $318.2 million which reduced the goodwill of all reporting units within the Held for Sale or Sold segment to zero. |
(2) |
Refer to Note 4, “Acquisitions and Divestitures,” for more information related to the acquisition that occurred in the year ended April 30, 2025. |
Fiscal Year 2025
Annual Impairment Test as of February 1, 2025
For our reporting units within the Research and Learning segments, we performed a qualitative assessment by reporting unit as of February 1, 2025. This assessment included consideration of key factors including macroeconomic conditions, industry and market considerations, financial performance, weighted average cost of capital (WACC), market multiples of current and forward 12-month EBITDA, and other relevant entity and reporting unit-specific events. Based on our qualitative assessment, we determined it was not more likely than not that the fair value of any reporting unit was less than its carrying amount. As such, it was not necessary to perform a quantitative test. There have been no significant events or circumstances affecting the valuation of goodwill subsequent to the qualitative assessment performed as of February 1, 2025.
If the fair value of these reporting units decreases in future periods, we could potentially have an impairment. The future occurrence of a potential indicator of impairment, such as a decrease in expected net earnings, changes in assumptions, adverse equity market conditions, a decline in current market multiples, a decline in our common stock price, a significant adverse change in legal factors or business climates, an adverse action or assessment by a regulator, unanticipated competition, strategic decisions made in response to economic or competitive conditions, or a more-likely-than-not expectation that a reporting unit or a significant portion of a reporting unit will be sold or disposed of, could require an interim assessment for some or all of the reporting units before the next required annual assessment.
Fiscal Year 2024
We recorded a goodwill impairment of $108.4 million in the year ended April 30, 2024. These charges are reflected in Impairment of goodwill on our Consolidated Statements of Income (Loss).
Change in Segment Reporting Structure and Goodwill Impairment
In the three months ended July 31, 2023, we reorganized our segments. Due to this realignment, we reallocated goodwill in the first quarter of fiscal year 2024 to our reporting units on a relative fair value basis.
As a result of this realignment, we were required to test goodwill for impairment immediately before and after the realignment. Since there were no changes to the Research reportable segment, no impairment test of the Research segment goodwill was required.
We estimated the fair value of the reporting units using a weighting of fair values derived from an income and a market approach. Fair value computed by these methods is arrived at using a number of key assumptions including forecasted revenues and related growth rates, forecasted operating cash flows, the discount rate, and the selection of relevant market multiples of comparable publicly-traded companies with similar characteristics to the reporting unit. Under the income approach, we determined the fair value of a reporting unit based on the present value of estimated future cash flows. Cash flow projections are based on our best estimates of forecasted economic and market conditions over the period including growth rates and expected changes in operating cash flows. The discount rate used is based on a weighted average cost of capital adjusted for the relevant risk associated with the characteristics of the business and the projected cash flows. The market approach estimates fair value based on market multiples of current and forward 12-month revenue or EBITDA, as applicable, derived from comparable publicly traded companies with similar operating and investment characteristics as the reporting unit.
Prior to the realignment, the previous reporting units (Academic Publishing, Talent Development, which includes Wiley Edge, and Professional Learning) fair values were above their carrying values. Therefore, there was no indication of impairment. The carrying value of the University Services reporting unit was above its fair value, which resulted in a pretax noncash goodwill impairment of $11.4 million. Such impairment reduced the goodwill of the University Services reporting unit to zero. University Services was adversely impacted by market conditions and headwinds for online degree programs, which led to a decline in projected enrollments from existing partners, pricing pressures and revenue share concessions, and a decline in new partner additions over both the short-term and long-term which adversely impacted forecasted revenue growth and operating cash flows. We also evaluated the recoverability of long-lived assets of the University Services reporting unit and there was no impairment.
After the realignment, the new reporting units (Academic, Professional, and Wiley Edge) fair values were above their carrying values. Therefore, there was no indication of impairment. The carrying value of the CrossKnowledge reporting unit was above its fair value which resulted in a pretax noncash goodwill impairment of $15.3 million. Such impairment reduced the goodwill of the CrossKnowledge reporting unit to zero. CrossKnowledge was adversely impacted by a decline in the demand for its offerings, which resulted in lower sales and a decline in average contract value, that adversely impacted forecasted revenue growth and operating cash flows. We also evaluated the recoverability of long-lived assets of the CrossKnowledge reporting unit and there was no impairment.
Wiley Edge Interim Impairment Test
As a result of signing the Edge Agreement with Inspirit and the decrease in the fair value of the business, which was impacted by a decline in placements, in the third quarter of fiscal year 2024, we tested the goodwill of the Wiley Edge reporting unit for impairment. We concluded that the carrying value of the Wiley Edge reporting unit was above its fair value, which resulted in a pretax noncash goodwill impairment of approximately $81.7 million. Such impairment reduced the goodwill of the Wiley Edge reporting unit to zero. The impairment was due to subsequent changes in the fair value resulting from the continued progression of the selling process, indications of changes in the consideration for the business, and a decline in placements in the third quarter of fiscal year 2024, as well as changes in the carrying amounts of the disposal group. We also evaluated the recoverability of long-lived assets of the Wiley Edge reporting unit and there was no impairment.
Refer to
Note 4, “Acquisitions and Divestitures,” for more information.
Annual Impairment Test as of February 1, 2024
For our reporting units within the Research and Learning segments, we performed a qualitative assessment by reporting unit as of February 1, 2024. This assessment included consideration of key factors including macroeconomic conditions, industry and market considerations, financial performance, WACC, market multiples of current and forward 12-month revenue or EBITDA, as applicable, and other relevant entity and reporting unit-specific events. Based on our qualitative assessment, we determined it was not more likely than not that the fair value of any reporting unit was less than its carrying amount. As such, it was not necessary to perform a quantitative test.
Fiscal Year 2023
We recorded a goodwill impairment of $99.8 million in the year ended April 30, 2023. These charges are reflected in Impairment of goodwill on our Consolidated Statements of Income (Loss).
Change in Segment Reporting Structure and Goodwill Impairment
In the three months ended January 31, 2023, we reorganized our segments. Due to this realignment, we reallocated goodwill in the third quarter of fiscal year 2023 to our reporting units on a relative fair value basis.
As a result of this realignment, we were required to test goodwill for impairment immediately before and after the realignment. Since there were no changes to the Research reportable segment, no interim impairment test of the Research segment goodwill was required.
We estimated the fair value of the reporting units using a weighting of fair values derived from an income and a market approach. Fair value computed by these methods is arrived at using a number of key assumptions including forecasted revenues and related growth rates, forecasted operating cash flows, the discount rate, and the selection of relevant market multiples of comparable publicly-traded companies with similar characteristics to the reporting unit. Under the income approach, we determined the fair value of a reporting unit based on the present value of estimated future cash flows. Cash flow projections are based on our best estimates of forecasted economic and market conditions over the period including growth rates and expected changes in operating cash flows. The discount rate used is based on a weighted average cost of capital adjusted for the relevant risk associated with the characteristics of the business and the projected cash flows. The market approach estimates fair value based on market multiples of current and forward 12-month revenue or EBITDA, as applicable, derived from comparable publicly traded companies with similar operating and investment characteristics as the reporting unit.
Prior to the realignment, we concluded that the fair value of the Academic & Professional Learning reporting unit was above its carrying value. Therefore, there was no indication of impairment. The carrying value of the Education Services reporting unit was above its fair value, which resulted in a pretax noncash goodwill impairment of $31.0 million. Education Services was adversely impacted by market conditions and headwinds for online degree programs. This has led to a decline in projected student enrollments from existing partners, pricing pressures and revenue share concessions, and a decline in new partner additions over both the short-term and long-term, which adversely impacted forecasted revenue growth and operating cash flows. This was partially offset by projected growth in talent placements, partially due to expansion into new regions and the addition of new corporate clients, which are forecasted to have a positive impact on revenue growth and operating cash flows. We also evaluated the recoverability of long-lived assets of the Education Services reporting unit and there was no impairment.
After the realignment, we concluded that the fair value of the Academic Publishing, Talent Development and Professional Learning reporting units were above their carrying values. Therefore, there was no indication of impairment. The carrying value of the University Services reporting unit was above its fair value, which resulted in a pretax noncash goodwill impairment of $68.8 million. University Services was adversely impacted by market conditions and headwinds for online degree programs which led to a decline in projected enrollments from existing partners, pricing pressures and revenue share concessions, and a decline in new partner additions over both the short-term and long-term which adversely impacted forecasted revenue growth and operating cash flows. We also evaluated the recoverability of long-lived assets of the University Services reporting unit and there was no impairment.
Intangible Assets
Intangible assets, net as of April 30 were as follows:
|
|
|
|
|
|
|
|
|
|
|
|
|
|
|
|
|
|
|
|
|
|
|
|
|
|
|
|
|
|
|
|
|
|
|
|
|
2025 |
|
2024 |
|
Cost |
|
Accumulated
Amortization |
|
Net |
|
Cost |
|
Accumulated
Amortization |
|
Net |
Intangible assets with definite lives, net(1): |
|
|
|
|
|
|
|
|
|
|
|
| Content and publishing rights |
$ |
1,080,115 |
|
|
$ |
(662,133) |
|
|
$ |
417,982 |
|
|
$ |
1,087,601 |
|
|
$ |
(656,342) |
|
|
$ |
431,259 |
|
| Customer relationships |
131,037 |
|
|
(95,996) |
|
|
35,041 |
|
|
125,521 |
|
|
(85,812) |
|
|
39,709 |
|
Developed technology(2) |
41,195 |
|
|
(28,789) |
|
|
12,406 |
|
|
44,880 |
|
|
(25,358) |
|
|
19,522 |
|
| Brands and trademarks |
30,538 |
|
|
(25,484) |
|
|
5,054 |
|
|
31,448 |
|
|
(25,714) |
|
|
5,734 |
|
| Covenants not to compete |
1,157 |
|
|
(1,148) |
|
|
9 |
|
|
1,157 |
|
|
(1,123) |
|
|
34 |
|
| Total intangible assets with definite lives, net |
1,284,042 |
|
|
(813,550) |
|
|
470,492 |
|
|
1,290,607 |
|
|
(794,349) |
|
|
496,258 |
|
| Intangible assets with indefinite lives: |
|
|
|
|
|
|
|
|
|
|
|
Brands and trademarks(2) |
37,000 |
|
|
— |
|
|
37,000 |
|
|
37,000 |
|
|
— |
|
|
37,000 |
|
| Publishing rights |
87,552 |
|
|
— |
|
|
87,552 |
|
|
82,436 |
|
|
— |
|
|
82,436 |
|
| Total intangible assets with indefinite lives |
124,552 |
|
|
— |
|
|
124,552 |
|
|
119,436 |
|
|
— |
|
|
119,436 |
|
| Total intangible assets, net |
$ |
1,408,594 |
|
|
$ |
(813,550) |
|
|
$ |
595,044 |
|
|
$ |
1,410,043 |
|
|
$ |
(794,349) |
|
|
$ |
615,694 |
|
|
|
|
|
|
|
(1) |
Refer to Note 4, “Acquisitions and Divestitures,” for more information related to the acquisition that occurred in the year ended April 30, 2025. |
(2) |
The developed technology balance as of April 30, 2025 and 2024 is presented net of accumulated impairments and write-offs of $2.8 million. The indefinite-lived brands and trademarks balance as of April 30, 2025 and 2024 is net of accumulated impairments of $93.1 million. |
Based on the current amount of intangible assets subject to amortization and assuming current foreign exchange rates, the estimated amortization expense for the following years are as follows:
|
|
|
|
|
|
| Fiscal Year |
Amount |
| 2026 |
$ |
51,561 |
|
| 2027 |
46,767 |
|
| 2028 |
40,844 |
|
| 2029 |
36,326 |
|
| 2030 |
32,523 |
|
| Thereafter |
262,471 |
|
| Total |
$ |
470,492 |
|
Annual Indefinite-lived Intangible Impairment Test as of February 1, 2025 and 2024
We also review our indefinite-lived intangible assets for impairment annually, which consists of brands and trademarks and certain acquired publishing rights.
For fiscal years 2025 and 2024, we performed a qualitative assessment for our annual indefinite-lived intangible assets impairment test. This assessment included consideration of key factors including macroeconomic conditions, industry and market considerations, financial performance, WACC, and other relevant entity and reporting unit-specific events. Based on our qualitative assessment, we determined it was not more likely than not that the fair value of any indefinite-lived intangible asset was less than its carrying amount. As such, it was not necessary to perform a quantitative test.
Note 12 – Operating Leases
We have contractual obligations as a lessee with respect to offices, warehouses and distribution centers, automobiles, and office equipment.
We determine if an arrangement is a lease at inception of the contract in accordance with guidance detailed in the lease standard and we perform the lease classification test as of the lease commencement date. ROU assets represent our right to use an underlying asset for the lease term and lease liabilities represent our obligation to make lease payments arising from the lease. Operating lease ROU assets and liabilities are recognized at commencement date based on the present value of lease payments over the lease term.
The present value of the lease payments is calculated using an incremental borrowing rate, which was determined based on the rate of interest that we would have to pay to borrow an amount equal to the lease payments on a collateralized basis over a similar term. We use an unsecured borrowing rate and risk-adjust that rate to approximate a collateralized rate.
We recognize operating lease expense on a straight-line basis over the term of the lease. Lease payments may be fixed or variable. Only lease payments that are fixed, in-substance fixed or depend on a rate or index are included in determining the lease liability. Variable lease payments include payments made to the lessor for taxes, insurance and maintenance of the leased asset and are recognized as operating costs as incurred.
We apply certain practical expedients allowed by ASC Topic 842, “Leases”. Leases that are more than one year in duration are capitalized and recorded on our Consolidated Statements of Financial Position. Leases with an initial term of 12 months or less are recognized as short term lease operating costs on a straight-line basis over the term. We have also elected to account for the lease and non-lease components as a single component. Some of our leases offer an option to extend the term of such leases. We utilize the reasonably certain threshold criteria in determining which options we will exercise.
For operating leases, the ROU assets and liabilities as of April 30 are presented in our Consolidated Statements of Financial Position as follows:
|
|
|
|
|
|
|
|
|
|
|
|
|
2025 |
|
2024 |
| Operating lease ROU assets |
$ |
66,128 |
|
|
$ |
69,074 |
|
| Short-term portion of operating lease liabilities |
18,282 |
|
|
18,294 |
|
| Operating lease liabilities, non-current |
$ |
81,482 |
|
|
$ |
94,386 |
|
As a result of the Global Restructuring Program, which included the exit of certain leased office space, we recorded restructuring and related charges, which included impairment charges and the acceleration of expense associated with certain operating lease ROU assets.
See Note 7, “Restructuring and Related Charges” for more information on this program and the charges incurred.
Our total net lease costs were as follows:
|
|
|
|
|
|
|
|
|
|
|
|
|
|
|
|
|
|
|
For the Years Ended April 30, |
|
2025 |
|
2024 |
|
2023 |
| Operating lease cost |
$ |
14,613 |
|
|
$ |
14,575 |
|
|
$ |
18,620 |
|
| Variable lease cost |
833 |
|
|
1,096 |
|
|
1,326 |
|
| Short-term lease cost |
455 |
|
|
1,059 |
|
|
744 |
|
| Sublease income |
(560) |
|
|
(847) |
|
|
(770) |
|
Total net lease cost(1) |
$ |
15,341 |
|
|
$ |
15,883 |
|
|
$ |
19,920 |
|
|
|
|
|
|
|
| (1) |
Total net lease cost does not include those costs and sublease income for operating leases we had identified as part of our restructuring programs that would be subleased. The costs and sublease income for those leases are included in Restructuring and related charges on our Consolidated Statements of Income (Loss). See Note 7, “Restructuring and Related Charges” for more information on these programs. |
Other supplemental information includes the following:
|
|
|
|
|
|
|
|
|
|
|
|
|
|
|
|
|
|
|
For the Years Ended April 30, |
|
2025 |
|
2024 |
|
2023 |
| Weighted-average remaining contractual lease term (years) |
7 |
|
7 |
|
8 |
| Weighted-average discount rate |
6.16 |
% |
|
6.05 |
% |
|
5.95 |
% |
| Cash paid for amounts included in the measurement of lease liabilities: |
|
|
|
|
|
| Operating cash flows from operating leases |
$ |
22,209 |
|
|
$ |
25,852 |
|
|
$ |
26,919 |
|
| Operating lease liabilities arising from obtaining ROU assets |
$ |
1,646 |
|
|
$ |
2,199 |
|
|
$ |
2,686 |
|
The table below reconciles the undiscounted cash flows for the first five years and total of the remaining years to the operating lease liabilities recorded in the Consolidated Statement of Financial Position as of April 30, 2025:
|
|
|
|
|
|
| Fiscal Year |
Operating Lease
Liabilities |
| 2026 |
$ |
23,137 |
|
| 2027 |
18,743 |
|
| 2028 |
15,235 |
|
| 2029 |
14,625 |
|
| 2030 |
14,513 |
|
| Thereafter |
36,052 |
|
| Total future undiscounted minimum lease payments |
122,305 |
|
|
|
| Less: Imputed interest |
22,541 |
|
|
|
| Present value of minimum lease payments |
99,764 |
|
|
|
| Less: Current portion |
18,282 |
|
|
|
| Noncurrent portion |
$ |
81,482 |
|
Note 13 – Income Taxes
The provision for income taxes were as follows:
|
|
|
|
|
|
|
|
|
|
|
|
|
|
|
|
|
|
|
For the Years Ended April 30, |
|
2025 |
|
2024 |
|
2023 |
| Current provision |
|
|
|
|
|
| US – Federal |
$ |
5,497 |
|
|
$ |
2,152 |
|
|
$ |
2,857 |
|
| International |
50,300 |
|
|
49,357 |
|
|
48,694 |
|
| State and local |
1,981 |
|
|
(337) |
|
|
1,797 |
|
| Total current provision |
$ |
57,778 |
|
|
$ |
51,172 |
|
|
$ |
53,348 |
|
| Deferred provision (benefit) |
|
|
|
|
|
| US – Federal |
$ |
3,394 |
|
|
$ |
(25,026) |
|
|
$ |
(24,368) |
|
| International |
1,696 |
|
|
(4,772) |
|
|
(8,705) |
|
| State and local |
(4,151) |
|
|
(8,102) |
|
|
(4,408) |
|
| Total deferred provision (benefit) |
$ |
939 |
|
|
$ |
(37,900) |
|
|
$ |
(37,481) |
|
| Total provision |
$ |
58,717 |
|
|
$ |
13,272 |
|
|
$ |
15,867 |
|
International and United States pretax income (loss) were as follows:
|
|
|
|
|
|
|
|
|
|
|
|
|
|
|
|
|
|
|
For the Years Ended April 30, |
|
2025 |
|
2024 |
|
2023 |
| International |
$ |
189,781 |
|
|
$ |
109,616 |
|
|
$ |
204,055 |
|
| United States |
(46,903) |
|
|
(296,663) |
|
|
(170,955) |
|
| Total |
$ |
142,878 |
|
|
$ |
(187,047) |
|
|
$ |
33,100 |
|
Our effective income tax rate as a percentage of pretax income differed from the US federal statutory rate as shown below:
|
|
|
|
|
|
|
|
|
|
|
|
|
|
|
|
|
|
|
For the Years Ended April 30, |
|
2025 |
|
2024 |
|
2023 |
| US federal statutory rate |
21.0 |
% |
|
21.0 |
% |
|
21.0 |
% |
| Impact of foreign operations |
8.8 |
% |
|
(11.7) |
% |
|
(10.5) |
% |
| Change in valuation allowance |
14.4 |
% |
|
(14.0) |
% |
|
(7.4) |
% |
| State income taxes, net of US federal tax benefit |
(1.5) |
% |
|
4.6 |
% |
|
(7.2) |
% |
| Tax credits and related net benefits |
(2.7) |
% |
|
1.8 |
% |
|
(12.1) |
% |
| Impairment of goodwill |
— |
% |
|
(10.9) |
% |
|
66.7 |
% |
| Return to provision |
(1.9) |
% |
|
6.1 |
% |
|
(13.7) |
% |
| Other |
3.0 |
% |
|
(4.0) |
% |
|
11.1 |
% |
| Effective income tax rate |
41.1 |
% |
|
(7.1) |
% |
|
47.9 |
% |
The Company's effective tax rate for the fiscal year ended April 30, 2025, was primarily driven by the impact of the US valuation allowance, the rates of tax imposed on income earned in foreign jurisdictions, and state taxes.
Accounting for Uncertainty in Income Taxes:
As of April 30, 2025, and April 30, 2024, the total amount of unrecognized tax benefits was $9.8 million and $9.2 million, respectively, of which $0.4 million and $0.2 million represented accruals for interest and penalties recorded as additional tax expense in accordance with our accounting policy. As of April 30, 2025, and April 30, 2024, the total interest and penalties was $0.8 million and $0.6 million, respectively. We recorded net interest expense on reserves for unrecognized and recognized tax benefits of $0.2 million in each of the years ended April 30, 2025, and April 30, 2024. As of April 30, 2025, and April 30, 2024, the total amounts of unrecognized tax benefits that would reduce our income tax provision, if recognized, were approximately $9.8 million and $9.2 million, respectively. We do not expect any significant changes to the unrecognized tax benefits within the next twelve months.
A reconciliation of the unrecognized tax benefits included within the Other long-term liabilities on the Consolidated Statements of Financial Position is as follows:
|
|
|
|
|
|
|
|
|
|
|
|
|
For the Years Ended April 30, |
|
2025 |
|
2024 |
| Balance at May 1 |
$ |
9,151 |
|
|
$ |
9,421 |
|
| Additions for current year tax positions |
1,423 |
|
|
1,607 |
|
| Reductions for prior year tax positions |
(337) |
|
|
(181) |
|
| Payments and settlements |
— |
|
|
(849) |
|
| Reductions for lapse of statute of limitations |
(440) |
|
|
(847) |
|
| Balance at April 30 |
$ |
9,797 |
|
|
$ |
9,151 |
|
Tax Audits:
We file income tax returns in the US and various states and non-US tax jurisdictions. Our major taxing jurisdictions are the United States, the United Kingdom, and Germany. We are no longer subject to income tax examinations for years prior to fiscal year 2014 in the major jurisdictions in which we are subject to tax.
Deferred Taxes:
Deferred taxes result from temporary differences in the recognition of revenue and expense for tax and financial reporting purposes.
The significant components of deferred tax assets and liabilities as of April 30 were as follows:
|
|
|
|
|
|
|
|
|
|
|
|
|
2025 |
|
2024 |
| Net operating losses |
$ |
11,360 |
|
|
$ |
22,587 |
|
| Reserve for sales returns and doubtful accounts |
2,095 |
|
|
2,363 |
|
| Accrued employee compensation |
24,967 |
|
|
27,293 |
|
| Foreign and federal credits |
28,835 |
|
|
33,742 |
|
| Other accrued expenses |
1,009 |
|
|
3,822 |
|
| Retirement and post-employment benefits |
8,282 |
|
|
10,203 |
|
| Operating lease liabilities |
18,308 |
|
|
23,095 |
|
| Interest expense disallowance |
14,919 |
|
|
10,676 |
|
Impairment |
9,543 |
|
|
— |
|
Other |
415 |
|
|
— |
|
| Total gross deferred tax assets |
$ |
119,733 |
|
|
$ |
133,781 |
|
| Less valuation allowance |
(77,309) |
|
|
(53,498) |
|
| Total deferred tax assets |
$ |
42,424 |
|
|
$ |
80,283 |
|
|
|
|
|
| Prepaid expenses and other assets |
$ |
(861) |
|
|
$ |
(5,352) |
|
| Unremitted foreign earnings |
(2,220) |
|
|
(3,115) |
|
| Intangible and fixed assets |
(130,077) |
|
|
(155,862) |
|
| Right-of-use assets |
(10,848) |
|
|
(12,685) |
|
| Total deferred tax liabilities |
$ |
(144,006) |
|
|
$ |
(177,014) |
|
| Net deferred tax liabilities |
$ |
(101,582) |
|
|
$ |
(96,731) |
|
|
|
|
|
| Reported As |
|
|
|
Deferred tax assets excluding held-for-sale |
3,563 |
|
|
3,147 |
|
Deferred tax assets held-for-sale |
— |
|
|
6,176 |
|
| Deferred tax assets |
$ |
3,563 |
|
|
$ |
9,323 |
|
Deferred tax liabilities excluding held-for-sale |
(105,145) |
|
|
(97,186) |
|
Deferred tax liabilities held-for-sale |
— |
|
|
(8,868) |
|
| Deferred tax liabilities |
(105,145) |
|
|
(106,054) |
|
| Net deferred tax liabilities |
$ |
(101,582) |
|
|
$ |
(96,731) |
|
The change in net deferred taxes was primarily due to the decrease in net deferred tax liabilities primarily attributable to a decrease in tax liabilities in the capitalization of research and development (R&D) expenses. In addition, we had a decrease in net deferred tax assets related to an increase in the valuation allowance. In assessing the need for a valuation allowance, we take into account prior earnings history, expected future earnings, reversal of existing taxable temporary differences, carry back and carry forward periods and tax planning strategies that could potentially enhance the likelihood of the realization of a deferred tax asset. Changes to tax laws and statutory tax rates can also have an impact on our valuation allowances. Changes in valuation allowances are included in the Company’s income tax provision in the period of change.
We have provided a $77.3 million valuation allowance as of April 30, 2025. This valuation allowance is increased by approximately $23.8 million from the valuation allowance as of April 30, 2024. In fiscal year 2024, due to temporary differences in the US, our deferred taxes reversed from a net deferred tax liability position to a net deferred tax asset position. Due to losses in the US resulting from impairments, restructuring, and acceleration of amortization expense on capitalized software, we concluded it was more-likely-than-not that all or a portion of our deferred tax asset may not be realized. As a result, we established a valuation allowance of $30.2 million. During fiscal year 2025 we increased this valuation allowance by $26.0 million, because of an increase in the US net deferred tax asset attributable primarily to interest expense disallowance and intangible and fixed assets.
As of April 30, 2025, we have apportioned state net operating loss carryforwards totaling approximately $126 million, with a tax effected value of $7.1 million net of federal benefits. We have foreign net operating loss carryforwards totaling approximately $0.1 million, and federal net operating loss carryforwards totaling $2.4 million, with a tax effected value of $0.5 million. Our state, foreign, and federal NOLs and credits, to the extent they expire, expire in various amounts from 1 year to indefinite.
We intend to repatriate earnings from our non-US subsidiaries, and to the extent we repatriate these funds to the US, we may be required to pay taxes in various US state and local jurisdictions and withholding or similar taxes in applicable non-US jurisdictions in the periods in which such repatriation occurs. As of April 30, 2025, we have recorded a $2.2 million liability related to the estimated taxes that would be incurred upon repatriating certain non-US earnings to the US.
Note 14 – Debt and Available Credit Facilities
Our total debt outstanding as of April 30 consisted of the amounts set forth in the following table:
|
|
|
|
|
|
|
|
|
|
|
|
|
2025 |
|
2024 |
Short-term portion of long-term debt (1) |
$ |
10,000 |
|
|
$ |
7,500 |
|
|
|
|
|
Term loan A - Amended and Restated CA(2) |
174,581 |
|
|
184,418 |
|
| Revolving credit facility - Amended and Restated CA |
614,854 |
|
|
582,678 |
|
| Total long-term debt, less current portion |
789,435 |
|
|
767,096 |
|
|
|
|
|
| Total debt |
$ |
799,435 |
|
|
$ |
774,596 |
|
|
|
|
|
|
|
(1) |
Relates to our term loan A under the Amended and Restated CA. |
(2) |
Amounts are shown net of unamortized issuance costs of $0.4 million as of April 30, 2025 and $0.6 million as of April 30, 2024. |
The following table summarizes the scheduled annual maturities for the next three years of our long-term debt, including the short-term portion of long-term debt. This schedule represents the principal portion amount of debt outstanding and therefore excludes unamortized issuance costs.
|
|
|
|
|
|
| Fiscal Year |
Amount |
| 2026 |
$ |
10,000 |
|
| 2027 |
12,500 |
|
| 2028 |
777,354 |
|
| Total |
$ |
799,854 |
|
Amended and Restated CA
On November 30, 2022, we entered into the second amendment to the Third Amended and Restated Credit Agreement (collectively, the Amended and Restated CA). The Amended and Restated CA as of November 30, 2022 provided for senior unsecured credit facilities comprised of the following (i) a five-year revolving credit facility in an aggregate principal amount up to $1.115 billion which matures November 2027, (ii) a five-year term loan A facility consisting of $200 million which matures November 2027, and (iii) $185 million aggregate principal amount revolving credit facility which matured in May 2024.
Under the terms of the Amended and Restated CA, which can be drawn in multiple currencies, we have the option of borrowing at the following floating interest rates depending on the currency borrowed: (i) at a rate based on the US Secured Overnight Financing Rate (SOFR), the Sterling Overnight Index Average Rate (SONIA) or a EURIBOR-based rate, each rate plus an applicable margin ranging from 0.98% to 1.50%, depending on our consolidated net leverage ratio, as defined, or (ii) at the lender’s base rate plus an applicable margin ranging from zero to 0.50%, depending on our consolidated net leverage ratio. With respect to SOFR loans, there is a SOFR adjustment of between 0.10% and 0.25% depending on the duration of the loan. The lender’s base rate is defined as the highest of (i) the US federal funds effective rate plus a 0.50% margin, (ii) the Daily SOFR rate, as defined, plus a 1.00% margin, or (iii) the Bank of America prime lending rate. In addition, we pay a facility fee for the Amended and Restated CA ranging from 0.15% to 0.25% depending on our consolidated net leverage ratio. We also have the option to request an increase in the revolving credit facility by an amount not to exceed $500 million, in minimum increments of $50 million, subject to the approval of the lenders.
The Amended and Restated CA contains certain customary affirmative and negative covenants, including a financial covenant in the form of a consolidated net leverage ratio and consolidated interest coverage ratio, which we were in compliance with as of April 30, 2025.
In the three months ended January 31, 2023, we incurred a loss of $(0.2) million on the write-off of unamortized deferred costs in connection with the second amendment of the Amended and Restated CA which is reflected in Other income (expense), net on our Consolidated Statements of Income (Loss) for the year ended April 30, 2023.
The amortization expense of the costs incurred related to the Amended and Restated CA related to the lender and non-lender fees is recognized over a five-year term for credit commitments that mature in November 2027 and an 18-month term for credit commitments that matured in May 2024. Total amortization expense included in Interest expense on our Consolidated Statements of Income (Loss) is as follows:
|
|
|
|
|
|
|
|
|
|
|
|
|
|
|
|
|
|
|
For the Years Ended April 30, |
|
2025 |
|
2024 |
|
2023 |
Amortization expense |
$ |
1,145 |
|
|
$ |
1,246 |
|
|
$ |
1,129 |
|
Lines of Credit
We have other lines of credit aggregating $1.0 million at various interest rates. There were no outstanding borrowings under these credit lines at April 30, 2025 and 2024.
Our total available lines of credit as of April 30, 2025 were approximately $1,300.6 million which includes the Amended and Restated CA, of which approximately $500.7 million was unused. We had letters of credit of $0.4 million outstanding under the Amended and Restated CA, and the aggregate stated amount outstanding of these letters of credit reduces the total borrowing base available under the Amended and Restated CA.
The weighted average interest rates on total debt outstanding during the years ended April 30, 2025 and 2024 were 6.10% and 5.52%, respectively. As of April 30, 2025 and 2024, the weighted average interest rates for total debt were 5.57% and 6.07%, respectively.
Based on estimates of interest rates currently available to us for loans with similar terms and maturities, the fair value of our debt approximates its carrying value.
Note 15 – Derivative Instruments and Activities
Interest Rate Contracts
As of April 30, 2025, we had total debt outstanding of $799.4 million, net of unamortized issuance costs of $0.4 million. The $799.8 million of debt outstanding are variable rate loans under the Amended and Restated CA. The carrying value of the debt approximates fair value.
As of April 30, 2025 and 2024, the interest rate swap agreements we maintained were designated as fully effective cash flow hedges as defined under ASC Topic 815. As a result, the impact on our Consolidated Statements of Income (Loss) from changes in the fair value of the interest rate swaps was fully offset by changes in the interest expense on the underlying variable rate debt instruments. It is management’s intention that the notional amount of interest rate swaps be less than the variable rate loans outstanding during the life of the derivatives.
As of both April 30, 2025 and 2024, we had interest rate swaps outstanding with a combined notional amount of $500.0 million that were designated as cash flow hedges.
We record the fair value of our interest rate swaps on a recurring basis using Level 2 inputs of quoted prices for similar assets or liabilities in active markets. The fair value of our interest rate swaps designated as cash flow hedges as of April 30 are reflected in our Consolidated Statements of Financial Position as follows:
|
|
|
|
|
|
|
|
|
|
|
|
|
|
|
|
|
|
Asset (Liability) |
|
Balance Sheet Location |
2025 |
|
2024 |
Current asset portion |
|
Prepaid expenses and other current assets |
$ |
197 |
|
|
$ |
154 |
|
| Non-current asset portion |
|
Other non-current assets |
— |
|
|
9,686 |
|
Current liability portion |
|
Other accrued liabilities |
(118) |
|
|
— |
|
Non-current liability portion |
|
Other long-term liabilities |
(3,438) |
|
|
— |
|
Total cash flow hedges |
|
|
$ |
(3,358) |
|
|
$ |
9,840 |
|
The effect of our interest rate swaps on the Consolidated Statements of Comprehensive Income (Loss) and the Consolidated Statements of Income (Loss) for the years ended April 30 are as follows:
|
|
|
|
|
|
|
|
|
|
|
|
|
|
|
|
|
|
|
|
|
|
|
2025 |
|
2024 |
|
2023 |
Amount of pretax (losses) gains recognized in Other comprehensive income (loss) |
|
$ |
(8,186) |
|
|
$ |
15,164 |
|
|
$ |
6,036 |
|
Amount of pretax gains reclassified from Accumulated other comprehensive loss into Interest expense |
|
$ |
4,755 |
|
|
$ |
12,420 |
|
|
$ |
5,039 |
|
Based on the amount in Accumulated other comprehensive loss at April 30, 2025, approximately $(0.4) million, net of tax, would be reclassified into Net income in the next twelve months.
Foreign Currency Contracts
We may enter into foreign currency forward contracts to manage our exposure on certain foreign currency denominated assets and liabilities. The foreign currency forward exchange contracts are marked to market through Net foreign exchange transaction (losses) gains on our Consolidated Statements of Income (Loss) and carried at fair value on our Consolidated Statements of Financial Position. Foreign currency denominated assets and liabilities are remeasured at spot rates in effect on the balance sheet date, with the effects of changes in spot rates reported in Net foreign exchange transaction (losses) gains on our Consolidated Statements of Income (Loss).
As of April 30, 2025 and 2024, we did not maintain any open foreign currency forward contracts. In addition, we did not maintain any open foreign currency forward contracts during the years ended April 30, 2025, 2024, and 2023.
Note 16 – Commitment and Contingencies
Legal Proceedings
We are involved in routine litigation in the ordinary course of our business. A provision for litigation is accrued when information available to us indicates that it is probable a liability has been incurred and the amount of loss can be reasonably estimated. Significant judgment may be required to determine both the probability and estimate of loss. When the amount of the loss can only be estimated within a range, the most likely outcome within that range is accrued. If no amount within the range is a better estimate than any other amount, the minimum amount within the range is accrued. When uncertainties exist related to the probable outcome of litigation and/or the amount or range of loss, we do not record a liability, but disclose facts related to the nature of the contingency and possible losses if management considers the information to be material. Reserves for legal defense costs are recognized when incurred. The accruals for loss contingencies and legal costs are reviewed regularly and may be adjusted to reflect updated information on the status of litigation and advice of legal counsel. In the opinion of management, the ultimate resolution of all pending litigation as of April 30, 2025, will not have a material effect upon our consolidated financial condition or results of operations.
Note 17 – Retirement Plans
We have retirement plans that cover substantially all employees. The plans generally provide for employee retirement between the ages 60 and 65, and benefits based on length of service and compensation, as defined.
Defined Benefit Plans
Our Board of Directors approved plan amendments that froze the following retirement plans:
•Retirement Plan for the Employees of John Wiley & Sons, Canada was frozen effective December 31, 2015;
•Retirement Plan for the Employees of John Wiley & Sons, Ltd., a UK plan was frozen effective April 30, 2015 and;
•US Employees’ Retirement Plan, Supplemental Benefit Plan, and Supplemental Executive Retirement Plan, were frozen effective June 30, 2013.
We maintain the Supplemental Executive Retirement Plan for certain officers and senior management which provides for the payment of supplemental retirement benefits after the termination of employment for 10 years, or in a lifetime annuity. Under certain circumstances, including a change of control as defined, the payment of such amounts could be accelerated on a present value basis. Future accrued benefits to this plan have been discontinued as noted above.
The components of net pension expense (income) for the defined benefit plans and the weighted average assumptions were as follows:
|
|
|
|
|
|
|
|
|
|
|
|
|
|
|
|
|
|
|
|
|
|
|
|
|
|
|
|
|
|
|
|
|
|
|
|
|
For the Years Ended April 30, |
|
2025 |
|
2024 |
|
2023 |
|
US |
|
Non-US |
|
US |
|
Non-US |
|
US |
|
Non-US |
| Service cost |
$ |
— |
|
|
$ |
560 |
|
|
$ |
— |
|
|
$ |
532 |
|
|
$ |
— |
|
|
$ |
796 |
|
| Interest cost |
12,133 |
|
|
16,603 |
|
|
11,654 |
|
|
16,069 |
|
|
11,242 |
|
|
13,389 |
|
| Expected return on plan assets |
(9,610) |
|
|
(18,449) |
|
|
(10,372) |
|
|
(19,443) |
|
|
(9,924) |
|
|
(23,134) |
|
| Amortization of prior service cost |
(154) |
|
|
66 |
|
|
(154) |
|
|
60 |
|
|
(154) |
|
|
60 |
|
| Amortization of net actuarial loss |
2,314 |
|
|
6,058 |
|
|
2,446 |
|
|
5,656 |
|
|
2,295 |
|
|
3,851 |
|
| Curtailment/settlement (credit) |
— |
|
|
(181) |
|
|
— |
|
|
— |
|
|
— |
|
|
(1,828) |
|
| Net pension expense (income) |
$ |
4,683 |
|
|
$ |
4,657 |
|
|
$ |
3,574 |
|
|
$ |
2,874 |
|
|
$ |
3,459 |
|
|
$ |
(6,866) |
|
|
|
|
|
|
|
|
|
|
|
|
|
| Discount rate |
5.8 |
% |
|
5.1 |
% |
|
5.1 |
% |
|
4.8 |
% |
|
4.6 |
% |
|
3.0 |
% |
| Rate of compensation increase |
N/A |
|
3.0 |
% |
|
N/A |
|
3.0 |
% |
|
N/A |
|
3.1 |
% |
| Expected return on plan assets |
5.8 |
% |
|
6.2 |
% |
|
5.8 |
% |
|
6.4 |
% |
|
5.0 |
% |
|
5.5 |
% |
In the year ended April 30, 2025, due to the sale of the CrossKnowledge business, there was a curtailment and a settlement credit due to the divestment of the CrossKnowledge Pension Plan of $(0.2) million which is primarily reflected in Other income (expense), net on our Consolidated Statements of Income (Loss).
In the year ended April 30, 2023, because of a reduction in force, there was a curtailment credit of $(0.3) million related to the retirement allowances for employees of CrossKnowledge, a France Pension Plan, which is reflected in Other income (expense), net on our Consolidated Statements of Income (Loss). In addition, in the year ended April 30, 2023 due to the closure of our operations in Russia, there was a curtailment and a settlement credit due to the wind up of the Russia Pension Plan of $(1.5) million which is primarily reflected in Other income (expense), net on our Consolidated Statements of Income (Loss).
The service cost component of net pension expense (income) is reflected in Operating and administrative expenses on our Consolidated Statements of Income (Loss). The other components of net pension expense (income) are reported separately from the service cost component and below Operating income. Such amounts are reflected in Other income (expense), net on our Consolidated Statements of Income (Loss).
The recognized net actuarial loss for each fiscal year is calculated using the “corridor method,” which reflects the amortization of the net loss at the beginning of the fiscal year in excess of 10% of the greater of the market value of plan assets or the projected benefit obligation. The amortization period is based on the average expected life of plan participants for plans with all or almost all inactive participants and frozen plans, and on the average remaining working lifetime of active plan participants for all other plans.
The vested benefit obligation for our defined benefit postretirement plans is the actuarial present value of the vested benefits to which the employee is currently entitled but based on the employee's expected date of separation of retirement.
We recognize the overfunded or underfunded status of defined benefit postretirement plans, measured as the difference between the fair value of plan assets and the projected benefit obligation, on the Consolidated Statements of Financial Position. The change in the funded status of the plan is recognized in Accumulated other comprehensive loss on the Consolidated Statements of Financial Position. Plan assets and obligations are measured at fair value as of our Consolidated Statements of Financial Position date.
The following table sets forth the changes in, and the status of, our defined benefit plans’ assets and benefit obligations:
|
|
|
|
|
|
|
|
|
|
|
|
|
|
|
|
|
|
|
|
|
|
|
|
|
2025 |
|
2024 |
|
US |
|
Non-US |
|
US |
|
Non-US |
| CHANGE IN PLAN ASSETS |
|
|
|
|
|
|
|
| Fair value of plan assets, beginning of year |
$ |
173,569 |
|
|
$ |
293,168 |
|
|
$ |
186,607 |
|
|
$ |
302,055 |
|
| Actual return on plan assets |
13,312 |
|
|
(7,426) |
|
|
(707) |
|
|
(7,276) |
|
| Employer contributions |
3,198 |
|
|
13,526 |
|
|
3,672 |
|
|
11,708 |
|
| Employee contributions |
— |
|
|
— |
|
|
— |
|
|
— |
|
| Settlements |
— |
|
|
(729) |
|
|
— |
|
|
— |
|
| Benefits paid |
(15,909) |
|
|
(14,560) |
|
|
(16,003) |
|
|
(12,215) |
|
| Foreign currency rate changes |
— |
|
|
18,553 |
|
|
— |
|
|
(1,104) |
|
| Fair value, end of year |
$ |
174,170 |
|
|
$ |
302,532 |
|
|
$ |
173,569 |
|
|
$ |
293,168 |
|
| CHANGE IN PROJECTED BENEFIT OBLIGATION |
|
|
|
|
|
|
|
| Benefit obligation, beginning of year |
$ |
(215,563) |
|
|
$ |
(324,362) |
|
|
$ |
(235,888) |
|
|
$ |
(343,008) |
|
| Service cost |
— |
|
|
(560) |
|
|
— |
|
|
(532) |
|
| Interest cost |
(12,133) |
|
|
(16,603) |
|
|
(11,654) |
|
|
(16,069) |
|
Actuarial (losses) gains |
(4,760) |
|
|
22,520 |
|
|
15,976 |
|
|
21,258 |
|
| Benefits paid |
15,909 |
|
|
14,560 |
|
|
16,003 |
|
|
12,215 |
|
| Foreign currency rate changes |
— |
|
|
(19,984) |
|
|
— |
|
|
2,009 |
|
| Settlements and other |
— |
|
|
1,097 |
|
|
— |
|
|
(235) |
|
| Benefit obligation, end of year |
$ |
(216,547) |
|
|
$ |
(323,332) |
|
|
$ |
(215,563) |
|
|
$ |
(324,362) |
|
| Underfunded status, end of year |
$ |
(42,377) |
|
|
$ |
(20,800) |
|
|
$ |
(41,994) |
|
|
$ |
(31,194) |
|
| AMOUNTS RECOGNIZED ON THE STATEMENT OF FINANCIAL POSITION |
|
|
|
|
|
|
|
| Noncurrent assets |
— |
|
|
12,885 |
|
|
— |
|
|
2,967 |
|
| Current pension liability |
(2,881) |
|
|
(1,282) |
|
|
(3,093) |
|
|
(1,193) |
|
| Noncurrent pension liability excluding held-for-sale |
(39,496) |
|
|
(32,403) |
|
|
(38,901) |
|
|
(31,931) |
|
| Noncurrent pension liability held-for-sale |
— |
|
|
— |
|
|
— |
|
|
(1,037) |
|
| Noncurrent pension liability |
(39,496) |
|
|
(32,403) |
|
|
(38,901) |
|
|
(32,968) |
|
| Net amount recognized in statement of financial position |
$ |
(42,377) |
|
|
$ |
(20,800) |
|
|
$ |
(41,994) |
|
|
$ |
(31,194) |
|
| AMOUNTS RECOGNIZED IN ACCUMULATED OTHER COMPREHENSIVE LOSS (BEFORE TAX) CONSIST OF |
|
|
|
|
|
|
|
| Net actuarial losses |
$ |
(75,768) |
|
|
$ |
(206,945) |
|
|
$ |
(77,025) |
|
|
$ |
(196,705) |
|
| Prior service cost gains (losses) |
1,484 |
|
|
(992) |
|
|
1,638 |
|
|
(1,224) |
|
| Total accumulated other comprehensive loss |
$ |
(74,284) |
|
|
$ |
(207,937) |
|
|
$ |
(75,387) |
|
|
$ |
(197,929) |
|
| Change in accumulated other comprehensive loss |
$ |
1,103 |
|
|
$ |
(10,008) |
|
|
$ |
7,188 |
|
|
$ |
830 |
|
| INFORMATION FOR PENSION PLANS WITH AN ACCUMULATED BENEFIT OBLIGATION IN EXCESS OF PLAN ASSETS |
|
|
|
|
|
|
|
| Accumulated benefit obligation |
$ |
216,547 |
|
|
$ |
34,189 |
|
|
$ |
215,563 |
|
|
$ |
34,274 |
|
| Fair value of plan assets |
$ |
174,170 |
|
|
$ |
511 |
|
|
$ |
173,569 |
|
|
$ |
481 |
|
| INFORMATION FOR PENSION PLANS WITH A PROJECTED BENEFIT OBLIGATION IN EXCESS OF PLAN ASSETS |
|
|
|
|
|
|
|
| Projected benefit obligation |
$ |
216,547 |
|
|
$ |
34,198 |
|
|
$ |
215,563 |
|
|
$ |
34,643 |
|
| Fair value of plan assets |
$ |
174,170 |
|
|
$ |
511 |
|
|
$ |
173,569 |
|
|
$ |
481 |
|
| WEIGHTED AVERAGE ASSUMPTIONS USED IN DETERMINING ASSETS AND LIABILITIES |
|
|
|
|
|
|
|
| Discount rate |
5.7 |
% |
|
5.5 |
% |
|
5.1 |
% |
|
4.8 |
% |
| Rate of compensation increase |
N/A |
|
3.0 |
% |
|
N/A |
|
3.0 |
% |
| Accumulated benefit obligations |
$ |
(216,547) |
|
|
$ |
(315,748) |
|
|
$ |
(215,563) |
|
|
$ |
(316,107) |
|
Actuarial losses in the US plans resulting in an increase to our projected benefit obligation for the year ended April 30, 2025, were primarily due to a change in the discount rate and losses from actual demographic experience being different than expected. Actuarial gains for the non-US plans, resulting in a decrease to our projected benefit obligation for the year ended April 30, 2025, were primarily due to a change in the discount rates.
Actuarial gains in the US resulting in a decrease to our projected benefit obligation for the year ended April 30, 2024 were primarily due to an increase in the discount rate. Actuarial gains for the non-US plans, resulting in a decrease to our projected benefit obligation for the year ended April 30, 2024 were primarily due to increases in the discount rates.
Pension plan assets/investments:
The investment guidelines for the defined benefit pension plans are established based upon an evaluation of market conditions, plan liabilities, cash requirements for benefit payments, and tolerance for risk. Investment guidelines include the use of actively and passively managed securities. The investment objective is to ensure that funds are available to meet the plans’ benefit obligations when they are due. The investment strategy is to invest in high quality and diversified equity and debt securities to achieve our long-term expectation. The plans’ risk management practices provide guidance to the investment managers, including guidelines for asset concentration, credit rating, and liquidity. Asset allocation favors a balanced portfolio, with a global aggregated target allocation of approximately 19% equity securities and 81% fixed income securities and cash. Due to volatility in the market, the target allocation is not always desirable and asset allocations will fluctuate between acceptable ranges of plus or minus 5%. We regularly review the investment allocations and periodically rebalance investments to the target allocations. We categorize our pension assets into three levels based upon the assumptions (inputs) used to price the assets. Level 1 provides the most reliable measure of fair value, whereas Level 3 generally requires significant management judgment. The three levels are defined as follows:
•Level 1: Unadjusted quoted prices in active markets for identical assets.
•Level 2: Observable inputs other than those included in Level 1. For example, quoted prices for similar assets in active markets or quoted prices for identical assets in inactive markets.
•Level 3: Unobservable inputs reflecting assumptions about the inputs used in pricing the asset.
We did not maintain any level 3 assets during the years ended April 30, 2025 and 2024.
Certain of our pension assets are invested in common collective trusts managed and valued by the fund administrator. The fair value of the funds is based on the Net Asset Value (NAV) of the underlying investments owned by the fund less its liabilities based on published daily rate. Certain investments that are measured at fair value using the NAV per share (or its equivalent) practical expedient do not have to be classified in the fair value hierarchy. The fair value amounts presented in the following tables are intended to permit reconciliation of the fair value hierarchy to the amounts presented for the total pension benefit plan assets. For those plan assets measured at NAV, a redemption request can be executed within a 7-day notice. There are no unfunded commitments or redemption restrictions for these funds.
The following tables set forth, by level within the fair value hierarchy, pension plan assets at their fair value as of April 30:
|
|
|
|
|
|
|
|
|
|
|
|
|
|
|
|
|
|
|
|
|
|
|
|
|
|
|
|
|
|
|
|
|
|
|
|
|
|
|
|
|
|
|
|
|
|
|
|
|
2025 |
|
2024 |
|
Level 1 |
|
Level 2 |
|
NAV |
|
Total |
|
Level 1 |
|
Level 2 |
|
NAV |
|
Total |
| US Plan Assets |
|
|
|
|
|
|
|
|
|
|
|
|
|
|
|
| Global Equity Securities: Limited Partnership |
|
|
$ |
4,904 |
|
|
$ |
51,727 |
|
|
$ |
56,631 |
|
|
|
|
$ |
5,598 |
|
|
$ |
58,238 |
|
|
$ |
63,836 |
|
| Fixed Income Securities: Commingled Trust Funds |
|
|
|
|
117,539 |
|
|
117,539 |
|
|
|
|
|
|
109,733 |
|
|
109,733 |
|
| Total Assets |
|
|
$ |
4,904 |
|
|
$ |
169,266 |
|
|
$ |
174,170 |
|
|
|
|
$ |
5,598 |
|
|
$ |
167,971 |
|
|
$ |
173,569 |
|
|
|
|
|
|
|
|
|
|
|
|
|
|
|
|
|
| Non-US Plan Assets |
|
|
|
|
|
|
|
|
|
|
|
|
|
|
|
| Equity securities: |
|
|
|
|
|
|
|
|
|
|
|
|
|
|
|
| US equities |
$ |
— |
|
|
$ |
25,110 |
|
|
|
|
$ |
25,110 |
|
|
$ |
— |
|
|
$ |
22,496 |
|
|
|
|
$ |
22,496 |
|
| Non-US equities |
— |
|
|
9,530 |
|
|
|
|
9,530 |
|
|
— |
|
|
9,637 |
|
|
|
|
9,637 |
|
| Balanced managed funds |
— |
|
|
71,629 |
|
|
|
|
71,629 |
|
|
— |
|
|
60,959 |
|
|
|
|
60,959 |
|
| Fixed income securities: Commingled funds |
— |
|
|
100,740 |
|
|
|
|
100,740 |
|
|
— |
|
|
125,223 |
|
|
|
|
125,223 |
|
| Other: |
|
|
|
|
|
|
|
|
|
|
|
|
|
|
|
| Real estate/other |
— |
|
|
511 |
|
|
|
|
511 |
|
|
— |
|
|
480 |
|
|
|
|
480 |
|
| Cash and cash equivalents |
12,503 |
|
|
82,509 |
|
|
|
|
95,012 |
|
|
1,328 |
|
|
73,045 |
|
|
|
|
74,373 |
|
| Total Non-US plan assets |
$ |
12,503 |
|
|
$ |
290,029 |
|
|
$ |
— |
|
|
$ |
302,532 |
|
|
$ |
1,328 |
|
|
$ |
291,840 |
|
|
$ |
— |
|
|
$ |
293,168 |
|
| Total plan assets |
$ |
12,503 |
|
|
$ |
294,933 |
|
|
$ |
169,266 |
|
|
$ |
476,702 |
|
|
$ |
1,328 |
|
|
$ |
297,438 |
|
|
$ |
167,971 |
|
|
$ |
466,737 |
|
Expected employer contributions to the defined benefit pension plans in the year ended April 30, 2026 will be approximately $4.8 million, including $1.8 million of minimum amounts required for our non-US plans. From time to time, we may elect to make voluntary contributions to our defined benefit plans to improve their funded status.
Benefit payments to retirees from all defined benefit plans are expected to be the following in the fiscal year indicated:
|
|
|
|
|
|
|
|
|
|
|
|
|
|
|
|
|
|
|
|
|
| Fiscal Year |
|
US |
|
Non-US |
|
Total |
| 2026 |
|
$ |
15,943 |
|
|
$ |
13,773 |
|
|
$ |
29,716 |
|
| 2027 |
|
15,880 |
|
|
14,497 |
|
|
30,377 |
|
| 2028 |
|
15,865 |
|
|
14,741 |
|
|
30,606 |
|
| 2029 |
|
15,886 |
|
|
15,879 |
|
|
31,765 |
|
| 2030 |
|
15,624 |
|
|
16,817 |
|
|
32,441 |
|
| 2031–2035 |
|
77,327 |
|
|
97,312 |
|
|
174,639 |
|
| Total |
|
$ |
156,525 |
|
|
$ |
173,019 |
|
|
$ |
329,544 |
|
Retiree Health Benefits
We provide contributory life insurance and health care benefits, subject to certain dollar limitations, for substantially all of our eligible retired US employees. The retiree health benefit is no longer available for any employee who retires after December 31, 2017. The cost of such benefits is expensed over the years the employee renders service and is not funded in advance. The accumulated post-retirement benefit obligation recognized on the Consolidated Statements of Financial Position as of both April 30, 2025 and 2024 was $0.6 million. Annual credits for these plans were $(0.1) million for each of the years ended April 30, 2025, 2024, and 2023 and are reflected in Operating and administrative expenses on our Consolidated Statements of Income (Loss).
Defined Contribution Savings Plans
We have defined contribution savings plans. Our contribution is based on employee contributions and the level of our match. We may make discretionary contributions to all employees as a group. The expense recorded for these plans was approximately $22.8 million, $27.0 million, and $30.7 million in the years ended April 30, 2025, 2024, and 2023, respectively, and is reflected in Operating and administrative expenses on our Consolidated Statements of Income (Loss).
Note 18 – Stock-Based Compensation
The Company provides stock-based compensation to its employees and non-employee directors, which may include restricted stock units (RSU), PSU, and stock options (collectively, stock-based awards). All equity compensation plans have been approved by shareholders. On September 29, 2022, the Company’s shareholders approved the 2022 Omnibus Stock and Long-Term Incentive Plan (the 2022 Plan), which replaced, with respect to new award grants, our 2014 Key Employee Stock Plan and 2018 Director Stock Plan (the Prior Plans) that were previously in effect. Following the approval of the 2022 Plan, no further awards were available to be issued under the Prior Plans, but awards outstanding under the Prior Plans as of that date remain outstanding in accordance with their terms. A total number of 6.2 million shares of our Class A stock was authorized under the 2022 Plan. In addition, any outstanding awards cancelled from the Prior Plans are added to the shares available under the 2022 Plan. As of April 30, 2025, there were approximately 5.3 million securities remaining that are available for future issuance under the 2022 Plan. We issue treasury shares to fund awards issued under the 2022 Plan.
Stock Option Activity
Under the terms of our stock option plan, the exercise price of stock options granted may not be less than 100% of the fair market value of the stock at the date of grant. Options are exercisable over a maximum period of ten years from the date of grant. For the options granted in the years ended April 30, 2024 and 2023, such options generally vest 10%, 20%, 30%, and 40% on April 30, or on each anniversary date after the award is granted. There were no options granted in the year ended April 30, 2025.
The following table provides the estimated weighted average fair value for options granted during the years ended April 30 using the Black-Scholes option-pricing model, and the significant weighted average assumptions used in their determination:
|
|
|
|
|
|
|
|
|
|
|
|
|
2024 |
|
2023 |
| Weighted average fair value of options on grant date |
$ |
6.47 |
|
|
$ |
9.24 |
|
|
|
|
|
| Weighted average assumptions: |
|
|
|
| Expected life of options (years) |
6.3 |
|
5.9 |
| Risk-free interest rate |
4.6 |
% |
|
2.0 |
% |
| Expected volatility |
34.0 |
% |
|
32.4 |
% |
| Expected dividend yield |
4.6 |
% |
|
3.4 |
% |
| Fair value of common stock on grant date |
$ |
30.37 |
|
|
$ |
41.30 |
|
| Exercise price of stock option grant |
$ |
34.86 |
|
|
$ |
41.30 |
|
As of April 30, 2025, there was $0.5 million of unrecognized share-based compensation cost related to options, which is expected to be recognized over a period up to 3 years, or 2.0 years on a weighted average basis.
The following table summarizes the activity and status of our stock option plans during the year ended April 30, 2025:
|
|
|
|
|
|
|
|
|
|
|
|
|
|
|
|
|
|
|
|
|
|
|
|
|
Number
of Options
(in 000’s) |
|
Weighted
Average
Exercise
Price |
|
Weighted
Average
Remaining
Term
(in years) |
|
Aggregate
Intrinsic
Value
(in millions) |
| Outstanding at beginning of year |
375 |
|
$ |
48.74 |
|
|
|
|
|
| Granted |
— |
|
$ |
— |
|
|
|
|
|
| Exercised |
(7) |
|
$ |
35.69 |
|
|
|
|
|
| Expired or forfeited |
(118) |
|
$ |
53.50 |
|
|
|
|
|
| Outstanding at end of year |
250 |
|
$ |
46.87 |
|
|
7.4 |
|
$ |
1.2 |
|
| Exercisable at end of year |
143 |
|
$ |
55.28 |
|
|
6.7 |
|
$ |
0.3 |
|
| Vested and expected to vest in the future at April 30 |
247 |
|
$ |
46.98 |
|
|
7.4 |
|
$ |
1.2 |
|
The intrinsic value is the difference between our common stock price and the option grant price. The total intrinsic value of options exercised during the years ended April 30, 2025 and 2023 was $0.1 million, and $0.1 million, respectively. There were no options exercised during the year ended April 30, 2024.
The total grant date fair value of stock options vested during the years ended April 30, 2025, 2024, and 2023 was $0.6 million, $0.9 million, and $0.5 million, respectively.
The following table summarizes information about stock options outstanding and exercisable at April 30, 2025:
|
|
|
|
|
|
|
|
|
|
|
|
|
|
|
|
|
|
|
|
|
|
|
|
|
|
|
|
|
|
|
Options Outstanding |
|
Options Exercisable |
| Range of Exercise Prices |
Number
of Options
(in 000’s) |
|
Weighted Average
Remaining
Term
(in years) |
|
Weighted
Average
Exercise
Price |
|
Number
of Options
(in 000’s) |
|
Weighted
Average
Exercise
Price |
$32.68 to $36.60 |
137 |
|
8.5 |
|
$ |
34.91 |
|
|
37 |
|
$ |
34.94 |
|
$45.99 to $63.07 |
113 |
|
6.1 |
|
$ |
61.37 |
|
|
106 |
|
$ |
62.39 |
|
| Total/average |
250 |
|
7.4 |
|
$ |
46.87 |
|
|
143 |
|
$ |
55.28 |
|
Performance-Based and Other Restricted Stock Activity
Under the terms of our long-term incentive plans, PSU are payable in restricted shares of our Class A Common Stock upon the achievement of certain three-year or less financial performance-based targets. During each three-year period or less, we adjust compensation expense based upon our best estimate of expected performance. Restricted performance share units vest 100% on June 30 following the end of the three-year performance cycle.
We may also grant individual restricted unit awards payable in restricted shares of our Class A Common Stock to key employees in connection with their employment. Restricted shares generally vest ratably 25% per year.
Under certain circumstances relating to a change of control or termination, as defined, the restrictions would lapse and shares would vest earlier.
Activity for performance-based and other restricted stock awards during the years ended April 30, was as follows (shares in thousands):
|
|
|
|
|
|
|
|
|
|
|
|
|
|
|
|
|
|
|
|
|
|
|
|
|
2025 |
|
2024 |
|
2023 |
|
Restricted
Shares |
|
Weighted
Average
Grant Date
Value |
|
Restricted
Shares |
|
Restricted
Shares |
| Nonvested shares at beginning of year |
1,203 |
|
$ |
37.07 |
|
|
1,073 |
|
1,274 |
| Granted |
735 |
|
$ |
43.06 |
|
|
1,089 |
|
540 |
| Change in shares due to performance |
71 |
|
$ |
39.83 |
|
|
54 |
|
(44) |
| Vested and issued |
(448) |
|
$ |
41.28 |
|
|
(660) |
|
(544) |
| Forfeited |
(345) |
|
$ |
39.84 |
|
|
(353) |
|
(153) |
| Nonvested shares at end of year |
1,216 |
|
$ |
38.51 |
|
|
1,203 |
|
1,073 |
We recognized stock-based compensation expense (including stock options) primarily in Operating and administrative expenses on the Consolidated Statements of Income (Loss), on a pretax basis, as follows:
|
|
|
|
|
|
|
|
|
|
|
|
|
|
|
|
|
|
|
For the Years Ended April 30, |
|
2025 |
|
2024 |
|
2023 |
Stock-based compensation expense |
$ |
22,222 |
|
|
$ |
24,982 |
|
|
$ |
26,504 |
|
As of April 30, 2025, there was $27.2 million of unrecognized share-based compensation cost related to performance-based and other restricted stock awards, which is expected to be recognized over a period up to 4 years, or 2.3 years on a weighted average basis.
Compensation expense for restricted stock awards is measured using the closing market price of our Class A Common Stock at the date of grant. The total grant date value of shares vested during the years ended April 30 was as follows:
|
|
|
|
|
|
|
|
|
|
|
|
|
|
|
|
|
|
|
2025 |
|
2024 |
|
2023 |
Grant date value of shares vested |
$ |
18,504 |
|
|
$ |
29,874 |
|
|
$ |
25,705 |
|
President and CEO New Hire Equity Awards
On July 8, 2024, the Company named Mr. Matthew Kissner President and CEO and entered into an employment agreement (Employment Agreement) with him. Mr. Kissner had served as the Company’s interim President and CEO since October 10, 2023. Under the Employment Agreement, Mr. Kissner will be eligible to participate in the Company’s Executive Long-Term Incentive Plan (ELTIP), with a target long-term incentive equal to $3.0 million.
Sixty percent of the ELTIP value will be delivered in the form of target performance share units and forty percent in restricted share units. The grant date fair value for the restricted share units was $46.65 per share and included 27,192 restricted share units, which vest 25% each year starting on April 30, 2025 to April 30, 2028. The grant date fair value for the performance share units was $46.65 per share and included 40,789 performance share units, which vest 100% on June 30, 2027. Awards are subject to forfeiture in the case of voluntary termination prior to vesting, and continued vesting in the case of earlier termination of employment without cause or due to constructive discharge. All other terms and conditions are the same as for other executives, as outlined in the ELTIP grant agreements.
Director Stock Awards
On September 29, 2022, the Company’s shareholders approved the 2022 Plan, which replaced, with respect to new award grants, the 2018 Director Stock Plan (the 2018 Plan) that was previously in effect. Under the terms of the 2022 Plan, each nonemployee director is eligible to receive an annual award of restricted shares of our Class A Common Stock equal in value to 100% of the annual director stock retainer fee, based on the stock price at the close of the New York Stock Exchange on the date of grant. Such restricted shares will vest on the earliest of (i) the day before the next annual meeting of stockholders following the grant, (ii) the nonemployee director’s death or disability (as determined by the Governance Committee of the Board of Directors (Governance Committee)), or (iii) a change in control (as defined in the 2022 Plan). The granted shares may not be sold or transferred during the time the nonemployee director remains a director.
There were 23,940, 25,744, and 30,706 restricted shares awarded under the 2022 Plan, or the 2018 Plan, as the case may be, for the years ended April 30, 2025, 2024, and 2023, respectively. In addition, pursuant to the John Wiley & Sons, Inc. Deferred Compensation Plan for Directors’ 2005 & After Compensation, as amended through September 20, 2022 (Deferred Compensation Plan), each nonemployee director has the option of receiving all or part of the annual cash retainer in the form of deferred stock and receive dividends in the form of deferred stock. The annual cash retainers deferred as stock and the dividends received in the form of deferred stock, all pursuant to the Deferred Compensation Plan, are nominal for the years ended April 30, 2025, 2024, and 2023.
Note 19 – Capital Stock and Changes in Capital Accounts
Wiley has two classes of common stock, Class A and Class B. Each share of our Class B Common Stock is convertible into one share of Class A Common Stock. The holders of Class A stock are entitled to elect 30% of the entire Board of Directors and the holders of Class B stock are entitled to elect the remainder. On all other matters, each share of Class A stock is entitled to one tenth of one vote, and each share of Class B stock is entitled to one vote.
Share Repurchases
During the year ended April 30, 2020, our Board of Directors approved a share repurchase program of $200 million of Class A or B Common Stock. As of April 30, 2025, we had authorization from our Board of Directors to purchase up to $57.4 million that was remaining under this program.
The following table summarizes the share repurchases of Class A and B Common Stock during the years ended April 30 (shares in thousands):
|
|
|
|
|
|
|
|
|
|
|
|
|
|
|
|
|
|
|
2025 |
|
2024 |
|
2023 |
| Shares repurchased – Class A |
1,186 |
|
1,294 |
|
831 |
| Shares repurchased – Class B |
173 |
|
3 |
|
1 |
| Average price – Class A and Class B |
$ |
44.16 |
|
|
$ |
34.71 |
|
|
$ |
42.07 |
|
For the year ended April 30, 2025, the average price per share excludes excise taxes payable on share repurchases and may differ from the share repurchases reflected in Purchases of treasury shares in our Consolidated Statements of Cash Flows.
Dividends
We declared and paid quarterly cash dividends on our Class A and Class B Common Stock for a total of $76.1 million, $77.0 million, and $77.3 million during the years ended April 30, 2025, 2024, and 2023, respectively.
Changes in Common Stock
The following is a summary of changes during the years ended April 30, in shares of our common stock and common stock in treasury (shares in thousands).
|
|
|
|
|
|
|
|
|
|
|
|
|
|
|
|
|
|
| Changes in Class A Common Stock: |
2025 |
|
2024 |
|
2023 |
| Number of shares, beginning of year |
70,259 |
|
70,231 |
|
70,226 |
| Common stock class conversions |
53 |
|
28 |
|
5 |
| Number of shares issued, end of year |
70,312 |
|
70,259 |
|
70,231 |
|
|
|
|
|
|
| Changes in Class A Common Stock in treasury: |
|
|
|
|
|
| Number of shares held, beginning of year |
24,828 |
|
23,983 |
|
23,515 |
| Restricted shares issued under stock-based compensation plans |
(448) |
|
(662) |
|
(544) |
| Impact of tax withholding on stock-based compensation and other |
121 |
|
213 |
|
181 |
| Purchases of treasury shares |
1,186 |
|
1,294 |
|
831 |
| Number of shares held, end of year |
25,687 |
|
24,828 |
|
23,983 |
| Number of Class A Common Stock outstanding, end of year |
44,625 |
|
45,431 |
|
46,248 |
|
|
|
|
|
|
|
|
|
|
|
|
|
|
|
|
|
|
| Changes in Class B Common Stock: |
2025 |
|
2024 |
|
2023 |
| Number of shares, beginning of year |
12,923 |
|
12,951 |
|
12,956 |
| Common stock class conversions |
(53) |
|
(28) |
|
(5) |
| Number of shares issued, end of year |
12,870 |
|
12,923 |
|
12,951 |
|
|
|
|
|
|
| Changes in Class B Common Stock in treasury: |
|
|
|
|
|
| Number of shares held, beginning of year |
3,928 |
|
3,925 |
|
3,924 |
| Purchases of treasury shares |
173 |
|
3 |
|
1 |
| Number of shares held, end of year |
4,101 |
|
3,928 |
|
3,925 |
| Number of Class B Common Stock outstanding, end of year |
8,769 |
|
8,995 |
|
9,026 |
Note 20 – Segment Information
We report our segment information in accordance with the provisions of FASB ASC Topic 280, “Segment Reporting.” We determine our operating and reportable segments based on how our CODM evaluates our business performance, manages the operations, makes operating decisions, and allocates resources.
Our segment reporting structure consists of three operating and reportable segments, which are listed below, as well as a Corporate expense category, which includes certain costs that are not allocated to the reportable segments:
•Research
•Learning
•Held for Sale or Sold
Our President and Chief Executive Officer is the Company’s CODM. The performance metric used by our CODM to evaluate performance of our reportable segments is Adjusted Operating Income. The CODM uses Adjusted Operating Income during the annual budgeting process and evaluates budget and forecast-to-actual variances on a monthly basis to make decisions about the allocation of resources to our segments.
Our significant expense categories that are included within Adjusted Operating Income include cost of sales, direct expenses, allocated expenses from our Corporate expense category, and amortization of intangible assets. The significant expense categories and amounts align with the segment-level information that is regularly provided to the CODM.
The following tables present a summary of our Adjusted Operating Income (Loss) by segment, and the reconciliation to Income (Loss) before taxes for the years ended April 30:
|
|
|
|
|
|
|
|
|
|
|
|
|
|
|
|
|
|
|
|
|
|
|
|
|
2025 |
|
Research |
|
Learning |
|
Held for Sale or Sold |
|
Total |
| Revenue |
$ |
1,075,459 |
|
|
$ |
584,768 |
|
|
$ |
17,382 |
|
|
$ |
1,677,609 |
|
Cost of sales |
278,867 |
|
|
144,758 |
|
|
7,755 |
|
|
431,380 |
|
Direct expenses |
336,484 |
|
|
142,204 |
|
|
10,365 |
|
|
489,053 |
|
Allocated Corporate expenses |
160,959 |
|
|
114,703 |
|
|
2,840 |
|
|
278,502 |
|
Amortization of intangible assets |
43,569 |
|
|
8,253 |
|
|
— |
|
|
51,822 |
|
Adjusted Operating Income (Loss) by segment |
$ |
255,580 |
|
|
$ |
174,850 |
|
|
$ |
(3,578) |
|
|
$ |
426,852 |
|
Reconciliation of Adjusted Operating Income by segment to Income before taxes |
|
|
|
|
|
|
|
Corporate expenses(1) |
|
|
|
|
|
|
(179,882) |
|
Restructuring and related charges(2) |
|
|
|
|
|
|
(25,561) |
|
| Interest expense |
|
|
|
|
|
|
(52,547) |
|
Net foreign exchange transaction losses |
|
|
|
|
|
|
(8,142) |
|
Net loss on sale of businesses, assets, and impairment charges related to assets held-for-sale |
|
|
|
|
|
|
(23,340) |
|
Other income, net |
|
|
|
|
|
|
5,498 |
|
Income before taxes |
|
|
|
|
|
|
$ |
142,878 |
|
|
|
|
|
|
|
|
|
|
|
|
|
|
|
|
|
|
|
|
|
|
|
|
|
|
2024 |
|
Research |
|
Learning |
|
Held for Sale or Sold |
|
Total |
| Revenue |
$ |
1,042,705 |
|
|
$ |
574,739 |
|
|
$ |
255,543 |
|
|
$ |
1,872,987 |
|
Cost of sales |
281,109 |
|
|
145,054 |
|
|
153,559 |
|
|
579,722 |
|
Direct expenses |
323,392 |
|
|
145,514 |
|
|
48,127 |
|
|
517,033 |
|
Allocated Corporate expenses |
155,495 |
|
|
132,394 |
|
|
23,142 |
|
|
311,031 |
|
Amortization of intangible assets |
44,946 |
|
|
9,044 |
|
|
2,004 |
|
|
55,994 |
|
| Adjusted Operating Income by segment |
$ |
237,763 |
|
|
$ |
142,733 |
|
|
$ |
28,711 |
|
|
$ |
409,207 |
|
Reconciliation of Adjusted Operating Income by segment to Loss before taxes |
|
|
|
|
|
|
|
Corporate expenses(1) |
|
|
|
|
|
|
(185,456) |
|
Impairment of goodwill(2) |
|
|
|
|
|
|
(108,449) |
|
Restructuring and related charges(2) |
|
|
|
|
|
|
(63,041) |
|
| Interest expense |
|
|
|
|
|
|
(49,003) |
|
Net foreign exchange transaction losses |
|
|
|
|
|
|
(2,959) |
|
Net loss on sale of businesses, assets, and impairment charges related to assets held-for-sale |
|
|
|
|
|
|
(183,389) |
|
Other expense, net |
|
|
|
|
|
|
(3,957) |
|
Loss before taxes |
|
|
|
|
|
|
$ |
(187,047) |
|
|
|
|
|
|
|
|
|
|
|
|
|
|
|
|
|
|
|
|
|
|
|
|
|
|
2023 |
|
Research |
|
Learning |
|
Held for Sale or Sold |
|
Total |
| Revenue |
$ |
1,080,311 |
|
|
$ |
546,395 |
|
|
$ |
393,194 |
|
|
$ |
2,019,900 |
|
Cost of sales |
286,361 |
|
|
148,925 |
|
|
257,255 |
|
|
692,541 |
|
Direct expenses |
312,383 |
|
|
157,694 |
|
|
71,310 |
|
|
541,387 |
|
Allocated Corporate expenses |
151,348 |
|
|
130,654 |
|
|
38,534 |
|
|
320,536 |
|
Amortization of intangible assets |
46,235 |
|
|
9,022 |
|
|
24,909 |
|
|
80,166 |
|
| Adjusted Operating Income by segment |
$ |
283,984 |
|
|
$ |
100,100 |
|
|
$ |
1,186 |
|
|
$ |
385,270 |
|
Reconciliation of Adjusted Operating Income by segment to Income before taxes |
|
|
|
|
|
|
|
Corporate expenses(1) |
|
|
|
|
|
|
(171,926) |
|
Impairment of goodwill(2) |
|
|
|
|
|
|
(99,800) |
|
Restructuring and related charges(2) |
|
|
|
|
|
|
(49,389) |
|
| Interest expense |
|
|
|
|
|
|
(37,745) |
|
Net foreign exchange transaction gains |
|
|
|
|
|
|
894 |
|
Net gain on sale of businesses and assets |
|
|
|
|
|
|
10,177 |
|
Other income, net |
|
|
|
|
|
|
3,884 |
|
Legal settlement(3) |
|
|
|
|
|
|
(3,671) |
|
Accelerated amortization of an intangible asset(4) |
|
|
|
|
|
|
(4,594) |
|
Income before taxes |
|
|
|
|
|
|
$ |
33,100 |
|
|
|
|
|
|
|
(1) |
Corporate expenses include certain costs that are not allocated to the reportable segments. |
(2) |
See Note 7, “Restructuring and Related Charges” and Note 11, “Goodwill and Intangible Assets” for more information of these charges by segment. |
(3) |
In the three months ended January 31, 2023, we settled a litigation matter related to consideration for a previous acquisition for $3.7 million which is included in Corporate Operating and administrative expenses. |
(4) |
We discontinued use of the mthree trademark that resulted in a change in the useful life and accelerated amortization expense of 4.6 million in the three months ended July 31, 2022. This amortization expense was an adjustment to the Held for Sale or Sold Adjusted operating income. In addition, it was included in Depreciation and amortization in the table below. |
See Note 3, “Revenue Recognition, Contracts with Customers,” for revenue from contracts with customers disaggregated by segment and product type for the years ended April 30, 2025, 2024, and 2023.
Depreciation and amortization expense for the years ended April 30 were as follows:
|
|
|
|
|
|
|
|
|
|
|
|
|
|
|
|
|
|
|
2025 |
|
2024 |
|
2023 |
| Research |
$ |
89,302 |
|
|
$ |
93,422 |
|
|
$ |
93,008 |
|
| Learning |
43,900 |
|
|
57,696 |
|
|
57,698 |
|
Held for Sale or Sold(1) |
— |
|
|
3,437 |
|
|
46,085 |
|
| Total depreciation and amortization |
$ |
133,202 |
|
|
$ |
154,555 |
|
|
$ |
196,791 |
|
| Corporate depreciation and amortization |
13,924 |
|
|
22,434 |
|
|
16,462 |
|
| Total depreciation and amortization |
$ |
147,126 |
|
|
$ |
176,989 |
|
|
$ |
213,253 |
|
|
|
|
|
|
|
(1) |
We ceased to record depreciation and amortization of long-lived assets for these businesses as of the date the assets were classified as held-for-sale. |
Revenue for the years ended April 30 from external customers based on the location of the customer were as follows:
|
|
|
|
|
|
|
|
|
|
|
|
|
|
|
|
|
|
|
2025 |
|
2024 |
|
2023 |
| United States |
$ |
729,833 |
|
|
$ |
881,795 |
|
|
$ |
995,918 |
|
| China |
141,239 |
|
|
120,213 |
|
|
150,939 |
|
| United Kingdom |
118,328 |
|
|
165,457 |
|
|
150,601 |
|
| Japan |
83,152 |
|
|
84,846 |
|
|
89,084 |
|
| Australia |
75,102 |
|
|
74,986 |
|
|
79,802 |
|
| Other countries |
529,955 |
|
|
545,690 |
|
|
553,556 |
|
| Total |
$ |
1,677,609 |
|
|
$ |
1,872,987 |
|
|
$ |
2,019,900 |
|
Total long-lived assets, consisting of technology, property and equipment, net and operating lease ROU assets by geographical area as of April 30 were as follows:
|
|
|
|
|
|
|
|
|
|
|
|
|
|
|
|
|
|
|
2025 |
|
2024 |
|
2023 |
| United States |
$ |
185,610 |
|
|
$ |
213,192 |
|
|
$ |
275,229 |
|
| United Kingdom |
25,315 |
|
|
27,584 |
|
|
34,748 |
|
| Other countries |
17,328 |
|
|
20,736 |
|
|
28,369 |
|
| Total |
$ |
228,253 |
|
|
$ |
261,512 |
|
|
$ |
338,346 |
|
Our CODM reviews our financial position at a consolidated level and does not review assets by segment to evaluate segment performance or allocate resources. As such, assets by segment are not disclosed.
Item 9. Changes in and Disagreements with Accountants on Accounting and Financial Disclosure
None
Item 9A. Controls and Procedures
Disclosure Controls and Procedures: The Company’s Chief Executive Officer and Interim Chief Financial Officer, together with other members of the Company’s management, have conducted an evaluation of the Company’s disclosure controls and procedures as defined in Rules 13a-15(e) and 15d-15(e) under the Securities Exchange Act of 1934 (the Exchange Act) as of the end of the period covered by this report. Based on this evaluation, the Chief Executive Officer and Interim Chief Financial Officer have concluded that the Company’s disclosure controls and procedures were effective to ensure that information required to be disclosed by the Company in reports filed or submitted under the Exchange Act is (i) recorded, processed, summarized and reported within the time periods specified by the Securities and Exchange Commission’s rules and forms, and (ii) accumulated and communicated to the Company’s management, including its Chief Executive Officer and Interim Chief Financial Officer, as appropriate to allow timely decisions regarding required disclosure.
Changes in Internal Control over Financial Reporting: There were no changes in our internal control over financial reporting in the fourth quarter of fiscal year 2025 that have materially affected, or are reasonably likely to materially affect, our internal control over financial reporting.
Management’s Report on Internal Control over Financial Reporting: Our management is responsible for establishing and maintaining adequate internal control over financial reporting, as such term is defined in Rule 13a-15(f) of the Exchange Act. Under the supervision and with the participation of our management, including our Chief Executive Officer and Interim Chief Financial Officer, management conducted an evaluation of the effectiveness of our internal control over financial reporting based upon the framework in Internal Control – Integrated Framework (2013) issued by the Committee of Sponsoring Organizations of the Treadway Commission. Based on their evaluation, our management concluded that our internal control over financial reporting was effective as of April 30, 2025.
The effectiveness of our internal control over financial reporting as of April 30, 2025 has been audited by PricewaterhouseCoopers LLP, an independent registered public accounting firm, as stated in their report which is included herein.
Item 9B. Other Information
During the fiscal quarter ended April 30, 2025, none of our directors or officers adopted, modified or terminated a “Rule 10b5-1 trading arrangement” or a “non-Rule 10b5-1 trading arrangement” as such terms are defined under Item 408 of Regulation S-K.
Item 9C. Disclosure Regarding Foreign Jurisdictions that Prevent Inspections
Not applicable.
PART III
Item 10. Directors, Executive Officers and Corporate Governance
Set forth below is information about the Company’s current executive officers and directors.
Information About Our Executive Officers
|
|
|
|
|
|
|
|
|
|
|
|
|
|
|
| Name, Current and Former Positions |
|
Age |
|
First Elected to
Current Position |
Matthew Kissner |
|
71 |
|
October 2023 |
President and Chief Executive Officer and Director |
|
|
|
|
July 2024 – Former Interim President and Chief Executive Officer, Wiley |
|
|
|
|
| May 2017 – Former Interim CEO, Group Executive and Board Chair, Wiley |
|
|
|
|
June 1999-Present – Vice Chair, Regional Plan Association |
|
|
|
|
|
|
|
|
|
Christopher Caridi |
|
59 |
|
September 2024 |
Senior Vice President, Chief Accounting Officer and Interim Chief Financial Officer |
|
|
|
|
October 2020 – SVP, Global Corporate Controller and Chief Accounting Officer, Wiley |
|
|
|
|
| June 2020 – SVP, Chief Accounting Officer and Controller, Teladoc Health, Inc. |
|
|
|
|
March 2017 – SVP, Chief Accounting Officer and Controller, Wiley |
|
|
|
|
|
|
|
|
|
Deirdre Silver |
|
57 |
|
February 2020 |
Executive Vice President and General Counsel |
|
|
|
|
August 2015 – Associate General Counsel, SVP of Legal, Research, Wiley |
|
|
|
|
November 2018-Present – Director, Copyright Clearance Center |
|
|
|
|
|
|
|
|
|
James Flynn |
|
54 |
|
September 2021 |
Executive Vice President and General Manager, Research & Learning |
|
|
|
|
June 2018 – Chief Product Officer, Research, Wiley |
|
|
|
|
May 2015 – SVP and Managing Director, Research Publishing, Wiley |
|
|
|
|
|
|
|
|
|
Andrew Weber |
|
58 |
|
November 2024 |
Executive Vice President, Technology & Operations |
|
|
|
|
November 2023 – SVP, Operations, Wiley |
|
|
|
|
July 2021 – SVP, Business Management & Operations, Wiley |
|
|
|
|
September 2020 – Global Chief Operating Officer, Macmillan Publishers |
|
|
|
|
|
|
|
|
|
Danielle McMahan |
|
50 |
|
November 2019 |
Executive Vice President and Chief People Officer |
|
|
|
|
September 2017 – Chief Human Resources Officer, York Risk Services |
|
|
|
|
June 2020-Present – Board Member, All In Together |
|
|
|
|
|
|
|
|
|
Kevin Monaco |
|
61 |
|
October 2018 |
| Senior Vice President, Treasurer and Tax |
|
|
|
|
| October 2009 – SVP, Finance, Treasurer, and Investor Relations, Coty Inc. |
|
|
|
|
2019-Present – Treasurer, The Wiley Foundation |
|
|
|
|
Information About Our Non-Employee Directors
|
|
|
|
|
|
|
Jesse C. Wiley
Chair of the Board
Director Since: 2012
|
Mr. Wiley, 54, is a 7th generation member of the Wiley family and brings to the Board deep knowledge and a passion for the contributions Wiley makes to research, learning and knowledge. His alignment with shareholder and stakeholder interests makes Mr. Wiley an important part of the Board’s governance processes, along with a majority of independent directors. Mr. Wiley has broad and deep experience in Wiley’s industries with partners and customers in the markets Wiley serves. He also brings in-depth knowledge of numerous businesses, functions and initiatives within Wiley, including in digital publishing and platforms and new product and business development, partnerships and global business and M&A. Mr. Wiley was elected Chair of the Board of Directors of Wiley in 2019, having served as a director since 2012. Prior to being elected as Chair, Mr. Wiley was an employee since 2003. Before becoming Chair, Mr. Wiley worked in Wiley’s Research division on business development including building partnerships with academic and professional societies, and in China. Previously he worked in corporate M&A and strategy development, on international business development, digital and new business initiatives, and product development. Prior to that, he worked as a marketer and editor of professional books and products. |
|
|
|
Mari J. Baker
Former Chief Executive Officer, PlayFirst, Inc.
Director Since: 2011
|
Ms. Baker, 60, has over 30 years of board service in public, private and non-profit environments. She is an experienced general manager and business leader, and has held a number of executive officer positions in public and private companies primarily in technology fields, including roles as Chief Executive Officer of PlayFirst, Inc. and Navigenics, Inc., Chief Operating Officer of Velti, plc (Nasdaq: VELT), President of BabyCenter, Inc., a Johnson and Johnson company (NYSE: JNJ), and SVP/General Manager at Intuit, Inc. (Nasdaq: INTU). She has also been involved in venture capital, higher education, and executive leadership communities, in various capacities, including serving on the Board of Trustees of Stanford University. Ms. Baker also currently serves on the board of Blue Shield of California, where she chairs the Audit Committee. |
|
|
|
David C. Dobson
Chief Executive Officer, Epiq Global
Director Since: 2017
|
Mr. Dobson, 62, has over 30 years of experience in transforming and building global technology and service organizations, as well as extensive experience in senior leadership positions. Mr. Dobson has been Chief Executive Officer of Epiq, a global provider of legal and business services, since 2019, and also serves on its board of directors. Previously, Mr. Dobson was the Chief Executive Officer of Digital River from 2013 to 2018 and served as Vice Chairman of the Digital River’s board of directors until 2019. From 2010 to 2012, Mr. Dobson served as Executive Vice President and Group Executive, Global Lines of Business, at CA Technologies. From 2009 to 2010, Mr. Dobson served as President of Pitney Bowes Management Services, Inc., a wholly owned subsidiary of Pitney Bowes, Inc. |
|
|
|
Brian O. Hemphill, Ph.D.
President of Old Dominion University (ODU)
Director Since: 2022
|
Dr. Hemphill, 55, has extensive executive leadership experience in academia, bringing insight into the needs and practices of the academic community critical for developing and innovating new business models in our key businesses. Dr. Hemphill has served as Old Dominion University’s (ODU) ninth president since 2021 and previously served as Radford University's seventh president from 2016 to 2021. Dr. Hemphill has also held senior roles at various educational institutions earlier in his career, including the University of Arkansas-Fayetteville, Northern Illinois University, and West Virginia State University. In his role as President of ODU, Dr. Hemphill serves on various boards and commissions. He also serves on the boards of Jefferson Science Associates, LLC and Preston Hollow Community Capital. |
|
|
|
Karen N. Madden, Ph.D.
Senior Vice President and Chief Technology Officer, MilliporeSigma
Director Since: 2025
|
Dr. Madden, 56, has extensive executive leadership experience in life science technology and innovation, bringing strategic vision to research and development in the pharmaceutical and biotech industries. Dr. Madden has served as Senior Vice President and Chief Technology Officer at MilliporeSigma, the U.S. and Canada Life Science business of Merck KGaA, Darmstadt, Germany since 2022. Previously, Dr. Madden served as Senior Vice President and Chief Innovation Officer at PerkinElmer from 2016 to 2022, and as their General Manager of Informatics from 2014 to 2016. In her role at MilliporeSigma, Dr. Madden shapes the Technology Roadmap and long-term R&D strategy, leads the Life Science Innovation Board, and serves as a member of the Life Science Executive Team responsible for the overall leadership and governance of the more than $9 billion Life Science Business. She also serves as the U.S. Country Speaker for Merck KGaA, Darmstadt, Germany, and sits on the boards of the Analytical, Life Science, and Diagnostics Association, and the New England Council. |
|
|
|
|
|
|
|
|
|
Raymond W. McDaniel, Jr.
Former Non-Executive Chairman, President and Chief Executive Officer, of the Moody’s Corporation
Director Since: 2005
|
Mr. McDaniel, 67, is a seasoned non-executive director, having served as the non-executive chairman of the board of directors of Moody’s Corporation from 2005 to 2012 and again from 2021 to 2023 and a member of the board from 2003 to 2023. Mr. McDaniel is also a global leader with extensive strategic and operational knowledge in a highly regulated financial services environment and experienced in implementing international business expansion, including the launch of new products. He previously served as the Chief Executive Officer of Moody's Corporation for over 15 years from 2005 through 2020, as well as held additional roles in senior leadership including as President and Chief Operating Officer of Moody’s Corporation. Mr. McDaniel serves on the board of directors of Raymond James Financial (NYSE: RJF) and as a Trustee on the Muhlenberg College Board. |
|
|
|
William J. Pesce
Retired President and Chief Executive Officer, John Wiley & Sons, Inc.
Director Since: 1998
|
Mr. Pesce, 74, has extensive experience with leading a global public company, strategic planning, financial planning and analysis, acquisitions and partnerships, and investor relations. In addition, through his active engagement in the academic community and investing in early-stage companies, he has exposure to innovative, technology-enabled business models. He has served as Wiley’s 10th President and Chief Executive Officer for 13 years from 1998 to 2011, when he retired after nearly 22 years. Mr. Pesce is a member of the Board of Trustees of William Paterson University. Mr. Pesce is also a benefactor and advisor to the Pesce Family Mentoring Institute at William Paterson University. He served on the Board of Overseers of New York University's Stern School of Business for 17 years until 2005. Mr. Pesce also launched Pesce Family Ventures, LLC in 2015 with the aim to invest in early-stage companies, particularly entities that leverage enabling technology to serve customers. |
|
|
|
Inder M. Singh
Former Chief Financial Officer & Executive Vice President of Arm Ltd.
Director Since: 2021
|
Mr. Singh, 66, has extensive finance and corporate management experience, as well as knowledge in the technology and infrastructure sectors in both developed and emerging markets having served as Executive Vice President and Chief Financial Officer of Arm Limited from 2019 to 2022. From 2016 to 2019, Mr. Singh served as Senior Vice President and Chief Financial Officer, and in 2016, as Chief Strategy and Marketing Officer, of Unisys Corp. Prior to that, Mr. Singh was a Managing Director at SunTrust Bank’s equities unit from 2013 to 2016, and a Senior Vice President in finance at Comcast Corporation from 2012 to 2013. Mr. Singh is currently a member of the board of directors of IonQ (NYSE: IONQ), Axelera AI, ICEYE, and the advisory board of Resonance. He is the chair of the audit committees of Axelera AI, ICEYE, IonQ, and Wiley. He has advised startups as a member of Columbia University’s Entrepreneurship Advisory Board and Engineering Development Council. He has also participated as a project advisor for the U.S. Department of Homeland Security and other agencies on national security and critical infrastructure matters. |
The following information will be included in the Company’s Proxy Statement for our 2025 Annual Meeting of Shareholders to be filed within 120 days of the Company’s fiscal year end of April 30, 2025 (2025 Proxy Statement) and is incorporated herein by reference.
•Additional information about our directors who are standing for reelection and any persons nominated to become directors of the Company is contained under the caption “Election of Director Nominees”.
•Information regarding compliance with Section 16(a) of the Securities Exchange Act of 1934 is incorporated herein by reference to the information set forth under the caption “Delinquent Section 16(a) Reports”.
•Information concerning the Company’s committees of the Board of Directors, including the audit committee and designated financial experts is contained under the captions “Report of the Audit Committee” and “Committees of the Board of Directors.”
•Information concerning the Company’s code of business conduct and ethics for directors, officers and employees, also known as the “Business Conduct and Ethics Policy,” the “Code of Ethics Policy for Senior Financial Officers” and the Company's “Corporate Governance Principles” are described under “Corporate Governance—Key Corporate Governance Documents.” All of these documents are publicly available on the Company’s Corporate Governance website at https://www.wiley.com/en-us/corporategovernance.
Item 11. Executive Compensation
The information required by this item will be included in the 2025 Proxy Statement under the headers “Directors’ Compensation,” “Compensation Committee Interlocks and Insider Participation,” and “Executive Compensation,” respectively, and is incorporated herein by reference.
Item 12. Security Ownership of Certain Beneficial Owners and Management and Related Stockholder Matters
The following information required in this item will be included under the “Ownership of Common Stock” section in the Company's 2025 Proxy Statement and is incorporated herein by reference.
•Information on the beneficial ownership reporting for the directors and executive officers is contained under the caption “Stock Ownership of Officers and Directors.”
•Information on the beneficial ownership reporting for all other shareholders that own 5% or more of the Company’s Class A or Class B Common Stock is contained under the caption “Stock Ownership of Certain Beneficial Owners.”
The following table summarizes the Company’s equity compensation plan information as of April 30, 2025:
|
|
|
|
|
|
|
|
|
|
|
|
|
|
|
|
|
|
|
|
|
| Plan Category |
|
Number of
Securities to Be
Issued Upon Exercise
of Outstanding Options,
Warrants and Rights (1)
|
|
Weighted Average
Exercise Price of
Outstanding Options,
Warrants and Rights |
|
Number of
Securities Remaining
Available for Future
Issuance Under Equity
Compensation Plans (2)
|
| Equity compensation plans approved by shareholders |
|
1,465,461 |
|
$ |
46.87 |
|
|
5,259,777 |
(1)This amount includes the following awards issued under the 2022 Plan and Prior Plans:
•249,935 shares issuable upon the exercise of outstanding stock options with a weighted average exercise price of $46.87.
•1,215,526 non-vested performance-based and other restricted stock awards. Since these awards have no exercise price, they are not included in the weighted average exercise price calculation.
(2)Per the terms of the 2022 Plan, a total of 6,200,000 shares shall be authorized for awards granted under the 2022 Plan, less one (1) share for every one (1) share that was subject to an award granted under a Prior Plan after July 13, 2022 and prior to the approval of the 2022 Plan on September 29, 2022 (Effective Date). In addition, after July 13, 2022, if any shares subject to an award under any Prior Plans are forfeited or an award under any Prior Plans expires or is settled for cash, then in each such case the shares subject to such award or award under any Prior Plan shall be added to the shares available for awards under the Plan, on a one-for-one-basis. After the Effective Date of the 2022 Plan, no awards may be granted under any Prior Plan.
All of the Company’s equity compensation plans are approved by shareholders.
Item 13. Certain Relationships and Related Transactions, and Director Independence
Information on related party transactions and the policies and procedures for reviewing and approving related party transactions will be contained under the caption “Transactions with Related Persons” within the “Corporate Governance” section of the 2025 Proxy Statement and are incorporated herein by reference.
Information on director independence will be contained under the caption “Director Independence” within the “Corporate Governance” section of the 2025 Proxy Statement and is incorporated herein by reference.
Item 14. Principal Accountant Fees and Services
Our independent registered public accounting firm is PricewaterhouseCoopers LLP, New York, NY, Auditor ID: 238
Information required by this item will be contained in the 2025 Proxy Statement under the captions “Audit Committee Matters" and “Audit Committee Report” and is incorporated herein by reference.
PART IV
Item 15. Exhibits and Financial Statement Schedules
(a) Documents filed as a part of this Annual Report on Form 10-K:
(1) Financial Statements
See Index to Consolidated Financial Statements and Schedule of this Annual Report on Form 10-K in Part II Item 8.
(2) Financial Statement Schedule
See Schedule II - Valuation and Qualifying Accounts and Reserves - Years Ended April 30, 2025, 2024, and 2023 of this Annual Report on Form 10-K. The other schedules are omitted as they are not applicable, or the amounts involved are not material.
(3) Exhibits
|
|
|
|
|
|
| Articles of Incorporation and By-Laws |
|
Restated Certificate of Incorporation of John Wiley & Sons, Inc. February 26, 2025 |
|
|
| 3.2 |
|
|
|
| Instruments Defining the Rights of Security Holders, Including Indentures |
| 4.1 |
|
|
|
Material Contracts |
|
| 10.1 |
|
|
|
| 10.2 |
|
|
|
| 10.3 |
|
|
|
| 10.4 |
|
|
|
|
|
|
|
|
|
| 10.5 |
|
|
|
| 10.6 |
|
|
|
| 10.7 |
|
|
|
| 10.8 |
|
|
|
| 10.9 |
|
|
|
| 10.11 |
|
|
|
| 10.12 |
|
|
|
| 10.13 |
|
|
|
| 10.14 |
|
|
|
| 10.15 |
|
|
|
| 10.16 |
|
|
|
| 10.17 |
|
|
|
| 10.18 |
|
|
|
| 10.19 |
Second Amendment to the Third Amended and Restated Credit Agreement, dated as of November 30, 2022, among John Wiley & Sons, Inc., John Wiley & Sons Limited, J Wiley Limited, Wiley Europe Investment Holdings Limited, and Wiley-VCH GmbH, as borrowers, Bank of America, N.A., as Administrative Agent, L/C Issuer and Swing Line Lender, and the other Lenders party thereto, which amends the Third Amended and Restated Credit Agreement dated as of May 30, 2019 (incorporated by reference to the Company’s Report on Form 8-K dated as of December 6, 2022). |
|
|
|
|
|
|
|
|
| 10.20 |
Third Amended and Restated Credit Agreement, among John Wiley & Sons, Inc., John Wiley & Sons Limited, J Wiley Limited, Wiley Europe Investment Holdings Limited, and Wiley-VCH GmbH , as borrowers, Bank of America, N.A., as Administrative Agent, L/C Issuer and Swing Line Lender, and the other Lenders party thereto, which amends the Third Amended and Restated Credit Agreement dated as of May 30, 2019 (incorporated by reference to the Company’s Report on Form 8-K dated as December 6, 2022). |
|
|
| 10.21 |
|
|
|
| 10.22 |
|
|
|
| 10.23 |
|
|
|
| 10.24 |
|
|
|
| 10.25 |
|
|
|
| 10.26 |
|
|
|
| 10.27 |
|
|
|
|
Employment Agreement dated September 24, 2020 between Christopher F. Caridi and the Company. ● |
|
|
| 10.29 |
|
|
|
|
Separation and Release Agreement, dated September 16, 2024 between Christina Van Tassell and the Company. |
|
|
|
Separation and Release Agreement, dated December 17, 2024 between Aref Matin and the Company. |
|
|
| 10.32 |
|
|
|
| 10.33 |
|
|
|
| 10.34 |
|
|
|
| 10.35 |
|
|
|
|
|
|
|
|
|
| 10.36 |
|
|
|
| 10.37 |
|
|
|
| 10.38 |
|
|
|
| 10.39 |
|
|
|
| 10.40 |
|
|
|
| 10.41 |
|
|
|
| 10.42 |
|
|
|
| 10.43 |
|
|
|
| 10.44 |
|
|
|
| 10.45 |
|
|
|
| 10.45 |
|
|
|
Insider trading policies and procedures. |
|
John Wiley & Sons, Inc. Insider Trading Policy dated March 21, 2025. |
|
|
| Subsidiaries |
|
List of Subsidiaries of the Company. |
|
|
| Consent of Independent Registered Public Accounting Firm |
|
Consent of PricewaterhouseCoopers LLP. |
|
Consent of KPMG LLP. |
|
|
| Certifications Pursuant to Section 302 of the Sarbanes-Oxley Act of 2002 |
|
Certification of Chief Executive Officer pursuant to Section 302 of the Sarbanes-Oxley Act of 2002. |
|
|
|
Certification of Chief Financial Officer pursuant to Section 302 of the Sarbanes-Oxley Act of 2002. |
|
|
|
|
|
|
|
|
| Certifications Pursuant to Section 906 of the Sarbanes-Oxley Act of 2002 |
|
Certification of Chief Executive Officer pursuant to 18 U.S.C. Section 1350, as adopted pursuant to Section 906 of the Sarbanes-Oxley Act of 2002. |
|
|
|
Certification of Chief Financial Officer pursuant to 18 U.S.C. Section 1350, as adopted pursuant to Section 906 of the Sarbanes-Oxley Act of 2002. |
|
|
Clawback Policy |
| 97.1 |
|
|
|
| Inline XBRL |
| 101.INS* |
Inline XBRL Instance Document (the instance document does not appear in the Interactive Data File because its XBRL tags are embedded within the Inline XBRL document). |
|
|
| 101.SCH* |
Inline XBRL Taxonomy Extension Schema Document. |
|
|
| 101.CAL* |
Inline XBRL Taxonomy Extension Calculation Linkbase Document. |
|
|
| 101.DEF* |
Inline XBRL Taxonomy Extension Definition Linkbase Document. |
|
|
| 101.LAB* |
Inline XBRL Taxonomy Extension Label Linkbase Document. |
|
|
| 101.PRE* |
Inline XBRL Taxonomy Extension Presentation Linkbase Document. |
|
|
| 104 |
Cover Page Interactive Data File (formatted as inline XBRL and contained in Exhibit 101). |
*Filed herewith
** Furnished herewith
● Indicates management compensatory plan, contract, or arrangement
Item 16. Form 10-K Summary
Not applicable.
(2) Financial Statement Schedule
Schedule II
JOHN WILEY & SONS, INC. AND SUBSIDIARIES
VALUATION AND QUALIFYING ACCOUNTS
FOR THE YEARS ENDED APRIL 30, 2025, 2024, AND 2023
(Dollars in thousands)
|
|
|
|
|
|
|
|
|
|
|
|
|
|
|
|
|
|
|
|
|
|
|
|
|
|
|
| Description |
|
Balance at
Beginning
of Period |
|
Charged to
Expenses |
|
Deductions
From Reserves
and Other(1)
|
|
Balance at
End of Period |
| Year Ended April 30, 2025 |
|
|
|
|
|
|
|
|
Allowance for sales returns(3) |
|
$ |
14,448 |
|
|
$ |
12,529 |
|
|
$ |
17,993 |
|
|
$ |
8,984 |
|
| Allowance for doubtful accounts |
|
$ |
17,297 |
|
|
$ |
839 |
|
|
$ |
4,964 |
|
|
$ |
13,172 |
|
| Allowance for inventory obsolescence |
|
$ |
11,919 |
|
|
$ |
4,705 |
|
|
$ |
5,502 |
|
|
$ |
11,122 |
|
Valuation allowance on deferred tax assets(2) |
|
$ |
53,498 |
|
|
$ |
20,816 |
|
|
$ |
(2,995) |
|
|
$ |
77,309 |
|
| Year Ended April 30, 2024 |
|
|
|
|
|
|
|
|
Allowance for sales returns(3) |
|
$ |
14,419 |
|
|
$ |
21,158 |
|
|
$ |
21,129 |
|
|
$ |
14,448 |
|
| Allowance for doubtful accounts |
|
$ |
18,662 |
|
|
$ |
3,844 |
|
|
$ |
5,209 |
|
|
$ |
17,297 |
|
| Allowance for inventory obsolescence |
|
$ |
12,990 |
|
|
$ |
5,906 |
|
|
$ |
6,977 |
|
|
$ |
11,919 |
|
Valuation allowance on deferred tax assets(2) |
|
$ |
27,448 |
|
|
$ |
24,620 |
|
|
$ |
(1,430) |
|
|
$ |
53,498 |
|
| Year Ended April 30, 2023 |
|
|
|
|
|
|
|
|
Allowance for sales returns(3) |
|
$ |
19,422 |
|
|
$ |
24,439 |
|
|
$ |
29,442 |
|
|
$ |
14,419 |
|
| Allowance for doubtful accounts |
|
$ |
21,221 |
|
|
$ |
347 |
|
|
$ |
2,906 |
|
|
$ |
18,662 |
|
| Allowance for inventory obsolescence |
|
$ |
11,219 |
|
|
$ |
7,222 |
|
|
$ |
5,451 |
|
|
$ |
12,990 |
|
Valuation allowance on deferred tax assets(2) |
|
$ |
30,000 |
|
|
$ |
(4,037) |
|
|
$ |
(1,485) |
|
|
$ |
27,448 |
|
|
|
|
|
|
|
(1) |
Deductions From Reserves and Other for the years ended April 30, 2025, 2024, and 2023 include foreign exchange translation adjustments. Included in Allowance for doubtful accounts are accounts written off, less recoveries as well as amounts reclassified as held-for-sale or sold as of April 30, 2024. Included in Allowance for inventory obsolescence are items removed from inventory. |
|
|
|
|
|
|
(2) |
Included in Valuation allowance on deferred tax assets for the years ended April 30, 2025, 2024, and 2023 are valuation allowances related to, and required with respect to, foreign tax credits generated by tax reform enacted in December 2017. In connection with a 5-year loss carryback and a subsequent audit, certain foreign tax credits requiring a valuation allowance were reinstated.
In fiscal year 2024, due to temporary differences in the US, our deferred taxes reversed from a net deferred tax liability position to a net deferred tax asset position. Due to losses in the US resulting from impairments, restructuring, and acceleration of amortization expense on capitalized software, we concluded it was more-likely-than-not that all or a portion of our deferred tax asset may not be realized. As a result, we established a valuation allowance of $30.2 million. During fiscal year 2025 we increased this valuation allowance by $26.0 million, because of an increase in the US net deferred tax asset attributable primarily to interest expense disallowance and intangible and fixed assets.
|
|
|
|
|
|
|
(3) |
Allowance for sales returns represents anticipated returns net of a recovery of inventory and royalty costs. The provision is reported as a reduction of gross sales to arrive at revenue and the reserve balance is reported as an increase in Contract liabilities with a corresponding increase in Inventories, net and a reduction in Accrued royalties for the years ended April 30, 2025, 2024, and 2023. |
SIGNATURES
Pursuant to the requirements of Section 13 or 15(d) of the Securities Exchange Act of 1934, the Company has duly caused this report to be signed on its behalf by the undersigned, thereunto duly authorized.
|
|
|
|
|
|
|
|
|
|
|
JOHN WILEY & SONS, INC. |
|
|
(Company) |
|
|
|
Dated: June 25, 2025 |
By: |
/s/ Matthew S. Kissner |
|
|
Matthew S. Kissner |
|
|
President and Chief Executive Officer |
Pursuant to the requirements of the Securities Exchange Act of 1934, this report has been signed below by the following persons on behalf of the Company and in the capacities and on the dates indicated.
|
|
|
|
|
|
|
|
|
|
|
|
|
|
|
| Signatures |
|
Titles |
|
Dated |
|
|
|
|
|
| /s/ Matthew S. Kissner |
|
President and Chief Executive Officer and Director |
|
June 25, 2025 |
| Matthew S. Kissner |
|
|
|
|
|
|
|
|
| /s/ Christopher F. Caridi |
|
Senior Vice President, Chief Accounting Officer and Interim Chief Financial Officer |
|
June 25, 2025 |
| Christopher F. Caridi |
|
|
|
|
|
|
|
|
| /s/ Jesse C. Wiley |
|
Chairman of the Board |
|
June 25, 2025 |
| Jesse C. Wiley |
|
|
|
|
|
|
|
|
|
| /s/ Mari J. Baker |
|
Director |
|
June 25, 2025 |
| Mari J. Baker |
|
|
|
|
|
|
|
|
|
| /s/ David C. Dobson |
|
Director |
|
June 25, 2025 |
| David C. Dobson |
|
|
|
|
|
|
|
|
|
| /s/ Brian O. Hemphill |
|
Director |
|
June 25, 2025 |
| Brian O. Hemphill |
|
|
|
|
|
|
|
|
|
/s/ Karen N. Madden |
|
Director |
|
June 25, 2025 |
Karen N. Madden |
|
|
|
|
|
|
|
|
|
| /s/ Raymond W. McDaniel, Jr. |
|
Director |
|
June 25, 2025 |
| Raymond W. McDaniel, Jr. |
|
|
|
|
|
|
|
|
|
| /s/ William J. Pesce |
|
Director |
|
June 25, 2025 |
| William J. Pesce |
|
|
|
|
|
|
|
|
|
| /s/ Inder Singh |
|
Director |
|
June 25, 2025 |
| Inder Singh |
|
|
|
|
EX-3.1
2
exhibit31-restatedcertif.htm
EX-3.1
exhibit31-restatedcertif

Filed with the NYS Department of State on 03/18/2025 Filing Number: 250407003456 DOS ID: 25324

Filed with the NYS Department of State on 03/18/2025 Filing Number: 250407003456 DOS ID: 25324

Filed with the NYS Department of State on 03/18/2025 Filing Number: 250407003456 DOS ID: 25324

Filed with the NYS Department of State on 03/18/2025 Filing Number: 250407003456 DOS ID: 25324

Filed with the NYS Department of State on 03/18/2025 Filing Number: 250407003456 DOS ID: 25324

Filed with the NYS Department of State on 03/18/2025 Filing Number: 250407003456 DOS ID: 25324

Filed with the NYS Department of State on 03/18/2025 Filing Number: 250407003456 DOS ID: 25324

Filed with the NYS Department of State on 03/18/2025 Filing Number: 250407003456 DOS ID: 25324

Filed with the NYS Department of State on 03/18/2025 Filing Number: 250407003456 DOS ID: 25324
EX-10.28
3
exhibit1028-christopherc.htm
EX-10.28
exhibit1028-christopherc

September 24, 2020 Christopher Caridi Dear Chris, I am very pleased to confirm our offer of employment with John Wiley & Sons, Inc. as SVP, Global Corporate Controller. This offer is contingent upon a satisfactory background check, your attestation that you are not bound by any contractual restrictions or conflicting obligations and your execution of the attached Agreements and Restrictive Covenants. By signing this offer letter, you confirm that your employment with Wiley will not breach any agreement you have with any third party. As discussed, your employment date will be on or before October 19 (“Start Date”). Your salary will be $363,875 annually, less applicable taxes and withholding. You will be eligible to participate in the Wiley Annual Incentive Plan, with a target incentive equal to 50% of your base salary. For fiscal year 2021, which will begin on May 1, 2020, you will be eligible for full participation. Payout will be based on individual and company performance, in accordance with plan provisions. In the event you are required to pay your current employer for you sign on, you will receive a one-time sign-on bonus in the amount of $175,752, subject to taxes and other withholding, payable 30 days after your Start Date. If you leave Wiley voluntarily within one year of your Start Date, you will be required to reimburse Wiley for the full amount of your sign-on bonus. Wiley reserves the right to deduct from your last paycheck, or any payments due you at separation, any debts you owe the Company as permitted by state law. Beginning in fiscal year 2021, you will be eligible to receive annual equity grants under the Business Officer Equity Program, with a target long-term incentive equal to 50% of your base salary. Your first grants will not be prorated. We will recommend to the Executive Compensation and Development Committee (ECDC) new grants that will restore your performance and restricted share units granted under the FY18 through FY21 Business Officer Equity Program, as follows: • Performance share units: o Earned for the FY18-20 cycle (granted in June 2017) were payable at 72%. On a target number of 2370 performance share units, your 1706 earned shares will vest on October 31, 2020 o Targeted for the FY19-21 and FY20-22 cycles will be 2073 and 2857, respectively. Shares earned for these cycles will be payable on June 30 following the end of each cycle o Targeted for the FY21-23 cycle will be granted in December, following approval of the financial targets for this cycle 111 River Street, Hoboken, NJ 07030-5774, U.S. T +1 201 748 6000 F +1 201 748 6088 www.wiley.com

111 River Street, Hoboken, NJ 07030-5774, U.S. T +1 201 748 6000 F +1 201 748 6088 www.wiley.com • Restricted share units: o The remaining 395 shares granted in June 2017 will vest on April 30, 2021 o The remaining 577 shares granted in June 2018 will vest as follows: 288 on April 30, 2021 and 289 on April 30, 2022 o The remaining 1428 shares granted in June 2019 will vest as follows: 476 on April 30, 2021, 476 on April 30, 2022 and 476 on April 30, 2023 o To be granted for FY21 are 1803 shares, and will vest 25% per year on April 30, 2021-24 Equity awards under the Business Officer Equity Program are granted based upon the recommendation of the EVP and CFO; and subject to the approval of the President and CEO and the Executive Compensation and Development Committee (ECDC) of the Board of Directors. All grants and payouts under the Business Officer Equity Program are subject to and in accordance with plan terms and conditions. All compensation is subject to withholding and payroll taxes. You will be eligible to participate in Wiley's benefits plans in accordance with Company policy. While we look forward to a mutually beneficial relationship, your employment is "at-will." This offer letter is not a contract and does not guarantee any employment duration, terms, or conditions. Should your employment be involuntarily terminated without cause, you will receive as severance twelve months of base salary. In the event your employment is involuntarily terminated without cause or due to constructive discharge within 24 months of a change in control, you will receive as severance twelve months of base salary and your target annual incentive. In a severance eligible event under this paragraph, you will also receive continued health insurance for the number of months of the cash severance period. All severance described in this paragraph is payable under the Executive Severance Plan, and subject to your signing a release and waiver of claims in a form provided by the Company, and your compliance with the restrictive covenants included in the attached document, which apply as material terms of your employment in any event. For the avoidance of doubt, you will be entitled to any applicable benefits under the Executive Severance Plan, the relevant equity plan or grant agreement to the extent not covered in or greater than the benefits set forth in this letter. Chris, I really look forward to working with you again! Please sign and return this letter, and the Agreements and Restrictive Covenants document, to me at shyland@wiley.com by September 30. Sincerely, Acknowledged and Agreed: Suzanne Hyland ________________ _ VP, Rewards Christopher Caridi Date September 29, 2020

111 River Street, Hoboken, NJ 07030-5774, U.S. T +1 201 748 6000 F +1 201 748 6088 www.wiley.com Agreements and Restrictive Covenants Intellectual Property Rights You hereby confirm that inventions, trade secrets and other work product produced by you or with your participation during the term of your employment with Wiley, in any form (collectively the “Work Product”) shall be deemed work for hire on behalf of Wiley and you agree that Wiley shall be the sole owner of the Work Product, and all underlying rights therein, in all media now known or hereinafter devised, throughout the universe and in perpetuity without any further obligations to you. If the Work Product, or any portion thereof, is deemed not to be Work for Hire, you hereby irrevocably convey, transfer and assign to Wiley, all rights, in all media now known or hereinafter devised, throughout the universe and in perpetuity, in and to the Work Product, including without limitation, all of your right, title and interest in the copyrights and patents thereto, free and clear of all liens and other encumbrances. You shall make such applications, sign such papers (including without limitation assignments), take all rightful oaths, and perform all acts as may be reasonably requested, during or after the term of your employment, with respect to evidencing ownership of the Work Product. You shall assist Wiley to obtain any registrations covering Work Product assigned hereunder to Wiley and you hereby irrevocably designate and appoint Wiley and its duly authorized officers and agents as your attorney in fact, to act for and in your behalf and stead, to execute and further the prosecution and issuance of registrations thereon with the same legal force and effect as if executed by you. Protection of Confidential Information You acknowledge that during the course of employment with Wiley, you may be privy to certain confidential information which may be communicated to you verbally or in writing, relating to Wiley, its information, sales and marketing plans, business plans and information, products, current and potential business partners, customers or other third parties (collectively, “Third Parties”), or other information which is not known to the public, and which may include material developed by you. You acknowledge that all such information is and shall be deemed to be “Confidential Information” belonging to Wiley or Third Parties. You agree to protect such Confidential Information from disclosure with the same degree of care that you normally use to protect your own confidential information, but not less than reasonable care, shall not divulge any such Confidential Information to anyone and shall not make use of the same without prior written consent of Wiley. All Confidential Information is and shall remain the property of Wiley (or the applicable Third Party), and you shall not acquire any rights therein. At the conclusion of your employment by Wiley, you shall promptly return all Wiley materials, including Confidential Information, in your possession and shall not retain any copies of any such material. In addition, both parties agree that this agreement is confidential and that neither of us shall disclose its contents to others without the other’s prior approval. Business Opportunities Should your role with Wiley expose you to business opportunities that might be attractive to Wiley as well as to others (including yourself), you agree to give Wiley consideration of any opportunity before you allow others to consider the opportunity.

111 River Street, Hoboken, NJ 07030-5774, U.S. T +1 201 748 6000 F +1 201 748 6088 www.wiley.com Non-Compete, Non-Solicitation During your employment with Wiley, you have and will become familiar with Wiley’s trade secrets, information related to the operations, products and services of the Wiley, and with other Confidential Information concerning Wiley, its subsidiaries, affiliates, and companies acquired by Wiley. Therefore, during your employment period and for a period of one year thereafter, you agree that you shall not directly or indirectly own any interest in, manage, control, participate in, consult with, or render services for any Competing Business. A “Competing Business” is any person or entity that (i) conducts or is planning to conduct a business similar to and/or in competition with any Wiley business unit to which you rendered services during the two year period prior to the date at issue or (ii) creates, develops, distributes, produces, offers for sale or sells a product or service that can be used as a substitute for, or is generally intended to satisfy the same customer needs for, any one or more products or services created, developed, distributed, produced or offered for sale or sold by the Wiley business unit to which you rendered services during the two year period prior to the date at issue. In the event that you have an enterprise role at Wiley, you will be deemed to render services to all Wiley business units. During your employment and for a period of one year thereafter, you agree that you shall not directly, or indirectly through another entity, (i) induce or attempt to induce any employee of Wiley or any affiliate to leave the employ of Wiley or such affiliate, or in any way interfere with the relationship between Wiley or any affiliate and any employee thereof, (ii) hire any person who was an employee of Wiley or any affiliate at any time during your employment with Wiley or (iii) induce or attempt to induce any customer, supplier, licensee, licensor, franchisee or other business relation of Wiley or any affiliate to cease doing business with Wiley or such affiliate, or in any way interfere with the relationship between any such customer, supplier, licensee, licensor, franchisee or business relation and Wiley or any affiliate (including, without limitation, making any negative statements or communications about Wiley or its affiliates). You agree that during the term of your employment with Wiley, you will devote full time to the business of Wiley and will not engage in any activity that conflicts with your obligations to Wiley. Representations You hereby represent and warrant that: (a) you have the right to enter into this Agreement, to grant the rights granted in this Agreement and to perform fully all their obligations under this Agreement. No consent of any other person or entity is necessary for you to enter into and fully perform this Agreement and you have not done and shall not do any act and have not made and shall not make any grant, assignment or agreement which shall or would likely conflict or interfere with the complete enjoyment of all of Wiley’s rights under this Agreement; (b) the material contributed by you, including without limitation, any Work Product, (i) shall not violate or infringe in any way upon the rights of others, including, without limitation, any copyright, patent, trademark or other proprietary right or the right of privacy or publicity, (ii) shall not contain any libelous, obscene or other unlawful matter, and (iii) shall not violate any applicable law.

111 River Street, Hoboken, NJ 07030-5774, U.S. T +1 201 748 6000 F +1 201 748 6088 www.wiley.com Modification It is the intention of the parties to make these restrictive covenants and agreements binding to the fullest extent permitted under existing applicable laws. In the event that any part of any of these restrictive covenants and agreements is determined by a court of law of competent jurisdiction to be overly broad or too long in duration or otherwise objectionable, thereby making the covenants unenforceable, the parties hereto agree, and it is their desire, that such a court shall substitute a reasonable judicial enforceable limitation in place of the offensive part of the covenant, and that as so modified the covenant shall be as fully enforceable as if set forth herein by the parties themselves in the modified form. General This document, those documents expressly referred to herein and other documents of even date herewith embody the complete agreement and understanding among the parties and supersede and preempt any prior understandings, agreements or representations by or among the parties, written or oral, which may have related to the subject matter hereof in any way. This document may be signed in one or more counterparts, each of which once signed shall be deemed to be an original. All such counterparts together shall constitute one and the same instrument. By __________________________ Suzanne Hyland Christopher Caridi Date VP, Rewards September 29, 2020
EX-10.30
4
exhibit1030-christinavan.htm
EX-10.30
exhibit1030-christinavan

1 SEPARATION AND RELEASE AGREEMENT This Separation and Release Agreement (“Agreement”) is made this 16th day of September 2024, between John Wiley & Sons (“Company” or “Wiley”), on behalf of itself and its predecessors, parents, successors, divisions, assigns, affiliates and subsidiaries and You, Christina Van Tassell, Your heirs, executors, administrators, successors and assigns (“You” or “Employee”). When signed by You, this Agreement will confirm the terms of Your separation from the Company and this Agreement will constitute a release of all claims. You have been employed by Wiley as Executive Vice President and Chief Financial Officer and based out of the Company’s Hoboken, New Jersey Corporate Headquarters. Since Your employment relationship with Wiley is ending, the Company has offered You benefits as set forth in this Agreement, certain of which are greater than what You are entitled to otherwise receive, and You have decided to accept the Company’s offer. In consideration of the monies, mutual promises, mutual covenants and terms contained in this Agreement, the Parties agree as follows: 1. Employment Termination: Your last day of active employment with the Company will be September 18, 2024 (“Last Working Date”), and Your employment with the Company will terminate on October 1, 2024 (“Separation Date”). Effective as of the Last Working Date, You shall have resigned from all positions with the Company and its subsidiaries and affiliates, including any officer positions. From and after the Separation Date, You shall not hold any office, title or fiduciary role with the Company. 2. Separation Benefits: In exchange for the promises and releases in this Agreement, and provided You do not revoke the Agreement as permitted in Section 7 below, the Company will provide You with the following benefits and payments: A. Severance: Subject to the terms of this Agreement, You will receive severance equal to 12 months of Your current base salary rate payable in a lump sum in the amount of $650,000.00. Provided that You are in compliance with the terms of this Agreement, Your severance will be paid in the pay cycle following the Effective Date of this Agreement. B. Health, Life, AD&D and Disability Insurance Benefits: Your group benefits coverage will cease at the end of the month of Your Separation Date. Your long-term disability (LTD) insurance coverage will cease on Your Separation Date (paragraph 1). If You timely and properly elect COBRA continuation coverage under the Company’s group health plan, the Company will pay the COBRA premiums for the level of medical dental and vision benefits that are in effect prior to Your last day of employment for 12 months, or until You become covered by another health plan, whichever is sooner. This benefit will be credited against the 18-month extension required by COBRA. Thereafter, Your right to continued coverage will be governed by COBRA and You shall be responsible for COBRA premiums for any remainder of the applicable COBRA continuation period. The company paid benefits excludes flexible spending accounts, life, AD&D, and disability insurance benefits. C. Equity Awards: In accordance with the terms of Your grant agreements: A. You are eligible for prorated participation through Your Separation Date in the FY23-25 and FY24-26 performance cycles, with payout of performance share units based on actual

2 performance at the end of the cycles. Your prorated target numbers of performance share units for these cycles are 12,849 and 12,120, respectively. B. Vested stock options may be exercised for up to ninety (90) days following Your Separation Date. C. All other performance share units, restricted share units and stock options that are not vested on Your Separation Date are forfeited and cancelled. Your UBS One Source account will remain active following Your Separation Date. You should ensure that UBS has a personal email address for You by contacting the UBS call center at (866) 592-7678, or by signing onto Your One Source account at https://onesource.ubs.com/wly. D. Executive Annual Incentive Plan: Per the terms and conditions of the Wiley Annual Incentive Plan, you will not be eligible to receive an incentive payment for FY25. E. You will not be entitled to any other compensation or benefits not provided in this Agreement. You understand, acknowledge and agree that the payment of benefits described in this Agreement, including payments and benefits described in Paragraph 2 herein, are conditioned upon Your execution of this Agreement. You acknowledge and agree that the sums and benefits to be provided under the terms of the Agreement are in addition to those benefits to which You are otherwise entitled. You may revoke this Agreement within seven (7) days after signing it by giving written notice to the Company. To be effective, this revocation must be received by the close of business on the 7th calendar day after You sign the Agreement. If You revoke this Agreement You understand that You will not receive the benefits that are conditioned upon Your execution of the Agreement. This Agreement will not become effective or enforceable unless and until the seven (7)-day revocation period has expired without You revoking it. 3. Deferred Compensation Plan: Under the terms of the Deferred Compensation Plan Your termination will be considered Separation of Service. The Deferred Compensation benefit is subject to a six-month delay and Your first distribution will be made no less than seven (7) months following Your Separation Date and payments will be made according to Your plan elections. 4. Complete Release and Waiver of Claims: You are aware of Your legal rights concerning Your employment with the Company. In exchange for the promises and payments of the Company set forth in paragraph 2, and other consideration as provided herein, to which You otherwise would not be entitled, You agree to irrevocably and unconditionally release (i.e. give up) any and all claims You may now have against the Company and You agree not to sue the Company and any currently or previously-affiliated companies, parent companies, successors or predecessors, and their officers, directors, agents and employees (collectively, the “Releasees”), arising out of the employment relationship between You and the Company (“the “Release’). A. This Release includes any and all past and present claims, demands, obligations, actions, causes of action, damages, costs, debts, liabilities, expenses and compensation of any nature whatsoever, whether known or unknown, foreseen or unforeseen, suspected or unsuspected that You as Releasor had, now have or in the future may or could have against Releasees, including but not limited to those arising under any and all applicable laws, in connection with any rights, claims in law or equity for wrongful or abusive discharge, whistleblowing, discriminatory, or retaliatory treatment under any local, state or federal law, including but not limited to, the Family and Medical Leave Act, the Age Discrimination in Employment Act of 1967, (“ADEA”), the Civil Rights Acts of 1866, 1964 and 1991, the Employee Retirement Income Security Act of 1974, the Older Worker Benefits Protection Act of 1990, the Worker Adjustment Retraining and Notification Act, the Americans with Disabilities Act, the Fair Labor Standards Act, The New York State Human Rights Law, the New York Labor Law, the

3 New York City Human Rights Law, the New York City Paid Safe and Sick Leave Law, The New Jersey Law Against Discrimination, The New Jersey Conscientious Employee Protection Act California Fair Employment and Housing Act, the New Jersey Wage and Hour Law, Colorado Anti-Discrimination Act, Florida Civil Rights Act, Illinois Human Rights Act, Indiana Civil Rights Law, Massachusetts Fair Employment Practices Law, the New York State Human Rights Law, the New York City Human Rights Law, the Worker Adjustment and Retraining Notification Act, the Immigration Reform and Control Act of 1986, the Occupational Safety and Health Act, or any other federal, state, or local statute, law, ordinance, or regulation that may be legally waived; any claims for personal injury, defamation, mental anguish, breach of contract, injury to health and personal reputation and any other claim of any nature whatsoever relating to or in connection with Your employment with Wiley or its subsidiaries, the termination of Your employment, rights, payments and benefits under any employment arrangements, or agreements, any qualified or nonqualified plans, vacation pay, health and other benefits except as otherwise provided You in this Agreement, and excluding any claims by You to enforce Your rights under this Agreement. The provisions of any law that provide in substance that a release shall not extend to unknown or unsuspected claims at the time of execution of this release are, to the extent permitted by law, hereby waived. B. Specific Release of Age Discrimination Claims: You understand and agree that, among other possible rights or claims herein waived or released by You, (i) You are, in particular, waiving rights and claims for age discrimination, including claims under state, federal law, and those based on Age Discrimination in Employment Act (“ADEA”) in exchange for the payments and other consideration described above that are not otherwise due You: and (ii) You are not waiving rights or claims for age discrimination that may arise after the effective date of this Agreement. C. Nothing in this Release and Agreement shall preclude You from bringing a charge or suit to challenge the validity or enforceability of this Agreement under the Age Discrimination in Employment Act, as amended by the Older Worker’s Benefit Protection Act. D. You acknowledge and agree that by virtue of the foregoing, You have waived any relief available for Yourself (including without limitation, monetary damages, equitable relief and reinstatement) under any of the claims and/or causes of action waived in this Agreement. Therefore, You agree that You will not accept any award or settlement from any source or proceeding (including but not limited to any proceeding brought by any other person or by any government agency) with respect to any claim or right waived in this Agreement. E. Nothing in this Agreement shall be a waiver of: (i) any claim for failure to provide vested benefits under an employee benefit or equity plan sponsored by Company, to which you are legally entitled, if any; (ii) claims for enforcement of this Agreement; (iii) claims that may arise after the Effective Date of this Agreement; or (iv) any claims that cannot be waived by law; (v) any claim you have to statutory, contractual or common law indemnification or advancement and/or under applicable insurance policies of the Company; or (vi) your right to file a charge with or participate in or provide information in connection with any investigation or proceeding conducted by the U.S. Equal Employment Opportunity Commission, Securities and Exchange Commission (SEC) or other government agency or self-regulatory body, subject to the limitations in sub-Paragraph (D) above. F. Covenant Not To Sue Company: You shall not file any suit, claim or complaint in a court of law against Releasees arising out of, or relating to, Your employment with Company, or employment decisions made by Company. You and the Company acknowledge and agree that this covenant not to file any suit, claim or complaint is an essential and material part of this Agreement and that without its inclusion, this Agreement would not have been reached by the parties.

4 5. Acknowledgements & Reimbursements: You acknowledge that You have received all leave (paid or unpaid), compensation, wages, bonuses, commissions, and/or benefits to which You may be entitled as of the Effective Date of this Agreement and that no other leave (paid or unpaid), compensation, wages, bonuses, commissions and/or benefits are due to You, except as provided in this Agreement. You furthermore affirm that You have no known workplace injuries or occupational diseases. You and the Company expressly consent that this Agreement shall be given full force and effect according to each and all of its terms and provisions. You acknowledge and agree that any and all expenses requiring reimbursement under the Executive Perquisites Policy will be properly and timely submitted on or before September 20, 2024. The Company agrees to pay your reasonable legal fees incurred in connection with the negotiation of this Agreement in an amount not to exceed $7,000 upon submission of a valid invoice. 6. Post-Termination Obligations and Restrictive Covenants A. Acknowledgement: You understand and acknowledge that by virtue of Your employment with the Company, You had access to and knowledge of Confidential Information, were in a position of trust and confidence with the Company, and benefitted from the Company’s goodwill. You understand and acknowledge that the Company invested significant time and expense in developing the Confidential Information and goodwill. You further understand and acknowledge that the restrictive covenants below are necessary to protect the Company’s legitimate business interests in its Confidential Information and goodwill. You further understand and acknowledge that the Company’s ability to reserve these for the exclusive knowledge and use of the Company is of great competitive importance and commercial value to the Company and that the Company would be irreparably harmed if You violate the restrictive covenants below. B. Confidentiality: • Continuing Confidentiality Obligation: You acknowledge that during the course of employment with the Company, You were privy to certain confidential information which was communicated to You verbally or in writing, relating to the Company, its businesses, its customers, trade secrets, know-how, inventions, techniques, processes, algorithms, software programs, hardware designs, schematics, designs, contracts, customer lists, financial information, sales and marketing plans, business plans and information, products, current and potential business partners, customers or other third parties (collectively, “Third Parties”), or other information which is not known to the public, and which may include material developed by You in the course of Your employment. You acknowledge that all such information is and shall be deemed to be “Confidential Information” belonging to the Company or Third Parties. You agree to protect such Confidential Information from disclosure with the same degree of care that You normally use to protect Your own confidential information, but not less than reasonable care, shall not divulge any such Confidential Information to anyone and shall not make use of the same without prior written consent of the Company. All Confidential Information is and shall remain the property of the Company (or the applicable Third Party), and You shall not acquire any rights therein. C. Non-Competition and Non-Solicitation: In consideration of the payments set forth in paragraph 2, other consideration as provided herein and other good and valuable consideration, to which You

5 otherwise would not be entitled, You again represent and agree that You will comply with the following terms and conditions: For a period of one year from October 1, 2024, You agree that You shall not directly or indirectly render services in a role or position with duties and responsibilities similar to the position currently held with Wiley for any company or individual that competes with Wiley without first notifying and obtaining consent from Wiley’s General Counsel, which shall not be unduly withheld; provided, however, that it shall not be a violation hereof for You to own and manage the interests held by You prior to Your employment with Wiley as separately previously disclosed to Wiley or to have beneficial ownership of less than 1% of the outstanding amount of any class of securities listed on a national or foreign securities exchange or an inter- dealer quotation system; and For a period of one year from October 1, 2024, You agree that You shall not directly, or indirectly through another entity, (i) induce or attempt to induce any employee of Wiley or any affiliate to leave the employ of Wiley or such affiliate, or in any way interfere with the relationship between Wiley or any affiliate and any employee thereof; (ii) hire any person who was an employee of Wiley or any affiliate within the previous 365 days prior to your Separation Date; or (iii) induce or attempt to induce any customer, supplier, licensee, licensor, franchisee or other business relation of Wiley or any affiliate to cease doing business with Wiley or such affiliate, or in any way interfere with the relationship between any such customer, supplier, licensee, licensor, franchisee or business relation and Wiley or any affiliate (including, without limitation, making any negative statements or communications about Wiley or its affiliates). D. Restrictive Covenant Remedies: Should You engage in prohibited conduct at any time through October 1, 2025, You and the Company acknowledge and agree that the Company will or would suffer irreparable injury in the event of a breach or violation or threatened breach or violation of the provisions set forth in this Paragraph 6 and agree that in the event of a breach or violation of such provisions, the Company may seek injunctive relief from a Court of competent jurisdiction to prohibit any such violation or breach, and that such right to injunctive relief will be in addition to any other remedy which may be ordered by the Court or an arbitrator. The aforementioned equitable relief shall be in addition to, not in lieu of, legal remedies, monetary damages or other available forms of relief. E. Disclosures/ Mutual Non-Disparagement: You agree and covenant that You will not engage in conduct or disclose any information which directly or indirectly discredits or disparages the Company or any of the Releasees to any third parties, including but not limited to customers, current and former Company employees, authors, investors, partner institutions and students, in any manner including without limitation through social media, and that You will characterize the Company, any of the Company’s products, services, business and its employees, officers and directors in a positive manner if You choose to talk about the Company at all. You acknowledge and agree that this prohibition includes, without limitation, making or publishing any such defamatory, libelous, slanderous, reckless, or maliciously untrue statements, such that they are made with knowledge of their falsity or with reckless disregard for their truth or falsity, or other content, but does not include statements that are not maliciously untrue or otherwise protected under the NLRA Section 7. If the Company reasonable determines that You have breached your obligations under this Section 6(E), You shall immediately forfeit any remaining separation payments and benefits due under this Agreement. In addition, You agree to repay any separation payments and benefits already received within thirty (30) days of the Company’s written demand. The Company retains and reserves the right to pursue any other remedies available under law or this Agreement in the event of a breach of Your non-disparagement obligations under this Agreement.

6 The provisions of this paragraph (6) shall survive termination or expiration of this Agreement. 7. Acknowledgment of Receipt of Agreement/Revocation: You acknowledge receiving this Agreement on the date indicated above, and that You have twenty-one (21) days from that date to consider the terms of this Agreement. You understand that if You do not sign this agreement by the end of the twenty-one (21) day period it will become null and void. You further acknowledge that: (a) You took advantage of this period to consider this Agreement before signing it; (b) You have carefully read this Agreement, and each of its provisions; (c) You fully understand what the Agreement, and each of its provisions, means; and (d) You are entering into the Agreement, and each of its provisions, knowingly and voluntarily. This Agreement is revocable by You for seven (7) days after it is signed by You. This Agreement shall not be effective or enforceable until the period for revocation has expired (“Effective Date”). If revoked, such notice of revocation shall be submitted by You, in writing, to me no later than the close of business on the seventh (7th) day following the date You originally sign this Agreement. 8. Tolling: If You violate any of the post-termination obligations in this Agreement, the obligation at issue will run from the first date on which You cease to be in violation of such obligation. 9. Taxes: All withholding taxes and other payroll taxes will be deducted from all payments due You under this Agreement. Any and all taxes that may be due by You as a result of payments made to You hereunder shall be Your responsibility. 10. Section 409A This Agreement is intended to comply with Section 409A of the Internal Revenue Code of 1986, as amended (Section 409A), including the exceptions thereto, and shall be construed and administered in accordance with such intent. Notwithstanding any other provision of this Agreement, payments provided under this Agreement may only be made upon an event and in a manner that complies with Section 409A or an applicable exemption. Any payments under this Agreement that may be excluded from Section 409A either as separation pay due to an involuntary separation from service, as a short-term deferral, or as a settlement payment pursuant to a bona fide legal dispute shall be excluded from Section 409A to the maximum extent possible. For purposes of Section 409A, any installment payments provided under this Agreement shall each be treated as a separate payment. To the extent required under Section 409A, any payments to be made under this Agreement in connection with a termination of employment shall only be made if such termination constitutes a "separation from service" under Section 409A. Notwithstanding the foregoing, the Company makes no representations that the payments and benefits provided under this Agreement comply with Section 409A and in no event shall the Company be liable for all or any portion of any taxes, penalties, interest, or other expenses that may be incurred by You on account of non-compliance with Section 409A. 11. Return of Company Property: You are responsible for returning all property belonging to the Company by October 1, 2024, including identification cards, laptop, computers, telephones, mobile phones, electronically stored documents or files and any other Company property in Your possession, provided, however You shall retain your mobile phone device (and permit the Company to wipe its contents and port the number and billing to You), computer peripherals (screen and docking station), the Company shall transfer your personal Salesforce license back to You, You shall arrange a visit to the office, accompanied and after-hours, to retrieve your personal property. 12. Section 16 Obligations after Separation from the Company: After You leave Your position as officer and director of the Company, You will not be subject to Section 16 obligations. However, under related federal securities obligations, after You leave the Company, You still may not buy or sell Company securities based on any material nonpublic information you obtained from your service with

7 the Company or any person or party associated with the Company, and You may not provide that information to any other person. If You have any questions about your Section 16 obligations, the Company's policies and procedures or the application of Section 16 to any proposed transaction in Company securities, please contact Corpsec@wiley.com. 13. References: It is agreed that with respect to inquiries or requests for references by past, present or prospective employers, you will direct prospective employers to The Work Number; www.theworknumber.com or 1-800-367-5690 and the Company will provide dates of employment and job title. Wiley’s employer code is: 26316. 14. Entire Agreement: This Agreement sets forth Your full and complete rights, payments and benefits and represents the entire agreement between the parties, superseding all other agreements and commitments whether oral or written. You acknowledge that You are not relying upon any representations or statements, written or oral, made by or on behalf of the Company not set forth herein. 15. Applicable Law: This Agreement shall be construed in accordance with New York law without regard to such State’s conflict of law rules. Any dispute arising from or related to this Agreement shall be brought exclusively before the courts located in the State and County of New York. 16. Non-Admission: Nothing in this Agreement is intended to be nor shall be deemed to be an admission of liability by any party, or an admission of the existence of any facts upon which liability could be based. 17. Your Right to Consult with an Attorney: You acknowledge that You have been advised of Your right to consult with an attorney prior to signing this Agreement and that sufficient opportunity has been made available to You to consult with an attorney. 18. Voluntary and Knowing Action: You acknowledge that You have read this document, and that You understand its meaning. You acknowledge that You agree to the terms of this Agreement and Release knowingly, voluntarily and with full knowledge of its implications. The parties hereto confirm agreement by the signatures shown below. John Wiley & Sons, Inc. By: Christina Van Tassell Danielle McMahan EVP and Chief People Officer Date Date Christina Van Tassell (Oct 1, 2024 12:02 EDT) Christina Van Tassell October 1, 2024 Danielle McMahan (Oct 1, 2024 16:03 EDT) Danielle McMahan 10/1/24
EX-10.31
5
exhibit1031-arefmatinsep.htm
EX-10.31
exhibit1031-arefmatinsep

1 SEPARATION AND RELEASE AGREEMENT This Separation and Release Agreement (“Agreement”) is made this 17th day of December 2024, between John Wiley & Sons (“Company” or “Wiley”), on behalf of itself and its predecessors, parents, successors, divisions, assigns, affiliates and subsidiaries and You, Aref Matin, Your heirs, executors, administrators, successors and assigns (“You” or “Employee”). When signed by You, this Agreement will confirm the terms of Your separation from the Company and this Agreement will constitute a release of all claims. You have been employed by Wiley as Executive Vice President and Chief Technology Officer and based out of the Company’s Hoboken, New Jersey Corporate Headquarters. Since Your employment relationship with Wiley is ending, the Company has offered You benefits as set forth in this Agreement, certain of which are greater than what You are entitled to otherwise receive, and You have decided to accept the Company’s offer. In consideration of the monies, mutual promises, mutual covenants and terms contained in this Agreement, the Parties agree as follows: 1. Employment Termination: Your last day of active employment with the Company will be November 22, 2024 (“Last Working Date”), and Your employment with the Company will terminate on December 2, 2024 (“Separation Date”). Effective as of the Last Working Date, You shall have resigned from all positions with the Company and its subsidiaries and affiliates, including any officer positions. From and after the Separation Date, You shall not hold any office, title or fiduciary role with the Company. 2. Separation Benefits: In exchange for the promises and releases in this Agreement, and provided You do not revoke the Agreement as permitted in Section 7 below, the Company will provide You with the following benefits and payments: A. Severance: Subject to the terms of this Agreement, You will receive severance equal to 12 months of Your current base salary rate payable in a lump sum in the amount of $460,000. Provided that You are in compliance with the terms of this Agreement, Your severance will be paid in the first pay cycle available in 2025 following the Effective Date of this Agreement. B. Health, Life, AD&D and Disability Insurance Benefits: Your group benefits coverage will cease at the end of the month of Your Separation Date. Your long-term disability (LTD) insurance coverage will cease on Your Separation Date (paragraph 1). If You timely and properly elect COBRA continuation coverage under the Company’s group health plan, the Company will pay the COBRA premiums for the level of medical dental and vision benefits that are in effect prior to Your last day of employment for 12 months, or until You become covered by another health plan, whichever is sooner. This benefit will be credited against the 18-month extension required by COBRA. Thereafter, Your right to continued coverage will be governed by COBRA and You shall be responsible for COBRA premiums for any remainder of the applicable COBRA continuation period. The company paid benefits excludes flexible spending accounts, life, AD&D, and disability insurance benefits. Premiums paid pursuant to this paragraph will be treated as taxable income. C. Equity Awards: In accordance with the terms of Your grant agreements:

2 A. You are eligible for prorated participation through Your Separation Date in the FY23-25 and FY24-26 performance cycles, with payout of performance share units based on actual performance at the end of the cycles. Your prorated target numbers of performance share units for these cycles are 12,152 and 11,983, respectively. B. Vested stock options may be exercised for up to ninety (90) days following Your Separation Date. C. All other performance share units, restricted share units and stock options that are not vested on Your Separation Date are forfeited and cancelled. Your UBS One Source account will remain active following Your Separation Date. You should ensure that UBS has a personal email address for You by contacting the UBS call center at (866) 592-7678, or by signing onto Your One Source account at https://onesource.ubs.com/wly. D. Executive Annual Incentive Plan: Per the terms and conditions of the Executive Annual Incentive Plan, you will not be eligible to receive an incentive payment for FY25. E. Legal Fees: The Company agrees to pay your reasonable legal fees incurred in connection with the negotiation of this Agreement in an amount not to exceed $5,000 upon submission of a valid invoice. F. You will not be entitled to any other compensation or benefits not provided in this Agreement. You understand, acknowledge and agree that the payment of benefits described in this Agreement, including payments and benefits described in Paragraph 2 herein, are conditioned upon Your execution of this Agreement. You acknowledge and agree that the sums and benefits to be provided under the terms of the Agreement are in addition to those benefits to which You are otherwise entitled. You may revoke this Agreement within seven (7) days after signing it by giving written notice to the Company. To be effective, this revocation must be received by the close of business on the 7th calendar day after You sign the Agreement. If You revoke this Agreement You understand that You will not receive the benefits that are conditioned upon Your execution of the Agreement. This Agreement will not become effective or enforceable unless and until the seven (7)-day revocation period has expired without You revoking it. 3. Deferred Compensation Plan: Under the terms of the Deferred Compensation Plan Your termination will be considered Separation of Service. The Deferred Compensation benefit is subject to a six-month delay and Your first distribution will be made no less than seven (7) months following Your Separation Date and payments will be made according to Your plan elections. 4. Complete Release and Waiver of Claims: You are aware of Your legal rights concerning Your employment with the Company. In exchange for the promises and payments of the Company set forth in paragraph 2, and other consideration as provided herein, to which You otherwise would not be entitled, You agree to irrevocably and unconditionally release (i.e. give up) any and all claims You may now have against the Company and You agree not to sue the Company and any currently or previously-affiliated companies, parent companies, successors or predecessors, and their officers, directors, agents and employees (collectively, the “Releasees”), arising out of the employment relationship between You and the Company (“the “Release’). A. This Release includes any and all past and present claims, demands, obligations, actions, causes of action, damages, costs, debts, liabilities, expenses and compensation of any nature whatsoever, whether known or unknown, foreseen or unforeseen, suspected or unsuspected that You as Releasor had, now have or in the future may or could have against Releasees, including but not limited to those arising under any and all applicable laws, in connection with any rights, claims in law or equity for

3 wrongful or abusive discharge, whistleblowing, discriminatory, or retaliatory treatment under any local, state or federal law, including but not limited to, the Family and Medical Leave Act, the Age Discrimination in Employment Act of 1967, (“ADEA”), the Civil Rights Acts of 1866, 1964 and 1991, the Employee Retirement Income Security Act of 1974, the Older Worker Benefits Protection Act of 1990, the Worker Adjustment Retraining and Notification Act, the Americans with Disabilities Act, the Fair Labor Standards Act, The New York State Human Rights Law, the New York Labor Law, the New York City Human Rights Law, the New York City Paid Safe and Sick Leave Law, The New Jersey Law Against Discrimination, The New Jersey Conscientious Employee Protection Act California Fair Employment and Housing Act, the New Jersey Wage and Hour Law, Colorado Anti-Discrimination Act, Florida Civil Rights Act, Illinois Human Rights Act, Indiana Civil Rights Law, Massachusetts Fair Employment Practices Law, the New York State Human Rights Law, the New York City Human Rights Law, the Worker Adjustment and Retraining Notification Act, the Immigration Reform and Control Act of 1986, the Occupational Safety and Health Act, or any other federal, state, or local statute, law, ordinance, or regulation that may be legally waived; any claims for personal injury, defamation, mental anguish, breach of contract, injury to health and personal reputation and any other claim of any nature whatsoever relating to or in connection with Your employment with Wiley or its subsidiaries, the termination of Your employment, rights, payments and benefits under any employment arrangements, or agreements, any qualified or nonqualified plans, vacation pay, health and other benefits except as otherwise provided You in this Agreement, and excluding any claims by You to enforce Your rights under this Agreement. The provisions of any law that provide in substance that a release shall not extend to unknown or unsuspected claims at the time of execution of this release are, to the extent permitted by law, hereby waived. B. Specific Release of Age Discrimination Claims: You understand and agree that, among other possible rights or claims herein waived or released by You, (i) You are, in particular, waiving rights and claims for age discrimination, including claims under state, federal law, and those based on Age Discrimination in Employment Act (“ADEA”) in exchange for the payments and other consideration described above that are not otherwise due You: and (ii) You are not waiving rights or claims for age discrimination that may arise after the effective date of this Agreement. C. Nothing in this Release and Agreement shall preclude You from bringing a charge or suit to challenge the validity or enforceability of this Agreement under the Age Discrimination in Employment Act, as amended by the Older Worker’s Benefit Protection Act. D. You acknowledge and agree that by virtue of the foregoing, You have waived any relief available for Yourself (including without limitation, monetary damages, equitable relief and reinstatement) under any of the claims and/or causes of action validly waived in this Agreement. Therefore, You agree that You will not accept any award or settlement from any source or proceeding (including but not limited to any proceeding brought by any other person or by any government agency) with respect to any claim or right validly waived in this Agreement. E. Nothing in this Agreement shall be a waiver of: (i) any claim for failure to provide vested benefits under an employee benefit or equity plan sponsored by Company, to which you are legally entitled, if any; (ii) claims for enforcement of this Agreement; (iii) claims that may arise after the Effective Date of this Agreement; (iv) any claims that cannot be waived by law; (v) any claim you have to statutory, contractual or common law indemnification or advancement and/or under applicable insurance policies of the Company; or (vi) your right to file a charge with or participate in or provide information in connection with any investigation or proceeding conducted by the U.S. Equal Employment Opportunity Commission, Securities and Exchange Commission (SEC) or other government agency or self-regulatory body, subject to the limitations in sub-Paragraph (D) above.

4 F. Covenant Not To Sue Company: Except as otherwise provided in paragraph 4, You shall not file any suit, claim or complaint in a court of law against Releasees arising out of, or relating to, Your employment with Company, or employment decisions made by Company. You and the Company acknowledge and agree that this covenant not to file any suit, claim or complaint is an essential and material part of this Agreement and that without its inclusion, this Agreement would not have been reached by the parties. G. Company Claims: The Company represents and warrants that at the time of entering into this Agreement it is not aware of claims of any kind it has against You, and that it has no intention of asserting any claims of any kind against You based on present knowledge. 5. Acknowledgements & Reimbursements: Except as set forth in this Agreement, You acknowledge that You have received all leave (paid or unpaid), compensation, wages, bonuses, commissions, and/or benefits to which You may be entitled as of the Effective Date of this Agreement and that no other leave (paid or unpaid), compensation, wages, bonuses, commissions and/or benefits are due to You, except as provided in this Agreement. You furthermore affirm that You have no known workplace injuries or occupational diseases. You and the Company expressly consent that this Agreement shall be given full force and effect according to each and all of its terms and provisions. You acknowledge and agree that any and all expenses requiring reimbursement under the Executive Perquisites Policy will be properly and timely submitted on or before November 22, 2024. 6. Post-Termination Obligations and Restrictive Covenants A. Acknowledgement: You understand and acknowledge that by virtue of Your employment with the Company, You had access to and knowledge of Confidential Information, were in a position of trust and confidence with the Company, and benefitted from the Company’s goodwill. You understand and acknowledge that the Company invested significant time and expense in developing the Confidential Information and goodwill. You further understand and acknowledge that the restrictive covenants below are necessary to protect the Company’s legitimate business interests in its Confidential Information and goodwill. You further understand and acknowledge that the Company’s ability to reserve these for the exclusive knowledge and use of the Company is of great competitive importance and commercial value to the Company and that the Company would be irreparably harmed if You violate the restrictive covenants below. B. Confidentiality: • Continuing Confidentiality Obligation: You acknowledge that during the course of employment with the Company, You were privy to certain confidential information which was communicated to You verbally or in writing, relating to the Company, its businesses, its customers, trade secrets, know-how, inventions, techniques, processes, algorithms, software programs, hardware designs, schematics, designs, contracts, customer lists, financial information, sales and marketing plans, business plans and information, products, current and potential business partners, customers or other third parties (collectively, “Third Parties”), or other information which is not known to the public, and which may include material developed by You in the course of Your employment. You acknowledge that all such information is and shall be deemed to be “Confidential Information” belonging to the Company or Third Parties. You agree to protect such Confidential Information from disclosure with the same degree of care that You normally

5 use to protect Your own confidential information, but not less than reasonable care, shall not divulge any such Confidential Information to anyone and shall not make use of the same without prior written consent of the Company. All Confidential Information is and shall remain the property of the Company (or the applicable Third Party), and You shall not acquire any rights therein. C. Non-Competition and Non-Solicitation: In consideration of the payments set forth in paragraph 2, other consideration as provided herein and other good and valuable consideration, to which You otherwise would not be entitled, You again represent and agree that You will comply with the following terms and conditions: Further, for a period of one year from December 2, 2024, You agree that You shall not directly or indirectly render services in a role or position with duties and responsibilities similar to the position currently held with Wiley for any company or individual that competes with Wiley’s research and research publishing business lines without first notifying and obtaining consent from Wiley’s General Counsel1, which shall not be unduly withheld; provided, however, that it shall not be a violation hereof for You to own and manage the interests held by You prior to Your employment with Wiley as separately previously disclosed to Wiley or to have beneficial ownership of less than 1% of the outstanding amount of any class of securities listed on a national or foreign securities exchange or an inter-dealer quotation system; and For a period of one year from December 2, 2024, You agree that You shall not directly, or indirectly through another entity, (i) induce or attempt to induce any employee of Wiley or any affiliate to leave the employ of Wiley or such affiliate, or in any way interfere with the relationship between Wiley or any affiliate and any employee thereof; (ii) hire any person who was an employee of Wiley or any affiliate within the previous 365 days prior to your Separation Date; or (iii) induce or attempt to induce any customer, supplier, licensee, licensor, franchisee or other business relation of Wiley or any affiliate to cease doing business with Wiley or such affiliate, or in any way interfere with the relationship between any such customer, supplier, licensee, licensor, franchisee or business relation and Wiley or any affiliate (including, without limitation, making any negative statements or communications about Wiley or its affiliates). D. Restrictive Covenant Remedies: You and the Company acknowledge and agree that the Company will or would suffer irreparable injury in the event of a breach or violation or threatened breach or violation of the provisions set forth in this Paragraph 6 at any time through December 2, 2025 and agree that in the event of a breach or violation of such provisions, the Company may seek injunctive relief from a Court of competent jurisdiction to prohibit any such violation or breach, and that such right to injunctive relief will be in addition to any other remedy which may be ordered by the Court or an arbitrator. The aforementioned equitable relief shall be in addition to, not in lieu of, legal remedies, monetary damages or other available forms of relief. E. Disclosures/ Mutual Non-Disparagement: You agree and covenant that You will not engage in conduct or disclose any information which directly or indirectly discredits or disparages the Company or any of the Releasees to any third parties, including but not limited to customers, current and former Company employees, authors, investors, partner institutions and students, in any manner including without limitation through social media, and that You will characterize the Company, any of the Company’s products, services, business and its employees, officers and directors in a positive manner if 1 For the avoidance of any doubt, this provision shall not limit You from taking any role or position with a company in the Education and Learning industry.

6 You choose to talk about the Company at all. You acknowledge and agree that this prohibition includes, without limitation, making or publishing any such defamatory, libelous, slanderous, reckless, or maliciously untrue statements, such that they are made with knowledge of their falsity or with reckless disregard for their truth or falsity, or other content, but does not include statements that are not maliciously untrue or otherwise protected under the NLRA Section 7. The Company agrees to provide instruction to the members of the Executive Leadership Team and the direct reports of Danielle McMahan in the Human Resources group to refrain from disparaging You with respect to your employment and separation from employment with the Company to any third parties. The provisions of this paragraph (6) shall survive termination or expiration of this Agreement. 7. Acknowledgment of Receipt of Agreement/Revocation: You acknowledge receiving this Agreement on the date indicated above, and that You have twenty-one (21) days from that date to consider the terms of this Agreement. You understand that if You do not sign this agreement by the end of the twenty-one (21) day period it will become null and void. You further acknowledge that: (a) You took advantage of this period to consider this Agreement before signing it; (b) You have carefully read this Agreement, and each of its provisions; (c) You fully understand what the Agreement, and each of its provisions, means; and (d) You are entering into the Agreement, and each of its provisions, knowingly and voluntarily. This Agreement is revocable by You for seven (7) days after it is signed by You. This Agreement shall not be effective or enforceable until the period for revocation has expired (“Effective Date”). If revoked, such notice of revocation shall be submitted by You, in writing, to me no later than the close of business on the seventh (7th) day following the date You originally sign this Agreement. 8. Tolling: If You violate any of the post-termination obligations in this Agreement, the obligation at issue will run from the first date on which You cease to be in violation of such obligation. 9. Taxes: All withholding taxes and other payroll taxes will be deducted from all payments due You under this Agreement. Any and all taxes that may be due by You as a result of payments made to You hereunder shall be Your responsibility. 10. Section 409A This Agreement is intended to comply with Section 409A of the Internal Revenue Code of 1986, as amended (Section 409A), including the exceptions thereto, and shall be construed and administered in accordance with such intent. Notwithstanding any other provision of this Agreement, payments provided under this Agreement may only be made upon an event and in a manner that complies with Section 409A or an applicable exemption. Any payments under this Agreement that may be excluded from Section 409A either as separation pay due to an involuntary separation from service, as a short-term deferral, or as a settlement payment pursuant to a bona fide legal dispute shall be excluded from Section 409A to the maximum extent possible. For purposes of Section 409A, any installment payments provided under this Agreement shall each be treated as a separate payment. To the extent required under Section 409A, any payments to be made under this Agreement in connection with a termination of employment shall only be made if such termination constitutes a "separation from service" under Section 409A. Notwithstanding the foregoing, the Company makes no representations that the payments and benefits provided under this Agreement comply with Section 409A and in no event shall the Company be liable for all or any portion of any taxes, penalties, interest, or other expenses that may be incurred by You on account of non-compliance with Section 409A. 11. Return of Company Property: You are responsible for returning all property belonging to the Company by December 2, 2024, including identification cards, laptop, computers, telephones, mobile phones,

7 electronically stored documents or files and any other Company property in Your possession, provided, however You shall retain your mobile phone device (and permit the Company to wipe its contents and port the number and billing to You), computer peripherals (screen and docking station), the Company shall transfer your personal Salesforce license (if any) back to You, You shall arrange a visit to the office, accompanied and after-hours, to retrieve your personal property. 12. Section 16 Obligations after Separation from the Company: After You leave Your position as officer and director of the Company, You will not be subject to Section 16 obligations. Consistent with the Company’s Insider Trading Policy, the Company will promptly instruct UBS to remove Your status as a corporate insider following the later of: (i) an open trading window following your Separation Date or (ii) Your confirmation to the Company that you do not possess material non-public information. However, under related federal securities obligations, after You leave the Company, You still may not buy or sell Company securities based on any material nonpublic information you obtained from your service with the Company or any person or party associated with the Company, and You may not provide that information to any other person. If You have any questions about your Section 16 obligations, the Company's policies and procedures or the application of Section 16 to any proposed transaction in Company’s securities, please contact Corpsec@wiley.com. 13. References: It is agreed that with respect to inquiries or requests for references by past, present or prospective employers, you will direct prospective employers to The Work Number; www.theworknumber.com or 1-800-367-5690 and the Company will provide dates of employment and job title. Wiley’s employer code is: 26316. 14. Entire Agreement: This Agreement sets forth Your full and complete rights, payments and benefits and represents the entire agreement between the parties, superseding all other agreements and commitments whether oral or written (including, without limitation, any restrictive covenants, confidentiality obligations, or non-compete obligations in Your employment agreement or any equity award). You acknowledge that You are not relying upon any representations or statements, written or oral, made by or on behalf of the Company not set forth herein. 15. Applicable Law: This Agreement shall be construed in accordance with New York law without regard to such State’s conflict of law rules. Any dispute arising from or related to this Agreement shall be brought exclusively before the courts located in the State and County of New York. 16. Non-Admission: Nothing in this Agreement is intended to be nor shall be deemed to be an admission of liability by any party, or an admission of the existence of any facts upon which liability could be based. 17. Your Right to Consult with an Attorney: You acknowledge that You have been advised of Your right to consult with an attorney prior to signing this Agreement and that sufficient opportunity has been made available to You to consult with an attorney. 18. Voluntary and Knowing Action: You acknowledge that You have read this document, and that You understand its meaning. You acknowledge that You agree to the terms of this Agreement and Release knowingly, voluntarily and with full knowledge of its implications.

8 The parties hereto confirm agreement by the signatures shown below. John Wiley & Sons, Inc. By: Aref Matin Danielle McMahan EVP and Chief People Officer Date Date Aref Matin (Dec 17, 2024 11:33 EST) Aref Matin 12/17/2024 Danielle McMahan (Dec 19, 2024 14:09 EST) 12/19/2024
EX-19
6
exhibit19-johnwileysonsi.htm
EX-19
exhibit19-johnwileysonsi

1 Insider Trading Policy Applies to: All Global Last updated: March 21, 2025 Scope and Purpose As a public company, John Wiley & Sons, Inc. (the “Company” or “Wiley”) is subject to various federal and state laws and regulations governing trading in its securities. Federal securities laws prohibit individuals with access to material information which has not been widely disseminated to the public, absorbed and evaluated, commonly referred to as “Material Non-public Information” from engaging in transactions in the Company’s securities, or divulging Material Non-public Information to enable others to trade on such information – practices understood as “Insider Trading”. Preventing Insider Trading is not only necessary to comply with securities laws, but it also serves to preserve the reputation and integrity of the Company as well as that of all persons affiliated with the Company. This Insider Trading Policy (the “Policy”) describes the standards, procedures, and guidelines of the Company and its subsidiaries on trading, and causing the trading of, the Company's securities or securities of certain other publicly traded companies while in possession of Material Non-public Information. Applicability The Company depends upon the conduct and diligence of colleagues, officers and directors affiliated with the Company, and their respective Family Members who have access to Material Non-public Information concerning the Company to ensure full compliance with this Policy. This Policy applies to all employees of the Company and the Covered Persons, as defined in this Policy, and provides procedures and guidelines with respect to transactions in the Company’s securities, the protection of Material Non-Public Information, and expected standards of conduct. This Policy also applies to any entities controlled by individuals subject to the Policy, including any corporations, partnerships, or trusts, and how transactions by these entities should be treated, for the purposes of this Policy and applicable securities laws, as if they were for the individual’s own account. Violation of the laws contained within this Policy may result in severe consequences to both the Company and the individual. The prohibitions against Insider Trading apply to trades, tips, and recommendations by virtually any person, including all persons associated with the Company, if the information involved is Material and Non-public. The prohibitions would also apply to all Covered Persons who buy or sell securities on the basis of Material Non-public Information that they have obtained about the Company’s customers, suppliers, partners, competitors, or other companies with which the Company has contractual relationships or may be negotiating transactions.

2 Definitions “Covered Persons” – All colleagues, officers and directors employed by or affiliated with the Company, and their respective Family Members, and individuals who through their work with the Company gain access to Non-public Material Information, or who have or is in a position to have access to Non-public Material Information concerning the Company. “Designated Insider” – Designated Insiders are other colleagues (i.e., not including Section 16 Individuals) who come into contact with Non-public Material Information on a continuing and frequent basis due to the nature of their job duties, and are notified in writing by the Office of the Corporate Secretary or their designee that they are a member of the group. "Family Member” – A person, including a spouse, who resides with a director, officer, or colleague, anyone else who lives in such person’s household, and any family members who do not live in such person’s household but whose Securities Transactions are directed by such person or are subject to such person’s influence or control. “Insider” – An Insider, beyond Designated Insiders and Section 16 Individuals, are colleagues of the Company and anyone else who, regardless of their actual knowledge of Non-Public Material Information, is in a position that they are considered to typically have access to such information. "Material Information" – Material Information means any information concerning the business and operations of the Company which could influence reasonable investors to buy, sell, or hold the Company's securities. Some examples of information that may be material include: a. announcements of earnings and/or minimum quarterly distributions; b. monthly financial results, financial forecasts (especially earnings estimates); c. changes in previously disclosed financial information; d. significant write-downs in assets or increases in reserves; e. material liquidity issues; f. changes in earnings estimates or unusual gains or losses in major operations; g. significant capital projects; h. new major contracts; i. mergers, acquisitions, tender offers or divestments; j. extraordinary borrowings; k. cybersecurity risks and incidents, including vulnerabilities and breaches; l. changes in debt ratings; m. technological breakthroughs; n. major marketing changes;

3 o. major litigation, governmental investigations, criminal actions, or indictments and any collateral consequences; p. significant changes in the Company’s management or board of directors; q. programs for the repurchase of securities by the Company or proposed issuances of new securities; and r. casualty losses if the casualty could have a significant financial effect. If you are unsure whether information could be considered material, or if you have any other question regarding whether to refrain from trading in the Company’s securities, you should consult the Office of the Corporate Secretary. “Non-public" – Insider Trading prohibitions come into play only when you possess information that is material and "non-public." The fact that information has been disclosed to a few members of the public does not make it public for insider trading purposes. To be "public" the information must have been disseminated in a manner designed to reach investors generally, and the investors must be given the opportunity to absorb the information. Even after public disclosure of information about the Company, you must wait until the close of business on the second trading day after the information was publicly disclosed before you can treat the information as public. “Securities Transactions” – All trading (purchasing, selling or offering to purchase or sell) or other transactions in the Company's securities, including common stock and any other security the Company may issue, such as preferred stock, notes, bonds and convertible securities, and transactions in the Company's Stock under any incentive plans, such as restricted units, and/or the exercise of options. “Section 16 Individuals” – Each member of the Company’s Board of Directors (the “Board”) and those officers of the Company designated by the Board as Section 16 officers. Section 16 Individuals come in contact with Non-public Material Information on a continuing and frequent basis. Section 16 Individuals are subject to the "short-swing" trading and disclosure rules promulgated under Section 16 of the Securities and Exchange Act of 1934, as amended (“SEC”). The Policy General Prohibition on Insider Trading No Covered Person shall engage in any Securities Transactions while in possession of Non- public Material Information ("Insider Trading"). No Covered Person shall engage in any transaction involving the purchase or sale of another company’s securities while in possession of Non-public Material Information about such company when that information is obtained in the course of employment with, or the performance of services on behalf of, the Company and for which there is a relationship of trust and confidence concerning the information.

4 The Insider Trading prohibitions do not apply to the surrender of shares to the Company used to satisfy any tax withholding obligations arising from the exercise of stock options or vesting of shares in a manner permitted by the applicable equity award agreement, that in each case do not involve a market sale of the Company’s securities or Securities Transactions made pursuant to a plan which meets the requirements of Rule 10b5-1, promulgated under the Securities Exchange Act of 1934, as amended (the “10b5-1 Plan”). No Covered Person shall engage in tipping. Tipping occurs when a Covered Person who learns of Non-public Material Information communicates it to another person (other than another Company director, officer, or colleague or authorized Company representative who has a legitimate and clear need to know). If that other person (including Family Members, friends, etc.) engages in a Securities Transaction, both the Covered Person(s) and the other person may be held liable. Covered Persons may not disclose any Material Non-public Information concerning the Company or make any recommendations or express opinions on the basis of Non-public Material Information to any other persons or entities, including Family Members and friends. This prohibition applies whether or not the Covered Person receives any benefit from the use of that information by the other person or entity. Confidentiality of Material Non-Public Information Non-public Material Information relating to the Company is the property of the Company and unauthorized disclosure of such information is prohibited. If you receive an inquiry for information from someone outside of the Company, such as a stock analyst, or a request for sensitive information outside the ordinary course of business from someone outside of the Company, such as a business partner, vendor, supplier or salesperson, then you should refer the inquiry to the Corporate Secretary or in accordance with Wiley’s Corporate Communications Policy. Responding to a request yourself may violate this Policy and, in certain circumstances, the law. Blackout Periods All Covered Persons are prohibited from trading in the Company’s securities when in possession of Non-public Material Information. Insiders are further prohibited from trading in the Company's securities during blackout periods as defined below. a. Quarterly Blackout Periods. Trading in the Company's securities is prohibited during the period commencing at the close of the market 10 calendar days prior to the current quarter end date and ending at the close of business on the second business day following the date the Company's financial results (“Earnings”) are publicly disclosed. During these periods, Covered Persons generally possess or are presumed to possess Non-public Material Information about the Company's financial results. b. Other Blackout Periods. From time to time, the Company may also require that all or certain colleagues refrain from engaging in Securities Transactions for a specified period of time due to Material Information known to such colleagues (such as negotiation of mergers, acquisitions or dispositions, investigation and assessment of cybersecurity incidents or new product developments) and not yet disclosed to the public. While such Non-public Material Information is pending, the Company may impose special blackout periods during which Covered Persons are prohibited from

5 trading in the Company's securities. Trading by any person possessing Non-public Material Information must be delayed for a sufficient period after release by the Company of Non-public Material Information to permit dissemination and to allow the investing public to digest the information. If the Company imposes a special blackout period, the Office of the Corporate Secretary will notify the Covered Persons affected. Company colleagues, officers and/or directors who are in possession of Non-public Material Information must wait until the close of business on the second trading day after the information was publicly disclosed before they can treat the information as public. For example, if an announcement is made on a Thursday, then Monday generally would be the first day that trading would be allowed. Similarly, if the announcement is made on a Friday, then Tuesday generally would be the first day that trading would be allowed. The Office of the Corporate Secretary will notify the Covered Persons when the special blackout period begins and ends based on this cadence. Trading Windows Insiders may only engage in Securities Transactions during an open trading window (a “Trading Window”) or pursuant to a 10b5-1 Plan. The Office of the Corporate Secretary will determine the commencement date and length of each Trading Window. However, and inverse to blackout periods, the Trading Window typically commences at the close of business on the second business day following the Earnings Call for the respective quarter and closes approximately 10 calendar days prior to the current quarter end date. Engaging in Securities Transactions during a Trading Window should not be considered a "safe harbor," and Insiders should use good judgment at all times to make sure that their Securities Transactions are not affected while they are in possession of Non-public Material Information concerning the Company, in addition to obtaining required pre-clearance, as described below. Rule 10b5-1 Plans The trading restrictions within this Policy do not apply to transactions under an approved, pre-existing written plan, contract, instruction, or arrangement under a 10b5-1 Plan, where such plans meet the following requirements: a. have been approved by the General Counsel or Corporate Secretary prior to establishment by the director, officer, or colleague; b. are created in good faith, before such director, officer, or colleague becomes aware of any Non-public Material Information; c. specify (or provides an algorithm or formula for determining) the amount, pricing of securities to be purchased or sold (such as trigger price if applicable), and the dates(s) of the transaction(s) (or include a written formula, algorithm, for determining the amount, pricing, and date); d. do not permit such director, officer, or colleague to exercise any subsequent influence over how, when, or whether to effect purchases or sales of securities;

6 e. for directors and officers, trading under such plans will not begin until the later of the “cooling off period”, which is (i) 90 days after the adoption or modification of the plan or (ii) at the close of business two business days after the disclosure of the Company’s financial results for the fiscal quarter in which the plan was adopted or modified. With respect to persons other than issuers, directors or officers, the applicable cooling-off period is 30 days after the adoption or modification of the trading plan; f. such plans include a representation certifying that at the time of adoption the director, officer or colleague is (i) not aware of Non-public Material Information about the Company’s securities; and (ii) the adoption is not a part of a plan or scheme to evade the prohibitions of Rule 10b5-1; g. are not adopted during a blackout period; and h. such plans provide that the broker is instructed to send same-day duplicate confirmations of all such purchase and/or sale transactions to the Office of the Corporate Secretary; b. provided, however, that no person acting on behalf of such director, officer, or colleague pursuant to such approved 10b5-1 Plans may be aware of Non-public Material Information when deciding how, when, or whether to effect purchases or sales of securities. Trading Under an approved 10b5-1 Plan Subsequent authorization or pre-clearance will not be required for actual purchases and sales of securities under an approved 10b5-1 Plan, provided: a. the timing of such purchase or sale is outside the control of the director, officer or colleague; b. such director, officer or colleague has no actual knowledge of the terms of the transaction prior to the execution. With respect to any purchase or sale under an approved 10b5-1 Plan, the third-party effecting transactions on behalf of the Insider should be instructed to send duplicate confirmations of all such transactions to the Office of the Corporate Secretary. Revocation and Amendments to an approved 10b5-1 Plan Revocation or suspension of an approved 10b5-1 Plan outside of the express terms of the 10b5-1 Plan should occur only in unusual circumstances. Effectiveness of any revocation or amendment of an approved 10b5-1 Plan will be subject to the prior review and approval by the General Counsel or Corporate Secretary. A person acting in good faith may amend a prior approved 10b5-1 Plan so long as (i) they first notify and seek approval of the General Counsel or Corporate Secretary, (ii) such amendments are made during a Trading Window; and (iii) the approved 10b5-1 Plan participant does not possess Material Non-public Information at the time of such amendment.

7 Multiple overlapping 10b5-1 Plans will not be permitted. Persons may not have another outstanding (and may not enter into any additional) 10b5-1 Plan for the purchases or sales of any class of securities of the Company on the open market during the same period. The SEC has also placed a restriction on single-trade 10b5-1 Plans. Persons will be able to rely on the Rule 10b5-1(c) affirmative defense for only one single-trade plan during any 12- month period. If you are considering entering into, modifying, or terminating a 10b5-1 Plan or have any questions regarding 10b5-1 Plans, please contact the Office of the Corporate Secretary. You should consult your own legal and tax advisors before entering into, modifying, or terminating a 10b5-1 Plan. A trading plan, contract, instruction or arrangement will not qualify as an approved 10b5-1 Plan without the prior review and approval of the General Counsel and Compliance Officer as described above. Disclosure Requirements Under Item 408(a) of Regulation S-K, the Company must disclose quarterly whether directors and officers have adopted or terminated a 10b5-1 plan or other trading arrangements and, if so, a description of the material terms of each trading arrangement other than price. For Compliance purposes, the Office of the Corporate Secretary will periodically, and in advance of the disclosure of the Company’s financial results for the fiscal quarter, ask Section 16 Individuals to confirm they have not adopted or terminated a 10b5- 1 plan or other trading arrangement. Limitations on Sales of Securities Because of the limited average trading volume for the Company's common stock, and concerns of market price fluctuations occasioned by the sale of stock by directors, officers, colleagues, the Company reserves the right to limit the number of shares that can be sold overall and per day by any director, officer or colleague, pursuant to a 10b5-1 Plan or otherwise. The General Counsel or Corporate Secretary has the right to require any director, officer, or colleague to amend an existing 10b5-1 Plan, in compliance with Rule 10b5-1, to effectuate such trading limitations, when necessary. No director, officer or colleague will have any cause of action against the Company, its affiliates, directors or officers as a result of any losses sustained as a result of restrictions imposed on the number of shares such person is permitted to sell. Pre-Clearance of Securities Transactions Because Insiders, and specifically Section 16 Individuals and Designated Insiders, are likely to obtain Non-public Material Information on a regular basis, the Company requires all Designated Insiders and Section 16 Individuals to refrain from trading, even during a trading window as described above, without first pre-clearing all Securities Transactions with the Office of Corporate Secretary and/or other persons designated by the Corporate Secretary from time to time, prior to executing the transaction, per the Pre-Clearance Procedure as laid out by the Office of the Corporate Secretary. Occasionally, because of their involvement in special projects or otherwise, other colleagues may also come into possession of Non-public Material Information (or information that could

8 become Non-public Material Information with the passage of time) who would otherwise not be considered a Designated Insider. The Office of the Corporate Secretary will inform these other colleagues whether they are subject to this Policy and, as such, will be required to pre-clear any anticipated Securities Transactions. Insiders will be notified in writing by the Corporate Secretary, the Assistant Corporate Secretary, or their designee that they are a Section 16 Individual or a Designated Insider. Upon a request for pre-clearance, the Office of Corporate Secretary shall record the date each request is received and the date and time each request is approved or disapproved. Unless revoked, a grant of permission will normally remain valid until the close of trading two business days following the day on which it was granted (after such time, a new approval would be required). If the Section 16 Individual or a Designated Insider becomes aware of Non-public Material Information before the transaction is executed, the pre- clearance is void and the trade must not be completed. Transactions not effected within the time limit become subject to pre-clearance again. Additional Requirements for Section 16 Individuals Section 16(a) requires that Section 16 Individuals file reports of most transactions in the Company’s securities with the SEC within two business days of each transaction, known as Forms 3, 4 and 5. Securities Transactions for reporting purposes generally include any change in ownership, including option grants, stock grants, vesting of restricted and performance share units, or exercise of options. To avoid any liability under Section 16(b), to assist in the timely filing of transaction reports under Section 16(a) and to otherwise ensure compliance with applicable securities laws, we require Section 16 Individuals to communicate their intentions to transact to the Office of the Corporate Secretary so they may initiate a pre-transaction review. This pre-transaction review is also intended to help ensure compliance with Rule 144 (which sets the conditions under which restricted (unregistered) and control securities can be sold and further described below), assist in the preparation of required reports, ensure compliance with applicable stock ownership guidelines, and avoid inadvertent insider trading violations. In addition to pre-clearing Securities Transactions, and before proceeding with the acquisition or disposition of any of the Company’s securities, Section 16 Individuals should review the following checklist. a. If a sale is proposed by Section 16 Individuals or any Family Member, ensure that: i. Neither the Section 16 Individual nor any Family member has made any purchases of the Company’s stock (or securities convertible into the Company’s stock) within the past six (6) months; and ii. No purchases by Section 16 Individual or any Family Member are anticipated within the next six months. b. If a purchase is proposed by Section 16 Individuals or any Family Member, ensure that:

9 i. Neither the Section 16 Individual nor any Family Member made any sales of the Company’s stock (or securities convertible into the Company’s stock) within the past six months; and ii. No sales are anticipated or required to be made within the next six months by the Section 16 Individual or any Family Member. c. Rule 144. In addition, Section 16 Individuals are required to comply with the requirements of Rule 144 when selling any Company securities. Rule 144 is an SEC regulation that allows for the public sale of restricted securities without needing to register them with the SEC, provided certain conditions are met regarding holding periods, selling volume, and public information availability about the company. Compliance requires the preparation and filing with the SEC of any required Form 144. The Section 16 Individuals’ broker will assist the Section 16 Individual in completing the required forms. d. Notice of Sale Transactions. Sales of Company securities by Section 16 Individuals often attract the attention of market observers who may mischaracterize the intent or reason for the sale of Company stock. Accordingly, to enhance internal communications, the Company’s CEO and/or Board Chairman may be informed of certain sale transactions in advance of such transactions, as well as the reason the shares are being sold (if known). Stock Ownership Guidelines Insiders may be subject to stock ownership guidelines which are based on their role within the organization. By requesting a Securities Transaction, it is understood that you have met such requirements, and such transactions will not result in being noncompliant with such guidelines. Notwithstanding, the Corporate Secretary or the Assistant Corporate Secretary, in partnership with Wiley’s People Organization, will confirm the status of the applicable stock ownership guidelines as part of the pre-clearance procedure. Prohibited Transactions In addition to the other restrictions set forth above, Insiders are prohibited from engaging in any of the transactions specified below because of the potential conflict of interest, or the perceptions created and the resulting possible impact on the market. a. Engaging in Short Sales. No Insider may engage in short sales of Company securities. A short sale is the sale of a security that the seller does not own at the time of the trade. b. Engaging in Derivative Transactions. No Insider may engage in transactions in puts, calls or other derivative instruments that relate to or involve Company securities. Such transactions are, in effect, bets on short-term movements in the Company’s stock price and therefore create the appearance that the transaction is based on Non-public Material Information.

10 c. Hedging. No Insider may engage in hedging transactions involving Company securities, including forward sale or purchase contracts, equity swaps, collars, or exchange funds. Such transactions are speculative in nature and therefore create the appearance that the transaction is based on Non-public Information. d. Trading on Margin or Pledging. No Insider may hold Company securities in a margin account or pledge (or hypothecate) Company securities as collateral for a loan. Margin sales or foreclosure sales may occur at a time when the Insider is aware of Non-public Material Information or otherwise is not permitted to trade in Company securities. Violations of Insider Trading Laws Penalties for trading on or communicating Non-public Material Information can be severe, both for individuals involved in such unlawful conduct and their employers and supervisors, and may include jail terms, criminal fines, civil penalties, and civil enforcement injunctions. Given the severity of the potential penalties, compliance with this Policy is mandatory. Legal Penalties. A person who violates Insider Trading laws by engaging in Securities Transactions when they have Non-public Material Information can be sentenced to a substantial jail term and required to pay a criminal penalty of several times the amount of profits gained or losses avoided. In addition, a person who engages in tipping may also be liable for transactions by the tippees to whom they have disclosed Non-Public Material Information. Tippers can be subject to the same penalties and sanctions as the tippees, and the SEC has imposed large penalties even when the tipper did not profit from the transaction. The SEC can also seek substantial civil penalties from any person who, at the time of an insider trading violation, "directly or indirectly controlled the person who committed such violation," which would apply to the Company and/or management and supervisory personnel. These control persons may be held liable for up to the greater of $1 million or three times the amount of the profits gained, or losses avoided. Even for violations that result in a small or no profit, the SEC can seek penalties from a company and/or its management and supervisory personnel as control persons. Company-Imposed Penalties. Colleagues who violate this Policy may be subject to disciplinary action by the Company, including dismissal for cause. The size of the transaction or the amount of profit received does not have to be significant to result in prosecution. The SEC has the ability to monitor even the smallest trades, and the SEC performs routine market surveillance. Post-Termination Transactions The prohibitions set forth in this Policy continue to apply to transactions in the Company’s securities even after the Insider’s employment or other service relationship with the Company has terminated until the later of (1) the re-opening of the quarterly Trading Window if such termination occurs outside of a Trading Window or (2) for so long as the Insider is aware of Non-Public Material Information.

11 Section 16 Obligations after Separation from the Company After a Section 16 Individual leaves their position as an officer and/or director of the Company, the Section 16 Individual will not be subject to Section 16 obligations. Consistent with this Policy, the Company will promptly remove the Section 16 Individual’s status as a corporate Insider from its internal system following the later of: (i) an open trading window following the Section 16 Individual’s Separation Date or (ii) the Section 16 Individual’s confirmation to the Company they do not possess Non-public Material Information. However, under related federal securities obligations, after a Section 16 Individual leaves the Company, Section 16 Individuals still may not buy or sell Company securities based on any Non-public Material Information obtained from their service with the Company or any person or party associated with the Company and may not provide that information to any other person. Section 16 Individuals should contact the Office of the Corporate Secretary should they have any questions about their Section 16 obligations, the Company's policies and procedures or the application of Section 16 to any proposed transaction in Company’s securities. Review of Policy This Policy will be reviewed annually by the Company’s Audit Committee, or more frequently, if material changes to the Policy are proposed. Policy Owner The Office of the Corporate Secretary is responsible for managing this Policy, including its drafting and approval, regular review and revision of the Policy and oversees compliance with the Policy. Questions regarding the Policy should be directed to the Company’s Corporate Secretary or General Counsel. Hardship Waivers The requirements specified in this Policy may be waived at the discretion of the General Counsel if compliance would create severe hardship or prevent an Insider from complying with a court order, as in the case of a divorce settlement, unless doing so would be in violation of applicable federal or state laws. Any exception approved by the General Counsel shall be reported immediately to the Audit Committee of the Board. Contacts and Responsibility If you have any questions about this Policy or its application to any proposed transaction in Company Securities or the proposed adoption or change in a 10b5-1 Plan, you may contact the Office of the Corporate Secretary at corpsec@wiley.com. Ultimately, however, the responsibility for adhering to this Policy and avoiding unlawful transactions, whether by you or your Family Member, rests with you. You should use your best judgment and consult your personal legal and financial advisors as needed. Approved by the Audit Committee of the Company on March 21, 2025.
EX-21
7
wly-20250430x10kxexx21.htm
EX-21
Document
Exhibit 21
|
|
|
|
|
|
| SUBSIDIARIES OF JOHN WILEY & SONS, INC. (1) |
As of April 30, 2025 |
|
|
|
Jurisdiction of Formation |
Atypon Systems, LLC |
Delaware |
Inscape Publishing, LLC |
Delaware |
John Wiley & Sons Canada, Limited |
Canada |
| Madgex Inc. |
Delaware |
| Wiley Periodicals LLC |
Delaware |
Personality Profile Solutions, LLC |
Delaware |
| PIIEU Ltd |
United Kingdom |
Wiley Heyden Ltd |
United Kingdom |
| Zyante Inc. |
Delaware |
| Wiley Publishing LLC |
Delaware |
Wiley India Private Ltd |
India |
| Wiley APAC Services LLP |
India |
| WWL LLC |
Delaware |
Wiley Global Technology (Private) Ltd |
Sri Lanka |
| Wiley International LLC |
Delaware |
| John Wiley & Sons (HK) Limited |
Hong Kong |
| Wiley HK2 Limited |
Hong Kong |
| Wiley Europe Investment Holdings, Ltd. |
United Kingdom |
Wiley Europe Ltd |
United Kingdom |
Wiley Heyden Ltd |
United Kingdom |
John Wiley & Sons Ltd |
United Kingdom |
J Wiley Ltd |
United Kingdom |
Atypon Systems Ltd |
United Kingdom |
John Wiley & Sons Singapore Pte. Ltd. |
Singapore |
John Wiley & Sons Commercial Service (Beijing) Co Ltd |
China |
| Wiley Information & Technology (Shanghai) Co Ltd |
China |
| Madgex Holdings Ltd |
United Kingdom |
Hindawi Ltd |
United Kingdom |
Blackwell Science (Overseas Holdings) Ltd |
United Kingdom |
John Wiley & Sons AS |
Denmark |
Wiley-VCH GmbH |
Germany |
| Ernst & Sohn GmbH |
Germany |
| Wiley-VHCA AG |
Switzerland |
| Wiley Publishing Japan KK |
Japan |
| Wiley Publishing Australia Pty Ltd. |
Australia |
| John Wiley and Sons Australia, Ltd. |
Australia |
(1) The names of other subsidiaries that would not constitute a significant subsidiary in the aggregate have been omitted.
EX-23.1
8
exhibit231consentfy25.htm
EX-23.1
Document
Exhibit 23.1
CONSENT OF INDEPENDENT REGISTERED PUBLIC ACCOUNTING FIRM
We hereby consent to the incorporation by reference in the Registration Statements on Form S-8 (No. 333-265700 and 333-267661) of John Wiley & Sons, Inc. of our report dated June 25, 2025 relating to the financial statements, financial statement schedule and the effectiveness of internal control over financial reporting, which appears in this Form 10-K.
/s/ PricewaterhouseCoopers LLP
New York, New York
June 25, 2025
EX-23.2
9
exhibit232consentfy25.htm
EX-23.2
Document
Exhibit 23.2
CONSENT OF INDEPENDENT REGISTERED PUBLIC ACCOUNTING FIRM
We consent to the incorporation by reference in the registration statements (No. 333-267661 and 333-265700) on Form S-8 of our report dated June 26, 2023, except for Note 20, as to which the date is June 25, 2025, with respect to the consolidated financial statements of John Wiley & Sons, Inc. and subsidiaries.
/s/ KPMG LLP
New York, New York
June 25, 2025
EX-31.1
10
wly-20250430x10kxexx311.htm
EX-31.1
Document
Exhibit 31.1
CERTIFICATIONS PURSUANT TO SECTION 302 OF THE SARBANES-OXLEY ACT OF 2002
I, Matthew S. Kissner, certify that:
1.I have reviewed this annual report on Form 10-K of John Wiley & Sons, Inc.;
2.Based on my knowledge, this report does not contain any untrue statement of a material fact or omit to state a material fact necessary to make the statements made, in light of the circumstances under which such statements were made, not misleading with respect to the period covered by this report;
3.Based on my knowledge, the financial statements, and other financial information included in this report, fairly present in all material respects the financial condition, results of operations and cash flows of the registrant as of, and for, the periods presented in this report;
4.The registrant’s other certifying officer and I are responsible for establishing and maintaining disclosure controls and procedures (as defined in Exchange Act Rules 13a-15(e) and 15d-15(e)) and internal control over financial reporting (as defined in Exchange Act Rules 13a-15(f) and 15d-15(f)) for the registrant and have:
a.Designed such disclosure controls and procedures, or caused such disclosure controls and procedures to be designed under our supervision, to ensure that material information relating to the registrant, including its consolidated subsidiaries, is made known to us by others within those entities, particularly during the period in which this report is being prepared;
b.Designed such internal control over financial reporting, or caused such internal control over financial reporting to be designed under our supervision, to provide reasonable assurance regarding the reliability of financial reporting and the preparation of financial statements for external purposes in accordance with generally accepted accounting principles;
c.Evaluated the effectiveness of the registrant’s disclosure controls and procedures and presented in this report our conclusions about the effectiveness of the disclosure controls and procedures, as of the end of the period covered by this report based on such evaluation; and
d.Disclosed in this report any change in the registrant’s internal control over financial reporting that occurred during the registrant’s most recent fiscal quarter (the registrant’s fourth fiscal quarter in the case of an annual report) that has materially affected or is reasonably likely to materially affect the registrant’s internal control over financial reporting; and
5.The registrant’s other certifying officer and I have disclosed, based on our most recent evaluation of internal control over financial reporting, to the registrant’s auditors and the audit committee of the registrant’s board of directors (or persons performing the equivalent functions):
a.All significant deficiencies and material weaknesses in the design or operation of internal control over financial reporting which are reasonably likely to adversely affect the registrant’s ability to record, process, summarize and report financial information; and
b.Any fraud, whether or not material, that involves management or other employees who have a significant role in the registrant’s internal control over financial reporting.
|
|
|
|
|
|
|
|
|
| By: |
/s/ Matthew S. Kissner |
|
|
Matthew S. Kissner |
|
|
President and Chief Executive Officer |
|
|
Dated: June 25, 2025 |
|
EX-31.2
11
wly-20250430x10kxexx312.htm
EX-31.2
Document
Exhibit 31.2
CERTIFICATIONS PURSUANT TO SECTION 302 OF THE SARBANES-OXLEY ACT OF 2002
I, Christopher F. Caridi, certify that:
1.I have reviewed this annual report on Form 10-K of John Wiley & Sons, Inc.;
2.Based on my knowledge, this report does not contain any untrue statement of a material fact or omit to state a material fact necessary to make the statements made, in light of the circumstances under which such statements were made, not misleading with respect to the period covered by this report;
3.Based on my knowledge, the financial statements, and other financial information included in this report, fairly present in all material respects the financial condition, results of operations and cash flows of the registrant as of, and for, the periods presented in this report;
4.The registrant’s other certifying officer and I are responsible for establishing and maintaining disclosure controls and procedures (as defined in Exchange Act Rules 13a-15(e) and 15d-15(e)) and internal control over financial reporting (as defined in Exchange Act Rules 13a-15(f) and 15d-15(f)) for the registrant and have:
a.Designed such disclosure controls and procedures, or caused such disclosure controls and procedures to be designed under our supervision, to ensure that material information relating to the registrant, including its consolidated subsidiaries, is made known to us by others within those entities, particularly during the period in which this report is being prepared;
b.Designed such internal control over financial reporting, or caused such internal control over financial reporting to be designed under our supervision, to provide reasonable assurance regarding the reliability of financial reporting and the preparation of financial statements for external purposes in accordance with generally accepted accounting principles;
c.Evaluated the effectiveness of the registrant’s disclosure controls and procedures and presented in this report our conclusions about the effectiveness of the disclosure controls and procedures, as of the end of the period covered by this report based on such evaluation; and
d.Disclosed in this report any change in the registrant’s internal control over financial reporting that occurred during the registrant’s most recent fiscal quarter (the registrant’s fourth fiscal quarter in the case of an annual report) that has materially affected, or is reasonably likely to materially affect, the registrant’s internal control over financial reporting; and
5.The registrant’s other certifying officer and I have disclosed, based on our most recent evaluation of internal control over financial reporting, to the registrant’s auditors and the audit committee of the registrant’s board of directors (or persons performing the equivalent functions):
a.All significant deficiencies and material weaknesses in the design or operation of internal controls over financial reporting which are reasonably likely to adversely affect the registrant’s ability to record, process, summarize and report financial information; and
b.Any fraud, whether or not material, that involves management or other employees who have a significant role in the registrant’s internal control over financial reporting
|
|
|
|
|
|
|
|
|
| By: |
/s/ Christopher F. Caridi |
|
|
Christopher F. Caridi |
|
|
Senior Vice President, Chief Accounting Officer and Interim Chief Financial Officer |
|
|
|
|
|
Dated: June 25, 2025 |
|
EX-32.1
12
wly-20250430x10kxexx321.htm
EX-32.1
Document
Exhibit 32.1
CERTIFICATION PURSUANT TO
18 U.S.C. SECTION 1350,
AS ADOPTED PURSUANT TO
SECTION 906 OF THE SARBANES-OXLEY ACT OF 2002
In connection with the Annual Report of John Wiley & Sons, Inc. (the “Company”) on Form 10-K for the year ended April 30, 2025 as filed with the Securities and Exchange Commission on the date hereof (the “Report”), I, Matthew S. Kissner, President and Chief Executive Officer of the Company, certify, pursuant to 18 U.S.C. Section 1350, as adopted pursuant to Section 906 of the Sarbanes-Oxley Act of 2002, that based on my knowledge:
(1)The Report fully complies with the requirements of Section 13(a) or 15(d) of the Securities Exchange Act of 1934; and
(2)The information contained in the Report fairly presents, in all material respects, the financial condition and results of operations of the Company.
|
|
|
|
|
|
|
|
|
| By: |
/s/ Matthew S. Kissner |
|
|
Matthew S. Kissner |
|
|
President and Chief Executive Officer |
|
|
Dated: June 25, 2025 |
|
EX-32.2
13
wly-20250430x10kxexx322.htm
EX-32.2
Document
Exhibit 32.2
CERTIFICATION PURSUANT TO
18 U.S.C. SECTION 1350,
AS ADOPTED PURSUANT TO
SECTION 906 OF THE SARBANES-OXLEY ACT OF 2002
In connection with the Annual Report of John Wiley & Sons, Inc. (the “Company”) on Form 10-K for the year ended April 30, 2025 as filed with the Securities and Exchange Commission on the date hereof (the “Report”), I, Christopher F. Caridi, Senior Vice President, Chief Accounting Officer and Interim Chief Financial Officer of the Company, certify, pursuant to 18 U.S.C. Section 1350, as adopted pursuant to Section 906 of the Sarbanes-Oxley Act of 2002, that based on my knowledge:
(1)The Report fully complies with the requirements of Section 13(a) or 15(d) of the Securities Exchange Act of 1934; and
(2)The information contained in the Report fairly presents, in all material respects, the financial condition and results of operations of the Company.
|
|
|
|
|
|
|
|
|
| By: |
/s/ Christopher F. Caridi |
|
|
Christopher F. Caridi |
|
|
Senior Vice President, Chief Accounting Officer and Interim Chief Financial Officer |
|
|
|
|
|
Dated: June 25, 2025 |
|