Financial presentation to accompany management commentary FY25 Q1

The following guidance reflects the Company’s expectations for the second quarter and fiscal year 2025 and is provided on a non-GAAP basis as the Company cannot predict certain elements that are included in reported GAAP results, such as the changes in fair value of the Company’s equity and other investments. Growth rates reflect an adjusted basis for prior year results. Additionally, the Company’s guidance assumes a generally stable consumer and continued pressure from its mix of products and formats globally. The Company’s fiscal year guidance is based on the following FY24 figures: Net sales: $642.6 billion, adjusted operating income1: $27.1 billion, adjusted EPS1 $2.22. Metric Q2 Consolidated net sales (cc) Increase 3.5% to 4.5% Consolidated operating income (cc) Increase 3.0% to 4.5% Adjusted EPS $0.62 to $0.65 Metric FY 2025 (updated) FY 2025 (original) Consolidated net sales (cc) High-end or slightly above original guidance Increase 3.0% to 4.0% Consolidated adj. operating income (cc) High-end or slightly above original guidance Increase 4.0% to 6.0% Interest, net Unchanged from original guidance Increase approximately $100M to $200M Effective tax rate Unchanged from original guidance Approximately 25.0% to 26.0% Non-controlling interest Unchanged from original guidance Relatively flat Adjusted EPS High-end or slightly above original guidance $2.23 to $2.37 Capital expenditures Unchanged from original guidance Approximately 3.0% to 3.5% of net sales 1For relevant reconciliations, see Q4 FY24 earnings release furnished on Form 8-K on February 20, 2024. cc = constant currency Guidance 2

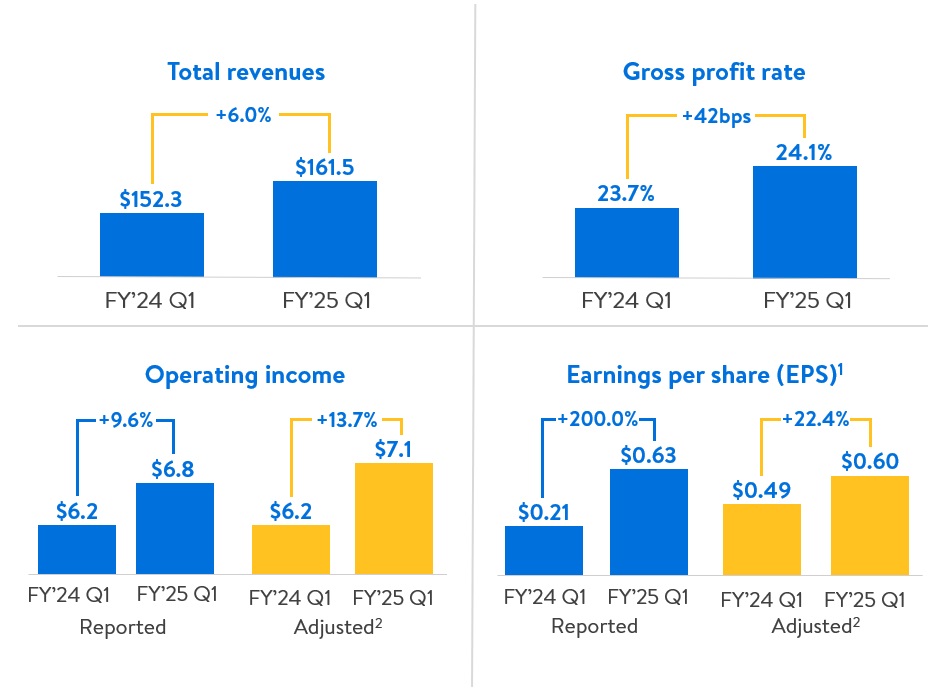
Total revenues (cc)1 $161.1 billion, up +5.8% Amounts in billions, except as noted. Dollar changes may not recalculate due to rounding. • Total revenues reached $161.5 billion with strength across all operating segments • Net sales positively affected by 2024 leap year which contributed approximately 1% to Y/Y growth; positive impact of $0.4 billion from currency fluctuations • Global eCommerce net sales grew by 21% • Strong growth in membership income globallyY/Y Change +7.6% +5.7% +5.2% +5.7% +6.0% Y/Y Change (cc)1 +7.7% +5.4% +4.3% +4.9% +5.8% 1See additional information at the end of this presentation regarding non-GAAP financial measures. Total revenues $152.3 $161.6 $160.8 $173.4 $161.5 Q1 FY24 Q2 FY24 Q3 FY24 Q4 FY24 Q1 FY25 3

• Due to improvements across segments, led by Walmart U.S. • Improvement from continuing to manage pricing aligned to competitive price gaps, lower markdowns as a result of disciplined inventory management, and favorable business mix Y/Y Change -18bps +50bps +32bps +39bps +42bps Gross profit rate 23.7% 24.0% 24.0% 23.3% 24.1% Q1 FY24 Q2 FY24 Q3 FY24 Q4 FY24 Q1 FY25 Gross profit rate +42bps to 24.1% 4

Adjusted operating expenses as a percentage of net sales1, +24bps to 20.6% • Operating expenses deleveraged on a reported basis 40bps driven by higher variable pay expenses due to exceeding planned performance, increased associate pay including previously-announced wage investments, and business reorganization charges in the U.S. • Partially offset by improved leverage in the Walmart International segment • Adjusted1 operating expenses deleveraged 24bps, excluding discrete charges related to business reorganization Y/Y Change -58bps +27bps +37bps +16bps +24bps 20.4% 20.2% 21.0% 20.0% 20.6% Q1 FY24 Q2 FY24 Q3 FY24 Q4 FY24 Q1 FY25 Operating expenses as a percentage of net sales 20.4% 20.3% 21.0% 20.0% 20.8% Q1 FY24 Q2 FY24 Q3 FY24 Q4 FY24 Q1 FY25 Y/Y Change -58bps +33bps -182bps -36bps +40bps Operating expenses as a percentage of net sales Adjusted operating expenses as a percentage of net sales1 1See additional information at the end of this presentation regarding non-GAAP financial measures. 5

1See additional information at the end of this presentation regarding non-GAAP financial measures. Operating income • Adjusted operating income (cc)1 up 12.9% relative to 5.7% growth in net sales (cc)1 • Reflects sales growth, higher gross margins and membership income; partially offset by expense deleverage • Q1 FY25 net income margin increased ~210 bps and adjusted EBITDA margin1 increased ~40bps Operating income Adjusted operating income1 $6.2 $7.3 $6.2 $7.3 $6.8 Q1 FY24 Q2 FY24 Q3 FY24 Q4 FY24 Q1 FY25 Y/Y Change +17.3% +8.1% +3.0% +13.2% +13.7% Y/Y Change (cc)1 +16.0% +6.3% +0.3% +10.9% +12.9% Y/Y Change +17.3% +6.7% +130.1% +30.4% +9.6% Y/Y Change (cc)1 +16.0% +4.9% +124.0% +27.8% +8.8% $6.2 $7.4 $6.2 $7.3 $7.1 Q1 FY24 Q2 FY24 Q3 FY24 Q4 FY24 Q1 FY25 Adjusted operating income1 of $7.1 billion, up 13.7% Amounts in billions, except as noted. Dollar changes may not recalculate due to rounding. 6

1Comparison period per-share amounts and percentage changes have been retroactively adjusted to reflect the February 23, 2024 stock split. 2See additional information at the end of this presentation regarding non-GAAP financial measures. NM = not meaningful Adjusted EPS2 of $0.60, up 22.4% EPS PY $0.43 $0.59 $0.50 $0.57 $0.49 Y/Y Change +14.0% +3.4% +2.0% +5.3% +22.4% • Adjusted EPS2 of $0.60 excludes the effects, net of tax, of $0.05 from net gains on equity and other investments and $0.02 of business reorganization charges Y/Y Change -16.0% +54.0% NM -11.7% +200.0% EPS1 $0.49 $0.61 $0.51 $0.60 $0.60 Q1 FY24 Q2 FY24 Q3 FY24 Q4 FY24 Q1 FY25 $0.21 $0.97 $0.06 $0.68 $0.63 Q1 FY24 Q2 FY24 Q3 FY24 Q4 FY24 Q1 FY25 7 Adjusted EPS1,2

PY $(7.3) $1.7 $3.6 $12.0 $0.2 Y/Y Change NM +414.0% +19.4% +26.2% NM • Operating cash flow decreased $0.4 billion primarily due to changes in working capital assets and liabilities, including timing impacts, partially offset by an increase in cash provided by operating income • Free cash flow1 decreased $0.6 billion due to the decrease in operating cash flow as well as an increase of $0.2 billion in capital expenditures to support strategic investments 1See additional information at the end of this presentation regarding non-GAAP financial measures. NM = not meaningful PY $(3.8) $9.2 $15.7 $28.8 $4.6 Y/Y Change NM +97.0% +21.1% +23.9% -8.3% Operating cash flow Free cash flow1 Cash flow $0.2 $9.0 $4.3 $15.1 $(0.4) Q1 FY24 YTD Q2 FY24 YTD Q3 FY24 YTD Q4 FY24 YTD Q1 FY25 YTD $4.6 $18.2 $19.0 $35.7 $4.2 Q1 FY24 YTD Q2 FY24 YTD Q3 FY24 YTD Q4 FY24 YTD Q1 FY25 YTD Amounts in billions, except as noted. Dollar changes may not recalculate due to rounding. 8

Dividends and share repurchases Amounts in billions, except as noted. Dollar amounts may not recalculate due to rounding. • Share repurchases during the quarter totaled $1.1 billion representing 18.0 million shares, at an average price of $59.05 per share • Remaining share repurchase authorization is $15.5 billion Returns to shareholders $2.2 $2.0 $1.6 $3.0 $2.7 Returns to shareholders $1.5 $1.5 $1.5 $1.5 $1.7 $0.7 $0.5 $0.1 $1.5 $1.1 Dividends Share repurchases Q1 FY24 Q2 FY24 Q3 FY24 Q4 FY24 Q1 FY25 9

Y/Y Change -120bps -100bps +130bps +230bps +230bps • ROI1 increased primarily as a result of an increase in operating income, primarily due to lapping opioid legal charges and business reorganization and restructuring charges recorded in the comparative trailing twelve months, as well as improvements in business performance • Partially offset by an increase in average invested capital primarily due to higher purchases of property and equipment 1See additional information at the end of this presentation regarding non-GAAP financial measures. Return on assets (ROA) Return on investment (ROI)1 Returns Y/Y Change -100bps -20bps +280bps +200bps +340bps 4.5% 5.6% 6.5% 6.6% 7.9% Q1 FY24 Q2 FY24 Q3 FY24 Q4 FY24 Q1 FY25 12.7% 12.8% 14.1% 15.0% 15.0% Q1 FY24 Q2 FY24 Q3 FY24 Q4 FY24 Q1 FY25 10

Net sales +4.6%, eCommerce +22% • Comp sales +3.8% driven by growth in transactions and unit volumes; strong value/convenience proposition resonating with customers ◦ Transactions ex fuel: +3.8% ◦ Average ticket ex fuel: flat • Continued share gains led by higher- income households • eCommerce growth reflects double-digit increases in store-fulfilled pickup and delivery, growth in marketplace due in part to a 36% increase in sellers, and Walmart Connect advertising growth of 26%eCommerce Contribution ~270bps ~230bps ~300bps ~240bps ~280bps Walmart U.S. comp sales1 7.4% 6.4% 4.9% 4.0% 3.8% Q1 FY24 Q2 FY24 Q3 FY24 Q4 FY24 Q1 FY25 1Comp sales for the 13-week period ended April 26, 2024 compared to the 13-week period ended April 28, 2023, and excludes fuel. 11

Remodels: 63 Pickup: ~4,600 stores Delivery from Store: ~4,300 • Managed pricing to maintain strong competitive price gaps to retail market • Benefited from lower markdowns as a result of disciplined inventory management • Advertising and data analytics & insights businesses aided business mix • Offset by category mix pressure as general merchandise sales declined partly due to deflation Gross profit rate +46 bps • Deleverage driven by annualizing of wage investments made last year; higher variable pay expenses as we exceeded our planned performance; and higher depreciation • Reflects impact of discrete charges from business reorganization totaling 12 bps Operating expenses as a percentage of net sales +48 bps • Reflects gross margin expansion and higher Walmart+ membership income, partially offset by expense deleverage • Excluding $130 million in business reorganization costs, adjusted operating income1 grew +9.6% Operating income $5.3 billion, +7.0% • Disciplined inventory management while sustaining strong sales and higher in-stock levels Inventory -4.2% Walmart U.S. 12 1See additional information at the end of this presentation regarding non-GAAP financial measures.

Merchandise category performance details Walmart U.S. Category Comp Comments Grocery + mid single-digit • Strong comps driven by increased transactions and units • Grocery inflation +LSD in Q1 (moderated ~80 bps versus Q4) • Fresh food had strong unit growth led by produce and meats with elevated quality, value and convenience • Consumables had solid unit growth led by personal care, pet supplies and beauty products • Private brand penetration increased ~30 bps Health & Wellness + high single-digit • Reflects increased pharmacy script counts, higher sales mix of branded versus generic prescriptions, and growth in over- the-counter sales General Merchandise - low single-digit • Comp sales reflected softness in entertainment and home due largely to deflation • Unit volumes in hardlines and home increased • Marketplace strength in furniture, sporting goods, and home • Share gains led by higher-income households (per Circana) 13

Net sales (cc)1 $29.4 billion, +10.7% Amounts in billions, except as noted. Dollar changes may not recalculate due to rounding. • Sales growth (cc)1 led by Walmex, China, and Flipkart • Continued strength in food and consumables as well as improved growth in general merchandise • eCommerce sales grew 19% led by store-fulfilled pickup and delivery and marketplace • Growth positively affected by leap day as well as timing of Easter and Chinese New Year • Currency rate fluctuations positively affected sales by $0.4 billionY/Y Change +12.0% +13.3% +10.8% +17.6% +12.1% Net Sales (cc)1,2 $26.6 $27.0 $26.7 $31.2 $29.4 Y/Y Change (cc)1 +12.9% +11.0% +5.4% +13.0% +10.7% Walmart International net sales $26.6 $27.6 $28.0 $32.4 $29.8 Q1 FY24 Q2 FY24 Q3 FY24 Q4 FY24 Q1 FY25 Net sales 1See additional information at the end of this presentation regarding non-GAAP financial measures. 2For Q1 FY24, net sales constant currency reflects reported results for comparison to current quarter growth in constant currency. 14

• Primarily due to improved eCommerce margins and growth in higher-margin services • Partially offset by ongoing channel and format mix changes and investments in price gaps Strong local businesses powered by Walmart 1See additional information at the end of this presentation regarding non-GAAP financial measures. Gross profit rate +32 bps • Strong sales growth combined with disciplined expense management driving leverage • Benefited by ongoing format mix changes Operating expenses as a percentage of net sales -47 bps • Operating income growing double digits with strength across markets and benefiting from lower losses in eCommerce Operating income $1.5 billion, +31.7%; $1.5 billion (cc)1, +27.2% Inventory +3.7% Walmart International • Driven by over 170 new stores in the past 12 months and currency rate fluctuations 15

Sales • Strong performance across categories, including general merchandise • In Mexico, comp sales grew 9.5%, driven by Bodega and Sam's Club • Mexico growth helped by accelerated payments from government social programs, Easter timing, and higher minimum wages • Opened 162 new stores in the past 12 months, including 12 new stores in the quarter Gross profit rate Increase • Lower supply chain costs and growth of higher-margin services Operating expense rate Increase • Primarily due to planned investments in associates and strategic priorities Operating income $ Increase Net sales growth +10.6% +10.1% +9.4% +7.7% +10.8% eCommerce net sales growth +17% +21% +16% +21% +24% 1Results are presented on a constant currency basis. Net sales and comparable sales are presented on a nominal, calendar basis and include eCommerce results. Change is calculated as the change versus the prior year comparable period. 2Walmex includes the consolidated results of Mexico and Central America Walmex1,2 Net sales (cc): $12.1 billion, +10.8% 9.3% 8.7% 8.0% 6.3% 9.2% Q1 FY24 Q2 FY24 Q3 FY24 Q4 FY24 Q1 FY25 Comparable sales growth 16

Net sales growth +6.7% +5.1% +5.3% +1.8% +3.9% eCommerce net sales growth -2% +4% +16% +11% +19% 1Results are presented on a constant currency basis. Net sales and comparable sales are presented on a nominal, calendar basis and include eCommerce results. Change is calculated as the change versus the prior year comparable period. Canada1 Net sales (cc): $5.3 billion, +3.9% 6.3% 4.8% 5.0% 1.5% 3.8% Q1 FY24 Q2 FY24 Q3 FY24 Q4 FY24 Q1 FY25 Sales • Continued strength in food and consumables • Strong eCommerce growth led by store-fulfilled pickup and delivery and marketplace • Celebrated 30th Anniversary alongside multiple festive events Gross profit rate Relatively flat • Lower supply chain costs and shrink offset by investments in price gaps Operating expense rate Relatively flat • Balanced expense management Operating income $ Increase Comparable sales growth 17

Net sales growth +28.3% +21.7% +25.3% +11.3% +16.2% eCommerce net sales growth +54% +44% +38% +11% +23% 1Results are presented on a constant currency basis. Net sales and comparable sales are presented on a nominal, calendar basis and include eCommerce results. Change is calculated as the change versus the prior year comparable period. China1 Net sales (cc): $5.7 billion, +16.2% 25.5% 17.2% 18.6% 6.6% 12.5% Q1 FY24 Q2 FY24 Q3 FY24 Q4 FY24 Q1 FY25 Sales • Continued strength in Sam’s Club and eCommerce • Growth positively affected by a later Chinese New Year shopping season • eCommerce penetration at 43%, up over 200 bps vs Q1 last year • Lapping strong post-covid reopening last year Gross profit rate Decrease • Due to format and channel mix changes, partially offset by lower delivery costs Operating expense rate Decrease • Driven by strong sales growth and format mix changes Operating income $ Increase Comparable sales growth 18

Net sales with fuel +4.6%, Net sales without fuel +5.3%, eCommerce +18% • Solid comp sales driven by increases in transactions and unit volume ◦ Transactions ex fuel: +5.4% ◦ Average ticket ex fuel: -1.0% • Strength in food, consumables, and health & wellness • Gained dollar and unit share in grocery (according to Circana) • eCommerce +18%, led by club-fulfilled curbside pickup and delivery • Scan & Go penetration up over 220 bps • Member's Mark grew high single-digitseComm Cont. without fuel ~160bps ~150bps ~170bps ~190bps ~180bps 1Comp sales for the 13-week period ended April 26, 2024 compared to the 13-week period ended April 28, 2023. Sam’s Club U.S. comp sales1 Sam's Club U.S. comp sales 4.2% (0.2)% 3.3% 1.9% 3.5% 7.0% 5.5% 3.8% 3.1% 4.4% With fuel Without fuel Q1 FY24 Q2 FY24 Q3 FY24 Q4 FY24 Q1 FY25 19

• Reflects impact of lapping LIFO • Benefited from lower markdowns as a result of disciplined inventory management • Continued focus on cost and price to increase value for the member Gross profit rate +58 bps, without fuel +64 bps • Deleverage due to higher incentive costs tied to better-than-expected performance and planned investments in associates and technology Operating expenses as a percentage of net sales +17 bps, without fuel +11 bps • Record highs for total and Plus membership, Plus penetration +330bps Y/Y • Expiration of Sam's Cash offer last year, offsetting fee increase for members Membership income +13.3% Inventory -4.9% Operating income $615M, +34.3%, without fuel $515M, +45.5% • Increased membership income drove operating income growth, as well as a benefit from lapping LIFO • Disciplined inventory management while sustaining strong sales and higher in-stock levels 20 Sam's Club U.S.

Category comparable sales Sam’s Club U.S. Category Comp Comments Fresh / Freezer / Cooler + high single-digit • Fresh meat, produce & floral, prepared foods, and deli performed well Grocery and Beverage + mid single-digit • Dry grocery, snacks, drinks, and candy showed strength Consumables + mid single-digit • Paper goods, laundry & home care, and baby care performed well Home and Apparel - low single-digit • Softness in seasonal and furniture, partially offset by strength in apparel and auto Technology, Office and Entertainment relatively flat • Strength in consumer electronics, gaming, and gift cards, offset by softness in office supplies Health and Wellness + mid teens • Strong performance in pharmacy and over the counter 21

Supplemental Information - FY25 and FY26 Comparable Sales 4-5-4 Reporting Calendars We report U.S. comparable sales on a 13-week and 52-week retail calendar — commonly referred to as a "4-5-4" calendar — which uses 364 days in a year. In certain years, it becomes necessary to add a 53rd week to our comparable sales reporting calendar, which occurs in fiscal 2025. The following tables reflect our period ending dates for the reporting of U.S. comparable sales throughout fiscal 2025 and fiscal 2026. The additional week only affects 4-5-4 comparable sales; all other measures remain unaffected. FY25 Comparable Sales Q1 13 Weeks Ended Q2 13 Weeks Ended Q3 13 Weeks Ended Q4 14 Weeks Ended Full Year 53 Weeks Ended FY25 (53 weeks) April 26, 2024 July 26, 2024 October 25, 2024 January 31, 2025 January 31, 2025 Base: FY24 (53 weeks) April 28, 2023 July 28, 2023 October 27, 2023 February 02, 2024 February 02, 2024 Comparison Period: FY24 Comparable Sales Q1 13 Weeks Ended Q2 13 Weeks Ended Q3 13 Weeks Ended Q4 13 Weeks Ended Full Year 52 Weeks Ended FY24 (52 weeks)1 April 28, 2023 July 28, 2023 October 27, 2023 January 26, 2024 January 26, 2024 Base: FY23 (52 weeks) April 29, 2022 July 29, 2022 October 28, 2022 January 27, 2023 January 27, 2023 FY25 Reporting FY26 Comparable Sales Q1 13 Weeks Ended Q2 13 Weeks Ended Q3 13 Weeks Ended Q4 13 Weeks Ended Full Year 52 Weeks Ended FY26 (52 weeks) May 02, 2025 August 01, 2025 October 31, 2025 January 30, 2026 January 30, 2026 Base: FY25 (52 weeks) May 03, 2024 August 02, 2024 November 01, 2024 January 31, 2025 January 31, 2025 Comparison Period: FY25 Comparable Sales Q1 13 Weeks Ended Q2 13 Weeks Ended Q3 13 Weeks Ended Q4 14 Weeks Ended Full Year 53 Weeks Ended FY25 (53 weeks)1 April 26, 2024 July 26, 2024 October 25, 2024 January 31, 2025 January 31, 2025 Base: FY24 (53 weeks) April 28, 2023 July 28, 2023 October 27, 2023 February 02, 2024 February 02, 2024 FY26 Reporting 1Our comparable sales calculations are based on periods of equal lengths and comparison periods are presented as they were originally reported. If the comparison periods were recast to align to the same number of weeks as the reporting period, any changes to the previously reported comparable sales would be inconsequential. 22

Safe harbor and non-GAAP measures This presentation and related management commentary contains statements that may be "forward-looking statements" as defined in, and are intended to enjoy the protection of the safe harbor for forward- looking statements within the meaning of Section 21E of the Securities Exchange Act of 1934, as amended. Assumptions on which such forward-looking statements are based are also forward-looking statements. Our actual results may differ materially from those expressed in or implied by any of these forward-looking statements as a result of changes in circumstances, assumptions not being realized or other risks, uncertainties and factors including: the impact of the COVID-19 pandemic on our business and the global economy; economic, capital markets and business conditions; trends and events around the world and in the markets in which we operate; currency exchange rate fluctuations, changes in market interest rates and market levels of wages; changes in the size of various markets, including eCommerce markets; unemployment levels; inflation or deflation, generally and in particular product categories; consumer confidence, disposable income, credit availability, spending levels, shopping patterns, debt levels and demand for certain merchandise; the effectiveness of the implementation and operation of our strategies, plans, programs and initiatives; unexpected changes in our objectives and plans; the impact of acquisitions, investments, divestitures, store or club closures, and other strategic decisions; our ability to successfully integrate acquired businesses, including within the eCommerce space; changes in the trading prices of certain equity investments we hold; initiatives of competitors, competitors' entry into and expansion in our markets, and competitive pressures; customer traffic and average ticket in our stores and clubs and on our eCommerce websites; the mix of merchandise we sell, the cost of goods we sell and the shrinkage we experience; trends in consumer shopping habits around the world and in the markets in which we operate; our gross profit margins; the financial performance of Walmart and each of its segments, including the amounts of our cash flow during various periods; changes in the credit ratings assigned to our commercial paper and debt securities by credit rating agencies; the amount of our net sales and operating expenses denominated in the U.S. dollar and various foreign currencies; transportation, energy and utility costs; commodity prices and the price of gasoline and diesel fuel; supply chain disruptions and disruptions in seasonal buying patterns; the availability of goods from suppliers and the cost of goods acquired from suppliers; consumer acceptance of and response to our stores, clubs, eCommerce platforms, programs, merchandise offerings and delivery methods; cyber security events affecting us and related costs and impact to the business; developments in, outcomes of, and costs incurred in legal or regulatory proceedings to which we are a party or are subject, and the liabilities, obligations and expenses, if any, that we may incur in connection therewith; casualty and accident-related costs and insurance costs; the turnover in our workforce and labor costs, including healthcare and other benefit costs; consumer enrollment in health and drug insurance programs and such programs’ reimbursement rates and drug formularies; our effective tax rate and the factors affecting our effective tax rate, including assessments of certain tax contingencies, valuation allowances, changes in law, administrative audit outcomes, impact of discrete items and the mix of earnings between the U.S. and Walmart's international operations; changes in existing tax, labor and other laws and regulations and changes in tax rates including the enactment of laws and the adoption and interpretation of administrative rules and regulations; the imposition of new taxes on imports, new tariffs and changes in existing tariff rates; the imposition of new trade restrictions and changes in existing trade restrictions; adoption or creation of new, and modification of existing, governmental policies, programs, initiatives and actions in the markets in which Walmart operates and elsewhere and actions with respect to such policies, programs and initiatives; changes in accounting estimates or judgments; the level of public assistance payments; natural disasters, changes in climate, geopolitical events and catastrophic events; and changes in generally accepted accounting principles in the United States. Our most recent annual report on Form 10-K filed with the SEC discusses other risks and factors that could cause actual results to differ materially from those expressed or implied by any forward-looking statement in the presentations. We urge you to consider all of the risks, uncertainties and factors identified above or discussed in such reports carefully in evaluating the forward-looking statements in this release. Walmart cannot assure you that the results reflected in or implied by any forward-looking statement will be realized or, even if substantially realized, that those results will have the forecasted or expected consequences and effects for or on our operations or financial performance. The forward-looking statements made in the presentation are as of the date of this meeting. Walmart undertakes no obligation to update these forward-looking statements to reflect subsequent events or circumstances. This presentation includes certain non-GAAP measures as defined under SEC rules, including net sales, revenue, and operating income on a constant currency basis, adjusted operating expenses as a percentage of net sales, adjusted operating income, adjusted EPS, free cash flow, return on investment, and adjusted EBITDA and adjusted EBITDA margin. Refer to information about the non-GAAP measures contained in this presentation. Additional information as required by Regulation G and Item 10(e) of Regulation S-K regarding non-GAAP measures can be found in our most recent Form 10-K and our Form 8-K furnished as of the date of this presentation with the SEC, which are available at stock.walmart.com. 23

Non-GAAP measures – ROI We include return on assets ("ROA"), which is calculated in accordance with U.S. generally accepted accounting principles ("GAAP") as well as return on investment ("ROI") as measures to assess returns on assets. Management believes ROI is a meaningful measure to share with investors because it helps investors assess how effectively Walmart is deploying its assets. Trends in ROI can fluctuate over time as management balances long-term strategic initiatives with possible short-term impacts. We consider ROA to be the financial measure computed in accordance with GAAP that is the most directly comparable financial measure to our calculation of ROI. ROA was 7.9 percent and 4.5 percent for the trailing twelve months ended April 30, 2024 and 2023, respectively. The increase in ROA was primarily due to an increase in consolidated net income during the trailing twelve month period, as a result of higher operating income and changes in the fair value of our equity and other investments. ROI was 15.0 percent and 12.7 percent for the trailing twelve months ended April 30, 2024 and 2023, respectively. The increase in ROI was the result of an increase in operating income, primarily due to lapping opioid legal charges as well as business reorganization and restructuring charges incurred in the comparative trailing twelve months, as well as improvements in business performance, partially offset by an increase in average invested capital primarily due to higher purchases of property and equipment. We define ROI as operating income plus interest income, depreciation and amortization, and rent expense for the trailing twelve months divided by average invested capital during that period. We consider average invested capital to be the average of our beginning and ending total assets, plus average accumulated depreciation and average amortization, less average accounts payable and average accrued liabilities for that period. Our calculation of ROI is considered a non-GAAP financial measure because we calculate ROI using financial measures that exclude and include amounts that are included and excluded in the most directly comparable GAAP financial measure. For example, we exclude the impact of depreciation and amortization from our reported operating income in calculating the numerator of our calculation of ROI. As mentioned above, we consider ROA to be the financial measure computed in accordance with generally accepted accounting principles most directly comparable to our calculation of ROI. ROI differs from ROA (which is consolidated net income for the period divided by average total assets for the period) because ROI: adjusts operating income to exclude certain expense items and adds interest income; adjusts total assets for the impact of accumulated depreciation and amortization, accounts payable and accrued liabilities to arrive at total invested capital. Because of the adjustments mentioned above, we believe ROI more accurately measures how we are deploying our key assets and is more meaningful to investors than ROA. Although ROI is a standard financial measure, numerous methods exist for calculating a company’s ROI. As a result, the method used by management to calculate our ROI may differ from the methods used by other companies to calculate their ROI. 24

The calculation of ROA and ROI, along with a reconciliation of ROI to the calculation of ROA, is as follows: Non-GAAP measures – ROI (cont.) CALCULATION OF RETURN ON ASSETS Trailing Twelve Months Ending Apr 30, Jul 31, Oct 31, Jan 31, Apr 30, (Dollars in millions) 2023 2023 2023 2024 2024 Numerator Consolidated net income $ 11,085 $ 13,991 $ 16,401 $ 16,270 $ 19,681 Denominator Average total assets1 $ 245,598 $ 251,160 $ 253,415 $ 247,798 $ 249,554 Return on assets (ROA) 4.5 % 5.6 % 6.5 % 6.6 % 7.9 % Apr 30, Jul 31, Oct 31, Jan 31, Apr 30, Jul 31, Oct 31, Jan 31, Apr 30, Certain Balance Sheet Data 2022 2022 2022 2023 2023 2023 2023 2024 2024 Total assets $ 246,142 $ 247,199 $ 247,656 $ 243,197 $ 245,053 $ 255,121 $ 259,174 $ 252,399 $ 254,054 Accumulated depreciation and amortization 104,295 105,963 107,628 110,286 113,164 115,878 118,122 119,602 118,518 Accounts payable 52,926 54,191 57,263 53,742 54,268 56,576 61,049 56,812 56,071 Accrued liabilities 21,061 23,843 27,443 31,126 27,527 29,239 26,132 28,759 24,092 1The average is based on the addition of the account balance at the end of the current period to the account balance at the end of the prior period and dividing by 2 25

The calculation of ROA and ROI, along with a reconciliation of ROI to the calculation of ROA, is as follows: Non-GAAP measures – ROI (cont.) CALCULATION OF RETURN ON INVESTMENT Trailing Twelve Months Ending Apr 30, Jul 31, Oct 31, Jan 31, Apr 30, (Dollars in millions) 2023 2023 2023 2024 2024 Numerator Operating income $ 21,350 $ 21,812 $ 25,319 $ 27,012 $ 27,613 + Interest income 323 442 504 546 553 + Depreciation and amortization 11,110 11,318 11,547 11,853 12,136 + Rent 2,301 2,284 2,286 2,277 2,291 ROI operating income $ 35,084 $ 35,856 $ 39,656 $ 41,688 $ 42,593 Denominator Average total assets1 $ 245,598 $ 251,160 $ 253,415 $ 247,798 $ 249,554 '+ Average accumulated depreciation and amortization1 108,730 110,921 112,875 114,944 115,841 '- Average accounts payable1 53,597 55,384 59,156 55,277 55,170 '- Average accrued liabilities1 24,294 26,541 26,788 29,943 25,810 Average invested capital $ 276,437 $ 280,156 $ 280,346 $ 277,522 $ 284,415 Return on investment (ROI) 12.7 % 12.8 % 14.1 % 15.0 % 15.0 % 1The average is based on the addition of the account balance at the end of the current period to the account balance at the end of the prior period and dividing by 2 26

Non-GAAP measures – free cash flow We define free cash flow as net cash provided by operating activities in a period minus payments for property and equipment made in that period. Net cash provided by operating activities was $4.2 billion for the three months ended April 30, 2024, which represents a decrease of $0.4 billion when compared to the same period in the prior year. The decrease was primarily due to changes in working capital assets and liabilities, including timing impacts, partially offset by an increase in cash provided by operating income. Free cash flow for the three months ended April 30, 2024 was negative $0.4 billion, which represents a decrease of $0.6 billion when compared to the same period in the prior year. The decrease in free cash flow was due to the decrease in net cash provided by operating activities described above and an increase of $0.2 billion in capital expenditures to support our investment strategy. Free cash flow is considered a non-GAAP financial measure. Management believes, however, that free cash flow, which measures our ability to generate additional cash from our business operations, is an important financial measure for use in evaluating the Company's financial performance. Free cash flow should be considered in addition to, rather than as a substitute for, consolidated net income as a measure of our performance and net cash provided by operating activities as a measure of our liquidity. Additionally, Walmart’s definition of free cash flow is limited, in that it does not represent residual cash flows available for discretionary expenditures, due to the fact that the measure does not deduct the payments required for debt service and other contractual obligations or payments made for business acquisitions. Therefore, we believe it is important to view free cash flow as a measure that provides supplemental information to our Condensed Consolidated Statements of Cash Flows. Although other companies report their free cash flow, numerous methods may exist for calculating a company’s free cash flow. As a result, the method used by Walmart’s management to calculate our free cash flow may differ from the methods used by other companies to calculate their free cash flow. 27

Non-GAAP measures – free cash flow (cont.) The following table sets forth a reconciliation of free cash flow, a non-GAAP financial measure, to net cash provided by operating activities, which we believe to be the GAAP financial measure most directly comparable to free cash flow, as well as information regarding net cash used in investing activities and net cash provided by (used in) financing activities. Year to Date Period Ended (Dollars in millions) Q1 FY24 Q2 FY24 Q3 FY24 Q4 FY24 Q1 FY25 Net cash provided by operating activities $ 4,633 $ 18,201 $ 19,014 $ 35,726 $ 4,249 Payments for property and equipment (capital expenditures) (4,429) (9,216) (14,674) (20,606) (4,676) Free cash flow $ 204 $ 8,985 $ 4,340 $ 15,120 $ (427) Net cash used in investing activities1 $ (4,860) $ (9,909) $ (15,374) $ (21,287) $ (4,409) Net cash provided by (used in) financing activities $ 1,940 $ (3,309) $ (179) $ (13,414) $ (321) Year to Date Period Ended (Dollars in millions) Q1 FY23 Q2 FY23 Q3 FY23 Q4 FY23 Q1 FY24 Net cash provided by (used in) operating activities $ (3,758) $ 9,240 $ 15,698 $ 28,841 $ 4,633 Payments for property and equipment (capital expenditures) (3,539) (7,492) (12,061) (16,857) (4,429) Free cash flow $ (7,297) $ 1,748 $ 3,637 $ 11,984 $ 204 Net cash used in investing activities1 $ (4,558) $ (8,584) $ (12,965) $ (17,722) $ (4,860) Net cash provided by (used in) financing activities 5,315 (1,400) (5,581) (17,039) 1,940 Y/Y change in free cash flow NM +414.0 % +19.3 % +26.2 % NM 1 "Net cash used in investing activities" includes payments for property and equipment, which is also included in our computation of free cash flow. NM = not meaningful 28

Non-GAAP measures – constant currency In discussing our operating results, the term currency exchange rates refers to the currency exchange rates we use to convert the operating results for countries where the functional currency is not the U.S. dollar into U.S. dollars. We calculate the effect of changes in currency exchange rates as the difference between current period activity translated using the current period's currency exchange rates and the comparable prior year period's currency exchange rates. Additionally, no currency exchange rate fluctuations are calculated for non-USD acquisitions until owned for 12 months. Throughout our discussion, we refer to the results of this calculation as the impact of currency exchange rate fluctuations. When we refer to constant currency operating results, this means operating results without the impact of the currency exchange rate fluctuations. The disclosure of constant currency amounts or results permits investors to better understand Walmart’s underlying performance without the effects of currency exchange rate fluctuations. The table below reflects the calculation of constant currency for net sales for the Walmart International segment for the trailing five quarters and operating income for the current quarter. Three Months Ended Walmart International (Dollars in millions) Q1 FY24 Q2 FY24 Q3 FY24 Q4 FY24 Q1 FY25 Net sales: As reported $ 26,604 $ 27,596 $ 28,022 $ 32,419 $ 29,833 Currency exchange rate fluctuations 226 (574) (1,357) (1,259) (385) Net sales (cc) $ 26,830 $ 27,022 $ 26,665 $ 31,160 $ 29,448 PY Reported $ 23,763 $ 24,350 $ 25,295 $ 27,575 $ 26,604 % change (cc) +12.9 % +11.0 % +5.4 % +13.0 % +10.7 % Operating income: As reported $ 1,533 Currency exchange rate fluctuations $ (52) Operating income (cc) $ 1,481 PY Reported $ 1,164 % change (cc) +27.2 % 29

Non-GAAP measures – constant currency (cont.) Three Months Ended Consolidated (Dollars in millions) Q1 FY24 Q2 FY24 Q3 FY24 Q4 FY24 Q1 FY25 Total revenues: As reported $ 152,301 $ 161,632 $ 160,804 $ 173,388 $ 161,508 Currency exchange rate fluctuations 230 (576) (1,366) (1,268) (386) Total Revenue (cc) $ 152,531 $ 161,056 $ 159,438 $ 172,120 $ 161,122 PY Reported $ 141,569 $ 152,859 $ 152,813 $ 164,048 $ 152,301 % change (cc) +7.7 % +5.4 % +4.3 % +4.9 % +5.8 % Net sales: As reported $ 151,004 $ 160,280 $ 159,439 $ 171,914 $ 159,938 Currency exchange rate fluctuations 226 (574) (1,357) (1,259) (385) Net sales (cc) $ 151,230 $ 159,706 $ 158,082 $ 170,655 $ 159,553 PY Reported $ 140,288 $ 151,381 $ 151,469 $ 162,743 $ 151,004 % change (cc) +7.8 % +5.5 % +4.4 % +4.9 % +5.7 % Operating income: As reported $ 6,240 $ 7,316 $ 6,202 $ 7,254 $ 6,841 Currency exchange rate fluctuations (72) (124) (164) (146) (52) Operating income (cc) $ 6,168 $ 7,192 $ 6,038 $ 7,108 $ 6,789 PY Reported $ 5,318 $ 6,854 $ 2,695 $ 5,561 $ 6,240 % change (cc) +16.0 % +4.9 % +124.0 % +27.8 % +8.8 % The table below reflects the calculation of constant currency for total revenues, net sales and operating income for the trailing five quarters. 30

Non-GAAP measures – adjusted operating expenses as a percentage of net sales Three Months Ended (Dollars in millions) Q1 FY24 Q1 FY23 Q2 FY24 Q2 FY23 Q3 FY24 Q3 FY23 Q4 FY24 Q4 FY23 Q1 FY25 Q1 FY24 Operating, selling, general and administrative expenses $ 30,777 $ 29,404 $ 32,466 $ 30,167 $ 33,419 $ 34,505 $ 34,309 $ 33,064 $ 33,236 $ 30,777 Less: Business reorganization and restructuring charges1 — — — — — — — 849 255 — Less: Opioid legal charges2 — — 93 — — 3,325 — — — — Adjusted operating expenses $ 30,777 $ 29,404 $ 32,373 $ 30,167 $ 33,419 $ 31,180 $ 34,309 $ 32,215 $ 32,981 $ 30,777 Net sales $ 151,004 $ 140,288 $ 160,280 $ 151,381 $ 159,439 $ 151,469 $ 171,914 $ 162,743 $ 159,938 $ 151,004 Operating, selling, general and administrative expenses as a percentage of net sales +20.4 % +21.0 % +20.3 % +19.9 % +21.0 % +22.8 % +20.0 % +20.3 % +20.8 % +20.4 % Adjusted operating expenses as a percentage of net sales +20.4 % +21.0 % +20.2 % +19.9 % +21.0 % +20.6 % +20.0 % +19.8 % +20.6 % +20.4 % Y/Y Change (bps) (58) NP 27 NP 37 NP 16 NP 24 NP 1Business reorganization and restructuring charges in the fourth quarter of fiscal 2023 primarily relate to compensation expenses incurred in connection with the strategic decisions made in the Walmart International segment. Business reorganization charges in the first quarter of fiscal 2025 primarily relate to expenses incurred in connection with strategic decisions made in the Walmart U.S. segment, as well as incremental business reorganization expenses recorded in Corporate and support. 2Recorded in Corporate and support. NP = not provided Adjusted operating expenses as a percentage of net sales is considered a non-GAAP financial measure under the SEC’s rules because it excludes certain charges included in operating, selling, general and administrative expenses calculated in accordance with GAAP. Management believes that adjusted operating expenses as a percentage of net sales is a meaningful measure to share with investors because it best allows comparison of performance with that of the comparable period. In addition, adjusted operating expenses as a percentage of net sales affords investors a view of what management considers Walmart’s core operating expenses and the ability to make a more informed assessment of such core operating expenses as compared with that of the prior year. The table below reflects the calculation of adjusted operating expenses as a percentage of net sales for the trailing five quarters. 31

Non-GAAP measures – adjusted operating income Three Months Ended Consolidated (Dollars in millions) Q1 FY24 Q1 FY23 Q2 FY24 Q2 FY23 Q3 FY24 Q3 FY23 Q4 FY24 Q4 FY23 Q1 FY25 Q1 FY24 Operating income: Operating income, as reported $ 6,240 $ 5,318 $ 7,316 $ 6,854 $ 6,202 $ 2,695 $ 7,254 $ 5,561 $ 6,841 $ 6,240 Business reorganization and restructuring charges1 — — — — — — — 849 255 — Opioid legal charges2 — — 93 — — 3,325 — — — — Adjusted operating income $ 6,240 $ 5,318 $ 7,409 $ 6,854 $ 6,202 $ 6,020 $ 7,254 $ 6,410 $ 7,096 $ 6,240 Percent change3 +17.3 % NP +8.1 % NP +3.0 % NP +13.2 % NP +13.7 % NP Currency exchange rate fluctuations $ (72) — $ (124) $ — $ (164) $ — $ (146) $ — $ (52) $ — Adjusted operating income, constant currency $ 6,168 $ 5,318 $ 7,285 $ 6,854 $ 6,038 $ 6,020 $ 7,108 $ 6,410 $ 7,044 $ 6,240 Percent change3 +16.0 % NP +6.3 % NP +0.3 % NP +10.9 % NP +12.9 % NP Adjusted operating income is considered a non-GAAP financial measure under the SEC’s rules because it excludes certain charges included in operating income calculated in accordance with GAAP. Management believes that adjusted operating income is a meaningful measure to share with investors because it best allows comparison of performance with that of the comparable period. In addition, adjusted operating income affords investors a view of what management considers Walmart’s core earnings performance and the ability to make a more informed assessment of such core earnings performance as compared with that of the prior year. When we refer to adjusted operating income in constant currency, this means adjusted operating results without the impact of the currency exchange rate fluctuations. The disclosure of constant currency amounts or results permits investors to better understand Walmart’s underlying performance without the effects of currency exchange rate fluctuations. The table below reflects the calculation of adjusted operating income and adjusted operating income in constant currency, when applicable, for the trailing five quarters. 1Business reorganization and restructuring charges in the fourth quarter of fiscal 2023 primarily relate to compensation expenses incurred in connection with the strategic decisions made in the Walmart International segment. Business reorganization charges in the first quarter of fiscal 2025 primarily relate to expenses incurred in connection with strategic decisions made in the Walmart U.S. segment, as well as incremental business reorganization expenses recorded in Corporate and support. 2Recorded in Corporate and support. 3Change versus prior year comparable period. NP = not provided 32

Non-GAAP measures – adjusted operating income (cont.) Three Months Ended Walmart U.S. (Dollars in millions) Q1 FY25 Q1 FY24 Operating income: Operating income, as reported $ 5,332 $ 4,984 Business reorganization charges1 130 — Adjusted operating income $ 5,462 $ 4,984 Percent change2 +9.6 % NP 1Business reorganization charges relate to expenses incurred in connection with strategic decisions made in the Walmart U.S. segment. 2Change versus prior year comparable period. NP = not provided The table below reflects the calculation of adjusted operating income for the three months ended April 30, 2024 and April 30, 2023 for the Walmart U.S. segment. 33

Non-GAAP measures – adjusted EPS Adjusted diluted earnings per share attributable to Walmart (Adjusted EPS) is considered a non-GAAP financial measure under the SEC’s rules because it excludes certain amounts included in the diluted earnings per share attributable to Walmart calculated in accordance with GAAP (EPS), the most directly comparable financial measure calculated in accordance with GAAP. Management believes that Adjusted EPS is a meaningful measure to share with investors because it best allows comparison of the performance with that of the comparable period. In addition, Adjusted EPS affords investors a view of what management considers Walmart’s core earnings performance and the ability to make a more informed assessment of such core earnings performance with that of the prior year. We adjust for the unrealized and realized gains and losses on our equity and other investments each quarter because although the investments are strategic decisions for our retail operations, management’s measurement of each strategy is primarily focused on the operational results rather than the fair value of such investments. Additionally, management does not forecast changes in the fair value of its equity and other investments. Accordingly, management adjusts EPS each quarter for the unrealized and realized gains and losses related to those investments. We have calculated Adjusted EPS for the trailing five quarters as well as the prior year comparable periods by adjusting EPS for the relevant adjustments for each period presented. Three Months Ended Apr 30, 20243 Three Months Ended Apr 30, 20233 Percent Change Diluted earnings per share: Reported EPS $0.63 $0.21 +200.0% Adjustments: Pre-Tax Impact Tax Impact1,4 NCI Impact2 Net Impact Pre-Tax Impact Tax Impact1,4 NCI Impact2 Net Impact Unrealized and realized (gains) and losses on equity and other investments5 $(0.08) $0.03 $— $(0.05) $0.38 $(0.10) $— $0.28 Business reorganization charges6 0.03 -0.01 — 0.02 — — — Net Adjustments $(0.03) $0.28 Adjusted EPS $0.60 $0.49 +22.4% 1 Tax impact calculated based on nature of item, including any realizable deductions, and statutory rate in effect for relevant jurisdictions. 2 Calculated based on the ownership percentages of our noncontrolling interests, where applicable. 3Individual components in the accompanying tables may include immaterial rounding, including per-share amounts and percentage changes retroactively adjusted to reflect the February 23, 2024 stock split. 4 The reported effective tax rate was 24.6% and 29.5% for the three months ended April 30, 2024 and April 30, 2023, respectively. Adjusted for the above items, the effective tax rate was 24.3% and 26.5% for the three months ended April 30, 2024 and April 30, 2023, respectively. 5For the three months ended April 30, 2024, net gains were primarily driven by an increase in the underlying stock price of our investment in JD.com, partially offset by a decrease in the underlying stock price of our investment in Symbotic. For the three months ended April 30, 2023, net losses were primarily driven by a decrease in the underlying stock price of our investment in JD.com. 6Business reorganization charges primarily relate to expenses incurred in connection with strategic decisions made in the Walmart U.S. segment, as well as incremental business reorganization expenses recorded in Corporate and support. 34

Non-GAAP measures – adjusted EPS (cont.) Three Months Ended Jan 31, 20243 Three Months Ended Jan 31, 20233 Percent Change Diluted earnings per share: Reported EPS $0.68 $0.77 -11.7% Adjustments: Pre-Tax Impact Tax Impact1 NCI Impact2 Net Impact Pre-Tax Impact Tax Impact1 NCI Impact2 Net Impact Unrealized and realized (gains) and losses on equity and other investments $(0.10) $0.02 $— $(0.08) $(0.47) $0.09 $— $(0.38) Business reorganization and restructuring charges — — — — 0.10 0.13 (0.05) 0.18 Net Adjustments $(0.08) $(0.20) Adjusted EPS $0.60 $0.57 +5.3% Three Months Ended Oct 31, 20233 Three Months Ended Oct 31, 20223 Percent Change Diluted earnings per share: Reported EPS $0.06 $(0.22) NM Adjustments: Pre-Tax Impact Tax Impact1 NCI Impact2 Net Impact Pre-Tax Impact Tax Impact1 NCI Impact2 Net Impact Unrealized and realized (gains) and losses on equity and other investments $0.59 $(0.14) $— $0.45 $0.45 $(0.08) $— $0.37 Opioid legal charges — — — — 0.41 (0.06) — 0.35 Net Adjustments $0.45 $0.72 Adjusted EPS4 $0.51 $0.50 +2.0% 1Tax impact calculated based on nature of item, including any realizable deductions, and statutory rate in effect for relevant jurisdictions. 2Calculated based on the ownership percentages of our noncontrolling interests, where applicable. 3Individual components in the accompanying tables may include immaterial rounding, including per-share amounts and percentage changes retroactively adjusted to reflect the February 23, 2024 stock split. 4Adjusted EPS for the three months ended October 31, 2022 was calculated using weighted average shares outstanding of 8,161 million, which includes the dilutive impact of share-based payment awards. 35

Non-GAAP measures – adjusted EPS (cont.) Three Months Ended Jul 31, 20233 Three Months Ended Jul 31, 20223 Percent Change Diluted earnings per share: Reported EPS $0.97 $0.63 +54.0% Adjustments: Pre-Tax Impact Tax Impact1 NCI Impact2 Net Impact Pre-Tax Impact Tax Impact1 NCI Impact2 Net Impact Unrealized and realized (gains) and losses on equity and other investments $(0.48) $0.11 $— $(0.37) $0.05 $(0.02) $— $0.03 Incremental opioid settlement expense 0.01 — — 0.01 — — — — Gain on sale of equity method investment in Brazil — — — — (0.05) — — (0.05) Discrete tax item — — — — — (0.02) — (0.02) Net Adjustments $(0.36) $(0.04) Adjusted EPS $0.61 $0.59 +3.4% Three Months Ended Apr 30, 20233 Three Months Ended Apr 30, 20223 Percent Change Diluted earnings per share: Reported EPS $0.21 $0.25 -16.0% Adjustments: Pre-Tax Impact Tax Impact1 NCI Impact2 Net Impact Pre-Tax Impact Tax Impact1 NCI Impact2 Net Impact Unrealized and realized (gains) and losses on equity and other investments $0.38 $(0.10) $— $0.28 $0.24 $(0.06) $— $0.18 Net Adjustments $0.28 $0.18 Adjusted EPS $0.49 $0.43 +14.0% 1Tax impact calculated based on nature of item, including any realizable deductions, and statutory rate in effect for relevant jurisdictions. 2Calculated based on the ownership percentages of our noncontrolling interests, where applicable. 3Individual components in the accompanying tables may include immaterial rounding, including per-share amounts and percentage changes retroactively adjusted to reflect the February 23, 2024 stock split. 36

Non-GAAP measures – adjusted EBITDA and adjusted EBITDA margin The calculation of net income (loss) margin and adjusted EBITDA margin, along with a reconciliation of adjusted EBITDA margin to the calculation of net income (loss) margin, is as follows: Three Months Ended (Dollars in millions) Q1 FY25 Q1 FY24 Consolidated net income attributable to Walmart $ 5,104 $ 1,673 Consolidated net income attributable to noncontrolling interest 203 223 Provision for income taxes 1,728 792 Other (gains) and losses (794) 2,995 Interest, Net 600 557 Operating Income $ 6,841 $ 6,240 + Depreciation and Amortization 3,128 2,845 + Business reorganization charges 255 — Adjusted EBITDA $ 10,224 $ 9,085 Net Sales $ 159,938 $ 151,004 Consolidated net income margin 3.2 % 1.1 % Adjusted EBITDA margin 6.4 % 6.0 % We include net income and net income margin, which are calculated in accordance with U.S. generally accepted accounting principle as well as adjusted EBITDA and adjusted EBITDA margin to provide meaningful information about our operational efficiency compared with our competitors by excluding the impact of certain items. We calculate adjusted EBITDA as earnings before interest, taxes, depreciation and amortization. We also exclude other gains and losses, which is primarily comprised of fair value adjustments on our investments which management does not believe are indicative of our core business performance. From time to time, we will also adjust certain items from operating income, which we believe is meaningful because it best allows comparison of the performance with that of the comparable period. Adjusted EBITDA margin is calculated by dividing adjusted EBITDA by consolidated net sales. Adjusted EBITDA and adjusted EBITDA margin are considered non-GAAP financial measures. Management believes, however, that these measures provide meaningful information about our operational efficiency by excluding the impact of differences in tax jurisdictions and structures, debt levels, capital investments and other items which management does not believe are indicative of our core business performance. We consider net income to be the financial measure computed in accordance with GAAP that is the most directly comparable financial measure to our calculation of adjusted EBITDA. We consider net income margin to be the financial measure computed in accordance with GAAP that is the most directly comparable financial measure to our calculation of adjusted EBITDA margin. Although adjusted EBITDA and adjusted EBITDA margin are standard financial measures, numerous methods exist for calculating a company’s adjusted EBITDA and adjusted EBITDA margin. As a result, the method used by management to calculate our adjusted EBITDA and adjusted EBITDA margin may differ from the methods used by other companies to calculate similarly titled measures. Net income margin was 3.2% and 1.1% for the three months ended April 30, 2024 and 2023, respectively. The increase in net income margin was primarily due to the increase in net income, as a result of changes in the fair value of our equity and other investments and higher operating income. Adjusted EBITDA margin was 6.4% and 6.0% for the three months ended April 30, 2024 and 2023, respectively. The increase in adjusted EBITDA margin was primarily due to adjusted operating income growth outpacing sales growth. 37