UNITED STATES
SECURITIES AND EXCHANGE COMMISSION
Washington, D.C. 20549
FORM 8-K
CURRENT REPORT
Pursuant to Section 13 OR 15(d) of The Securities Exchange Act of 1934
May 1, 2024
Date of Report (Date of earliest event reported)
Valmont Industries, Inc.
(Exact name of registrant as specified in its charter)
Delaware
(State or other jurisdiction of incorporation)
1-31429 |
47-0351813 |
|
(Commission File Number) |
|
(IRS Employer Identification No.) |
|
|
|
15000 Valmont Plaza |
|
68154 |
Omaha, Nebraska |
|
|
(Address of principal executive offices) |
|
(Zip Code) |
(402) 963-1000
Registrant's telephone number, including area code
N/A
(Former name or former address, if changed since last report.)
Check the appropriate box below if the Form 8-K filing is intended to simultaneously satisfy the filing obligation of the registrant under any of the following provisions (see General Instruction A.2. below):
☐ Written communications pursuant to Rule 425 under the Securities Act (17 CFR 230.425)
☐ Soliciting material pursuant to Rule 14a-12 under the Exchange Act (17 CFR 240.14a-12)
☐ Pre-commencement communications pursuant to Rule 14d-2(b) under the Exchange Act (17 CFR 240.14d-2(b))
☐ Pre-commencement communications pursuant to Rule 13e-4(c) under the Exchange Act (17 CFR 240.13e-4(c))
Securities registered pursuant to Section 12(b) of the Act:
Title of each class |
|
Trading Symbol(s) |
|
Name of each exchange on which registered |
Common Stock, $1.00 par value |
|
VMI |
|
New York Stock Exchange |
Indicate by check mark whether the registrant is an emerging growth company as defined in Rule 405 of the Securities Act of 1933 (§230.405 of this chapter) or Rule 12b-2 of the Securities Exchange Act of 1934 (§240.12b-2 of this chapter).
Emerging growth company ☐
If an emerging growth company, indicate by check mark if the registrant has elected not to use the extended transition period for complying with any new or revised financial accounting standards provided pursuant to Section 13(a) of the Exchange Act.
☐
Item 2.02. Results of Operations and Financial Condition.
Valmont Industries, Inc. issued a press release on May 1, 2024 announcing its financial results for its fiscal quarter ended March 30, 2024. The press release, along with the presentation to be used during its earnings call on May 2, 2024, are furnished with this Form 8-K as Exhibit 99.1 and Exhibit 99.2, respectively.
The information in this Item 2.02 is being furnished and shall not be deemed “filed” for the purpose of Section 18 of the Securities Exchange Act of 1934, as amended, or otherwise subject to the liabilities of that section. The information in this Item 2.02 shall not be incorporated by reference into any registration statement or other document pursuant to the Securities Act of 1933, as amended.
Item 9.01. Financial Statements and Exhibits.
(d) Exhibits.
Exhibit No. |
|
Description |
99.1 |
|
|
99.2 |
|
|
104 |
|
Cover Page Interactive File (the cover page XBRL tags are embedded in the Inline XBRL document) |
SIGNATURES
Pursuant to the requirements of the Securities Exchange Act of 1934, the registrant has duly caused this report to be signed on its behalf by the undersigned hereunto duly authorized.
|
|
Valmont Industries, Inc. |
||
Date: |
May 1, 2024 |
|
|
|
|
By: |
/s/ TIMOTHY P. FRANCIS |
||
|
|
Name: |
Timothy P. Francis |
|
|
|
Title: |
Interim Chief Financial Officer |
|

Exhibit 99.1
|
FOR IMMEDIATE RELEASE |
||
|
|
|
|
Contact: |
Renee Campbell |
|
|
Email: |
renee.campbell@valmont.com |
|
|
Date: |
May 1, 2024 |
|
|
Valmont Reports First Quarter 2024 Results
and Raises Full-Year 2024 Guidance
OMAHA, Neb.-- Valmont® Industries, Inc. (NYSE: VMI), a global leader that provides vital infrastructure and advances agricultural productivity while driving innovation through technology, today reported financial results for the first quarter ended March 30, 2024.
President and Chief Executive Officer Avner M. Applbaum commented, “We are pleased to have achieved strong quarterly results that reflect our team’s focus on execution and commitment to enhancing shareholder value. We meaningfully expanded margins year-over-year on lower sales through successful commercial execution, improved operational efficiencies in our facilities, and reduced SG&A expenses due to structural cost improvement actions taken in late 2023. In Infrastructure, our strong results reflect continued robust utility market demand and effective pricing strategies across the portfolio, and we achieved another quarter of operating margin improvement year-over-year even as telecommunications markets remain muted. In Agriculture, as expected, sales in North America and Brazil were lower as backlog levels in those regions normalized this year compared to the first quarter of 2023, and we continue to see soft but stable market demand amid lower grain prices. Our performance this quarter demonstrates the effectiveness of our Valmont Business Model, and we remain confident in our strategies, focusing on value creation and delivering outstanding results.”
First Quarter 2024 Highlights (all metrics compared to First Quarter 2023 unless otherwise noted)
| ● | Net Sales decreased 8.0% to $1.0 billion compared to $1.1 billion |
| ● | Operating Income increased 11.0% to $131.6 million or 13.5% of net sales compared to $118.5 million or 11.1% of net sales |
| ● | Diluted Earnings per Share grew 24.5% to $4.32 compared to $3.47 |
| ● | Generated operating cash flows of $23.3 million; cash and cash equivalents at the end of the first quarter were $169.2 million |
| ● | Completed the $120.0 million Accelerated Share Repurchase program resulting in the repurchase of approximately 96,200 additional shares of Company stock in the first quarter |
Key Financial Metrics
First Quarter 2024 |
|
|
|
||||||
(000s except per-share amounts) |
|
3/30/2024 |
|
4/1/2023 |
|
|
|
||
|
|
Q1 2024 |
|
Q1 2023 |
|
vs. Q1 2023 |
|
||
Net Sales |
|
$ |
977,828 |
|
$ |
1,062,481 |
|
(8.0) |
% |
Gross Profit |
|
|
306,216 |
|
|
308,585 |
|
(0.8) |
% |
Gross Profit as a % of Net Sales |
|
|
31.3 |
% |
|
29.0 |
% |
|
|
Operating Income |
|
|
131,553 |
|
|
118,466 |
|
11.0 |
% |
Operating Income as a % of Net Sales |
|
|
13.5 |
% |
|
11.1 |
% |
|
|
Net Earnings Attributable to Valmont Industries, Inc. |
|
|
87,822 |
|
|
74,540 |
|
17.8 |
% |
Diluted Earnings per Share |
|
|
4.32 |
|
|
3.47 |
|
24.5 |
% |
Weighted Average Shares Outstanding |
|
|
20,321 |
|
|
21,512 |
|
|
|
First Quarter 2024 Segment Review
Infrastructure (73.7% of Net Sales)
Products and solutions to serve the infrastructure markets of utility, solar, lighting and transportation, and telecommunications, along with coatings services to protect metal products
Sales of $723.6 million decreased 1.7% year-over-year. Higher volumes in the Transmission, Distribution, and Substation and Solar product lines were driven by continued strong utility market demand and ongoing investments in the global energy transition. These volume increases, and favorable pricing across the portfolio, were more than offset by significantly lower Telecommunications volumes.
Operating Income was $117.9 million or 16.4% of net sales compared to $94.4 million or 12.9% of net sales in the first quarter of 2023 driven by commercial and pricing strategies, deliberate actions that improved overall cost of goods sold, and lower SG&A expenses.
Agriculture (26.3% of Net Sales)
Center pivot components and linear irrigation equipment for agricultural markets, including parts and tubular products, and advanced technology solutions for precision agriculture
Sales of $258.7 million decreased 22.1% year-over-year. In North America, irrigation equipment volumes were lower as the first quarter of 2023 benefited from the ongoing delivery of elevated backlog. Average irrigation selling prices were slightly lower compared to last year.
International sales decreased compared to last year. Primary drivers were lower sales in Brazil due to more normalized backlog levels as compared to the first quarter of 2023 and softer soybean prices, along with a decrease in Middle East project sales. The sales contribution from the HR Products acquisition partially offset the lower sales.
Operating Income was $41.0 million or 15.9% of net sales compared to $53.3 million or 16.1% of net sales in the first quarter of 2023. Improvement in gross profit margins and the benefit of lower SG&A expenses were more than offset by the impact of lower volumes.
Balance Sheet, Liquidity, and Capital Allocation
The Company generated operating cash flows of $23.3 million, and cash and cash equivalents were $169.2 million at the end of the first quarter. During the quarter, Valmont completed the $120.0 million Accelerated Share Repurchase (“ASR”) program commenced in the fourth quarter of 2023. The total number of shares of Valmont common stock repurchased under the ASR program was 535,141 shares at an average price of $224.24 per share, and $136.1 million remains on the authorized share repurchase program. Fitch Ratings, Inc. reaffirmed the Company’s BBB-/Stable credit rating during the quarter. Valmont remains committed to maintaining its investment-grade rating.
Raising 2024 Full-Year Financial Outlook and Updating Key Assumptions
Considering current strong market demand and an expectation of continued positive performance in the Infrastructure segment, along with improved visibility of international agriculture projects, the Company is increasing its 2024 full-year net sales and diluted earnings per share outlook from the previous indications that were communicated last quarter and providing updated key assumptions for the year.
Metric |
Previous Outlook |
Current Outlook |
Net Sales Change |
(3.0%) to flat |
(2.0%) to 0.5% |
Infrastructure Net Sales |
Growth Approaching Mid-Single Digits |
No Change from Previous Outlook |
Agriculture Net Sales |
Down 15 to 20% vs. PY |
Down 10 to 15% vs. PY |
Diluted Earnings per Share |
$14.25 to $15.50 |
$15.40 to $16.40 |
Applbaum added, “We are raising our 2024 net sales and diluted earnings per share expectations as we remain focused on execution, commercial excellence, and operational efficiencies to drive margin expansion. Improved visibility to international agriculture projects supports a slightly more positive view of Agriculture sales for the full year. Demand for our Infrastructure products remains strong. We are making strategic capacity investments to meet the needs of our customers and take advantage of the visible opportunities ahead of us. Our broad exposure to infrastructure and agriculture markets helps us manage market cycles and share resources across businesses, improving efficiency and returns on investment. We believe these advantages will become increasingly important as the energy transition accelerates and agriculture markets recover, positioning us well to allocate resources to opportunities that strengthen our core businesses and deliver strong returns on invested capital. By effectively managing costs, we are further enhancing our ability to expand margins. We remain focused on driving sustainable growth while delivering superior value to our shareholders for years to come.”
A live audio discussion with Avner M. Applbaum, President and Chief Executive Officer, and Timothy P. Francis, Interim Chief Financial Officer, will be accessible by telephone on Thursday, May 2, 2024 at 8:00 a.m. CT by dialing +1 877.407.6184 or +1 201.389.0877 (no Conference ID needed), or via webcast by pointing browsers to this link: Valmont Industries 1Q 2024 Earnings Conference Call. A slide presentation will simultaneously be available for download on the Investors page of valmont.com. A replay of the event can be accessed three hours after the call at the above link or by telephone at +1 877.660.6853 or +1 201.612.7415. Please use access code 13742903. The replay will be available through 10:59 p.m. CT on Thursday, May 9, 2024.
About Valmont Industries, Inc.
For nearly 80 years, Valmont has been a global leader in creating vital infrastructure and advancing agricultural productivity. Today, we remain committed to doing more with less by innovating through technology. Learn more about how we’re Conserving Resources. Improving Life.® at valmont.com.
Concerning Forward-Looking Statements
This release contains forward-looking statements, within the meaning of the Private Securities Litigation Reform Act of 1995. These forward-looking statements are based on assumptions that management has made in light of experience in the industries in which Valmont operates, as well as management’s perceptions of historical trends, current conditions, expected future developments, and other factors believed to be appropriate under the circumstances. As you read and consider this release, you should understand that these statements are not guarantees of performance or results. They involve risks, uncertainties (some of which are beyond Valmont’s control), and assumptions. Although management believes that these forward-looking statements are based on reasonable assumptions, you should be aware that many factors could affect Valmont’s actual financial results and cause them to differ materially from those anticipated in the forward-looking statements. These factors include, among other things, risk factors described from time to time in Valmont’s reports to the Securities and Exchange Commission, as well as future economic and market circumstances, industry conditions, company performance and financial results, operating efficiencies, availability and price of raw materials, availability and market acceptance of new products, product pricing, domestic and international competitive environments, geopolitical risks, and actions and policy changes of domestic and foreign governments. The Company cautions that any forward-looking statement included in this press release is made as of the date of this press release and the Company does not undertake to update any forward-looking statement.
Website and Social Media Disclosure
The Company uses its website and social media channels identified on its website as channels of distribution of Company information. The information that the Company posts through these channels may be deemed material. Accordingly, investors should monitor these channels, in addition to following the Company’s press releases, Securities and Exchange Commission filings, and public conference calls and webcasts. The contents of the Company’s website and social media channels are not part of this press release.
###
VALMONT INDUSTRIES, INC. AND SUBSIDIARIES
CONDENSED CONSOLIDATED STATEMENTS OF EARNINGS
(Dollars and shares in thousands, except per-share amounts)
(Unaudited)
|
|
Thirteen weeks ended |
||||
|
|
March 30, |
|
April 1, |
||
|
|
2024 |
|
2023 |
||
Net sales |
|
$ |
977,828 |
|
$ |
1,062,481 |
Cost of sales |
|
|
671,612 |
|
|
753,896 |
Gross profit |
|
|
306,216 |
|
|
308,585 |
Selling, general, and administrative expenses |
|
|
174,663 |
|
|
190,119 |
Operating income |
|
|
131,553 |
|
|
118,466 |
Other income (expenses): |
|
|
|
|
|
|
Interest expense |
|
|
(16,221) |
|
|
(13,105) |
Interest income |
|
|
1,779 |
|
|
830 |
Gain on deferred compensation investments |
|
|
1,431 |
|
|
1,194 |
Other |
|
|
(105) |
|
|
(2,376) |
Total other income (expenses) |
|
|
(13,116) |
|
|
(13,457) |
Earnings before income taxes and equity in loss of nonconsolidated subsidiaries |
|
|
118,437 |
|
|
105,009 |
Income tax expense |
|
|
29,988 |
|
|
31,843 |
Equity in loss of nonconsolidated subsidiaries |
|
|
(20) |
|
|
(821) |
Net earnings |
|
|
88,429 |
|
|
72,345 |
Loss (earnings) attributable to redeemable noncontrolling interests |
|
|
(607) |
|
|
2,195 |
Net earnings attributable to Valmont Industries, Inc. |
|
$ |
87,822 |
|
$ |
74,540 |
|
|
|
|
|
|
|
Weighted average shares outstanding - Basic |
|
|
20,188 |
|
|
21,269 |
Earnings per share - Basic |
|
$ |
4.35 |
|
$ |
3.50 |
|
|
|
|
|
|
|
Weighted average shares outstanding - Diluted |
|
|
20,321 |
|
|
21,512 |
Earnings per share - Diluted |
|
$ |
4.32 |
|
$ |
3.47 |
|
|
|
|
|
|
|
Cash dividends per share |
|
$ |
0.60 |
|
$ |
0.60 |
VALMONT INDUSTRIES, INC. AND SUBSIDIARIES
SUMMARY OPERATING RESULTS
(Dollars in thousands)
(Unaudited)
|
|
Thirteen weeks ended |
|
||||
|
|
March 30, |
|
April 1, |
|
||
|
|
2024 |
|
2023 |
|
||
Infrastructure |
|
|
|
|
|
|
|
Net sales |
|
$ |
720,733 |
|
$ |
732,140 |
|
Gross profit |
|
|
217,617 |
|
|
200,432 |
|
as a percent of net sales |
|
|
30.2 |
% |
|
27.4 |
% |
Selling, general, and administrative expenses |
|
|
99,753 |
|
|
106,080 |
|
as a percent of net sales |
|
|
13.8 |
% |
|
14.5 |
% |
Operating income |
|
|
117,864 |
|
|
94,352 |
|
as a percent of net sales |
|
|
16.4 |
% |
|
12.9 |
% |
|
|
|
|
|
|
|
|
Agriculture |
|
|
|
|
|
|
|
Net sales |
|
$ |
257,095 |
|
$ |
330,341 |
|
Gross profit |
|
|
88,599 |
|
|
108,153 |
|
as a percent of net sales |
|
|
34.5 |
% |
|
32.7 |
% |
Selling, general, and administrative expenses |
|
|
47,626 |
|
|
54,830 |
|
as a percent of net sales |
|
|
18.5 |
% |
|
16.6 |
% |
Operating income |
|
|
40,973 |
|
|
53,323 |
|
as a percent of net sales |
|
|
15.9 |
% |
|
16.1 |
% |
|
|
|
|
|
|
|
|
Corporate |
|
|
|
|
|
|
|
Selling, general, and administrative expenses |
|
$ |
27,284 |
|
$ |
29,209 |
|
Operating loss |
|
|
(27,284) |
|
|
(29,209) |
|
VALMONT INDUSTRIES, INC. AND SUBSIDIARIES
SUMMARY OPERATING RESULTS
(Dollars in thousands)
(Unaudited)
|
|
Thirteen weeks ended March 30, 2024 |
||||||||||
|
|
Infrastructure |
|
Agriculture |
|
Intersegment |
|
Consolidated |
||||
Geographical Market: |
|
|
|
|
|
|
|
|
|
|
|
|
North America |
|
$ |
568,572 |
|
$ |
159,915 |
|
$ |
(4,466) |
|
$ |
724,021 |
International |
|
|
155,042 |
|
|
98,820 |
|
|
(55) |
|
|
253,807 |
Total sales |
|
$ |
723,614 |
|
$ |
258,735 |
|
$ |
(4,521) |
|
$ |
977,828 |
|
|
|
|
|
|
|
|
|
|
|
|
|
Product Line: |
|
|
|
|
|
|
|
|
|
|
|
|
Transmission, Distribution, and Substation |
|
$ |
325,256 |
|
$ |
— |
|
$ |
— |
|
$ |
325,256 |
Lighting and Transportation |
|
|
222,096 |
|
|
— |
|
|
— |
|
|
222,096 |
Coatings |
|
|
87,090 |
|
|
— |
|
|
(2,826) |
|
|
84,264 |
Telecommunications |
|
|
53,961 |
|
|
— |
|
|
— |
|
|
53,961 |
Solar |
|
|
35,211 |
|
|
— |
|
|
(55) |
|
|
35,156 |
Irrigation Equipment and Parts |
|
|
— |
|
|
233,120 |
|
|
(1,640) |
|
|
231,480 |
Technology Products and Services |
|
|
— |
|
|
25,615 |
|
|
— |
|
|
25,615 |
Total sales |
|
$ |
723,614 |
|
$ |
258,735 |
|
$ |
(4,521) |
|
$ |
977,828 |
|
|
Thirteen weeks ended April 1, 2023 |
||||||||||
|
|
Infrastructure |
|
Agriculture |
|
Intersegment |
|
Consolidated |
||||
Geographical Market: |
|
|
|
|
|
|
|
|
|
|
|
|
North America |
|
$ |
584,083 |
|
$ |
182,869 |
|
$ |
(5,374) |
|
$ |
761,578 |
International |
|
|
152,023 |
|
|
149,294 |
|
|
(414) |
|
|
300,903 |
Total sales |
|
$ |
736,106 |
|
$ |
332,163 |
|
$ |
(5,788) |
|
$ |
1,062,481 |
|
|
|
|
|
|
|
|
|
|
|
|
|
Product Line: |
|
|
|
|
|
|
|
|
|
|
|
|
Transmission, Distribution, and Substation |
|
$ |
314,820 |
|
$ |
— |
|
$ |
— |
|
$ |
314,820 |
Lighting and Transportation |
|
|
229,136 |
|
|
— |
|
|
— |
|
|
229,136 |
Coatings |
|
|
90,114 |
|
|
— |
|
|
(3,552) |
|
|
86,562 |
Telecommunications |
|
|
68,137 |
|
|
— |
|
|
— |
|
|
68,137 |
Solar |
|
|
33,899 |
|
|
— |
|
|
(414) |
|
|
33,485 |
Irrigation Equipment and Parts |
|
|
— |
|
|
299,181 |
|
|
(1,822) |
|
|
297,359 |
Technology Products and Services |
|
|
— |
|
|
32,982 |
|
|
— |
|
|
32,982 |
Total sales |
|
$ |
736,106 |
|
$ |
332,163 |
|
$ |
(5,788) |
|
$ |
1,062,481 |
VALMONT INDUSTRIES, INC. AND SUBSIDIARIES
CONDENSED CONSOLIDATED BALANCE SHEETS
(Dollars in thousands)
(Unaudited)
|
|
March 30, |
|
December 30, |
||
|
|
2024 |
|
2023 |
||
ASSETS |
|
|
|
|
|
|
Current assets: |
|
|
|
|
|
|
Cash and cash equivalents |
|
$ |
169,195 |
|
$ |
203,041 |
Receivables, net |
|
|
659,036 |
|
|
657,960 |
Inventories |
|
|
668,743 |
|
|
658,428 |
Contract assets |
|
|
191,483 |
|
|
175,721 |
Prepaid expenses and other current assets |
|
|
91,114 |
|
|
92,479 |
Total current assets |
|
|
1,779,571 |
|
|
1,787,629 |
Property, plant, and equipment, net |
|
|
608,403 |
|
|
617,394 |
Goodwill and other non-current assets |
|
|
1,077,407 |
|
|
1,072,425 |
Total assets |
|
$ |
3,465,381 |
|
$ |
3,477,448 |
|
|
|
|
|
|
|
LIABILITIES, REDEEMABLE NONCONTROLLING INTERESTS, |
|
|
|
|
|
|
AND SHAREHOLDERS' EQUITY |
|
|
|
|
|
|
Current liabilities: |
|
|
|
|
|
|
Current installments of long-term debt |
|
$ |
620 |
|
$ |
719 |
Notes payable to banks |
|
|
2,029 |
|
|
3,205 |
Accounts payable |
|
|
327,414 |
|
|
358,311 |
Accrued expenses |
|
|
238,322 |
|
|
277,764 |
Contract liabilities |
|
|
84,041 |
|
|
70,978 |
Income taxes payable |
|
|
10,295 |
|
|
— |
Dividends payable |
|
|
12,113 |
|
|
12,125 |
Total current liabilities |
|
|
674,834 |
|
|
723,102 |
Long-term debt, excluding current installments |
|
|
1,107,644 |
|
|
1,107,885 |
Operating lease liabilities |
|
|
157,279 |
|
|
162,743 |
Other non-current liabilities |
|
|
71,353 |
|
|
66,646 |
Total liabilities |
|
|
2,011,110 |
|
|
2,060,376 |
Redeemable noncontrolling interests |
|
|
44,980 |
|
|
62,792 |
Shareholders' equity |
|
|
1,409,291 |
|
|
1,354,280 |
Total liabilities, redeemable noncontrolling interests, and shareholders' equity |
|
$ |
3,465,381 |
|
$ |
3,477,448 |
VALMONT INDUSTRIES, INC. AND SUBSIDIARIES
CONDENSED CONSOLIDATED STATEMENTS OF CASH FLOWS
(Dollars in thousands)
(Unaudited)
|
|
Thirteen weeks ended |
||||
|
|
March 30, |
|
April 1, |
||
|
|
2024 |
|
2023 |
||
Cash flows from operating activities: |
|
|
|
|
|
|
Net earnings |
|
$ |
88,429 |
|
$ |
72,345 |
Depreciation and amortization |
|
|
23,536 |
|
|
24,558 |
Contribution to defined benefit pension plan |
|
|
(16,714) |
|
|
(15,259) |
Change in working capital |
|
|
(88,924) |
|
|
(83,206) |
Other |
|
|
17,005 |
|
|
22,761 |
Net cash flows from operating activities |
|
|
23,332 |
|
|
21,199 |
Cash flows from investing activities: |
|
|
|
|
|
|
Purchase of property, plant, and equipment |
|
|
(15,010) |
|
|
(22,361) |
Other |
|
|
(3,629) |
|
|
572 |
Net cash flows from investing activities |
|
|
(18,639) |
|
|
(21,789) |
Cash flows from financing activities: |
|
|
|
|
|
|
Net proceeds (payments) on short-term borrowings |
|
|
(1,136) |
|
|
5,302 |
Proceeds from long-term borrowings |
|
|
10 |
|
|
125,000 |
Principal payments on long-term borrowings |
|
|
(175) |
|
|
(10,796) |
Dividends paid |
|
|
(12,126) |
|
|
(11,742) |
Purchase of redeemable noncontrolling interests |
|
|
(17,745) |
|
|
— |
Purchase of treasury shares |
|
|
— |
|
|
(111,115) |
Other |
|
|
(3,662) |
|
|
(9,658) |
Net cash flows from financing activities |
|
|
(34,834) |
|
|
(13,009) |
Effect of exchange rates on cash and cash equivalents |
|
|
(3,705) |
|
|
1,141 |
Net change in cash and cash equivalents |
|
|
(33,846) |
|
|
(12,458) |
Cash and cash equivalents—beginning of period |
|
|
203,041 |
|
|
185,406 |
Cash and cash equivalents—end of period |
|
$ |
169,195 |
|
$ |
172,948 |
|
Valmont® © 2024 Industries, Inc. Q1 2024 Earnings Presentation May 2, 2024 |
|
Today’s Agenda 2 May 2, 2024 | Valmont Industries, Inc. 01 02 03 04 Q1 2024 Results & Market Dynamics 2024 Strategic Priorities Updated 2024 Outlook and Guidance Q&A |
|
These slides contain (and the accompanying oral discussion will contain) “forward-looking statements” within the meaning of the Private Securities Litigation Reform Act of 1995. Such statements involve known and unknown risks, uncertainties and other factors that could cause the actual results of the Company to differ materially from the results expressed or implied by such statements, including general economic and business conditions, conditions affecting the industries served by the Company and its subsidiaries, the overall market acceptance of such products and services, the integration of acquisitions and other factors disclosed in the Company’s periodic reports filed with the Securities and Exchange Commission, as well as future economic and market circumstances, industry conditions, company performance and financial results, operating efficiencies, availability and price of raw materials, availability and market acceptance of new products, product pricing, domestic and international competitive environments, geopolitical risks and actions and policy changes of domestic and foreign governments. Consequently, such forward-looking statements should be regarded as the Company’s current plans, estimates, and beliefs. The Company does not undertake and specifically declines any obligation to publicly release the results of any revisions to these forward-looking statements that may be made to reflect any future events or circumstances after the date of such statements or to reflect the occurrence of anticipated or unanticipated events. Disclosure Regarding Forward-Looking Statements 3 May 2, 2024 | Valmont Industries, Inc. |
|
CEO Opening Comments Avner Applbaum, President & CEO 4 May 2, 2024 | Valmont Industries, Inc. |
|
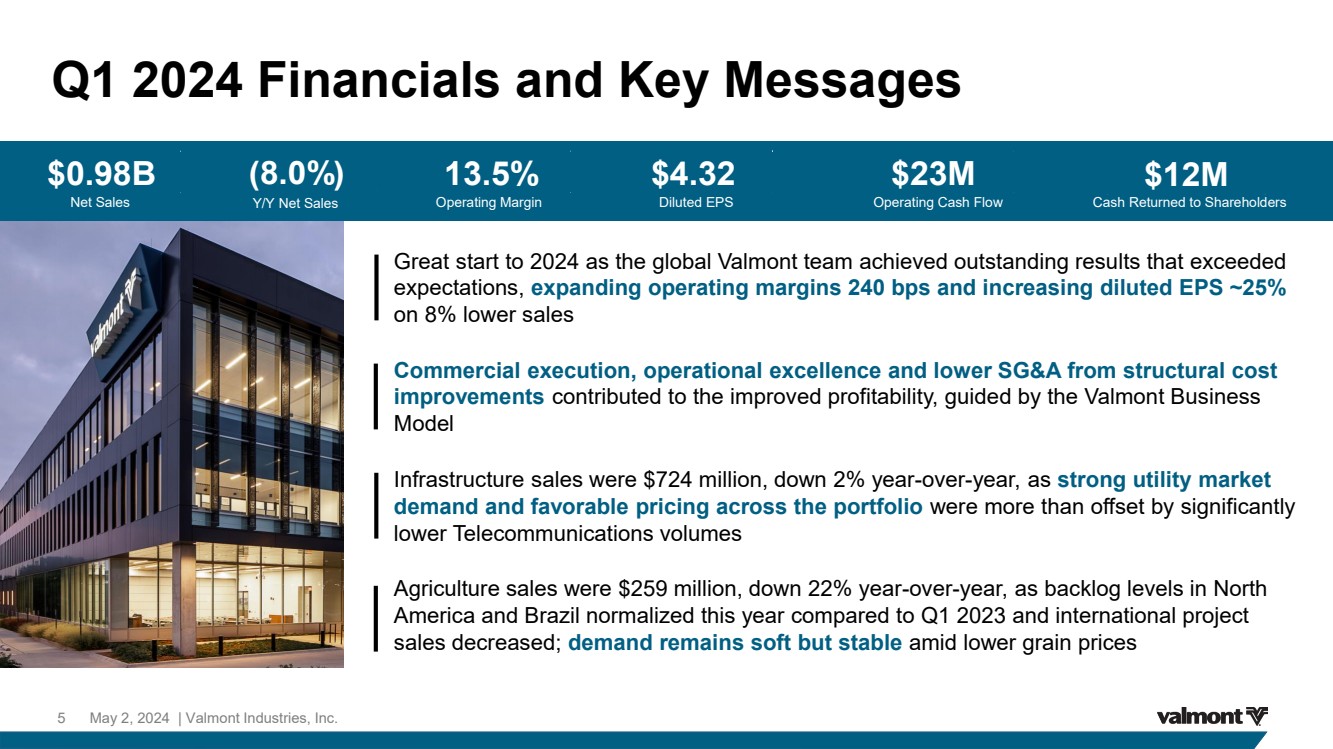
Q1 2024 Financials and Key Messages 5 May 2, 2024 | Valmont Industries, Inc. Great start to 2024 as the global Valmont team achieved outstanding results that exceeded expectations, expanding operating margins 240 bps and increasing diluted EPS ~25% on 8% lower sales Commercial execution, operational excellence and lower SG&A from structural cost improvements contributed to the improved profitability, guided by the Valmont Business Model Infrastructure sales were $724 million, down 2% year-over-year, as strong utility market demand and favorable pricing across the portfolio were more than offset by significantly lower Telecommunications volumes Agriculture sales were $259 million, down 22% year-over-year, as backlog levels in North America and Brazil normalized this year compared to Q1 2023 and international project sales decreased; demand remains soft but stable amid lower grain prices Net Sales Y/Y Net Sales Operating Margin Diluted EPS Operating Cash Flow Cash Returned to Shareholders $0.98B (8.0%) 13.5% $4.32 $23M $12M |
|
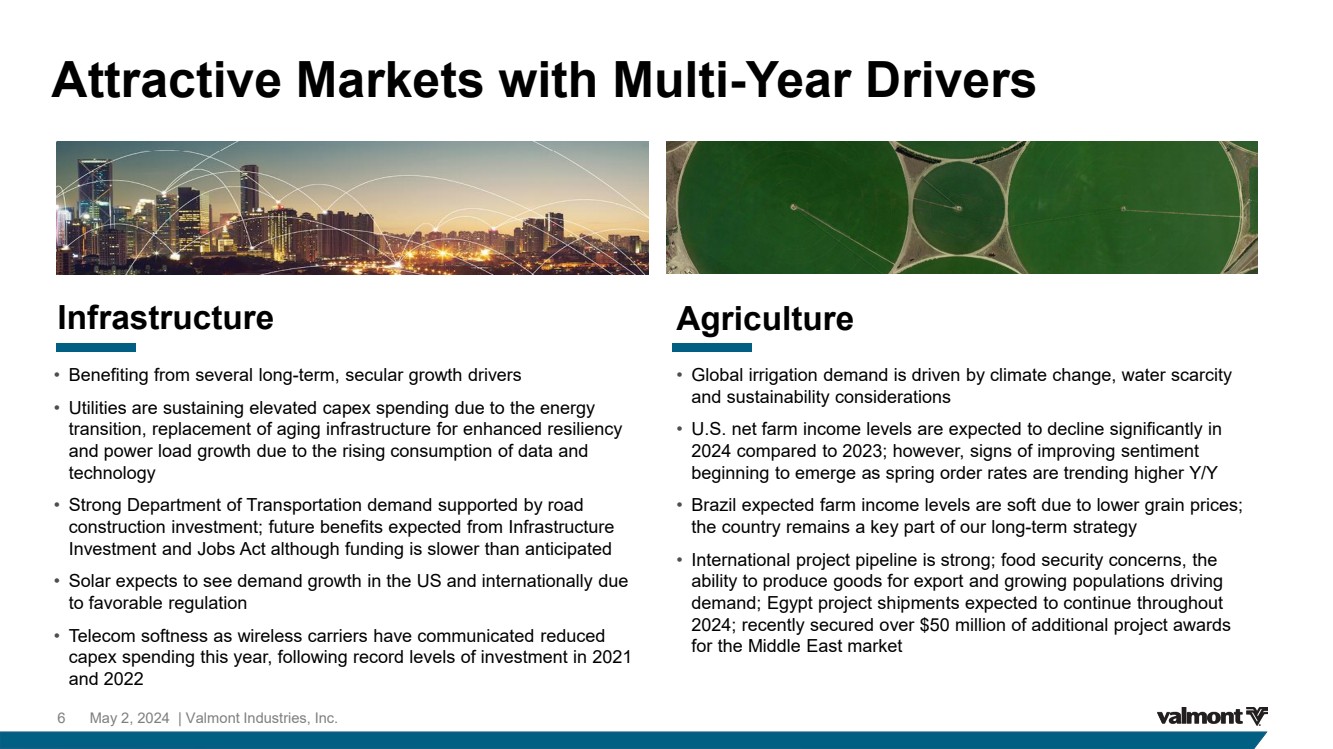
Infrastructure Agriculture Attractive Markets with Multi-Year Drivers • Benefiting from several long-term, secular growth drivers • Utilities are sustaining elevated capex spending due to the energy transition, replacement of aging infrastructure for enhanced resiliency and power load growth due to the rising consumption of data and technology • Strong Department of Transportation demand supported by road construction investment; future benefits expected from Infrastructure Investment and Jobs Act although funding is slower than anticipated • Solar expects to see demand growth in the US and internationally due to favorable regulation • Telecom softness as wireless carriers have communicated reduced capex spending this year, following record levels of investment in 2021 and 2022 • Global irrigation demand is driven by climate change, water scarcity and sustainability considerations • U.S. net farm income levels are expected to decline significantly in 2024 compared to 2023; however, signs of improving sentiment beginning to emerge as spring order rates are trending higher Y/Y • Brazil expected farm income levels are soft due to lower grain prices; the country remains a key part of our long-term strategy • International project pipeline is strong; food security concerns, the ability to produce goods for export and growing populations driving demand; Egypt project shipments expected to continue throughout 2024; recently secured over $50 million of additional project awards for the Middle East market 6 May 2, 2024 | Valmont Industries, Inc. |
|
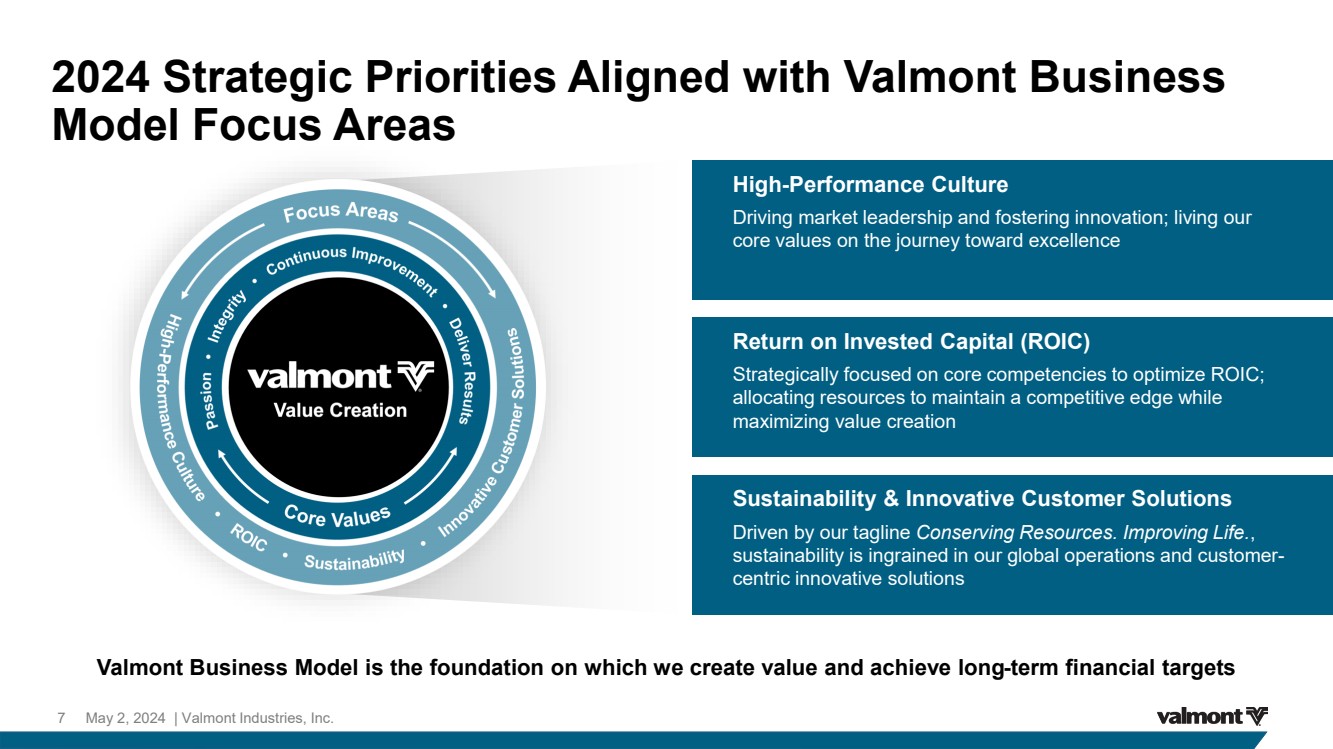
2024 Strategic Priorities Aligned with Valmont Business Model Focus Areas 7 May 2, 2024 | Valmont Industries, Inc. Valmont Business Model is the foundation on which we create value and achieve long-term financial targets High-Performance Culture Driving market leadership and fostering innovation; living our core values on the journey toward excellence Return on Invested Capital (ROIC) Strategically focused on core competencies to optimize ROIC; allocating resources to maintain a competitive edge while maximizing value creation Sustainability & Innovative Customer Solutions Driven by our tagline Conserving Resources. Improving Life., sustainability is ingrained in our global operations and customer-centric innovative solutions |
|
Financial Results and Outlook Tim Francis, Interim CFO 8 May 2, 2024 | Valmont Industries, Inc. |
|
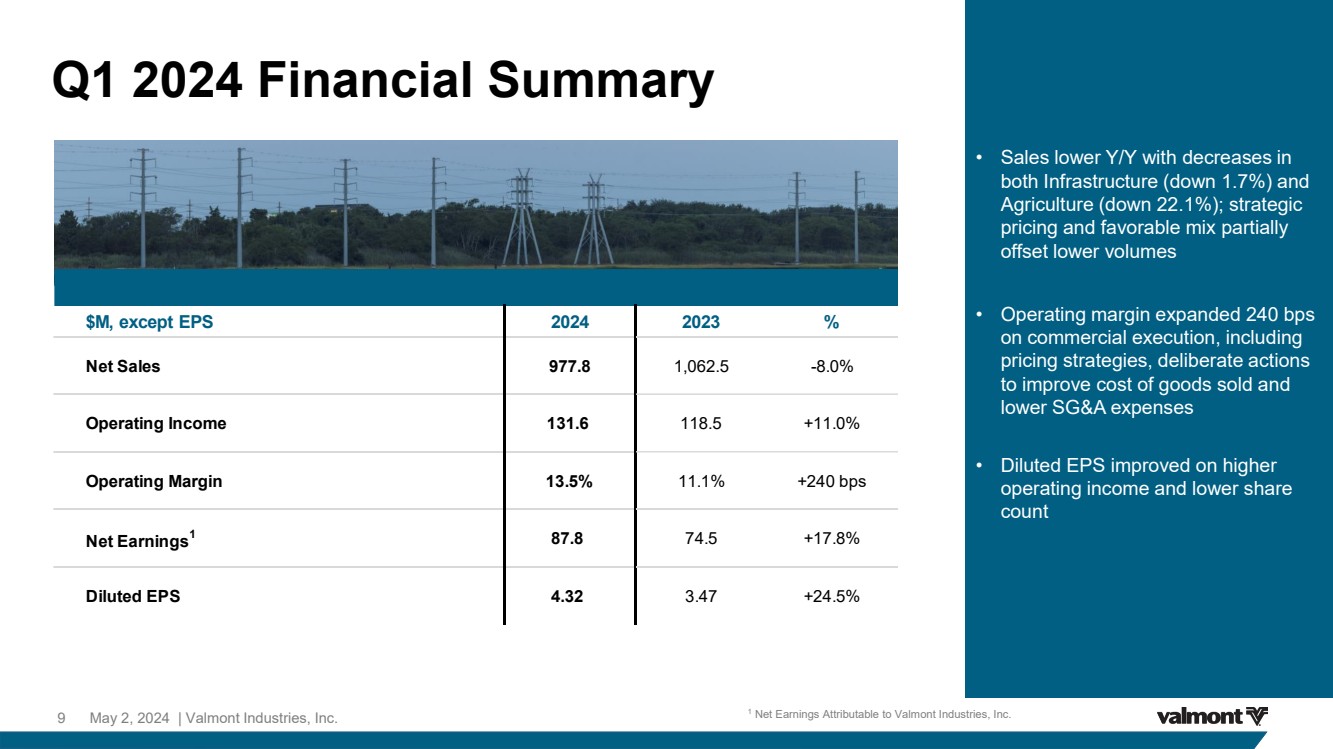
Q1 2024 Financial Summary 9 May 2, 2024 | Valmont Industries, Inc. • Sales lower Y/Y with decreases in both Infrastructure (down 1.7%) and Agriculture (down 22.1%); strategic pricing and favorable mix partially offset lower volumes • Operating margin expanded 240 bps on commercial execution, including pricing strategies, deliberate actions to improve cost of goods sold and lower SG&A expenses • Diluted EPS improved on higher operating income and lower share count $M, except EPS 2024 2023 % Net Sales 977.8 1,062.5 -8.0% Operating Income 131.6 118.5 +11.0% Operating Margin 13.5% 11.1% +240 bps Net Earnings1 87.8 74.5 +17.8% Diluted EPS 4.32 3.47 +24.5% 1 Net Earnings Attributable to Valmont Industries, Inc. |
|
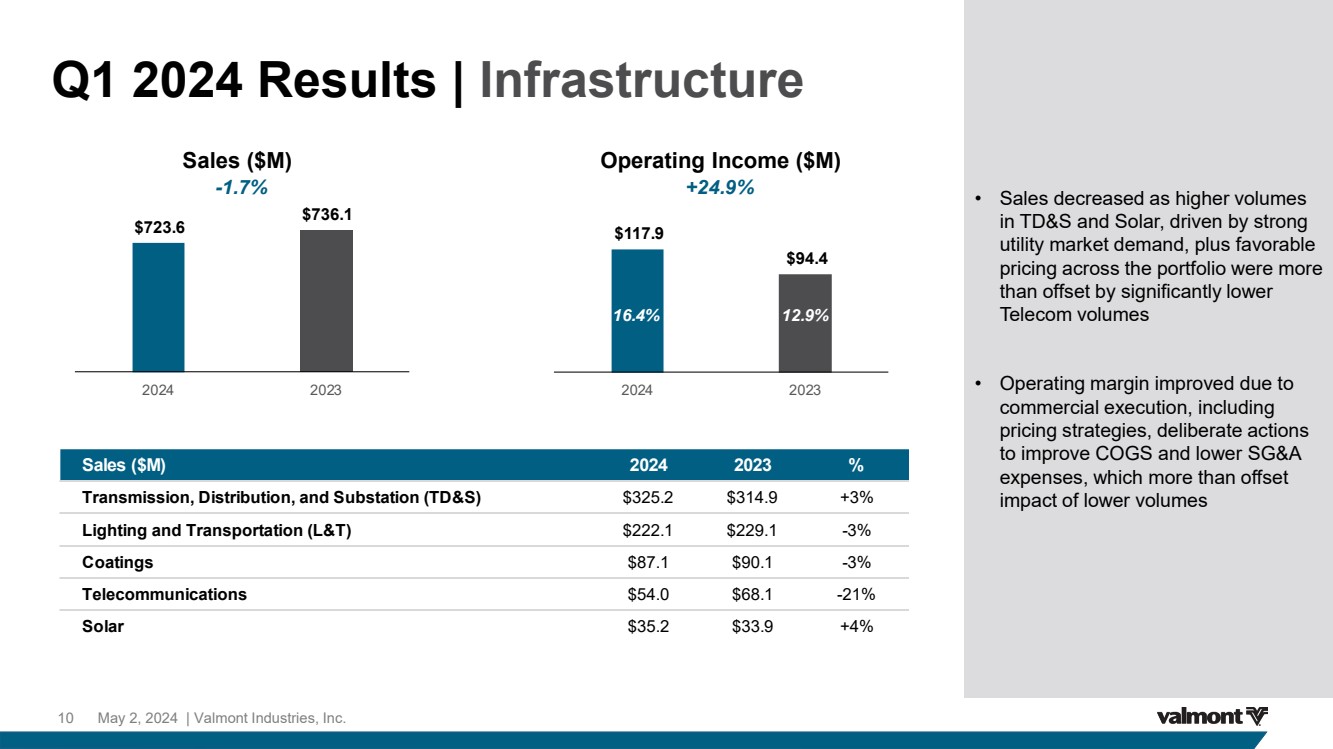
Q1 2024 Results | Infrastructure 10 May 2, 2024 | Valmont Industries, Inc. Sales ($M) Operating Income ($M) • Sales decreased as higher volumes in TD&S and Solar, driven by strong utility market demand, plus favorable pricing across the portfolio were more than offset by significantly lower Telecom volumes • Operating margin improved due to commercial execution, including pricing strategies, deliberate actions to improve COGS and lower SG&A expenses, which more than offset impact of lower volumes $723.6 $736.1 2024 2023 -1.7% +24.9% $117.9 $94.4 2024 2023 16.4% 12.9% Sales ($M) 2024 2023 % Transmission, Distribution, and Substation (TD&S) $325.2 $314.9 +3% Lighting and Transportation (L&T) $222.1 $229.1 -3% Coatings $87.1 $90.1 -3% Telecommunications $54.0 $68.1 -21% Solar $35.2 $33.9 +4% |
|
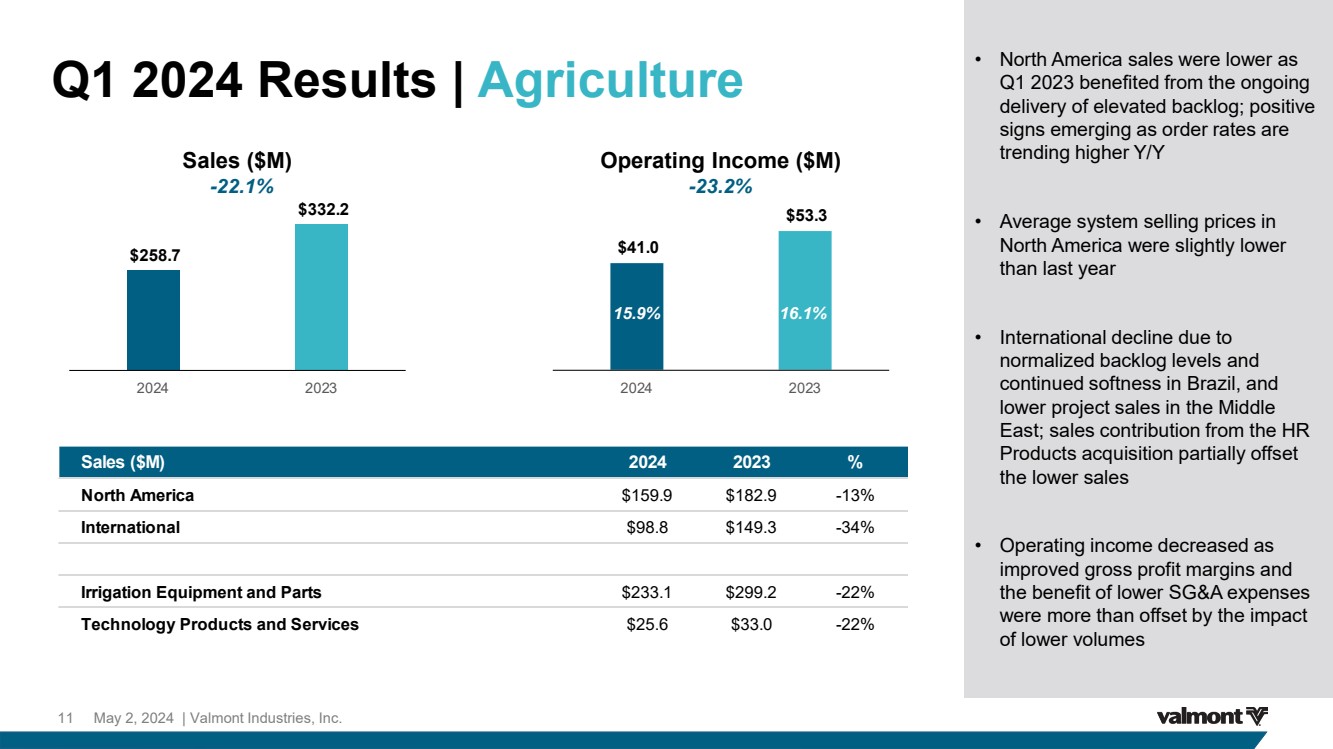
Q1 2024 Results | Agriculture 11 May 2, 2024 | Valmont Industries, Inc. • North America sales were lower as Q1 2023 benefited from the ongoing delivery of elevated backlog; positive signs emerging as order rates are trending higher Y/Y • Average system selling prices in North America were slightly lower than last year • International decline due to normalized backlog levels and continued softness in Brazil, and lower project sales in the Middle East; sales contribution from the HR Products acquisition partially offset the lower sales • Operating income decreased as improved gross profit margins and the benefit of lower SG&A expenses were more than offset by the impact of lower volumes Sales ($M) Operating Income ($M) Sales ($M) 2024 2023 % North America $159.9 $182.9 -13% International $98.8 $149.3 -34% Irrigation Equipment and Parts $233.1 $299.2 -22% Technology Products and Services $25.6 $33.0 -22% -22.1% -23.2% $258.7 $332.2 2024 2023 $41.0 $53.3 2024 2023 15.9% 16.1% |
|
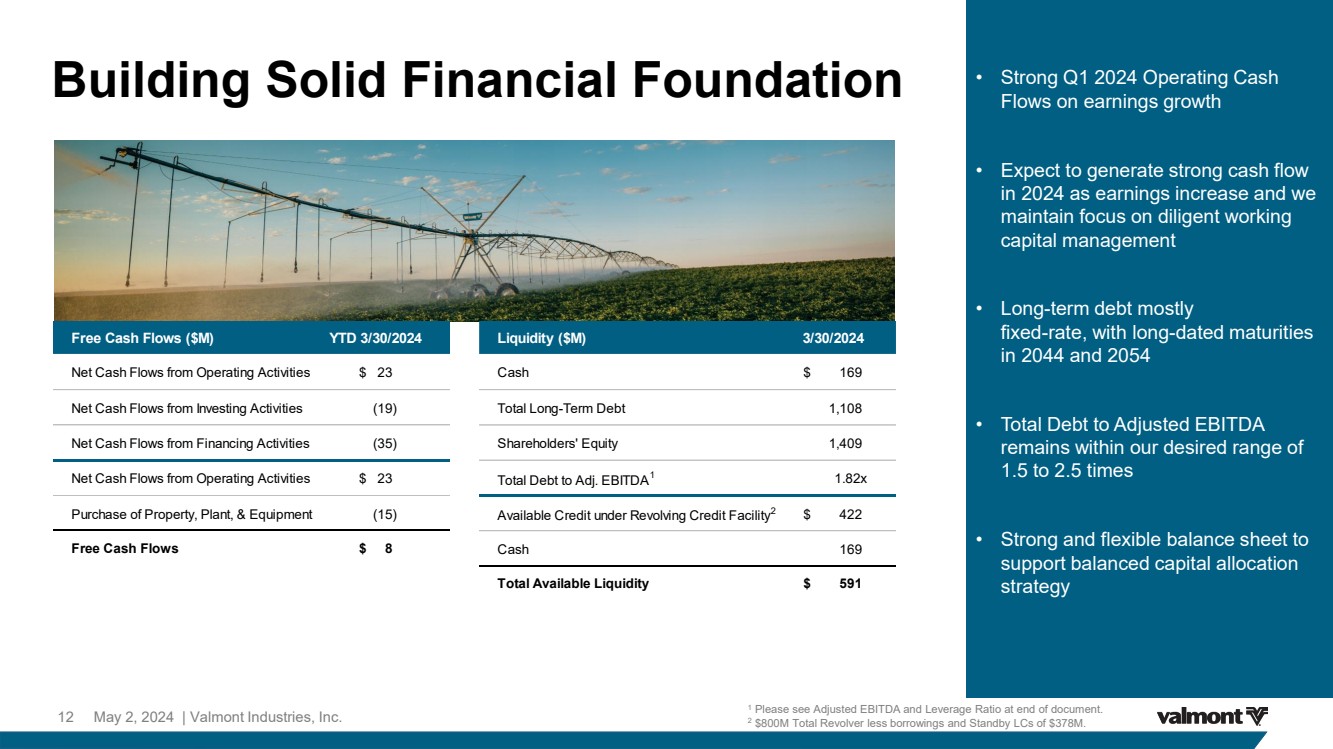
Building Solid Financial Foundation 12 May 2, 2024 | Valmont Industries, Inc. • Strong Q1 2024 Operating Cash Flows on earnings growth • Expect to generate strong cash flow in 2024 as earnings increase and we maintain focus on diligent working capital management • Long-term debt mostly fixed-rate, with long-dated maturities in 2044 and 2054 • Total Debt to Adjusted EBITDA remains within our desired range of 1.5 to 2.5 times • Strong and flexible balance sheet to support balanced capital allocation strategy Free Cash Flows ($M) YTD 3/30/2024 Liquidity ($M) 3/30/2024 Net Cash Flows from Operating Activities $ 23 Cash $ 169 Net Cash Flows from Investing Activities (19) Total Long-Term Debt 1,108 Net Cash Flows from Financing Activities (35) Shareholders' Equity 1,409 Net Cash Flows from Operating Activities $ 23 Total Debt to Adj. EBITDA1 1.82x Purchase of Property, Plant, & Equipment (15) Available Credit under Revolving Credit Facility2 $ 422 Free Cash Flows $ 8 Cash 169 Total Available Liquidity $ 591 1 Please see Adjusted EBITDA and Leverage Ratio at end of document. 2 $800M Total Revolver less borrowings and Standby LCs of $378M. |
|
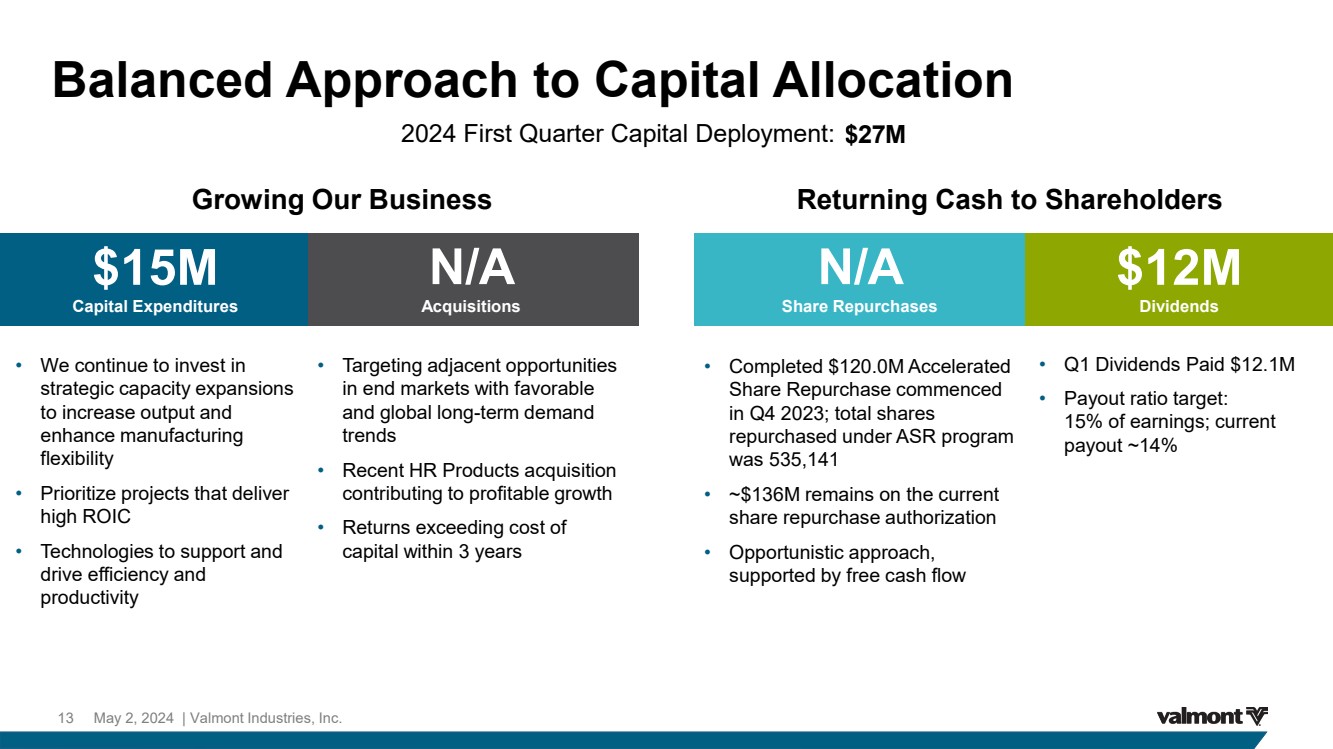
Balanced Approach to Capital Allocation 2024 First Quarter Capital Deployment: 13 May 2, 2024 | Valmont Industries, Inc. Growing Our Business Returning Cash to Shareholders • Targeting adjacent opportunities in end markets with favorable and global long-term demand trends • Recent HR Products acquisition contributing to profitable growth • Returns exceeding cost of capital within 3 years • We continue to invest in strategic capacity expansions to increase output and enhance manufacturing flexibility • Prioritize projects that deliver high ROIC • Technologies to support and drive efficiency and productivity • Q1 Dividends Paid $12.1M • Payout ratio target: 15% of earnings; current payout ~14% • Completed $120.0M Accelerated Share Repurchase commenced in Q4 2023; total shares repurchased under ASR program was 535,141 • ~$136M remains on the current share repurchase authorization • Opportunistic approach, supported by free cash flow Capital Expenditures Acquisitions Share Repurchases Dividends $15M N/A N/A $12M $27M |
|
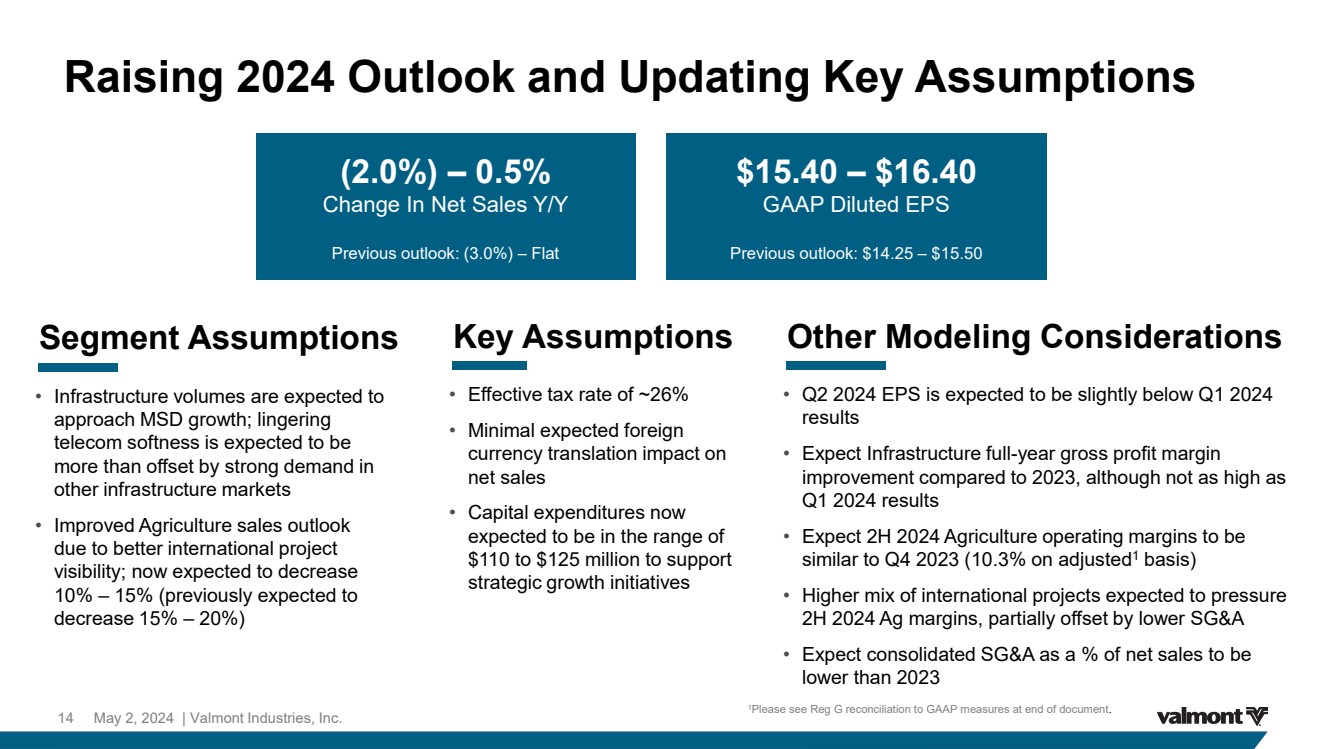
Segment Assumptions Raising 2024 Outlook and Updating Key Assumptions • Infrastructure volumes are expected to approach MSD growth; lingering telecom softness is expected to be more than offset by strong demand in other infrastructure markets • Improved Agriculture sales outlook due to better international project visibility; now expected to decrease 10% – 15% (previously expected to decrease 15% – 20%) 14 May 2, 2024 | Valmont Industries, Inc. (2.0%) – 0.5% Change In Net Sales Y/Y Previous outlook: (3.0%) – Flat $15.40 – $16.40 GAAP Diluted EPS Previous outlook: $14.25 – $15.50 Key Assumptions • Effective tax rate of ~26% • Minimal expected foreign currency translation impact on net sales • Capital expenditures now expected to be in the range of $110 to $125 million to support strategic growth initiatives Other Modeling Considerations • Q2 2024 EPS is expected to be slightly below Q1 2024 results • Expect Infrastructure full-year gross profit margin improvement compared to 2023, although not as high as Q1 2024 results • Expect 2H 2024 Agriculture operating margins to be similar to Q4 2023 (10.3% on adjusted1 basis) • Higher mix of international projects expected to pressure 2H 2024 Ag margins, partially offset by lower SG&A • Expect consolidated SG&A as a % of net sales to be lower than 2023 1Please see Reg G reconciliation to GAAP measures at end of document. |
|
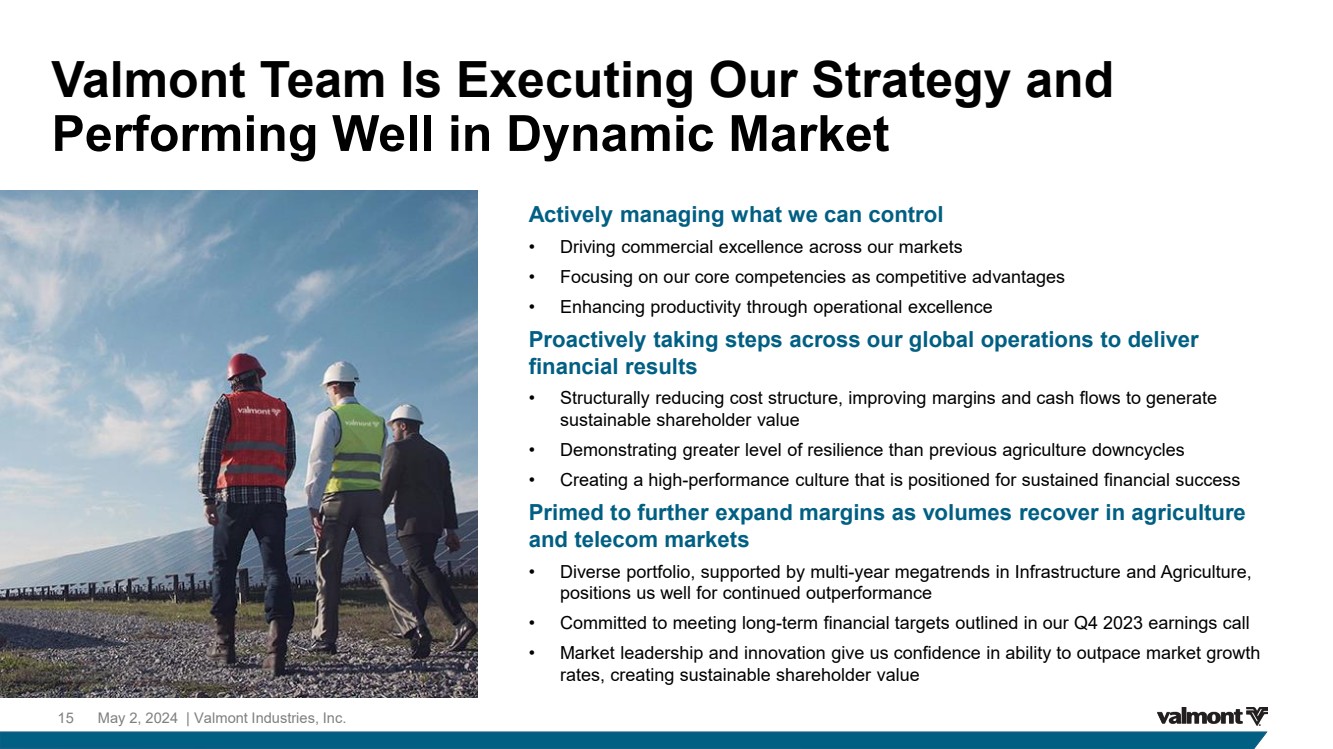
Valmont Team Is Executing Our Strategy and Performing Well in Dynamic Market 15 May 2, 2024 | Valmont Industries, Inc. Actively managing what we can control • Driving commercial excellence across our markets • Focusing on our core competencies as competitive advantages • Enhancing productivity through operational excellence Proactively taking steps across our global operations to deliver financial results • Structurally reducing cost structure, improving margins and cash flows to generate sustainable shareholder value • Demonstrating greater level of resilience than previous agriculture downcycles • Creating a high-performance culture that is positioned for sustained financial success Primed to further expand margins as volumes recover in agriculture and telecom markets • Diverse portfolio, supported by multi-year megatrends in Infrastructure and Agriculture, positions us well for continued outperformance • Committed to meeting long-term financial targets outlined in our Q4 2023 earnings call • Market leadership and innovation give us confidence in ability to outpace market growth rates, creating sustainable shareholder value |
|
Q&A 16 May 2, 2024 | Valmont Industries, Inc. |
|
Appendix 17 May 2, 2024 | Valmont Industries, Inc. |
|
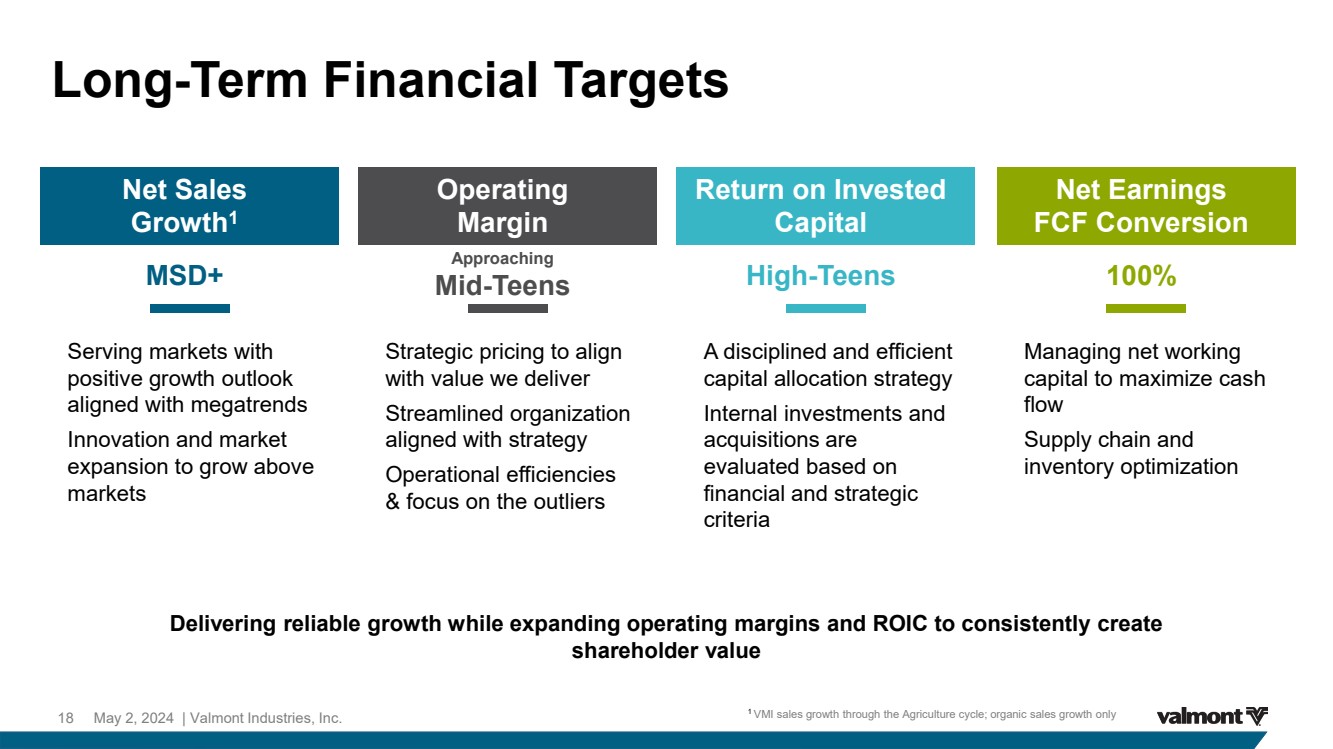
Long-Term Financial Targets MSD+ Net Sales Growth1 Approaching Mid-Teens Operating Margin 100% Net Earnings FCF Conversion High-Teens Return on Invested Capital Serving markets with positive growth outlook aligned with megatrends Innovation and market expansion to grow above markets Strategic pricing to align with value we deliver Streamlined organization aligned with strategy Operational efficiencies & focus on the outliers A disciplined and efficient capital allocation strategy Internal investments and acquisitions are evaluated based on financial and strategic criteria Managing net working capital to maximize cash flow Supply chain and inventory optimization 1 VMI sales growth through the Agriculture cycle; organic sales growth only Delivering reliable growth while expanding operating margins and ROIC to consistently create shareholder value 18 May 2, 2024 | Valmont Industries, Inc. |
|
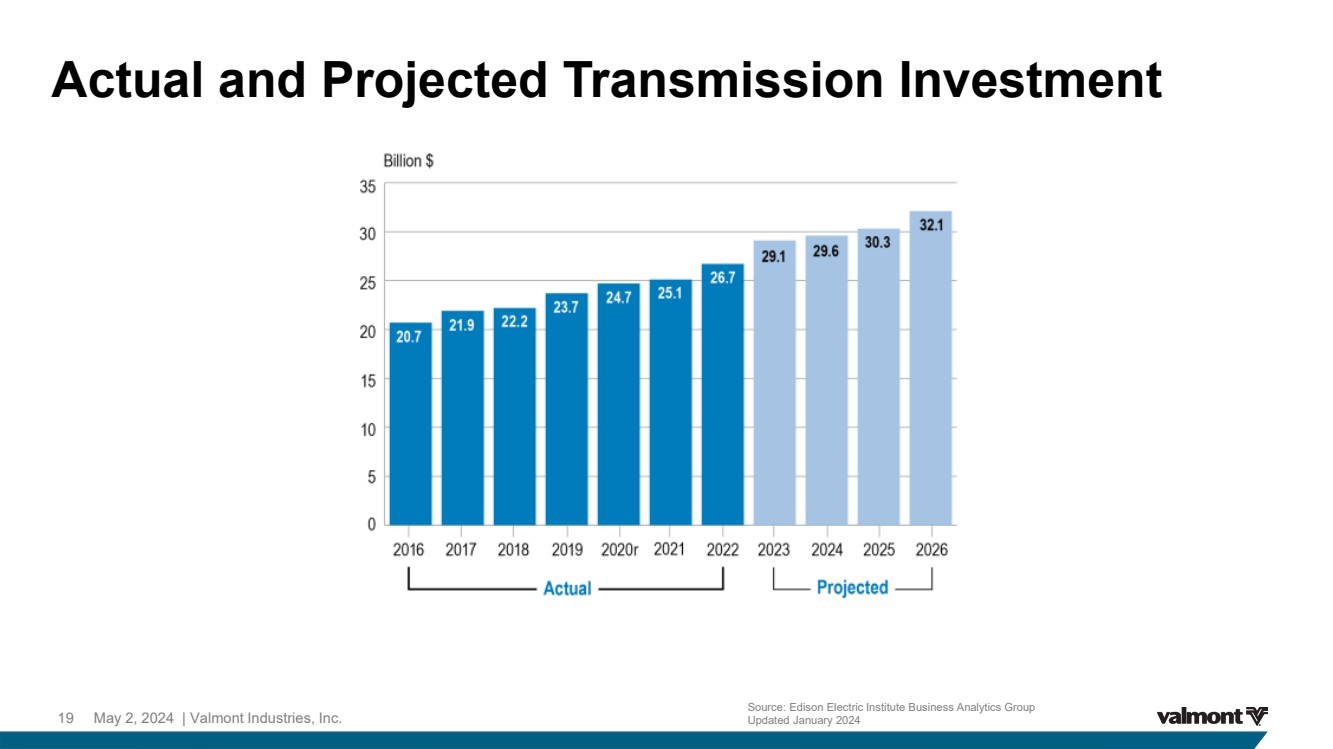
Actual and Projected Transmission Investment 19 May 2, 2024 | Valmont Industries, Inc. Source: Edison Electric Institute Business Analytics Group Updated January 2024 |
|
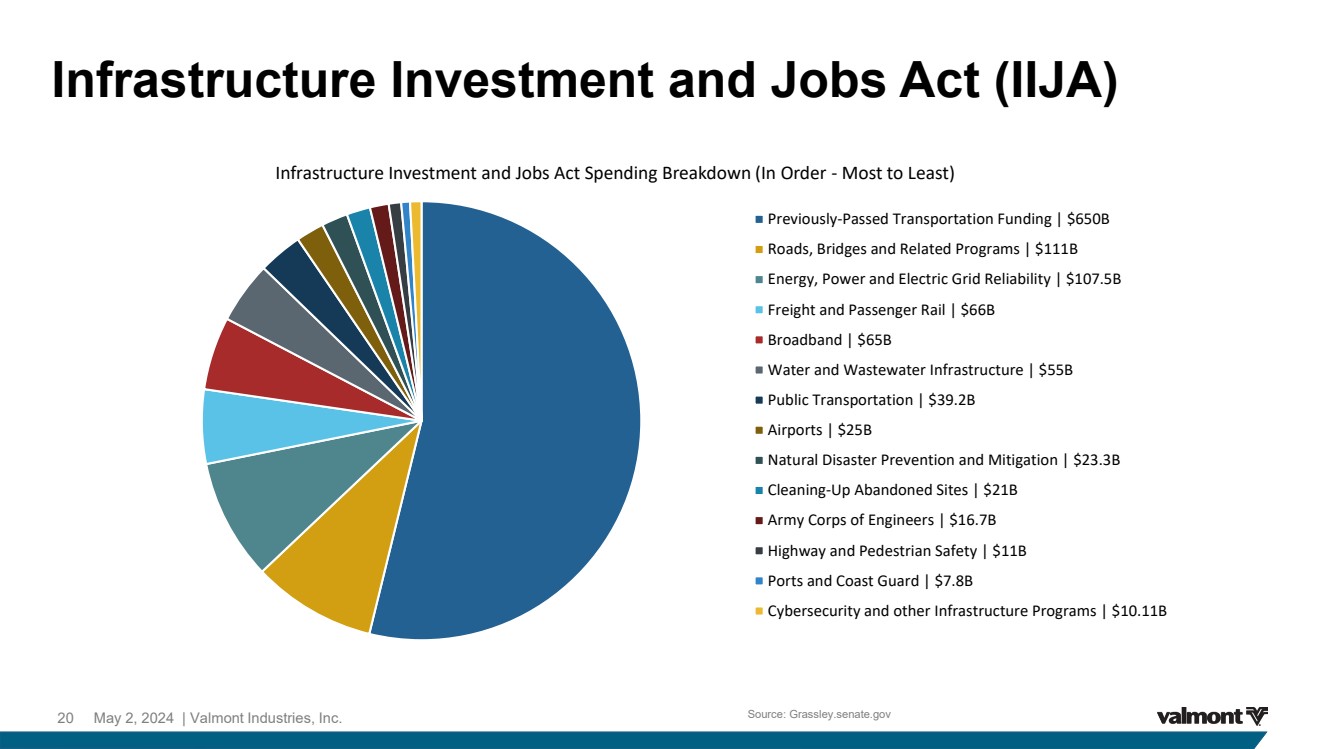
Infrastructure Investment and Jobs Act (IIJA) 20 May 2, 2024 | Valmont Industries, Inc. Source: Grassley.senate.gov Infrastructure Investment and Jobs Act Spending Breakdown (In Order - Most to Least) Previously-Passed Transportation Funding | $650B Roads, Bridges and Related Programs | $111B Energy, Power and Electric Grid Reliability | $107.5B Freight and Passenger Rail | $66B Broadband | $65B Water and Wastewater Infrastructure | $55B Public Transportation | $39.2B Airports | $25B Natural Disaster Prevention and Mitigation | $23.3B Cleaning-Up Abandoned Sites | $21B Army Corps of Engineers | $16.7B Highway and Pedestrian Safety | $11B Ports and Coast Guard | $7.8B Cybersecurity and other Infrastructure Programs | $10.11B |
|
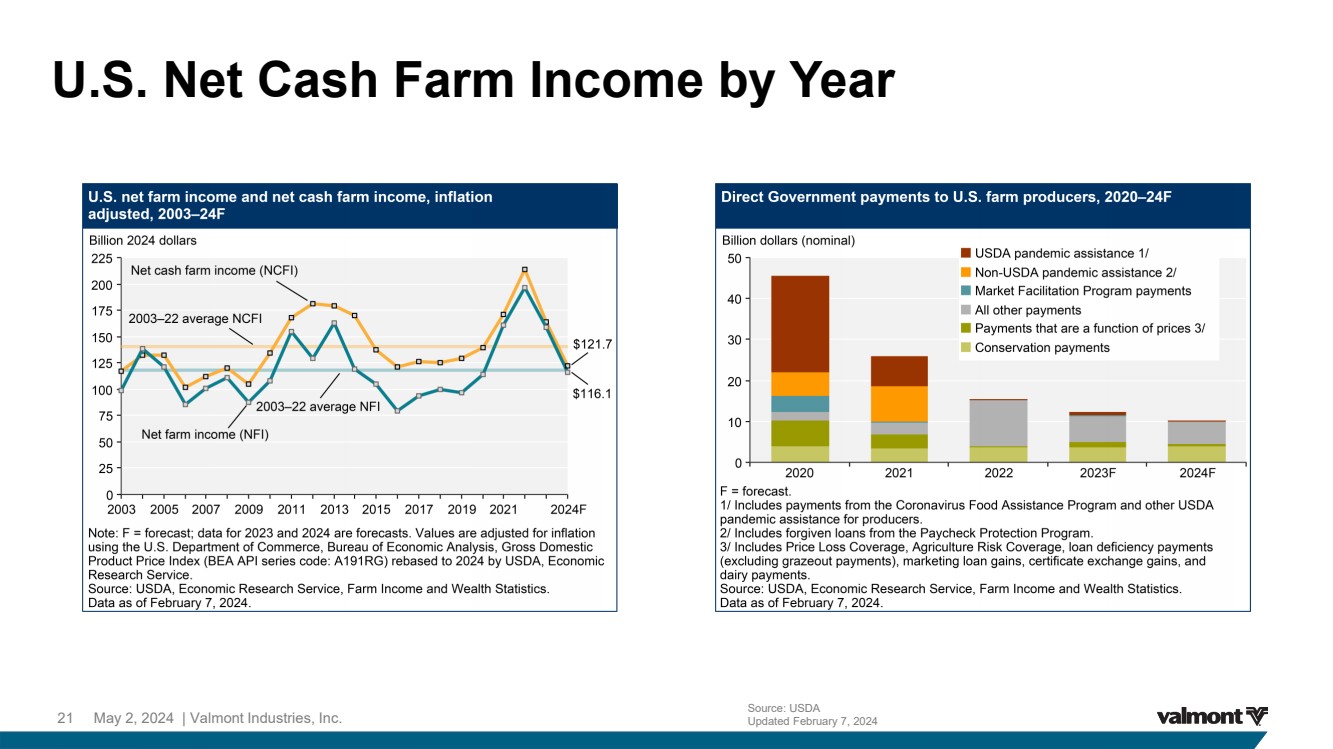
U.S. Net Cash Farm Income by Year 21 May 2, 2024 | Valmont Industries, Inc. Source: USDA Updated February 7, 2024 |
|
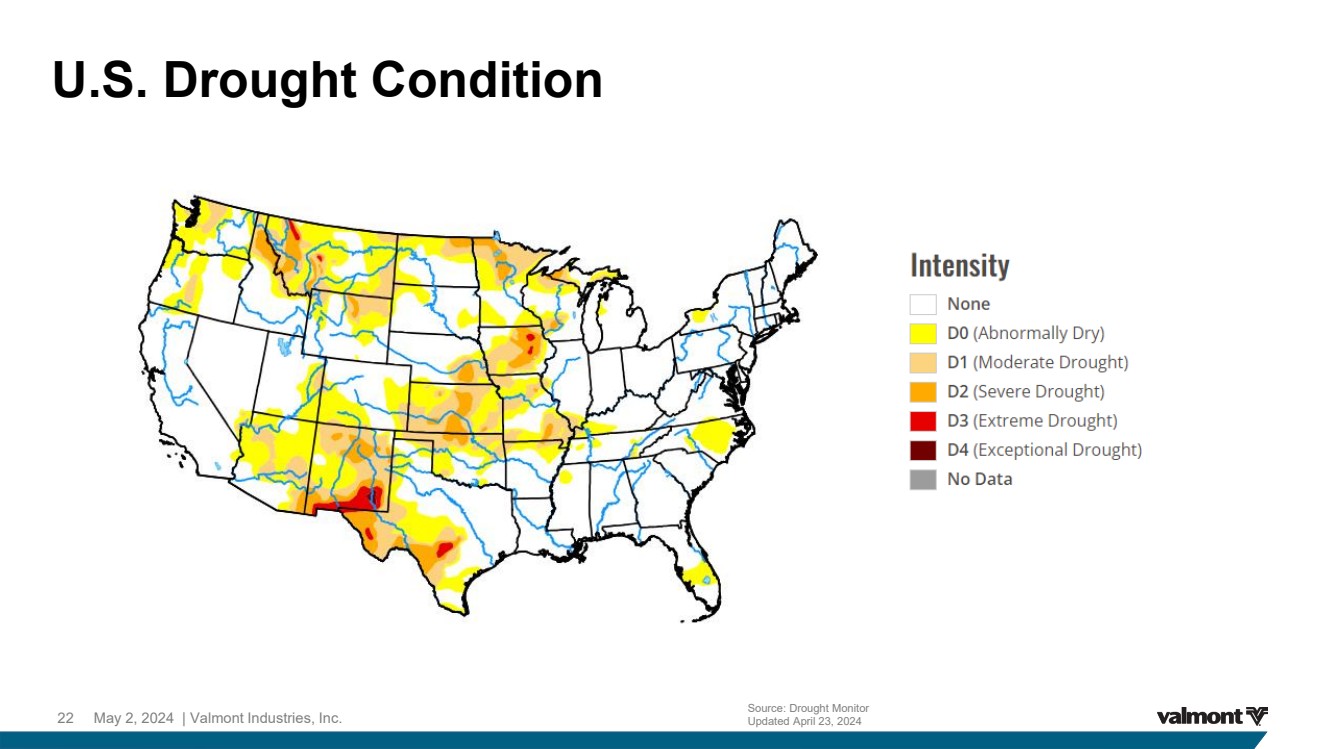
U.S. Drought Condition 22 May 2, 2024 | Valmont Industries, Inc. Source: Drought Monitor Updated April 23, 2024 |
|
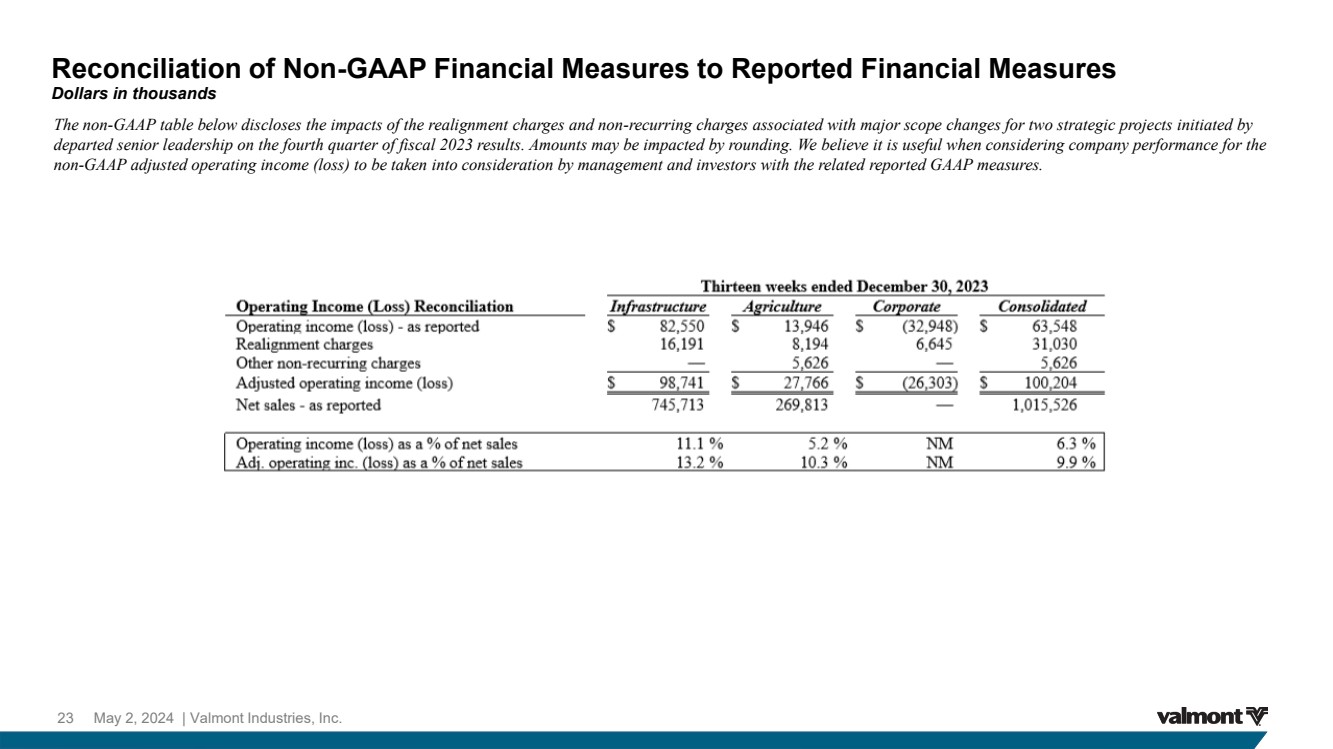
The non-GAAP table below discloses the impacts of the realignment charges and non-recurring charges associated with major scope changes for two strategic projects initiated by departed senior leadership on the fourth quarter of fiscal 2023 results. Amounts may be impacted by rounding. We believe it is useful when considering company performance for the non-GAAP adjusted operating income (loss) to be taken into consideration by management and investors with the related reported GAAP measures. Reconciliation of Non-GAAP Financial Measures to Reported Financial Measures Dollars in thousands 23 May 2, 2024 | Valmont Industries, Inc. |
|
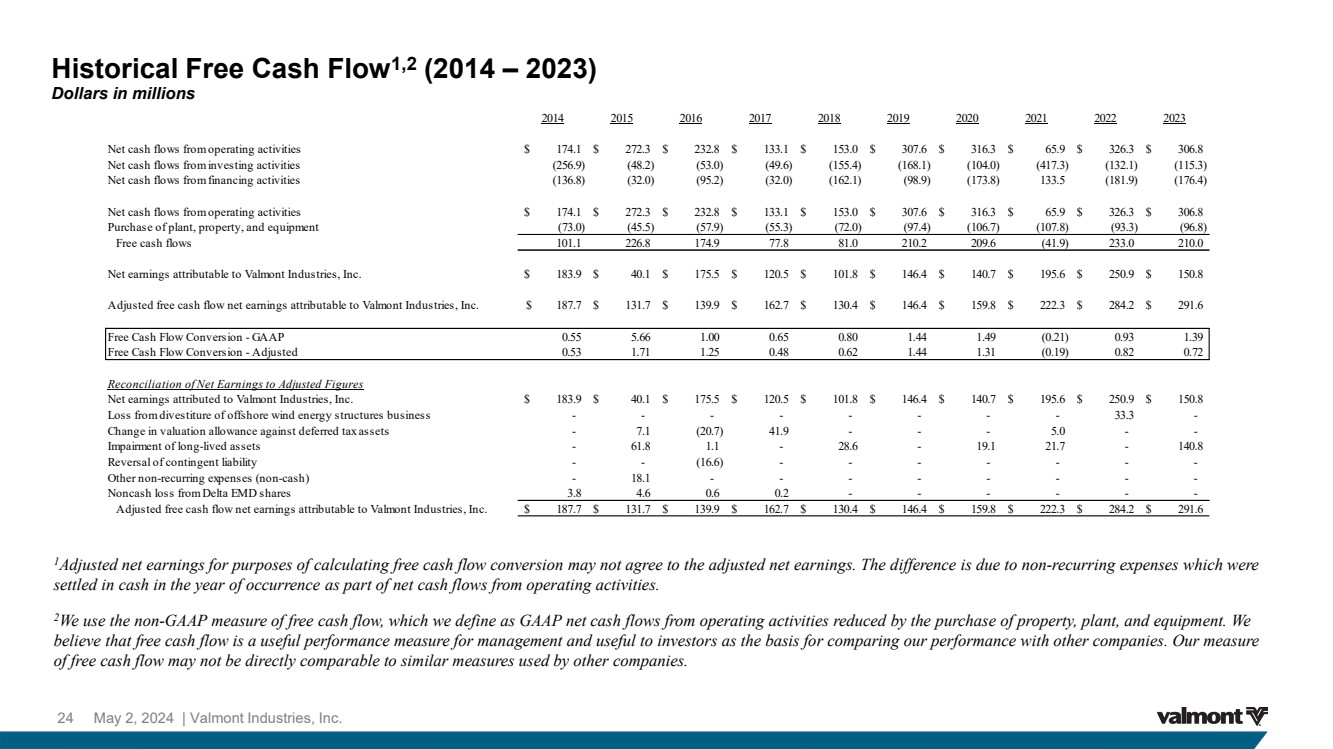
1Adjusted net earnings for purposes of calculating free cash flow conversion may not agree to the adjusted net earnings. The difference is due to non-recurring expenses which were settled in cash in the year of occurrence as part of net cash flows from operating activities. 2We use the non-GAAP measure of free cash flow, which we define as GAAP net cash flows from operating activities reduced by the purchase of property, plant, and equipment. We believe that free cash flow is a useful performance measure for management and useful to investors as the basis for comparing our performance with other companies. Our measure of free cash flow may not be directly comparable to similar measures used by other companies. Historical Free Cash Flow1,2 (2014 – 2023) Dollars in millions 24 May 2, 2024 | Valmont Industries, Inc. 2014 2015 2016 2017 2018 2019 2020 2021 2022 2023 Net cash flows from operating activities $ 174.1 $ 272.3 $ 232.8 $ 133.1 $ 153.0 $ 307.6 $ 316.3 $ 65.9 $ 326.3 $ 306.8 Net cash flows from investing activities (256.9) (48.2) (53.0) (49.6) (155.4) (168.1) (104.0) (417.3) (132.1) (115.3) Net cash flows from financing activities (136.8) (32.0) (95.2) (32.0) (162.1) (98.9) (173.8) 133.5 (181.9) (176.4) Net cash flows from operating activities $ 174.1 $ 272.3 $ 232.8 $ 133.1 $ 153.0 $ 307.6 $ 316.3 $ 65.9 $ 326.3 $ 306.8 Purchase of plant, property, and equipment (73.0) (45.5) (57.9) (55.3) (72.0) (97.4) (106.7) (107.8) (93.3) (96.8) Free cash flows 101.1 226.8 174.9 77.8 81.0 210.2 209.6 (41.9) 233.0 210.0 Net earnings attributable to Valmont Industries, Inc. $ 183.9 $ 40.1 $ 175.5 $ 120.5 $ 101.8 $ 146.4 $ 140.7 $ 195.6 $ 250.9 $ 150.8 Adjusted free cash flow net earnings attributable to Valmont Industries, Inc. $ 187.7 $ 131.7 $ 139.9 $ 162.7 $ 130.4 $ 146.4 $ 159.8 $ 222.3 $ 284.2 $ 291.6 Free Cash Flow Conversion - GAAP 0.55 5.66 1.00 0.65 0.80 1.44 1.49 (0.21) 0.93 1.39 Free Cash Flow Conversion - Adjusted 0.53 1.71 1.25 0.48 0.62 1.44 1.31 (0.19) 0.82 0.72 Reconciliation of Net Earnings to Adjusted Figures Net earnings attributed to Valmont Industries, Inc. $ 183.9 $ 40.1 $ 175.5 $ 120.5 $ 101.8 $ 146.4 $ 140.7 $ 195.6 $ 250.9 $ 150.8 Loss from divestiture of offshore wind energy structures business - - - - - - - - 33.3 - Change in valuation allowance against deferred tax assets - 7.1 (20.7) 41.9 - - - 5.0 - - Impairment of long-lived assets - 61.8 1.1 - 28.6 - 19.1 21.7 - 140.8 Reversal of contingent liability - - (16.6) - - - - - - - Other non-recurring expenses (non-cash) - 18.1 - - - - - - - - Noncash loss from Delta EMD shares 3.8 4.6 0.6 0.2 - - - - - - Adjusted free cash flow net earnings attributable to Valmont Industries, Inc. $ 187.7 $ 131.7 $ 139.9 $ 162.7 $ 130.4 $ 146.4 $ 159.8 $ 222.3 $ 284.2 $ 291.6 |
|
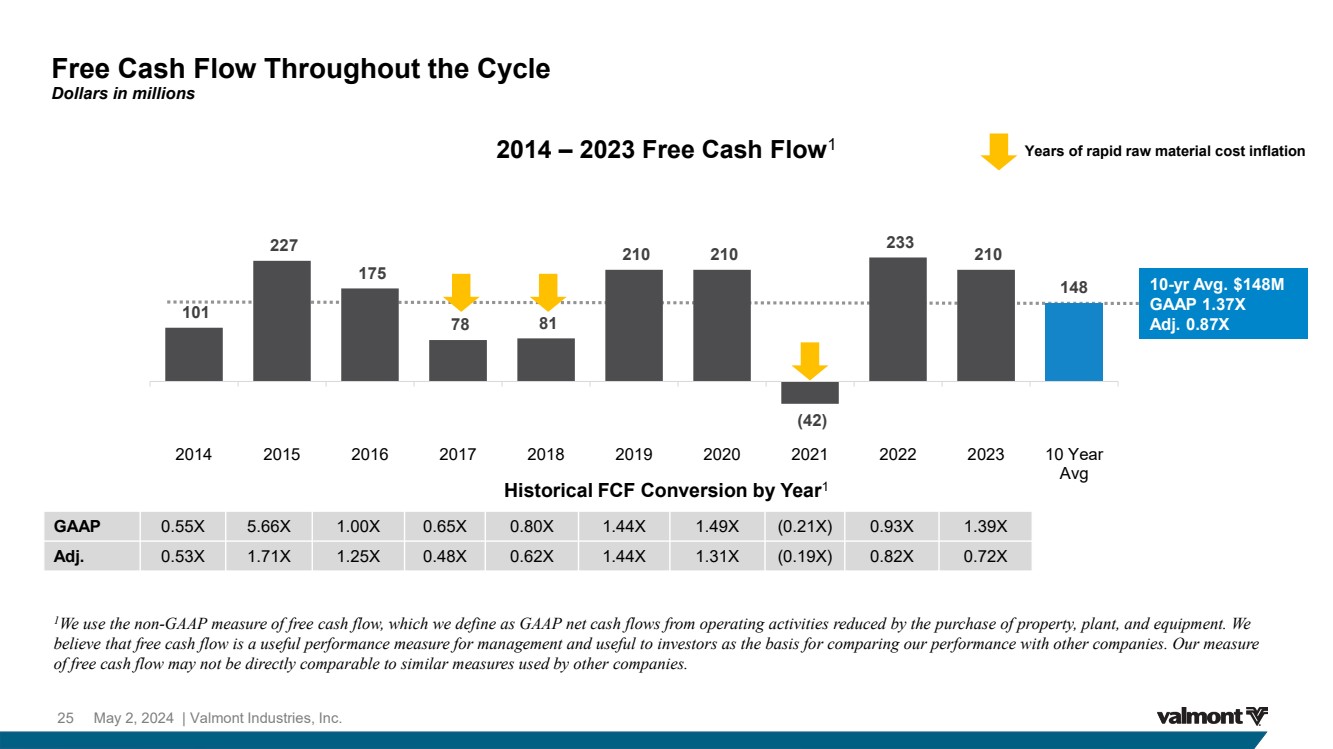
1We use the non-GAAP measure of free cash flow, which we define as GAAP net cash flows from operating activities reduced by the purchase of property, plant, and equipment. We believe that free cash flow is a useful performance measure for management and useful to investors as the basis for comparing our performance with other companies. Our measure of free cash flow may not be directly comparable to similar measures used by other companies. Free Cash Flow Throughout the Cycle Dollars in millions 25 May 2, 2024 | Valmont Industries, Inc. 101 227 175 78 81 210 210 (42) 233 210 148 (100) (50) - 50 100 150 200 250 300 350 2014 2015 2016 2017 2018 2019 2020 2021 2022 2023 10 Year Avg GAAP 0.55X 5.66X 1.00X 0.65X 0.80X 1.44X 1.49X (0.21X) 0.93X 1.39X Adj. 0.53X 1.71X 1.25X 0.48X 0.62X 1.44X 1.31X (0.19X) 0.82X 0.72X Historical FCF Conversion by Year1 2014 – 2023 Free Cash Flow1 10-yr Avg. $148M GAAP 1.37X Adj. 0.87X Years of rapid raw material cost inflation |
|
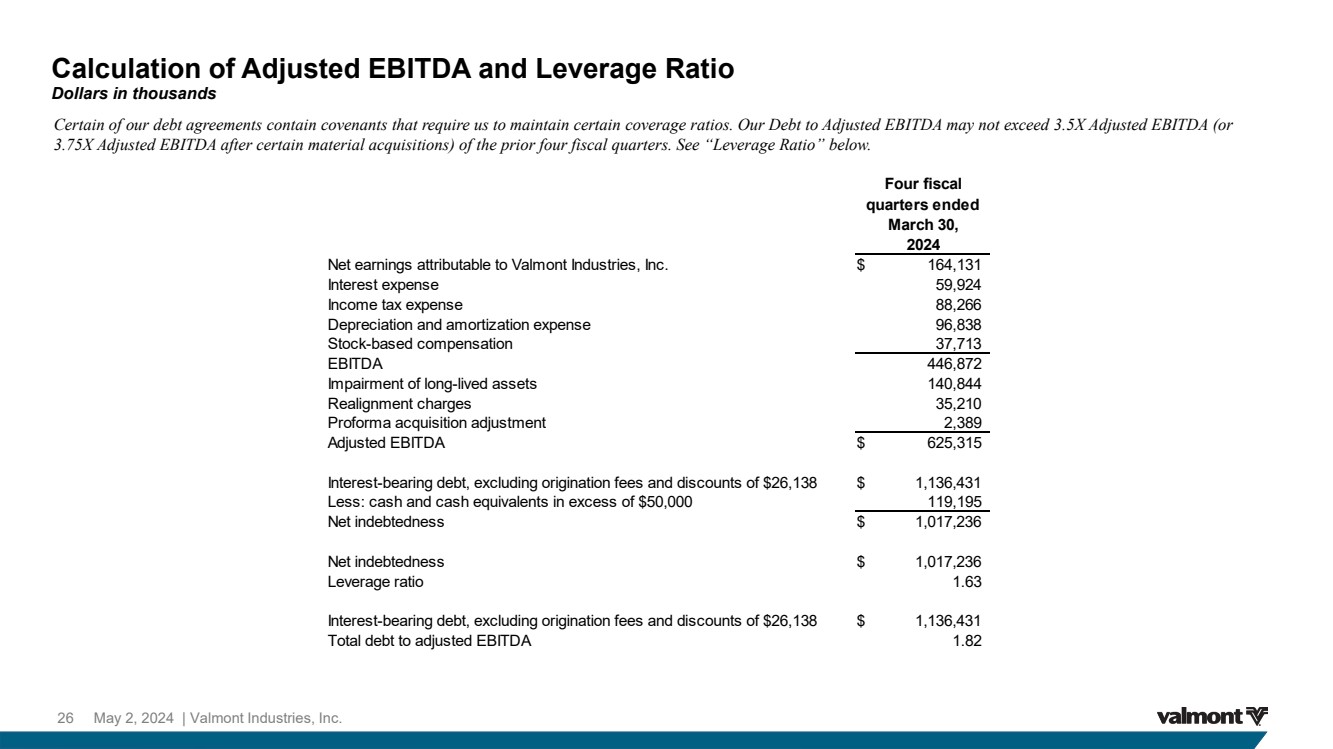
Certain of our debt agreements contain covenants that require us to maintain certain coverage ratios. Our Debt to Adjusted EBITDA may not exceed 3.5X Adjusted EBITDA (or 3.75X Adjusted EBITDA after certain material acquisitions) of the prior four fiscal quarters. See “Leverage Ratio” below. Calculation of Adjusted EBITDA and Leverage Ratio Dollars in thousands 26 May 2, 2024 | Valmont Industries, Inc. Net earnings attributable to Valmont Industries, Inc. $ 164,131 Interest expense 59,924 Income tax expense 88,266 Depreciation and amortization expense 96,838 Stock-based compensation 37,713 EBITDA 446,872 Impairment of long-lived assets 140,844 Realignment charges 35,210 Proforma acquisition adjustment 2,389 Adjusted EBITDA $ 625,315 Interest-bearing debt, excluding origination fees and discounts of $26,138 $ 1,136,431 Less: cash and cash equivalents in excess of $50,000 119,195 Net indebtedness $ 1,017,236 Net indebtedness $ 1,017,236 Leverage ratio 1.63 Interest-bearing debt, excluding origination fees and discounts of $26,138 $ 1,136,431 Total debt to adjusted EBITDA 1.82 Four fiscal quarters ended March 30, 2024 |