UNITED STATES
SECURITIES AND EXCHANGE COMMISSION
Washington, D.C. 20549
FORM 8-K
CURRENT REPORT
Pursuant to Section 13 OR 15(d) of The Securities Exchange Act of 1934
February 21, 2024
Date of Report (Date of earliest event reported)
Valmont Industries, Inc.
(Exact name of registrant as specified in its charter)
Delaware
(State or other jurisdiction of incorporation)
1-31429 |
47-0351813 |
|
(Commission File Number) |
|
(IRS Employer Identification No.) |
|
|
|
15000 Valmont Plaza |
|
68154 |
Omaha, Nebraska |
|
|
(Address of principal executive offices) |
|
(Zip Code) |
(402) 963-1000
Registrant's telephone number, including area code
N/A
(Former name or former address, if changed since last report.)
Check the appropriate box below if the Form 8-K filing is intended to simultaneously satisfy the filing obligation of the registrant under any of the following provisions (see General Instruction A.2. below):
☐ Written communications pursuant to Rule 425 under the Securities Act (17 CFR 230.425)
☐ Soliciting material pursuant to Rule 14a-12 under the Exchange Act (17 CFR 240.14a-12)
☐ Pre-commencement communications pursuant to Rule 14d-2(b) under the Exchange Act (17 CFR 240.14d-2(b))
☐ Pre-commencement communications pursuant to Rule 13e-4(c) under the Exchange Act (17 CFR 240.13e-4(c))
Securities registered pursuant to Section 12(b) of the Act:
Title of each class |
|
Trading Symbol(s) |
|
Name of each exchange on which registered |
Common Stock, $1.00 par value |
|
VMI |
|
New York Stock Exchange |
Indicate by check mark whether the registrant is an emerging growth company as defined in Rule 405 of the Securities Act of 1933 (§230.405 of this chapter) or Rule 12b-2 of the Securities Exchange Act of 1934 (§240.12b-2 of this chapter).
Emerging growth company ☐
If an emerging growth company, indicate by check mark if the registrant has elected not to use the extended transition period for complying with any new or revised financial accounting standards provided pursuant to Section 13(a) of the Exchange Act.
☐
Item 2.02. Results of Operations and Financial Condition.
Valmont Industries, Inc. issued a press release on February 21, 2024 announcing its financial results for its fiscal quarter ended December 30, 2023. The press release, along with the presentation to be used during its earnings call on February 22, 2024, are furnished with this Form 8-K as Exhibit 99.1 and Exhibit 99.2, respectively.
The information in this Item 2.02 is being furnished and shall not be deemed “filed” for the purpose of Section 18 of the Securities Exchange Act of 1934, as amended, or otherwise subject to the liabilities of that section. The information in this Item 2.02 shall not be incorporated by reference into any registration statement or other document pursuant to the Securities Act of 1933, as amended.
Item 9.01. Financial Statements and Exhibits.
(d) Exhibits.
Exhibit No. |
|
Description |
99.1 |
|
|
99.2 |
|
|
104 |
|
Cover Page Interactive File (the cover page XBRL tags are embedded in the Inline XBRL document) |
SIGNATURES
Pursuant to the requirements of the Securities Exchange Act of 1934, the registrant has duly caused this report to be signed on its behalf by the undersigned hereunto duly authorized.
|
|
Valmont Industries, Inc. |
||
Date: |
February 21, 2024 |
|
|
|
|
By: |
/s/ TIMOTHY P. FRANCIS |
||
|
|
Name: |
Timothy P. Francis |
|
|
|
Title: |
Interim Chief Financial Officer |
|

Exhibit 99.1
|
FOR IMMEDIATE RELEASE |
||
|
|
|
|
Contact: |
Renee Campbell |
|
|
Email: |
renee.campbell@valmont.com |
|
|
Date: |
February 21, 2024 |
|
|
Valmont Reports Fourth Quarter and Full Year 2023 Results
Provides 2024 Financial Outlook and New Long-Term Financial Targets
Omaha, NE - Valmont Industries, Inc. (NYSE: VMI), a global leader that provides vital infrastructure and advances agricultural productivity while driving innovation through technology, today reported financial results for the fourth quarter and fiscal year ended December 30, 2023.
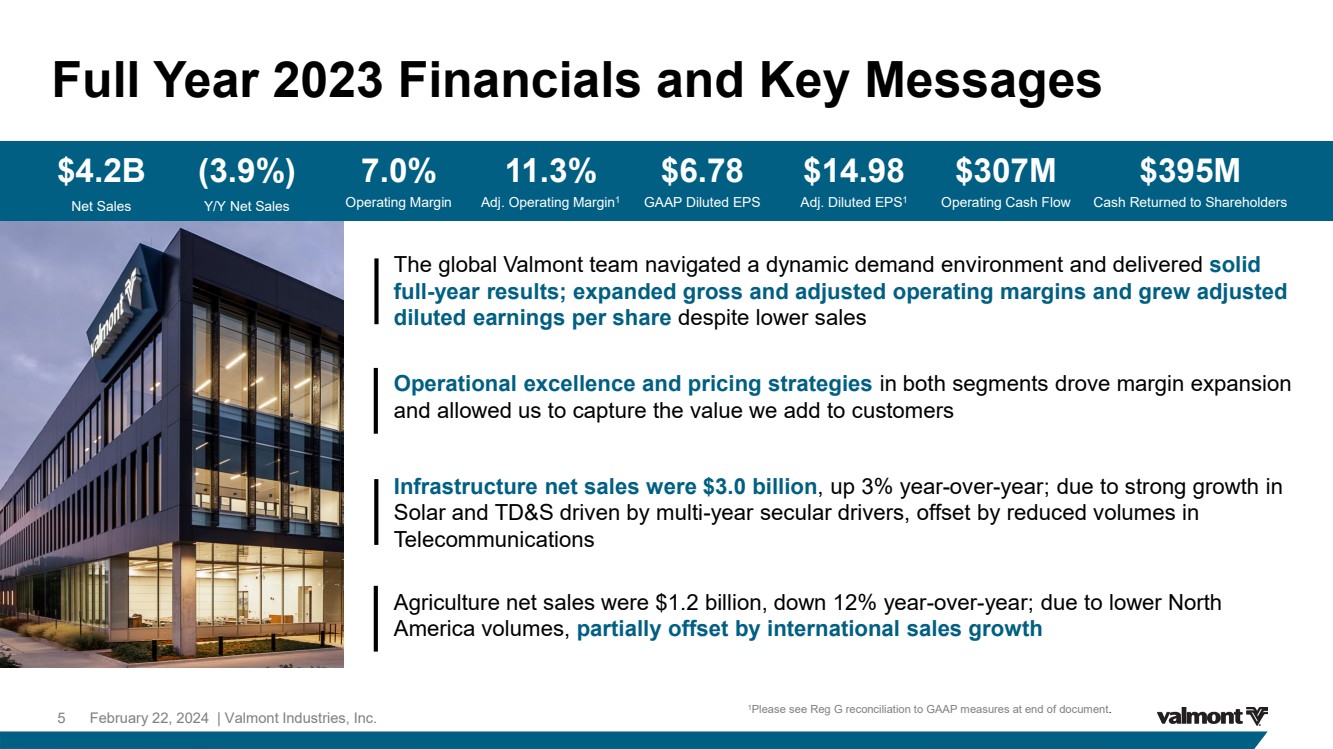
President and Chief Executive Officer Avner M. Applbaum commented, “The Valmont team delivered fourth-quarter results in line with our expectations. Despite lower sales volumes, we expanded gross profit margins year-over-year through successful pricing strategies and improved operational efficiencies in our facilities. In Infrastructure, our solid results reflect continued strong utility market demand, and we achieved another quarter of adjusted operating margin improvement year-over-year despite lower Telecommunications volumes. In Agriculture, as expected, North America sales were lower as backlog levels were more normalized this year compared to fourth quarter 2022. International sales growth was driven by Middle East project shipments and sales from our recent acquisition of HR Products, offset by lower sales in Brazil due to slowing market demand amid lower grain prices. Reflecting on the full year, our global teams performed extremely well in 2023, despite industry-wide demand challenges in North America agriculture and telecommunications markets that pressured the top line. I’m very pleased with our progress in reducing inventory, which helped deliver strong operating cash flows.”
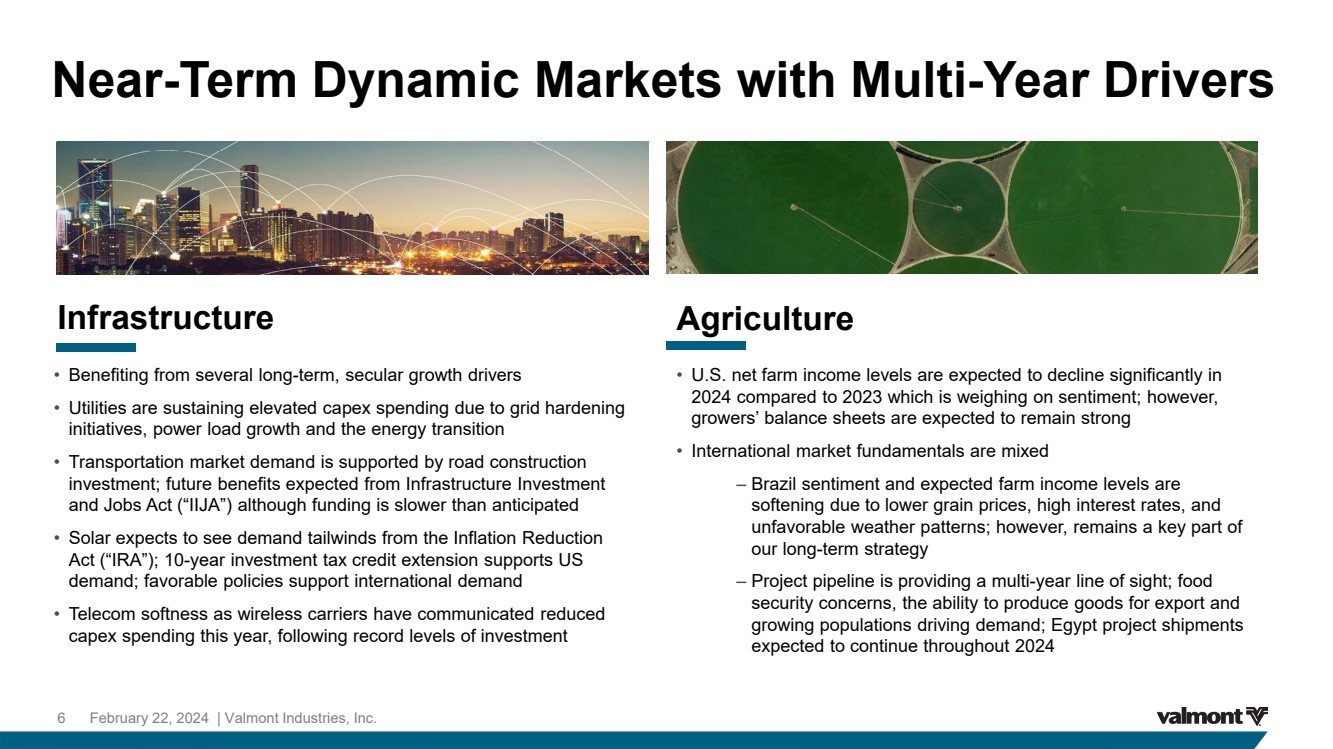
Applbaum added, “Turning to 2024, we remain focused on what we can control. We are sustaining higher gross profit margins through ongoing improvement in operational efficiencies and commitment to our pricing strategies. We are reducing SG&A expense through the realignment program we announced last quarter. We expect these efforts to help mitigate the bottom-line impact of softer demand in agriculture and telecommunications markets, and to position our business for incremental profit when those markets normalize. Turning to the segments, in Infrastructure, demand for our products remains strong and we are making strategic capacity investments to meet the needs of our customers and take advantage of the visible opportunities ahead of us. In Agriculture, we expect lower sales this year amid more challenging global market conditions due to lower grain prices and farm income projections. Across both segments, we will continue to deliver operational efficiencies and benefit from our realigned organization. Our market leadership, combined with a relentless focus on strong cash flow generation, return on invested capital and a disciplined capital allocation framework gives us confidence in our actions to enhance shareholder value for years to come.”
Fourth Quarter 2023 Highlights (all metrics compared to Fourth Quarter 2022 unless otherwise noted)
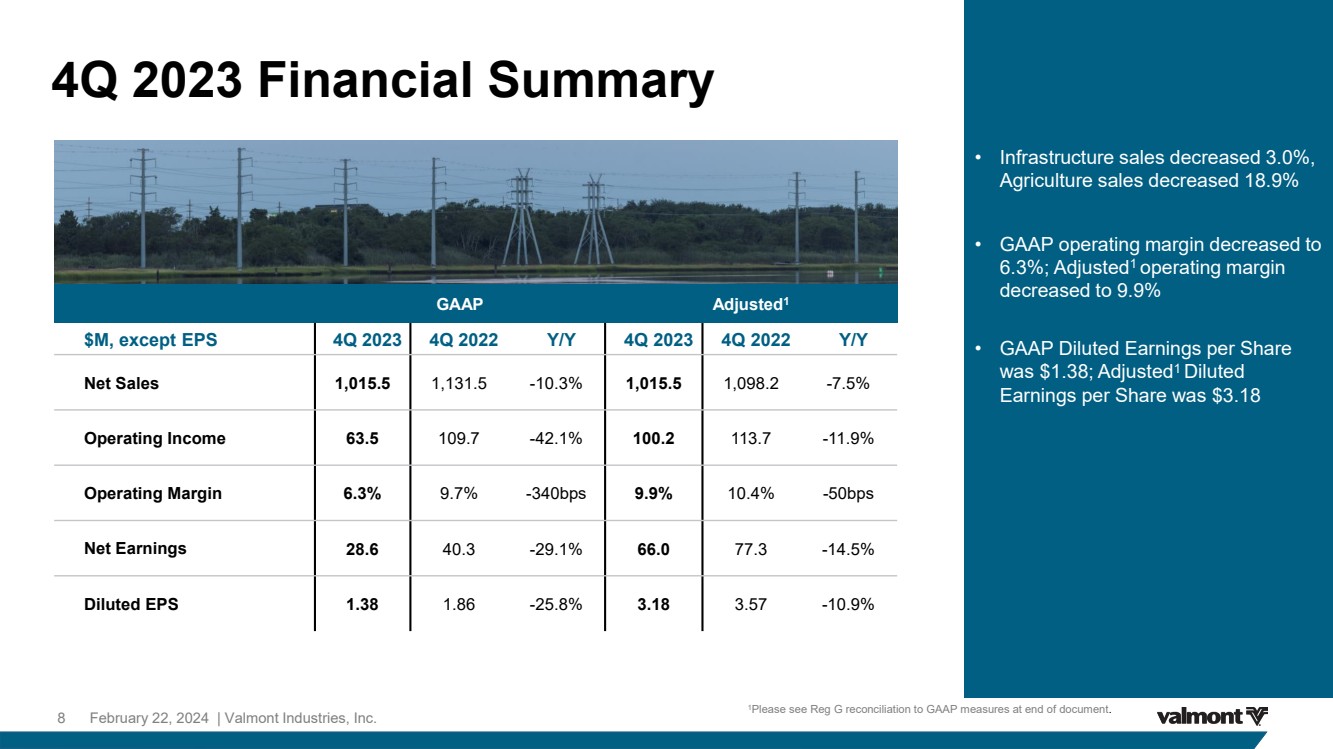
| ● | Net Sales decreased 10.3% to $1.0 billion. Accounting for the 2022 divestiture of the offshore wind energy structures business, reported in the “Other” segment, Net Sales decreased 7.5%1 |
| ● | Operating Income decreased 42.1% to $63.5 million or 6.3% of net sales (decreased 11.9% to $100.2 million or 9.9% adjusted1) compared to $109.7 million or 9.7% of net sales ($113.7 million or 10.4% adjusted1) |
| ● | Diluted Earnings per Share (“EPS”) of $1.38 ($3.18 adjusted1) compared to $1.86 ($3.57 adjusted1) |
| ● | Generated strong operating cash flows of $115.9 million; cash and cash equivalents at the end of the fourth quarter were $203.0 million |
Full Year 2023 Highlights (all metrics compared to Full Year 2022 unless otherwise noted)
| ● | Net Sales decreased 3.9% to $4.2 billion. Accounting for the 2022 divestiture of the offshore wind energy structures business, reported in the “Other” segment, Net Sales decreased 1.7%1 |
| ● | Operating Income decreased 32.7% to $291.6 million or 7.0% of net sales (increased 5.2% to $473.2 million or 11.3% adjusted1) compared to $433.2 million or 10.0% of net sales ($449.7 million or 10.6% adjusted1) |
| ● | Diluted EPS of $6.78 ($14.98 adjusted1) compared to $11.62 ($13.82 adjusted1) |
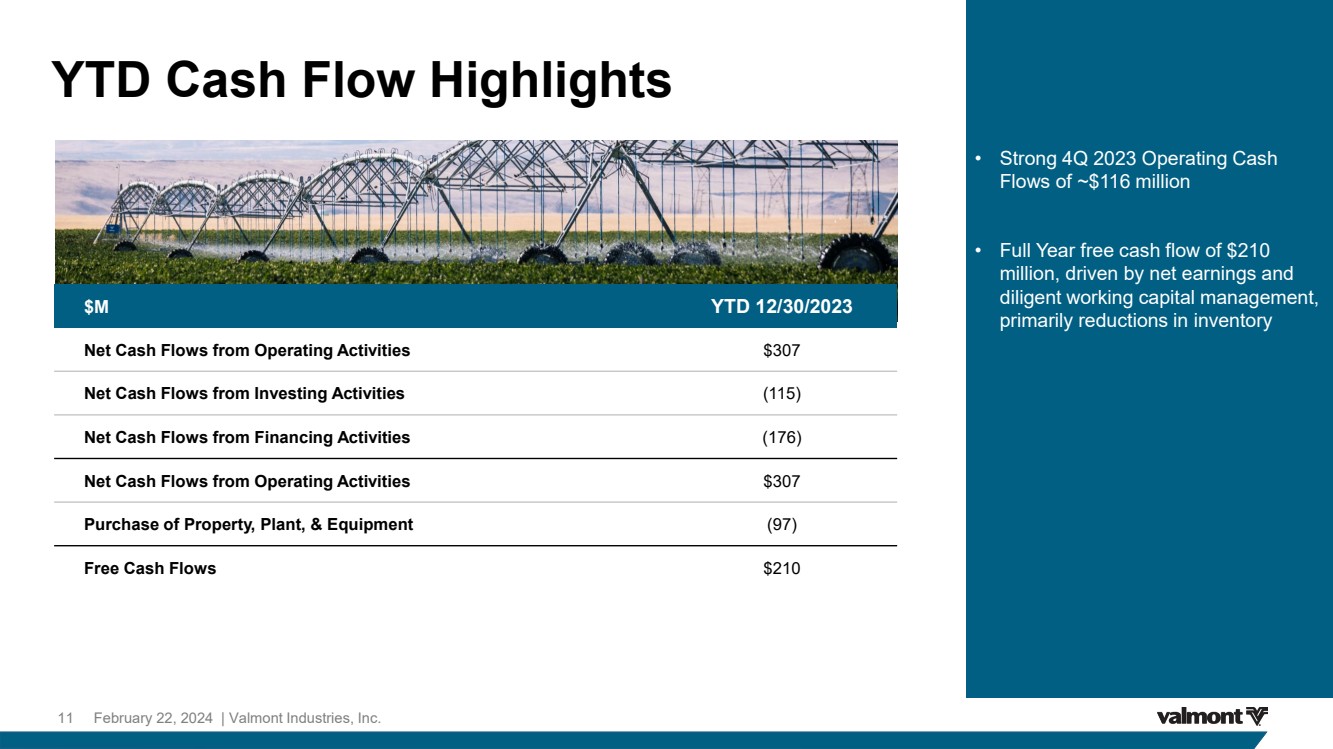
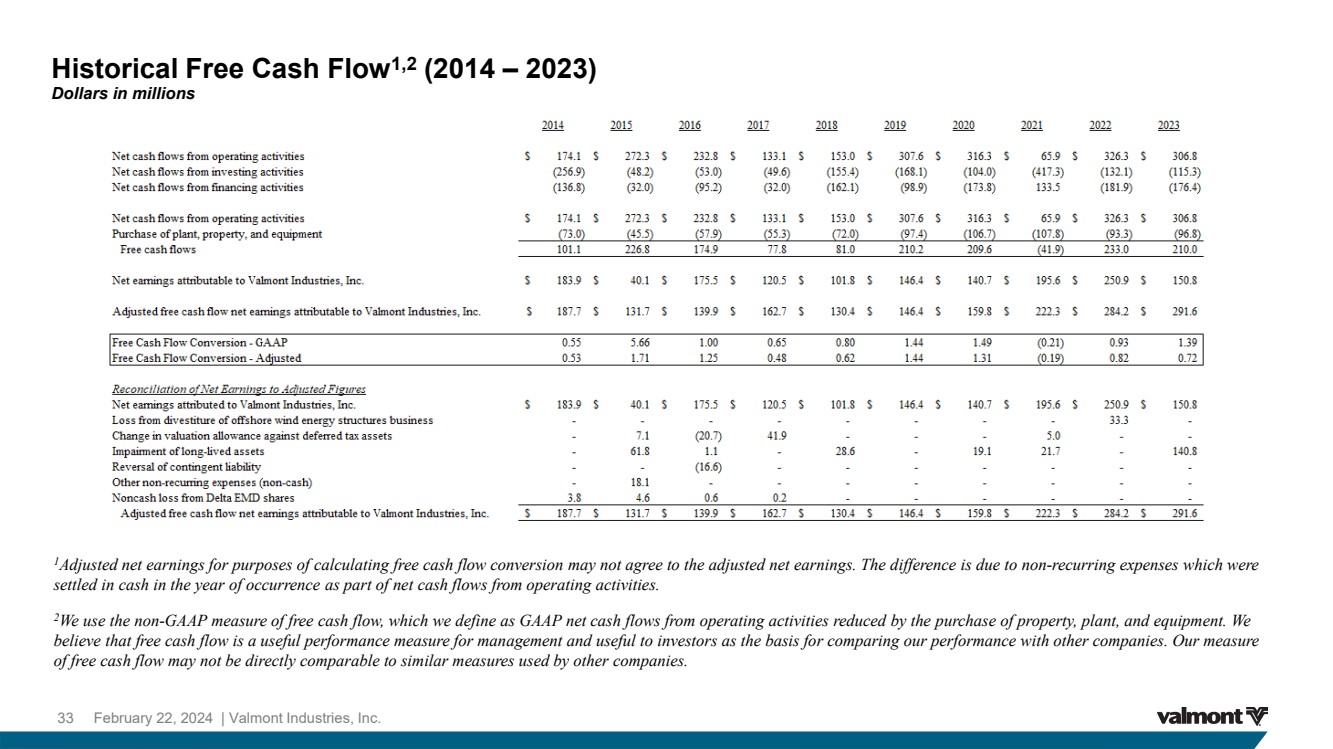
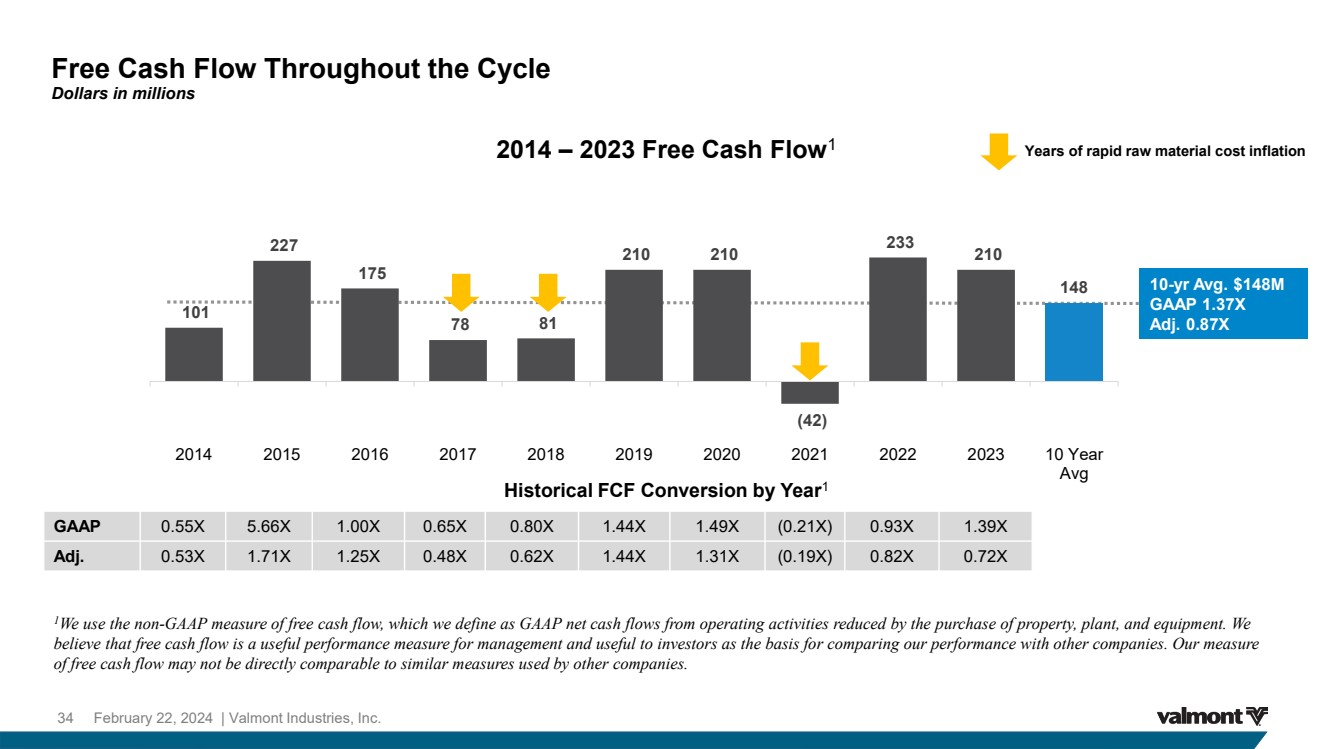
| ● | Generated strong operating cash flows of $306.8 million and free cash flow of $210.0 million1, driven by net earnings and working capital management |
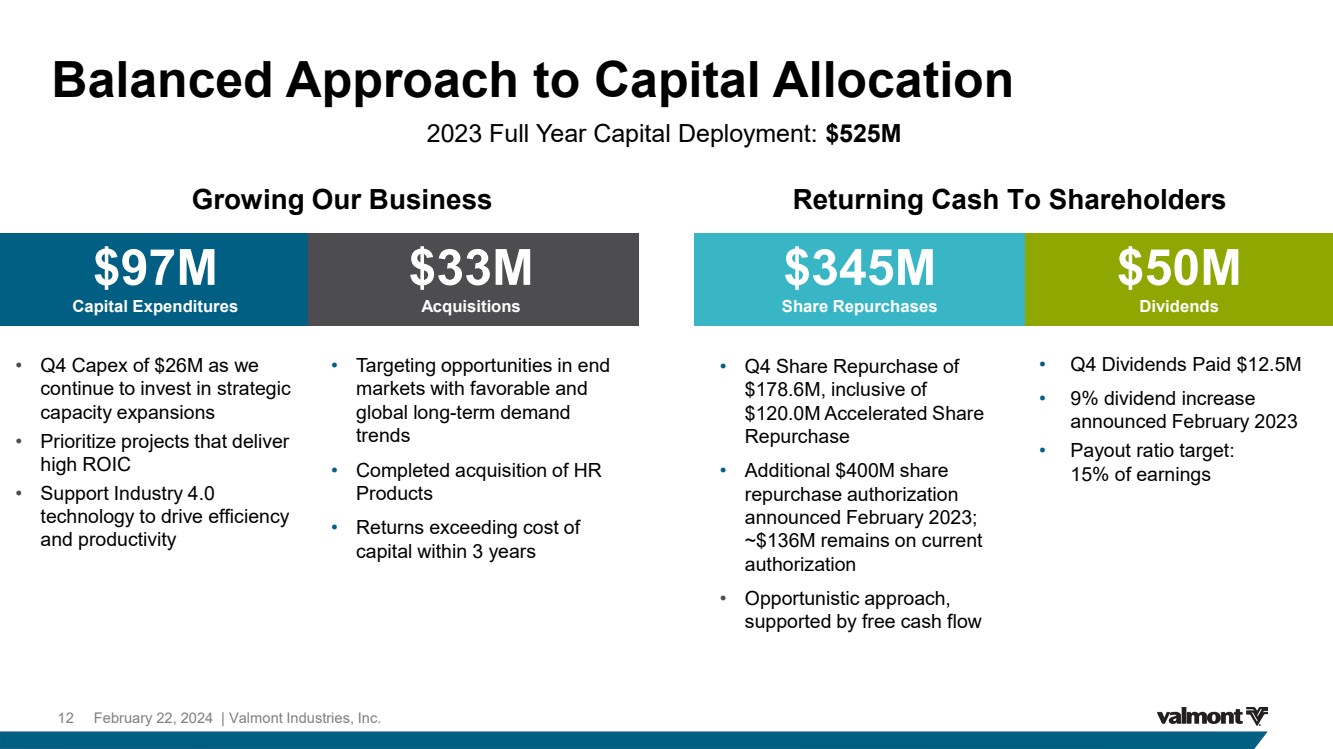
| ● | Deployed $524.2 million of capital, including $129.4 million for capital expenditures and acquisitions, and $394.8 million was returned to shareholders through dividends and share repurchases |
| o | Share repurchases include a $120.0 million Accelerated Share Repurchase program announced in the fourth quarter |
| ● | Achieved Return on Invested Capital of 7.2% (14.0% adjusted1) |
1Please see Reg G reconciliation to GAAP measures at end of document
Key Financial Metrics
Fourth Quarter 2023 |
|
GAAP |
|
Adjusted1 |
|
|||||||||||||
(000s except per share amounts) |
|
13 weeks |
|
14 weeks |
|
|
|
|
13 weeks |
|
14 weeks |
|
|
|
||||
|
|
12/30/2023 |
|
12/31/2022 |
|
|
|
|
12/30/2023 |
|
12/31/2022 |
|
|
|
||||
|
|
Q4 2023 |
|
Q4 2022 |
|
vs. Q4 2022 |
|
|
Q4 2023 |
|
Q4 2022 |
|
vs. Q4 2022 |
|
||||
Net Sales |
|
$ |
1,015,526 |
|
$ |
1,131,516 |
|
(10.3) |
% |
|
$ |
1,015,526 |
|
$ |
1,098,244 |
|
(7.5) |
% |
Gross Profit |
|
|
282,941 |
|
|
298,959 |
|
(5.4) |
% |
|
|
282,941 |
|
|
298,959 |
|
(5.4) |
% |
Gross Profit as a % of Net Sales |
|
|
27.9 |
% |
|
26.4 |
% |
|
|
|
|
27.9 |
% |
|
27.2 |
% |
|
|
Operating Income |
|
|
63,548 |
|
|
109,716 |
|
(42.1) |
% |
|
|
100,204 |
|
|
113,734 |
|
(11.9) |
% |
Operating Income as a % of Net Sales |
|
|
6.3 |
% |
|
9.7 |
% |
|
|
|
|
9.9 |
% |
|
10.4 |
% |
|
|
Net Earnings1 |
|
|
28,587 |
|
|
40,332 |
|
(29.1) |
% |
|
|
66,034 |
|
|
77,256 |
|
(14.5) |
% |
Diluted Earnings per Share |
|
|
1.38 |
|
|
1.86 |
|
(25.8) |
% |
|
|
3.18 |
|
|
3.57 |
|
(10.9) |
% |
Average Shares Outstanding |
|
|
20,764 |
|
|
21,656 |
|
|
|
|
|
20,764 |
|
|
21,656 |
|
|
|
Full Year 2023 |
|
GAAP |
|
Adjusted1 |
|
|||||||||||||
(000s except per share amounts) |
|
52 weeks |
|
53 weeks |
|
|
|
|
52 weeks |
|
53 weeks |
|
|
|
||||
|
|
12/30/2023 |
|
12/31/2022 |
|
|
|
|
12/30/2023 |
|
12/31/2022 |
|
|
|
||||
|
|
FY 2023 |
|
FY 2022 |
|
vs. FY 2022 |
|
|
FY 2023 |
|
FY 2022 |
|
vs. FY 2022 |
|
||||
Net Sales |
|
$ |
4,174,598 |
|
$ |
4,345,250 |
|
(3.9) |
% |
|
$ |
4,174,598 |
|
$ |
4,245,031 |
|
(1.7) |
% |
Gross Profit |
|
|
1,236,034 |
|
|
1,126,224 |
|
9.8 |
% |
|
|
1,236,034 |
|
|
1,126,224 |
|
9.8 |
% |
Gross Profit as a % of Net Sales |
|
|
29.6 |
% |
|
25.9 |
% |
|
|
|
|
29.6 |
% |
|
26.5 |
% |
|
|
Operating Income |
|
|
291,557 |
|
|
433,249 |
|
(32.7) |
% |
|
|
473,237 |
|
|
449,725 |
|
5.2 |
% |
Operating Income as a % of Net Sales |
|
|
7.0 |
% |
|
10.0 |
% |
|
|
|
|
11.3 |
% |
|
10.6 |
% |
|
|
Net Earnings1 |
|
|
143,475 |
|
|
250,863 |
|
(42.8) |
% |
|
|
316,926 |
|
|
298,139 |
|
6.3 |
% |
Diluted Earnings per Share |
|
|
6.78 |
|
|
11.62 |
|
(41.7) |
% |
|
|
14.98 |
|
|
13.82 |
|
8.4 |
% |
Average Shares Outstanding |
|
|
21,159 |
|
|
21,580 |
|
|
|
|
|
21,159 |
|
|
21,580 |
|
|
|
Fourth Quarter 2023 Segment Review
Infrastructure (73.4% of Net Sales)
Products and solutions to serve the infrastructure markets of utility, solar, lighting, transportation, and telecommunications, along with coatings services to protect metal products
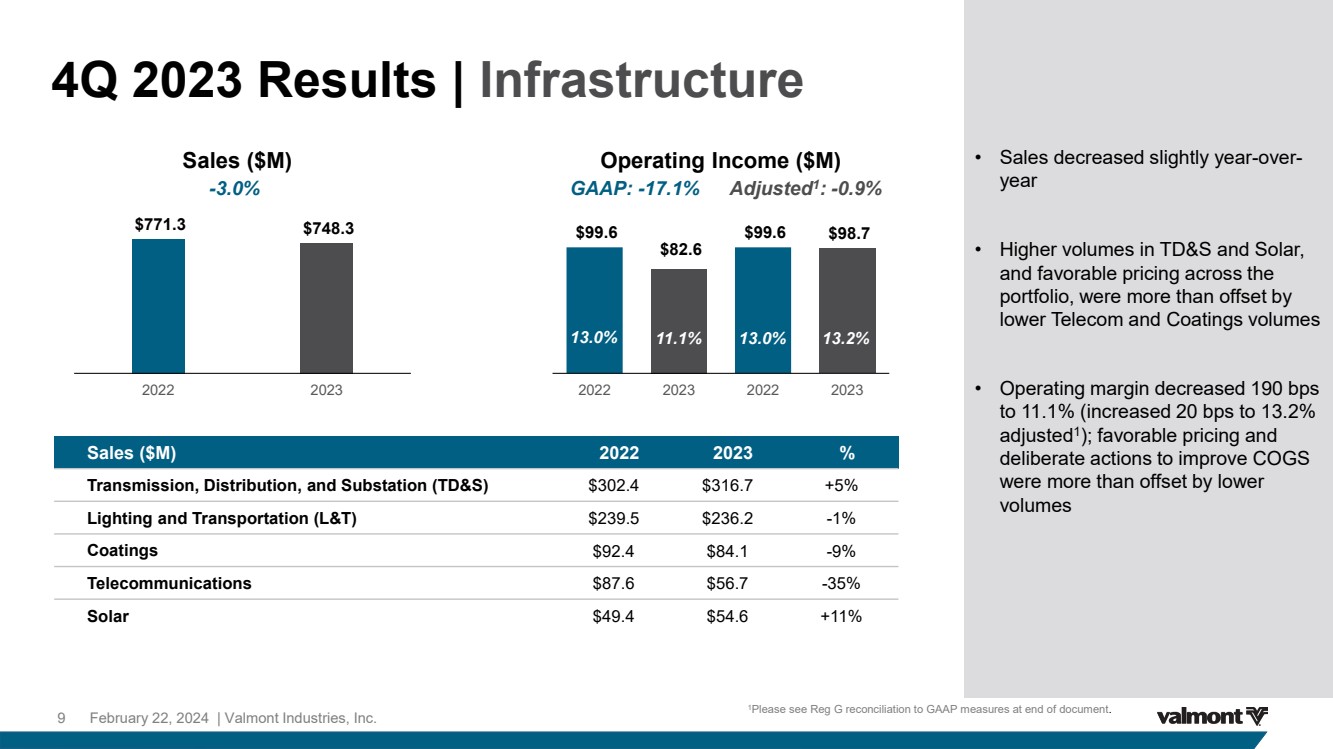
Sales of $748.3 million decreased 3.0% year-over-year. Higher volumes in the Transmission, Distribution and Substation (TD&S) and Solar product lines were driven by continued strong market demand led by ongoing investments in the global energy transition. These volume increases, and favorable pricing across the portfolio, were more than offset by lower Telecommunications and Coatings volumes.
Operating Income decreased to $82.6 million or 11.1% of net sales ($98.7 million or 13.2% adjusted1) compared to $99.6 million or 13.0% of net sales in 2022. Favorable pricing and deliberate actions to improve overall cost of goods sold were more than offset by lower volumes.
Agriculture (26.6% of Net Sales)
Center pivot components and linear irrigation equipment for agricultural markets, including parts and tubular products; advanced technology solutions for precision agriculture
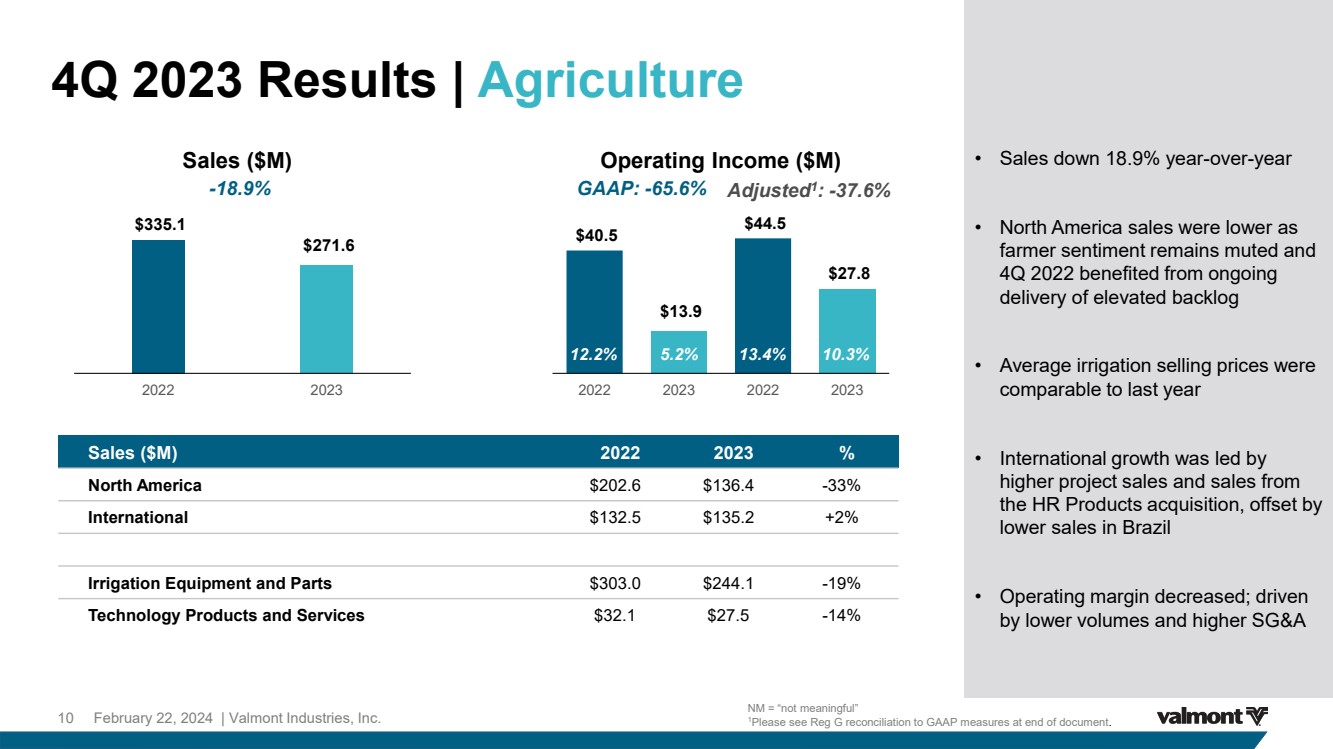
Sales of $271.6 million decreased 18.9% year-over-year. In North America, irrigation equipment volumes were lower as the fourth quarter of 2022 benefited from the ongoing delivery of elevated backlog. Average irrigation selling prices were comparable to last year.
International sales growth was driven by higher project sales and sales from the HR Products acquisition, offset by lower sales in Brazil, due to lower grain prices and the return of backlog to a more normalized level as compared to fourth quarter 2022.
1Please see Reg G reconciliation to GAAP measures at end of document
Operating Income decreased to $13.9 million, or 5.2% of net sales ($27.8 million or 10.3% adjusted1) compared to $40.5 million or 12.2% of net sales ($44.5 million or 13.4% adjusted1) in 2022 driven by lower volumes and higher SG&A.
Other
Offshore wind energy structures business
As previously announced, the divestiture of the offshore wind energy structures business was completed in December 2022. In the fourth quarter of 2022, the subsequently divested business generated sales of $33.3 million and operating income was $1.4 million.
1Please see Reg G reconciliation to GAAP measures at end of document
Balance Sheet, Liquidity, and Capital Allocation
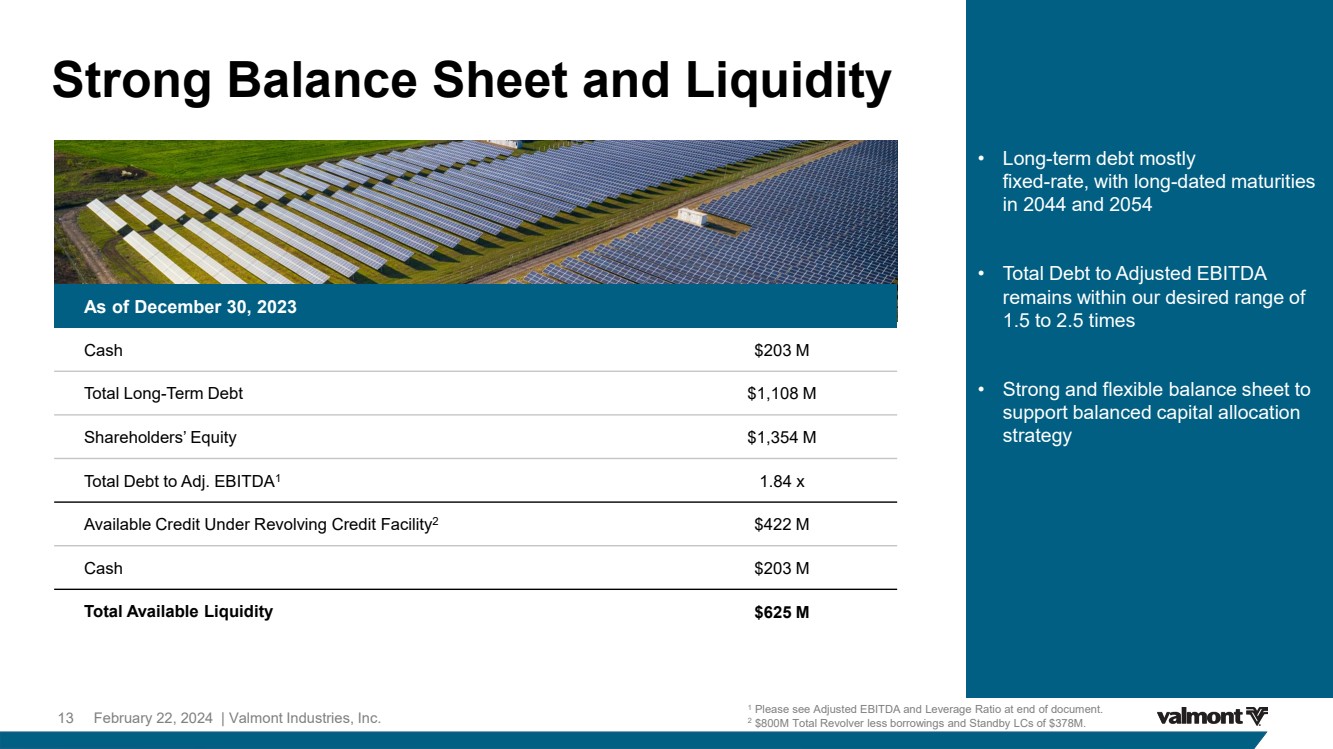
The Company generated full-year 2023 free cash flow1 of $210.0 million through earnings and effectively managing working capital. At the end of 2023, cash and cash equivalents were $203.0 million.
$178.6 million of Company stock was purchased in the fourth quarter, inclusive of the $120.0 million Accelerated Share Repurchase program executed during the quarter. $136.1 million remains on the authorized share repurchase program.
Organizational Realignment Program
As announced in October 2023, the Company initiated an organizational realignment program to better align the Company’s administrative support structure to its long-term growth strategy. The program affected both reportable segments and corporate, and was completed in 2023. Actions taken resulted in pre-tax cash expenses of $35.2 million in fiscal 2023, including $31.0 million in the fourth quarter, and are expected to be recovered through lower SG&A within 12 months.
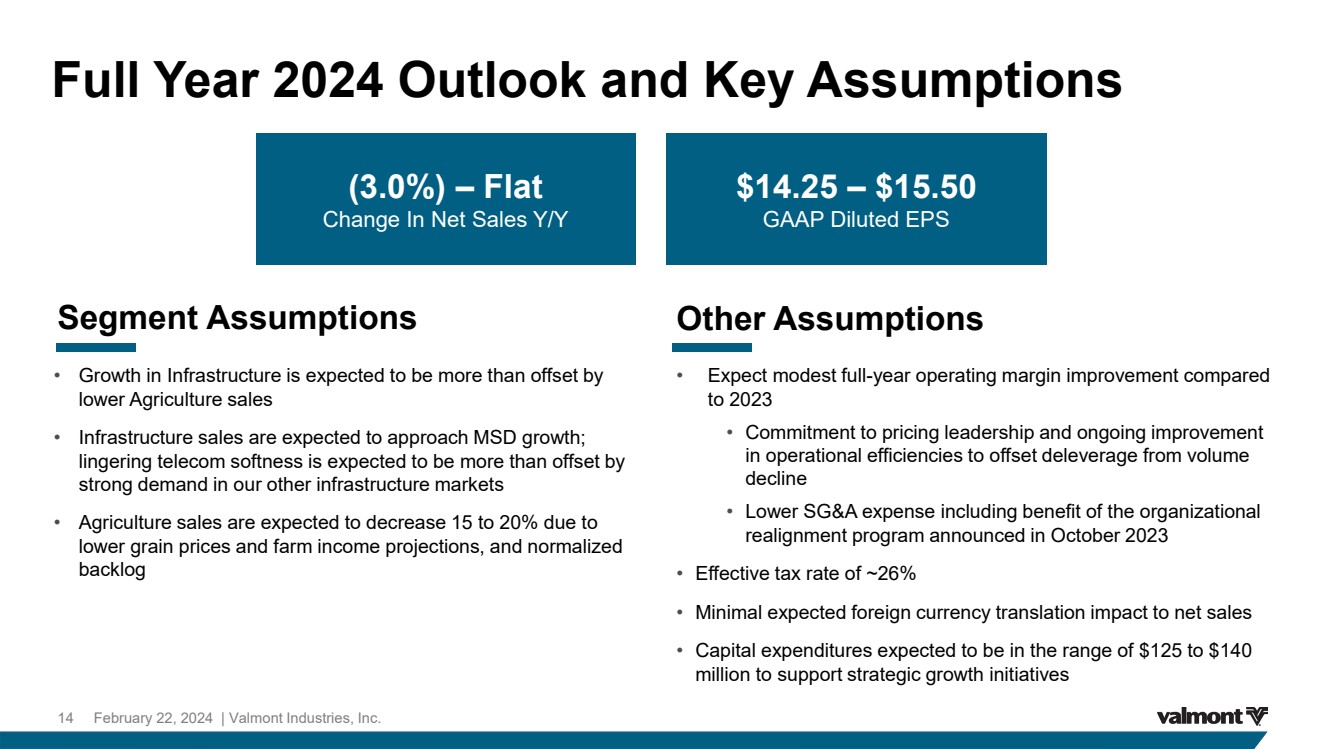
Introducing 2024 Full Year Financial Outlook and Key Assumptions
The Company is introducing its 2024 full-year net sales and diluted earnings per share outlook and key assumptions for the year.
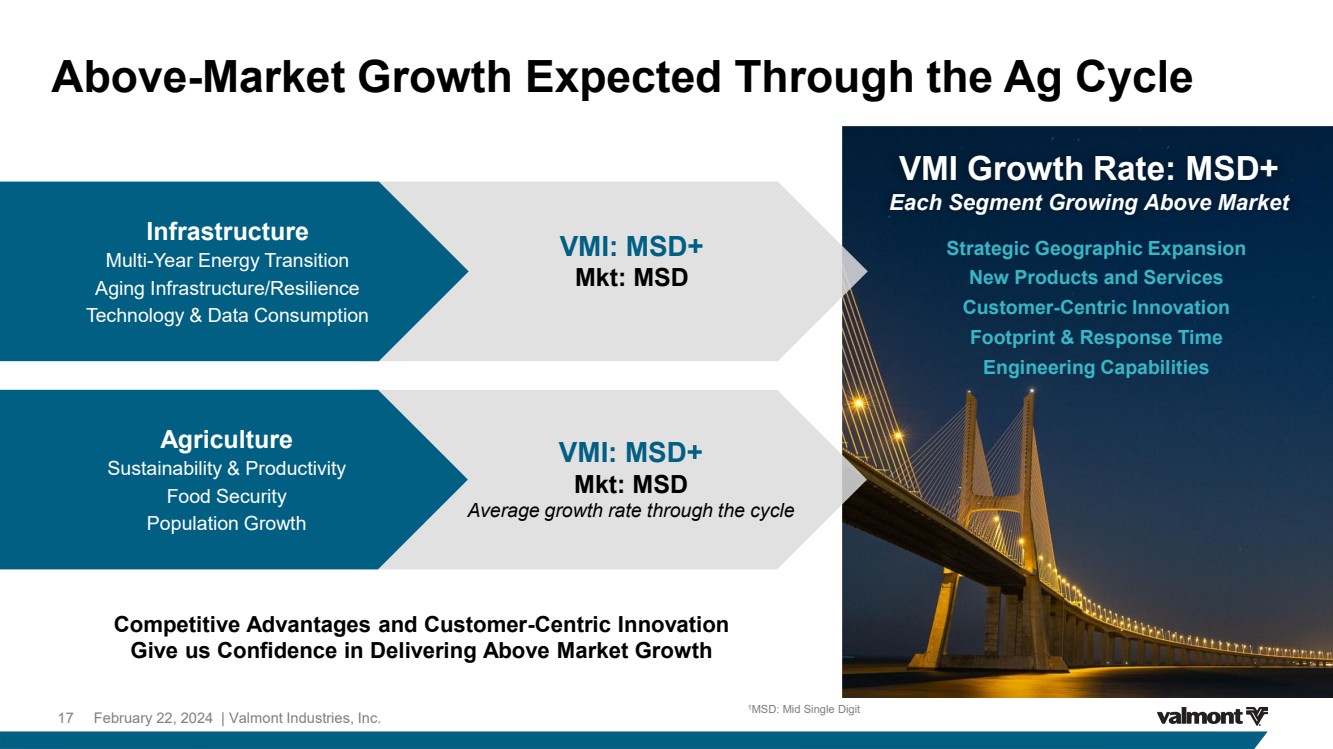
| o | Infrastructure sales growth expected to approach mid-single digits |
| o | Agriculture sales expected to decrease 15-20% |
Providing New Long-Term Financial Targets
The Company is taking the opportunity to provide new long-term financial targets beyond 2024.
Metric |
Target |
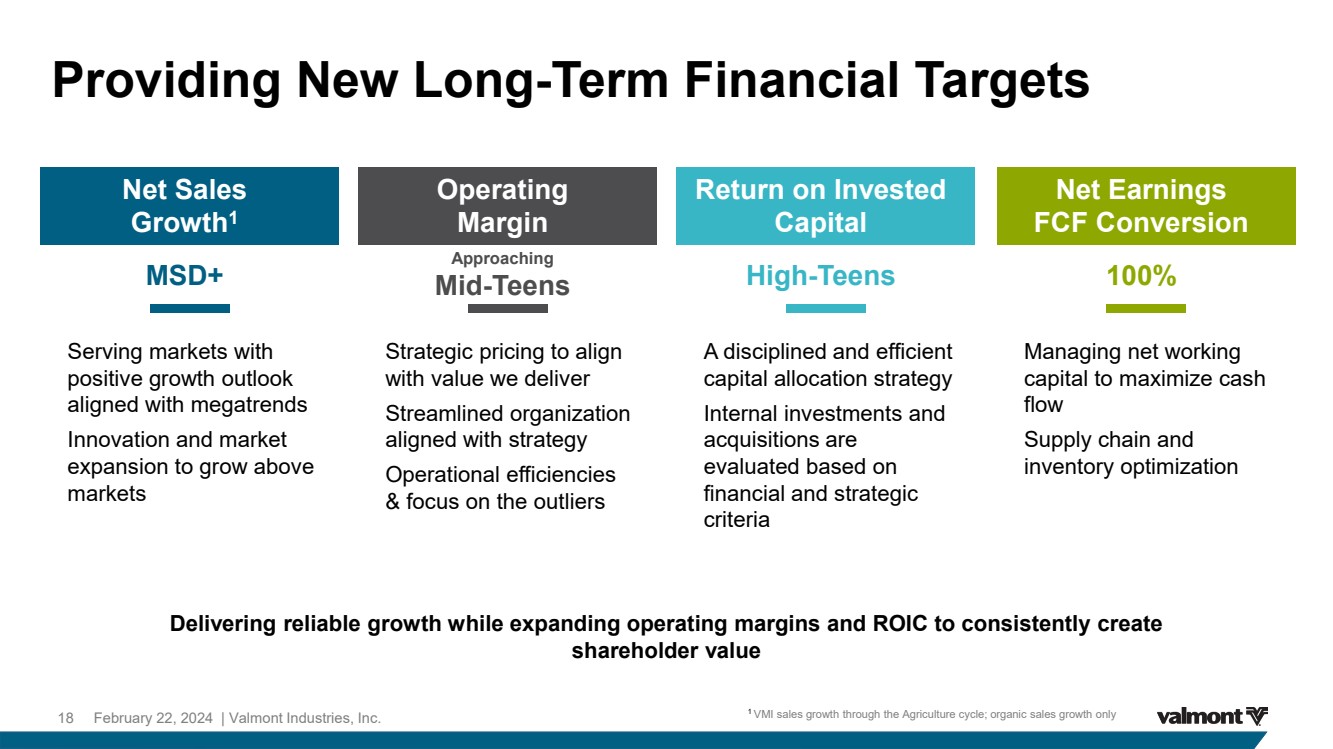
Organic Net Sales Growth |
Above Mid-Single Digits |
Operating Margin |
Approaching Mid-Teens |
Return on Invested Capital (ROIC) |
High-Teens |
Free Cash Flow Conversion |
100% of Net Earnings |
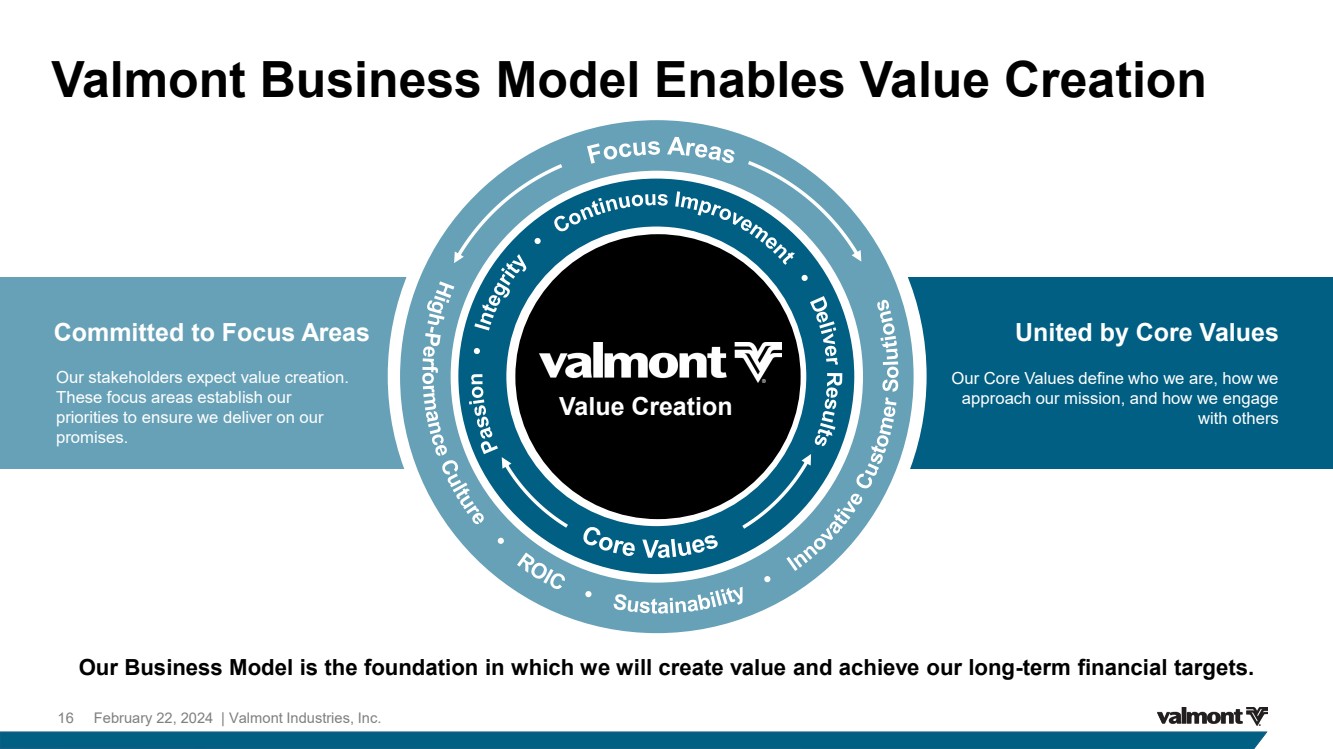
Applbaum continued, “I’m excited to share our long-term financial targets for Valmont beyond 2024. We are focusing on strategic initiatives that drive sustainable growth and profitability over the long term with an ongoing commitment to value creation. We are executing a focused and disciplined plan to leverage our diversified portfolio and deliver operating margin and ROIC improvements. As evidenced by these goals, we are demonstrating higher levels of through-cycle structural profitability while making our company more resilient. This drives our position as a market leader, enabling us to achieve greater performance and create sustainable value for our shareholders.”
1Please see Reg G reconciliation to GAAP measures at end of document
A live audio discussion with Avner M. Applbaum, President and Chief Executive Officer, and Timothy P. Francis, Interim Chief Financial Officer, will be accessible by telephone on Thursday, February 22, 2024 at 8:00 a.m. CT by dialing +1 877.407.6184 or +1 201.389.0877 (no Conference ID needed), or via webcast by pointing browsers to this link: Valmont Industries 4Q and Full Year 2023 Earnings Conference Call. A slide presentation will simultaneously be available for download on the Investors page of valmont.com. A replay of the event can be accessed three hours after the call at the above link or by telephone at +1 877.660.6853 or +1 201.612.7415. Please use access code 13742393. The replay will be available through 10:59 p.m. CT on February 29, 2024.
About Valmont Industries, Inc.
For over 75 years, Valmont® has been a global leader in creating vital infrastructure and advancing agricultural productivity. Today, we remain committed to doing more with less by innovating through technology. Learn more about how we’re Conserving Resources. Improving Life.® at valmont.com.
1Please see Reg G reconciliation to GAAP measures at end of document
Concerning Forward-Looking Statements
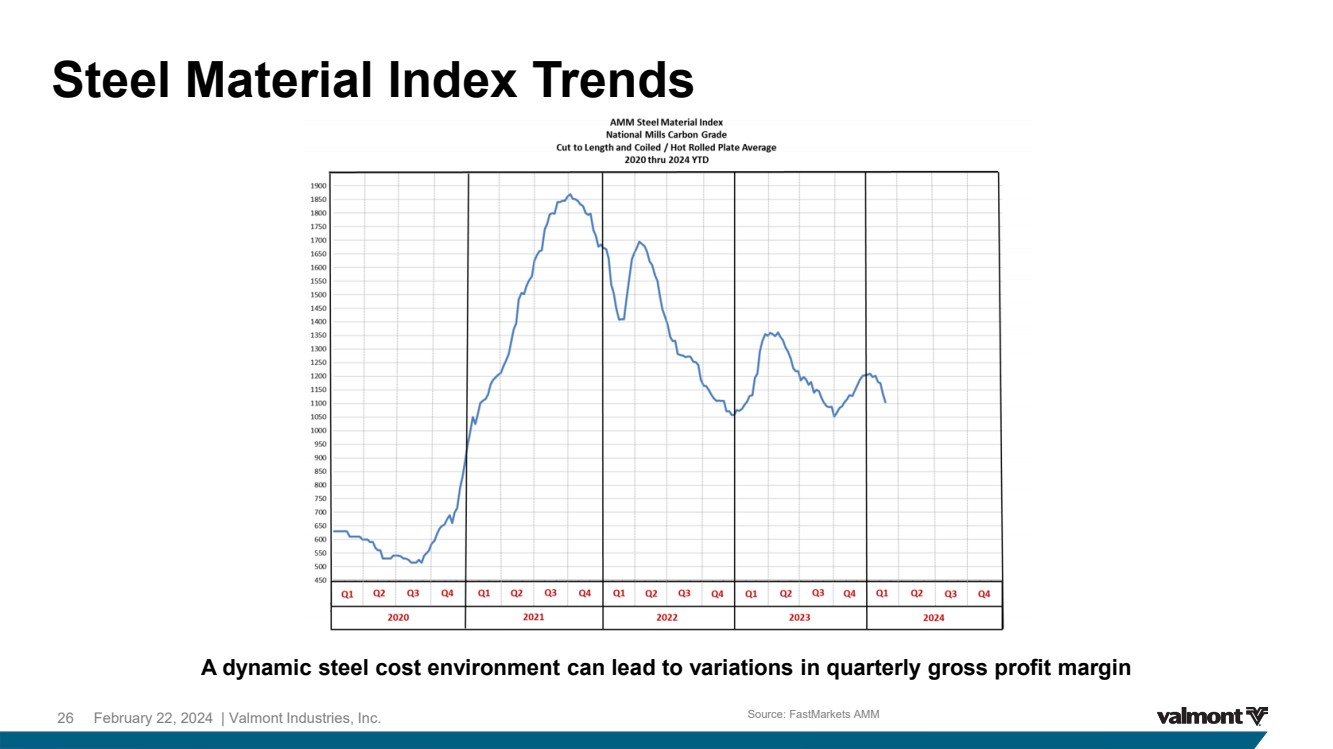
This release contains forward-looking statements, within the meaning of the Private Securities Litigation Reform Act of 1995. These forward-looking statements are based on assumptions that management has made in light of experience in the industries in which Valmont operates, as well as management’s perceptions of historical trends, current conditions, expected future developments and other factors believed to be appropriate under the circumstances. As you read and consider this release, you should understand that these statements are not guarantees of performance or results. They involve risks, uncertainties (some of which are beyond Valmont’s control) and assumptions. Although management believes that these forward-looking statements are based on reasonable assumptions, you should be aware that many factors could affect Valmont’s actual financial results and cause them to differ materially from those anticipated in the forward-looking statements. These factors include among other things, the continuing and developing effects of the pandemic including the effects of the outbreak on the general economy and the specific economic effects on the Company’s business and that of its customers and suppliers, risk factors described from time to time in Valmont’s reports to the Securities and Exchange Commission, as well as future economic and market circumstances, industry conditions, company performance and financial results, operating efficiencies, availability and price of raw material, availability and market acceptance of new products, product pricing, domestic and international competitive environments, geopolitical risks, and actions and policy changes of domestic and foreign governments. The Company cautions that any forward-looking statement included in this press release is made as of the date of this press release and the Company does not undertake to update any forward-looking statement.
Website and Social Media Disclosure
The Company uses its website and social media channels identified on its website as channels of distribution of Company information. The information that the Company posts through these channels may be deemed material. Accordingly, investors should monitor these channels, in addition to following the Company’s press releases, Securities and Exchange Commission filings, and public conference calls and webcasts. The contents of the Company’s website and social media channels are not part of this press release.
###
VALMONT INDUSTRIES, INC. AND SUBSIDIARIES
CONDENSED CONSOLIDATED STATEMENTS OF EARNINGS
(Dollars in thousands, except per share amounts)
(Unaudited)
|
|
13 and 14 Weeks Ended |
|
52 and 53 Weeks Ended |
||||||||
|
|
December, |
|
December |
|
December, |
|
December |
||||
|
|
30, 2023 |
|
31, 2022 |
|
30, 2023 |
|
31, 2022 |
||||
Net sales |
|
$ |
1,015,526 |
|
$ |
1,131,516 |
|
$ |
4,174,598 |
|
$ |
4,345,250 |
Cost of sales |
|
|
732,585 |
|
|
832,557 |
|
|
2,938,564 |
|
|
3,219,026 |
Gross profit |
|
|
282,941 |
|
|
298,959 |
|
|
1,236,034 |
|
|
1,126,224 |
Selling, general, and administrative expenses |
|
|
188,363 |
|
|
189,243 |
|
|
768,423 |
|
|
692,975 |
Impairment of long-lived assets |
|
|
— |
|
|
— |
|
|
140,844 |
|
|
— |
Realignment charges |
|
|
31,030 |
|
|
— |
|
|
35,210 |
|
|
— |
Operating income |
|
|
63,548 |
|
|
109,716 |
|
|
291,557 |
|
|
433,249 |
Other income (expense) |
|
|
|
|
|
|
|
|
|
|
|
|
Interest expense |
|
|
(15,314) |
|
|
(13,256) |
|
|
(56,808) |
|
|
(47,534) |
Interest income |
|
|
1,651 |
|
|
996 |
|
|
6,230 |
|
|
2,015 |
Gain (loss) on investments - unrealized |
|
|
1,773 |
|
|
932 |
|
|
3,564 |
|
|
(3,374) |
Loss from divestiture of offshore wind energy structures business |
|
|
— |
|
|
(33,273) |
|
|
— |
|
|
(33,273) |
Other |
|
|
(6,492) |
|
|
4,268 |
|
|
(8,091) |
|
|
12,805 |
Other income (expense), net |
|
|
(18,382) |
|
|
(40,333) |
|
|
(55,105) |
|
|
(69,361) |
Earnings before income taxes and equity in loss of |
|
|
|
|
|
|
|
|
|
|
|
|
nonconsolidated subsidiaries |
|
|
45,166 |
|
|
69,383 |
|
|
236,452 |
|
|
363,888 |
Income tax expense |
|
|
10,882 |
|
|
28,156 |
|
|
90,121 |
|
|
108,687 |
Equity in loss of nonconsolidated subsidiaries |
|
|
(200) |
|
|
(19) |
|
|
(1,419) |
|
|
(950) |
Net earnings |
|
|
34,084 |
|
|
41,208 |
|
|
144,912 |
|
|
254,251 |
Loss (earnings) attributable to redeemable noncontrolling interests |
|
|
1,877 |
|
|
(876) |
|
|
5,937 |
|
|
(3,388) |
Net earnings attributable to Valmont Industries, Inc. |
|
|
35,961 |
|
|
40,332 |
|
|
150,849 |
|
|
250,863 |
Change in redemption value of redeemable noncontrolling interests |
|
|
(7,374) |
|
|
— |
|
|
(7,374) |
|
|
— |
Net earnings attributable to Valmont Industries, Inc. including |
|
|
|
|
|
|
|
|
|
|
|
|
change in redemption value of redeemable noncontrolling interests |
|
$ |
28,587 |
|
$ |
40,332 |
|
$ |
143,475 |
|
$ |
250,863 |
|
|
|
|
|
|
|
|
|
|
|
|
|
Average shares outstanding (000s) - Basic |
|
|
20,577 |
|
|
21,319 |
|
|
20,956 |
|
|
21,311 |
Earnings per share - Basic |
|
$ |
1.39 |
|
$ |
1.89 |
|
$ |
6.85 |
|
$ |
11.77 |
|
|
|
|
|
|
|
|
|
|
|
|
|
Average shares outstanding (000s) - Diluted |
|
|
20,764 |
|
|
21,656 |
|
|
21,159 |
|
|
21,580 |
Earnings per share - Diluted |
|
$ |
1.38 |
|
$ |
1.86 |
|
$ |
6.78 |
|
$ |
11.62 |
|
|
|
|
|
|
|
|
|
|
|
|
|
Cash dividends per share |
|
$ |
0.60 |
|
$ |
0.55 |
|
$ |
2.40 |
|
$ |
2.20 |
VALMONT INDUSTRIES, INC. AND SUBSIDIARIES
SUMMARY OPERATING RESULTS
(Dollars in thousands)
(Unaudited)
|
|
13 and 14 Weeks Ended |
|
52 and 53 Weeks Ended |
|
||||||||
|
|
December 30, |
|
December 31, |
|
December 30, |
|
December 31, |
|
||||
|
|
2023 |
|
2022 |
|
2023 |
|
2022 |
|
||||
Infrastructure |
|
|
|
|
|
|
|
|
|
|
|
|
|
Net sales |
|
$ |
745,713 |
|
$ |
765,077 |
|
$ |
2,999,637 |
|
$ |
2,909,746 |
|
Gross profit |
|
|
201,968 |
|
|
201,978 |
|
|
842,081 |
|
|
736,611 |
|
as a percent of net sales |
|
|
27.1 |
% |
|
26.4 |
% |
|
28.1 |
% |
|
25.3 |
% |
Selling, general, and administrative expenses |
|
|
103,227 |
|
|
102,387 |
|
|
424,997 |
|
|
382,112 |
|
as a percent of net sales |
|
|
13.8 |
% |
|
13.4 |
% |
|
14.2 |
% |
|
13.1 |
% |
Impairment of long-lived assets |
|
|
— |
|
|
— |
|
|
3,571 |
|
|
— |
|
Realignment charges |
|
|
16,191 |
|
|
— |
|
|
17,260 |
|
|
— |
|
Operating income |
|
|
82,550 |
|
|
99,591 |
|
|
396,253 |
|
|
354,499 |
|
as a percent of net sales |
|
|
11.1 |
% |
|
13.0 |
% |
|
13.2 |
% |
|
12.2 |
% |
|
|
|
|
|
|
|
|
|
|
|
|
|
|
Agriculture |
|
|
|
|
|
|
|
|
|
|
|
|
|
Net sales |
|
$ |
269,813 |
|
$ |
333,167 |
|
$ |
1,174,961 |
|
$ |
1,335,285 |
|
Gross profit |
|
|
80,973 |
|
|
94,378 |
|
|
393,953 |
|
|
381,793 |
|
as a percent of net sales |
|
|
30.0 |
% |
|
28.3 |
% |
|
33.5 |
% |
|
28.6 |
% |
Selling, general, and administrative expenses |
|
|
58,833 |
|
|
53,894 |
|
|
230,729 |
|
|
202,530 |
|
as a percent of net sales |
|
|
21.8 |
% |
|
16.2 |
% |
|
19.6 |
% |
|
15.2 |
% |
Impairment of long-lived assets |
|
|
— |
|
|
— |
|
|
137,273 |
|
|
— |
|
Realignment charges |
|
|
8,194 |
|
|
— |
|
|
9,101 |
|
|
— |
|
Operating income |
|
|
13,946 |
|
|
40,484 |
|
|
16,850 |
|
|
179,263 |
|
as a percent of net sales |
|
|
5.2 |
% |
|
12.2 |
% |
|
1.4 |
% |
|
13.4 |
% |
|
|
|
|
|
|
|
|
|
|
|
|
|
|
Other |
|
|
|
|
|
|
|
|
|
|
|
|
|
Net sales |
|
$ |
— |
|
$ |
33,272 |
|
$ |
— |
|
$ |
100,219 |
|
Gross profit |
|
|
— |
|
|
2,603 |
|
|
— |
|
|
7,820 |
|
as a percent of net sales |
|
|
NM |
|
|
7.8 |
% |
|
NM |
|
|
7.8 |
% |
Selling, general, and administrative expenses |
|
|
— |
|
|
1,158 |
|
|
— |
|
|
5,561 |
|
as a percent of net sales |
|
|
NM |
|
|
3.5 |
% |
|
NM |
|
|
5.5 |
% |
Operating income |
|
|
— |
|
|
1,445 |
|
|
— |
|
|
2,259 |
|
as a percent of net sales |
|
|
NM |
|
|
4.3 |
% |
|
NM |
|
|
2.3 |
% |
|
|
|
|
|
|
|
|
|
|
|
|
|
|
Corporate |
|
|
|
|
|
|
|
|
|
|
|
|
|
Selling, general, and administrative expenses |
|
$ |
26,303 |
|
$ |
31,804 |
|
$ |
112,697 |
|
$ |
102,772 |
|
Realignment charges |
|
|
6,645 |
|
|
— |
|
|
8,849 |
|
|
— |
|
Operating loss |
|
|
(32,948) |
|
|
(31,804) |
|
|
(121,546) |
|
|
(102,772) |
|
NM = not meaningful
Valmont has aggregated its business segments into two global reportable segments as follows.
Infrastructure: This segment consists of the manufacture and distribution of products and solutions to serve infrastructure markets of utility, solar, lighting, transportation, and telecommunications, along with coatings services to protect metal products.
Agriculture: This segment consists of the manufacture of center pivot components and linear irrigation equipment for agricultural markets, including parts and tubular products, and advanced technology solutions for precision agriculture.
In addition to these two reportable segments, the Company had a business and related activities that were not more than 10% of consolidated sales, operating income, or assets. This business, the offshore wind energy structures business, was reported in the “Other” segment until its divestiture in fiscal 2022.
VALMONT INDUSTRIES, INC. AND SUBSIDIARIES
SUMMARY OPERATING RESULTS
(Dollars in millions)
(Unaudited)
The backlog of orders for the principal products manufactured and marketed was $1,465.5 million as of December 30, 2023 and $1,656.4 million as of December 31, 2022. An order is reported in our backlog upon receipt of a purchase order from the customer or execution of a sales order contract. We anticipate that most of the fiscal 2023 backlog of orders will be filled during fiscal 2024. As of December 30, 2023 and December 31, 2022, total backlog by segment was as follows:
|
|
December 30, |
|
December 31, |
||
|
|
2023 |
|
2022 |
||
Infrastructure |
|
$ |
1,299.6 |
|
$ |
1,339.1 |
Agriculture |
|
|
165.9 |
|
|
317.3 |
Total backlog |
|
$ |
1,465.5 |
|
$ |
1,656.4 |
VALMONT INDUSTRIES, INC. AND SUBSIDIARIES
SUMMARY OPERATING RESULTS
(Dollars in thousands)
(Unaudited)
|
|
Thirteen weeks ended December 30, 2023 |
||||||||||
|
|
Infrastructure |
|
Agriculture |
|
Intersegment |
|
Consolidated |
||||
Geographical Market: |
|
|
|
|
|
|
|
|
|
|
|
|
North America |
|
$ |
575,166 |
|
$ |
136,378 |
|
$ |
(4,240) |
|
$ |
707,304 |
International |
|
|
173,124 |
|
|
135,266 |
|
|
(168) |
|
|
308,222 |
Total sales |
|
$ |
748,290 |
|
$ |
271,644 |
|
$ |
(4,408) |
|
$ |
1,015,526 |
|
|
|
|
|
|
|
|
|
|
|
|
|
Product Line: |
|
|
|
|
|
|
|
|
|
|
|
|
Transmission, Distribution, and Substation |
|
$ |
316,674 |
|
$ |
— |
|
$ |
— |
|
$ |
316,674 |
Lighting and Transportation |
|
|
236,210 |
|
|
— |
|
|
— |
|
|
236,210 |
Coatings |
|
|
84,129 |
|
|
— |
|
|
(2,409) |
|
|
81,720 |
Telecommunications |
|
|
56,660 |
|
|
— |
|
|
— |
|
|
56,660 |
Solar |
|
|
54,617 |
|
|
— |
|
|
(168) |
|
|
54,449 |
Irrigation Equipment and Parts |
|
|
— |
|
|
244,148 |
|
|
(1,831) |
|
|
242,317 |
Technology Products and Services |
|
|
— |
|
|
27,496 |
|
|
— |
|
|
27,496 |
Total sales |
|
$ |
748,290 |
|
$ |
271,644 |
|
$ |
(4,408) |
|
$ |
1,015,526 |
|
|
Fourteen weeks ended December 31, 2022 |
|||||||||||||
|
|
Infrastructure |
|
Agriculture |
|
Other |
|
Intersegment |
|
Consolidated |
|||||
Geographical Market: |
|
|
|
|
|
|
|
|
|
|
|
|
|
|
|
North America |
|
$ |
588,867 |
|
$ |
202,560 |
|
$ |
— |
|
$ |
(5,932) |
|
$ |
785,495 |
International |
|
|
182,470 |
|
|
132,506 |
|
|
33,272 |
|
|
(2,227) |
|
|
346,021 |
Total sales |
|
$ |
771,337 |
|
$ |
335,066 |
|
$ |
33,272 |
|
$ |
(8,159) |
|
$ |
1,131,516 |
|
|
|
|
|
|
|
|
|
|
|
|
|
|
|
|
Product Line: |
|
|
|
|
|
|
|
|
|
|
|
|
|
|
|
Transmission, Distribution, and Substation |
|
$ |
302,444 |
|
$ |
— |
|
$ |
— |
|
$ |
— |
|
$ |
302,444 |
Lighting and Transportation |
|
|
239,453 |
|
|
— |
|
|
— |
|
|
— |
|
|
239,453 |
Coatings |
|
|
92,441 |
|
|
— |
|
|
— |
|
|
(4,032) |
|
|
88,409 |
Telecommunications |
|
|
87,577 |
|
|
— |
|
|
— |
|
|
— |
|
|
87,577 |
Solar |
|
|
49,422 |
|
|
— |
|
|
— |
|
|
(2,228) |
|
|
47,194 |
Irrigation Equipment and Parts |
|
|
— |
|
|
302,965 |
|
|
— |
|
|
(1,899) |
|
|
301,066 |
Technology Products and Services |
|
|
— |
|
|
32,101 |
|
|
— |
|
|
— |
|
|
32,101 |
Other |
|
|
— |
|
|
— |
|
|
33,272 |
|
|
— |
|
|
33,272 |
Total sales |
|
$ |
771,337 |
|
$ |
335,066 |
|
$ |
33,272 |
|
$ |
(8,159) |
|
$ |
1,131,516 |
VALMONT INDUSTRIES, INC. AND SUBSIDIARIES
SUMMARY OPERATING RESULTS
(Dollars in thousands)
(Unaudited)
|
|
Fifty-two weeks ended December 30, 2023 |
||||||||||
|
|
Infrastructure |
|
Agriculture |
|
Intersegment |
|
Consolidated |
||||
Geographical Market: |
|
|
|
|
|
|
|
|
|
|
|
|
North America |
|
$ |
2,318,801 |
|
$ |
587,056 |
|
$ |
(16,282) |
|
$ |
2,889,575 |
International |
|
|
691,266 |
|
|
595,167 |
|
|
(1,410) |
|
|
1,285,023 |
Total sales |
|
$ |
3,010,067 |
|
$ |
1,182,223 |
|
$ |
(17,692) |
|
$ |
4,174,598 |
|
|
|
|
|
|
|
|
|
|
|
|
|
Product Line: |
|
|
|
|
|
|
|
|
|
|
|
|
Transmission, Distribution, and Substation |
|
$ |
1,243,768 |
|
$ |
— |
|
$ |
— |
|
$ |
1,243,768 |
Lighting and Transportation |
|
|
964,072 |
|
|
— |
|
|
— |
|
|
964,072 |
Coatings |
|
|
354,330 |
|
|
— |
|
|
(9,020) |
|
|
345,310 |
Telecommunications |
|
|
252,165 |
|
|
— |
|
|
— |
|
|
252,165 |
Solar |
|
|
195,732 |
|
|
— |
|
|
(1,410) |
|
|
194,322 |
Irrigation Equipment and Parts |
|
|
— |
|
|
1,069,425 |
|
|
(7,262) |
|
|
1,062,163 |
Technology Products and Services |
|
|
— |
|
|
112,798 |
|
|
— |
|
|
112,798 |
Total sales |
|
$ |
3,010,067 |
|
$ |
1,182,223 |
|
$ |
(17,692) |
|
$ |
4,174,598 |
|
|
Fifty-three weeks ended December 31, 2022 |
|||||||||||||
|
|
Infrastructure |
|
Agriculture |
|
Other |
|
Intersegment |
|
Consolidated |
|||||
Geographical Market: |
|
|
|
|
|
|
|
|
|
|
|
|
|
|
|
North America |
|
$ |
2,234,339 |
|
$ |
766,929 |
|
$ |
— |
|
$ |
(26,248) |
|
$ |
2,975,020 |
International |
|
|
694,080 |
|
|
579,743 |
|
|
100,219 |
|
|
(3,812) |
|
|
1,370,230 |
Total sales |
|
$ |
2,928,419 |
|
$ |
1,346,672 |
|
$ |
100,219 |
|
$ |
(30,060) |
|
$ |
4,345,250 |
|
|
|
|
|
|
|
|
|
|
|
|
|
|
|
|
Product Line: |
|
|
|
|
|
|
|
|
|
|
|
|
|
|
|
Transmission, Distribution, and Substation |
|
$ |
1,184,660 |
|
$ |
— |
|
$ |
— |
|
$ |
— |
|
$ |
1,184,660 |
Lighting and Transportation |
|
|
940,462 |
|
|
— |
|
|
— |
|
|
— |
|
|
940,462 |
Coatings |
|
|
356,707 |
|
|
— |
|
|
— |
|
|
(15,327) |
|
|
341,380 |
Telecommunications |
|
|
320,342 |
|
|
— |
|
|
— |
|
|
— |
|
|
320,342 |
Solar |
|
|
126,248 |
|
|
— |
|
|
— |
|
|
(3,346) |
|
|
122,902 |
Irrigation Equipment and Parts |
|
|
— |
|
|
1,231,587 |
|
|
— |
|
|
(11,387) |
|
|
1,220,200 |
Technology Products and Services |
|
|
— |
|
|
115,085 |
|
|
— |
|
|
— |
|
|
115,085 |
Other |
|
|
— |
|
|
— |
|
|
100,219 |
|
|
— |
|
|
100,219 |
Total sales |
|
$ |
2,928,419 |
|
$ |
1,346,672 |
|
$ |
100,219 |
|
$ |
(30,060) |
|
$ |
4,345,250 |
VALMONT INDUSTRIES, INC. AND SUBSIDIARIES
CONDENSED CONSOLIDATED BALANCE SHEETS
(Dollars in thousands)
(Unaudited)
|
|
December 30, |
|
December 31, |
||
|
|
2023 |
|
2022 |
||
ASSETS |
|
|
|
|
|
|
Current assets: |
|
|
|
|
|
|
Cash and cash equivalents |
|
$ |
203,041 |
|
$ |
185,406 |
Receivables, net |
|
|
657,960 |
|
|
604,181 |
Inventories |
|
|
658,428 |
|
|
728,762 |
Contract assets |
|
|
175,721 |
|
|
174,539 |
Prepaid expenses and other current assets |
|
|
91,754 |
|
|
87,697 |
Refundable income taxes |
|
|
725 |
|
|
— |
Total current assets |
|
|
1,787,629 |
|
|
1,780,585 |
Property, plant, and equipment, net |
|
|
617,394 |
|
|
595,578 |
Goodwill and other non-current assets |
|
|
1,072,425 |
|
|
1,180,833 |
Total assets |
|
$ |
3,477,448 |
|
$ |
3,556,996 |
|
|
|
|
|
|
|
LIABILITIES, REDEEMABLE NONCONTROLLING INTERESTS, |
|
|
|
|
|
|
AND SHAREHOLDERS' EQUITY |
|
|
|
|
|
|
Current liabilities: |
|
|
|
|
|
|
Current installments of long-term debt |
|
$ |
719 |
|
$ |
1,194 |
Notes payable to banks |
|
|
3,205 |
|
|
5,846 |
Accounts payable |
|
|
358,311 |
|
|
360,312 |
Accrued expenses |
|
|
277,764 |
|
|
248,320 |
Contract liabilities |
|
|
70,978 |
|
|
172,915 |
Income taxes payable |
|
|
— |
|
|
3,664 |
Dividends payable |
|
|
12,125 |
|
|
11,742 |
Total current liabilities |
|
|
723,102 |
|
|
803,993 |
Long-term debt, excluding current installments |
|
|
1,107,885 |
|
|
870,935 |
Operating lease liabilities |
|
|
162,743 |
|
|
155,469 |
Other non-current liabilities |
|
|
66,646 |
|
|
84,887 |
Total liabilities |
|
|
2,060,376 |
|
|
1,915,284 |
Redeemable noncontrolling interests |
|
|
62,792 |
|
|
60,865 |
Shareholders' equity |
|
|
1,354,280 |
|
|
1,580,847 |
Total liabilities, redeemable noncontrolling interests, and shareholders' equity |
|
$ |
3,477,448 |
|
$ |
3,556,996 |
VALMONT INDUSTRIES, INC. AND SUBSIDIARIES
CONDENSED CONSOLIDATED STATEMENTS OF CASH FLOWS
(Dollars in thousands)
(Unaudited)
|
|
52 and 53 Weeks Ended |
||||
|
|
December 30, |
|
December 31, |
||
|
|
2023 |
|
2022 |
||
Cash flows from operating activities: |
|
|
|
|
|
|
Net earnings |
|
$ |
144,912 |
|
$ |
254,251 |
Depreciation and amortization |
|
|
98,708 |
|
|
97,167 |
Contribution to defined benefit pension plan |
|
|
(17,345) |
|
|
(17,155) |
Impairment of long-lived assets |
|
|
140,844 |
|
|
— |
Loss (gain) on divestitures |
|
|
(2,994) |
|
|
33,273 |
Change in working capital |
|
|
(66,342) |
|
|
(56,092) |
Other |
|
|
8,992 |
|
|
14,821 |
Net cash flows provided by operating activities |
|
|
306,775 |
|
|
326,265 |
|
|
|
|
|
|
|
Cash flows from investing activities: |
|
|
|
|
|
|
Purchase of property, plant, and equipment |
|
|
(96,771) |
|
|
(93,288) |
Proceeds from divestiture, net of cash divested |
|
|
6,369 |
|
|
— |
Proceeds from property damage insurance claims |
|
|
7,468 |
|
|
— |
Acquisitions, net of cash acquired |
|
|
(32,676) |
|
|
(39,287) |
Other |
|
|
329 |
|
|
495 |
Net cash flows used in investing activities |
|
|
(115,281) |
|
|
(132,080) |
|
|
|
|
|
|
|
Cash flows from financing activities: |
|
|
|
|
|
|
Proceeds from long-term borrowings |
|
|
370,012 |
|
|
253,999 |
Principal payments on long-term borrowings |
|
|
(134,748) |
|
|
(336,403) |
Net payments on short-term borrowings |
|
|
(3,298) |
|
|
(7,577) |
Purchase of treasury shares |
|
|
(345,279) |
|
|
(40,474) |
Dividends to redeemable noncontrolling interests |
|
|
(662) |
|
|
(714) |
Purchase of redeemable noncontrolling interests |
|
|
— |
|
|
(7,338) |
Dividends paid |
|
|
(49,515) |
|
|
(45,813) |
Other |
|
|
(12,915) |
|
|
2,415 |
Net cash flows used in financing activities |
|
|
(176,405) |
|
|
(181,905) |
Effect of exchange rates on cash and cash equivalents |
|
|
2,546 |
|
|
(4,106) |
Net change in cash and cash equivalents |
|
|
17,635 |
|
|
8,174 |
Cash and cash equivalents - beginning of period |
|
|
185,406 |
|
|
177,232 |
Cash and cash equivalents - end of period |
|
$ |
203,041 |
|
$ |
185,406 |
VALMONT INDUSTRIES, INC. AND SUBSIDIARIES
SUMMARY OF EFFECT OF SIGNIFICANT NON-RECURRING ITEMS ON REPORTED RESULTS
REGULATION G RECONCILIATION
(Dollars in thousands, except per share amounts)
(Unaudited)
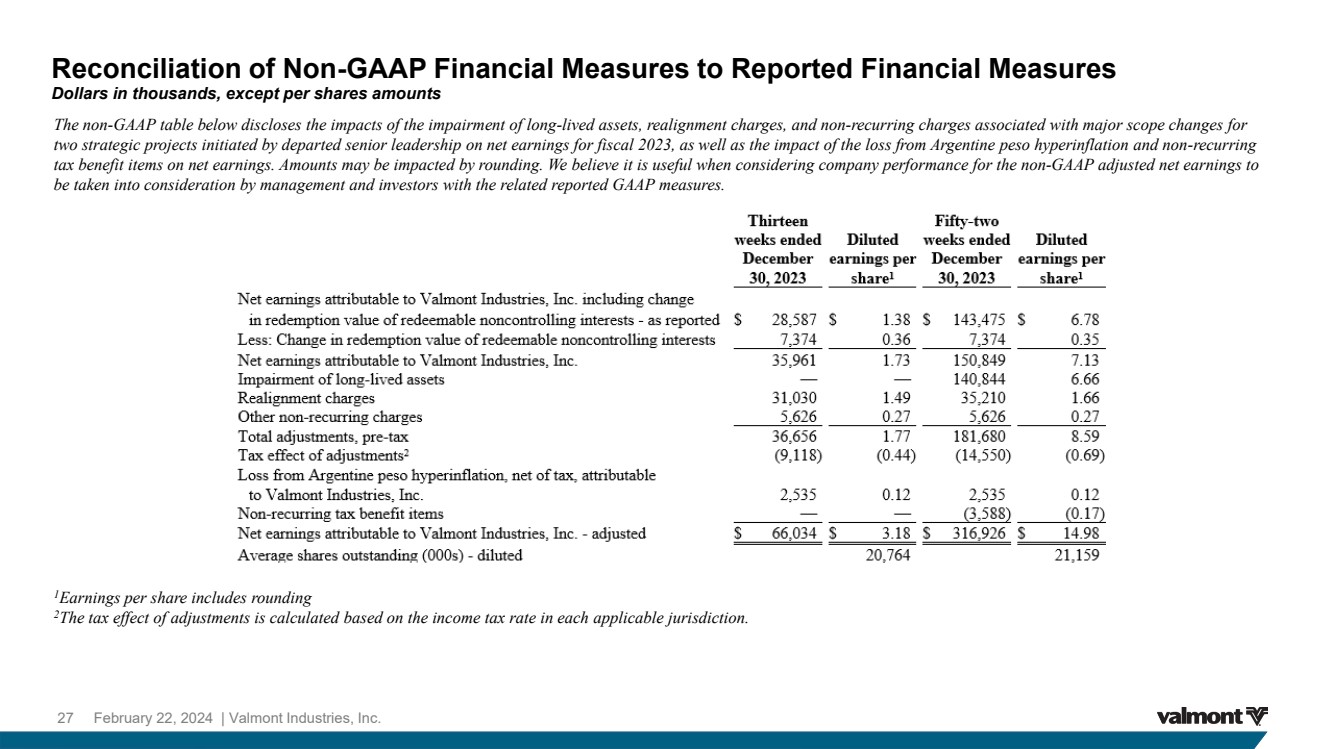
The non-GAAP table below discloses the impacts of the impairment of long-lived assets, realignment charges, and non-recurring charges associated with major scope changes for two strategic projects initiated by departed senior leadership on net earnings for fiscal 2023, as well as the impact of the loss from Argentine peso hyperinflation and non-recurring tax benefit items on net earnings. Amounts may be impacted by rounding. We believe it is useful when considering company performance for the non-GAAP adjusted net earnings to be taken into consideration by management and investors with the related reported GAAP measures.
|
|
Thirteen |
|
|
|
|
Fifty-two |
|
|
|
||
|
|
weeks ended |
|
Diluted |
|
weeks ended |
|
Diluted |
||||
|
|
December |
|
earnings per |
|
December |
|
earnings per |
||||
|
|
30, 2023 |
|
share1 |
|
30, 2023 |
|
share1 |
||||
Net earnings attributable to Valmont Industries, Inc. including change |
|
|
|
|
|
|
|
|
|
|
|
|
in redemption value of redeemable noncontrolling interests - as reported |
|
$ |
28,587 |
|
$ |
1.38 |
|
$ |
143,475 |
|
$ |
6.78 |
Less: Change in redemption value of redeemable noncontrolling interests |
|
|
7,374 |
|
|
0.36 |
|
|
7,374 |
|
|
0.35 |
Net earnings attributable to Valmont Industries, Inc. |
|
|
35,961 |
|
|
1.73 |
|
|
150,849 |
|
|
7.13 |
Impairment of long-lived assets |
|
|
— |
|
|
— |
|
|
140,844 |
|
|
6.66 |
Realignment charges |
|
|
31,030 |
|
|
1.49 |
|
|
35,210 |
|
|
1.66 |
Other non-recurring charges |
|
|
5,626 |
|
|
0.27 |
|
|
5,626 |
|
|
0.27 |
Total adjustments, pre-tax |
|
|
36,656 |
|
|
1.77 |
|
|
181,680 |
|
|
8.59 |
Tax effect of adjustments2 |
|
|
(9,118) |
|
|
(0.44) |
|
|
(14,550) |
|
|
(0.69) |
Loss from Argentine peso hyperinflation, net of tax, attributable |
|
|
|
|
|
|
|
|
|
|
|
|
to Valmont Industries, Inc. |
|
|
2,535 |
|
|
0.12 |
|
|
2,535 |
|
|
0.12 |
Non-recurring tax benefit items |
|
|
— |
|
|
— |
|
|
(3,588) |
|
|
(0.17) |
Net earnings attributable to Valmont Industries, Inc. - adjusted |
|
$ |
66,034 |
|
$ |
3.18 |
|
$ |
316,926 |
|
$ |
14.98 |
Average shares outstanding (000s) - diluted |
|
|
|
|
|
20,764 |
|
|
|
|
|
21,159 |
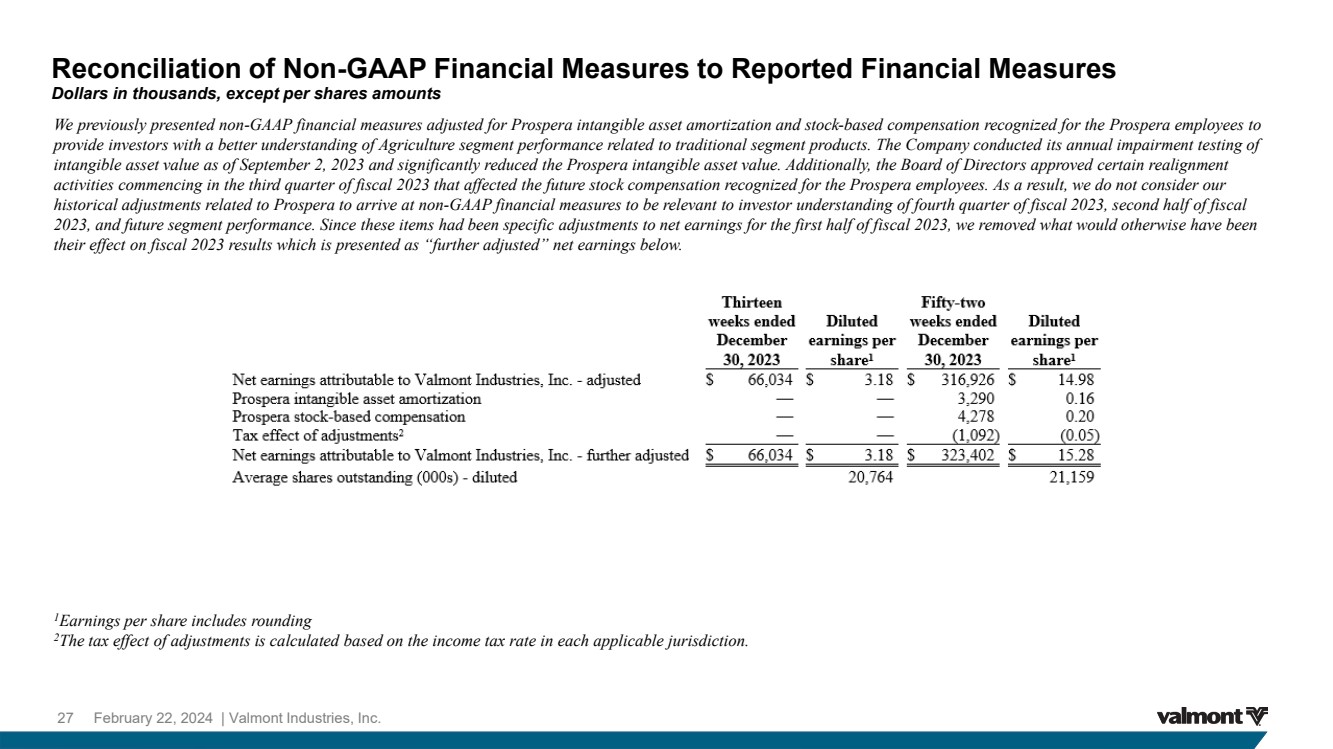
We previously presented non-GAAP financial measures adjusted for Prospera intangible asset amortization and stock-based compensation recognized for the Prospera employees to provide investors with a better understanding of Agriculture segment performance related to traditional segment products. The Company conducted its annual impairment testing of intangible asset value as of September 2, 2023 and significantly reduced the Prospera intangible asset value. Additionally, the Board of Directors approved certain realignment activities commencing in the third quarter of fiscal 2023 that affected the future stock compensation recognized for the Prospera employees. As a result, we do not consider our historical adjustments related to Prospera to arrive at non-GAAP financial measures to be relevant to investor understanding of fourth quarter of fiscal 2023, second half of fiscal 2023, and future segment performance. Since these items had been specific adjustments to net earnings for the first half of fiscal 2023, we removed what would otherwise have been their effect on fiscal 2023 results which is presented as “further adjusted” net earnings below.
|
|
Thirteen |
|
|
|
|
Fifty-two |
|
|
|
||
|
|
weeks ended |
|
Diluted |
|
weeks ended |
|
Diluted |
||||
|
|
December |
|
earnings per |
|
December |
|
earnings per |
||||
|
|
30, 2023 |
|
share1 |
|
30, 2023 |
|
share1 |
||||
Net earnings attributable to Valmont Industries, Inc. - adjusted |
|
$ |
66,034 |
|
$ |
3.18 |
|
$ |
316,926 |
|
$ |
14.98 |
Prospera intangible asset amortization |
|
|
— |
|
|
— |
|
|
3,290 |
|
|
0.16 |
Prospera stock-based compensation |
|
|
— |
|
|
— |
|
|
4,278 |
|
|
0.20 |
Tax effect of adjustments2 |
|
|
— |
|
|
— |
|
|
(1,092) |
|
|
(0.05) |
Net earnings attributable to Valmont Industries, Inc. - further adjusted |
|
$ |
66,034 |
|
$ |
3.18 |
|
$ |
323,402 |
|
$ |
15.28 |
Average shares outstanding (000s) - diluted |
|
|
|
|
|
20,764 |
|
|
|
|
|
21,159 |
1Earnings per share includes rounding
2The tax effect of adjustments is calculated based on the income tax rate in each applicable jurisdiction.
VALMONT INDUSTRIES, INC. AND SUBSIDIARIES
SUMMARY OF EFFECT OF SIGNIFICANT NON-RECURRING ITEMS ON REPORTED RESULTS
REGULATION G RECONCILIATION
(Dollars in thousands, except per share amounts)
(Unaudited)
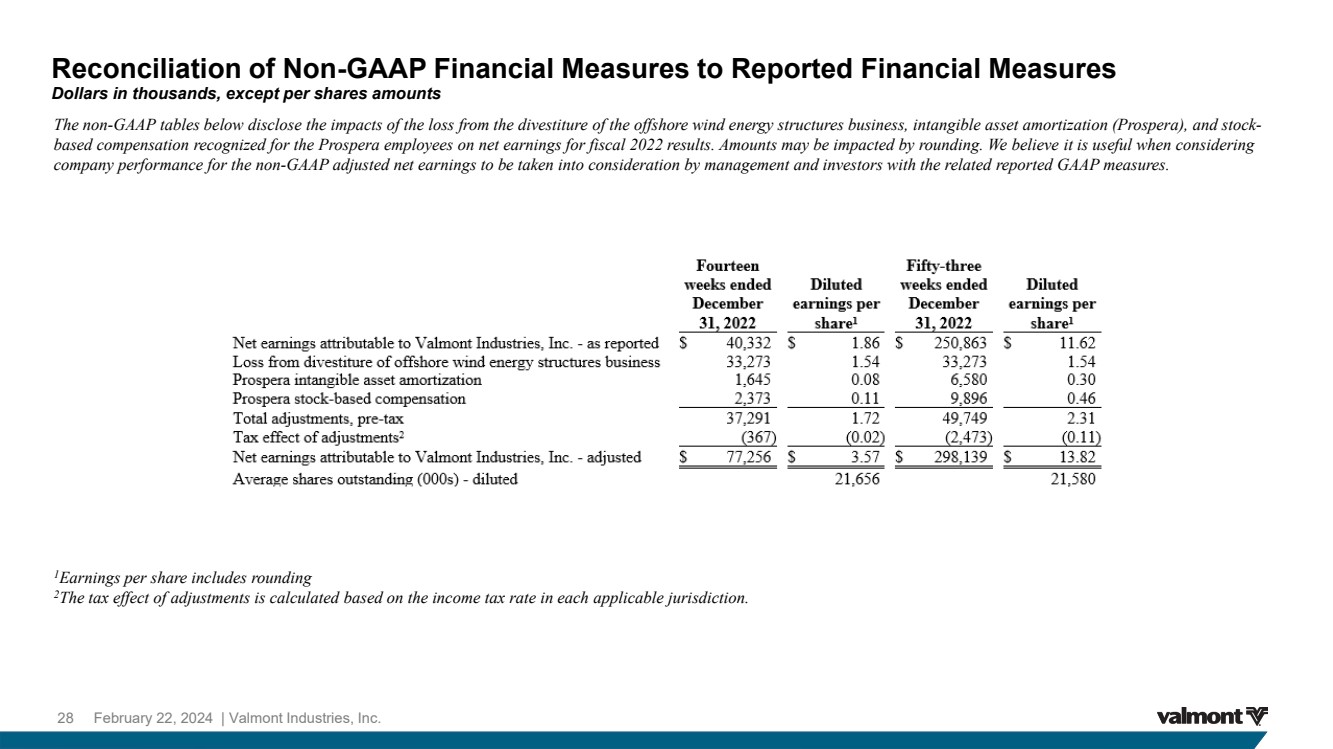
The non-GAAP tables below disclose the impacts of the loss from the divestiture of the offshore wind energy structures business, intangible asset amortization (Prospera), and stock-based compensation recognized for the Prospera employees on net earnings for fiscal 2022 results. Amounts may be impacted by rounding. We believe it is useful when considering company performance for the non-GAAP adjusted net earnings to be taken into consideration by management and investors with the related reported GAAP measures.
|
|
Fourteen |
|
|
|
|
Fifty-three |
|
|
|
||
|
|
weeks ended |
|
Diluted |
|
weeks ended |
|
Diluted |
||||
|
|
December |
|
earnings per |
|
December |
|
earnings per |
||||
|
|
31, 2022 |
|
share1 |
|
31, 2022 |
|
share1 |
||||
Net earnings attributable to Valmont Industries, Inc. - as reported |
|
$ |
40,332 |
|
$ |
1.86 |
|
$ |
250,863 |
|
$ |
11.62 |
Loss from divestiture of offshore wind energy structures business |
|
|
33,273 |
|
|
1.54 |
|
|
33,273 |
|
|
1.54 |
Prospera intangible asset amortization |
|
|
1,645 |
|
|
0.08 |
|
|
6,580 |
|
|
0.30 |
Prospera stock-based compensation |
|
|
2,373 |
|
|
0.11 |
|
|
9,896 |
|
|
0.46 |
Total adjustments, pre-tax |
|
|
37,291 |
|
|
1.72 |
|
|
49,749 |
|
|
2.31 |
Tax effect of adjustments2 |
|
|
(367) |
|
|
(0.02) |
|
|
(2,473) |
|
|
(0.11) |
Net earnings attributable to Valmont Industries, Inc. - adjusted |
|
$ |
77,256 |
|
$ |
3.57 |
|
$ |
298,139 |
|
$ |
13.82 |
Average shares outstanding (000s) - diluted |
|
|
|
|
|
21,656 |
|
|
|
|
|
21,580 |
1Earnings per share includes rounding
2The tax effect of adjustments is calculated based on the income tax rate in each applicable jurisdiction.
VALMONT INDUSTRIES, INC. AND SUBSIDIARIES
SUMMARY OF EFFECT OF SIGNIFICANT NON-RECURRING ITEMS ON REPORTED RESULTS
REGULATION G RECONCILIATION
(Dollars in thousands, except per share amounts)
(Unaudited)
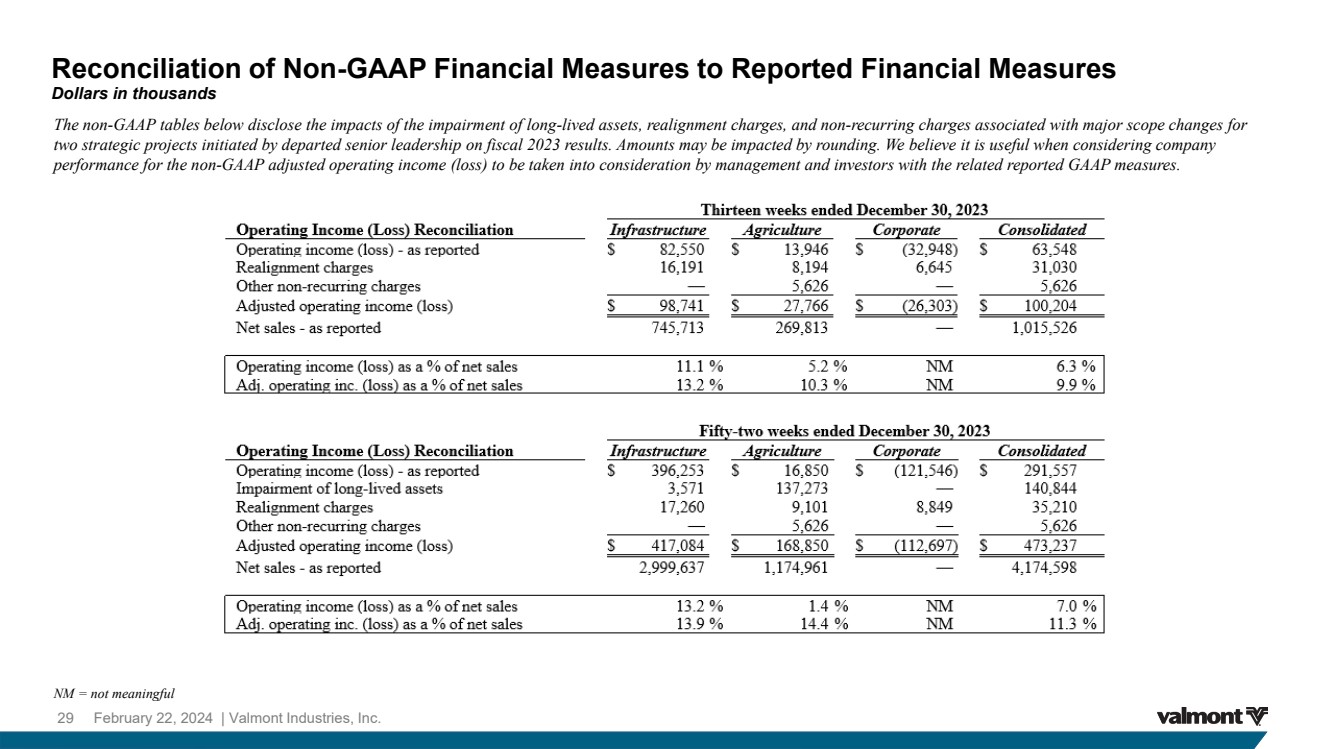
The non-GAAP tables below disclose the impacts of the impairment of long-lived assets, realignment charges, and non-recurring charges associated with major scope changes for two strategic projects initiated by departed senior leadership on fiscal 2023 results. Amounts may be impacted by rounding. We believe it is useful when considering company performance for the non-GAAP adjusted operating income (loss) to be taken into consideration by management and investors with the related reported GAAP measures.
|
|
Thirteen weeks ended December 30, 2023 |
|
||||||||||
Operating Income (Loss) Reconciliation |
|
Infrastructure |
|
Agriculture |
|
Corporate |
|
Consolidated |
|||||
Operating income (loss) - as reported |
|
$ |
82,550 |
|
$ |
13,946 |
|
$ |
(32,948) |
|
$ |
63,548 |
|
Realignment charges |
|
|
16,191 |
|
|
8,194 |
|
|
6,645 |
|
|
31,030 |
|
Other non-recurring charges |
|
|
— |
|
|
5,626 |
|
|
— |
|
|
5,626 |
|
Adjusted operating income (loss) |
|
$ |
98,741 |
|
$ |
27,766 |
|
$ |
(26,303) |
|
$ |
100,204 |
|
Net sales - as reported |
|
|
745,713 |
|
|
269,813 |
|
|
— |
|
|
1,015,526 |
|
|
|
|
|
|
|
|
|
|
|
|
|
|
|
Operating income (loss) as a % of net sales |
|
|
11.1 |
% |
|
5.2 |
% |
|
NM |
|
|
6.3 |
% |
Adj. operating inc. (loss) as a % of net sales |
|
|
13.2 |
% |
|
10.3 |
% |
|
NM |
|
|
9.9 |
% |
|
|
Fifty-two weeks ended December 30, 2023 |
|
||||||||||
Operating Income (Loss) Reconciliation |
|
Infrastructure |
|
Agriculture |
|
Corporate |
|
Consolidated |
|||||
Operating income (loss) - as reported |
|
$ |
396,253 |
|
$ |
16,850 |
|
$ |
(121,546) |
|
$ |
291,557 |
|
Impairment of long-lived assets |
|
|
3,571 |
|
|
137,273 |
|
|
— |
|
|
140,844 |
|
Realignment charges |
|
|
17,260 |
|
|
9,101 |
|
|
8,849 |
|
|
35,210 |
|
Other non-recurring charges |
|
|
— |
|
|
5,626 |
|
|
— |
|
|
5,626 |
|
Adjusted operating income (loss) |
|
$ |
417,084 |
|
$ |
168,850 |
|
$ |
(112,697) |
|
$ |
473,237 |
|
Net sales - as reported |
|
|
2,999,637 |
|
|
1,174,961 |
|
|
— |
|
|
4,174,598 |
|
|
|
|
|
|
|
|
|
|
|
|
|
|
|
Operating income (loss) as a % of net sales |
|
|
13.2 |
% |
|
1.4 |
% |
|
NM |
|
|
7.0 |
% |
Adj. operating inc. (loss) as a % of net sales |
|
|
13.9 |
% |
|
14.4 |
% |
|
NM |
|
|
11.3 |
% |
We previously presented non-GAAP financial measures adjusted for Prospera intangible asset amortization and stock-based compensation recognized for the Prospera employees to provide investors with a better understanding of Agriculture segment performance related to traditional segment products. The Company conducted its annual impairment testing of intangible asset value as of September 2, 2023 and significantly reduced the Prospera intangible asset value. Additionally, the Board of Directors approved certain realignment activities commencing in the third quarter of fiscal 2023 that affected the future stock compensation recognized for the Prospera employees. As a result, we do not consider our historical adjustments related to Prospera to arrive at non-GAAP financial measures to be relevant to investor understanding of fourth quarter of fiscal 2023, second half of fiscal 2023, and future segment performance. Since these items had been specific adjustments to operating income (loss) for the first half of fiscal 2023, we removed what would otherwise have been their effect on fiscal 2023 results which is presented as “further adjusted” operating income (loss) below.
|
|
Fifty-two weeks ended December 30, 2023 |
|
||||||||||
Operating Income (Loss) Reconciliation |
|
Infrastructure |
|
Agriculture |
|
Corporate |
|
Consolidated |
|||||
Adjusted operating income (loss) |
|
$ |
417,084 |
|
$ |
168,850 |
|
$ |
(112,697) |
|
$ |
473,237 |
|
Prospera intangible asset amortization |
|
|
— |
|
|
3,290 |
|
|
— |
|
|
3,290 |
|
Prospera stock-based compensation |
|
|
— |
|
|
4,278 |
|
|
— |
|
|
4,278 |
|
Further adjusted operating income (loss) |
|
$ |
417,084 |
|
$ |
176,418 |
|
$ |
(112,697) |
|
$ |
480,805 |
|
Net sales - as reported |
|
|
2,999,637 |
|
|
1,174,961 |
|
|
— |
|
|
4,174,598 |
|
|
|
|
|
|
|
|
|
|
|
|
|
|
|
Adj. operating inc. (loss) as a % of net sales |
|
|
13.9 |
% |
|
14.4 |
% |
|
NM |
|
|
11.3 |
% |
Further adj. oper. inc. (loss) as a % of net sales |
|
|
13.9 |
% |
|
15.0 |
% |
|
NM |
|
|
11.5 |
% |
NM = not meaningful
VALMONT INDUSTRIES, INC. AND SUBSIDIARIES
SUMMARY OF EFFECT OF SIGNIFICANT NON-RECURRING ITEMS ON REPORTED RESULTS
REGULATION G RECONCILIATION
(Dollars in thousands, except per share amounts)
(Unaudited)
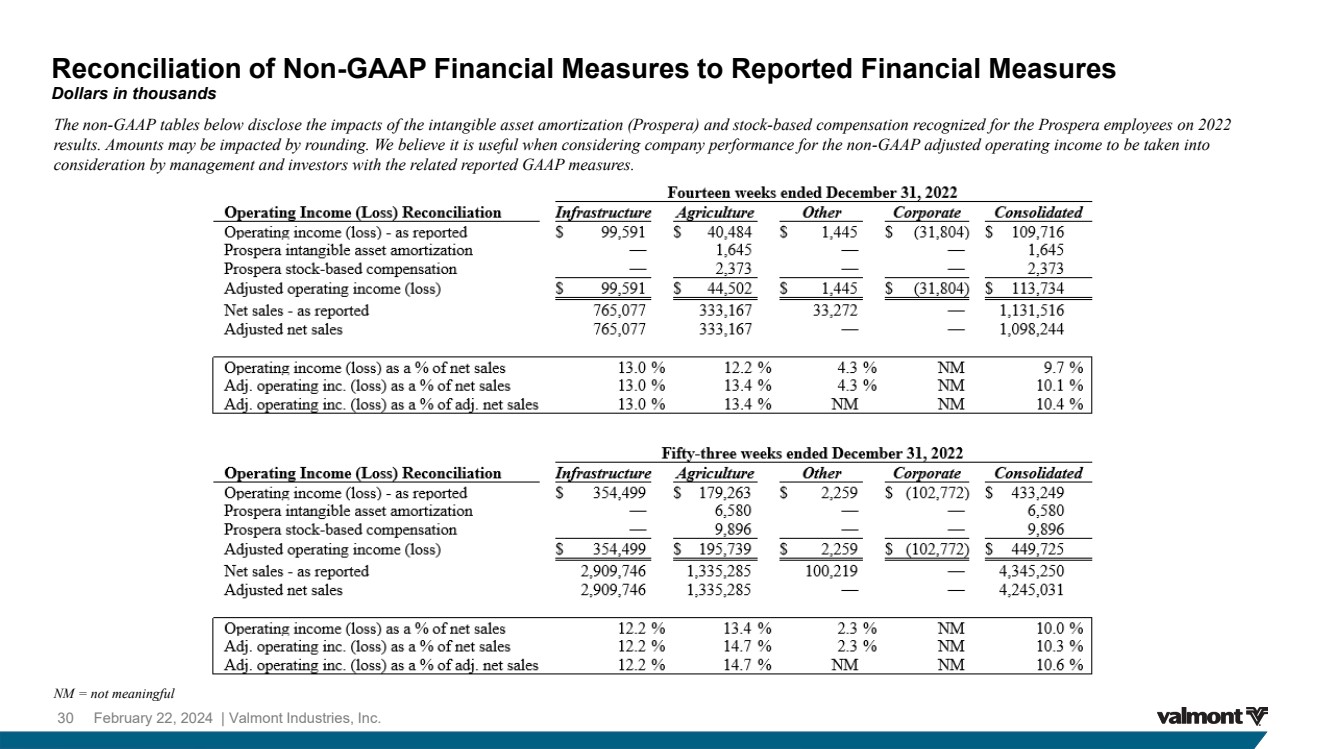
The non-GAAP tables below disclose the impacts of the intangible asset amortization (Prospera) and stock-based compensation recognized for the Prospera employees on 2022 results. Amounts may be impacted by rounding. We believe it is useful when considering company performance for the non-GAAP adjusted operating income (loss) to be taken into consideration by management and investors with the related reported GAAP measures.
|
|
Fourteen weeks ended December 31, 2022 |
|
|||||||||||||
Operating Income (Loss) Reconciliation |
|
Infrastructure |
|
Agriculture |
|
Other |
|
Corporate |
|
Consolidated |
||||||
Operating income (loss) - as reported |
|
$ |
99,591 |
|
$ |
40,484 |
|
$ |
1,445 |
|
$ |
(31,804) |
|
$ |
109,716 |
|
Prospera intangible asset amortization |
|
|
— |
|
|
1,645 |
|
|
— |
|
|
— |
|
|
1,645 |
|
Prospera stock-based compensation |
|
|
— |
|
|
2,373 |
|
|
— |
|
|
— |
|
|
2,373 |
|
Adjusted operating income (loss) |
|
$ |
99,591 |
|
$ |
44,502 |
|
$ |
1,445 |
|
$ |
(31,804) |
|
$ |
113,734 |
|
Net sales - as reported |
|
|
765,077 |
|
|
333,167 |
|
|
33,272 |
|
|
— |
|
|
1,131,516 |
|
Adjusted net sales |
|
|
765,077 |
|
|
333,167 |
|
|
— |
|
|
— |
|
|
1,098,244 |
|
|
|
|
|
|
|
|
|
|
|
|
|
|
|
|
|
|
Operating income (loss) as a % of net sales |
|
|
13.0 |
% |
|
12.2 |
% |
|
4.3 |
% |
|
NM |
|
|
9.7 |
% |
Adj. operating inc. (loss) as a % of net sales |
|
|
13.0 |
% |
|
13.4 |
% |
|
4.3 |
% |
|
NM |
|
|
10.1 |
% |
Adj. operating inc. (loss) as a % of adj. net sales |
|
|
13.0 |
% |
|
13.4 |
% |
|
NM |
|
|
NM |
|
|
10.4 |
% |
|
|
Fifty-three weeks ended December 31, 2022 |
|
|||||||||||||
Operating Income (Loss) Reconciliation |
|
Infrastructure |
|
Agriculture |
|
Other |
|
Corporate |
|
Consolidated |
||||||
Operating income (loss) - as reported |
|
$ |
354,499 |
|
$ |
179,263 |
|
$ |
2,259 |
|
$ |
(102,772) |
|
$ |
433,249 |
|
Prospera intangible asset amortization |
|
|
— |
|
|
6,580 |
|
|
— |
|
|
— |
|
|
6,580 |
|
Prospera stock-based compensation |
|
|
— |
|
|
9,896 |
|
|
— |
|
|
— |
|
|
9,896 |
|
Adjusted operating income (loss) |
|
$ |
354,499 |
|
$ |
195,739 |
|
$ |
2,259 |
|
$ |
(102,772) |
|
$ |
449,725 |
|
Net sales - as reported |
|
|
2,909,746 |
|
|
1,335,285 |
|
|
100,219 |
|
|
— |
|
|
4,345,250 |
|
Adjusted net sales |
|
|
2,909,746 |
|
|
1,335,285 |
|
|
— |
|
|
— |
|
|
4,245,031 |
|
|
|
|
|
|
|
|
|
|
|
|
|
|
|
|
|
|
Operating income (loss) as a % of net sales |
|
|
12.2 |
% |
|
13.4 |
% |
|
2.3 |
% |
|
NM |
|
|
10.0 |
% |
Adj. operating inc. (loss) as a % of net sales |
|
|
12.2 |
% |
|
14.7 |
% |
|
2.3 |
% |
|
NM |
|
|
10.3 |
% |
Adj. operating inc. (loss) as a % of adj. net sales |
|
|
12.2 |
% |
|
14.7 |
% |
|
NM |
|
|
NM |
|
|
10.6 |
% |
NM = not meaningful
VALMONT INDUSTRIES, INC. AND SUBSIDIARIES
REGULATION G RECONCILIATION OF EXCLUDING OTHER SEGMENT NET SALES
(Dollars in thousands)
(Unaudited)
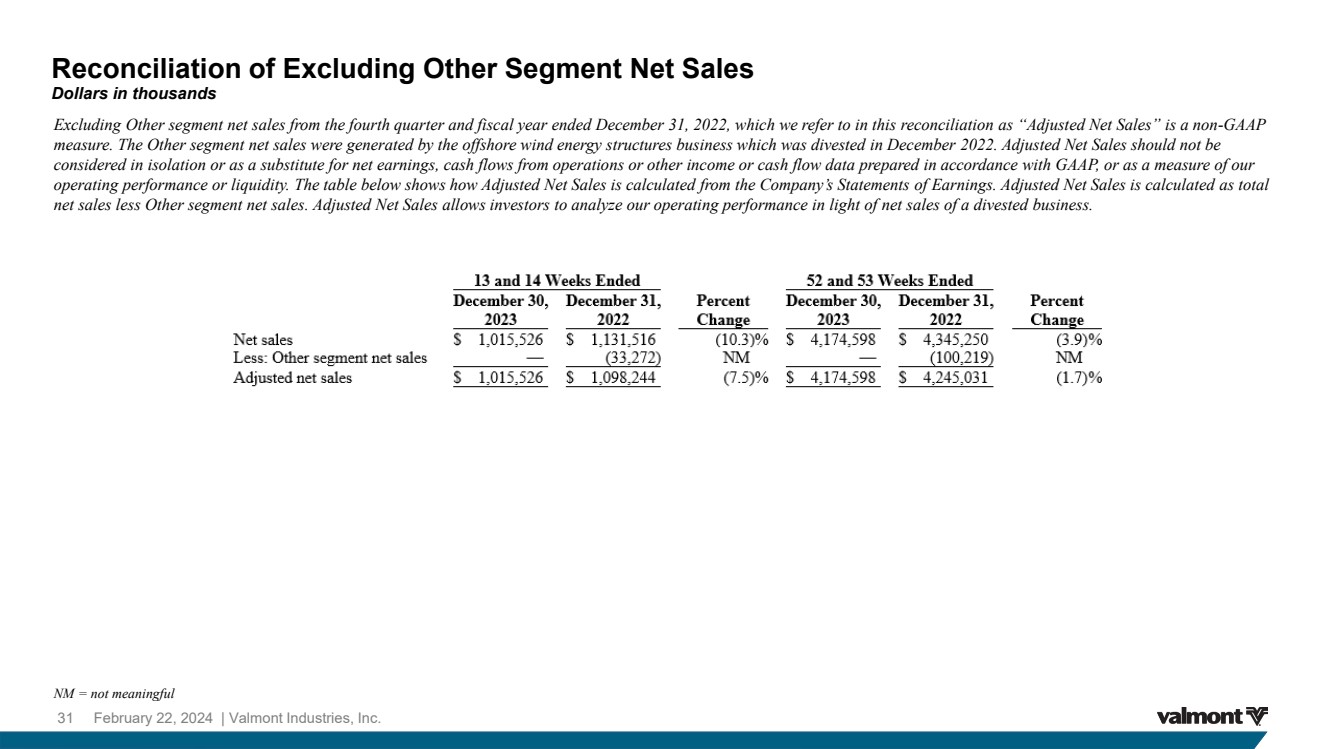
Excluding Other segment net sales from the fourth quarter and fiscal year ended December 31, 2022, which we refer to in this reconciliation as “Adjusted Net Sales”, is a non-GAAP measure. The Other segment net sales were generated by the offshore wind energy structures business which was divested in December 2022. Adjusted Net Sales should not be considered in isolation or as a substitute for net earnings, cash flows from operations or other income or cash flow data prepared in accordance with GAAP, or as a measure of our operating performance or liquidity. The table below shows how Adjusted Net Sales is calculated from the Company’s Statements of Earnings. Adjusted Net Sales is calculated as total net sales less Other segment net sales. Adjusted Net Sales allows investors to analyze our operating performance in light of net sales of a divested business.
|
|
13 and 14 Weeks Ended |
|
|
|
|
|
52 and 53 Weeks Ended |
|
|
|
|
||||||||
|
|
December 30, |
|
December 31, |
|
Percent |
|
December 30, |
|
December 31, |
|
Percent |
||||||||
|
|
2023 |
|
2022 |
|
Change |
|
2023 |
|
2022 |
|
Change |
||||||||
Net sales |
|
$ |
1,015,526 |
|
$ |
1,131,516 |
|
|
(10.3) |
% |
|
$ |
4,174,598 |
|
$ |
4,345,250 |
|
|
(3.9) |
% |
Less: Other segment net sales |
|
|
— |
|
|
(33,272) |
|
|
NM |
|
|
|
— |
|
|
(100,219) |
|
|
NM |
|
Adjusted net sales |
|
$ |
1,015,526 |
|
$ |
1,098,244 |
|
|
(7.5) |
% |
|
$ |
4,174,598 |
|
$ |
4,245,031 |
|
|
(1.7) |
% |
NM = not meaningful
VALMONT INDUSTRIES, INC. AND SUBSIDIARIES
REGULATION G RECONCILIATION OF ADJUSTED RETURN ON INVESTED CAPITAL
(Dollars in thousands)
(Unaudited)
Return on Invested Capital (“ROIC”) and Adjusted ROIC are non-GAAP measures. Accordingly, Invested Capital, ROIC, and Adjusted ROIC should not be considered in isolation or as a substitute for net earnings, cash flows from operations or other income or cash flow data prepared in accordance with GAAP, or as a measure of our operating performance or liquidity. The table below shows how Invested Capital, ROIC, and Adjusted ROIC are calculated from our Statements of Earnings and Balance Sheets. ROIC is calculated as after-tax operating income divided by the average of beginning and ending Invested Capital. Adjusted ROIC is calculated as after-tax operating income, adjusted for impairment of long-lived assets, realignment charges, and non-recurring charges associated with major scope changes for two strategic projects initiated by departed senior leadership then divided by the average of beginning and ending Invested Capital. Invested Capital represents total assets minus total liabilities (excluding interest-bearing debt and redeemable noncontrolling interests). ROIC and Adjusted ROIC are some of our key operating ratios, as they allow investors to analyze our operating performance in light of the amount of investment required to generate our operating profit. ROIC and Adjusted ROIC are also measures used to determine management incentives.
|
|
Fifty-two |
||
|
|
weeks ended |
||
|
|
December 30, |
||
|
|
2023 |
||
Operating income |
|
$ |
291,557 |
|
Effective tax rate |
|
|
38.1 |
% |
Tax effect on operating income |
|
|
(111,124) |
|
After-tax operating income |
|
|
180,433 |
|
Average invested capital |
|
|
2,504,474 |
|
Return on invested capital |
|
|
7.2 |
% |
|
|
|
|
|
Operating income |
|
|
291,557 |
|
Impairment of long-lived assets |
|
|
140,844 |
|
Realignment charges |
|
|
35,210 |
|
Other non-recurring charges |
|
|
5,626 |
|
Adjusted operating income |
|
|
473,237 |
|
Adjusted effective tax rate1 |
|
|
25.9 |
% |
Tax effect on adjusted operating income |
|
|
(122,665) |
|
After-tax adjusted operating income |
|
|
350,572 |
|
Average invested capital |
|
|
2,504,474 |
|
Adjusted return on invested capital |
|
|
14.0 |
% |
|
|
|
|
|
|
|
December 30, |
||
|
|
2023 |
||
Total assets |
|
|
3,477,448 |
|
Less: Accounts payable |
|
|
(358,311) |
|
Less: Accrued expenses |
|
|
(277,764) |
|
Less: Defined benefit pension asset |
|
|
(15,404) |
|
Less: Deferred compensation |
|
|
(32,623) |
|
Less: Other noncurrent liabilities |
|
|
(12,818) |
|
Less: Dividends payable |
|
|
(12,125) |
|
Less: Lease liability |
|
|
(162,743) |
|
Less: Contract liability |
|
|
(70,978) |
|
Less: Deferred tax liability |
|
|
(21,205) |
|
Total invested capital |
|
$ |
2,513,477 |
|
Beginning of year invested capital |
|
$ |
2,495,471 |
|
Average invested capital |
|
$ |
2,504,474 |
|
1See Regulation G Reconciliation of Adjusted Effective Tax Rate
ROIC and Adjusted ROIC, as presented, may not be comparable to similarly titled measures of other companies.
VALMONT INDUSTRIES, INC. AND SUBSIDIARIES
REGULATION G RECONCILIATION OF ADJUSTED EFFECTIVE TAX RATE
(Dollars in thousands)
(Unaudited)
Excluding significant non-recurring items from the fourth quarter and fiscal year ended December 30, 2023 from the calculation of effective tax rate, which we refer to as “Adjusted Effective Tax Rate”, is a non-GAAP measure. Adjusted Effective Tax Rate should not be considered in isolation or as a substitute for the effective tax rate prepared in accordance with GAAP. The table below shows how Adjusted Effective Tax Rate is calculated from the Company’s Statements of Earnings. Adjusted Effective Tax Rate is calculated as total earnings before income taxes and equity in loss of nonconsolidated subsidiaries plus the significant non-recurring items of impairment of long-lived assets, realignment charges, non-recurring charges associated with major scope changes for two strategic projects initiated by departed senior leadership, the loss from Argentine peso hyperinflation, and non-recurring tax benefit items. Adjusted Effective Tax Rate allows investors to analyze our effective tax rate in light of these non-recurring items.
|
|
Thirteen weeks ended |
|
Fifty-two weeks ended |
||||||||||||||
|
|
December 30, 2023 |
|
December 30, 2023 |
||||||||||||||
|
|
Earnings before income taxes and equity in loss of nonconsolidated subsidiaries |
|
Income tax expense |
|
Effective tax rate |
|
Earnings before income taxes and equity in loss of nonconsolidated subsidiaries |
|
Income tax expense |
|
Effective tax rate |
||||||
As reported |
|
$ |
45,166 |
|
$ |
10,882 |
|
|
24.1% |
|
$ |
236,452 |
|
$ |
90,121 |
|
|
38.1% |
Impairment of long-lived assets |
|
|
— |
|
|
— |
|
|
|
|
|
140,844 |
|
|
4,387 |
|
|
|
Realignment charges |
|
|
31,030 |
|
|
7,675 |
|
|
|
|
|
35,210 |
|
|
8,720 |
|
|
|
Other non-recurring charges |
|
|
5,626 |
|
|
1,443 |
|
|
|
|
|
5,626 |
|
|
1,443 |
|
|
|
Loss from Argentine peso hyperinflation |
|
|
5,132 |
|
|
1,453 |
|
|
|
|
|
5,132 |
|
|
1,453 |
|
|
|
Non-recurring tax benefit items |
|
|
— |
|
|
— |
|
|
|
|
|
— |
|
|
3,588 |
|
|
|
Adjusted |
|
$ |
86,954 |
|
$ |
21,453 |
|
|
24.7% |
|
$ |
423,264 |
|
$ |
109,712 |
|
|
25.9% |
VALMONT INDUSTRIES, INC. AND SUBSIDIARIES
REGULATION G RECONCILIATION OF FREE CASH FLOW
(Dollars in thousands)
(Unaudited)
We use the non-GAAP measure of free cash flow, which we define as net cash flows provided by operating activities reduced by the purchase of property, plant, and equipment. We believe that free cash flow is a useful performance measure for management and useful to investors as the basis for comparing our performance with other companies. Our measure of free cash flow may not be directly comparable to similar measures used by other companies.
|
|
Fifty-two |
|
|
|
weeks ended |
|
|
|
December 30, |
|
|
|
2023 |
|
Net cash flows provided by operating activities |
|
$ |
306,775 |
Net cash flows used in investing activities |
|
|
(115,281) |
Net cash flows used in financing activities |
|
|
(176,405) |
|
|
|
|
Net cash flows provided by operating activities |
|
$ |
306,775 |
Purchase of property, plant, and equipment |
|
|
(96,771) |
Free cash flow |
|
$ |
210,004 |
|
Valmont® © 2024 Industries, Inc. 4Q and Full Year 2023 Earnings Presentation February 22, 2024 |
|
Today’s Agenda 2 February 22, 2024 | Valmont Industries, Inc. 01 02 03 04 2023 Results & Market Dynamics 4Q 2023 Results & Initial 2024 Outlook Valmont Business Model Long-term Financial Targets |
|
These slides contain (and the accompanying oral discussion will contain) “forward-looking statements” within the meaning of the Private Securities Litigation Reform Act of 1995. Such statements involve known and unknown risks, uncertainties and other factors that could cause the actual results of the Company to differ materially from the results expressed or implied by such statements, including general economic and business conditions, conditions affecting the industries served by the Company and its subsidiaries, the overall market acceptance of such products and services, the integration of acquisitions and other factors disclosed in the Company’s periodic reports filed with the Securities and Exchange Commission, as well as future economic and market circumstances, industry conditions, company performance and financial results, operating efficiencies, availability and price of raw materials, availability and market acceptance of new products, product pricing, domestic and international competitive environments, geopolitical risks and actions and policy changes of domestic and foreign governments. Consequently, such forward-looking statements should be regarded as the Company’s current plans, estimates, and beliefs. The Company does not undertake and specifically declines any obligation to publicly release the results of any revisions to these forward-looking statements that may be made to reflect any future events or circumstances after the date of such statements or to reflect the occurrence of anticipated or unanticipated events. Disclosure Regarding Forward-Looking Statements 3 February 22, 2024 | Valmont Industries, Inc. |
|
CEO Opening Comments Avner Applbaum, President & CEO 4 February 22, 2024 | Valmont Industries, Inc. |
|
Full Year 2023 Financials and Key Messages 5 February 22, 2024 | Valmont Industries, Inc. The global Valmont team navigated a dynamic demand environment and delivered solid full-year results; expanded gross and adjusted operating margins and grew adjusted diluted earnings per share despite lower sales Infrastructure net sales were $3.0 billion, up 3% year-over-year; due to strong growth in Solar and TD&S driven by multi-year secular drivers, offset by reduced volumes in Telecommunications Operational excellence and pricing strategies in both segments drove margin expansion and allowed us to capture the value we add to customers Agriculture net sales were $1.2 billion, down 12% year-over-year; due to lower North America volumes, partially offset by international sales growth 7.0% Operating Margin $4.2B Net Sales (3.9%) Y/Y Net Sales 11.3% Adj. Operating Margin1 $6.78 GAAP Diluted EPS $14.98 Adj. Diluted EPS1 $307M Operating Cash Flow $395M Cash Returned to Shareholders 1Please see Reg G reconciliation to GAAP measures at end of document. |
|
Infrastructure Agriculture Near-Term Dynamic Markets with Multi-Year Drivers • Benefiting from several long-term, secular growth drivers • Utilities are sustaining elevated capex spending due to grid hardening initiatives, power load growth and the energy transition • Transportation market demand is supported by road construction investment; future benefits expected from Infrastructure Investment and Jobs Act (“IIJA”) although funding is slower than anticipated • Solar expects to see demand tailwinds from the Inflation Reduction Act (“IRA”); 10-year investment tax credit extension supports US demand; favorable policies support international demand • Telecom softness as wireless carriers have communicated reduced capex spending this year, following record levels of investment • U.S. net farm income levels are expected to decline significantly in 2024 compared to 2023 which is weighing on sentiment; however, growers’ balance sheets are expected to remain strong • International market fundamentals are mixed ‒ Brazil sentiment and expected farm income levels are softening due to lower grain prices, high interest rates, and unfavorable weather patterns; however, remains a key part of our long-term strategy ‒ Project pipeline is providing a multi-year line of sight; food security concerns, the ability to produce goods for export and growing populations driving demand; Egypt project shipments expected to continue throughout 2024 6 February 22, 2024 | Valmont Industries, Inc. |
|
Financial Results and Outlook Tim Francis, Interim CFO 7 February 22, 2024 | Valmont Industries, Inc. |
|
4Q 2023 Financial Summary 8 February 22, 2024 | Valmont Industries, Inc. • Infrastructure sales decreased 3.0%, Agriculture sales decreased 18.9% • GAAP operating margin decreased to 6.3%; Adjusted1 operating margin decreased to 9.9% • GAAP Diluted Earnings per Share was $1.38; Adjusted1 Diluted Earnings per Share was $3.18 GAAP Adjusted1 $M, except EPS 4Q 2023 4Q 2022 Y/Y 4Q 2023 4Q 2022 Y/Y Net Sales 1,015.5 1,131.5 -10.3% 1,015.5 1,098.2 -7.5% Operating Income 63.5 109.7 -42.1% 100.2 113.7 -11.9% Operating Margin 6.3% 9.7% -340bps 9.9% 10.4% -50bps Net Earnings 28.6 40.3 -29.1% 66.0 77.3 -14.5% Diluted EPS 1.38 1.86 -25.8% 3.18 3.57 -10.9% 1Please see Reg G reconciliation to GAAP measures at end of document. |
|
4Q 2023 Results | Infrastructure 9 February 22, 2024 | Valmont Industries, Inc. Sales ($M) Operating Income ($M) $771.3 $748.3 2022 2023 $99.6 $82.6 $99.6 $98.7 2022 2023 2022 2023 Sales ($M) 2022 2023 % Transmission, Distribution, and Substation (TD&S) $302.4 $316.7 +5% Lighting and Transportation (L&T) $239.5 $236.2 -1% Coatings $92.4 $84.1 -9% Telecommunications $87.6 $56.7 -35% Solar $49.4 $54.6 +11% Adjusted1 -3.0% GAAP: -17.1% : -0.9% 13.0% 11.1% 13.0% 13.2% • Sales decreased slightly year-over-year • Higher volumes in TD&S and Solar, and favorable pricing across the portfolio, were more than offset by lower Telecom and Coatings volumes • Operating margin decreased 190 bps to 11.1% (increased 20 bps to 13.2% adjusted1 ); favorable pricing and deliberate actions to improve COGS were more than offset by lower volumes 1Please see Reg G reconciliation to GAAP measures at end of document. |
|
4Q 2023 Results | Agriculture 10 February 22, 2024 | Valmont Industries, Inc. • Sales down 18.9% year-over-year • North America sales were lower as farmer sentiment remains muted and 4Q 2022 benefited from ongoing delivery of elevated backlog • Average irrigation selling prices were comparable to last year • International growth was led by higher project sales and sales from the HR Products acquisition, offset by lower sales in Brazil • Operating margin decreased; driven by lower volumes and higher SG&A Sales ($M) Operating Income ($M) $335.1 $271.6 2022 2023 $40.5 $13.9 $44.5 $27.8 2022 2023 2022 2023 Sales ($M) 2022 2023 % North America $202.6 $136.4 -33% International $132.5 $135.2 +2% Irrigation Equipment and Parts $303.0 $244.1 -19% Technology Products and Services $32.1 $27.5 -14% GAAP: -65.6% Adjusted1 : -37.6% 12.2% 5.2% 13.4% 10.3% -18.9% NM = “not meaningful” 1Please see Reg G reconciliation to GAAP measures at end of document. |
|
YTD Cash Flow Highlights 11 February 22, 2024 | Valmont Industries, Inc. $M YTD 12/30/2023 Net Cash Flows from Operating Activities $307 Net Cash Flows from Investing Activities (115) Net Cash Flows from Financing Activities (176) Net Cash Flows from Operating Activities $307 Purchase of Property, Plant, & Equipment (97) Free Cash Flows $210 • Strong 4Q 2023 Operating Cash Flows of ~$116 million • Full Year free cash flow of $210 million, driven by net earnings and diligent working capital management, primarily reductions in inventory |
|
Balanced Approach to Capital Allocation 2023 Full Year Capital Deployment: $525M 12 February 22, 2024 | Valmont Industries, Inc. Growing Our Business Returning Cash To Shareholders • Targeting opportunities in end markets with favorable and global long-term demand trends • Completed acquisition of HR Products • Returns exceeding cost of capital within 3 years • Q4 Capex of $26M as we continue to invest in strategic capacity expansions • Prioritize projects that deliver high ROIC • Support Industry 4.0 technology to drive efficiency and productivity • Q4 Dividends Paid $12.5M • 9% dividend increase announced February 2023 • Payout ratio target: 15% of earnings • Q4 Share Repurchase of $178.6M, inclusive of $120.0M Accelerated Share Repurchase • Additional $400M share repurchase authorization announced February 2023; ~$136M remains on current authorization • Opportunistic approach, supported by free cash flow $97M Capital Expenditures $33M Acquisitions $345M Share Repurchases $50M Dividends |
|
Strong Balance Sheet and Liquidity 13 February 22, 2024 | Valmont Industries, Inc. As of December 30, 2023 Cash $203 M Total Long-Term Debt $1,108 M Shareholders’ Equity $1,354 M Total Debt to Adj. EBITDA1 1.84 x Available Credit Under Revolving Credit Facility2 $422 M Cash $203 M Total Available Liquidity $625 M • Long-term debt mostly fixed-rate, with long-dated maturities in 2044 and 2054 • Total Debt to Adjusted EBITDA remains within our desired range of 1.5 to 2.5 times • Strong and flexible balance sheet to support balanced capital allocation strategy 1 Please see Adjusted EBITDA and Leverage Ratio at end of document. 2 $800M Total Revolver less borrowings and Standby LCs of $378M. |
|
Segment Assumptions Other Assumptions Full Year 2024 Outlook and Key Assumptions • Growth in Infrastructure is expected to be more than offset by lower Agriculture sales • Infrastructure sales are expected to approach MSD growth; lingering telecom softness is expected to be more than offset by strong demand in our other infrastructure markets • Agriculture sales are expected to decrease 15 to 20% due to lower grain prices and farm income projections, and normalized backlog • Expect modest full-year operating margin improvement compared to 2023 • Commitment to pricing leadership and ongoing improvement in operational efficiencies to offset deleverage from volume decline • Lower SG&A expense including benefit of the organizational realignment program announced in October 2023 • Effective tax rate of ~26% • Minimal expected foreign currency translation impact to net sales • Capital expenditures expected to be in the range of $125 to $140 million to support strategic growth initiatives 14 February 22, 2024 | Valmont Industries, Inc. (3.0%) – Flat Change In Net Sales Y/Y $14.25 – $15.50 GAAP Diluted EPS |
|
Valmont Business Model and Long-Term Financial Targets 15 February 22, 2024 | Valmont Industries, Inc. |
|
Valmont Business Model Enables Value Creation 16 February 22, 2024 | Valmont Industries, Inc. Committed to Focus Areas Our stakeholders expect value creation. These focus areas establish our priorities to ensure we deliver on our promises. United by Core Values Our Core Values define who we are, how we approach our mission, and how we engage with others Our Business Model is the foundation in which we will create value and achieve our long-term financial targets. Value Creation Focus Areas Core Values H gi h P- e rfo rmance Culture • ROIC • Sustainability • Innovative Custome r S o ul t oi ns Pass oi n • Integrity • Continuous Improvement • Delive r R es u lts |
|
Above-Market Growth Expected Through the Ag Cycle 17 February 22, 2024 | Valmont Industries, Inc. VMI Growth Rate: MSD+ Each Segment Growing Above Market Strategic Geographic Expansion New Products and Services Customer-Centric Innovation Footprint & Response Time Engineering Capabilities Competitive Advantages and Customer-Centric Innovation Give us Confidence in Delivering Above Market Growth Agriculture Sustainability & Productivity Food Security Population Growth VMI: MSD+ Mkt: MSD Average growth rate through the cycle Infrastructure Multi-Year Energy Transition Aging Infrastructure/Resilience Technology & Data Consumption VMI: MSD+ Mkt: MSD 1MSD: Mid Single Digit |
|
Providing New Long-Term Financial Targets 18 February 22, 2024 | Valmont Industries, Inc. MSD+ Net Sales Growth1 Approaching Mid-Teens Operating Margin 100% Net Earnings FCF Conversion High-Teens Return on Invested Capital Serving markets with positive growth outlook aligned with megatrends Innovation and market expansion to grow above markets Strategic pricing to align with value we deliver Streamlined organization aligned with strategy Operational efficiencies & focus on the outliers A disciplined and efficient capital allocation strategy Internal investments and acquisitions are evaluated based on financial and strategic criteria Managing net working capital to maximize cash flow Supply chain and inventory optimization 1 VMI sales growth through the Agriculture cycle; organic sales growth only Delivering reliable growth while expanding operating margins and ROIC to consistently create shareholder value |
|
Q&A 19 February 22, 2024 | Valmont Industries, Inc. |
|
Appendix 20 February 22, 2024 | Valmont Industries, Inc. |
|
Actual and Projected Transmission Investment 21 February 22, 2024 | Valmont Industries, Inc. Source: Edison Electric Institute Business Analytics Group Updated January 2024 |
|
Infrastructure Investment and Jobs Act (IIJA) 22 February 22, 2024 | Valmont Industries, Inc. Source: Grassley.senate.gov Infrastructure Investment and Jobs Act Spending Breakdown (In Order - Most to Least) Previously-Passed Transportation Funding | $650B Roads, Bridges and Related Programs | $111B Energy, Power and Electric Grid Reliability | $107.5B Freight and Passenger Rail | $66B Broadband | $65B Water and Wastewater Infrastructure | $55B Public Transportation | $39.2B Airports | $25B Natural Disaster Prevention and Mitigation | $23.3B Cleaning-Up Abandoned Sites | $21B Army Corps of Engineers | $16.7B Highway and Pedestrian Safety | $11B Ports and Coast Guard | $7.8B Cybersecurity and other Infrastructure Programs | $10.11B |
|
5G Adoption 23 February 22, 2024 | Valmont Industries, Inc. Source: GSMA Intelligence- The Mobile Economy 2023 |
|
U.S. Net Cash Farm Income by Year 24 February 22, 2024 | Valmont Industries, Inc. Source: USDA Updated February 7, 2024 |
|
U.S. Drought Condition 25 February 22, 2024 | Valmont Industries, Inc. Source: Drought Monitor Updated February 15, 2024 |
|
26 February 22, 2024 | Valmont Industries, Inc. Steel Material Index Trends Source: FastMarkets AMM A dynamic steel cost environment can lead to variations in quarterly gross profit margin |
|
The non-GAAP table below discloses the impacts of the impairment of long-lived assets, realignment charges, and non-recurring charges associated with major scope changes for two strategic projects initiated by departed senior leadership on net earnings for fiscal 2023, as well as the impact of the loss from Argentine peso hyperinflation and non-recurring tax benefit items on net earnings. Amounts may be impacted by rounding. We believe it is useful when considering company performance for the non-GAAP adjusted net earnings to be taken into consideration by management and investors with the related reported GAAP measures. 1Earnings per share includes rounding 2The tax effect of adjustments is calculated based on the income tax rate in each applicable jurisdiction. Reconciliation of Non-GAAP Financial Measures to Reported Financial Measures Dollars in thousands, except per shares amounts 27 February 22, 2024 | Valmont Industries, Inc. |
|
We previously presented non-GAAP financial measures adjusted for Prospera intangible asset amortization and stock-based compensation recognized for the Prospera employees to provide investors with a better understanding of Agriculture segment performance related to traditional segment products. The Company conducted its annual impairment testing of intangible asset value as of September 2, 2023 and significantly reduced the Prospera intangible asset value. Additionally, the Board of Directors approved certain realignment activities commencing in the third quarter of fiscal 2023 that affected the future stock compensation recognized for the Prospera employees. As a result, we do not consider our historical adjustments related to Prospera to arrive at non-GAAP financial measures to be relevant to investor understanding of fourth quarter of fiscal 2023, second half of fiscal 2023, and future segment performance. Since these items had been specific adjustments to net earnings for the first half of fiscal 2023, we removed what would otherwise have been their effect on fiscal 2023 results which is presented as “further adjusted” net earnings below. 1Earnings per share includes rounding 2The tax effect of adjustments is calculated based on the income tax rate in each applicable jurisdiction. Reconciliation of Non-GAAP Financial Measures to Reported Financial Measures Dollars in thousands, except per shares amounts 27 February 22, 2024 | Valmont Industries, Inc. |
|
The non-GAAP tables below disclose the impacts of the loss from the divestiture of the offshore wind energy structures business, intangible asset amortization (Prospera), and stock-based compensation recognized for the Prospera employees on net earnings for fiscal 2022 results. Amounts may be impacted by rounding. We believe it is useful when considering company performance for the non-GAAP adjusted net earnings to be taken into consideration by management and investors with the related reported GAAP measures. 1Earnings per share includes rounding 2The tax effect of adjustments is calculated based on the income tax rate in each applicable jurisdiction. Reconciliation of Non-GAAP Financial Measures to Reported Financial Measures Dollars in thousands, except per shares amounts 28 February 22, 2024 | Valmont Industries, Inc. |
|
The non-GAAP tables below disclose the impacts of the impairment of long-lived assets, realignment charges, and non-recurring charges associated with major scope changes for two strategic projects initiated by departed senior leadership on fiscal 2023 results. Amounts may be impacted by rounding. We believe it is useful when considering company performance for the non-GAAP adjusted operating income (loss) to be taken into consideration by management and investors with the related reported GAAP measures. Reconciliation of Non-GAAP Financial Measures to Reported Financial Measures Dollars in thousands 29 February 22, 2024 | Valmont Industries, Inc. NM = not meaningful |
|
The non-GAAP tables below disclose the impacts of the intangible asset amortization (Prospera) and stock-based compensation recognized for the Prospera employees on 2022 results. Amounts may be impacted by rounding. We believe it is useful when considering company performance for the non-GAAP adjusted operating income to be taken into consideration by management and investors with the related reported GAAP measures. Reconciliation of Non-GAAP Financial Measures to Reported Financial Measures Dollars in thousands 30 February 22, 2024 | Valmont Industries, Inc. NM = not meaningful |
|
Excluding Other segment net sales from the fourth quarter and fiscal year ended December 31, 2022, which we refer to in this reconciliation as “Adjusted Net Sales” is a non-GAAP measure. The Other segment net sales were generated by the offshore wind energy structures business which was divested in December 2022. Adjusted Net Sales should not be considered in isolation or as a substitute for net earnings, cash flows from operations or other income or cash flow data prepared in accordance with GAAP, or as a measure of our operating performance or liquidity. The table below shows how Adjusted Net Sales is calculated from the Company’s Statements of Earnings. Adjusted Net Sales is calculated as total net sales less Other segment net sales. Adjusted Net Sales allows investors to analyze our operating performance in light of net sales of a divested business. Reconciliation of Excluding Other Segment Net Sales Dollars in thousands 31 February 22, 2024 | Valmont Industries, Inc. NM = not meaningful |
|
Excluding significant non-recurring items from the fourth quarter and fiscal year ended December 30, 2023, from the calculation of effective tax rate, which we refer to as “Adjusted Effective Tax Rate”, is a non-GAAP measure. Adjusted Effective Tax Rate should not be considered in isolation or as a substitute for the effective tax rate prepared in accordance with GAAP. The table below shows how Adjusted Effective Tax Rate is calculated from the Company’s Statements of Earnings. Adjusted Effective Tax Rate is calculated as total earnings before income taxes and equity in loss of nonconsolidated subsidiaries plus the significant non-recurring items of impairment of long-lived assets, realignment charges, non-recurring charges associated with major scope changes for two strategic projects initiated by departed senior leadership, the loss from Argentine peso hyperinflation, and non-recurring tax benefit items. Adjusted Effective Tax Rate allows investors to analyze our effective tax rate in light of these non-recurring items. Reconciliation of Adjusted Effective Tax Rate Dollars in thousands 32 February 22, 2024 | Valmont Industries, Inc. |
|
1Adjusted net earnings for purposes of calculating free cash flow conversion may not agree to the adjusted net earnings. The difference is due to non-recurring expenses which were settled in cash in the year of occurrence as part of net cash flows from operating activities. 2We use the non-GAAP measure of free cash flow, which we define as GAAP net cash flows from operating activities reduced by the purchase of property, plant, and equipment. We believe that free cash flow is a useful performance measure for management and useful to investors as the basis for comparing our performance with other companies. Our measure of free cash flow may not be directly comparable to similar measures used by other companies. Historical Free Cash Flow1,2 (2014 – 2023) Dollars in millions 33 February 22, 2024 | Valmont Industries, Inc. |
|
1We use the non-GAAP measure of free cash flow, which we define as GAAP net cash flows from operating activities reduced by the purchase of property, plant, and equipment. We believe that free cash flow is a useful performance measure for management and useful to investors as the basis for comparing our performance with other companies. Our measure of free cash flow may not be directly comparable to similar measures used by other companies. Free Cash Flow Throughout the Cycle Dollars in millions 34 February 22, 2024 | Valmont Industries, Inc. 101 227 175 78 81 210 210 (42) 233 210 148 (100) (50) - 50 100 150 200 250 300 350 2014 2015 2016 2017 2018 2019 2020 2021 2022 2023 10 Year Avg GAAP 0.55X 5.66X 1.00X 0.65X 0.80X 1.44X 1.49X (0.21X) 0.93X 1.39X Adj. 0.53X 1.71X 1.25X 0.48X 0.62X 1.44X 1.31X (0.19X) 0.82X 0.72X Historical FCF Conversion by Year1 2014 – 2023 Free Cash Flow1 10-yr Avg. $148M GAAP 1.37X Adj. 0.87X Years of rapid raw material cost inflation |
|
Certain of our debt agreements contain covenants that require us to maintain certain coverage ratios. Our Debt to Adjusted EBITDA may not exceed 3.5X Adjusted EBITDA (or 3.75X Adjusted EBITDA after certain material acquisitions) of the prior four fiscal quarters. See “Leverage Ratio” below. Calculation of Adjusted EBITDA and Leverage Ratio Dollars in thousands 35 February 22, 2024 | Valmont Industries, Inc. |