UNITED STATES
SECURITIES AND EXCHANGE COMMISSION
Washington, D.C. 20549
FORM 8-K
CURRENT REPORT
Pursuant to Section 13 OR 15(d) of The Securities Exchange Act of 1934
January 10, 2024
Date of Report (date of earliest event reported)
Valmont Industries, Inc.
(Exact name of registrant as specified in its charter)
Delaware
(State or other jurisdiction of incorporation)
1-31429 |
|
47-0351813 |
(Commission File Number) |
|
(I.R.S. Employer Identification No.) |
|
|
|
15000 Valmont Plaza |
|
68154 |
Omaha NE |
|
|
(Address of Principal Executive Offices) |
|
(Zip Code) |
(402) 963-1000
Registrant's telephone number, including area code
(Former name or former address, if changed since last report.)
Check the appropriate box below if the Form 8-K filing is intended to simultaneously satisfy the filing obligation of the registrant under any of the following provisions (see General Instruction A.2. below):
☐ Written communications pursuant to Rule 425 under the Securities Act (17 CFR 230.425)
☐ Soliciting material pursuant to Rule 14a-12 under the Exchange Act (17 CFR 240.14a-12)
☐ Pre-commencement communications pursuant to Rule 14d-2(b) under the Exchange Act (17 CFR 240.14d-2(b))
☐ Pre-commencement communications pursuant to Rule 13e-4(c) under the Exchange Act (17 CFR 240.13e-4(c))
Securities registered pursuant to Section 12(b) of the Act:
|
|
|
|
|
Title of each class |
|
Trading Symbol(s) |
|
Name of each exchange on which registered |
Common Stock, $1.00 par value |
|
VMI |
|
New York Stock Exchange |
Indicate by check mark whether the registrant is an emerging growth company as defined in Rule 405 of the Securities Act of 1933 (§230.405 of this chapter) or Rule 12b-2 of the Securities Exchange Act of 1934 (§240.12b-2 of this chapter).
Emerging growth company ☐
If an emerging growth company, indicate by check mark if the registrant has elected not to use the extended transition period for complying with any new or revised financial accounting standards provided pursuant to Section 13(a) of the Exchange Act.
☐
Item 7.01. Regulation FD Disclosure.
On January 10, 2024, Valmont Industries, Inc. (the “Company”) will post a presentation, a copy of which is furnished as Exhibit 99.1 to this report, on its website. Exhibit 99.1 is being furnished in accordance with Regulation FD of the Securities and Exchange Commission.
The information in this Item 7.01 is being furnished and shall not be deemed “filed” for the purpose of Section 18 of the Securities Exchange Act of 1934, as amended, or otherwise subject to the liabilities of that section. The information in this Item 7.01 shall not be incorporated by reference into any registration statement or other document pursuant to the Securities Act of 1933, as amended.
Item 9.01. Financial Statements and Exhibits.
(d) Exhibits.
Exhibit No. |
|
Description |
99.1 |
|
|
104 |
|
Cover Page Interactive File (the cover page XBRL tags are embedded in the Inline XBRL document) |
|
|
|
SIGNATURES
Pursuant to the requirements of the Securities Exchange Act of 1934, the registrant has duly caused this report to be signed on its behalf by the undersigned hereunto duly authorized.
|
|
Valmont Industries, Inc. |
||
Date: |
January 10, 2024 |
|
|
|
|
By: |
/s/ TIMOTHY P. FRANCIS |
||
|
|
Name: |
Timothy P. Francis |
|
|
|
Title: |
Interim Chief Financial Officer |
|
|
CJS New Ideas for the New Year January 10, 2024 |
|
2 These slides contain (and the accompanying oral discussion will contain) “forward-looking statements” within the meaning of the Private Securities Litigation Reform Act of 1995. Such statements involve known and unknown risks, uncertainties and other factors that could cause the actual results of the Company to differ materially from the results expressed or implied by such statements, including general economic and business conditions, conditions affecting the industries served by the Company and its subsidiaries including the continuing and developing effects of the pandemic including the effects of the outbreak on the general economy and the specific economic responses to the Company’s products and services, the overall market acceptance of such products and services, the integration of acquisitions and other factors disclosed in the Company’s periodic reports filed with the Securities and Exchange Commission, as well as future economic and market circumstances, industry conditions, company performance and financial results, operating efficiencies, availability and price of raw materials, availability and market acceptance of new products, product pricing, domestic and international competitive environments, geopolitical risks and actions and policy changes of domestic and foreign governments. Consequently, such forward-looking statements should be regarded as the Company’s current plans, estimates, and beliefs. The Company does not undertake and specifically declines any obligation to publicly release the results of any revisions to these forward-looking statements that may be made to reflect any future events or circumstances after the date of such statements or to reflect the occurrence of anticipated or unanticipated events. Disclosure Regarding Forward-Looking Statements |
|
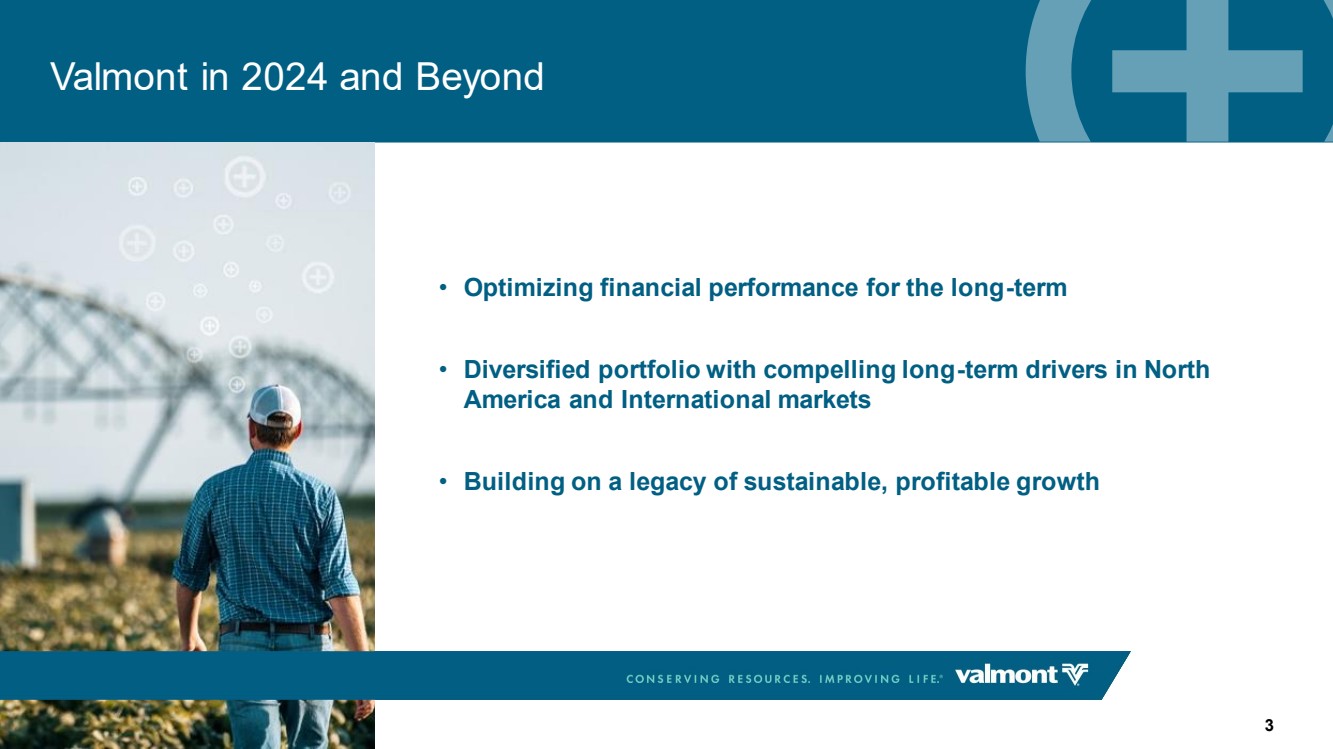
Valmont in 2024 and Beyond 3 • Optimizing financial performance for the long-term • Diversified portfolio with compelling long-term drivers in North America and International markets • Building on a legacy of sustainable, profitable growth |
|
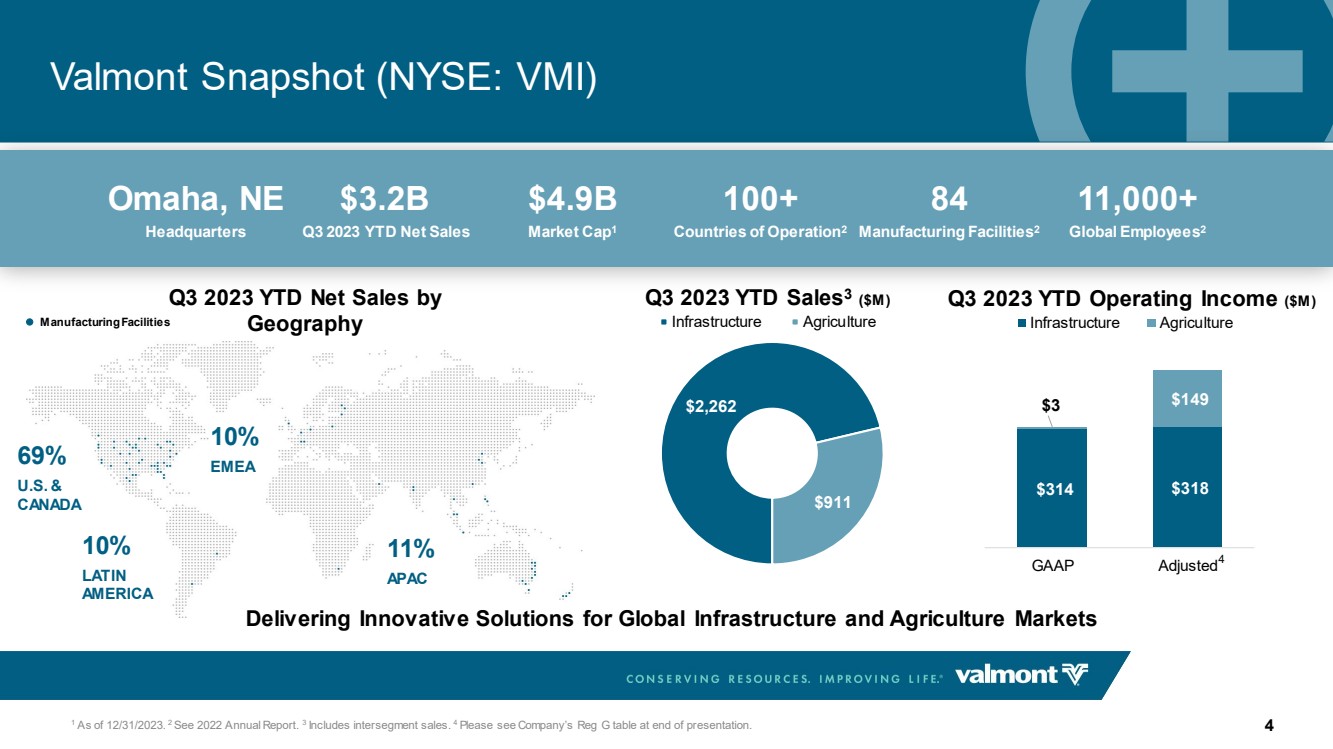
Manufacturing Facilities $2,262 $911 Infrastructure Agriculture Valmont Snapshot (NYSE: VMI) Delivering Innovative Solutions for Global Infrastructure and Agriculture Markets 1 As of 12/31/2023. 2 See 2022 Annual Report. 3 Includes intersegment sales. 4 Please see Company’s Reg G table at end of presentation. Omaha, NE Headquarters $3.2B Q3 2023 YTD Net Sales $4.9B Market Cap1 100+ Countries of Operation2 84 Manufacturing Facilities2 11,000+ Global Employees2 Q3 2023 YTD Sales3 ($M) Q3 2023 YTD Operating Income ($M) $314 $318 $3 $149 GAAP Adjusted Infrastructure Agriculture 4 U.S. & CANADA 69% LATIN AMERICA 10% EMEA 10% APAC 11% 4 Q3 2023 YTD Net Sales by Geography |
|
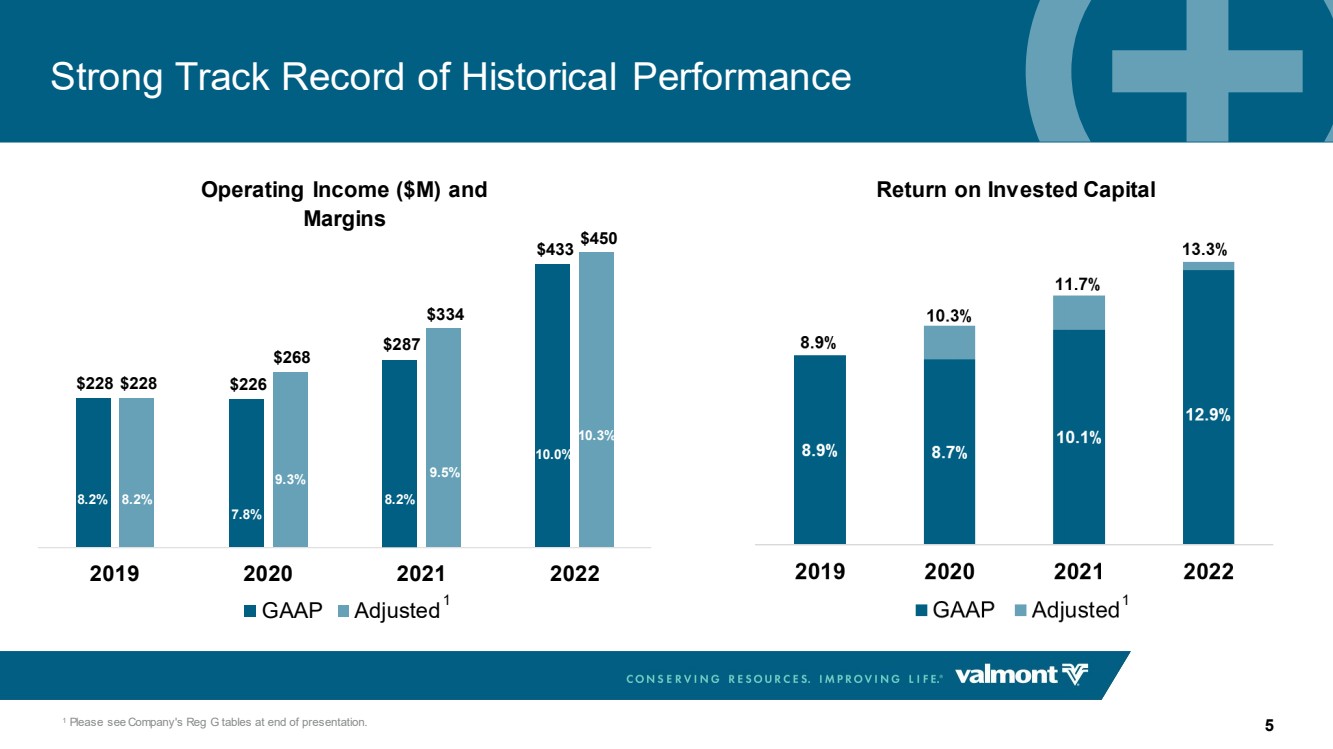
Strong Track Record of Historical Performance 5 $228 $226 $287 $433 $228 $268 $334 $450 2019 2020 2021 2022 GAAP Adjusted 10.0% 8.2% 8.2% 9.3% 7.8% 9.5% 8.2% 10.3% Operating Income ($M) and Return on Invested Capital Margins 1 Please see Company's Reg G tables at end of presentation. 1 1 |
|
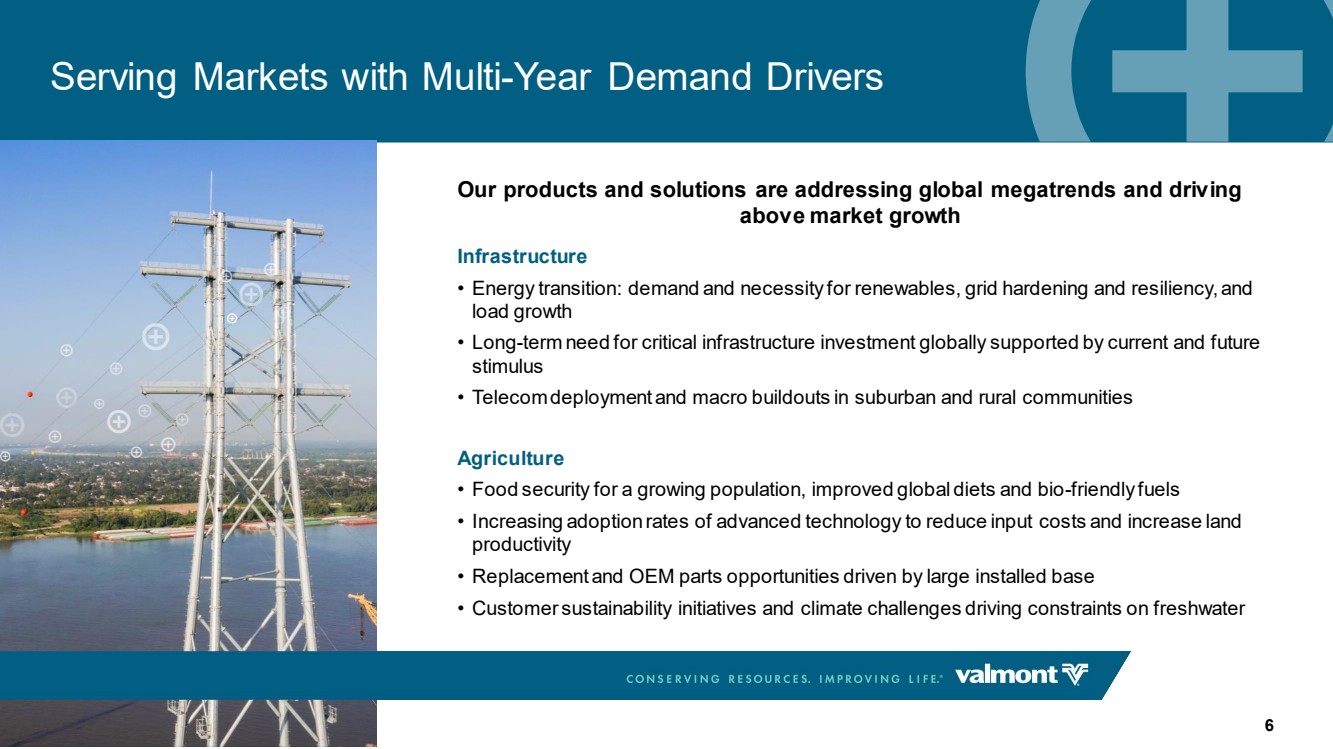
6 Serving Markets with Multi-Year Demand Drivers Our products and solutions are addressing global megatrends and driving above market growth Infrastructure • Energy transition: demand and necessity for renewables, grid hardening and resiliency, and load growth • Long-term need for critical infrastructure investment globally supported by current and future stimulus • Telecom deployment and macro buildouts in suburban and rural communities Agriculture • Food security for a growing population, improved global diets and bio-friendly fuels • Increasing adoption rates of advanced technology to reduce input costs and increase land productivity • Replacement and OEM parts opportunities driven by large installed base • Customer sustainability initiatives and climate challenges driving constraints on freshwater |
|
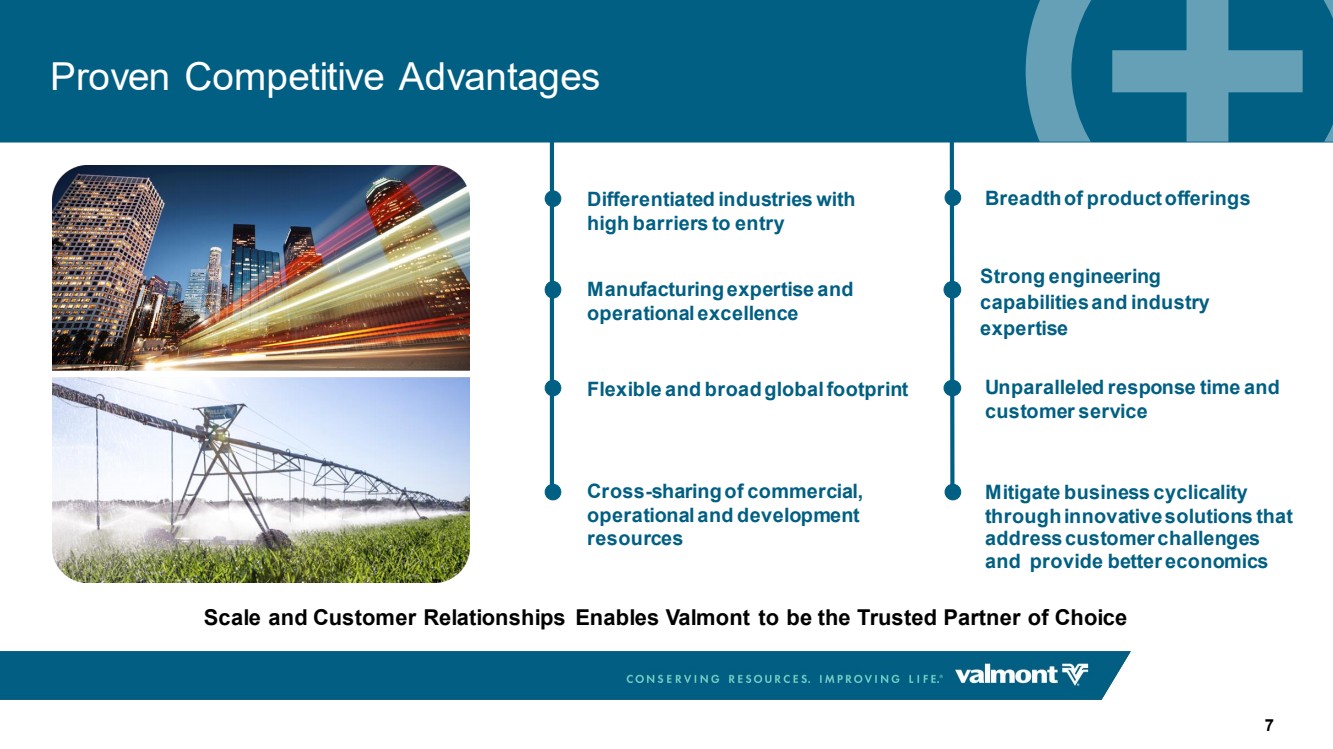
Breadth of product offerings Unparalleled response time and customer service Mitigate business cyclicality through innovative solutions that address customer challenges and provide better economics Differentiated industries with high barriers to entry Manufacturing expertise and operational excellence Flexible and broad global footprint Cross-sharing of commercial, operational and development resources Proven Competitive Advantages Scale and Customer Relationships Enables Valmont to be the Trusted Partner of Choice 7 Strong engineering capabilities and industry expertise |
|
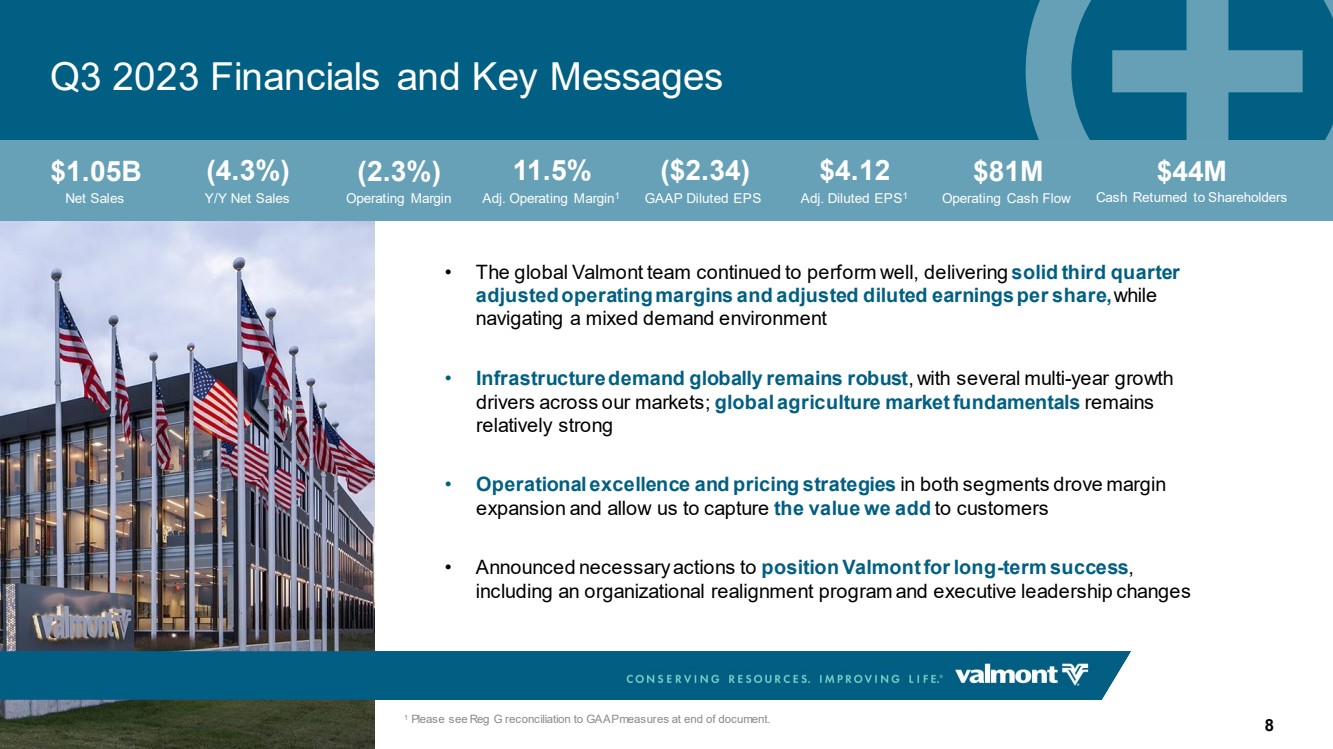
Q3 2023 Financials and Key Messages 8 • The global Valmont team continued to perform well, delivering solid third quarter adjusted operating margins and adjusted diluted earnings per share, while navigating a mixed demand environment • Infrastructure demand globally remains robust, with several multi-year growth drivers across our markets; global agriculture market fundamentals remains relatively strong • Operational excellence and pricing strategies in both segments drove margin expansion and allow us to capture the value we add to customers • Announced necessary actions to position Valmont for long-term success, including an organizational realignment program and executive leadership changes Net Sales Y/Y Net Sales Operating Margin Adj. Operating Margin1 GAAP Diluted EPS Adj. Diluted EPS1 Operating Cash Flow Cash Returned to Shareholders 1 Please see Reg G reconciliation to GAAP measures at end of document. $1.05B (4.3%) (2.3%) 11.5% ($2.34) $4.12 $81M $44M |
|
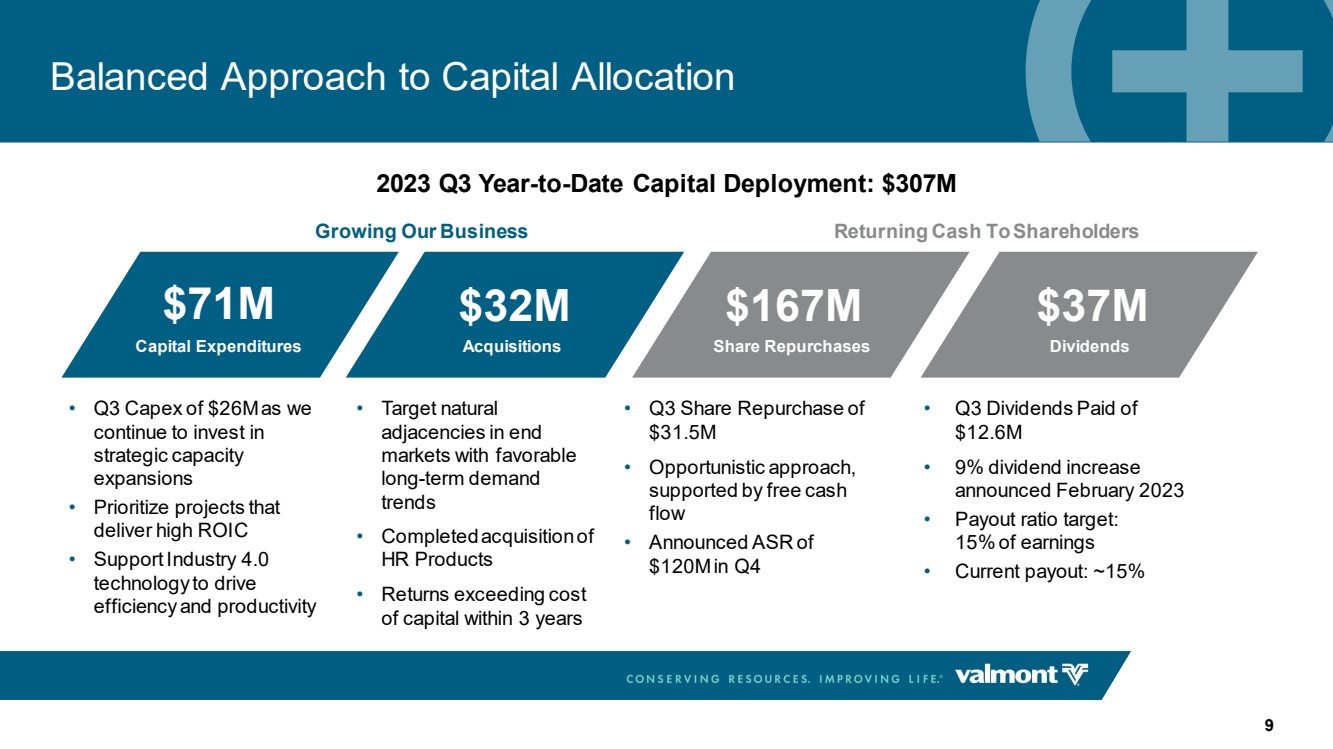
Balanced Approach to Capital Allocation 9 Growing Our Business Returning Cash To Shareholders • Target natural adjacencies in end markets with favorable long-term demand trends • Completed acquisition of HR Products • Returns exceeding cost of capital within 3 years • Q3 Capex of $26M as we continue to invest in strategic capacity expansions • Prioritize projects that deliver high ROIC • Support Industry 4.0 technology to drive efficiency and productivity • Q3 Dividends Paid of $12.6M • 9% dividend increase announced February 2023 • Payout ratio target: 15% of earnings • Current payout: ~15% • Q3 Share Repurchase of $31.5M • Opportunistic approach, supported by free cash flow • Announced ASR of $120M in Q4 Capital Expenditures Acquisitions Share Repurchases Dividends $71M $32M $167M $37M 2023 Q3 Year-to-Date Capital Deployment: $307M |
|
Positioning Valmont for Long-Term Success • Advancing strategic priorities through July 2023 CEO transition and subsequent senior leadership changes • Announced an organizational realignment and early retirement program; simplified reporting lines to enable a more efficient and effective structure with improved visibility and accountability, while reducing costs. 2023 Performance Relative to Expectations Agriculture: • Elevated North America Net Farm Income levels; however, farmer sentiment remained muted; International project timing was slower than anticipated impacting Q4 guidance • Entered the year with strong backlog, specifically in North America and Brazil irrigation Infrastructure: • Telecom capital investments have slowed per typical pattern following strong investment cycle Ag Tech Impairment • Decline in the North American Ag market and a higher weighted average cost of capital attributed to higher interest rates • Slower adoption rate of agronomy technology solutions than originally projected • Strong confidence in the technology solutions; Prospera and Valley Tech teams are now integrated, and the commercial strategy is being refined to streamline the go-to-market approach and better serve our customers Long-Term Financial Targets • We have demonstrated operating margin improvement and have made good progress on ROIC; we expect continued improvement • An update related to our targets will be provided in the coming months Additional Topics 10 |
|
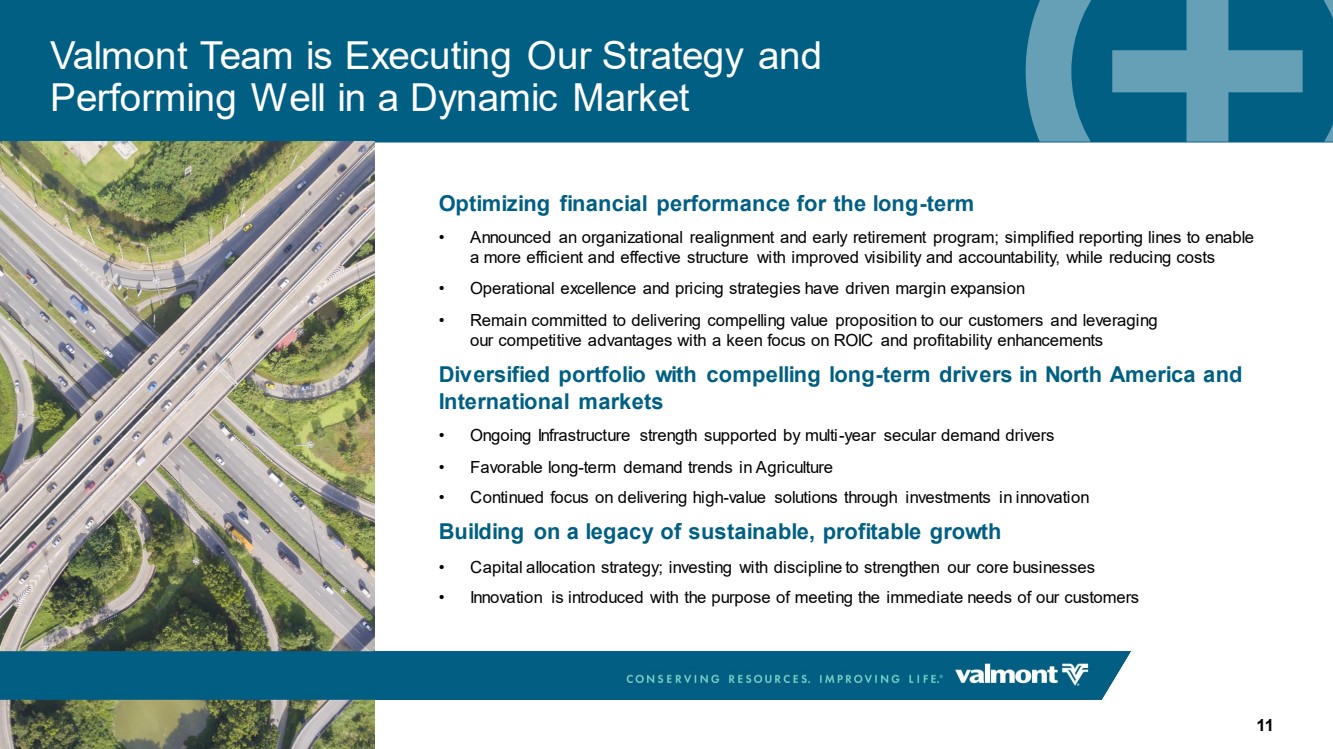
Valmont Team is Executing Our Strategy and Performing Well in a Dynamic Market Optimizing financial performance for the long-term • Announced an organizational realignment and early retirement program; simplified reporting lines to enable a more efficient and effective structure with improved visibility and accountability, while reducing costs • Operational excellence and pricing strategies have driven margin expansion • Remain committed to delivering compelling value proposition to our customers and leveraging our competitive advantages with a keen focus on ROIC and profitability enhancements Diversified portfolio with compelling long-term drivers in North America and International markets • Ongoing Infrastructure strength supported by multi-year secular demand drivers • Favorable long-term demand trends in Agriculture • Continued focus on delivering high-value solutions through investments in innovation Building on a legacy of sustainable, profitable growth • Capital allocation strategy; investing with discipline to strengthen our core businesses • Innovation is introduced with the purpose of meeting the immediate needs of our customers 11 |
|
Appendix |
|
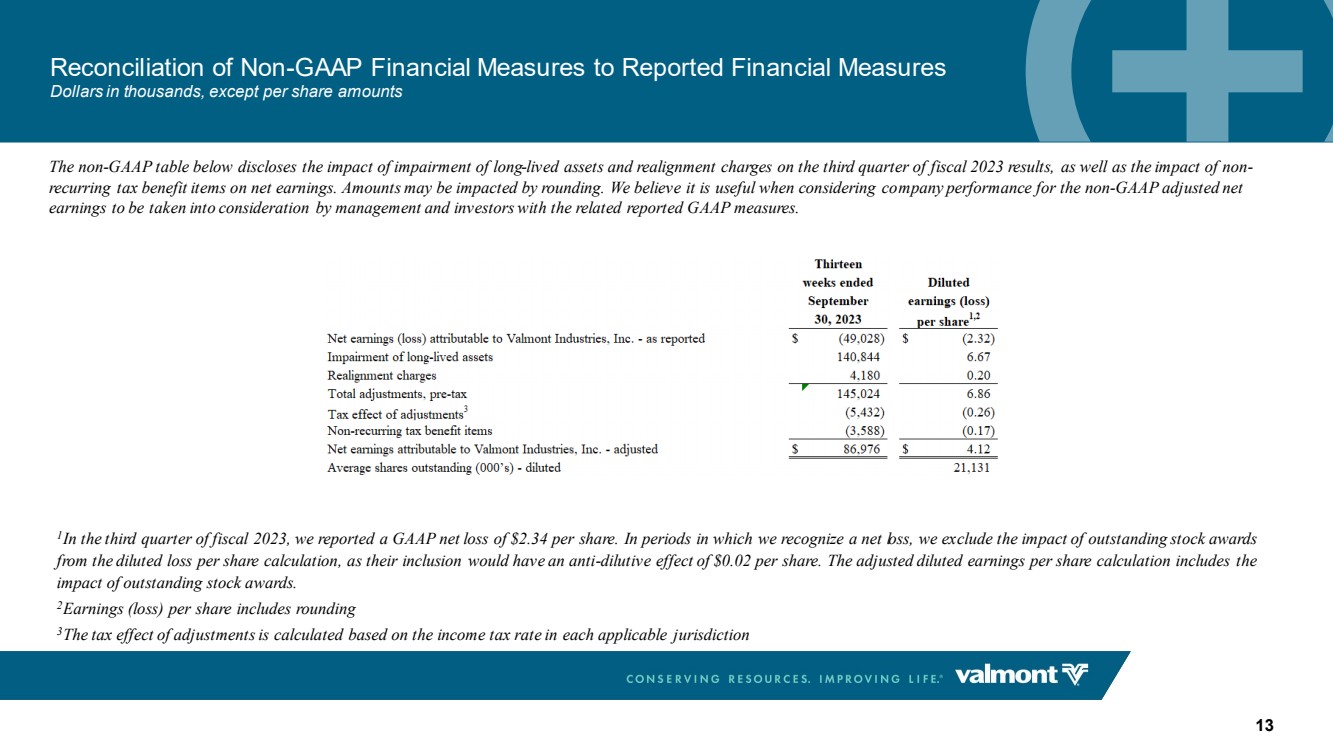
The non-GAAP table below discloses the impact of impairment of long-lived assets and realignment charges on the third quarter of fiscal 2023 results, as well as the impact of non-recurring tax benefit items on net earnings. Amounts may be impacted by rounding. We believe it is useful when considering company performance for the non-GAAP adjusted net earnings to be taken into consideration by management and investors with the related reported GAAP measures. Reconciliation of Non-GAAP Financial Measures to Reported Financial Measures Dollars in thousands, except per share amounts 13 1 In the third quarter of fiscal 2023, we reported a GAAP net loss of $2.34 per share. In periods in which we recognize a net loss, we exclude the impact of outstanding stock awards from the diluted loss per share calculation, as their inclusion would have an anti-dilutive effect of $0.02 per share. The adjusted diluted earnings per share calculation includes the impact of outstanding stock awards. 2Earnings (loss) per share includes rounding 3The tax effect of adjustments is calculated based on the income tax rate in each applicable jurisdiction |
|
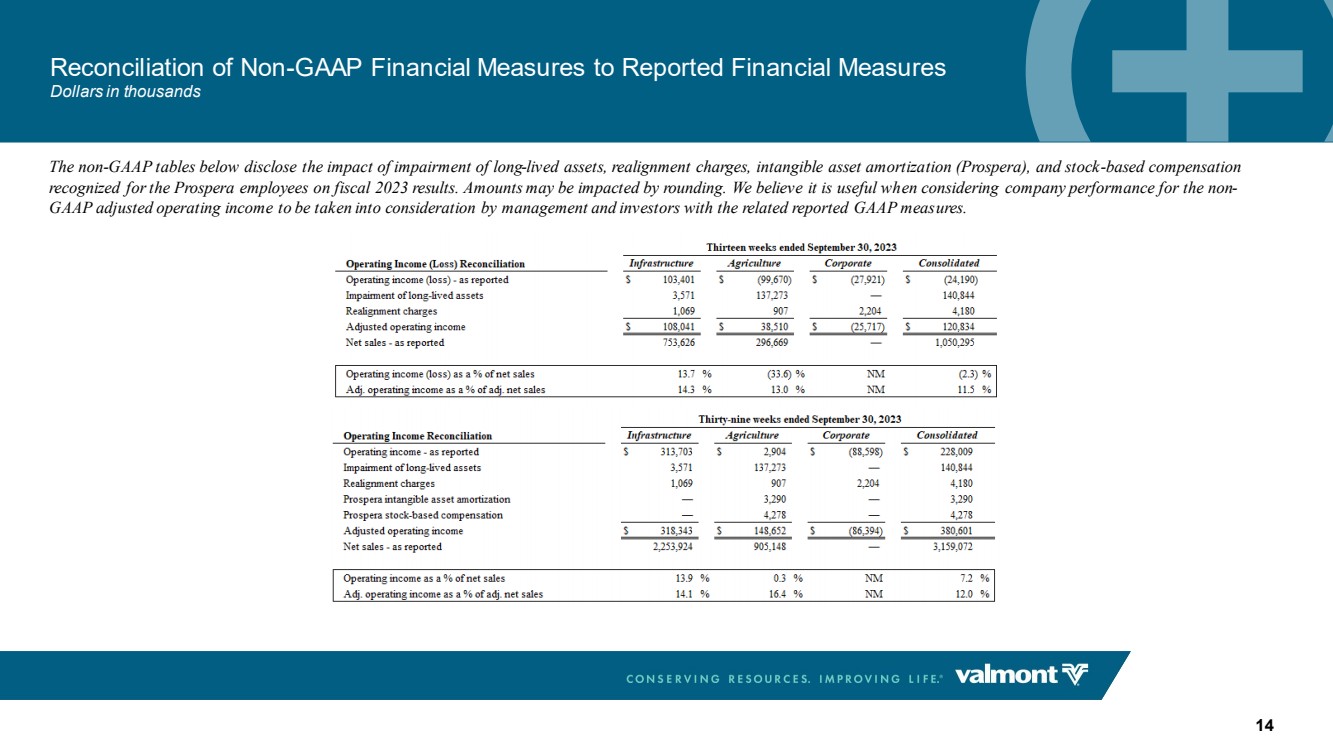
Reconciliation of Non-GAAP Financial Measures to Reported Financial Measures Dollars in thousands 14 The non-GAAP tables below disclose the impact of impairment of long-lived assets, realignment charges, intangible asset amortization (Prospera), and stock-based compensation recognized for the Prospera employees on fiscal 2023 results. Amounts may be impacted by rounding. We believe it is useful when considering company performance for the non-GAAP adjusted operating income to be taken into consideration by management and investors with the related reported GAAP measures. |
|
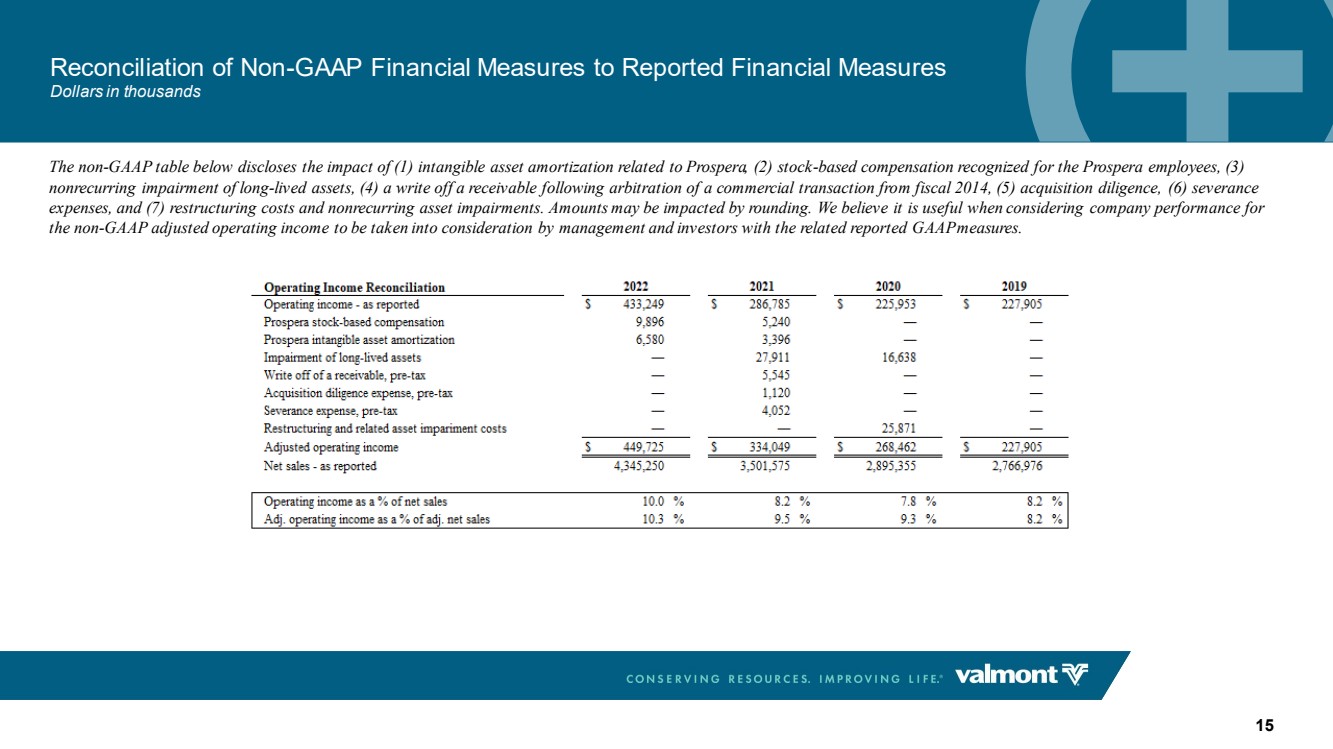
Reconciliation of Non-GAAP Financial Measures to Reported Financial Measures Dollars in thousands 15 The non-GAAP table below discloses the impact of (1) intangible asset amortization related to Prospera, (2) stock-based compensation recognized for the Prospera employees, (3) nonrecurring impairment of long-lived assets, (4) a write off a receivable following arbitration of a commercial transaction from fiscal 2014, (5) acquisition diligence, (6) severance expenses, and (7) restructuring costs and nonrecurring asset impairments. Amounts may be impacted by rounding. We believe it is useful when considering company performance for the non-GAAP adjusted operating income to be taken into consideration by management and investors with the related reported GAAPmeasures. |
|
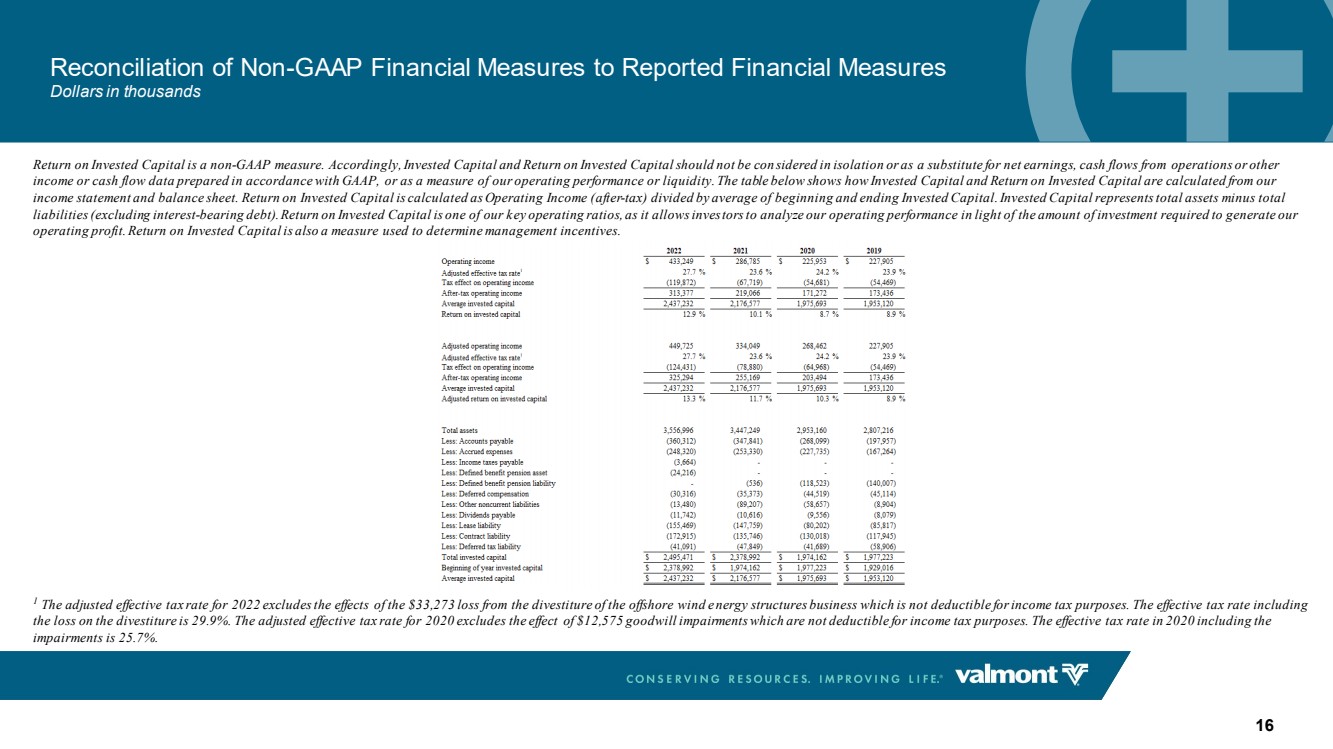
Reconciliation of Non-GAAP Financial Measures to Reported Financial Measures Dollars in thousands 16 Return on Invested Capital is a non-GAAP measure. Accordingly, Invested Capital and Return on Invested Capital should not be con sidered in isolation or as a substitute for net earnings, cash flows from operations or other income or cash flow data prepared in accordance with GAAP, or as a measure of our operating performance or liquidity. The table below shows how Invested Capital and Return on Invested Capital are calculated from our income statement and balance sheet. Return on Invested Capital is calculated as Operating Income (after-tax) divided by average of beginning and ending Invested Capital. Invested Capital represents total assets minus total liabilities (excluding interest-bearing debt). Return on Invested Capital is one of our key operating ratios, as it allows investors to analyze our operating performance in light of the amount of investment required to generate our operating profit. Return on Invested Capital is also a measure used to determine management incentives. 1 The adjusted effective tax rate for 2022 excludes the effects of the $33,273 loss from the divestiture of the offshore wind energy structures business which is not deductible for income tax purposes. The effective tax rate including the loss on the divestiture is 29.9%. The adjusted effective tax rate for 2020 excludes the effect of $12,575 goodwill impairments which are not deductible for income tax purposes. The effective tax rate in 2020 including the impairments is 25.7%. |