UNITED STATES
SECURITIES AND EXCHANGE COMMISSION
Washington, D.C. 20549
FORM 8-K
CURRENT REPORT
Pursuant to Section 13 OR 15(d) of The Securities Exchange Act of 1934
July 26, 2023
Date of Report (date of earliest event reported)
Valmont Industries, Inc.
(Exact name of registrant as specified in its charter)
Delaware
(State or other jurisdiction of incorporation)
1-31429 |
47-0351813 |
|
(Commission File Number) |
|
(I.R.S. Employer Identification No.) |
|
|
|
15000 Valmont Plaza |
|
68154 |
Omaha NE |
|
|
(Address of Principal Executive Offices) |
|
(Zip Code) |
(402) 963-1000
Registrant's telephone number, including area code
(Former name or former address, if changed since last report.)
Check the appropriate box below if the Form 8-K filing is intended to simultaneously satisfy the filing obligation of the registrant under any of the following provisions (see General Instruction A.2. below):
☐ Written communications pursuant to Rule 425 under the Securities Act (17 CFR 230.425)
☐ Soliciting material pursuant to Rule 14a-12 under the Exchange Act (17 CFR 240.14a-12)
☐ Pre-commencement communications pursuant to Rule 14d-2(b) under the Exchange Act (17 CFR 240.14d-2(b))
☐ Pre-commencement communications pursuant to Rule 13e-4(c) under the Exchange Act (17 CFR 240.13e-4(c))
Securities registered pursuant to Section 12(b) of the Act:
Title of each class |
|
Trading Symbol(s) |
|
Name of each exchange on which registered |
Common Stock, $1.00 par value |
|
VMI |
|
New York Stock Exchange |
Indicate by check mark whether the registrant is an emerging growth company as defined in Rule 405 of the Securities Act of 1933 (§230.405 of this chapter) or Rule 12b-2 of the Securities Exchange Act of 1934 (§240.12b-2 of this chapter).
Emerging growth company ☐
If an emerging growth company, indicate by check mark if the registrant has elected not to use the extended transition period for complying with any new or revised financial accounting standards provided pursuant to Section 13(a) of the Exchange Act.
☐
Item 2.02. Results of Operations and Financial Condition.
Valmont Industries, Inc. issued a press release on July 26, 2023 announcing its financial results for its fiscal quarter ended July 1, 2023. The press release, along with the presentation to be used during its earnings call on July 27, 2023, are furnished with this Form 8-K as Exhibit 99.1 and Exhibit 99.2, respectively.
The information in this Item 2.02 is being furnished and shall not be deemed “filed” for the purpose of Section 18 of the Securities Exchange Act of 1934, as amended, or otherwise subject to the liabilities of that section. The information in this Item 2.02 shall not be incorporated by reference into any registration statement or other document pursuant to the Securities Act of 1933, as amended.
Item 9.01. Financial Statements and Exhibits.
(d) Exhibits.
Exhibit No. |
|
Description |
|
Press Release dated July 26, 2023 |
|
|
Presentation Slides for earnings call on July 27, 2023 |
|
104 |
|
Cover Page Interactive File (the cover page XBRL tags are embedded in the Inline XBRL document) |
SIGNATURES
Pursuant to the requirements of the Securities Exchange Act of 1934, the registrant has duly caused this report to be signed on its behalf by the undersigned hereunto duly authorized.
|
|
Valmont Industries, Inc. |
||
Date: |
July 26, 2023 |
|
|
|
|
By: |
/s/ TIMOTHY P. FRANCIS |
||
|
|
Name: |
Timothy P. Francis |
|
|
|
Title: |
Interim Chief Financial Officer |
|

Exhibit 99.1
|
FOR IMMEDIATE RELEASE |
||
|
|
|
|
Contact: |
Renee Campbell |
|
|
Email: |
renee.campbell@valmont.com |
|
|
Date: |
July 26, 2023 |
|
|
Valmont Reports Second Quarter 2023 Results
Expands Operating Margins, Delivers Record Earnings per Share
Omaha, NE - Valmont Industries, Inc. (NYSE: VMI), a global leader that provides vital infrastructure and advances agricultural productivity while driving innovation through technology, today reported financial results for the second quarter ended July 1, 2023.
Second Quarter 2023 Highlights (all metrics compared to Second Quarter 2022 unless otherwise noted)
| ● | Net Sales of $1.0 billion decreased 7.9%; accounting for the 2022 divestiture of the offshore wind energy structures business, reported in the “Other” segment, Net Sales decreased 5.7%1 |
| ● | Operating Income increased 12.6% to $133.7 million, or 12.8% of net sales (increased 12.0% to $137.6 million or 13.2% adjusted1) compared to $118.7 million or 10.5% of net sales ($122.9 million or 11.1% adjusted1) |
| ● | Diluted Earnings per Share (“EPS”) grew to $4.21 ($4.37 adjusted1) compared to $3.53 ($3.70 adjusted1) |
| ● | Generated solid operating cash flows of $88.3 million in the second quarter and $109.5 million year-to-date; cash and cash equivalents at the end of the second quarter were $166.9 million |
| ● | Returned $36.6 million to shareholders through dividends and share repurchases including repurchasing 85,300 shares of Company stock for $24.0 million |
| ● | Recognized a more favorable effective tax rate of 26.4% driven by the geographic mix of earnings |
| ● | Released the Valmont 2023 Sustainability Report and enhanced the Company's dedicated Sustainability website while updating key disclosures and highlighting Valmont products and solutions that support ESG principles |
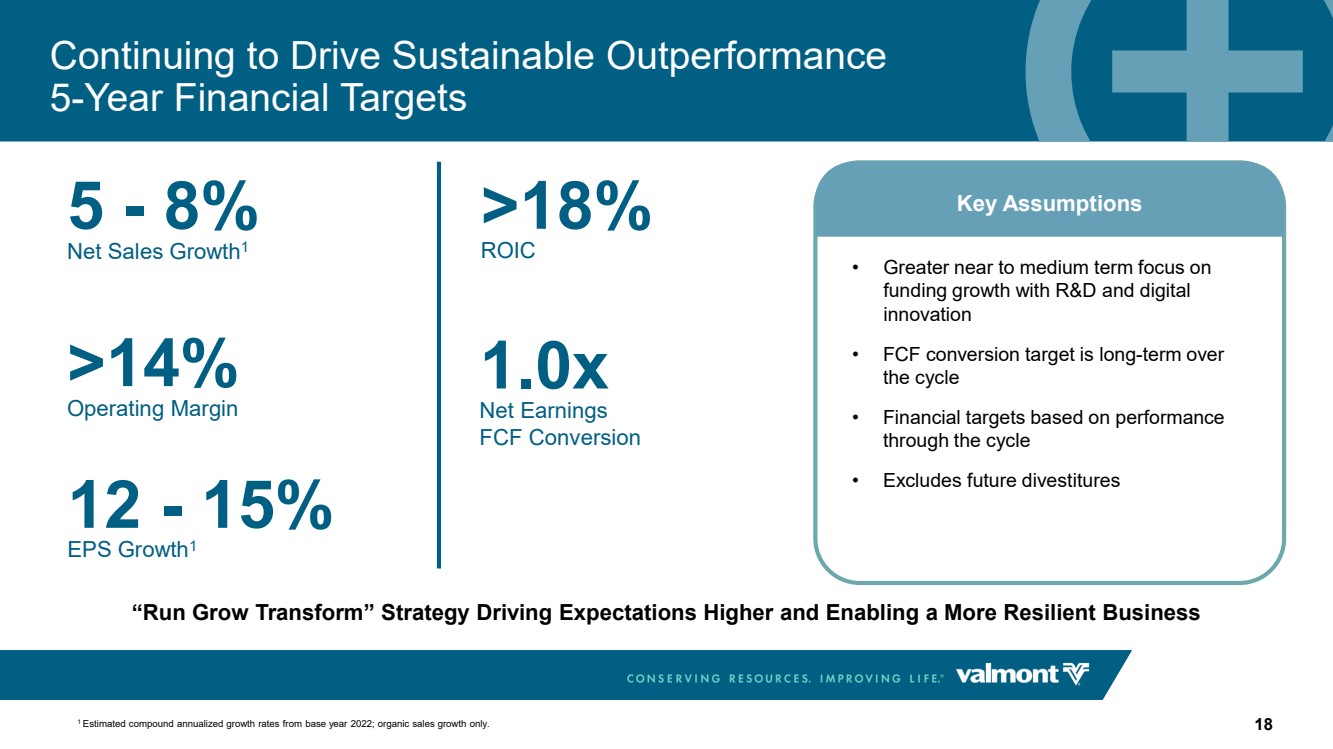
| ● | Hosted an Investor Day at the New York Stock Exchange, introducing a refreshed strategy and a new “Run Grow Transform” strategic framework to deliver sustainable outperformance, including updated 5-year financial targets (from base year 2022): |
| o | Net Sales Growth (organic) of 5% - 8% |
| o | Operating Margin of >14% |
| o | EPS Compound Annual Growth Rate of 12% - 15% |
| o | Return on Invested Capital of >18% |
| o | Free Cash Flow Conversion of 1.0x Net Earnings (over the 5-year period) |
1Please see Reg G reconciliation to GAAP measures at end of document
| ● | Providing updated 2023 full-year net sales growth outlook while maintaining diluted earnings per share outlook |
Key Financial Metrics
Second Quarter 2023 |
|
GAAP |
|
Adjusted1 |
|
|||||||||||||
(000's except per share amounts) |
|
07/01/2023 |
|
06/25/2022 |
|
|
|
|
07/01/2023 |
|
06/25/2022 |
|
|
|
||||
|
|
Q2 2023 |
|
Q2 2022 |
|
vs. Q2 2022 |
|
|
Q2 2023 |
|
Q2 2022 |
|
vs. Q2 2022 |
|
||||
Net Sales |
|
$ |
1,046,296 |
|
$ |
1,135,532 |
|
(7.9) |
% |
|
$ |
1,046,296 |
|
$ |
1,110,100 |
|
(5.7) |
% |
Operating Income |
|
|
133,733 |
|
|
118,719 |
|
12.6 |
% |
|
|
137,642 |
|
|
122,859 |
|
12.0 |
% |
Operating Income as a % of Net Sales |
|
|
12.8 |
% |
|
10.5 |
% |
|
|
|
|
13.2 |
% |
|
11.1 |
% |
|
|
Net Earnings |
|
|
89,376 |
|
|
76,108 |
|
17.4 |
% |
|
|
92,739 |
|
|
79,682 |
|
16.4 |
% |
Diluted Earnings Per Share |
|
$ |
4.21 |
|
$ |
3.53 |
|
19.3 |
% |
|
$ |
4.37 |
|
$ |
3.70 |
|
18.1 |
% |
Average Shares Outstanding |
|
|
21,229 |
|
|
21,541 |
|
|
|
|
|
21,229 |
|
|
21,541 |
|
|
|
Year-to-Date 2023 |
|
GAAP |
|
Adjusted1 |
|
|||||||||||||
(000's except per share amounts) |
|
07/01/2023 |
|
06/25/2022 |
|
|
|
|
07/01/2023 |
|
06/25/2022 |
|
|
|
||||
|
|
FY 2023 |
|
FY 2022 |
|
vs. FY 2022 |
|
|
FY 2023 |
|
FY 2022 |
|
vs. FY 2022 |
|
||||
Net Sales |
|
$ |
2,108,777 |
|
$ |
2,116,352 |
|
(0.4) |
% |
|
$ |
2,108,777 |
|
$ |
2,072,266 |
|
1.8 |
% |
Operating Income |
|
|
252,199 |
|
|
213,561 |
|
18.1 |
% |
|
|
259,767 |
|
|
221,844 |
|
17.1 |
% |
Operating Income as a % of Net Sales |
|
|
12.0 |
% |
|
10.1 |
% |
|
|
|
|
12.3 |
% |
|
10.7 |
% |
|
|
Net Earnings |
|
|
163,916 |
|
|
138,419 |
|
18.4 |
% |
|
|
170,392 |
|
|
145,570 |
|
17.1 |
% |
Diluted Earnings Per Share |
|
$ |
7.67 |
|
$ |
6.43 |
|
19.3 |
% |
|
$ |
7.97 |
|
$ |
6.77 |
|
17.7 |
% |
Average Shares Outstanding |
|
|
21,370 |
|
|
21,516 |
|
|
|
|
|
21,370 |
|
|
21,516 |
|
|
|
President and Chief Executive Officer Avner M. Applbaum commented, “We delivered another quarter of strong performance, expanding operating margins in both segments and achieving record earnings per share, demonstrating the resiliency of our portfolio, value-based pricing and operational excellence strategies. I’m very pleased with the solid execution by our global teams and our ability to maintain disciplined pricing strategies across the portfolio, despite softer than expected demand in North America agriculture and telecommunications markets. As we look ahead to the remainder of the year, we remain committed to executing on our strategic framework while capitalizing on investments in growth and innovation with a firm commitment to long-term shareholder value creation opportunities across our global businesses.”
1Please see Reg G reconciliation to GAAP measures at end of document
Second Quarter 2023 Segment Review
Infrastructure (73.4% of Net Sales)
Products and solutions to serve the infrastructure markets of utility, solar, lighting, transportation, and telecommunications, along with coatings services to preserve metal products
Sales of $770.6 million grew 4.2% year-over-year. Sales growth was driven by favorable pricing globally, higher volumes, notably in the Solar and Transmission, Distribution, and Substation (“TD&S”) product lines, and sales from the ConcealFab acquisition, partially offset by lower Telecommunications volumes.
Operating Income improved to $116.0 million or 15.1% of net sales compared to $84.1 million or 11.4% of net sales in the second quarter of 2022, driven by favorable pricing with improved overall cost of goods sold.
Agriculture (26.6% of Net Sales)
Center pivot components and linear irrigation equipment for agricultural markets, including parts and tubular products; advanced technology solutions for precision agriculture
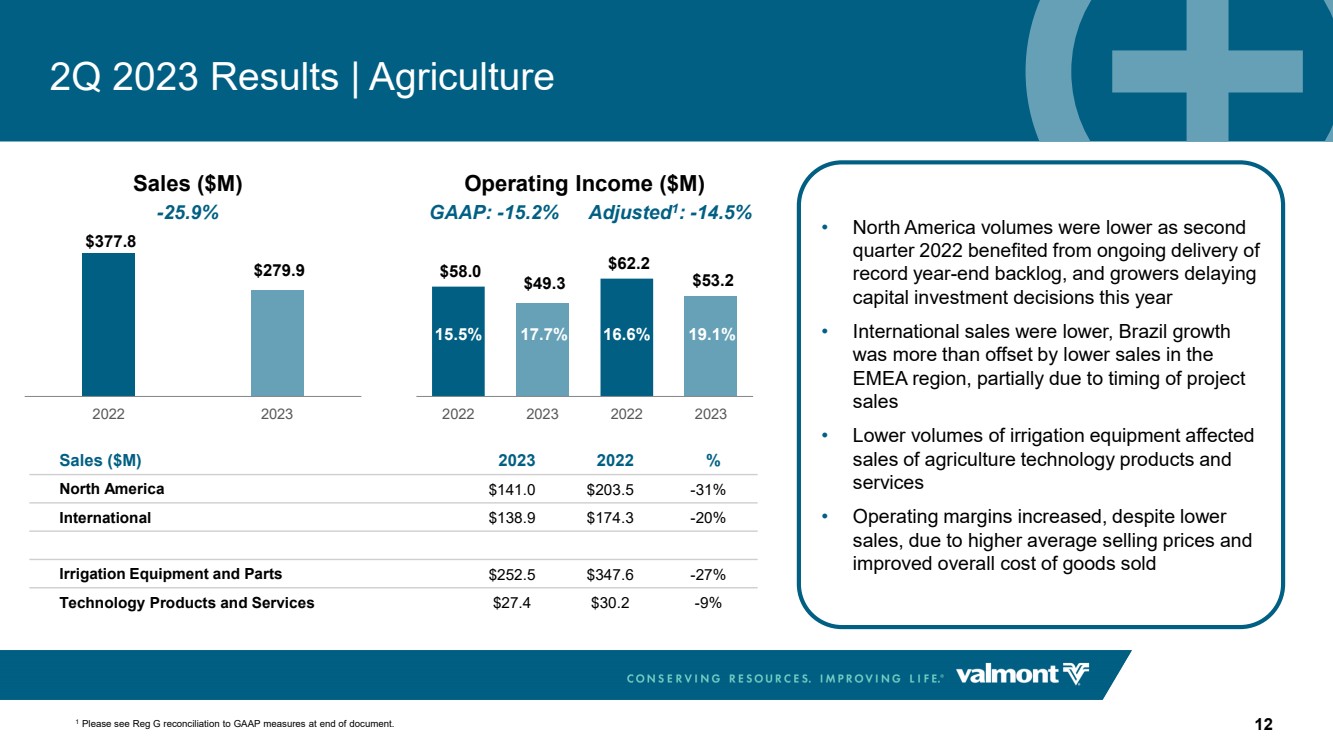
Sales of $279.9 million decreased 25.9% year-over-year. The benefit of higher average selling prices of irrigation equipment globally was more than offset by lower volumes. In North America, sales were lower as the second quarter of 2022 benefited from the ongoing delivery of record year-end backlog and growers delaying capital investment decisions in the quarter. International sales were lower as strong sales in Brazil were more than offset by lower sales in the EMEA region, partially due to timing of project sales. Sales of agriculture technology products and services globally were lower due to lower irrigation equipment volumes.
Operating Income decreased to $49.3 million or 17.7% of net sales ($53.2 million or 19.1% adjusted1) compared to $58.0 million or 15.5% of net sales ($62.2 million or 16.6% adjusted1) in the second quarter of 2022. Operating margin improvement was driven by favorable pricing and improved overall cost of goods sold, partially offset by higher SG&A, including incremental R&D expense for technology investments.
Other
Offshore wind energy structures business
As previously announced, the divestiture of the offshore wind energy structures business was completed in December 2022. In the second quarter of 2022, the subsequently-divested business generated sales of $25.4 million and operating income of $0.5 million.
Balance Sheet, Liquidity, and Capital Allocation
The Company generated solid second quarter 2023 operating cash flows of $88.3 million through strong earnings and effectively managing working capital. At the end of the second quarter, cash and cash equivalents were $166.9 million. During the quarter, Valmont repurchased $24.0 million of Company stock, with $346.3 million remaining on the share repurchase program.
1Please see Reg G reconciliation to GAAP measures at end of document
Updating 2023 Full Year Financial Outlook and Key Assumptions
Taking into consideration second quarter sales and record diluted earnings per share results, and the near-term demand outlook for North America agriculture and telecommunications markets, the Company is updating its full-year net sales growth outlook from the previous indications that were communicated last quarter and providing updated key assumptions for the year.
2023 Full Year Financial Outlook |
Previous Outlook |
Revised Outlook |
Net Sales Growth (vs. PY) |
4% to 7% |
0% to 2% |
GAAP Diluted Earnings per Share |
$14.80 to $15.35 |
No Change |
Adjusted Diluted Earnings per Share1 |
$15.45 to $16.00 |
No Change |
| ● | Expect full-year operating margin improvement compared to 2022 |
| ● | 2022 sales include $100 million from the offshore wind energy structures business which was divested at the end of fiscal 2022 |
| ● | Effective tax rate of 28% to 29%, primarily due to expected geographic mix of earnings |
| ● | Minimal expected foreign currency translation impact to net sales |
| ● | Capital expenditures expected to be in the range of $105 to $115 million to support strategic growth and digital transformation initiatives |
Applbaum continued, “We remain excited in our ability to drive multi-year profitable growth by capitalizing on the strong market drivers across our businesses, despite near-term softness in some markets. In the Infrastructure segment, the long-term need for critical investment globally is supporting multi-year market growth trends. Our backlog remains strong, reflecting the overall robust demand for our products and the trust our customers place in us to solve their most pressing infrastructure needs. We expect continued near-term softness in telecommunications markets as we are seeing capex spending by wireless carriers more aligned with historical trends following record levels of investment. In Agriculture, while market fundamentals remain positive, including projections of historically-high net farm income levels in the U.S., we are expecting modestly lower sales in North America in the second half of the year compared to the first half as growers continue to take a wait-and-see approach to purchasing decisions. The outcomes of the fall harvest should provide more clarity on farmer sentiment and expected buying patterns. International agriculture market demand remains strong driven by a robust project pipeline and continued sales growth in Brazil, supported by the recently-announced government financing program. Therefore, for the balance of the year, we expect international sales growth to more than offset any softness in North America, demonstrating the resilience of our increasingly diverse end markets. We continue to expect profitable growth across the portfolio, with full-year 2023 adjusted operating margins expected to approach 12%, driven by solid execution and supported by a backlog of approximately $1.5 billion. The operating margin improvement, along with a strong second quarter, supports maintaining our full-year earnings per share outlook. The organization is performing well, and our balance sheet remains strong, providing us with ample liquidity to support our capital allocation deployment strategy. We are confident in our ability to achieve our strategic objectives and deliver on our long-term financial targets, creating sustainable shareholder value.”
1Please see Reg G reconciliation to GAAP measures at end of document
A live audio discussion with Avner M. Applbaum, President and Chief Executive Officer, and Timothy P. Francis, Interim Chief Financial Officer, will be accessible by telephone on Thursday, July 27, 2023 at 8:00 a.m. CDT by dialing 1-877-407-6184 or 1-201-389-0877 (no Conference ID needed), or via webcast by pointing browsers to this link: Valmont Industries 2Q 2023 Earnings Conference Call. A slide presentation will simultaneously be available for download on the Investors page of valmont.com. A replay of the event can be accessed three hours after the call at the above link or by telephone at 1-877-660-6853 or 1-201-612-7415. Please use access code 13734764. The replay will be available through 10:59 p.m. CDT on Thursday, August 3, 2023.
About Valmont Industries, Inc.
For over 75 years, Valmont® has been a global leader in creating vital infrastructure and advancing agricultural productivity. Today, we remain committed to doing more with less by innovating through technology. Learn more about how we’re Conserving Resources. Improving Life.® at valmont.com.
Concerning Forward-Looking Statements
This release contains forward-looking statements, within the meaning of the Private Securities Litigation Reform Act of 1995. These forward-looking statements are based on assumptions that management has made in light of experience in the industries in which Valmont operates, as well as management’s perceptions of historical trends, current conditions, expected future developments and other factors believed to be appropriate under the circumstances. As you read and consider this release, you should understand that these statements are not guarantees of performance or results. They involve risks, uncertainties (some of which are beyond Valmont’s control) and assumptions. Although management believes that these forward-looking statements are based on reasonable assumptions, you should be aware that many factors could affect Valmont’s actual financial results and cause them to differ materially from those anticipated in the forward-looking statements. These factors include among other things, the continuing and developing effects of the pandemic including the effects of the outbreak on the general economy and the specific economic effects on the Company’s business and that of its customers and suppliers, risk factors described from time to time in Valmont’s reports to the Securities and Exchange Commission, as well as future economic and market circumstances, industry conditions, company performance and financial results, operating efficiencies, availability and price of raw material, availability and market acceptance of new products, product pricing, domestic and international competitive environments, geopolitical risks, and actions and policy changes of domestic and foreign governments. The Company cautions that any forward-looking statement included in this press release is made as of the date of this press release and the Company does not undertake to update any forward-looking statement.
###
1Please see Reg G reconciliation to GAAP measures at end of document
VALMONT INDUSTRIES, INC. AND SUBSIDIARIES
CONDENSED CONSOLIDATED STATEMENTS OF EARNINGS
(Dollars in thousands, except per share amounts)
(Unaudited)
|
|
Thirteen weeks ended |
|
Twenty-six weeks ended |
||||||||
|
|
July 1, |
|
June 25, |
|
July 1, |
|
June 25, |
||||
|
|
2023 |
|
2022 |
|
2023 |
|
2022 |
||||
Net sales |
|
$ |
1,046,296 |
|
$ |
1,135,532 |
|
$ |
2,108,777 |
|
$ |
2,116,352 |
Cost of sales |
|
|
716,899 |
|
|
842,931 |
|
|
1,470,795 |
|
|
1,574,565 |
Gross profit |
|
|
329,397 |
|
|
292,601 |
|
|
637,982 |
|
|
541,787 |
Selling, general, and administrative expenses |
|
|
195,664 |
|
|
173,882 |
|
|
385,783 |
|
|
328,226 |
Operating income |
|
|
133,733 |
|
|
118,719 |
|
|
252,199 |
|
|
213,561 |
Other income (expense) |
|
|
|
|
|
|
|
|
|
|
|
|
Interest expense |
|
|
(14,917) |
|
|
(11,386) |
|
|
(28,022) |
|
|
(22,649) |
Interest income |
|
|
563 |
|
|
285 |
|
|
1,393 |
|
|
512 |
Gain (loss) on investments - unrealized |
|
|
941 |
|
|
(2,342) |
|
|
2,135 |
|
|
(3,405) |
Other |
|
|
612 |
|
|
2,073 |
|
|
(1,764) |
|
|
5,715 |
Other income (expense), net |
|
|
(12,801) |
|
|
(11,370) |
|
|
(26,258) |
|
|
(19,827) |
Earnings before income taxes |
|
|
120,932 |
|
|
107,349 |
|
|
225,941 |
|
|
193,734 |
Income tax expense |
|
|
31,935 |
|
|
29,587 |
|
|
63,778 |
|
|
52,708 |
Equity in loss of nonconsolidated subsidiaries |
|
|
(199) |
|
|
(555) |
|
|
(1,020) |
|
|
(913) |
Net earnings |
|
|
88,798 |
|
|
77,207 |
|
|
161,143 |
|
|
140,113 |
Loss (earnings) attributable to non-controlling interests |
|
|
578 |
|
|
(1,099) |
|
|
2,773 |
|
|
(1,694) |
Net earnings attributable to Valmont Industries, Inc. |
|
$ |
89,376 |
|
$ |
76,108 |
|
$ |
163,916 |
|
$ |
138,419 |
|
|
|
|
|
|
|
|
|
|
|
|
|
Average shares outstanding (000's) - Basic |
|
|
21,029 |
|
|
21,313 |
|
|
21,149 |
|
|
21,296 |
Earnings per share - Basic |
|
$ |
4.25 |
|
$ |
3.57 |
|
$ |
7.75 |
|
$ |
6.50 |
|
|
|
|
|
|
|
|
|
|
|
|
|
Average shares outstanding (000's) - Diluted |
|
|
21,229 |
|
|
21,541 |
|
|
21,370 |
|
|
21,516 |
Earnings per share - Diluted |
|
$ |
4.21 |
|
$ |
3.53 |
|
$ |
7.67 |
|
$ |
6.43 |
|
|
|
|
|
|
|
|
|
|
|
|
|
Cash dividends per share |
|
$ |
0.60 |
|
$ |
0.55 |
|
$ |
1.20 |
|
$ |
1.10 |
VALMONT INDUSTRIES, INC. AND SUBSIDIARIES
SUMMARY OPERATING RESULTS
(Dollars in thousands)
(Unaudited)
|
|
Thirteen weeks ended |
|
Twenty-six weeks ended |
||||||||
|
|
July 1, |
|
June 25, |
|
July 1, |
|
June 25, |
||||
|
|
2023 |
|
2022 |
|
2023 |
|
2022 |
||||
Net sales |
|
|
|
|
|
|
|
|
|
|
|
|
Infrastructure |
|
$ |
770,595 |
|
$ |
739,518 |
|
$ |
1,506,701 |
|
$ |
1,401,590 |
Agriculture |
|
|
279,933 |
|
|
377,765 |
|
|
612,096 |
|
|
684,345 |
Other |
|
|
— |
|
|
25,432 |
|
|
— |
|
|
44,086 |
Total |
|
|
1,050,528 |
|
|
1,142,715 |
|
|
2,118,797 |
|
|
2,130,021 |
Less: Intersegment sales |
|
|
(4,232) |
|
|
(7,183) |
|
|
(10,020) |
|
|
(13,669) |
Total |
|
$ |
1,046,296 |
|
$ |
1,135,532 |
|
$ |
2,108,777 |
|
$ |
2,116,352 |
|
|
|
|
|
|
|
|
|
|
|
|
|
Operating Income (Loss) |
|
|
|
|
|
|
|
|
|
|
|
|
Infrastructure |
|
$ |
115,950 |
|
$ |
84,127 |
|
$ |
210,302 |
|
$ |
162,443 |
Agriculture |
|
|
49,251 |
|
|
58,046 |
|
|
102,574 |
|
|
95,521 |
Other |
|
|
— |
|
|
516 |
|
|
— |
|
|
(293) |
Corporate |
|
|
(31,468) |
|
|
(23,970) |
|
|
(60,677) |
|
|
(44,110) |
Total |
|
$ |
133,733 |
|
$ |
118,719 |
|
$ |
252,199 |
|
$ |
213,561 |
Valmont has aggregated its business segments into two global reportable segments, as follows.
Infrastructure: This segment consists of the manufacture and distribution of products and solutions to serve the infrastructure markets of utility, solar, lighting, transportation, and telecommunications, along with coatings services to preserve metal products.
Agriculture: This segment consists of the manufacture of center pivot components and linear irrigation equipment for agricultural markets, including parts and tubular products, and advanced technology solutions for precision agriculture.
In addition to these two reportable segments, the Company had a business and related activities in 2022 that were not more than 10% of consolidated sales, operating income, or assets. This comprised the offshore wind energy structures business which was reported in the “Other” segment until its divestiture in December 2022.
VALMONT INDUSTRIES, INC. AND SUBSIDIARIES
SUMMARY OPERATING RESULTS
(Dollars in thousands)
(Unaudited)
|
|
Thirteen weeks ended July 1, 2023 |
|||||||||||||
|
|
|
|
|
|
|
|
|
|
Intersegment |
|
|
|
||
|
|
Infrastructure |
|
Agriculture |
|
Other |
|
Sales |
|
Consolidated |
|||||
Geographical market: |
|
|
|
|
|
|
|
|
|
|
|
|
|
|
|
North America |
|
$ |
587,313 |
|
$ |
140,981 |
|
$ |
— |
|
$ |
(3,613) |
|
$ |
724,681 |
International |
|
|
183,282 |
|
|
138,952 |
|
|
— |
|
|
(619) |
|
|
321,615 |
Total |
|
$ |
770,595 |
|
$ |
279,933 |
|
$ |
— |
|
$ |
(4,232) |
|
$ |
1,046,296 |
|
|
|
|
|
|
|
|
|
|
|
|
|
|
|
|
Product line: |
|
|
|
|
|
|
|
|
|
|
|
|
|
|
|
Transmission, Distribution, and Substation |
|
$ |
314,307 |
|
$ |
— |
|
$ |
— |
|
$ |
— |
|
$ |
314,307 |
Lighting and Transportation |
|
|
246,123 |
|
|
— |
|
|
— |
|
|
— |
|
|
246,123 |
Coatings |
|
|
91,120 |
|
|
— |
|
|
— |
|
|
(1,818) |
|
|
89,302 |
Telecommunications |
|
|
67,738 |
|
|
— |
|
|
— |
|
|
— |
|
|
67,738 |
Solar |
|
|
51,307 |
|
|
— |
|
|
— |
|
|
(619) |
|
|
50,688 |
Irrigation Equipment and Parts |
|
|
— |
|
|
252,457 |
|
|
— |
|
|
(1,795) |
|
|
250,662 |
Technology Products and Services |
|
|
— |
|
|
27,476 |
|
|
— |
|
|
— |
|
|
27,476 |
Total |
|
$ |
770,595 |
|
$ |
279,933 |
|
$ |
— |
|
$ |
(4,232) |
|
$ |
1,046,296 |
|
|
Thirteen weeks ended June 25, 2022 |
|||||||||||||
|
|
|
|
|
|
|
|
|
|
Intersegment |
|
|
|
||
|
|
Infrastructure |
|
Agriculture |
|
Other |
|
Sales |
|
Consolidated |
|||||
Geographical market: |
|
|
|
|
|
|
|
|
|
|
|
|
|
|
|
North America |
|
$ |
559,864 |
|
$ |
203,488 |
|
$ |
— |
|
$ |
(6,716) |
|
$ |
756,636 |
International |
|
|
179,654 |
|
|
174,277 |
|
|
25,432 |
|
|
(467) |
|
|
378,896 |
Total |
|
$ |
739,518 |
|
$ |
377,765 |
|
$ |
25,432 |
|
$ |
(7,183) |
|
$ |
1,135,532 |
|
|
|
|
|
|
|
|
|
|
|
|
|
|
|
|
Product line: |
|
|
|
|
|
|
|
|
|
|
|
|
|
|
|
Transmission, Distribution, and Substation |
|
$ |
295,835 |
|
$ |
— |
|
$ |
— |
|
$ |
— |
|
$ |
295,835 |
Lighting and Transportation |
|
|
246,652 |
|
|
— |
|
|
— |
|
|
— |
|
|
246,652 |
Coatings |
|
|
90,321 |
|
|
— |
|
|
— |
|
|
(4,200) |
|
|
86,121 |
Telecommunications |
|
|
78,539 |
|
|
— |
|
|
— |
|
|
— |
|
|
78,539 |
Solar |
|
|
28,171 |
|
|
— |
|
|
25,432 |
|
|
— |
|
|
53,603 |
Irrigation Equipment and Parts |
|
|
— |
|
|
347,585 |
|
|
— |
|
|
(2,983) |
|
|
344,602 |
Technology Products and Services |
|
|
— |
|
|
30,180 |
|
|
— |
|
|
— |
|
|
30,180 |
Total |
|
$ |
739,518 |
|
$ |
377,765 |
|
$ |
25,432 |
|
$ |
(7,183) |
|
$ |
1,135,532 |
VALMONT INDUSTRIES, INC. AND SUBSIDIARIES
SUMMARY OPERATING RESULTS
(Dollars in thousands)
(Unaudited)
|
|
Twenty-six weeks ended July 1, 2023 |
|||||||||||||
|
|
|
|
|
|
|
|
|
|
Intersegment |
|
|
|
||
|
|
Infrastructure |
|
Agriculture |
|
Other |
|
Sales |
|
Consolidated |
|||||
Geographical market: |
|
|
|
|
|
|
|
|
|
|
|
|
|
|
|
North America |
|
$ |
1,171,396 |
|
$ |
323,850 |
|
$ |
— |
|
$ |
(8,987) |
|
$ |
1,486,259 |
International |
|
|
335,305 |
|
|
288,246 |
|
|
— |
|
|
(1,033) |
|
|
622,518 |
Total |
|
$ |
1,506,701 |
|
$ |
612,096 |
|
$ |
— |
|
$ |
(10,020) |
|
$ |
2,108,777 |
|
|
|
|
|
|
|
|
|
|
|
|
|
|
|
|
Product line: |
|
|
|
|
|
|
|
|
|
|
|
|
|
|
|
Transmission, Distribution, and Substation |
|
$ |
629,127 |
|
$ |
— |
|
$ |
— |
|
$ |
— |
|
$ |
629,127 |
Lighting and Transportation |
|
|
475,259 |
|
|
— |
|
|
— |
|
|
— |
|
|
475,259 |
Coatings |
|
|
181,234 |
|
|
— |
|
|
— |
|
|
(5,370) |
|
|
175,864 |
Telecommunications |
|
|
135,875 |
|
|
— |
|
|
— |
|
|
— |
|
|
135,875 |
Solar |
|
|
85,206 |
|
|
— |
|
|
— |
|
|
(1,033) |
|
|
84,173 |
Irrigation Equipment and Parts |
|
|
— |
|
|
551,638 |
|
|
— |
|
|
(3,617) |
|
|
548,021 |
Technology Products and Services |
|
|
— |
|
|
60,458 |
|
|
— |
|
|
— |
|
|
60,458 |
Total |
|
$ |
1,506,701 |
|
$ |
612,096 |
|
$ |
— |
|
$ |
(10,020) |
|
$ |
2,108,777 |
|
|
Twenty-six weeks ended June 25, 2022 |
|||||||||||||
|
|
|
|
|
|
|
|
|
|
Intersegment |
|
|
|
||
|
|
Infrastructure |
|
Agriculture |
|
Other |
|
Sales |
|
Consolidated |
|||||
Geographical market: |
|
|
|
|
|
|
|
|
|
|
|
|
|
|
|
North America |
|
$ |
1,065,844 |
|
$ |
385,743 |
|
$ |
— |
|
$ |
(13,202) |
|
$ |
1,438,385 |
International |
|
|
335,746 |
|
|
298,602 |
|
|
44,086 |
|
|
(467) |
|
|
677,967 |
Total |
|
$ |
1,401,590 |
|
$ |
684,345 |
|
$ |
44,086 |
|
$ |
(13,669) |
|
$ |
2,116,352 |
|
|
|
|
|
|
|
|
|
|
|
|
|
|
|
|
Product line: |
|
|
|
|
|
|
|
|
|
|
|
|
|
|
|
Transmission, Distribution, and Substation |
|
$ |
577,435 |
|
$ |
— |
|
$ |
— |
|
$ |
— |
|
$ |
577,435 |
Lighting and Transportation |
|
|
459,419 |
|
|
— |
|
|
— |
|
|
— |
|
|
459,419 |
Coatings |
|
|
172,297 |
|
|
— |
|
|
— |
|
|
(7,301) |
|
|
164,996 |
Telecommunications |
|
|
139,935 |
|
|
— |
|
|
— |
|
|
— |
|
|
139,935 |
Solar |
|
|
52,504 |
|
|
— |
|
|
44,086 |
|
|
— |
|
|
96,590 |
Irrigation Equipment and Parts |
|
|
— |
|
|
625,619 |
|
|
— |
|
|
(6,368) |
|
|
619,251 |
Technology Products and Services |
|
|
— |
|
|
58,726 |
|
|
— |
|
|
— |
|
|
58,726 |
Total |
|
$ |
1,401,590 |
|
$ |
684,345 |
|
$ |
44,086 |
|
$ |
(13,669) |
|
$ |
2,116,352 |
VALMONT INDUSTRIES, INC. AND SUBSIDIARIES
CONDENSED CONSOLIDATED BALANCE SHEETS
(Dollars in thousands)
(Unaudited)
|
|
July 1, |
|
December 31, |
||
|
|
2023 |
|
2022 |
||
ASSETS |
|
|
|
|
|
|
Current assets: |
|
|
|
|
|
|
Cash and cash equivalents |
|
$ |
166,907 |
|
$ |
185,406 |
Receivables, net |
|
|
651,133 |
|
|
604,181 |
Inventories |
|
|
729,738 |
|
|
728,762 |
Contract assets |
|
|
154,410 |
|
|
174,539 |
Prepaid expenses and other current assets |
|
|
99,994 |
|
|
87,697 |
Total current assets |
|
|
1,802,182 |
|
|
1,780,585 |
Property, plant, and equipment, net |
|
|
603,112 |
|
|
595,578 |
Goodwill and other non-current assets |
|
|
1,210,546 |
|
|
1,180,833 |
Total assets |
|
$ |
3,615,840 |
|
$ |
3,556,996 |
|
|
|
|
|
|
|
LIABILITIES AND SHAREHOLDERS' EQUITY |
|
|
|
|
|
|
Current liabilities: |
|
|
|
|
|
|
Current installments of long-term debt |
|
$ |
1,041 |
|
$ |
1,194 |
Notes payable to banks |
|
|
1,665 |
|
|
5,846 |
Accounts payable |
|
|
346,000 |
|
|
360,312 |
Accrued expenses |
|
|
240,499 |
|
|
248,320 |
Contract liabilities |
|
|
124,230 |
|
|
172,915 |
Income taxes payable |
|
|
23,152 |
|
|
3,664 |
Dividends payable |
|
|
12,607 |
|
|
11,742 |
Total current liabilities |
|
|
749,194 |
|
|
803,993 |
Long-term debt, excluding current installments |
|
|
952,704 |
|
|
870,935 |
Operating lease liabilities |
|
|
161,795 |
|
|
155,469 |
Other non-current liabilities |
|
|
81,855 |
|
|
84,887 |
Total liabilities |
|
|
1,945,548 |
|
|
1,915,284 |
Shareholders' equity |
|
|
1,670,292 |
|
|
1,641,712 |
Total liabilities and shareholders' equity |
|
$ |
3,615,840 |
|
$ |
3,556,996 |
VALMONT INDUSTRIES, INC. AND SUBSIDIARIES
CONDENSED CONSOLIDATED STATEMENTS OF CASH FLOWS
(Dollars in thousands)
(Unaudited)
|
|
Twenty-six weeks ended |
||||
|
|
July 1, |
|
June 25, |
||
|
|
2023 |
|
2022 |
||
Cash flows from operating activities: |
|
|
|
|
|
|
Net earnings |
|
$ |
161,143 |
|
$ |
140,113 |
Depreciation and amortization |
|
|
48,792 |
|
|
48,012 |
Contribution to defined benefit pension plan |
|
|
(15,259) |
|
|
(17,155) |
Gain on divestiture |
|
|
(2,994) |
|
|
— |
Change in working capital |
|
|
(98,979) |
|
|
(115,170) |
Other |
|
|
16,843 |
|
|
12,219 |
Net cash flows provided by operating activities |
|
|
109,546 |
|
|
68,019 |
|
|
|
|
|
|
|
Cash flows from investing activities: |
|
|
|
|
|
|
Purchase of property, plant, and equipment |
|
|
(45,393) |
|
|
(49,676) |
Proceeds from divestiture, net of cash divested |
|
|
6,369 |
|
|
— |
Proceeds from property damage insurance claims |
|
|
4,844 |
|
|
— |
Acquisitions |
|
|
— |
|
|
(39,297) |
Other |
|
|
134 |
|
|
1,162 |
Net cash flows used in investing activities |
|
|
(34,046) |
|
|
(87,811) |
|
|
|
|
|
|
|
Cash flows from financing activities: |
|
|
|
|
|
|
Proceeds from long-term borrowings |
|
|
165,012 |
|
|
201,462 |
Principal payments on long-term borrowings |
|
|
(84,105) |
|
|
(156,973) |
Net payments on short-term borrowings |
|
|
(4,693) |
|
|
(9,155) |
Purchase of treasury shares |
|
|
(135,115) |
|
|
(9,776) |
Dividends to noncontrolling interests |
|
|
(662) |
|
|
— |
Purchase of noncontrolling interests |
|
|
— |
|
|
(4,292) |
Dividends paid |
|
|
(24,376) |
|
|
(22,337) |
Other |
|
|
(10,215) |
|
|
1,641 |
Net cash flows (used in) provided by financing activities |
|
|
(94,154) |
|
|
570 |
Effect of exchange rates on cash and cash equivalents |
|
|
155 |
|
|
(3,431) |
Net change in cash and cash equivalents |
|
|
(18,499) |
|
|
(22,653) |
Cash and cash equivalents - beginning of year |
|
|
185,406 |
|
|
177,232 |
Cash and cash equivalents - end of period |
|
$ |
166,907 |
|
$ |
154,579 |
VALMONT INDUSTRIES, INC. AND SUBSIDIARIES
SUMMARY OF EFFECT OF ITEMS ON REPORTED RESULTS
REGULATION G RECONCILIATION
(Dollars in thousands, except per share amounts)
(Unaudited)
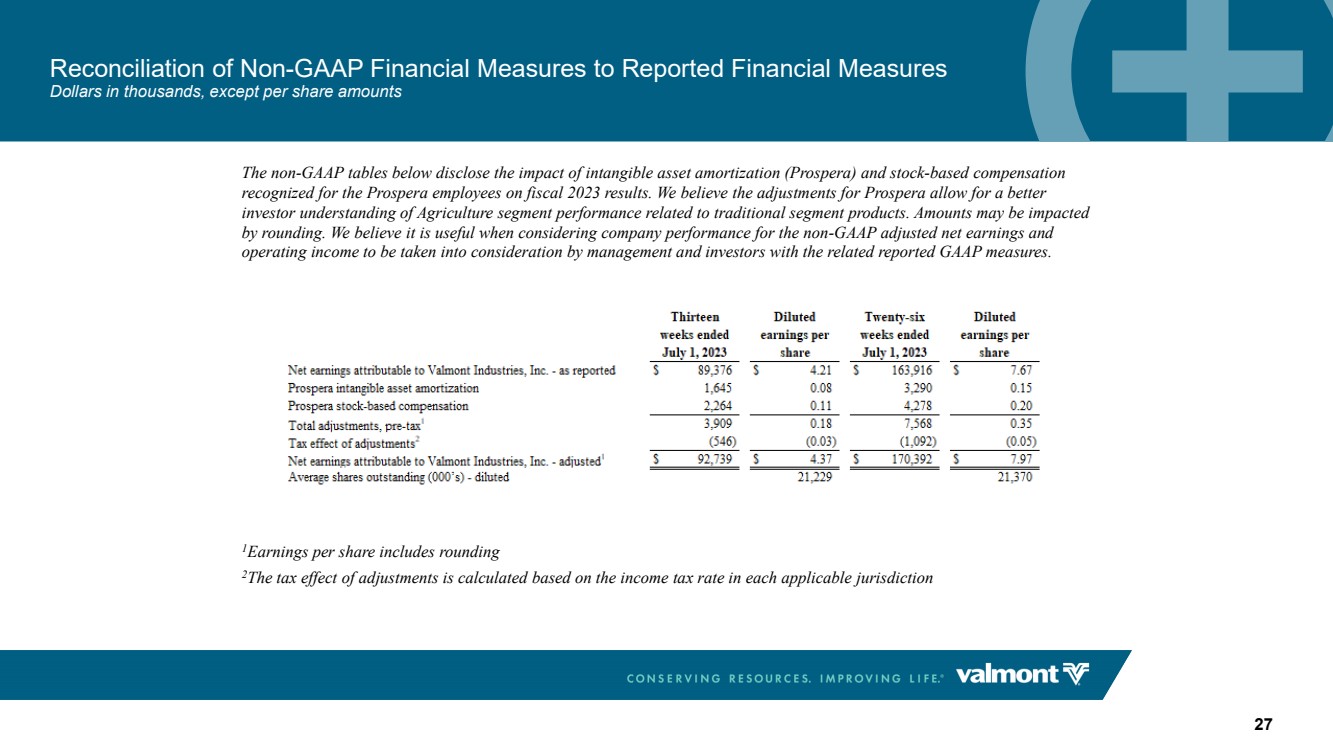
The non-GAAP tables below disclose the impact of intangible asset amortization (Prospera) and stock-based compensation recognized for the Prospera employees on fiscal 2023 and 2022 results. We believe the adjustments for Prospera allow for a better investor understanding of Agriculture segment performance related to traditional segment products. Amounts may be impacted by rounding. We believe it is useful when considering company performance for the non-GAAP adjusted net earnings and operating income to be taken into consideration by management and investors with the related reported GAAP measures.
|
|
Thirteen |
|
Diluted |
|
Twenty-six |
|
Diluted |
||||
|
|
weeks ended |
|
earnings per |
|
weeks ended |
|
earnings per |
||||
|
|
July 1, 2023 |
|
share |
|
July 1, 2023 |
|
share |
||||
Net earnings attributable to Valmont Industries, Inc. - as reported |
|
$ |
89,376 |
|
$ |
4.21 |
|
$ |
163,916 |
|
$ |
7.67 |
Prospera intangible asset amortization |
|
|
1,645 |
|
|
0.08 |
|
|
3,290 |
|
|
0.15 |
Prospera stock-based compensation |
|
|
2,264 |
|
|
0.11 |
|
|
4,278 |
|
|
0.20 |
Total adjustments, pre-tax1 |
|
|
3,909 |
|
|
0.18 |
|
|
7,568 |
|
|
0.35 |
Tax effect of adjustments2 |
|
|
(546) |
|
|
(0.03) |
|
|
(1,092) |
|
|
(0.05) |
Net earnings attributable to Valmont Industries, Inc. - adjusted1 |
|
$ |
92,739 |
|
$ |
4.37 |
|
$ |
170,392 |
|
$ |
7.97 |
Average shares outstanding (000’s) - diluted |
|
|
|
|
|
21,229 |
|
|
|
|
|
21,370 |
|
|
Thirteen |
|
Diluted |
|
Twenty-six |
|
Diluted |
||||
|
|
weeks ended |
|
earnings per |
|
weeks ended |
|
earnings per |
||||
|
|
June 25, 2022 |
|
share |
|
June 25, 2022 |
|
share |
||||
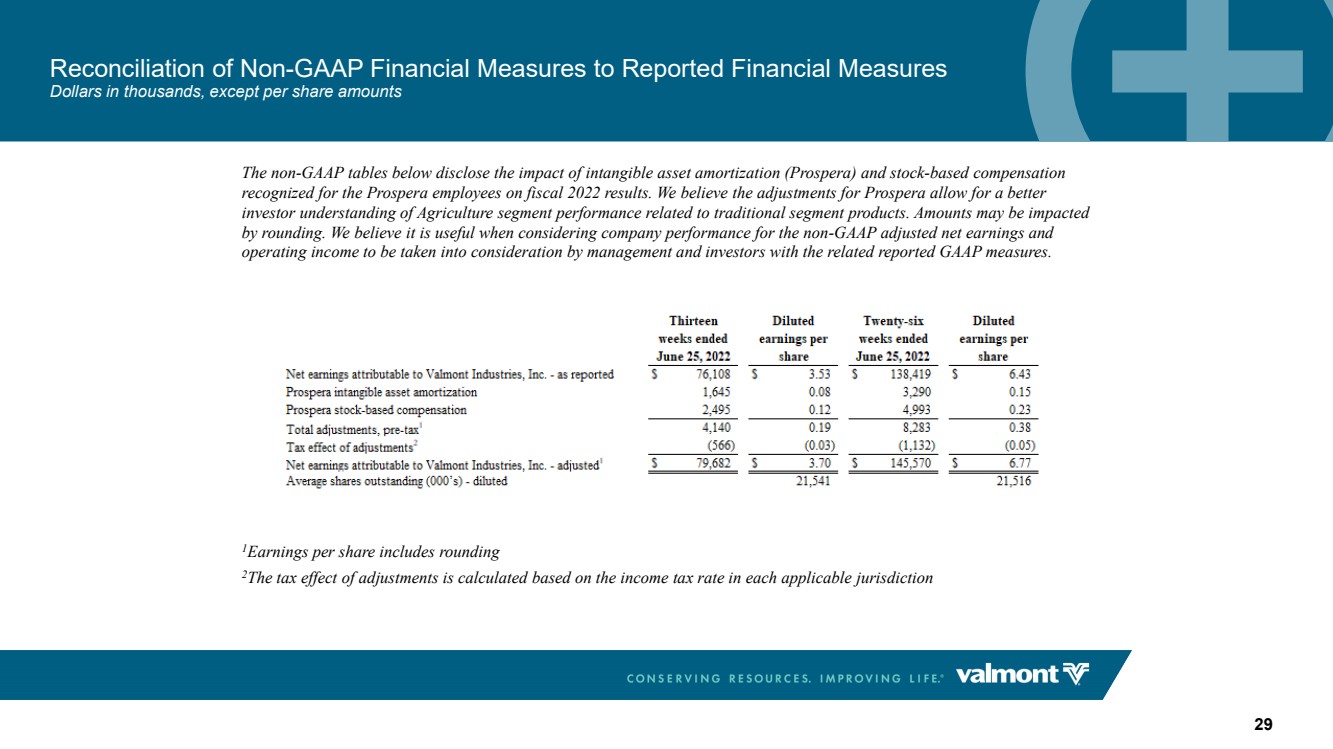
Net earnings attributable to Valmont Industries, Inc. - as reported |
|
$ |
76,108 |
|
$ |
3.53 |
|
$ |
138,419 |
|
$ |
6.43 |
Prospera intangible asset amortization |
|
|
1,645 |
|
|
0.08 |
|
|
3,290 |
|
|
0.15 |
Prospera stock-based compensation |
|
|
2,495 |
|
|
0.12 |
|
|
4,993 |
|
|
0.23 |
Total adjustments, pre-tax1 |
|
|
4,140 |
|
|
0.19 |
|
|
8,283 |
|
|
0.38 |
Tax effect of adjustments2 |
|
|
(566) |
|
|
(0.03) |
|
|
(1,132) |
|
|
(0.05) |
Net earnings attributable to Valmont Industries, Inc. - adjusted1 |
|
$ |
79,682 |
|
$ |
3.70 |
|
$ |
145,570 |
|
$ |
6.77 |
Average shares outstanding (000’s) - diluted |
|
|
|
|
|
21,541 |
|
|
|
|
|
21,516 |
1Earnings per share includes rounding
2The tax effect of adjustments is calculated based on the income tax rate in each applicable jurisdiction
VALMONT INDUSTRIES, INC. AND SUBSIDIARIES
SUMMARY OF EFFECT OF SIGNIFICANT NON-RECURRING ITEMS ON REPORTED RESULTS
REGULATION G RECONCILIATION
(Dollars in thousands, except per share amounts)
(Unaudited)
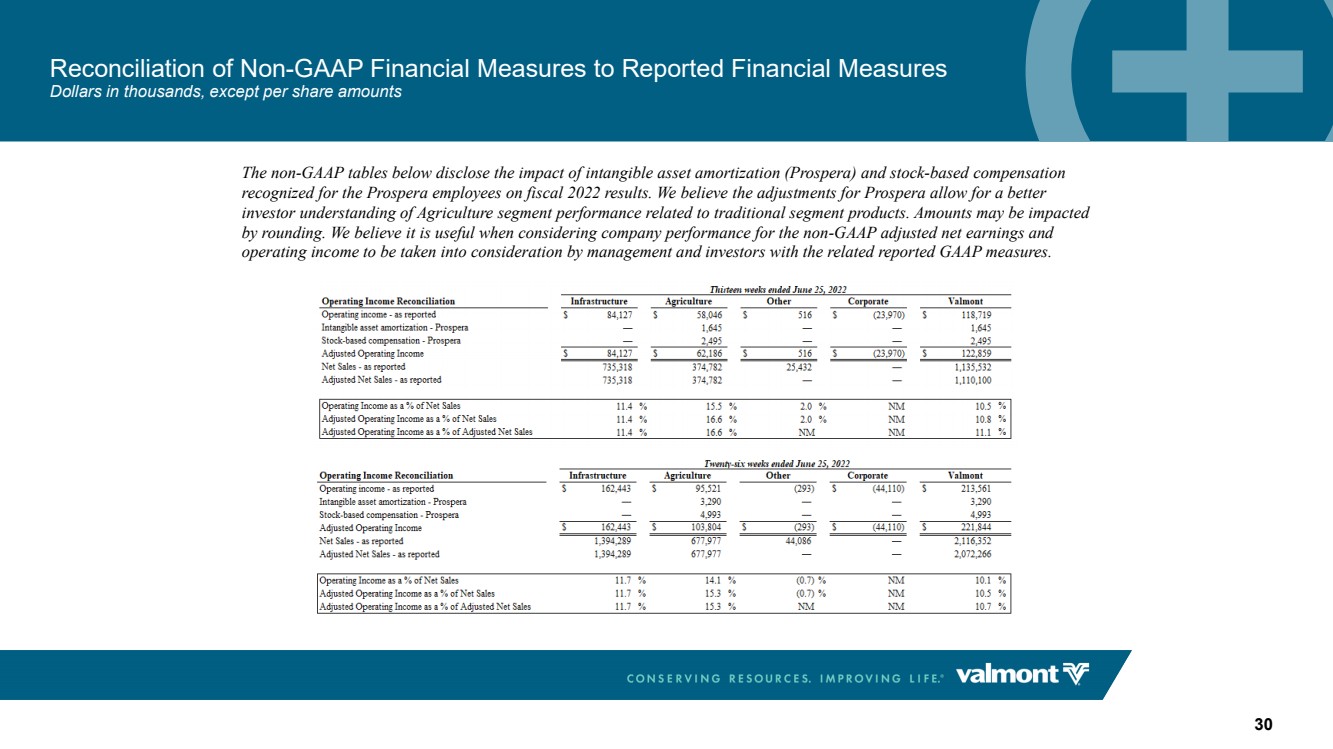
The non-GAAP tables below disclose the impact of intangible asset amortization (Prospera) and stock-based compensation recognized for the Prospera employees on fiscal 2023 and 2022 results. We believe the adjustments for Prospera allow for a better investor understanding of Agriculture segment performance related to traditional segment products. Amounts may be impacted by rounding. We believe it is useful when considering company performance for the non-GAAP adjusted net earnings and operating income to be taken into consideration by management and investors with the related reported GAAP measures.
|
|
Thirteen weeks ended July 1, 2023 |
|
|||||||||||||
Operating Income Reconciliation |
|
Infrastructure |
|
Agriculture |
|
Other |
|
Corporate |
|
Valmont |
||||||
Operating income - as reported |
|
$ |
115,950 |
|
$ |
49,251 |
|
$ |
— |
|
$ |
(31,468) |
|
$ |
133,733 |
|
Prospera intangible asset amortization |
|
|
— |
|
|
1,645 |
|
|
— |
|
|
— |
|
|
1,645 |
|
Prospera stock-based compensation |
|
|
— |
|
|
2,264 |
|
|
— |
|
|
— |
|
|
2,264 |
|
Adjusted operating income |
|
$ |
115,950 |
|
$ |
53,160 |
|
$ |
— |
|
$ |
(31,468) |
|
$ |
137,642 |
|
Net sales - as reported |
|
|
768,158 |
|
|
278,138 |
|
|
— |
|
|
— |
|
|
1,046,296 |
|
|
|
|
|
|
|
|
|
|
|
|
|
|
|
|
|
|
Operating income as a % of net sales |
|
|
15.1 |
% |
|
17.7 |
% |
|
NM |
|
|
NM |
|
|
12.8 |
% |
Adj. operating income as a % of net sales |
|
|
15.1 |
% |
|
19.1 |
% |
|
NM |
|
|
NM |
|
|
13.2 |
% |
|
|
Thirteen weeks ended June 25, 2022 |
|
|||||||||||||
Operating Income Reconciliation |
|
Infrastructure |
|
Agriculture |
|
Other |
|
Corporate |
|
Valmont |
||||||
Operating income - as reported |
|
$ |
84,127 |
|
$ |
58,046 |
|
$ |
516 |
|
$ |
(23,970) |
|
$ |
118,719 |
|
Prospera intangible asset amortization |
|
|
— |
|
|
1,645 |
|
|
— |
|
|
— |
|
|
1,645 |
|
Prospera stock-based compensation |
|
|
— |
|
|
2,495 |
|
|
— |
|
|
— |
|
|
2,495 |
|
Adjusted operating income |
|
$ |
84,127 |
|
$ |
62,186 |
|
$ |
516 |
|
$ |
(23,970) |
|
$ |
122,859 |
|
Net sales - as reported |
|
|
735,318 |
|
|
374,782 |
|
|
25,432 |
|
|
— |
|
|
1,135,532 |
|
Adjusted net sales - as reported |
|
|
735,318 |
|
|
374,782 |
|
|
— |
|
|
— |
|
|
1,110,100 |
|
|
|
|
|
|
|
|
|
|
|
|
|
|
|
|
|
|
Operating income as a % of net sales |
|
|
11.4 |
% |
|
15.5 |
% |
|
2.0 |
% |
|
NM |
|
|
10.5 |
% |
Adj. operating income as a % of net sales |
|
|
11.4 |
% |
|
16.6 |
% |
|
2.0 |
% |
|
NM |
|
|
10.8 |
% |
Adj. operating income as a % of adjusted net sales |
|
|
11.4 |
% |
|
16.6 |
% |
|
NM |
|
|
NM |
|
|
11.1 |
% |
|
|
Twenty-six weeks ended July 1, 2023 |
|
|||||||||||||
Operating Income Reconciliation |
|
Infrastructure |
|
Agriculture |
|
Other |
|
Corporate |
|
Valmont |
||||||
Operating income - as reported |
|
$ |
210,302 |
|
$ |
102,574 |
|
$ |
— |
|
$ |
(60,677) |
|
$ |
252,199 |
|
Prospera intangible asset amortization |
|
|
— |
|
|
3,290 |
|
|
— |
|
|
— |
|
|
3,290 |
|
Prospera stock-based compensation |
|
|
— |
|
|
4,278 |
|
|
— |
|
|
— |
|
|
4,278 |
|
Adjusted operating income |
|
$ |
210,302 |
|
$ |
110,142 |
|
$ |
— |
|
$ |
(60,677) |
|
$ |
259,767 |
|
Net sales - as reported |
|
|
1,500,298 |
|
|
608,479 |
|
|
— |
|
|
— |
|
|
2,108,777 |
|
|
|
|
|
|
|
|
|
|
|
|
|
|
|
|
|
|
Operating income as a % of net sales |
|
|
14.0 |
% |
|
16.9 |
% |
|
NM |
|
|
NM |
|
|
12.0 |
% |
Adj. operating income as a % of net sales |
|
|
14.0 |
% |
|
18.1 |
% |
|
NM |
|
|
NM |
|
|
12.3 |
% |
|
|
Twenty-six weeks ended June 25, 2022 |
|
|||||||||||||
Operating Income Reconciliation |
|
Infrastructure |
|
Agriculture |
|
Other |
|
Corporate |
|
Valmont |
||||||
Operating income - as reported |
|
$ |
162,443 |
|
$ |
95,521 |
|
$ |
(293) |
|
$ |
(44,110) |
|
$ |
213,561 |
|
Prospera intangible asset amortization |
|
|
— |
|
|
3,290 |
|
|
— |
|
|
— |
|
|
3,290 |
|
Prospera stock-based compensation |
|
|
— |
|
|
4,993 |
|
|
— |
|
|
— |
|
|
4,993 |
|
Adjusted operating income |
|
$ |
162,443 |
|
$ |
103,804 |
|
$ |
(293) |
|
$ |
(44,110) |
|
$ |
221,844 |
|
Net sales - as reported |
|
|
1,394,289 |
|
|
677,977 |
|
|
44,086 |
|
|
— |
|
|
2,116,352 |
|
Adjusted net sales - as reported |
|
|
1,394,289 |
|
|
677,977 |
|
|
— |
|
|
— |
|
|
2,072,266 |
|
|
|
|
|
|
|
|
|
|
|
|
|
|
|
|
|
|
Operating income as a % of net sales |
|
|
11.7 |
% |
|
14.1 |
% |
|
(0.7) |
% |
|
NM |
|
|
10.1 |
% |
Adj. operating income as a % of net sales |
|
|
11.7 |
% |
|
15.3 |
% |
|
(0.7) |
% |
|
NM |
|
|
10.5 |
% |
Adj. operating income as a % of adjusted net sales |
|
|
11.7 |
% |
|
15.3 |
% |
|
NM |
|
|
NM |
|
|
10.7 |
% |
VALMONT INDUSTRIES, INC. AND SUBSIDIARIES
REGULATION G RECONCILIATION OF EXCLUDING OTHER SEGMENT NET SALES
(Dollars in thousands, except per share amounts)
(Unaudited)
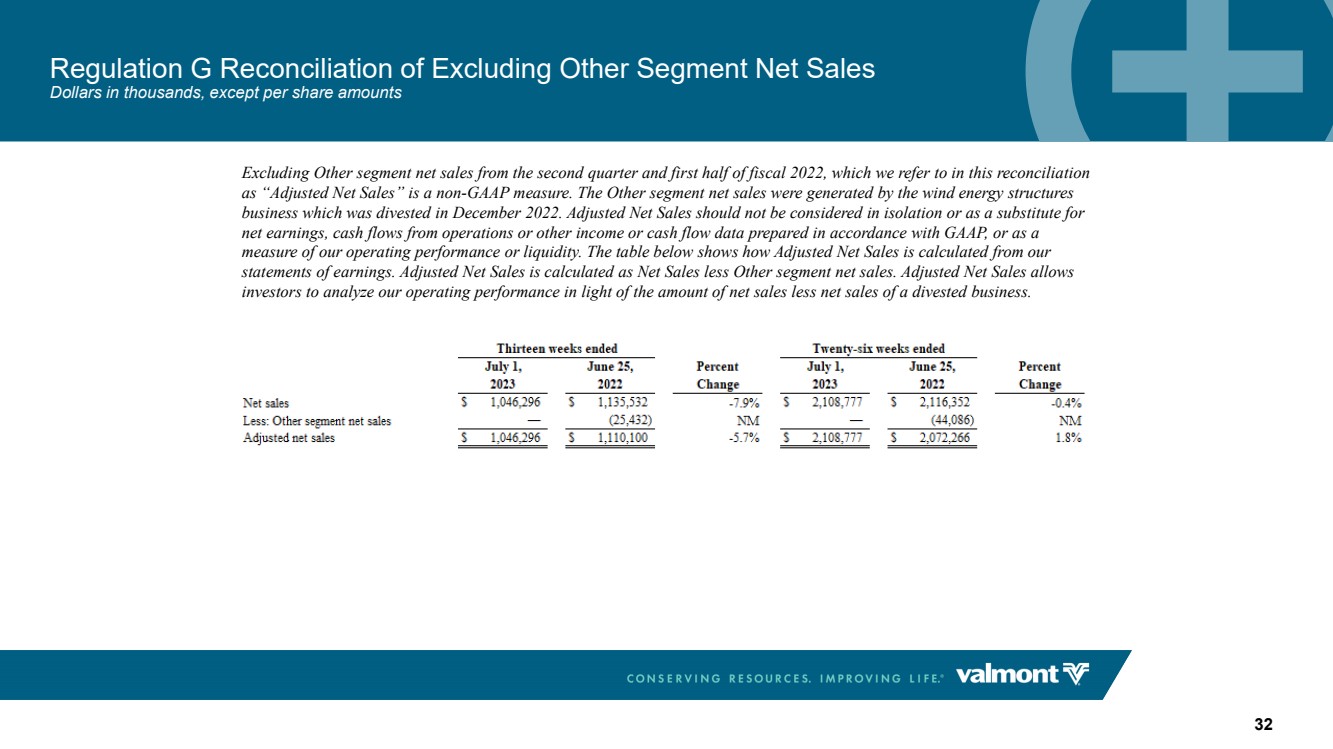
Excluding Other segment net sales from the second quarter and first half of fiscal 2022, which we refer to in this reconciliation as “Adjusted Net Sales”, is a non-GAAP measure. The Other segment net sales were generated by the offshore wind energy structures business which was divested in December 2022. Adjusted Net Sales should not be considered in isolation or as a substitute for net earnings, cash flows from operations or other income or cash flow data prepared in accordance with GAAP, or as a measure of our operating performance or liquidity. The table below shows how Adjusted Net Sales is calculated from the Company’s Statements of Earnings. Adjusted Net Sales is calculated as total net sales less Other segment net sales. Adjusted Net Sales allows investors to analyze our operating performance in light of the amount of net sales less net sales of a divested business.
|
|
Thirteen weeks ended |
|
|
|
|
Twenty-six weeks ended |
|
|
|
||||||||
|
|
July 1, |
|
June 25, |
|
Percent |
|
July 1, |
|
June 25, |
|
Percent |
||||||
|
|
2023 |
|
2022 |
|
Change |
|
2023 |
|
2022 |
|
Change |
||||||
Net sales |
|
$ |
1,046,296 |
|
$ |
1,135,532 |
|
|
(7.9)% |
|
$ |
2,108,777 |
|
$ |
2,116,352 |
|
|
(0.4)% |
Less: Other segment net sales |
|
|
— |
|
|
(25,432) |
|
|
NM |
|
|
— |
|
|
(44,086) |
|
|
NM |
Adjusted net sales |
|
$ |
1,046,296 |
|
$ |
1,110,100 |
|
|
(5.7)% |
|
$ |
2,108,777 |
|
$ |
2,072,266 |
|
|
1.8% |
VALMONT INDUSTRIES, INC. AND SUBSIDIARIES
REGULATION G RECONCILIATION OF FORECASTED GAAP AND ADJUSTED EARNINGS
(Dollars in thousands, except per share amounts)
(Unaudited)
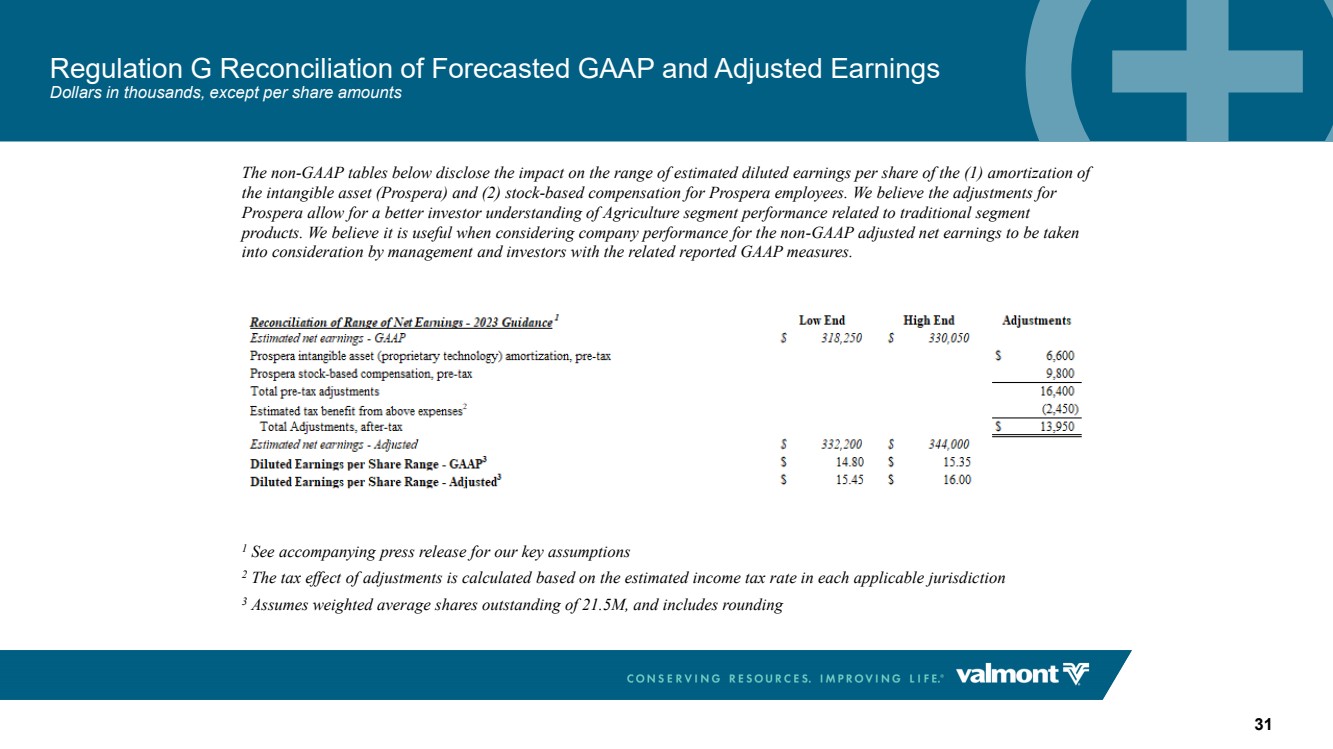
The non-GAAP tables below disclose the impact on the range of estimated diluted earnings per share of the (1) amortization of the intangible asset (Prospera) and (2) stock-based compensation for Prospera employees. We believe the adjustments for Prospera allow for a better investor understanding of Agriculture segment performance related to traditional segment products. We believe it is useful when considering company performance for the non-GAAP adjusted net earnings to be taken into consideration by management and investors with the related reported GAAP measures.
Reconciliation of Range of Net Earnings - 2023 Guidance1 |
|
Low End |
|
High End |
|
Adjustments |
|||
Estimated net earnings - GAAP |
|
$ |
318,250 |
|
$ |
330,050 |
|
|
|
Prospera intangible asset (proprietary technology) amortization, pre-tax |
|
|
|
|
|
|
|
$ |
6,600 |
Prospera stock-based compensation, pre-tax |
|
|
|
|
|
|
|
|
9,800 |
Total pre-tax adjustments |
|
|
|
|
|
|
|
|
16,400 |
Estimated tax benefit from above expenses2 |
|
|
|
|
|
|
|
|
(2,450) |
Total Adjustments, after-tax |
|
|
|
|
|
|
|
$ |
13,950 |
Estimated net earnings - Adjusted |
|
$ |
332,200 |
|
$ |
344,000 |
|
|
|
Diluted Earnings per Share Range - GAAP3 |
|
$ |
14.80 |
|
$ |
15.35 |
|
|
|
Diluted Earnings per Share Range - Adjusted3 |
|
$ |
15.45 |
|
$ |
16.00 |
|
|
|
1 See accompanying press release for our key assumptions
2 The tax effect of adjustments is calculated based on the estimated income tax rate in each applicable jurisdiction
3 Assumes weighted average shares outstanding of 21.5M and includes rounding
###
|
2Q 2023 Earnings Presentation July 27, 2023 |
|
2 These slides contain (and the accompanying oral discussion will contain) “forward-looking statements” within the meaning of the Private Securities Litigation Reform Act of 1995. Such statements involve known and unknown risks, uncertainties and other factors that could cause the actual results of the Company to differ materially from the results expressed or implied by such statements, including general economic and business conditions, conditions affecting the industries served by the Company and its subsidiaries including the continuing and developing effects of the pandemic including the effects of the outbreak on the general economy and the specific economic responses to the Company’s products and services, the overall market acceptance of such products and services, the integration of acquisitions and other factors disclosed in the Company’s periodic reports filed with the Securities and Exchange Commission, as well as future economic and market circumstances, industry conditions, company performance and financial results, operating efficiencies, availability and price of raw materials, availability and market acceptance of new products, product pricing, domestic and international competitive environments, geopolitical risks and actions and policy changes of domestic and foreign governments. Consequently, such forward-looking statements should be regarded as the Company’s current plans, estimates, and beliefs. The Company does not undertake and specifically declines any obligation to publicly release the results of any revisions to these forward-looking statements that may be made to reflect any future events or circumstances after the date of such statements or to reflect the occurrence of anticipated or unanticipated events. Disclosure Regarding Forward-Looking Statements |
|
Avner Applbaum President and CEO CEO Opening Comments |
|
Announces New CEO to Continue Strategic Vision 4 Committed to “Run Grow Transform” framework and delivering targets communicated during Investor Day 25+ Years of Experience • In Senior Operational and Financial Roles in Publicly Traded and Private Equity-Backed Companies Joined Valmont as CFO in March 2020 • Led Information Technology, Cybersecurity and Technology Innovation Functions • Was Responsible for Developing and Implementing Valmont’s Finance Transformation and Overseeing All Financial Activities Avner Applbaum President and CEO |
|
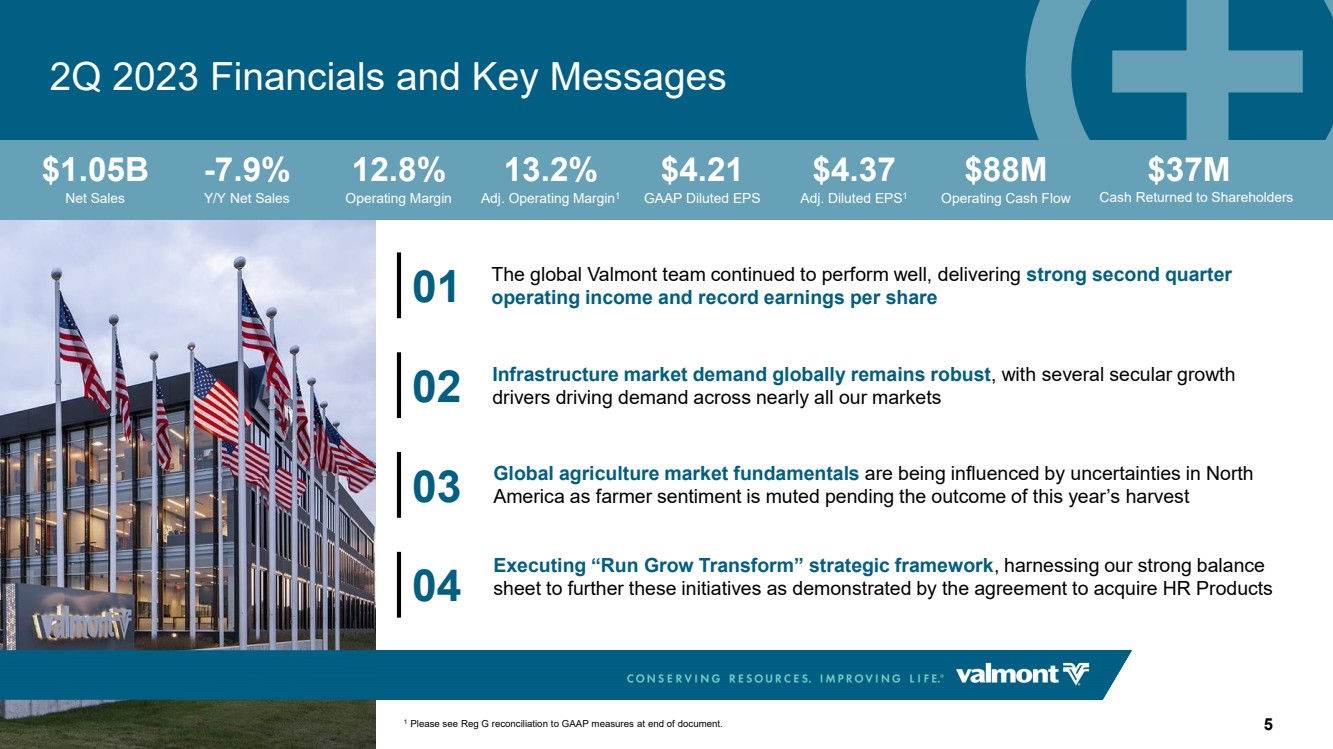
2Q 2023 Financials and Key Messages 5 The global Valmont team continued to perform well, delivering strong second quarter 01 operating income and record earnings per share Infrastructure market demand globally remains robust, with several secular growth 02 drivers driving demand across nearly all our markets Global agriculture market fundamentals are being influenced by uncertainties in North 03 America as farmer sentiment is muted pending the outcome of this year’s harvest Executing “Run Grow Transform” strategic framework, harnessing our strong balance 04 sheet to further these initiatives as demonstrated by the agreement to acquire HR Products 12.8% Operating Margin $1.05B Net Sales -7.9% Y/Y Net Sales 13.2% Adj. Operating Margin1 $4.21 GAAP Diluted EPS $4.37 Adj. Diluted EPS1 $88M Operating Cash Flow Cash Returned to Shareholders $37M 1 Please see Reg G reconciliation to GAAP measures at end of document. |
|
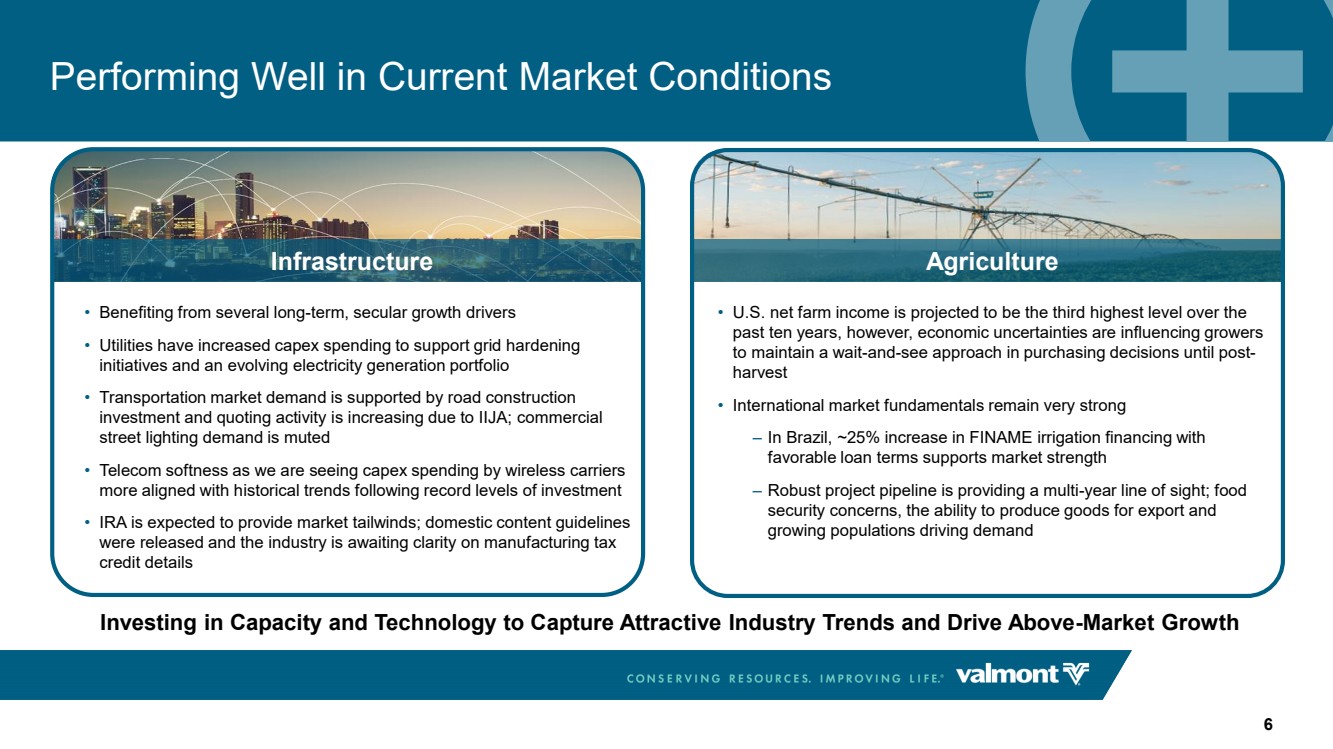
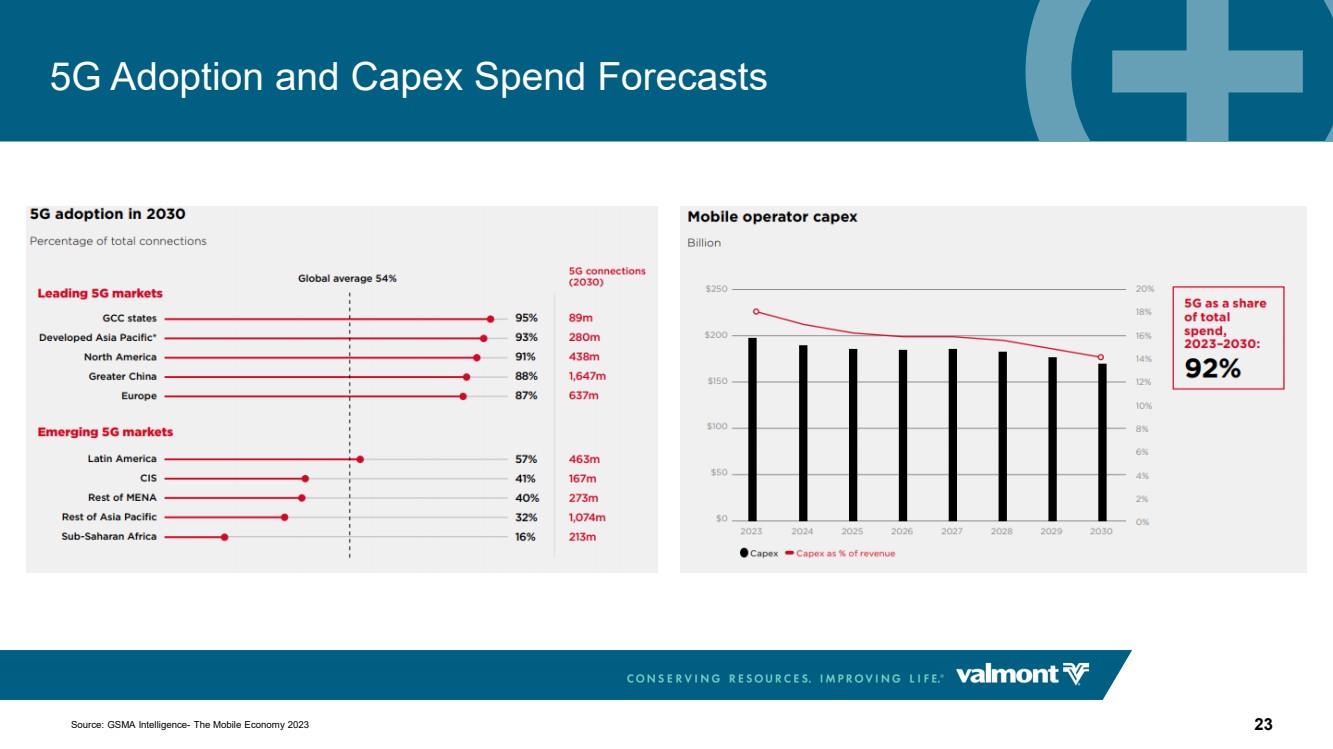
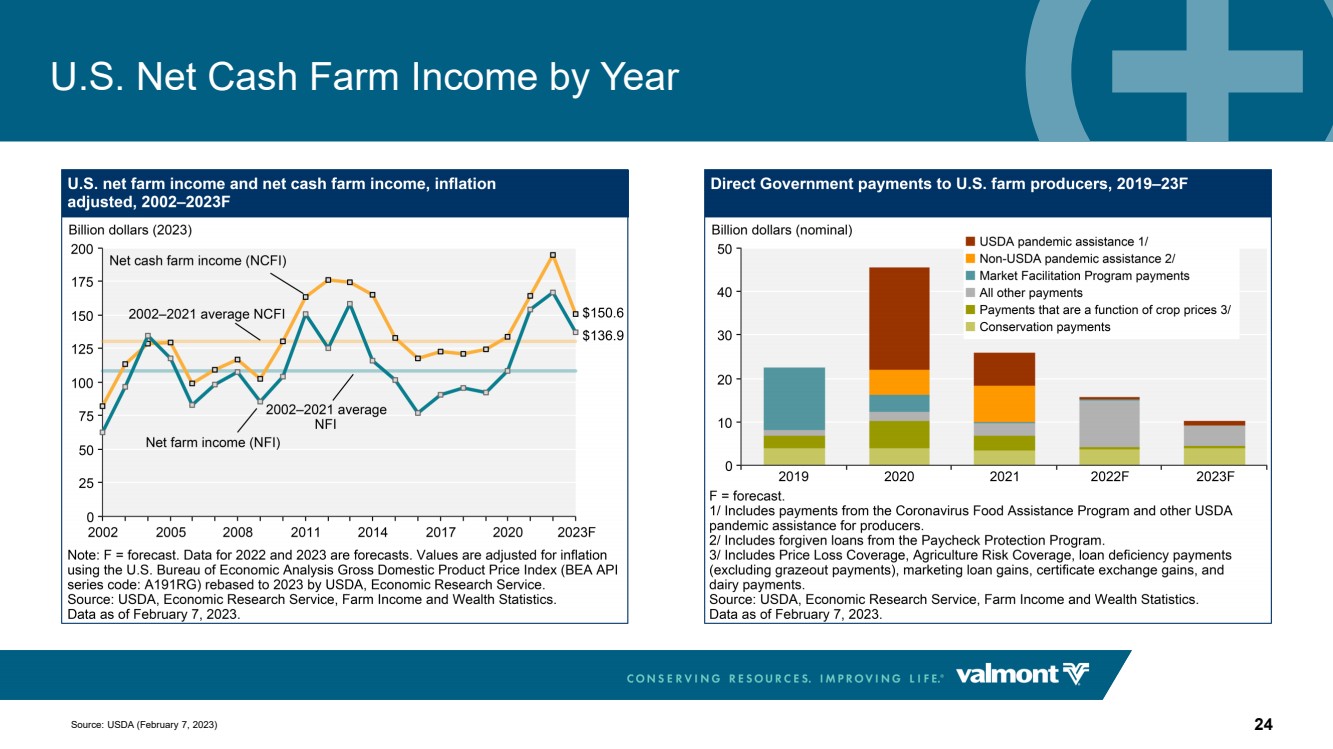
Agriculture Performing Well in Current Market Conditions Investing in Capacity and Technology to Capture Attractive Industry Trends and Drive Above-Market Growth • Benefiting from several long-term, secular growth drivers • Utilities have increased capex spending to support grid hardening initiatives and an evolving electricity generation portfolio • Transportation market demand is supported by road construction investment and quoting activity is increasing due to IIJA; commercial street lighting demand is muted • Telecom softness as we are seeing capex spending by wireless carriers more aligned with historical trends following record levels of investment • IRA is expected to provide market tailwinds; domestic content guidelines were released and the industry is awaiting clarity on manufacturing tax credit details • U.S. net farm income is projected to be the third highest level over the past ten years, however, economic uncertainties are influencing growers to maintain a wait-and-see approach in purchasing decisions until post-harvest • International market fundamentals remain very strong ‒ In Brazil, ~25% increase in FINAME irrigation financing with favorable loan terms supports market strength ‒ Robust project pipeline is providing a multi-year line of sight; food security concerns, the ability to produce goods for export and growing populations driving demand Infrastructure 6 |
|
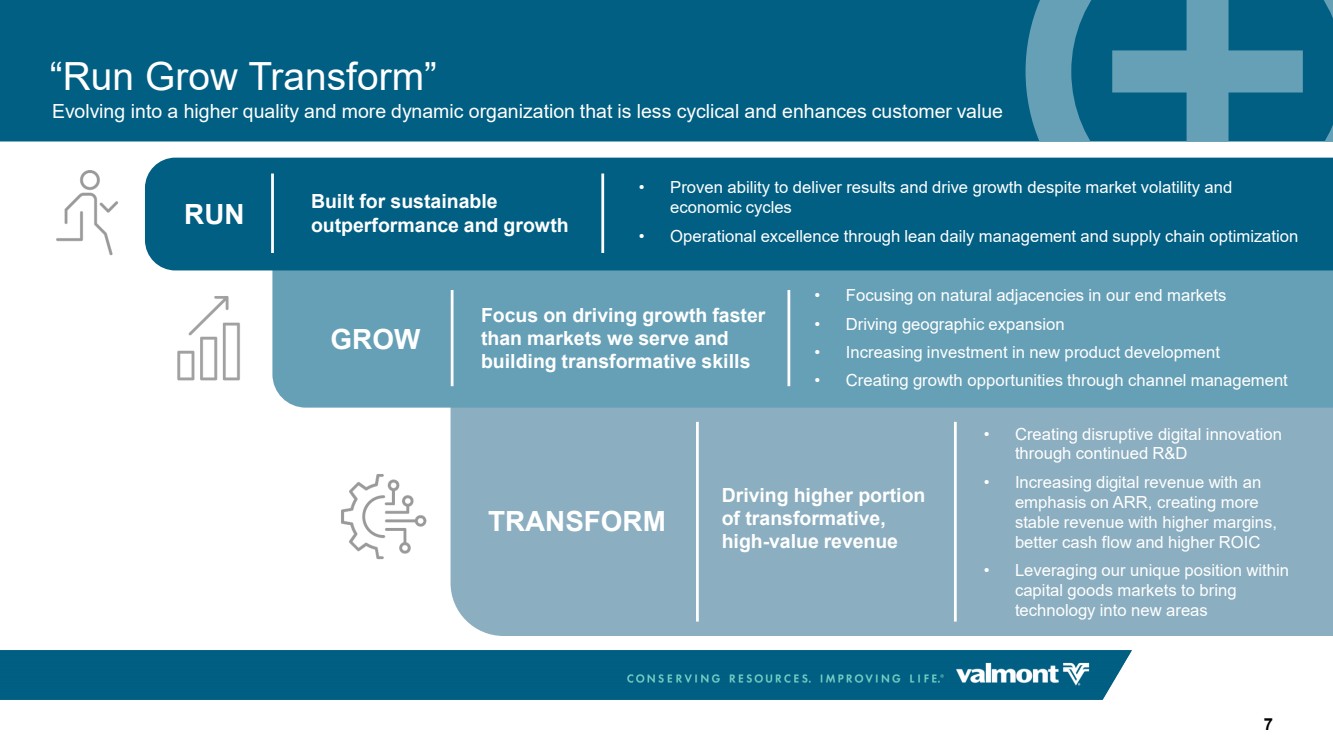
“Run Grow Transform” 7 Evolving into a higher quality and more dynamic organization that is less cyclical and enhances customer value GROW TRANSFORM RUN Built for sustainable outperformance and growth • Proven ability to deliver results and drive growth despite market volatility and economic cycles • Operational excellence through lean daily management and supply chain optimization • Focusing on natural adjacencies in our end markets • Driving geographic expansion • Increasing investment in new product development • Creating growth opportunities through channel management Focus on driving growth faster than markets we serve and building transformative skills Driving higher portion of transformative, high-value revenue • Creating disruptive digital innovation through continued R&D • Increasing digital revenue with an emphasis on ARR, creating more stable revenue with higher margins, better cash flow and higher ROIC • Leveraging our unique position within capital goods markets to bring technology into new areas |
|
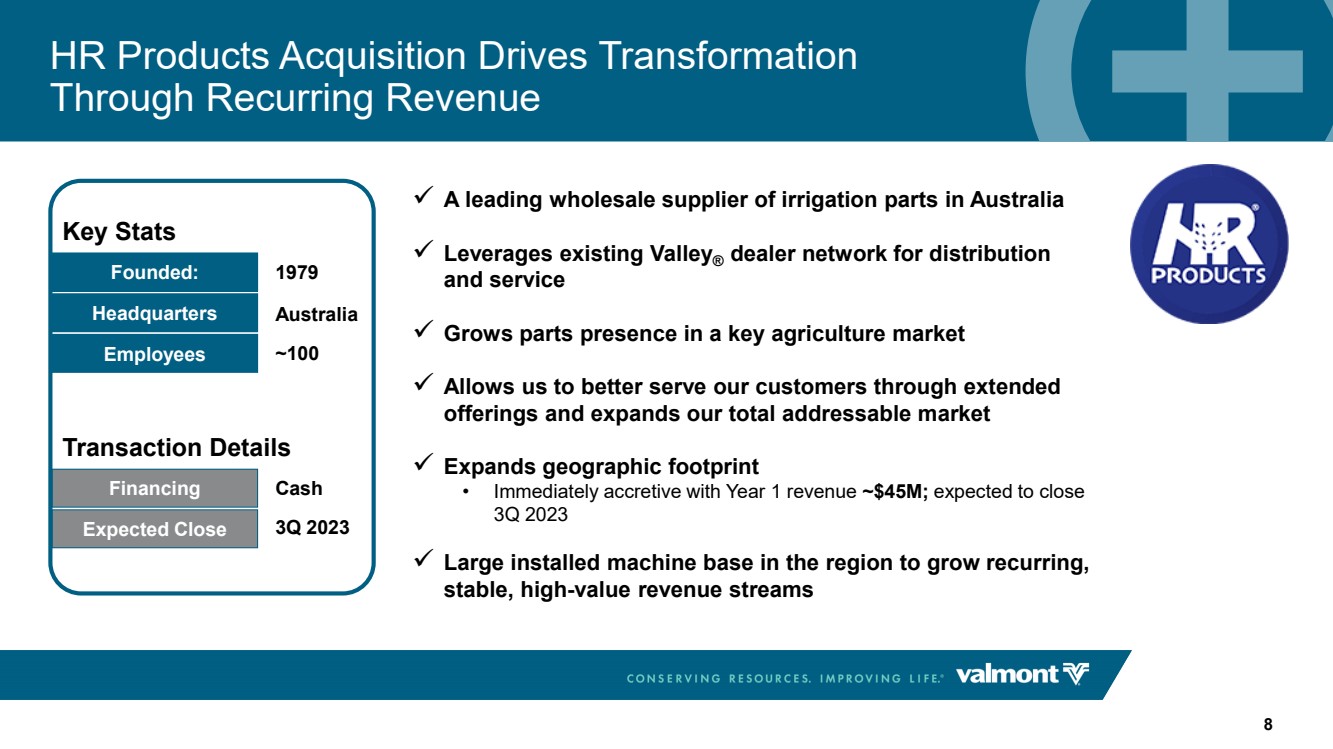
Founded: Headquarters Employees Key Stats 1979 Australia ~100 Financing Expected Close Transaction Details Cash 3Q 2023 HR Products Acquisition Drives Transformation Through Recurring Revenue 8 ✓ A leading wholesale supplier of irrigation parts in Australia ✓ Leverages existing Valley® dealer network for distribution and service ✓ Grows parts presence in a key agriculture market ✓ Allows us to better serve our customers through extended offerings and expands our total addressable market ✓ Expands geographic footprint • Immediately accretive with Year 1 revenue ~$45M; expected to close 3Q 2023 ✓ Large installed machine base in the region to grow recurring, stable, high-value revenue streams |
|
Tim Francis Interim CFO Financial Results and Outlook |
|
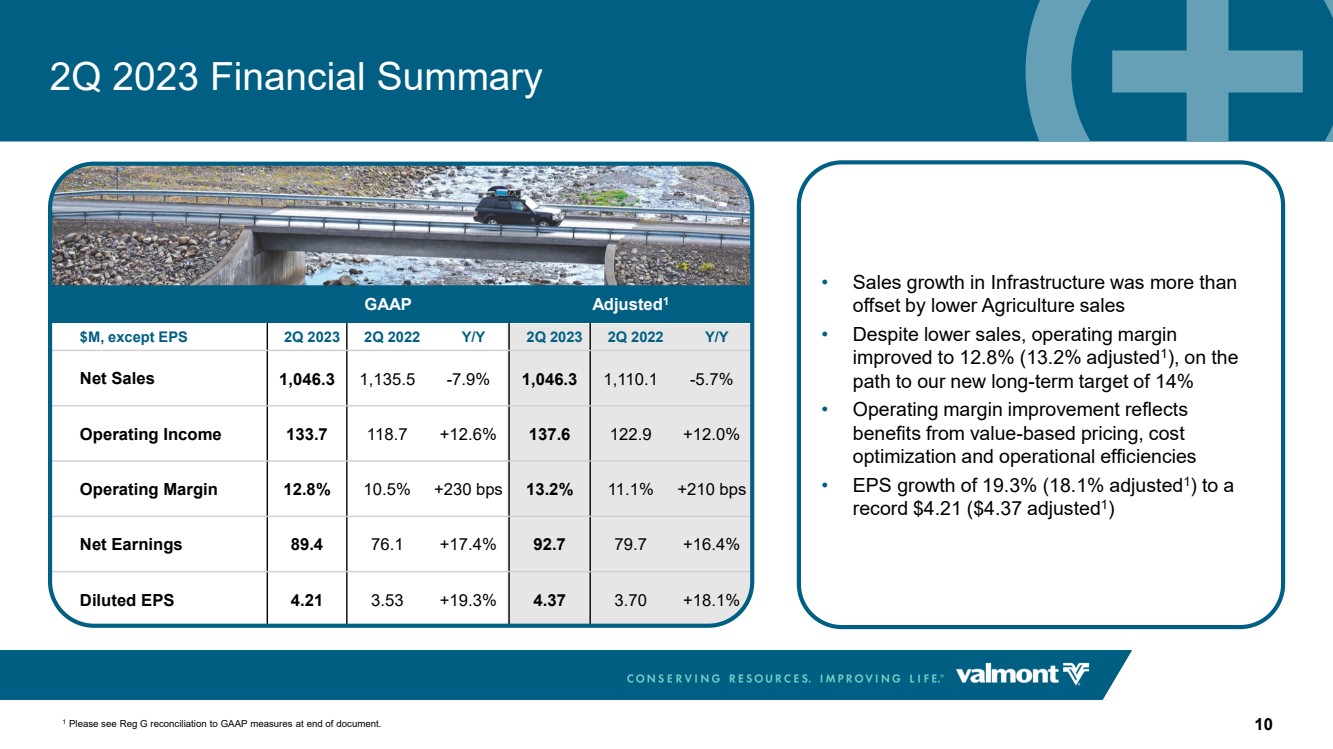
GAAP Adjusted1 $M, except EPS 2Q 2023 2Q 2022 Y/Y 2Q 2023 2Q 2022 Y/Y Net Sales 1,046.3 1,135.5 -7.9% 1,046.3 1,110.1 -5.7% Operating Income 133.7 118.7 +12.6% 137.6 122.9 +12.0% Operating Margin 12.8% 10.5% +230 bps 13.2% 11.1% +210 bps Net Earnings 89.4 76.1 +17.4% 92.7 79.7 +16.4% Diluted EPS 4.21 3.53 +19.3% 4.37 3.70 +18.1% 2Q 2023 Financial Summary 10 • Sales growth in Infrastructure was more than offset by lower Agriculture sales • Despite lower sales, operating margin improved to 12.8% (13.2% adjusted1 ), on the path to our new long-term target of 14% • Operating margin improvement reflects benefits from value-based pricing, cost optimization and operational efficiencies • EPS growth of 19.3% (18.1% adjusted1 ) to a record $4.21 ($4.37 adjusted1 ) 1 Please see Reg G reconciliation to GAAP measures at end of document. |
|
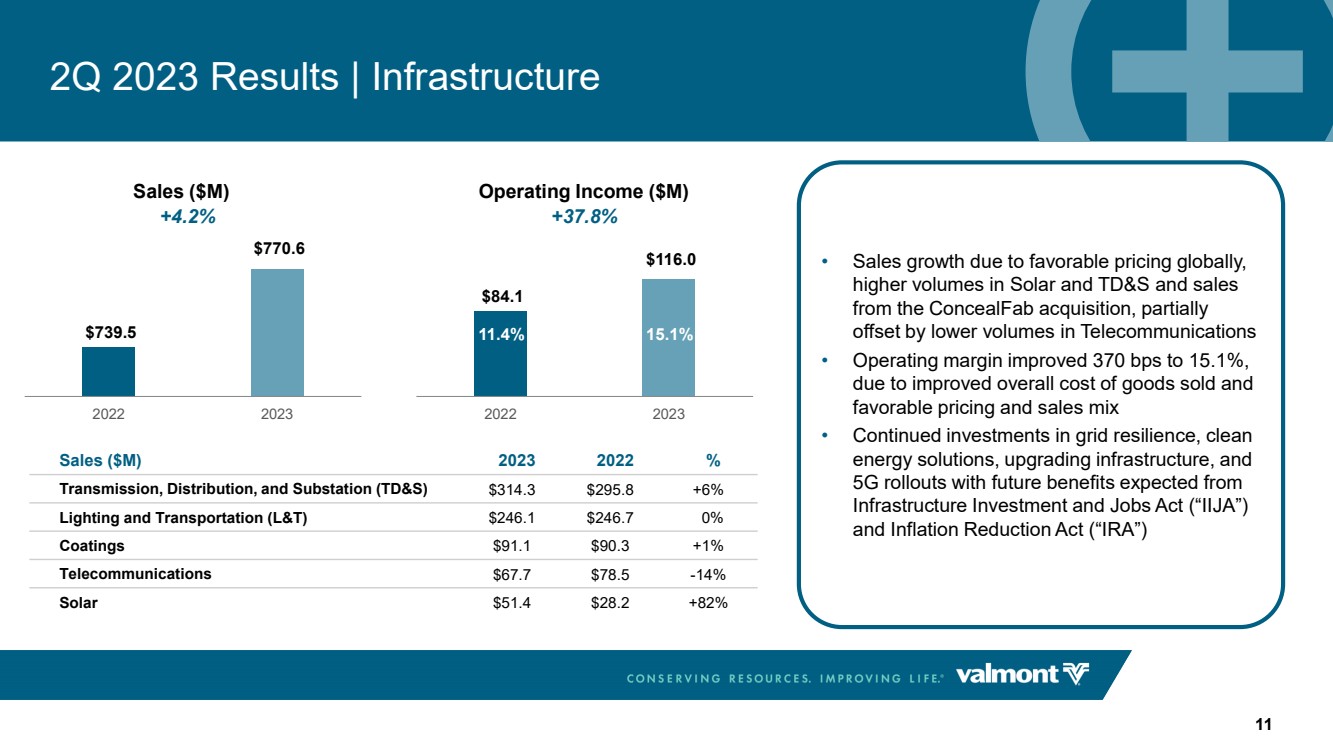
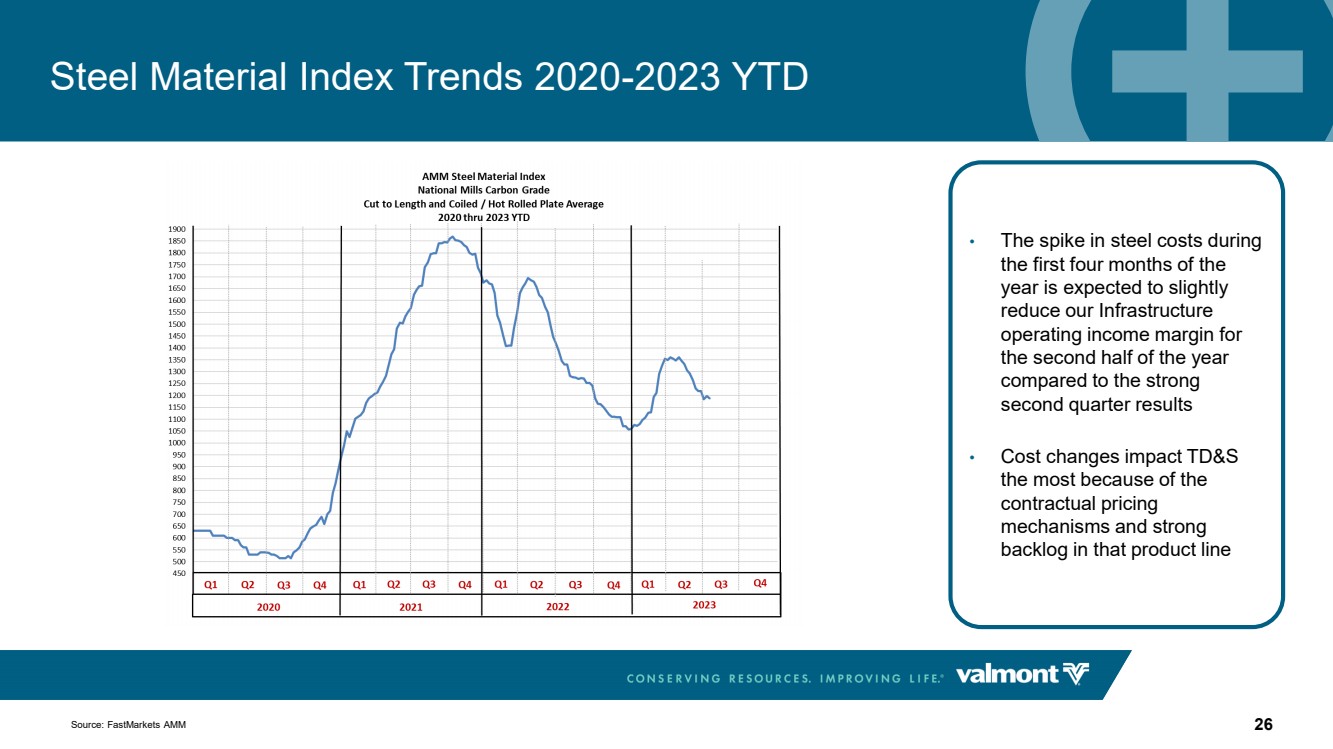
2Q 2023 Results | Infrastructure 11 • Sales growth due to favorable pricing globally, higher volumes in Solar and TD&S and sales from the ConcealFab acquisition, partially offset by lower volumes in Telecommunications • Operating margin improved 370 bps to 15.1%, due to improved overall cost of goods sold and favorable pricing and sales mix • Continued investments in grid resilience, clean energy solutions, upgrading infrastructure, and 5G rollouts with future benefits expected from Infrastructure Investment and Jobs Act (“IIJA”) and Inflation Reduction Act (“IRA”) +4.2% +37.8% $739.5 $770.6 2022 2023 $84.1 $116.0 2022 2023 Sales ($M) 2023 2022 % Transmission, Distribution, and Substation (TD&S) $314.3 $295.8 +6% Lighting and Transportation (L&T) $246.1 $246.7 0% Coatings $91.1 $90.3 +1% Telecommunications $67.7 $78.5 -14% Solar $51.4 $28.2 +82% 11.4% 15.1% Sales ($M) Operating Income ($M) |
|
2Q 2023 Results | Agriculture 12 Sales ($M) Operating Income ($M) • North America volumes were lower as second quarter 2022 benefited from ongoing delivery of record year-end backlog, and growers delaying capital investment decisions this year • International sales were lower, Brazil growth was more than offset by lower sales in the EMEA region, partially due to timing of project sales • Lower volumes of irrigation equipment affected sales of agriculture technology products and services • Operating margins increased, despite lower sales, due to higher average selling prices and improved overall cost of goods sold -25.9% Adjusted1 : -14.5% $377.8 $279.9 2022 2023 $58.0 $49.3 $62.2 $53.2 2022 2023 2022 2023 Sales ($M) 2023 2022 % North America $141.0 $203.5 -31% International $138.9 $174.3 -20% Irrigation Equipment and Parts $252.5 $347.6 -27% Technology Products and Services $27.4 $30.2 -9% GAAP: -15.2% 15.5% 17.7% 16.6% 19.1% 1 Please see Reg G reconciliation to GAAP measures at end of document. |
|
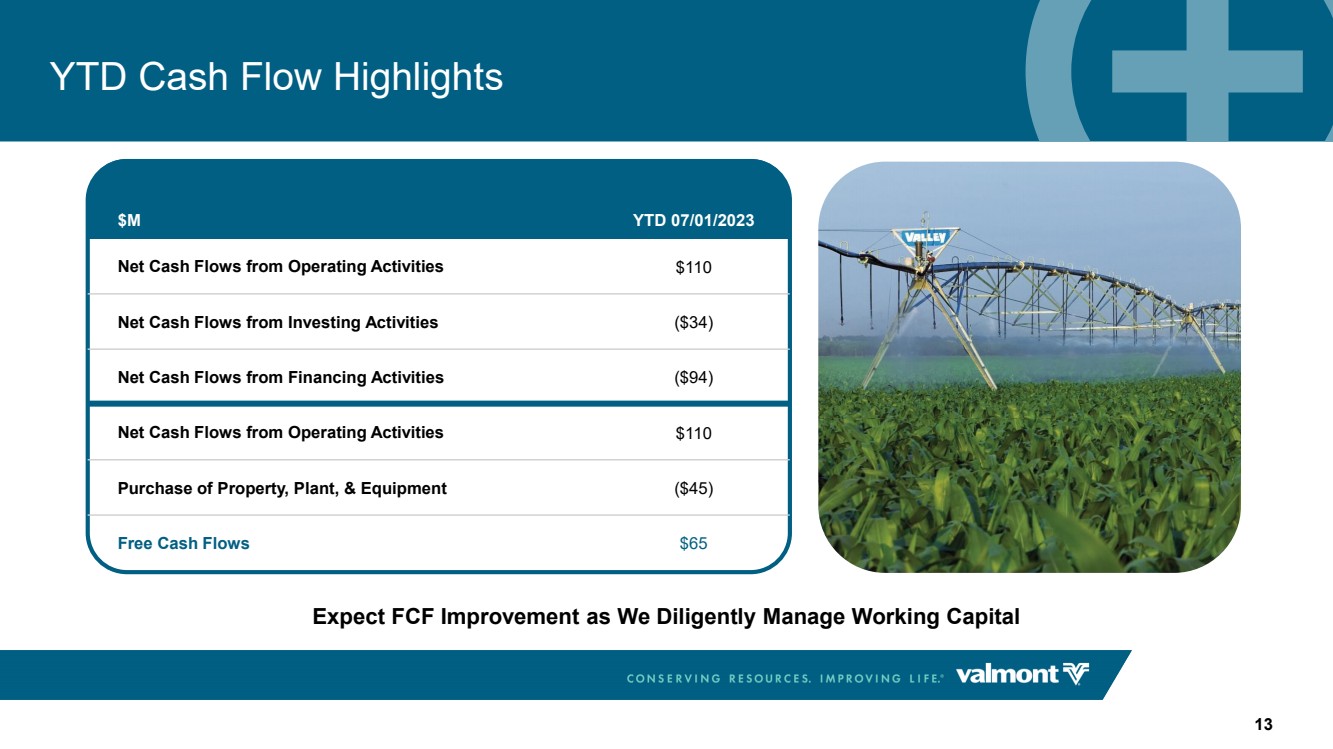
YTD Cash Flow Highlights Expect FCF Improvement as We Diligently Manage Working Capital $M YTD 07/01/2023 Net Cash Flows from Operating Activities $110 Net Cash Flows from Investing Activities ($34) Net Cash Flows from Financing Activities ($94) Net Cash Flows from Operating Activities $110 Purchase of Property, Plant, & Equipment ($45) Free Cash Flows $65 13 |
|
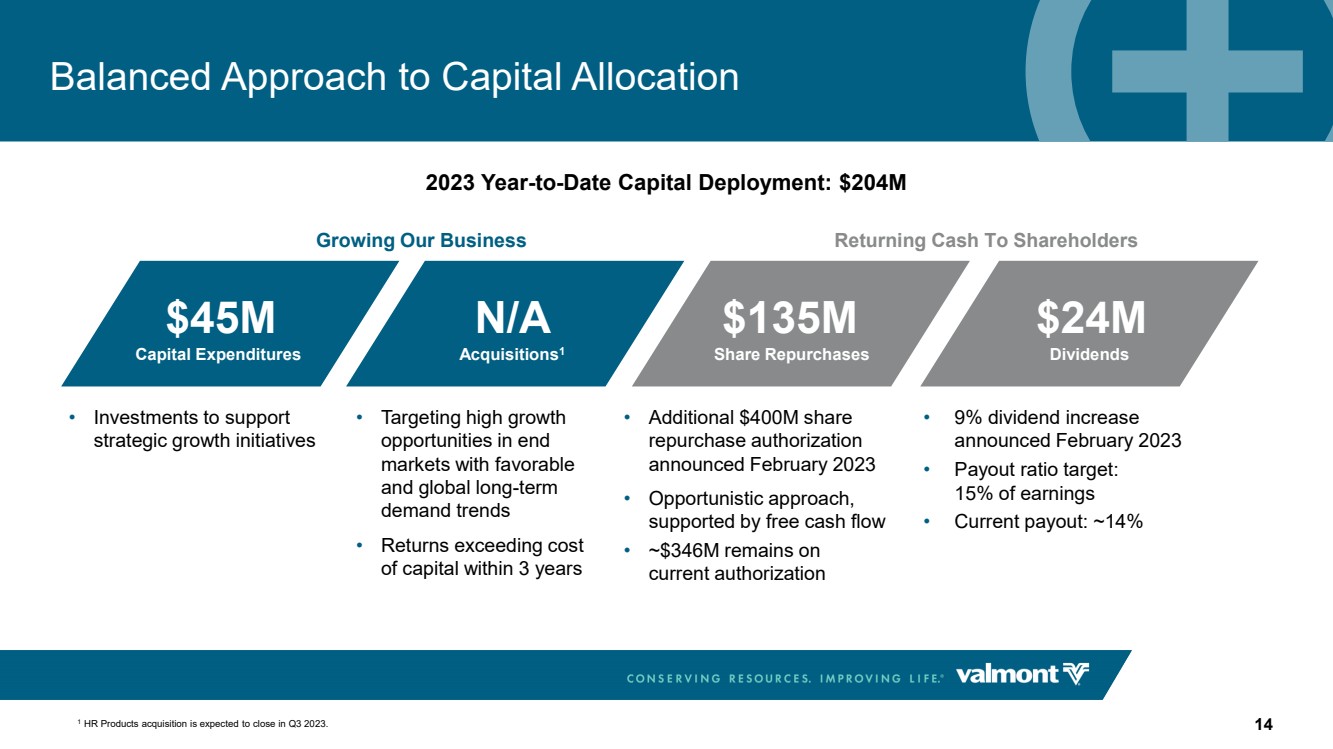
Balanced Approach to Capital Allocation 14 Growing Our Business Returning Cash To Shareholders 2023 Year-to-Date Capital Deployment: $204M • Targeting high growth opportunities in end markets with favorable and global long-term demand trends • Returns exceeding cost of capital within 3 years N/A • Investments to support strategic growth initiatives $45M • 9% dividend increase announced February 2023 • Payout ratio target: 15% of earnings • Current payout: ~14% $24M • Additional $400M share repurchase authorization announced February 2023 • Opportunistic approach, supported by free cash flow • ~$346M remains on current authorization $135M Capital Expenditures Acquisitions1 Share Repurchases Dividends 1 HR Products acquisition is expected to close in Q3 2023. |
|
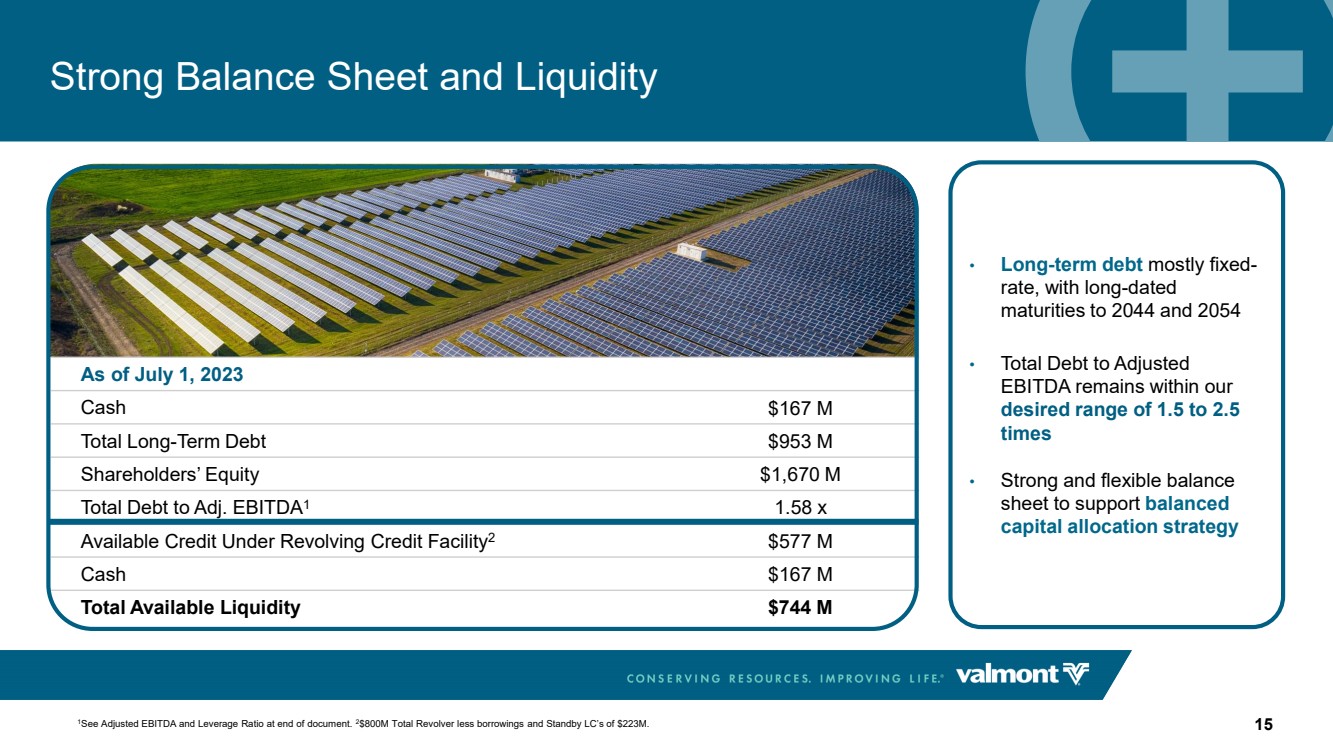
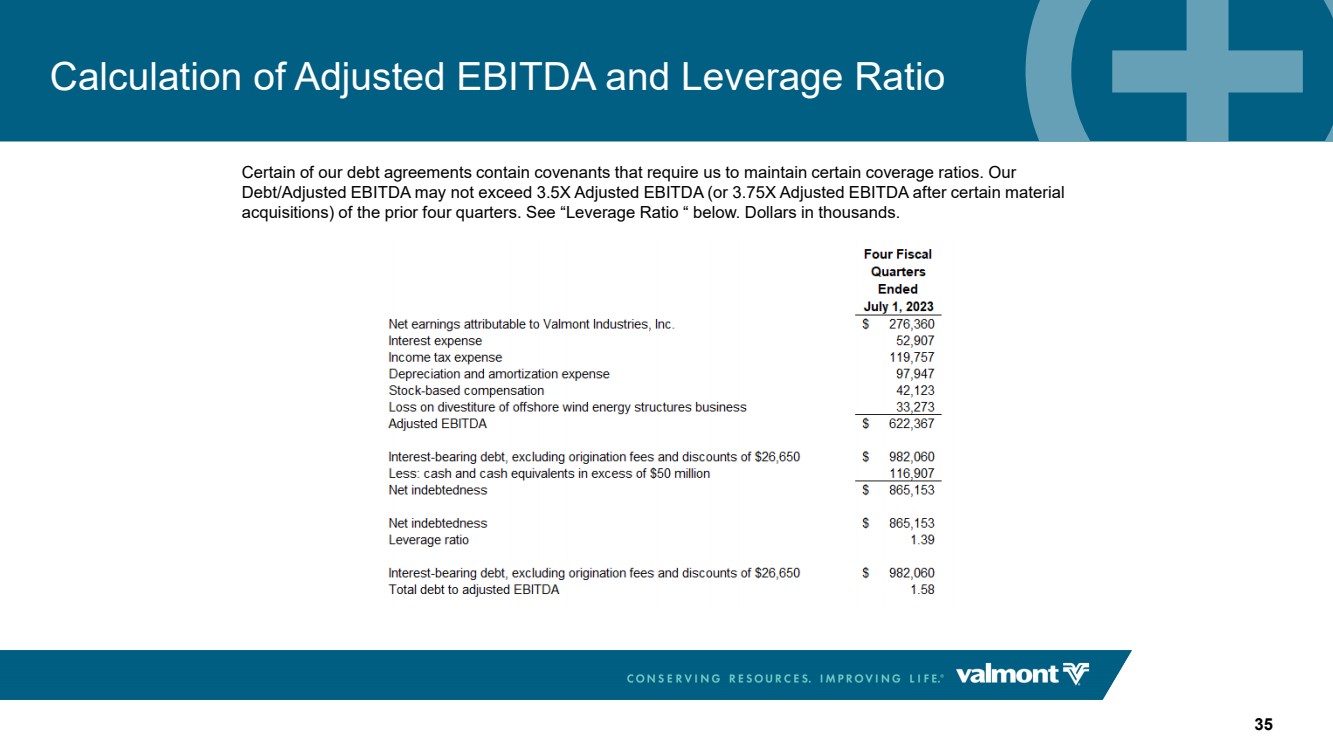
Strong Balance Sheet and Liquidity 15 As of July 1, 2023 Cash $167 M Total Long-Term Debt $953 M Shareholders’ Equity $1,670 M Total Debt to Adj. EBITDA1 1.58 x Available Credit Under Revolving Credit Facility2 $577 M Cash $167 M Total Available Liquidity $744 M • Long-term debt mostly fixed-rate, with long-dated maturities to 2044 and 2054 • Total Debt to Adjusted EBITDA remains within our desired range of 1.5 to 2.5 times • Strong and flexible balance sheet to support balanced capital allocation strategy 1See Adjusted EBITDA and Leverage Ratio at end of document. 2$800M Total Revolver less borrowings and Standby LC’s of $223M. |
|
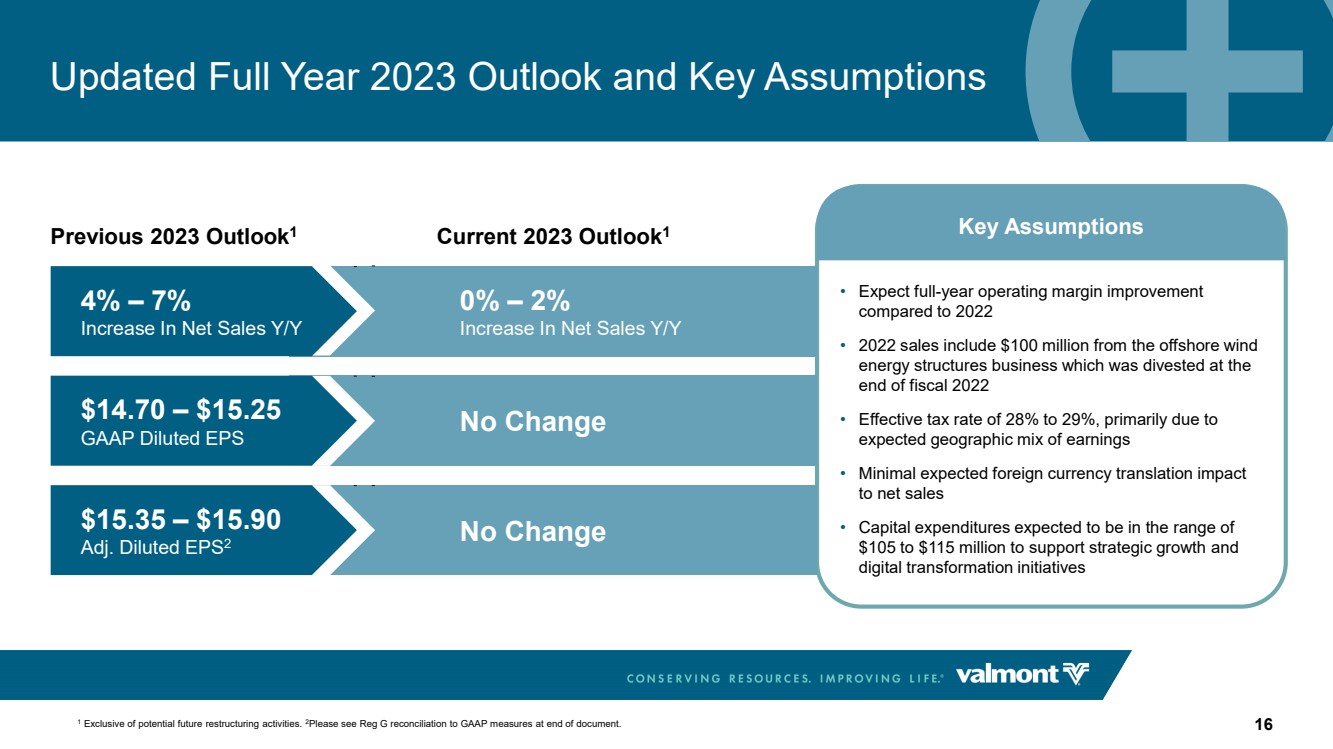
Updated Full Year 2023 Outlook and Key Assumptions 16 • Expect full-year operating margin improvement compared to 2022 • 2022 sales include $100 million from the offshore wind energy structures business which was divested at the end of fiscal 2022 • Effective tax rate of 28% to 29%, primarily due to expected geographic mix of earnings • Minimal expected foreign currency translation impact to net sales • Capital expenditures expected to be in the range of $105 to $115 million to support strategic growth and digital transformation initiatives Key Assumptions 0% – 2% Increase In Net Sales Y/Y No Change No Change Current 2023 Outlook1 4% – 7% Increase in Net Sales Y/Y $15.35 – $15.90 Adj. Diluted EPS1 $14.70 – $15.25 GAAP Diluted EPS Previous 2023 Outlook1 4% – 7% Increase In Net Sales Y/Y $15.35 – $15.90 Adj. Diluted EPS2 $14.70 – $15.25 GAAP Diluted EPS 1 Exclusive of potential future restructuring activities. 2Please see Reg G reconciliation to GAAP measures at end of document. |
|
Uniquely Positioned to Win in Markets with Multi-Year Demand Drivers 17 Our products and solutions, enhanced with innovative technology, are addressing global megatrends and driving above-market growth Infrastructure • Energy transition: demand and necessity for renewables, grid hardening and resiliency, and load growth • Long-term need for critical infrastructure investment globally supported by current and future stimulus • Rapid acceleration of telecom deployment and macro buildouts in suburban and rural communities • Uniquely positioned to acquire and aggregate data to enable cities and grids to become smarter Agriculture • Food security for a growing population, improved global diets and bio-friendly fuels • Increasing adoption rates of advanced agronomy • Digital farming management to reduce input costs, increase land productivity and minimize farm labor costs • Replacement and OEM parts opportunities driven by large installed base • Customer sustainability initiatives and constraints on freshwater Breadth of product offerings Differentiated niche industries with high barriers to entry Unparalleled response time and customer service Minimize business cyclicality through innovative solutions that address customer challenges and provide better economics Unmatched channel in capital goods markets Manufacturing expertise and operational excellence Flexible and broad global footprint Cross-sharing of commercial, operational and development resources |
|
Continuing to Drive Sustainable Outperformance 5-Year Financial Targets 18 Key Assumptions “Run Grow Transform” Strategy Driving Expectations Higher and Enabling a More Resilient Business 12 - 15% EPS Growth1 5 - 8% Net Sales Growth1 >14% Operating Margin 1.0x Net Earnings FCF Conversion >18% ROIC • Greater near to medium term focus on funding growth with R&D and digital innovation • FCF conversion target is long-term over the cycle • Financial targets based on performance through the cycle • Excludes future divestitures 1 Estimated compound annualized growth rates from base year 2022; organic sales growth only. |
|
Q&A |
|
Appendix |
|
U.S. Electric Utilities Capital Expenditures Source: EEI Finance Department, member company reports, and S&P Global Market Intelligence (updated Sept 2022). 21 |
|
Infrastructure Investment and Jobs Act (IIJA) 22 Infrastructure Investment and Jobs Act Spending Breakdown (In Order - Most to Least) Previously-Passed Transportation Funding | $650B Roads, Bridges and Related Programs | $111B Energy, Power and Electric Grid Reliability | $107.5B Freight and Passenger Rail | $66B Broadband | $65B Water and Wastewater Infrastructure | $55B Public Transportation | $39.2B Airports | $25B Natural Disaster Prevention and Mitigation | $23.3B Cleaning-Up Abandoned Sites | $21B Army Corps of Engineers | $16.7B Highway and Pedestrian Safety | $11B Ports and Coast Guard | $7.8B Cybersecurity and other Infrastructure Programs | $10.11B Source: Grassley.senate.gov |
|
5G Adoption and Capex Spend Forecasts Source: GSMA Intelligence- The Mobile Economy 2023 23 |
|
U.S. Net Cash Farm Income by Year Source: USDA (February 7, 2023) 24 |
|
U.S. Drought Condition Source: Drought Monitor (July 18, 2023) 25 |
|
Steel Material Index Trends 2020-2023 YTD Source: FastMarkets AMM 26 • The spike in steel costs during the first four months of the year is expected to slightly reduce our Infrastructure operating income margin for the second half of the year compared to the strong second quarter results • Cost changes impact TD&S the most because of the contractual pricing mechanisms and strong backlog in that product line |
|
The non-GAAP tables below disclose the impact of intangible asset amortization (Prospera) and stock-based compensation recognized for the Prospera employees on fiscal 2023 results. We believe the adjustments for Prospera allow for a better investor understanding of Agriculture segment performance related to traditional segment products. Amounts may be impacted by rounding. We believe it is useful when considering company performance for the non-GAAP adjusted net earnings and operating income to be taken into consideration by management and investors with the related reported GAAP measures. Reconciliation of Non-GAAP Financial Measures to Reported Financial Measures Dollars in thousands, except per share amounts 27 1Earnings per share includes rounding 2The tax effect of adjustments is calculated based on the income tax rate in each applicable jurisdiction |
|
The non-GAAP tables below disclose the impact of intangible asset amortization (Prospera) and stock-based compensation recognized for the Prospera employees on fiscal 2023 results. We believe the adjustments for Prospera allow for a better investor understanding of Agriculture segment performance related to traditional segment products. Amounts may be impacted by rounding. We believe it is useful when considering company performance for the non-GAAP adjusted net earnings and operating income to be taken into consideration by management and investors with the related reported GAAP measures. Reconciliation of Non-GAAP Financial Measures to Reported Financial Measures Dollars in thousands, except per share amounts 28 |
|
The non-GAAP tables below disclose the impact of intangible asset amortization (Prospera) and stock-based compensation recognized for the Prospera employees on fiscal 2022 results. We believe the adjustments for Prospera allow for a better investor understanding of Agriculture segment performance related to traditional segment products. Amounts may be impacted by rounding. We believe it is useful when considering company performance for the non-GAAP adjusted net earnings and operating income to be taken into consideration by management and investors with the related reported GAAP measures. Reconciliation of Non-GAAP Financial Measures to Reported Financial Measures Dollars in thousands, except per share amounts 29 1Earnings per share includes rounding 2The tax effect of adjustments is calculated based on the income tax rate in each applicable jurisdiction |
|
The non-GAAP tables below disclose the impact of intangible asset amortization (Prospera) and stock-based compensation recognized for the Prospera employees on fiscal 2022 results. We believe the adjustments for Prospera allow for a better investor understanding of Agriculture segment performance related to traditional segment products. Amounts may be impacted by rounding. We believe it is useful when considering company performance for the non-GAAP adjusted net earnings and operating income to be taken into consideration by management and investors with the related reported GAAP measures. Reconciliation of Non-GAAP Financial Measures to Reported Financial Measures Dollars in thousands, except per share amounts 30 |
|
Regulation G Reconciliation of Forecasted GAAP and Adjusted Earnings Dollars in thousands, except per share amounts 31 The non-GAAP tables below disclose the impact on the range of estimated diluted earnings per share of the (1) amortization of the intangible asset (Prospera) and (2) stock-based compensation for Prospera employees. We believe the adjustments for Prospera allow for a better investor understanding of Agriculture segment performance related to traditional segment products. We believe it is useful when considering company performance for the non-GAAP adjusted net earnings to be taken into consideration by management and investors with the related reported GAAP measures. 1 See accompanying press release for our key assumptions 2 The tax effect of adjustments is calculated based on the estimated income tax rate in each applicable jurisdiction 3 Assumes weighted average shares outstanding of 21.5M, and includes rounding |
|
Regulation G Reconciliation of Excluding Other Segment Net Sales Dollars in thousands, except per share amounts 32 Excluding Other segment net sales from the second quarter and first half of fiscal 2022, which we refer to in this reconciliation as “Adjusted Net Sales” is a non-GAAP measure. The Other segment net sales were generated by the wind energy structures business which was divested in December 2022. Adjusted Net Sales should not be considered in isolation or as a substitute for net earnings, cash flows from operations or other income or cash flow data prepared in accordance with GAAP, or as a measure of our operating performance or liquidity. The table below shows how Adjusted Net Sales is calculated from our statements of earnings. Adjusted Net Sales is calculated as Net Sales less Other segment net sales. Adjusted Net Sales allows investors to analyze our operating performance in light of the amount of net sales less net sales of a divested business. |
|
2013 – 2022 Historical Free Cash Flow1,2 33 ($M) 2013 2014 2015 2016 2017 2018 2019 2020 2021 2022 Net cash flows from operating activities $ 396.4 $ 174.1 $ 272.3 $ 232.8 $ 133.1 $ 153.0 $ 307.6 $ 316.3 $ 65.9 $ 326.3 Net cash flows from investing activities (131.7) (256.9) (48.2) (53.0) (49.6) (155.4) (168.1) (104.0) (417.3) (132.1) Net cash flows from financing activities (37.4) (136.8) (32.0) (95.2) (32.0) (162.1) (98.9) (173.8) 133.5 (181.9) Net cash flows from operating activities $ 396.4 $ 174.1 $ 272.3 $ 232.8 $ 133.1 $ 153.0 $ 307.6 $ 316.3 $ 65.9 $ 326.3 Purchase of plant, property, and equipment (106.8) (73.0) (45.5) (57.9) (55.3) (72.0) (97.4) (106.7) (107.8) (93.3) Free cash flows 289.7 101.1 226.8 174.9 77.8 81.0 210.2 209.6 (41.9) 233.0 Net earnings attributed to Valmont Industries, Inc. $ 278.5 $ 183.9 $ 40.1 $ 175.5 $ 120.5 $ 101.8 $ 146.4 $ 140.7 $ 195.6 $ 250.9 Adjusted free cash flow net earnings attributed to Valmont Industries, Inc. $ 295.1 $ 187.7 $ 131.7 $ 139.9 $ 162.7 $ 130.4 N/A $ 159.8 $ 222.3 $ 284.2 Free Cash Flow Conversion - GAAP 1.04 0.55 5.66 1.00 0.65 0.80 1.44 1.49 (0.21) 0.93 Free Cash Flow Conversion - Adjusted 0.98 0.53 1.71 1.25 0.48 0.62 N/A 1.31 (0.19) 0.82 1) Reconciliation of Net Earnings to Adjusted Figures Net earnings attributed to Valmont Industries, Inc. $ 278.5 $ 183.9 $ 40.1 $ 175.5 $ 120.5 $ 101.8 $ 146.4 $ 140.7 $ 195.6 $ 250.9 Loss from divestiture of offshore wind energy structures business - - - - - - - - - 33.3 Change in valuation allowance against deferred tax assets - - 7.1 (20.7) 41.9 - - - 5.0 - Impairment of long-lived assets 12.2 - 61.8 1.1 - 28.6 - 19.1 21.7 - Reversal of contingent liability - - (16.6) - - - - - - Other non-recurring expenses (non-cash) - - 18.1 - - - - - Deconsolidation of Delta EMD, after-tax and NCI 4.4 - - - - - - - - - Noncash loss from Delta EMD shares - 3.8 4.6 0.6 0.2 - - - - - Adjusted free cash flow net earnings attributed to Valmont Industries, Inc. $ 295.1 $ 187.7 $ 131.7 $ 139.9 $ 162.7 $ 130.4 $ 146.4 $ 159.8 $ 222.3 $ 284.2 1 Adjusted earnings for purposes of calculating FCF conversion may not agree to the adjusted net earnings. The difference is due to non-recurring expenses which were settled in cash in the year of occurrence as part of net cash flows from operating activities. 2 We use the non-GAAP measure of FCF, which we define as GAAP net cash flows from operating activities reduced by capex. We believe that FCF is a useful performance measure for management and useful to investors as the basis for comparing our performance with other companies. Our measure of FCF may not be directly comparable to similar measures used by other companies. |
|
Strong Free Cash Flow throughout the Cycle 34 Years of rapid raw material cost inflation GAAP 1.04X 0.55X 5.66X 1.00X 0.65X 0.80X 1.44X 1.49X (0.21X) 0.93X Adj. 0.98X 0.53X 1.71X 1.25X 0.48X 0.62X N/A 1.31X (0.19X) 0.82X 2013 – 2022 Free Cash Flow1 ($M) 290 101 227 175 78 81 210 210 (42) 233 156 (100) (50) - 50 100 150 200 250 300 350 2013 2014 2015 2016 2017 2018 2019 2020 2021 2022 10 Year Avg 10-yr Avg. $156M GAAP 1.33X Adj. 0.83X Historical FCF Conversion by Year1 1 We use the non-GAAP measure of FCF, which we define as GAAP net cash flows from operating activities reduced by capex. We believe that FCF is a useful performance measure for management and useful to investors as the basis for comparing our performance with other companies. Our measure of FCF may not be directly comparable to similar measures used by other companies. |
|
Calculation of Adjusted EBITDA and Leverage Ratio 35 Certain of our debt agreements contain covenants that require us to maintain certain coverage ratios. Our Debt/Adjusted EBITDA may not exceed 3.5X Adjusted EBITDA (or 3.75X Adjusted EBITDA after certain material acquisitions) of the prior four quarters. See “Leverage Ratio “ below. Dollars in thousands. |