TRINITY INDUSTRIES INC0000099780false2024Q112/31http://fasb.org/us-gaap/2023#InterestIncomeExpenseNethttp://fasb.org/us-gaap/2023#InterestIncomeExpenseNethttp://fasb.org/us-gaap/2023#InterestIncomeExpenseNethttp://fasb.org/us-gaap/2023#InterestIncomeExpenseNethttp://fasb.org/us-gaap/2023#InterestIncomeExpenseNethttp://fasb.org/us-gaap/2023#InterestIncomeExpenseNethttp://fasb.org/us-gaap/2023#InterestIncomeExpenseNethttp://fasb.org/us-gaap/2023#InterestIncomeExpenseNethttp://fasb.org/us-gaap/2023#InterestIncomeExpenseNethttp://fasb.org/us-gaap/2023#InterestIncomeExpenseNethttp://fasb.org/us-gaap/2023#InterestIncomeExpenseNethttp://fasb.org/us-gaap/2023#InterestIncomeExpenseNethttp://fasb.org/us-gaap/2023#CostOfGoodsAndServicesSoldhttp://fasb.org/us-gaap/2023#CostOfGoodsAndServicesSoldhttp://fasb.org/us-gaap/2023#CostOfGoodsAndServicesSoldhttp://fasb.org/us-gaap/2023#CostOfGoodsAndServicesSoldhttp://fasb.org/us-gaap/2023#OtherOperatingIncomeExpenseNethttp://fasb.org/us-gaap/2023#OtherOperatingIncomeExpenseNethttp://fasb.org/us-gaap/2023#OtherOperatingIncomeExpenseNethttp://fasb.org/us-gaap/2023#OtherOperatingIncomeExpenseNethttp://fasb.org/us-gaap/2023#OtherOperatingIncomeExpenseNethttp://fasb.org/us-gaap/2023#OtherOperatingIncomeExpenseNethttp://fasb.org/us-gaap/2023#OtherOperatingIncomeExpenseNethttp://fasb.org/us-gaap/2023#OtherOperatingIncomeExpenseNet00000997802024-01-012024-03-3100000997802024-04-24xbrli:shares0000099780trn:ManufacturingMember2024-01-012024-03-31iso4217:USD0000099780trn:ManufacturingMember2023-01-012023-03-310000099780trn:RailcarLeasingAndServicesGroupMember2024-01-012024-03-310000099780trn:RailcarLeasingAndServicesGroupMember2023-01-012023-03-3100000997802023-01-012023-03-310000099780trn:OtherMember2024-01-012024-03-310000099780trn:OtherMember2023-01-012023-03-31iso4217:USDxbrli:shares00000997802024-03-3100000997802023-12-310000099780trn:RailcarLeasingAndServicesGroupMembertrn:PartiallyOwnedSubsidiariesMember2024-03-310000099780trn:RailcarLeasingAndServicesGroupMembertrn:PartiallyOwnedSubsidiariesMember2023-12-310000099780us-gaap:RecourseMember2024-03-310000099780us-gaap:RecourseMember2023-12-310000099780us-gaap:NonrecourseMembertrn:WhollyOwnedSubsidiariesMember2024-03-310000099780us-gaap:NonrecourseMembertrn:WhollyOwnedSubsidiariesMember2023-12-310000099780us-gaap:NonrecourseMembertrn:PartiallyOwnedSubsidiariesMember2024-03-310000099780us-gaap:NonrecourseMembertrn:PartiallyOwnedSubsidiariesMember2023-12-3100000997802022-12-3100000997802023-03-310000099780us-gaap:CommonStockMember2023-12-310000099780us-gaap:AdditionalPaidInCapitalMember2023-12-310000099780us-gaap:RetainedEarningsMember2023-12-310000099780us-gaap:AccumulatedOtherComprehensiveIncomeMember2023-12-310000099780us-gaap:TreasuryStockCommonMember2023-12-310000099780us-gaap:ParentMember2023-12-310000099780us-gaap:NoncontrollingInterestMember2023-12-310000099780us-gaap:RetainedEarningsMember2024-01-012024-03-310000099780us-gaap:ParentMember2024-01-012024-03-310000099780us-gaap:NoncontrollingInterestMember2024-01-012024-03-310000099780us-gaap:AccumulatedOtherComprehensiveIncomeMember2024-01-012024-03-310000099780us-gaap:AdditionalPaidInCapitalMember2024-01-012024-03-310000099780us-gaap:TreasuryStockCommonMember2024-01-012024-03-310000099780us-gaap:CommonStockMember2024-03-310000099780us-gaap:AdditionalPaidInCapitalMember2024-03-310000099780us-gaap:RetainedEarningsMember2024-03-310000099780us-gaap:AccumulatedOtherComprehensiveIncomeMember2024-03-310000099780us-gaap:TreasuryStockCommonMember2024-03-310000099780us-gaap:ParentMember2024-03-310000099780us-gaap:NoncontrollingInterestMember2024-03-310000099780us-gaap:CommonStockMember2022-12-310000099780us-gaap:AdditionalPaidInCapitalMember2022-12-310000099780us-gaap:RetainedEarningsMember2022-12-310000099780us-gaap:AccumulatedOtherComprehensiveIncomeMember2022-12-310000099780us-gaap:TreasuryStockCommonMember2022-12-310000099780us-gaap:ParentMember2022-12-310000099780us-gaap:NoncontrollingInterestMember2022-12-310000099780us-gaap:RetainedEarningsMember2023-01-012023-03-310000099780us-gaap:ParentMember2023-01-012023-03-310000099780us-gaap:NoncontrollingInterestMember2023-01-012023-03-310000099780us-gaap:AccumulatedOtherComprehensiveIncomeMember2023-01-012023-03-310000099780us-gaap:AdditionalPaidInCapitalMember2023-01-012023-03-310000099780us-gaap:TreasuryStockCommonMember2023-01-012023-03-310000099780us-gaap:CommonStockMember2023-03-310000099780us-gaap:AdditionalPaidInCapitalMember2023-03-310000099780us-gaap:RetainedEarningsMember2023-03-310000099780us-gaap:AccumulatedOtherComprehensiveIncomeMember2023-03-310000099780us-gaap:TreasuryStockCommonMember2023-03-310000099780us-gaap:ParentMember2023-03-310000099780us-gaap:NoncontrollingInterestMember2023-03-310000099780trn:RailcarLeasingAndServicesGroupMember2024-03-310000099780trn:RailcarLeasingAndServicesGroupMember2023-12-310000099780trn:RailProductsGroupMember2024-03-310000099780trn:RailProductsGroupMember2023-12-310000099780trn:RailProductsGroupMembertrn:ExternalCustomersMembertrn:RailProductsDomain2024-03-310000099780trn:RailcarLeasingAndServicesGroupMembertrn:RailProductsGroupMembertrn:RailProductsDomain2024-03-310000099780trn:RailProductsGroupMembertrn:RailProductsDomain2024-03-31xbrli:pure0000099780trn:RailProductsGroupMembertrn:SustainableRailcarConversionsMember2024-03-310000099780trn:RailcarLeasingAndServicesGroupMembertrn:LeasingAndManagementMember2024-03-310000099780trn:RailcarLeasingAndServicesGroupMembertrn:MaintenanceServicesDomain2024-03-310000099780srt:MinimumMember2024-03-310000099780srt:MaximumMember2024-03-310000099780trn:RailcarsOnLeaseMember2024-03-310000099780trn:OperatingAdministrativeAssetsMember2024-03-310000099780srt:MinimumMembertrn:RailcarLeasingAndServicesGroupMember2024-03-310000099780srt:MaximumMembertrn:RailcarLeasingAndServicesGroupMember2024-03-310000099780srt:MinimumMember2024-01-012024-03-310000099780srt:MaximumMember2024-01-012024-03-310000099780trn:HoldenAmericaMembertrn:HoldenAmericaMember2022-12-310000099780trn:HoldenAmericaMembertrn:HoldenAmericaMember2023-12-310000099780trn:HoldenAmericaMembertrn:HoldenAmericaMember2024-03-310000099780trn:RSILogisticsMember2023-12-310000099780trn:RSILogisticsMember2023-01-012023-12-310000099780trn:SaleOfHighwayProductsMember2024-01-012024-03-310000099780trn:SaleOfHighwayProductsMember2023-01-012023-03-310000099780us-gaap:DesignatedAsHedgingInstrumentMembertrn:InterestRateSwapExpired2018SecuredRailcarEquipmentNotesMember2024-03-310000099780us-gaap:DesignatedAsHedgingInstrumentMembertrn:InterestRateSwapExpired2018SecuredRailcarEquipmentNotesMemberus-gaap:AccumulatedNetGainLossFromDesignatedOrQualifyingCashFlowHedgesMember2024-03-310000099780us-gaap:DesignatedAsHedgingInstrumentMembertrn:InterestRateSwapExpired2018SecuredRailcarEquipmentNotesMemberus-gaap:AccumulatedNetGainLossFromCashFlowHedgesAttributableToNoncontrollingInterestMember2024-03-310000099780trn:InterestRateSwapExpiredTributeRailSecuredRailcarEquipmentNotesMemberus-gaap:DesignatedAsHedgingInstrumentMember2024-03-310000099780us-gaap:DesignatedAsHedgingInstrumentMembertrn:InterestRateSwapExpiredTributeRailSecuredRailcarEquipmentNotesMemberus-gaap:AccumulatedNetGainLossFromDesignatedOrQualifyingCashFlowHedgesMember2024-03-310000099780us-gaap:DesignatedAsHedgingInstrumentMembertrn:InterestRateSwapExpiredTributeRailSecuredRailcarEquipmentNotesMemberus-gaap:AccumulatedNetGainLossFromCashFlowHedgesAttributableToNoncontrollingInterestMember2024-03-310000099780us-gaap:DesignatedAsHedgingInstrumentMemberus-gaap:InterestRateCapMember2024-03-310000099780us-gaap:DesignatedAsHedgingInstrumentMemberus-gaap:InterestRateCapMemberus-gaap:AccumulatedNetGainLossFromDesignatedOrQualifyingCashFlowHedgesMember2024-03-310000099780us-gaap:DesignatedAsHedgingInstrumentMemberus-gaap:InterestRateCapMemberus-gaap:AccumulatedNetGainLossFromCashFlowHedgesAttributableToNoncontrollingInterestMember2024-03-310000099780us-gaap:DesignatedAsHedgingInstrumentMembertrn:InterestRateSwap2017PromissoryNotesMember2024-03-310000099780us-gaap:DesignatedAsHedgingInstrumentMembertrn:InterestRateSwap2017PromissoryNotesMemberus-gaap:AccumulatedNetGainLossFromDesignatedOrQualifyingCashFlowHedgesMember2024-03-310000099780us-gaap:DesignatedAsHedgingInstrumentMembertrn:InterestRateSwap2017PromissoryNotesMemberus-gaap:AccumulatedNetGainLossFromCashFlowHedgesAttributableToNoncontrollingInterestMember2024-03-310000099780us-gaap:DesignatedAsHedgingInstrumentMembertrn:InterestRateSwapTRL2023TermLoanMember2024-03-310000099780us-gaap:DesignatedAsHedgingInstrumentMembertrn:InterestRateSwapTRL2023TermLoanMemberus-gaap:AccumulatedNetGainLossFromDesignatedOrQualifyingCashFlowHedgesMember2024-03-310000099780us-gaap:DesignatedAsHedgingInstrumentMemberus-gaap:AccumulatedNetGainLossFromCashFlowHedgesAttributableToNoncontrollingInterestMembertrn:InterestRateSwapTRL2023TermLoanMember2024-03-310000099780us-gaap:DesignatedAsHedgingInstrumentMembertrn:InterestRateSwapExpired2018SecuredRailcarEquipmentNotesMemberus-gaap:InterestExpenseMember2024-01-012024-03-310000099780us-gaap:DesignatedAsHedgingInstrumentMembertrn:InterestRateSwapExpired2018SecuredRailcarEquipmentNotesMemberus-gaap:InterestExpenseMember2023-01-012023-03-310000099780us-gaap:DesignatedAsHedgingInstrumentMembertrn:InterestRateSwapExpired2018SecuredRailcarEquipmentNotesMemberus-gaap:InterestExpenseMember2024-03-310000099780us-gaap:DesignatedAsHedgingInstrumentMembertrn:InterestRateSwapExpiredTRIPHoldingsWarehouseLoanMemberus-gaap:InterestExpenseMember2024-01-012024-03-310000099780us-gaap:DesignatedAsHedgingInstrumentMembertrn:InterestRateSwapExpiredTRIPHoldingsWarehouseLoanMemberus-gaap:InterestExpenseMember2023-01-012023-03-310000099780us-gaap:DesignatedAsHedgingInstrumentMembertrn:InterestRateSwapExpiredTRIPHoldingsWarehouseLoanMemberus-gaap:InterestExpenseMember2024-03-310000099780us-gaap:DesignatedAsHedgingInstrumentMembertrn:InterestRateSwapExpiredTributeRailSecuredRailcarEquipmentNotesMemberus-gaap:InterestExpenseMember2024-01-012024-03-310000099780us-gaap:DesignatedAsHedgingInstrumentMembertrn:InterestRateSwapExpiredTributeRailSecuredRailcarEquipmentNotesMemberus-gaap:InterestExpenseMember2023-01-012023-03-310000099780us-gaap:DesignatedAsHedgingInstrumentMembertrn:InterestRateSwapExpiredTributeRailSecuredRailcarEquipmentNotesMemberus-gaap:InterestExpenseMember2024-03-310000099780us-gaap:DesignatedAsHedgingInstrumentMemberus-gaap:InterestRateCapMemberus-gaap:InterestExpenseMember2024-01-012024-03-310000099780us-gaap:DesignatedAsHedgingInstrumentMemberus-gaap:InterestRateCapMemberus-gaap:InterestExpenseMember2023-01-012023-03-310000099780us-gaap:DesignatedAsHedgingInstrumentMemberus-gaap:InterestRateCapMemberus-gaap:InterestExpenseMember2024-03-310000099780us-gaap:DesignatedAsHedgingInstrumentMembertrn:InterestRateSwap2017PromissoryNotesMemberus-gaap:InterestExpenseMember2024-01-012024-03-310000099780us-gaap:DesignatedAsHedgingInstrumentMembertrn:InterestRateSwap2017PromissoryNotesMemberus-gaap:InterestExpenseMember2023-01-012023-03-310000099780us-gaap:DesignatedAsHedgingInstrumentMembertrn:InterestRateSwap2017PromissoryNotesMemberus-gaap:InterestExpenseMember2024-03-310000099780us-gaap:DesignatedAsHedgingInstrumentMemberus-gaap:InterestExpenseMembertrn:InterestRateSwapTRL2023TermLoanMember2024-01-012024-03-310000099780us-gaap:DesignatedAsHedgingInstrumentMemberus-gaap:InterestExpenseMembertrn:InterestRateSwapTRL2023TermLoanMember2023-01-012023-03-310000099780us-gaap:DesignatedAsHedgingInstrumentMemberus-gaap:InterestExpenseMembertrn:InterestRateSwapTRL2023TermLoanMember2024-03-310000099780us-gaap:DesignatedAsHedgingInstrumentMemberus-gaap:ForeignExchangeForwardMember2024-03-310000099780us-gaap:DesignatedAsHedgingInstrumentMemberus-gaap:ForeignExchangeForwardMemberus-gaap:AccumulatedNetGainLossFromDesignatedOrQualifyingCashFlowHedgesMember2024-03-310000099780us-gaap:DesignatedAsHedgingInstrumentMemberus-gaap:ForeignExchangeForwardMemberus-gaap:InterestExpenseMember2024-01-012024-03-310000099780us-gaap:DesignatedAsHedgingInstrumentMemberus-gaap:ForeignExchangeForwardMemberus-gaap:InterestExpenseMember2023-01-012023-03-310000099780us-gaap:DesignatedAsHedgingInstrumentMemberus-gaap:ForeignExchangeForwardMemberus-gaap:InterestExpenseMember2024-03-310000099780us-gaap:DesignatedAsHedgingInstrumentMemberus-gaap:ForeignExchangeOptionMember2024-03-310000099780us-gaap:DesignatedAsHedgingInstrumentMemberus-gaap:ForeignExchangeOptionMemberus-gaap:AccumulatedNetGainLossFromDesignatedOrQualifyingCashFlowHedgesMember2024-03-310000099780us-gaap:DesignatedAsHedgingInstrumentMemberus-gaap:ForeignExchangeOptionMemberus-gaap:InterestExpenseMember2024-01-012024-03-310000099780us-gaap:DesignatedAsHedgingInstrumentMemberus-gaap:ForeignExchangeOptionMemberus-gaap:InterestExpenseMember2023-01-012023-03-310000099780us-gaap:DesignatedAsHedgingInstrumentMemberus-gaap:ForeignExchangeOptionMemberus-gaap:InterestExpenseMember2024-03-310000099780us-gaap:NondesignatedMembertrn:TILCWarehouseBackToBackSwapAgreementsOpenMember2024-03-310000099780us-gaap:NondesignatedMemberus-gaap:OtherOperatingIncomeExpenseMembertrn:TILCWarehouseBackToBackSwapAgreementsOpenMember2024-01-012024-03-310000099780us-gaap:NondesignatedMemberus-gaap:OtherOperatingIncomeExpenseMembertrn:TILCWarehouseBackToBackSwapAgreementsOpenMember2023-01-012023-03-310000099780us-gaap:NondesignatedMembertrn:TILCBackToBackSwapAgreementsOpenMember2024-03-310000099780us-gaap:NondesignatedMemberus-gaap:OtherOperatingIncomeExpenseMembertrn:TILCBackToBackSwapAgreementsOpenMember2024-01-012024-03-310000099780us-gaap:NondesignatedMemberus-gaap:OtherOperatingIncomeExpenseMembertrn:TILCBackToBackSwapAgreementsOpenMember2023-01-012023-03-310000099780us-gaap:NondesignatedMembertrn:TILCWarehouseBackToBackSwapAgreementsExpiredMember2024-03-310000099780us-gaap:NondesignatedMemberus-gaap:OtherOperatingIncomeExpenseMembertrn:TILCWarehouseBackToBackSwapAgreementsExpiredMember2024-01-012024-03-310000099780us-gaap:NondesignatedMemberus-gaap:OtherOperatingIncomeExpenseMembertrn:TILCWarehouseBackToBackSwapAgreementsExpiredMember2023-01-012023-03-310000099780us-gaap:NondesignatedMembertrn:TILCBackToBackSwapAgreementsExpiredMember2024-03-310000099780us-gaap:NondesignatedMembertrn:TILCBackToBackSwapAgreementsExpiredMemberus-gaap:OtherOperatingIncomeExpenseMember2024-01-012024-03-310000099780us-gaap:NondesignatedMembertrn:TILCBackToBackSwapAgreementsExpiredMemberus-gaap:OtherOperatingIncomeExpenseMember2023-01-012023-03-310000099780us-gaap:NondesignatedMembertrn:TILCBackToBackSwapAgreementsOpenMember2024-01-012024-03-310000099780us-gaap:FairValueInputsLevel1Member2024-01-012024-03-310000099780us-gaap:FairValueInputsLevel1Memberus-gaap:FairValueMeasurementsRecurringMember2024-03-310000099780us-gaap:FairValueInputsLevel1Memberus-gaap:FairValueMeasurementsRecurringMember2023-12-310000099780us-gaap:FairValueInputsLevel2Member2024-01-012024-03-310000099780us-gaap:DesignatedAsHedgingInstrumentMemberus-gaap:OtherAssetsMemberus-gaap:InterestRateSwapMemberus-gaap:FairValueInputsLevel2Memberus-gaap:FairValueMeasurementsRecurringMember2024-03-310000099780us-gaap:DesignatedAsHedgingInstrumentMemberus-gaap:OtherAssetsMemberus-gaap:InterestRateSwapMemberus-gaap:FairValueInputsLevel2Memberus-gaap:FairValueMeasurementsRecurringMember2023-12-310000099780us-gaap:DesignatedAsHedgingInstrumentMemberus-gaap:ForeignExchangeForwardMemberus-gaap:OtherAssetsMemberus-gaap:FairValueInputsLevel2Memberus-gaap:FairValueMeasurementsRecurringMember2024-03-310000099780us-gaap:DesignatedAsHedgingInstrumentMemberus-gaap:ForeignExchangeForwardMemberus-gaap:OtherAssetsMemberus-gaap:FairValueInputsLevel2Memberus-gaap:FairValueMeasurementsRecurringMember2023-12-310000099780us-gaap:DesignatedAsHedgingInstrumentMemberus-gaap:ForeignExchangeOptionMemberus-gaap:OtherAssetsMemberus-gaap:FairValueInputsLevel2Memberus-gaap:FairValueMeasurementsRecurringMember2024-03-310000099780us-gaap:DesignatedAsHedgingInstrumentMemberus-gaap:ForeignExchangeOptionMemberus-gaap:OtherAssetsMemberus-gaap:FairValueInputsLevel2Memberus-gaap:FairValueMeasurementsRecurringMember2023-12-310000099780us-gaap:NondesignatedMemberus-gaap:OtherAssetsMemberus-gaap:FairValueInputsLevel2Membertrn:TILCWarehouseBackToBackSwapAgreementsExpiredMemberus-gaap:FairValueMeasurementsRecurringMember2024-03-310000099780us-gaap:NondesignatedMemberus-gaap:OtherAssetsMemberus-gaap:FairValueInputsLevel2Membertrn:TILCWarehouseBackToBackSwapAgreementsExpiredMemberus-gaap:FairValueMeasurementsRecurringMember2023-12-310000099780us-gaap:OtherAssetsMemberus-gaap:FairValueInputsLevel2Memberus-gaap:FairValueMeasurementsRecurringMember2024-03-310000099780us-gaap:OtherAssetsMemberus-gaap:FairValueInputsLevel2Memberus-gaap:FairValueMeasurementsRecurringMember2023-12-310000099780us-gaap:DesignatedAsHedgingInstrumentMemberus-gaap:AccruedLiabilitiesMemberus-gaap:InterestRateSwapMemberus-gaap:FairValueInputsLevel2Memberus-gaap:FairValueMeasurementsRecurringMember2024-03-310000099780us-gaap:DesignatedAsHedgingInstrumentMemberus-gaap:AccruedLiabilitiesMemberus-gaap:InterestRateSwapMemberus-gaap:FairValueInputsLevel2Memberus-gaap:FairValueMeasurementsRecurringMember2023-12-310000099780us-gaap:NondesignatedMembertrn:TILCBackToBackSwapAgreementsExpiredMemberus-gaap:AccruedLiabilitiesMemberus-gaap:FairValueInputsLevel2Memberus-gaap:FairValueMeasurementsRecurringMember2024-03-310000099780us-gaap:NondesignatedMembertrn:TILCBackToBackSwapAgreementsExpiredMemberus-gaap:AccruedLiabilitiesMemberus-gaap:FairValueInputsLevel2Memberus-gaap:FairValueMeasurementsRecurringMember2023-12-310000099780us-gaap:AccruedLiabilitiesMemberus-gaap:FairValueInputsLevel2Memberus-gaap:FairValueMeasurementsRecurringMember2024-03-310000099780us-gaap:AccruedLiabilitiesMemberus-gaap:FairValueInputsLevel2Memberus-gaap:FairValueMeasurementsRecurringMember2023-12-310000099780us-gaap:FairValueInputsLevel3Memberus-gaap:FairValueMeasurementsRecurringMember2023-12-310000099780us-gaap:FairValueInputsLevel3Memberus-gaap:FairValueMeasurementsRecurringMember2024-03-31trn:segment0000099780trn:RailcarLeasingAndServicesGroupMember2024-01-012024-03-310000099780trn:RailProductsGroupMember2024-01-012024-03-310000099780us-gaap:IntersegmentEliminationMembertrn:RailcarLeasingAndServicesGroupMember2024-01-012024-03-310000099780trn:RailProductsGroupMemberus-gaap:IntersegmentEliminationMember2024-01-012024-03-310000099780us-gaap:IntersegmentEliminationMember2024-01-012024-03-310000099780us-gaap:OperatingSegmentsMembertrn:RailcarLeasingAndServicesGroupMember2024-01-012024-03-310000099780trn:RailProductsGroupMemberus-gaap:OperatingSegmentsMember2024-01-012024-03-310000099780us-gaap:OperatingSegmentsMember2024-01-012024-03-310000099780trn:RailcarLeasingAndServicesGroupMember2023-01-012023-03-310000099780trn:RailProductsGroupMember2023-01-012023-03-310000099780us-gaap:IntersegmentEliminationMembertrn:RailcarLeasingAndServicesGroupMember2023-01-012023-03-310000099780trn:RailProductsGroupMemberus-gaap:IntersegmentEliminationMember2023-01-012023-03-310000099780us-gaap:IntersegmentEliminationMember2023-01-012023-03-310000099780us-gaap:OperatingSegmentsMembertrn:RailcarLeasingAndServicesGroupMember2023-01-012023-03-310000099780trn:RailProductsGroupMemberus-gaap:OperatingSegmentsMember2023-01-012023-03-310000099780us-gaap:OperatingSegmentsMember2023-01-012023-03-310000099780us-gaap:CorporateMember2024-01-012024-03-310000099780us-gaap:CorporateMember2023-01-012023-03-310000099780trn:RailcarLeasingAndServicesGroupMembertrn:PartiallyOwnedSubsidiariesMember2024-01-012024-03-31trn:subsidiary0000099780trn:RailcarLeasingAndServicesGroupMembertrn:PartiallyOwnedSubsidiariesMember2024-03-31trn:board_member0000099780trn:PartiallyOwnedSubsidiariesMembertrn:RailcarLeasingAndServicesGroupMember2024-03-310000099780trn:PartiallyOwnedSubsidiariesMember2024-03-310000099780trn:RailProductsGroupMembertrn:PartiallyOwnedSubsidiariesMember2024-03-310000099780trn:SignalRailHoldingsLLCMember2024-03-310000099780trn:SignalRailHoldingsLLCMember2021-07-012024-03-310000099780us-gaap:OperatingSegmentsMembertrn:RailcarLeasingAndServicesGroupMembertrn:LeasingAndManagementMember2024-01-012024-03-310000099780us-gaap:OperatingSegmentsMembertrn:RailcarLeasingAndServicesGroupMembertrn:LeasingAndManagementMember2023-01-012023-03-310000099780us-gaap:OperatingSegmentsMembertrn:RailcarLeasingAndServicesGroupMembertrn:MaintenanceServicesDomain2024-01-012024-03-310000099780us-gaap:OperatingSegmentsMembertrn:RailcarLeasingAndServicesGroupMembertrn:MaintenanceServicesDomain2023-01-012023-03-310000099780trn:DigitalLogisticsServicesMemberus-gaap:OperatingSegmentsMembertrn:RailcarLeasingAndServicesGroupMember2024-01-012024-03-310000099780trn:DigitalLogisticsServicesMemberus-gaap:OperatingSegmentsMembertrn:RailcarLeasingAndServicesGroupMember2023-01-012023-03-310000099780us-gaap:RailroadTransportationEquipmentMember2024-01-012024-03-310000099780us-gaap:RailroadTransportationEquipmentMember2023-01-012023-03-310000099780us-gaap:OperatingSegmentsMembertrn:RailcarLeasingAndServicesGroupMembertrn:SustainableRailcarConversionsMember2023-01-012023-03-310000099780trn:SalesofLeasedRailcarsDomainus-gaap:OperatingSegmentsMembertrn:RailcarLeasingAndServicesGroupMember2024-01-012024-03-310000099780trn:SalesofLeasedRailcarsDomainus-gaap:OperatingSegmentsMembertrn:RailcarLeasingAndServicesGroupMember2023-01-012023-03-310000099780us-gaap:OperatingSegmentsMembertrn:RailcarLeasingAndServicesGroupMembertrn:SalesOfLeasedRailcarsExcludingSalesTypeLeasesMember2024-01-012024-03-310000099780us-gaap:OperatingSegmentsMembertrn:RailcarLeasingAndServicesGroupMembertrn:SalesOfLeasedRailcarsExcludingSalesTypeLeasesMember2023-01-012023-03-310000099780us-gaap:RailroadTransportationEquipmentMembertrn:RailcarLeasingAndServicesGroupMember2024-03-310000099780us-gaap:SecuredDebtMembertrn:RailcarLeasingAndServicesGroupMembertrn:WhollyOwnedSubsidiariesMember2024-03-310000099780trn:RailcarLeasingAndServicesGroupMembertrn:WhollyOwnedSubsidiariesMember2024-03-310000099780us-gaap:SecuredDebtMembertrn:RailcarLeasingAndServicesGroupMembertrn:TripHoldingsMember2024-03-310000099780us-gaap:SecuredDebtMembertrn:RailcarLeasingAndServicesGroupMembertrn:TRP2021SecuredRailcarEquipmentNotesRIV2013Membertrn:RIV2013HoldingsMember2024-03-310000099780trn:OtherThirdPartiesMember2024-01-012024-03-310000099780trn:OtherThirdPartiesMembertrn:RailcarLeasingAndServicesGroupMember2024-03-310000099780us-gaap:PropertyLeaseGuaranteeMembertrn:RailcarLeasingAndServicesGroupMember2024-03-310000099780trn:RailcarsOnLeaseMemberus-gaap:OperatingSegmentsMembertrn:WhollyOwnedSubsidiariesMember2024-03-310000099780trn:RailcarsOnLeaseMemberus-gaap:OperatingSegmentsMembertrn:WhollyOwnedSubsidiariesMember2023-12-310000099780trn:RailcarsOnLeaseMemberus-gaap:OperatingSegmentsMembertrn:PartiallyOwnedSubsidiariesMember2024-03-310000099780trn:RailcarsOnLeaseMemberus-gaap:OperatingSegmentsMembertrn:PartiallyOwnedSubsidiariesMember2023-12-310000099780trn:RailcarsOnLeaseMemberus-gaap:IntersegmentEliminationMember2024-03-310000099780trn:RailcarsOnLeaseMemberus-gaap:IntersegmentEliminationMember2023-12-310000099780trn:RailcarsOnLeaseMember2023-12-310000099780us-gaap:LandMembertrn:OperatingAdministrativeAssetsMember2024-03-310000099780us-gaap:LandMembertrn:OperatingAdministrativeAssetsMember2023-12-310000099780us-gaap:BuildingAndBuildingImprovementsMembertrn:OperatingAdministrativeAssetsMember2024-03-310000099780us-gaap:BuildingAndBuildingImprovementsMembertrn:OperatingAdministrativeAssetsMember2023-12-310000099780us-gaap:MachineryAndEquipmentMembertrn:OperatingAdministrativeAssetsMember2024-03-310000099780us-gaap:MachineryAndEquipmentMembertrn:OperatingAdministrativeAssetsMember2023-12-310000099780us-gaap:ConstructionInProgressMembertrn:OperatingAdministrativeAssetsMember2024-03-310000099780us-gaap:ConstructionInProgressMembertrn:OperatingAdministrativeAssetsMember2023-12-310000099780trn:OperatingAdministrativeAssetsMember2024-03-310000099780trn:OperatingAdministrativeAssetsMember2023-12-310000099780us-gaap:LineOfCreditMemberus-gaap:CorporateMemberus-gaap:RevolvingCreditFacilityMember2024-03-310000099780us-gaap:LineOfCreditMemberus-gaap:CorporateMemberus-gaap:RevolvingCreditFacilityMember2023-12-310000099780trn:SeniorNotesDue2024Memberus-gaap:CorporateMember2024-03-310000099780trn:SeniorNotesDue2024Memberus-gaap:CorporateMember2023-12-310000099780us-gaap:CorporateMembertrn:SeniorNotesDue2028Member2024-03-310000099780us-gaap:CorporateMembertrn:SeniorNotesDue2028Member2023-12-310000099780us-gaap:CorporateMember2024-03-310000099780us-gaap:CorporateMember2023-12-310000099780us-gaap:SecuredDebtMembertrn:RailcarLeasingAndServicesGroupMembertrn:WhollyOwnedSubsidiariesMember2024-03-310000099780us-gaap:SecuredDebtMembertrn:RailcarLeasingAndServicesGroupMembertrn:WhollyOwnedSubsidiariesMember2023-12-310000099780trn:A2017SecuredRailcarEquipmentNotesMemberDomaintrn:PromissoryNotesMembertrn:RailcarLeasingAndServicesGroupMembertrn:WhollyOwnedSubsidiariesMember2024-03-310000099780trn:A2017SecuredRailcarEquipmentNotesMemberDomaintrn:PromissoryNotesMembertrn:RailcarLeasingAndServicesGroupMembertrn:WhollyOwnedSubsidiariesMember2023-12-310000099780us-gaap:LineOfCreditMembertrn:TRL2023TermLoanMembertrn:RailcarLeasingAndServicesGroupMembertrn:WhollyOwnedSubsidiariesMember2024-03-310000099780us-gaap:LineOfCreditMembertrn:TRL2023TermLoanMembertrn:RailcarLeasingAndServicesGroupMembertrn:WhollyOwnedSubsidiariesMember2023-12-310000099780us-gaap:LineOfCreditMembertrn:TilcWarehouseFacilityMembertrn:RailcarLeasingAndServicesGroupMembertrn:TILCMemberus-gaap:RevolvingCreditFacilityMember2024-03-310000099780us-gaap:LineOfCreditMembertrn:TilcWarehouseFacilityMembertrn:RailcarLeasingAndServicesGroupMembertrn:TILCMemberus-gaap:RevolvingCreditFacilityMember2023-12-310000099780trn:OtherEquipmentFinancingMembertrn:RailcarLeasingAndServicesGroupMembertrn:WhollyOwnedSubsidiariesMember2024-03-310000099780trn:OtherEquipmentFinancingMembertrn:RailcarLeasingAndServicesGroupMembertrn:WhollyOwnedSubsidiariesMember2023-12-310000099780trn:RailcarLeasingAndServicesGroupMembertrn:WhollyOwnedSubsidiariesMember2023-12-310000099780us-gaap:NonrecourseMembertrn:RailcarLeasingAndServicesGroupMembertrn:WhollyOwnedSubsidiariesMember2024-03-310000099780us-gaap:NonrecourseMembertrn:RailcarLeasingAndServicesGroupMembertrn:WhollyOwnedSubsidiariesMember2023-12-310000099780us-gaap:SecuredDebtMembertrn:RailcarLeasingAndServicesGroupMembertrn:PartiallyOwnedSubsidiariesMember2024-03-310000099780us-gaap:SecuredDebtMembertrn:RailcarLeasingAndServicesGroupMembertrn:PartiallyOwnedSubsidiariesMember2023-12-310000099780us-gaap:NonrecourseMembertrn:RailcarLeasingAndServicesGroupMembertrn:PartiallyOwnedSubsidiariesMember2024-03-310000099780us-gaap:NonrecourseMembertrn:RailcarLeasingAndServicesGroupMembertrn:PartiallyOwnedSubsidiariesMember2023-12-310000099780us-gaap:NonrecourseMember2024-03-310000099780us-gaap:NonrecourseMember2023-12-310000099780trn:A775SeniorNotesDue2028Memberus-gaap:CorporateMembertrn:SeniorNotesDue2028Member2024-03-310000099780trn:A4.55SeniorNotesDueOctober2024Membertrn:SeniorNotesDue2024Memberus-gaap:CorporateMember2024-03-310000099780us-gaap:FairValueInputsLevel2Member2024-03-310000099780us-gaap:FairValueInputsLevel2Member2023-12-310000099780us-gaap:FairValueInputsLevel3Member2024-03-310000099780us-gaap:FairValueInputsLevel3Member2023-12-310000099780us-gaap:LineOfCreditMemberus-gaap:CorporateMemberus-gaap:RevolvingCreditFacilityMember2024-01-012024-03-310000099780us-gaap:LetterOfCreditMemberus-gaap:LineOfCreditMemberus-gaap:CorporateMember2024-03-310000099780us-gaap:LineOfCreditMembersrt:MinimumMemberus-gaap:CorporateMemberus-gaap:RevolvingCreditFacilityMember2024-03-310000099780us-gaap:LineOfCreditMembersrt:MaximumMemberus-gaap:CorporateMemberus-gaap:RevolvingCreditFacilityMember2024-03-310000099780us-gaap:LineOfCreditMembertrn:TilcWarehouseFacilityMembertrn:RailcarLeasingAndServicesGroupMembertrn:TILCMemberus-gaap:RevolvingCreditFacilityMember2024-01-012024-03-310000099780us-gaap:AccumulatedNetGainLossFromDesignatedOrQualifyingCashFlowHedgesMember2023-12-310000099780us-gaap:AccumulatedDefinedBenefitPlansAdjustmentNetUnamortizedGainLossMember2023-12-310000099780us-gaap:AccumulatedNetGainLossFromDesignatedOrQualifyingCashFlowHedgesMember2024-01-012024-03-310000099780us-gaap:AccumulatedDefinedBenefitPlansAdjustmentNetUnamortizedGainLossMember2024-01-012024-03-310000099780us-gaap:AccumulatedGainLossNetCashFlowHedgeNoncontrollingInterestMember2024-01-012024-03-310000099780us-gaap:AccumulatedNetGainLossFromDesignatedOrQualifyingCashFlowHedgesMember2024-03-310000099780us-gaap:AccumulatedDefinedBenefitPlansAdjustmentNetUnamortizedGainLossMember2024-03-310000099780trn:December2022ShareRepurchaseProgramMember2022-12-090000099780trn:December2022ShareRepurchaseProgramMember2024-01-012024-03-310000099780trn:December2022ShareRepurchaseProgramMember2023-01-012023-03-310000099780us-gaap:EmployeeStockOptionMember2024-01-012024-03-310000099780srt:MinimumMemberus-gaap:RestrictedStockUnitsRSUMember2024-01-012024-03-310000099780srt:MaximumMemberus-gaap:RestrictedStockUnitsRSUMember2024-01-012024-03-310000099780trn:RestrictedShareAwardsMember2024-01-012024-03-310000099780us-gaap:PerformanceSharesMember2024-01-012024-03-310000099780us-gaap:RestrictedStockUnitsRSUMember2024-01-012024-03-310000099780us-gaap:RestrictedStockMember2024-01-012024-03-310000099780us-gaap:RestrictedStockMember2023-01-012023-03-310000099780us-gaap:EmployeeStockOptionMember2023-01-012023-03-310000099780trn:JoshuaHarmanFalseClaimsActMembertrn:HighwayProductsLitigationMember2015-06-092015-06-090000099780trn:StateCountyandMunicipalActionsMembertrn:HighwayProductsLitigationMember2024-03-310000099780trn:OhioTrainDerailmentLitigationMembertrn:OhioTrainDerailmentLitigationMember2024-03-310000099780us-gaap:AccruedLiabilitiesMember2024-03-310000099780trn:EnvironmentalAndWorkplaceMattersMember2024-03-310000099780us-gaap:DamageFromFireExplosionOrOtherHazardMember2024-03-310000099780us-gaap:DamageFromFireExplosionOrOtherHazardMember2024-01-012024-03-31
UNITED STATES SECURITIES AND EXCHANGE COMMISSION
Washington, D.C. 20549
Form 10-Q
|
|
|
|
|
|
| (Mark One) |
| ☑ |
QUARTERLY REPORT PURSUANT TO SECTION 13 OR 15(d) OF THE SECURITIES EXCHANGE ACT OF 1934 |
FOR THE QUARTERLY PERIOD ENDED MARCH 31, 2024
|
|
|
|
|
|
|
OR |
| ☐ |
TRANSITION REPORT PURSUANT TO SECTION 13 OR 15(d) OF THE SECURITIES EXCHANGE ACT OF 1934 |
For the transition period from _________ to _________ .
Commission File Number 1-6903
(Exact name of registrant as specified in its charter)
|
|
|
|
|
|
|
|
|
|
|
|
| Delaware |
75-0225040 |
| (State or Other Jurisdiction of Incorporation or Organization) |
(I.R.S. Employer Identification No.) |
| 14221 N. Dallas Parkway, Suite 1100 |
|
| Dallas, |
Texas |
|
75254-2957 |
(Address of principal executive offices) |
(Zip Code) |
(214) 631-4420
(Registrant's telephone number, including area code)
Securities registered pursuant to Section 12(b) of the Act:
|
|
|
|
|
|
|
|
|
| Title of each class |
Trading Symbol(s) |
Name of each exchange
on which registered
|
| Common Stock |
TRN |
New York Stock Exchange |
Indicate by check mark whether the Registrant (1) has filed all reports required to be filed by Section 13 or 15(d) of the Securities Exchange Act of 1934 during the preceding 12 months (or for such shorter period that the Registrant was required to file such reports), and (2) has been subject to such filing requirements for the past 90 days. Yes þ No ¨
Indicate by check mark whether the registrant has submitted electronically every Interactive Data File required to be submitted pursuant to Rule 405 of Regulation S-T (§ 232.405 of this chapter) during the preceding 12 months (or for such shorter period that the registrant was required to submit such files). Yes þ No ¨
Indicate by check mark whether the registrant is a large accelerated filer, an accelerated filer, a non-accelerated filer, a smaller reporting company, or an emerging growth company. See the definitions of “large accelerated filer,” “accelerated filer,” “smaller reporting company,” and "emerging growth company" in Rule 12b-2 of the Exchange Act.
Large accelerated filer þ Accelerated filer ¨ Non-accelerated filer ¨
Smaller reporting company ☐ Emerging growth company ☐
If an emerging growth company, indicate by check mark if the registrant has elected not to use the extended transition period for complying with any new or revised financial accounting standards provided pursuant to Section 13(a) of the Exchange Act. ¨
Indicate by check mark whether the Registrant is a shell company (as defined in Rule 12b-2 of the Exchange Act).
Yes ☐ No þ
At April 24, 2024, the number of shares of common stock, $0.01 par value, outstanding was 81,835,835.
TRINITY INDUSTRIES, INC.
FORM 10-Q
TABLE OF CONTENTS
PART I
Item 1. Financial Statements
Trinity Industries, Inc. and Subsidiaries
Consolidated Statements of Operations
(unaudited)
|
|
|
|
|
|
|
|
|
|
|
|
|
|
|
|
|
|
|
Three Months Ended
March 31, |
| |
|
|
|
|
2024 |
|
2023 |
| |
|
|
|
|
(in millions, except per share amounts) |
Revenues: |
|
|
|
|
|
|
|
| Manufacturing |
|
|
|
|
$ |
525.3 |
|
|
$ |
409.0 |
|
| Leasing & Services |
|
|
|
|
284.3 |
|
|
232.7 |
|
|
|
|
|
|
809.6 |
|
|
641.7 |
|
Operating costs: |
|
|
|
|
|
|
|
Cost of revenues: |
|
|
|
|
|
|
|
| Manufacturing |
|
|
|
|
476.3 |
|
|
391.9 |
|
| Leasing & Services |
|
|
|
|
168.6 |
|
|
146.6 |
|
|
|
|
|
|
644.9 |
|
|
538.5 |
|
Selling, engineering, and administrative expenses: |
|
|
|
|
|
|
|
| Manufacturing |
|
|
|
|
7.7 |
|
|
7.0 |
|
| Leasing & Services |
|
|
|
|
18.1 |
|
|
16.9 |
|
| Corporate & other |
|
|
|
|
26.5 |
|
|
26.0 |
|
|
|
|
|
|
52.3 |
|
|
49.9 |
|
Gains on dispositions of property: |
|
|
|
|
|
|
|
| Lease portfolio sales |
|
|
|
|
2.1 |
|
|
13.5 |
|
| Other |
|
|
|
|
0.7 |
|
|
1.8 |
|
|
|
|
|
|
2.8 |
|
|
15.3 |
|
|
|
|
|
|
|
|
|
| Restructuring activities, net |
|
|
|
|
— |
|
|
(0.4) |
|
| Total operating profit |
|
|
|
|
115.2 |
|
|
69.0 |
|
Other (income) expense: |
|
|
|
|
|
|
|
| Interest expense, net |
|
|
|
|
69.1 |
|
|
62.1 |
|
|
|
|
|
|
|
|
|
|
|
|
|
|
|
|
|
| Other, net |
|
|
|
|
3.4 |
|
|
1.6 |
|
|
|
|
|
|
72.5 |
|
|
63.7 |
|
| Income from continuing operations before income taxes |
|
|
|
|
42.7 |
|
|
5.3 |
|
Provision (benefit) for income taxes: |
|
|
|
|
|
|
|
| Current |
|
|
|
|
13.1 |
|
|
0.9 |
|
| Deferred |
|
|
|
|
(2.1) |
|
|
(12.4) |
|
|
|
|
|
|
11.0 |
|
|
(11.5) |
|
| Income from continuing operations |
|
|
|
|
31.7 |
|
|
16.8 |
|
Loss from discontinued operations, net of benefit for income taxes of $1.3 and $0.8 |
|
|
|
|
(4.3) |
|
|
(3.1) |
|
|
|
|
|
|
|
|
|
| Net income |
|
|
|
|
27.4 |
|
|
13.7 |
|
| Net income attributable to noncontrolling interest |
|
|
|
|
3.7 |
|
|
9.3 |
|
| Net income attributable to Trinity Industries, Inc. |
|
|
|
|
$ |
23.7 |
|
|
$ |
4.4 |
|
|
|
|
|
|
|
|
|
| Basic earnings per common share: |
|
|
|
|
|
|
|
| Income from continuing operations |
|
|
|
|
$ |
0.34 |
|
|
$ |
0.09 |
|
| Loss from discontinued operations |
|
|
|
|
(0.05) |
|
|
(0.04) |
|
| Basic net income attributable to Trinity Industries, Inc. |
|
|
|
|
$ |
0.29 |
|
|
$ |
0.05 |
|
| Diluted earnings per common share: |
|
|
|
|
|
|
|
| Income from continuing operations |
|
|
|
|
$ |
0.33 |
|
|
$ |
0.09 |
|
| Loss from discontinued operations |
|
|
|
|
(0.05) |
|
|
(0.04) |
|
| Diluted net income attributable to Trinity Industries, Inc. |
|
|
|
|
$ |
0.28 |
|
|
$ |
0.05 |
|
| Weighted average number of shares outstanding: |
|
|
|
|
|
|
|
| Basic |
|
|
|
|
81.6 |
|
|
80.8 |
|
| Diluted |
|
|
|
|
83.5 |
|
|
83.2 |
|
See accompanying notes to Consolidated Financial Statements.
Trinity Industries, Inc. and Subsidiaries
Consolidated Statements of Comprehensive Income (Loss)
(unaudited)
|
|
|
|
|
|
|
|
|
|
|
|
|
|
|
|
|
|
|
Three Months Ended
March 31, |
| |
|
|
|
|
2024 |
|
2023 |
| |
|
|
|
|
(in millions) |
| Net income |
|
|
|
|
$ |
27.4 |
|
|
$ |
13.7 |
|
| Other comprehensive income (loss): |
|
|
|
|
|
|
|
| Derivative financial instruments: |
|
|
|
|
|
|
|
Unrealized gains arising during the period, net of tax benefit (expense) of $3.4 and $(0.1) |
|
|
|
|
11.4 |
|
|
0.5 |
|
Reclassification adjustments for gains included in net income, net of tax (expense) benefit of $(1.2) and $11.0 |
|
|
|
|
(3.9) |
|
|
(14.9) |
|
|
|
|
|
|
|
|
|
|
|
|
|
|
|
|
|
|
|
|
|
|
|
|
|
|
|
|
|
|
|
|
|
|
|
|
|
|
|
|
|
|
|
|
|
|
7.5 |
|
|
(14.4) |
|
| Comprehensive income (loss) |
|
|
|
|
34.9 |
|
|
(0.7) |
|
| Less: comprehensive income attributable to noncontrolling interest |
|
|
|
|
3.8 |
|
|
1.9 |
|
| Comprehensive income (loss) attributable to Trinity Industries, Inc. |
|
|
|
|
$ |
31.1 |
|
|
$ |
(2.6) |
|
See accompanying notes to Consolidated Financial Statements.
Trinity Industries, Inc. and Subsidiaries
Consolidated Balance Sheets
|
|
|
|
|
|
|
|
|
|
|
|
|
March 31, 2024 |
|
December 31, 2023 |
|
(unaudited) |
|
|
| |
(in millions) |
| ASSETS |
|
|
|
| Cash and cash equivalents |
$ |
118.8 |
|
|
$ |
105.7 |
|
|
|
|
|
| Receivables, net of allowance |
484.0 |
|
|
363.5 |
|
| Income tax receivable |
4.9 |
|
|
5.2 |
|
Inventories: |
|
|
|
| Raw materials and supplies |
397.2 |
|
|
419.4 |
|
| Work in process |
174.8 |
|
|
142.4 |
|
| Finished goods |
71.1 |
|
|
122.5 |
|
|
643.1 |
|
|
684.3 |
|
Restricted cash, including partially-owned subsidiaries of $30.0 and $30.6 |
116.3 |
|
|
129.4 |
|
Property, plant, and equipment, at cost, including partially-owned subsidiaries of $1,921.7 and $1,922.5 |
9,658.2 |
|
|
9,539.6 |
|
Less accumulated depreciation, including partially-owned subsidiaries of $656.8 and $644.7 |
(2,598.6) |
|
|
(2,534.8) |
|
|
7,059.6 |
|
|
7,004.8 |
|
| Goodwill |
221.5 |
|
|
221.5 |
|
| Other assets |
431.6 |
|
|
392.1 |
|
| Total assets |
$ |
9,079.8 |
|
|
$ |
8,906.5 |
|
|
|
|
|
| LIABILITIES AND STOCKHOLDERS' EQUITY |
|
|
|
| Accounts payable |
$ |
335.9 |
|
|
$ |
305.3 |
|
| Accrued liabilities |
328.3 |
|
|
302.3 |
|
Debt: |
|
|
|
| Recourse |
795.0 |
|
|
794.6 |
|
| Non-recourse: |
|
|
|
| Wholly-owned subsidiaries |
3,946.0 |
|
|
3,819.2 |
|
| Partially-owned subsidiaries |
1,126.0 |
|
|
1,140.4 |
|
|
5,867.0 |
|
|
5,754.2 |
|
| Deferred income taxes |
1,104.1 |
|
|
1,103.5 |
|
| Other liabilities |
156.0 |
|
|
165.7 |
|
| Total liabilities |
7,791.3 |
|
|
7,631.0 |
|
Commitments and contingencies (Note 14) |
|
|
|
Preferred stock – 1.5 shares authorized and unissued |
— |
|
|
— |
|
Common stock – 400.0 shares authorized |
0.8 |
|
|
0.8 |
|
| Capital in excess of par value |
20.2 |
|
|
15.4 |
|
| Retained earnings |
1,010.9 |
|
|
1,010.5 |
|
| Accumulated other comprehensive income |
18.4 |
|
|
11.0 |
|
| Treasury stock |
(1.0) |
|
|
(0.6) |
|
|
1,049.3 |
|
|
1,037.1 |
|
| Noncontrolling interest |
239.2 |
|
|
238.4 |
|
| Total stockholders' equity |
1,288.5 |
|
|
1,275.5 |
|
| Total liabilities and stockholders' equity |
$ |
9,079.8 |
|
|
$ |
8,906.5 |
|
See accompanying notes to Consolidated Financial Statements.
Trinity Industries, Inc. and Subsidiaries
Consolidated Statements of Cash Flows
(unaudited)
|
|
|
|
|
|
|
|
|
|
|
|
|
Three Months Ended
March 31, |
| |
2024 |
|
2023 |
| |
(in millions) |
| Operating activities: |
|
|
|
| Net income |
$ |
27.4 |
|
|
$ |
13.7 |
|
| Loss from discontinued operations, net of income taxes |
4.3 |
|
|
3.1 |
|
|
|
|
|
| Adjustments to reconcile net income to net cash provided by operating activities – continuing operations: |
|
|
|
| Depreciation and amortization |
73.4 |
|
|
74.0 |
|
| Stock-based compensation expense |
4.7 |
|
|
6.2 |
|
|
|
|
|
| Provision (benefit) for deferred income taxes |
(2.1) |
|
|
(12.4) |
|
| Net gains on lease portfolio sales |
(2.1) |
|
|
(13.5) |
|
| Gains on dispositions of property and other assets |
(0.7) |
|
|
(1.0) |
|
| Gains on insurance recoveries from property damage |
— |
|
|
(1.2) |
|
|
|
|
|
|
|
|
|
| Non-cash interest expense |
3.4 |
|
|
2.6 |
|
|
|
|
|
| Other |
0.5 |
|
|
(1.9) |
|
| Changes in operating assets and liabilities: |
|
|
|
| (Increase) decrease in receivables |
(118.1) |
|
|
2.8 |
|
|
|
|
|
| (Increase) decrease in inventories |
41.2 |
|
|
(3.3) |
|
| (Increase) decrease in other assets |
(5.1) |
|
|
7.3 |
|
| Increase (decrease) in accounts payable |
30.6 |
|
|
11.6 |
|
| Increase (decrease) in accrued liabilities |
(1.5) |
|
|
14.7 |
|
| Increase (decrease) in other liabilities |
0.6 |
|
|
(0.2) |
|
| Net cash provided by operating activities – continuing operations |
56.5 |
|
|
102.5 |
|
| Net cash used in operating activities – discontinued operations |
(4.3) |
|
|
(3.1) |
|
| Net cash provided by operating activities |
52.2 |
|
|
99.4 |
|
| Investing activities: |
|
|
|
|
|
|
|
| Proceeds from dispositions of property and other assets |
3.9 |
|
|
4.9 |
|
| Proceeds from lease portfolio sales |
24.2 |
|
|
56.7 |
|
|
|
|
|
| Capital expenditures – lease fleet |
(147.5) |
|
|
(191.5) |
|
| Capital expenditures – operating and administrative |
(4.6) |
|
|
(7.1) |
|
| Acquisitions, net of cash acquired |
— |
|
|
(66.2) |
|
| Proceeds from insurance recoveries |
— |
|
|
1.2 |
|
| Equity investments |
— |
|
|
(1.1) |
|
|
|
|
|
|
|
|
|
|
|
|
|
| Net cash used in investing activities |
(124.0) |
|
|
(203.1) |
|
| Financing activities: |
|
|
|
|
|
|
|
|
|
|
|
| Payments to retire debt |
(803.8) |
|
|
(149.6) |
|
| Proceeds from issuance of debt |
909.9 |
|
|
246.3 |
|
| Payments to settle contingent consideration liability |
(8.0) |
|
|
— |
|
| Dividends paid to common shareholders |
(23.0) |
|
|
(21.1) |
|
| Purchase of shares to satisfy employee tax on vested stock |
(0.3) |
|
|
(0.3) |
|
|
|
|
|
|
|
|
|
|
|
|
|
| Distributions to noncontrolling interest |
(3.0) |
|
|
(2.9) |
|
|
|
|
|
|
|
|
|
|
|
|
|
| Net cash provided by financing activities |
71.8 |
|
|
72.4 |
|
| Net increase (decrease) in cash, cash equivalents, and restricted cash |
— |
|
|
(31.3) |
|
| Cash, cash equivalents, and restricted cash at beginning of period |
235.1 |
|
|
294.3 |
|
| Cash, cash equivalents, and restricted cash at end of period |
$ |
235.1 |
|
|
$ |
263.0 |
|
See accompanying notes to Consolidated Financial Statements.
Trinity Industries, Inc. and Subsidiaries
Consolidated Statements of Stockholders' Equity
(unaudited)
|
|
|
|
|
|
|
|
|
|
|
|
|
|
|
|
|
|
|
|
|
|
|
|
|
|
|
|
|
|
|
|
|
|
|
|
|
|
|
|
|
|
|
|
|
|
|
|
|
|
|
|
|
|
|
|
|
|
|
|
|
Common Stock |
|
Capital in
Excess of
Par Value |
|
Retained
Earnings |
|
Accumulated
Other
Comprehensive
Income (Loss) |
|
Treasury Stock |
|
Trinity
Stockholders’
Equity |
|
Noncontrolling
Interest |
|
Total
Stockholders’
Equity |
| |
Shares |
|
$0.01 Par Value |
|
|
|
|
Shares |
|
Amount |
|
|
|
| |
(in millions, except par value and per common share amounts) |
|
Balances at
December 31, 2023
|
81.8 |
|
|
$ |
0.8 |
|
|
$ |
15.4 |
|
|
$ |
1,010.5 |
|
|
$ |
11.0 |
|
|
— |
|
|
$ |
(0.6) |
|
|
$ |
1,037.1 |
|
|
$ |
238.4 |
|
|
$ |
1,275.5 |
|
| Net income |
— |
|
|
— |
|
|
— |
|
|
23.7 |
|
|
— |
|
|
— |
|
|
— |
|
|
23.7 |
|
|
3.7 |
|
|
27.4 |
|
| Other comprehensive income |
— |
|
|
— |
|
|
— |
|
|
— |
|
|
7.4 |
|
|
— |
|
|
— |
|
|
7.4 |
|
|
0.1 |
|
|
7.5 |
|
Cash dividends declared on common stock (1) |
— |
|
|
— |
|
|
— |
|
|
(23.3) |
|
|
— |
|
|
— |
|
|
— |
|
|
(23.3) |
|
|
— |
|
|
(23.3) |
|
Distributions to noncontrolling interest |
— |
|
|
— |
|
|
— |
|
|
— |
|
|
— |
|
|
— |
|
|
— |
|
|
— |
|
|
(3.0) |
|
|
(3.0) |
|
Stock-based compensation expense |
— |
|
|
— |
|
|
4.7 |
|
|
— |
|
|
— |
|
|
— |
|
|
— |
|
|
4.7 |
|
|
— |
|
|
4.7 |
|
| Settlement of share-based awards, net |
— |
|
|
— |
|
|
0.1 |
|
|
— |
|
|
— |
|
|
— |
|
|
(0.4) |
|
|
(0.3) |
|
|
— |
|
|
(0.3) |
|
|
|
|
|
|
|
|
|
|
|
|
|
|
|
|
|
|
|
|
|
|
|
|
|
|
|
|
|
|
|
|
|
|
|
|
|
|
|
|
|
|
|
|
|
|
|
|
|
|
|
|
|
|
|
|
|
|
|
|
|
|
Balances at
March 31, 2024
|
81.8 |
|
|
$ |
0.8 |
|
|
$ |
20.2 |
|
|
$ |
1,010.9 |
|
|
$ |
18.4 |
|
|
— |
|
|
$ |
(1.0) |
|
|
$ |
1,049.3 |
|
|
$ |
239.2 |
|
|
$ |
1,288.5 |
|
|
|
|
|
|
|
|
|
|
|
|
|
|
|
|
|
|
|
|
|
|
|
|
|
|
|
|
|
|
|
|
|
|
|
|
|
|
|
|
|
|
|
|
|
|
|
|
|
|
|
|
|
|
|
|
|
|
|
|
|
|
|
|
|
|
|
|
|
|
|
|
|
|
|
|
|
|
|
|
|
|
|
|
|
|
|
|
|
|
|
|
|
|
|
|
|
|
|
|
|
|
|
|
|
|
|
|
|
|
|
|
|
|
|
|
|
|
|
|
|
|
|
|
|
|
|
|
|
|
|
|
|
|
|
|
|
|
|
|
|
|
|
|
|
|
|
|
|
|
|
|
|
|
|
|
|
|
|
|
|
|
|
|
|
|
|
|
|
|
|
|
|
|
|
|
|
|
|
|
|
|
|
|
|
|
|
|
|
|
|
|
|
|
|
|
|
|
|
|
|
|
|
|
|
|
|
|
|
|
|
|
|
|
|
|
|
|
|
|
|
|
|
|
|
|
|
|
|
|
|
|
|
|
|
|
|
|
|
|
|
|
|
|
|
|
|
|
|
|
|
|
|
|
|
|
|
|
|
|
|
|
|
|
|
|
|
|
|
|
|
|
|
|
|
|
|
|
|
|
|
|
|
|
|
|
|
|
|
|
|
|
|
|
|
|
|
|
|
|
|
|
|
|
|
|
|
|
|
|
|
|
|
|
|
|
|
|
|
|
|
|
|
|
|
|
|
|
|
|
|
|
|
|
|
|
|
|
|
|
|
|
|
|
|
|
|
|
|
|
|
|
|
|
|
|
|
|
|
|
|
|
|
|
|
|
|
|
|
|
|
|
|
|
|
|
|
|
|
|
|
|
|
|
|
|
|
|
|
|
|
|
|
|
|
|
|
|
|
|
|
|
|
|
|
|
|
|
|
|
|
|
|
|
|
|
|
|
|
|
|
|
|
|
|
|
|
|
|
|
|
|
|
|
|
|
|
|
|
|
|
|
|
|
|
|
|
|
|
|
|
|
|
|
|
|
|
|
|
|
|
|
|
|
|
|
|
|
|
|
|
|
|
|
|
|
|
|
|
|
|
|
Common Stock |
|
Capital in
Excess of
Par Value |
|
Retained
Earnings |
|
Accumulated
Other
Comprehensive
Income (Loss) |
|
Treasury Stock |
|
Trinity
Stockholders’
Equity |
|
Noncontrolling
Interest |
|
Total
Stockholders’
Equity |
| |
Shares |
|
$0.01 Par Value |
|
|
|
|
Shares |
|
Amount |
|
|
|
| |
(in millions, except par value and per common share amounts) |
|
Balances at
December 31, 2022
|
81.1 |
|
|
$ |
0.8 |
|
|
$ |
— |
|
|
$ |
992.6 |
|
|
$ |
19.7 |
|
|
— |
|
|
$ |
(0.7) |
|
|
$ |
1,012.4 |
|
|
$ |
257.2 |
|
|
$ |
1,269.6 |
|
| Net income |
— |
|
|
— |
|
|
— |
|
|
4.4 |
|
|
— |
|
|
— |
|
|
— |
|
|
4.4 |
|
|
9.3 |
|
|
13.7 |
|
| Other comprehensive loss |
— |
|
|
— |
|
|
— |
|
|
— |
|
|
(7.0) |
|
|
— |
|
|
— |
|
|
(7.0) |
|
|
(7.4) |
|
|
(14.4) |
|
Cash dividends declared on common stock (1) |
— |
|
|
— |
|
|
— |
|
|
(21.4) |
|
|
— |
|
|
— |
|
|
— |
|
|
(21.4) |
|
|
— |
|
|
(21.4) |
|
| Distributions to noncontrolling interest |
— |
|
|
— |
|
|
— |
|
|
— |
|
|
— |
|
|
— |
|
|
— |
|
|
— |
|
|
(2.9) |
|
|
(2.9) |
|
Stock-based compensation expense |
— |
|
|
— |
|
|
6.2 |
|
|
— |
|
|
— |
|
|
— |
|
|
— |
|
|
6.2 |
|
|
— |
|
|
6.2 |
|
| Settlement of share-based awards, net |
— |
|
|
— |
|
|
0.4 |
|
|
— |
|
|
— |
|
|
— |
|
|
(0.8) |
|
|
(0.4) |
|
|
— |
|
|
(0.4) |
|
|
|
|
|
|
|
|
|
|
|
|
|
|
|
|
|
|
|
|
|
|
|
|
|
|
|
|
|
|
|
|
|
|
|
|
|
|
|
|
|
|
|
|
|
|
|
|
|
|
|
|
|
|
|
|
|
|
|
|
|
|
Balances at
March 31, 2023
|
81.1 |
|
|
$ |
0.8 |
|
|
$ |
6.6 |
|
|
$ |
975.6 |
|
|
$ |
12.7 |
|
|
— |
|
|
$ |
(1.5) |
|
|
$ |
994.2 |
|
|
$ |
256.2 |
|
|
$ |
1,250.4 |
|
|
|
|
|
|
|
|
|
|
|
|
|
|
|
|
|
|
|
|
|
|
|
|
|
|
|
|
|
|
|
|
|
|
|
|
|
|
|
|
|
|
|
|
|
|
|
|
|
|
|
|
|
|
|
|
|
|
|
|
|
|
|
|
|
|
|
|
|
|
|
|
|
|
|
|
|
|
|
|
|
|
|
|
|
|
|
|
|
|
|
|
|
|
|
|
|
|
|
|
|
|
|
|
|
|
|
|
|
|
|
|
|
|
|
|
|
|
|
|
|
|
|
|
|
|
|
|
|
|
|
|
|
|
|
|
|
|
|
|
|
|
|
|
|
|
|
|
|
|
|
|
|
|
|
|
|
|
|
|
|
|
|
|
|
|
|
|
|
|
|
|
|
|
|
|
|
|
|
|
|
|
|
|
|
|
|
|
|
|
|
|
|
|
|
|
|
|
|
|
|
|
|
|
|
|
|
|
|
|
|
|
|
|
|
|
|
|
|
|
|
|
|
|
|
|
|
|
|
|
|
|
|
|
|
|
|
|
|
|
|
|
|
|
|
|
|
|
|
|
|
|
|
|
|
|
|
|
|
|
|
|
|
|
|
|
|
|
|
|
|
|
|
|
|
|
|
|
|
|
|
|
|
|
|
|
|
|
|
|
|
|
|
|
|
|
|
|
|
|
|
|
|
|
|
|
|
|
|
|
|
|
|
|
|
|
|
|
|
|
|
|
|
|
|
|
|
|
|
|
|
|
|
|
|
|
|
|
|
|
|
|
|
|
|
|
|
|
|
|
|
|
|
|
|
|
|
|
|
|
|
|
|
|
|
|
|
|
|
|
|
|
|
|
|
|
|
|
|
|
|
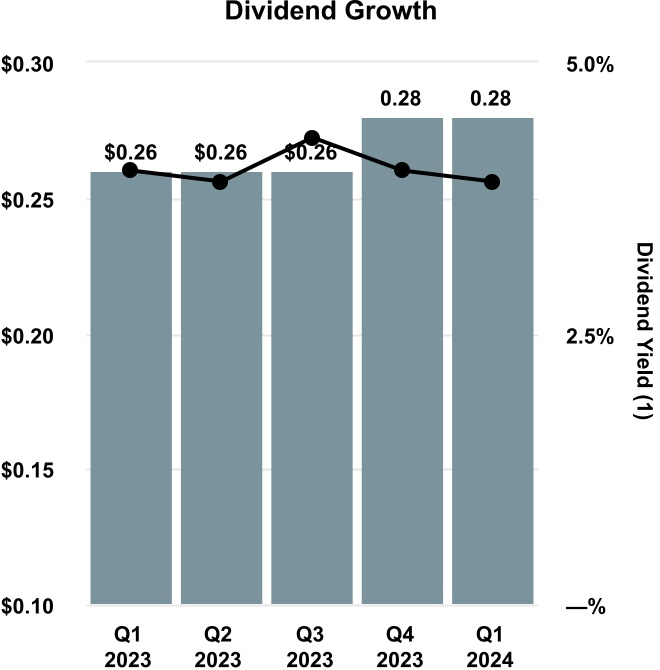
(1) Dividends of $0.28 and $0.26 per common share for the three months ended March 31, 2024 and 2023, respectively.
See accompanying notes to Consolidated Financial Statements.
Trinity Industries, Inc. and Subsidiaries
Notes to Consolidated Financial Statements
(Unaudited)
Note 1. Summary of Significant Accounting Policies
Basis of Presentation
The foregoing Consolidated Financial Statements are unaudited and have been prepared from the books and records of Trinity Industries, Inc. and Subsidiaries (“Trinity,” “Company,” “we,” “our,” or "us"), including the accounts of our wholly-owned subsidiaries and partially-owned subsidiaries, TRIP Rail Holdings LLC (“TRIP Holdings”), RIV 2013 Rail Holdings LLC ("RIV 2013"), and Trinity Global Ventures Limited ("Trinity Global Ventures"), in which we have a controlling interest. In our opinion, all normal and recurring adjustments necessary for a fair presentation of our financial position as of March 31, 2024 and the results of operations and cash flows for the three months ended March 31, 2024 and 2023 have been made in conformity with generally accepted accounting principles. All significant intercompany accounts and transactions have been eliminated. Certain prior year balances have been reclassified to conform to the 2024 presentation.
Due to seasonal and other factors, the results of operations for the three months ended March 31, 2024 may not be indicative of expected results of operations for the year ending December 31, 2024. These interim financial statements and notes are condensed as permitted by the instructions to Form 10-Q and should be read in conjunction with our audited Consolidated Financial Statements included in our Form 10-K for the year ended December 31, 2023.
Our Reportable Segments
Effective January 1, 2024, the Company modified its organizational structure to better leverage our maintenance services capabilities to support lease fleet optimization and to grow our services and parts businesses. The new structure resulted in a change to our reportable segments beginning in 2024. In connection with this organizational update, we aligned the maintenance services business, which was previously reported in the Rail Products Group, to now be presented within our leasing business. This change aligns with the way in which our Chief Operating Decision Maker ("CODM") assesses performance and allocates resources. Consequently, beginning January 1, 2024, we report our operating results in two reportable segments: (1) the Railcar Leasing and Services Group, formerly the Railcar Leasing and Management Services Group, and (2) the Rail Products Group. These changes had no impact to our previously reported consolidated results of operations, financial position, or cash flows. All prior period segment results set forth herein have been recast to reflect these changes and present results on a comparable basis.
Revenue Recognition
Revenue is measured based on the allocation of the transaction price in a contract to satisfied performance obligations. The transaction price does not include any amounts collected on behalf of third parties. We recognize revenue when we satisfy a performance obligation by transferring control over a product or service to a customer. For all contracts with customers, we evaluate whether we are the principal (i.e., report revenues on a gross basis) or agent (i.e., report revenues on a net basis). Generally, we are the principal in our contracts with customers and report revenues on a gross basis as we control the product or service before it is transferred to a customer. We act as an agent for a small number of service contracts and report those revenues on a net basis as we do not control the services before they are provided to the customer. Payments for our products and services are generally due within normal commercial terms. The following is a description of principal activities from which we generate our revenue, separated by reportable segments. See Note 4 for a further discussion regarding our reportable segments.
Railcar Leasing and Services Group
In our Railcar Leasing and Services Group ("Leasing Group"), revenue from rentals and operating leases, including contracts that contain non-level fixed lease payments, is recognized monthly on a straight-line basis. Leases not classified as operating leases are generally considered sales-type leases as a result of an option to purchase.
We review our operating lease receivables for collectibility on a regular basis, taking into consideration changes in factors such as the lessee’s payment history, the financial condition of the lessee, and business and economic conditions in the industry in which the lessee operates. In the event that the collectibility of a receivable with respect to any lessee is no longer probable, we derecognize the revenue and related receivable and recognize future revenue only when the lessee makes a rental payment. Contingent rents are recognized when the contingency is resolved.
Selling profit or loss associated with sales-type leases is recognized upon lease commencement, and a net investment in the sales-type lease is recorded in the Consolidated Balance Sheets. Interest income related to sales-type leases is recognized over the lease term using the effective interest method. See "Lease Accounting" below for additional information regarding sales-type leases as of March 31, 2024 and 2023.
We report all sales of railcars from the lease fleet and selling profit or loss associated with sales-type leases as a net gain or loss from the disposal of a long-term asset in accordance with Accounting Standards Codification ("ASC") 610-20, Gains and losses from the derecognition of non-financial assets. These sales are presented in the Lease portfolio sales line in our Consolidated Statements of Operations.
Our maintenance services business is primarily dedicated to servicing our lease fleet pursuant to the provisions of our lease contracts. This may include services that are not included in the full-service lease agreement, such as repairs of railcar damage or other customer-specific requirements. We also perform maintenance and repair activities on railcars owned by third parties, including our investor-owned fleet.
Within our maintenance services business, revenue is recognized over time as repair and maintenance projects are completed, using an input approach based on the costs incurred relative to the total estimated costs of performing the project. We recorded contract assets of $17.4 million and $8.8 million as of March 31, 2024 and December 31, 2023, respectively, related to unbilled revenues recognized on repair and maintenance activities that have been performed, but for which the entire project has not yet been completed, and the railcar has not yet been shipped to the customer. These contract assets are included within the Receivables, net of allowance line in our Consolidated Balance Sheets.
We act as an agent for certain logistics services and report these revenues on a net basis as we do not control the services before they are provided to the customer.
Rail Products Group
Our railcar manufacturing business recognizes revenue related to new railcars when the customer has submitted its certificate of acceptance and legal title of the railcar has passed to the customer. Certain contracts for the sales of railcars include price adjustments based on changes to input costs; this amount represents variable consideration for which we are generally unable to estimate the final consideration until the railcar is delivered.
Revenue is recognized over time as sustainable railcar conversions are completed, using an input approach based on the costs incurred relative to the total estimated costs of performing the project. We recorded contract assets of $6.2 million and $12.6 million as of March 31, 2024 and December 31, 2023, respectively, which primarily relate to unbilled revenues recognized on sustainable railcar conversions that have been performed, but for which the entire project has not yet been completed, and the railcar has not yet been shipped to the customer. These contract assets are included within the Receivables, net of allowance line in our Consolidated Balance Sheets.
We account for shipping and handling costs as activities to fulfill the promise to transfer the good; as such, these fees are recorded in revenue. The fees and costs of shipping and handling activities are accrued when the related performance obligation has been satisfied.
Unsatisfied Performance Obligations
The following table includes estimated revenue expected to be recognized in future periods related to performance obligations that are unsatisfied or partially satisfied as of March 31, 2024 and the percentage of the outstanding performance obligations as of March 31, 2024 expected to be delivered during the remainder of 2024:
|
|
|
|
|
|
|
|
|
|
|
|
|
Unsatisfied performance obligations at March 31, 2024 |
|
Total
Amount |
|
Percent expected to be delivered in 2024 |
| |
(in millions) |
|
|
Rail Products Group: |
|
|
|
| New railcars: |
|
|
|
| External customers |
$ |
2,626.3 |
|
|
|
Leasing Group |
312.6 |
|
|
|
|
$ |
2,938.9 |
|
|
49.1 |
% |
| Sustainable railcar conversions |
$ |
35.8 |
|
|
91.5 |
% |
|
|
|
|
Railcar Leasing and Services Group: |
|
|
|
| Leasing and management |
$ |
62.7 |
|
|
21.4 |
% |
| Maintenance services |
$ |
7.9 |
|
|
100.0 |
% |
The remainder of the unsatisfied performance obligations for the Rail Products Group is expected to be delivered through 2028. The orders in the Rail Products Group's backlog from the Leasing Group are fully supported by lease commitments with external customers. The final amount of backlog attributable to the Leasing Group may vary by the time of delivery as customers may elect to change their procurement decision.
Unsatisfied performance obligations for the Railcar Leasing and Services Group are related to servicing, maintenance, and management agreements and are expected to be performed through 2029.
Lease Accounting
Lessee
We are the lessee of operating leases predominantly for office buildings and railcars, as well as manufacturing equipment and office equipment. Our operating leases have remaining lease terms ranging from one year to thirteen years, some of which include options to extend for up to five years, and some of which include options to terminate within one year. As of March 31, 2024, we had no material finance leases in which we were the lessee. Certain of our operating leases include lease incentives, which reduce the right-of-use asset and are recognized on a straight-line basis over the lease term.
The following table summarizes the impact of our operating leases on our Consolidated Financial Statements (in millions, except lease term and discount rate):
|
|
|
|
|
|
|
|
|
|
|
|
|
|
|
|
|
|
|
Three Months Ended
March 31, |
|
|
|
|
|
2024 |
|
2023 |
| Consolidated Statements of Operations |
|
|
|
|
|
|
|
| Operating lease expense |
|
|
|
|
$ |
5.3 |
|
|
$ |
4.3 |
|
|
|
|
|
|
|
|
|
|
|
|
|
|
|
|
|
| Consolidated Statements of Cash Flows |
|
|
|
|
|
|
|
| Cash flows from operating activities |
|
|
|
$ |
5.3 |
|
|
$ |
4.3 |
|
| Right-of-use assets recognized in exchange for new lease liabilities |
|
$ |
4.2 |
|
|
$ |
2.1 |
|
|
|
|
|
|
|
|
|
|
|
|
|
|
March 31, 2024 |
|
December 31, 2023 |
| Consolidated Balance Sheets |
|
|
|
|
|
|
|
Right-of-use assets (1) |
|
|
|
|
$ |
100.9 |
|
|
$ |
100.6 |
|
Lease liabilities (2) |
|
|
|
|
$ |
118.0 |
|
|
$ |
118.2 |
|
| Weighted average remaining lease term |
|
|
|
|
9.1 years |
|
9.3 years |
Weighted average discount rate (3) |
|
|
|
|
3.7 |
% |
|
3.6 |
% |
(1) Included in other assets in our Consolidated Balance Sheets.
(2) Included in other liabilities in our Consolidated Balance Sheets.
(3) As the rate implicit in our leases is not readily determinable, we use the incremental borrowing rate of our Trinity Industries Leasing Company ("TILC") warehouse loan facility for railcar leases or our revolving credit facility for operating and administrative leases at lease commencement to determine the present value of lease payments.
Future contractual minimum operating lease liabilities will mature as follows (in millions):
|
|
|
|
|
|
|
|
|
|
|
|
|
|
|
|
|
|
|
Railcars in our Lease Fleet |
|
Operating and Administrative |
|
Total |
| Remaining nine months of 2024 |
$ |
6.6 |
|
|
$ |
9.1 |
|
|
$ |
15.7 |
|
| 2025 |
8.2 |
|
|
10.7 |
|
|
18.9 |
|
| 2026 |
7.7 |
|
|
9.5 |
|
|
17.2 |
|
| 2027 |
7.2 |
|
|
8.8 |
|
|
16.0 |
|
| 2028 |
5.1 |
|
|
7.4 |
|
|
12.5 |
|
| Thereafter |
6.8 |
|
|
51.5 |
|
|
58.3 |
|
| Total operating lease payments |
$ |
41.6 |
|
|
$ |
97.0 |
|
|
$ |
138.6 |
|
| Less: Present value adjustment |
|
|
|
|
(20.6) |
|
|
|
|
|
|
|
| Total operating lease liabilities |
|
|
|
|
$ |
118.0 |
|
Lessor
Our Leasing Group enters into railcar operating leases with third parties with terms generally ranging between one year and ten years. The majority of our fleet operates on leases that earn fixed monthly lease payments. Generally, lease payments are due at the beginning of the applicable month. A portion of our fleet operates on per diem leases that earn usage-based variable lease payments. Some of our leases include options to extend the leases for up to five years, and a small percentage of our leases include early termination options with certain notice requirements and early termination penalties. As of March 31, 2024, non-lease fleet operating leases in which we are the lessor were not significant, and we had no direct finance leases.
We manage risks associated with residual values of leased railcars by investing across a diverse portfolio of railcar types, staggering lease maturities within any given railcar type, avoiding concentration of railcar type and industry, and actively participating in secondary markets. Additionally, our lease agreements contain normal wear and tear return condition provisions and high mileage thresholds designed to protect the value of our residual assets. Our lease agreements do not contain any material residual value guarantees or restrictive covenants.
The following table summarizes the impact of our leases on our Consolidated Statements of Operations:
|
|
|
|
|
|
|
|
|
|
|
|
|
|
|
|
|
|
|
Three Months Ended
March 31, |
|
|
|
|
|
2024 |
|
2023 |
|
|
|
|
|
(in millions) |
| Operating lease revenues |
|
|
|
|
$ |
191.8 |
|
|
$ |
176.7 |
|
| Variable operating lease revenues |
|
|
|
|
$ |
13.7 |
|
|
$ |
14.6 |
|
|
|
|
|
|
|
|
|
| Interest income on sales-type lease receivables |
|
|
|
|
$ |
0.2 |
|
|
$ |
0.2 |
|
|
|
|
|
|
|
|
|
Future contractual minimum revenues for operating leases will mature as follows (in millions)(1):
|
|
|
|
|
|
| Remaining nine months of 2024 |
$ |
530.2 |
|
| 2025 |
593.8 |
|
| 2026 |
472.1 |
|
| 2027 |
350.4 |
|
| 2028 |
211.4 |
|
| Thereafter |
331.7 |
|
| Total |
$ |
2,489.6 |
|
(1) Total contractual minimum rental revenues on operating leases relates to our wholly-owned and partially-owned subsidiaries and sub-lease rental revenues associated with the Leasing Group's operating lease obligations.
Future contractual minimum lease receivables for sales-type leases will mature as follows (in millions):
|
|
|
|
|
|
| Remaining nine months of 2024 |
$ |
0.8 |
|
| 2025 |
1.1 |
|
| 2026 |
1.1 |
|
| 2027 |
1.1 |
|
| 2028 |
1.1 |
|
| Thereafter |
9.0 |
|
| Total |
14.2 |
|
| Less: Unearned interest income |
(4.1) |
|
Net investment in sales-type leases (1) |
$ |
10.1 |
|
(1) Included in other assets in our Consolidated Balance Sheets.
Financial Instruments
We consider all highly liquid debt instruments to be either cash and cash equivalents if purchased with a maturity of three months or less, or short-term marketable securities if purchased with a maturity of more than three months and less than one year.
Financial instruments that potentially subject us to a concentration of credit risk are primarily cash investments, including restricted cash and receivables. We place our cash investments in bank deposits, investment grade short-term debt instruments, highly-rated money market funds, and highly-rated commercial paper. We limit the amount of credit exposure to any one commercial issuer. The carrying values of cash, receivables, and accounts payable are considered to be representative of their respective fair values.
Concentrations of credit risk with respect to receivables are limited due to control procedures that monitor the credit worthiness of customers, the large number of customers in our customer base, and their dispersion across different end markets and geographic areas. Receivables are generally evaluated at a portfolio level based on these characteristics. As receivables are generally unsecured, we maintain an allowance for credit losses using a forward-looking approach based on historical losses and consideration of current and expected future economic conditions. Historically, we have observed that the likelihood of loss increases when receivables have aged beyond 180 days. When a receivable is deemed uncollectible, the write-off is recorded as a reduction to the allowance for credit losses. During the three months ended March 31, 2024, we recognized approximately $0.6 million of credit loss expense and wrote off $0.8 million related to our trade receivables that are in the scope of ASC 326, Financial Instruments – Credit Losses, bringing the allowance for credit losses balance from $12.8 million at December 31, 2023 to $12.6 million at March 31, 2024. This balance excludes the general reserve for operating lease receivables that is permitted under ASC 450, Contingencies.
Supply Chain Finance Program
In cooperation with a participating financial institution, we facilitate a voluntary supply chain finance ("SCF") program for several of our suppliers. We negotiate payment terms with suppliers that are in line with average industry terms. We have not pledged any assets as security or provided other forms of guarantees to the financial institution. Under the SCF program, participating suppliers may choose to sell, at a discounted price, receivables due from us to the financial institution, at the sole discretion of both the suppliers and the financial institution, prior to the invoices’ scheduled due dates. The payment terms that we negotiate with all suppliers are consistent regardless of whether the supplier chooses to participate in the SCF program for a particular invoice. The SCF program is administered by a third-party financial institution, and our responsibility is limited to making payments based on the terms originally negotiated with participating suppliers, regardless of whether such suppliers sell receivables to the financial institution.
Amounts due to our participating suppliers in the SCF program totaled $23.9 million and $18.3 million as of March 31, 2024 and December 31, 2023, respectively, and are included in accounts payable in our Consolidated Balance Sheets. Payments made under the SCF program are reflected in net cash provided by operating activities from continuing operations in our Consolidated Statements of Cash Flows.
Goodwill
Goodwill by segment is as follows:
|
|
|
|
|
|
|
|
|
|
|
|
|
March 31, 2024 |
|
December 31, 2023 |
| Railcar Leasing and Services Group |
$ |
50.6 |
|
|
$ |
50.6 |
|
| Rail Products Group |
170.9 |
|
|
170.9 |
|
$ |
221.5 |
|
|
$ |
221.5 |
|
Warranties
We provide various express, limited product warranties that generally range from one year to five years depending on the product. The warranty costs are estimated using a two-step approach. First, an engineering estimate is made for the cost of all claims that have been asserted by customers. Second, based on historical claims experience, a cost is accrued for all products still within a warranty period for which no claims have been filed. We provide for the estimated cost of product warranties at the time revenue is recognized related to products covered by warranties and assess the adequacy of the resulting reserves on a quarterly basis. The changes in the accruals for warranties for the three months ended March 31, 2024 and 2023 are as follows:
|
|
|
|
|
|
|
|
|
|
|
|
|
|
|
|
| |
|
|
Three Months Ended
March 31, |
|
|
|
|
|
2024 |
|
2023 |
| |
|
|
|
|
(in millions) |
| Beginning balance |
|
|
|
|
$ |
3.3 |
|
|
$ |
3.3 |
|
| Warranty costs incurred |
|
|
|
|
(0.2) |
|
|
— |
|
| Warranty originations and revisions |
|
|
|
|
(0.2) |
|
|
1.0 |
|
| Warranty expirations |
|
|
|
|
(0.1) |
|
|
(0.4) |
|
| Ending balance |
|
|
|
|
$ |
2.8 |
|
|
$ |
3.9 |
|
Recent Accounting Pronouncements
Not Yet Adopted
ASU 2023-07 – In November 2023, the FASB issued ASU No. 2023-07, "Improvements to Reportable Segment Disclosures," which improves disclosures about a public entity's reportable segments through enhanced disclosures about significant segment expenses. ASU 2023-07 requires disclosures, on an annual and interim basis, of significant segment expenses that are regularly provided to the CODM, the amount for other segment items by reportable segment and a description of its composition, the title and position of the CODM, and interim period disclosure of all current ASC 280, Segment Reporting, annual disclosures about a reportable segment's profit or loss and assets. ASU 2023-07 is effective for public companies during annual reporting periods beginning after December 15, 2023 and during interim reporting periods beginning after December 15, 2024 and is to be adopted on a retrospective basis. Early adoption is permitted. We are currently evaluating the impact ASU 2023-07 will have on our segment reporting disclosures.
ASU 2023-09 – In December 2023, the FASB issued ASU No. 2023-09, "Improvements to Income Tax Disclosures," which enhances transparency and decision usefulness of income tax disclosures. ASU 2023-09 requires, on an annual basis, a tabular disclosure using specific categories in the rate reconciliation and providing additional information for reconciling items that meet a quantitative threshold, as well as the disaggregation of income taxes paid by federal, state, and foreign jurisdictions. ASU 2023-09 is effective for public companies during annual reporting periods beginning after December 15, 2024 on a prospective basis, with an option for retrospective application. Early adoption is permitted. We are currently evaluating the impact ASU-2023-09 will have on our income tax disclosures.
Note 2. Acquisitions and Discontinued Operations
Acquisitions
Acquisition of Holden America
In December 2022, we acquired Holden America, a manufacturer of market-leading multi-level vehicle securement and protection systems, gravity-outlet gates, and gate accessories for freight rail in North America. The purchase agreement included minimum additional consideration of $10.0 million, which is payable in installments of $5.0 million per year in each of 2024 and 2025. The purchase agreement also contained a provision whereby additional consideration could become payable based on the achievement of certain revenue targets, up to a maximum payout of $10.0 million.
The total additional consideration, which is included in other liabilities in our Consolidated Balance Sheets, had an estimated fair value of $20.0 million as of December 31, 2023 and is remeasured at each reporting period using Level 3 inputs. During the three months ended March 31, 2024, the first installment of the additional consideration, totaling $10.0 million, was paid. This payment is reflected in our Consolidated Statements of Cash Flows, of which $8.0 million related to the initial estimated fair value is included in financing activities, and $2.0 million related to the remeasurement of the initial estimated fair value is included in operating activities. As of March 31, 2024, the estimated fair value of the remaining additional consideration was $10.0 million.
Acquisition of RSI Logistics
In March 2023, we acquired RSI Logistics ("RSI"), a data-centric provider of proprietary software and logistics and terminal management solutions to the North American rail industry. This transaction was recorded as a business combination within the Leasing Group, based on valuations of the acquired assets and liabilities at their acquisition date fair value using Level 3 inputs. Based on our purchase price allocation, we recorded identifiable intangible assets of $35.7 million, goodwill of $25.6 million, and certain other immaterial assets and liabilities. The identifiable intangible assets, with the exception of the trade name, which is considered an indefinite-lived intangible asset, are being amortized over their estimated useful lives, ranging from 5 years to 15 years.
Discontinued Operations
Sale of Highway Products Business
In the fourth quarter of 2021, we completed the sale of Trinity Highway Products, LLC (“THP”). Upon completion of the sale, the accounting requirements for reporting THP as a discontinued operation were met. In connection with the sale, the Company agreed to indemnify Rush Hour for certain liabilities related to the highway products business, including certain liabilities resulting from or arising out of the ET-Plus® System, a highway guardrail end-terminal system (the “ET Plus”). Consequently, results from discontinued operations include certain legal expenses that are directly attributable to the highway products business. Similar expenses related to these retained obligations that may be incurred in the future will likewise be reported in discontinued operations. For the three months ended March 31, 2024 and 2023, we recorded expenses related to these obligations of $5.6 million ($4.3 million, net of income taxes) and $3.9 million ($3.1 million, net of income taxes), respectively, which are included in loss from discontinued operations, net of income taxes in our Consolidated Statements of Operations. See Note 14 for further information regarding obligations retained in connection with the THP sale.
Note 3. Derivative Instruments and Fair Value Measurements
Derivative Instruments
We use derivative instruments to mitigate interest rate risk, including risks associated with the impact of changes in interest rates in anticipation of future debt issuances and to offset interest rate variability of certain floating rate debt issuances outstanding. We also use derivative instruments to mitigate the impact of changes in foreign currency exchange rates. Derivative instruments that are designated and qualify as cash flow hedges are accounted for by recording the effective portion of the gain or loss on the derivative instrument in accumulated other comprehensive income or loss ("AOCI") as a separate component of stockholders' equity. These accumulated gains or losses are reclassified into earnings in the periods during which the hedged transactions affect earnings. Derivative instruments that are not designated as hedges are accounted for by recording the realized and unrealized gains or losses on the derivative instrument in other, net (income) expense in our Consolidated Statements of Operations. We continuously monitor our derivative positions and the credit ratings of our counterparties and do not anticipate losses due to non-performance. See Note 8 for a description of our debt instruments.
Derivatives Designated as Hedging Instruments
Interest Rate Hedges
|
|
|
|
|
|
|
|
|
|
|
|
|
|
|
|
|
|
|
|
|
|
|
|
|
|
|
|
|
|
| |
|
|
|
|
Included in accompanying balance sheet
at March 31, 2024
|
|
|
|
|
|
|
|
AOCI – loss/(income) |
| |
Notional Amount |
|
Interest Rate (1) |
|
Asset/(Liability) |
|
Controlling Interest |
|
Noncontrolling Interest |
| |
($ in millions) |
| Expired hedges: |
|
|
|
|
|
|
|
|
|
| 2018 secured railcar equipment notes |
$ |
249.3 |
|
|
4.41 |
% |
|
$ |
— |
|
|
$ |
0.2 |
|
|
$ |
— |
|
|
|
|
|
|
|
|
|
|
|
| Tribute Rail secured railcar equipment notes |
$ |
256.0 |
|
|
2.86 |
% |
|
$ |
— |
|
|
$ |
0.4 |
|
|
$ |
0.5 |
|
| 2017 promissory notes – interest rate cap |
$ |
169.3 |
|
|
3.00 |
% |
|
$ |
— |
|
|
$ |
(0.1) |
|
|
$ |
— |
|
| Open hedges: |
|
|
|
|
|
|
|
|
|
| 2017 promissory notes – interest rate swap |
$ |
401.4 |
|
|
2.31 |
% |
|
$ |
14.4 |
|
|
$ |
(13.8) |
|
|
$ |
— |
|
| TRL-2023 term loan |
$ |
265.4 |
|
|
3.79 |
% |
|
$ |
2.2 |
|
|
$ |
(2.1) |
|
|
$ |
— |
|
(1) Weighted average fixed interest rate, except for the interest rate cap on the 2017 promissory notes.
|
|
|
|
|
|
|
|
|
|
|
|
|
|
|
|
|
|
|
|
|
|
| |
|
|
|
|
Effect on interest expense – increase/(decrease) |
| |
|
|
Three Months Ended
March 31, |
|
Expected effect during next twelve months |
| |
|
|
|
|
2024 |
|
2023 |
|
| |
|
|
|
|
(in millions) |
Expired hedges: |
|
|
|
|
|
|
|
|
|
2018 secured railcar equipment notes |
|
|
|
|
$ |
— |
|
|
$ |
— |
|
|
$ |
0.2 |
|
| TRIP Holdings warehouse loan |
|
|
|
|
$ |
— |
|
|
$ |
0.1 |
|
|
$ |
— |
|
|
|
|
|
|
|
|
|
|
|
| Tribute Rail secured railcar equipment notes |
|
|
|
|
$ |
0.2 |
|
|
$ |
0.2 |
|
|
$ |
0.7 |
|
| 2017 promissory notes – interest rate cap |
|
|
|
|
$ |
— |
|
|
$ |
— |
|
|
$ |
(0.1) |
|
Open hedges (1): |
|
|
|
|
|
|
|
|
|
| 2017 promissory notes – interest rate swap |
|
|
|
|
$ |
(3.1) |
|
|
$ |
(2.5) |
|
|
$ |
(12.4) |
|
| TRL-2023 term loan |
|
|
|
|
$ |
(1.0) |
|
|
$ |
— |
|
|
$ |
(2.9) |
|
(1) Based on the fair value of open hedges as of March 31, 2024.
Foreign Currency Hedges
Our exposure related to foreign currency transactions is currently hedged for up to a maximum of twelve months. Information related to our foreign currency hedges is as follows:
|
|
|
|
|
|
|
|
|
|
|
|
|
|
|
|
|
|
|
|
|
|
|
|
|
|
|
|
|
|
|
|
|
|
|
|
|
|
|
|
|
|
|
Included in
accompanying balance
sheet at March 31, 2024
|
|
|
|
|
|
Effect on cost of revenues –
increase/(decrease) |
|
Notional
Amount |
|
Asset/ (Liability) |
|
AOCI –
loss/(income) |
|
|
|
Three Months Ended
March 31, |
|
Expected effect during next twelve months (1) |
| Instrument |
|
|
|
|
|
|
|
2024 |
|
2023 |
|
|
(in millions) |
| Forward contracts |
$ |
99.0 |
|
|
$ |
7.7 |
|
|
$ |
(9.7) |
|
|
|
|
|
|
$ |
(1.5) |
|
|
$ |
(1.7) |
|
|
$ |
(9.5) |
|
| Options |
$ |
5.9 |
|
|
$ |
0.5 |
|
|
$ |
(0.6) |
|
|
|
|
|
|
$ |
0.3 |
|
|
$ |
— |
|
|
$ |
(0.6) |
|
(1) Based on the fair value of open hedges as of March 31, 2024.
Derivatives Not Designated as Hedging Instruments (1)
|
|
|
|
|
|
|
|
|
|
|
|
|
|
|
|
|
|
|
|
|
|
|
|
|
|
|
|
|
|
|
|
|
|
| |
|
|
|
|
Asset/(Liability) at
March 31, 2024
|
|
|
|
|
|
Effect on other, net (income) expense – increase/(decrease) |
|
Notional
Amount |
|
Interest
Rate |
|
|
|
|
Three Months Ended
March 31, |
| |
|
|
|
|
|
|
|
2024 |
|
2023 |
| |
($ in millions) |
| Interest rate derivatives – open: |
|
|
|
|
|
|
|
|
|
|
|
|
|
| TILC warehouse facility – interest rate cap |
$ |
680.0 |
|
|
2.50 |
% |
|
$ |
36.0 |
|
|
|
|
|
|
$ |
0.7 |
|
|
$ |
— |
|
TILC – interest rate cap (2) |
$ |
680.0 |
|
|
2.50 |
% |
|
$ |
(36.0) |
|
|
|
|
|
|
$ |
2.4 |
|
|
$ |
— |
|
Interest rate derivatives – expired (3): |
|
|
|
|
|
|
|
|
|
|
|
|
|
| TILC warehouse facility – interest rate cap |
$ |
800.0 |
|
|
2.50 |
% |
|
$ |
0.9 |
|
|
|
|
|
|
$ |
1.0 |
|
|
$ |
(0.9) |
|
| TILC – interest rate cap |
$ |
800.0 |
|
|
2.50 |
% |
|
$ |
(0.9) |
|
|
|
|
|
|
$ |
(1.0) |
|
|
$ |
0.9 |
|
(1) Comprised of back-to-back interest rate caps entered into with the same counterparty in connection with our risk management objectives.
(2) The amount recorded to other, net (income) expense in our Consolidated Statements of Operations for the three months ended March 31, 2024 includes a fee of $3.1 million related to the execution of back-to-back interest rate caps associated with the new TILC warehouse loan facility. See Note 8 for further information.
(3) These interest rate caps matured in March 2024 and were settled in April 2024.
Fair Value Measurements
Fair value is defined as the exchange price that would be received for an asset or paid to transfer a liability (an exit price) in the principal or most advantageous market for that asset or liability in an orderly transaction between market participants on the measurement date. An entity is required to establish a fair value hierarchy that maximizes the use of observable inputs and minimizes the use of unobservable inputs when measuring fair value. The three levels of inputs that may be used to measure fair value are listed below.
Level 1 – This level is defined as quoted prices in active markets for identical assets or liabilities. Our cash equivalents and restricted cash are instruments of the U.S. Treasury or highly-rated money market mutual funds. The assets measured on a recurring basis as Level 1 in the fair value hierarchy are summarized below:
|
|
|
|
|
|
|
|
|
|
|
|
|
Level 1 |
| |
March 31, 2024 |
|
December 31, 2023 |
|
(in millions) |
| Assets: |
|
|
|
| Cash equivalents |
$ |
43.9 |
|
|
$ |
78.7 |
|
| Restricted cash |
116.3 |
|
|
129.4 |
|
| Total assets |
$ |
160.2 |
|
|
$ |
208.1 |
|
Level 2 – This level is defined as observable inputs other than Level 1 prices such as quoted prices for similar assets or liabilities; quoted prices in markets that are not active; or other inputs that are observable or can be corroborated by observable market data for substantially the full term of the assets or liabilities. Interest rate swaps and interest rate caps are valued at exit prices obtained from each counterparty. Foreign currency hedges are valued at exit prices obtained from each counterparty, which are based on currency spot and forward rates and forward points. The assets and liabilities measured on a recurring basis as Level 2 in the fair value hierarchy are summarized below:
|
|
|
|
|
|
|
|
|
|
|
|
|
|
Level 2 |
|
| |
March 31, 2024 |
|
December 31, 2023 |
|
|
(in millions) |
|
Assets (1): |
|
|
|
|
| Derivatives designated as hedging instruments: |
|
|
|
|
| Interest rate hedges |
$ |
16.6 |
|
|
$ |
13.1 |
|
|
| Foreign currency forward contracts |
7.7 |
|
|
5.8 |
|
|
| Foreign currency options |
0.5 |
|
|
1.0 |
|
|
| Derivatives not designated as hedging instruments: |
|
|
|
|
| TILC warehouse facility – interest rate caps |
36.9 |
|
|
6.6 |
|
|
|
|
|
|
|
|
|
|
|
|
| Total assets |
$ |
61.7 |
|
|
$ |
26.5 |
|
|
|
|
|
|
|
Liabilities (2): |
|
|
|
|
| Derivatives designated as hedging instruments: |
|
|
|
|
| Interest rate hedges |
$ |
— |
|
|
$ |
2.5 |
|
|
|
|
|
|
|
| Derivatives not designated as hedging instruments: |
|
|
|
|
| TILC – interest rate caps |
36.9 |
|
|
6.6 |
|
|
| Total liabilities |
$ |
36.9 |
|
|
$ |
9.1 |
|
|
(1) Included in other assets in our Consolidated Balance Sheets.
(2) Included in accrued liabilities in our Consolidated Balance Sheets.
Level 3 – This level is defined as unobservable inputs that are supported by little or no market activity and that are significant to the fair value of the assets or liabilities. As of March 31, 2024 and December 31, 2023, we have no assets or liabilities measured on a recurring basis as Level 3 in the fair value hierarchy, except as described in Note 2.
See Note 2 for more information regarding fair value measurements involving Level 3 inputs resulting from acquisition activity. See Note 8 for the estimated fair values of our debt instruments. The fair values of all other financial instruments are estimated to approximate carrying value.
Note 4. Segment Information
We report our operating results in two reportable segments: (1) the Railcar Leasing and Services Group, which owns and operates a fleet of railcars and provides third-party fleet leasing, management, and administrative services; railcar maintenance and modification services; and other railcar logistics products and services; and (2) the Rail Products Group, which manufactures and sells railcars and related parts and components.
Effective January 1, 2024, the Company modified its organizational structure to better leverage our maintenance services capabilities to support lease fleet optimization and to grow our services and parts businesses. The new structure resulted in a change to our reportable segments beginning in 2024. In connection with this organizational update, we aligned the maintenance services business, which was previously reported in the Rail Products Group, to now be presented within our leasing business. This change aligns with the way in which our CODM assesses performance and allocates resources. Consequently, beginning January 1, 2024, we report our operating results in two reportable segments: (1) the Railcar Leasing and Services Group, formerly the Railcar Leasing and Management Services Group, and (2) the Rail Products Group. These changes had no impact to our previously reported consolidated results of operations, financial position, or cash flows. All prior period segment results set forth herein have been recast to reflect these changes and present results on a comparable basis.
Gains and losses from the sale of property, plant, and equipment are included in the operating profit of each respective segment. Our CODM regularly reviews the operating results of our reportable segments in order to assess performance and allocate resources. Our CODM does not consider restructuring activities when evaluating segment operating results; therefore, restructuring activities are not allocated to segment profit or loss.
Sales and related net profits ("deferred profit") from the Rail Products Group to the Leasing Group are recorded in the Rail Products Group and eliminated in consolidation. Sales between these groups are recorded at prices comparable to those charged to external customers, taking into consideration quantity, features, and production demand. Amortization of deferred profit on railcars sold to the Leasing Group is included in the operating profit of the Leasing Group, resulting in the recognition of depreciation expense based on our original manufacturing cost of the railcars. Lease portfolio sales are included in the Leasing Group, with related gains and losses computed based on the net book value of the original manufacturing cost of the railcars.
The financial information for these segments is shown in the tables below (in millions). We operate principally in North America.
|
|
|
|
|
|
|
|
|
|
|
|
|
|
|
|
|
|
|
|
|
|
|
|
|
|
|
|
|
Three Months Ended March 31, 2024 |
|
Railcar Leasing and Services Group |
|
Rail Products Group |
|
|
|
Eliminations |
|
|
|
Consolidated Total |
| External revenue |
$ |
284.3 |
|
|
$ |
525.3 |
|
|
|
|
$ |
— |
|
|
|
|
$ |
809.6 |
|
| Intersegment revenue |
0.9 |
|
|
142.1 |
|
|
|
|
(143.0) |
|
|
|
|
— |
|
| Total revenues |
$ |
285.2 |
|
|
$ |
667.4 |
|
|
|
|
$ |
(143.0) |
|
|
|
|
$ |
809.6 |
|
|
|
|
|
|
|
|
|
|
|
|
|
|
|
|
|
|
|
|
|
|
|
|
|
|
|
|
|
|
|
|
|
|
|
|
|
|
|
|
|
|
|
|
|
|
|
|
|
|
|
|
|
|
Three Months Ended March 31, 2023 |
|
Railcar Leasing and Services Group |
|
Rail Products Group |
|
|
|
Eliminations |
|
|
|
Consolidated Total |
| External revenue |
$ |
232.7 |
|
|
$ |
409.0 |
|
|
|
|
$ |
— |
|
|
|
|
$ |
641.7 |
|
| Intersegment revenue |
0.2 |
|
|
178.6 |
|
|
|
|
(178.8) |
|
|
|
|
— |
|
| Total revenues |
$ |
232.9 |
|
|
$ |
587.6 |
|
|
|
|
$ |
(178.8) |
|
|
|
|
$ |
641.7 |
|
|
|
|
|
|
|
|
|
|
|
|
|
|
|
|
|
|
|
|
|
|
|
|
|
The reconciliation of segment operating profit to consolidated net income is as follows:
|
|
|
|
|
|
|
|
|
|
|
|
|
|
|
|
| |
|
|
Three Months Ended
March 31, |
| |
|
|
|
|
2024 |
|
2023 |
| |
|
|
|
|
(in millions) |
| Operating profit: |
|
|
|
|
|
|
|
| Railcar Leasing and Services Group |
|
|
|
|
$ |
100.3 |
|
|
$ |
84.6 |
|
| Rail Products Group |
|
|
|
|
43.8 |
|
|
24.1 |
|
| Segment Totals |
|
|
|
|
144.1 |
|
|
108.7 |
|
| Corporate and other |
|
|
|
|
(26.5) |
|
|
(26.0) |
|
|
|
|
|
|
|
|
|
| Restructuring activities, net |
|
|
|
|
— |
|
|
0.4 |
|
| Eliminations |
|
|
|
|
(2.4) |
|
|
(14.1) |
|
|
|
|
|
|
|
|
|
| Consolidated operating profit |
|
|
|
|
115.2 |
|
|
69.0 |
|
| Other (income) expense |
|
|
|
|
72.5 |
|
|
63.7 |
|
| Provision (benefit) for income taxes |
|
|
|
|
11.0 |
|
|
(11.5) |
|
| Loss from discontinued operations, net of income taxes |
|
|
|
|
(4.3) |
|
|
(3.1) |
|
|
|
|
|
|
|
|
|
| Net income |
|
|
|
|
$ |
27.4 |
|
|
$ |
13.7 |
|
Note 5. Partially-Owned Subsidiaries
Investments in Leasing Subsidiaries
Through our wholly-owned subsidiary, TILC, we formed two subsidiaries, TRIP Holdings and RIV 2013, for the purpose of providing railcar leasing services in North America for institutional investors. Each of TRIP Holdings and RIV 2013 are direct, partially-owned subsidiaries of TILC in which we have a controlling interest. Each is governed by a seven-member board of representatives, two of whom are designated by TILC. TILC is the agent of each of TRIP Holdings and RIV 2013 and, as such, has been delegated the authority, power, and discretion to take certain actions on behalf of the respective companies.
At March 31, 2024, the carrying value of our investment in TRIP Holdings and RIV 2013 totaled $124.2 million. Our weighted average ownership interest in TRIP Holdings and RIV 2013 is 38% while the remaining 62% weighted average interest is owned by third-party, investor-owned funds. The investment in our partially-owned leasing subsidiaries is eliminated in consolidation.
Each of TRIP Holdings and RIV 2013 has wholly-owned subsidiaries that are the owners of railcars acquired from our Rail Products and Leasing Groups. TRIP Holdings has wholly-owned subsidiaries known as Triumph Rail LLC ("Triumph Rail") and Tribute Rail LLC ("Tribute Rail"). RIV 2013 has a wholly-owned subsidiary known as TRP 2021 LLC ("TRP-2021"). TILC is the contractual servicer for Triumph Rail, Tribute Rail, and TRP-2021, with the authority to manage and service each entity's owned railcars. Our controlling interest in each of TRIP Holdings and RIV 2013 results from our combined role as both equity member and agent/servicer. The noncontrolling interest included in the accompanying Consolidated Balance Sheets represents the non-Trinity equity interest in these partially-owned subsidiaries.
Trinity has no obligation to guarantee performance under any of our partially-owned subsidiaries' (or their respective subsidiaries') debt agreements, guarantee any railcar residual values, shield any parties from losses or guarantee minimum yields.
The assets of each of Triumph Rail, Tribute Rail, and TRP-2021 may only be used to satisfy the particular subsidiary's liabilities, and the creditors of each of Triumph Rail, Tribute Rail, and TRP-2021 have recourse only to the particular subsidiary's assets. Each of TILC and the third-party equity investors receive distributions from TRIP Holdings and RIV 2013, when available, in proportion to its respective equity interests, and has an interest in the net assets of the partially-owned subsidiaries upon a liquidation event in the same proportion. TILC is paid fees for the services it provides to Triumph Rail, Tribute Rail, and TRP-2021 and has the potential to earn certain incentive fees. There are no remaining equity commitments with respect to TRIP Holdings or RIV 2013.
See Note 8 for additional information regarding the debt of TRIP Holdings and RIV 2013 and their respective subsidiaries.
Other Investment in Consolidated Affiliate
In 2023, the Company and a third party formed Trinity Global Ventures to deliver railcars and provide warranty support services in Saudi Arabia. Trinity Global Ventures is owned 51.0% by Trinity Rail Group, LLC ("Trinity Rail Group"), a wholly-owned subsidiary of the Company, and 49.0% by the third party. Upon consideration under the variable interest entity (“VIE”) model of ASC 810, Consolidation, Trinity has concluded that Trinity Global Ventures meets the definition of a VIE. Trinity Rail Group has a variable interest in Trinity Global Ventures arising from its 51.0% equity ownership position. We determined that Trinity is the primary beneficiary and therefore consolidates this entity as we have the power to direct the activities of the entity that most significantly impact its economic performance. At March 31, 2024, the carrying value of our investment in Trinity Global Ventures totaled $2.5 million, which is eliminated in consolidation.
Investment in Unconsolidated Affiliate
In 2021, the Company and Wafra, Inc. (“Wafra”), a global alternative investment manager, announced a new railcar investment vehicle program between Trinity and certain funds managed by Wafra (“Wafra Funds”). As part of this program, a joint venture was formed, Signal Rail Holdings LLC (“Signal Rail”), which is currently owned 87.1% by Wafra Funds and 12.9% by TILC. To date, TILC has sold 6,460 railcars and related leases to Signal Rail for an aggregate sales price of $598.6 million. TILC services all railcars owned by Signal Rail.
Upon consideration under the VIE model of ASC 810, Consolidation, Trinity has concluded that Signal Rail meets the definition of a VIE. TILC has variable interests in Signal Rail arising from its 12.9% equity ownership position and its role as a service provider. We determined that Trinity is not the primary beneficiary and therefore does not consolidate this entity as we do not have the power to direct the activities of the entity that most significantly impact its economic performance. We will absorb portions of Signal Rail’s expected losses and/or receive portions of expected residual returns commensurate with our 12.9% equity interest in Signal Rail.
Our investment in Signal Rail is being accounted for under the equity method of accounting. At March 31, 2024, the carrying value of TILC’s equity investment in Signal Rail was $20.3 million, which is included in other assets in our Consolidated Balance Sheets. The carrying value of this investment represents our maximum exposure in Signal Rail.
Note 6. Railcar Leasing and Services Group
The Railcar Leasing and Services Group owns and operates a fleet of railcars and provides third-party fleet leasing, management, and administrative services; railcar maintenance and modification services; and other railcar logistics products and services. Information related to the Leasing Group is as follows:
|
|
|
|
|
|
|
|
|
|
|
|
|
|
|
|
|
|
|
|
|
|
|
|
|
|
|
Three Months Ended March 31, |
| |
|
|
|
|
|
|
2024 |
|
2023 |
|
Percent |
|
|
|
|
|
($ in millions) |
|
Change |
| Revenues: |
|
|
|
|
|
|
|
|
|
|
|
| Leasing and management |
|
|
|
|
|
|
$ |
209.0 |
|
|
$ |
194.7 |
|
|
7.3 |
% |
Maintenance services (1) |
|
|
|
|
|
|
65.2 |
|
|
29.4 |
|
|
121.8 |
% |
| Digital and logistics services |
|
|
|
|
|
|
11.0 |
|
|
8.8 |
|
|
25.0 |
% |
| Total revenues |
|
|
|
|
|
|
$ |
285.2 |
|
|
$ |
232.9 |
|
|
22.5 |
% |
|
|
|
|
|
|
|
|
|
|
|
|
Cost of revenues (2) |
|
|
|
|
|
|
169.6 |
|
|
146.8 |
|
|
15.5 |
% |
| Selling, engineering, and administrative expenses |
|
|
|
|
|
|
18.1 |
|
|
16.9 |
|
|
7.1 |
% |
| Gains on dispositions of property: |
|
|
|
|
|
|
|
|
|
|
|
| Lease portfolio sales |
|
|
|
|
|
|
2.1 |
|
|
13.5 |
|
|
* |
| Other |
|
|
|
|
|
|
0.7 |
|
|
1.9 |
|
|
* |
| Total operating profit |
|
|
|
|
|
|
$ |
100.3 |
|
|
$ |
84.6 |
|
|
18.6 |
% |
| Total operating profit margin |
|
|
|
|
|
|
35.2 |
% |
|
36.3 |
% |
|
|
| Total operating profit margin, excluding lease portfolio sales |
|
|
|
|
|
|
34.4 |
% |
|
30.5 |
% |
|
|
|
|
|
|
|
|
|
|
|
|
|
|
Selected expense information for Company-owned railcars (3): |
|
|
|
|
|
|
|
|
|
|
|
Depreciation and amortization expense (4) |
|
|
|
|
|
|
$ |
59.9 |
|
|
$ |
61.6 |
|
|
(2.8) |
% |
Maintenance and compliance expense (5) |
|
|
|
|
|
|
$ |
30.4 |
|
|
$ |
34.8 |
|
|
(12.6) |
% |
Other fleet operating costs (6) |
|
|
|
|
|
|
$ |
7.7 |
|
|
$ |
9.2 |
|
|
(16.3) |
% |
Interest expense (7) |
|
|
|
|
|
|
$ |
57.4 |
|
|
$ |
54.8 |
|
|
4.7 |
% |
* Not meaningful
(1) Revenues related to services performed by the maintenance services business to support the railcars in our lease fleet are eliminated within the Railcar Leasing & Services Group and are excluded from the totals reported on this line.
(2) Includes depreciation and amortization expense, maintenance and compliance expense, and other fleet operating costs related to our lease fleet, as well as cost of revenues for our maintenance services and digital and logistics services businesses.
(3) Includes wholly-owned railcars, partially-owned railcars, and railcars under leased-in arrangements.
(4) Depreciation and amortization expense includes $4.7 million for the three months ended March 31, 2023 related to the disposal of certain railcar components associated with our sustainable railcar conversion program. Additionally, amortization of deferred profit on railcars sold from the Rail Products Group to the Leasing Group is included in depreciation and amortization expense, resulting in the recognition of depreciation expense based on our original manufacturing cost of the railcars.
(5) Maintenance and compliance expense is reported at cost with respect to the work that is completed by our maintenance services business to support the railcars in our lease fleet.
(6) Other fleet operating costs include freight, storage, rent, and ad valorem taxes.
(7) Interest expense is not a component of operating profit and includes the effect of hedges.
Information related to lease portfolio sales is as follows:
|
|
|
|
|
|
|
|
|
|
|
|
|
|
|
|
|
|
|
Three Months Ended
March 31, |
|
|
|
|
|
2024 |
|
2023 |
|
|
|
|
|
($ in millions) |
| Lease portfolio sales |
|
|
|
|
$ |
24.2 |
|
|
$ |
56.7 |
|
| Operating profit on lease portfolio sales |
|
|
|
|
$ |
2.1 |
|
|
$ |
13.5 |
|
| Operating profit margin on lease portfolio sales |
|
|
|
|
8.7 |
% |
|
23.8 |
% |
Railcar Leasing Equipment Portfolio. The Leasing Group's equipment consists primarily of railcars leased by third parties. The Leasing Group purchases equipment manufactured predominantly by the Rail Products Group and enters into lease contracts with third parties with terms generally ranging between one year and ten years. The Leasing Group primarily enters into operating leases. Future contractual minimum rental revenues on operating leases related to our wholly-owned and partially-owned subsidiaries are as follows:
|
|
|
|
|
|
|
|
|
|
|
|
|
|
|
|
|
|
|
|
|
|
|
|
|
|
|
|
|
|
|
|
|
|
|
|
|
|
|
|
|
|
|
Remaining nine months of 2024 |
|
2025 |
|
2026 |
|
2027 |
|
2028 |
|
Thereafter |
|
Total |
| |
(in millions) |
| Future contractual minimum rental revenues |
$ |
523.0 |
|
|
$ |
586.3 |
|
|
$ |
467.0 |
|
|
$ |
349.3 |
|
|
$ |
211.1 |
|
|
$ |
331.7 |
|
|
$ |
2,468.4 |
|
Debt. Wholly-owned subsidiaries. The Leasing Group’s debt at March 31, 2024 consisted primarily of non-recourse debt. As of March 31, 2024, Trinity’s wholly-owned subsidiaries included in the Leasing Group held equipment with a net book value of $5,634.0 million, which is pledged solely as collateral for Leasing Group debt held by those subsidiaries. The net book value of unpledged equipment at March 31, 2024 was $368.6 million. See Note 8 for more information regarding the Leasing Group’s debt.
Partially-owned subsidiaries. Debt owed by TRIP Holdings and RIV 2013 and their respective subsidiaries is non-recourse to Trinity and TILC. Creditors of each of TRIP Holdings and RIV 2013 and their respective subsidiaries have recourse only to the particular subsidiary's assets. As of March 31, 2024, TRIP Holdings held equipment with a net book value of $1,035.1 million, which is pledged solely as collateral for the TRIP Holdings' debt held by its subsidiaries. As of March 31, 2024, TRP-2021 equipment with a net book value of $422.9 million is pledged solely as collateral for the TRP-2021 debt. See Note 5 for a description of TRIP Holdings and RIV 2013 and their respective subsidiaries.
Operating Lease Obligations. Future amounts due as well as future contractual minimum rental revenues related to the Leasing Group's railcar operating lease obligations are as follows:
|
|
|
|
|
|
|
|
|
|
|
|
|
|
|
|
|
|
|
|
|
|
|
|
|
|
|
|
|
|
|
|
|
|
|
|
|
|
|
|
|
|
|
Remaining nine months of 2024 |
|
2025 |
|
2026 |
|
2027 |
|
2028 |
|
Thereafter |
|
Total |
| |
(in millions) |
Future operating lease obligations |
$ |
6.6 |
|
|
$ |
8.2 |
|
|
$ |
7.7 |
|
|
$ |
7.2 |
|
|
$ |
5.1 |
|
|
$ |
6.8 |
|
|
$ |
41.6 |
|
| Future contractual minimum rental revenues |
$ |
7.2 |
|
|
$ |
7.5 |
|
|
$ |
5.1 |
|
|
$ |
1.1 |
|
|
$ |
0.3 |
|
|
$ |
— |
|
|
$ |
21.2 |
|
Operating lease obligations totaling $0.8 million are guaranteed by Trinity Industries, Inc. and certain subsidiaries.
Note 7. Property, Plant, and Equipment
The following table summarizes the components of property, plant, and equipment:
|
|
|
|
|
|
|
|
|
|
|
|
|
March 31, 2024 |
|
December 31, 2023 |
| |
(in millions) |
| Railcars in our lease fleet: |
|
|
|
| Wholly-owned subsidiaries: |
|
|
|
| Equipment on lease |
$ |
7,657.7 |
|
|
$ |
7,536.7 |
|
| Less: accumulated depreciation |
(1,655.1) |
|
|
(1,604.9) |
|
|
6,002.6 |
|
|
5,931.8 |
|
| Partially-owned subsidiaries: |
|
|
|
| Equipment on lease |
2,235.7 |
|
|
2,236.6 |
|
| Less: accumulated depreciation |
(777.7) |
|
|
(763.4) |
|
|
1,458.0 |
|
|
1,473.2 |
|
|
|
|
|
Deferred profit on railcar products sold (1) |
(1,061.7) |
|
|
(1,061.3) |
|
| Less: accumulated amortization |
318.6 |
|
|
311.1 |
|
|
(743.1) |
|
|
(750.2) |
|
| Total railcars in our lease fleet |
6,717.5 |
|
|
6,654.8 |
|
|
|
|
|
| Operating and administrative assets: |
|
|
|
| Land |
16.4 |
|
|
16.1 |
|
| Buildings and improvements |
380.1 |
|
|
380.4 |
|
| Machinery and other |
421.8 |
|
|
419.8 |
|
| Construction in progress |
8.2 |
|
|
11.3 |
|
|
826.5 |
|
|
827.6 |
|
| Less: accumulated depreciation |
(484.4) |
|
|
(477.6) |
|
| Total operating and administrative assets |
342.1 |
|
|
350.0 |
|
| Total property, plant, and equipment, net |
$ |
7,059.6 |
|
|
$ |
7,004.8 |
|
(1) Includes deferred profit related to new railcar additions, sustainable railcar conversions, railcar modifications, and other betterments. The deferred profit is subsequently eliminated in consolidation.
Note 8. Debt
The carrying amounts of our debt are as follows:
|
|
|
|
|
|
|
|
|
|
|
|
|
March 31, 2024 |
|
December 31, 2023 |
| |
(in millions) |
| Corporate – Recourse: |
|
|
|
| Revolving credit facility |
$ |
— |
|
|
$ |
— |
|
Senior notes due 2024, net of unamortized discount of $— and $0.1 |
400.0 |
|
|
399.9 |
|
| Senior notes due 2028 |
400.0 |
|
|
400.0 |
|
|
800.0 |
|
|
799.9 |
|
| Less: unamortized debt issuance costs |
(5.0) |
|
|
(5.3) |
|
| Total recourse debt |
795.0 |
|
|
794.6 |
|
|
|
|
|
| Lease fleet – Non-recourse: |
|
|
|
| Wholly-owned subsidiaries: |
|
|
|
Secured railcar equipment notes, net of unamortized discount of $0.2 and $0.2 |
2,213.6 |
|
|
2,246.7 |
|
2017 promissory notes, net of unamortized discount of $3.0 and $3.5 |
663.1 |
|
|
673.7 |
|
| TRL-2023 term loan |
331.7 |
|
|
334.5 |
|
| TILC warehouse facility |
701.8 |
|
|
529.3 |
|
| Other equipment financing |
51.8 |
|
|
52.3 |
|
|
3,962.0 |
|
|
3,836.5 |
|
| Less: unamortized debt issuance costs |
(16.0) |
|
|
(17.3) |
|
|
3,946.0 |
|
|
3,819.2 |
|
| Partially-owned subsidiaries: |
|
|
|
Secured railcar equipment notes, net of unamortized discount of $0.1 and $0.1 |
1,132.8 |
|
|
1,147.8 |
|
|
|
|
|
|
|
|
|
| Less: unamortized debt issuance costs |
(6.8) |
|
|
(7.4) |
|
|
1,126.0 |
|
|
1,140.4 |
|
| Total non-recourse debt |
5,072.0 |
|
|
4,959.6 |
|
| Total debt |
$ |
5,867.0 |
|
|
$ |
5,754.2 |
|
Estimated Fair Value of Debt – The estimated fair values of our 7.75% senior notes due 2028 ("Senior Notes due 2028") and our 4.55% senior notes due 2024 ("Senior Notes due 2024") are based on a quoted market price in a market with little activity (Level 2 input). The estimated fair values of our secured railcar equipment notes are based on our estimate of their fair value using unobservable input values provided by a third party (Level 3 inputs). The respective carrying values of our revolving credit facility, 2017 promissory notes, TRL-2023 term loan, and TILC warehouse facility approximate fair value because the interest rate adjusts to the market interest rate. As of March 31, 2024, we evaluated the fair value of the other equipment financing liability using Level 3 inputs and determined that the carrying value approximates fair value. The estimated fair values of our debt are as follows:
|
|
|
|
|
|
|
|
|
|
|
|
|
March 31, 2024 |
|
December 31, 2023 |
|
(in millions) |
|
|
|
|
| Level 2 |
$ |
807.3 |
|
|
$ |
812.1 |
|
| Level 3 |
$ |
3,174.1 |
|
|
$ |
3,192.7 |
|
Revolving Credit Facility – We have a $600.0 million unsecured corporate revolving credit facility. During the three months ended March 31, 2024, we had total borrowings of $130.0 million and total repayments of $130.0 million under the revolving credit facility. Additionally, we had outstanding letters of credit issued in an aggregate amount of $18.2 million, leaving $581.8 million available for borrowing as of March 31, 2024. The majority of our outstanding letters of credit as of March 31, 2024 are scheduled to expire in October 2024. Our letters of credit obligations support performance bonds related to certain railcar orders. The revolving credit facility bears interest at a variable rate of SOFR plus (1) a benchmark adjustment of 10 basis points and (2) a facility margin of 1.75%, for an all-in interest rate of 7.16% as of March 31, 2024. A commitment fee accrues on the average daily unused portion of the revolving credit facility at the rate of 0.175% to 0.40% (0.25% as of March 31, 2024).
The revolving credit facility requires the maintenance of ratios related to minimum interest coverage for the leasing and manufacturing operations and maximum leverage. As of March 31, 2024, we were in compliance with all such financial covenants.
TILC Warehouse Loan Facility – TILC has historically maintained a warehouse loan facility to finance railcars owned by TILC. In March 2024, we entered into a new warehouse loan facility with a total commitment amount of $800.0 million, a revolving termination date of March 15, 2027, and a maturity date of March 15, 2028. This warehouse loan facility replaced the prior $1.0 billion warehouse loan facility. We incurred $3.6 million in debt issuance costs, which are recorded in other assets in our Consolidated Balance Sheets as of March 31, 2024, and are being amortized to interest expense over the facility term. During the three months ended March 31, 2024, we had total borrowings of $783.7 million and total repayments of $611.2 million under the current and prior TILC warehouse loan facilities. The entire unused facility amount of $98.2 million was available as of March 31, 2024 based on the amount of warehouse-eligible, unpledged equipment. Advances under the facility bear interest at one-month term SOFR plus a facility margin of 1.75%, for an all-in interest rate of 7.12% at March 31, 2024.
Terms and conditions of our other debt, including recourse and non-recourse provisions and scheduled maturities, are described in Note 9 of our 2023 Annual Report on Form 10-K.
Note 9. Income Taxes
The effective tax rate from continuing operations for the three months ended March 31, 2024 was an expense of 25.8%, which differs from the U.S. statutory rate of 21.0% primarily due to state income taxes and foreign income taxes, partially offset by the benefit of noncontrolling interest, for which we do not provide income taxes.
The effective tax rate from continuing operations for the three months ended March 31, 2023 was a benefit of 217.0%, which differs from the U.S. statutory rate of 21.0% primarily due to the release of residual taxes out of AOCI; the re-measurement of our net deferred tax liabilities due to the acquisition of a subsidiary; changes in our valuation allowances; state income taxes; and foreign income taxes.
During the three months ended March 31, 2023, one of our partially-owned subsidiaries released residual tax effects that had previously been recorded in AOCI. This deferred tax benefit was originally recorded before the partially-owned subsidiary was treated as a flow-through entity, remaining in AOCI until the underlying book-to-tax difference no longer existed, which occurred during the three months ended March 31, 2023. As a result, we recorded an $11.9 million income tax benefit in our Consolidated Statements of Operations during the three months ended March 31, 2023.
Pursuant to the acquisition of a subsidiary during the three months ended March 31, 2023, we re-measured our existing deferred tax assets and liabilities, taking into account the expected change to state tax apportionment. This resulted in an increase to our net deferred tax liability of $3.2 million in the period, which was recorded through deferred income tax expense.
The tax provision for the three months ended March 31, 2023 also reflects a $4.0 million tax benefit related to the net impact of an adjustment to valuation allowances, primarily for deferred tax assets in Mexico, state tax loss carryforwards, and federal tax credits.
The total income tax receivable position as of March 31, 2024 was $4.9 million primarily for state tax overpayments. Our income tax payable for federal, state, and foreign income taxes is $11.6 million as of March 31, 2024.
Deferred income taxes related to railcars in our lease fleet were $1.1 billion as of both March 31, 2024 and December 31, 2023.
Our federal tax return years through 2020 are closed under statute and the years 2021-2023 remain open. We have state tax returns that are under audit in the normal course of business, and our Mexican subsidiaries' tax returns statutes of limitations remain open for auditing 2018 forward. We believe we are appropriately reserved for any potential matters.
Beginning in 2024, certain jurisdictions have enacted a 15% minimum tax on all companies that operate in their jurisdiction, consistent with one or more Organization for Economic Co-operation and Development Global Anti-Base Erosion Model Rules ("Pillar Two"). Because the Pillar Two legislation has not been enacted in jurisdictions in which we operate, there is no impact to our effective tax rate; however, we will continue to monitor our potential exposure to Pillar Two in the jurisdictions in which we operate.
Note 10. Employee Retirement Plans
Amounts related to our employee retirement plans are as follows:
|
|
|
|
|
|
|
|
|
|
|
|
|
|
|
|
| |
|
|
Three Months Ended
March 31, |
| |
|
|
|
|
2024 |
|
2023 |
| |
|
|
|
|
(in millions) |
| Defined contribution expense |
|
|
|
|
$ |
3.0 |
|
|
$ |
2.4 |
|
|
|
|
|
|
|
|
|
Note 11. Accumulated Other Comprehensive Income
Changes in AOCI for the three months ended March 31, 2024 are as follows:
|
|
|
|
|
|
|
|
|
|
|
|
|
|
|
|
|
|
|
|
|
|
|
Unrealized gains/(losses) on derivative financial instruments |
|
Net actuarial gains/(losses) of defined benefit plans |
|
Accumulated other comprehensive income (loss) |
| |
|
|
(in millions) |
Balances at December 31, 2023 |
|
|
$ |
12.4 |
|
|
$ |
(1.4) |
|
|
$ |
11.0 |
|
| Other comprehensive income, net of tax, before reclassifications |
|
|
11.4 |
|
|
— |
|
|
11.4 |
|
Amounts reclassified from AOCI, net of tax expense of $1.2, $—, and $1.2 |
|
|
(3.9) |
|
|
— |
|
|
(3.9) |
|
|
|
|
|
|
|
|
|
| Less: noncontrolling interest |
|
|
(0.1) |
|
|
— |
|
|
(0.1) |
|
| Other comprehensive income |
|
|
7.4 |
|
|
— |
|
|
7.4 |
|
Balances at March 31, 2024 |
|
|
$ |
19.8 |
|
|
$ |
(1.4) |
|
|
$ |
18.4 |
|
See Note 3 for additional information on the reclassification of amounts in AOCI into earnings. Reclassifications of unrealized before-tax gains and losses on derivative financial instruments are included in interest expense, net for our interest rate hedges and in cost of revenues for our foreign currency hedges in our Consolidated Statements of Operations. Reclassifications of before-tax net actuarial gains/(losses) of defined benefit plans are included in other, net (income) expense in our Consolidated Statements of Operations.
Note 12. Common Stock and Stock-Based Compensation
Stockholders' Equity
In December 2022, our Board of Directors authorized a share repurchase program effective December 9, 2022 with no expiration. The share repurchase program authorizes the Company to repurchase up to $250.0 million of its common stock. There were no shares repurchased during the three months ended March 31, 2024 and 2023.
Stock-Based Compensation
Stock-based compensation expense totaled approximately $4.7 million and $6.2 million for the three months ended March 31, 2024 and 2023, respectively. The Company's annual grants of share-based awards generally occur in the first and second quarters under our Fifth Amended and Restated Stock Option and Incentive Plan (the "Plan”). Our stock options have contractual terms of ten years and become exercisable over a three-year period. Expense related to stock options is recognized on a straight-line basis over the vesting period. Expense related to restricted stock units ("RSUs") issued to eligible employees under the Plan is recognized over the vesting period, generally between three years and four years. Beginning in 2020, certain RSU grants provide for full vesting when the award recipients retire having reached 60 years of age and having provided at least ten years of service to the Company, provided that the awards remain outstanding for a period of six months from the date of grant. The expense for these awards is recognized over the applicable service period for each of the eligible award recipients. Expense related to RSUs and restricted stock awards ("RSAs") granted to non-employee directors under the Plan is recognized on a straight-line basis over the vesting period, generally one year. Expense related to performance units is recognized on a straight-line basis from their award date to the end of the performance period, generally three years.
The following table summarizes stock-based compensation awards granted during the three months ended March 31, 2024:
|
|
|
|
|
|
|
|
|
|
|
|
|
Number of Shares Granted |
|
Weighted Average Grant-Date Fair Value per Award |
|
|
|
|
| Restricted stock units |
12,155 |
|
|
$ |
24.93 |
|
|
|
|
|
| Performance units |
130,610 |
|
|
$ |
31.15 |
|
The fair value of RSUs granted is based on the Company's closing stock price on the date of grant. The fair value of the performance units for relative total shareholder return granted during the three months ended March 31, 2024 was estimated at the date of grant using a Monte Carlo simulation with assumptions that reflect market conditions at the date of grant, including stock price, risk-free interest rate, expected term, expected volatility, and dividend yield.
Note 13. Earnings Per Common Share
Basic net income attributable to Trinity Industries, Inc. per common share ("EPS") is computed by dividing net income attributable to Trinity by the weighted average number of basic common shares outstanding for the period. Except when the effect would be antidilutive, the calculation of diluted EPS includes the net impact of potentially dilutive common shares. The Company has certain unvested RSAs that participate in dividends on a nonforfeitable basis and are therefore considered to be participating securities. Consequently, diluted net income attributable to Trinity Industries, Inc. per common share is calculated under both the two-class method and the treasury stock method, and the more dilutive of the two calculations is presented.
The following table sets forth the computation of basic and diluted net income attributable to Trinity Industries, Inc.
|
|
|
|
|
|
|
|
|
|
|
|
|
|
|
|
| |
|
|
Three Months Ended
March 31, |
| |
|
|
|
|
2024 |
|
2023 |
|
|
|
|
|
(in millions, except per share amounts) |
| Income from continuing operations |
|
|
|
|
$ |
31.7 |
|
|
$ |
16.8 |
|
| Less: Net income attributable to noncontrolling interest |
|
|
|
|
(3.7) |
|
|
(9.3) |
|
|
|
|
|
|
|
|
|
| Net income from continuing operations attributable to Trinity Industries, Inc. |
|
|
|
|
28.0 |
|
|
7.5 |
|
|
|
|
|
|
|
|
|
|
|
|
|
|
|
|
|
|
|
|
|
|
|
|
|
| Net loss from discontinued operations attributable to Trinity Industries, Inc. |
|
|
|
|
(4.3) |
|
|
(3.1) |
|
| Net income attributable to Trinity Industries, Inc. |
|
|
|
|
$ |
23.7 |
|
|
$ |
4.4 |
|
|
|
|
|
|
|
|
|
| Basic weighted average shares outstanding |
|
|
|
|
81.6 |
|
|
80.8 |
|
| Effect of dilutive securities |
|
|
|
|
1.9 |
|
|
2.4 |
|
Diluted weighted average shares outstanding |
|
|
|
|
83.5 |
|
|
83.2 |
|
|
|
|
|
|
|
|
|
Basic earnings per common share: |
|
|
|
|
|
|
|
| Income from continuing operations |
|
|
|
|
$ |
0.34 |
|
|
$ |
0.09 |
|
| Loss from discontinued operations |
|
|
|
|
(0.05) |
|
|
(0.04) |
|
| Basic net income attributable to Trinity Industries, Inc. |
|
|
|
|
$ |
0.29 |
|
|
$ |
0.05 |
|
| Diluted earnings per common share: |
|
|
|
|
|
|
|
| Income from continuing operations |
|
|
|
|
$ |
0.33 |
|
|
$ |
0.09 |
|
| Loss from discontinued operations |
|
|
|
|
(0.05) |
|
|
(0.04) |
|
| Diluted net income attributable to Trinity Industries, Inc. |
|
|
|
|
$ |
0.28 |
|
|
$ |
0.05 |
|
|
|
|
|
|
|
|
|
| Potentially dilutive securities excluded from EPS calculation: |
|
|
|
|
|
|
|
| Antidilutive restricted shares |
|
|
|
|
0.2 |
|
|
0.1 |
|
| Antidilutive stock options |
|
|
|
|
— |
|
|
— |
|
Note 14. Contingencies
Highway products litigation
We previously reported the filing of a False Claims Act (“FCA”) complaint in the United States District Court for the Eastern District of Texas, Marshall Division (“District Court”) styled Joshua Harman, on behalf of the United States of America, Plaintiff/Relator v. Trinity Industries, Inc., Defendant, Case No. 2:12-cv-00089-JRG (E.D. Tex.). In this case, in which the U.S. Government declined to intervene, the relator, Mr. Joshua Harman, alleged the Company violated the FCA pertaining to sales of the ET Plus. On October 20, 2014, a trial in this case concluded with a jury verdict stating that the Company and THP “knowingly made, used or caused to be made or used, a false record or statement material to a false or fraudulent claim," and the District Court entered judgment on the verdict in the total amount of $682.4 million. On September 29, 2017, the United States Court of Appeals for the Fifth Circuit ("Fifth Circuit") reversed the District Court’s $682.4 million judgment and rendered judgment as a matter of law in favor of the Company and THP. On January 7, 2019, the United States Supreme Court denied Mr. Harman's petition for certiorari seeking review of the Fifth Circuit's decision. The denial of Mr. Harman's petition ended this action.
Pursuant to the purchase and sale agreement related to the sale of THP, the Company agreed to indemnify Rush Hour for certain liabilities related to the highway products business, including those liabilities resulting from or arising out of (a) the proceedings set forth under “State actions” below and (b) any other proceedings to the extent resulting from or arising out of ET Plus systems or specified ET Plus component parts that were both (i) manufactured prior to December 31, 2021, and (ii) sold in the United States on or prior to April 30, 2022, or related warranty obligations with respect thereto.
State actions
Mr. Harman also has a separate state qui tam action currently pending pursuant to the Virginia Fraud Against Taxpayers Act ("VFATA") (Commonwealth of Virginia ex rel. Joshua M. Harman v. Trinity Industries, Inc. and Trinity Highway Products, LLC, Case No. CL13-698, in the Circuit Court, Richmond, Virginia). In this matter, Mr. Harman alleged the Company violated the VFATA pertaining to sales of the ET Plus, and he is seeking damages, civil penalties, attorneys’ fees, costs, and interest. The Commonwealth of Virginia Attorney General has intervened in the Virginia matter. On February 7, 2024, the trial court granted the Company's motion for summary judgment and ordered that the trial dates and hearing dates in this matter be removed from the court's docket. On March 26, 2024, the trial court granted the Commonwealth of Virginia’s motion to suspend entry of a final order pending the trial court’s review of Mr. Harman’s forthcoming motion for reconsideration of the order granting the Company’s motion for summary judgment.
In a similar New Jersey state qui tam action (State of New Jersey ex rel. Joshua M. Harman v. Trinity Industries, Inc. and Trinity Highway Products, LLC, Case No.L-1344-14, in the Superior Court of New Jersey Law Division: Mercer County) that was previously dismissed by the trial court, Mr. Harman sought leave to file an amended complaint pursuant to the New Jersey False Claims Act. On February 16, 2022, the trial court denied Mr. Harman’s motion. On March 9, 2022, Mr. Harman filed a motion for reconsideration of the trial court’s order denying leave to file an amended complaint. On June 27, 2022, the trial court denied Mr. Harman’s motion for reconsideration seeking leave to file an amended complaint with prejudice. On August 9, 2022, Mr. Harman filed a Notice of Appeal of the trial court's order denying Mr. Harman's motion for reconsideration. Mr. Harman's appeal remains pending.
The Company believes that the claims in these matters are without merit and intends to vigorously defend against all allegations. Based on information currently available to the Company and previously disclosed, we currently do not believe that a loss is probable in the state qui tam actions described under "State actions," therefore no accrual has been included in the accompanying Consolidated Financial Statements. Because of the complexity of these actions, as well as the current status of certain of these actions, we are not able to estimate a range of possible losses with respect to any one or more of these actions. While the financial impacts of these state actions are currently unknown, they could be material.
Product liability cases
The Company is currently defending product liability lawsuits that are alleged to involve the ET Plus as well as other products manufactured by THP. These cases are diverse in light of the randomness of collisions in general and the fact that each accident involving a roadside device, such as an end terminal, or any other fixed object along the highway, has its own unique facts and circumstances. The Company carries general liability insurance to mitigate the impact of adverse judgment exposures in these product liability cases. To the extent that the Company believes that a loss is probable with respect to these product liability cases, the accrual for such losses is included in the amounts described below under "Other matters".
East Palestine, OH Train Derailment
On February 3, 2023, a Norfolk Southern Railway freight train derailed 38 railcars in East Palestine, Ohio. In March 2023, the State of Ohio and the United States Environmental Protection Agency filed lawsuits against Norfolk Southern Railway Company and Norfolk Southern Corporation (“Norfolk Southern”), which were consolidated in the United States District Court for the Northern District of Ohio, Eastern Division in a civil action styled The State of Ohio, ex rel., Dave Yost, Ohio Attorney General, and the United States of America, Plaintiffs v. Norfolk Southern Railway Company and Norfolk Southern Corporation, Defendants, Civil Action No. 4:23-cv-00517. In this action, on June 30, 2023, Norfolk Southern filed a third-party complaint against the Company’s wholly-owned subsidiary, TILC. Norfolk Southern also named as third-party defendants in this action Oxy Vinyls LP, GATX Corporation, General American Marks Company, SMBC Rail Services LLC, Dow Chemical Incorporated, and Union Tank Car Company. Norfolk Southern asserts third-party claims against TILC for recovery of response costs, contribution, and declaratory relief under the Comprehensive Environmental Response, Compensation, and Liability Act ("CERCLA"); negligence; and equitable contribution. TILC was the owner of one tank car cited in this action, which was leased to a third party, who is also a third-party defendant in the litigation. On September 15, 2023, TILC filed a motion to dismiss Norfolk Southern’s third-party complaint. On March 6, 2024, the trial court granted TILC’s motion to dismiss Norfolk Southern’s Third-Party Complaint and entered an order dismissing Norfolk Southern’s complaint against TILC. On March 26, 2024, Norfolk Southern filed a Motion for Entry of Partial Final Judgment, which remains pending.
In April 2023, multiple putative class action lawsuits filed against Norfolk Southern were consolidated in the United States District Court for the Northern District of Ohio, Eastern Division in a civil action styled In re: East Palestine Train Derailment, Civil Action No. 4:23-CV-00242 ("Consolidated Class Action"). In this action, on July 25, 2023, Norfolk Southern filed a third-party complaint against the Company’s wholly-owned subsidiary, TILC. Norfolk Southern also named as third-party defendants in this action Oxy Vinyls LP, GATX Corporation, and General American Marks Company. Norfolk Southern asserts third-party claims against TILC for negligence, joint and several liability, and contribution. On August 14, 2023, plaintiffs filed a First Amended Master Consolidated Class Action Complaint and Jury Demand (“First Amended Complaint”) asserting direct claims for negligence, gross negligence, and medical monitoring against Oxy Vinyls LP, GATX Corporation, General American Marks Company, and TILC ("Railcar Defendants"). On September 15, 2023, TILC filed a motion to dismiss Norfolk Southern’s third-party complaint, and on September 26, 2023, TILC filed a motion to dismiss plaintiffs’ First Amended Complaint. On March 13, 2024, the trial court granted in part and denied in part TILC’s motion to dismiss Norfolk Southern’s third-party complaint and TILC’s motion to dismiss plaintiffs’ First Amended Complaint. On April 9, 2024, plaintiffs and Norfolk Southern announced a settlement in principal of plaintiffs’ claims against Norfolk Southern and the Railcar Defendants. Norfolk Southern preserved its third-party claims against the Railcar Defendants. TILC was the owner of one tank car cited in this action, which was leased to a third party, who is also a third-party defendant in the litigation.
On December 8, 2023, a lawsuit was filed against TILC titled Ambridge Area School District et al. v. Norfolk Southern Corporation et al., Case No. 2:23-cv-01530-CB, in the United States District Court for the Western District of Pennsylvania. Plaintiffs in this putative class action lawsuit assert claims against Norfolk Southern Corporation, Norfolk Southern Railway Company, Oxy Vinyls, LP, GATX Corporation, General American Marks Company, and TILC for negligence, negligence per se, strict liability, public and private nuisance, future health monitoring, trespass, and punitive damages. On February 23, 2024, TILC filed a motion to dismiss plaintiffs’ amended complaint, which remains pending. TILC was the owner of one tank car cited in this action, which was leased to a third party, who is also a defendant in the litigation.
On March 8, 2024, a lawsuit was filed against TILC titled Patricia Almasy et al. v. Norfolk Southern Corporation et al., Case No. 4:24-cv-00452, in the United States District Court for the Northern District of Ohio (“Almasy Lawsuit”). Plaintiffs assert claims against Norfolk Southern Corporation, Norfolk Southern Railway Company, Oxy Vinyls, LP, GATX Corporation, General American Marks Company, and TILC. Plaintiffs assert claims against TILC for negligence, gross negligence, future health monitoring, and willful and wanton conduct. TILC was the owner of one tank car cited in this action, which was leased to a third party, who is also a defendant in this lawsuit. On March 13, 2024, this lawsuit was consolidated into the Consolidated Class Action lawsuit.
The Company believes it has substantial defenses and intends to vigorously defend itself against all allegations in the third-party and direct claims asserted against TILC. The Company or its subsidiaries could be named in similar litigation involving other plaintiffs, but the ultimate number of claims and the jurisdiction(s) in which such claims, if any, may be filed may vary. We do not believe at this time that a loss is probable in these matters, nor can a range of possible losses be determined. Accordingly, no accrual or range of loss has been included in the accompanying consolidated financial statements. The Company maintains liability insurance coverage and commercial contractual indemnity rights to protect the Company’s assets from losses arising from these types of litigation claims.
Other matters
The Company is involved in claims and lawsuits incidental to our business arising from various matters, including product warranty, personal injury, environmental issues, workplace laws, and various governmental regulations. The Company evaluates its exposure to such claims and suits periodically and establishes accruals for these contingencies when a range of loss can be reasonably estimated. The range of reasonably possible losses for such matters is $7.9 million to $19.4 million, which includes our rights to indemnity and recourse to third parties of approximately $0.1 million, which is recorded in other assets in our Consolidated Balance Sheets as of March 31, 2024. This range includes any amounts related to the Highway Products litigation matters described above in the section titled “Highway products litigation." At March 31, 2024, total accruals of $8.8 million, including environmental and workplace matters described below, are included in accrued liabilities in the accompanying Consolidated Balance Sheets. The Company believes any additional liability would not be material to its financial position or results of operations.
Trinity is subject to remedial orders and federal, state, local, and foreign laws and regulations relating to the environment and the workplace. The Company has reserved $1.4 million to cover our probable and estimable liabilities with respect to the investigations, assessments, and remedial responses to such matters, taking into account currently available information and our contractual rights to indemnification and recourse to third parties. However, estimates of liability arising from future proceedings, assessments, or remediation are inherently imprecise. Accordingly, there can be no assurance that we will not become involved in future litigation or other proceedings involving the environment and the workplace or, if we are found to be responsible or liable in any such litigation or proceeding, that such costs would not be material to the Company. We believe that we are currently in substantial compliance with environmental and workplace laws and regulations.
Georgia Fire
On January 16, 2024, a fire damaged a portion of the Company's facility in Cartersville, Georgia. We have incurred costs related to cleanup and damage remediation activities in order for the facility to resume limited operations, and we expect to return to normal production levels in the second half of 2024. We believe our insurance coverage is sufficient to cover property damage costs related to the event. Accordingly, at March 31, 2024, we recorded an insurance receivable of approximately $1.0 million for property damage recoveries that we have concluded are probable of collection. As of March 31, 2024, we have received advanced payments from insurance of approximately $1.5 million for cleanup and damage remediation activities.
Any property damage insurance proceeds received in excess of the net book value of property lost and related cleanup costs will be accounted for as a gain. Additionally, the Company may be entitled to business interruption proceeds related to the event. We will not record these recoveries until settlements have been reached with the insurance company.
Item 2. Management’s Discussion and Analysis of Financial Condition and Results of Operations
Management’s Discussion and Analysis of Financial Condition and Results of Operations (“MD&A”) is intended to provide management's perspective on our financial condition, results of operations, liquidity, and certain other factors that may affect our future results. Our MD&A should be read in conjunction with the unaudited Consolidated Financial Statements and related Notes in Part I, Item 1 of this Quarterly Report on Form 10-Q and Item 8, Financial Statements and Supplementary Data, of our 2023 Annual Report on Form 10-K.
This MD&A includes financial measures compiled in accordance with generally accepted accounting principles ("GAAP") and certain non-GAAP measures. Please refer to the Non-GAAP Financial Measures section herein for information on the non-GAAP measures included in the MD&A, reconciliations to the most directly comparable GAAP financial measure, and the reasons why management believes each measure is useful to management and investors.
Forward-Looking Statements
This quarterly report on Form 10-Q (or statements otherwise made by the Company or on the Company’s behalf from time to time in other reports, filings with the Securities and Exchange Commission (“SEC”), news releases, conferences, website postings or otherwise) contains forward-looking statements within the meaning of the Private Securities Litigation Reform Act of 1995. Any statements contained herein that are not historical facts are forward-looking statements and involve risks and uncertainties. These forward-looking statements include expectations, beliefs, plans, objectives, future financial performances, estimates, projections, goals, and forecasts. Trinity uses the words “anticipates,” “believes,” “estimates,” “expects,” “intends,” “forecasts,” “may,” “will,” “should,” and similar expressions to identify these forward-looking statements. Potential factors that could cause our actual results of operations to differ materially from those in the forward-looking statements, include, among others:
•market conditions and customer demand for our business products and services;
•the cyclical nature of the industries in which we compete;
•variations in weather in areas where our products are manufactured, delivered, or used;
•naturally-occurring events, pandemics, and/or disasters causing disruption to our manufacturing, product deliveries, and production capacity, thereby giving rise to an increase in expenses, loss of revenue, and property losses;
•disruptions in the transportation network used to transport parts and components to our production facilities and to deliver products to our customers, particularly with respect to the delivery of finished railcars from Mexico to the U.S., which may impact our ability to manufacture and timely deliver railcars to our customers;
•shortages of labor;
•impacts from asset impairments and related charges;
•the timing of introduction of new products;
•the inability to effectively integrate acquired businesses;
•the timing and delivery of customer orders, lease portfolio sales, or a breach of customer contracts;
•the creditworthiness of customers and their access to capital;
•product price changes;
•changes in mix of products sold;
•the costs incurred to align manufacturing capacity with demand and the extent of its utilization;
•the operating leverage and efficiencies that can be achieved by our manufacturing businesses;
•availability and costs of steel, component parts, supplies, and other raw materials;
•competition and other competitive factors;
•changing technologies;
•material failure, interruption of service, compromised data security, phishing emails, or cybersecurity breaches in our information technology (or that of the third-party vendors who provide information technology or other services);
•surcharges and other fees added to fixed pricing agreements for steel, component parts, supplies, and other raw materials;
•inflation, interest rates, and capital costs;
•counter-party risks for financial instruments;
•long-term funding of our operations;
•taxes;
•the stability of the governments and political and business conditions in certain foreign countries, particularly Mexico;
•fluctuations in foreign currency exchange rates, particularly the Mexican peso;
•geopolitical events, including armed conflicts, and their impact on supply chains, pricing, and the global economy;
•changes in import and export quotas and regulations;
•business conditions in emerging economies;
•costs and results of litigation, including trial and appellate costs;
•changes in accounting standards or inaccurate estimates or assumptions in the application of accounting policies;
•changes in laws and regulations that may have an adverse effect on demand for our products and services, our results of operations, financial condition or cash flows;
•legal, regulatory, and environmental issues, including compliance of our products with mandated specifications, standards, or testing criteria and obligations to remove and replace our products following installation or to recall our products and install different products;
•actions by U.S. and/or foreign governments (particularly Mexico and Canada) relative to federal government budgeting, taxation policies, government expenditures, borrowing/debt ceiling limits, tariffs, and trade policies;
•the use of social or digital media to disseminate false, misleading and/or unreliable or inaccurate information; and
•the inability to sufficiently protect our intellectual property rights.
Any forward-looking statement speaks only as of the date on which such statement is made. Except as required by federal securities laws, Trinity undertakes no obligation to update any forward-looking statement to reflect events or circumstances after the date on which such statement is made. For a discussion of risks and uncertainties which could cause actual results to differ from those contained in the forward-looking statements, see “Risk Factors” in our 2023 Annual Report on Form 10-K, this Form 10-Q and future Forms 10-Q and Current Reports on Forms 8-K.
Company Overview
Trinity Industries, Inc. and its consolidated subsidiaries (“Trinity,” “Company,” “we,” “our,” or "us") own businesses that are leading providers of railcar products and services in North America. We market our railcar products and services under the trade name TrinityRail®. The TrinityRail platform provides railcar leasing and management services; railcar manufacturing; railcar maintenance and modifications; and other railcar logistics products and services.
We report our operating results in two reportable segments: (1) the Railcar Leasing and Services Group (the "Leasing Group"), which owns and operates a fleet of railcars and provides third-party fleet leasing, management, and administrative services; railcar maintenance and modification services; and other railcar logistics products and services; and (2) the Rail Products Group, which manufactures and sells railcars and related parts and components.
Effective January 1, 2024, the Company modified its organizational structure to better leverage our maintenance services capabilities to support lease fleet optimization and to grow our services and parts businesses. The new structure resulted in a change to our reportable segments beginning in 2024. In connection with this organizational update, we aligned the maintenance services business, which was previously reported in the Rail Products Group, to now be presented within our leasing business. This change aligns with the way in which our CODM assesses performance and allocates resources. Consequently, beginning January 1, 2024, we report our operating results in two reportable segments: (1) the Railcar Leasing and Services Group, formerly the Railcar Leasing and Management Services Group, and (2) the Rail Products Group. These changes had no impact to our previously reported consolidated results of operations, financial position, or cash flows. All prior period segment results set forth herein have been recast to reflect these changes and present results on a comparable basis.
Executive Summary
Cyclical, Seasonal and Other Trends Impacting Our Business
General/Business Trends
The industries in which our customers operate are cyclical in nature. Although lease rates and lease fleet utilization remain strong, weaknesses in certain sectors of the North American and global economy may make it more difficult to sell or lease certain types of railcars. Additionally, changes in certain commodity prices, or changes in demand for certain commodities, could impact customer demand for various types of railcars. Further, disruptions in the global supply chain have impacted demand for, and the costs of, certain of our products and services.
We continuously assess demand for our products and services and take steps to rationalize and diversify our leased railcar portfolio and align our operating capacity appropriately. We evaluate the creditworthiness of our customers and monitor performance of relevant market sectors; however, weaknesses in any of these market sectors could affect the financial viability of our customers, which could negatively impact our revenues, credit loss expense, and operating profits. We continue to believe that our rail platform is able to respond to cyclical changes in demand and perform throughout the railcar cycle.
Due to their transactional nature, lease portfolio sales are the primary driver of fluctuations in results in the Leasing Group.
U.S.-Mexico Border Disruption
In late 2023, the U.S. Customs and Border Protection Agency suspended cross-border rail traffic in Eagle Pass, Texas, the primary border crossing used for railcar deliveries from our manufacturing facilities in Mexico, which negatively impacted our railcar deliveries in the second half of 2023. We have not experienced a border closure at Eagle Pass thus far in 2024, and substantially all railcar shipments that were delayed at the end of 2023 were delivered during the three months ended March 31, 2024; however, while we have seen some improvement in recent months, there is ongoing instability at the border, and there can be no assurance that similar border closings or congestion will not occur in the future. We actively monitor rail and truck traffic at the U.S.-Mexico border and remain in close contact with all stakeholders, including the relevant government agencies, and continue to evaluate available alternatives for rail and truck transportation between Mexico and the United States. Any future rail and truck congestion at the border could negatively impact our deliveries and supply chain.
Supply Chain Disruptions
As a result of disruptions in the global supply chain, we have continued to experience shortages of materials used to manufacture or repair certain railcar types, as well as disruptions in the transportation network, which have impacted our ability to timely deliver these railcars to our customers. While we believe these challenges will be resolved over time, they may persist over the foreseeable future, which could continue to impact our operations. We will continue to monitor the situation and take appropriate steps within our control to mitigate the potential impacts on our production schedules and delivery timelines.
Foreign Currency Fluctuations
We are exposed to the impact of foreign currency fluctuations in our Mexico operations resulting from certain expenditures that are denominated in the Mexican peso. The strengthening of the Mexican peso relative to the U.S. dollar unfavorably impacted the operating results in our Rail Products Group in 2023. We have expanded our hedging program and have taken other actions to mitigate the foreign currency impact of a portion of our peso-denominated expenditures. We regularly evaluate and update our strategies to mitigate the negative effects on margins and operating profits that may arise due to foreign currency fluctuations.
Input and Labor Costs
We periodically experience increases in the costs of steel, components, and certain other inputs that represent a substantial portion of our cost of revenues. We typically use contract-specific purchasing practices, existing supplier commitments, contractual price escalation provisions, and other arrangements with our customers to reduce the impact of the volatility of certain input costs on our operating profit. Further, the cost and volume of lease fleet maintenance and compliance events have increased, and we expect elevated levels of these activities to continue in the near term. Finally, although we remain committed to attracting and retaining a highly skilled and diverse workforce, challenging labor market conditions and increases in labor costs have negatively impacted our operations. We continually assess the impact of input and labor costs on our operational efficiency, margins, and overall profitability.
Financial and Operational Highlights
•Our revenues for the three months ended March 31, 2024 were $809.6 million, representing an increase of 26.2%, compared to the three months ended March 31, 2023. Our operating profit for the three months ended March 31, 2024 was $115.2 million compared to $69.0 million for the three months ended March 31, 2023.
•The Leasing Group's lease fleet of 110,205 company-owned railcars was 97.5% utilized as of March 31, 2024, compared to a lease fleet utilization of 98.2% on 108,865 company-owned railcars as of March 31, 2023. Our company-owned lease fleet includes wholly-owned railcars, partially-owned railcars, and railcars under leased-in arrangements.
•For the three months ended March 31, 2024, we made a net investment in our lease fleet of approximately $123.3 million, which primarily includes new railcar additions, sustainable railcar conversions, railcar modifications, and other betterments, net of deferred profit, and secondary market purchases; and is net of proceeds from lease portfolio sales.
•The total value of the new railcar backlog at March 31, 2024 was $2.9 billion, compared to $3.7 billion at March 31, 2023. The Rail Products Group received orders for 1,880 railcars and delivered 4,695 railcars in the three months ended March 31, 2024, in comparison to orders for 2,690 railcars and deliveries of 4,045 railcars in the three months ended March 31, 2023.
•During the three months ended March 31, 2024, sustainable railcar conversion revenues totaled $50.2 million, representing 675 railcars.
•For the three months ended March 31, 2024, we generated operating cash flows from continuing operations and Adjusted Free Cash Flow After Investments and Dividends ("Adjusted Free Cash Flow") of $56.5 million and $11.7 million(1), respectively, in comparison to $102.5 million and $36.2 million(1), respectively, for the three months ended March 31, 2023.
(1) Non-GAAP financial measure. See the Non-GAAP Financial Measures section within this Form 10-Q for a reconciliation to the most directly comparable GAAP measure and why management believes this measure is useful to management and investors.
See "Consolidated Results of Operations" and "Segment Discussion" below for additional information regarding our operating results.
Returns of Capital to Shareholders
Returns of capital to shareholders in the form of dividends are summarized below. There were no shares repurchased during the three months ended March 31, 2024 and 2023.
(1) Dividend yield is calculated as dividends paid for the four previous quarters divided by the closing stock price on the last trading day of each respective quarter.
Capital Structure Updates
TILC Warehouse Loan Facility – In March 2024, we entered into a new Trinity Industries Leasing Company ("TILC") warehouse loan facility with a total commitment amount of $800.0 million, a revolving termination date of March 15, 2027, and a maturity date of March 15, 2028. This warehouse loan facility replaced the prior $1.0 billion warehouse loan facility.
See Note 8 of the Consolidated Financial Statements for additional information regarding this debt transaction.
Litigation Updates
See Note 14 of the Consolidated Financial Statements for an update on the status of certain litigation.
Consolidated Results of Operations
The following table summarizes our consolidated results of operations for the three months ended March 31, 2024 and 2023:
|
|
|
|
|
|
|
|
|
|
|
|
|
|
|
|
| |
|
|
Three Months Ended
March 31, |
| |
|
|
|
|
2024 |
|
2023 |
| |
|
|
|
|
(in millions) |
| Revenues |
|
|
|
|
$ |
809.6 |
|
|
$ |
641.7 |
|
| Cost of revenues |
|
|
|
|
644.9 |
|
|
538.5 |
|
| Selling, engineering, and administrative expenses |
|
|
|
|
52.3 |
|
|
49.9 |
|
| Gains on dispositions of property |
|
|
|
|
2.8 |
|
|
15.3 |
|
|
|
|
|
|
|
|
|
| Restructuring activities, net |
|
|
|
|
— |
|
|
(0.4) |
|
| Total operating profit |
|
|
|
|
115.2 |
|
|
69.0 |
|
| Interest expense, net |
|
|
|
|
69.1 |
|
|
62.1 |
|
|
|
|
|
|
|
|
|
| Other, net |
|
|
|
|
3.4 |
|
|
1.6 |
|
| Income from continuing operations before income taxes |
|
|
|
|
42.7 |
|
|
5.3 |
|
| Provision (benefit) for income taxes |
|
|
|
|
11.0 |
|
|
(11.5) |
|
| Income from continuing operations |
|
|
|
|
$ |
31.7 |
|
|
$ |
16.8 |
|
Revenues
The tables below present revenues by segment for the three months ended March 31, 2024 and 2023:
|
|
|
|
|
|
|
|
|
|
|
|
|
|
|
|
|
|
|
|
|
|
|
|
|
|
|
|
|
|
|
|
|
|
|
|
|
|
|
|
|
|
|
|
|
|
|
|
|
|
|
|
|
|
|
|
|
|
|
|
|
|
|
|
|
|
|
|
|
|
|
|
|
|
|
|
|
|
|
|
|
|
|
|
|
|
|
|
|
|
|
|
|
|
|
|
|
|
|
|
|
|
|
|
|
|
|
|
|
|
|
|
|
|
|
|
|
|
|
|
|
|
|
|
|
|
|
|
|
|
|
|
|
|
|
|
|
|
|
|
|
|
|
|
|
|
|
|
|
|
|
|
|
|
|
|
|
|
|
|
|
|
|
|
|
|
|
|
|
|
|
|
|
|
|
|
|
|
|
|
|
|
|
|
|
|
|
|
|
|
|
| |
Three Months Ended March 31, 2024 |
|
|
|
Revenues |
|
Percent |
|
External |
|
Intersegment |
|
Total |
|
Change |
|
(in millions) |
|
| Railcar Leasing and Services Group |
$ |
284.3 |
|
|
$ |
0.9 |
|
|
$ |
285.2 |
|
|
22.5 |
% |
| Rail Products Group |
525.3 |
|
|
142.1 |
|
|
667.4 |
|
|
13.6 |
% |
|
|
|
|
|
|
|
|
| Segment Totals |
809.6 |
|
|
143.0 |
|
|
952.6 |
|
|
16.1 |
% |
| Eliminations |
— |
|
|
(143.0) |
|
|
(143.0) |
|
|
|
|
|
|
|
|
|
|
|
| Consolidated Total |
$ |
809.6 |
|
|
$ |
— |
|
|
$ |
809.6 |
|
|
26.2 |
% |
|
|
|
|
|
|
|
|
|
Three Months Ended March 31, 2023 |
|
|
|
Revenues |
|
|
|
External |
|
Intersegment |
|
Total |
|
|
|
(in millions) |
|
|
| Railcar Leasing and Services Group |
$ |
232.7 |
|
|
$ |
0.2 |
|
|
$ |
232.9 |
|
|
|
| Rail Products Group |
409.0 |
|
|
178.6 |
|
|
587.6 |
|
|
|
|
|
|
|
|
|
|
|
| Segment Totals |
641.7 |
|
|
178.8 |
|
|
820.5 |
|
|
|
| Eliminations |
— |
|
|
(178.8) |
|
|
(178.8) |
|
|
|
|
|
|
|
|
|
|
|
| Consolidated Total |
$ |
641.7 |
|
|
$ |
— |
|
|
$ |
641.7 |
|
|
|
Operating Costs
Operating costs are comprised of cost of revenues; selling, engineering, and administrative costs; gains or losses on property disposals; and restructuring activities. Operating costs by segment for the three months ended March 31, 2024 and 2023 were as follows:
|
|
|
|
|
|
|
|
|
|
|
|
|
|
|
|
| |
|
|
Three Months Ended
March 31, |
| |
|
|
|
|
2024 |
|
2023 |
| |
|
|
|
|
(in millions) |
Railcar Leasing and Services Group (1) |
|
|
|
|
$ |
184.9 |
|
|
$ |
148.3 |
|
| Rail Products Group |
|
|
|
|
623.6 |
|
|
563.5 |
|
| Segment Totals |
|
|
|
|
808.5 |
|
|
711.8 |
|
| Corporate and other |
|
|
|
|
26.5 |
|
|
26.0 |
|
|
|
|
|
|
|
|
|
| Restructuring activities, net |
|
|
|
|
— |
|
|
(0.4) |
|
| Eliminations |
|
|
|
|
(140.6) |
|
|
(164.7) |
|
|
|
|
|
|
|
|
|
| Consolidated Total |
|
|
|
|
$ |
694.4 |
|
|
$ |
572.7 |
|
(1) Includes gains on lease portfolio sales of $2.1 million and $13.5 million for the three months ended March 31, 2024 and 2023, respectively.
Operating Profit
Operating profit by segment for the three months ended March 31, 2024 and 2023 was as follows:
|
|
|
|
|
|
|
|
|
|
|
|
|
|
|
|
| |
|
|
Three Months Ended
March 31, |
| |
|
|
|
|
2024 |
|
2023 |
| |
|
|
|
|
(in millions) |
| Railcar Leasing and Services Group |
|
|
|
|
$ |
100.3 |
|
|
$ |
84.6 |
|
| Rail Products Group |
|
|
|
|
43.8 |
|
|
24.1 |
|
|
|
|
|
|
|
|
|
| Segment Totals |
|
|
|
|
144.1 |
|
|
108.7 |
|
| Corporate and other |
|
|
|
|
(26.5) |
|
|
(26.0) |
|
|
|
|
|
|
|
|
|
| Restructuring activities, net |
|
|
|
|
— |
|
|
0.4 |
|
| Eliminations |
|
|
|
|
(2.4) |
|
|
(14.1) |
|
|
|
|
|
|
|
|
|
| Consolidated Total |
|
|
|
|
$ |
115.2 |
|
|
$ |
69.0 |
|
Discussion of Consolidated Results
Revenues – Our revenues for the three months ended March 31, 2024 were $809.6 million, representing an increase of $167.9 million, or 26.2%, over the prior year period. The increase in revenues was primarily due to higher external deliveries in the Rail Products Group, and improved lease rates and a higher volume of external repairs in the Leasing Group.
Cost of revenues – Our cost of revenues for the three months ended March 31, 2024 was $644.9 million, representing an increase of $106.4 million, or 19.8%, over the prior year period. The increase in cost of revenues was primarily due to higher external deliveries and the impact of foreign currency fluctuations in the Rail Products Group.
Selling, engineering, and administrative expenses – Selling, engineering, and administrative expenses for the three months ended March 31, 2024 were $52.3 million, representing an increase of $2.4 million, or 4.8%, when compared to the prior year period primarily due to higher employee-related costs.
Gains on dispositions of property – Gains on dispositions of property decreased by $12.5 million for the three months ended March 31, 2024, when compared to the prior year period primarily due to lower lease portfolio sales volume in the current year period. Additionally, we recorded gains of $1.2 million during three months ended March 31, 2023 related to insurance recoveries in excess of net book value for assets damaged by a tornado at the Company’s rail maintenance facility in Cartersville, Georgia.
Operating profit – Operating profit for the three months ended March 31, 2024 totaled $115.2 million, representing an increase of $46.2 million, or 67.0%, from the prior year period. The increase was primarily due to higher external deliveries in the Rail Products Group, improved lease rates in the Leasing Group, and a higher volume of external repairs in our maintenance services business, partially offset by lower lease portfolio sales volume in the current year period.
For further information regarding the operating results of individual segments, see "Segment Discussion" below.
Interest expense, net – Interest expense, net for the three months ended March 31, 2024 totaled $69.1 million, compared to $62.1 million for the three months ended March 31, 2023. The increase was primarily driven by higher average debt in 2024.
Income taxes – The effective tax rate from continuing operations for the three months ended March 31, 2024 was an expense of 25.8%, which differs from the U.S. statutory rate of 21.0% primarily due to state income taxes and foreign income taxes, partially offset by the benefit of noncontrolling interest, for which we do not provide income taxes.
The effective tax rate from continuing operations for the three months ended March 31, 2023 was a benefit of 217.0%, which differs from the U.S. statutory rate of 21.0% primarily due to the release of residual taxes out of accumulated other comprehensive income; the re-measurement of our net deferred tax liabilities due to the acquisition of a subsidiary; changes in our valuation allowances; state income taxes; and foreign income taxes. See Note 9 of the Consolidated Financial Statements for additional information.
Segment Discussion
Railcar Leasing and Services Group
|
|
|
|
|
|
|
|
|
|
|
|
|
|
|
|
|
|
|
|
|
|
|
|
|
|
|
Three Months Ended March 31, |
| |
|
|
|
|
|
|
2024 |
|
2023 |
|
Percent |
|
|
|
|
|
($ in millions) |
|
Change |
| Revenues: |
|
|
|
|
|
|
|
|
|
|
|
| Leasing and management |
|
|
|
|
|
|
$ |
209.0 |
|
|
$ |
194.7 |
|
|
7.3 |
% |
Maintenance services (1) |
|
|
|
|
|
|
65.2 |
|
|
29.4 |
|
|
121.8 |
% |
| Digital and logistics services |
|
|
|
|
|
|
11.0 |
|
|
8.8 |
|
|
25.0 |
% |
| Total revenues |
|
|
|
|
|
|
$ |
285.2 |
|
|
$ |
232.9 |
|
|
22.5 |
% |
|
|
|
|
|
|
|
|
|
|
|
|
Cost of revenues (2) |
|
|
|
|
|
|
169.6 |
|
|
146.8 |
|
|
15.5 |
% |
| Selling, engineering, and administrative expenses |
|
|
|
|
|
|
18.1 |
|
|
16.9 |
|
|
7.1 |
% |
| Gains on dispositions of property: |
|
|
|
|
|
|
|
|
|
|
|
| Lease portfolio sales |
|
|
|
|
|
|
2.1 |
|
|
13.5 |
|
|
* |
| Other |
|
|
|
|
|
|
0.7 |
|
|
1.9 |
|
|
* |
| Total operating profit |
|
|
|
|
|
|
$ |
100.3 |
|
|
$ |
84.6 |
|
|
18.6 |
% |
| Total operating profit margin |
|
|
|
|
|
|
35.2 |
% |
|
36.3 |
% |
|
|
| Total operating profit margin, excluding lease portfolio sales |
|
|
|
|
|
|
34.4 |
% |
|
30.5 |
% |
|
|
|
|
|
|
|
|
|
|
|
|
|
|
Selected expense information for Company-owned railcars (3): |
|
|
|
|
|
|
|
|
|
|
|
Depreciation and amortization expense (4) |
|
|
|
|
|
|
$ |
59.9 |
|
|
$ |
61.6 |
|
|
(2.8) |
% |
Maintenance and compliance expense (5) |
|
|
|
|
|
|
$ |
30.4 |
|
|
$ |
34.8 |
|
|
(12.6) |
% |
Other fleet operating costs (6) |
|
|
|
|
|
|
$ |
7.7 |
|
|
$ |
9.2 |
|
|
(16.3) |
% |
Interest expense (7) |
|
|
|
|
|
|
$ |
57.4 |
|
|
$ |
54.8 |
|
|
4.7 |
% |
* Not meaningful
(1) Revenues related to services performed by the maintenance services business to support the railcars in our lease fleet are eliminated within the Railcar Leasing & Services Group and are excluded from the totals reported on this line.
(2) Includes depreciation and amortization expense, maintenance and compliance expense, and other fleet operating costs related to our lease fleet, as well as operating costs for our maintenance services and digital and logistics services businesses.
(3) Includes wholly-owned railcars, partially-owned railcars, and railcars under leased-in arrangements.
(4) Depreciation and amortization expense includes $4.7 million for the three months ended March 31, 2023 related to the disposal of certain railcar components associated with our sustainable railcar conversion program. Additionally, amortization of deferred profit on railcars sold from the Rail Products Group to the Leasing Group is included in depreciation and amortization expense, resulting in the recognition of depreciation expense based on our original manufacturing cost of the railcars.
(5) Maintenance and compliance expense is reported at cost with respect to the services performed by our maintenance services business to support the railcars in our lease fleet.
(6) Other fleet operating costs include freight, storage, rent, and ad valorem taxes.
(7) Interest expense is not a component of operating profit and includes the effect of hedges.
Information related to lease portfolio sales is as follows:
|
|
|
|
|
|
|
|
|
|
|
|
|
|
|
|
|
|
|
Three Months Ended
March 31, |
|
|
|
|
|
2024 |
|
2023 |
|
|
|
|
|
($ in millions) |
| Lease portfolio sales |
|
|
|
|
$ |
24.2 |
|
|
$ |
56.7 |
|
| Operating profit on lease portfolio sales |
|
|
|
|
$ |
2.1 |
|
|
$ |
13.5 |
|
| Operating profit margin on lease portfolio sales |
|
|
|
|
8.7 |
% |
|
23.8 |
% |
Total revenues for the Railcar Leasing and Services Group increased by 22.5% for the three months ended March 31, 2024, compared to the prior year period. Leasing and management revenues for the three months ended March 31, 2024 were favorably impacted primarily by improved lease rates and net additions to the lease fleet, which resulted in higher revenues when compared to the three months ended March 31, 2023.
Our maintenance services business is primarily dedicated to servicing our lease fleet pursuant to the provisions of our lease contracts. This may include services that are not included in the full-service lease agreement, such as repairs of railcar damage or other customer-specific requirements. We also perform maintenance and repair activities on railcars owned by third parties, including our investor-owned fleet. Revenues in our maintenance services business increased for the three months ended March 31, 2024 as a result of a higher volume of repairs completed for third parties, including our investor-owned fleet, as well as favorable pricing.
Cost of revenues for the Railcar Leasing and Services Group increased by 15.5% for the three months ended March 31, 2024, compared to the prior year period. In our maintenance services business, cost of revenues increased for the three months ended March 31, 2024 as a result of the volume of external repairs. Cost of revenues was favorably impacted by lower maintenance and fleet operating costs and reduced depreciation in the leasing and management business.
Leasing Group operating profit increased by 18.6% for the three months ended March 31, 2024, compared to the prior year period primarily due to improved lease rates and a higher volume of external repairs in the maintenance services business, partially offset by lower lease portfolio sales volume in the current year period. Additionally, operating profit was favorably impacted by gains of $1.2 million during the three months ended March 31, 2023 related to insurance recoveries in excess of net book value for assets damaged by a tornado at the Company’s rail maintenance facility in Cartersville, Georgia in the first quarter of 2021.
The Leasing Group generally uses its non-recourse warehouse loan facility or cash to provide initial funding for a portion of the purchase price of the railcars. After initial funding, the Leasing Group may obtain long-term financing for the railcars in the lease fleet through non-recourse asset-backed securities; long-term recourse debt; long-term non-recourse promissory notes; or third-party equity.
Information regarding the Leasing Group’s lease fleet is as follows:
|
|
|
|
|
|
|
|
|
|
|
|
| |
March 31, 2024 |
|
March 31, 2023 |
| Number of railcars: |
|
|
|
Wholly-owned (1) |
86,655 |
|
|
85,185 |
|
| Partially-owned |
23,550 |
|
|
23,680 |
|
|
110,205 |
|
|
108,865 |
|
| Investor-owned |
32,995 |
|
|
33,420 |
|
|
143,200 |
|
|
142,285 |
|
Company-owned railcars (2): |
|
|
|
| Average age in years |
13.2 |
|
|
12.5 |
|
| Average remaining lease term in years |
2.9 |
|
|
3.0 |
|
| Fleet utilization |
97.5 |
% |
|
98.2 |
% |
(1) Includes 2,490 railcars and 2,470 railcars under leased-in arrangements as of March 31, 2024 and 2023, respectively.
(2) Includes wholly-owned railcars, partially-owned railcars, and railcars under leased-in arrangements.
Rail Products Group
|
|
|
|
|
|
|
|
|
|
|
|
|
|
|
|
|
|
|
|
|
|
|
|
| |
|
|
Three Months Ended March 31, |
| |
|
|
|
|
|
|
2024 |
|
2023 |
|
Percent |
| |
|
|
|
|
($ in millions) |
|
Change |
| Revenues: |
|
|
|
|
|
|
|
|
|
|
|
Rail products (1) |
|
|
|
|
|
|
$ |
639.2 |
|
|
$ |
558.4 |
|
|
14.5 |
% |
| Parts & components |
|
|
|
|
|
|
28.2 |
|
|
29.2 |
|
|
(3.4) |
% |
| Total revenues |
|
|
|
|
|
|
$ |
667.4 |
|
|
$ |
587.6 |
|
|
13.6 |
% |
|
|
|
|
|
|
|
|
|
|
|
|
| Operating costs: |
|
|
|
|
|
|
|
|
|
|
|
| Cost of revenues |
|
|
|
|
|
|
615.9 |
|
|
556.4 |
|
|
10.7 |
% |
Selling, engineering, and administrative expenses |
|
|
|
|
|
|
7.7 |
|
|
7.0 |
|
|
10.0 |
% |
| Losses on dispositions of property |
|
|
|
|
|
|
— |
|
|
(0.1) |
|
|
* |
| Operating profit |
|
|
|
|
|
|
$ |
43.8 |
|
|
$ |
24.1 |
|
|
81.7 |
% |
| Operating profit margin |
|
|
|
|
|
|
6.6 |
% |
|
4.1 |
% |
|
|
* Not meaningful
(1) Includes sustainable railcar conversion revenues of $50.2 million, representing 675 railcars, for the three months ended March 31, 2024 and sustainable railcar conversion revenues of $53.9 million, representing 590 railcars, for the three months ended March 31, 2023.
Revenues for the Rail Products Group increased for the three months ended March 31, 2024 by 13.6%, when compared to the prior year period primarily as a result of higher deliveries.
Cost of revenues for the Rail Products Group increased for the three months ended March 31, 2024 by 10.7%, when compared to the prior year period. The increase in cost of revenues for the three months ended March 31, 2024 was driven by higher deliveries and the impact of foreign currency fluctuations, partially offset by operational efficiencies associated with reduced production line changeovers and fewer supply chain disruptions, and improved labor efficiencies when compared to the prior year period.
Operating profit for the Rail Products Group increased for the three months ended March 31, 2024 by 81.7%, when compared to the prior year period primarily due to higher deliveries and improved operational and labor efficiencies.
Information related to our Rail Products Group backlog of new railcars is set forth below. In addition to the amounts below, as of March 31, 2024, our backlog related to sustainable railcar conversions totaled $35.8 million, representing 445 railcars.
|
|
|
|
|
|
|
|
|
|
|
|
|
|
|
|
|
|
| |
March 31, |
| |
2024 |
|
2023 |
|
Percent |
| |
(in millions) |
|
Change |
| External customers |
$ |
2,626.3 |
|
|
$ |
3,257.1 |
|
|
|
Leasing Group |
312.6 |
|
|
448.8 |
|
|
|
| Total |
$ |
2,938.9 |
|
|
$ |
3,705.9 |
|
|
(20.7) |
% |
|
|
|
|
|
|
|
|
|
|
|
|
|
|
|
|
|
|
|
|
|
|
| |
|
|
Three Months Ended
March 31, |
| |
|
|
|
|
2024 |
|
2023 |
|
Percent |
|
|
|
|
|
(in units, $ in whole dollars) |
|
Change |
| Beginning balance |
|
|
|
|
25,890 |
|
|
32,270 |
|
|
|
| Orders received |
|
|
|
|
1,880 |
|
|
2,690 |
|
|
(30.1) |
% |
| Deliveries |
|
|
|
|
(4,695) |
|
|
(4,045) |
|
|
16.1 |
% |
|
|
|
|
|
|
|
|
|
|
| Ending balance |
|
|
|
|
23,075 |
|
|
30,915 |
|
|
(25.4) |
% |
| Average selling price in ending backlog |
|
|
|
|
$ |
127,363 |
|
|
$ |
119,874 |
|
|
6.2 |
% |
Total backlog dollars decreased by 20.7% when compared to the prior year period. We expect to deliver approximately 49.1% of our railcar backlog value during the remaining nine months of 2024 and 20.4% during 2025, with the remainder to be delivered through 2028. The orders in our backlog from the Leasing Group are fully supported by lease commitments with external customers. The final amount of backlog attributable to the Leasing Group may vary by the time of delivery as customers may elect to change their procurement decision.
Transactions between the Rail Products Group and the Leasing Group are as follows:
|
|
|
|
|
|
|
|
|
|
|
|
|
|
|
|
|
|
|
Three Months Ended
March 31, |
| |
|
|
|
|
2024 |
|
2023 |
|
|
|
|
|
($ in millions) |
| Revenues: |
|
|
|
|
|
|
|
| New railcars |
|
|
|
|
$ |
135.2 |
|
|
$ |
134.3 |
|
| Sustainable railcar conversions |
|
|
|
|
$ |
0.4 |
|
|
$ |
39.0 |
|
| Parts & components |
|
|
|
|
$ |
6.5 |
|
|
$ |
5.3 |
|
|
|
|
|
|
|
|
|
| Deferred profit |
|
|
|
|
$ |
2.1 |
|
|
$ |
14.7 |
|
|
|
|
|
|
|
|
|
| Number of new railcars (in units) |
|
|
|
|
1,095 |
|
|
1,020 |
|
| Number of sustainable railcar conversions (in units) |
|
|
|
|
5 |
|
|
390 |
|
Corporate and other
|
|
|
|
|
|
|
|
|
|
|
|
|
|
|
|
|
|
|
|
|
|
|
|
| |
|
|
Three Months Ended March 31, |
| |
|
|
|
|
|
|
2024 |
|
2023 |
|
Percent |
| |
|
|
|
|
(in millions) |
Change |
|
|
|
|
|
|
|
|
|
|
|
|
|
|
|
|
|
|
|
|
|
|
|
|
|
|
|
|
|
|
|
|
|
|
|
|
|
|
|
|
|
|
|
|
|
|
|
|
| Operating costs: |
|
|
|
|
|
|
|
|
|
|
|
|
|
|
|
|
|
|
|
|
|
|
|
Selling, engineering, and administrative expenses |
|
|
|
|
|
|
$ |
26.5 |
|
|
$ |
26.0 |
|
|
1.9 |
% |
|
|
|
|
|
|
|
|
|
|
|
|
| Operating loss |
|
|
|
|
|
|
$ |
(26.5) |
|
|
$ |
(26.0) |
|
|
1.9 |
% |
Selling, engineering, and administrative expenses for the three months ended March 31, 2024 were relatively flat when compared to the prior year period. There were no gains or losses on dispositions of property for the three months ended March 31, 2024 and 2023; however, as we continue to streamline our operational footprint, we may have gains or losses on the disposition of non-operating facilities.
Liquidity and Capital Resources
Overview
We expect to finance future operating requirements with cash, cash equivalents, and short-term marketable securities; cash flows from operations; and short-term debt, long-term debt, and equity. Debt instruments that we have utilized include the TILC warehouse loan facility, senior notes, convertible subordinated notes, asset-backed securities, non-recourse promissory notes, and our revolving credit facility.
As of March 31, 2024, we have total committed liquidity of $798.8 million. Our total available liquidity includes: $118.8 million of unrestricted cash and cash equivalents; $581.8 million unused and available under our revolving credit facility; and $98.2 million unused and available under the TILC warehouse loan facility based on the amount of warehouse-eligible, unpledged equipment. We believe we have access to adequate capital resources to fund operating requirements and are an active participant in the capital markets. We intend to use cash from operations and our available liquidity to repay our 4.55% senior notes due 2024 ("Senior Notes due 2024").
Liquidity Highlights
TILC Warehouse Loan Facility – In March 2024, we entered into a new TILC warehouse loan facility with a total commitment amount of $800.0 million, a revolving termination date of March 15, 2027, and a maturity date of March 15, 2028. This warehouse loan facility replaced the prior $1.0 billion warehouse loan facility.
See Note 8 of the Consolidated Financial Statements for additional information regarding this debt transaction.
Dividend Payments – We paid $23.0 million in dividends to our common stockholders during the three months ended March 31, 2024.
Share Repurchase Authorization – In December 2022, our Board of Directors authorized a share repurchase program effective December 9, 2022 with no expiration. The share repurchase program authorizes the Company to repurchase up to $250.0 million of its common stock. There were no shares repurchased during the three months ended March 31, 2024.
Cash Flows
The following table summarizes our cash flows from operating, investing, and financing activities for the three months ended March 31, 2024 and 2023:
|
|
|
|
|
|
|
|
|
|
|
|
| |
Three Months Ended
March 31, |
| |
2024 |
|
2023 |
| |
(in millions) |
| Net cash flows from continuing operations: |
|
|
|
| Operating activities |
$ |
56.5 |
|
|
$ |
102.5 |
|
| Investing activities |
(124.0) |
|
|
(203.1) |
|
| Financing activities |
71.8 |
|
|
72.4 |
|
| Net cash flows from discontinued operations |
(4.3) |
|
|
(3.1) |
|
| Net increase (decrease) in cash, cash equivalents, and restricted cash |
$ |
— |
|
|
$ |
(31.3) |
|
Operating Activities. Net cash provided by operating activities from continuing operations for the three months ended March 31, 2024 was $56.5 million compared to net cash provided by operating activities from continuing operations of $102.5 million for the three months ended March 31, 2023. The changes in our operating assets and liabilities are as follows:
|
|
|
|
|
|
|
|
|
|
|
|
|
Three Months Ended
March 31, |
|
2024 |
|
2023 |
|
(in millions) |
| (Increase) decrease in receivables, inventories, and other assets |
$ |
(82.0) |
|
|
$ |
6.8 |
|
|
|
|
|
| Increase (decrease) in accounts payable, accrued liabilities, and other liabilities |
29.7 |
|
|
26.1 |
|
| Changes in operating assets and liabilities |
$ |
(52.3) |
|
|
$ |
32.9 |
|
The changes in our operating assets and liabilities resulted in a net use of $52.3 million for the three months ended March 31, 2024, as compared to a net source of $32.9 million for the three months ended March 31, 2023. The change in operating assets for the current year period was impacted by higher receivables balances, partially offset by lower inventory balances associated with railcar deliveries.
Investing Activities. Net cash used in investing activities from continuing operations for the three months ended March 31, 2024 was $124.0 million compared to $203.1 million of net cash used in investing activities from continuing operations for the three months ended March 31, 2023. Significant investing activities are as follows:
•We made a net investment in our lease fleet of $123.3 million during the three months ended March 31, 2024, compared to $134.8 million in the prior year period. Our investment in the lease fleet primarily includes new railcar additions, sustainable railcar conversions, railcar modifications, and other betterments, net of deferred profit, and secondary market purchases; and is net of proceeds from lease portfolio sales.
•During the three months ended March 31, 2023, we acquired a company that is a provider of proprietary software and logistics and terminal management solutions for net cash of $66.2 million. We had no acquisitions during the three months ended March 31, 2024.
Financing Activities. Net cash provided by financing activities during the three months ended March 31, 2024 was $71.8 million compared to $72.4 million of net cash provided by financing activities for the three months ended March 31, 2023. Significant financing activities are as follows:
•During the three months ended March 31, 2024, we had total borrowings of $909.9 million and total repayments of $803.8 million, for net proceeds of $106.1 million, primarily from debt proceeds to support our investment in the lease fleet and for general corporate purposes. During the three months ended March 31, 2023, we had total borrowings of $246.3 million and total repayments of $149.6 million, for net proceeds of $96.7 million, primarily from debt proceeds to support our investment in the lease fleet and for general corporate purposes.
•We paid $23.0 million and $21.1 million in dividends to our common stockholders during the three months ended March 31, 2024 and 2023, respectively.
Current Debt Obligations
The revolving credit facility contains several financial covenants that require the maintenance of ratios related to minimum interest coverage for the leasing and manufacturing operations and maximum leverage. A summary of our financial covenants is detailed below:
|
|
|
|
|
|
|
|
|
|
|
|
|
|
|
| Ratio |
|
Covenant |
|
Actual at
March 31, 2024
|
Maximum leverage (1) |
|
No greater than 3.75 to 1.00 |
|
2.01 |
Minimum interest coverage (2) |
|
No less than 2.25 to 1.00 |
|
8.20 |
|
|
|
|
|
(1) Defined as the ratio of consolidated total indebtedness to consolidated earnings before interest, taxes, depreciation and amortization ("EBITDA") for the Borrower and its restricted subsidiaries for the period of four consecutive quarters ending with March 31, 2024.
(2) Defined as the ratio of the difference of (A) consolidated EBITDA less (B) consolidated capital expenditures – operating and administrative to consolidated interest expense to the extent paid in cash, in each case for the Borrower and its restricted subsidiaries for the period of four consecutive quarters ending with March 31, 2024.
As of March 31, 2024, we were in compliance with all such financial covenants. Please refer to Note 8 of the Consolidated Financial Statements for a description of our current debt obligations.
Supplemental Guarantor Financial Information
Our Senior Notes due 2024 are fully and unconditionally and jointly and severally guaranteed by certain of Trinity’s 100%-owned subsidiaries: Trinity Industries Leasing Company; Trinity North American Freight Car, Inc.; Trinity Rail Group, LLC; Trinity Tank Car, Inc.; and TrinityRail Maintenance Services, Inc. (collectively, the "Guarantor Subsidiaries”).
The Senior Notes due 2024 indenture agreement includes customary provisions for the release of the guarantees by the Guarantor Subsidiaries upon the occurrence of certain allowed events including the release of one or more of the Guarantor Subsidiaries as guarantor under our revolving credit facility. See Note 9 of our 2023 Annual Report on Form 10-K. The Senior Notes due 2024 are not guaranteed by any of our remaining 100%-owned subsidiaries or partially-owned subsidiaries (“Non-Guarantor Subsidiaries”).
As of March 31, 2024, assets held by the Non-Guarantor Subsidiaries included $110.7 million of restricted cash that was not available for distribution to Trinity Industries, Inc. (“Parent”), $7,223.9 million of equipment securing certain non-recourse debt, and $545.7 million of assets located in foreign locations. As of December 31, 2023, assets held by the Non-Guarantor Subsidiaries included $122.4 million of restricted cash that was not available for distribution to the Parent, $7,157.8 million of equipment securing certain non-recourse debt, and $590.0 million of assets located in foreign locations.
The following tables include the summarized financial information for Parent and Guarantor Subsidiaries (together, the obligor group) on a combined basis after elimination of intercompany transactions within the obligor group (in millions). Investments in and equity in the earnings of the Non-Guarantor Subsidiaries (the non-obligor group) have been excluded.
|
|
|
|
|
|
|
|
|
|
|
|
|
|
|
Three Months Ended March 31, 2024 |
| Summarized Statement of Operations: |
|
|
|
Revenues (1) |
|
|
$ |
580.3 |
|
Cost of revenues (2) |
|
|
$ |
514.0 |
|
| Income from continuing operations |
|
|
$ |
6.0 |
|
Net income (3) |
|
|
$ |
1.7 |
|
|
|
|
|
|
|
|
|
|
March 31, 2024 |
|
December 31, 2023 |
| Summarized Balance Sheets: |
|
|
|
| Assets: |
|
|
|
Receivables, net of allowance (4) |
$ |
437.0 |
|
|
$ |
308.4 |
|
| Inventories |
$ |
583.7 |
|
|
$ |
628.5 |
|
| Property, plant, and equipment, net |
$ |
513.4 |
|
|
$ |
531.2 |
|
| Goodwill and other assets |
$ |
401.1 |
|
|
$ |
399.1 |
|
|
|
|
|
| Liabilities: |
|
|
|
Accounts payable and accrued liabilities (5) |
$ |
506.0 |
|
|
$ |
480.7 |
|
| Debt |
$ |
846.8 |
|
|
$ |
846.9 |
|
| Deferred income taxes |
$ |
924.7 |
|
|
$ |
923.6 |
|
| Other liabilities |
$ |
141.8 |
|
|
$ |
150.9 |
|
| Noncontrolling interest |
$ |
239.2 |
|
|
$ |
238.4 |
|
(1) There were no net sales from the obligor group to Non-Guarantor Subsidiaries during the three months ended March 31, 2024.
(2) Cost of revenues includes $102.1 million of purchases from Non-Guarantor Subsidiaries during the three months ended March 31, 2024.
(3) Net income includes $4.3 million of net loss related to discontinued operations.
(4) Receivables, net of allowance includes $87.9 million and $87.7 million of receivables from Non-Guarantor Subsidiaries as of March 31, 2024 and December 31, 2023, respectively.
(5) Accounts payable includes $96.5 million and $109.8 million of payables to Non-Guarantor Subsidiaries as of March 31, 2024 and December 31, 2023, respectively.
Capital Expenditures
For the full year 2024, we anticipate a net investment in our lease fleet of between $300 million and $400 million. Capital expenditures related to operating and administrative activities, including supporting automation, technology, and modernization of our facilities and processes, are projected to range between $50 million and $60 million for the full year 2024.
Equity Investment
See Note 5 of the Consolidated Financial Statements for information about our investment in partially-owned subsidiaries.
Off Balance Sheet Arrangements
As of March 31, 2024, we had letters of credit issued under our revolving credit facility in an aggregate amount of $18.2 million, the majority of which are expected to expire in October 2024. Our letters of credit obligations support performance bonds related to certain railcar orders. See Note 8 of the Consolidated Financial Statements for further information about our corporate revolving credit facility. Additionally, we had a letter of credit issued outside our revolving credit facility for $8.5 million. This letter of credit obligation replaces a required cash liquidity reserve to support the TILC warehouse loan facility and renews by its terms each year.
Derivative Instruments
We use derivative instruments to mitigate interest rate risk, including risks associated with the impact of changes in interest rates in anticipation of future debt issuances and to offset interest rate variability of certain floating rate debt issuances outstanding. We also may use derivative instruments from time to time to mitigate the impact of changes in foreign currency exchange rates. Derivative instruments are accounted for in accordance with applicable accounting standards. See Note 3 of the Consolidated Financial Statements for discussion of how we utilize our derivative instruments.
Non-GAAP Financial Measures
We have included financial measures compiled in accordance with GAAP and certain non-GAAP measures in this Quarterly Report on Form 10-Q to provide management and investors with additional information regarding our financial results. Non-GAAP measures should not be considered in isolation or as a substitute for our reported results prepared in accordance with GAAP and, as calculated, may not be comparable to other similarly titled measures for other companies. For each non-GAAP financial measure, we provide a reconciliation to the most comparable GAAP measure.
Adjusted Free Cash Flow
Adjusted Free Cash Flow After Investments and Dividends ("Adjusted Free Cash Flow") is a non-GAAP financial measure. We believe Adjusted Free Cash Flow is useful to both management and investors as it provides a relevant measure of liquidity and a useful basis for assessing our ability to fund our operations and repay our debt. Adjusted Free Cash Flow is reconciled to net cash provided by operating activities from continuing operations, the most directly comparable GAAP financial measure, in the following table.
Adjusted Free Cash Flow is defined as net cash provided by operating activities from continuing operations as computed in accordance with GAAP, plus cash proceeds from lease portfolio sales, less capital expenditures for operating and administrative activities, dividends paid, and Equity CapEx for leased railcars. Equity CapEx for leased railcars is defined as capital expenditures for our lease fleet, adjusted to exclude net proceeds from (repayments of) recourse and non-recourse debt.
|
|
|
|
|
|
|
|
|
|
|
|
|
Three Months Ended
March 31, |
|
2024 |
|
2023 |
|
(in millions) |
| Net cash provided by operating activities – continuing operations |
$ |
56.5 |
|
|
$ |
102.5 |
|
| Proceeds from lease portfolio sales |
24.2 |
|
|
56.7 |
|
| Capital expenditures – operating and administrative |
(4.6) |
|
|
(7.1) |
|
| Dividends paid to common shareholders |
(23.0) |
|
|
(21.1) |
|
| Equity CapEx for leased railcars |
(41.4) |
|
|
(94.8) |
|
Adjusted Free Cash Flow After Investments and Dividends |
$ |
11.7 |
|
|
$ |
36.2 |
|
|
|
|
|
| Capital expenditures – lease fleet |
$ |
147.5 |
|
|
$ |
191.5 |
|
| Less: |
|
|
|
| Payments to retire debt |
(803.8) |
|
|
(149.6) |
|
| Proceeds from issuance of debt |
909.9 |
|
|
246.3 |
|
| Net proceeds from (repayments of) debt |
106.1 |
|
|
96.7 |
|
| Equity CapEx for leased railcars |
$ |
41.4 |
|
|
$ |
94.8 |
|
Contractual Obligations and Commercial Commitments
Except as described below, as of March 31, 2024, there have been no material changes to our contractual obligations from December 31, 2023:
•In March 2024, we entered into a new TILC warehouse loan facility with a total commitment amount of $800.0 million, a revolving termination date of March 15, 2027, and a maturity date of March 15, 2028. This warehouse loan facility replaced the prior $1.0 billion warehouse loan facility.
See Note 8 of the Consolidated Financial Statements for additional information regarding this debt transaction.
Recent Accounting Pronouncements
See Note 1 of the Consolidated Financial Statements for information about recent accounting pronouncements.
Item 3. Quantitative and Qualitative Disclosures about Market Risk
There has been no material change in our market risks since December 31, 2023 as set forth in Item 7A of our 2023 Annual Report on Form 10-K. Refer to Note 3 and Note 8 of the Consolidated Financial Statements for a discussion of the impact of hedging activity and debt-related activity, respectively, for the three months ended March 31, 2024.
Item 4. Controls and Procedures
Disclosure Controls and Procedures
We maintain disclosure controls and procedures designed to ensure that we are able to collect and record the information we are required to disclose in the reports we file with the SEC, and to process, summarize, and disclose this information within the time periods specified in the rules of the SEC. Our Chief Executive and Chief Financial Officers are responsible for establishing and maintaining these procedures and, as required by the rules of the SEC, evaluating their effectiveness. Based on their evaluation of our disclosure controls and procedures that took place as of the end of the period covered by this report, the Chief Executive and Chief Financial Officers concluded that these procedures are effective to 1) ensure that we are able to collect, process, and disclose the information we are required to disclose in the reports we file with the SEC within the required time periods and 2) accumulate and communicate this information to our management, including our Chief Executive and Chief Financial Officers, to allow timely decisions regarding this disclosure.
Internal Controls over Financial Reporting
During the period covered by this report, there have been no changes in our internal controls over financial reporting that have materially affected or are reasonably likely to materially affect our internal controls over financial reporting.
PART II
Item 1. Legal Proceedings
The information provided in Note 14 of the Consolidated Financial Statements is hereby incorporated into this Part II, Item 1 by reference.
Item 1A. Risk Factors
There have been no material changes from the risk factors previously disclosed in Item 1A of our 2023 Annual Report on Form 10-K.
Item 2. Unregistered Sales of Equity Securities, Use of Proceeds, and Issuer Purchases of Equity Securities
This table provides information with respect to purchases by the Company of shares of its common stock during the quarter ended March 31, 2024:
|
|
|
|
|
|
|
|
|
|
|
|
|
|
|
|
|
|
|
|
|
|
|
|
| Period |
Number of Shares Purchased (1) |
|
Average Price Paid per Share (1) |
|
Total Number of Shares Purchased as Part of Publicly Announced Plans or Programs (2) |
|
Maximum Number (or Approximate Dollar Value) of Shares that May Yet Be Purchased Under the Plans or Programs (2)
(in millions)
|
January 1, 2024 through January 31, 2024 |
8,345 |
|
|
$ |
26.03 |
|
|
— |
|
|
$ |
250.0 |
|
February 1, 2024 through February 29, 2024 |
726 |
|
|
$ |
25.57 |
|
|
— |
|
|
$ |
250.0 |
|
March 1, 2024 through March 31, 2024 |
822 |
|
|
$ |
27.79 |
|
|
— |
|
|
$ |
250.0 |
|
| Total |
9,893 |
|
|
|
|
— |
|
|
|
(1) These columns include the following transactions during the three months ended March 31, 2024: (i) the surrender to the Company of 9,754 shares of common stock to satisfy tax withholding obligations in connection with the vesting of restricted stock issued to employees; and (ii) the purchase of 139 shares of common stock by the Trustee for assets held in a non-qualified employee profit sharing plan trust.
(2) In December 2022, our Board of Directors authorized a share repurchase program effective December 9, 2022 with no expiration. The share repurchase program authorizes the Company to repurchase up to $250.0 million of its common stock. There were no shares repurchased under this share repurchase program during the three months ended March 31, 2024. The approximate dollar value of shares that were eligible to be repurchased under our share repurchase program is shown as of the end of such month or quarter.
Item 3. Defaults Upon Senior Securities
None.
Item 4. Mine Safety Disclosures
Not applicable.
Item 5. Other Information
During the three months ended March 31, 2024, none of our directors or executive officers informed the Company of the adoption or termination of a "Rule 10b5-1 trading arrangement" or a "non-Rule 10b5-1 trading arrangement", as those terms are defined in Item 408 of SEC Regulation S-K.
Item 6. Exhibits
|
|
|
|
|
|
|
|
|
| NO. |
|
DESCRIPTION |
| 10.1 |
|
Warehouse Loan Agreement dated as of March 15, 2024, among Trinity Rail Leasing Warehouse Trust, Trinity Industries Leasing Company, Atlas Securitized Products Administration, L.P., as Agent, the Lenders, and U.S. Bank Trust Company, National Association, not in its individual capacity, but solely in its capacity as collateral agent and depositary (incorporated by reference to Exhibit 10.1 to our Form 8-K filed March 18, 2024). |
| 22.1 |
|
|
| 31.1 |
|
|
| 31.2 |
|
|
| 32.1 |
|
|
| 32.2 |
|
|
| 101.INS |
|
Inline XBRL Instance Document – the instance document does not appear in the Interactive Data File because its XBRL tags are embedded within the Inline XBRL document. |
| 101.SCH |
|
Inline XBRL Taxonomy Extension Schema Document (filed electronically herewith). |
| 101.CAL |
|
Inline XBRL Taxonomy Extension Calculation Linkbase Document (filed electronically herewith). |
| 101.LAB |
|
Inline XBRL Taxonomy Extension Label Linkbase Document (filed electronically herewith). |
| 101.PRE |
|
Inline XBRL Taxonomy Extension Presentation Linkbase Document (filed electronically herewith). |
| 101.DEF |
|
Inline XBRL Taxonomy Extension Definition Linkbase Document (filed electronically herewith). |
| 104 |
|
Cover Page Interactive Data File (formatted as Inline XBRL and contained in Exhibit 101). |
_____________________________
SIGNATURES
Pursuant to the requirements of the Securities Exchange Act of 1934, the registrant has duly caused this report to be signed on its behalf by the undersigned, thereunto duly authorized.
|
|
|
|
|
|
|
|
|
| TRINITY INDUSTRIES, INC. |
By: |
/s/ Eric R. Marchetto |
| Registrant |
|
|
|
|
Eric R. Marchetto |
|
|
Executive Vice President and Chief Financial Officer |
|
|
May 1, 2024 |
EX-22.1
2
exh221listofguarantorsubsi.htm
EX-22.1
Document
Exhibit 22.1
List of Guarantor Subsidiaries
As of March 31, 2024, the following subsidiaries of Trinity Industries, Inc. (the “Parent”) are guarantors of the Parent’s 4.55% senior notes due 2024:
Trinity Industries Leasing Company
Trinity North American Freight Car, Inc.
Trinity Rail Group, LLC
Trinity Tank Car, Inc.
TrinityRail Maintenance Services, Inc.
EX-31.1
3
exh3113312024-10qxq1.htm
EX-31.1
Document
Exhibit 31.1
CERTIFICATION
I, E. Jean Savage, certify that:
1.I have reviewed this quarterly report on Form 10-Q of Trinity Industries, Inc.;
2.Based on my knowledge, this report does not contain any untrue statement of a material fact or omit to state a material fact necessary to make the statements made, in light of the circumstances under which such statements were made, not misleading with respect to the period covered by this report;
3.Based on my knowledge, the financial statements, and other financial information included in this report, fairly present in all material respects the financial condition, results of operations and cash flows of the registrant as of, and for, the periods presented in this report;
4.The registrant’s other certifying officer(s) and I are responsible for establishing and maintaining disclosure controls and procedures (as defined in Exchange Act Rules 13a-15(e) and 15d-15(e)) and internal control over financial reporting (as defined in Exchange Act Rules 13a-15(f) and 15d-15(f)) for the registrant and have:
a.Designed such disclosure controls and procedures, or caused such disclosure controls and procedures to be designed under our supervision, to ensure that material information relating to the registrant, including its consolidated subsidiaries, is made known to us by others within those entities, particularly during the period in which this report is being prepared;
b.Designed such internal control over financial reporting, or caused such internal control over financial reporting to be designed under our supervision, to provide reasonable assurance regarding the reliability of financial reporting and the preparation of financial statements for external purposes in accordance with generally accepted accounting principles;
c.Evaluated the effectiveness of the registrant’s disclosure controls and procedures and presented in this report our conclusions about the effectiveness of the disclosure controls and procedures, as of the end of the period covered by this report based on such evaluation; and
d.Disclosed in this report any change in the registrant’s internal control over financial reporting that occurred during the registrant’s most recent fiscal quarter (the registrant’s fourth fiscal quarter in the case of an annual report) that has materially affected, or is reasonably likely to materially affect, the registrant’s internal control over financial reporting; and
5.The registrant’s other certifying officer and I have disclosed, based on our most recent evaluation of internal control over financial reporting, to the registrant’s auditors and the audit committee of the registrant’s board of directors (or persons performing the equivalent functions):
a.All significant deficiencies and material weaknesses in the design or operation of internal control over financial reporting which are reasonably likely to adversely affect the registrant’s ability to record, process, summarize and report financial information; and
b.Any fraud, whether or not material, that involves management or other employees who have a significant role in the registrant’s internal control over financial reporting.
Date: May 1, 2024
/s/ E. Jean Savage
E. Jean Savage
Chief Executive Officer and President
EX-31.2
4
exh3123312024-10qxq1.htm
EX-31.2
Document
Exhibit 31.2
CERTIFICATION
I, Eric R. Marchetto, certify that:
1.I have reviewed this quarterly report on Form 10-Q of Trinity Industries, Inc.;
2.Based on my knowledge, this report does not contain any untrue statement of a material fact or omit to state a material fact necessary to make the statements made, in light of the circumstances under which such statements were made, not misleading with respect to the period covered by this report;
3.Based on my knowledge, the financial statements, and other financial information included in this report, fairly present in all material respects the financial condition, results of operations and cash flows of the registrant as of, and for, the periods presented in this report;
4.The registrant’s other certifying officer(s) and I are responsible for establishing and maintaining disclosure controls and procedures (as defined in Exchange Act Rules 13a-15(e) and 15d-15(e)) and internal control over financial reporting (as defined in Exchange Act Rules 13a-15(f) and 15d-15(f)) for the registrant and have:
a.Designed such disclosure controls and procedures, or caused such disclosure controls and procedures to be designed under our supervision, to ensure that material information relating to the registrant, including its consolidated subsidiaries, is made known to us by others within those entities, particularly during the period in which this report is being prepared;
b.Designed such internal control over financial reporting, or caused such internal control over financial reporting to be designed under our supervision, to provide reasonable assurance regarding the reliability of financial reporting and the preparation of financial statements for external purposes in accordance with generally accepted accounting principles;
c.Evaluated the effectiveness of the registrant’s disclosure controls and procedures and presented in this report our conclusions about the effectiveness of the disclosure controls and procedures, as of the end of the period covered by this report based on such evaluation; and
d.Disclosed in this report any change in the registrant’s internal control over financial reporting that occurred during the registrant’s most recent fiscal quarter (the registrant’s fourth fiscal quarter in the case of an annual report) that has materially affected, or is reasonably likely to materially affect, the registrant’s internal control over financial reporting; and
5.The registrant’s other certifying officer and I have disclosed, based on our most recent evaluation of internal control over financial reporting, to the registrant’s auditors and the audit committee of the registrant’s board of directors (or persons performing the equivalent functions):
a.All significant deficiencies and material weaknesses in the design or operation of internal control over financial reporting which are reasonably likely to adversely affect the registrant’s ability to record, process, summarize and report financial information; and
b.Any fraud, whether or not material, that involves management or other employees who have a significant role in the registrant’s internal control over financial reporting.
Date: May 1, 2024
/s/ Eric R. Marchetto
Eric R. Marchetto
Executive Vice President and Chief Financial Officer
EX-32.1
5
exh3213312024-10qxq1.htm
EX-32.1
Document
Exhibit 32.1
CERTIFICATION PURSUANT TO
18 U.S.C. SECTION 1350,
AS ADOPTED PURSUANT TO
SECTION 906 OF THE SARBANES-OXLEY ACT OF 2002
In connection with the Quarterly Report of Trinity Industries, Inc. (the “Company”) on Form 10-Q for the period ended March 31, 2024 as filed with the Securities and Exchange Commission on the date hereof (the “Report”), I, E. Jean Savage, Chief Executive Officer and President of the Company, certify, pursuant to 18 U.S.C. Section 1350, as adopted pursuant to Section 906 of the Sarbanes-Oxley Act of 2002, that:
(1)The Report fully complies with the requirements of Section 13(a) or 15(d) of the Securities Exchange Act of 1934; and
(2)The information contained in the Report fairly presents, in all material respects, the financial condition and result of operations of the Company, as of, and for, the periods presented in the Report.
/s/ E. Jean Savage
E. Jean Savage
Chief Executive Officer and President
May 1, 2024
A signed original of this written statement required by Section 906 has been provided to the Company and will be retained by the Company and furnished to the Securities and Exchange Commission or its staff upon request.
EX-32.2
6
exh3223312024-10qxq1.htm
EX-32.2
Document
Exhibit 32.2
CERTIFICATION PURSUANT TO
18 U.S.C. SECTION 1350,
AS ADOPTED PURSUANT TO
SECTION 906 OF THE SARBANES-OXLEY ACT OF 2002
In connection with the Quarterly Report of Trinity Industries, Inc. (the “Company”) on Form 10-Q for the period ended March 31, 2024 as filed with the Securities and Exchange Commission on the date hereof (the “Report”), I, Eric R. Marchetto, Executive Vice President and Chief Financial Officer of the Company, certify, pursuant to 18 U.S.C. Section 1350, as adopted pursuant to Section 906 of the Sarbanes-Oxley Act of 2002, that:
(1)The Report fully complies with the requirements of Section 13(a) or 15(d) of the Securities Exchange Act of 1934; and
(2)The information contained in the Report fairly presents, in all material respects, the financial condition and result of operations of the Company, as of, and for, the periods presented in the Report.
/s/ Eric R. Marchetto
Eric R. Marchetto
Executive Vice President and Chief Financial Officer
May 1, 2024
A signed original of this written statement required by Section 906 has been provided to the Company and will be retained by the Company and furnished to the Securities and Exchange Commission or its staff upon request.