☒ |
QUARTERLY REPORT PURSUANT TO SECTION 13 OR 15(d) OF THE SECURITIES EXCHANGE ACT OF 1934 |
☐ |
TRANSITION REPORT PURSUANT TO SECTION 13 OR 15(d) OF THE SECURITIES EXCHANGE ACT OF 1934 |
New York |
13-2615557 |
||||
(State or other jurisdiction of
incorporation or organization)
|
(I.R.S. Employer
Identification No.)
|
||||
520 Madison Avenue, |
New York, |
New York |
10022 |
||
(Address of principal executive offices) |
(Zip Code) |
||||
Title of each class |
Trading Symbol(s) |
Name of each exchange on which registered |
Common Shares, par value $1 per share |
JEF |
New York Stock Exchange |
4.850% Senior Notes Due 2027 |
JEF 27A |
New York Stock Exchange |
5.875% Senior Notes Due 2028 |
JEF 28 |
New York Stock Exchange |
2.750% Senior Notes Due 2032 |
JEF 32A |
New York Stock Exchange |
6.200% Senior Notes Due 2034 |
JEF 34 |
New York Stock Exchange |
Large accelerated filer |
☒ |
Accelerated filer |
☐ |
|||
Non-accelerated filer |
☐ |
Smaller reporting company |
☐ |
|||
Emerging growth company |
☐ |
PART I. FINANCIAL INFORMATION | |
Page |
|
Consolidated Statements of Financial Condition (Unaudited) ......................................................................................................... |
|
Consolidated Statements of Earnings (Unaudited) ............................................................................................................................ |
|
Consolidated Statements of Comprehensive Income (Unaudited) .................................................................................................. |
|
Consolidated Statements of Changes in Equity (Unaudited) ............................................................................................................ |
|
Consolidated Statements of Cash Flows (Unaudited) ....................................................................................................................... |
|
Notes to Consolidated Financial Statements (Unaudited) ................................................................................................................ |
|
Item 2. Management’s Discussion and Analysis of Financial Condition and Results of Operations ............................................... |
|
Item 3. Quantitative and Qualitative Disclosures About Market Risk .................................................................................................... |
|
Item 4. Controls and Procedures .................................................................................................................................................................. |
|
PART II. OTHER INFORMATION | |
Item 1. Legal Proceedings ............................................................................................................................................................................. |
|
Item 1A. Risk Factors ..................................................................................................................................................................................... |
|
Item 2. Unregistered Sales of Equity Securities and Use of Proceeds .................................................................................................. |
|
Item 5. Other Information .............................................................................................................................................................................. |
|
Item 6. Exhibits ................................................................................................................................................................................................ |
|
2 |
Jefferies Financial Group Inc. |
$ in thousands, except share and per share amounts |
May 31,
2025
|
November 30,
2024
|
Assets |
||
Cash and cash equivalents ............................................................................................................................................................... |
$11,260,403 |
$12,153,414 |
Cash and securities segregated and on deposit for regulatory purposes or deposited with clearing and depository
organizations (includes $120,414 of securities at fair value at November 30, 2024) .........................................................
|
1,051,304 |
1,132,612 |
Financial instruments owned, at fair value (includes securities pledged of $18,404,776 and $18,441,751) ....................... |
25,570,194 |
24,138,274 |
Investments in and loans to related parties ................................................................................................................................... |
1,436,583 |
1,385,658 |
Securities borrowed ........................................................................................................................................................................... |
7,844,835 |
7,213,421 |
Securities purchased under agreements to resell ........................................................................................................................ |
7,485,007 |
6,179,653 |
Securities received as collateral, at fair value ................................................................................................................................ |
50,968 |
185,588 |
Receivables: |
||
Brokers, dealers and clearing organizations ............................................................................................................................... |
2,766,535 |
2,666,591 |
Customers ........................................................................................................................................................................................ |
2,652,808 |
2,494,717 |
Fees, interest and other .................................................................................................................................................................. |
805,846 |
663,536 |
Premises and equipment .................................................................................................................................................................. |
1,235,343 |
1,194,720 |
Goodwill ............................................................................................................................................................................................... |
1,842,114 |
1,827,938 |
Assets held for sale ........................................................................................................................................................................... |
39,128 |
51,885 |
Other assets (includes assets pledged of $532,703 and $429,347) .......................................................................................... |
3,244,276 |
3,072,302 |
Total assets ........................................................................................................................................................................................ |
$67,285,344 |
$64,360,309 |
Liabilities and Equity |
||
Short-term borrowings ...................................................................................................................................................................... |
$1,315,103 |
$443,160 |
Financial instruments sold, not yet purchased, at fair value ....................................................................................................... |
11,775,135 |
11,007,328 |
Securities loaned ................................................................................................................................................................................ |
2,041,795 |
2,540,861 |
Securities sold under agreements to repurchase ......................................................................................................................... |
12,157,620 |
12,337,935 |
Other secured financings (includes $429,289 and $24,848 at fair value) ................................................................................. |
2,741,561 |
2,183,000 |
Obligation to return securities received as collateral, at fair value ............................................................................................. |
50,968 |
185,588 |
Payables: |
||
Brokers, dealers and clearing organizations ............................................................................................................................... |
3,809,896 |
3,686,367 |
Customers ........................................................................................................................................................................................ |
4,266,776 |
4,073,975 |
Lease liabilities ................................................................................................................................................................................... |
616,494 |
635,306 |
Accrued expenses and other liabilities ........................................................................................................................................... |
2,775,449 |
3,510,831 |
Long-term debt (includes $3,304,517 and $2,351,346 at fair value) .......................................................................................... |
15,351,967 |
13,530,565 |
Total liabilities .................................................................................................................................................................................... |
56,902,764 |
54,134,916 |
Mezzanine Equity |
||
Redeemable noncontrolling interests ............................................................................................................................................. |
406 |
406 |
Equity |
||
Preferred shares, par value of $1 per share, authorized 70,000 shares; 55,125 shares issued and outstanding;
liquidation preference of $17,500 per share .............................................................................................................................
|
55 |
55 |
Common shares, par value $1 per share, authorized 565,000,000 shares; 206,271,769 and 205,504,272 shares issued
and outstanding, after deducting 114,846,301 and 115,613,798 shares held in treasury ..................................................
|
206,272 |
205,504 |
Non-voting common shares, par value $1 per share, authorized 35,000,000, shares; no shares issued and
outstanding ....................................................................................................................................................................................
|
— |
— |
Additional paid-in capital .................................................................................................................................................................. |
2,129,358 |
2,104,199 |
Accumulated other comprehensive loss ........................................................................................................................................ |
(339,695) |
(423,131) |
Retained earnings .............................................................................................................................................................................. |
8,309,035 |
8,270,145 |
Total Jefferies Financial Group Inc. shareholders' equity .......................................................................................................... |
10,305,025 |
10,156,772 |
Noncontrolling interests ................................................................................................................................................................... |
77,149 |
68,215 |
Total equity ......................................................................................................................................................................................... |
10,382,174 |
10,224,987 |
Total liabilities and equity ................................................................................................................................................................ |
$67,285,344 |
$64,360,309 |
May 2025 Form 10-Q |
3 |
Three Months Ended May 31, |
Six Months Ended May 31, |
||||||
$ in thousands, except per share amounts |
2025 |
2024 |
2025 |
2024 |
|||
Revenues |
|||||||
Investment banking ............................................................................................... |
$789,269 |
$738,584 |
$1,518,779 |
$1,417,649 |
|||
Principal transactions ............................................................................................ |
338,507 |
416,195 |
745,737 |
1,056,931 |
|||
Commissions and other fees ............................................................................... |
353,233 |
271,782 |
641,533 |
517,325 |
|||
Asset management fees and revenues .............................................................. |
20,076 |
11,768 |
105,484 |
62,140 |
|||
Interest ..................................................................................................................... |
878,025 |
879,727 |
1,723,196 |
1,699,216 |
|||
Other ......................................................................................................................... |
115,205 |
198,240 |
232,450 |
314,977 |
|||
Total revenues ........................................................................................................ |
2,494,315 |
$2,516,296 |
4,967,179 |
5,068,238 |
|||
Interest expense ..................................................................................................... |
859,868 |
859,851 |
1,739,713 |
1,673,590 |
|||
Net revenues ........................................................................................................... |
1,634,447 |
1,656,445 |
3,227,466 |
3,394,648 |
|||
Non-interest expenses |
|||||||
Compensation and benefits ................................................................................. |
854,839 |
861,993 |
1,695,966 |
1,788,864 |
|||
Brokerage and clearing fees ................................................................................. |
129,745 |
110,536 |
239,181 |
220,206 |
|||
Underwriting costs ................................................................................................. |
14,525 |
18,552 |
32,371 |
37,036 |
|||
Technology and communications ....................................................................... |
146,198 |
135,238 |
285,673 |
272,750 |
|||
Occupancy and equipment rental ........................................................................ |
30,711 |
29,327 |
60,910 |
57,480 |
|||
Business development .......................................................................................... |
80,070 |
68,630 |
152,361 |
126,281 |
|||
Professional services ............................................................................................ |
77,768 |
75,493 |
150,234 |
153,337 |
|||
Depreciation and amortization ............................................................................. |
52,253 |
49,946 |
83,241 |
93,148 |
|||
Cost of sales ........................................................................................................... |
42,961 |
37,462 |
84,529 |
72,133 |
|||
Other expenses ....................................................................................................... |
70,476 |
41,514 |
157,034 |
125,417 |
|||
Total non-interest expenses ................................................................................ |
1,499,546 |
1,428,691 |
2,941,500 |
2,946,652 |
|||
Earnings from continuing operations before income taxes ............................ |
134,901 |
227,754 |
285,966 |
447,996 |
|||
Income tax expense ............................................................................................... |
43,506 |
73,107 |
57,722 |
129,066 |
|||
Net earnings from continuing operations ........................................................... |
91,395 |
154,647 |
228,244 |
318,930 |
|||
Net earnings (losses) from discontinued operations, net of income tax
benefit of $0, $173, $0, and $3,176 .....................................................................
|
— |
40 |
— |
(7,851) |
|||
Net earnings ........................................................................................................... |
91,395 |
154,687 |
228,244 |
311,079 |
|||
Net losses attributable to noncontrolling interests ........................................... |
(7,668) |
(4,790) |
(14,651) |
(12,228) |
|||
Preferred stock dividends ..................................................................................... |
11,046 |
13,741 |
26,940 |
27,930 |
|||
Net earnings attributable to common shareholders ........................................ |
$88,017 |
$145,736 |
$215,955 |
$295,377 |
|||
Earnings per common share |
|||||||
Basic from continuing operations ....................................................................... |
$0.41 |
$0.66 |
$1.01 |
$1.37 |
|||
Diluted from continuing operations ..................................................................... |
0.40 |
0.64 |
0.97 |
1.34 |
|||
Basic ......................................................................................................................... |
0.41 |
0.66 |
1.01 |
1.34 |
|||
Diluted ...................................................................................................................... |
0.40 |
0.64 |
0.97 |
1.31 |
|||
Weighted-average common shares outstanding ............................................. |
|||||||
Basic ......................................................................................................................... |
215,097 |
219,971 |
214,818 |
219,935 |
|||
Diluted ...................................................................................................................... |
221,897 |
226,146 |
222,383 |
225,587 |
|||
4 |
Jefferies Financial Group Inc. |
Three Months Ended
May 31,
|
Six Months Ended
May 31,
|
||||||
$ in thousands |
2025 |
2024 |
2025 |
2024 |
|||
Net earnings ................................................................................................................... |
$91,395 |
$154,687 |
$228,244 |
$311,079 |
|||
Other comprehensive income (loss), net of tax: |
|||||||
Currency translation adjustments and other (1) ...................................................... |
46,769 |
(4,018) |
31,447 |
(4,117) |
|||
Changes in fair value related to instrument-specific credit risk (2) ...................... |
21,571 |
(9,950) |
51,827 |
(12,702) |
|||
Unrealized gains (losses) on available-for-sale-securities .................................... |
37 |
(328) |
162 |
1,630 |
|||
Total other comprehensive income (loss), net of tax (3) ....................................... |
68,377 |
(14,296) |
83,436 |
(15,189) |
|||
Comprehensive income ................................................................................................ |
159,772 |
140,391 |
311,680 |
295,890 |
|||
Net losses attributable to noncontrolling interests .................................................. |
(7,668) |
(4,790) |
(14,651) |
(12,228) |
|||
Preferred stock dividends ............................................................................................ |
11,046 |
13,741 |
26,940 |
27,930 |
|||
Comprehensive income attributable to common shareholders ............................ |
$156,394 |
$131,440 |
$299,391 |
$280,188 |
|||
May 2025 Form 10-Q |
5 |
Three Months Ended May 31, |
Six Months Ended May 31, |
||||||
$ in thousands, except share amounts |
2025 |
2024 |
2025 |
2024 |
|||
Preferred shares $1 par value |
|||||||
Balance, beginning of period ............................................................................. |
$55 |
$42 |
$55 |
$42 |
|||
Balance, end of period ....................................................................................... |
$55 |
$42 |
$55 |
$42 |
|||
Common shares $1 par value |
|||||||
Balance, beginning of period ............................................................................. |
$206,250 |
$212,001 |
$205,504 |
$210,627 |
|||
Purchase of common shares for treasury ................................................... |
(23) |
(15) |
(719) |
(1,082) |
|||
Other .................................................................................................................. |
45 |
67 |
1,487 |
2,508 |
|||
Balance, end of period ....................................................................................... |
$206,272 |
$212,053 |
$206,272 |
$212,053 |
|||
Additional paid-in capital |
|||||||
Balance, beginning of period ............................................................................. |
$2,094,138 |
$2,026,584 |
$2,104,199 |
$2,044,859 |
|||
Share-based compensation expense ............................................................ |
18,193 |
14,357 |
53,830 |
34,572 |
|||
Purchase of common shares for treasury ................................................... |
(1,227) |
(931) |
(56,849) |
(42,897) |
|||
Dividend equivalents ....................................................................................... |
8,354 |
4,926 |
16,951 |
9,680 |
|||
Change in equity interest related to consolidated subsidiaries ................ |
(1,976) |
— |
(1,123) |
— |
|||
Other .................................................................................................................. |
11,876 |
6,213 |
12,350 |
4,935 |
|||
Balance, end of period ....................................................................................... |
$2,129,358 |
$2,051,149 |
$2,129,358 |
$2,051,149 |
|||
Accumulated other comprehensive loss, net of tax |
|||||||
Balance, beginning of period ............................................................................. |
$(408,072) |
$(396,438) |
$(423,131) |
$(395,545) |
|||
Other comprehensive income (loss), net of taxes ...................................... |
68,377 |
(14,296) |
83,436 |
(15,189) |
|||
Balance, end of period ....................................................................................... |
$(339,695) |
$(410,734) |
$(339,695) |
$(410,734) |
|||
Retained earnings |
|||||||
Balance, beginning of period ............................................................................. |
$8,311,857 |
$7,937,908 |
$8,270,145 |
$7,849,844 |
|||
Net earnings attributable to Jefferies Financial Group Inc. ....................... |
99,063 |
159,478 |
242,895 |
323,308 |
|||
Dividends - common shares ($0.40, $0.30, $0.80, $0.60) per share) ....... |
(90,860) |
(68,540) |
(181,955) |
(136,903) |
|||
Dividends - preferred shares .......................................................................... |
(11,025) |
(6,300) |
(22,050) |
(12,600) |
|||
Cumulative effect of change in accounting principle for current
expected credit losses, net of tax .............................................................
|
— |
— |
— |
(644) |
|||
Other .................................................................................................................. |
— |
— |
— |
(459) |
|||
Balance, end of period ....................................................................................... |
$8,309,035 |
$8,022,546 |
$8,309,035 |
$8,022,546 |
|||
Total Jefferies Financial Group Inc. shareholders' equity ........................... |
$10,305,025 |
$9,875,056 |
$10,305,025 |
$9,875,056 |
|||
Noncontrolling interests |
|||||||
Balance, beginning of period ............................................................................. |
$64,211 |
$87,372 |
$68,215 |
$92,308 |
|||
Net losses attributable to noncontrolling interests .................................... |
(7,668) |
(4,790) |
(14,651) |
(12,228) |
|||
Contributions .................................................................................................... |
17,350 |
5 |
17,454 |
9,321 |
|||
Distributions ..................................................................................................... |
(1,528) |
(3,563) |
(4,323) |
(10,689) |
|||
Change in equity interest related to consolidated subsidiaries ................ |
4,273 |
— |
3,420 |
— |
|||
Other .................................................................................................................. |
511 |
(1,894) |
7,034 |
(1,582) |
|||
Balance, end of period ....................................................................................... |
$77,149 |
$77,130 |
$77,149 |
$77,130 |
|||
Total equity .......................................................................................................... |
$10,382,174 |
$9,952,186 |
$10,382,174 |
$9,952,186 |
|||
6 |
Jefferies Financial Group Inc. |
Six Months Ended May 31, |
||
$ in thousands |
2025 |
2024 |
Cash flows from operating activities: |
||
Net earnings ...................................................................................................................................................................................... |
$228,244 |
$311,079 |
Adjustments to reconcile net earnings to net cash used in operating activities: |
||
Depreciation and amortization .................................................................................................................................................... |
88,454 |
93,722 |
Share-based compensation ......................................................................................................................................................... |
53,830 |
34,572 |
Net bad debt expense ................................................................................................................................................................... |
13,463 |
46,593 |
Income on investments in and loans to related parties ........................................................................................................... |
(15,162) |
(37,202) |
Distributions received on investments in related parties ........................................................................................................ |
28,593 |
874 |
Gain on sale of subsidiaries and investments in related parties ............................................................................................ |
— |
(56,174) |
Other adjustments ......................................................................................................................................................................... |
184,362 |
147,851 |
Net change in assets and liabilities: |
||
Receivables: |
||
Brokers, dealers and clearing organizations .......................................................................................................................... |
(90,224) |
(722,293) |
Customers ................................................................................................................................................................................... |
(158,094) |
(594,067) |
Fees, interest and other ............................................................................................................................................................. |
(143,594) |
(114,271) |
Securities borrowed ...................................................................................................................................................................... |
(622,392) |
48,414 |
Financial instruments owned ....................................................................................................................................................... |
(1,241,243) |
(937,418) |
Securities purchased under agreements to resell .................................................................................................................... |
(1,266,238) |
(799,421) |
Other assets ................................................................................................................................................................................... |
(205,378) |
(539,351) |
Payables: |
||
Brokers, dealers and clearing organizations .......................................................................................................................... |
112,293 |
601,124 |
Customers ................................................................................................................................................................................... |
192,801 |
(119,505) |
Securities loaned ........................................................................................................................................................................... |
(509,851) |
405,066 |
Financial instruments sold, not yet purchased ......................................................................................................................... |
727,110 |
680,922 |
Securities sold under agreements to repurchase ..................................................................................................................... |
(217,150) |
122,236 |
Lease liabilities .............................................................................................................................................................................. |
(33,240) |
(38,778) |
Accrued expenses and other liabilities ...................................................................................................................................... |
(770,081) |
285,980 |
Net cash used in operating activities from continuing operations ......................................................................................... |
(3,643,497) |
(1,180,047) |
Net cash used in operating activities from discontinued operations ..................................................................................... |
— |
(90,174) |
Cash flows from investing activities: |
||
Contributions to investments in and loans to related parties ................................................................................................. |
(111,087) |
(62,543) |
Capital distributions from investments and repayments of loans from related parties ..................................................... |
47,190 |
7,941 |
Originations and purchases of automobile loans, notes and other receivables .................................................................. |
— |
(89,540) |
Principal collections of automobile loans, notes and other receivables ............................................................................... |
— |
83,268 |
Net payments on premises and equipment .............................................................................................................................. |
(93,247) |
(144,857) |
Proceeds from sales of subsidiary and investment in related parties, net of cash of operations sold ........................... |
— |
95,276 |
Net cash used in investing activities from continuing operations .......................................................................................... |
(157,144) |
(110,455) |
May 2025 Form 10-Q |
7 |
Six Months Ended May 31, |
||
$ in thousands |
2025 |
2024 |
Cash flows from financing activities: |
||
Proceeds from short-term borrowings ....................................................................................................................................... |
$4,744,829 |
$2,113,633 |
Payments on short-term borrowings .......................................................................................................................................... |
(3,852,844) |
(1,495,796) |
Proceeds from issuance of long-term debt, net of issuance costs ....................................................................................... |
2,635,540 |
3,527,009 |
Repayment of long-term debt ...................................................................................................................................................... |
(960,857) |
(726,019) |
Purchase of common shares for treasury ................................................................................................................................. |
(57,568) |
(43,979) |
Dividends paid to common and preferred shareholders ......................................................................................................... |
(187,054) |
(139,823) |
Net proceeds from other secured financings ........................................................................................................................... |
556,902 |
240,898 |
Net change in bank overdrafts .................................................................................................................................................... |
(22,945) |
17,754 |
Proceeds from contributions of noncontrolling interests ....................................................................................................... |
16,354 |
9,321 |
Payments on distributions to noncontrolling interests ............................................................................................................ |
(3,223) |
(10,689) |
Other ................................................................................................................................................................................................ |
16,134 |
6,984 |
Net cash provided by financing activities from continuing operations .................................................................................. |
2,885,268 |
3,499,293 |
Net cash provided by financing activities from discontinued operations .............................................................................. |
— |
4,384 |
Effect of exchange rate changes on cash, cash equivalents, and restricted cash ............................................................... |
61,470 |
(1,513) |
Change in cash, cash equivalents, and restricted cash reclassified from (to) assets held for sale .................................... |
— |
(13,224) |
Net (decrease) increase in cash, cash equivalents, and restricted cash ................................................................................. |
(853,905) |
2,121,488 |
Cash, cash equivalents, and restricted cash at beginning of period ........................................................................................ |
13,165,612 |
9,830,758 |
Cash, cash equivalents, and restricted cash at end of period .................................................................................................. |
$12,311,707 |
$11,939,022 |
Supplemental disclosures of cash flow information: |
||
Cash paid during the period for: |
||
Interest ............................................................................................................................................................................................ |
$1,716,136 |
$1,579,458 |
Income taxes, net .......................................................................................................................................................................... |
53,197 |
88,988 |
May 31, |
November 30, |
|
$ in thousands |
2025 |
2024 |
Cash and cash equivalents ........................................................................................................................................... |
$11,260,403 |
$12,153,414 |
Cash on deposit for regulatory purposes with clearing and depository organizations ....................................... |
1,051,304 |
1,012,198 |
Total cash, cash equivalents and restricted cash .................................................................................................... |
$12,311,707 |
$13,165,612 |
8 |
Jefferies Financial Group Inc. |
Page |
|
Note 1. Organization and Basis of Presentation ...................................................................................................................................................................... |
|
Note 2. Summary of Significant Accounting Policies ............................................................................................................................................................. |
|
Note 3. Accounting Developments ............................................................................................................................................................................................ |
|
Note 4. Business Acquisitions .................................................................................................................................................................................................... |
|
Note 5. Assets Held for Sale and Discontinued Operations ................................................................................................................................................... |
|
Note 6. Fair Value Disclosures .................................................................................................................................................................................................... |
|
Note 7. Derivative Financial Instruments .................................................................................................................................................................................. |
|
Note 8. Collateralized Transactions ........................................................................................................................................................................................... |
|
Note 9. Securitization Activities ................................................................................................................................................................................................. |
|
Note 10. Variable Interest Entities .............................................................................................................................................................................................. |
|
Note 11. Investments ................................................................................................................................................................................................................... |
|
Note 12. Credit Losses on Financial Assets Measured at Amortized Cost ......................................................................................................................... |
|
Note 13. Goodwill and Intangible Assets .................................................................................................................................................................................. |
|
Note 14. Revenues from Contracts with Customers ............................................................................................................................................................... |
|
Note 15. Compensation Plans .................................................................................................................................................................................................... |
|
Note 16. Borrowings ..................................................................................................................................................................................................................... |
|
Note 17. Total Equity .................................................................................................................................................................................................................... |
|
Note 18. Income Taxes ................................................................................................................................................................................................................ |
|
Note 19. Commitments, Contingencies and Guarantees ....................................................................................................................................................... |
|
Note 20. Regulatory Requirements ............................................................................................................................................................................................ |
|
Note 21. Segment Reporting ....................................................................................................................................................................................................... |
|
Note 22. Related Party Transactions ......................................................................................................................................................................................... |
May 2025 Form 10-Q |
9 |
10 |
Jefferies Financial Group Inc. |
May 2025 Form 10-Q |
11 |
12 |
Jefferies Financial Group Inc. |
May 31, 2025 (1) |
|||||
$ in thousands |
Level 1 |
Level 2 |
Level 3 |
Counterparty
and Cash
Collateral
Netting (2)
|
Total |
Assets: |
|||||
Financial instruments owned: |
|||||
Corporate equity securities .................................................................................. |
$5,018,987 |
$417,979 |
$231,160 |
$— |
$5,668,126 |
Corporate debt securities ..................................................................................... |
— |
5,375,646 |
44,682 |
— |
5,420,328 |
Collateralized debt obligations and collateralized loan obligations ............... |
— |
685,511 |
70,948 |
— |
756,459 |
U.S. government and federal agency securities ................................................ |
3,139,294 |
130,185 |
— |
— |
3,269,479 |
Municipal securities .............................................................................................. |
— |
621,737 |
— |
— |
621,737 |
Sovereign obligations ............................................................................................ |
694,500 |
738,064 |
— |
— |
1,432,564 |
Residential mortgage-backed securities ............................................................ |
— |
2,040,529 |
7,947 |
— |
2,048,476 |
Commercial mortgage-backed securities .......................................................... |
— |
72,563 |
505 |
— |
73,068 |
Other asset-backed securities ............................................................................. |
— |
579,030 |
153,681 |
— |
732,711 |
Loans and other receivables ................................................................................ |
— |
2,572,953 |
92,168 |
— |
2,665,121 |
Derivatives .............................................................................................................. |
472 |
3,995,263 |
8,569 |
(2,715,818) |
1,288,486 |
Investments at fair value ...................................................................................... |
— |
7 |
153,379 |
— |
153,386 |
Total financial instruments owned, excluding Investments at fair value
based on NAV ....................................................................................................
|
$8,853,253 |
$17,229,467 |
$763,039 |
$(2,715,818) |
$24,129,941 |
Securities received as collateral .......................................................................... |
$50,968 |
$— |
$— |
$— |
$50,968 |
Liabilities: |
|||||
Financial instruments sold, not yet purchased: |
|||||
Corporate equity securities .................................................................................. |
$3,870,700 |
$14,554 |
$161 |
$— |
$3,885,415 |
Corporate debt securities ..................................................................................... |
— |
3,534,470 |
644 |
— |
3,535,114 |
Collateralized debt obligations and collateralized loan obligations ............... |
— |
1 |
— |
— |
1 |
U.S. government and federal agency securities ................................................ |
2,136,579 |
5 |
— |
— |
2,136,584 |
Sovereign obligations ............................................................................................ |
814,027 |
592,350 |
— |
— |
1,406,377 |
Commercial mortgage-backed securities .......................................................... |
— |
37 |
1,153 |
— |
1,190 |
Loans ....................................................................................................................... |
— |
87,415 |
313 |
— |
87,728 |
Derivatives .............................................................................................................. |
— |
3,768,347 |
41,857 |
(3,087,478) |
722,726 |
Total financial instruments sold, not yet purchased ....................................... |
$6,821,306 |
$7,997,179 |
$44,128 |
$(3,087,478) |
$11,775,135 |
Other secured financings ...................................................................................... |
$— |
$410,413 |
$18,876 |
$— |
$429,289 |
Obligation to return securities received as collateral ....................................... |
50,968 |
— |
— |
— |
50,968 |
Long-term debt ....................................................................................................... |
— |
2,313,361 |
991,156 |
— |
3,304,517 |
May 2025 Form 10-Q |
13 |
November 30, 2024 (1) |
|||||
$ in thousands |
Level 1 |
Level 2 |
Level 3 |
Counterparty
and Cash
Collateral
Netting (2)
|
Total |
Assets: |
|||||
Financial instruments owned: |
|||||
Corporate equity securities .................................................................................. |
$5,238,058 |
$302,051 |
$239,364 |
$— |
$5,779,473 |
Corporate debt securities ..................................................................................... |
— |
5,310,815 |
24,931 |
— |
5,335,746 |
Collateralized debt obligations and collateralized loan obligations ............... |
— |
1,029,662 |
63,976 |
— |
1,093,638 |
U.S. government and federal agency securities ................................................ |
3,583,139 |
160,227 |
— |
— |
3,743,366 |
Municipal securities .............................................................................................. |
— |
320,507 |
— |
— |
320,507 |
Sovereign obligations ............................................................................................ |
749,912 |
630,681 |
172 |
— |
1,380,765 |
Residential mortgage-backed securities ............................................................ |
— |
2,348,862 |
7,714 |
— |
2,356,576 |
Commercial mortgage-backed securities .......................................................... |
— |
146,752 |
477 |
— |
147,229 |
Other asset-backed securities ............................................................................. |
— |
110,687 |
103,214 |
— |
213,901 |
Loans and other receivables ................................................................................ |
— |
1,706,152 |
152,586 |
— |
1,858,738 |
Derivatives .............................................................................................................. |
146 |
3,181,454 |
3,926 |
(2,667,751) |
517,775 |
Investments at fair value ...................................................................................... |
— |
6 |
137,865 |
— |
137,871 |
Total financial instruments owned, excluding Investments at fair value
based on NAV ....................................................................................................
|
$9,571,255 |
$15,247,856 |
$734,225 |
$(2,667,751) |
$22,885,585 |
Securities segregated and on deposit for regulatory purposes or
deposited with clearing and depository organizations ................................
|
$120,414 |
$— |
$— |
$— |
$120,414 |
Securities received as collateral .......................................................................... |
185,588 |
— |
— |
— |
185,588 |
Liabilities: |
|||||
Financial instruments sold, not yet purchased: |
|||||
Corporate equity securities .................................................................................. |
$3,013,877 |
$73,240 |
$208 |
$— |
$3,087,325 |
Corporate debt securities ..................................................................................... |
— |
3,105,010 |
165 |
— |
3,105,175 |
U.S. government and federal agency securities ................................................ |
2,904,379 |
26 |
— |
— |
2,904,405 |
Sovereign obligations ............................................................................................ |
667,647 |
422,124 |
— |
— |
1,089,771 |
Commercial mortgage-backed securities ......................................................... |
— |
— |
1,153 |
— |
1,153 |
Loans ....................................................................................................................... |
— |
92,321 |
16,864 |
— |
109,185 |
Derivatives .............................................................................................................. |
13 |
3,477,802 |
26,212 |
(2,793,713) |
710,314 |
Total financial instruments sold, not yet purchased ....................................... |
$6,585,916 |
$7,170,523 |
$44,602 |
$(2,793,713) |
$11,007,328 |
Other secured financings ...................................................................................... |
$— |
$9,964 |
$14,884 |
$— |
$24,848 |
Obligation to return securities received as collateral ...................................... |
185,588 |
— |
— |
— |
185,588 |
Long-term debt ....................................................................................................... |
— |
1,529,443 |
821,903 |
— |
2,351,346 |
14 |
Jefferies Financial Group Inc. |
May 31, 2025 |
||||
$ in thousands |
Fair Value
(1)
|
Unfunded
Commitments
|
Redemption
Frequency
|
Redemption
Notice Period
|
Hedge
Funds (2) ..............
|
$689,960 |
$— |
Quarterly (50%)
Monthly (50%)
|
45 - 90 days
45 - 60 days
|
Private Equity
Funds (3) ..............
|
64,532 |
26,638 |
N/R (100%) |
N/R |
Credit
Funds (4) ..............
|
489,597 |
106 |
Quarterly (60%)
Monthly (2%)
N/R (38%)
|
90 days
30 days
N/R
|
Real Estate and
Other Funds (5) ....
|
196,164 |
164,982 |
Quarterly (26%)
N/R (74%)
|
90 days
N/R
|
Total ...................... |
$1,440,253 |
$191,726 |
||
November 30, 2024 |
||||
$ in thousands |
Fair Value
(1)
|
Unfunded
Commitments
|
Redemption
Frequency
|
Redemption
Notice Period
|
Hedge
Funds (2) ............
|
$660,720 |
$— |
Quarterly (53%)
Monthly (47%)
|
45 - 90 days
45 - 60 days
|
Private Equity
Funds (3) ............
|
60,215 |
30,530 |
N/R (100%) |
N/R |
Credit Funds (4) |
430,429 |
30,554 |
Quarterly (72%)
Monthly (3%)
N/R (25%)
|
90 days
30 days
N/R
|
Real Estate and
Other Funds (5) .
|
101,325 |
232,696 |
N/R (100%) |
N/R |
Total ................... |
$1,252,689 |
$293,780 |
||
May 2025 Form 10-Q |
15 |
Three Months Ended May 31, 2025 |
||||||||||
$ in thousands |
Balance at
February 28,
2025
|
Total
gains/
losses
(realized
and
unrealized)
(1)
|
Purchases |
Sales |
Settlements |
Issuances |
Net
transfers
into/
(out of)
Level 3
|
Balance at
May 31,
2025
|
For instruments still held at
May 31, 2025, changes in
unrealized gains (losses)
included in:
|
|
Earnings (1) |
Other
comprehensive
income
(loss) (1)
|
|||||||||
Level 3 assets: |
||||||||||
Financial instruments owned: |
||||||||||
Corporate equity securities .................... |
$212,409 |
$8,245 |
$2,482 |
$(2,201) |
$— |
$— |
$10,225 |
$231,160 |
$5,003 |
$— |
Corporate debt securities ...................... |
25,925 |
2,547 |
18,805 |
(15,740) |
(2,177) |
— |
15,322 |
44,682 |
2,194 |
— |
CDOs and CLOs ....................................... |
71,827 |
(4,123) |
35,644 |
(18,469) |
(6,550) |
— |
(7,381) |
70,948 |
(4,564) |
— |
RMBS ........................................................ |
7,526 |
436 |
— |
— |
(15) |
— |
— |
7,947 |
439 |
— |
CMBS ........................................................ |
471 |
34 |
— |
— |
— |
— |
— |
505 |
34 |
— |
Other ABS ................................................. |
147,319 |
6,814 |
27,523 |
(26,231) |
(1,863) |
— |
119 |
153,681 |
5,985 |
— |
Loans and other receivables ................. |
153,764 |
(7,236) |
18,008 |
(39,475) |
(13,063) |
— |
(19,830) |
92,168 |
(10,875) |
— |
Investments at fair value ........................ |
157,881 |
6,041 |
261 |
— |
(804) |
— |
(10,000) |
153,379 |
3,581 |
— |
Level 3 liabilities: |
||||||||||
Financial instruments sold, not yet
purchased:
|
||||||||||
Corporate equity securities .................... |
$590 |
$(256) |
$(173) |
$— |
$— |
$— |
$— |
$161 |
$31 |
$— |
Corporate debt securities ...................... |
1,113 |
222 |
(41,346) |
41,436 |
(662) |
— |
(119) |
644 |
(86) |
— |
RMBS ........................................................ |
15 |
(15) |
— |
— |
— |
— |
— |
— |
— |
— |
CMBS ........................................................ |
1,154 |
(1) |
— |
35 |
— |
— |
(35) |
1,153 |
1 |
— |
Loans ........................................................ |
848 |
(658) |
(37) |
— |
183 |
— |
(23) |
313 |
(226) |
— |
Net derivatives (2) ................................... |
42,076 |
(1,132) |
— |
— |
(4) |
— |
(7,652) |
33,288 |
(6,385) |
— |
Other secured financings ....................... |
12,705 |
— |
— |
— |
(2,360) |
8,531 |
— |
18,876 |
— |
— |
Long-term debt ........................................ |
860,684 |
34,729 |
— |
— |
(5,893) |
93,570 |
8,066 |
991,156 |
(49,509) |
14,781 |
Six Months Ended May 31, 2025 |
||||||||||
$ in thousands |
Balance at
November 30,
2024
|
Total
gains/
losses
(realized
and
unrealized)
(1)
|
Purchases |
Sales |
Settlements |
Issuances |
Net
transfers
into/
(out of)
Level 3
|
Balance at
May 31,
2025
|
For instruments still held at
May 31, 2025, changes in
unrealized gains (losses)
included in:
|
|
Earnings (1) |
Other
comprehensive
income
(loss) (1)
|
|||||||||
Assets: |
||||||||||
Financial instruments owned: |
||||||||||
Corporate equity securities ................ |
$239,364 |
$9,940 |
$7,049 |
$(5,366) |
$494 |
$— |
$(20,321) |
$231,160 |
$8,292 |
$— |
Corporate debt securities ................... |
24,931 |
2,147 |
37,129 |
(23,787) |
(2,197) |
— |
6,459 |
44,682 |
2,419 |
— |
CDOs and CLOs ................................... |
63,976 |
(10,286) |
52,875 |
(23,728) |
(6,550) |
— |
(5,339) |
70,948 |
(10,336) |
— |
Sovereign obligations ......................... |
172 |
2 |
— |
(174) |
— |
— |
— |
— |
— |
— |
RMBS ..................................................... |
7,714 |
269 |
— |
— |
(36) |
— |
— |
7,947 |
279 |
— |
CMBS .................................................... |
477 |
28 |
— |
— |
— |
— |
— |
505 |
28 |
— |
Other ABS ............................................. |
103,214 |
(264) |
86,866 |
(30,929) |
(4,175) |
— |
(1,031) |
153,681 |
(565) |
— |
Loans and other receivables .............. |
152,586 |
(5,759) |
72,851 |
(82,603) |
(21,549) |
3,670 |
(27,028) |
92,168 |
(9,134) |
— |
Investments at fair value .................... |
137,865 |
6,434 |
21,549 |
— |
(2,469) |
— |
(10,000) |
153,379 |
3,974 |
— |
Liabilities: |
||||||||||
Financial instruments sold, not yet
purchased:
|
||||||||||
Corporate equity securities ................ |
$208 |
$126 |
$(173) |
$— |
$— |
$— |
$— |
$161 |
$(126) |
$— |
Corporate debt securities ................... |
165 |
52 |
(135,198) |
135,433 |
— |
— |
192 |
644 |
(123) |
— |
CMBS .................................................... |
1,153 |
— |
— |
35 |
— |
— |
(35) |
1,153 |
— |
— |
Loans .................................................... |
16,864 |
(1,673) |
(1,046) |
— |
698 |
— |
(14,530) |
313 |
39 |
— |
Net derivatives (2) ............................... |
22,286 |
(13,925) |
— |
22,588 |
(484) |
— |
2,823 |
33,288 |
5,076 |
— |
Other secured financings ................... |
14,884 |
241 |
— |
— |
(4,780) |
8,531 |
— |
18,876 |
(241) |
— |
Long-term debt .................................... |
821,903 |
(21,118) |
— |
— |
(2,799) |
218,124 |
(24,954) |
991,156 |
(19,522) |
40,640 |
16 |
Jefferies Financial Group Inc. |
May 2025 Form 10-Q |
17 |
Three Months Ended May 31, 2024 |
||||||||||
$ in thousands |
Balance at
February 28,
2024
|
Total
gains/
losses
(realized
and
unrealized)
(1)
|
Purchases |
Sales |
Settlements |
Issuances |
Net
transfers
into/
(out of)
Level 3
|
Balance at
May 31,
2024
|
For instruments still held at
May 31, 2024, changes in
unrealized gains (losses)
included in:
|
|
Earnings (1) |
Other
comprehensive
income
(loss) (1)
|
|||||||||
Assets: |
||||||||||
Financial instruments owned: |
||||||||||
Corporate equity securities ................. |
$173,214 |
$(12,751) |
$15,398 |
$(18) |
$— |
$— |
$2,912 |
$178,755 |
$(12,404) |
$— |
Corporate debt securities ................... |
35,335 |
1,363 |
1,091 |
(16,250) |
— |
— |
17,178 |
38,717 |
89 |
— |
CDOs and CLOs .................................... |
69,367 |
1,220 |
6,810 |
(1,905) |
(5,527) |
— |
(1,339) |
68,626 |
(675) |
— |
RMBS ..................................................... |
684 |
(6) |
— |
— |
(34) |
— |
— |
644 |
— |
— |
CMBS ..................................................... |
473 |
4 |
— |
— |
— |
— |
— |
477 |
— |
— |
Other ABS .............................................. |
102,256 |
(2,198) |
63,554 |
(15,138) |
(35,363) |
— |
55,625 |
168,736 |
(1,694) |
— |
Loans and other receivables .............. |
78,885 |
1,255 |
11,329 |
(4,161) |
(35) |
— |
5,273 |
92,546 |
579 |
— |
Investments at fair value ..................... |
121,764 |
1,616 |
15,224 |
(547) |
— |
— |
— |
138,057 |
1,616 |
— |
Liabilities: |
||||||||||
Financial instruments sold, not yet
purchased:
|
||||||||||
Corporate equity securities ................. |
675 |
8 |
— |
25 |
— |
— |
— |
708 |
(8) |
— |
Corporate debt securities ................... |
124 |
(23) |
— |
246 |
— |
— |
159 |
506 |
23 |
— |
CMBS ..................................................... |
944 |
— |
— |
— |
105 |
— |
— |
1,049 |
— |
— |
Loans ..................................................... |
1,466 |
(251) |
(925) |
2,801 |
81 |
— |
(1,588) |
1,584 |
309 |
— |
Net derivatives (2) ................................ |
52,089 |
(10,062) |
— |
— |
(9,689) |
— |
2,539 |
34,877 |
(178) |
— |
Other secured financings .................... |
3,965 |
— |
— |
— |
— |
— |
— |
3,965 |
— |
— |
Long-term debt ..................................... |
779,529 |
(2,477) |
— |
— |
(2,109) |
6,616 |
2,653 |
784,212 |
9,334 |
(6,857) |
Six Months Ended May 31, 2024 |
||||||||||
$ in thousands |
Balance at
November 30,
2023
|
Total
gains/
losses
(realized
and
unrealized)
(1)
|
Purchases |
Sales |
Settlements |
Issuances |
Net
transfers
into/
(out of)
Level 3
|
Balance at
May 31,
2024
|
For instruments still held at
May 31, 2024, changes in
unrealized gains (losses)
included in:
|
|
Earnings (1) |
Other
comprehensive
income
(loss) (1)
|
|||||||||
Assets: |
||||||||||
Financial instruments owned: |
||||||||||
Corporate equity securities ................ |
$181,294 |
$(12,817) |
$15,956 |
$(2,230) |
$— |
$— |
$(3,448) |
$178,755 |
$(12,175) |
$— |
Corporate debt securities ................... |
26,112 |
3,830 |
25,563 |
(17,217) |
(200) |
— |
629 |
38,717 |
2,997 |
— |
CDOs and CLOs ................................... |
64,862 |
9,006 |
20,333 |
(15,838) |
(7,293) |
— |
(2,444) |
68,626 |
4,904 |
— |
RMBS ..................................................... |
20,871 |
(207) |
32 |
(32) |
(5,395) |
— |
(14,625) |
644 |
33 |
— |
CMBS .................................................... |
508 |
(35) |
4 |
— |
— |
— |
— |
477 |
(64) |
— |
Other ABS ............................................. |
117,661 |
(5,913) |
76,263 |
(32,817) |
(26,619) |
— |
40,161 |
168,736 |
(3,938) |
— |
Loans and other receivables .............. |
130,101 |
(39,831) |
18,555 |
(3,974) |
(17,892) |
— |
5,587 |
92,546 |
(17,220) |
— |
Investments at fair value .................... |
130,835 |
(9,079) |
16,855 |
— |
(547) |
— |
(7) |
138,057 |
(9,079) |
— |
Liabilities: |
||||||||||
Financial instruments sold, not yet
purchased:
|
||||||||||
Corporate equity securities |
$676 |
$1 |
$— |
$31 |
$— |
$— |
$— |
$708 |
$(1) |
$— |
Corporate debt securities ................... |
124 |
(23) |
— |
246 |
— |
— |
159 |
506 |
23 |
— |
CMBS .................................................... |
840 |
— |
(245) |
— |
455 |
— |
(1) |
1,049 |
— |
— |
Loans .................................................... |
1,521 |
(114) |
(1,041) |
3,642 |
114 |
— |
(2,538) |
1,584 |
107 |
— |
Net derivatives (2) ............................... |
50,955 |
(17,979) |
(978) |
2,913 |
(9,486) |
— |
9,452 |
34,877 |
9,057 |
— |
Other secured financings ................... |
3,898 |
4,482 |
— |
— |
(4,415) |
— |
— |
3,965 |
(4,482) |
— |
Long-term debt .................................... |
744,597 |
9,651 |
— |
— |
(2,109) |
28,072 |
4,001 |
784,212 |
(5,117) |
(4,534) |
18 |
Jefferies Financial Group Inc. |
May 2025 Form 10-Q |
19 |
May 31, 2025 | |||||||
Financial Instruments Owned |
Fair Value
(in
thousands)
|
Valuation
Technique
|
Significant Unobservable Input(s) |
Input / Range |
Weighted
Average
|
||
Corporate equity securities ..................... |
$205,389 |
||||||
Non-exchange-traded securities |
Market approach |
Price |
$0 |
- |
$486 |
$80 |
|
Corporate debt securities ........................ |
$38,700 |
Market approach |
Price |
$49 |
- |
$118 |
$52 |
Discounted cash
flows
|
Discount rate/yield |
18% |
- |
26% |
21% |
||
CDOs and CLOs .......................................... |
$63,639 |
Discounted cash
flows
|
Constant prepayment rate |
20% |
— |
||
Constant default rate |
2% |
— |
|||||
Loss severity |
30% |
— |
|||||
Discount rate/yield |
13% |
- |
19% |
17% |
|||
Market approach |
Price |
$98 |
- |
$114 |
$105 |
||
RMBS ........................................................... |
$7,947 |
Discounted cash
flows
|
Constant prepayment rate |
40% |
— |
||
Loss severity |
90% |
— |
|||||
Discount rate/yield |
18% |
— |
|||||
Other ABS ................................................... |
$152,664 |
Discounted cash
flows
|
Discount rate/yield |
10% |
- |
29% |
19% |
Cumulative loss rate |
11% |
- |
34% |
17% |
|||
Duration (years) |
0.6 |
- |
1.2 |
1.0 |
|||
Market approach |
Price |
$114 |
- |
$135 |
$122 |
||
Scenario analysis |
Estimated recovery percentage |
83% |
— |
||||
Loans and other receivables ................... |
$92,168 |
Market approach |
Price |
$8 |
- |
$114 |
$92 |
Scenario analysis |
Estimated recovery percentage |
17% |
- |
251% |
91% |
||
Derivatives .................................................. |
$4,701 |
||||||
Embedded options |
Market approach |
Basis points upfront |
0.3 |
— |
|||
Investments at fair value .......................... |
$148,059 |
||||||
Private equity securities |
Market approach |
Price |
$0 |
- |
$9,133 |
$1,704 |
|
Discount rate/yield |
28% |
— |
|||||
Estimated revenue |
$29,733,947 |
— |
|||||
Financial Instruments Sold, Not Yet Purchased: |
|||||||
Derivatives .................................................. |
$40,701 |
||||||
Equity options |
Volatility
benchmarking
|
Volatility |
49% |
- |
51% |
50% |
|
Options |
Market approach |
Basis points upfront |
0.0 |
- |
23.8 |
15.6 |
|
Other secured financings ......................... |
$18,876 |
Scenario analysis |
Estimated recovery percentage |
76% |
- |
100% |
96% |
Market approach |
Price |
$112 |
- |
$117 |
$114 |
||
Long-term debt .......................................... |
$990,274 |
||||||
Structured notes |
Market approach |
Price |
$66 |
- |
$116 |
$97 |
|
20 |
Jefferies Financial Group Inc. |
November 30, 2024 | |||||||
Financial Instruments Owned |
Fair Value
(in
thousands)
|
Valuation
Technique
|
Significant Unobservable Input(s) |
Input / Range |
Weighted
Average
|
||
Corporate equity securities ..................... |
$239,364 |
||||||
Non-exchange-traded securities |
Market approach |
Price |
$0 |
- |
$486 |
$68 |
|
Corporate debt securities ........................ |
$24,931 |
Market approach |
Price |
$28 |
- |
$105 |
$74 |
CDOs and CLOs .......................................... |
$53,388 |
Discounted cash
flows
|
Constant prepayment rate |
20% |
— |
||
Constant default rate |
2% |
— |
|||||
Loss severity |
30% |
— |
|||||
Discount rate/yield |
14% |
- |
32% |
26% |
|||
Market approach |
Price |
$70 |
- |
$106 |
$94 |
||
RMBS ........................................................... |
$7,714 |
Discounted cash
flows
|
Constant prepayment rate |
20% |
— |
||
Loss severity |
10% |
— |
|||||
Discount rate/yield |
12% |
— |
|||||
Other ABS ................................................... |
$98,172 |
Discounted cash
flows
|
Discount rate/yield |
19% |
- |
30% |
25% |
Cumulative loss rate |
17% |
- |
34% |
24% |
|||
Duration (years) |
0.9 |
- |
1.0 |
0.9 |
|||
Market approach |
Price |
$106 |
- |
$127 |
$121 |
||
Scenario analysis |
Estimated recovery percentage |
92% |
— |
||||
Loans and other receivables ................... |
$152,586 |
Market approach |
Price |
$17 |
- |
$106 |
$75 |
Scenario analysis |
Estimated recovery percentage |
3% |
- |
252% |
50% |
||
Derivatives .................................................. |
$1,396 |
||||||
Embedded options |
Market approach |
Basis points upfront |
0.3 |
— |
|||
Investments at fair value .......................... |
$132,769 |
||||||
Private equity securities |
Market approach |
Price |
$1 |
- |
$8,506 |
$501 |
|
Discount rate/yield |
28% |
— |
|||||
Estimated revenue |
$29,908,372 |
— |
|||||
Financial Instruments Sold, Not Yet Purchased: |
|||||||
Loans .......................................................... |
$16,864 |
Market approach |
Price |
$17 |
- |
$100 |
$75 |
Scenario analysis |
Estimated recovery percentage |
0% |
- |
205% |
50% |
||
Derivatives .................................................. |
$25,045 |
||||||
Equity options |
Volatility
benchmarking
|
Volatility |
28% |
- |
102% |
49% |
|
Options |
Market approach |
Basis points upfront |
8.0 |
- |
22.3 |
14.9 |
|
Other secured financings ......................... |
$14,884 |
Scenario analysis |
Estimated recovery percentage |
60% |
- |
100% |
93% |
Market approach |
Price |
$117 |
— |
||||
Long-term debt .......................................... |
$821,903 |
||||||
Structured notes |
Market approach |
Price |
$61 |
- |
$122 |
$96 |
|
May 2025 Form 10-Q |
21 |
Three Months Ended
May 31,
|
Six Months Ended
May 31,
|
|||
$ in thousands |
2025 |
2024 |
2025 |
2024 |
Financial instruments owned: |
||||
Loans and other receivables (1) . |
$69,578 |
$(28,264) |
$103,854 |
$(39,691) |
Other secured financings: |
||||
Other changes in fair value (1) ... |
$(1,418) |
$— |
$(1,659) |
$(4,482) |
Long-term debt: |
||||
Changes in instrument-specific
credit risk (2) ............................
|
$28,763 |
$(13,790) |
$66,501 |
$(17,769) |
Other changes in fair value (1) ... |
13,225 |
16,367 |
27,548 |
(27,451) |
$ in thousands |
May 31,
2025
|
November 30,
2024
|
Financial instruments owned: |
||
Loans and other receivables (1) ............................... |
$1,635,461 |
$1,603,512 |
Loans and other receivables on nonaccrual
status and/or 90 days or greater past
due (1) (2) ...............................................................
|
135,253 |
132,838 |
Long-term debt ........................................................... |
266,641 |
131,107 |
Other secured financings ......................................... |
(1,200) |
459 |
22 |
Jefferies Financial Group Inc. |
May 31, 2025 (1) |
||||
Assets |
Liabilities |
|||
$ in thousands |
Fair Value |
Number of
Contracts (2)
|
Fair Value |
Number of
Contracts (2)
|
Derivatives designated as
accounting hedges:
|
||||
Interest rate contracts: |
||||
Cleared OTC ........................................ |
$1,712 |
3 |
$— |
— |
Foreign exchange contracts: |
||||
Bilateral OTC ....................................... |
1,862 |
1 |
55,950 |
3 |
Total derivatives designated as
accounting hedges ............................
|
3,574 |
55,950 |
||
Derivatives not designated as
accounting hedges:
|
||||
Interest rate contracts: |
||||
Exchange-traded ................................ |
536 |
46,274 |
— |
23,687 |
Cleared OTC ........................................ |
329,900 |
7,826 |
331,751 |
8,253 |
Bilateral OTC ....................................... |
329,124 |
1,167 |
682,976 |
1,365 |
Foreign exchange contracts: |
||||
Bilateral OTC ....................................... |
161,844 |
37,567 |
136,950 |
12,957 |
Equity contracts: |
||||
Exchange-traded ................................ |
1,815,569 |
2,837,638 |
1,023,820 |
1,617,971 |
Bilateral OTC ....................................... |
1,293,083 |
34,451 |
1,521,811 |
32,884 |
Commodity contracts: |
||||
Exchange-traded ................................ |
1 |
903 |
234 |
823 |
Bilateral OTC ....................................... |
4,252 |
9,900 |
1,475 |
4,372 |
Credit contracts: |
||||
Cleared OTC ........................................ |
1,493 |
52 |
10,827 |
6 |
Bilateral OTC ....................................... |
64,928 |
9 |
44,410 |
23 |
Total derivatives not designated
as accounting hedges .......................
|
4,000,730 |
3,754,254 |
||
Total gross derivative assets/
liabilities:
|
||||
Exchange-traded ................................ |
1,816,106 |
1,024,054 |
||
Cleared OTC ........................................ |
333,105 |
342,578 |
||
Bilateral OTC ....................................... |
1,855,093 |
2,443,572 |
||
Amounts offset in our
Consolidated Statements of
Financial Condition (3):
|
||||
Exchange-traded ................................ |
(981,970) |
(981,970) |
||
Cleared OTC ........................................ |
(330,271) |
(339,425) |
||
Bilateral OTC ....................................... |
(1,403,577) |
(1,766,083) |
||
Net amounts per Consolidated
Statements of Financial
Condition (4) .................................
|
$1,288,486 |
$722,726 |
||
May 2025 Form 10-Q |
23 |
November 30, 2024 (1) |
||||
Assets |
Liabilities |
|||
$ in thousands |
Fair Value |
Number of
Contracts (2)
|
Fair Value |
Number of
Contracts (2)
|
Derivatives designated as
accounting hedges:
|
||||
Interest rate contracts: |
||||
Cleared OTC ......................................... |
$3,396 |
3 |
$— |
— |
Foreign exchange contracts: |
||||
Bilateral OTC ........................................ |
41,903 |
3 |
— |
— |
Total derivatives designated as
accounting hedges .............................
|
45,299 |
— |
||
Derivatives not designated as
accounting hedges:
|
||||
Interest rate contracts: |
||||
Exchange-traded ................................. |
273 |
16,548 |
13 |
32,984 |
Cleared OTC ......................................... |
1,030,842 |
6,663 |
1,030,671 |
6,891 |
Bilateral OTC ........................................ |
365,678 |
1,096 |
717,255 |
1,256 |
Foreign exchange contracts: |
||||
Bilateral OTC ........................................ |
132,240 |
57,786 |
138,608 |
35,545 |
Equity contracts: |
||||
Exchange-traded ................................. |
682,327 |
1,777,822 |
521,889 |
1,574,498 |
Bilateral OTC ........................................ |
855,169 |
33,516 |
1,024,129 |
20,587 |
Commodity contracts: |
||||
Exchange-traded ................................. |
22 |
806 |
17 |
697 |
Bilateral OTC ....................................... |
4,570 |
11,691 |
1,381 |
5,180 |
Credit contracts: |
||||
Cleared OTC ......................................... |
31,488 |
66 |
38,711 |
32 |
Bilateral OTC ........................................ |
37,618 |
16 |
31,353 |
32 |
Total derivatives not designated as
accounting hedges .............................
|
3,140,227 |
3,504,027 |
||
Total gross derivative assets/
liabilities:
|
||||
Exchange-traded ................................. |
682,622 |
521,919 |
||
Cleared OTC ......................................... |
1,065,726 |
1,069,382 |
||
Bilateral OTC ........................................ |
1,437,178 |
1,912,726 |
||
Amounts offset in our
Consolidated Statements of
Financial Condition (3):
|
||||
Exchange-traded ................................. |
(476,364) |
(476,364) |
||
Cleared OTC ......................................... |
(1,058,995) |
(1,066,232) |
||
Bilateral OTC ........................................ |
(1,132,392) |
(1,251,117) |
||
Net amounts per Consolidated
Statements of Financial
Condition (4) ..................................
|
$517,775 |
$710,314 |
||
$ in thousands |
Three Months Ended
May 31,
|
Six Months Ended
May 31,
|
||
Gains (Losses) |
2025 |
2024 |
2025 |
2024 |
Interest rate swaps (1) .................. |
$(415) |
$(26,253) |
$(6,043) |
$(30,811) |
Long-term debt ............................... |
(11,968) |
10,282 |
(18,659) |
(985) |
Total ................................................. |
$(12,383) |
$(15,971) |
$(24,702) |
$(31,796) |
$ in thousands |
Three Months Ended
May 31,
|
Six Months Ended
May 31,
|
||
Gains (Losses) |
2025 |
2024 |
2025 |
2024 |
Foreign exchange contracts ......... |
$(90,986) |
$(10,925) |
$(74,132) |
$(8,808) |
Total ................................................. |
$(90,986) |
$(10,925) |
$(74,132) |
$(8,808) |
$ in thousands |
Three Months Ended
May 31,
|
Six Months Ended
May 31,
|
||
Gains (Losses) |
2025 |
2024 |
2025 |
2024 |
Interest rate contracts ................... |
$(8,710) |
$36,783 |
$(31,212) |
$58,505 |
Foreign exchange contracts ......... |
21,645 |
42,363 |
16,770 |
32,529 |
Equity contracts .............................. |
823,950 |
50,298 |
1,318,166 |
(259,358) |
Commodity contracts .................... |
7,723 |
14,332 |
13,457 |
18,432 |
Credit contracts .............................. |
653 |
(8,769) |
1,704 |
(13,342) |
Total ................................................. |
$845,261 |
$135,007 |
$1,318,885 |
$(163,234) |
24 |
Jefferies Financial Group Inc. |
OTC Derivative Assets (1) (2) (3) |
|||||
$ in thousands |
0 – 12
Months
|
1 – 5
Years
|
Greater
Than 5
Years
|
Cross-
Maturity
Netting
(4)
|
Total |
Commodity swaps, options and
forwards ......................................
|
$4,031 |
$— |
$— |
$— |
$4,031 |
Equity options and forwards .......... |
238,135 |
872 |
— |
(389) |
238,618 |
Credit default swaps ....................... |
— |
— |
21,592 |
(106) |
21,486 |
Total return swaps ........................... |
147,772 |
57,728 |
181 |
(2,269) |
203,412 |
Foreign currency forwards, swaps
and options .................................
|
68,897 |
992 |
— |
— |
69,889 |
Fixed income forwards ................... |
42,666 |
— |
— |
— |
42,666 |
Interest rate swaps, options and
forwards ......................................
|
52,418 |
142,873 |
32,691 |
(31,415) |
196,567 |
Total ................................................... |
$553,919 |
$202,465 |
$54,464 |
$(34,179) |
776,669 |
Cross-product counterparty
netting ..........................................
|
(37,916) |
||||
Total OTC derivative assets
included in Financial
instruments owned ....................
|
$738,753 |
||||
OTC Derivative Liabilities (1) (2) (3) |
|||||
$ in thousands |
0 – 12
Months
|
1 – 5
Years
|
Greater
Than 5
Years
|
Cross-
Maturity
Netting
(4)
|
Total |
Commodity swaps, options and
forwards ......................................
|
$1,376 |
$— |
$— |
$— |
$1,376 |
Equity options and forwards .......... |
208,093 |
88,727 |
13,726 |
(389) |
310,157 |
Credit default swaps ........................ |
714 |
753 |
9,680 |
(106) |
11,041 |
Total return swaps ........................... |
271,638 |
131,091 |
— |
(2,269) |
400,460 |
Foreign currency forwards, swaps
and options .................................
|
98,657 |
427 |
— |
— |
99,084 |
Fixed income forwards ................... |
528 |
— |
— |
— |
528 |
Interest rate swaps, options and
forwards ......................................
|
34,901 |
85,465 |
463,024 |
(31,415) |
551,975 |
Total ................................................... |
$615,907 |
$306,463 |
$486,430 |
$(34,179) |
1,374,621 |
Cross-product counterparty
netting ..........................................
|
(37,916) |
||||
Total OTC derivative liabilities
included in Financial
instruments sold, not yet
purchased ...................................
|
$1,336,705 |
||||
Counterparty credit quality (1): |
$ in thousands |
A- or higher ............................................................................................... |
$246,263 |
BBB- to BBB+ ........................................................................................... |
29,767 |
BB+ or lower ............................................................................................. |
194,209 |
Unrated ..................................................................................................... |
268,514 |
Total .......................................................................................................... |
$738,753 |
May 31, 2025 |
|||
External Credit Rating |
|||
$ in millions |
Investment
Grade
|
Non-
investment
Grade
|
Total
Notional
|
Credit protection sold: |
|||
Index credit default swaps ..................... |
$63.2 |
$743.8 |
$807.0 |
November 30, 2024 |
|||
External Credit Rating |
|||
$ in millions |
Investment
Grade
|
Non-
investment
Grade
|
Total
Notional
|
Credit protection sold: |
|||
Index credit default swaps ..................... |
$395.2 |
$553.4 |
$948.6 |
$ in millions |
May 31,
2025
|
November 30,
2024
|
Derivative instrument liabilities with credit-risk-
related contingent features ....................................
|
$197.3 |
$102.3 |
Collateral posted ........................................................... |
(105.6) |
(50.6) |
Collateral received ........................................................ |
297.8 |
296.1 |
Return of and additional collateral required in the
event of a credit rating downgrade below
investment grade (1) ...............................................
|
389.5 |
347.8 |
May 2025 Form 10-Q |
25 |
May 31, 2025 |
||||
$ in millions |
Securities
Lending
Arrangements
|
Repurchase
Agreements
|
Obligation to
Return
Securities
Received as
Collateral, at
Fair Value
|
Total |
Collateral Pledged: |
||||
Corporate equity
securities .....................
|
$1,555.0 |
$1,823.9 |
$— |
$3,378.9 |
Corporate debt
securities .....................
|
371.6 |
4,196.9 |
— |
4,568.5 |
Mortgage-backed and
asset-backed
securities .....................
|
— |
2,133.0 |
— |
2,133.0 |
U.S. government and
federal agency
securities .....................
|
84.4 |
9,169.2 |
— |
9,253.6 |
Municipal securities ........ |
— |
467.7 |
— |
467.7 |
Sovereign obligations ..... |
30.8 |
2,061.4 |
51.0 |
2,143.2 |
Loans and other
receivables ..................
|
— |
692.9 |
— |
692.9 |
Total .................................. |
$2,041.8 |
$20,545.0 |
$51.0 |
$22,637.8 |
November 30, 2024 |
||||
$ in millions |
Securities
Lending
Arrangements
|
Repurchase
Agreements
|
Obligation to
Return
Securities
Received as
Collateral, at
Fair Value
|
Total |
Collateral Pledged: |
||||
Corporate equity
securities .....................
|
$2,059.8 |
$1,394.2 |
$3.9 |
$3,457.8 |
Corporate debt
securities .....................
|
416.4 |
4,522.5 |
— |
4,938.9 |
Mortgage-backed and
asset-backed
securities .....................
|
— |
2,384.8 |
— |
2,384.8 |
U.S. government and
federal agency
securities .....................
|
30.9 |
6,837.1 |
— |
6,868.0 |
Municipal securities ........ |
— |
212.1 |
— |
212.1 |
Sovereign obligations ..... |
33.7 |
1,981.0 |
181.7 |
2,196.4 |
Loans and other
receivables ..................
|
— |
757.4 |
— |
757.4 |
Total .................................. |
$2,540.9 |
$18,088.9 |
$185.6 |
$20,815.4 |
May 31, 2025 |
|||||
$ in millions |
Overnight
and
Continuous
|
Up to 30
Days
|
31-90
Days
|
Greater
than 90
Days
|
Total |
Securities lending
arrangements ..............
|
$1,474.5 |
$76.1 |
$195.0 |
$296.2 |
$2,041.8 |
Repurchase agreements . |
2,431.4 |
10,216.6 |
3,879.2 |
4,017.8 |
20,545.0 |
Obligation to return
securities received as
collateral, at fair
value .............................
|
51.0 |
— |
— |
— |
51.0 |
Total ................................... |
$3,956.9 |
$10,292.7 |
$4,074.2 |
$4,314.0 |
$22,637.8 |
November 30, 2024 |
|||||
$ in millions |
Overnight
and
Continuous
|
Up to 30
Days
|
31-90
Days
|
Greater
than 90
Days
|
Total |
Securities lending
arrangements ..............
|
$1,617.8 |
$154.3 |
$250.4 |
$518.4 |
$2,540.9 |
Repurchase agreements . |
2,258.1 |
7,055.1 |
4,182.8 |
4,592.9 |
18,088.9 |
Obligation to return
securities received as
collateral, at fair
value .............................
|
185.6 |
— |
— |
— |
185.6 |
Total ................................... |
$4,061.5 |
$7,209.4 |
$4,433.2 |
$5,111.2 |
$20,815.4 |
26 |
Jefferies Financial Group Inc. |
May 31, 2025 |
||||||
$ in millions |
Gross
Amounts
|
Netting in
Consolidated
Statements
of Financial
Condition
|
Net Amounts in
Consolidated
Statements of
Financial
Condition
|
Additional
Amounts
Available for
Setoff (1)
|
Available
Collateral (2)
|
Net
Amount (3)
|
Assets: |
||||||
Securities borrowing arrangements ................................... |
$7,844.8 |
$— |
$7,844.8 |
$(585.4) |
$(1,769.1) |
$5,490.3 |
Reverse repurchase agreements ......................................... |
15,872.4 |
(8,387.4) |
7,485.0 |
(1,479.4) |
(5,919.8) |
85.8 |
Securities received as collateral, at fair value ................... |
51.0 |
— |
51.0 |
— |
(51.0) |
— |
Liabilities: |
||||||
Securities lending arrangements ........................................ |
$2,041.8 |
$— |
$2,041.8 |
$(585.4) |
$(1,408.1) |
$48.3 |
Repurchase agreements ....................................................... |
20,545.0 |
(8,387.4) |
12,157.6 |
(1,479.4) |
(10,039.6) |
638.6 |
Obligation to return securities received as collateral, at
fair value .............................................................................
|
51.0 |
— |
51.0 |
— |
(51.0) |
— |
November 30, 2024 |
||||||
$ in millions |
Gross
Amounts
|
Netting in
Consolidated
Statements
of Financial
Condition
|
Net Amounts in
Consolidated
Statements of
Financial
Condition
|
Additional
Amounts
Available for
Setoff (1)
|
Available
Collateral (2)
|
Net
Amount (4)
|
Assets: |
||||||
Securities borrowing arrangements ................................... |
$7,213.4 |
$— |
$7,213.4 |
$(325.4) |
$(1,537.3) |
$5,350.7 |
Reverse repurchase agreements ......................................... |
11,930.7 |
(5,751.0) |
6,179.7 |
(1,475.9) |
(4,574.0) |
129.8 |
Securities received as collateral, at fair value ................... |
185.6 |
— |
185.6 |
— |
(185.6) |
— |
Liabilities: |
||||||
Securities lending arrangements ........................................ |
$2,540.9 |
$— |
$2,540.9 |
$(325.4) |
$(2,091.4) |
$124.1 |
Repurchase agreements ....................................................... |
18,088.9 |
(5,751.0) |
12,337.9 |
(1,475.9) |
(10,274.6) |
587.4 |
Obligation to return securities received as collateral, at
fair value .............................................................................
|
185.6 |
— |
185.6 |
— |
(185.6) |
— |
May 2025 Form 10-Q |
27 |
$ in millions |
May 31,
2025
|
November 30,
2024
|
Cash and securities segregated and on
deposit for regulatory purposes or
deposited with clearing and depository
organizations ..................................................
|
$1,051.3 |
$1,132.6 |
Three Months Ended
May 31,
|
Six Months Ended
May 31,
|
|||
$ in millions |
2025 |
2024 |
2025 |
2024 |
Transferred assets ..................... |
$2,591.4 |
$1,910.0 |
$2,633.4 |
$3,412.0 |
Proceeds on new
securitizations .......................
|
2,591.4 |
1,910.0 |
2,633.4 |
3,412.0 |
Cash flows received on
retained interests ..................
|
6.5 |
9.0 |
11.1 |
19.1 |
$ in millions |
May 31, 2025 |
November 30, 2024 |
||
Securitization Type |
Total
Assets
|
Retained
Interests
|
Total
Assets
|
Retained
Interests
|
U.S. government agency RMBS ... |
$2,045.0 |
$18.6 |
$3,956.8 |
$105.7 |
U.S. government agency CMBS ... |
1,345.2 |
48.0 |
1,817.1 |
91.8 |
CLOs ................................................. |
10,416.7 |
60.2 |
9,001.9 |
37.2 |
Consumer and other loans ........... |
1,674.3 |
58.7 |
1,424.4 |
52.1 |
28 |
Jefferies Financial Group Inc. |
May 31, 2025 (1) |
||
$ in millions |
Secured
Funding
Vehicles
|
Other |
Cash ................................................................................... |
$— |
$16.8 |
Financial instruments owned ........................................ |
— |
56.6 |
Securities purchased under agreements to resell (2) |
3,336.9 |
— |
Receivables from brokers (3) ......................................... |
— |
21.3 |
Other receivables ............................................................. |
— |
3.1 |
Other assets (4) ............................................................... |
— |
88.6 |
Total assets ...................................................................... |
$3,336.9 |
$186.4 |
Financial instruments sold, not yet purchased ........... |
$— |
$10.6 |
Other secured financings (5) ......................................... |
3,333.2 |
29.9 |
Other liabilities (6) ........................................................... |
5.1 |
25.9 |
Long-term debt ................................................................ |
— |
70.1 |
Total liabilities ................................................................. |
$3,338.3 |
$136.5 |
November 30, 2024 (1) |
||
$ in millions |
Secured
Funding
Vehicles
|
Other |
Cash ................................................................................... |
$— |
$1.6 |
Financial instruments owned ......................................... |
— |
40.0 |
Securities purchased under agreements to resell (2) |
2,829.7 |
— |
Receivables from brokers (3) ......................................... |
— |
23.5 |
Other receivables ............................................................. |
— |
3.0 |
Other assets (4) ............................................................... |
— |
90.3 |
Total assets ...................................................................... |
$2,829.7 |
$158.4 |
Financial instruments sold, not yet purchased ........... |
$— |
$7.6 |
Other secured financings (5) ......................................... |
2,823.0 |
26.1 |
Other liabilities (6) ........................................................... |
6.7 |
23.1 |
Long-term debt ................................................................ |
— |
70.1 |
Total liabilities ................................................................. |
$2,829.7 |
$126.9 |
May 2025 Form 10-Q |
29 |
May 31, 2025 |
||||
Carrying Amount |
Maximum
Exposure to
Loss
|
VIE Assets |
||
$ in millions |
Assets |
Liabilities |
||
CLOs ...................................... |
$969.6 |
$42.2 |
$4,843.7 |
$15,080.2 |
Asset-backed vehicles ........ |
734.3 |
— |
994.9 |
3,601.2 |
Related party private equity
vehicles ............................
|
3.4 |
— |
15.0 |
40.7 |
Other investment vehicles .. |
1,385.4 |
— |
1,606.3 |
30,032.9 |
Total ....................................... |
$3,092.7 |
$42.2 |
$7,459.9 |
$48,755.0 |
November 30, 2024 |
||||
Carrying Amount |
Maximum
Exposure to
Loss
|
VIE Assets |
||
$ in millions |
Assets |
Liabilities |
||
CLOs ...................................... |
951.8 |
$26.5 |
$6,511.1 |
$14,872.4 |
Asset-backed vehicles ........ |
827.4 |
— |
946.3 |
4,266.7 |
Related party private equity
vehicles ............................
|
3.7 |
— |
14.0 |
34.4 |
Other investment vehicles .. |
1,107.8 |
— |
1,365.8 |
19,064.1 |
Total ....................................... |
$2,890.7 |
$26.5 |
$8,837.2 |
$38,237.6 |
30 |
Jefferies Financial Group Inc. |
$ in millions |
May 31,
2025
|
November 30,
2024
|
Total Investments in and loans to related
parties ........................................................
|
$1,436.6 |
$1,385.7 |
Three Months Ended
May 31,
|
Six Months Ended
May 31,
|
|||
$ in millions |
2025 |
2024 |
2025 |
2024 |
Total equity method pickup
earnings recognized in Other
revenues ...................................
|
$8.1 |
$28.5 |
$15.2 |
$37.2 |
Three Months Ended
May 31,
|
Six Months Ended
May 31,
|
|||
$ in millions |
2025 |
2024 |
2025 |
2024 |
Unfunded commitment fees ......... |
$0.3 |
$0.3 |
0.6 |
0.6 |
$ in millions |
May 31,
2025
|
November 30,
2024
|
Total assets .................................................... |
$6,073.6 |
$5,762.6 |
Total liabilities ................................................ |
4,732.8 |
4,415.6 |
Total mezzanine equity ................................. |
13.9 |
14.4 |
$ in millions |
May 31,
2025
|
November 30,
2024
|
Our total investment balance ....................... |
$663.5 |
$666.3 |
Three Months Ended
May 31,
|
Six Months Ended
May 31,
|
|||
$ in millions |
2025 |
2024 |
2025 |
2024 |
Net earnings (losses)
attributable to members ..........
|
$0.1 |
$40.2 |
$(1.6) |
$39.3 |
May 2025 Form 10-Q |
31 |
Three Months Ended
May 31,
|
Six Months Ended
May 31,
|
|||
$ in millions |
2025 |
2024 |
2025 |
2024 |
Origination and syndication fee
revenues (1) ............................
|
$58.4 |
$74.9 |
$118.6 |
$127.3 |
Origination fee expenses (1) ..... |
13.9 |
9.7 |
32.4 |
24.6 |
CLO placement and structuring
fee revenues (2) ....................
|
1.3 |
0.3 |
1.5 |
0.3 |
Placement and referral fees (3) |
9.4 |
0.4 |
10.0 |
0.9 |
Asset management fee
revenues (4) .............................
|
7.5 |
— |
7.5 |
— |
Service fee revenues (5) ............. |
22.7 |
20.8 |
77.1 |
65.7 |
$ in millions |
May 31,
2025
|
November 30,
2024
|
Total assets ................................................... |
$4,914.9 |
$4,963.2 |
Total liabilities ............................................... |
3,557.0 |
3,515.6 |
Total noncontrolling interest ....................... |
391.8 |
502.1 |
$ in millions |
May 31,
2025
|
November 30,
2024
|
Our total investment balance ....................... |
$437.7 |
$427.7 |
Three Months Ended
May 31,
|
Six Months Ended
May 31,
|
|||
$ in millions |
2025 |
2024 |
2025 |
2024 |
Net earnings attributable to
members ....................................
|
$44.2 |
$48.9 |
$82.0 |
$78.2 |
Three Months Ended
May 31,
|
Six Months Ended
May 31,
|
|||
$ in millions |
2025 |
2024 |
2025 |
2024 |
Distributions .................................... |
$10.9 |
$2.9 |
$27.0 |
$6.7 |
$ in millions |
May 31,
2025
|
November 30,
2024
|
Total assets .................................................... |
$316.2 |
$326.0 |
Total liabilities ................................................ |
476.5 |
484.7 |
May 31,
2025
|
November 30,
2024
|
|
Our total investment balance ....................... |
$98.0 |
$97.8 |
Three Months Ended
May 31,
|
Six Months Ended
May 31,
|
|||
$ in millions |
2025 |
2024 |
2025 |
2024 |
Net earnings (losses) .................... |
$(3.3) |
$(2.4) |
$1.3 |
$0.1 |
32 |
Jefferies Financial Group Inc. |
Three Months Ended
May 31,
|
Six Months Ended May
31,
|
|||
$ in millions |
2025 |
2024 |
2025 |
2024 |
Distributions we received
from Brooklyn Renaissance
Office .......................................
|
$1.2 |
$— |
$1.2 |
$— |
Three Months Ended
May 31,
|
Six Months Ended
May 31,
|
|||
$ in millions |
2025 |
2024 |
2025 |
2024 |
Net gains (losses) from our
investments in JCP Fund V .....
|
$— |
$0.1 |
$(0.2) |
$(0.2) |
Three Months Ended |
||||
$ in millions |
March 31,
2025
|
December 31,
2024
|
March 31,
2024
|
December 31,
2023
|
Net increase (decrease)
in net assets resulting
from operations (1) .....
|
$0.1 |
$(0.6) |
$0.1 |
$(0.9) |
$ in millions |
March 31,
2025 (1)
|
September 30,
2024 (1)
|
Total assets ............................................................... |
$447.9 |
$304.2 |
Total liabilities ........................................................... |
0.1 |
0.2 |
Total members’ equity ............................................. |
447.8 |
304.0 |
Three Months Ended (1) |
||
$ in millions |
March 31,
2025
|
December 31,
2024
|
Net increase in members’ equity resulting from
operations ................................................................
|
$27.5 |
$8.4 |
Three Months Ended
May 31,
|
Six Months Ended
May 31,
|
|||
$ in millions |
2025 |
2024 |
2025 |
2024 |
Operating lease income ................ |
$1.3 |
$5.6 |
$6.9 |
$9.4 |
May 2025 Form 10-Q |
33 |
Three Months Ended
May 31,
|
Six Months Ended
May 31,
|
|||
$ in thousands |
2025 |
2024 |
2025 |
2024 |
Beginning balance ............... |
$2,046 |
$2,963 |
$5,277 |
$6,306 |
Bad debt expense ................ |
1,472 |
1,077 |
2,818 |
2,088 |
Charge-offs ........................... |
— |
(219) |
(3,076) |
(2,719) |
Recoveries collected ........... |
(1,203) |
(953) |
(2,704) |
(2,807) |
Ending balance (1) ............... |
$2,315 |
$2,868 |
$2,315 |
$2,868 |
Six Months Ended May 31, 2025 |
|||
$ in thousands |
Investment
Banking and
Capital
Markets
|
Asset
Management
|
Total |
Balance, at beginning of period ................... |
$1,533,013 |
$294,925 |
$1,827,938 |
Currency translation and other
adjustments ..............................................
|
4,457 |
7,917 |
12,374 |
Measurement period adjustments (1) ........ |
— |
1,802 |
1,802 |
Balance, at end of period ............................. |
$1,537,470 |
$304,644 |
$1,842,114 |
Six Months Ended May 31, 2024 |
|||
$ in thousands |
Investment
Banking and
Capital
Markets
|
Asset
Management
|
Total |
Balance, at beginning of period ................... |
$1,532,172 |
$315,684 |
$1,847,856 |
Currency translation and other
adjustments ..............................................
|
357 |
(424) |
(67) |
Measurement period adjustments (1) ........ |
— |
(28,346) |
(28,346) |
Goodwill relating to acquisitions by
Tessellis .....................................................
|
— |
3,366 |
3,366 |
Balance, at end of period ............................. |
$1,532,529 |
$290,280 |
$1,822,809 |
$ in millions |
May 31,
2025
|
November 30,
2024
|
Investment banking .............................................................. |
$702.7 |
$700.7 |
Equities and wealth management ...................................... |
256.1 |
255.4 |
Fixed income ......................................................................... |
578.5 |
576.9 |
Asset management .............................................................. |
143.0 |
143.0 |
Other investments ................................................................. |
161.8 |
151.9 |
Total ........................................................................................ |
$1,842.1 |
$1,827.9 |
34 |
Jefferies Financial Group Inc. |
May 31, 2025 |
Weighted
Average
Remaining
Lives
(Years)
|
||||
$ in thousands |
Gross
Cost
|
Assets
Acquired
|
Accumulated
Amortization
|
Net
Carrying
Amount
|
|
Customer relationships ....................... |
$165,820 |
$622 |
$(111,235) |
$55,207 |
5.2 |
Trademarks and trade names ............ |
160,291 |
— |
(52,338) |
107,953 |
21.0 |
Exchange and clearing organization
membership interests and
registrations ..........................................
|
8,793 |
— |
— |
8,793 |
N/A |
Other ...................................................... |
85,295 |
99 |
(39,442) |
45,952 |
3.6 |
Total ....................................................... |
$420,199 |
$721 |
$(203,015) |
$217,905 |
|
November 30, 2024 |
Weighted
Average
Remaining
Lives
(Years)
|
|||||
$ in thousands |
Gross
Cost
|
Assets
Acquired
(1)
|
Impairment
Losses
|
Accumulated
Amortization
|
Net
Carrying
Amount
|
|
Customer relationships |
$136,049 |
$26,450 |
$— |
$(104,539) |
$57,960 |
5.6 |
Trademarks and trade
names ..............................
|
146,032 |
8,533 |
— |
(45,412) |
109,153 |
21.4 |
Exchange and clearing
organization
membership interests
and registrations ............
|
8,715 |
— |
(10) |
— |
8,705 |
N/A |
Other ................................ |
50,930 |
26,316 |
— |
(26,693) |
50,553 |
3.9 |
Total ................................ |
$341,726 |
$61,299 |
$(10) |
$(176,644) |
$226,371 |
|
Remainder of fiscal year 2025 ................................................................ |
$16,934 |
Year ending November 30, 2026 ............................................................ |
32,937 |
Year ending November 30, 2027 ............................................................ |
29,370 |
Year ending November 30, 2028 ............................................................ |
28,087 |
Year ending November 30, 2029 ............................................................ |
16,051 |
Three Months Ended
May 31,
|
Six Months Ended
May 31,
|
|||
$ in thousands |
2025 |
2024 |
2025 |
2024 |
Revenues from
contracts with
customers:
|
||||
Investment banking .......... |
$785,455 |
$738,584 |
$1,511,116 |
$1,417,649 |
Commissions and other
fees ....................................
|
344,184 |
271,782 |
632,149 |
517,325 |
Asset management fees . |
7,495 |
6,989 |
53,303 |
36,350 |
Real estate revenues ........ |
16,211 |
3,540 |
27,292 |
6,689 |
Internet connection and
broadband revenues
(1) ..................................
|
56,668 |
58,855 |
114,471 |
122,269 |
Other contracts with
customers ..........................
|
16,791 |
14,651 |
32,899 |
28,750 |
Total revenue from
contracts with
customers ....................
|
1,226,804 |
1,094,401 |
2,371,230 |
2,129,032 |
Other sources of
revenue:
|
||||
Principal transactions ...... |
338,507 |
416,195 |
745,737 |
1,056,931 |
Revenues from strategic
affiliates ........................
|
21,336 |
4,779 |
64,785 |
25,790 |
Interest ............................... |
878,025 |
879,727 |
1,723,196 |
1,699,216 |
Other (1) ............................. |
29,643 |
121,194 |
62,231 |
157,269 |
Total revenues .................. |
$2,494,315 |
$2,516,296 |
$4,967,179 |
$5,068,238 |
Three Months Ended May 31, 2025 |
|||
$ in thousands |
Investment
Banking and
Capital Markets
|
Asset
Management
|
Total |
Major business activity: |
|||
Investment banking - Advisory ................ |
$457,725 |
$— |
$457,725 |
Investment banking - Underwriting ......... |
327,730 |
— |
327,730 |
Equities (1) ................................................. |
342,179 |
— |
342,179 |
Fixed income (1) ........................................ |
2,005 |
— |
2,005 |
Asset management ................................... |
— |
7,495 |
7,495 |
Other investments ..................................... |
— |
89,670 |
89,670 |
Total ............................................................ |
$1,129,639 |
$97,165 |
$1,226,804 |
Primary geographic region: |
|||
Americas ..................................................... |
$788,139 |
$38,522 |
$826,661 |
Europe and the Middle East ..................... |
238,528 |
57,695 |
296,223 |
Asia-Pacific ................................................ |
102,972 |
948 |
103,920 |
Total ............................................................ |
$1,129,639 |
$97,165 |
$1,226,804 |
May 2025 Form 10-Q |
35 |
Three Months Ended May 31, 2024 |
|||
$ in thousands |
Investment
Banking and
Capital Markets
|
Asset
Management
|
Total |
Major business activity: |
|||
Investment banking - Advisory ................ |
$283,898 |
$— |
$283,898 |
Investment banking - Underwriting ......... |
454,686 |
— |
454,686 |
Equities (1) ................................................. |
269,189 |
— |
269,189 |
Fixed income (1) ........................................ |
2,120 |
— |
2,120 |
Asset management ................................... |
— |
6,989 |
6,989 |
Other investments (2) ............................... |
— |
77,519 |
77,519 |
Total ............................................................ |
$1,009,893 |
$84,508 |
$1,094,401 |
Primary geographic region: |
|||
Americas ..................................................... |
$735,377 |
$23,568 |
$758,945 |
Europe and the Middle East (2) ............... |
169,344 |
59,901 |
229,245 |
Asia-Pacific ................................................ |
105,172 |
1,039 |
106,211 |
Total ............................................................ |
$1,009,893 |
$84,508 |
$1,094,401 |
Six Months Ended May 31, 2025 |
|||
$ in thousands |
Investment
Banking and
Capital Markets
|
Asset
Management
|
Total |
Major business activity: |
|||
Investment banking - Advisory ................ |
$855,505 |
$— |
$855,505 |
Investment banking - Underwriting ......... |
655,611 |
— |
655,611 |
Equities (1) ................................................. |
628,229 |
— |
628,229 |
Fixed income (1) ........................................ |
3,920 |
— |
3,920 |
Asset management ................................... |
— |
53,303 |
53,303 |
Other investments ..................................... |
— |
174,662 |
174,662 |
Total ............................................................ |
$2,143,265 |
$227,965 |
$2,371,230 |
Primary geographic region: |
|||
Americas ..................................................... |
$1,536,814 |
$109,593 |
$1,646,407 |
Europe and the Middle East ..................... |
411,649 |
116,488 |
528,137 |
Asia-Pacific ................................................ |
194,802 |
1,884 |
196,686 |
Total ............................................................ |
$2,143,265 |
$227,965 |
$2,371,230 |
Six Months Ended May 31, 2024 |
|||
$ in thousands |
Investment
Banking and
Capital Markets
|
Asset
Management
|
Total |
Major business activity: |
|||
Investment banking - Advisory ................ |
$622,466 |
$— |
$622,466 |
Investment banking - Underwriting ......... |
795,183 |
— |
795,183 |
Equities (1) ................................................. |
511,765 |
— |
511,765 |
Fixed income (1) ........................................ |
4,550 |
— |
4,550 |
Asset management ................................... |
— |
36,350 |
36,350 |
Other investments (2) ............................... |
— |
158,718 |
158,718 |
Total ............................................................ |
$1,933,964 |
$195,068 |
$2,129,032 |
Primary geographic region: |
|||
Americas ..................................................... |
$1,465,754 |
$68,767 |
$1,534,521 |
Europe and the Middle East (2) ............... |
295,346 |
124,421 |
419,767 |
Asia-Pacific ................................................ |
172,864 |
1,880 |
174,744 |
Total ............................................................ |
$1,933,964 |
$195,068 |
$2,129,032 |
36 |
Jefferies Financial Group Inc. |
$ in millions |
Grant Terms |
RSUs |
|
Aggregate grant date fair value ...................................... |
$18.0 |
Vesting period ................................................................... |
3-year cliff |
PSUs |
|
Aggregate target fair value .............................................. |
$18.0 |
Service period .................................................................... |
3 years |
Performance period .......................................................... |
Fiscal 2024 to Fiscal 2026 |
Performance target (1) .................................................... |
10% ROTE |
Performance range (2) ..................................................... |
7.5% - 15% ROTE |
Three Months Ended
May 31,
|
Six Months Ended
May 31,
|
|||
$ in millions |
2025 |
2024 |
2025 |
2024 |
Restricted cash awards |
$131.5 |
$104.2 |
$246.6 |
$212.1 |
Restricted stock and
RSUs (1) .....................
|
18.2 |
14.4 |
53.8 |
34.6 |
Profit sharing plan ......... |
1.9 |
2.2 |
9.3 |
9.1 |
Total compensation
cost .............................
|
$151.6 |
$120.8 |
$309.7 |
$255.8 |
$ in millions |
Remaining
Unamortized
Amounts
|
Weighted Average
Vesting Period
(in Years)
|
Non-vested share-based awards .............. |
$126.1 |
2.6 |
Restricted cash awards (1) ........................ |
1,050.5 |
2.8 |
Total .............................................................. |
$1,176.6 |
$ in thousands |
May 31, 2025 |
November 30,
2024
|
Bank loans and other credit facilities ........................ |
$615,770 |
$443,160 |
Fixed rate callable note ............................................... |
699,333 |
— |
Total short-term borrowings (1) ............................... |
$1,315,103 |
$443,160 |
May 2025 Form 10-Q |
37 |
$ in thousands |
Maturity (Fiscal Years) |
May 31, 2025 |
November 30, 2024 |
Parent Co. unsecured borrowings |
|||
Fixed rate |
2025 |
6,203 |
519,738 |
2026 |
1,304,514 |
818,819 |
|
2027 |
1,165,138 |
587,631 |
|
2028 |
1,098,720 |
1,031,076 |
|
2029 |
664,938 |
742,427 |
|
2030 and Later |
5,697,602 |
4,561,814 |
|
Variable rate |
2025 |
350,000 |
— |
2026 |
44,277 |
41,230 |
|
2027 |
— |
570,432 |
|
2029 |
1,312 |
1,311 |
|
2030 and Later |
71,916 |
850,273 |
|
Structured notes (1) |
2025 |
81,836 |
157,638 |
2026 |
139,700 |
114,308 |
|
2027 |
100,865 |
97,758 |
|
2028 |
143,633 |
77,781 |
|
2029 |
267,167 |
316,139 |
|
2030 and Later |
2,000,286 |
1,587,721 |
|
Total Parent Co. unsecured borrowings (2) .......................................................................................................................................... |
13,138,107 |
12,076,096 |
|
Subsidiaries secured borrowings |
|||
Fixed rate |
2025 |
163,529 |
160,384 |
2026 |
26,042 |
42,643 |
|
2027 |
34,799 |
13,077 |
|
2028 |
86,375 |
35,135 |
|
2029 |
132,230 |
104,912 |
|
Variable rate |
2026 |
865,770 |
792,400 |
2027 |
274,254 |
274,026 |
|
Structured note (1) ....................................................................................................................................... |
2028 |
571,030 |
— |
Total Subsidiaries secured borrowings ................................................................................................................................................. |
2,154,029 |
1,422,577 |
|
Subsidiaries unsecured borrowings |
|||
Fixed rate |
2029 |
4,015 |
4,310 |
2030 and Later |
1,606 |
1,347 |
|
Variable rate |
2026 |
— |
26,235 |
2027 |
54,210 |
— |
|
Total Subsidiaries unsecured borrowings ............................................................................................................................................. |
59,831 |
31,892 |
|
Total long-term debt (3) .......................................................................................................................................................................... |
$15,351,967 |
$13,530,565 |
|
Fair value .................................................................................................................................................................................................... |
$15,386,322 |
$13,734,421 |
|
Weighted-average interest rate (4) ....................................................................................................................................................... |
5.27% |
5.30% |
|
Interest rate range (4) .............................................................................................................................................................................. |
0.00% - 7.52% |
0.00% - 7.66% |
|
38 |
Jefferies Financial Group Inc. |
May 2025 Form 10-Q |
39 |
Three Months Ended
May 31,
|
Six Months Ended
May 31,
|
|||
In thousands, except per share amounts |
2025 |
2024 |
2025 |
2024 |
Numerator for earnings per common share from continuing operations: |
||||
Net earnings from continuing operations ......................................................................................................... |
$91,395 |
$154,647 |
$228,244 |
$318,930 |
Less: Net losses attributable to noncontrolling interests ............................................................................... |
(7,668) |
(3,785) |
(14,651) |
(10,237) |
Allocation of earnings to participating securities (1) ...................................................................................... |
(11,046) |
(13,741) |
(26,940) |
(27,930) |
Net earnings from continuing operations attributable to common shareholders for basic earnings
per share ...........................................................................................................................................................
|
$88,017 |
$144,691 |
$215,955 |
$301,237 |
Net earnings from continuing operations attributable to common shareholders for diluted earnings
per share ...........................................................................................................................................................
|
$88,017 |
$144,691 |
$215,955 |
$301,237 |
Numerator for earnings per common share from discontinued operations: |
||||
Net earnings (losses) from discontinued operations, net of taxes ............................................................... |
— |
40 |
— |
(7,851) |
Less: Net losses attributable to noncontrolling interests ............................................................................... |
— |
(1,005) |
— |
(1,991) |
Net earnings (losses) from discontinued operations attributable to common shareholders for basic
and diluted earnings per share ......................................................................................................................
|
$— |
$1,045 |
$— |
$(5,860) |
Net earnings attributable to common shareholders for basic earnings per share ................................... |
$88,017 |
$145,736 |
$215,955 |
$295,377 |
Net earnings attributable to common shareholders for diluted earnings per share ................................ |
$88,017 |
$145,736 |
$215,955 |
$295,377 |
Denominator for earnings per common share: |
||||
Weighted average common shares outstanding ............................................................................................. |
206,254 |
212,039 |
206,150 |
211,787 |
Weighted average shares of restricted stock outstanding with future service required ........................... |
(2,248) |
(2,329) |
(2,276) |
(2,366) |
Weighted average RSUs outstanding with no future service required .......................................................... |
11,091 |
10,261 |
10,944 |
10,514 |
Weighted average basic common shares ........................................................................................................ |
215,097 |
219,971 |
214,818 |
219,935 |
Stock options and other share-based awards ................................................................................................. |
4,262 |
3,470 |
4,984 |
3,124 |
Senior executive compensation plan RSU awards .......................................................................................... |
2,538 |
2,705 |
2,581 |
2,528 |
Weighted average diluted common shares (2) ............................................................................................... |
221,897 |
226,146 |
222,383 |
225,587 |
Earnings (losses) per common share: |
||||
Basic from continuing operations ...................................................................................................................... |
$0.41 |
$0.66 |
$1.01 |
$1.37 |
Basic from discontinued operations .................................................................................................................. |
— |
— |
— |
(0.03) |
Basic ....................................................................................................................................................................... |
$0.41 |
$0.66 |
$1.01 |
$1.34 |
Diluted from continuing operations .................................................................................................................... |
$0.40 |
$0.64 |
$0.97 |
$1.34 |
Diluted from discontinued operations ................................................................................................................ |
— |
— |
— |
(0.03) |
Diluted .................................................................................................................................................................... |
$0.40 |
$0.64 |
$0.97 |
$1.31 |
40 |
Jefferies Financial Group Inc. |
Six Months Ended May 31, 2025 | |||
Declaration Date |
Record Date |
Payment Date |
Per Common
Share Amount
|
January 8, 2025 |
February 14, 2025 |
February 27, 2025 |
$0.40 |
March 26, 2025 |
May 19, 2025 |
May 29, 2025 |
$0.40 |
Six Months Ended May 31, 2024 | |||
Declaration Date |
Record Date |
Payment Date |
Per Common
Share Amount
|
January 8, 2024 |
February 16, 2024 |
February 27, 2024 |
$0.30 |
March 27, 2024 |
May 20, 2024 |
May 30, 2024 |
$0.30 |
$ in thousands |
May 31, 2025 |
November 30,
2024
|
Net unrealized losses on available-for-sale
securities .......................................................................
|
$(2,244) |
$(2,406) |
Net currency translation adjustments and other ..... |
(143,174) |
(173,841) |
Net unrealized losses related to instrument-
specific credit risk .......................................................
|
(154,837) |
(206,664) |
Net minimum pension liability .................................... |
(39,440) |
(40,220) |
Total accumulated other comprehensive loss, net
of tax ..............................................................................
|
$(339,695) |
$(423,131) |
Three Months
Ended
May 31,
|
Six Months
Ended
May 31,
|
|||
$ in thousands |
2025 |
2024 |
2025 |
2024 |
Net unrealized gains (losses) on
instrument-specific credit risk at fair value
(1) ........................................................................
|
$5,121 |
$516 |
$7,658 |
$2,633 |
Amortization of defined benefit pension
plan actuarial losses (2) ..................................
|
(67) |
(90) |
(826) |
(180) |
Total reclassifications for the period, net
of tax ..................................................................
|
$5,054 |
$426 |
$6,832 |
$2,453 |
Jurisdiction |
Tax Year |
United States ........................................................................................... |
2021 |
New York State ........................................................................................ |
2001 |
New York City .......................................................................................... |
2006 |
United Kingdom ....................................................................................... |
2022 |
Germany ................................................................................................... |
2019 |
Hong Kong ............................................................................................... |
2019 |
India ........................................................................................................... |
2010 |
Three Months Ended
May 31,
|
Six Months Ended May
31,
|
|||
$ in millions |
2025 |
2024 |
2025 |
2024 |
Income tax expense .............. |
$43.5 |
$73.1 |
$57.7 |
$129.1 |
Effective tax rate .................... |
32.3% |
32.1% |
20.2% |
28.8% |
Expected Maturity Date (Fiscal Years) |
||||||
$ in millions |
2025 |
2026 |
2027
and
2028
|
2029
and
2030
|
2031
and
Later
|
Maximum
Payout
|
Equity commitments (1) ..... |
$26.9 |
$18.0 |
$76.5 |
$0.1 |
$166.3 |
$287.8 |
Loan commitments (1) ....... |
1.8 |
337.2 |
14.8 |
— |
— |
353.8 |
Loan purchase
commitments (2) .................
|
3,588.4 |
— |
— |
— |
— |
3,588.4 |
Forward starting reverse
repos (3) ...............................
|
4,342.0 |
— |
— |
— |
— |
4,342.0 |
Forward starting repos (3) . |
3,051.7 |
— |
— |
— |
— |
3,051.7 |
Other unfunded
commitments (1) .................
|
222.3 |
392.9 |
457.6 |
14.2 |
— |
1,087.0 |
Total commitments ............ |
$11,233.1 |
$748.1 |
$548.9 |
$14.3 |
$166.3 |
$12,710.7 |
May 2025 Form 10-Q |
41 |
Expected Maturity Date (Fiscal Years) |
|||||
$ in millions |
2025 |
2026 |
2027 and
2028
|
2029 and
2030
|
Notional/
Maximum
Payout
|
Guarantee Type: |
|||||
Derivative contracts—
non-credit related .........
|
$12,864.2 |
$18,190.8 |
$15,253.4 |
$1,550.0 |
$47,858.4 |
Total derivative contracts ....... |
$12,864.2 |
$18,190.8 |
$15,253.4 |
$1,550.0 |
$47,858.4 |
42 |
Jefferies Financial Group Inc. |
$ in thousands |
Net
Capital
|
Excess Net
Capital
|
Jefferies LLC ................................................................. |
$1,648,720 |
$1,510,016 |
JFSI - SEC ...................................................................... |
345,239 |
325,239 |
JFSI - CFTC ................................................................... |
345,239 |
317,560 |
May 2025 Form 10-Q |
43 |
Three Months Ended
May 31,
|
Six Months Ended
May 31,
|
|||
$ in millions |
2025 |
2024 |
2025 |
2024 |
Investment Banking and Capital
Markets:
|
||||
Net revenues |
$1,470.5 |
$1,494.4 |
$2,869.4 |
$2,945.7 |
Non-interest expenses |
1,282.2 |
1,243.1 |
2,514.3 |
2,539.4 |
Earnings from continuing operations
before income taxes
|
188.3 |
251.3 |
$355.10 |
406.3 |
Asset Management: |
||||
Net revenues |
154.6 |
156.5 |
346.3 |
429.9 |
Non-interest expenses |
217.3 |
185.6 |
427.2 |
407.3 |
Earnings (losses) from continuing
operations before income taxes
|
(62.7) |
(29.1) |
(80.9) |
22.6 |
Total of Reportable Business
Segments:
|
||||
Net revenues |
1,625.1 |
1,650.9 |
3,215.7 |
3,375.6 |
Non-interest expenses |
1,499.5 |
1,428.7 |
2,941.5 |
2,946.7 |
Earnings from continuing operations
before income taxes
|
125.6 |
222.2 |
274.2 |
428.9 |
Reconciliation to consolidated
amounts:
|
||||
Net revenues |
9.3 |
5.5 |
11.8 |
19.0 |
Earnings from continuing operations
before income taxes (1)
|
9.3 |
5.5 |
11.8 |
19.0 |
Total: |
||||
Net revenues |
1,634.4 |
1,656.4 |
3,227.5 |
3,394.6 |
Non-interest expenses |
1,499.5 |
1,428.7 |
2,941.5 |
2,946.7 |
Earnings from continuing operations
before income taxes
|
$134.9 |
$227.7 |
$286.0 |
$447.9 |
$ in millions |
May 31, 2025 |
November 30,
2024
|
Investment Banking and Capital Markets ................. |
$61,957.3 |
$59,142.9 |
Asset Management ...................................................... |
5,328.0 |
5,217.4 |
Total assets .................................................................. |
$67,285.3 |
$64,360.3 |
Three Months Ended
May 31,
|
Six Months Ended
May 31,
|
|||
$ in millions |
2025 |
2024 |
2025 |
2024 |
Americas (1) .......................................... |
$990.3 |
$1,145.3 |
$2,097.3 |
$2,453.0 |
Europe and the Middle East (2) ........... |
488.2 |
370.2 |
859.1 |
702.1 |
Asia-Pacific ............................................ |
155.9 |
140.9 |
271.1 |
239.5 |
Net revenues ......................................... |
$1,634.4 |
$1,656.4 |
$3,227.5 |
$3,394.6 |
44 |
Jefferies Financial Group Inc. |
$ in thousands |
May 31, 2025 |
November 30, 2024 |
Assets |
||
Cash and cash equivalents ............ |
$302,463 |
$542,212 |
Cash and securities segregated
and on deposit for regulatory
purposes or deposited with
clearing and depository
organizations ...............................
|
29,222 |
— |
Financial instruments owned, at
fair value .......................................
|
5,985 |
1,539 |
Securities borrowed ......................... |
3,579 |
20,403 |
Securities purchased under
agreements to resell ..................
|
379,932 |
381,568 |
Receivables: |
||
Brokers, dealers and clearing
organizations ................................
|
32,604 |
3,012 |
Fees, interest and other ............... |
5,193 |
7,851 |
Other assets ..................................... |
88 |
175 |
Total assets ...................................... |
$759,066 |
$956,760 |
Liabilities |
||
Financial instruments sold, not
yet purchased, at fair value .......
|
$2,578 |
$1,830 |
Securities loaned ............................. |
3,312 |
187 |
Securities sold under agreements
to repurchase ..............................
|
481,851 |
631,390 |
Payables: |
||
Brokers, dealers and clearing
organizations ..........................
|
9,816 |
18,701 |
Accrued expenses and other
liabilities .......................................
|
10,862 |
6,767 |
Long-term debt (1) ........................... |
350,000 |
— |
Total liabilities ................................. |
$858,419 |
$658,875 |
$ in thousands |
Three Months Ended
May 31, 2025
|
Six Months Ended
May 31, 2025
|
Revenues |
||
Investment banking ..................... |
$3,814 |
$7,663 |
Principal transactions (1) ........... |
3,197 |
(995) |
Commissions and other fees ..... |
752 |
1,401 |
Interest ........................................... |
7,117 |
14,734 |
Total revenues ............................. |
14,880 |
22,803 |
Interest expense ........................... |
10,844 |
21,716 |
Net revenues ................................ |
$4,036 |
$1,087 |
Non-interest expenses |
||
Business development ................ |
$7,117 |
$11,805 |
Other expenses ............................ |
1 |
5 |
Total non-interest expenses ...... |
$7,118 |
$11,810 |
May 2025 Form 10-Q |
45 |
Three Months Ended
May 31,
|
|||
$ in thousands |
2025 |
2024 |
% Change |
Net revenues .................................................... |
$1,634,447 |
$1,656,445 |
(1.3)% |
Non-interest expenses .................................... |
1,499,546 |
1,428,691 |
5.0% |
Earnings from continuing operations
before income taxes ........................................
|
134,901 |
227,754 |
(40.8)% |
Income tax expense from continuing
operations ..........................................................
|
43,506 |
73,107 |
(40.5)% |
Net earnings from continuing operations ..... |
91,395 |
154,647 |
(40.9)% |
Net earnings from discontinued operations,
net of income taxes .........................................
|
— |
40 |
(100.0)% |
Net losses attributable to noncontrolling
interests .............................................................
|
(7,668) |
(4,790) |
60.1% |
Preferred stock dividends ............................... |
11,046 |
13,741 |
(19.6)% |
Net earnings attributable to common
shareholders .....................................................
|
88,017 |
145,736 |
(39.6)% |
Effective tax rate from continuing
operations ........................................................
|
32.3% |
32.1% |
|
Six Months Ended
May 31,
|
|||
$ in thousands |
2025 |
2024 |
% Change |
Net revenues .................................................... |
$3,227,466 |
$3,394,648 |
(4.9)% |
Non-interest expenses .................................... |
2,941,500 |
2,946,652 |
(0.2)% |
Earnings from continuing operations
before income taxes ........................................
|
285,966 |
447,996 |
(36.2)% |
Income tax expense from continuing
operations ..........................................................
|
57,722 |
129,066 |
(55.3)% |
Net earnings from continuing operations ..... |
228,244 |
318,930 |
(28.4)% |
Net losses from discontinued operations,
net of income taxes .........................................
|
— |
(7,851) |
(100.0)% |
Net losses attributable to noncontrolling
interests .............................................................
|
(14,651) |
(12,228) |
19.8% |
Preferred stock dividends ............................... |
26,940 |
27,930 |
(3.5)% |
Net earnings attributable to common
shareholders .....................................................
|
215,955 |
295,377 |
(26.9)% |
Effective tax rate from continuing
operations ........................................................
|
20.2% |
28.8% |
|
46 |
Jefferies Financial Group Inc. |
May 2025 Form 10-Q |
47 |
Three Months Ended |
|||||
May 31, 2025 |
May 31, 2024 |
||||
$ in thousands |
Amount |
% of Net
Revenues
|
Amount |
% of Net
Revenues
|
% Change |
Advisory ............................ |
$457,860 |
28.0% |
$283,898 |
17.1% |
61.3% |
Equity underwriting .......... |
122,366 |
7.5 |
249,187 |
15.0 |
(50.9) |
Debt underwriting ............. |
205,363 |
12.6 |
205,499 |
12.4 |
(0.1) |
Other investment
banking ........................
|
(19,282) |
(1.2) |
48,802 |
3.0 |
N/M |
Total Investment
Banking ........................
|
766,307 |
46.9 |
787,386 |
47.5 |
(2.7) |
Equities .............................. |
526,244 |
32.2 |
422,884 |
25.5 |
24.4 |
Fixed income ..................... |
177,911 |
10.9 |
284,177 |
17.2 |
(37.4) |
Total Capital Markets ...... |
704,155 |
43.1 |
707,061 |
42.7 |
(0.4) |
Total Investment
Banking and Capital
Markets (1) ..................
|
1,470,462 |
90.0 |
1,494,447 |
90.2 |
(1.6) |
Asset management fees
and revenues ..............
|
20,766 |
1.3 |
16,818 |
1.0 |
23.5 |
Investment return ............. |
50,404 |
3.1 |
32,942 |
2.0 |
53.0 |
Allocated net interest (2) . |
(19,144) |
(1.2) |
(16,003) |
(1.0) |
19.6 |
Other investments,
inclusive of net
interest .........................
|
102,595 |
6.3 |
122,767 |
7.4 |
(16.4) |
Total Asset
Management ...............
|
154,621 |
9.5 |
156,524 |
9.4 |
(1.2) |
Other ................................... |
9,364 |
0.5 |
5,474 |
0.4 |
71.1 |
Net revenues ..................... |
$1,634,447 |
100.0% |
$1,656,445 |
100.0% |
(1.3)% |
Six Months Ended |
|||||
May 31, 2025 |
May 31, 2024 |
||||
$ in thousands |
Amount |
% of Net
Revenues
|
Amount |
% of Net
Revenues
|
% Change |
Advisory ............................... |
$855,640 |
26.5% |
$622,465 |
18.3% |
37.5% |
Equity underwriting ............. |
250,886 |
7.8 |
458,490 |
13.5 |
(45.3) |
Debt underwriting ................ |
404,725 |
12.5 |
334,693 |
9.9 |
20.9 |
Other investment banking .. |
(44,252) |
(1.4) |
98,748 |
2.9 |
N/M |
Total Investment Banking . |
1,466,999 |
45.4 |
1,514,396 |
44.6 |
(3.1) |
Equities ................................. |
935,302 |
29.0 |
794,684 |
23.4 |
17.7 |
Fixed income ........................ |
467,137 |
14.5 |
636,655 |
18.8 |
(26.6) |
Total Capital Markets ......... |
1,402,439 |
43.5 |
1,431,339 |
42.2 |
(2.0) |
Total Investment Banking
and Capital Markets
(1) ....................................
|
2,869,438 |
88.9 |
2,945,735 |
86.8 |
(2.6) |
Asset management fees
and revenues .................
|
109,396 |
3.4 |
76,475 |
2.3 |
43.0 |
Investment return ................ |
44,770 |
1.4 |
150,582 |
4.4 |
(70.3) |
Allocated net interest (2) .... |
(36,365) |
(1.1) |
(31,015) |
(0.9) |
17.2 |
Other investments,
inclusive of net interest
|
228,535 |
7.1 |
233,865 |
6.9 |
(2.3) |
Total Asset Management .. |
346,336 |
10.8 |
429,907 |
12.7 |
(19.4) |
Other ...................................... |
11,692 |
0.3 |
19,006 |
0.5 |
(38.5) |
Net revenues ........................ |
$3,227,466 |
100.0% |
$3,394,648 |
100.0% |
(4.9)% |
48 |
Jefferies Financial Group Inc. |
Deals Completed |
||||
Three Months Ended
May 31,
|
Six Months Ended
May 31,
|
|||
2025 |
2024 |
2025 |
2024 |
|
Advisory transactions ........ |
84 |
74 |
176 |
152 |
Public and private equity
and convertible
offerings ...........................
|
45 |
64 |
80 |
122 |
Public and private debt
financings ........................
|
268 |
285 |
481 |
467 |
Aggregate Value |
||||
Three Months Ended
May 31,
|
Six Months Ended
May 31,
|
|||
$ in billions |
2025 |
2024 |
2025 |
2024 |
Advisory transactions .......... |
$87.2 |
$75.9 |
$199.0 |
$130.8 |
Public and private equity
and convertible offerings
|
21.6 |
31.6 |
44.0 |
44.4 |
Public and private debt
financings ..........................
|
100.3 |
160.7 |
247.5 |
268.0 |
May 2025 Form 10-Q |
49 |
Three Months Ended
May 31,
|
|||
$ in thousands |
2025 |
2024 |
% Change |
Asset management fees and other .. |
7,495 |
6,990 |
7.2% |
Revenue from strategic affiliates (1) |
13,271 |
9,828 |
35.0% |
Total asset management fees and
revenues ..........................................
|
20,766 |
16,818 |
23.5% |
Investment return ................................ |
50,404 |
32,942 |
53.0% |
Allocated net interest .......................... |
(19,144) |
(16,003) |
19.6% |
Other investments ............................... |
102,595 |
122,767 |
(16.4)% |
Total Asset Management .................. |
$154,621 |
$156,524 |
(1.2)% |
Six Months Ended
May 31,
|
|||
$ in thousands |
2025 |
2024 |
% Change |
Asset management fees and other .. |
53,302 |
36,351 |
46.6% |
Revenue from strategic affiliates (1) |
56,094 |
40,124 |
39.8% |
Total asset management fees and
revenues ..........................................
|
109,396 |
76,475 |
43.0% |
Investment return ................................ |
44,770 |
150,582 |
(70.3)% |
Allocated net interest .......................... |
(36,365) |
(31,015) |
17.2% |
Other investments ............................... |
228,535 |
233,865 |
(2.3)% |
Total Asset Management .................. |
$346,336 |
$429,907 |
(19.4)% |
50 |
Jefferies Financial Group Inc. |
$ in millions |
May 31,
2025
|
November 30,
2024
|
Net asset values of seed investments ................. |
$1,870 |
$1,761 |
Net asset values of financed investments .......... |
1,193 |
1,174 |
Net asset values of investments (1) ..................... |
3,063 |
2,935 |
Assets under management by affiliated asset
managers with revenue sharing
arrangements (2) ................................................
|
25,731 |
22,515 |
Third-party and other investments actively
managed by our wholly-owned managers (3)
|
2,626 |
2,596 |
Total aggregate net asset values or net asset
value equivalent assets under management .
|
$31,420 |
$28,046 |
$ in thousands |
May 31,
2025
|
November 30,
2024
|
Jefferies Financial Group Inc.; as manager: |
||
Fund investments (1) ................................................... |
$205,769 |
$199,248 |
Separately managed accounts (2) ............................ |
209,111 |
177,998 |
Total ............................................................................... |
$414,880 |
$377,246 |
Strategic affiliates; as manager: |
||
Fund investments (1) ................................................... |
$1,121,442 |
$944,940 |
Separately managed accounts (2) ............................ |
333,157 |
439,043 |
Investments in asset managers ................................. |
163,815 |
81,403 |
Total ............................................................................... |
$1,618,414 |
$1,465,386 |
Total asset management investments ................... |
$2,033,294 |
$1,842,632 |
May 2025 Form 10-Q |
51 |
Three Months Ended
May 31,
|
|||
$ in thousands |
2025 |
2024 |
% Change |
Compensation and benefits ........... |
$854,839 |
$861,993 |
(0.8)% |
Brokerage and clearing fees .......... |
129,745 |
110,536 |
17.4 |
Underwriting costs .......................... |
14,525 |
18,552 |
(21.7) |
Technology and communications |
146,198 |
135,238 |
8.1 |
Occupancy and equipment rental . |
30,711 |
29,327 |
4.7 |
Business development ................... |
80,070 |
68,630 |
16.7 |
Professional services ..................... |
77,768 |
75,493 |
3.0 |
Depreciation and amortization ...... |
52,253 |
49,946 |
4.6 |
Cost of sales .................................... |
42,961 |
37,462 |
14.7 |
Other .................................................. |
70,476 |
41,514 |
69.8 |
Total non-interest expenses ......... |
$1,499,546 |
$1,428,691 |
5.0% |
Six Months Ended
May 31,
|
|||
$ in thousands |
2025 |
2024 |
% Change |
Compensation and benefits ........... |
$1,695,966 |
$1,788,864 |
(5.2)% |
Brokerage and clearing fees .......... |
239,181 |
220,206 |
8.6 |
Underwriting costs .......................... |
32,371 |
37,036 |
(12.6) |
Technology and communications |
285,673 |
272,750 |
4.7 |
Occupancy and equipment rental . |
60,910 |
57,480 |
6.0 |
Business development ................... |
152,361 |
126,281 |
20.7 |
Professional services ..................... |
150,234 |
153,337 |
(2.0) |
Depreciation and amortization ...... |
83,241 |
93,148 |
(10.6) |
Cost of sales .................................... |
84,529 |
72,133 |
17.2 |
Other .................................................. |
157,034 |
125,417 |
25.2 |
Total non-interest expenses ......... |
$2,941,500 |
$2,946,652 |
(0.2)% |
52 |
Jefferies Financial Group Inc. |
May 2025 Form 10-Q |
53 |
$ in millions |
May 31,
2025
|
November 30,
2024
|
Investment banking .......................................................... |
$702.7 |
$700.7 |
Equities and wealth management .................................. |
256.1 |
255.4 |
Fixed income ..................................................................... |
578.5 |
576.9 |
Asset management .......................................................... |
143.0 |
143.0 |
Other investments ............................................................ |
161.8 |
151.9 |
Total .................................................................................... |
$1,842.1 |
$1,827.9 |
54 |
Jefferies Financial Group Inc. |
$ in millions |
May 31,
2025
|
November 30,
2024
|
% Change |
Total assets ........................................... |
$67,285.3 |
$64,360.3 |
4.5% |
Cash and cash equivalents .................. |
11,260.4 |
12,153.4 |
(7.3) |
Cash and securities segregated and
on deposit for regulatory
purposes or deposited with
clearing and depository
organizations ....................................
|
1,051.3 |
1,132.6 |
(7.2) |
Financial instruments owned .............. |
25,570.2 |
24,138.3 |
5.9 |
Financial instruments sold, not yet
purchased .........................................
|
11,775.1 |
11,007.3 |
7.0 |
Total Level 3 assets .............................. |
763.0 |
734.2 |
3.9 |
Securities borrowed .............................. |
$7,844.8 |
$7,213.4 |
8.8% |
Securities purchased under
agreements to resell ........................
|
7,485.0 |
6,179.7 |
21.1 |
Total securities borrowed and
securities purchased under
agreements to resell .......................
|
$15,329.8 |
$13,393.1 |
14.5% |
Securities loaned ................................... |
$2,041.8 |
$2,540.9 |
(19.6)% |
Securities sold under agreements to
repurchase ........................................
|
12,157.6 |
12,337.9 |
(1.5) |
Total securities loaned and
securities sold under agreements
to repurchase ...................................
|
$14,199.4 |
$14,878.8 |
(4.6)% |
$ in millions |
May 31,
2025
|
Percent |
November 30,
2024
|
Percent |
Investment Banking ............ |
$140.9 |
18.5% |
$146.7 |
20.0% |
Equities and Fixed Income . |
370.0 |
48.5 |
312.2 |
42.5 |
Asset Management (1) ....... |
231.0 |
30.3 |
256.2 |
34.9 |
Other ...................................... |
21.1 |
2.7 |
19.1 |
2.6 |
Total ...................................... |
$763.0 |
100.0% |
$734.2 |
100.0% |
May 2025 Form 10-Q |
55 |
$ in millions |
Six Months
Ended
May 31, 2025
|
Year Ended
November 30,
2024
|
Securities Purchased Under Agreements to
Resell:
|
||
Period end ........................................................... |
$7,485 |
$6,180 |
Month end average ............................................ |
10,195 |
8,910 |
Maximum month end ........................................ |
14,927 |
10,978 |
Securities Sold Under Agreements to
Repurchase:
|
||
Period end ........................................................... |
$12,158 |
$12,338 |
Month end average ............................................ |
16,807 |
15,197 |
Maximum month end ........................................ |
19,785 |
20,971 |
$ in millions |
May 31,
2025
|
November 30,
2024
|
Total assets .................................................................. |
$67,285 |
$64,360 |
Total equity ................................................................... |
$10,382 |
$10,225 |
Total shareholders’ equity .......................................... |
$10,305 |
$10,157 |
Deduct: Goodwill and intangible assets, net ............ |
(2,060) |
(2,054) |
Tangible shareholders’ equity ................................... |
$8,245 |
$8,103 |
Leverage ratio (1) ......................................................... |
6.5 |
6.3 |
Tangible gross leverage ratio (2) ............................... |
7.9 |
7.7 |
56 |
Jefferies Financial Group Inc. |
$ in thousands |
May 31,
2025
|
Average
Balance
Quarter Ended
May 31, 2025
(1)
|
November 30,
2024
|
Cash and cash equivalents: |
|||
Cash in banks ............................................. |
$3,975,192 |
$4,831,344 |
$3,925,535 |
Money market investments (2) ............... |
7,285,211 |
4,333,430 |
8,227,879 |
Total cash and cash equivalents ............ |
11,260,403 |
9,164,774 |
12,153,414 |
Other sources of liquidity: |
|||
Debt securities owned and securities
purchased under agreements to
resell (3) ................................................
|
1,731,916 |
1,693,106 |
1,287,564 |
Other (4) ...................................................... |
674,513 |
818,009 |
573,042 |
Total other sources ................................... |
2,406,429 |
2,511,115 |
1,860,606 |
Total cash and cash equivalents and
other liquidity sources .......................
|
$13,666,832 |
$11,675,889 |
$14,014,020 |
Total cash and cash equivalents and
other liquidity sources as % of Total
assets ....................................................
|
20.3% |
21.8% |
|
Total cash and cash equivalents and
other liquidity sources as % of Total
assets less goodwill and intangible
assets ....................................................
|
21.0% |
22.5% |
May 2025 Form 10-Q |
57 |
May 31, 2025 |
November 30, 2024 |
|||
$ in thousands |
Liquid Financial
Instruments
|
Unencumbered
Liquid Financial
Instruments (2)
|
Liquid Financial
Instruments
|
Unencumbered
Liquid Financial
Instruments (2)
|
Corporate equity
securities .............
|
$4,845,526 |
$762,486 |
$5,280,920 |
$781,490 |
Corporate debt
securities .............
|
5,637,737 |
152,724 |
5,179,229 |
339,500 |
U.S. government,
agency and
municipal
securities .............
|
3,858,523 |
127,302 |
4,061,773 |
75,911 |
Other sovereign
obligations ..........
|
1,346,683 |
1,424,865 |
1,361,762 |
1,044,630 |
Agency mortgage-
backed
securities (1) .......
|
2,505,238 |
— |
2,695,282 |
— |
Loans and other
receivables ..........
|
229,416 |
— |
978 |
— |
Total ........................... |
$18,423,123 |
$2,467,377 |
$18,579,944 |
$2,241,531 |
58 |
Jefferies Financial Group Inc. |
$ in thousands |
May 31,
2025
|
November 30,
2024
|
Unsecured Long-Term Debt (1) .................................. |
$11,373,498 |
$11,430,610 |
Total Mezzanine Equity ............................................... |
406 |
406 |
Total Equity ................................................................... |
10,382,174 |
10,224,987 |
Total Long-Term Capital ............................................ |
$21,756,078 |
$21,656,003 |
Rating |
Outlook |
|
Moody’s Investors Service ......................................... |
Baa2 |
Stable |
Standard & Poor’s ........................................................ |
BBB |
Stable |
Fitch Ratings ................................................................. |
BBB+ |
Stable |
Jefferies LLC |
Jefferies
International
Limited
|
Jefferies GmbH |
||||
Rating |
Outlook |
Rating |
Outlook |
Rating |
Outlook |
|
Moody’s
Investors
Service ..........
|
Baa1 |
Stable |
Baa1 |
Stable |
Baa1 |
Stable |
Standard &
Poor’s ............
|
BBB+ |
Stable |
BBB+ |
Stable |
BBB+ |
Stable |
Six Months Ended May 31, 2025 | |||
Declaration Date |
Record Date |
Payment Date |
Per Common
Share Amount
|
January 8, 2025 |
February 14, 2025 |
February 27, 2025 |
$0.40 |
March 26, 2025 |
May 19, 2025 |
May 29, 2025 |
$0.40 |
May 2025 Form 10-Q |
59 |
$ in thousands |
Net
Capital
|
Excess Net
Capital
|
Jefferies LLC ................................................................. |
$1,648,720 |
$1,510,016 |
JFSI - SEC ...................................................................... |
345,239 |
325,239 |
JFSI - CFTC ................................................................... |
345,239 |
317,560 |
60 |
Jefferies Financial Group Inc. |
May 2025 Form 10-Q |
61 |
62 |
Jefferies Financial Group Inc. |
VaR at
May 31,
2025
|
Daily Firmwide VaR |
|||
$ in millions |
Daily VaR for the Three Months
Ended May 31, 2025
|
|||
Risk Categories |
Average |
High |
Low |
|
Interest Rates and Credit
Spreads .....................................
|
$6.51 |
$6.47 |
$9.31 |
$3.36 |
Equity Prices ................................ |
10.27 |
9.71 |
13.93 |
7.14 |
Currency Rates ............................ |
1.56 |
2.01 |
2.61 |
1.42 |
Commodity Prices ...................... |
0.44 |
0.35 |
0.71 |
0.17 |
Diversification Effect (1) ............ |
(7.10) |
(6.65) |
N/A |
N/A |
Firmwide VaR (2) ........................ |
$11.68 |
$11.89 |
$15.39 |
$8.96 |
VaR at
February 28,
2025
|
Daily Firmwide VaR |
|||
$ in millions |
Daily VaR for the Three Months
Ended February 28, 2025
|
|||
Risk Categories |
Average |
High |
Low |
|
Interest Rates and Credit
Spreads ..................................
|
$2.95 |
$5.43 |
$8.70 |
$2.50 |
Equity Prices ............................ |
11.76 |
10.37 |
12.14 |
7.67 |
Currency Rates ........................ |
1.36 |
1.00 |
1.72 |
0.54 |
Commodity Prices ................... |
0.32 |
0.29 |
0.62 |
0.12 |
Diversification Effect (1) ........ |
(4.46) |
(3.96) |
N/A |
N/A |
Firmwide VaR (2) .................... |
$11.93 |
$13.13 |
$16.03 |
$8.79 |
VaR at
May 31,
2025
|
Daily Capital Markets VaR |
|||
$ in millions |
Daily VaR for the Three Months
Ended May 31, 2025
|
|||
Risk Categories |
Average |
High |
Low |
|
Interest Rates and Credit
Spreads .....................................
|
$6.22 |
$6.19 |
$9.10 |
$1.05 |
Equity Prices ................................ |
4.40 |
3.99 |
5.81 |
2.85 |
Currency Rates ............................ |
1.05 |
1.16 |
1.50 |
0.64 |
Commodity Prices ...................... |
0.10 |
0.08 |
0.25 |
— |
Diversification Effect (1) ............ |
(4.63) |
(3.10) |
N/A |
N/A |
Capital Markets VaR (2) ............ |
$7.14 |
$8.32 |
$13.08 |
$6.13 |
VaR at
February 28,
2025
|
Daily Capital Markets VaR |
|||
$ in millions |
Daily VaR for the Three Months
Ended February 28, 2025
|
|||
Risk Categories |
Average |
High |
Low |
|
Interest Rates and Credit
Spreads ..................................
|
$2.69 |
$5.19 |
$8.50 |
$2.39 |
Equity Prices ............................ |
4.09 |
4.67 |
6.95 |
3.41 |
Currency Rates ........................ |
0.75 |
0.72 |
1.08 |
0.51 |
Diversification Effect (1) ........ |
(1.77) |
(1.76) |
N/A |
N/A |
Capital Markets VaR (2) ......... |
$5.76 |
$8.82 |
$14.01 |
$5.76 |
May 2025 Form 10-Q |
63 |
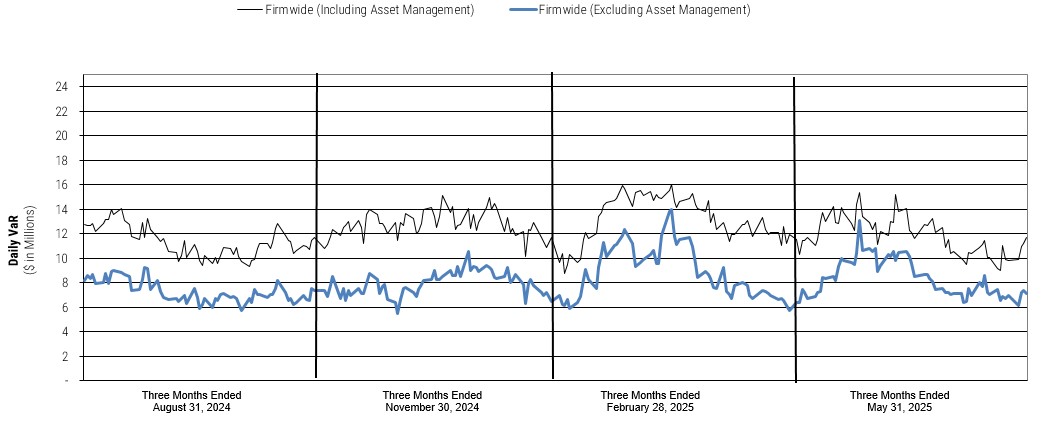
64 |
Jefferies Financial Group Inc. |
$ in thousands |
10% Sensitivity |
Investment in funds (1) ............................................................................................................................................................................................ |
$197,122 |
Private investments .................................................................................................................................................................................................. |
61,997 |
Corporate debt securities in default ....................................................................................................................................................................... |
16,434 |
Trade claims .............................................................................................................................................................................................................. |
2,312 |
Expected Maturity Date (Fiscal Years) |
||||||||
$ in thousands |
2025 |
2026 |
2027 |
2028 |
2029 |
Thereafter |
Total |
Fair Value |
Rate Sensitive Liabilities: |
||||||||
Fixed Interest Rate Borrowings ............................... |
$152,667 |
$539,594 |
$628,977 |
$1,292,287 |
$298,171 |
$5,810,095 |
$8,721,791 |
$8,557,404 |
Weighted-Average Interest Rate ............................. |
1.90% |
5.20% |
5.23% |
5.59% |
5.64% |
5.64% |
||
Variable Interest Rate Borrowings .......................... |
$395,944 |
$596,323 |
$954,669 |
$49,385 |
$210,024 |
$1,416,503 |
$3,622,848 |
$3,464,217 |
Weighted-Average Interest Rate ............................. |
5.97% |
6.73% |
6.85% |
6.51% |
6.37% |
6.22% |
||
Borrowings with Foreign Currency Exposure ........ |
$53,419 |
$1,240,496 |
$54,210 |
$567,950 |
$571,965 |
$1,002,404 |
$3,490,444 |
$3,364,701 |
Weighted-Average Interest Rate ............................. |
5.20% |
5.54% |
2.59% |
3.37% |
6.53% |
6.85% |
||
May 2025 Form 10-Q |
65 |
66 |
Jefferies Financial Group Inc. |
Counterparty Credit Exposure by Credit Rating | ||||||||||||
Loans and Lending |
Securities and Margin
Finance
|
OTC Derivatives |
Total |
Cash and
Cash Equivalents
|
Total with Cash and
Cash Equivalents
|
|||||||
At |
At |
At |
At |
At |
At |
|||||||
$ in millions |
May
31,
2025
|
November
30,
2024
|
May
31,
2025
|
November
30,
2024
|
May
31,
2025
|
November
30,
2024
|
May
31,
2025
|
November
30,
2024
|
May
31,
2025
|
November
30,
2024
|
May
31,
2025
|
November
30,
2024
|
AAA Range |
$— |
$— |
$9.7 |
$12.0 |
$— |
$— |
$9.7 |
$12.0 |
$7,285.2 |
$8,227.9 |
$7,294.9 |
$8,239.9 |
AA Range |
85.2 |
80.0 |
327.6 |
190.3 |
2.6 |
5.6 |
415.4 |
275.9 |
5.6 |
63.8 |
421.0 |
339.7 |
A Range |
0.9 |
0.2 |
1,147.1 |
1,145.1 |
365.8 |
415.0 |
1,513.8 |
1,560.3 |
3,880.6 |
3,691.8 |
5,394.4 |
5,252.1 |
BBB Range |
250.0 |
253.5 |
91.6 |
31.2 |
3.5 |
40.0 |
345.1 |
324.7 |
88.5 |
169.4 |
433.6 |
494.1 |
BB or Lower |
30.9 |
37.2 |
35.2 |
31.2 |
113.2 |
78.7 |
179.3 |
147.1 |
0.5 |
0.5 |
179.8 |
147.6 |
Unrated |
232.1 |
322.6 |
— |
— |
5.3 |
5.3 |
237.4 |
327.9 |
— |
— |
237.4 |
327.9 |
Total |
$599.1 |
$693.5 |
$1,611.2 |
$1,409.8 |
$490.4 |
$544.6 |
$2,700.7 |
$2,647.9 |
$11,260.4 |
$12,153.4 |
$13,961.1 |
$14,801.3 |
Counterparty Credit Exposure by Region | ||||||||||||
Loans and Lending |
Securities and Margin
Finance
|
OTC Derivatives |
Total |
Cash and
Cash Equivalents
|
Total with Cash and
Cash Equivalents
|
|||||||
At |
At |
At |
At |
At |
At |
|||||||
$ in millions |
May
31,
2025
|
November
30,
2024
|
May
31,
2025
|
November
30,
2024
|
May
31,
2025
|
November
30,
2024
|
May
31,
2025
|
November
30,
2024
|
May
31,
2025
|
November
30,
2024
|
May
31,
2025
|
November
30,
2024
|
Asia-Pacific/Latin
America/Other
|
$15.8 |
$15.8 |
$189.7 |
$130.4 |
$0.6 |
$0.2 |
$206.1 |
$146.4 |
$473.2 |
$520.3 |
$679.3 |
$666.7 |
Europe and the Middle
East
|
1.0 |
0.2 |
567.0 |
523.2 |
62.0 |
88.7 |
630.0 |
612.1 |
45.4 |
70.8 |
675.4 |
682.9 |
North America |
582.3 |
677.5 |
854.5 |
756.2 |
427.8 |
455.7 |
1,864.6 |
1,889.4 |
10,741.8 |
11,562.3 |
12,606.4 |
13,451.7 |
Total |
$599.1 |
$693.5 |
$1,611.2 |
$1,409.8 |
$490.4 |
$544.6 |
$2,700.7 |
$2,647.9 |
$11,260.4 |
$12,153.4 |
$13,961.1 |
$14,801.3 |
Counterparty Credit Exposure by Industry | ||||||||||||
Loans and Lending |
Securities and Margin
Finance
|
OTC Derivatives |
Total |
Cash and
Cash Equivalents
|
Total with Cash and
Cash Equivalents
|
|||||||
At |
At |
At |
At |
At |
At |
|||||||
$ in millions |
May
31,
2025
|
November
30,
2024
|
May
31,
2025
|
November
30,
2024
|
May
31,
2025
|
November
30,
2024
|
May
31,
2025
|
November
30,
2024
|
May
31,
2025
|
November
30,
2024
|
May
31,
2025
|
November
30,
2024
|
Asset Managers |
$0.2 |
$6.4 |
$— |
$0.8 |
$— |
$— |
$0.2 |
$7.2 |
$7,285.2 |
$8,227.9 |
$7,285.4 |
$8,235.1 |
Banks, Broker-Dealers |
251.1 |
253.7 |
968.0 |
849.0 |
381.5 |
466.6 |
1,600.6 |
1,569.3 |
3,975.2 |
3,925.5 |
5,575.8 |
5,494.8 |
Corporates |
146.6 |
187.1 |
— |
— |
106.8 |
69.5 |
253.4 |
256.6 |
— |
— |
253.4 |
256.6 |
As Agent Banks |
— |
— |
499.3 |
474.8 |
— |
— |
499.3 |
474.8 |
— |
— |
499.3 |
474.8 |
Other |
201.2 |
246.3 |
143.9 |
85.2 |
2.1 |
8.5 |
347.2 |
340.0 |
— |
— |
347.2 |
340.0 |
Total |
$599.1 |
$693.5 |
$1,611.2 |
$1,409.8 |
$490.4 |
$544.6 |
$2,700.7 |
$2,647.9 |
$11,260.4 |
$12,153.4 |
$13,961.1 |
$14,801.3 |
May 2025 Form 10-Q |
67 |
May 31, 2025 |
|||||||||
Issuer Risk |
Counterparty Risk |
Issuer and Counterparty Risk |
|||||||
$ in millions |
Fair Value of
Long Debt
Securities
|
Fair Value of
Short Debt
Securities
|
Net Derivative
Notional
Exposure
|
Loans and
Lending
|
Securities and
Margin
Finance
|
OTC
Derivatives
|
Cash and
Cash
Equivalents
|
Excluding
Cash and
Cash
Equivalents
|
Including
Cash and
Cash
Equivalents
|
United Kingdom |
$1,486.2 |
$(911.6) |
$(118.3) |
$0.9 |
$117.5 |
$52.8 |
$20.7 |
$627.5 |
$648.2 |
Canada |
244.7 |
(148.1) |
29.7 |
0.1 |
37.6 |
307.0 |
— |
471.0 |
471.0 |
Hong Kong |
79.2 |
(72.2) |
4.7 |
— |
7.2 |
— |
207.4 |
18.9 |
226.3 |
Japan |
2,381.5 |
(2,316.4) |
(41.6) |
— |
93.8 |
— |
61.1 |
117.3 |
178.4 |
India |
24.0 |
(27.0) |
— |
— |
— |
— |
152.3 |
(3.0) |
149.3 |
France |
551.5 |
(638.3) |
40.3 |
0.1 |
186.0 |
3.3 |
— |
142.9 |
142.9 |
Germany |
1,011.8 |
(1,098.1) |
98.7 |
— |
110.8 |
1.3 |
15.8 |
124.5 |
140.3 |
Netherlands |
522.2 |
(490.8) |
83.3 |
— |
6.1 |
— |
0.7 |
120.8 |
121.5 |
Spain |
421.2 |
(363.5) |
(5.6) |
— |
63.8 |
— |
0.5 |
115.9 |
116.4 |
Taiwan |
901.1 |
(831.8) |
(23.5) |
— |
40.1 |
— |
— |
85.9 |
85.9 |
Total |
$7,623.4 |
$(6,897.8) |
$67.7 |
$1.1 |
$662.9 |
$364.4 |
$458.5 |
$1,821.7 |
$2,280.2 |
November 30, 2024 |
|||||||||
Issuer Risk |
Counterparty Risk |
Issuer and Counterparty Risk |
|||||||
$ in millions |
Fair Value of
Long Debt
Securities
|
Fair Value of
Short Debt
Securities
|
Net Derivative
Notional
Exposure
|
Loans and
Lending
|
Securities and
Margin
Finance
|
OTC
Derivatives
|
Cash and
Cash
Equivalents
|
Excluding
Cash and
Cash
Equivalents
|
Including
Cash and
Cash
Equivalents
|
Canada |
$259.2 |
$(280.1) |
$109.7 |
$— |
$46.6 |
$360.1 |
$59.3 |
$495.5 |
$554.8 |
United Kingdom |
1,332.5 |
(680.8) |
(364.3) |
0.1 |
95.8 |
76.5 |
37.9 |
459.8 |
497.7 |
France |
592.2 |
(495.0) |
7.7 |
0.1 |
184.9 |
1.6 |
— |
291.5 |
291.5 |
Hong Kong |
73.5 |
(36.5) |
(6.0) |
— |
2.4 |
— |
250.0 |
33.4 |
283.4 |
Spain |
403.1 |
(263.6) |
(6.0) |
— |
63.1 |
1.2 |
0.5 |
197.8 |
198.3 |
Netherlands |
484.1 |
(450.4) |
125.4 |
— |
5.7 |
1.7 |
0.1 |
166.5 |
166.6 |
Japan |
2,146.0 |
(2,093.5) |
0.4 |
— |
63.2 |
— |
37.4 |
116.1 |
153.5 |
Australia |
523.8 |
(426.8) |
(16.8) |
— |
26.5 |
— |
44.6 |
106.7 |
151.3 |
India |
27.4 |
(29.7) |
— |
— |
— |
— |
142.9 |
(2.3) |
140.6 |
Italy |
1,070.9 |
(569.3) |
(402.9) |
— |
0.4 |
— |
1.1 |
99.1 |
100.2 |
Total |
$6,912.7 |
$(5,325.7) |
$(552.8) |
$0.2 |
$488.6 |
$441.1 |
$573.8 |
$1,964.1 |
$2,537.9 |
68 |
Jefferies Financial Group Inc. |
May 2025 Form 10-Q |
69 |
$ in thousands, except share
and per share amounts
|
(a) Total
Number of
Shares
Purchased
(1)
|
(b) Average
Price Paid
per Share
|
(c) Total
Number of
Shares
Purchased as
Part of
Publicly
Announced
Plans
or Programs
|
(d)
Approximate
Dollar Value
of Shares
that May Yet
Be
Purchased
Under the
Plans or
Programs
|
March 1, 2025 to
March 31, 2025 ........................
|
20,846 |
$56.45 |
— |
$250,000 |
April 1, 2025 to
April 30, 2025 ..........................
|
— |
$— |
— |
$250,000 |
May 1, 2025 to
May 31, 2025 ............................
|
1,549 |
$46.59 |
— |
$250,000 |
Total........................................... |
22,395 |
$55.77 |
— |
Exhibit
No.
|
Description |
31.1 |
|
31.2 |
|
32.1 |
|
32.2 |
|
101 |
Interactive Data Files pursuant to Rule 405 of Regulation S-T,
formatted in Inline Extensible Business Reporting Language
(iXBRL).
|
104 |
Cover page interactive data file pursuant to Rule 406 of
Regulation S-T, formatted in iXBRL (included in exhibit 101)
|
+ |
Management/Employment Contract or Compensatory Plan
or Arrangement.
|
* |
Incorporated by reference. |
** |
Furnished herewith pursuant to item 601(b) (32) of
Regulation S-K.
|
70 |
Jefferies Financial Group Inc. |
Jefferies Financial Group Inc. |
/s/ MATT LARSON |
Matt Larson |
Executive Vice President and Chief Financial Officer |
| Date: | July 9, 2025 | By: | /s/ Richard B. Handler | |||||||||||
| Name: Title: |
Richard B. Handler Chief Executive Officer |
|||||||||||||
| Date: | July 9, 2025 | By: | /s/ Matt Larson | |||||||||||
| Name: Title: |
Matt Larson Chief Financial Officer |
|||||||||||||
| Date: | July 9, 2025 | By: | /s/ Richard B. Handler | |||||||||||
| Name: Title: |
Richard B. Handler Chief Executive Officer |
|||||||||||||
| Date: | July 9, 2025 | By: | /s/ Matt Larson | |||||||||||
| Name: Title: |
Matt Larson Chief Financial Officer |
|||||||||||||