| North Carolina | 1-10853 | 56-0939887 | ||||||
(State or other jurisdiction of incorporation) |
(Commission File Number) |
(I.R.S. Employer Identification No.) |
||||||
214 North Tryon Street |
||||||||
Charlotte, |
North Carolina |
28202 |
||||||
(Address of principal executive offices) |
(Zip Code) |
|||||||
| Title of each class | Trading Symbol | Name of each exchange on which registered | ||||||||||||||||||||||||
| Common Stock, $5 par value | TFC | New York Stock Exchange | ||||||||||||||||||||||||
| Depositary Shares each representing 1/4,000th interest in a share of Series I Perpetual Preferred Stock | TFC.PI | New York Stock Exchange | ||||||||||||||||||||||||
| 5.853% Fixed-to-Floating Rate Normal Preferred Purchase Securities each representing 1/100th interest in a share of Series J Perpetual Preferred Stock | TFC.PJ | New York Stock Exchange | ||||||||||||||||||||||||
| Depositary Shares each representing 1/1,000th interest in a share of Series O Non-Cumulative Perpetual Preferred Stock | TFC.PO | New York Stock Exchange | ||||||||||||||||||||||||
| Depositary Shares each representing 1/1,000th interest in a share of Series R Non-Cumulative Perpetual Preferred Stock | TFC.PR | New York Stock Exchange | ||||||||||||||||||||||||
| Exhibit No. | Description of Exhibit | |||||||
| Earnings Release issued July 22, 2024. | ||||||||
| Quarterly Performance Summary issued July 22, 2024. | ||||||||
| Earnings Release Presentation issued July 22, 2024. | ||||||||
| 104 | The cover page from this Current Report on Form 8-K, formatted in Inline XBRL. | |||||||
TRUIST FINANCIAL CORPORATION |
||||||||
(Registrant) |
||||||||
| By: | /s/ Cynthia B. Powell | |||||||
Cynthia B. Powell |
||||||||
Executive Vice President and Corporate Controller |
||||||||
(Principal Accounting Officer) |
||||||||
 |
News Release | ||||||||||
Truist reports second quarter 2024 results | |||||||||||
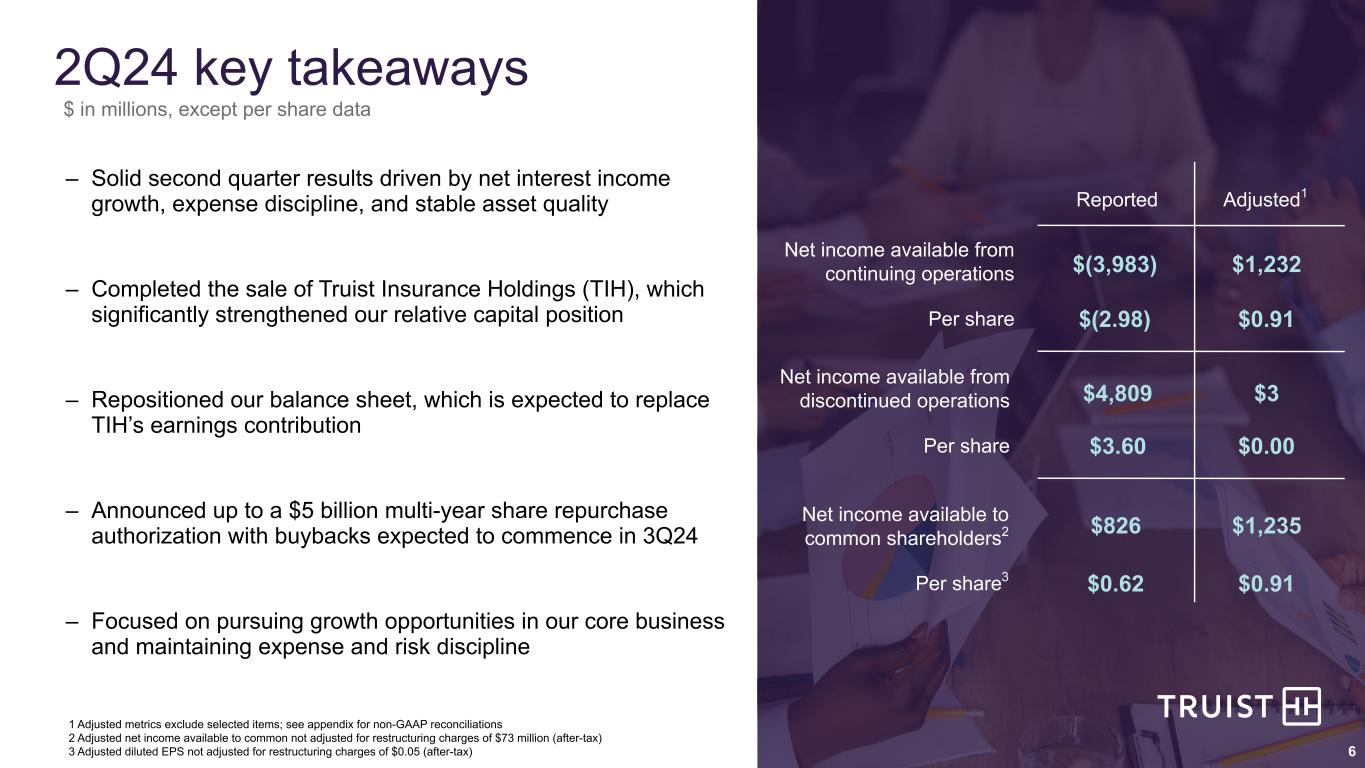
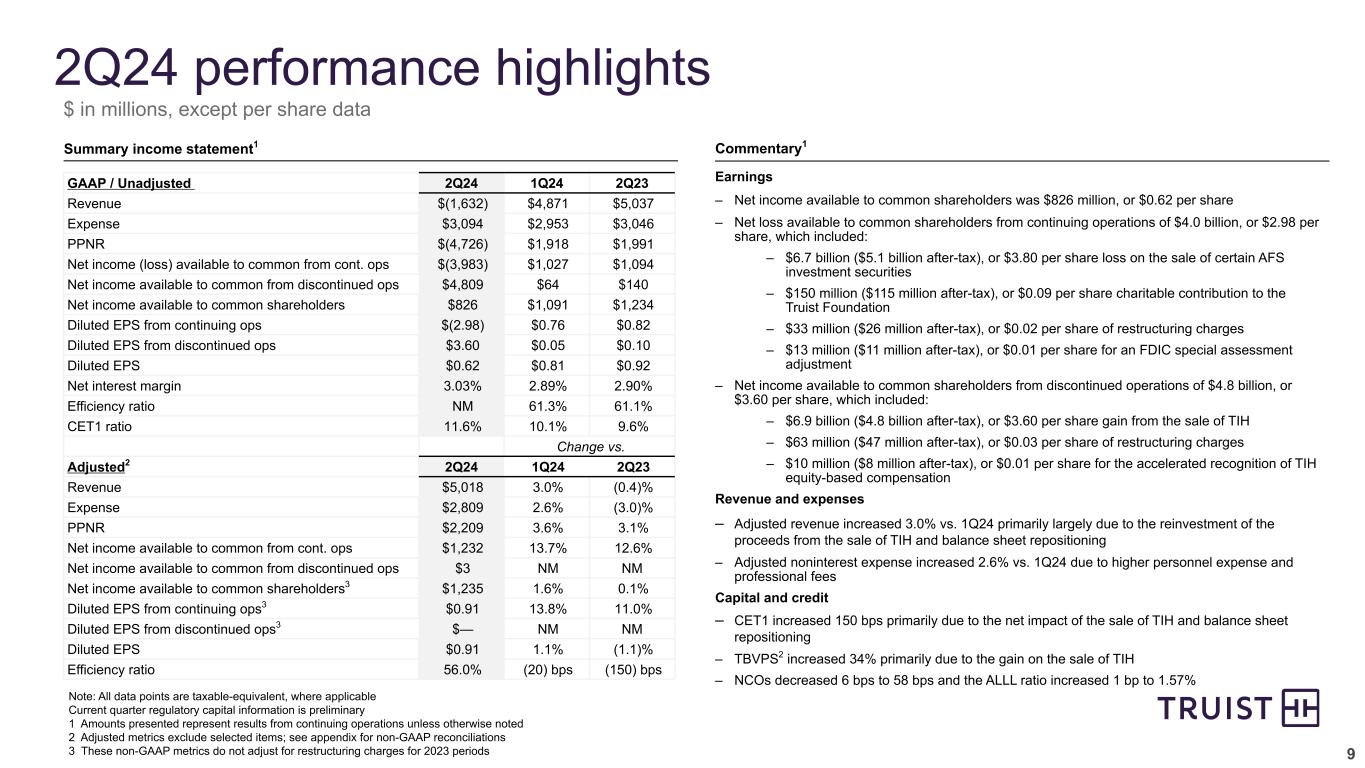
Net income available to common shareholders of $826 million, or $0.62 per share, or $1.2 billion, or $0.91 per share on an adjusted basis(1) |
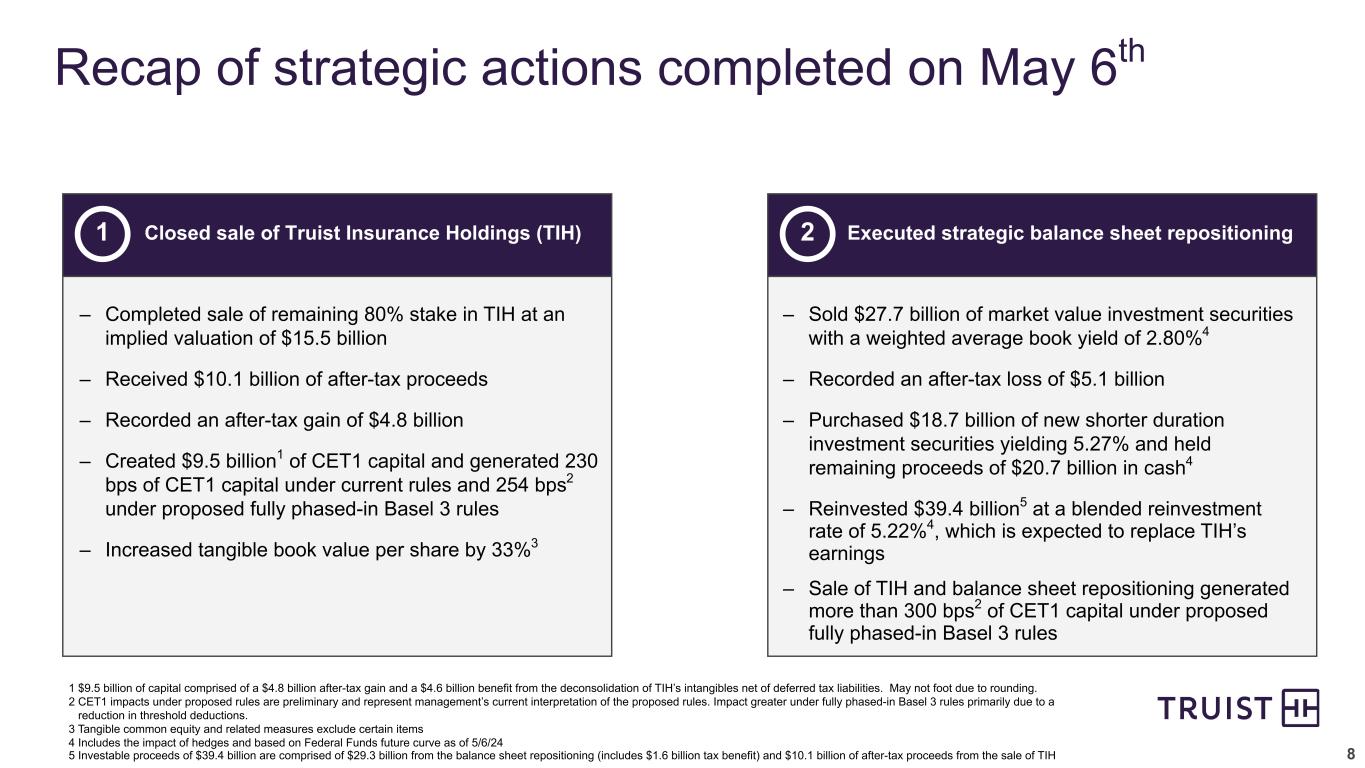
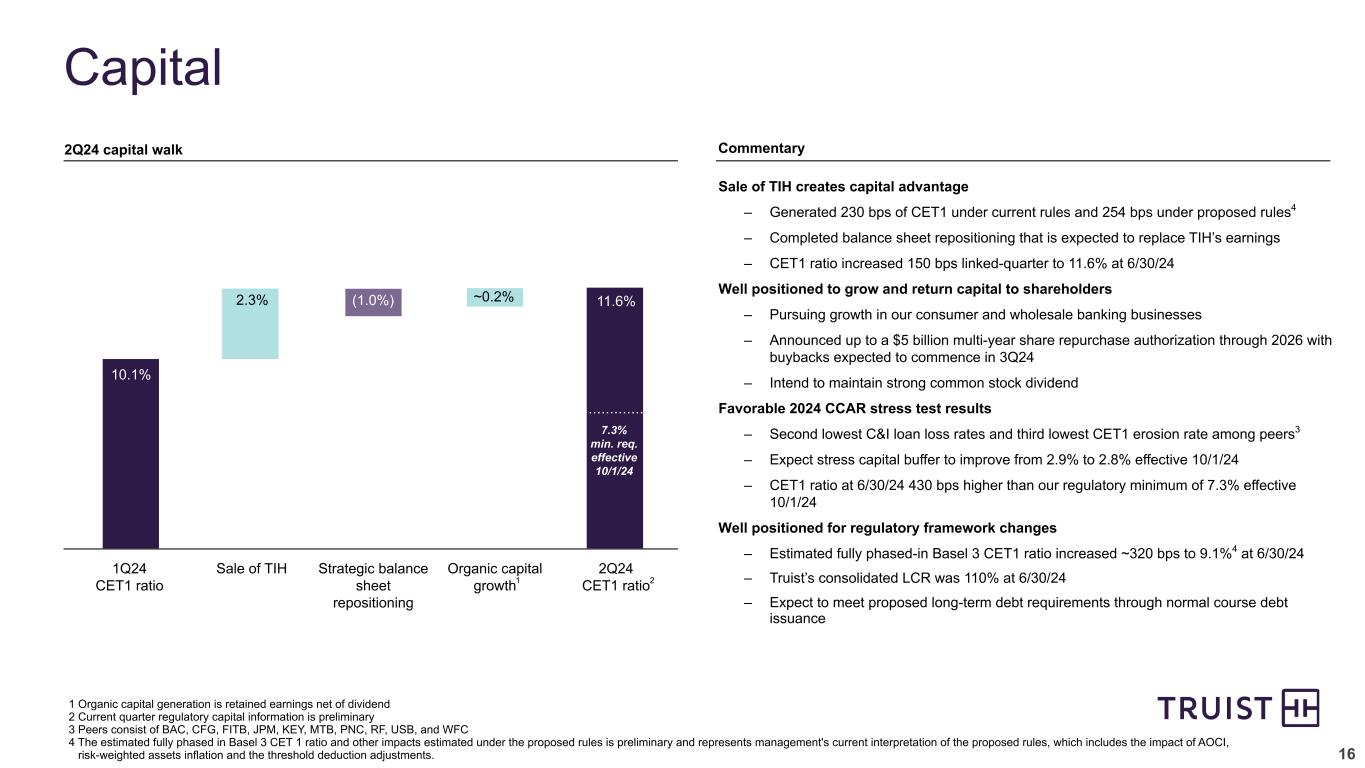
CET1 ratio(3) was 11.6%, significantly strengthened by the sale of TIH |
Truist executed a strategic balance sheet repositioning and announced planned share repurchases | |||||||||
2Q24 Key Financial Data |
2Q24 Performance Highlights(4) |
||||||||||
| (Dollars in billions, except per share data) | 2Q24 | 1Q24 | 2Q23 | ||||||||
| Summary Income Statement | |||||||||||
| Net interest income - TE | $ | 3.58 | $ | 3.43 | $ | 3.66 | |||||
| Noninterest income | (5.21) | 1.45 | 1.38 | ||||||||
| Total revenue - TE | (1.63) | 4.87 | 5.04 | ||||||||
| Noninterest expense | 3.09 | 2.95 | 3.05 | ||||||||
| Net income (loss) from continuing operations | (3.91) | 1.13 | 1.17 | ||||||||
| Net income from discontinued operations | 4.83 | 0.07 | 0.18 | ||||||||
| Net income (loss) | 0.92 | 1.20 | 1.35 | ||||||||
| Net income (loss) available to common shareholders | 0.83 | 1.09 | 1.23 | ||||||||
Adjusted net income available to common shareholders(1) |
1.24 | 1.22 | 1.23 | ||||||||
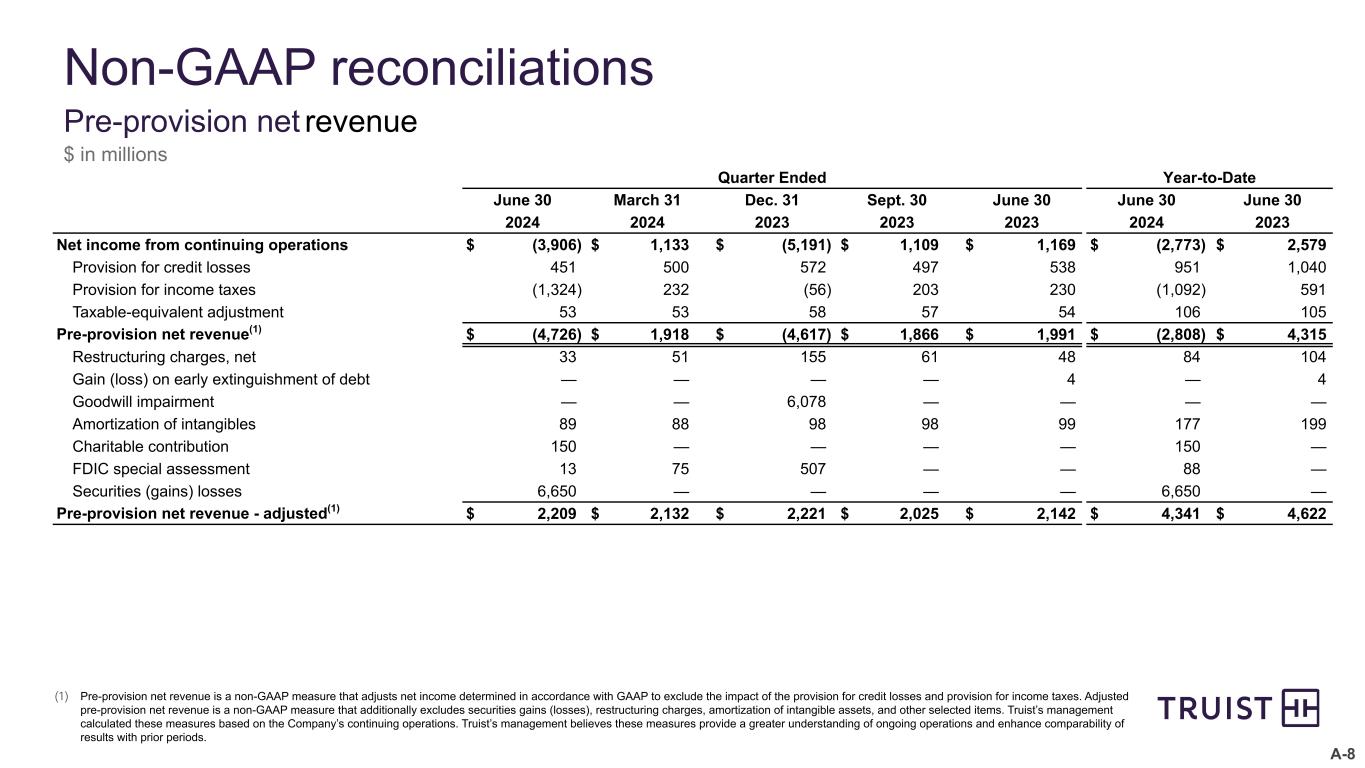
PPNR - unadjusted(1)(2) |
(4.73) | 1.92 | 1.99 | ||||||||
PPNR - adjusted(1)(2) |
2.21 | 2.13 | 2.14 | ||||||||
| Key Metrics | |||||||||||
| Diluted EPS | $ | 0.62 | $ | 0.81 | $ | 0.92 | |||||
Adjusted diluted EPS(1) |
0.91 | 0.90 | 0.92 | ||||||||
| BVPS | 42.71 | 38.97 | 42.68 | ||||||||
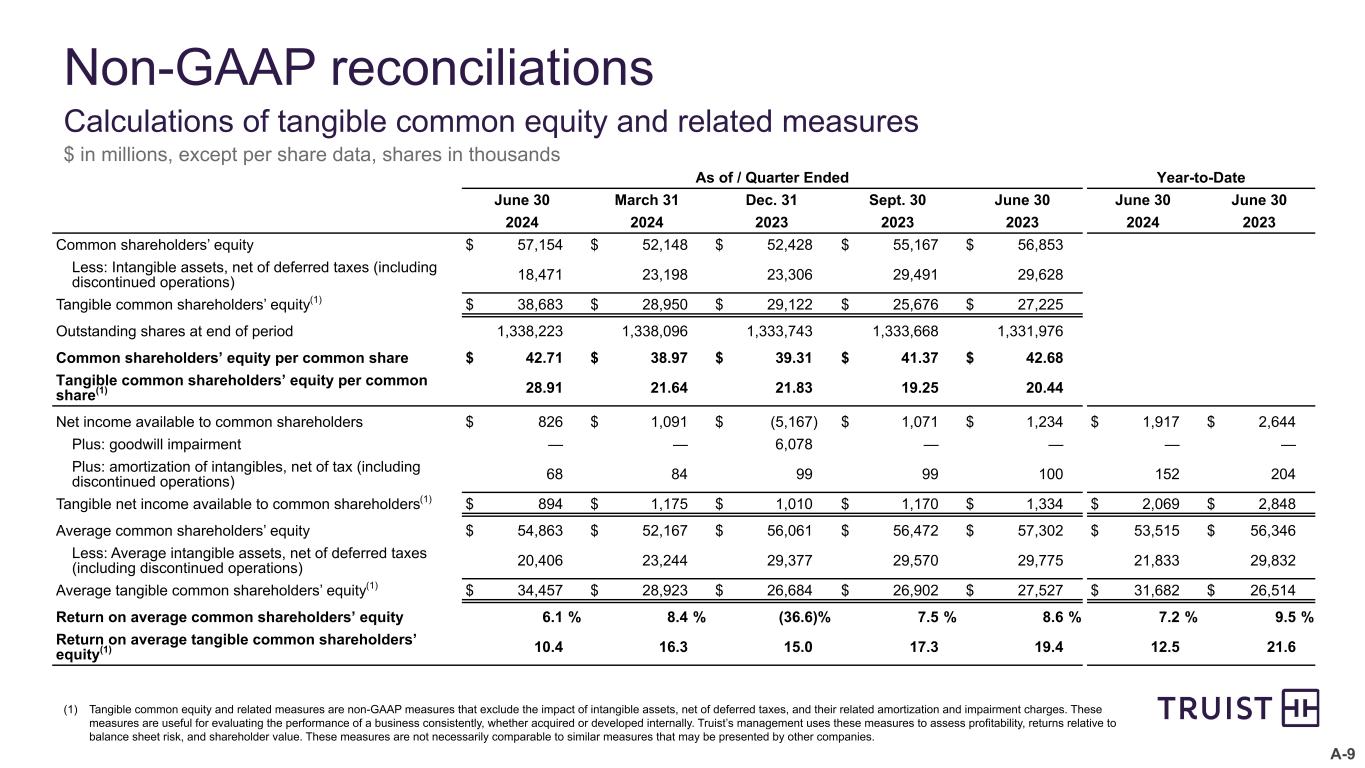
TBVPS(1) |
28.91 | 21.64 | 20.44 | ||||||||
| ROCE | 6.1 | % | 8.4 | % | 8.6 | % | |||||
ROTCE(1) |
10.4 | 16.3 | 19.4 | ||||||||
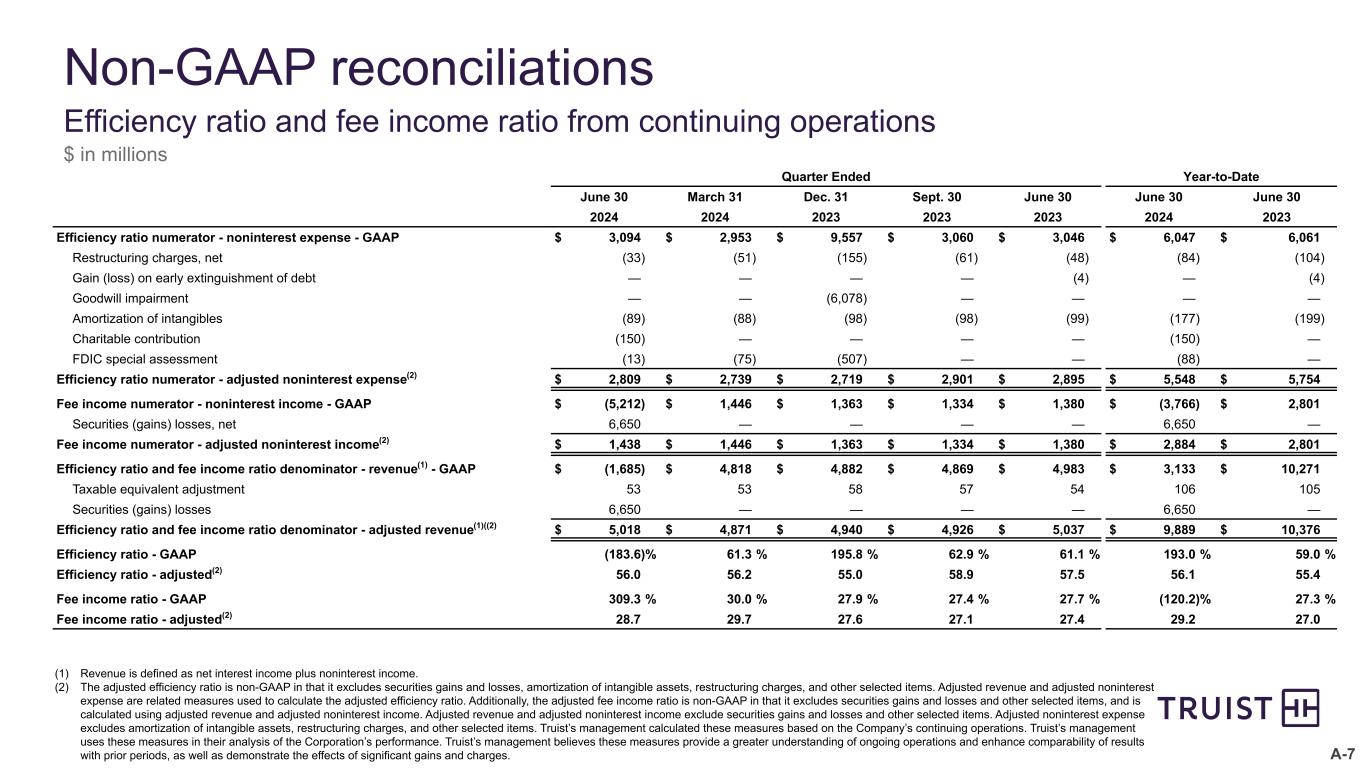
Efficiency ratio - GAAP(2) |
NM | 61.3 | 61.1 | ||||||||
Efficiency ratio - adjusted(1)(2) |
56.0 | 56.2 | 57.5 | ||||||||
Fee income ratio - GAAP(2) |
NM | 30.0 | 27.7 | ||||||||
Fee income ratio - adjusted(1)(2) |
28.7 | 29.7 | 27.4 | ||||||||
NIM - TE(2) |
3.03 | 2.89 | 2.90 | ||||||||
| NCO ratio | 0.58 | 0.64 | 0.54 | ||||||||
| ALLL ratio | 1.57 | 1.56 | 1.43 | ||||||||
CET1 ratio(3) |
11.6 | 10.1 | 9.6 | ||||||||
| Average Balances | |||||||||||
| Assets | $ | 527 | $ | 531 | $ | 566 | |||||
| Securities | 121 | 131 | 138 | ||||||||
| Loans and leases | 308 | 309 | 328 | ||||||||
| Deposits | 388 | 389 | 400 | ||||||||
| CEO Commentary | ||
| Contact: | ||||||||
| Investors: | Brad Milsaps | 770.352.5347 | investors@truist.com | ||||||
| Media: | Hannah Joyce | 781.650.0403 | media@truist.com | ||||||

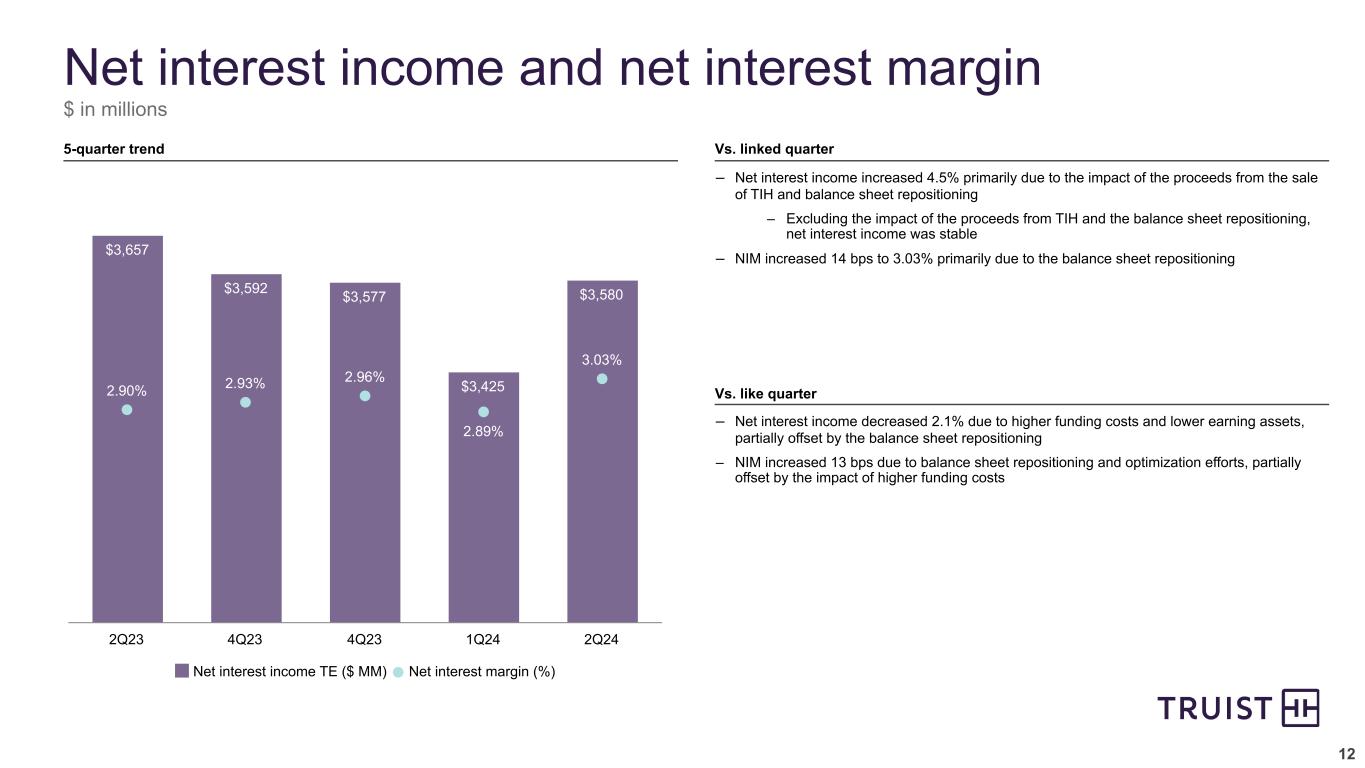
| Net Interest Income, Net Interest Margin, and Average Balances | |||||||||||||||||||||||||||||
| Quarter Ended | Change | ||||||||||||||||||||||||||||
| (Dollars in millions) | 2Q24 | 1Q24 | 2Q23 | Link | Like | ||||||||||||||||||||||||
Interest income(1) |
$ | 6,404 | $ | 6,237 | $ | 6,229 | $ | 167 | 2.7 | % | $ | 175 | 2.8 | % | |||||||||||||||
| Interest expense | 2,824 | 2,812 | 2,572 | 12 | 0.4 | 252 | 9.8 | ||||||||||||||||||||||
Net interest income(1) |
$ | 3,580 | $ | 3,425 | $ | 3,657 | $ | 155 | 4.5 | $ | (77) | (2.1) | |||||||||||||||||
Net interest margin(1) |
3.03 | % | 2.89 | % | 2.90 | % | 14 bps | 13 bps | |||||||||||||||||||||
Average Balances(2) |
|||||||||||||||||||||||||||||
| Total earning assets | $ | 473,666 | $ | 476,111 | $ | 505,712 | $ | (2,445) | (0.5) | % | $ | (32,046) | (6.3) | % | |||||||||||||||
| Total interest-bearing liabilities | 343,145 | 347,121 | 363,754 | (3,976) | (1.1) | (20,609) | (5.7) | ||||||||||||||||||||||
Yields / Rates(1) |
|||||||||||||||||||||||||||||
| Total earning assets | 5.42 | % | 5.26 | % | 4.94 | % | 16 bps | 48 bps | |||||||||||||||||||||
| Total interest-bearing liabilities | 3.31 | 3.26 | 2.84 | 5 bps | 47 bps | ||||||||||||||||||||||||

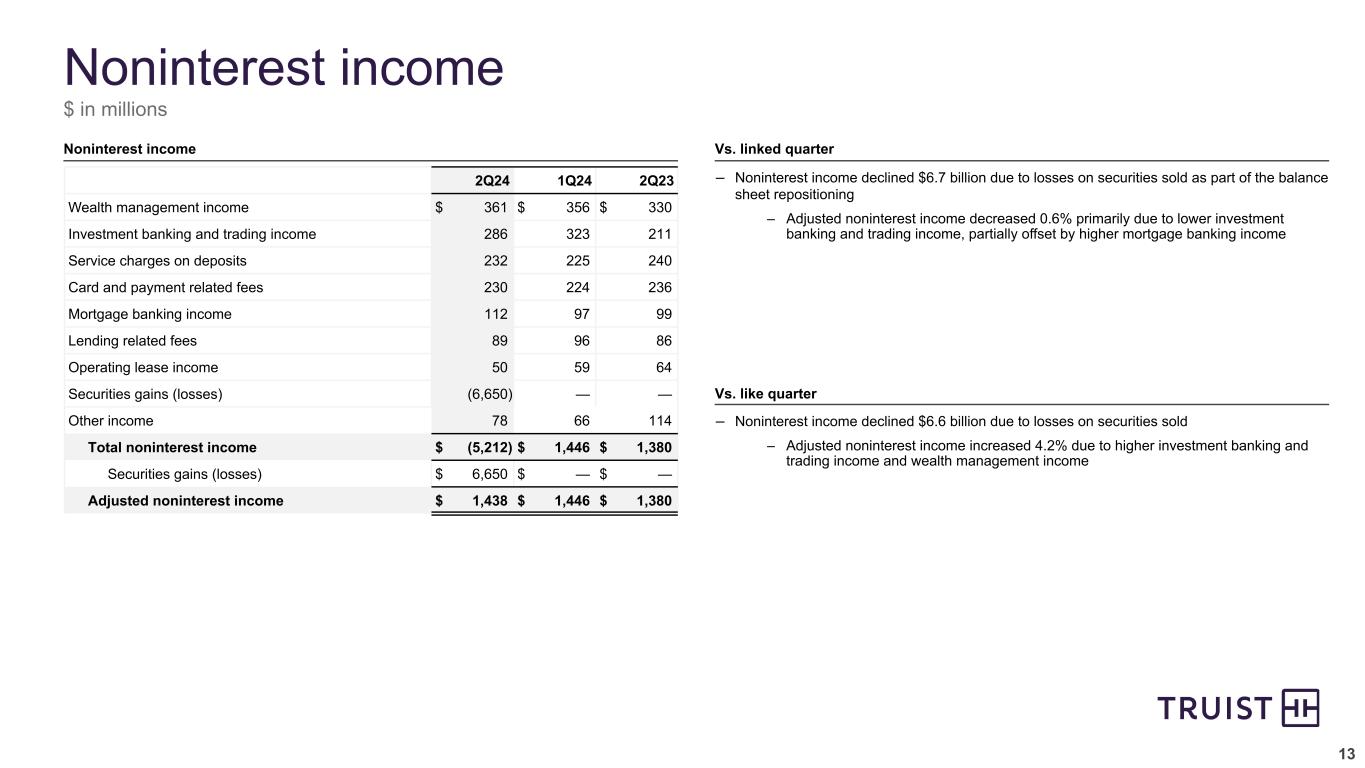
| Noninterest Income | |||||||||||||||||||||||||||||
| Quarter Ended | Change | ||||||||||||||||||||||||||||
| (Dollars in millions) | 2Q24 | 1Q24 | 2Q23 | Link | Like | ||||||||||||||||||||||||
| Wealth management income | $ | 361 | $ | 356 | $ | 330 | $ | 5 | 1.4 | % | $ | 31 | 9.4 | % | |||||||||||||||
| Investment banking and trading income | 286 | 323 | 211 | (37) | (11.5) | 75 | 35.5 | ||||||||||||||||||||||
| Service charges on deposits | 232 | 225 | 240 | 7 | 3.1 | (8) | (3.3) | ||||||||||||||||||||||
| Card and payment related fees | 230 | 224 | 236 | 6 | 2.7 | (6) | (2.5) | ||||||||||||||||||||||
| Mortgage banking income | 112 | 97 | 99 | 15 | 15.5 | 13 | 13.1 | ||||||||||||||||||||||
| Lending related fees | 89 | 96 | 86 | (7) | (7.3) | 3 | 3.5 | ||||||||||||||||||||||
| Operating lease income | 50 | 59 | 64 | (9) | (15.3) | (14) | (21.9) | ||||||||||||||||||||||
| Securities gains (losses) | (6,650) | — | — | (6,650) | NM | (6,650) | NM | ||||||||||||||||||||||
| Other income | 78 | 66 | 114 | 12 | 18.2 | (36) | (31.6) | ||||||||||||||||||||||
| Total noninterest income | $ | (5,212) | $ | 1,446 | $ | 1,380 | $ | (6,658) | NM | $ | (6,592) | (477.7) | |||||||||||||||||

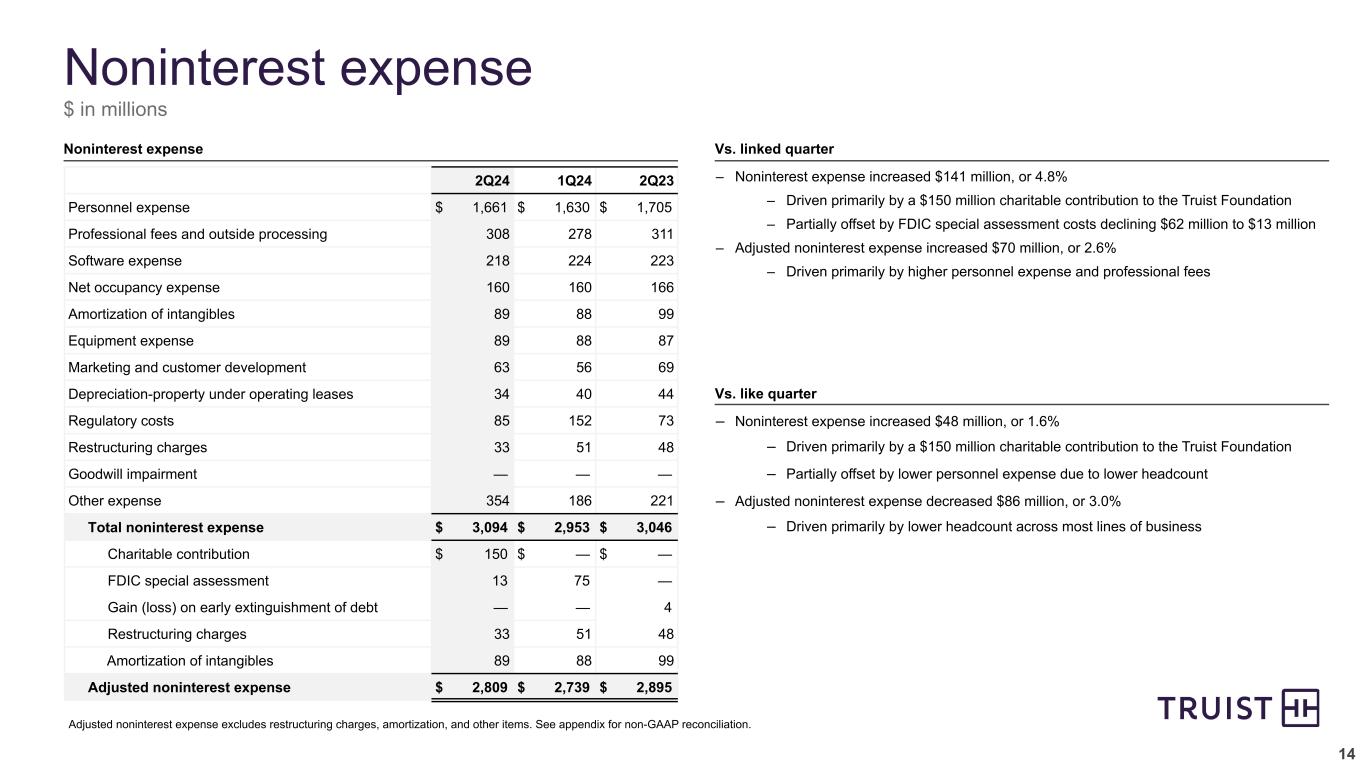
Noninterest Expense | |||||||||||||||||||||||||||||
| Quarter Ended | Change | ||||||||||||||||||||||||||||
| (Dollars in millions) | 2Q24 | 1Q24 | 2Q23 | Link | Like | ||||||||||||||||||||||||
| Personnel expense | $ | 1,661 | $ | 1,630 | $ | 1,705 | $ | 31 | 1.9 | % | $ | (44) | (2.6) | % | |||||||||||||||
| Professional fees and outside processing | 308 | 278 | 311 | 30 | 10.8 | (3) | (1.0) | ||||||||||||||||||||||
| Software expense | 218 | 224 | 223 | (6) | (2.7) | (5) | (2.2) | ||||||||||||||||||||||
| Net occupancy expense | 160 | 160 | 166 | — | — | (6) | (3.6) | ||||||||||||||||||||||
| Amortization of intangibles | 89 | 88 | 99 | 1 | 1.1 | (10) | (10.1) | ||||||||||||||||||||||
| Equipment expense | 89 | 88 | 87 | 1 | 1.1 | 2 | 2.3 | ||||||||||||||||||||||
| Marketing and customer development | 63 | 56 | 69 | 7 | 12.5 | (6) | (8.7) | ||||||||||||||||||||||
| Operating lease depreciation | 34 | 40 | 44 | (6) | (15.0) | (10) | (22.7) | ||||||||||||||||||||||
| Regulatory costs | 85 | 152 | 73 | (67) | (44.1) | 12 | 16.4 | ||||||||||||||||||||||
| Restructuring charges | 33 | 51 | 48 | (18) | (35.3) | (15) | (31.3) | ||||||||||||||||||||||
| Goodwill impairment | — | — | — | — | — | — | — | ||||||||||||||||||||||
| Other expense | 354 | 186 | 221 | 168 | 90.3 | 133 | 60.2 | ||||||||||||||||||||||
| Total noninterest expense | $ | 3,094 | $ | 2,953 | $ | 3,046 | $ | 141 | 4.8 | $ | 48 | 1.6 | |||||||||||||||||

| Provision for Income Taxes | |||||||||||||||||||||||||||||
| Quarter Ended | Change | ||||||||||||||||||||||||||||
| (Dollars in millions) | 2Q24 | 1Q24 | 2Q23 | Link | Like | ||||||||||||||||||||||||
| Provision (benefit) for income taxes | $ | (1,324) | $ | 232 | $ | 230 | $ | (1,556) | NM | $ | (1,554) | NM | |||||||||||||||||
| Effective tax rate | 25.3 | % | 17.0 | % | 16.4 | % | NM | NM | |||||||||||||||||||||
Average Loans and Leases | |||||||||||||||||||||||
| (Dollars in millions) | 2Q24 | 1Q24 | Change | % Change | |||||||||||||||||||
| Commercial: | |||||||||||||||||||||||
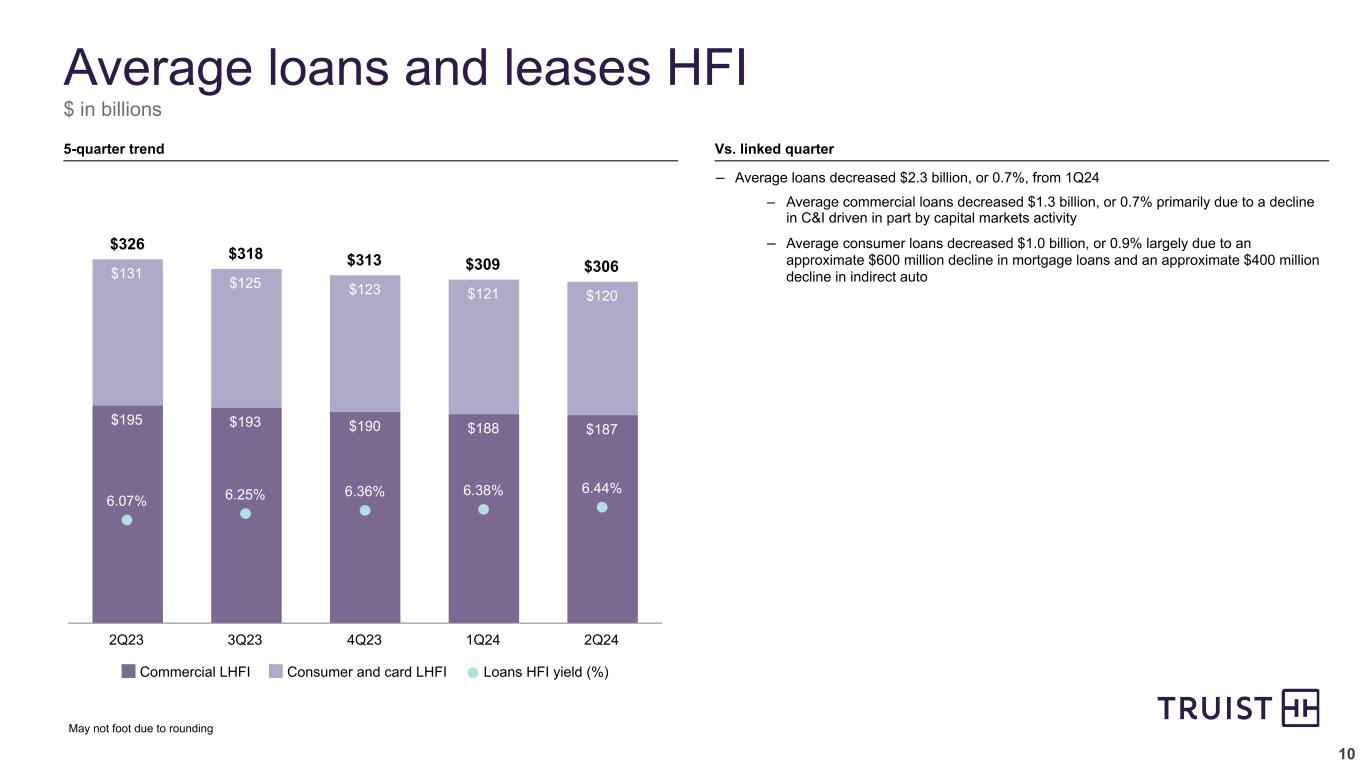
| Commercial and industrial | $ | 157,043 | $ | 158,385 | $ | (1,342) | (0.8) | % | |||||||||||||||
| CRE | 21,969 | 22,400 | (431) | (1.9) | |||||||||||||||||||
| Commercial construction | 7,645 | 7,134 | 511 | 7.2 | |||||||||||||||||||
| Total commercial | 186,657 | 187,919 | (1,262) | (0.7) | |||||||||||||||||||
| Consumer: | |||||||||||||||||||||||
| Residential mortgage | 54,490 | 55,070 | (580) | (1.1) | |||||||||||||||||||
| Home equity | 9,805 | 9,930 | (125) | (1.3) | |||||||||||||||||||
| Indirect auto | 22,016 | 22,374 | (358) | (1.6) | |||||||||||||||||||
| Other consumer | 28,326 | 28,285 | 41 | 0.1 | |||||||||||||||||||
| Total consumer | 114,637 | 115,659 | (1,022) | (0.9) | |||||||||||||||||||
| Credit card | 4,905 | 4,923 | (18) | (0.4) | |||||||||||||||||||
| Total loans and leases held for investment | $ | 306,199 | $ | 308,501 | $ | (2,302) | (0.7) | ||||||||||||||||
| Average Deposits | |||||||||||||||||||||||
| (Dollars in millions) | 2Q24 | 1Q24 | Change | % Change | |||||||||||||||||||
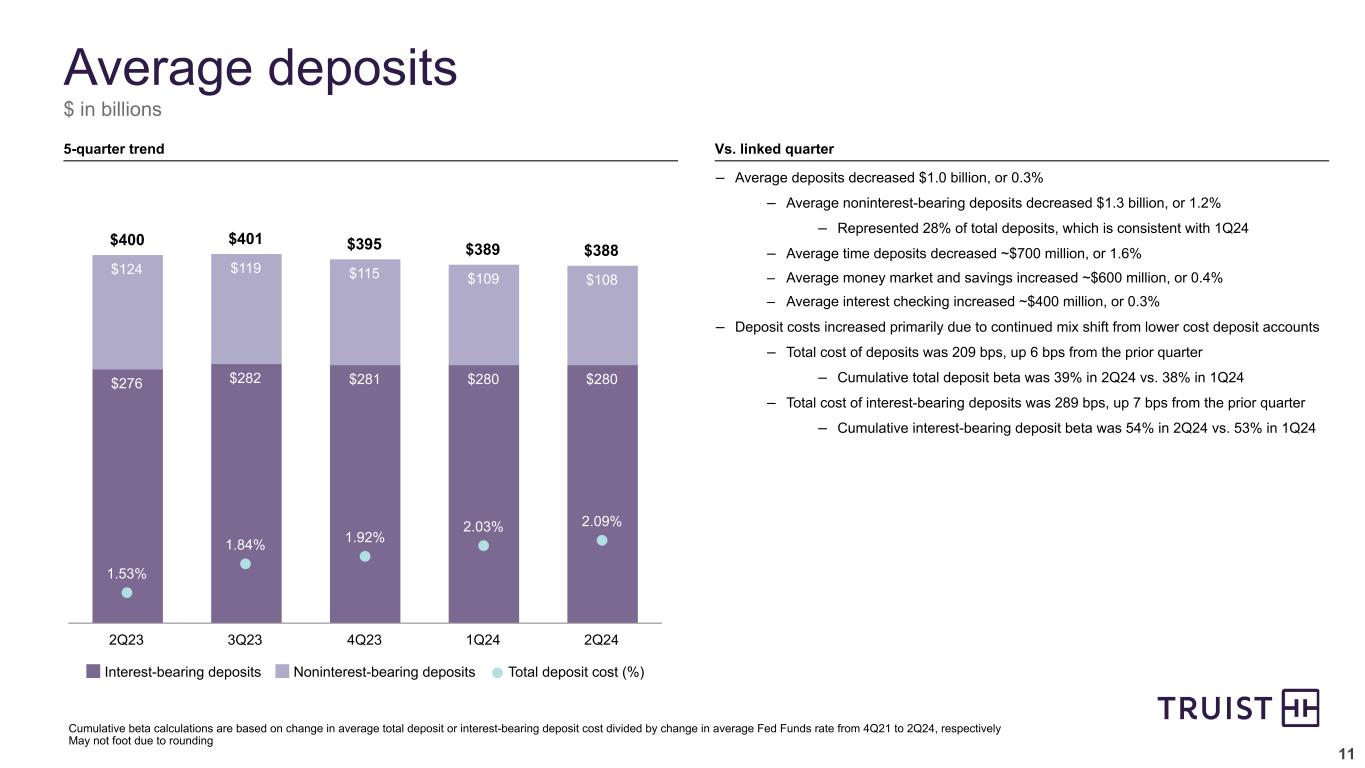
| Noninterest-bearing deposits | $ | 107,634 | $ | 108,888 | $ | (1,254) | (1.2) | % | |||||||||||||||
| Interest checking | 103,894 | 103,537 | 357 | 0.3 | |||||||||||||||||||
| Money market and savings | 135,264 | 134,696 | 568 | 0.4 | |||||||||||||||||||
| Time deposits | 41,250 | 41,937 | (687) | (1.6) | |||||||||||||||||||
| Total deposits | $ | 388,042 | $ | 389,058 | $ | (1,016) | (0.3) | ||||||||||||||||

Capital Ratios | |||||||||||||||||||||||||||||
| 2Q24 | 1Q24 | 4Q23 | 3Q23 | 2Q23 | |||||||||||||||||||||||||
| Risk-based: | (preliminary) | ||||||||||||||||||||||||||||
| CET1 | 11.6 | % | 10.1 | % | 10.1 | % | 9.9 | % | 9.6 | % | |||||||||||||||||||
| Tier 1 | 13.2 | 11.7 | 11.6 | 11.4 | 11.1 | ||||||||||||||||||||||||
| Total | 15.4 | 13.9 | 13.7 | 13.5 | 13.2 | ||||||||||||||||||||||||
| Leverage | 10.5 | 9.5 | 9.3 | 9.2 | 8.8 | ||||||||||||||||||||||||
| Supplementary leverage | 8.9 | 8.0 | 7.9 | 7.8 | 7.5 | ||||||||||||||||||||||||

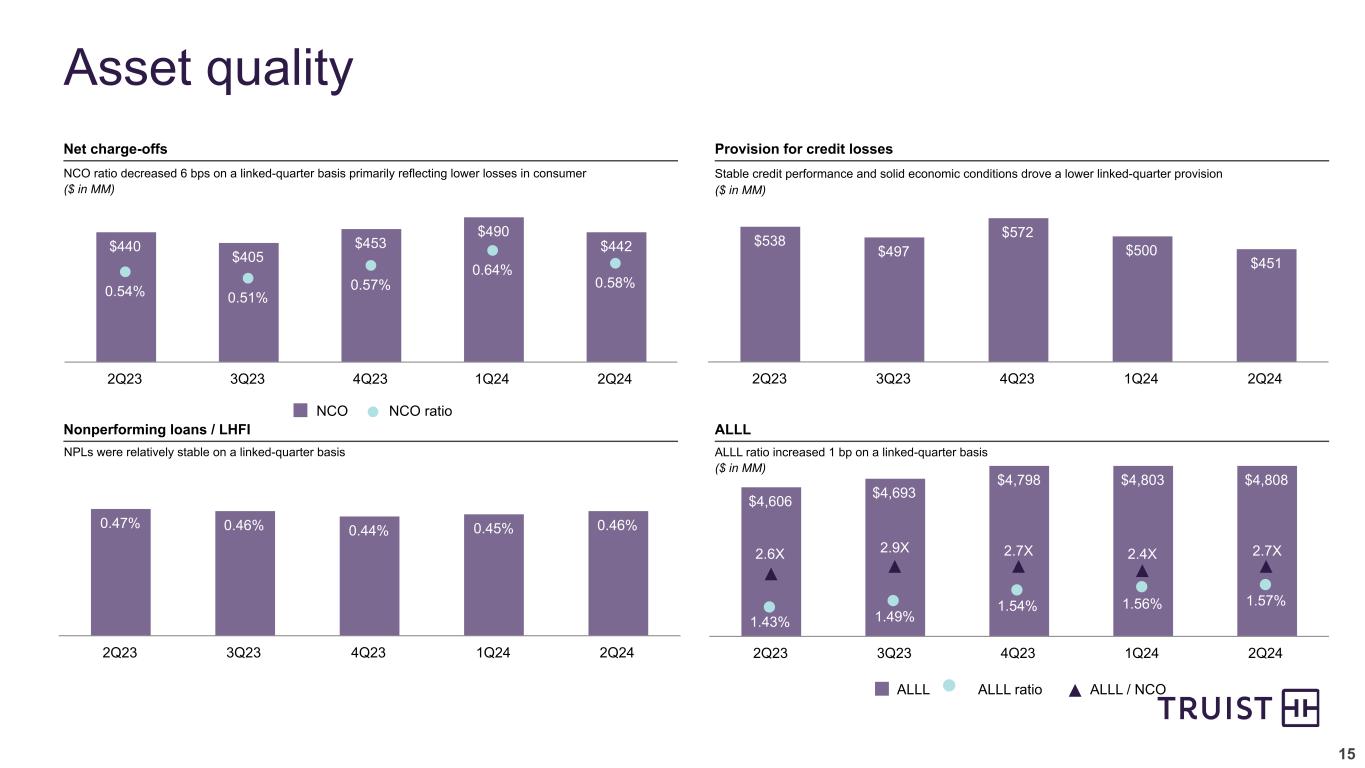
| Asset Quality | |||||||||||||||||||||||||||||
| (Dollars in millions) | 2Q24 | 1Q24 | 4Q23 | 3Q23 | 2Q23 | ||||||||||||||||||||||||
| Total nonperforming assets | $ | 1,476 | $ | 1,476 | $ | 1,488 | $ | 1,584 | $ | 1,583 | |||||||||||||||||||
| Total loans 90 days past due and still accruing | 489 | 538 | 534 | 574 | 662 | ||||||||||||||||||||||||
| Total loans 30-89 days past due and still accruing | 1,791 | 1,716 | 1,971 | 1,636 | 1,550 | ||||||||||||||||||||||||
Nonperforming loans and leases as a percentage of loans and leases held for investment |
0.46 | % | 0.45 | % | 0.44 | % | 0.46 | % | 0.47 | % | |||||||||||||||||||
| Loans 30-89 days past due and still accruing as a percentage of loans and leases | 0.59 | 0.56 | 0.63 | 0.52 | 0.48 | ||||||||||||||||||||||||
| Loans 90 days or more past due and still accruing as a percentage of loans and leases | 0.16 | 0.18 | 0.17 | 0.18 | 0.21 | ||||||||||||||||||||||||
| Loans 90 days or more past due and still accruing as a percentage of loans and leases, excluding government guaranteed | 0.04 | 0.04 | 0.04 | 0.04 | 0.04 | ||||||||||||||||||||||||
Allowance for loan and lease losses as a percentage of loans and leases held for investment |
1.57 | 1.56 | 1.54 | 1.49 | 1.43 | ||||||||||||||||||||||||
Ratio of allowance for loan and lease losses to net charge-offs |
2.7x | 2.4x | 2.7x | 2.9x | 2.6x | ||||||||||||||||||||||||
Ratio of allowance for loan and lease losses to nonperforming loans and leases held for investment |
3.4x | 3.4x | 3.5x | 3.2x | 3.0x | ||||||||||||||||||||||||
Provision for Credit Losses | |||||||||||||||||||||||||||||
| Quarter Ended | Change | ||||||||||||||||||||||||||||
| (Dollars in millions) | 2Q24 | 1Q24 | 2Q23 | Link | Like | ||||||||||||||||||||||||
| Provision for credit losses | $ | 451 | $ | 500 | $ | 538 | $ | (49) | (9.8) | % | $ | (87) | (16.2) | % | |||||||||||||||
| Net charge-offs | 442 | 490 | 440 | (48) | (9.8) | 2 | 0.5 | ||||||||||||||||||||||
Net charge-offs as a percentage of average loans and leases |
0.58 | % | 0.64 | % | 0.54 | % | (6) bps | 4 bps | |||||||||||||||||||||

Earnings Presentation and Quarterly Performance Summary | ||
About Truist | ||
| Glossary of Defined Terms | |||||
| Term | Definition | ||||
ACL |
Allowance for credit losses |
||||
ALLL |
Allowance for loan and lease losses |
||||
| BVPS | Book value (common equity) per share | ||||
| CEO | Chief Executive Officer | ||||
CET1 |
Common equity tier 1 |
||||
| CRE | Commercial real estate | ||||
| FDIC | Federal Deposit Insurance Corporation | ||||
| FHLB | Federal Home Loan Bank | ||||
| GAAP | Accounting principles generally accepted in the United States of America | ||||
| HFI | Held for investment | ||||
| LCR | Liquidity Coverage Ratio | ||||
| Like | Compared to second quarter of 2023 |
||||
| Link | Compared to first quarter of 2024 |
||||
NCO |
Net charge-offs |
||||
| NIM | Net interest margin, computed on a TE basis | ||||
| NM | Not meaningful | ||||
| PPNR | Pre-provision net revenue | ||||
| ROCE | Return on average common equity | ||||
ROTCE |
Return on average tangible common equity |
||||
TBVPS |
Tangible book value per common share | ||||
| TE | Taxable-equivalent | ||||
| TIH | Truist Insurance Holdings | ||||

| Non-GAAP Financial Information | ||

| Forward Looking Statements | ||

| Table of Contents | ||||||||
| Quarterly Performance Summary | ||||||||
| Truist Financial Corporation | ||||||||
| Page | ||||||||
| Financial Highlights | ||||||||
| Consolidated Statements of Income | ||||||||
| Consolidated Ending Balance Sheets | ||||||||
| Average Balances and Rates - Quarters | ||||||||
| Average Balances and Rates - Year-To-Date | ||||||||
| Credit Quality | ||||||||
| Segment Financial Performance | ||||||||
| Capital Information | ||||||||
| Selected Mortgage Banking Information & Additional Information | ||||||||
| Selected Items | ||||||||
| Quarter Ended | Year-to-Date | ||||||||||||||||||||||||||||||||||||||||
| (Dollars in millions, except per share data, shares in thousands) | June 30 | March 31 | Dec. 31 | Sept. 30 | June 30 | June 30 | June 30 | ||||||||||||||||||||||||||||||||||
| 2024 | 2024 | 2023 | 2023 | 2023 | 2024 | 2023 | |||||||||||||||||||||||||||||||||||
| Summary Income Statement | |||||||||||||||||||||||||||||||||||||||||
| Interest income - taxable equivalent | $ | 6,404 | $ | 6,237 | $ | 6,324 | $ | 6,284 | $ | 6,229 | $ | 12,641 | $ | 12,064 | |||||||||||||||||||||||||||
| Interest expense | 2,824 | 2,812 | 2,747 | 2,692 | 2,572 | 5,636 | 4,489 | ||||||||||||||||||||||||||||||||||
| Net interest income - taxable equivalent | 3,580 | 3,425 | 3,577 | 3,592 | 3,657 | 7,005 | 7,575 | ||||||||||||||||||||||||||||||||||
| Less: Taxable-equivalent adjustment | 53 | 53 | 58 | 57 | 54 | 106 | 105 | ||||||||||||||||||||||||||||||||||
| Net interest income | 3,527 | 3,372 | 3,519 | 3,535 | 3,603 | 6,899 | 7,470 | ||||||||||||||||||||||||||||||||||
| Provision for credit losses | 451 | 500 | 572 | 497 | 538 | 951 | 1,040 | ||||||||||||||||||||||||||||||||||
| Net interest income after provision for credit losses | 3,076 | 2,872 | 2,947 | 3,038 | 3,065 | 5,948 | 6,430 | ||||||||||||||||||||||||||||||||||
| Noninterest income | (5,212) | 1,446 | 1,363 | 1,334 | 1,380 | (3,766) | 2,801 | ||||||||||||||||||||||||||||||||||
| Noninterest expense | 3,094 | 2,953 | 9,557 | 3,060 | 3,046 | 6,047 | 6,061 | ||||||||||||||||||||||||||||||||||
| Income (loss) before income taxes | (5,230) | 1,365 | (5,247) | 1,312 | 1,399 | (3,865) | 3,170 | ||||||||||||||||||||||||||||||||||
| Provision (benefit) for income taxes | (1,324) | 232 | (56) | 203 | 230 | (1,092) | 591 | ||||||||||||||||||||||||||||||||||
Net income (loss) from continuing operations(1) |
(3,906) | 1,133 | (5,191) | 1,109 | 1,169 | (2,773) | 2,579 | ||||||||||||||||||||||||||||||||||
Net income (loss) from discontinued operations(1) |
4,828 | 67 | 101 | 74 | 176 | 4,895 | 281 | ||||||||||||||||||||||||||||||||||
| Net income (loss) | 922 | 1,200 | (5,090) | 1,183 | 1,345 | 2,122 | 2,860 | ||||||||||||||||||||||||||||||||||
Noncontrolling interests from discontinued operations(1) |
19 | 3 | — | 6 | 36 | 22 | 38 | ||||||||||||||||||||||||||||||||||
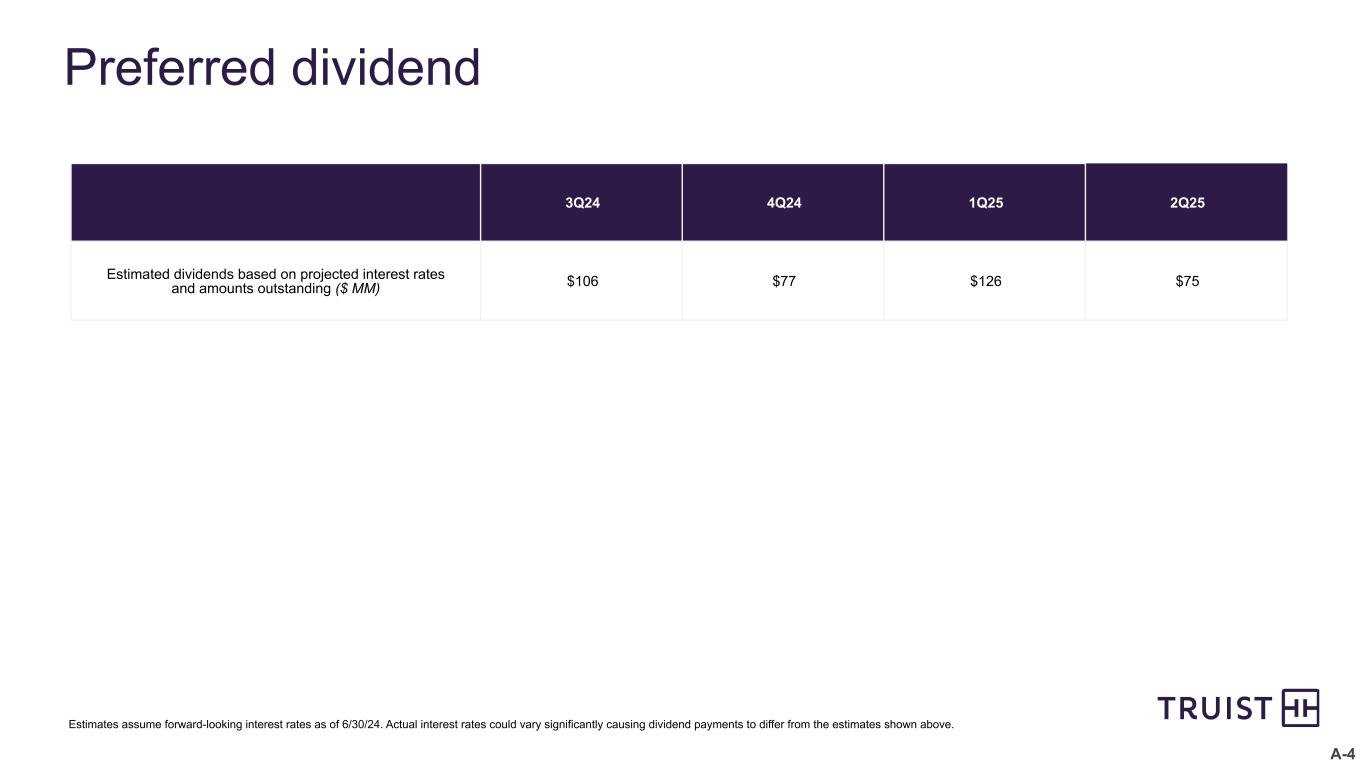
| Preferred stock dividends and other | 77 | 106 | 77 | 106 | 75 | 183 | 178 | ||||||||||||||||||||||||||||||||||
| Net income (loss) available to common shareholders | 826 | 1,091 | (5,167) | 1,071 | 1,234 | 1,917 | 2,644 | ||||||||||||||||||||||||||||||||||
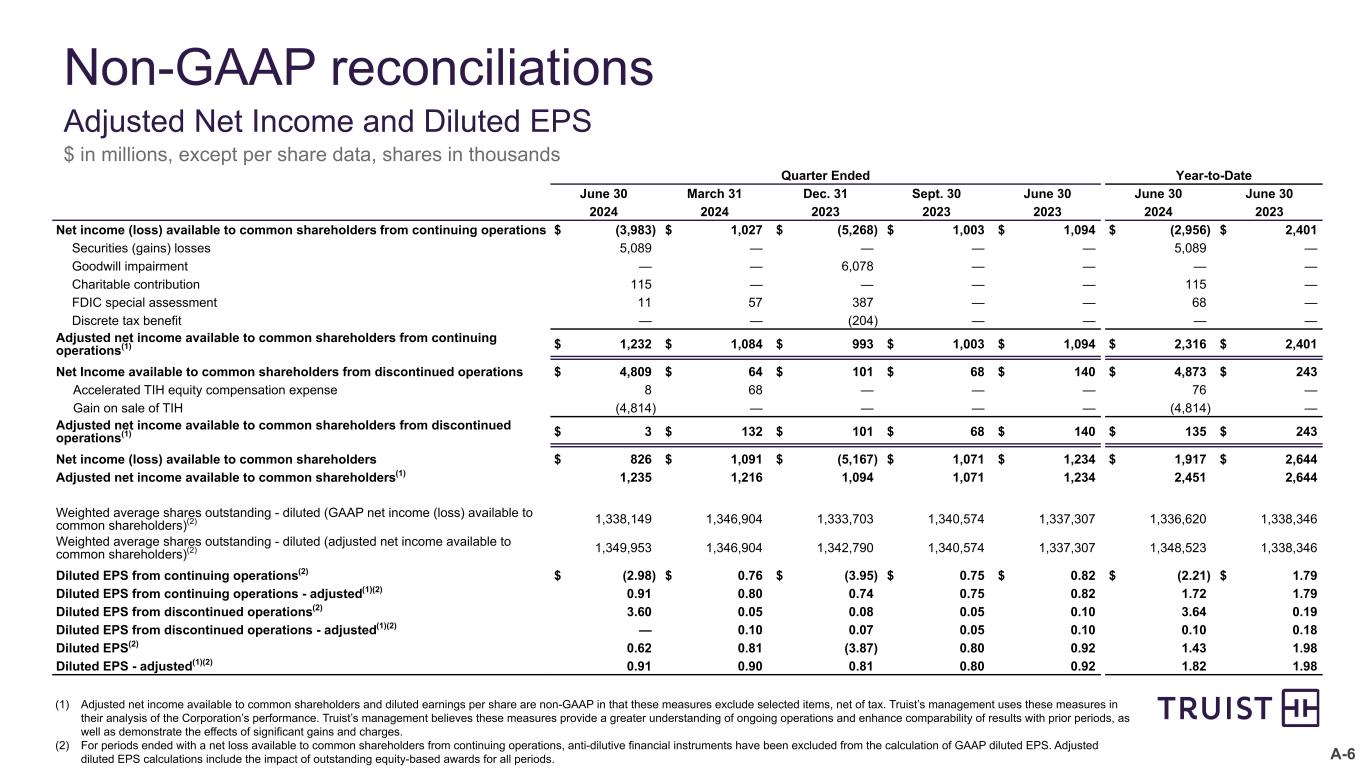
Net income available to common shareholders - adjusted(2) |
1,235 | 1,216 | 1,094 | 1,071 | 1,234 | 2,451 | 2,644 | ||||||||||||||||||||||||||||||||||
| Additional Income Statement Information | |||||||||||||||||||||||||||||||||||||||||
| Revenue - taxable equivalent | (1,632) | 4,871 | 4,940 | 4,926 | 5,037 | 3,239 | 10,376 | ||||||||||||||||||||||||||||||||||
Pre-provision net revenue - unadjusted(2) |
(4,726) | 1,918 | (4,617) | 1,866 | 1,991 | (2,808) | 4,315 | ||||||||||||||||||||||||||||||||||
Pre-provision net revenue - adjusted(2) |
2,209 | 2,132 | 2,221 | 2,025 | 2,142 | 4,341 | 4,622 | ||||||||||||||||||||||||||||||||||
| Key Metrics | |||||||||||||||||||||||||||||||||||||||||
| Earnings: | |||||||||||||||||||||||||||||||||||||||||
Earnings per share-basic from continuing operations(1)(3) |
$ | (2.98) | $ | 0.77 | $ | (3.95) | $ | 0.75 | $ | 0.82 | $ | (2.21) | $ | 1.80 | |||||||||||||||||||||||||||
| Earnings per share-basic | 0.62 | 0.82 | (3.87) | 0.80 | 0.93 | $ | 1.43 | $ | 1.99 | ||||||||||||||||||||||||||||||||
Earnings per share-diluted from continuing operations(1)(3) |
(2.98) | 0.76 | (3.95) | 0.75 | 0.82 | (2.21) | 1.79 | ||||||||||||||||||||||||||||||||||
| Earnings per share-diluted | 0.62 | 0.81 | (3.87) | 0.80 | 0.92 | 1.43 | 1.98 | ||||||||||||||||||||||||||||||||||
Earnings per share-adjusted diluted(2) |
0.91 | 0.90 | 0.81 | 0.80 | 0.92 | 1.82 | 1.98 | ||||||||||||||||||||||||||||||||||
| Cash dividends declared per share | 0.52 | 0.52 | 0.52 | 0.52 | 0.52 | 1.04 | 1.04 | ||||||||||||||||||||||||||||||||||
| Common shareholders’ equity per share | 42.71 | 38.97 | 39.31 | 41.37 | 42.68 | ||||||||||||||||||||||||||||||||||||
Tangible common shareholders’ equity per share(2) |
28.91 | 21.64 | 21.83 | 19.25 | 20.44 | ||||||||||||||||||||||||||||||||||||
| End of period shares outstanding | 1,338,223 | 1,338,096 | 1,333,743 | 1,333,668 | 1,331,976 | ||||||||||||||||||||||||||||||||||||
| Weighted average shares outstanding-basic | 1,338,149 | 1,335,091 | 1,333,703 | 1,333,522 | 1,331,953 | 1,336,620 | 1,330,286 | ||||||||||||||||||||||||||||||||||
| Weighted average shares outstanding-diluted | 1,338,149 | 1,346,904 | 1,333,703 | 1,340,574 | 1,337,307 | 1,336,620 | 1,338,346 | ||||||||||||||||||||||||||||||||||
| Return on average assets | 0.70 | % | 0.91 | % | (3.74) | % | 0.86 | % | 0.95 | % | 0.81 | % | 1.02 | % | |||||||||||||||||||||||||||
| Return on average common shareholders’ equity | 6.1 | 8.4 | (36.6) | 7.5 | 8.6 | 7.2 | 9.5 | ||||||||||||||||||||||||||||||||||
Return on average tangible common shareholders’ equity(2) |
10.4 | 16.3 | 15.0 | 17.3 | 19.4 | 12.5 | 21.6 | ||||||||||||||||||||||||||||||||||
Net interest margin - taxable equivalent(3) |
3.03 | 2.89 | 2.96 | 2.93 | 2.90 | 2.96 | 3.03 | ||||||||||||||||||||||||||||||||||
Efficiency ratio-GAAP(3) |
NM | 61.3 | 195.8 | 62.9 | 61.1 | NM | 59.0 | ||||||||||||||||||||||||||||||||||
Efficiency ratio-adjusted(2)(3) |
56.0 | 56.2 | 55.0 | 58.9 | 57.5 | 56.1 | 55.4 | ||||||||||||||||||||||||||||||||||
Fee income ratio-GAAP(3) |
NM | 30.0 | 27.9 | 27.4 | 27.7 | NM | 27.3 | ||||||||||||||||||||||||||||||||||
Fee income ratio-adjusted(2)(3) |
28.7 | 29.7 | 27.6 | 27.1 | 27.4 | 29.2 | 27.0 | ||||||||||||||||||||||||||||||||||
| Credit Quality | |||||||||||||||||||||||||||||||||||||||||
| Nonperforming loans and leases as a percentage of LHFI | 0.46 | % | 0.45 | % | 0.44 | % | 0.46 | % | 0.47 | % | 0.28 | % | 0.29 | % | |||||||||||||||||||||||||||
| Net charge-offs as a percentage of average LHFI | 0.58 | 0.64 | 0.57 | 0.51 | 0.54 | 0.61 | % | 0.46 | % | ||||||||||||||||||||||||||||||||
| Allowance for loan and lease losses as a percentage of LHFI | 1.57 | 1.56 | 1.54 | 1.49 | 1.43 | ||||||||||||||||||||||||||||||||||||
| Ratio of allowance for loan and lease losses to nonperforming LHFI | 3.4x | 3.4x | 3.5x | 3.2x | 3.0x | ||||||||||||||||||||||||||||||||||||
| Average Balances | |||||||||||||||||||||||||||||||||||||||||
| Assets | $ | 526,894 | $ | 531,002 | $ | 539,656 | $ | 547,704 | $ | 565,822 | $ | 528,948 | $ | 562,741 | |||||||||||||||||||||||||||
Securities(4) |
121,318 | 131,273 | 133,390 | 135,527 | 138,393 | 126,295 | 139,466 | ||||||||||||||||||||||||||||||||||
| Loans and leases | 307,583 | 309,426 | 313,832 | 319,881 | 328,258 | 308,505 | 327,905 | ||||||||||||||||||||||||||||||||||
| Deposits | 388,042 | 389,058 | 395,333 | 401,038 | 399,826 | 388,550 | 404,118 | ||||||||||||||||||||||||||||||||||
| Common shareholders’ equity | 54,863 | 52,167 | 56,061 | 56,472 | 57,302 | 53,515 | 56,346 | ||||||||||||||||||||||||||||||||||
| Total shareholders’ equity | 61,677 | 59,011 | 62,896 | 63,312 | 64,101 | 60,344 | 63,095 | ||||||||||||||||||||||||||||||||||
| Period-End Balances | |||||||||||||||||||||||||||||||||||||||||
| Assets | $ | 519,853 | $ | 534,959 | $ | 535,349 | $ | 542,707 | $ | 554,549 | |||||||||||||||||||||||||||||||
Securities(4) |
108,416 | 119,419 | 121,473 | 120,059 | 124,923 | ||||||||||||||||||||||||||||||||||||
| Loans and leases | 307,149 | 308,477 | 313,341 | 317,112 | 324,015 | ||||||||||||||||||||||||||||||||||||
| Deposits | 385,411 | 394,265 | 395,865 | 400,024 | 406,043 | ||||||||||||||||||||||||||||||||||||
| Common shareholders’ equity | 57,154 | 52,148 | 52,428 | 55,167 | 56,853 | ||||||||||||||||||||||||||||||||||||
| Total shareholders’ equity | 63,827 | 59,053 | 59,253 | 62,007 | 63,681 | ||||||||||||||||||||||||||||||||||||
| Capital and Liquidity Ratios | (preliminary) | ||||||||||||||||||||||||||||||||||||||||
| Common equity tier 1 | 11.6 | % | 10.1 | % | 10.1 | % | 9.9 | % | 9.6 | % | |||||||||||||||||||||||||||||||
| Tier 1 | 13.2 | 11.7 | 11.6 | 11.4 | 11.1 | ||||||||||||||||||||||||||||||||||||
| Total | 15.4 | 13.9 | 13.7 | 13.5 | 13.2 | ||||||||||||||||||||||||||||||||||||
| Leverage | 10.5 | 9.5 | 9.3 | 9.2 | 8.8 | ||||||||||||||||||||||||||||||||||||
| Supplementary leverage | 8.9 | 8.0 | 7.9 | 7.8 | 7.5 | ||||||||||||||||||||||||||||||||||||
| Liquidity coverage ratio | 110 | 115 | 112 | 110 | 112 | ||||||||||||||||||||||||||||||||||||
| Quarter Ended | Year-to-Date | ||||||||||||||||||||||||||||||||||||||||
| June 30 | March 31 | Dec. 31 | Sept. 30 | June 30 | June 30 | June 30 | |||||||||||||||||||||||||||||||||||
| (Dollars in millions, except per share data, shares in thousands) | 2024 | 2024 | 2023 | 2023 | 2023 | 2024 | 2023 | ||||||||||||||||||||||||||||||||||
| Interest Income | |||||||||||||||||||||||||||||||||||||||||
| Interest and fees on loans and leases | $ | 4,879 | $ | 4,865 | $ | 4,971 | $ | 4,976 | $ | 4,915 | $ | 9,744 | $ | 9,571 | |||||||||||||||||||||||||||
| Interest on securities | 838 | 805 | 802 | 763 | 749 | 1,643 | 1,501 | ||||||||||||||||||||||||||||||||||
| Interest on other earning assets | 634 | 514 | 493 | 488 | 511 | 1,148 | 887 | ||||||||||||||||||||||||||||||||||
| Total interest income | 6,351 | 6,184 | 6,266 | 6,227 | 6,175 | 12,535 | 11,959 | ||||||||||||||||||||||||||||||||||
| Interest Expense | |||||||||||||||||||||||||||||||||||||||||
| Interest on deposits | 2,016 | 1,964 | 1,917 | 1,858 | 1,527 | 3,980 | 2,652 | ||||||||||||||||||||||||||||||||||
| Interest on long-term debt | 446 | 482 | 476 | 491 | 734 | 928 | 1,248 | ||||||||||||||||||||||||||||||||||
| Interest on other borrowings | 362 | 366 | 354 | 343 | 311 | 728 | 589 | ||||||||||||||||||||||||||||||||||
| Total interest expense | 2,824 | 2,812 | 2,747 | 2,692 | 2,572 | 5,636 | 4,489 | ||||||||||||||||||||||||||||||||||
| Net Interest Income | 3,527 | 3,372 | 3,519 | 3,535 | 3,603 | 6,899 | 7,470 | ||||||||||||||||||||||||||||||||||
| Provision for credit losses | 451 | 500 | 572 | 497 | 538 | 951 | 1,040 | ||||||||||||||||||||||||||||||||||
| Net Interest Income After Provision for Credit Losses | 3,076 | 2,872 | 2,947 | 3,038 | 3,065 | 5,948 | 6,430 | ||||||||||||||||||||||||||||||||||
| Noninterest Income | |||||||||||||||||||||||||||||||||||||||||
| Wealth management income | 361 | 356 | 346 | 343 | 330 | 717 | 669 | ||||||||||||||||||||||||||||||||||
| Investment banking and trading income | 286 | 323 | 165 | 185 | 211 | 609 | 472 | ||||||||||||||||||||||||||||||||||
| Service charges on deposits | 232 | 225 | 229 | 154 | 240 | 457 | 490 | ||||||||||||||||||||||||||||||||||
| Card and payment related fees | 230 | 224 | 232 | 238 | 236 | 454 | 466 | ||||||||||||||||||||||||||||||||||
| Mortgage banking income | 112 | 97 | 94 | 102 | 99 | 209 | 241 | ||||||||||||||||||||||||||||||||||
| Lending related fees | 89 | 96 | 153 | 102 | 86 | 185 | 192 | ||||||||||||||||||||||||||||||||||
| Operating lease income | 50 | 59 | 60 | 63 | 64 | 109 | 131 | ||||||||||||||||||||||||||||||||||
| Securities gains (losses) | (6,650) | — | — | — | — | (6,650) | — | ||||||||||||||||||||||||||||||||||
| Other income | 78 | 66 | 84 | 147 | 114 | 144 | 140 | ||||||||||||||||||||||||||||||||||
| Total noninterest income | (5,212) | 1,446 | 1,363 | 1,334 | 1,380 | (3,766) | 2,801 | ||||||||||||||||||||||||||||||||||
| Noninterest Expense | |||||||||||||||||||||||||||||||||||||||||
| Personnel expense | 1,661 | 1,630 | 1,474 | 1,669 | 1,705 | 3,291 | 3,373 | ||||||||||||||||||||||||||||||||||
| Professional fees and outside processing | 308 | 278 | 305 | 289 | 311 | 586 | 598 | ||||||||||||||||||||||||||||||||||
| Software expense | 218 | 224 | 223 | 222 | 223 | 442 | 423 | ||||||||||||||||||||||||||||||||||
| Net occupancy expense | 160 | 160 | 159 | 164 | 166 | 320 | 335 | ||||||||||||||||||||||||||||||||||
| Amortization of intangibles | 89 | 88 | 98 | 98 | 99 | 177 | 199 | ||||||||||||||||||||||||||||||||||
| Equipment expense | 89 | 88 | 103 | 89 | 87 | 177 | 189 | ||||||||||||||||||||||||||||||||||
| Marketing and customer development | 63 | 56 | 53 | 70 | 69 | 119 | 137 | ||||||||||||||||||||||||||||||||||
| Operating lease depreciation | 34 | 40 | 42 | 43 | 44 | 74 | 90 | ||||||||||||||||||||||||||||||||||
| Regulatory costs | 85 | 152 | 599 | 77 | 73 | 237 | 148 | ||||||||||||||||||||||||||||||||||
| Restructuring charges | 33 | 51 | 155 | 61 | 48 | 84 | 104 | ||||||||||||||||||||||||||||||||||
| Goodwill impairment | — | — | 6,078 | — | — | — | — | ||||||||||||||||||||||||||||||||||
| Other expense | 354 | 186 | 268 | 278 | 221 | 540 | 465 | ||||||||||||||||||||||||||||||||||
| Total noninterest expense | 3,094 | 2,953 | 9,557 | 3,060 | 3,046 | 6,047 | 6,061 | ||||||||||||||||||||||||||||||||||
| Earnings | |||||||||||||||||||||||||||||||||||||||||
| Income (loss) before income taxes | (5,230) | 1,365 | (5,247) | 1,312 | 1,399 | (3,865) | 3,170 | ||||||||||||||||||||||||||||||||||
| Provision (benefit) for income taxes | (1,324) | 232 | (56) | 203 | 230 | (1,092) | 591 | ||||||||||||||||||||||||||||||||||
Net income (loss) from continuing operations(1) |
(3,906) | 1,133 | (5,191) | 1,109 | 1,169 | (2,773) | 2,579 | ||||||||||||||||||||||||||||||||||
Net income from discontinued operations(1) |
4,828 | 67 | 101 | 74 | 176 | 4,895 | 281 | ||||||||||||||||||||||||||||||||||
| Net income (loss) | 922 | 1,200 | (5,090) | 1,183 | 1,345 | 2,122 | 2,860 | ||||||||||||||||||||||||||||||||||
Noncontrolling interests from discontinuing operations(1) |
19 | 3 | — | 6 | 36 | 22 | 38 | ||||||||||||||||||||||||||||||||||
| Preferred stock dividends and other | 77 | 106 | 77 | 106 | 75 | 183 | 178 | ||||||||||||||||||||||||||||||||||
| Net income (loss) available to common shareholders | $ | 826 | $ | 1,091 | $ | (5,167) | $ | 1,071 | $ | 1,234 | $ | 1,917 | $ | 2,644 | |||||||||||||||||||||||||||
| Earnings Per Common Share | |||||||||||||||||||||||||||||||||||||||||
Basic earnings from continuing operations(1) |
$ | (2.98) | $ | 0.77 | $ | (3.95) | $ | 0.75 | $ | 0.82 | $ | (2.21) | $ | 1.80 | |||||||||||||||||||||||||||
| Basic earnings | 0.62 | 0.82 | (3.87) | 0.80 | 0.93 | $ | 1.43 | 1.99 | |||||||||||||||||||||||||||||||||
Diluted earnings from continuing operations(1) |
(2.98) | 0.76 | (3.95) | 0.75 | 0.82 | (2.21) | 1.79 | ||||||||||||||||||||||||||||||||||
| Diluted earnings | 0.62 | 0.81 | (3.87) | 0.80 | 0.92 | 1.43 | 1.98 | ||||||||||||||||||||||||||||||||||
| Weighted Average Shares Outstanding | |||||||||||||||||||||||||||||||||||||||||
| Basic | 1,338,149 | 1,335,091 | 1,333,703 | 1,333,522 | 1,331,953 | 1,336,620 | 1,330,286 | ||||||||||||||||||||||||||||||||||
| Diluted | 1,338,149 | 1,346,904 | 1,333,703 | 1,340,574 | 1,337,307 | 1,336,620 | 1,338,346 | ||||||||||||||||||||||||||||||||||
| June 30 | March 31 | Dec. 31 | Sept. 30 | June 30 | |||||||||||||||||||||||||
| (Dollars in millions) | 2024 | 2024 | 2023 | 2023 | 2023 | ||||||||||||||||||||||||
| Assets | |||||||||||||||||||||||||||||
| Cash and due from banks | $ | 5,204 | $ | 5,040 | $ | 5,000 | $ | 5,090 | $ | 4,733 | |||||||||||||||||||
| Interest-bearing deposits with banks | 35,675 | 29,510 | 25,230 | 24,305 | 24,934 | ||||||||||||||||||||||||
| Securities borrowed or purchased under resale agreements | 2,338 | 2,091 | 2,378 | 2,018 | 2,315 | ||||||||||||||||||||||||
| Trading assets at fair value | 5,558 | 5,268 | 4,332 | 4,384 | 4,097 | ||||||||||||||||||||||||
| Securities available for sale at fair value | 55,969 | 66,050 | 67,366 | 65,117 | 68,965 | ||||||||||||||||||||||||
| Securities held to maturity at amortized cost | 52,447 | 53,369 | 54,107 | 54,942 | 55,958 | ||||||||||||||||||||||||
| Loans and leases: | |||||||||||||||||||||||||||||
| Commercial: | |||||||||||||||||||||||||||||
| Commercial and industrial | 156,400 | 157,669 | 160,788 | 162,330 | 167,153 | ||||||||||||||||||||||||
| CRE | 21,730 | 22,142 | 22,570 | 22,736 | 22,825 | ||||||||||||||||||||||||
| Commercial construction | 7,787 | 7,472 | 6,683 | 6,343 | 5,943 | ||||||||||||||||||||||||
| Consumer: | |||||||||||||||||||||||||||||
| Residential mortgage | 54,344 | 54,886 | 55,492 | 56,013 | 56,476 | ||||||||||||||||||||||||
| Home equity | 9,772 | 9,825 | 10,053 | 10,160 | 10,348 | ||||||||||||||||||||||||
| Indirect auto | 21,994 | 22,145 | 22,727 | 24,084 | 25,759 | ||||||||||||||||||||||||
| Other consumer | 28,677 | 28,096 | 28,647 | 29,105 | 28,755 | ||||||||||||||||||||||||
| Credit card | 4,988 | 4,989 | 5,101 | 4,928 | 4,833 | ||||||||||||||||||||||||
| Total loans and leases held for investment | 305,692 | 307,224 | 312,061 | 315,699 | 322,092 | ||||||||||||||||||||||||
| Loans held for sale | 1,457 | 1,253 | 1,280 | 1,413 | 1,923 | ||||||||||||||||||||||||
| Total loans and leases | 307,149 | 308,477 | 313,341 | 317,112 | 324,015 | ||||||||||||||||||||||||
| Allowance for loan and lease losses | (4,808) | (4,803) | (4,798) | (4,693) | (4,606) | ||||||||||||||||||||||||
| Premises and equipment | 3,244 | 3,274 | 3,298 | 3,319 | 3,379 | ||||||||||||||||||||||||
| Goodwill | 17,157 | 17,157 | 17,156 | 23,234 | 23,235 | ||||||||||||||||||||||||
| Core deposit and other intangible assets | 1,729 | 1,816 | 1,909 | 2,011 | 2,111 | ||||||||||||||||||||||||
| Loan servicing rights at fair value | 3,410 | 3,417 | 3,378 | 3,537 | 3,497 | ||||||||||||||||||||||||
| Other assets | 34,781 | 36,521 | 34,997 | 34,858 | 33,864 | ||||||||||||||||||||||||
Assets of discontinued operations(1) |
— | 7,772 | 7,655 | 7,473 | 8,052 | ||||||||||||||||||||||||
| Total assets | $ | 519,853 | $ | 534,959 | $ | 535,349 | $ | 542,707 | $ | 554,549 | |||||||||||||||||||
| Liabilities | |||||||||||||||||||||||||||||
| Deposits: | |||||||||||||||||||||||||||||
| Noninterest-bearing deposits | $ | 107,310 | $ | 110,901 | $ | 111,624 | $ | 116,674 | $ | 121,831 | |||||||||||||||||||
| Interest checking | 102,654 | 108,329 | 104,757 | 103,288 | 106,471 | ||||||||||||||||||||||||
| Money market and savings | 136,989 | 133,176 | 135,923 | 137,914 | 135,514 | ||||||||||||||||||||||||
| Time deposits | 38,458 | 41,859 | 43,561 | 42,148 | 42,227 | ||||||||||||||||||||||||
| Total deposits | 385,411 | 394,265 | 395,865 | 400,024 | 406,043 | ||||||||||||||||||||||||
| Short-term borrowings | 22,816 | 26,329 | 24,828 | 23,485 | 24,456 | ||||||||||||||||||||||||
| Long-term debt | 34,616 | 39,071 | 38,918 | 41,232 | 44,749 | ||||||||||||||||||||||||
| Other liabilities | 13,183 | 13,119 | 12,946 | 12,962 | 11,788 | ||||||||||||||||||||||||
| Liabilities of discontinued operations | — | 3,122 | 3,539 | 2,997 | 3,832 | ||||||||||||||||||||||||
| Total liabilities | 456,026 | 475,906 | 476,096 | 480,700 | 490,868 | ||||||||||||||||||||||||
| Shareholders’ Equity: | |||||||||||||||||||||||||||||
| Preferred stock | 6,673 | 6,673 | 6,673 | 6,673 | 6,673 | ||||||||||||||||||||||||
| Common stock | 6,691 | 6,690 | 6,669 | 6,668 | 6,660 | ||||||||||||||||||||||||
| Additional paid-in capital | 36,364 | 36,197 | 36,177 | 36,114 | 35,990 | ||||||||||||||||||||||||
| Retained earnings | 22,603 | 22,483 | 22,088 | 27,944 | 27,577 | ||||||||||||||||||||||||
| Accumulated other comprehensive loss | (8,504) | (13,222) | (12,506) | (15,559) | (13,374) | ||||||||||||||||||||||||
| Noncontrolling interests | — | 232 | 152 | 167 | 155 | ||||||||||||||||||||||||
| Total shareholders’ equity | 63,827 | 59,053 | 59,253 | 62,007 | 63,681 | ||||||||||||||||||||||||
| Total liabilities and shareholders’ equity | $ | 519,853 | $ | 534,959 | $ | 535,349 | $ | 542,707 | $ | 554,549 | |||||||||||||||||||
| Quarter Ended | |||||||||||||||||||||||||||||||||||||||||||||||||||||||||||
| June 30, 2024 | March 31, 2024 | December 31, 2023 | September 30, 2023 | June 30, 2023 | |||||||||||||||||||||||||||||||||||||||||||||||||||||||
| (Dollars in millions) | Average Balances(1) |
Income/ Expense(2) |
Yields/ Rates(2) |
Average Balances(1) |
Income/ Expense(2) |
Yields/ Rates(2) |
Average Balances(1) |
Income/ Expense(2) |
Yields/ Rates(2) |
Average Balances(1) |
Income/ Expense(2) |
Yields/ Rates(2) |
Average Balances(1) |
Income/ Expense(2) |
Yields/ Rates(2) |
||||||||||||||||||||||||||||||||||||||||||||
| Assets | |||||||||||||||||||||||||||||||||||||||||||||||||||||||||||
| AFS and HTM securities at amortized cost: | |||||||||||||||||||||||||||||||||||||||||||||||||||||||||||
| U.S. Treasury | $ | 11,145 | $ | 101 | 3.66 | % | $ | 9,853 | $ | 37 | 1.49 | % | $ | 10,967 | $ | 38 | 1.37 | % | $ | 10,886 | $ | 34 | 1.27 | % | $ | 11,115 | $ | 30 | 1.10 | % | |||||||||||||||||||||||||||||
| U.S. government-sponsored entities (GSE) | 382 | 3 | 3.27 | 389 | 3 | 3.40 | 389 | 2 | 3.23 | 339 | 3 | 2.92 | 329 | 3 | 2.70 | ||||||||||||||||||||||||||||||||||||||||||||
| Mortgage-backed securities issued by GSE | 107,901 | 720 | 2.67 | 116,946 | 735 | 2.51 | 117,868 | 736 | 2.50 | 120,078 | 701 | 2.33 | 122,647 | 690 | 2.25 | ||||||||||||||||||||||||||||||||||||||||||||
| States and political subdivisions | 420 | 5 | 4.14 | 421 | 4 | 4.15 | 421 | 5 | 4.16 | 423 | 4 | 4.12 | 425 | 5 | 4.18 | ||||||||||||||||||||||||||||||||||||||||||||
| Non-agency mortgage-backed | 1,452 | 10 | 2.61 | 3,645 | 27 | 2.98 | 3,725 | 22 | 2.37 | 3,781 | 22 | 2.33 | 3,852 | 22 | 2.32 | ||||||||||||||||||||||||||||||||||||||||||||
| Other | 18 | — | 5.29 | 19 | — | 5.35 | 20 | — | 5.47 | 20 | 1 | 5.55 | 25 | — | 5.20 | ||||||||||||||||||||||||||||||||||||||||||||
| Total securities | 121,318 | 839 | 2.77 | 131,273 | 806 | 2.46 | 133,390 | 803 | 2.41 | 135,527 | 765 | 2.26 | 138,393 | 750 | 2.17 | ||||||||||||||||||||||||||||||||||||||||||||
| Loans and leases: | |||||||||||||||||||||||||||||||||||||||||||||||||||||||||||
| Commercial: | |||||||||||||||||||||||||||||||||||||||||||||||||||||||||||
| Commercial and industrial | 157,043 | 2,550 | 6.53 | 158,385 | 2,572 | 6.53 | 160,278 | 2,657 | 6.58 | 164,022 | 2,686 | 6.50 | 166,588 | 2,610 | 6.28 | ||||||||||||||||||||||||||||||||||||||||||||
| CRE | 21,969 | 381 | 6.93 | 22,400 | 389 | 6.95 | 22,755 | 400 | 6.94 | 22,812 | 396 | 6.85 | 22,706 | 384 | 6.73 | ||||||||||||||||||||||||||||||||||||||||||||
| Commercial construction | 7,645 | 147 | 7.85 | 7,134 | 137 | 7.83 | 6,515 | 127 | 7.84 | 6,194 | 120 | 7.83 | 5,921 | 111 | 7.64 | ||||||||||||||||||||||||||||||||||||||||||||
| Consumer: | |||||||||||||||||||||||||||||||||||||||||||||||||||||||||||
| Residential mortgage | 54,490 | 525 | 3.86 | 55,070 | 528 | 3.84 | 55,658 | 532 | 3.83 | 56,135 | 532 | 3.79 | 56,320 | 531 | 3.77 | ||||||||||||||||||||||||||||||||||||||||||||
| Home equity | 9,805 | 195 | 8.02 | 9,930 | 196 | 7.92 | 10,104 | 199 | 7.80 | 10,243 | 196 | 7.61 | 10,478 | 190 | 7.26 | ||||||||||||||||||||||||||||||||||||||||||||
| Indirect auto | 22,016 | 381 | 6.95 | 22,374 | 372 | 6.69 | 23,368 | 381 | 6.46 | 24,872 | 386 | 6.16 | 26,558 | 398 | 6.01 | ||||||||||||||||||||||||||||||||||||||||||||
| Other consumer | 28,326 | 581 | 8.25 | 28,285 | 561 | 7.98 | 28,913 | 561 | 7.69 | 28,963 | 542 | 7.43 | 28,189 | 499 | 7.10 | ||||||||||||||||||||||||||||||||||||||||||||
| Student | — | — | — | — | — | — | — | — | — | — | 1 | — | 4,766 | 80 | 6.76 | ||||||||||||||||||||||||||||||||||||||||||||
| Credit card | 4,905 | 148 | 12.14 | 4,923 | 146 | 11.96 | 4,996 | 149 | 11.84 | 4,875 | 143 | 11.62 | 4,846 | 137 | 11.48 | ||||||||||||||||||||||||||||||||||||||||||||
| Total loans and leases held for investment | 306,199 | 4,908 | 6.44 | 308,501 | 4,901 | 6.38 | 312,587 | 5,006 | 6.36 | 318,116 | 5,002 | 6.25 | 326,372 | 4,940 | 6.07 | ||||||||||||||||||||||||||||||||||||||||||||
| Loans held for sale | 1,384 | 22 | 6.56 | 925 | 15 | 6.38 | 1,245 | 21 | 6.82 | 1,765 | 28 | 6.20 | 1,886 | 28 | 5.94 | ||||||||||||||||||||||||||||||||||||||||||||
| Total loans and leases | 307,583 | 4,930 | 6.44 | 309,426 | 4,916 | 6.38 | 313,832 | 5,027 | 6.36 | 319,881 | 5,030 | 6.25 | 328,258 | 4,968 | 6.07 | ||||||||||||||||||||||||||||||||||||||||||||
| Interest earning trading assets | 5,515 | 84 | 6.11 | 4,845 | 79 | 6.50 | 4,680 | 80 | 6.92 | 4,380 | 76 | 6.91 | 4,445 | 75 | 6.73 | ||||||||||||||||||||||||||||||||||||||||||||
| Other earning assets | 39,250 | 551 | 5.56 | 30,567 | 436 | 5.74 | 28,956 | 414 | 5.65 | 28,574 | 413 | 5.74 | 34,616 | 436 | 5.06 | ||||||||||||||||||||||||||||||||||||||||||||
| Total earning assets | 473,666 | 6,404 | 5.42 | 476,111 | 6,237 | 5.26 | 480,858 | 6,324 | 5.23 | 488,362 | 6,284 | 5.12 | 505,712 | 6,229 | 4.94 | ||||||||||||||||||||||||||||||||||||||||||||
| Nonearning assets | 50,587 | 47,307 | 51,165 | 51,607 | 52,316 | ||||||||||||||||||||||||||||||||||||||||||||||||||||||
| Assets of discontinued operations | 2,641 | 7,584 | 7,633 | 7,735 | 7,794 | ||||||||||||||||||||||||||||||||||||||||||||||||||||||
| Total assets | $ | 526,894 | $ | 531,002 | $ | 539,656 | $ | 547,704 | $ | 565,822 | |||||||||||||||||||||||||||||||||||||||||||||||||
| Liabilities and Shareholders’ Equity | |||||||||||||||||||||||||||||||||||||||||||||||||||||||||||
| Interest-bearing deposits: | |||||||||||||||||||||||||||||||||||||||||||||||||||||||||||
| Interest checking | $ | 103,894 | 707 | 2.74 | $ | 103,537 | 684 | 2.65 | $ | 101,722 | 635 | 2.48 | $ | 101,252 | 611 | 2.40 | $ | 102,105 | 508 | 1.99 | |||||||||||||||||||||||||||||||||||||||
| Money market and savings | 135,264 | 873 | 2.60 | 134,696 | 832 | 2.49 | 137,464 | 843 | 2.43 | 139,961 | 829 | 2.35 | 138,149 | 686 | 1.99 | ||||||||||||||||||||||||||||||||||||||||||||
| Time deposits | 41,250 | 436 | 4.24 | 41,937 | 448 | 4.30 | 41,592 | 439 | 4.19 | 40,920 | 418 | 4.05 | 35,844 | 333 | 3.73 | ||||||||||||||||||||||||||||||||||||||||||||
| Total interest-bearing deposits | 280,408 | 2,016 | 2.89 | 280,170 | 1,964 | 2.82 | 280,778 | 1,917 | 2.71 | 282,133 | 1,858 | 2.61 | 276,098 | 1,527 | 2.22 | ||||||||||||||||||||||||||||||||||||||||||||
| Short-term borrowings | 26,016 | 362 | 5.58 | 26,230 | 366 | 5.62 | 24,958 | 354 | 5.62 | 24,894 | 343 | 5.47 | 23,991 | 311 | 5.19 | ||||||||||||||||||||||||||||||||||||||||||||
| Long-term debt | 36,721 | 446 | 4.87 | 40,721 | 482 | 4.74 | 40,818 | 476 | 4.67 | 43,353 | 491 | 4.51 | 63,665 | 734 | 4.62 | ||||||||||||||||||||||||||||||||||||||||||||
| Total interest-bearing liabilities | 343,145 | 2,824 | 3.31 | 347,121 | 2,812 | 3.26 | 346,554 | 2,747 | 3.15 | 350,380 | 2,692 | 3.05 | 363,754 | 2,572 | 2.84 | ||||||||||||||||||||||||||||||||||||||||||||
| Noninterest-bearing deposits | 107,634 | 108,888 | 114,555 | 118,905 | 123,728 | ||||||||||||||||||||||||||||||||||||||||||||||||||||||
| Other liabilities | 13,318 | 12,885 | 12,433 | 11,699 | 10,865 | ||||||||||||||||||||||||||||||||||||||||||||||||||||||
| Liabilities of discontinued operations | 1,120 | 3,097 | 3,218 | 3,408 | 3,374 | ||||||||||||||||||||||||||||||||||||||||||||||||||||||
| Shareholders’ equity | 61,677 | 59,011 | 62,896 | 63,312 | 64,101 | ||||||||||||||||||||||||||||||||||||||||||||||||||||||
| Total liabilities and shareholders’ equity | $ | 526,894 | $ | 531,002 | $ | 539,656 | $ | 547,704 | $ | 565,822 | |||||||||||||||||||||||||||||||||||||||||||||||||
| Average interest-rate spread | 2.11 | 2.00 | 2.08 | 2.07 | 2.10 | ||||||||||||||||||||||||||||||||||||||||||||||||||||||
| Net interest income/ net interest margin | $ | 3,580 | 3.03 | % | $ | 3,425 | 2.89 | % | $ | 3,577 | 2.96 | % | $ | 3,592 | 2.93 | % | $ | 3,657 | 2.90 | % | |||||||||||||||||||||||||||||||||||||||
| Taxable-equivalent adjustment | 53 | 53 | 58 | 57 | 54 | ||||||||||||||||||||||||||||||||||||||||||||||||||||||
| Memo: Total deposits | $ | 388,042 | 2,016 | 2.09 | % | $ | 389,058 | 1,964 | 2.03 | % | $ | 395,333 | 1,917 | 1.92 | % | $ | 401,038 | 1,858 | 1.84 | % | $ | 399,826 | 1,527 | 1.53 | % | ||||||||||||||||||||||||||||||||||
| Year-to-Date | ||||||||||||||||||||||||||||||||||||||
| June 30, 2024 | June 30, 2023 | |||||||||||||||||||||||||||||||||||||
| (Dollars in millions) | Average Balances(1) |
Income/Expense(2) |
Yields/ Rates(2) |
Average Balances(1) |
Income/Expense(2) |
Yields/ Rates(2) |
||||||||||||||||||||||||||||||||
| Assets | ||||||||||||||||||||||||||||||||||||||
| AFS and HTM securities at amortized cost: | ||||||||||||||||||||||||||||||||||||||
| U.S. Treasury | $ | 10,499 | $ | 138 | 2.64 | % | $ | 11,116 | $ | 60 | 1.08 | % | ||||||||||||||||||||||||||
| U.S. government-sponsored entities (GSE) | 385 | 6 | 3.34 | 332 | 5 | 2.78 | ||||||||||||||||||||||||||||||||
| Mortgage-backed securities issued by GSE | 112,423 | 1,455 | 2.59 | 123,692 | 1,384 | 2.24 | ||||||||||||||||||||||||||||||||
| States and political subdivisions | 420 | 9 | 4.14 | 425 | 9 | 4.12 | ||||||||||||||||||||||||||||||||
| Non-agency mortgage-backed | 2,549 | 37 | 2.87 | 3,879 | 45 | 2.33 | ||||||||||||||||||||||||||||||||
| Other | 19 | — | 5.32 | 22 | — | 5.24 | ||||||||||||||||||||||||||||||||
| Total securities | 126,295 | 1,645 | 2.61 | 139,466 | 1,503 | 2.16 | ||||||||||||||||||||||||||||||||
| Loans and leases: | ||||||||||||||||||||||||||||||||||||||
| Commercial: | ||||||||||||||||||||||||||||||||||||||
| Commercial and industrial | 157,714 | 5,122 | 6.53 | 165,846 | 5,046 | 6.13 | ||||||||||||||||||||||||||||||||
| CRE | 22,185 | 770 | 6.94 | 22,698 | 739 | 6.52 | ||||||||||||||||||||||||||||||||
| Commercial construction | 7,389 | 284 | 7.84 | 5,892 | 212 | 7.39 | ||||||||||||||||||||||||||||||||
| Consumer: | ||||||||||||||||||||||||||||||||||||||
| Residential mortgage | 54,780 | 1,053 | 3.85 | 56,370 | 1,057 | 3.75 | ||||||||||||||||||||||||||||||||
| Home equity | 9,868 | 391 | 7.97 | 10,606 | 370 | 7.03 | ||||||||||||||||||||||||||||||||
| Indirect auto | 22,195 | 753 | 6.82 | 27,147 | 796 | 5.91 | ||||||||||||||||||||||||||||||||
| Other consumer | 28,306 | 1,142 | 8.12 | 27,876 | 958 | 6.93 | ||||||||||||||||||||||||||||||||
| Student | — | — | — | 4,947 | 169 | 6.91 | ||||||||||||||||||||||||||||||||
| Credit card | 4,913 | 294 | 12.05 | 4,815 | 273 | 11.45 | ||||||||||||||||||||||||||||||||
| Total loans and leases held for investment | 307,350 | 9,809 | 6.41 | 326,197 | 9,620 | 5.94 | ||||||||||||||||||||||||||||||||
| Loans held for sale | 1,155 | 37 | 6.49 | 1,708 | 53 | 6.28 | ||||||||||||||||||||||||||||||||
| Total loans and leases | 308,505 | 9,846 | 6.41 | 327,905 | 9,673 | 5.94 | ||||||||||||||||||||||||||||||||
| Interest earning trading assets | 5,180 | 163 | 6.29 | 4,951 | 158 | 6.38 | ||||||||||||||||||||||||||||||||
| Other earning assets | 34,909 | 987 | 5.60 | 29,916 | 730 | 4.87 | ||||||||||||||||||||||||||||||||
| Total earning assets | 474,889 | 12,641 | 5.34 | 502,238 | 12,064 | 4.83 | ||||||||||||||||||||||||||||||||
| Nonearning assets | 48,947 | 52,953 | ||||||||||||||||||||||||||||||||||||
| Assets of discontinued operations | 5,112 | 7,550 | ||||||||||||||||||||||||||||||||||||
| Total assets | $ | 528,948 | $ | 562,741 | ||||||||||||||||||||||||||||||||||
| Liabilities and Shareholders’ Equity | ||||||||||||||||||||||||||||||||||||||
| Interest-bearing deposits: | ||||||||||||||||||||||||||||||||||||||
| Interest checking | $ | 103,716 | 1,391 | 2.70 | $ | 105,477 | 938 | 1.79 | ||||||||||||||||||||||||||||||
| Money market and savings | 134,979 | 1,705 | 2.54 | 138,972 | 1,162 | 1.69 | ||||||||||||||||||||||||||||||||
| Time deposits | 41,594 | 884 | 4.27 | 32,276 | 552 | 3.45 | ||||||||||||||||||||||||||||||||
| Total interest-bearing deposits | 280,289 | 3,980 | 2.86 | 276,725 | 2,652 | 1.93 | ||||||||||||||||||||||||||||||||
| Short-term borrowings | 26,123 | 728 | 5.60 | 24,023 | 589 | 4.94 | ||||||||||||||||||||||||||||||||
| Long-term debt | 38,721 | 928 | 4.80 | 57,396 | 1,248 | 4.37 | ||||||||||||||||||||||||||||||||
| Total interest-bearing liabilities | 345,133 | 5,636 | 3.28 | 358,144 | 4,489 | 2.52 | ||||||||||||||||||||||||||||||||
| Noninterest-bearing deposits | 108,261 | 127,393 | ||||||||||||||||||||||||||||||||||||
| Other liabilities | 13,101 | 11,043 | ||||||||||||||||||||||||||||||||||||
| Liabilities of discontinued operations | 2,109 | 3,066 | ||||||||||||||||||||||||||||||||||||
| Shareholders’ equity | 60,344 | 63,095 | ||||||||||||||||||||||||||||||||||||
| Total liabilities and shareholders’ equity | $ | 528,948 | $ | 562,741 | ||||||||||||||||||||||||||||||||||
| Average interest-rate spread | 2.06 | 2.31 | ||||||||||||||||||||||||||||||||||||
| Net interest income/ net interest margin | $ | 7,005 | 2.96 | % | $ | 7,575 | 3.03 | % | ||||||||||||||||||||||||||||||
| Taxable-equivalent adjustment | 106 | 105 | ||||||||||||||||||||||||||||||||||||
| Memo: Total deposits | $ | 388,550 | 3,980 | 2.06 | % | $ | 404,118 | 2,652 | 1.32 | % | ||||||||||||||||||||||||||||
| June 30 | March 31 | Dec. 31 | Sept. 30 | June 30 | ||||||||||||||||||||||||||||
| (Dollars in millions) | 2024 | 2024 | 2023 | 2023 | 2023 | |||||||||||||||||||||||||||
| Nonperforming Assets | ||||||||||||||||||||||||||||||||
| Nonaccrual loans and leases: | ||||||||||||||||||||||||||||||||
| Commercial: | ||||||||||||||||||||||||||||||||
| Commercial and industrial | $ | 459 | $ | 512 | $ | 470 | $ | 561 | $ | 562 | ||||||||||||||||||||||
| CRE | 360 | 261 | 284 | 289 | 275 | |||||||||||||||||||||||||||
| Commercial construction | — | 23 | 24 | 29 | 16 | |||||||||||||||||||||||||||
| Consumer: | ||||||||||||||||||||||||||||||||
| Residential mortgage | 161 | 151 | 153 | 132 | 221 | |||||||||||||||||||||||||||
| Home equity | 123 | 130 | 122 | 123 | 129 | |||||||||||||||||||||||||||
| Indirect auto | 244 | 256 | 268 | 266 | 262 | |||||||||||||||||||||||||||
| Other consumer | 64 | 61 | 59 | 52 | 46 | |||||||||||||||||||||||||||
| Total nonaccrual loans and leases held for investment | 1,411 | 1,394 | 1,380 | 1,452 | 1,511 | |||||||||||||||||||||||||||
| Loans held for sale | 9 | 22 | 51 | 75 | 13 | |||||||||||||||||||||||||||
| Total nonaccrual loans and leases | 1,420 | 1,416 | 1,431 | 1,527 | 1,524 | |||||||||||||||||||||||||||
| Foreclosed real estate | 5 | 4 | 3 | 3 | 3 | |||||||||||||||||||||||||||
| Other foreclosed property | 51 | 56 | 54 | 54 | 56 | |||||||||||||||||||||||||||
| Total nonperforming assets | $ | 1,476 | $ | 1,476 | $ | 1,488 | $ | 1,584 | $ | 1,583 | ||||||||||||||||||||||
| Loans 90 Days or More Past Due and Still Accruing | ||||||||||||||||||||||||||||||||
| Commercial: | ||||||||||||||||||||||||||||||||
| Commercial and industrial | $ | 8 | $ | 12 | $ | 7 | $ | 15 | $ | 36 | ||||||||||||||||||||||
| Commercial construction | 1 | — | 1 | — | 5 | |||||||||||||||||||||||||||
| Consumer: | ||||||||||||||||||||||||||||||||
| Residential mortgage - government guaranteed | 375 | 408 | 418 | 456 | 541 | |||||||||||||||||||||||||||
| Residential mortgage - nonguaranteed | 27 | 33 | 21 | 30 | 23 | |||||||||||||||||||||||||||
| Home equity | 7 | 10 | 11 | 9 | 7 | |||||||||||||||||||||||||||
| Indirect auto | 1 | 1 | 2 | 1 | — | |||||||||||||||||||||||||||
| Other consumer | 19 | 18 | 21 | 16 | 12 | |||||||||||||||||||||||||||
| Credit card | 51 | 56 | 53 | 47 | 38 | |||||||||||||||||||||||||||
| Total loans 90 days past due and still accruing | $ | 489 | $ | 538 | $ | 534 | $ | 574 | $ | 662 | ||||||||||||||||||||||
| Loans 30-89 Days Past Due | ||||||||||||||||||||||||||||||||
| Commercial: | ||||||||||||||||||||||||||||||||
| Commercial and industrial | $ | 109 | $ | 158 | $ | 230 | $ | 98 | $ | 142 | ||||||||||||||||||||||
| CRE | 8 | 21 | 5 | 28 | 38 | |||||||||||||||||||||||||||
| Commercial construction | — | — | — | 1 | 6 | |||||||||||||||||||||||||||
| Consumer: | ||||||||||||||||||||||||||||||||
| Residential mortgage - government guaranteed | 340 | 286 | 326 | 293 | 267 | |||||||||||||||||||||||||||
| Residential mortgage - nonguaranteed | 392 | 352 | 313 | 270 | 254 | |||||||||||||||||||||||||||
| Home equity | 58 | 59 | 70 | 61 | 56 | |||||||||||||||||||||||||||
| Indirect auto | 592 | 540 | 669 | 598 | 549 | |||||||||||||||||||||||||||
| Other consumer | 214 | 226 | 271 | 219 | 175 | |||||||||||||||||||||||||||
| Credit card | 78 | 74 | 87 | 68 | 63 | |||||||||||||||||||||||||||
| Total loans 30-89 days past due | $ | 1,791 | $ | 1,716 | $ | 1,971 | $ | 1,636 | $ | 1,550 | ||||||||||||||||||||||
| As of/For the Quarter Ended | ||||||||||||||||||||||||||||||||
| June 30 | March 31 | Dec. 31 | Sept. 30 | June 30 | ||||||||||||||||||||||||||||
| 2024 | 2024 | 2023 | 2023 | 2023 | ||||||||||||||||||||||||||||
| Asset Quality Ratios | ||||||||||||||||||||||||||||||||
| Loans 30-89 days past due and still accruing as a percentage of loans and leases | 0.59 | % | 0.56 | % | 0.63 | % | 0.52 | % | 0.48 | % | ||||||||||||||||||||||
| Loans 90 days or more past due and still accruing as a percentage of loans and leases | 0.16 | 0.18 | 0.17 | 0.18 | 0.21 | |||||||||||||||||||||||||||
| Nonperforming loans and leases as a percentage of loans and leases held for investment | 0.46 | 0.45 | 0.44 | 0.46 | 0.47 | |||||||||||||||||||||||||||
Nonperforming loans and leases as a percentage of loans and leases(1) |
0.46 | 0.46 | 0.46 | 0.48 | 0.47 | |||||||||||||||||||||||||||
| Nonperforming assets as a percentage of: | ||||||||||||||||||||||||||||||||
Total assets(1) |
0.28 | 0.28 | 0.28 | 0.29 | 0.29 | |||||||||||||||||||||||||||
| Loans and leases plus foreclosed property | 0.48 | 0.47 | 0.46 | 0.48 | 0.49 | |||||||||||||||||||||||||||
| Net charge-offs as a percentage of average loans and leases | 0.58 | 0.64 | 0.57 | 0.51 | 0.54 | |||||||||||||||||||||||||||
| Allowance for loan and lease losses as a percentage of loans and leases | 1.57 | 1.56 | 1.54 | 1.49 | 1.43 | |||||||||||||||||||||||||||
| Ratio of allowance for loan and lease losses to: | ||||||||||||||||||||||||||||||||
| Net charge-offs | 2.7X | 2.4X | 2.7X | 2.9X | 2.6X | |||||||||||||||||||||||||||
| Nonperforming loans and leases | 3.4X | 3.4X | 3.5X | 3.2X | 3.0X | |||||||||||||||||||||||||||
| Asset Quality Ratios (Excluding Government Guaranteed) | ||||||||||||||||||||||||||||||||
| Loans 90 days or more past due and still accruing as a percentage of loans and leases | 0.04 | % | 0.04 | % | 0.04 | % | 0.04 | % | 0.04 | % | ||||||||||||||||||||||
| Applicable ratios are annualized. | ||||||||||||||||||||||||||||||||
(1)Includes loans held for sale. |
||||||||||||||||||||||||||||||||
| As of/For the Year-to-Date | ||||||||||||||||||||||||||||||||
| Period Ended June 30 | ||||||||||||||||||||||||||||||||
| 2024 | 2023 | |||||||||||||||||||||||||||||||
| Asset Quality Ratios | ||||||||||||||||||||||||||||||||
| Net charge-offs as a percentage of average loans and leases | 0.61 | % | 0.46 | % | ||||||||||||||||||||||||||||
| Ratio of allowance for loan and lease losses to net charge-offs | 2.6X | 3.1X | ||||||||||||||||||||||||||||||
| Applicable ratios are annualized. | ||||||||||||||||||||||||||||||||
| As of/For the Quarter Ended | As of/For the Year-to-Date | |||||||||||||||||||||||||||||||||||||||||||
| June 30 | March 31 | Dec. 31 | Sept. 30 | June 30 | Period Ended June 30 | |||||||||||||||||||||||||||||||||||||||
| (Dollars in millions) | 2024 | 2024 | 2023 | 2023 | 2023 | 2024 | 2023 | |||||||||||||||||||||||||||||||||||||
Allowance for Credit Losses(1) |
||||||||||||||||||||||||||||||||||||||||||||
| Beginning balance | $ | 5,100 | $ | 5,093 | $ | 4,970 | $ | 4,879 | $ | 4,761 | $ | 5,093 | $ | 4,649 | ||||||||||||||||||||||||||||||
| Provision for credit losses | 451 | 500 | 572 | 497 | 558 | 951 | 1,040 | |||||||||||||||||||||||||||||||||||||
| Charge-offs: | ||||||||||||||||||||||||||||||||||||||||||||
| Commercial: | ||||||||||||||||||||||||||||||||||||||||||||
| Commercial and industrial | (83) | (97) | (110) | (98) | (107) | (180) | (182) | |||||||||||||||||||||||||||||||||||||
| CRE | (97) | (103) | (48) | (77) | (35) | (200) | (41) | |||||||||||||||||||||||||||||||||||||
| Commercial construction | — | — | (5) | — | — | — | — | |||||||||||||||||||||||||||||||||||||
| Consumer: | ||||||||||||||||||||||||||||||||||||||||||||
| Residential mortgage | (1) | (1) | — | (8) | (1) | (2) | (2) | |||||||||||||||||||||||||||||||||||||
| Home equity | (3) | (3) | (2) | (4) | (2) | (6) | (4) | |||||||||||||||||||||||||||||||||||||
| Indirect auto | (136) | (154) | (154) | (135) | (115) | (290) | (242) | |||||||||||||||||||||||||||||||||||||
| Other consumer | (141) | (165) | (148) | (120) | (104) | (306) | (209) | |||||||||||||||||||||||||||||||||||||
| Student | — | — | — | — | (103) | — | (108) | |||||||||||||||||||||||||||||||||||||
| Credit card | (74) | (77) | (64) | (55) | (53) | (151) | (104) | |||||||||||||||||||||||||||||||||||||
| Total charge-offs | (535) | (600) | (531) | (497) | (520) | (1,135) | (892) | |||||||||||||||||||||||||||||||||||||
| Recoveries: | ||||||||||||||||||||||||||||||||||||||||||||
| Commercial: | ||||||||||||||||||||||||||||||||||||||||||||
| Commercial and industrial | 14 | 32 | 16 | 28 | 13 | 46 | 26 | |||||||||||||||||||||||||||||||||||||
| CRE | 5 | 7 | — | 2 | — | 12 | 1 | |||||||||||||||||||||||||||||||||||||
| Commercial construction | 1 | — | 2 | — | — | 1 | 1 | |||||||||||||||||||||||||||||||||||||
| Consumer: | ||||||||||||||||||||||||||||||||||||||||||||
| Residential mortgage | 2 | 1 | 1 | 1 | 2 | 3 | 4 | |||||||||||||||||||||||||||||||||||||
| Home equity | 4 | 5 | 5 | 7 | 5 | 9 | 11 | |||||||||||||||||||||||||||||||||||||
| Indirect auto | 30 | 28 | 25 | 25 | 31 | 58 | 57 | |||||||||||||||||||||||||||||||||||||
| Other consumer | 28 | 28 | 21 | 20 | 20 | 56 | 37 | |||||||||||||||||||||||||||||||||||||
| Credit card | 9 | 9 | 8 | 9 | 9 | 18 | 18 | |||||||||||||||||||||||||||||||||||||
| Total recoveries | 93 | 110 | 78 | 92 | 80 | 203 | 155 | |||||||||||||||||||||||||||||||||||||
| Net charge-offs | (442) | (490) | (453) | (405) | (440) | (932) | (737) | |||||||||||||||||||||||||||||||||||||
Other(2) |
1 | (3) | 4 | (1) | — | (2) | (73) | |||||||||||||||||||||||||||||||||||||
| Ending balance | $ | 5,110 | $ | 5,100 | $ | 5,093 | $ | 4,970 | $ | 4,879 | $ | 5,110 | $ | 4,879 | ||||||||||||||||||||||||||||||
Allowance for Credit Losses:(1) |
||||||||||||||||||||||||||||||||||||||||||||
| Allowance for loan and lease losses | $ | 4,808 | $ | 4,803 | $ | 4,798 | $ | 4,693 | $ | 4,606 | ||||||||||||||||||||||||||||||||||
| Reserve for unfunded lending commitments (RUFC) | 302 | 297 | 295 | 277 | 273 | |||||||||||||||||||||||||||||||||||||||
| Allowance for credit losses | $ | 5,110 | $ | 5,100 | $ | 5,093 | $ | 4,970 | $ | 4,879 | ||||||||||||||||||||||||||||||||||
| Quarter Ended | As of/For the Year-to-Date | |||||||||||||||||||||||||||||||||||||||||||
| June 30 | March 31 | Dec. 31 | Sept. 30 | June 30 | Period Ended June 30 | |||||||||||||||||||||||||||||||||||||||
| 2024 | 2024 | 2023 | 2023 | 2023 | 2024 | 2023 | ||||||||||||||||||||||||||||||||||||||
| Net Charge-offs as a Percentage of Average Loans and Leases: | ||||||||||||||||||||||||||||||||||||||||||||
| Commercial: | ||||||||||||||||||||||||||||||||||||||||||||
| Commercial and industrial | 0.18 | % | 0.17 | % | 0.23 | % | 0.17 | % | 0.23 | % | 0.17 | % | 0.19 | % | ||||||||||||||||||||||||||||||
| CRE | 1.67 | 1.73 | 0.83 | 1.31 | 0.62 | 1.70 | 0.35 | |||||||||||||||||||||||||||||||||||||
| Commercial construction | (0.05) | (0.02) | 0.22 | (0.03) | (0.02) | (0.04) | (0.03) | |||||||||||||||||||||||||||||||||||||
| Consumer: | ||||||||||||||||||||||||||||||||||||||||||||
| Residential mortgage | (0.01) | — | (0.01) | 0.05 | (0.01) | — | (0.01) | |||||||||||||||||||||||||||||||||||||
| Home equity | (0.03) | (0.08) | (0.12) | (0.10) | (0.12) | (0.06) | (0.14) | |||||||||||||||||||||||||||||||||||||
| Indirect auto | 1.94 | 2.26 | 2.19 | 1.75 | 1.28 | 2.10 | 1.38 | |||||||||||||||||||||||||||||||||||||
| Other consumer | 1.60 | 1.96 | 1.74 | 1.37 | 1.20 | 1.78 | 1.25 | |||||||||||||||||||||||||||||||||||||
| Student | — | — | — | — | 8.67 | — | 4.42 | |||||||||||||||||||||||||||||||||||||
| Credit card | 5.33 | 5.54 | 4.38 | 3.78 | 3.66 | 5.44 | 3.60 | |||||||||||||||||||||||||||||||||||||
| Total loans and leases | 0.58 | 0.64 | 0.57 | 0.51 | 0.54 | 0.61 | 0.46 | |||||||||||||||||||||||||||||||||||||
| Applicable ratios are annualized. | ||||||||||||||||||||||||||||||||||||||||||||
| Quarter Ended | ||||||||||||||||||||||||||||||||
| June 30 | March 31 | Dec. 31 | Sept. 30 | June 30 | ||||||||||||||||||||||||||||
| (Dollars in millions) | 2024 | 2024 | 2023 | 2023 | 2023 | |||||||||||||||||||||||||||
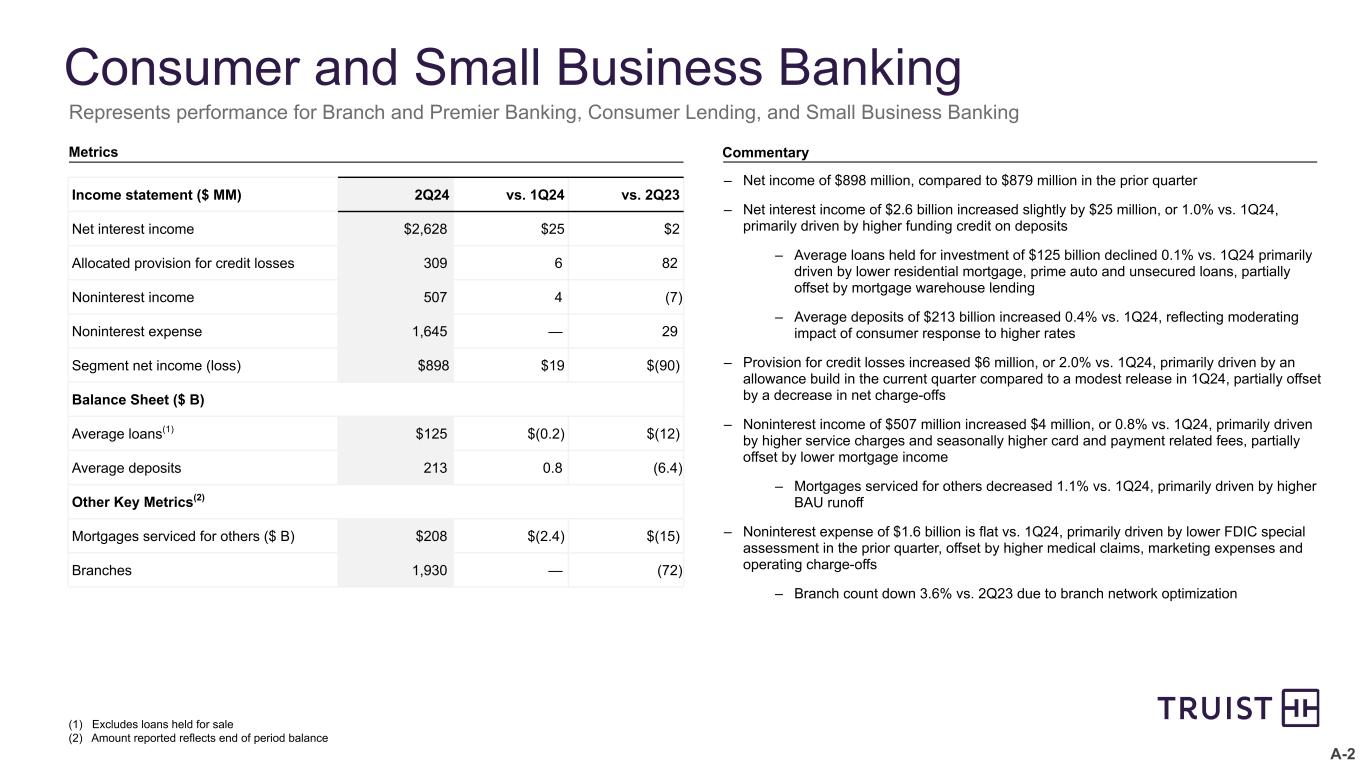
| Consumer and Small Business Banking | ||||||||||||||||||||||||||||||||
| Net interest income (expense) | $ | 1,286 | $ | 1,264 | $ | 1,340 | $ | 1,370 | $ | 1,544 | ||||||||||||||||||||||
| Net intersegment interest income (expense) | 1,342 | 1,339 | 1,272 | 1,236 | 1,082 | |||||||||||||||||||||||||||
| Segment net interest income (expense) | 2,628 | 2,603 | 2,612 | 2,606 | 2,626 | |||||||||||||||||||||||||||
| Allocated provision for credit losses | 309 | 303 | 359 | 260 | 227 | |||||||||||||||||||||||||||
| Noninterest income | 507 | 503 | 526 | 436 | 514 | |||||||||||||||||||||||||||
| Goodwill impairment | — | — | 3,361 | — | — | |||||||||||||||||||||||||||
| Noninterest expense ex goodwill impairment | 1,645 | 1,645 | 1,696 | 1,642 | 1,616 | |||||||||||||||||||||||||||
| Income (loss) before income taxes | 1,181 | 1,158 | (2,278) | 1,140 | 1,297 | |||||||||||||||||||||||||||
| Provision (benefit) for income taxes | 283 | 279 | 262 | 274 | 309 | |||||||||||||||||||||||||||
| Segment net income (loss) | $ | 898 | $ | 879 | $ | (2,540) | $ | 866 | $ | 988 | ||||||||||||||||||||||
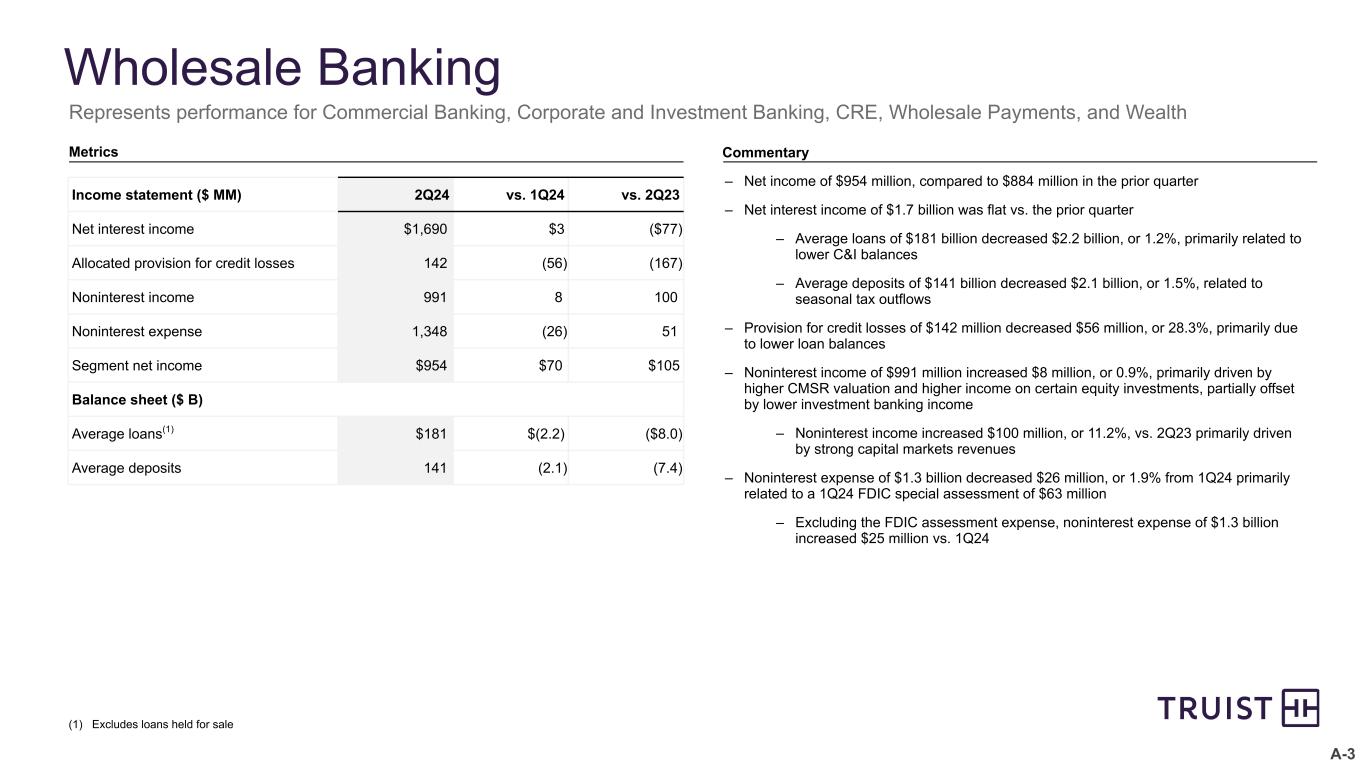
| Wholesale Banking | ||||||||||||||||||||||||||||||||
| Net interest income (expense) | $ | 2,187 | $ | 2,234 | $ | 2,300 | $ | 2,323 | $ | 2,329 | ||||||||||||||||||||||
| Net intersegment interest income (expense) | (497) | (547) | (565) | (607) | (562) | |||||||||||||||||||||||||||
| Segment net interest income (expense) | 1,690 | 1,687 | 1,735 | 1,716 | 1,767 | |||||||||||||||||||||||||||
| Allocated provision for credit losses | 142 | 198 | 212 | 243 | 309 | |||||||||||||||||||||||||||
| Noninterest income | 991 | 983 | 883 | 905 | 891 | |||||||||||||||||||||||||||
| Goodwill impairment | — | — | 2,717 | — | — | |||||||||||||||||||||||||||
| Noninterest expense ex goodwill impairment | 1,348 | 1,374 | 1,643 | 1,297 | 1,297 | |||||||||||||||||||||||||||
| Income (loss) before income taxes | 1,191 | 1,098 | (1,954) | 1,081 | 1,052 | |||||||||||||||||||||||||||
| Provision (benefit) for income taxes | 237 | 214 | 138 | 211 | 203 | |||||||||||||||||||||||||||
| Segment net income (loss) | $ | 954 | $ | 884 | $ | (2,092) | $ | 870 | $ | 849 | ||||||||||||||||||||||
Other, Treasury & Corporate(3) |
||||||||||||||||||||||||||||||||
| Net interest income (expense) | $ | 54 | $ | (126) | $ | (121) | $ | (158) | $ | (270) | ||||||||||||||||||||||
| Net intersegment interest income (expense) | (845) | (792) | (707) | (629) | (520) | |||||||||||||||||||||||||||
| Segment net interest income (expense) | (791) | (918) | (828) | (787) | (790) | |||||||||||||||||||||||||||
| Allocated provision for credit losses | — | (1) | 1 | (6) | 2 | |||||||||||||||||||||||||||
| Noninterest income | (6,710) | (40) | (46) | (7) | (25) | |||||||||||||||||||||||||||
| Noninterest expense | 101 | (66) | 140 | 121 | 133 | |||||||||||||||||||||||||||
| Income (loss) before income taxes | (7,602) | (891) | (1,015) | (909) | (950) | |||||||||||||||||||||||||||
| Provision (benefit) for income taxes | (1,844) | (261) | (456) | (282) | (282) | |||||||||||||||||||||||||||
| Segment net income (loss) | $ | (5,758) | $ | (630) | $ | (559) | $ | (627) | $ | (668) | ||||||||||||||||||||||
| Total Truist Financial Corporation | ||||||||||||||||||||||||||||||||
| Net interest income (expense) | $ | 3,527 | $ | 3,372 | $ | 3,519 | $ | 3,535 | $ | 3,603 | ||||||||||||||||||||||
| Net intersegment interest income (expense) | — | — | — | — | — | |||||||||||||||||||||||||||
| Segment net interest income (expense) | 3,527 | 3,372 | 3,519 | 3,535 | 3,603 | |||||||||||||||||||||||||||
| Allocated provision for credit losses | 451 | 500 | 572 | 497 | 538 | |||||||||||||||||||||||||||
| Noninterest income | (5,212) | 1,446 | 1,363 | 1,334 | 1,380 | |||||||||||||||||||||||||||
| Goodwill impairment | — | — | 6,078 | — | — | |||||||||||||||||||||||||||
| Noninterest expense ex goodwill impairment | 3,094 | 2,953 | 3,479 | 3,060 | 3,046 | |||||||||||||||||||||||||||
| Income (loss) before income taxes | (5,230) | 1,365 | (5,247) | 1,312 | 1,399 | |||||||||||||||||||||||||||
| Provision (benefit) for income taxes | (1,324) | 232 | (56) | 203 | 230 | |||||||||||||||||||||||||||
| Net income (loss) from continuing operations | $ | (3,906) | $ | 1,133 | $ | (5,191) | $ | 1,109 | $ | 1,169 | ||||||||||||||||||||||
| As of/For the Quarter Ended | ||||||||||||||||||||||||||||||||
| June 30 | March 31 | Dec. 31 | Sept. 30 | June 30 | ||||||||||||||||||||||||||||
| (Dollars in millions, except per share data, shares in thousands) | 2024 | 2024 | 2023 | 2023 | 2023 | |||||||||||||||||||||||||||
| Selected Capital Information | (preliminary) | |||||||||||||||||||||||||||||||
| Risk-based capital: | ||||||||||||||||||||||||||||||||
| Common equity tier 1 | $ | 47,707 | $ | 42,691 | $ | 42,671 | $ | 42,276 | $ | 41,642 | ||||||||||||||||||||||
| Tier 1 | 54,377 | 49,361 | 49,341 | 48,946 | 48,312 | |||||||||||||||||||||||||||
| Total | 63,346 | 58,548 | 58,063 | 57,713 | 57,236 | |||||||||||||||||||||||||||
| Risk-weighted assets | 412,406 | 421,680 | 423,705 | 428,755 | 434,946 | |||||||||||||||||||||||||||
| Average quarterly assets for leverage ratio | 519,467 | 522,095 | 533,084 | 534,402 | 550,734 | |||||||||||||||||||||||||||
| Average quarterly assets for supplementary leverage ratio | 608,546 | 614,238 | 624,591 | 627,382 | 643,662 | |||||||||||||||||||||||||||
| Risk-based capital ratios: | ||||||||||||||||||||||||||||||||
| Common equity tier 1 | 11.6 | % | 10.1 | % | 10.1 | % | 9.9 | % | 9.6 | % | ||||||||||||||||||||||
| Tier 1 | 13.2 | 11.7 | 11.6 | 11.4 | 11.1 | |||||||||||||||||||||||||||
| Total | 15.4 | 13.9 | 13.7 | 13.5 | 13.2 | |||||||||||||||||||||||||||
| Leverage capital ratio | 10.5 | 9.5 | 9.3 | 9.2 | 8.8 | |||||||||||||||||||||||||||
| Supplementary leverage | 8.9 | 8.0 | 7.9 | 7.8 | 7.5 | |||||||||||||||||||||||||||
| Common equity per common share | $ | 42.71 | $ | 38.97 | $ | 39.31 | $ | 41.37 | $ | 42.68 | ||||||||||||||||||||||
| June 30 | March 31 | Dec. 31 | Sept. 30 | June 30 | ||||||||||||||||||||||||||||
| (Dollars in millions, except per share data, shares in thousands) | 2024 | 2024 | 2023 | 2023 | 2023 | |||||||||||||||||||||||||||
Calculations of Tangible Common Equity and Related Measures:(1) |
||||||||||||||||||||||||||||||||
| Total shareholders’ equity | $ | 63,827 | $ | 59,053 | $ | 59,253 | $ | 62,007 | $ | 63,681 | ||||||||||||||||||||||
| Less: | ||||||||||||||||||||||||||||||||
| Preferred stock | 6,673 | 6,673 | 6,673 | 6,673 | 6,673 | |||||||||||||||||||||||||||
| Noncontrolling interests | — | 232 | 152 | 167 | 155 | |||||||||||||||||||||||||||
| Intangible assets, net of deferred taxes (including discontinued operations) | 18,471 | 23,198 | 23,306 | 29,491 | 29,628 | |||||||||||||||||||||||||||
| Tangible common equity | $ | 38,683 | $ | 28,950 | $ | 29,122 | $ | 25,676 | $ | 27,225 | ||||||||||||||||||||||
| Outstanding shares at end of period (in thousands) | 1,338,223 | 1,338,096 | 1,333,743 | 1,333,668 | 1,331,976 | |||||||||||||||||||||||||||
| Tangible common equity per common share | $ | 28.91 | $ | 21.64 | $ | 21.83 | $ | 19.25 | $ | 20.44 | ||||||||||||||||||||||
| Total assets | $ | 519,853 | $ | 534,959 | $ | 535,349 | $ | 542,707 | $ | 554,549 | ||||||||||||||||||||||
| Less: Intangible assets, net of deferred taxes (including discontinued operations prior to the sale of TIH) | 18,471 | 23,198 | 23,306 | 29,491 | 29,628 | |||||||||||||||||||||||||||
| Tangible assets | $ | 501,382 | $ | 511,761 | $ | 512,043 | $ | 513,216 | $ | 524,921 | ||||||||||||||||||||||
| Equity as a percentage of total assets | 12.3 | % | 11.0 | % | 11.1 | % | 11.4 | % | 11.5 | % | ||||||||||||||||||||||
| Tangible common equity as a percentage of tangible assets | 7.7 | 5.7 | 5.7 | 5.0 | 5.2 | |||||||||||||||||||||||||||
| As of/For the Quarter Ended | ||||||||||||||||||||||||||||||||
| June 30 | March 31 | Dec. 31 | Sept. 30 | June 30 | ||||||||||||||||||||||||||||
| (Dollars in millions, except per share data) | 2024 | 2024 | 2023 | 2023 | 2023 | |||||||||||||||||||||||||||
| Mortgage Banking Income | ||||||||||||||||||||||||||||||||
| Residential mortgage income: | ||||||||||||||||||||||||||||||||
| Residential mortgage production revenue | $ | 24 | $ | 17 | $ | 14 | $ | 19 | $ | 22 | ||||||||||||||||||||||
| Residential mortgage servicing income: | ||||||||||||||||||||||||||||||||
| Residential mortgage servicing income before MSR valuation | 72 | 88 | 85 | 85 | 77 | |||||||||||||||||||||||||||
| Net MSRs valuation | (12) | (15) | (13) | (20) | (19) | |||||||||||||||||||||||||||
| Total residential mortgage servicing income | 60 | 73 | 72 | 65 | 58 | |||||||||||||||||||||||||||
| Total residential mortgage income | 84 | 90 | 86 | 84 | 80 | |||||||||||||||||||||||||||
| Commercial mortgage income: | ||||||||||||||||||||||||||||||||
| Commercial mortgage production revenue | 4 | 5 | 5 | 17 | 16 | |||||||||||||||||||||||||||
| Commercial mortgage servicing income: | ||||||||||||||||||||||||||||||||
| Commercial mortgage servicing income before MSR valuation | 7 | 3 | 3 | 3 | 4 | |||||||||||||||||||||||||||
| Net MSRs valuation | 17 | (1) | — | (2) | (1) | |||||||||||||||||||||||||||
| Total commercial mortgage servicing income | 24 | 2 | 3 | 1 | 3 | |||||||||||||||||||||||||||
| Total commercial mortgage income | 28 | 7 | 8 | 18 | 19 | |||||||||||||||||||||||||||
| Total mortgage banking income | $ | 112 | $ | 97 | $ | 94 | $ | 102 | $ | 99 | ||||||||||||||||||||||
Other Mortgage Banking Information |
||||||||||||||||||||||||||||||||
| Residential mortgage loan originations | $ | 3,881 | $ | 2,412 | $ | 3,027 | $ | 4,196 | $ | 5,558 | ||||||||||||||||||||||
Residential mortgage servicing portfolio:(1) |
||||||||||||||||||||||||||||||||
| Loans serviced for others | 208,270 | 210,635 | 213,399 | 214,953 | 222,917 | |||||||||||||||||||||||||||
| Bank-owned loans serviced | 54,903 | 55,255 | 55,669 | 56,679 | 57,147 | |||||||||||||||||||||||||||
| Total servicing portfolio | 263,173 | 265,890 | 269,068 | 271,632 | 280,064 | |||||||||||||||||||||||||||
| Weighted-average coupon rate on mortgage loans serviced for others | 3.63 | % | 3.59 | % | 3.56 | % | 3.51 | % | 3.54 | % | ||||||||||||||||||||||
| Weighted-average servicing fee on mortgage loans serviced for others | 0.28 | 0.28 | 0.27 | 0.27 | 0.27 | |||||||||||||||||||||||||||
| Additional Information | ||||||||||||||||||||||||||||||||
Brokered deposits(2) |
$ | 27,384 | $ | 30,650 | $ | 31,260 | $ | 34,986 | $ | 32,307 | ||||||||||||||||||||||
NQDCP income (expense):(3) |
||||||||||||||||||||||||||||||||
| Interest income | $ | — | $ | 1 | $ | 2 | $ | 3 | $ | 3 | ||||||||||||||||||||||
| Other income | 4 | 15 | 17 | 35 | 9 | |||||||||||||||||||||||||||
| Personnel expense | (4) | (16) | (19) | (38) | (12) | |||||||||||||||||||||||||||
| Total NQDCP income (expense) | $ | — | $ | — | $ | — | $ | — | $ | — | ||||||||||||||||||||||
| Common stock prices: | ||||||||||||||||||||||||||||||||
| High | $ | 40.51 | $ | 39.29 | $ | 37.83 | $ | 35.78 | $ | 35.39 | ||||||||||||||||||||||
| Low | 35.09 | 34.23 | 26.57 | 27.70 | 25.56 | |||||||||||||||||||||||||||
| End of period | 38.85 | 38.98 | 36.92 | 28.61 | 30.35 | |||||||||||||||||||||||||||
| Banking offices | 1,930 | 1,930 | 2,001 | 2,001 | 2,002 | |||||||||||||||||||||||||||
| ATMs | 2,942 | 2,947 | 3,031 | 3,037 | 3,041 | |||||||||||||||||||||||||||
FTEs(4) |
41,368 | 49,218 | 50,905 | 51,943 | 52,564 | |||||||||||||||||||||||||||
FTEs - continuing operations(4) |
38,140 | 39,417 | 40,997 | 41,997 | 42,701 | |||||||||||||||||||||||||||
| Favorable (Unfavorable) | |||||||||||||||||
| (Dollars in millions, except per share data) Description |
Pre-Tax | After-Tax at Marginal Rate | Impact to Diluted EPS | ||||||||||||||
| Selected Items | |||||||||||||||||
| Second Quarter 2024 | |||||||||||||||||
| Gain on sale of TIH (net income from discontinued operations) | $ | 6,903 | $ | 4,814 | $ | 3.60 | |||||||||||
| Loss on sale of securities (securities gains (losses)) | (6,650) | (5,089) | (3.80) | ||||||||||||||
| Charitable contribution (other expense) | (150) | (115) | (0.09) | ||||||||||||||
| Restructuring charges ($33 million in restructuring charges and $63 million in net income from discontinued operations) | (96) | (73) | (0.05) | ||||||||||||||
| FDIC special assessment (regulatory costs) | (13) | (11) | (0.01) | ||||||||||||||
Accelerated recognition of TIH equity compensation expense (net income from discontinued operations) |
(10) | (8) | (0.01) | ||||||||||||||
| First Quarter 2024 | |||||||||||||||||
Accelerated recognition of TIH equity compensation expense (net income from discontinued operations) |
$ | (89) | $ | (68) | $ | (0.05) | |||||||||||
| FDIC special assessment (regulatory costs) | (75) | (57) | (0.04) | ||||||||||||||
| Restructuring charges ($51 million in restructuring charges and $19 million in net income from discontinued operations) | (70) | (53) | (0.04) | ||||||||||||||
| Fourth Quarter 2023 | |||||||||||||||||
| Goodwill impairment | $ | (6,078) | $ | (6,078) | $ | (4.53) | |||||||||||
| FDIC special assessment (regulatory costs) | (507) | (387) | (0.29) | ||||||||||||||
| Restructuring charges ($155 million in restructuring charges and $28 million in net income from discontinued operations) | (183) | (139) | (0.10) | ||||||||||||||
Discrete tax benefit (provision for income taxes) |
— | 204 | (0.15) | ||||||||||||||
| Third Quarter 2023 | |||||||||||||||||
| Restructuring charges ($61 million in restructuring charges and $14 million in net income from discontinued operations) | $ | (75) | $ | (58) | $ | (0.04) | |||||||||||
| Second Quarter 2023 | |||||||||||||||||
| Restructuring charges ($48 million in restructuring charges and $6 million in net income from discontinued operations) | $ | (54) | $ | (41) | $ | (0.03) | |||||||||||
| First Quarter 2023 | |||||||||||||||||
| Restructuring charges ($56 million in restructuring charges and $7 million in net income from discontinued operations) | $ | (63) | $ | (48) | $ | (0.04) | |||||||||||

