
|
Ohio
|
001-00434
|
31-0411980 |
||
|
(State or Other Jurisdiction of Incorporation)
|
(Commission File Number) |
(I.R.S. Employer Identification No.)
|
|
☐
|
Written communications pursuant to Rule 425 under the Securities Act (17 CFR 230.425)
|
|
☐
|
Soliciting material pursuant to Rule 14a-12 under the Exchange Act (17 CFR 240.14a-12)
|
|
☐
|
Pre-commencement communications pursuant to Rule 14d-2(b) under the Exchange Act (17 CFR 240.14d-2(b))
|
|
☐
|
Pre-commencement communications pursuant to Rule 13e-4(c) under the Exchange Act (17 CFR 240.13e-4(c))
|
|
Title of each class
|
Trading
Symbol(s)
|
Name of each exchange on which registered
|
||
| Common Stock without Par Value |
PG |
NYSE |
||
| 0.500% Notes due 2024 |
|
PG24A |
|
NYSE |
| 0.625% Notes due 2024 |
|
PG24B |
|
NYSE |
| 1.375% Notes due 2025 |
PG25 |
NYSE |
||
| 0.110% Notes due 2026 |
PG26D |
NYSE |
||
| 3.25% EUR Notes due 2026 |
PG26E | NYSE |
||
| 4.875% EUR notes due May 2027 |
PG27A |
NYSE |
||
| 1.200% Notes due 2028 |
|
PG28 |
|
NYSE |
| 1.250% Notes due 2029 |
|
PG29B |
|
NYSE |
| 1.800% Notes due 2029 |
|
PG29A |
|
NYSE |
| 6.250% GBP notes due January 2030 |
PG30 |
NYSE |
||
| 0.350% Notes due 2030 |
PG30C |
NYSE |
||
| 0.230% Notes due 2031 |
PG31A |
NYSE |
||
| 3.25% EUR Notes due 2031 | PG31B | NYSE |
||
| 5.250% GBP notes due January 2033 |
PG33 |
NYSE |
||
| 1.875% Notes due 2038 |
|
PG38 |
|
NYSE |
| 0.900% Notes due 2041 |
PG41 |
NYSE |
|
|
Indicate by check mark whether the registrant is an emerging growth company as defined in Rule 405 of the Securities Act of 1933 (§230.405 of this chapter) or Rule 12b-2 of the Securities
Exchange Act of 1934 (§240.12b-2 of this chapter).
|
||
|
|
|
Emerging growth company
|
☐ |
| If an emerging growth company, indicate by check mark if the registrant has elected not to use the extended tramsition period for complying with any new or revised financial accounting standards provided pursuant to Section 13(a) of the Exchange Act. | ☐ | ||
|
ITEM 9.01 FINANCIAL STATEMENTS AND
EXHIBITS
|
|
Exhibit Number
|
|
Description
|
|
99.1
|
|
Informational Slides Provided by The Procter & Gamble Company dated April 19, 2024
|
| 104 | Cover Page Interactive Data File (embedded within the Inline XBRL document) |
|
SIGNATURE
Pursuant to the requirements of the Securities Exchange Act of 1934,
the Registrant has duly caused this Report to be signed on its behalf by the undersigned hereunto duly authorized.
|
|
Exhibit Number
|
|
Description
|
|
|
|


|
1.
|
Organic sales growth — page 2
|
|
2.
|
Core EPS and Currency-neutral Core EPS — page 3
|
|
3.
|
Core gross margin and Currency-neutral Core gross margin — page 4
|
|
4.
|
Core operating margin and Currency-neutral Core operating margin — page 4
|
|
5.
|
Adjusted free cash flow and Adjusted free cash flow productivity — page 4
|
|
•
|
Incremental restructuring: The Company has historically had an ongoing level of restructuring activities of approximately $250 - $500 million before tax. On December 5, 2023, the Company announced a limited market portfolio restructuring
of its business operations, primarily in certain Enterprise Markets, including Argentina and Nigeria. The adjustment to Core earnings includes the restructuring charges that exceed the normal, recurring level of restructuring charges.
|
|
•
|
Intangible asset impairment: The Company recognized in the three months ended December 31, 2023, a non-cash, after-tax impairment charge of $1.0 billion ($1.3 billion before tax) to adjust the carrying value of the Gillette intangible asset
acquired as part of the Company's 2005 acquisition of The Gillette Company.
|
|
Three Months Ended
March 31, 2024 |
Net Sales Growth
|
Foreign Exchange Impact
|
Acquisition &
Divestiture Impact/Other* |
Organic Sales Growth
|
|||
|
Beauty
|
2%
|
3%
|
(2)%
|
3%
|
|||
|
Grooming
|
3%
|
7%
|
—%
|
10%
|
|||
|
Health Care
|
2%
|
1%
|
(1)%
|
2%
|
|||
|
Fabric Care & Home Care
|
2%
|
1%
|
—%
|
3%
|
|||
|
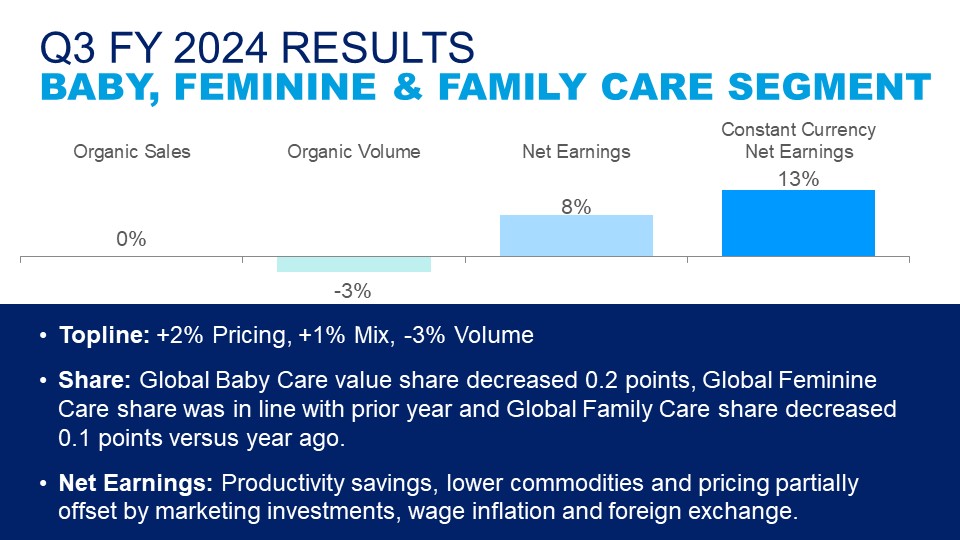
Baby, Feminine & Family Care
|
(2)%
|
2%
|
—%
|
—%
|
|||
|
Total Company
|
1%
|
2%
|
—%
|
3%
|
|
Total Company
|
Net Sales Growth
|
Foreign Exchange Impact
|
Acquisition/ Divestiture Impact/Other*
|
Organic Sales Growth
|
|||
|
Q1 FY 2023
|
1%
|
6%
|
—%
|
7%
|
|||
|
Q2 FY 2023
|
(1)%
|
6%
|
—%
|
5%
|
|||
|
Q3 FY 2023
|
4%
|
4%
|
(1)%
|
7%
|
|||
|
Q4 FY 2023
|
5%
|
4%
|
(1)%
|
8%
|
|||
|
Q1 FY 2024
|
6%
|
1%
|
—%
|
7%
|
|||
|
Q2 FY 2024
|
3%
|
1%
|
—%
|
4%
|
|
Total Company
|
Net Sales Growth
|
Combined Foreign Exchange &
Acquisition/Divestiture Impact/Other*
|
Organic Sales Growth
|
|||
|
FY 2024 (Estimate)
|
+2% to +4%
|
+1% to +2%
|
+4% to +5%
|
|
Three Months Ended March 31
|
||
|
2024
|
2023
|
|
|
Diluted EPS
|
$1.52
|
$1.37
|
|
Incremental restructuring
|
—
|
—
|
|
Intangible asset impairment
|
—
|
—
|
|
Core EPS
|
$1.52
|
$1.37
|
|
Percentage change vs. prior period Core EPS
|
11%
|
|
|
Currency impact to earnings
|
0.09
|
|
|
Currency-Neutral Core EPS
|
$1.61
|
|
|
Percentage change vs. prior period Core EPS
|
18%
|
|
|
Nine Months Ended March 31
|
||
|
2024
|
2023
|
|
|
Diluted EPS
|
$4.75
|
$4.53
|
|
Incremental restructuring
|
0.02
|
—
|
|
Intangible asset impairment
|
0.42
|
—
|
|
Core EPS
|
$5.19
|
$4.53
|
|
Percentage change vs. prior period Core EPS
|
15%
|
|
|
Q1
FY23
|
Q1
FY22
|
Q2
FY23
|
Q2
FY22
|
Q3
FY23
|
Q3
FY22
|
Q4
FY23
|
Q4
FY22
|
Q1
FY24
|
Q1
FY23
|
Q2
FY24
|
Q2
FY23
|
|
|
Diluted EPS
|
$1.57
|
$1.61
|
$1.59
|
$1.66
|
$1.37
|
$1.33
|
$1.37
|
$1.21
|
$1.83
|
$1.57
|
$1.40
|
$1.59
|
|
Incremental restructuring
|
—
|
—
|
—
|
—
|
—
|
—
|
—
|
—
|
—
|
—
|
0.02
|
—
|
|
Intangible asset impairment
|
—
|
—
|
—
|
—
|
—
|
—
|
—
|
—
|
—
|
—
|
0.42
|
—
|
|
Core EPS
|
$1.57
|
$1.61
|
$1.59
|
$1.66
|
$1.37
|
$1.33
|
$1.37
|
$1.21
|
$1.83
|
$1.57
|
$1.84
|
$1.59
|
|
Percentage change vs. prior period Core EPS
|
(2)%
|
(4)%
|
3%
|
13%
|
17%
|
16%
|
||||||
|
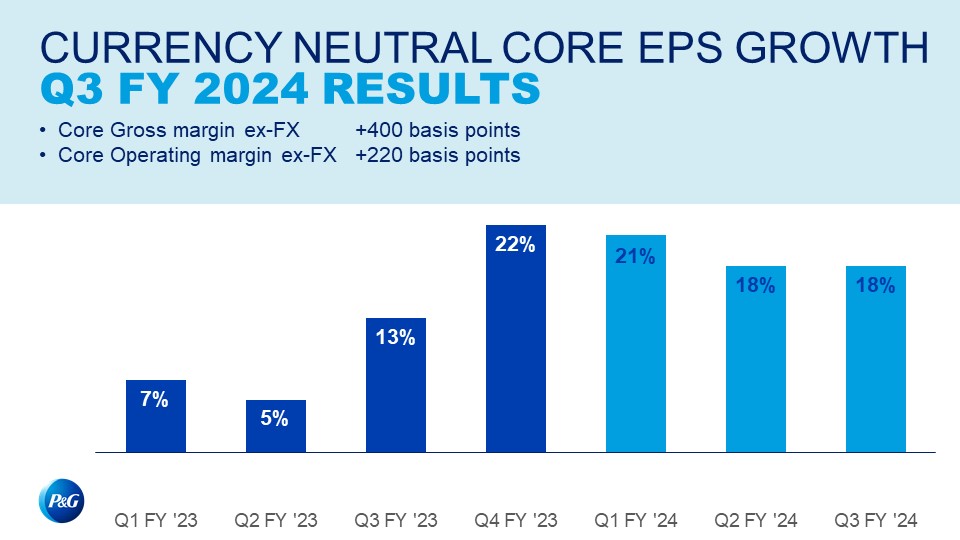
Currency Impact to Earnings
|
0.16
|
0.16
|
0.13
|
0.11
|
0.07
|
0.03
|
||||||
|
Currency-Neutral Core EPS
|
$1.73
|
$1.75
|
$1.50
|
$1.48
|
$1.90
|
$1.87
|
||||||
|
Percentage change vs. prior period Core EPS
|
7%
|
5%
|
13%
|
22%
|
21%
|
18%
|
|
Total Company
|
Diluted
EPS Growth
|
Impact of Incremental Non-Core Items
|
Core EPS Growth
|
FX Impact
|
Currency-Neutral
Core EPS Growth
|
|
FY 2024 (Estimate)
|
+1% to +2%
|
+9%
|
+10% to +11%
|
+4%
|
14% to +15%
|
|
Three Months Ended March 31
|
||
|
2024
|
2023
|
|
|
Gross Margin
|
51.2%
|
48.2%
|
|
Incremental restructuring
|
0.1%
|
—
|
|
Core Gross Margin
|
51.3%
|
48.2%
|
|
Basis point change vs. prior year Core gross margin
|
310
|
|
|
Currency Impact to Margin
|
0.9%
|
|
|
Currency-Neutral Core Gross Margin
|
52.2%
|
|
|
Basis point change vs prior year Core gross margin
|
400
|
|
|
Three Months Ended March 31
|
||
|
2024
|
2023
|
|
|
Operating Margin
|
22.1%
|
21.2%
|
|
Incremental restructuring
|
—
|
—
|
|
Intangible asset impairment charge
|
—
|
—
|
|
Core Operating Margin
|
22.1%
|
21.2%
|
|
Basis point change vs. prior year Core operating margin
|
90
|
|
|
Currency Impact to Margin
|
1.3%
|
|
|
Currency-Neutral Core Operating Margin
|
23.4%
|
|
|
Basis point change vs. prior year Core operating margin
|
220
|
|
|
Three Months Ended March 31, 2024
|
||||||
|
Operating Cash Flow
|
Capital Spending
|
Adjusted Free Cash Flow
|
Net Earnings
|
Adjustments to Net Earnings*
|
Net Earnings
as Adjusted
|
Adjusted Free Cash Flow Productivity
|
|
$4,088
|
$(797)
|
$3,291
|
$3,781
|
$—
|
$3,781
|
87%
|