FALSE2026Q2000007312412/311.66671.666710.1http://fasb.org/us-gaap/2026#OtherAssetshttp://fasb.org/us-gaap/2026#OtherAssetshttp://fasb.org/us-gaap/2026#OtherLiabilitieshttp://fasb.org/us-gaap/2026#OtherLiabilitieshttp://fasb.org/us-gaap/2026#NoninterestIncomeOtherOperatingIncomehttp://fasb.org/us-gaap/2026#NoninterestIncomeOtherOperatingIncomehttp://fasb.org/us-gaap/2026#ForeignCurrencyTransactionGainLossBeforeTaxhttp://fasb.org/us-gaap/2026#ForeignCurrencyTransactionGainLossBeforeTaxhttp://www.northerntrust.com/20260630#SecurityCommissionsandTradingIncomehttp://www.northerntrust.com/20260630#SecurityCommissionsandTradingIncomexbrli:sharesiso4217:USDiso4217:USDxbrli:sharesntrs:securityxbrli:purentrs:monthutr:Qntrs:segmentntrs:trustiso4217:EUR00000731242026-01-012026-06-300000073124us-gaap:CommonStockMember2026-01-012026-06-300000073124ntrs:DepositarySharesMember2026-01-012026-06-3000000731242026-06-3000000731242025-12-310000073124us-gaap:CommercialPortfolioSegmentMember2026-06-300000073124us-gaap:CommercialPortfolioSegmentMember2025-12-310000073124us-gaap:ConsumerPortfolioSegmentMember2026-06-300000073124us-gaap:ConsumerPortfolioSegmentMember2025-12-310000073124us-gaap:SeriesDPreferredStockMember2026-06-300000073124us-gaap:SeriesDPreferredStockMember2025-12-310000073124us-gaap:SeriesEPreferredStockMember2025-12-310000073124us-gaap:SeriesEPreferredStockMember2026-06-3000000731242026-04-012026-06-3000000731242025-04-012025-06-3000000731242025-01-012025-06-300000073124us-gaap:PreferredStockMember2025-12-310000073124us-gaap:CommonStockMember2025-12-310000073124us-gaap:AdditionalPaidInCapitalMember2025-12-310000073124us-gaap:RetainedEarningsMember2025-12-310000073124us-gaap:AccumulatedOtherComprehensiveIncomeMember2025-12-310000073124us-gaap:TreasuryStockCommonMember2025-12-310000073124us-gaap:RetainedEarningsMember2026-01-012026-03-3100000731242026-01-012026-03-310000073124us-gaap:AccumulatedOtherComprehensiveIncomeMember2026-01-012026-03-310000073124us-gaap:AdditionalPaidInCapitalMember2026-01-012026-03-310000073124us-gaap:TreasuryStockCommonMember2026-01-012026-03-310000073124us-gaap:PreferredStockMember2026-03-310000073124us-gaap:CommonStockMember2026-03-310000073124us-gaap:AdditionalPaidInCapitalMember2026-03-310000073124us-gaap:RetainedEarningsMember2026-03-310000073124us-gaap:AccumulatedOtherComprehensiveIncomeMember2026-03-310000073124us-gaap:TreasuryStockCommonMember2026-03-3100000731242026-03-310000073124us-gaap:RetainedEarningsMember2026-04-012026-06-300000073124us-gaap:AccumulatedOtherComprehensiveIncomeMember2026-04-012026-06-300000073124us-gaap:AdditionalPaidInCapitalMember2026-04-012026-06-300000073124us-gaap:TreasuryStockCommonMember2026-04-012026-06-300000073124us-gaap:PreferredStockMember2026-06-300000073124us-gaap:CommonStockMember2026-06-300000073124us-gaap:AdditionalPaidInCapitalMember2026-06-300000073124us-gaap:RetainedEarningsMember2026-06-300000073124us-gaap:AccumulatedOtherComprehensiveIncomeMember2026-06-300000073124us-gaap:TreasuryStockCommonMember2026-06-300000073124us-gaap:PreferredStockMember2024-12-310000073124us-gaap:CommonStockMember2024-12-310000073124us-gaap:AdditionalPaidInCapitalMember2024-12-310000073124us-gaap:RetainedEarningsMember2024-12-310000073124us-gaap:AccumulatedOtherComprehensiveIncomeMember2024-12-310000073124us-gaap:TreasuryStockCommonMember2024-12-3100000731242024-12-310000073124us-gaap:RetainedEarningsMember2025-01-012025-03-3100000731242025-01-012025-03-310000073124us-gaap:AccumulatedOtherComprehensiveIncomeMember2025-01-012025-03-310000073124us-gaap:AdditionalPaidInCapitalMember2025-01-012025-03-310000073124us-gaap:TreasuryStockCommonMember2025-01-012025-03-310000073124us-gaap:PreferredStockMember2025-03-310000073124us-gaap:CommonStockMember2025-03-310000073124us-gaap:AdditionalPaidInCapitalMember2025-03-310000073124us-gaap:RetainedEarningsMember2025-03-310000073124us-gaap:AccumulatedOtherComprehensiveIncomeMember2025-03-310000073124us-gaap:TreasuryStockCommonMember2025-03-3100000731242025-03-310000073124us-gaap:RetainedEarningsMember2025-04-012025-06-300000073124us-gaap:AccumulatedOtherComprehensiveIncomeMember2025-04-012025-06-300000073124us-gaap:AdditionalPaidInCapitalMember2025-04-012025-06-300000073124us-gaap:TreasuryStockCommonMember2025-04-012025-06-300000073124us-gaap:PreferredStockMember2025-06-300000073124us-gaap:CommonStockMember2025-06-300000073124us-gaap:AdditionalPaidInCapitalMember2025-06-300000073124us-gaap:RetainedEarningsMember2025-06-300000073124us-gaap:AccumulatedOtherComprehensiveIncomeMember2025-06-300000073124us-gaap:TreasuryStockCommonMember2025-06-3000000731242025-06-300000073124us-gaap:FairValueInputsLevel2Member2026-06-300000073124us-gaap:FairValueInputsLevel2Member2025-12-310000073124us-gaap:SwapMemberus-gaap:FairValueMeasurementsRecurringMemberus-gaap:FairValueInputsLevel3Memberus-gaap:ValuationTechniqueDiscountedCashFlowMember2026-06-300000073124us-gaap:SwapMemberntrs:MeasurementInputConversionRateMemberus-gaap:FairValueMeasurementsRecurringMemberus-gaap:FairValueInputsLevel3Memberus-gaap:ValuationTechniqueDiscountedCashFlowMember2026-06-300000073124us-gaap:SwapMemberntrs:MeasurementInputConversionRateMembersrt:WeightedAverageMemberus-gaap:FairValueMeasurementsRecurringMemberus-gaap:FairValueInputsLevel3Memberus-gaap:ValuationTechniqueDiscountedCashFlowMember2026-06-300000073124us-gaap:SwapMemberntrs:MeasurementInputVisaClassAAppreciationMemberus-gaap:FairValueMeasurementsRecurringMemberus-gaap:FairValueInputsLevel3Memberus-gaap:ValuationTechniqueDiscountedCashFlowMember2026-06-300000073124us-gaap:SwapMemberntrs:MeasurementInputVisaClassAAppreciationMembersrt:WeightedAverageMemberus-gaap:FairValueMeasurementsRecurringMemberus-gaap:FairValueInputsLevel3Memberus-gaap:ValuationTechniqueDiscountedCashFlowMember2026-06-300000073124us-gaap:SwapMemberus-gaap:MeasurementInputExpectedTermMembersrt:MinimumMemberus-gaap:FairValueMeasurementsRecurringMemberus-gaap:FairValueInputsLevel3Memberus-gaap:ValuationTechniqueDiscountedCashFlowMember2026-06-300000073124us-gaap:SwapMemberus-gaap:MeasurementInputExpectedTermMembersrt:MaximumMemberus-gaap:FairValueMeasurementsRecurringMemberus-gaap:FairValueInputsLevel3Memberus-gaap:ValuationTechniqueDiscountedCashFlowMember2026-06-300000073124us-gaap:SwapMemberus-gaap:MeasurementInputExpectedTermMembersrt:WeightedAverageMemberus-gaap:FairValueMeasurementsRecurringMemberus-gaap:FairValueInputsLevel3Memberus-gaap:ValuationTechniqueDiscountedCashFlowMember2026-06-300000073124us-gaap:SwapMemberus-gaap:FairValueMeasurementsRecurringMemberus-gaap:FairValueInputsLevel3Memberus-gaap:ValuationTechniqueDiscountedCashFlowMember2025-12-310000073124us-gaap:SwapMemberntrs:MeasurementInputConversionRateMemberus-gaap:FairValueMeasurementsRecurringMemberus-gaap:FairValueInputsLevel3Memberus-gaap:ValuationTechniqueDiscountedCashFlowMember2025-12-310000073124us-gaap:SwapMemberntrs:MeasurementInputConversionRateMembersrt:WeightedAverageMemberus-gaap:FairValueMeasurementsRecurringMemberus-gaap:FairValueInputsLevel3Memberus-gaap:ValuationTechniqueDiscountedCashFlowMember2025-12-310000073124us-gaap:SwapMemberntrs:MeasurementInputVisaClassAAppreciationMemberus-gaap:FairValueMeasurementsRecurringMemberus-gaap:FairValueInputsLevel3Memberus-gaap:ValuationTechniqueDiscountedCashFlowMember2025-12-310000073124us-gaap:SwapMemberntrs:MeasurementInputVisaClassAAppreciationMembersrt:WeightedAverageMemberus-gaap:FairValueMeasurementsRecurringMemberus-gaap:FairValueInputsLevel3Memberus-gaap:ValuationTechniqueDiscountedCashFlowMember2025-12-310000073124us-gaap:SwapMemberus-gaap:MeasurementInputExpectedTermMembersrt:MinimumMemberus-gaap:FairValueMeasurementsRecurringMemberus-gaap:FairValueInputsLevel3Memberus-gaap:ValuationTechniqueDiscountedCashFlowMember2025-12-310000073124us-gaap:SwapMemberus-gaap:MeasurementInputExpectedTermMembersrt:MaximumMemberus-gaap:FairValueMeasurementsRecurringMemberus-gaap:FairValueInputsLevel3Memberus-gaap:ValuationTechniqueDiscountedCashFlowMember2025-12-310000073124us-gaap:SwapMemberus-gaap:MeasurementInputExpectedTermMembersrt:WeightedAverageMemberus-gaap:FairValueMeasurementsRecurringMemberus-gaap:FairValueInputsLevel3Memberus-gaap:ValuationTechniqueDiscountedCashFlowMember2025-12-310000073124us-gaap:USTreasuryAndGovernmentMemberus-gaap:FairValueMeasurementsRecurringMemberus-gaap:FairValueInputsLevel1Member2026-06-300000073124us-gaap:USTreasuryAndGovernmentMemberus-gaap:FairValueMeasurementsRecurringMemberus-gaap:FairValueInputsLevel2Member2026-06-300000073124us-gaap:USTreasuryAndGovernmentMemberus-gaap:FairValueMeasurementsRecurringMemberus-gaap:FairValueInputsLevel3Member2026-06-300000073124us-gaap:USTreasuryAndGovernmentMemberus-gaap:FairValueMeasurementsRecurringMember2026-06-300000073124us-gaap:USGovernmentAgenciesDebtSecuritiesMemberus-gaap:FairValueMeasurementsRecurringMemberus-gaap:FairValueInputsLevel1Member2026-06-300000073124us-gaap:USGovernmentAgenciesDebtSecuritiesMemberus-gaap:FairValueMeasurementsRecurringMemberus-gaap:FairValueInputsLevel2Member2026-06-300000073124us-gaap:USGovernmentAgenciesDebtSecuritiesMemberus-gaap:FairValueMeasurementsRecurringMemberus-gaap:FairValueInputsLevel3Member2026-06-300000073124us-gaap:USGovernmentAgenciesDebtSecuritiesMemberus-gaap:FairValueMeasurementsRecurringMember2026-06-300000073124us-gaap:ForeignGovernmentDebtSecuritiesMemberus-gaap:FairValueMeasurementsRecurringMemberus-gaap:FairValueInputsLevel1Member2026-06-300000073124us-gaap:ForeignGovernmentDebtSecuritiesMemberus-gaap:FairValueMeasurementsRecurringMemberus-gaap:FairValueInputsLevel2Member2026-06-300000073124us-gaap:ForeignGovernmentDebtSecuritiesMemberus-gaap:FairValueMeasurementsRecurringMemberus-gaap:FairValueInputsLevel3Member2026-06-300000073124us-gaap:ForeignGovernmentDebtSecuritiesMemberus-gaap:FairValueMeasurementsRecurringMember2026-06-300000073124us-gaap:CorporateDebtSecuritiesMemberus-gaap:FairValueMeasurementsRecurringMemberus-gaap:FairValueInputsLevel1Member2026-06-300000073124us-gaap:CorporateDebtSecuritiesMemberus-gaap:FairValueMeasurementsRecurringMemberus-gaap:FairValueInputsLevel2Member2026-06-300000073124us-gaap:CorporateDebtSecuritiesMemberus-gaap:FairValueMeasurementsRecurringMemberus-gaap:FairValueInputsLevel3Member2026-06-300000073124us-gaap:CorporateDebtSecuritiesMemberus-gaap:FairValueMeasurementsRecurringMember2026-06-300000073124ntrs:CoveredBondsMemberus-gaap:FairValueMeasurementsRecurringMemberus-gaap:FairValueInputsLevel1Member2026-06-300000073124ntrs:CoveredBondsMemberus-gaap:FairValueMeasurementsRecurringMemberus-gaap:FairValueInputsLevel2Member2026-06-300000073124ntrs:CoveredBondsMemberus-gaap:FairValueMeasurementsRecurringMemberus-gaap:FairValueInputsLevel3Member2026-06-300000073124ntrs:CoveredBondsMemberus-gaap:FairValueMeasurementsRecurringMember2026-06-300000073124ntrs:SubSovereignSupranationalAndNonUsAgencyBondsMemberus-gaap:FairValueMeasurementsRecurringMemberus-gaap:FairValueInputsLevel1Member2026-06-300000073124ntrs:SubSovereignSupranationalAndNonUsAgencyBondsMemberus-gaap:FairValueMeasurementsRecurringMemberus-gaap:FairValueInputsLevel2Member2026-06-300000073124ntrs:SubSovereignSupranationalAndNonUsAgencyBondsMemberus-gaap:FairValueMeasurementsRecurringMemberus-gaap:FairValueInputsLevel3Member2026-06-300000073124ntrs:SubSovereignSupranationalAndNonUsAgencyBondsMemberus-gaap:FairValueMeasurementsRecurringMember2026-06-300000073124us-gaap:CollateralizedLoanObligationsMemberus-gaap:FairValueMeasurementsRecurringMemberus-gaap:FairValueInputsLevel1Member2026-06-300000073124us-gaap:CollateralizedLoanObligationsMemberus-gaap:FairValueMeasurementsRecurringMemberus-gaap:FairValueInputsLevel2Member2026-06-300000073124us-gaap:CollateralizedLoanObligationsMemberus-gaap:FairValueMeasurementsRecurringMemberus-gaap:FairValueInputsLevel3Member2026-06-300000073124us-gaap:CollateralizedLoanObligationsMemberus-gaap:FairValueMeasurementsRecurringMember2026-06-300000073124ntrs:OtherAssetBackedSecuritiesMemberus-gaap:FairValueMeasurementsRecurringMemberus-gaap:FairValueInputsLevel1Member2026-06-300000073124ntrs:OtherAssetBackedSecuritiesMemberus-gaap:FairValueMeasurementsRecurringMemberus-gaap:FairValueInputsLevel2Member2026-06-300000073124ntrs:OtherAssetBackedSecuritiesMemberus-gaap:FairValueMeasurementsRecurringMemberus-gaap:FairValueInputsLevel3Member2026-06-300000073124ntrs:OtherAssetBackedSecuritiesMemberus-gaap:FairValueMeasurementsRecurringMember2026-06-300000073124us-gaap:CommercialMortgageBackedSecuritiesMemberus-gaap:FairValueMeasurementsRecurringMemberus-gaap:FairValueInputsLevel1Member2026-06-300000073124us-gaap:CommercialMortgageBackedSecuritiesMemberus-gaap:FairValueMeasurementsRecurringMemberus-gaap:FairValueInputsLevel2Member2026-06-300000073124us-gaap:CommercialMortgageBackedSecuritiesMemberus-gaap:FairValueMeasurementsRecurringMemberus-gaap:FairValueInputsLevel3Member2026-06-300000073124us-gaap:CommercialMortgageBackedSecuritiesMemberus-gaap:FairValueMeasurementsRecurringMember2026-06-300000073124us-gaap:FairValueInputsLevel1Memberus-gaap:FairValueMeasurementsRecurringMember2026-06-300000073124us-gaap:FairValueInputsLevel2Memberus-gaap:FairValueMeasurementsRecurringMember2026-06-300000073124us-gaap:FairValueInputsLevel3Memberus-gaap:FairValueMeasurementsRecurringMember2026-06-300000073124us-gaap:FairValueMeasurementsRecurringMember2026-06-300000073124us-gaap:FairValueMeasurementsRecurringMemberus-gaap:ForeignExchangeContractMemberus-gaap:FairValueInputsLevel1Member2026-06-300000073124us-gaap:FairValueMeasurementsRecurringMemberus-gaap:ForeignExchangeContractMemberus-gaap:FairValueInputsLevel2Member2026-06-300000073124us-gaap:FairValueMeasurementsRecurringMemberus-gaap:ForeignExchangeContractMemberus-gaap:FairValueInputsLevel3Member2026-06-300000073124us-gaap:ForeignExchangeContractMemberus-gaap:FairValueMeasurementsRecurringMember2026-06-300000073124us-gaap:FairValueMeasurementsRecurringMemberus-gaap:InterestRateContractMemberus-gaap:FairValueInputsLevel1Member2026-06-300000073124us-gaap:FairValueMeasurementsRecurringMemberus-gaap:InterestRateContractMemberus-gaap:FairValueInputsLevel2Member2026-06-300000073124us-gaap:FairValueMeasurementsRecurringMemberus-gaap:InterestRateContractMemberus-gaap:FairValueInputsLevel3Member2026-06-300000073124us-gaap:InterestRateContractMemberus-gaap:FairValueMeasurementsRecurringMember2026-06-300000073124us-gaap:FairValueMeasurementsRecurringMemberus-gaap:OtherContractMemberus-gaap:FairValueInputsLevel1Member2026-06-300000073124us-gaap:FairValueMeasurementsRecurringMemberus-gaap:OtherContractMemberus-gaap:FairValueInputsLevel2Member2026-06-300000073124us-gaap:FairValueMeasurementsRecurringMemberus-gaap:OtherContractMemberus-gaap:FairValueInputsLevel3Member2026-06-300000073124us-gaap:OtherContractMemberus-gaap:FairValueMeasurementsRecurringMember2026-06-300000073124ntrs:CrossProductCollateralAdjustmentMember2026-06-300000073124us-gaap:MoneyMarketFundsMemberus-gaap:FairValueMeasurementsRecurringMember2026-06-300000073124ntrs:VisaClassCSharesMemberus-gaap:FairValueMeasurementsRecurringMember2026-06-300000073124ntrs:SeedCapitalInvestmentsCertainNorthernFundsMemberus-gaap:FairValueMeasurementsRecurringMember2026-06-300000073124us-gaap:USTreasuryAndGovernmentMemberus-gaap:FairValueMeasurementsRecurringMemberus-gaap:FairValueInputsLevel1Member2025-12-310000073124us-gaap:USTreasuryAndGovernmentMemberus-gaap:FairValueMeasurementsRecurringMemberus-gaap:FairValueInputsLevel2Member2025-12-310000073124us-gaap:USTreasuryAndGovernmentMemberus-gaap:FairValueMeasurementsRecurringMemberus-gaap:FairValueInputsLevel3Member2025-12-310000073124us-gaap:USTreasuryAndGovernmentMemberus-gaap:FairValueMeasurementsRecurringMember2025-12-310000073124us-gaap:USStatesAndPoliticalSubdivisionsMemberus-gaap:FairValueMeasurementsRecurringMemberus-gaap:FairValueInputsLevel1Member2025-12-310000073124us-gaap:USStatesAndPoliticalSubdivisionsMemberus-gaap:FairValueMeasurementsRecurringMemberus-gaap:FairValueInputsLevel2Member2025-12-310000073124us-gaap:USStatesAndPoliticalSubdivisionsMemberus-gaap:FairValueMeasurementsRecurringMemberus-gaap:FairValueInputsLevel3Member2025-12-310000073124us-gaap:USStatesAndPoliticalSubdivisionsMemberus-gaap:FairValueMeasurementsRecurringMember2025-12-310000073124us-gaap:USGovernmentAgenciesDebtSecuritiesMemberus-gaap:FairValueMeasurementsRecurringMemberus-gaap:FairValueInputsLevel1Member2025-12-310000073124us-gaap:USGovernmentAgenciesDebtSecuritiesMemberus-gaap:FairValueMeasurementsRecurringMemberus-gaap:FairValueInputsLevel2Member2025-12-310000073124us-gaap:USGovernmentAgenciesDebtSecuritiesMemberus-gaap:FairValueMeasurementsRecurringMemberus-gaap:FairValueInputsLevel3Member2025-12-310000073124us-gaap:USGovernmentAgenciesDebtSecuritiesMemberus-gaap:FairValueMeasurementsRecurringMember2025-12-310000073124us-gaap:ForeignGovernmentDebtSecuritiesMemberus-gaap:FairValueMeasurementsRecurringMemberus-gaap:FairValueInputsLevel1Member2025-12-310000073124us-gaap:ForeignGovernmentDebtSecuritiesMemberus-gaap:FairValueMeasurementsRecurringMemberus-gaap:FairValueInputsLevel2Member2025-12-310000073124us-gaap:ForeignGovernmentDebtSecuritiesMemberus-gaap:FairValueMeasurementsRecurringMemberus-gaap:FairValueInputsLevel3Member2025-12-310000073124us-gaap:ForeignGovernmentDebtSecuritiesMemberus-gaap:FairValueMeasurementsRecurringMember2025-12-310000073124us-gaap:CorporateDebtSecuritiesMemberus-gaap:FairValueMeasurementsRecurringMemberus-gaap:FairValueInputsLevel1Member2025-12-310000073124us-gaap:CorporateDebtSecuritiesMemberus-gaap:FairValueMeasurementsRecurringMemberus-gaap:FairValueInputsLevel2Member2025-12-310000073124us-gaap:CorporateDebtSecuritiesMemberus-gaap:FairValueMeasurementsRecurringMemberus-gaap:FairValueInputsLevel3Member2025-12-310000073124us-gaap:CorporateDebtSecuritiesMemberus-gaap:FairValueMeasurementsRecurringMember2025-12-310000073124ntrs:CoveredBondsMemberus-gaap:FairValueMeasurementsRecurringMemberus-gaap:FairValueInputsLevel1Member2025-12-310000073124ntrs:CoveredBondsMemberus-gaap:FairValueMeasurementsRecurringMemberus-gaap:FairValueInputsLevel2Member2025-12-310000073124ntrs:CoveredBondsMemberus-gaap:FairValueMeasurementsRecurringMemberus-gaap:FairValueInputsLevel3Member2025-12-310000073124ntrs:CoveredBondsMemberus-gaap:FairValueMeasurementsRecurringMember2025-12-310000073124ntrs:SubSovereignSupranationalAndNonUsAgencyBondsMemberus-gaap:FairValueMeasurementsRecurringMemberus-gaap:FairValueInputsLevel1Member2025-12-310000073124ntrs:SubSovereignSupranationalAndNonUsAgencyBondsMemberus-gaap:FairValueMeasurementsRecurringMemberus-gaap:FairValueInputsLevel2Member2025-12-310000073124ntrs:SubSovereignSupranationalAndNonUsAgencyBondsMemberus-gaap:FairValueMeasurementsRecurringMemberus-gaap:FairValueInputsLevel3Member2025-12-310000073124ntrs:SubSovereignSupranationalAndNonUsAgencyBondsMemberus-gaap:FairValueMeasurementsRecurringMember2025-12-310000073124us-gaap:CollateralizedLoanObligationsMemberus-gaap:FairValueMeasurementsRecurringMemberus-gaap:FairValueInputsLevel1Member2025-12-310000073124us-gaap:CollateralizedLoanObligationsMemberus-gaap:FairValueMeasurementsRecurringMemberus-gaap:FairValueInputsLevel2Member2025-12-310000073124us-gaap:CollateralizedLoanObligationsMemberus-gaap:FairValueMeasurementsRecurringMemberus-gaap:FairValueInputsLevel3Member2025-12-310000073124us-gaap:CollateralizedLoanObligationsMemberus-gaap:FairValueMeasurementsRecurringMember2025-12-310000073124ntrs:OtherAssetBackedSecuritiesMemberus-gaap:FairValueMeasurementsRecurringMemberus-gaap:FairValueInputsLevel1Member2025-12-310000073124ntrs:OtherAssetBackedSecuritiesMemberus-gaap:FairValueMeasurementsRecurringMemberus-gaap:FairValueInputsLevel2Member2025-12-310000073124ntrs:OtherAssetBackedSecuritiesMemberus-gaap:FairValueMeasurementsRecurringMemberus-gaap:FairValueInputsLevel3Member2025-12-310000073124ntrs:OtherAssetBackedSecuritiesMemberus-gaap:FairValueMeasurementsRecurringMember2025-12-310000073124us-gaap:CommercialMortgageBackedSecuritiesMemberus-gaap:FairValueMeasurementsRecurringMemberus-gaap:FairValueInputsLevel1Member2025-12-310000073124us-gaap:CommercialMortgageBackedSecuritiesMemberus-gaap:FairValueMeasurementsRecurringMemberus-gaap:FairValueInputsLevel2Member2025-12-310000073124us-gaap:CommercialMortgageBackedSecuritiesMemberus-gaap:FairValueMeasurementsRecurringMemberus-gaap:FairValueInputsLevel3Member2025-12-310000073124us-gaap:CommercialMortgageBackedSecuritiesMemberus-gaap:FairValueMeasurementsRecurringMember2025-12-310000073124us-gaap:FairValueInputsLevel1Memberus-gaap:FairValueMeasurementsRecurringMember2025-12-310000073124us-gaap:FairValueInputsLevel2Memberus-gaap:FairValueMeasurementsRecurringMember2025-12-310000073124us-gaap:FairValueInputsLevel3Memberus-gaap:FairValueMeasurementsRecurringMember2025-12-310000073124us-gaap:FairValueMeasurementsRecurringMember2025-12-310000073124us-gaap:FairValueMeasurementsRecurringMemberus-gaap:ForeignExchangeContractMemberus-gaap:FairValueInputsLevel1Member2025-12-310000073124us-gaap:FairValueMeasurementsRecurringMemberus-gaap:ForeignExchangeContractMemberus-gaap:FairValueInputsLevel2Member2025-12-310000073124us-gaap:FairValueMeasurementsRecurringMemberus-gaap:ForeignExchangeContractMemberus-gaap:FairValueInputsLevel3Member2025-12-310000073124us-gaap:ForeignExchangeContractMemberus-gaap:FairValueMeasurementsRecurringMember2025-12-310000073124us-gaap:FairValueMeasurementsRecurringMemberus-gaap:InterestRateContractMemberus-gaap:FairValueInputsLevel1Member2025-12-310000073124us-gaap:FairValueMeasurementsRecurringMemberus-gaap:InterestRateContractMemberus-gaap:FairValueInputsLevel2Member2025-12-310000073124us-gaap:FairValueMeasurementsRecurringMemberus-gaap:InterestRateContractMemberus-gaap:FairValueInputsLevel3Member2025-12-310000073124us-gaap:InterestRateContractMemberus-gaap:FairValueMeasurementsRecurringMember2025-12-310000073124us-gaap:FairValueMeasurementsRecurringMemberus-gaap:OtherContractMemberus-gaap:FairValueInputsLevel1Member2025-12-310000073124us-gaap:FairValueMeasurementsRecurringMemberus-gaap:OtherContractMemberus-gaap:FairValueInputsLevel2Member2025-12-310000073124us-gaap:FairValueMeasurementsRecurringMemberus-gaap:OtherContractMemberus-gaap:FairValueInputsLevel3Member2025-12-310000073124us-gaap:OtherContractMemberus-gaap:FairValueMeasurementsRecurringMember2025-12-310000073124ntrs:CrossProductCollateralAdjustmentMember2025-12-310000073124us-gaap:MoneyMarketFundsMemberus-gaap:FairValueMeasurementsRecurringMember2025-12-310000073124ntrs:SeedCapitalInvestmentsCertainNorthernFundsMemberus-gaap:FairValueMeasurementsRecurringMember2025-12-310000073124ntrs:VisaClassCSharesMemberus-gaap:FairValueMeasurementsRecurringMember2025-12-310000073124ntrs:VisaConversionRateSwapMember2026-03-310000073124ntrs:VisaConversionRateSwapMember2025-03-310000073124ntrs:VisaConversionRateSwapMember2026-04-012026-06-300000073124ntrs:VisaConversionRateSwapMember2025-04-012025-06-300000073124ntrs:VisaConversionRateSwapMember2026-06-300000073124ntrs:VisaConversionRateSwapMember2025-06-300000073124ntrs:VisaConversionRateSwapMember2025-12-310000073124ntrs:VisaConversionRateSwapMember2024-12-310000073124ntrs:VisaConversionRateSwapMember2026-01-012026-06-300000073124ntrs:VisaConversionRateSwapMember2025-01-012025-06-300000073124us-gaap:MeasurementInputDiscountRateMemberus-gaap:FairValueMeasurementsNonrecurringMemberus-gaap:FairValueInputsLevel3Member2026-06-300000073124us-gaap:MeasurementInputDiscountRateMembersrt:WeightedAverageMemberus-gaap:FairValueMeasurementsNonrecurringMemberus-gaap:FairValueInputsLevel3Member2026-06-300000073124us-gaap:MeasurementInputDiscountRateMemberus-gaap:FairValueMeasurementsNonrecurringMemberus-gaap:FairValueInputsLevel3Member2025-12-310000073124us-gaap:MeasurementInputDiscountRateMembersrt:WeightedAverageMemberus-gaap:FairValueMeasurementsNonrecurringMemberus-gaap:FairValueInputsLevel3Member2025-12-310000073124us-gaap:LoansMemberus-gaap:MeasurementInputDiscountRateMemberus-gaap:FairValueMeasurementsNonrecurringMemberus-gaap:FairValueInputsLevel3Member2026-06-300000073124us-gaap:LoansMemberus-gaap:MeasurementInputDiscountRateMemberus-gaap:FairValueMeasurementsNonrecurringMemberus-gaap:FairValueInputsLevel3Member2025-12-310000073124us-gaap:CarryingReportedAmountFairValueDisclosureMember2026-06-300000073124us-gaap:EstimateOfFairValueFairValueDisclosureMember2026-06-300000073124us-gaap:EstimateOfFairValueFairValueDisclosureMemberus-gaap:FairValueInputsLevel1Member2026-06-300000073124us-gaap:EstimateOfFairValueFairValueDisclosureMemberus-gaap:FairValueInputsLevel2Member2026-06-300000073124us-gaap:EstimateOfFairValueFairValueDisclosureMemberus-gaap:FairValueInputsLevel3Member2026-06-300000073124us-gaap:CarryingReportedAmountFairValueDisclosureMember2025-12-310000073124us-gaap:EstimateOfFairValueFairValueDisclosureMember2025-12-310000073124us-gaap:EstimateOfFairValueFairValueDisclosureMemberus-gaap:FairValueInputsLevel1Member2025-12-310000073124us-gaap:EstimateOfFairValueFairValueDisclosureMemberus-gaap:FairValueInputsLevel2Member2025-12-310000073124us-gaap:EstimateOfFairValueFairValueDisclosureMemberus-gaap:FairValueInputsLevel3Member2025-12-310000073124us-gaap:USTreasuryAndGovernmentMember2026-06-300000073124us-gaap:USGovernmentAgenciesDebtSecuritiesMember2026-06-300000073124us-gaap:ForeignGovernmentDebtSecuritiesMember2026-06-300000073124us-gaap:CorporateDebtSecuritiesMember2026-06-300000073124ntrs:CoveredBondsMember2026-06-300000073124ntrs:SubSovereignSupranationalAndNonUsAgencyBondsMember2026-06-300000073124us-gaap:CollateralizedLoanObligationsMember2026-06-300000073124ntrs:OtherAssetBackedSecuritiesMember2026-06-300000073124us-gaap:CommercialMortgageBackedSecuritiesMember2026-06-300000073124us-gaap:USStatesAndPoliticalSubdivisionsMember2026-06-300000073124us-gaap:CertificatesOfDepositMember2026-06-300000073124ntrs:OtherHeldToMaturitySecuritiesMember2026-06-300000073124us-gaap:USTreasuryAndGovernmentMember2025-12-310000073124us-gaap:USStatesAndPoliticalSubdivisionsMember2025-12-310000073124us-gaap:USGovernmentAgenciesDebtSecuritiesMember2025-12-310000073124us-gaap:ForeignGovernmentDebtSecuritiesMember2025-12-310000073124us-gaap:CorporateDebtSecuritiesMember2025-12-310000073124ntrs:CoveredBondsMember2025-12-310000073124ntrs:SubSovereignSupranationalAndNonUsAgencyBondsMember2025-12-310000073124us-gaap:CollateralizedLoanObligationsMember2025-12-310000073124ntrs:OtherAssetBackedSecuritiesMember2025-12-310000073124us-gaap:CommercialMortgageBackedSecuritiesMember2025-12-310000073124us-gaap:CertificatesOfDepositMember2025-12-310000073124ntrs:OtherHeldToMaturitySecuritiesMember2025-12-310000073124us-gaap:USStatesAndPoliticalSubdivisionsMemberntrs:MoodysAndStandardPoorsAAARatingMember2026-06-300000073124us-gaap:USStatesAndPoliticalSubdivisionsMemberntrs:MoodysAndStandardPoorsAARatingMember2026-06-300000073124us-gaap:USStatesAndPoliticalSubdivisionsMemberntrs:MoodysAndStandardPoorsARatingMember2026-06-300000073124us-gaap:USStatesAndPoliticalSubdivisionsMemberntrs:MoodysAndStandardPoorsBBBRatingMember2026-06-300000073124us-gaap:USStatesAndPoliticalSubdivisionsMemberntrs:MoodysAndStandardPoorsNotRatedMember2026-06-300000073124us-gaap:USGovernmentAgenciesDebtSecuritiesMemberntrs:MoodysAndStandardPoorsAAARatingMember2026-06-300000073124us-gaap:USGovernmentAgenciesDebtSecuritiesMemberntrs:MoodysAndStandardPoorsAARatingMember2026-06-300000073124us-gaap:USGovernmentAgenciesDebtSecuritiesMemberntrs:MoodysAndStandardPoorsARatingMember2026-06-300000073124us-gaap:USGovernmentAgenciesDebtSecuritiesMemberntrs:MoodysAndStandardPoorsBBBRatingMember2026-06-300000073124us-gaap:USGovernmentAgenciesDebtSecuritiesMemberntrs:MoodysAndStandardPoorsNotRatedMember2026-06-300000073124us-gaap:ForeignGovernmentDebtSecuritiesMemberntrs:MoodysAndStandardPoorsAAARatingMember2026-06-300000073124us-gaap:ForeignGovernmentDebtSecuritiesMemberntrs:MoodysAndStandardPoorsAARatingMember2026-06-300000073124us-gaap:ForeignGovernmentDebtSecuritiesMemberntrs:MoodysAndStandardPoorsARatingMember2026-06-300000073124us-gaap:ForeignGovernmentDebtSecuritiesMemberntrs:MoodysAndStandardPoorsBBBRatingMember2026-06-300000073124us-gaap:ForeignGovernmentDebtSecuritiesMemberntrs:MoodysAndStandardPoorsNotRatedMember2026-06-300000073124us-gaap:CorporateDebtSecuritiesMemberntrs:MoodysAndStandardPoorsAAARatingMember2026-06-300000073124us-gaap:CorporateDebtSecuritiesMemberntrs:MoodysAndStandardPoorsAARatingMember2026-06-300000073124us-gaap:CorporateDebtSecuritiesMemberntrs:MoodysAndStandardPoorsARatingMember2026-06-300000073124us-gaap:CorporateDebtSecuritiesMemberntrs:MoodysAndStandardPoorsBBBRatingMember2026-06-300000073124us-gaap:CorporateDebtSecuritiesMemberntrs:MoodysAndStandardPoorsNotRatedMember2026-06-300000073124ntrs:CoveredBondsMemberntrs:MoodysAndStandardPoorsAAARatingMember2026-06-300000073124ntrs:CoveredBondsMemberntrs:MoodysAndStandardPoorsAARatingMember2026-06-300000073124ntrs:CoveredBondsMemberntrs:MoodysAndStandardPoorsARatingMember2026-06-300000073124ntrs:CoveredBondsMemberntrs:MoodysAndStandardPoorsBBBRatingMember2026-06-300000073124ntrs:CoveredBondsMemberntrs:MoodysAndStandardPoorsNotRatedMember2026-06-300000073124us-gaap:CertificatesOfDepositMemberntrs:MoodysAndStandardPoorsAAARatingMember2026-06-300000073124us-gaap:CertificatesOfDepositMemberntrs:MoodysAndStandardPoorsAARatingMember2026-06-300000073124us-gaap:CertificatesOfDepositMemberntrs:MoodysAndStandardPoorsARatingMember2026-06-300000073124us-gaap:CertificatesOfDepositMemberntrs:MoodysAndStandardPoorsBBBRatingMember2026-06-300000073124us-gaap:CertificatesOfDepositMemberntrs:MoodysAndStandardPoorsNotRatedMember2026-06-300000073124ntrs:SubSovereignSupranationalAndNonUsAgencyBondsMemberntrs:MoodysAndStandardPoorsAAARatingMember2026-06-300000073124ntrs:SubSovereignSupranationalAndNonUsAgencyBondsMemberntrs:MoodysAndStandardPoorsAARatingMember2026-06-300000073124ntrs:SubSovereignSupranationalAndNonUsAgencyBondsMemberntrs:MoodysAndStandardPoorsARatingMember2026-06-300000073124ntrs:SubSovereignSupranationalAndNonUsAgencyBondsMemberntrs:MoodysAndStandardPoorsBBBRatingMember2026-06-300000073124ntrs:SubSovereignSupranationalAndNonUsAgencyBondsMemberntrs:MoodysAndStandardPoorsNotRatedMember2026-06-300000073124ntrs:OtherAssetBackedSecuritiesMemberntrs:MoodysAndStandardPoorsAAARatingMember2026-06-300000073124ntrs:OtherAssetBackedSecuritiesMemberntrs:MoodysAndStandardPoorsAARatingMember2026-06-300000073124ntrs:OtherAssetBackedSecuritiesMemberntrs:MoodysAndStandardPoorsARatingMember2026-06-300000073124ntrs:OtherAssetBackedSecuritiesMemberntrs:MoodysAndStandardPoorsBBBRatingMember2026-06-300000073124ntrs:OtherAssetBackedSecuritiesMemberntrs:MoodysAndStandardPoorsNotRatedMember2026-06-300000073124us-gaap:CommercialMortgageBackedSecuritiesMemberntrs:MoodysAndStandardPoorsAAARatingMember2026-06-300000073124us-gaap:CommercialMortgageBackedSecuritiesMemberntrs:MoodysAndStandardPoorsAARatingMember2026-06-300000073124us-gaap:CommercialMortgageBackedSecuritiesMemberntrs:MoodysAndStandardPoorsARatingMember2026-06-300000073124us-gaap:CommercialMortgageBackedSecuritiesMemberntrs:MoodysAndStandardPoorsBBBRatingMember2026-06-300000073124us-gaap:CommercialMortgageBackedSecuritiesMemberntrs:MoodysAndStandardPoorsNotRatedMember2026-06-300000073124ntrs:OtherHeldToMaturitySecuritiesMemberntrs:MoodysAndStandardPoorsAAARatingMember2026-06-300000073124ntrs:OtherHeldToMaturitySecuritiesMemberntrs:MoodysAndStandardPoorsAARatingMember2026-06-300000073124ntrs:OtherHeldToMaturitySecuritiesMemberntrs:MoodysAndStandardPoorsARatingMember2026-06-300000073124ntrs:OtherHeldToMaturitySecuritiesMemberntrs:MoodysAndStandardPoorsBBBRatingMember2026-06-300000073124ntrs:OtherHeldToMaturitySecuritiesMemberntrs:MoodysAndStandardPoorsNotRatedMember2026-06-300000073124ntrs:MoodysAndStandardPoorsAAARatingMember2026-06-300000073124ntrs:MoodysAndStandardPoorsAARatingMember2026-06-300000073124ntrs:MoodysAndStandardPoorsARatingMember2026-06-300000073124ntrs:MoodysAndStandardPoorsBBBRatingMember2026-06-300000073124ntrs:MoodysAndStandardPoorsNotRatedMember2026-06-300000073124us-gaap:USStatesAndPoliticalSubdivisionsMemberntrs:MoodysAndStandardPoorsAAARatingMember2025-12-310000073124us-gaap:USStatesAndPoliticalSubdivisionsMemberntrs:MoodysAndStandardPoorsAARatingMember2025-12-310000073124us-gaap:USStatesAndPoliticalSubdivisionsMemberntrs:MoodysAndStandardPoorsARatingMember2025-12-310000073124us-gaap:USStatesAndPoliticalSubdivisionsMemberntrs:MoodysAndStandardPoorsBBBRatingMember2025-12-310000073124us-gaap:USStatesAndPoliticalSubdivisionsMemberntrs:MoodysAndStandardPoorsNotRatedMember2025-12-310000073124us-gaap:USGovernmentAgenciesDebtSecuritiesMemberntrs:MoodysAndStandardPoorsAAARatingMember2025-12-310000073124us-gaap:USGovernmentAgenciesDebtSecuritiesMemberntrs:MoodysAndStandardPoorsAARatingMember2025-12-310000073124us-gaap:USGovernmentAgenciesDebtSecuritiesMemberntrs:MoodysAndStandardPoorsARatingMember2025-12-310000073124us-gaap:USGovernmentAgenciesDebtSecuritiesMemberntrs:MoodysAndStandardPoorsBBBRatingMember2025-12-310000073124us-gaap:USGovernmentAgenciesDebtSecuritiesMemberntrs:MoodysAndStandardPoorsNotRatedMember2025-12-310000073124us-gaap:ForeignGovernmentDebtSecuritiesMemberntrs:MoodysAndStandardPoorsAAARatingMember2025-12-310000073124us-gaap:ForeignGovernmentDebtSecuritiesMemberntrs:MoodysAndStandardPoorsAARatingMember2025-12-310000073124us-gaap:ForeignGovernmentDebtSecuritiesMemberntrs:MoodysAndStandardPoorsARatingMember2025-12-310000073124us-gaap:ForeignGovernmentDebtSecuritiesMemberntrs:MoodysAndStandardPoorsBBBRatingMember2025-12-310000073124us-gaap:ForeignGovernmentDebtSecuritiesMemberntrs:MoodysAndStandardPoorsNotRatedMember2025-12-310000073124us-gaap:CorporateDebtSecuritiesMemberntrs:MoodysAndStandardPoorsAAARatingMember2025-12-310000073124us-gaap:CorporateDebtSecuritiesMemberntrs:MoodysAndStandardPoorsAARatingMember2025-12-310000073124us-gaap:CorporateDebtSecuritiesMemberntrs:MoodysAndStandardPoorsARatingMember2025-12-310000073124us-gaap:CorporateDebtSecuritiesMemberntrs:MoodysAndStandardPoorsBBBRatingMember2025-12-310000073124us-gaap:CorporateDebtSecuritiesMemberntrs:MoodysAndStandardPoorsNotRatedMember2025-12-310000073124ntrs:CoveredBondsMemberntrs:MoodysAndStandardPoorsAAARatingMember2025-12-310000073124ntrs:CoveredBondsMemberntrs:MoodysAndStandardPoorsAARatingMember2025-12-310000073124ntrs:CoveredBondsMemberntrs:MoodysAndStandardPoorsARatingMember2025-12-310000073124ntrs:CoveredBondsMemberntrs:MoodysAndStandardPoorsBBBRatingMember2025-12-310000073124ntrs:CoveredBondsMemberntrs:MoodysAndStandardPoorsNotRatedMember2025-12-310000073124us-gaap:CertificatesOfDepositMemberntrs:MoodysAndStandardPoorsAAARatingMember2025-12-310000073124us-gaap:CertificatesOfDepositMemberntrs:MoodysAndStandardPoorsAARatingMember2025-12-310000073124us-gaap:CertificatesOfDepositMemberntrs:MoodysAndStandardPoorsARatingMember2025-12-310000073124us-gaap:CertificatesOfDepositMemberntrs:MoodysAndStandardPoorsBBBRatingMember2025-12-310000073124us-gaap:CertificatesOfDepositMemberntrs:MoodysAndStandardPoorsNotRatedMember2025-12-310000073124ntrs:SubSovereignSupranationalAndNonUsAgencyBondsMemberntrs:MoodysAndStandardPoorsAAARatingMember2025-12-310000073124ntrs:SubSovereignSupranationalAndNonUsAgencyBondsMemberntrs:MoodysAndStandardPoorsAARatingMember2025-12-310000073124ntrs:SubSovereignSupranationalAndNonUsAgencyBondsMemberntrs:MoodysAndStandardPoorsARatingMember2025-12-310000073124ntrs:SubSovereignSupranationalAndNonUsAgencyBondsMemberntrs:MoodysAndStandardPoorsBBBRatingMember2025-12-310000073124ntrs:SubSovereignSupranationalAndNonUsAgencyBondsMemberntrs:MoodysAndStandardPoorsNotRatedMember2025-12-310000073124us-gaap:CommercialMortgageBackedSecuritiesMemberntrs:MoodysAndStandardPoorsAAARatingMember2025-12-310000073124us-gaap:CommercialMortgageBackedSecuritiesMemberntrs:MoodysAndStandardPoorsAARatingMember2025-12-310000073124us-gaap:CommercialMortgageBackedSecuritiesMemberntrs:MoodysAndStandardPoorsARatingMember2025-12-310000073124us-gaap:CommercialMortgageBackedSecuritiesMemberntrs:MoodysAndStandardPoorsBBBRatingMember2025-12-310000073124us-gaap:CommercialMortgageBackedSecuritiesMemberntrs:MoodysAndStandardPoorsNotRatedMember2025-12-310000073124ntrs:OtherHeldToMaturitySecuritiesMemberntrs:MoodysAndStandardPoorsAAARatingMember2025-12-310000073124ntrs:OtherHeldToMaturitySecuritiesMemberntrs:MoodysAndStandardPoorsAARatingMember2025-12-310000073124ntrs:OtherHeldToMaturitySecuritiesMemberntrs:MoodysAndStandardPoorsARatingMember2025-12-310000073124ntrs:OtherHeldToMaturitySecuritiesMemberntrs:MoodysAndStandardPoorsBBBRatingMember2025-12-310000073124ntrs:OtherHeldToMaturitySecuritiesMemberntrs:MoodysAndStandardPoorsNotRatedMember2025-12-310000073124ntrs:MoodysAndStandardPoorsAAARatingMember2025-12-310000073124ntrs:MoodysAndStandardPoorsAARatingMember2025-12-310000073124ntrs:MoodysAndStandardPoorsARatingMember2025-12-310000073124ntrs:MoodysAndStandardPoorsBBBRatingMember2025-12-310000073124ntrs:MoodysAndStandardPoorsNotRatedMember2025-12-310000073124ntrs:MoodysAndStandardPoorsAOrHigherRatingMember2026-06-300000073124ntrs:MoodysAndStandardPoorsAOrHigherRatingMember2025-12-310000073124us-gaap:USTreasuryAndGovernmentMember2026-04-012026-06-300000073124us-gaap:USTreasuryAndGovernmentMember2025-04-012025-06-300000073124us-gaap:USTreasuryAndGovernmentMember2026-01-012026-06-300000073124us-gaap:USTreasuryAndGovernmentMember2025-01-012025-06-300000073124us-gaap:USStatesAndPoliticalSubdivisionsMember2026-04-012026-06-300000073124us-gaap:USStatesAndPoliticalSubdivisionsMember2025-04-012025-06-300000073124us-gaap:USStatesAndPoliticalSubdivisionsMember2026-01-012026-06-300000073124us-gaap:USStatesAndPoliticalSubdivisionsMember2025-01-012025-06-300000073124us-gaap:USGovernmentAgenciesDebtSecuritiesMember2026-04-012026-06-300000073124us-gaap:USGovernmentAgenciesDebtSecuritiesMember2025-04-012025-06-300000073124us-gaap:USGovernmentAgenciesDebtSecuritiesMember2026-01-012026-06-300000073124us-gaap:USGovernmentAgenciesDebtSecuritiesMember2025-01-012025-06-300000073124us-gaap:ForeignGovernmentDebtSecuritiesMember2026-04-012026-06-300000073124us-gaap:ForeignGovernmentDebtSecuritiesMember2025-04-012025-06-300000073124us-gaap:ForeignGovernmentDebtSecuritiesMember2026-01-012026-06-300000073124us-gaap:ForeignGovernmentDebtSecuritiesMember2025-01-012025-06-300000073124ntrs:SubSovereignSupranationalAndNonUsAgencyBondsMember2026-04-012026-06-300000073124ntrs:SubSovereignSupranationalAndNonUsAgencyBondsMember2025-04-012025-06-300000073124ntrs:SubSovereignSupranationalAndNonUsAgencyBondsMember2026-01-012026-06-300000073124ntrs:SubSovereignSupranationalAndNonUsAgencyBondsMember2025-01-012025-06-300000073124ntrs:OtherAssetBackedSecuritiesMember2026-04-012026-06-300000073124ntrs:OtherAssetBackedSecuritiesMember2025-04-012025-06-300000073124ntrs:OtherAssetBackedSecuritiesMember2026-01-012026-06-300000073124ntrs:OtherAssetBackedSecuritiesMember2025-01-012025-06-300000073124us-gaap:CommercialMortgageBackedSecuritiesMember2026-04-012026-06-300000073124us-gaap:CommercialMortgageBackedSecuritiesMember2025-04-012025-06-300000073124us-gaap:CommercialMortgageBackedSecuritiesMember2026-01-012026-06-300000073124us-gaap:CommercialMortgageBackedSecuritiesMember2025-01-012025-06-300000073124ntrs:CommercialAndInstitutionalLoansMemberus-gaap:CommercialPortfolioSegmentMember2026-06-300000073124ntrs:CommercialAndInstitutionalLoansMemberus-gaap:CommercialPortfolioSegmentMember2025-12-310000073124us-gaap:CommercialRealEstateMemberus-gaap:CommercialPortfolioSegmentMember2026-06-300000073124us-gaap:CommercialRealEstateMemberus-gaap:CommercialPortfolioSegmentMember2025-12-310000073124ntrs:SubscriptionFinanceLoansMemberus-gaap:CommercialPortfolioSegmentMember2026-06-300000073124ntrs:SubscriptionFinanceLoansMemberus-gaap:CommercialPortfolioSegmentMember2025-12-310000073124ntrs:FundFinanceLoansMemberus-gaap:CommercialPortfolioSegmentMember2026-06-300000073124ntrs:FundFinanceLoansMemberus-gaap:CommercialPortfolioSegmentMember2025-12-310000073124ntrs:OtherCommercialLoanMemberus-gaap:CommercialPortfolioSegmentMember2026-06-300000073124ntrs:OtherCommercialLoanMemberus-gaap:CommercialPortfolioSegmentMember2025-12-310000073124ntrs:PrivateClientMemberus-gaap:ConsumerPortfolioSegmentMember2026-06-300000073124ntrs:PrivateClientMemberus-gaap:ConsumerPortfolioSegmentMember2025-12-310000073124us-gaap:ResidentialRealEstateMemberus-gaap:ConsumerPortfolioSegmentMember2026-06-300000073124us-gaap:ResidentialRealEstateMemberus-gaap:ConsumerPortfolioSegmentMember2025-12-310000073124ntrs:OtherConsumerLoanMemberus-gaap:ConsumerPortfolioSegmentMember2026-06-300000073124ntrs:OtherConsumerLoanMemberus-gaap:ConsumerPortfolioSegmentMember2025-12-310000073124ntrs:ForeignCommercialLoansMemberus-gaap:CommercialPortfolioSegmentMember2026-06-300000073124ntrs:ForeignCommercialLoansMemberus-gaap:CommercialPortfolioSegmentMember2025-12-310000073124ntrs:ForeignConsumerLoansMemberus-gaap:ConsumerPortfolioSegmentMember2026-06-300000073124ntrs:ForeignConsumerLoansMemberus-gaap:ConsumerPortfolioSegmentMember2025-12-310000073124us-gaap:HomeEquityLoanMemberus-gaap:ConsumerPortfolioSegmentMember2026-01-012026-06-300000073124us-gaap:HomeEquityLoanMemberus-gaap:ConsumerPortfolioSegmentMember2026-06-300000073124us-gaap:HomeEquityLoanMemberus-gaap:ConsumerPortfolioSegmentMember2025-12-310000073124us-gaap:HomeEquityLoanMemberus-gaap:ConsumerPortfolioSegmentMember2025-01-012025-12-310000073124ntrs:OneToThreeInternalGradeMemberus-gaap:CommercialPortfolioSegmentMemberntrs:CommercialAndInstitutionalLoansMember2026-06-300000073124ntrs:FourToFiveInternalGradeMemberus-gaap:CommercialPortfolioSegmentMemberntrs:CommercialAndInstitutionalLoansMember2026-06-300000073124ntrs:SixToNineInternalGradeMemberus-gaap:CommercialPortfolioSegmentMemberntrs:CommercialAndInstitutionalLoansMember2026-06-300000073124ntrs:CommercialAndInstitutionalLoansMemberus-gaap:CommercialPortfolioSegmentMember2026-01-012026-06-300000073124ntrs:OneToThreeInternalGradeMemberus-gaap:CommercialPortfolioSegmentMemberus-gaap:CommercialRealEstateMember2026-06-300000073124ntrs:FourToFiveInternalGradeMemberus-gaap:CommercialPortfolioSegmentMemberus-gaap:CommercialRealEstateMember2026-06-300000073124ntrs:SixToNineInternalGradeMemberus-gaap:CommercialPortfolioSegmentMemberus-gaap:CommercialRealEstateMember2026-06-300000073124ntrs:OneToThreeInternalGradeMemberus-gaap:CommercialPortfolioSegmentMemberntrs:SubscriptionFinanceLoansMember2026-06-300000073124ntrs:FourToFiveInternalGradeMemberus-gaap:CommercialPortfolioSegmentMemberntrs:SubscriptionFinanceLoansMember2026-06-300000073124ntrs:SixToNineInternalGradeMemberus-gaap:CommercialPortfolioSegmentMemberntrs:SubscriptionFinanceLoansMember2026-06-300000073124ntrs:OneToThreeInternalGradeMemberus-gaap:CommercialPortfolioSegmentMemberntrs:FundFinanceLoansMember2026-06-300000073124ntrs:FourToFiveInternalGradeMemberus-gaap:CommercialPortfolioSegmentMemberntrs:FundFinanceLoansMember2026-06-300000073124ntrs:OneToThreeInternalGradeMemberus-gaap:CommercialPortfolioSegmentMemberntrs:OtherCommercialLoanMember2026-06-300000073124ntrs:FourToFiveInternalGradeMemberus-gaap:CommercialPortfolioSegmentMemberntrs:OtherCommercialLoanMember2026-06-300000073124ntrs:SixToNineInternalGradeMemberus-gaap:CommercialPortfolioSegmentMemberntrs:OtherCommercialLoanMember2026-06-300000073124us-gaap:CommercialPortfolioSegmentMember2026-01-012026-06-300000073124ntrs:OneToThreeInternalGradeMemberus-gaap:ConsumerPortfolioSegmentMemberntrs:PrivateClientMember2026-06-300000073124ntrs:FourToFiveInternalGradeMemberus-gaap:ConsumerPortfolioSegmentMemberntrs:PrivateClientMember2026-06-300000073124ntrs:SixToNineInternalGradeMemberus-gaap:ConsumerPortfolioSegmentMemberntrs:PrivateClientMember2026-06-300000073124ntrs:PrivateClientMemberus-gaap:ConsumerPortfolioSegmentMember2026-01-012026-06-300000073124ntrs:OneToThreeInternalGradeMemberus-gaap:ConsumerPortfolioSegmentMemberus-gaap:ResidentialRealEstateMember2026-06-300000073124ntrs:FourToFiveInternalGradeMemberus-gaap:ConsumerPortfolioSegmentMemberus-gaap:ResidentialRealEstateMember2026-06-300000073124ntrs:SixToNineInternalGradeMemberus-gaap:ConsumerPortfolioSegmentMemberus-gaap:ResidentialRealEstateMember2026-06-300000073124ntrs:OneToThreeInternalGradeMemberus-gaap:ConsumerPortfolioSegmentMemberntrs:OtherConsumerLoanMember2026-06-300000073124ntrs:FourToFiveInternalGradeMemberus-gaap:ConsumerPortfolioSegmentMemberntrs:OtherConsumerLoanMember2026-06-300000073124us-gaap:ConsumerPortfolioSegmentMember2026-01-012026-06-300000073124ntrs:OneToThreeInternalGradeMemberus-gaap:CommercialPortfolioSegmentMemberntrs:CommercialAndInstitutionalLoansMember2025-12-310000073124ntrs:FourToFiveInternalGradeMemberus-gaap:CommercialPortfolioSegmentMemberntrs:CommercialAndInstitutionalLoansMember2025-12-310000073124ntrs:SixToNineInternalGradeMemberus-gaap:CommercialPortfolioSegmentMemberntrs:CommercialAndInstitutionalLoansMember2025-12-310000073124ntrs:CommercialAndInstitutionalLoansMemberus-gaap:CommercialPortfolioSegmentMember2025-01-012025-12-310000073124ntrs:OneToThreeInternalGradeMemberus-gaap:CommercialPortfolioSegmentMemberus-gaap:CommercialRealEstateMember2025-12-310000073124ntrs:FourToFiveInternalGradeMemberus-gaap:CommercialPortfolioSegmentMemberus-gaap:CommercialRealEstateMember2025-12-310000073124ntrs:SixToNineInternalGradeMemberus-gaap:CommercialPortfolioSegmentMemberus-gaap:CommercialRealEstateMember2025-12-310000073124us-gaap:CommercialRealEstateMemberus-gaap:CommercialPortfolioSegmentMember2025-01-012025-12-310000073124ntrs:OneToThreeInternalGradeMemberus-gaap:CommercialPortfolioSegmentMemberntrs:SubscriptionFinanceLoansMember2025-12-310000073124ntrs:FourToFiveInternalGradeMemberus-gaap:CommercialPortfolioSegmentMemberntrs:SubscriptionFinanceLoansMember2025-12-310000073124ntrs:OneToThreeInternalGradeMemberus-gaap:CommercialPortfolioSegmentMemberntrs:FundFinanceLoansMember2025-12-310000073124ntrs:FourToFiveInternalGradeMemberus-gaap:CommercialPortfolioSegmentMemberntrs:FundFinanceLoansMember2025-12-310000073124ntrs:OneToThreeInternalGradeMemberus-gaap:CommercialPortfolioSegmentMemberntrs:OtherCommercialLoanMember2025-12-310000073124ntrs:FourToFiveInternalGradeMemberus-gaap:CommercialPortfolioSegmentMemberntrs:OtherCommercialLoanMember2025-12-310000073124ntrs:SixToNineInternalGradeMemberus-gaap:CommercialPortfolioSegmentMemberntrs:OtherCommercialLoanMember2025-12-310000073124us-gaap:CommercialPortfolioSegmentMember2025-01-012025-12-310000073124ntrs:OneToThreeInternalGradeMemberus-gaap:ConsumerPortfolioSegmentMemberntrs:PrivateClientMember2025-12-310000073124ntrs:FourToFiveInternalGradeMemberus-gaap:ConsumerPortfolioSegmentMemberntrs:PrivateClientMember2025-12-310000073124ntrs:SixToNineInternalGradeMemberus-gaap:ConsumerPortfolioSegmentMemberntrs:PrivateClientMember2025-12-310000073124ntrs:PrivateClientMemberus-gaap:ConsumerPortfolioSegmentMember2025-01-012025-12-310000073124ntrs:OneToThreeInternalGradeMemberus-gaap:ConsumerPortfolioSegmentMemberus-gaap:ResidentialRealEstateMember2025-12-310000073124ntrs:FourToFiveInternalGradeMemberus-gaap:ConsumerPortfolioSegmentMemberus-gaap:ResidentialRealEstateMember2025-12-310000073124ntrs:SixToNineInternalGradeMemberus-gaap:ConsumerPortfolioSegmentMemberus-gaap:ResidentialRealEstateMember2025-12-310000073124us-gaap:ResidentialRealEstateMemberus-gaap:ConsumerPortfolioSegmentMember2025-01-012025-12-310000073124ntrs:OneToThreeInternalGradeMemberus-gaap:ConsumerPortfolioSegmentMemberntrs:OtherConsumerLoanMember2025-12-310000073124ntrs:FourToFiveInternalGradeMemberus-gaap:ConsumerPortfolioSegmentMemberntrs:OtherConsumerLoanMember2025-12-310000073124ntrs:OtherConsumerLoanMemberus-gaap:ConsumerPortfolioSegmentMember2025-01-012025-12-310000073124us-gaap:ConsumerPortfolioSegmentMember2025-01-012025-12-3100000731242025-01-012025-12-310000073124us-gaap:CommercialPortfolioSegmentMemberus-gaap:FinancialAssetNotPastDueMemberntrs:CommercialAndInstitutionalLoansMember2026-06-300000073124us-gaap:CommercialPortfolioSegmentMemberus-gaap:FinancingReceivables30To59DaysPastDueMemberntrs:CommercialAndInstitutionalLoansMember2026-06-300000073124us-gaap:CommercialPortfolioSegmentMemberus-gaap:FinancingReceivables60To89DaysPastDueMemberntrs:CommercialAndInstitutionalLoansMember2026-06-300000073124us-gaap:CommercialPortfolioSegmentMemberus-gaap:FinancingReceivablesEqualToGreaterThan90DaysPastDueMemberntrs:CommercialAndInstitutionalLoansMember2026-06-300000073124us-gaap:CommercialPortfolioSegmentMemberus-gaap:FinancialAssetNotPastDueMemberus-gaap:CommercialRealEstateMember2026-06-300000073124us-gaap:CommercialPortfolioSegmentMemberus-gaap:FinancingReceivables30To59DaysPastDueMemberus-gaap:CommercialRealEstateMember2026-06-300000073124us-gaap:CommercialPortfolioSegmentMemberus-gaap:FinancingReceivables60To89DaysPastDueMemberus-gaap:CommercialRealEstateMember2026-06-300000073124us-gaap:CommercialPortfolioSegmentMemberus-gaap:FinancingReceivablesEqualToGreaterThan90DaysPastDueMemberus-gaap:CommercialRealEstateMember2026-06-300000073124us-gaap:CommercialPortfolioSegmentMemberus-gaap:FinancialAssetNotPastDueMemberntrs:SubscriptionFinanceLoansMember2026-06-300000073124us-gaap:CommercialPortfolioSegmentMemberus-gaap:FinancingReceivables30To59DaysPastDueMemberntrs:SubscriptionFinanceLoansMember2026-06-300000073124us-gaap:CommercialPortfolioSegmentMemberus-gaap:FinancingReceivables60To89DaysPastDueMemberntrs:SubscriptionFinanceLoansMember2026-06-300000073124us-gaap:CommercialPortfolioSegmentMemberus-gaap:FinancingReceivablesEqualToGreaterThan90DaysPastDueMemberntrs:SubscriptionFinanceLoansMember2026-06-300000073124us-gaap:CommercialPortfolioSegmentMemberus-gaap:FinancialAssetNotPastDueMemberntrs:FundFinanceLoansMember2026-06-300000073124us-gaap:CommercialPortfolioSegmentMemberus-gaap:FinancingReceivables30To59DaysPastDueMemberntrs:FundFinanceLoansMember2026-06-300000073124us-gaap:CommercialPortfolioSegmentMemberus-gaap:FinancingReceivables60To89DaysPastDueMemberntrs:FundFinanceLoansMember2026-06-300000073124us-gaap:CommercialPortfolioSegmentMemberus-gaap:FinancingReceivablesEqualToGreaterThan90DaysPastDueMemberntrs:FundFinanceLoansMember2026-06-300000073124us-gaap:CommercialPortfolioSegmentMemberus-gaap:FinancialAssetNotPastDueMemberntrs:OtherCommercialLoanMember2026-06-300000073124us-gaap:CommercialPortfolioSegmentMemberus-gaap:FinancingReceivables30To59DaysPastDueMemberntrs:OtherCommercialLoanMember2026-06-300000073124us-gaap:CommercialPortfolioSegmentMemberus-gaap:FinancingReceivables60To89DaysPastDueMemberntrs:OtherCommercialLoanMember2026-06-300000073124us-gaap:CommercialPortfolioSegmentMemberus-gaap:FinancingReceivablesEqualToGreaterThan90DaysPastDueMemberntrs:OtherCommercialLoanMember2026-06-300000073124us-gaap:CommercialPortfolioSegmentMemberus-gaap:FinancialAssetNotPastDueMember2026-06-300000073124us-gaap:CommercialPortfolioSegmentMemberus-gaap:FinancingReceivables30To59DaysPastDueMember2026-06-300000073124us-gaap:CommercialPortfolioSegmentMemberus-gaap:FinancingReceivables60To89DaysPastDueMember2026-06-300000073124us-gaap:CommercialPortfolioSegmentMemberus-gaap:FinancingReceivablesEqualToGreaterThan90DaysPastDueMember2026-06-300000073124us-gaap:ConsumerPortfolioSegmentMemberus-gaap:FinancialAssetNotPastDueMemberntrs:PrivateClientMember2026-06-300000073124us-gaap:ConsumerPortfolioSegmentMemberus-gaap:FinancingReceivables30To59DaysPastDueMemberntrs:PrivateClientMember2026-06-300000073124us-gaap:ConsumerPortfolioSegmentMemberus-gaap:FinancingReceivables60To89DaysPastDueMemberntrs:PrivateClientMember2026-06-300000073124us-gaap:ConsumerPortfolioSegmentMemberus-gaap:FinancingReceivablesEqualToGreaterThan90DaysPastDueMemberntrs:PrivateClientMember2026-06-300000073124us-gaap:ConsumerPortfolioSegmentMemberus-gaap:FinancialAssetNotPastDueMemberus-gaap:ResidentialRealEstateMember2026-06-300000073124us-gaap:ConsumerPortfolioSegmentMemberus-gaap:FinancingReceivables30To59DaysPastDueMemberus-gaap:ResidentialRealEstateMember2026-06-300000073124us-gaap:ConsumerPortfolioSegmentMemberus-gaap:FinancingReceivables60To89DaysPastDueMemberus-gaap:ResidentialRealEstateMember2026-06-300000073124us-gaap:ConsumerPortfolioSegmentMemberus-gaap:FinancingReceivablesEqualToGreaterThan90DaysPastDueMemberus-gaap:ResidentialRealEstateMember2026-06-300000073124us-gaap:ConsumerPortfolioSegmentMemberus-gaap:FinancialAssetNotPastDueMemberntrs:OtherConsumerLoanMember2026-06-300000073124us-gaap:ConsumerPortfolioSegmentMemberus-gaap:FinancingReceivables30To59DaysPastDueMemberntrs:OtherConsumerLoanMember2026-06-300000073124us-gaap:ConsumerPortfolioSegmentMemberus-gaap:FinancingReceivables60To89DaysPastDueMemberntrs:OtherConsumerLoanMember2026-06-300000073124us-gaap:ConsumerPortfolioSegmentMemberus-gaap:FinancingReceivablesEqualToGreaterThan90DaysPastDueMemberntrs:OtherConsumerLoanMember2026-06-300000073124us-gaap:ConsumerPortfolioSegmentMemberus-gaap:FinancialAssetNotPastDueMember2026-06-300000073124us-gaap:ConsumerPortfolioSegmentMemberus-gaap:FinancingReceivables30To59DaysPastDueMember2026-06-300000073124us-gaap:ConsumerPortfolioSegmentMemberus-gaap:FinancingReceivables60To89DaysPastDueMember2026-06-300000073124us-gaap:ConsumerPortfolioSegmentMemberus-gaap:FinancingReceivablesEqualToGreaterThan90DaysPastDueMember2026-06-300000073124us-gaap:FinancialAssetNotPastDueMember2026-06-300000073124us-gaap:FinancingReceivables30To59DaysPastDueMember2026-06-300000073124us-gaap:FinancingReceivables60To89DaysPastDueMember2026-06-300000073124us-gaap:FinancingReceivablesEqualToGreaterThan90DaysPastDueMember2026-06-300000073124us-gaap:CommercialPortfolioSegmentMemberus-gaap:FinancialAssetNotPastDueMemberntrs:CommercialAndInstitutionalLoansMember2025-12-310000073124us-gaap:CommercialPortfolioSegmentMemberus-gaap:FinancingReceivables30To59DaysPastDueMemberntrs:CommercialAndInstitutionalLoansMember2025-12-310000073124us-gaap:CommercialPortfolioSegmentMemberus-gaap:FinancingReceivables60To89DaysPastDueMemberntrs:CommercialAndInstitutionalLoansMember2025-12-310000073124us-gaap:CommercialPortfolioSegmentMemberus-gaap:FinancingReceivablesEqualToGreaterThan90DaysPastDueMemberntrs:CommercialAndInstitutionalLoansMember2025-12-310000073124us-gaap:CommercialPortfolioSegmentMemberus-gaap:FinancialAssetNotPastDueMemberus-gaap:CommercialRealEstateMember2025-12-310000073124us-gaap:CommercialPortfolioSegmentMemberus-gaap:FinancingReceivables30To59DaysPastDueMemberus-gaap:CommercialRealEstateMember2025-12-310000073124us-gaap:CommercialPortfolioSegmentMemberus-gaap:FinancingReceivables60To89DaysPastDueMemberus-gaap:CommercialRealEstateMember2025-12-310000073124us-gaap:CommercialPortfolioSegmentMemberus-gaap:FinancingReceivablesEqualToGreaterThan90DaysPastDueMemberus-gaap:CommercialRealEstateMember2025-12-310000073124us-gaap:CommercialPortfolioSegmentMemberus-gaap:FinancialAssetNotPastDueMemberntrs:SubscriptionFinanceLoansMember2025-12-310000073124us-gaap:CommercialPortfolioSegmentMemberus-gaap:FinancingReceivables30To59DaysPastDueMemberntrs:SubscriptionFinanceLoansMember2025-12-310000073124us-gaap:CommercialPortfolioSegmentMemberus-gaap:FinancingReceivables60To89DaysPastDueMemberntrs:SubscriptionFinanceLoansMember2025-12-310000073124us-gaap:CommercialPortfolioSegmentMemberus-gaap:FinancingReceivablesEqualToGreaterThan90DaysPastDueMemberntrs:SubscriptionFinanceLoansMember2025-12-310000073124us-gaap:CommercialPortfolioSegmentMemberus-gaap:FinancialAssetNotPastDueMemberntrs:FundFinanceLoansMember2025-12-310000073124us-gaap:CommercialPortfolioSegmentMemberus-gaap:FinancingReceivables30To59DaysPastDueMemberntrs:FundFinanceLoansMember2025-12-310000073124us-gaap:CommercialPortfolioSegmentMemberus-gaap:FinancingReceivables60To89DaysPastDueMemberntrs:FundFinanceLoansMember2025-12-310000073124us-gaap:CommercialPortfolioSegmentMemberus-gaap:FinancingReceivablesEqualToGreaterThan90DaysPastDueMemberntrs:FundFinanceLoansMember2025-12-310000073124us-gaap:CommercialPortfolioSegmentMemberus-gaap:FinancialAssetNotPastDueMemberntrs:OtherCommercialLoanMember2025-12-310000073124us-gaap:CommercialPortfolioSegmentMemberus-gaap:FinancingReceivables30To59DaysPastDueMemberntrs:OtherCommercialLoanMember2025-12-310000073124us-gaap:CommercialPortfolioSegmentMemberus-gaap:FinancingReceivables60To89DaysPastDueMemberntrs:OtherCommercialLoanMember2025-12-310000073124us-gaap:CommercialPortfolioSegmentMemberus-gaap:FinancingReceivablesEqualToGreaterThan90DaysPastDueMemberntrs:OtherCommercialLoanMember2025-12-310000073124us-gaap:CommercialPortfolioSegmentMemberus-gaap:FinancialAssetNotPastDueMember2025-12-310000073124us-gaap:CommercialPortfolioSegmentMemberus-gaap:FinancingReceivables30To59DaysPastDueMember2025-12-310000073124us-gaap:CommercialPortfolioSegmentMemberus-gaap:FinancingReceivables60To89DaysPastDueMember2025-12-310000073124us-gaap:CommercialPortfolioSegmentMemberus-gaap:FinancingReceivablesEqualToGreaterThan90DaysPastDueMember2025-12-310000073124us-gaap:ConsumerPortfolioSegmentMemberus-gaap:FinancialAssetNotPastDueMemberntrs:PrivateClientMember2025-12-310000073124us-gaap:ConsumerPortfolioSegmentMemberus-gaap:FinancingReceivables30To59DaysPastDueMemberntrs:PrivateClientMember2025-12-310000073124us-gaap:ConsumerPortfolioSegmentMemberus-gaap:FinancingReceivables60To89DaysPastDueMemberntrs:PrivateClientMember2025-12-310000073124us-gaap:ConsumerPortfolioSegmentMemberus-gaap:FinancingReceivablesEqualToGreaterThan90DaysPastDueMemberntrs:PrivateClientMember2025-12-310000073124us-gaap:ConsumerPortfolioSegmentMemberus-gaap:FinancialAssetNotPastDueMemberus-gaap:ResidentialRealEstateMember2025-12-310000073124us-gaap:ConsumerPortfolioSegmentMemberus-gaap:FinancingReceivables30To59DaysPastDueMemberus-gaap:ResidentialRealEstateMember2025-12-310000073124us-gaap:ConsumerPortfolioSegmentMemberus-gaap:FinancingReceivables60To89DaysPastDueMemberus-gaap:ResidentialRealEstateMember2025-12-310000073124us-gaap:ConsumerPortfolioSegmentMemberus-gaap:FinancingReceivablesEqualToGreaterThan90DaysPastDueMemberus-gaap:ResidentialRealEstateMember2025-12-310000073124us-gaap:ConsumerPortfolioSegmentMemberus-gaap:FinancialAssetNotPastDueMemberntrs:OtherConsumerLoanMember2025-12-310000073124us-gaap:ConsumerPortfolioSegmentMemberus-gaap:FinancingReceivables30To59DaysPastDueMemberntrs:OtherConsumerLoanMember2025-12-310000073124us-gaap:ConsumerPortfolioSegmentMemberus-gaap:FinancingReceivables60To89DaysPastDueMemberntrs:OtherConsumerLoanMember2025-12-310000073124us-gaap:ConsumerPortfolioSegmentMemberus-gaap:FinancingReceivablesEqualToGreaterThan90DaysPastDueMemberntrs:OtherConsumerLoanMember2025-12-310000073124us-gaap:ConsumerPortfolioSegmentMemberus-gaap:FinancialAssetNotPastDueMember2025-12-310000073124us-gaap:ConsumerPortfolioSegmentMemberus-gaap:FinancingReceivables30To59DaysPastDueMember2025-12-310000073124us-gaap:ConsumerPortfolioSegmentMemberus-gaap:FinancingReceivables60To89DaysPastDueMember2025-12-310000073124us-gaap:ConsumerPortfolioSegmentMemberus-gaap:FinancingReceivablesEqualToGreaterThan90DaysPastDueMember2025-12-310000073124us-gaap:FinancialAssetNotPastDueMember2025-12-310000073124us-gaap:FinancingReceivables30To59DaysPastDueMember2025-12-310000073124us-gaap:FinancingReceivables60To89DaysPastDueMember2025-12-310000073124us-gaap:FinancingReceivablesEqualToGreaterThan90DaysPastDueMember2025-12-310000073124ntrs:FinancialAsset30To89DaysPastDueMember2026-06-300000073124ntrs:FinancialAsset30To89DaysPastDueMember2025-06-300000073124us-gaap:CommitmentsToExtendCreditMember2026-06-300000073124us-gaap:StandbyLettersOfCreditMember2026-06-300000073124us-gaap:StandbyLettersOfCreditMember2025-12-310000073124us-gaap:CommitmentsToExtendCreditMember2025-12-310000073124us-gaap:CommercialPortfolioSegmentMember2026-03-310000073124us-gaap:ConsumerPortfolioSegmentMember2026-03-310000073124us-gaap:CommercialPortfolioSegmentMember2026-04-012026-06-300000073124us-gaap:ConsumerPortfolioSegmentMember2026-04-012026-06-300000073124us-gaap:CommercialPortfolioSegmentMember2025-03-310000073124us-gaap:ConsumerPortfolioSegmentMember2025-03-310000073124us-gaap:CommercialPortfolioSegmentMember2025-04-012025-06-300000073124us-gaap:ConsumerPortfolioSegmentMember2025-04-012025-06-300000073124us-gaap:CommercialPortfolioSegmentMember2025-06-300000073124us-gaap:ConsumerPortfolioSegmentMember2025-06-300000073124us-gaap:CommercialPortfolioSegmentMember2024-12-310000073124us-gaap:ConsumerPortfolioSegmentMember2024-12-310000073124us-gaap:CommercialPortfolioSegmentMember2025-01-012025-06-300000073124us-gaap:ConsumerPortfolioSegmentMember2025-01-012025-06-300000073124us-gaap:CorporateDebtSecuritiesMember2026-03-310000073124us-gaap:ForeignGovernmentDebtSecuritiesMember2026-03-310000073124ntrs:SubSovereignSupranationalAndNonUsAgencyBondsMember2026-03-310000073124us-gaap:USStatesAndPoliticalSubdivisionsMember2026-03-310000073124ntrs:CoveredBondsMember2026-03-310000073124us-gaap:OtherDebtSecuritiesMember2026-03-310000073124us-gaap:CorporateDebtSecuritiesMember2026-04-012026-06-300000073124ntrs:CoveredBondsMember2026-04-012026-06-300000073124us-gaap:OtherDebtSecuritiesMember2026-04-012026-06-300000073124us-gaap:OtherDebtSecuritiesMember2026-06-300000073124us-gaap:OtherDebtSecuritiesMember2025-12-310000073124us-gaap:CorporateDebtSecuritiesMember2026-01-012026-06-300000073124ntrs:CoveredBondsMember2026-01-012026-06-300000073124us-gaap:OtherDebtSecuritiesMember2026-01-012026-06-300000073124us-gaap:CorporateDebtSecuritiesMember2025-03-310000073124us-gaap:ForeignGovernmentDebtSecuritiesMember2025-03-310000073124ntrs:SubSovereignSupranationalAndNonUsAgencyBondsMember2025-03-310000073124us-gaap:USStatesAndPoliticalSubdivisionsMember2025-03-310000073124ntrs:CoveredBondsMember2025-03-310000073124us-gaap:OtherDebtSecuritiesMember2025-03-310000073124us-gaap:CorporateDebtSecuritiesMember2025-04-012025-06-300000073124ntrs:CoveredBondsMember2025-04-012025-06-300000073124us-gaap:OtherDebtSecuritiesMember2025-04-012025-06-300000073124us-gaap:CorporateDebtSecuritiesMember2025-06-300000073124us-gaap:ForeignGovernmentDebtSecuritiesMember2025-06-300000073124ntrs:SubSovereignSupranationalAndNonUsAgencyBondsMember2025-06-300000073124us-gaap:USStatesAndPoliticalSubdivisionsMember2025-06-300000073124ntrs:CoveredBondsMember2025-06-300000073124us-gaap:OtherDebtSecuritiesMember2025-06-300000073124us-gaap:CorporateDebtSecuritiesMember2024-12-310000073124us-gaap:ForeignGovernmentDebtSecuritiesMember2024-12-310000073124ntrs:SubSovereignSupranationalAndNonUsAgencyBondsMember2024-12-310000073124us-gaap:USStatesAndPoliticalSubdivisionsMember2024-12-310000073124ntrs:CoveredBondsMember2024-12-310000073124us-gaap:OtherDebtSecuritiesMember2024-12-310000073124us-gaap:CorporateDebtSecuritiesMember2025-01-012025-06-300000073124ntrs:CoveredBondsMember2025-01-012025-06-300000073124us-gaap:OtherDebtSecuritiesMember2025-01-012025-06-300000073124us-gaap:DebtSecuritiesMemberus-gaap:AssetPledgedAsCollateralMember2026-06-300000073124us-gaap:DebtSecuritiesMemberus-gaap:AssetPledgedAsCollateralMember2025-12-310000073124us-gaap:LoansMemberus-gaap:AssetPledgedAsCollateralMember2026-06-300000073124us-gaap:LoansMemberus-gaap:AssetPledgedAsCollateralMember2025-12-310000073124us-gaap:AssetPledgedAsCollateralMember2026-06-300000073124us-gaap:AssetPledgedAsCollateralMember2025-12-310000073124ntrs:DebtSecuritiesAndLoansMember2026-06-300000073124ntrs:DebtSecuritiesAndLoansMember2025-12-310000073124us-gaap:RepurchaseAgreementsMember2026-06-300000073124us-gaap:RepurchaseAgreementsMember2025-12-310000073124us-gaap:DerivativeMember2026-06-300000073124us-gaap:DerivativeMember2025-12-310000073124ntrs:AssetServicingSegmentMember2025-12-310000073124ntrs:WealthManagementSegmentMember2025-12-310000073124ntrs:AssetServicingSegmentMember2026-01-012026-06-300000073124ntrs:WealthManagementSegmentMember2026-01-012026-06-300000073124ntrs:AssetServicingSegmentMember2026-06-300000073124ntrs:WealthManagementSegmentMember2026-06-300000073124us-gaap:OtherIntangibleAssetsMember2026-06-300000073124us-gaap:OtherIntangibleAssetsMember2025-12-310000073124us-gaap:SoftwareAndSoftwareDevelopmentCostsMember2026-06-300000073124us-gaap:SoftwareAndSoftwareDevelopmentCostsMember2025-12-310000073124us-gaap:SoftwareAndSoftwareDevelopmentCostsMember2026-04-012026-06-300000073124us-gaap:SoftwareAndSoftwareDevelopmentCostsMember2026-01-012026-06-300000073124us-gaap:SoftwareAndSoftwareDevelopmentCostsMember2025-04-012025-06-300000073124us-gaap:SoftwareAndSoftwareDevelopmentCostsMember2025-01-012025-06-300000073124ntrs:CorporateAndReconcilingItemsMember2026-04-012026-06-300000073124ntrs:CorporateAndReconcilingItemsMember2026-01-012026-06-300000073124ntrs:CorporateAndReconcilingItemsMember2025-04-012025-06-300000073124ntrs:CorporateAndReconcilingItemsMember2025-01-012025-06-300000073124us-gaap:OperatingSegmentsMemberntrs:AssetServicingSegmentMember2026-04-012026-06-300000073124us-gaap:OperatingSegmentsMemberntrs:AssetServicingSegmentMember2025-04-012025-06-300000073124us-gaap:OperatingSegmentsMemberntrs:WealthManagementSegmentMember2026-04-012026-06-300000073124us-gaap:OperatingSegmentsMemberntrs:WealthManagementSegmentMember2025-04-012025-06-300000073124us-gaap:OperatingSegmentsMemberntrs:AssetServicingSegmentMember2026-01-012026-06-300000073124us-gaap:OperatingSegmentsMemberntrs:AssetServicingSegmentMember2025-01-012025-06-300000073124us-gaap:OperatingSegmentsMemberntrs:WealthManagementSegmentMember2026-01-012026-06-300000073124us-gaap:OperatingSegmentsMemberntrs:WealthManagementSegmentMember2025-01-012025-06-300000073124ntrs:SeriesDPreferredStockDepositarySharesMember2026-06-300000073124us-gaap:PreferredStockMemberus-gaap:SeriesDPreferredStockMember2025-12-310000073124us-gaap:PreferredStockMemberus-gaap:SeriesDPreferredStockMember2026-06-300000073124us-gaap:SeriesDPreferredStockMember2026-01-012026-06-300000073124ntrs:SeriesEPreferredStockDepositarySharesMember2026-06-300000073124us-gaap:PreferredStockMemberus-gaap:SeriesEPreferredStockMember2025-12-310000073124us-gaap:PreferredStockMemberus-gaap:SeriesEPreferredStockMember2026-06-300000073124us-gaap:SeriesEPreferredStockMember2026-01-012026-06-300000073124us-gaap:SeriesEPreferredStockMember2026-04-012026-06-3000000731242025-07-220000073124us-gaap:AccumulatedNetUnrealizedInvestmentGainLossMember2026-03-310000073124us-gaap:AccumulatedGainLossNetCashFlowHedgeParentMember2026-03-310000073124us-gaap:AccumulatedTranslationAdjustmentMember2026-03-310000073124us-gaap:AccumulatedDefinedBenefitPlansAdjustmentMember2026-03-310000073124us-gaap:AccumulatedNetUnrealizedInvestmentGainLossMember2026-04-012026-06-300000073124us-gaap:AccumulatedGainLossNetCashFlowHedgeParentMember2026-04-012026-06-300000073124us-gaap:AccumulatedTranslationAdjustmentMember2026-04-012026-06-300000073124us-gaap:AccumulatedDefinedBenefitPlansAdjustmentMember2026-04-012026-06-300000073124us-gaap:AccumulatedNetUnrealizedInvestmentGainLossMember2026-06-300000073124us-gaap:AccumulatedGainLossNetCashFlowHedgeParentMember2026-06-300000073124us-gaap:AccumulatedTranslationAdjustmentMember2026-06-300000073124us-gaap:AccumulatedDefinedBenefitPlansAdjustmentMember2026-06-300000073124us-gaap:AccumulatedNetUnrealizedInvestmentGainLossMember2025-12-310000073124us-gaap:AccumulatedGainLossNetCashFlowHedgeParentMember2025-12-310000073124us-gaap:AccumulatedTranslationAdjustmentMember2025-12-310000073124us-gaap:AccumulatedDefinedBenefitPlansAdjustmentMember2025-12-310000073124us-gaap:AccumulatedNetUnrealizedInvestmentGainLossMember2026-01-012026-06-300000073124us-gaap:AccumulatedGainLossNetCashFlowHedgeParentMember2026-01-012026-06-300000073124us-gaap:AccumulatedTranslationAdjustmentMember2026-01-012026-06-300000073124us-gaap:AccumulatedDefinedBenefitPlansAdjustmentMember2026-01-012026-06-300000073124us-gaap:AccumulatedNetUnrealizedInvestmentGainLossMember2025-03-310000073124us-gaap:AccumulatedGainLossNetCashFlowHedgeParentMember2025-03-310000073124us-gaap:AccumulatedTranslationAdjustmentMember2025-03-310000073124us-gaap:AccumulatedDefinedBenefitPlansAdjustmentMember2025-03-310000073124us-gaap:AccumulatedNetUnrealizedInvestmentGainLossMember2025-04-012025-06-300000073124us-gaap:AccumulatedGainLossNetCashFlowHedgeParentMember2025-04-012025-06-300000073124us-gaap:AccumulatedTranslationAdjustmentMember2025-04-012025-06-300000073124us-gaap:AccumulatedDefinedBenefitPlansAdjustmentMember2025-04-012025-06-300000073124us-gaap:AccumulatedNetUnrealizedInvestmentGainLossMember2025-06-300000073124us-gaap:AccumulatedGainLossNetCashFlowHedgeParentMember2025-06-300000073124us-gaap:AccumulatedTranslationAdjustmentMember2025-06-300000073124us-gaap:AccumulatedDefinedBenefitPlansAdjustmentMember2025-06-300000073124us-gaap:AccumulatedNetUnrealizedInvestmentGainLossMember2024-12-310000073124us-gaap:AccumulatedGainLossNetCashFlowHedgeParentMember2024-12-310000073124us-gaap:AccumulatedTranslationAdjustmentMember2024-12-310000073124us-gaap:AccumulatedDefinedBenefitPlansAdjustmentMember2024-12-310000073124us-gaap:AccumulatedNetUnrealizedInvestmentGainLossMember2025-01-012025-06-300000073124us-gaap:AccumulatedGainLossNetCashFlowHedgeParentMember2025-01-012025-06-300000073124us-gaap:AccumulatedTranslationAdjustmentMember2025-01-012025-06-300000073124us-gaap:AccumulatedDefinedBenefitPlansAdjustmentMember2025-01-012025-06-300000073124ntrs:AOCIAccumulatedGainLossDebtSecuritiesAvailableForSaleInterestIncomeMember2026-04-012026-06-300000073124ntrs:AOCIAccumulatedGainLossDebtSecuritiesAvailableForSaleInterestIncomeMember2025-04-012025-06-300000073124ntrs:AOCIAccumulatedGainLossDebtSecuritiesAvailableForSaleNetGainsMember2026-04-012026-06-300000073124ntrs:AOCIAccumulatedGainLossDebtSecuritiesAvailableForSaleNetGainsMember2025-04-012025-06-300000073124us-gaap:ForeignExchangeContractMemberus-gaap:AccumulatedGainLossNetCashFlowHedgeParentMember2026-04-012026-06-300000073124us-gaap:ForeignExchangeContractMemberus-gaap:AccumulatedGainLossNetCashFlowHedgeParentMember2025-04-012025-06-300000073124ntrs:AccumulatedTranslationAdjustmentMemberAccumulatedForeignCurrencyAdjustmentAttributableToParentOtherMemberMember2026-04-012026-06-300000073124ntrs:AccumulatedTranslationAdjustmentMemberAccumulatedForeignCurrencyAdjustmentAttributableToParentOtherMemberMember2025-04-012025-06-300000073124ntrs:LongtermIntraentityForeignCurrencyTransactionGainsLossesMember2026-04-012026-06-300000073124ntrs:LongtermIntraentityForeignCurrencyTransactionGainsLossesMember2025-04-012025-06-300000073124ntrs:NetInvestmentHedgeGainLossMember2026-04-012026-06-300000073124ntrs:NetInvestmentHedgeGainLossMember2025-04-012025-06-300000073124us-gaap:AccumulatedDefinedBenefitPlansAdjustmentNetUnamortizedGainLossMember2026-04-012026-06-300000073124us-gaap:AccumulatedDefinedBenefitPlansAdjustmentNetUnamortizedGainLossMember2025-04-012025-06-300000073124us-gaap:AccumulatedDefinedBenefitPlansAdjustmentNetPriorServiceCostCreditMember2026-04-012026-06-300000073124us-gaap:AccumulatedDefinedBenefitPlansAdjustmentNetPriorServiceCostCreditMember2025-04-012025-06-300000073124ntrs:AOCIAccumulatedGainLossDebtSecuritiesAvailableForSaleInterestIncomeMember2026-01-012026-06-300000073124ntrs:AOCIAccumulatedGainLossDebtSecuritiesAvailableForSaleInterestIncomeMember2025-01-012025-06-300000073124ntrs:AOCIAccumulatedGainLossDebtSecuritiesAvailableForSaleNetGainsMember2026-01-012026-06-300000073124ntrs:AOCIAccumulatedGainLossDebtSecuritiesAvailableForSaleNetGainsMember2025-01-012025-06-300000073124us-gaap:ForeignExchangeContractMemberus-gaap:AccumulatedGainLossNetCashFlowHedgeParentMember2026-01-012026-06-300000073124us-gaap:ForeignExchangeContractMemberus-gaap:AccumulatedGainLossNetCashFlowHedgeParentMember2025-01-012025-06-300000073124ntrs:AccumulatedTranslationAdjustmentMemberAccumulatedForeignCurrencyAdjustmentAttributableToParentOtherMemberMember2026-01-012026-06-300000073124ntrs:AccumulatedTranslationAdjustmentMemberAccumulatedForeignCurrencyAdjustmentAttributableToParentOtherMemberMember2025-01-012025-06-300000073124ntrs:LongtermIntraentityForeignCurrencyTransactionGainsLossesMember2026-01-012026-06-300000073124ntrs:LongtermIntraentityForeignCurrencyTransactionGainsLossesMember2025-01-012025-06-300000073124ntrs:NetInvestmentHedgeGainLossMember2026-01-012026-06-300000073124ntrs:NetInvestmentHedgeGainLossMember2025-01-012025-06-300000073124us-gaap:AccumulatedDefinedBenefitPlansAdjustmentNetUnamortizedGainLossMember2026-01-012026-06-300000073124us-gaap:AccumulatedDefinedBenefitPlansAdjustmentNetUnamortizedGainLossMember2025-01-012025-06-300000073124us-gaap:AccumulatedDefinedBenefitPlansAdjustmentNetPriorServiceCostCreditMember2026-01-012026-06-300000073124us-gaap:AccumulatedDefinedBenefitPlansAdjustmentNetPriorServiceCostCreditMember2025-01-012025-06-300000073124ntrs:CustodyandFundAdministrationMember2026-04-012026-06-300000073124ntrs:CustodyandFundAdministrationMember2025-04-012025-06-300000073124ntrs:CustodyandFundAdministrationMember2026-01-012026-06-300000073124ntrs:CustodyandFundAdministrationMember2025-01-012025-06-300000073124ntrs:InvestmentManagementandAdvisoryMember2026-04-012026-06-300000073124ntrs:InvestmentManagementandAdvisoryMember2025-04-012025-06-300000073124ntrs:InvestmentManagementandAdvisoryMember2026-01-012026-06-300000073124ntrs:InvestmentManagementandAdvisoryMember2025-01-012025-06-300000073124ntrs:SecuritiesLendingMember2026-04-012026-06-300000073124ntrs:SecuritiesLendingMember2025-04-012025-06-300000073124ntrs:SecuritiesLendingMember2026-01-012026-06-300000073124ntrs:SecuritiesLendingMember2025-01-012025-06-300000073124ntrs:OtherTrustInvestmentAndOtherServicingFeesMember2026-04-012026-06-300000073124ntrs:OtherTrustInvestmentAndOtherServicingFeesMember2025-04-012025-06-300000073124ntrs:OtherTrustInvestmentAndOtherServicingFeesMember2026-01-012026-06-300000073124ntrs:OtherTrustInvestmentAndOtherServicingFeesMember2025-01-012025-06-300000073124ntrs:SecuritiesCommissionandTradingMember2026-04-012026-06-300000073124ntrs:ProductsandServicesOtherOperatingIncomeMember2026-04-012026-06-300000073124ntrs:SecuritiesCommissionandTradingMember2026-01-012026-06-300000073124ntrs:ProductsandServicesOtherOperatingIncomeMember2026-01-012026-06-300000073124ntrs:SecuritiesCommissionandTradingMember2025-04-012025-06-300000073124ntrs:ProductsandServicesOtherOperatingIncomeMember2025-04-012025-06-300000073124ntrs:SecuritiesCommissionandTradingMember2025-01-012025-06-300000073124ntrs:ProductsandServicesOtherOperatingIncomeMember2025-01-012025-06-300000073124ntrs:TrustFeesReceivableNetMember2026-06-300000073124ntrs:TrustFeesReceivableNetMember2025-12-310000073124ntrs:OtherCustomerReceivablesMember2026-06-300000073124ntrs:OtherCustomerReceivablesMember2025-12-310000073124ntrs:LoanServicingMember2026-04-012026-06-300000073124ntrs:LoanServicingMember2025-04-012025-06-300000073124ntrs:LoanServicingMember2026-01-012026-06-300000073124ntrs:LoanServicingMember2025-01-012025-06-300000073124us-gaap:BankServicingMember2026-04-012026-06-300000073124us-gaap:BankServicingMember2025-04-012025-06-300000073124us-gaap:BankServicingMember2026-01-012026-06-300000073124us-gaap:BankServicingMember2025-01-012025-06-300000073124ntrs:BankOwnedLifeInsuranceMember2026-04-012026-06-300000073124ntrs:BankOwnedLifeInsuranceMember2025-04-012025-06-300000073124ntrs:BankOwnedLifeInsuranceMember2026-01-012026-06-300000073124ntrs:BankOwnedLifeInsuranceMember2025-01-012025-06-300000073124ntrs:TreasuryManagementFeesMember2026-04-012026-06-300000073124ntrs:TreasuryManagementFeesMember2025-04-012025-06-300000073124ntrs:TreasuryManagementFeesMember2026-01-012026-06-300000073124ntrs:TreasuryManagementFeesMember2025-01-012025-06-300000073124us-gaap:FinancialServiceOtherMember2026-04-012026-06-300000073124us-gaap:FinancialServiceOtherMember2025-04-012025-06-300000073124us-gaap:FinancialServiceOtherMember2026-01-012026-06-300000073124us-gaap:FinancialServiceOtherMember2025-01-012025-06-300000073124country:USus-gaap:PensionPlansDefinedBenefitMemberus-gaap:QualifiedPlanMember2026-04-012026-06-300000073124country:USus-gaap:PensionPlansDefinedBenefitMemberus-gaap:QualifiedPlanMember2025-04-012025-06-300000073124country:USus-gaap:PensionPlansDefinedBenefitMemberus-gaap:QualifiedPlanMember2026-01-012026-06-300000073124country:USus-gaap:PensionPlansDefinedBenefitMemberus-gaap:QualifiedPlanMember2025-01-012025-06-300000073124country:USus-gaap:PensionPlansDefinedBenefitMemberus-gaap:NonqualifiedPlanMember2026-04-012026-06-300000073124country:USus-gaap:PensionPlansDefinedBenefitMemberus-gaap:NonqualifiedPlanMember2025-04-012025-06-300000073124country:USus-gaap:PensionPlansDefinedBenefitMemberus-gaap:NonqualifiedPlanMember2026-01-012026-06-300000073124country:USus-gaap:PensionPlansDefinedBenefitMemberus-gaap:NonqualifiedPlanMember2025-01-012025-06-300000073124us-gaap:ForeignPlanMemberus-gaap:PensionPlansDefinedBenefitMember2026-04-012026-06-300000073124us-gaap:ForeignPlanMemberus-gaap:PensionPlansDefinedBenefitMember2025-04-012025-06-300000073124us-gaap:ForeignPlanMemberus-gaap:PensionPlansDefinedBenefitMember2026-01-012026-06-300000073124us-gaap:ForeignPlanMemberus-gaap:PensionPlansDefinedBenefitMember2025-01-012025-06-300000073124us-gaap:RestrictedStockUnitsRSUMember2026-06-302026-06-300000073124us-gaap:RestrictedStockUnitsRSUMember2026-04-012026-06-300000073124us-gaap:RestrictedStockUnitsRSUMember2025-04-012025-06-300000073124us-gaap:RestrictedStockUnitsRSUMember2026-01-012026-06-300000073124us-gaap:RestrictedStockUnitsRSUMember2025-01-012025-06-300000073124us-gaap:PerformanceSharesMember2026-04-012026-06-300000073124us-gaap:PerformanceSharesMember2025-04-012025-06-300000073124us-gaap:PerformanceSharesMember2026-01-012026-06-300000073124us-gaap:PerformanceSharesMember2025-01-012025-06-300000073124ntrs:AffordableHousingInvestmentMember2026-06-300000073124ntrs:AffordableHousingInvestmentMember2025-12-310000073124ntrs:NewMarketsInvestmentMember2026-06-300000073124ntrs:NewMarketsInvestmentMember2025-12-310000073124ntrs:AffordableHousingInvestmentMember2026-04-012026-06-300000073124ntrs:AffordableHousingInvestmentMember2025-04-012025-06-300000073124ntrs:AffordableHousingInvestmentMember2026-01-012026-06-300000073124ntrs:AffordableHousingInvestmentMember2025-01-012025-06-300000073124ntrs:NewMarketsInvestmentMember2026-04-012026-06-300000073124ntrs:NewMarketsInvestmentMember2025-04-012025-06-300000073124ntrs:NewMarketsInvestmentMember2026-01-012026-06-300000073124ntrs:NewMarketsInvestmentMember2025-01-012025-06-300000073124ntrs:CommercialLettersOfCreditMember2026-06-300000073124ntrs:CommercialLettersOfCreditMember2025-12-310000073124us-gaap:FinancialGuaranteeMember2026-06-300000073124us-gaap:FinancialGuaranteeMember2025-12-310000073124us-gaap:CommitmentsToExtendCreditMember2026-06-300000073124us-gaap:CommitmentsToExtendCreditMember2025-12-310000073124ntrs:SecuredByCashDepositsOrParticipatedToOthersMemberus-gaap:StandbyLettersOfCreditMember2026-06-300000073124ntrs:SecuredByCashDepositsOrParticipatedToOthersMemberus-gaap:StandbyLettersOfCreditMember2025-12-310000073124ntrs:StandbyLetterOfCreditAndFinancialGuaranteeMember2026-06-300000073124ntrs:StandbyLetterOfCreditAndFinancialGuaranteeMember2025-12-310000073124us-gaap:IndemnificationGuaranteeMember2026-06-300000073124us-gaap:IndemnificationGuaranteeMember2025-12-310000073124srt:MinimumMember2026-06-300000073124srt:MaximumMember2026-06-300000073124srt:SubsidiariesMemberntrs:NorthernTrustFiduciaryServicesGuernseyLimitedMember2015-01-012015-12-310000073124ntrs:NorthernTrustFiduciaryServicesGuernseyLimitedMember2024-03-052024-03-050000073124ntrs:VisaMember2018-01-012026-03-310000073124ntrs:VisaClassB3SharesMember2026-05-012026-05-310000073124ntrs:VisaClassCSharesMember2026-05-012026-05-310000073124ntrs:VisaClassB3SharesMember2026-06-300000073124ntrs:VisaMemberntrs:VisaClassAMember2026-06-300000073124ntrs:VisaClassCSharesMember2026-04-012026-06-300000073124ntrs:VisaClassCSharesMember2026-06-300000073124us-gaap:DesignatedAsHedgingInstrumentMemberus-gaap:InterestRateContractMemberus-gaap:FairValueHedgingMember2026-06-300000073124us-gaap:DesignatedAsHedgingInstrumentMemberus-gaap:InterestRateContractMemberus-gaap:FairValueHedgingMember2025-12-310000073124us-gaap:DesignatedAsHedgingInstrumentMemberus-gaap:InterestRateContractMemberus-gaap:CashFlowHedgingMember2026-06-300000073124us-gaap:DesignatedAsHedgingInstrumentMemberus-gaap:InterestRateContractMemberus-gaap:CashFlowHedgingMember2025-12-310000073124us-gaap:DesignatedAsHedgingInstrumentMemberus-gaap:ForeignExchangeContractMemberus-gaap:CashFlowHedgingMember2026-06-300000073124us-gaap:DesignatedAsHedgingInstrumentMemberus-gaap:ForeignExchangeContractMemberus-gaap:CashFlowHedgingMember2025-12-310000073124us-gaap:DesignatedAsHedgingInstrumentMemberus-gaap:ForeignExchangeContractMemberus-gaap:NetInvestmentHedgingMember2026-06-300000073124us-gaap:DesignatedAsHedgingInstrumentMemberus-gaap:ForeignExchangeContractMemberus-gaap:NetInvestmentHedgingMember2025-12-310000073124us-gaap:DesignatedAsHedgingInstrumentMember2026-06-300000073124us-gaap:DesignatedAsHedgingInstrumentMember2025-12-310000073124us-gaap:NotDesignatedAsHedgingInstrumentEconomicHedgeMemberus-gaap:ForeignExchangeContractMemberus-gaap:FairValueHedgingMember2026-06-300000073124us-gaap:NotDesignatedAsHedgingInstrumentEconomicHedgeMemberus-gaap:ForeignExchangeContractMemberus-gaap:FairValueHedgingMember2025-12-310000073124us-gaap:NotDesignatedAsHedgingInstrumentEconomicHedgeMemberntrs:OtherFinancialDerivativeMemberus-gaap:FairValueHedgingMember2026-06-300000073124us-gaap:NotDesignatedAsHedgingInstrumentEconomicHedgeMemberntrs:OtherFinancialDerivativeMemberus-gaap:FairValueHedgingMember2025-12-310000073124us-gaap:NotDesignatedAsHedgingInstrumentEconomicHedgeMemberus-gaap:FairValueHedgingMember2026-06-300000073124us-gaap:NotDesignatedAsHedgingInstrumentEconomicHedgeMemberus-gaap:FairValueHedgingMember2025-12-310000073124us-gaap:NotDesignatedAsHedgingInstrumentTradingMemberus-gaap:ForeignExchangeContractMemberus-gaap:FairValueHedgingMember2026-06-300000073124us-gaap:NotDesignatedAsHedgingInstrumentTradingMemberus-gaap:ForeignExchangeContractMemberus-gaap:FairValueHedgingMember2025-12-310000073124us-gaap:NotDesignatedAsHedgingInstrumentTradingMemberus-gaap:InterestRateContractMemberus-gaap:FairValueHedgingMember2026-06-300000073124us-gaap:NotDesignatedAsHedgingInstrumentTradingMemberus-gaap:InterestRateContractMemberus-gaap:FairValueHedgingMember2025-12-310000073124us-gaap:NotDesignatedAsHedgingInstrumentTradingMemberus-gaap:FairValueHedgingMember2026-06-300000073124us-gaap:NotDesignatedAsHedgingInstrumentTradingMemberus-gaap:FairValueHedgingMember2025-12-310000073124us-gaap:NondesignatedMemberus-gaap:FairValueHedgingMember2026-06-300000073124us-gaap:NondesignatedMemberus-gaap:FairValueHedgingMember2025-12-310000073124us-gaap:InterestAndDividendIncomeOperating2026-04-012026-06-300000073124us-gaap:InterestAndDividendIncomeOperating2025-04-012025-06-300000073124us-gaap:InterestExpenseOperating2026-04-012026-06-300000073124us-gaap:InterestExpenseOperating2025-04-012025-06-300000073124us-gaap:InterestRateContractMemberus-gaap:InterestAndDividendIncomeOperating2026-04-012026-06-300000073124us-gaap:InterestRateContractMemberus-gaap:InterestAndDividendIncomeOperating2025-04-012025-06-300000073124us-gaap:InterestRateContractMemberus-gaap:InterestExpenseOperating2026-04-012026-06-300000073124us-gaap:InterestRateContractMemberus-gaap:InterestExpenseOperating2025-04-012025-06-300000073124us-gaap:ForeignExchangeContractMemberus-gaap:InterestAndDividendIncomeOperating2026-04-012026-06-300000073124us-gaap:ForeignExchangeContractMemberus-gaap:InterestAndDividendIncomeOperating2025-04-012025-06-300000073124us-gaap:ForeignExchangeContractMemberus-gaap:InterestExpenseOperating2026-04-012026-06-300000073124us-gaap:ForeignExchangeContractMemberus-gaap:InterestExpenseOperating2025-04-012025-06-300000073124us-gaap:InterestAndDividendIncomeOperating2026-01-012026-06-300000073124us-gaap:InterestAndDividendIncomeOperating2025-01-012025-06-300000073124us-gaap:InterestExpenseOperating2026-01-012026-06-300000073124us-gaap:InterestExpenseOperating2025-01-012025-06-300000073124us-gaap:InterestRateContractMemberus-gaap:InterestAndDividendIncomeOperating2026-01-012026-06-300000073124us-gaap:InterestRateContractMemberus-gaap:InterestAndDividendIncomeOperating2025-01-012025-06-300000073124us-gaap:InterestRateContractMemberus-gaap:InterestExpenseOperating2026-01-012026-06-300000073124us-gaap:InterestRateContractMemberus-gaap:InterestExpenseOperating2025-01-012025-06-300000073124us-gaap:ForeignExchangeContractMemberus-gaap:InterestAndDividendIncomeOperating2026-01-012026-06-300000073124us-gaap:ForeignExchangeContractMemberus-gaap:InterestAndDividendIncomeOperating2025-01-012025-06-300000073124us-gaap:ForeignExchangeContractMemberus-gaap:InterestExpenseOperating2026-01-012026-06-300000073124us-gaap:ForeignExchangeContractMemberus-gaap:InterestExpenseOperating2025-01-012025-06-300000073124us-gaap:NotDesignatedAsHedgingInstrumentEconomicHedgeMemberntrs:OtherFinancialObligationsMember2025-01-012025-06-300000073124us-gaap:NotDesignatedAsHedgingInstrumentEconomicHedgeMemberntrs:OtherFinancialObligationsMember2026-01-012026-06-300000073124us-gaap:NotDesignatedAsHedgingInstrumentEconomicHedgeMemberntrs:OtherFinancialObligationsMember2026-04-012026-06-300000073124us-gaap:NotDesignatedAsHedgingInstrumentEconomicHedgeMemberntrs:OtherFinancialObligationsMember2025-04-012025-06-300000073124us-gaap:NotDesignatedAsHedgingInstrumentEconomicHedgeMember2026-04-012026-06-300000073124us-gaap:NotDesignatedAsHedgingInstrumentEconomicHedgeMember2025-04-012025-06-300000073124us-gaap:NotDesignatedAsHedgingInstrumentEconomicHedgeMember2026-01-012026-06-300000073124us-gaap:NotDesignatedAsHedgingInstrumentEconomicHedgeMember2025-01-012025-06-300000073124us-gaap:NotDesignatedAsHedgingInstrumentTradingMemberus-gaap:ForeignExchangeContractMember2026-01-012026-06-300000073124us-gaap:NotDesignatedAsHedgingInstrumentTradingMemberus-gaap:ForeignExchangeContractMember2025-01-012025-06-300000073124us-gaap:NotDesignatedAsHedgingInstrumentTradingMemberus-gaap:ForeignExchangeContractMember2026-04-012026-06-300000073124us-gaap:NotDesignatedAsHedgingInstrumentTradingMemberus-gaap:ForeignExchangeContractMember2025-04-012025-06-300000073124us-gaap:NotDesignatedAsHedgingInstrumentTradingMemberus-gaap:InterestRateContractMember2026-01-012026-06-300000073124us-gaap:NotDesignatedAsHedgingInstrumentTradingMemberus-gaap:InterestRateContractMember2025-01-012025-06-300000073124us-gaap:NotDesignatedAsHedgingInstrumentTradingMemberus-gaap:InterestRateContractMember2026-04-012026-06-300000073124us-gaap:NotDesignatedAsHedgingInstrumentTradingMemberus-gaap:InterestRateContractMember2025-04-012025-06-300000073124us-gaap:NotDesignatedAsHedgingInstrumentTradingMember2026-04-012026-06-300000073124us-gaap:NotDesignatedAsHedgingInstrumentTradingMember2025-04-012025-06-300000073124us-gaap:NotDesignatedAsHedgingInstrumentTradingMember2026-01-012026-06-300000073124us-gaap:NotDesignatedAsHedgingInstrumentTradingMember2025-01-012025-06-300000073124us-gaap:NondesignatedMember2026-04-012026-06-300000073124us-gaap:NondesignatedMember2025-04-012025-06-300000073124us-gaap:NondesignatedMember2026-01-012026-06-300000073124us-gaap:NondesignatedMember2025-01-012025-06-300000073124us-gaap:USGovernmentDebtSecuritiesMember2026-06-300000073124us-gaap:USGovernmentDebtSecuritiesMember2025-12-310000073124us-gaap:OverTheCounterMemberus-gaap:ForeignExchangeContractMember2026-06-300000073124us-gaap:OverTheCounterMemberus-gaap:InterestRateSwapMember2026-06-300000073124us-gaap:OtherContractMemberntrs:OtherFinancialDerivativeMember2026-06-300000073124us-gaap:OverTheCounterMemberus-gaap:ForeignExchangeContractMember2025-12-310000073124us-gaap:OverTheCounterMemberus-gaap:InterestRateSwapMember2025-12-310000073124us-gaap:OtherContractMemberntrs:OtherFinancialDerivativeMember2025-12-310000073124us-gaap:NetInvestmentHedgingMember2026-06-300000073124us-gaap:NetInvestmentHedgingMember2025-12-31
UNITED STATES
SECURITIES AND EXCHANGE COMMISSION
Washington, D.C. 20549
____________________________________________
FORM 10-Q
|
|
|
|
|
|
| ☒ |
QUARTERLY REPORT PURSUANT TO SECTION 13 OR 15(d) OF THE SECURITIES EXCHANGE ACT OF 1934 |
For the quarterly period ended June 30, 2026
OR
|
|
|
|
|
|
| ☐ |
TRANSITION REPORT PURSUANT TO SECTION 13 OR 15(d) OF THE SECURITIES EXCHANGE ACT OF 1934 |
For the transition period from to
Commission File No. 001-36609
NORTHERN TRUST CORPORATION
(Exact name of registrant as specified in its charter)
|
|
|
|
|
|
| Delaware |
36-2723087 |
(State or other jurisdiction of
incorporation or organization) |
(I.R.S. Employer
Identification No.) |
|
|
|
|
|
|
|
|
|
| 50 South LaSalle Street |
60603 |
| Chicago, |
Illinois |
(Zip Code) |
| (Address of principal executive offices) |
|
Registrant’s telephone number, including area code: (312) 630-6000
____________________________________________
Securities registered pursuant to Section 12(b) of the Act:
|
|
|
|
|
|
|
|
|
| Title of each class |
Trading Symbol |
Name of each exchange on which registered |
| Common Stock, $1.66 2/3 Par Value |
NTRS |
The NASDAQ Stock Market LLC |
| Depositary Shares, each representing 1/1,000th interest in a share of Series E Non-Cumulative Perpetual Preferred Stock |
NTRSO |
The NASDAQ Stock Market LLC |
Indicate by check mark whether the registrant (1) has filed all reports required to be filed by Section 13 or 15(d) of the Securities Exchange Act of 1934 during the preceding 12 months (or for such shorter period that the registrant was required to file such reports), and (2) has been subject to such filing requirements for the past 90 days. Yes x No ¨
Indicate by check mark whether the registrant has submitted electronically every Interactive Data File required to be submitted pursuant to Rule 405 of Regulation S-T (§232.405 of this chapter) during the preceding 12 months (or for such shorter period that the registrant was required to submit such files). Yes x No ¨
Indicate by check mark whether the registrant is a large accelerated filer, an accelerated filer, a non-accelerated filer, a smaller reporting company, or an emerging growth company. See the definitions of “large accelerated filer,” “accelerated filer,” “smaller reporting company,” and “emerging growth company” in Rule 12b-2 of the Exchange Act.
|
|
|
|
|
|
|
|
|
|
|
|
| Large accelerated filer |
x |
Accelerated filer |
¨ |
|
|
|
|
| Non-accelerated filer |
¨ |
Smaller reporting company |
☐ |
|
|
|
|
|
|
Emerging growth company |
☐ |
If an emerging growth company, indicate by check mark if the registrant has elected not to use the extended transition period for complying with any new or revised financial accounting standards provided pursuant to Section 13(a) of the Exchange Act. ¨
Indicate by check mark whether the registrant is a shell company (as defined in Rule 12b-2 of the Exchange Act). Yes ☐ No x
At June 30, 2026, 182,955,653 shares of common stock, $1.66 2/3 par value, were outstanding.
NORTHERN TRUST CORPORATION
QUARTERLY REPORT ON FORM 10-Q
FOR THE QUARTERLY PERIOD ENDED JUNE 30, 2026
TABLE OF CONTENTS
CONSOLIDATED FINANCIAL HIGHLIGHTS
(UNAUDITED)
|
|
|
|
|
|
|
|
|
|
|
|
|
|
|
|
|
|
|
|
|
|
THREE MONTHS ENDED JUNE 30, |
SIX MONTHS ENDED JUNE 30, |
| CONDENSED INCOME STATEMENTS ($ In Millions) |
2026 |
2025 |
% CHANGE(1)
|
2026 |
2025 |
% CHANGE(1)
|
| Noninterest Income |
$ |
2,022.5
|
|
$ |
1,387.4 |
|
46 |
% |
$ |
3,574.2
|
|
$ |
2,759.3 |
|
30 |
% |
| Net Interest Income |
675.5
|
|
610.5 |
|
11 |
|
1,329.5
|
|
1,178.6 |
|
13 |
|
| Total Revenue |
2,698.0
|
|
1,997.9 |
|
35 |
|
4,903.7
|
|
3,937.9 |
|
25 |
|
| Provision for Credit Losses |
(5.3) |
|
16.5 |
|
N/M |
(8.3) |
|
17.5 |
|
N/M |
| Noninterest Expense |
1,638.6
|
|
1,416.6 |
|
16 |
|
3,146.6
|
|
2,834.2 |
|
11 |
|
| Income before Income Taxes |
1,064.7
|
|
564.8 |
|
89 |
|
1,765.4
|
|
1,086.2 |
|
63 |
|
| Provision for Income Taxes |
272.5
|
|
143.5 |
|
90 |
|
447.6
|
|
272.9 |
|
64 |
|
| Net Income |
$ |
792.2
|
|
$ |
421.3 |
|
88 |
% |
$ |
1,317.8
|
|
$ |
813.3 |
|
62 |
% |
|
|
|
|
|
|
|
|
|
|
|
|
|
|
|
|
|
|
|
|
|
| PER COMMON SHARE |
|
|
|
|
|
|
| Net Income — Basic |
$ |
4.25
|
|
$ |
2.14 |
|
98 |
% |
$ |
6.97
|
|
$ |
4.05 |
|
72 |
% |
| — Diluted |
4.23
|
|
2.13 |
|
98 |
|
6.93
|
|
4.03 |
|
72 |
|
| Cash Dividends Declared Per Common Share |
0.80
|
|
0.75 |
|
7 |
|
1.60
|
|
1.50 |
|
7 |
|
| Book Value — End of Period (EOP) |
68.41
|
|
62.65 |
|
9 |
|
68.41
|
|
62.65 |
|
9 |
|
| Market Value — EOP |
173.84
|
|
126.79 |
|
37 |
|
173.84
|
|
126.79 |
|
37 |
|
|
|
|
|
|
|
|
|
|
|
|
|
| SELECTED BALANCE SHEET DATA ($ In Millions) |
JUNE 30, 2026 |
DECEMBER 31, 2025 |
% CHANGE(1)
|
| End of Period: |
|
|
|
| Total Assets |
$ |
179,297.2
|
|
$ |
177,132.7 |
|
1 |
% |
| Earning Assets |
166,079.4
|
|
166,194.2 |
|
— |
|
| Deposits |
145,580.0
|
|
142,797.7 |
|
2 |
|
| Stockholders’ Equity |
13,401.6
|
|
12,957.9 |
|
3 |
|
|
|
|
|
|
|
|
|
|
|
|
|
|
|
|
|
|
|
|
|
|
|
THREE MONTHS ENDED JUNE 30, |
SIX MONTHS ENDED JUNE 30, |
|
2026 |
2025 |
% CHANGE(1)
|
2026 |
2025 |
% CHANGE(1)
|
| Average Balances: |
|
|
|
|
|
|
| Total Assets |
$ |
163,575.8
|
|
$ |
157,719.2 |
|
4 |
% |
$ |
164,431.8
|
|
$ |
154,011.3 |
|
7 |
% |
| Earning Assets |
151,291.2
|
|
145,822.0 |
|
4 |
|
152,477.7
|
|
141,936.5 |
|
7 |
|
| Deposits |
127,845.7
|
|
122,377.8 |
|
4 |
|
128,435.4
|
|
119,166.3 |
|
8 |
|
| Stockholders’ Equity |
13,094.6
|
|
12,612.1 |
|
4 |
|
12,928.8
|
|
12,608.1 |
|
3 |
|
|
|
|
|
|
|
|
|
|
|
|
|
| CLIENT ASSETS ($ In Billions) |
JUNE 30, 2026 |
DECEMBER 31, 2025 |
% CHANGE(1)
|
AUC/A(2)
|
$ |
20,000.2
|
|
$ |
18,716.1 |
|
7 |
% |
| AUC |
15,938.8
|
|
14,889.1 |
|
7 |
|
| AUM |
1,969.9
|
|
1,803.2 |
|
9 |
|
N/M - Not meaningful
(1) Percentage calculations are based on actual balances rather than the rounded amounts presented in the table above.
(2) For the purposes of disclosing AUC/A, to the extent that both custody and administration services are provided, the value of the assets is included only once in this amount.
SELECTED RATIOS AND METRICS
|
|
|
|
|
|
|
|
|
|
|
|
|
|
|
|
THREE MONTHS ENDED JUNE 30, |
SIX MONTHS ENDED JUNE 30, |
|
2026 |
2025 |
2026 |
2025 |
| Financial Ratios: |
|
|
|
|
| Return on Average Common Equity |
25.9
|
% |
14.2 |
% |
21.7
|
% |
13.6 |
% |
|
|
|
|
|
| Dividend Payout Ratio |
18.9
|
|
35.2 |
|
23.1
|
|
37.2 |
|
Net Interest Margin(1)
|
1.81
|
|
1.69 |
|
1.78
|
|
1.69 |
|
|
|
|
|
|
|
|
|
|
|
|
|
|
|
|
|
|
|
|
|
|
|
|
|
|
|
|
|
Standardized Approach |
|
Advanced Approach |
|
|
|
|
June 30, 2026 |
December 31, 2025 |
|
June 30, 2026 |
December 31, 2025 |
|
WELL-CAPITALIZED RATIOS |
MINIMUM CAPITAL RATIOS |
| Capital Ratios: |
|
|
|
|
|
|
|
|
| Northern Trust Corporation |
|
|
|
|
|
|
|
|
| Common Equity Tier 1 Capital |
12.2
|
% |
12.6 |
% |
|
14.3
|
% |
15.0 |
% |
|
N/A |
4.5 |
% |
| Tier 1 Capital |
13.1
|
|
13.5 |
|
|
15.3
|
|
16.0 |
|
|
6.0 |
|
6.0 |
|
| Total Capital |
15.5
|
|
16.1 |
|
|
17.9
|
|
18.8 |
|
|
10.0 |
|
8.0 |
|
| Tier 1 Leverage |
7.6
|
|
7.8 |
|
|
7.6
|
|
7.8 |
|
|
N/A |
4.0 |
|
| Supplementary Leverage |
N/A |
N/A |
|
8.6
|
|
8.7 |
|
|
N/A |
3.0 |
|
|
|
|
|
|
|
|
|
|
| The Northern Trust Company |
|
|
|
|
|
|
|
|
| Common Equity Tier 1 Capital |
11.8
|
% |
12.1 |
% |
|
14.1
|
% |
14.6 |
% |
|
6.5 |
% |
4.5 |
% |
| Tier 1 Capital |
11.8
|
|
12.1 |
|
|
14.1
|
|
14.6 |
|
|
8.0 |
|
6.0 |
|
| Total Capital |
13.9
|
|
14.3 |
|
|
16.3
|
|
17.0 |
|
|
10.0 |
|
8.0 |
|
| Tier 1 Leverage |
6.8
|
|
6.9 |
|
|
6.8
|
|
6.9 |
|
|
5.0 |
|
4.0 |
|
| Supplementary Leverage |
N/A |
N/A |
|
7.7
|
|
7.7 |
|
|
3.0 |
|
3.0 |
|
(1) Net interest margin is presented on a fully taxable equivalent (FTE) basis, a non-generally accepted accounting principle (GAAP) financial measure that facilitates the analysis of asset yields. The net interest margin on a GAAP basis and a reconciliation of net interest income on a GAAP basis to net interest income on an FTE basis are presented in “Reconciliation to Fully Taxable Equivalent” within the “Management’s Discussion and Analysis of Financial Condition and Results of Operations” section.
PART I – FINANCIAL INFORMATION
Items 2. and 3. Management’s Discussion and Analysis of Financial Condition and Results of Operations and Quantitative and Qualitative Disclosures about Market Risk
The following is management’s discussion and analysis of the financial condition and results of operations (MD&A) of Northern Trust Corporation (Corporation) for the second quarter of 2026. The following should be read in conjunction with the consolidated financial statements and related footnotes included in this report as well as the Annual Report on Form 10-K for the year ended December 31, 2025. Investors also should read the section titled “Forward-Looking Statements.”
Certain terms used in this report are defined in the Glossary included in our Annual Report on Form 10-K for the year ended December 31, 2025.
CONSOLIDATED RESULTS OF OPERATIONS
General
The Corporation is a leading provider of asset servicing, wealth management, asset management and banking solutions to corporations, institutions, families and individuals. The Corporation focuses on managing and servicing client assets through its two client-focused reporting segments: Asset Servicing and Wealth Management. Asset management and related services are provided to Asset Servicing and Wealth Management clients primarily by the Asset Management business. Except where the context requires otherwise, the terms “Northern Trust,” “we,” “us,” “our,” “its,” or similar terms mean the Corporation and its subsidiaries on a consolidated basis.
Overview of Financial Results
TABLE 1: FINANCIAL HIGHLIGHTS
|
|
|
|
|
|
|
|
|
|
|
|
|
|
|
|
|
|
|
|
|
|
|
|
|
|
|
|
THREE MONTHS ENDED JUNE 30, |
SIX MONTHS ENDED JUNE 30, |
| ($ In Millions) |
2026 |
2025 |
CHANGE |
2026 |
2025 |
CHANGE |
| Trust, Investment and Other Servicing Fees |
$ |
1,349.5
|
|
$ |
1,231.1 |
|
$ |
118.4 |
|
10 |
% |
$ |
2,690.9
|
|
$ |
2,444.9 |
|
$ |
246.0 |
|
10 |
% |
Other Noninterest Income(1)
|
673.0
|
|
156.3 |
|
516.7 |
|
N/M |
883.3
|
|
314.4 |
|
568.9 |
|
181 |
| Net Interest Income |
675.5
|
|
610.5 |
|
65.0 |
|
11 |
|
1,329.5
|
|
1,178.6 |
|
150.9 |
|
13 |
|
| Total Revenue |
$ |
2,698.0
|
|
$ |
1,997.9 |
|
$ |
700.1 |
|
35 |
% |
$ |
4,903.7
|
|
$ |
3,937.9 |
|
$ |
965.8 |
|
25 |
% |
| Provision for Credit Losses |
(5.3) |
|
16.5 |
|
N/M |
N/M |
(8.3) |
|
17.5 |
|
N/M |
N/M |
Noninterest Expense(2)
|
1,638.6
|
|
1,416.6 |
|
222.0 |
|
16 |
|
3,146.6
|
|
2,834.2 |
|
312.4 |
|
11 |
|
| Income before Income Taxes |
$ |
1,064.7
|
|
$ |
564.8 |
|
$ |
499.9 |
|
89 |
% |
$ |
1,765.4
|
|
$ |
1,086.2 |
|
$ |
679.2 |
|
63 |
% |
| Provision for Income Taxes |
272.5
|
|
143.5 |
|
129.0 |
|
90 |
|
447.6
|
|
272.9 |
|
174.7 |
|
64 |
|
| Net Income |
$ |
792.2
|
|
$ |
421.3 |
|
$ |
370.9 |
|
88 |
% |
$ |
1,317.8
|
|
$ |
813.3 |
|
$ |
504.5 |
|
62 |
% |
| Preferred Stock Dividends |
4.7
|
|
4.7 |
|
— |
|
— |
|
20.9
|
|
20.9 |
|
— |
|
— |
|
| Net Income Applicable to Common Stock |
$ |
787.5
|
|
$ |
416.6 |
|
$ |
370.9 |
|
89 |
% |
$ |
1,296.9
|
|
$ |
792.4 |
|
$ |
504.5 |
|
64 |
% |
| PER COMMON SHARE |
|
|
|
|
|
|
|
|
| Net Income – Basic |
$ |
4.25
|
|
$ |
2.14 |
|
$ |
2.11 |
|
98 |
% |
$ |
6.97
|
|
$ |
4.05 |
|
$ |
2.92 |
|
72 |
% |
| – Diluted |
4.23
|
|
2.13 |
|
2.10 |
|
98 |
|
6.93
|
|
4.03 |
|
2.90 |
|
72 |
|
| Cash Dividends Declared Per Common Share |
0.80
|
|
0.75 |
|
0.05 |
|
7 |
|
1.60
|
|
1.50 |
|
0.10 |
|
7 |
|
N/M - Not meaningful
(1) For the three and six months ended June 30, 2026, Other Noninterest Income included a $525.4 million (pre-tax) gain related to Northern Trust’s participation in the second Visa, Inc. Exchange Offer, recorded in Other Operating Income and a $73.9 million (pre-tax) loss on available for sale debt securities sold in conjunction with a repositioning of the portfolio, recognized in Investment Security Gains (Losses)
(2) For the three and six months ended June 30, 2026, Noninterest Expense included a $61.5 million (pre-tax) charge related to software dispositions, recognized in Equipment and Software expense, as well as $51.0 million (pre-tax) of severance-related charges and a $33.1 million (pre-tax) expense related to the Invested as One equity grant to eligible employees, both recognized in Compensation and Benefits expense.
CONSOLIDATED RESULTS OF OPERATIONS (continued)
Overview of Financial Results (continued)
Three Months Ended June 30, 2026 highlights:
•Revenue for the three months ended June 30, 2026 increased from the prior-year quarter to $2.7 billion, reflecting:
◦Trust, Investment and Other Servicing Fees increased to $1.3 billion in the current quarter primarily due to favorable markets, net client inflows, and net new business.
◦Other Noninterest Income increased to $673.0 million in the current quarter primarily due to higher Other Operating Income, mainly driven by a $525.4 million gain related to Northern Trust’s participation in the second Visa, Inc. Exchange Offer in the current quarter, as well as higher Foreign Exchange Trading Income and Securities Commissions and Trading Income, mainly driven by higher volumes resulting from client activity and market volatility, partially offset by a $73.9 million loss on the sale of AFS securities related to a repositioning of the portfolio in the current quarter, recognized in Investment Security Gains (Losses), net.
◦Net Interest Income increased to $675.5 million in the current quarter primarily driven by higher deposits and lower funding costs.
•Noninterest Expense increased to $1.6 billion in the current quarter primarily due to a $61.5 million charge related to software dispositions recognized in Equipment and Software expense, as well as $51.0 million of severance-related charges and a $33.1 million expense related to the Invested as One equity grant to eligible employees, both recognized in Compensation and Benefits expense, all occurring in the current quarter.
•In the current quarter, there was a negative Provision for Credit Losses of $5.3 million, as compared to a Provision for Credit Losses of $16.5 million in the prior-year quarter. For additional information, refer to the Provision for Credit Losses within the “Consolidated Results of Operations” section.
Six Months Ended June 30, 2026 highlights:
•Revenue for the six months ended June 30, 2026 increased from the prior-year period to $4.9 billion, reflecting:
◦Trust, Investment and Other Servicing Fees increased to $2.7 billion in the current year primarily due to favorable markets, net new business, and favorable currency movement.
◦Other Noninterest Income increased to $883.3 million in the current year primarily due to higher Other Operating Income, mainly driven by a $525.4 million gain related to Northern Trust’s participation in the second Visa, Inc. Exchange Offer in the current quarter, as well as higher Foreign Exchange Trading Income and Securities Commissions and Trading Income, mainly driven by higher volumes resulting from client activity and market volatility, partially offset by a $73.9 million loss on the sale of AFS securities related to a repositioning of the portfolio in the current quarter, recognized in Investment Security Gains (Losses), net.
◦Net Interest Income increased to $1.3 billion in the year primarily driven by higher deposit levels and lower funding costs, partially offset by lower asset yields.
•Noninterest Expense increased to $3.1 billion in the current year primarily due to a $61.5 million charge related to software dispositions recognized in Equipment and Software expense, as well as $51.0 million of severance-related charges and a $33.1 million expense related to the Invested as One equity grant to eligible employees, both recognized in Compensation and Benefits expense, all occurring in the current quarter.
•In the current year, there was a negative Provision for Credit Losses of $8.3 million, as compared to a Provision for Credit Losses of $17.5 million in the prior-year quarter. For additional information, refer to the Provision for Credit Losses within the “Consolidated Results of Operations” section.
SECOND QUARTER CONSOLIDATED RESULTS OF OPERATIONS (continued)
Trust, Investment and Other Servicing Fees
Trust, Investment and Other Servicing Fees are based primarily on the market value of assets held in custody, managed or serviced; the volume of transactions; securities lending volume and spreads; and fees for other services rendered. Certain market value calculations on which fees are based are performed on a monthly or quarterly basis in arrears.
The components of Trust, Investment and Other Servicing Fees are provided below.
TABLE 2: TRUST, INVESTMENT AND OTHER SERVICING FEES
|
|
|
|
|
|
|
|
|
|
|
|
|
|
|
|
|
|
|
|
|
|
|
|
|
|
|
|
THREE MONTHS ENDED JUNE 30, |
SIX MONTHS ENDED JUNE 30, |
| ($ In Millions) |
2026 |
2025 |
CHANGE |
2026 |
2025 |
CHANGE |
| Asset Servicing Trust, Investment and Other Servicing Fees |
|
|
|
|
|
|
|
|
| Custody and Fund Administration |
$ |
512.3
|
|
$ |
469.2 |
|
$ |
43.1 |
|
9 |
% |
$ |
1,009.9
|
|
$ |
922.5 |
|
$ |
87.4 |
|
9 |
% |
| Investment Management |
172.2
|
|
157.3 |
|
14.9 |
|
10 |
|
341.4
|
|
309.8 |
|
31.6 |
|
10 |
|
| Securities Lending |
29.4
|
|
20.2 |
|
9.2 |
|
46 |
|
52.8
|
|
38.1 |
|
14.7 |
|
39 |
|
| Other |
43.5
|
|
45.1 |
|
(1.6) |
|
(3) |
|
93.8
|
|
93.3 |
|
0.5 |
|
1 |
|
| Total Asset Servicing Trust, Investment and Other Servicing Fees |
$ |
757.4
|
|
$ |
691.8 |
|
$ |
65.6 |
|
9 |
% |
$ |
1,497.9
|
|
$ |
1,363.7 |
|
$ |
134.2 |
|
10 |
% |
| Wealth Management Trust, Investment and Other Servicing Fees |
|
|
|
|
|
|
|
|
Private Wealth(1)
|
$ |
483.0
|
|
$ |
434.8 |
|
$ |
48.2 |
|
11 |
% |
$ |
969.0
|
|
$ |
872.9 |
|
$ |
96.1 |
|
11 |
% |
| Global Family Office |
109.1
|
|
104.5 |
|
4.6 |
|
4 |
|
224.0
|
|
208.3 |
|
15.7 |
|
8 |
|
| Total Wealth Management Trust, Investment and Other Servicing Fees |
$ |
592.1
|
|
$ |
539.3 |
|
$ |
52.8 |
|
10 |
% |
$ |
1,193.0
|
|
$ |
1,081.2 |
|
$ |
111.8 |
|
10 |
% |
| Total Consolidated Trust, Investment and Other Servicing Fees |
$ |
1,349.5
|
|
$ |
1,231.1 |
|
$ |
118.4 |
|
10 |
% |
$ |
2,690.9
|
|
$ |
2,444.9 |
|
$ |
246.0 |
|
10 |
% |
(1) Beginning in Q2 2026, Wealth Management Trust, Investment and Other Servicing Fees by region are combined into the Private Wealth line item. Prior periods have been revised.
Asset Servicing
Custody and Fund Administration fees, the largest component of Asset Servicing fees, are driven primarily by values of client assets under custody/administration (AUC/A), transaction volumes and the number of accounts. The asset values used to calculate these fees vary depending on the individual fee arrangements negotiated with each client. Custody fees related to asset values are client-specific and are priced based on month-end market values, quarter-end market values, or the average of month-end market values for the quarter. The fund administration fees that are asset-value-related are priced using month-end, quarter-end, or average daily balances. Investment Management fees are based generally on market values of client AUM throughout the period. Typically, the asset values used to calculate fee revenue are based on a one-month or one-quarter lag. Securities Lending revenue is affected by market values; the demand for securities to be lent, which drives volumes; and the interest rate spread earned on the investment of cash deposited by investment firms as collateral for securities they have borrowed. The Other fee category in Asset Servicing includes products such as investment risk and analytical services, benefit payments, and other services. Revenue from these products is based generally on the volume of services provided or a fixed fee.
Custody and Fund Administration fees increased from the prior-year quarter primarily driven by favorable markets and net new business. Custody and Fund Administration fees increased from the prior-year period primarily driven by favorable markets, favorable currency movements and net new business.
Investment Management fees increased from both the the prior-year quarter and the prior-year period primarily due to favorable markets and net client inflows.
Securities Lending increased from both the prior-year quarter and prior-year period primarily due to higher trading volumes and spreads.
Wealth Management
Wealth Management fees are calculated primarily based on market values and is impacted by both one-month and one-quarter lagged asset values.
Private Wealth fee income increased from the prior-year quarter and from the prior-year period primarily due to favorable markets.
Global Family Office fee income increased from the prior-year period primarily due to favorable markets and client inflows.
SECOND QUARTER CONSOLIDATED RESULTS OF OPERATIONS (continued)
Trust, Investment and Other Servicing Fees (continued)
Market Indices
The following tables present selected market indices and the percentage changes year-over-year to provide context regarding equity and fixed income market impacts on the Corporation’s results.
TABLE 3: EQUITY MARKET INDICES
|
|
|
|
|
|
|
|
|
|
|
|
|
|
|
|
|
|
|
|
|
|
DAILY AVERAGES |
PERIOD-END |
|
THREE MONTHS ENDED JUNE 30, |
AS OF JUNE 30, |
|
2026 |
2025 |
CHANGE |
2026 |
2025 |
CHANGE |
| S&P 500 |
7,259
|
|
5,730 |
|
27 |
% |
7,499
|
|
6,205 |
|
21 |
% |
| MSCI EAFE (U.S. dollars) |
3,059
|
|
2,512 |
|
22 |
|
3,117
|
|
2,655 |
|
17 |
|
| MSCI EAFE (local currency) |
1,882
|
|
1,549 |
|
21 |
|
1,952
|
|
1,600 |
|
22 |
|
TABLE 4: FIXED INCOME MARKET INDICES
|
|
|
|
|
|
|
|
|
|
|
|
|
AS OF JUNE 30, |
|
2026 |
2025 |
CHANGE |
| Barclays Capital U.S. Aggregate Bond Index |
2,363
|
|
2,277 |
|
4 |
% |
| Barclays Capital Global Aggregate Bond Index |
500
|
|
497 |
|
1 |
|
Client Assets
As noted above, AUC/A and AUM are two of the primary drivers of our Trust, Investment and Other Servicing Fees. For the purposes of disclosing AUC/A, to the extent that both custody and administration services are provided, the value of the assets is included only once in this amount. The following table presents AUC/A by reporting segment.
TABLE 5: ASSETS UNDER CUSTODY / ADMINISTRATION BY REPORTING SEGMENT
|
|
|
|
|
|
|
|
|
|
|
|
|
|
|
|
|
|
|
JUNE 30, 2026 |
MARCH 31, 2026 |
JUNE 30, 2025 |
CHANGE Q2-26/Q1-26 |
CHANGE Q2-26/Q2-25 |
| ($ In Billions) |
| Asset Servicing |
$ |
18,635.2
|
|
$ |
17,288.6 |
|
$ |
16,864.9 |
|
8 |
% |
10 |
% |
| Wealth Management |
1,365.0
|
|
1,265.3 |
|
1,203.4 |
|
8 |
|
13 |
|
| Total Assets Under Custody / Administration |
$ |
20,000.2
|
|
$ |
18,553.9 |
|
$ |
18,068.3 |
|
8 |
% |
11 |
% |
The following table presents Northern Trust’s assets under custody, a component of AUC/A, by reporting segment.
TABLE 6: ASSETS UNDER CUSTODY BY REPORTING SEGMENT
|
|
|
|
|
|
|
|
|
|
|
|
|
|
|
|
|
|
|
JUNE 30, 2026 |
MARCH 31, 2026 |
JUNE 30, 2025 |
CHANGE Q2-26/Q1-26 |
CHANGE Q2-26/Q2-25 |
| ($ In Billions) |
| Asset Servicing |
$ |
14,587.7
|
|
$ |
13,521.1 |
|
$ |
13,056.5 |
|
8 |
% |
12 |
% |
| Wealth Management |
1,351.1
|
|
1,254.2 |
|
1,187.2 |
|
8 |
|
14 |
|
| Total Assets Under Custody |
$ |
15,938.8
|
|
$ |
14,775.3 |
|
$ |
14,243.7 |
|
8 |
% |
12 |
% |
Total assets under custody/administration and assets under custody increased from the prior quarter, primarily driven by favorable markets and net client inflows. Total assets under custody/administration and assets under custody increased from the prior-year quarter, primarily driven by favorable markets, partially offset by unfavorable currency translation
SECOND QUARTER CONSOLIDATED RESULTS OF OPERATIONS (continued)
Trust, Investment and Other Servicing Fees (continued)
The following table presents the allocation of Northern Trust’s custodied assets by reporting segment.
TABLE 7: ALLOCATION OF ASSETS UNDER CUSTODY
|
|
|
|
|
|
|
|
|
|
|
|
|
|
|
|
|
|
|
|
|
|
|
|
|
|
|
|
|
|
|
JUNE 30, 2026 |
MARCH 31, 2026 |
JUNE 30, 2025 |
|
AS |
WM |
TOTAL |
AS |
WM |
TOTAL |
AS |
WM |
TOTAL |
| Equities |
50
|
% |
62
|
% |
51
|
% |
48 |
% |
60 |
% |
49 |
% |
49 |
% |
62 |
% |
50 |
% |
| Fixed Income Securities |
30
|
|
13
|
|
29
|
|
32 |
|
13 |
|
30 |
|
31 |
|
13 |
|
30 |
|
| Cash and Other Assets |
18
|
|
25
|
|
19
|
|
19 |
|
27 |
|
20 |
|
18 |
|
25 |
|
19 |
|
| Securities Lending Collateral |
2
|
|
—
|
|
2
|
|
1 |
|
— |
|
1 |
|
2 |
|
— |
|
1 |
|
The following table presents Northern Trust’s assets under custody by investment type.
TABLE 8: ASSETS UNDER CUSTODY BY INVESTMENT TYPE
|
|
|
|
|
|
|
|
|
|
|
|
|
|
|
|
|
|
| ($ In Billions) |
JUNE 30, 2026 |
MARCH 31, 2026 |
JUNE 30, 2025 |
CHANGE Q2-26/Q1-26 |
CHANGE Q2-26/Q2-25 |
| Equities |
$ |
8,092.7
|
|
$ |
7,176.6 |
|
$ |
7,156.8 |
|
13 |
% |
13 |
% |
| Fixed Income Securities |
4,578.2
|
|
4,467.4 |
|
4,203.0 |
|
2 |
|
9 |
|
| Cash and Other Assets |
3,028.0
|
|
2,914.7 |
|
2,677.9 |
|
4 |
|
13 |
|
| Securities Lending Collateral |
239.9
|
|
216.6 |
|
206.0 |
|
11 |
|
16 |
|
| Total AUC |
$ |
15,938.8
|
|
$ |
14,775.3 |
|
$ |
14,243.7 |
|
8 |
% |
12 |
% |
The following table presents Northern Trust’s AUM by reporting segment.
TABLE 9: ASSETS UNDER MANAGEMENT BY REPORTING SEGMENT
|
|
|
|
|
|
|
|
|
|
|
|
|
|
|
|
|
|
|
JUNE 30, 2026 |
MARCH 31, 2026 |
JUNE 30, 2025 |
CHANGE Q2-26/Q1-26 |
CHANGE Q2-26/Q2-25 |
| ($ In Billions) |
| Asset Servicing |
$ |
1,436.0
|
|
$ |
1,287.3 |
|
$ |
1,229.2 |
|
12 |
% |
17 |
% |
| Wealth Management |
533.9
|
|
497.6 |
|
468.5 |
|
7 |
|
14 |
|
| Total AUM |
$ |
1,969.9
|
|
$ |
1,784.9 |
|
$ |
1,697.7 |
|
10 |
% |
16 |
% |
Total assets under management increased compared to the prior quarter and the prior-year quarter primarily reflecting favorable markets and net client inflows.
The following table presents the allocation of Northern Trust’s AUM by reporting segment.
TABLE 10: ALLOCATION OF ASSETS UNDER MANAGEMENT
|
|
|
|
|
|
|
|
|
|
|
|
|
|
|
|
|
|
|
|
|
|
|
|
|
|
|
|
|
|
|
JUNE 30, 2026 |
MARCH 31, 2026 |
JUNE 30, 2025 |
|
AS |
WM |
TOTAL |
AS |
WM |
TOTAL |
AS |
WM |
TOTAL |
| Equities |
55
|
% |
62
|
% |
57
|
% |
53 |
% |
59 |
% |
55 |
% |
54 |
% |
59 |
% |
56 |
% |
| Fixed Income Securities |
10
|
|
18
|
|
12
|
|
11 |
|
19 |
|
13 |
|
11 |
|
20 |
|
13 |
|
| Cash and Other Assets |
18
|
|
20
|
|
19
|
|
19 |
|
22 |
|
20 |
|
18 |
|
21 |
|
19 |
|
| Securities Lending Collateral |
17
|
|
—
|
|
12
|
|
17 |
|
— |
|
12 |
|
17 |
|
— |
|
12 |
|
The following table presents Northern Trust’s AUM by investment type.
TABLE 11: ASSETS UNDER MANAGEMENT BY INVESTMENT TYPE
|
|
|
|
|
|
|
|
|
|
|
|
|
|
|
|
|
|
| ($ In Billions) |
JUNE 30, 2026 |
MARCH 31, 2026 |
JUNE 30, 2025 |
CHANGE Q2-26/Q1-26 |
CHANGE Q2-26/Q2-25 |
| Equities |
$ |
1,117.3
|
|
$ |
984.1 |
|
$ |
943.6 |
|
14 |
% |
18 |
% |
| Fixed Income Securities |
236.9
|
|
233.6 |
|
223.5 |
|
1 |
|
6 |
|
| Cash and Other Assets |
375.8
|
|
350.6 |
|
324.6 |
|
7 |
|
16 |
|
| Securities Lending Collateral |
239.9
|
|
216.6 |
|
206.0 |
|
11 |
|
16 |
|
| Total AUM |
$ |
1,969.9
|
|
$ |
1,784.9 |
|
$ |
1,697.7 |
|
10 |
% |
16 |
% |
SECOND QUARTER CONSOLIDATED RESULTS OF OPERATIONS (continued)
Trust, Investment and Other Servicing Fees (continued)
The following table presents activity in consolidated AUM by product.
TABLE 12: ACTIVITY IN CONSOLIDATED ASSETS UNDER MANAGEMENT BY PRODUCT
|
|
|
|
|
|
|
|
|
|
|
|
|
|
|
|
|
|
|
|
|
|
|
THREE MONTHS ENDED |
| (In Billions) |
JUNE 30, 2626 |
MARCH 31, 2026 |
DECEMBER 31, 2025 |
SEPTEMBER 30, 2025 |
JUNE 30, 2025 |
| Beginning Balance of AUM |
$ |
1,784.9
|
|
$ |
1,803.2 |
|
$ |
1,772.7 |
|
$ |
1,697.7 |
|
$ |
1,607.8 |
|
| Net Inflows (Outflows) by Product |
|
|
|
|
|
|
Equities |
(4.6) |
|
(5.1) |
|
(8.7) |
|
(14.6) |
|
(25.2) |
|
|
Fixed Income |
2.1
|
|
1.1 |
|
0.8 |
|
4.2 |
|
(1.4) |
|
|
Cash and Other Assets |
22.5
|
|
9.5 |
|
5.6 |
|
15.3 |
|
12.4 |
|
|
Securities Lending Collateral |
23.3
|
|
8.2 |
|
1.7 |
|
0.6 |
|
14.9 |
|
| Net Inflows (Outflows) |
43.3
|
|
13.7 |
|
(0.6) |
|
5.5 |
|
0.7 |
|
|
|
|
|
|
|
|
|
|
|
|
|
|
|
|
|
|
|
|
|
| Total Market Performance, Currency & Other |
141.7
|
|
(32.0) |
|
31.1 |
|
69.5 |
|
89.2 |
|
| Ending Balance of AUM |
$ |
1,969.9
|
|
$ |
1,784.9 |
|
$ |
1,803.2 |
|
$ |
1,772.7 |
|
$ |
1,697.7 |
|
Other Noninterest Income
The components of Other Noninterest Income are provided below.
TABLE 13: OTHER NONINTEREST INCOME
|
|
|
|
|
|
|
|
|
|
|
|
|
|
|
|
|
|
|
|
|
|
|
|
|
|
|
|
THREE MONTHS ENDED JUNE 30, |
SIX MONTHS ENDED JUNE 30, |
| ($ In Millions) |
2026 |
2025 |
CHANGE |
2026 |
2025 |
CHANGE |
| Foreign Exchange Trading Income |
$ |
97.1
|
|
$ |
50.6 |
|
$ |
46.5 |
|
92 |
% |
$ |
184.8
|
|
$ |
109.3 |
|
$ |
75.5 |
|
69 |
% |
| Security Commissions and Trading Income |
55.6
|
|
39.6 |
|
16.0 |
|
40 |
|
107.7
|
|
78.7 |
|
29.0 |
|
37 |
|
Other Operating Income(1)
|
594.2
|
|
66.1 |
|
528.1 |
|
N/M |
664.7
|
|
126.4 |
|
538.3 |
|
N/M |
| Investment Security Gains (Losses), net |
(73.9) |
|
— |
|
— |
|
N/M |
(73.9) |
|
— |
|
(73.9) |
|
N/M |
| Total Other Noninterest Income |
$ |
673.0
|
|
$ |
156.3 |
|
$ |
516.7 |
|
N/M |
$ |
883.3
|
|
$ |
314.4 |
|
$ |
568.9 |
|
181% |
N/M - Not meaningful
(1) Beginning in Q1 2026, Treasury Management Fees are included within Other Operating Income. The prior period has been revised to conform to the current year presentation.
For the three and six months ended June 30, 2026, Foreign Exchange Trading Income increased compared to the prior-year quarter and prior-year period, primarily due to higher trading volumes driven by client activity and market volatility, particularly in Asia-Pacific markets.
For the three and six months ended June 30, 2026, Security Commissions and Trading Income increased compared to the prior-year quarter and prior-year period, primarily due to higher volumes as a result of market volatility and growth in outsourced trading activity.
For the three and six months ended June 30, 2026, Other Operating Income increased compared to the prior-year quarter and prior-year period, primarily due to a $525.4 million gain related to Northern Trust’s participation in the second Visa, Inc. Exchange Offer.
For the three and six months ended June 30, 2026 Investment Securities Gains (Losses), net reflects a $73.9 million loss on the sale of available for sale debt securities in the current quarter related to a repositioning of the securities portfolio.
Net Interest Income
Net Interest Income is defined as the total of Interest Income and amortized fees on earning assets, less Interest Expense on deposits and borrowed funds, adjusted for the impact of interest-related hedging activity. Earning assets—including Federal Funds Sold, Securities Purchased under Agreements to Resell, Interest-Bearing Due From and Deposits with Banks, Federal Reserve and Other Central Bank Deposits, Securities, Loans, and Other Interest-Earning Assets—are financed by a large base of interest-bearing liabilities that include client deposits, short-term borrowings, Senior Notes and Long-Term Debt. Short-term borrowings include Federal Funds Purchased, Securities Sold Under Agreements to Repurchase, and Other Borrowings. Earning assets are also funded by noninterest-bearing funds, which include demand deposits and stockholders’ equity. Net Interest Income is subject to variations in the level and mix of earning assets and interest-bearing funds and their relative sensitivity to interest rates. In addition, the levels of nonaccruing assets and client compensating deposit balances used to pay for services impact Net Interest Income.
Net interest margin is the difference between what we earn on our assets and what we pay for deposits and other sources of funding relative to average interest-earning assets. The direction and level of interest rates are important factors in our earnings. Net interest margin is calculated by dividing annualized Net Interest Income by average interest-earning assets.
CONSOLIDATED RESULTS OF OPERATIONS (continued)
Net Interest Income (continued)
Net Interest Income stated on a fully taxable equivalent (FTE) basis is a non-generally accepted accounting principle (GAAP) financial measure that facilitates the analysis of asset yields. Management believes an FTE presentation provides a clearer indication of net interest margins for comparative purposes. When adjusted to an FTE basis, yields on taxable, nontaxable, and partially taxable assets are comparable; however, the adjustment to an FTE basis has no impact on Net Income. A reconciliation of Net Interest Income on a GAAP basis to Net Interest Income on an FTE basis is provided in “Reconciliation to Fully Taxable Equivalent” within this MD&A.
The following tables present an analysis of average daily balances and interest rates changes affecting Net Interest Income and an analysis of Net Interest Income changes for the three months ended June 30, 2026 and three months ended June 30, 2025.
CONSOLIDATED RESULTS OF OPERATIONS (continued)
Net Interest Income (continued)
TABLE 14: AVERAGE CONSOLIDATED BALANCE SHEETS WITH ANALYSIS OF NET INTEREST INCOME
|
|
|
|
|
|
|
|
|
|
|
|
|
|
|
|
|
|
|
|
|
| (INTEREST AND RATE ON A FULLY TAXABLE EQUIVALENT BASIS) |
SECOND QUARTER |
| 2026 |
2025 |
| ($ In Millions) |
INTEREST |
AVERAGE BALANCE |
AVERAGE RATE(1)
|
INTEREST |
AVERAGE BALANCE |
AVERAGE RATE(1)
|
| Interest-Earning Assets |
|
|
|
|
|
|
| Federal Reserve and Other Central Bank Deposits |
$ |
328.8
|
|
$ |
38,322.9
|
|
3.44
|
% |
$ |
436.4 |
|
$ |
43,655.3 |
|
4.01 |
% |
Interest-Bearing Due from and Deposits with Banks(2)
|
18.2
|
|
6,304.2
|
|
1.16
|
|
21.8 |
|
5,321.5 |
|
1.64 |
|
Federal Funds Sold and Securities Purchased under Agreements to Resell (3)(4)
|
783.6
|
|
521.9
|
|
602.18
|
|
693.2 |
|
713.2 |
|
389.92 |
|
| Debt Securities |
|
|
|
|
|
|
| Available for Sale |
397.7
|
|
37,775.8
|
|
4.22
|
|
367.6 |
|
31,415.0 |
|
4.69 |
|
| Held to Maturity |
121.5
|
|
23,604.2
|
|
2.06
|
|
96.3 |
|
20,895.9 |
|
1.85 |
|
|
|
|
|
|
|
|
| Total Debt Securities |
519.2
|
|
61,380.0
|
|
3.39
|
|
463.9 |
|
52,310.9 |
|
3.56 |
|
| Loans |
517.4
|
|
41,567.6
|
|
4.99
|
|
576.9 |
|
41,158.0 |
|
5.62 |
|
Other Interest-Earning Assets(5)
|
29.7
|
|
3,194.6
|
|
3.73
|
|
25.3 |
|
2,663.1 |
|
3.81 |
|
| Total Interest-Earning Assets |
2,196.9
|
|
151,291.2
|
|
5.82
|
|
2,217.5 |
|
145,822.0 |
|
6.10 |
|
Cash and Due from Banks and Other Central Bank Deposits(6)
|
—
|
|
1,313.9
|
|
—
|
|
— |
|
1,069.8 |
|
—
|
|
| Other Noninterest-Earning Assets |
—
|
|
10,970.7
|
|
—
|
|
— |
|
10,827.4 |
|
—
|
|
| Total Assets |
$ |
—
|
|
$ |
163,575.8
|
|
—
|
% |
$ |
— |
|
$ |
157,719.2 |
|
— |
% |
| Average Source of Funds |
|
|
|
|
|
|
| Deposits |
|
|
|
|
|
|
| Savings, Money Market and Other |
$ |
208.5
|
|
$ |
32,356.8
|
|
2.58
|
% |
$ |
222.6 |
|
$ |
28,797.4 |
|
3.10 |
% |
| Savings Certificates and Other Time |
46.4
|
|
5,059.1
|
|
3.68
|
|
71.5 |
|
6,652.0 |
|
4.31 |
|
| Non-U.S. Offices — Interest-Bearing |
310.1
|
|
70,929.3
|
|
1.75
|
|
427.9 |
|
70,158.0 |
|
2.45 |
|
| Total Interest-Bearing Deposits |
565.0
|
|
108,345.2
|
|
2.09
|
|
722.0 |
|
105,607.4 |
|
2.74 |
|
| Federal Funds Purchased |
19.6
|
|
2,338.3
|
|
3.36
|
|
24.4 |
|
2,469.0 |
|
3.97 |
|
Securities Sold under Agreements to Repurchase(3)(7)
|
769.8
|
|
677.2
|
|
455.90
|
|
680.6 |
|
584.6 |
|
467.05 |
|
Other Borrowings(8)
|
79.9
|
|
8,255.7
|
|
3.88
|
|
80.4 |
|
7,008.2 |
|
4.60 |
|
| Senior Notes |
41.2
|
|
3,335.9
|
|
4.95
|
|
39.0 |
|
2,818.2 |
|
5.55 |
|
| Long-Term Debt |
38.3
|
|
2,856.9
|
|
5.38
|
|
55.9 |
|
4,087.8 |
|
5.48 |
|
|
|
|
|
|
|
|
| Total Interest-Bearing Liabilities |
1,513.8
|
|
125,809.2
|
|
4.83
|
|
1,602.3 |
|
122,575.2 |
|
5.24 |
|
| Interest Rate Spread |
—
|
|
—
|
|
0.99
|
|
— |
|
— |
|
0.86 |
|
| Demand and Other Noninterest-Bearing Deposits |
—
|
|
19,500.5
|
|
—
|
|
— |
|
16,770.4 |
|
— |
|
| Other Noninterest-Bearing Liabilities |
—
|
|
5,171.5
|
|
—
|
|
— |
|
5,761.5 |
|
— |
|
| Stockholders’ Equity |
—
|
|
13,094.6
|
|
—
|
|
— |
|
12,612.1 |
|
— |
|
| Total Liabilities and Stockholders’ Equity |
$ |
—
|
|
$ |
163,575.8
|
|
—
|
% |
$ |
— |
|
$ |
157,719.2 |
|
— |
% |
| Less: FTE Adjustment |
$ |
7.6
|
|
$ |
—
|
|
—
|
% |
$ |
4.7 |
|
$ |
— |
|
— |
% |
| Net Interest Income/Margin (Unadjusted) |
$ |
675.5
|
|
$ |
—
|
|
1.79
|
% |
$ |
610.5 |
|
$ |
— |
|
1.68 |
% |
Net Interest Income/Margin (FTE Adjusted)(9)
|
$ |
683.1
|
|
$ |
—
|
|
1.81
|
% |
$ |
615.2 |
|
$ |
— |
|
1.69 |
% |
(1) Rate calculations are based on actual balances rather than the rounded amounts presented in the table above.
(2) Interest-Bearing Due from and Deposits with Banks includes the interest-bearing component of Cash and Due from Banks and Interest-Bearing Deposits with Banks as presented on the consolidated balance sheets.
(3) Includes the impact of balance sheet netting under master netting arrangements of approximately $84.0 billion and $62.0 billion in 2026 and 2025, respectively, primarily related to our involvement in FICC. Northern Trust nets securities sold under repurchase agreements against those purchased under resale agreements when the GAAP requirements to net are met.
(4) Excluding the impact of netting, the average interest rate on Federal Funds Sold and Securities Purchased under Agreements to Resell would be approximately 3.72% and 4.43% in 2026 and 2025, respectively. It includes balances and rates for FICC reverse repurchase agreements, Non-FICC reverse repurchase agreements and federal funds sold of ($84.1 billion / 3.72%), ($0.4 billion / 4.04%), and ($0.8 million / 3.85%) for 2026 and ($62.1 billion / 4.45%), ($0.7 billion / 2.88%), and ($1.1 million / 4.61%) for 2025, respectively.
(5) Other Interest-Earning Assets include certain community development investments, collateral deposits with certain securities depositories and clearing houses, Federal Home Loan Bank and Federal Reserve stock, and money market investments which are classified in Other Assets on the consolidated balance sheets.
(6) Cash and Due from Banks and Other Central Bank Deposits includes the noninterest-bearing component of Federal Reserve and Other Central Bank Deposits on the consolidated balance sheets.
(7) Excluding the impact of netting, the average interest rate on Securities Sold under Agreements to Repurchase would be approximately 3.65% and 4.36% in 2026 and 2025, respectively. It includes balances and rates for FICC repurchase agreements and Non-FICC repurchase agreements of ($84.0 billion / 3.65%) and ($0.7 billion / 3.41%) for 2026 and ($62.0 billion / 4.36%) and ($0.6 billion / 4.17%) for 2025, respectively.
(8) Other Borrowings primarily includes advances from the Federal Home Loan Bank of Chicago.
(9) A reconciliation of Net Interest Income on a GAAP basis to Net Interest Income on an FTE basis is provided in “Supplemental Information—Reconciliation to Fully Taxable Equivalent” within this “Management’s Discussion and Analysis of Financial Condition and Results of Operations” section.
CONSOLIDATED RESULTS OF OPERATIONS (continued)
Net Interest Income (continued)
Net Interest Income for the three months ended June 30, 2026, stated on an FTE basis, increased from the prior-year quarter, primarily driven by higher deposits and lower funding costs.
The net interest margin on an FTE basis increased from the prior-year quarter, primarily driven by lower funding costs.
Interest-earning deposits includes Federal Reserve and Other Central Bank Deposits and Interest-Bearing Due from and Deposits with Banks. Average interest-earning deposits decreased 9%, from the prior-year quarter, primarily driven by strategic purchases in the securities portfolio.
Average Securities increased 17% from the prior-year quarter, reflecting strategic purchases of investment securities, primarily in the AFS portfolio. Average taxable Securities were $53.4 billion in the current quarter and $44.0 billion in the prior-year quarter. Average nontaxable Securities, which represent securities that are primarily exempt from U.S. federal and state income taxes, were $8.0 billion in the current quarter and $8.3 billion in the prior-year quarter. For additional discussion relating to the securities portfolio, refer to the “Asset Quality” section in this MD&A and to Note 4-Securities to the consolidated financial statements provided in Item 1. Consolidated Financial Statements (unaudited).
Average Loans of $41.6 billion increased 1% compared to the prior-year quarter, primarily driven by an increase in short term advances, primarily related to the processing of custodied client investments, and Subscription Finance loans, partially offset by a decrease in Commercial and Institutional loans. For additional discussion relating to the revised loan classes within the Commercial loan segment, refer to Note 5- Loans to the consolidated financial statements provided in Item 1. Consolidated Financial Statements (unaudited).
Average Other Interest-Earning Assets includes collateral deposits with certain securities depositories and clearing houses, certain community development investments, Federal Home Loan Bank stock, a money market investment, and Federal Reserve stock of $1.7 billion, $986.1 million, $342.7 million, $101.8 million, and $69.1 million, respectively, which are recorded in Other Assets on the consolidated balance sheets.
Average Interest-Bearing Deposits increased 3% from the prior-year quarter, primarily due to increased liquidity and client activity as a result of market volatility and growth across institutional and personal clients. Average Non-U.S. Offices Interest-Bearing Deposits comprised 65% and 66% of total average Interest-Bearing Deposits for the three months ended June 30, 2026 and 2025, respectively.
CONSOLIDATED RESULTS OF OPERATIONS (continued)
Net Interest Income (continued)
The following tables present an analysis of average daily balances and interest rate changes affecting Net Interest Income and an analysis of Net Interest Income changes for the six months ended June 30, 2026.
TABLE 15: AVERAGE CONSOLIDATED BALANCE SHEETS WITH ANALYSIS OF NET INTEREST INCOME
|
|
|
|
|
|
|
|
|
|
|
|
|
|
|
|
|
|
|
|
|
| (INTEREST AND RATE ON A FULLY TAXABLE EQUIVALENT BASIS) |
SIX MONTHS ENDED JUNE 30, |
| 2026 |
2025 |
| ($ In Millions) |
INTEREST |
AVERAGE BALANCE |
AVERAGE
RATE(1)
|
INTEREST |
AVERAGE BALANCE |
AVERAGE
RATE(7)
|
| Interest-Earning Assets |
|
|
|
|
|
|
| Federal Reserve and Other Central Bank Deposits |
$ |
692.3
|
|
$ |
40,427.1
|
|
3.45
|
% |
$ |
816.4 |
|
$ |
40,426.1 |
|
4.07 |
% |
Interest-Bearing Due from and Deposits with Banks(2)
|
37.7
|
|
6,160.2
|
|
1.23
|
|
45.2 |
|
5,100.7 |
|
1.79 |
|
Federal Funds Sold and Securities Purchased under Agreements to Resell (3)(4)
|
1,610.5
|
|
852.5
|
|
380.96
|
|
1,380.0 |
|
554.7 |
|
501.67 |
|
| Debt Securities |
|
|
|
|
|
|
| Available for Sale |
766.2
|
|
36,783.6
|
|
4.20
|
|
719.7 |
|
30,795.1 |
|
4.71 |
|
| Held to Maturity |
242.2
|
|
23,743.0
|
|
2.06
|
|
200.9 |
|
21,356.3 |
|
1.90 |
|
|
|
|
|
|
|
|
| Total Debt Securities |
1,008.4
|
|
60,526.6
|
|
3.36
|
|
920.6 |
|
52,151.4 |
|
3.56 |
|
| Loans |
1,029.9
|
|
41,232.8
|
|
5.04
|
|
1,152.5 |
|
41,117.4 |
|
5.65 |
|
Other Interest-Earning Assets(5)
|
59.8
|
|
3,278.5
|
|
3.68
|
|
49.3 |
|
2,586.2 |
|
3.85 |
|
| Total Interest-Earning Assets |
4,438.6
|
|
152,477.7
|
|
5.87
|
|
4,364.0 |
|
141,936.5 |
|
6.20 |
|
Cash and Due from Banks and Other Central Bank Deposits(6)
|
—
|
|
1,225.9
|
|
—
|
|
— |
|
1,055.6 |
|
— |
|
| Other Noninterest-Earning Assets |
—
|
|
10,728.2
|
|
—
|
|
— |
|
11,019.2 |
|
— |
|
| Total Assets |
$ |
—
|
|
$ |
164,431.8
|
|
—
|
% |
$ |
— |
|
$ |
154,011.3 |
|
— |
% |
| Average Source of Funds |
|
|
|
|
|
|
| Deposits |
|
|
|
|
|
|
| Savings, Money Market and Other |
$ |
394.0
|
|
$ |
30,809.5
|
|
2.58
|
% |
$ |
435.3 |
|
$ |
28,261.9 |
|
3.11 |
% |
| Savings Certificates and Other Time |
101.6
|
|
5,420.1
|
|
3.78
|
|
147.4 |
|
6,762.4 |
|
4.40 |
|
| Non-U.S. Offices — Interest-Bearing |
661.3
|
|
73,083.6
|
|
1.82
|
|
841.2 |
|
67,321.9 |
|
2.52 |
|
| Total Interest-Bearing Deposits |
1,156.9
|
|
109,313.2
|
|
2.13
|
|
1,423.9 |
|
102,346.2 |
|
2.81 |
|
| Federal Funds Purchased |
40.9
|
|
2,456.9
|
|
3.36
|
|
48.0 |
|
2,431.5 |
|
3.98 |
|
Securities Sold under Agreements to Repurchase(3)(7)
|
1,574.2
|
|
581.0
|
|
546.37
|
|
1,353.8 |
|
513.9 |
|
531.30 |
|
Other Borrowings(8)
|
155.4
|
|
7,948.7
|
|
3.94
|
|
160.1 |
|
7,016.2 |
|
4.60 |
|
| Senior Notes |
82.3
|
|
3,344.3
|
|
4.96
|
|
77.8 |
|
2,800.0 |
|
5.60 |
|
| Long-Term Debt |
84.2
|
|
3,163.1
|
|
5.37
|
|
111.5 |
|
4,085.7 |
|
5.50 |
|
| Total Interest-Related Funds |
3,093.9
|
|
126,807.2
|
|
4.92
|
|
3,175.1 |
|
119,193.5 |
|
5.37 |
|
| Interest Rate Spread |
—
|
|
—
|
|
0.95
|
|
— |
|
— |
|
0.83 |
|
| Demand and Other Noninterest-Bearing Deposits |
—
|
|
19,122.2
|
|
—
|
|
— |
|
16,820.1 |
|
— |
|
| Other Noninterest-Bearing Liabilities |
—
|
|
5,573.6
|
|
—
|
|
— |
|
5,389.6 |
|
— |
|
| Stockholders’ Equity |
—
|
|
12,928.8
|
|
—
|
|
— |
|
12,608.1 |
|
— |
|
| Total Liabilities and Stockholders’ Equity |
$ |
—
|
|
$ |
164,431.8
|
|
—
|
% |
$ |
— |
|
$ |
154,011.3 |
|
— |
% |
| Less: FTE Adjustment |
$ |
15.2
|
|
$ |
—
|
|
—
|
% |
$ |
10.3 |
|
$ |
— |
|
— |
% |
| Net Interest Income/Margin (Unadjusted) |
$ |
1,329.5
|
|
$ |
—
|
|
1.76
|
% |
$ |
1,178.6 |
|
$ |
— |
|
1.67 |
% |
Net Interest Income/Margin (FTE Adjusted)(9)
|
$ |
1,344.7
|
|
$ |
—
|
|
1.78
|
% |
$ |
1,188.9 |
|
$ |
— |
|
1.69 |
% |
(1) Rate calculations are based on actual balances rather than the rounded amounts presented in the table above.
(2) Interest-Bearing Due from and Deposits with Banks includes the interest-bearing component of Cash and Due from Banks and Interest-Bearing Deposits with Banks as presented on the consolidated balance sheets.
(3) Includes the impact of balance sheet netting under master netting arrangements of approximately $86.0 billion and $62.0 billion in 2026 and 2025, respectively, primarily related to our involvement in FICC. Northern Trust nets securities sold under repurchase agreements against those purchased under resale agreements when the GAAP requirements to net are met.
(4) Excluding the impact of netting, the average interest rate on Federal Funds Sold and Securities Purchased under Agreements to Resell would be approximately 3.74% and 4.45% in 2026 and 2025, respectively. It includes balances and rates for FICC reverse repurchase agreements, Non-FICC reverse repurchase agreements and federal funds sold of ($86.1 billion / 3.74%), ($0.8 billion / 3.31%), and ($0.6 million / 3.85%) for 2026 and ($62.1 billion / 4.45%), ($0.5 billion / 3.36%), and ($1.2 million / 4.61%) for 2025, respectively.
(5) Other Interest-Earning Assets include certain community development investments, collateral deposits with certain securities depositories and clearing houses, Federal Home Loan Bank and Federal Reserve stock, and money market investments which are classified in Other Assets on the consolidated balance sheets.
(6) Cash and Due from Banks and Other Central Bank Deposits includes the noninterest-bearing component of Federal Reserve and Other Central Bank Deposits on the consolidated balance sheets.
(7) Excluding the impact of netting, the average interest rate on Securities Sold under Agreements to Repurchase would be approximately 3.67% and 4.36%, in 2026 and 2025, respectively. It includes balances and rates for FICC repurchase agreements and Non-FICC repurchase agreements of ($86.0 billion / 3.67%) and ($0.6 billion / 3.38%) for 2026 and ($62.0 billion / 4.37%) and ($0.5 billion / 4.14%) for 2025, respectively.
(8) Other Borrowings primarily includes advances from the Federal Home Loan Bank of Chicago.
(9) A reconciliation of Net Interest Income on a GAAP basis to Net Interest Income on an FTE basis is provided in “Reconciliation to Fully Taxable Equivalent” within this “Management’s Discussion and Analysis of Financial Condition and Results of Operations” section.
CONSOLIDATED RESULTS OF OPERATIONS (continued)
Net Interest Income (continued)
Net Interest Income for the six months ended June 30, 2026, stated on an FTE basis, increased from the prior-year period, primarily driven by higher deposits levels and lower funding costs, partially offset by lower asset yields.
The net interest margin on an FTE basis increased from the prior-year period, primarily driven by lower funding costs, partially offset by lower yields on interest-earning assets.
Interest-earning deposits includes Federal Reserve and Other Central Bank Deposits and Interest-Bearing Due from and Deposits with Banks. Average interest-earning deposits increased 2% from the prior-year period, primarily driven by higher client deposits.
Average Securities increased 16%, from the prior-year period reflecting strategic purchases of investment securities primarily in the AFS portfolio. Average taxable Securities were $52.4 billion in the current period and $44.0 billion in the prior-year period. Average nontaxable Securities, which represent securities that are primarily exempt from U.S. federal and state income taxes, were $8.1 billion in the current period and $8.2 billion in the prior-year period. For additional discussion relating to the securities portfolio, refer to the “Asset Quality” section in this MD&A and to Note 4-Securities to the consolidated financial statements provided in Item 1. Consolidated Financial Statements (unaudited).
Average Loans was relatively flat compared the prior-year period as an increase in short term advances, primarily related to the processing of custodied client investments, was partially offset by a decrease in Commercial and Institutional loans and Private Client loans.
Average Other Interest-Earning Assets includes collateral deposits with certain securities depositories and clearing houses, certain community development investments, Federal Home Loan Bank stock, a money market investment, and Federal Reserve stock of $1.8 billion, $1.0 billion, $342.7 million, $93.4 million, and $69.1 million respectively, which are recorded in Other Assets on the consolidated balance sheets.
Average Interest-Bearing Deposits increased 7% from the prior-year period, primarily due to increased client activity and higher liquidity as a result of market volatility and growth across institutional and personal clients. Average non-U.S. offices interest-bearing deposits comprised 67% and 66% of total average interest-bearing deposits for the six months ended June 30, 2026 and 2025, respectively.
CONSOLIDATED RESULTS OF OPERATIONS (continued)
Net Interest Income (continued)
TABLE 16: ANALYSIS OF NET INTEREST INCOME CHANGES DUE TO VOLUME AND RATE QTD(1)
|
|
|
|
|
|
|
|
|
|
|
|
| (INTEREST AND RATE ON A FULLY TAXABLE EQUIVALENT BASIS) |
THREE MONTHS ENDED JUNE 30, 2026 VS. 2025 |
|
CHANGE DUE TO |
|
| (In Millions) |
AVERAGE BALANCE |
AVERAGE RATE |
NET (DECREASE) INCREASE |
| Increase (Decrease) in Net Interest Income (FTE) |
|
|
|
| Federal Reserve and Other Central Bank Deposits |
$ |
(49.4) |
|
$ |
(58.2) |
|
$ |
(107.6) |
|
| Interest-Bearing Due from and Deposits with Banks |
3.6
|
|
(7.2) |
|
(3.6) |
|
Federal Funds Sold and Securities Purchased under Agreements to Resell (2)
|
220.9
|
|
(130.5) |
|
90.4
|
|
| Debt Securities |
|
|
|
| Available for Sale |
69.7
|
|
(39.6) |
|
30.1
|
|
| Held to Maturity |
13.5
|
|
11.7
|
|
25.2
|
|
|
|
|
|
| Total Debt Securities |
83.2
|
|
(27.9) |
|
55.3
|
|
| Loans |
5.7
|
|
(65.2) |
|
(59.5) |
|
| Other Interest-Earning Assets |
4.9
|
|
(0.5) |
|
4.4
|
|
| Total Interest Income |
$ |
268.9
|
|
$ |
(289.5) |
|
$ |
(20.6) |
|
|
|
|
|
| Interest-Bearing Deposits |
|
|
|
| Savings, Money Market and Other |
$ |
25.9
|
|
$ |
(40.0) |
|
$ |
(14.1) |
|
| Savings Certificates and Other Time |
(15.5) |
|
(9.6) |
|
(25.1) |
|
| Non-U.S. Offices - Interest-Bearing |
4.7
|
|
(122.5) |
|
(117.8) |
|
| Total Interest-Bearing Deposits |
15.1
|
|
(172.1) |
|
(157.0) |
|
| Federal Funds Purchased |
(1.2) |
|
(3.6) |
|
(4.8) |
|
Securities Sold under Agreements to Repurchase (2)
|
220.8
|
|
(131.6) |
|
89.2
|
|
| Other Borrowings |
13.3
|
|
(13.8) |
|
(0.5) |
|
| Senior Notes |
6.7
|
|
(4.5) |
|
2.2
|
|
| Long-Term Debt |
(16.6) |
|
(1.0) |
|
(17.6) |
|
|
|
|
|
| Total Interest Expense |
$ |
238.1
|
|
$ |
(326.6) |
|
$ |
(88.5) |
|
| Increase in Net Interest Income (FTE) |
$ |
30.8
|
|
$ |
37.1
|
|
$ |
67.9
|
|
(1)Changes not due solely to average balance changes or rate changes are allocated proportionately to average balance and rate based on their relative absolute magnitudes.
(2)Changes due to average balance and average rate exclude the impact of balance sheet netting noted in Table 14: Average Consolidated Balance Sheets with Analysis of Net Interest Income.
Notes: Net Interest Income (FTE adjusted), a non-GAAP financial measure, includes adjustments to a fully taxable equivalent basis for Loans, Securities and Other Interest-Earning assets. The adjustments are based on a federal income tax rate of 21.0%, where the rate is adjusted for applicable state income taxes, net of related federal tax benefit. See Table 14: Average Consolidated Balance Sheets with Analysis of Net Interest Income which reflects the applied FTE adjustment. A reconciliation of Net Interest Income and net interest margin on a GAAP basis to Net Interest Income and net interest margin on an FTE basis (each of which is a non-GAAP financial measure) is provided in “Reconciliation to Fully Taxable Equivalent” within this MD&A. Net interest margin is calculated by dividing annualized net interest income by average interest-earning assets.
Interest revenue on cash collateral positions is reported above within Interest-Bearing Due from and Deposits with Banks, Loans and within Other Interest-Earning Assets. Interest expense on cash collateral positions is reported above within Savings, Money Market and Other and in Non-U.S. Offices Interest-Bearing Deposits. Related cash collateral received from and deposited with derivative counterparties is recorded net of the associated derivative contract in Other Assets and Other Liabilities, respectively.
CONSOLIDATED RESULTS OF OPERATIONS (continued)
Net Interest Income (continued)
TABLE 17: ANALYSIS OF NET INTEREST INCOME CHANGES DUE TO VOLUME AND RATE YTD(1)
|
|
|
|
|
|
|
|
|
|
|
|
| (INTEREST AND RATE ON A FULLY TAXABLE EQUIVALENT BASIS) |
SIX MONTHS ENDED JUNE 30, 2026 vs. 2025 |
|
CHANGE DUE TO |
|
| (In Millions) |
AVERAGE BALANCE |
AVERAGE
RATE |
NET (DECREASE) INCREASE |
| Increase (Decrease) in Net Interest Income (FTE) |
|
|
|
| Federal Reserve and Other Central Bank Deposits |
$ |
—
|
|
$ |
(124.1) |
|
$ |
(124.1) |
|
| Interest-Bearing Due from and Deposits with Banks |
8.3
|
|
(15.8) |
|
(7.5) |
|
Federal Funds Sold and Securities Purchased under Agreements to Resell (2)
|
487.3
|
|
(256.8) |
|
230.5
|
|
| Debt Securities |
|
|
|
| Available for Sale |
129.6
|
|
(83.1) |
|
46.5
|
|
| Held to Maturity |
23.5
|
|
17.8
|
|
41.3
|
|
|
|
|
|
| Total Debt Securities |
153.1
|
|
(65.3) |
|
87.8
|
|
| Loans |
3.1
|
|
(125.7) |
|
(122.6) |
|
| Other Interest-Earning Assets |
12.7
|
|
(2.2) |
|
10.5
|
|
| Total Interest Income |
$ |
664.5
|
|
$ |
(589.9) |
|
$ |
74.6
|
|
|
|
|
|
| Interest-Bearing Deposits |
|
|
|
| Savings, Money Market and Other |
$ |
37.3
|
|
$ |
(78.6) |
|
$ |
(41.3) |
|
| Savings Certificates and Other Time |
(26.6) |
|
(19.2) |
|
(45.8) |
|
| Non-U.S. Offices - Interest-Bearing |
73.9
|
|
(253.8) |
|
(179.9) |
|
| Total Interest-Bearing Deposits |
84.6
|
|
(351.6) |
|
(267.0) |
|
| Federal Funds Purchased |
0.5
|
|
(7.6) |
|
(7.1) |
|
Securities Sold under Agreements to Repurchase (2)
|
464.5
|
|
(244.1) |
|
220.4
|
|
| Other Borrowings |
19.9
|
|
(24.6) |
|
(4.7) |
|
| Senior Notes |
14.1
|
|
(9.6) |
|
4.5
|
|
| Long-Term Debt |
(24.7) |
|
(2.6) |
|
(27.3) |
|
|
|
|
|
| Total Interest Expense |
$ |
558.9
|
|
$ |
(640.1) |
|
$ |
(81.2) |
|
| Increase in Net Interest Income (FTE) |
$ |
105.6
|
|
$ |
50.2
|
|
$ |
155.8
|
|
(1) Changes not due solely to average balance changes or rate changes are allocated proportionately to average balance and rate based on their relative absolute magnitudes.
(2) Changes due to average balance and average rate exclude the impact of balance sheet netting noted in Table 20: Average Consolidated Balance Sheets with Analysis of Net Interest Income.
Notes: Net Interest Income (FTE Adjusted), a non-GAAP financial measure, includes adjustments to a fully taxable equivalent basis for Loans, Securities and Other Interest-Earning assets. The adjustments are based on a federal income tax rate of 21.0%, where the rate is adjusted for applicable state income taxes, net of related federal tax benefit. See Table 16: Average Consolidated Balance Sheets with Analysis of Net Interest Income which reflects the applied FTE adjustment. A reconciliation of Net Interest Income and net interest margin on a GAAP basis to Net Interest Income and net interest margin on an FTE basis (each of which is a non-GAAP financial measure) is provided in “Reconciliation to Fully Taxable Equivalent” within this MD&A. Net interest margin is calculated by dividing annualized net interest income by average interest-earning assets.
Interest revenue on cash collateral positions is reported above within Interest-Bearing Due from and Deposits with Banks, Loans and within Other Interest-Earning Assets. Interest expense on cash collateral positions is reported above within Savings, Money Market and Other and in Non-U.S. Offices Interest-Bearing Deposits. Related cash collateral received from and deposited with derivative counterparties is recorded net of the associated derivative contract in Other Assets and Other Liabilities, respectively.
SECOND QUARTER CONSOLIDATED RESULTS OF OPERATIONS (continued)
Provision for Credit Losses
For the three and six months ended June 30, 2026, there was a negative Provision for Credit Losses of $5.3 million and $8.3 million, respectively. The negative provision in the current quarter resulted from a decrease in the collective reserve, partially offset by an increase in individual reserves. The decrease in the collective reserve was primarily driven by a strengthening macroeconomic outlook and improved credit quality for the Commercial Real Estate (CRE) and Commercial and Institutional (C&I) portfolios. The increase in the individual reserve was driven by a small number of non-performing loans. The negative provision in the current-year period was primarily in the C&I portfolio, driven by a strengthening macroeconomic outlook and improved credit quality; partially offset by an increase in specific reserves related to a small number of non-performing loans. Net recoveries in the current quarter were $0.4 million, reflecting $0.6 million of recoveries and $0.2 million of charge-offs. Net recoveries in the current-year period were $0.3 million, reflecting $0.9 million of recoveries and $0.6 million of charge-offs.
For the three and six months ended June 30, 2025, the Provision for Credit Losses was $16.5 million and $17.5 million, respectively. The provision for both periods resulted from an increase in specific reserves related to a small number of non-performing loans and an increase in the collective reserve resulting primarily from a worsening macroeconomic outlook, partially offset by sector and portfolio-specific improvements within the CRE portfolio. The prior-year quarter included $0.3 million net recoveries, reflecting $0.4 million of recoveries and $0.1 million of charge-offs. The prior-year period included $0.5 million net recoveries, reflecting $0.9 million of recoveries and $0.4 million of charge-offs.
For additional discussion of the allowance for credit losses, refer to the “Asset Quality” section in this MD&A.
Noninterest Expense
The components of Noninterest Expense are provided in the following table.
TABLE 18: NONINTEREST EXPENSE
|
|
|
|
|
|
|
|
|
|
|
|
|
|
|
|
|
|
|
|
|
|
|
|
|
|
|
|
THREE MONTHS ENDED JUNE 30, |
SIX MONTHS ENDED JUNE 30, |
| ($ In Millions) |
2026 |
2025 |
CHANGE |
2026 |
2025 |
CHANGE |
| Compensation and Benefits |
$ |
868.0
|
|
$ |
732.5 |
|
$ |
135.5 |
|
18 |
% |
$ |
1,690.2
|
|
$ |
1,486.6 |
|
$ |
203.6 |
|
14 |
% |
| Outside Services |
246.3
|
|
247.0 |
|
(0.7) |
|
— |
|
483.0
|
|
492.2 |
|
(9.2) |
|
(2) |
|
| Equipment and Software |
378.5
|
|
293.7 |
|
84.8 |
|
29 |
|
686.6
|
|
574.6 |
|
112.0 |
|
19 |
|
| Occupancy |
53.5
|
|
52.5 |
|
1.0 |
|
2 |
|
104.8
|
|
105.9 |
|
(1.1) |
|
(1) |
|
| Other Operating Expense |
92.3
|
|
90.9 |
|
1.4 |
|
2 |
|
182.0
|
|
174.9 |
|
7.1 |
|
4 |
|
| Total Noninterest Expense |
$ |
1,638.6
|
|
$ |
1,416.6
|
|
$ |
222.0 |
|
16 |
% |
$ |
3,146.6
|
|
$ |
2,834.2 |
|
$ |
312.4 |
|
11 |
% |
For the three and six months ended June 30, 2026 Compensation and Benefits expense, the largest component of Noninterest Expense, increased compared to the prior-year quarter and prior year period, primarily due to the current quarter severance charge of $51.0 million, higher incentives, the $33.1 million Invested as One equity grant to eligible employees, annual base pay adjustments and an increase in pension expense.
For the three and six months ended June 30, 2026 Equipment and Software expense increased compared to the prior-year quarter and the prior year period, primarily due to software dispositions of $61.5 million in the current quarter, higher software support and higher amortization.
Provision for Income Taxes
Income tax expense for the three months ended June 30, 2026 was $272.5 million, representing an effective tax rate of 25.6%, compared to $143.5 million in the prior-year quarter, representing an effective tax rate of 25.4%.
Income tax expense for the six months ended June 30, 2026 was $447.6 million, representing an effective tax rate of 25.4%, compared to $272.9 million in the prior-year period, representing an effective tax rate of 25.1%.
REPORTING SEGMENTS
Northern Trust is organized around its two client-focused reporting segments: Asset Servicing and Wealth Management. Asset management and related services are provided to Asset Servicing and Wealth Management clients primarily by the Asset Management business. The revenue and expenses of Asset Management and certain other support functions are allocated fully to Asset Servicing and Wealth Management.
Reporting segment financial information, presented on an internal management-reporting basis, is determined by accounting systems used to allocate revenue and expense to each segment, and incorporates processes for allocating assets, liabilities, equity and the applicable interest income and expense utilizing an FTP methodology. Under the methodology, assets and
REPORTING SEGMENTS (continued)
liabilities receive a funding charge or credit that considers interest rate risk, liquidity risk, and other product characteristics on an instrument level. Additionally, segment information is presented on an FTE basis as management believes an FTE presentation provides a clearer indication of net interest income. Income before Income Taxes on an FTE basis is the measure of segment profit or loss reviewed by the Chief Operating Decision Maker for purposes of assessing performance and allocating resources. The adjustment to an FTE basis has no impact on Net Income.
Revenues, expenses and average assets are allocated to Asset Servicing and Wealth Management, with the exception of non-recurring activities such as certain corporate transactions and costs incurred associated with acquisitions, divestitures, litigation, restructuring, and tax adjustments not directly attributable to a specific reporting segment, which are reported within Other.
In addition to income and expenses associated with non-recurring activities, Other includes expenses for the Enterprise Chief Operating Office, Asset Management, corporate and other support functions not directly incurred by, but ultimately allocated back to Asset Servicing and Wealth Management. Other also includes the FTE adjustments of $7.6 million and $15.2 million for the three and six months ended June 30, 2026, respectively, and $4.7 million and $10.3 million for the three and six months ended June 30, 2025, respectively, in order to reconcile the segment results that are reported on an internal management-reporting basis into consolidated results.
Reporting segment results are subject to reclassification when organizational changes are made. The results are also subject to refinements in revenue and expense allocation methodologies, which are typically reflected on a retrospective basis unless it is impractical to do so.
For further details, please refer to Note 9—Reporting Segments to the consolidated financial statements provided in Item 1. Consolidated Financial Statements (unaudited).
The following table presents the earnings contributions and average assets of Northern Trust’s reporting segments for the three- and six- month periods ended June 30, 2026 and 2025.
TABLE 19: RESULTS OF REPORTING SEGMENTS
|
|
|
|
|
|
|
|
|
|
|
|
|
|
|
|
|
|
|
|
|
|
|
|
|
|
|
| ($ In Millions) |
ASSET SERVICING(3)
|
WEALTH MANAGEMENT(3)
|
OTHER(4)
|
TOTAL CONSOLIDATED |
| THREE MONTHS ENDED JUNE 30, |
2026 |
2025 |
2026 |
2025 |
2026 |
2025 |
2026 |
2025 |
| Noninterest Income |
|
|
|
|
|
|
|
|
| Trust, Investment and Other Servicing Fees |
$ |
757.4 |
$ |
691.8 |
$ |
592.1 |
$ |
539.3 |
$ |
— |
$ |
— |
$ |
1,349.5 |
$ |
1,231.1 |
| Foreign Exchange Trading Income (Loss) |
98.9 |
61.0 |
(1.8) |
(10.4) |
— |
— |
97.1 |
50.6 |
| Other Noninterest Income |
89.3 |
70.6 |
35.8 |
34.6 |
450.8 |
0.5 |
575.9 |
105.7 |
| Total Noninterest Income |
945.6 |
823.4 |
626.1 |
563.5 |
450.8 |
0.5 |
2,022.5 |
1,387.4 |
Net Interest Income (Expense)(1)
|
416.1 |
347.2 |
265.3 |
268.3 |
(5.9) |
(5.0) |
675.5 |
610.5 |
Revenue(1)
|
1,361.7 |
1,170.6 |
891.4 |
831.8 |
444.9 |
(4.5) |
2,698.0 |
1,997.9 |
| Provision for Credit Losses |
(2.7) |
3.9 |
(1.6) |
11.2 |
(1.0) |
1.4 |
(5.3) |
16.5 |
| Noninterest Expense |
|
|
|
|
|
|
|
|
| Compensation and Benefits |
111.7 |
90.9 |
176.3 |
163.6 |
580.0 |
478.0 |
868.0 |
732.5 |
| Outside Services |
31.4 |
43.5 |
13.6 |
17.0 |
201.3 |
186.5 |
246.3 |
247.0 |
| Allocated Expense |
875.3 |
741.5 |
348.6 |
306.7 |
(1,223.9) |
(1,048.2) |
— |
— |
Other Segment Items(2)
|
22.7 |
19.4 |
21.0 |
23.7 |
480.6 |
394.0 |
524.3 |
437.1 |
| Total Noninterest Expense |
1,041.1 |
895.3 |
559.5 |
511.0 |
38.0 |
10.3 |
1,638.6 |
1,416.6 |
Income (Loss) before Income Taxes(1)
|
323.3 |
271.4 |
333.5 |
309.6 |
407.9 |
(16.2) |
1,064.7 |
564.8 |
Provision for Income Taxes(1)
|
72.9 |
58.2 |
83.2 |
75.6 |
116.4 |
9.7 |
272.5 |
143.5 |
| Net Income (Loss) |
$ |
250.4 |
$ |
213.2 |
$ |
250.3 |
$ |
234.0 |
$ |
291.5 |
$ |
(25.9) |
$ |
792.2 |
$ |
421.3 |
| Percentage of Consolidated Net Income |
32
|
% |
51 |
% |
32% |
56 |
% |
36
|
% |
(7) |
% |
100
|
% |
100 |
% |
| Average Assets |
$ |
123,994.6 |
$ |
117,044.6 |
$ |
39,431.2 |
$ |
39,094.5 |
$ |
150.0 |
$ |
1,580.1 |
$ |
163,575.8 |
$ |
157,719.2 |
| Average Loans |
$ |
5,800.6 |
$ |
5,812.8 |
$ |
35,767.0 |
$ |
35,345.2 |
$ |
— |
$ |
— |
$ |
41,567.6 |
$ |
41,158.0 |
| Average Deposits |
$ |
100,980.6 |
$ |
95,506.7 |
$ |
26,715.1 |
$ |
25,291.0 |
$ |
150.0 |
$ |
1,580.1 |
$ |
127,845.7 |
$ |
122,377.8 |
(1) Financial measures stated on an FTE basis. The FTE adjustment was $7.6 million and $4.7 million for the three months ended June 30, 2026 and 2025, respectively, and is eliminated within “Other” in order for “Total Consolidated” to reconcile with the Consolidated Statement of Income.
(2) Other Segment Items include Occupancy, Equipment & Software and Other Operating Expense.
(3) The current quarter charges related to software dispositions and severance are included in the Reporting Segments with $100.6 million recorded to Asset Servicing and $11.9 million recorded to Wealth Management.
(4) Other includes the current quarter $525.4 million gain related to Northern Trust's participation in the second Visa Exchange Offer, the $73.9 million loss on available for sale debt securities sold in conjunction with a repositioning of the portfolio, and the $33.1 million Invested as One equity grant to eligible employees.
REPORTING SEGMENTS (continued)
|
|
|
|
|
|
|
|
|
|
|
|
|
|
|
|
|
|
|
|
|
|
|
|
|
|
|
|
|
|
|
|
|
|
|
|
| (In Millions) |
ASSET SERVICING(3)
|
WEALTH MANAGEMENT(3)
|
OTHER(4)
|
TOTAL CONSOLIDATED |
| SIX MONTHS ENDED JUNE 30, |
2026 |
2025 |
2026 |
2025 |
2026 |
2025 |
2026 |
2025 |
| Noninterest Income |
|
|
|
|
|
|
|
|
| Trust, Investment and Other Servicing Fees |
$ |
1,497.9 |
$ |
1,363.7 |
$ |
1,193.0 |
$ |
1,081.2 |
$ |
— |
$ |
— |
$ |
2,690.9 |
$ |
2,444.9 |
| Foreign Exchange Trading Income (Loss) |
189.9 |
124.9 |
(5.1) |
(15.6) |
— |
— |
184.8 |
109.3 |
| Other Noninterest Income (Loss) |
174.2 |
139.2 |
69.7 |
68.1 |
454.6 |
(2.2) |
698.5 |
205.1 |
| Total Noninterest Income (Loss) |
1,862.0 |
1,627.8 |
1,257.6 |
1,133.7 |
454.6 |
(2.2) |
3,574.2 |
2,759.3 |
Net Interest Income (Expense)(1)
|
817.8 |
670.9 |
524.8 |
518.4 |
(13.1) |
(10.7) |
1,329.5 |
1,178.6 |
Revenue(1)
|
2,679.8 |
2,298.7 |
1,782.4 |
1,652.1 |
441.5 |
(12.9) |
4,903.7 |
3,937.9 |
| Provision for Credit Losses |
(5.0) |
6.0 |
— |
10.3 |
(3.3) |
1.2 |
(8.3) |
17.5 |
| Noninterest Expense |
|
|
|
|
|
|
|
|
| Compensation and Employee Benefits |
219.2 |
202.1 |
353.6 |
335.3 |
1,117.4 |
949.2 |
1,690.2 |
1,486.6 |
| Outside Services |
61.2 |
90.2 |
24.6 |
31.3 |
397.2 |
370.7 |
483.0 |
492.2 |
| Allocated Expense |
1,663.4 |
1,451.8 |
699.4 |
615.3 |
(2,362.8) |
(2,067.1) |
— |
— |
Other Segment Items(2)
|
44.4 |
41.7 |
41.0 |
46.2 |
888.0 |
767.5 |
973.4 |
855.4 |
| Total Noninterest Expense |
1,988.2 |
1,785.8 |
1,118.6 |
1,028.1 |
39.8 |
20.3 |
3,146.6 |
2,834.2 |
Income (Loss) before Income Taxes(1)
|
696.6 |
506.9 |
663.8 |
613.7 |
405.0 |
(34.4) |
1,765.4 |
1,086.2 |
Provision for Income Taxes(1)
|
156.1 |
109.1 |
165.6 |
150.0 |
125.9 |
13.8 |
447.6 |
272.9 |
| Net Income (Loss) |
$ |
540.5 |
$ |
397.8 |
$ |
498.2 |
$ |
463.7 |
$ |
279.1 |
$ |
(48.2) |
$ |
1,317.8 |
$ |
813.3 |
| Percentage of Consolidated Net Income |
41
|
% |
49 |
% |
38% |
57 |
% |
21% |
(6) |
% |
100
|
% |
100 |
% |
| Average Assets |
$ |
124,800.1
|
|
$ |
113,432.9 |
|
$ |
39,486.2 |
$ |
39,121.2 |
$ |
145.5 |
$ |
1,457.2 |
$ |
164,431.8 |
$ |
154,011.3 |
| Average Loans |
$ |
5,717.0 |
$ |
5,781.2 |
$ |
35,515.8 |
$ |
35,336.2 |
$ |
— |
$ |
— |
$ |
41,232.8 |
$ |
41,117.4 |
| Average Deposits |
$ |
101,696.8 |
$ |
92,418.8 |
$ |
26,593.1 |
$ |
25,290.3 |
$ |
145.5 |
$ |
1,457.2 |
$ |
128,435.4 |
$ |
119,166.3 |
(1) Financial measures stated on an FTE basis. The FTE adjustment was $15.2 million and $10.3 million for the six months ended June 30, 2026 and 2025, respectively, and is eliminated within “Other” in order for “Total Consolidated” to reconcile with the Consolidated Statement of Income.
(2) Other Segment Items include Occupancy, Equipment & Software and Other Operating Expense.
(3) The current quarter charges related to software dispositions and severance are included in the Reporting Segments with $100.6 million recorded to Asset Servicing and $11.9 million recorded to Wealth Management.
(4) Other includes the current quarter $525.4 million gain related to Northern Trust's participation in the second Visa Exchange Offer, the $73.9 million loss on available for sale debt securities sold in conjunction with a repositioning of the portfolio, and the $33.1 million Invested as One equity grant to eligible employees.
Asset Servicing
Asset Servicing Trust, Investment and Other Servicing Fees
For an explanation of Asset Servicing Trust, Investment and Other Servicing Fees, please see the “Trust, Investment and Other Servicing Fees” section within the Consolidated Results of Operations section.
Asset Servicing Foreign Exchange Trading Income
Foreign Exchange Trading Income increased $37.9 million, or 62%, from the prior-year quarter and increased $65.0 million, or 52%, from the prior-year period, primarily due to higher trading volumes driven by client activity and market volatility, particularly in Asia-Pacific markets.
Asset Servicing Other Noninterest Income
Other Noninterest Income increased $18.7 million, or 26%, from the prior-year quarter and increased $35.0 million, or 25%, from the prior-year period, primarily in Security Commissions and Trading Income due to higher volumes driven by market volatility and growth in outsourced trading activity.
Asset Servicing Net Interest Income
Net Interest Income stated on an FTE basis increased $68.9 million, or 20%, from the prior-year quarter and increased $146.9 million, or 22%, from the prior-year period, primarily due to the favorable impact of higher deposits and lower funding costs.
Asset Servicing Provision for Credit Losses
The negative Provision for Credit Losses for the three and six months ended June 30, 2026, reflected a decrease in the collective reserve primarily in the C&I portfolio, driven by a strengthening macroeconomic outlook and improved credit quality.
REPORTING SEGMENTS (continued)
Asset Servicing Noninterest Expense
Noninterest Expense increased $145.8 million, or 16%, from the prior-year quarter and increased $202.4 million, or 11%, from the prior-year period, primarily driven by higher indirect expense allocations for certain corporate support services and $100.6 million of the current quarter charges related to software dispositions and severance.
Wealth Management
Wealth Management Trust, Investment and Other Servicing Fees
For an explanation of Wealth Management Trust, Investment and Other Servicing Fees, please see the “Trust, Investment and Other Servicing Fees” section within the Consolidated Results of Operations section.
Wealth Management Foreign Exchange Trading Income (Loss)
Foreign Exchange Trading Income (Loss) increased $8.6 million, or 83%, from the prior-year quarter and $10.5 million, or 67%, from the prior-year period, primarily driven by the favorable impact from lower foreign exchange swap activity executed by our Treasury department that is allocated to Wealth Management.
Wealth Management Provision for Credit Losses
The negative Provision for Credit Losses for the three months ended June 30, 2026, reflected a decrease in the collective reserve driven by a strengthening macroeconomic outlook and improved credit quality for the CRE and C&I portfolios; partially offset by an increase in the individual reserve driven by a small number of non-performing loans
Wealth Management Noninterest Expense
Noninterest Expense increased $48.5 million, or 9%, from the prior-year quarter and $90.5 million, or 9%, from the prior-year period, primarily driven by higher indirect expense allocations for certain corporate support services and $11.9 million of the current quarter charges related to software dispositions and severance.
Other
Other—Noninterest Income
Other Noninterest Income increased $450.3 million and $456.8 million from the prior-year quarter and prior-year period, respectively, primarily due to the current quarter $525.4 million gain related to Northern Trust's participation in the second Visa Exchange Offer, partially offset by the $73.9 million loss on available for sale debt securities sold in conjunction with a repositioning of the portfolio.
Other—Noninterest Expense
Other Noninterest Expense increased $27.7 million from the prior-year quarter primarily due to the current quarter $33.1 million Invested as One equity grant to eligible employees. Other Noninterest Expense increased $19.5 million from the prior-year period driven by the current quarter $33.1 million Invested as One equity grant to eligible employees, partially offset by lower non-allocated occupancy expense primarily arising from early lease exits.
CONSOLIDATED BALANCE SHEETS
The following table summarizes selected consolidated balance sheet information.
TABLE 20: SELECT CONSOLIDATED BALANCE SHEET INFORMATION
|
|
|
|
|
|
|
|
|
|
|
|
|
|
|
| ($ In Billions) |
JUNE 30, 2026 |
DECEMBER 31, 2025 |
CHANGE |
| Assets |
|
|
|
|
| Federal Reserve and Other Central Bank Deposits |
$ |
50.6
|
|
$ |
53.5 |
|
$ |
(2.9) |
|
(5) |
% |
Interest-Bearing Due from and Deposits with Banks(1)
|
6.2
|
|
6.5 |
|
(0.3) |
|
(6) |
|
| Federal Funds Sold and Securities Purchased under Agreements to Resell |
0.4
|
|
2.7 |
|
(2.3) |
|
(84) |
|
| Total Debt Securities |
61.6
|
|
57.5 |
|
4.1 |
|
7 |
|
| Loans |
43.8
|
|
41.9 |
|
1.9 |
|
4 |
|
Other Interest-Earning Assets(2)
|
3.5
|
|
4.1 |
|
(0.6) |
|
(15) |
|
| Total Earning Assets |
166.1
|
|
166.2 |
|
(0.1) |
|
— |
|
| Total Assets |
179.3
|
|
177.1 |
|
2.2 |
|
1 |
|
| Liabilities and Stockholders' Equity |
|
|
|
|
| Total Interest-Bearing Deposits |
117.4
|
|
115.4 |
|
2.0 |
|
2 |
|
| Demand and Other Noninterest-Bearing Deposits |
28.2
|
|
27.3 |
|
0.9 |
|
3 |
|
| Federal Funds Purchased |
1.6
|
|
2.1 |
|
(0.5) |
|
(27) |
|
| Securities Sold under Agreements to Repurchase |
0.2
|
|
0.3 |
|
(0.1) |
|
(40) |
|
Other Borrowings(3)
|
8.6
|
|
7.2 |
|
1.4 |
|
21 |
|
| Total Stockholders’ Equity |
13.4
|
|
13.0 |
|
0.4 |
|
3 |
|
(1) Interest-Bearing Due from and Deposits with Banks includes the interest-bearing component of Cash and Due from Banks and Interest-Bearing Deposits with Banks as presented on the consolidated balance sheets.
(2) Other Interest-Earning Assets includes certain community development investments, collateral deposits with certain securities depositories and clearing houses, Federal Home Loan Bank and Federal Reserve stock, and money market investments which are classified in Other Assets on the consolidated balance sheets.
(3) Other Borrowings primarily includes advances from the Federal Home Loan Bank of Chicago.
During the three and six months ended June 30, 2026, the Corporation declared cash dividends totaling $148.8 million and $299.6 million to common stockholders, and cash dividends totaling $4.7 million and $20.9 million to preferred stockholders, respectively. During the three and six months ended June 30, 2025, the Corporation declared cash dividends totaling $146.2 million and $294.4 million to common stockholders, and cash dividends totaling $4.7 million and $20.9 million to preferred stockholders respectively.
ASSET QUALITY
Securities Portfolio
Northern Trust maintains a high quality debt securities portfolio. The following tables provide the book value of debt securities by credit rating using ratings from Moody’s, S&P Global or Fitch Ratings. Book value is fair value for AFS debt securities and amortized cost for HTM debt securities. Debt securities not explicitly rated were grouped where possible under the credit rating of the issuer of the security.
TABLE 21: BOOK VALUE OF DEBT SECURITIES BY CREDIT RATING
|
|
|
|
|
|
|
|
|
|
|
|
|
|
|
|
|
|
|
|
|
|
JUNE 30, 2026 |
| ($ In Millions) |
AAA |
AA |
A |
BBB |
NOT RATED |
TOTAL |
| Available for Sale |
|
|
|
|
|
|
| U.S. Governments |
$ |
—
|
|
$ |
7,883.3
|
|
$ |
—
|
|
$ |
—
|
|
$ |
—
|
|
$ |
7,883.3
|
|
|
|
|
|
|
|
|
| Government Sponsored Agency |
—
|
|
19,302.8
|
|
—
|
|
—
|
|
—
|
|
19,302.8
|
|
| Non-U.S. Government |
408.5
|
|
—
|
|
—
|
|
—
|
|
—
|
|
408.5
|
|
| Corporate Debt |
—
|
|
226.6
|
|
44.8
|
|
—
|
|
—
|
|
271.4
|
|
| Covered Bonds |
275.7
|
|
—
|
|
—
|
|
—
|
|
—
|
|
275.7
|
|
|
|
|
|
|
|
|
| Sub-Sovereign, Supranational and Non-U.S. Agency Bonds |
4,092.3
|
|
383.1
|
|
195.0
|
|
—
|
|
—
|
|
4,670.4
|
|
| CLOs |
3,453.7
|
|
—
|
|
—
|
|
—
|
|
—
|
|
3,453.7
|
|
| Other Asset-Backed |
1,345.7
|
|
—
|
|
—
|
|
—
|
|
—
|
|
1,345.7
|
|
| Commercial Mortgage-Backed |
502.8
|
|
8.8
|
|
—
|
|
—
|
|
—
|
|
511.6
|
|
|
|
|
|
|
|
|
| Total Available for Sale |
$ |
10,078.7
|
|
$ |
27,804.6
|
|
$ |
239.8
|
|
$ |
—
|
|
$ |
—
|
|
$ |
38,123.1
|
|
| Percent of Total Available for Sale |
26
|
% |
73
|
% |
1
|
% |
—
|
% |
—
|
% |
100
|
% |
| Held to Maturity |
|
|
|
|
|
|
|
|
|
|
|
|
|
| Obligations of States and Political Subdivisions |
$ |
993.0
|
|
$ |
1,377.1
|
|
$ |
14.7
|
|
$ |
—
|
|
$ |
—
|
|
$ |
2,384.8
|
|
| Government Sponsored Agency |
41.6
|
|
8,071.2
|
|
—
|
|
—
|
|
—
|
|
8,112.8
|
|
| Non-U.S. Government |
1,275.7
|
|
1,457.5
|
|
1,813.1
|
|
14.9
|
|
—
|
|
4,561.2
|
|
| Corporate Debt |
154.6
|
|
16.0
|
|
109.7
|
|
—
|
|
—
|
|
280.3
|
|
| Covered Bonds |
2,114.9
|
|
—
|
|
—
|
|
—
|
|
—
|
|
2,114.9
|
|
| Certificate of Deposit |
—
|
|
—
|
|
—
|
|
—
|
|
751.8
|
|
751.8
|
|
| Sub-Sovereign, Supranational and Non-U.S. Agency Bonds |
3,316.3
|
|
901.7
|
|
376.2
|
|
1.2
|
|
—
|
|
4,595.4
|
|
|
|
|
|
|
|
|
| Other Asset-Backed |
47.1
|
|
—
|
|
—
|
|
—
|
|
—
|
|
47.1
|
|
| Commercial Mortgage-Backed |
—
|
|
—
|
|
37.6
|
|
—
|
|
—
|
|
37.6
|
|
| Other |
—
|
|
—
|
|
—
|
|
—
|
|
606.2
|
|
606.2
|
|
| Total Held to Maturity |
$ |
7,943.2
|
|
$ |
11,823.5
|
|
$ |
2,351.3
|
|
$ |
16.1
|
|
$ |
1,358.0
|
|
$ |
23,492.1
|
|
| Percent of Total Held to Maturity |
34
|
% |
50
|
% |
10
|
% |
—
|
% |
6
|
% |
100
|
% |
| Total Debt Securities |
$ |
18,021.9
|
|
$ |
39,628.1
|
|
$ |
2,591.1
|
|
$ |
16.1
|
|
$ |
1,358.0
|
|
$ |
61,615.2
|
|
| Percent of Total Debt Securities |
29
|
% |
65
|
% |
4
|
% |
—
|
% |
2
|
% |
100
|
% |
ASSET QUALITY (continued)
Securities Portfolio (continued)
|
|
|
|
|
|
|
|
|
|
|
|
|
|
|
|
|
|
|
|
|
|
DECEMBER 31, 2025 |
| ($ In Millions) |
AAA |
AA |
A |
BBB |
NOT RATED |
TOTAL |
| Available for Sale |
|
|
|
|
|
|
| U.S. Governments |
$ |
— |
|
$ |
8,172.4 |
|
$ |
— |
|
$ |
— |
|
$ |
— |
|
$ |
8,172.4 |
|
| Obligations of States and Political Subdivisions |
40.7 |
|
272.4 |
|
— |
|
— |
|
— |
|
313.1 |
|
| Government Sponsored Agency |
— |
|
16,567.5 |
|
— |
|
— |
|
— |
|
16,567.5 |
|
| Non-U.S. Government |
527.2 |
|
— |
|
— |
|
— |
|
— |
|
527.2 |
|
| Corporate Debt |
— |
|
21.3 |
|
43.1 |
|
— |
|
— |
|
64.4 |
|
| Covered Bonds |
273.5 |
|
— |
|
— |
|
— |
|
— |
|
273.5 |
|
|
|
|
|
|
|
|
| Sub-Sovereign, Supranational and Non-U.S. Agency Bonds |
4,325.8 |
|
461.4 |
|
197.1 |
|
— |
|
— |
|
4,984.3 |
|
| CLOs |
2,154.9 |
|
— |
|
— |
|
— |
|
— |
|
2,154.9 |
|
| Other Asset-Backed |
570.2 |
|
— |
|
— |
|
— |
|
— |
|
570.2 |
|
| Commercial Mortgage-Backed |
391.5 |
|
17.5 |
|
— |
|
— |
|
— |
|
409.0 |
|
|
|
|
|
|
|
|
| Total Available for Sale |
$ |
8,283.8 |
|
$ |
25,512.5 |
|
$ |
240.2 |
|
$ |
— |
|
$ |
— |
|
$ |
34,036.5 |
|
| Percent of Total Available for Sale |
24 |
% |
75 |
% |
1 |
% |
— |
% |
— |
% |
100 |
% |
| Held to Maturity |
|
|
|
|
|
|
|
|
|
|
|
|
|
| Obligations of States and Political Subdivisions |
$ |
986.0 |
|
$ |
1,471.8 |
|
$ |
— |
|
$ |
— |
|
$ |
— |
|
$ |
2,457.8 |
|
| Government Sponsored Agency |
— |
|
8,424.5 |
|
— |
|
— |
|
— |
|
8,424.5 |
|
| Non-U.S. Government |
649.7 |
|
1,231.7 |
|
2,844.7 |
|
14.9 |
|
— |
|
4,741.0 |
|
| Corporate Debt |
159.2 |
|
150.2 |
|
79.6 |
|
— |
|
— |
|
389.0 |
|
| Covered Bonds |
1,754.5 |
|
— |
|
— |
|
— |
|
— |
|
1,754.5 |
|
| Certificate of Deposit |
— |
|
— |
|
— |
|
— |
|
444.5 |
|
444.5 |
|
| Sub-Sovereign, Supranational and Non-U.S. Agency Bonds |
3,412.9 |
|
776.2 |
|
321.2 |
|
1.2 |
|
— |
|
4,511.5 |
|
|
|
|
|
|
|
|
|
|
|
|
|
|
|
| Commercial Mortgage-Backed |
— |
|
37.6 |
|
— |
|
— |
|
— |
|
37.6 |
|
| Other |
53.0 |
|
— |
|
— |
|
— |
|
616.2 |
|
669.2 |
|
| Total Held to Maturity |
$ |
7,015.3 |
|
$ |
12,092.0 |
|
$ |
3,245.5 |
|
$ |
16.1 |
|
$ |
1,060.7 |
|
$ |
23,429.6 |
|
| Percent of Total Held to Maturity |
30 |
% |
52 |
% |
14 |
% |
— |
% |
4 |
% |
100 |
% |
| Total Debt Securities |
$ |
15,299.1 |
|
$ |
37,604.5 |
|
$ |
3,485.7 |
|
$ |
16.1 |
|
$ |
1,060.7 |
|
$ |
57,466.1 |
|
| Percent of Total Debt Securities |
27 |
% |
65 |
% |
6 |
% |
— |
% |
2 |
% |
100 |
% |
As of June 30, 2026 and December 31, 2025, HTM debt securities not rated by Moody’s, S&P Global or Fitch Ratings primarily consisted of certificates of deposit with a remaining life of less than one month, as well as investments purchased by Northern Trust to fulfill its obligations under the Community Reinvestment Act (CRA). Northern Trust fulfills its obligations under the CRA by making qualified investments for purposes of supporting institutions and programs that benefit low-to-moderate income communities within Northern Trust’s market area.
For additional information relating to the securities portfolio, refer to Note 4, “Securities” to the consolidated financial statements provided in Item 1. Consolidated Financial Statements (unaudited).
Short-Term Borrowings
Short-term borrowings includes Federal Funds Purchased, Securities Sold under Agreements to Repurchase, and Other Borrowings. These balances are primarily driven by sources of strategic funding needs. Securities purchased under agreements to resell and securities sold under agreements to repurchase are accounted for as collateralized financings and recorded at the amounts at which the securities were acquired or sold plus accrued interest. To minimize potential credit risk associated with these transactions, the fair value of the securities purchased or sold is monitored, limits are set on exposure with counterparties, and the financial condition of counterparties is regularly assessed. It is Northern Trust’s policy to take possession, either directly or via third-party custodians, of securities purchased under agreements to resell. Securities sold under agreements to repurchase are held by the counterparty until their repurchase.
ASSET QUALITY (continued)
Nonaccrual Loans and Other Real Estate Owned
Nonaccrual assets consist of nonaccrual loans and other real estate owned (OREO). OREO is comprised of commercial and residential properties acquired in partial or total satisfaction of loans. There was no outstanding OREO as of June 30, 2026 or December 31, 2025.
The following table provides the amounts of nonaccrual loans, by loan segment and class, that were outstanding at the dates shown, as well as the balance of loans that were delinquent 90 days or more and still accruing interest. Loans that are delinquent 90 days or more and still accruing interest can fluctuate widely based on the timing of cash collections, renegotiation and renewals.
TABLE 22: NONACCRUAL ASSETS
|
|
|
|
|
|
|
|
|
|
|
|
|
|
|
|
JUNE 30, 2026 |
DECEMBER 31, 2025 |
| ($ In Millions) |
AMOUNT |
% OF NONACCRUAL LOANS TO TOTAL NONACCRUAL LOANS |
AMOUNT |
% OF NONACCRUAL LOANS TO TOTAL NONACCRUAL LOANS |
Nonaccrual Loans(1)
|
|
|
|
|
| Commercial |
|
|
|
|
| Commercial and Institutional |
$ |
44.6
|
|
62
|
% |
$ |
39.7 |
|
52 |
% |
| Commercial Real Estate |
2.1
|
|
3
|
|
— |
|
— |
|
|
|
|
|
|
|
|
|
|
|
| Other |
0.5
|
|
1
|
|
0.6 |
|
1 |
|
| Total Commercial |
$ |
47.2
|
|
66
|
% |
$ |
40.3 |
|
53 |
% |
| Personal |
|
|
|
|
| Private Client |
$ |
5.4
|
|
8
|
% |
$ |
6.7 |
|
9 |
% |
| Residential Real Estate |
18.7
|
|
26
|
|
29.7 |
|
38 |
|
| Total Personal |
$ |
24.1
|
|
34
|
% |
$ |
36.4 |
|
47 |
% |
| Total Nonaccrual Loans |
71.3
|
|
|
76.7 |
|
|
|
|
|
|
|
|
|
|
|
|
| 90 Day Past Due Loans Still Accruing |
$ |
28.0
|
|
|
$ |
25.0 |
|
|
| Nonaccrual Loans to Total Loans |
0.16
|
% |
|
0.18 |
% |
|
| Allowance for Credit Losses Assigned to Loans to Nonaccrual Loans |
2.3
|
x |
|
2.1 |
x |
|
(1) Loan classes that do not have a non-accrual balance are excluded from the table.
Nonaccrual assets of $71.3 million as of June 30, 2026, were $5.4 million, or 7%, lower than December 31, 2025, primarily due to payoffs and paydowns related to a small number of Residential Real Estate loans, partially offset by the downgrade of a small number of C&I loans. In addition to the negative impact on Net Interest Income and the risk of credit losses, nonaccrual assets also increase operating costs due to the expense associated with collection efforts. Changes in the level of nonaccrual assets may be indicative of changes in the credit quality of one or more loan classes. Changes in credit quality impact the allowance for credit losses through the resultant adjustment of the allowance evaluated on an individual basis and the quantitative and qualitative factors used in the determination of the allowance evaluated on a collective basis within the allowance for credit losses.
Northern Trust’s credit policies do not allow for the origination of loan types generally considered to be high risk in nature, such as option adjustable rate mortgage loans, subprime loans, loans with initial “teaser” rates and loans with excessively high loan-to-value ratios. Residential real estate loans consist of first lien mortgages and equity credit lines, which generally require a loan-to-collateral value of no more than 65% to 80% at inception. Appraisals of supporting collateral for residential real estate loans are obtained at loan origination and upon refinancing or default or when otherwise considered warranted. Residential real estate collateral appraisals are performed and reviewed by independent third parties.
For additional information relating to the loans portfolio, refer to Note 5—Loans to the consolidated financial statements provided in Item 1. Consolidated Financial Statements (unaudited).
ASSET QUALITY (continued)
Allowance for Credit Losses
The Allowance for Credit Losses—which represents management’s best estimate of lifetime expected credit losses related to various portfolios subject to credit risk, off-balance-sheet credit exposure, and specific borrower relationships—is determined by management through a disciplined credit review process. Northern Trust measures expected credit losses of financial assets with similar risk characteristics on a collective basis. A financial asset is measured individually if it does not share similar risk characteristics with other financial assets and the related allowance is determined through an individual evaluation.
Management’s estimates utilized in establishing an appropriate level of allowance for credit losses are not dependent on any single assumption. In determining an appropriate allowance level, management evaluates numerous variables, many of which are interrelated or dependent on other assumptions and estimates, and takes into consideration past events, current conditions and reasonable and supportable forecasts.
The results of the credit reserve estimation methodology are reviewed quarterly by Northern Trust’s Credit Loss Reserve Committee and CFO, which receives input from Financial Risk Management, Treasury, Corporate Finance, the Economic Research Department, and each of Northern Trust’s reporting business units.
As of June 30, 2026, the Allowance for Credit Losses related to loans, undrawn loan commitments and standby letters of credit, HTM debt securities, and other financial assets, was $160.9 million, $21.9 million, $6.6 million, and $0.9 million, respectively. There was no allowance for credit losses related to AFS debt securities as of June 30, 2026. As of December 31, 2025, the Allowance for Credit Losses related to loans, undrawn loan commitments and standby letters of credit, HTM debt securities, and other financial assets, was $164.3 million, $23.3 million, $9.3 million, and $1.4 million, respectively. There was no allowance for credit losses related to AFS debt securities as of December 31, 2025. For additional information relating to the Allowance for Credit Losses and the changes in the Allowance for Credit Losses during the three and six months ended June 30, 2026 and June 30, 2025 due to charge-offs, recoveries and provisions for credit losses, refer to Note 6—Allowance for Credit Losses to the consolidated financial statements provided in Item 1. Consolidated Financial Statements (unaudited).
As of January 1, 2026, Northern Trust refined the presentation of its commercial loan segment to enhance the alignment of segment reporting with business needs, risk characteristics, and management’s approach to monitoring and managing credit performance. As part of this refinement, Subscription Finance and Fund Finance were introduced as separate loan classes. Subscription Finance includes loans to private equity funds that are secured by investors’ contractual commitments to fund capital calls. Fund Finance includes loans and credit lines to all other collective investment funds and to investment managers primarily established for short-term liquidity needs. These borrowers generally maintain highly diversified portfolios of liquid securities. Prior period disclosures have been revised to conform to the current period presentation.
The following table provides the allowance evaluated on an individual and collective basis for the loan portfolio by segment and class.
TABLE 23: ALLOCATION OF THE ALLOWANCE FOR CREDIT LOSSES FOR LOANS
|
|
|
|
|
|
|
|
|
|
|
|
|
|
|
|
JUNE 30, 2026 |
DECEMBER 31, 2025 |
| ($ In Millions) |
ALLOWANCE AMOUNT |
PERCENT OF LOANS TO TOTAL LOANS |
ALLOWANCE AMOUNT |
PERCENT OF LOANS TO TOTAL LOANS |
| Evaluated on an Individual Basis |
$ |
19.2
|
|
—
|
% |
$ |
10.2 |
|
— |
% |
| Evaluated on a Collective Basis |
|
|
|
|
| Commercial |
|
|
|
|
| Commercial and Institutional |
47.5
|
|
15
|
|
59.0 |
|
16 |
|
| Commercial Real Estate |
85.0
|
|
12
|
|
85.6 |
|
13 |
|
| Subscription Finance |
0.9
|
|
10
|
|
2.8 |
|
9 |
|
| Fund Finance |
0.9
|
|
4
|
|
0.8 |
|
3 |
|
| Other |
0.1
|
|
8
|
|
0.1 |
|
8 |
|
| Total Commercial |
134.4
|
|
49
|
|
148.3 |
|
49 |
|
| Personal |
|
|
|
|
| Private Client |
16.5
|
|
36
|
|
16.0 |
|
35 |
|
| Residential Real Estate |
12.7
|
|
14
|
|
13.1 |
|
15 |
|
| Other |
—
|
|
1
|
|
— |
|
1 |
|
| Total Personal |
29.2
|
|
51
|
|
29.1 |
|
51 |
|
| Total Allowance Evaluated on a Collective Basis |
$ |
163.6
|
|
|
$ |
177.4 |
|
|
| Total Allowance for Credit Losses |
$ |
182.8
|
|
|
$ |
187.6 |
|
|
| Allowance Assigned to |
|
|
|
|
| Loans |
$ |
160.9
|
|
|
$ |
164.3 |
|
|
| Undrawn Commitments and Standby Letters of Credit |
21.9
|
|
|
23.3 |
|
|
| Total Allowance for Credit Losses |
$ |
182.8
|
|
|
$ |
187.6 |
|
|
| Allowance Assigned to Loans to Total Loans |
0.37
|
% |
|
0.39 |
% |
|
ASSET QUALITY (continued)
Commercial Real Estate Loans
The table below provides additional detail regarding commercial real estate loan types.
TABLE 24: COMMERCIAL REAL ESTATE LOANS
|
|
|
|
|
|
|
|
|
|
|
|
| (In Millions) |
JUNE 30, 2026 |
DECEMBER 31, 2025 |
| Commercial Mortgages |
|
|
| Apartment/ Multi-family |
$ |
1,488.7
|
|
$ |
1,586.4 |
|
| Industrial/ Warehouse |
977.5
|
|
960.1 |
|
| Office |
906.0
|
|
948.0 |
|
| Retail |
712.6
|
|
695.9 |
|
| Other |
588.1
|
|
622.5 |
|
| Total Commercial Mortgages |
4,672.9
|
|
4,812.9 |
|
| Construction, Acquisition and Development Loans |
643.3
|
|
459.3 |
|
| Total Commercial Real Estate Loans |
$ |
5,316.2
|
|
$ |
5,272.2 |
|
In managing its credit exposure, management has defined a commercial real estate loan as one where: (1) the borrower’s principal business activity is the acquisition or the development of real estate for commercial purposes; (2) the principal collateral is real estate held for commercial purposes, and loan repayment is expected to flow from the operation of the property; or (3) the loan repayment is expected to flow from the sale or refinance of real estate as a normal and ongoing part of the business. The commercial real estate portfolio consists of commercial mortgages and construction, acquisition and development loans extended primarily to experienced investors well known to Northern Trust.
Underwriting standards generally reflect conservative loan-to-collateral value (LTV) ratios and debt service coverage requirements. LTV ratios, calculated as the outstanding amount of the loan divided by the estimated value of the property, are a critical component of Northern Trust’s underwriting standards. Northern Trust utilizes LTV ratios in various stages of the lending and risk management process. Northern Trust’s policy related to LTV limits is more conservative than what is prescribed by current supervisory regulations. LTV ratios are monitored and updated on a quarterly basis utilizing the most recent outstanding amounts and appraisal values based on models, automated valuation services, or updated appraisals.
All commercial real estate transactions, regardless of size, require an independent appraisal at loan origination, unless permissible and approved regulatory exemptions can be applied. Real estate appraisals are, at a minimum, performed in accordance with generally accepted appraisal standards as applicable under local regulations. Northern Trust considers obtaining a new appraisal as part of the loan renewal process or whenever credit quality or market conditions have materially and adversely changed to the point where it is prudent to reassess the value of the real estate collateral. For defaulted loans, appraisals are updated on an, at least, annual basis. Appraisal values might be discounted based upon Northern Trust’s experience with actual liquidation values and management’s judgment as to the realizable value of the property.
For an overall discussion on the loan portfolio and on the allowance, refer to Note 5—Loans and Note 6—Allowance for Credit Losses to the consolidated financial statements provided in Item 1. Consolidated Financial Statements (unaudited).
STATEMENTS OF CASH FLOWS
The following discusses the statement of cash flow activities for the six months ended June 30, 2026 and 2025.
TABLE 25: CASH FLOW ACTIVITY SUMMARY
|
|
|
|
|
|
|
|
|
|
SIX MONTHS ENDED JUNE 30, |
| (In Millions) |
2026 |
2025 |
| Net cash provided by (used in): |
|
|
| Operating activities |
$ |
(384.9) |
|
$ |
4,619.3 |
|
| Investing activities |
(1,359.4) |
|
(13,906.6) |
|
| Financing activities |
1,647.0
|
|
10,340.6 |
|
| Effect of Foreign Currency Exchange Rates on Cash |
(38.9) |
|
692.9 |
|
| Change in Cash and Due from Banks |
$ |
(136.2) |
|
$ |
1,746.2 |
|
STATEMENTS OF CASH FLOWS (continued)
Operating Activities
Net cash used in operating activities of $384.9 million for the six months ended June 30, 2026 was primarily attributable to higher net collateral deposited with derivative counterparties, partially offset by period earnings.
Net cash provided by operating activities of $4.6 billion for the six months ended June 30, 2025 was primarily attributable to lower net collateral deposited with derivative counterparties and period earnings.
Investing Activities
Net cash used in investing activities of $1.4 billion for the six months ended June 30, 2026 was primarily attributable to net purchases of AFS securities and an increase in loans, partially offset by decreased levels of Federal Reserve and other central bank deposits and a decrease in federal funds sold and securities purchased under agreements to resell.
Net cash used in investing activities of $13.9 billion for the six months ended June 30, 2025 was primarily attributable to increased levels of Federal Reserve and other central bank deposits and net purchases of AFS debt securities, partially offset by net proceeds associated with HTM debt securities.
Financing Activities
Net cash provided by financing activities of $1.6 billion for the six months ended June 30, 2026 was primarily attributable to increased levels of total deposits and short term borrowings, partially offset by share repurchases.
Net cash provided by financing activities of $10.3 billion for the six months ended June 30, 2025 was primarily attributable to the increased levels of total deposits, partially offset by share repurchases.
REGULATORY CAPITAL
Capital ratios remained strong at June 30, 2026, exceeding the requirements for classification as “well-capitalized” under applicable U.S. regulatory requirements.
Northern Trust is a Category II institution as defined by the Federal Reserve Board which requires us to adhere to regulatory capital standards. In adhering to these standards, Northern Trust engages in a range of reporting and activities with regulators to affirm our financial strength and stability, including but not limited to, capital adequacy reporting that deducts any unrealized losses related to AFS securities from reported capital, and stringent, annual company-run and supervisory stress testing in the form of CCAR exercises, which confirms our ability to remain solvent under severely adverse market conditions.
The results of the 2026 Dodd-Frank Act Stress Test (DFAST) were published by the Federal Reserve Board on June 24, 2026 and resulted in no change to the Corporation’s stress capital buffer. On February 4, 2026, the Federal Reserve notified the Corporation that because the Stress Testing Transparency Proposal remains subject to public comment, absent further action from the Federal Reserve, the Corporation’s stress capital buffer and Common Equity Tier 1 capital ratio minimum requirement will remain at 2.5% and 7.0%, respectively, until October 1, 2027.
In March 2026, the U.S. banking agencies issued a revised proposal to implement the final components of the Basel III regulatory capital framework. The revised proposal would eliminate the existing standardized and advanced approach methodologies for determining Risk-Weighted Assets for Category I and Category II institutions and replace it with a new expanded risk-based approach. Based upon a preliminary assessment, Northern Trust estimates the proposal will result in a modest decrease in Risk-Weighted Assets. However, the potential impacts on the Corporation and the Bank of a final rule and the timing associated with it remain uncertain.
REGULATORY CAPITAL (continued)
The following table provides a reconciliation of the Corporation’s common stockholders’ equity to total risk-based capital under the applicable U.S. regulatory rules as of June 30, 2026, December 31, 2025 and June 30, 2025.
TABLE 26: REGULATORY CAPITAL
|
|
|
|
|
|
|
|
|
|
|
|
|
|
|
|
|
|
|
|
|
|
|
|
|
|
|
|
JUNE 30, 2026 |
|
DECEMBER 31, 2025 |
|
JUNE 30, 2025 |
| ($ In Millions) |
STANDARDIZED APPROACH |
ADVANCED APPROACH |
|
STANDARDIZED APPROACH |
ADVANCED APPROACH |
|
STANDARDIZED APPROACH |
ADVANCED APPROACH |
| Common Equity Tier 1 Capital |
|
|
|
|
|
|
|
|
| Common Stockholders’ Equity |
$ |
12,516.7
|
|
$ |
12,516.7
|
|
|
$ |
12,073.0 |
|
$ |
12,073.0 |
|
|
$ |
11,981.6 |
|
$ |
11,981.6 |
|
| Goodwill and Other Intangible Assets, net of Deferred Tax Liability |
(710.4) |
|
(710.4) |
|
|
(715.9) |
|
(715.9) |
|
|
(720.4) |
|
(720.4) |
|
| Other |
(200.7) |
|
(200.7) |
|
|
(164.6) |
|
(164.6) |
|
|
(153.0) |
|
(153.0) |
|
| Total Common Equity Tier 1 Capital |
11,605.6
|
|
11,605.6
|
|
|
11,192.5 |
|
11,192.5 |
|
|
11,108.2 |
|
11,108.2 |
|
| Additional Tier 1 Capital |
|
|
|
|
|
|
|
|
| Preferred Stock |
884.9
|
|
884.9
|
|
|
884.9 |
|
884.9 |
|
|
884.9 |
|
884.9 |
|
| Other |
(71.8) |
|
(71.8) |
|
|
(68.9) |
|
(68.9) |
|
|
(54.6) |
|
(54.6) |
|
| Total Additional Tier 1 Capital |
813.1
|
|
813.1
|
|
|
816.0 |
|
816.0 |
|
|
830.3 |
|
830.3 |
|
| Total Tier 1 Capital |
12,418.7
|
|
12,418.7
|
|
|
12,008.5 |
|
12,008.5 |
|
|
11,938.5 |
|
11,938.5 |
|
| Tier 2 Capital |
|
|
|
|
|
|
|
|
| Qualifying Allowance for Credit Losses |
190.3
|
|
—
|
|
|
198.4 |
|
— |
|
|
223.3 |
|
— |
|
| Qualifying Subordinated Debt |
2,097.5
|
|
2,097.5
|
|
|
2,097.3 |
|
2,097.3 |
|
|
1,347.1 |
|
1,347.1 |
|
| Total Tier 2 Capital |
2,287.8
|
|
2,097.5
|
|
|
2,295.7 |
|
2,097.3 |
|
|
1,570.4 |
|
1,347.1 |
|
| Total Risk-Based Capital |
$ |
14,706.5
|
|
$ |
14,516.2
|
|
|
$ |
14,304.2 |
|
$ |
14,105.8 |
|
|
$ |
13,508.9 |
|
$ |
13,285.6 |
|
Risk-Weighted Assets(1)
|
$ |
95,157.3
|
|
$ |
81,119.6
|
|
|
$ |
89,015.4 |
|
$ |
74,843.6 |
|
|
$ |
91,385.4 |
|
$ |
74,176.8 |
|
| Total Assets – End of Period (EOP) |
179,297.2
|
|
179,297.2
|
|
|
177,132.7 |
|
177,132.7 |
|
|
171,883.6 |
|
171,883.6 |
|
Adjusted Average Assets(2)
|
162,601.3
|
|
162,601.3
|
|
|
154,083.9 |
|
154,083.9 |
|
|
156,854.5 |
|
156,854.5 |
|
| Total Loans – EOP |
43,822.0
|
|
43,822.0
|
|
|
41,948.3 |
|
41,948.3 |
|
|
43,323.4 |
|
43,323.4 |
|
| Common Stockholders’ Equity to: |
|
|
|
|
|
|
|
|
| Total Loans – EOP |
28.56
|
% |
28.56
|
% |
|
28.78 |
% |
28.78 |
% |
|
27.66 |
% |
27.66 |
% |
| Total Assets – EOP |
6.98
|
|
6.98
|
|
|
6.82 |
|
6.82 |
|
|
6.97 |
|
6.97 |
|
(1) Risk-weighted assets exclude, as applicable under each regulatory approach, amounts primarily related to goodwill, certain other intangible assets, and net unrealized gains or losses on securities and reflect adjustments for excess allowances for credit losses that have been excluded from Tier 1 and Tier 2 capital, if any.
(2) Adjusted average assets exclude amounts primarily related to goodwill, other intangible assets, and net unrealized gains or losses on securities.
The table below provides capital ratios, as well as the required minimum capital ratios, for Northern Trust Corporation and The Northern Trust Company.
TABLE 27: REGULATORY CAPITAL RATIOS
|
|
|
|
|
|
|
|
|
|
|
|
|
|
|
|
|
|
|
|
|
|
|
|
|
|
|
|
|
|
|
|
|
|
Standardized Approach |
|
Advanced Approach |
|
|
| June 30, 2026 |
December 31, 2025 |
June 30, 2025 |
|
June 30, 2026 |
December 31, 2025 |
June 30, 2025 |
|
WELL-CAPITALIZED RATIOS |
MINIMUM CAPITAL RATIOS |
| Northern Trust Corporation |
|
|
|
|
|
|
|
|
|
|
| Common Equity Tier 1 Capital |
12.2
|
% |
12.6 |
% |
12.2 |
% |
|
14.3
|
% |
15.0 |
% |
15.0 |
% |
|
N/A |
4.5 |
% |
| Tier 1 Capital |
13.1
|
|
13.5 |
|
13.1 |
|
|
15.3
|
|
16.0 |
|
16.1 |
|
|
6.0 |
6.0 |
|
| Total Capital |
15.5
|
|
16.1 |
|
14.8 |
|
|
17.9
|
|
18.8 |
|
17.9 |
|
|
10.0 |
8.0 |
|
| Tier 1 Leverage |
7.6
|
|
7.8 |
|
7.6 |
|
|
7.6
|
|
7.8 |
|
7.6 |
|
|
N/A |
4.0 |
|
| Supplementary Leverage |
N/A |
N/A |
N/A |
|
8.6
|
|
8.7 |
|
9.1 |
|
|
N/A |
3.0 |
|
|
|
|
|
|
|
|
|
|
|
|
| The Northern Trust Company |
|
|
|
|
|
|
|
|
|
|
| Common Equity Tier 1 Capital |
11.8
|
% |
12.1 |
% |
11.4 |
% |
|
14.1
|
% |
14.6 |
% |
14.3 |
% |
|
6.5 |
% |
4.5 |
% |
| Tier 1 Capital |
11.8
|
|
12.1 |
|
11.4 |
|
|
14.1
|
|
14.6 |
|
14.3 |
|
|
8.0 |
|
6.0 |
|
| Total Capital |
13.9
|
|
14.3 |
|
12.8 |
|
|
16.3
|
|
17.0 |
|
15.7 |
|
|
10.0 |
|
8.0 |
|
| Tier 1 Leverage |
6.8
|
|
6.9 |
|
6.6 |
|
|
6.8
|
|
6.9 |
|
6.6 |
|
|
5.0 |
|
4.0 |
|
| Supplementary Leverage |
N/A |
N/A |
N/A |
|
7.7
|
|
7.7 |
|
7.9 |
|
|
3.0 |
|
3.0 |
|
RECENT ACCOUNTING PRONOUNCEMENTS AND DEVELOPMENTS
In November 2024, the FASB issued Accounting Standards Update (ASU) No. 2024-03, “Income Statement—Reporting Comprehensive Income—Expense Disaggregation Disclosures (Subtopic 220-40): Disaggregation of Income Statement Expenses” (ASU 2024-03). ASU 2024-03 requires disaggregated disclosures in tabular format for specific income statement expense categories as well as a narrative disclosure about selling expenses. The amendments in ASU 2024-03 do not change or remove existing income statement presentation or disclosure requirements. ASU 2024-03 is effective for annual periods beginning after December 15, 2026, and interim periods beginning after December 15, 2027. Early adoption is permitted. Upon adoption, the impact of ASU 2024-03 will be limited to certain enhancements within the notes to the consolidated financial statements and therefore is not expected to have an impact on Northern Trust’s consolidated balance sheets or consolidated statements of income.
In September 2025, the FASB issued ASU No. 2025-06, “Intangibles—Goodwill and Other—Internal-Use Software (Subtopic 350-40): Targeted Improvements to the Accounting for Internal-Use Software” (ASU 2025-06). ASU 2025-06 changes the cost capitalization threshold by removing the accounting consideration given to software project development stages and replaces it with the following criteria that must be met for entities to begin capitalizing software costs: (1) management has authorized and committed to funding the project and (2) it is ‘probable’ the project will be completed and the software used to perform its intended function (referred to as the ‘probable-to-complete’ threshold). In addition, ASU 2025-06 specifies that entities must apply the disclosure requirements in ASC 360-10, Property, Plant, and Equipment—Overall to capitalized internal-use software and related amortization, regardless of how the internal-use software is classified on the balance sheet. ASU 2025-06 is effective for interim and annual periods beginning after December 15, 2027, although early adoption is permitted. Northern Trust is currently assessing the impacts upon adoption of ASU 2025-06.
Other accounting pronouncements that were issued by the FASB but not yet adopted as of June 30, 2026 are not expected to have a material impact on Northern Trust’s consolidated balance sheets or consolidated statements of income upon adoption.
RISK MANAGEMENT
Liquidity Risk
Liquidity risk is the risk of not being able to raise sufficient funds or maintain collateral to meet balance sheet and contingent liability cash flow obligations when due, because of firm-specific or market-wide stress events. Northern Trust is a Category II institution as defined by the Federal Reserve Board which requires us to adhere to the same regulatory liquidity standards as U.S. global systemically important bank holding companies (GSIBs). In adhering to these standards, Northern Trust engages in a range of reporting and other activities with regulators to affirm our financial strength and stability, including but not limited to, daily LCR and Net Stable Funding Ratio calculations to regulators.
We maintain a highly liquid balance sheet consisting principally of cash and due from banks, deposits with the Federal Reserve and other central banks, short-term money market assets, and investment securities, which were 66% of total assets as of both June 30, 2026 and December 31, 2025, respectively. The majority of Northern Trust’s securities portfolio is composed of highly liquid securities including U.S. Treasury, non-U.S. government, and government sponsored agency securities.
Market Risk
There are two types of market risk; interest rate risk associated with the banking book and trading risk. Interest rate risk associated with the banking book is the potential for movements in interest rates to cause changes in Net Interest Income and the market value of equity, including AOCI from the AFS debt securities portfolio. Trading risk is the potential for movements in market variables such as foreign exchange and interest rates to cause changes in the value of trading positions.
Northern Trust uses two primary measurement techniques to manage interest rate risk: NII sensitivity and MVE sensitivity. NII sensitivity provides management with a short-term view of the impact of interest rate changes on NII. MVE sensitivity provides management with a long-term view of interest rate changes on MVE based on the period-end balance sheet. Higher interest rates may impact the fair value of AFS debt securities which in turn affects AOCI, which can impact regulatory capital ratios.
As part of its risk management activities, Northern Trust also measures daily the risk of loss associated with all trading book positions using a VaR model and applying the historical simulation methodology. The following information about Northern Trust’s management of market risk should be read in conjunction with our Annual Report on Form 10-K for the year ended December 31, 2025.
NII Sensitivity — The modeling of NII sensitivity incorporates on-balance-sheet positions, as well as derivative financial instruments (principally interest rate swaps) that are used to manage interest rate risk. Northern Trust uses market implied forward interest rates as the base case and measures the sensitivity (i.e., change) of a static balance sheet to changes in interest rates. Stress testing of interest rates is performed to include such scenarios as immediate parallel shocks to rates, nonparallel (i.e., twist) changes to yield curves that result in their becoming steeper or flatter, and changes to the relationship among the yield curves (i.e., basis risk).
RISK MANAGEMENT (continued)
Market Risk (continued)
The NII sensitivity analysis incorporates certain critical assumptions such as interest rates and client behaviors under changing rate environments. These assumptions are based on a combination of historical analysis and future expected pricing behavior. The simulation cannot precisely estimate NII sensitivity given uncertainty in the assumptions. The following key assumptions are incorporated into the simulation:
▪the balance sheet size and mix remains constant over the simulation horizon with maturing assets and liabilities replaced with instruments with similar terms as those that are maturing, with the exception of certain nonmaturity deposits that are considered short-term in nature and therefore receive a more conservative interest-bearing treatment;
▪prepayments on mortgage loans and securities collateralized by mortgages are projected under each rate scenario using a third-party mortgage analytics system that incorporates market prepayment assumptions;
▪cash flows for structured securities are estimated using a third-party vendor in conjunction with the prepayments provided by the third-party mortgage analytics vendor;
▪nonmaturity deposit pricing is projected based on Northern Trust’s actual historical patterns and management judgment, depending upon the availability of historical data and current pricing strategies/or judgment; and
▪new business rates are based on current spreads to market indices.
The following table shows the estimated NII impact over the next twelve months of 100 and 200 basis point ramps upward and downward in interest rates relative to forward rates as of June 30, 2026 and June 30, 2025. Each rate movement is assumed to occur gradually over a one-year period.
TABLE 28: NET INTEREST INCOME SENSITIVITY
|
|
|
|
|
|
|
|
|
| INCREASE (DECREASE) ESTIMATED IMPACT ON NEXT TWELVE MONTHS OF NET INTEREST INCOME |
| (In Millions) |
JUNE 30, 2026 |
JUNE 30, 2025 |
| Increase in Interest Rates Above Market Implied Forward Rates |
|
|
| 100 Basis Points |
$ |
44
|
|
$ |
69 |
|
| 200 Basis Points |
74
|
|
147 |
|
| Decrease in Interest Rates Below Market Implied Forward Rates |
|
|
| 100 Basis Points |
$ |
(57) |
|
$ |
(89) |
|
| 200 Basis Points |
(147) |
|
$ |
(188) |
|
The NII sensitivity analysis does not incorporate certain management actions that may be used to mitigate adverse effects of actual interest rate movement. For that reason and others, the estimated impacts do not reflect the likely actual results but serve as estimates of interest rate risk. NII sensitivity is not comparable to actual results disclosed elsewhere or directly predictive of future values of other measures provided.
MVE Sensitivity — MVE is defined as the present value of assets minus the present value of liabilities, net of the value of financial derivatives that are used to manage the interest rate risk of balance sheet items. The MVE looks at the whole balance sheet, which includes AFS debt securities, HTM debt securities, money market accounts, deposits, loans and wholesale borrowings. The potential effect of interest rate changes on MVE is derived from the impact of such changes on projected future cash flows and the present value of these cash flows and is then compared to the established limit. Northern Trust uses current market rates (and the future rates implied by these market rates) as the base case and measures MVE sensitivity under various rate scenarios. Stress testing of interest rates is performed to include such scenarios as immediate parallel shocks to rates, nonparallel (i.e., twist) changes to yield curves that result in their becoming steeper or flatter, and changes to the relationship among the yield curves (i.e., basis risk).
The MVE sensitivity analysis incorporates certain critical assumptions such as interest rates and client behaviors under changing rate environments. These assumptions are based on a combination of historical analysis and future expected pricing behavior. The simulation cannot precisely estimate MVE sensitivity given uncertainty in the assumptions. Many of the assumptions that apply to NII sensitivity also apply to MVE sensitivity simulations, with the following separate key assumptions incorporated into the MVE simulation:
▪the present value of nonmaturity deposits is estimated using dynamic decay methodologies or estimated remaining lives, which are based on a combination of Northern Trust’s actual historical runoff patterns and management judgment—some balances are assumed to be core and have longer lives while other balances are assumed to be temporary and have comparatively shorter lives;
▪the present values of most noninterest-bearing balances (such as receivables, equipment, and payables) are the same as their book values; and
▪Monte Carlo simulation is used to generate forward interest rate paths.
RISK MANAGEMENT (continued)
Market Risk (continued)
The following table shows the estimated impact on MVE of 100 and 200 basis point shocks up and down from current market implied forward rates at June 30, 2026 and December 31, 2025. Each rate movement is assumed to occur gradually over a one-year period.
TABLE 29: MARKET VALUE OF EQUITY SENSITIVITY
|
|
|
|
|
|
|
|
|
| INCREASE (DECREASE) ESTIMATED IMPACT ON MARKET VALUE OF EQUITY |
| (In Millions) |
JUNE 30, 2026 |
DECEMBER 31, 2025 |
| Increase in Interest Rates Above Market Implied Forward Rates |
|
|
| 100 Basis Points |
$ |
(623) |
|
$ |
(537) |
|
| 200 Basis Points |
(1,357) |
|
(1,186) |
|
| Decrease in Interest Rates Below Market Implied Forward Rates |
|
|
| 100 Basis Points |
$ |
647
|
|
$ |
534 |
|
| 200 Basis Points |
1,218
|
|
920 |
|
The MVE simulations do not incorporate certain management actions that may be used to mitigate adverse effects of actual interest rate movements. For that reason and others, the estimated impacts do not reflect the likely actual results but serve as estimates of interest rate risk. MVE sensitivity is not comparable to actual results disclosed elsewhere or directly predictive of future values of other measures provided.
Value-At-Risk (VaR) — Northern Trust measures daily the risk of loss associated with trading positions using a VaR model and applying the historical simulation methodology. This statistical model provides estimates, based on high confidence levels, of the potential loss in value that might be incurred if an adverse shift in foreign exchange rates and interest rates were to occur over a small number of days. The model incorporates foreign currency and interest rate volatilities and correlations in price movements among the currencies and interest rates. VaR is computed for each trading desk and for the global portfolio.
Northern Trust monitors several variations of the VaR measures to meet specific regulatory and internal management needs. Variations include different methodologies (historical simulation, Monte Carlo simulation and Taylor approximation), horizons of one day and ten days, confidence levels of 95% and 99%, subcomponent VaRs using only foreign exchange (FX) drivers, only interest rate (IR) drivers, and only volatility drivers, and look-back periods of one year, two years, and four years. Those alternative measures provide management an array of corroborating metrics and alternative perspectives on Northern Trust’s market risks.
The following table presents the levels of total regulatory VaR and its subcomponents, covering global foreign exchange (GFX), foreign currency balances, and interest rate derivatives combined, in the periods indicated below, based on the historical simulation methodology, a 99% confidence level, a one-day horizon and equally weighted volatility. The total VaR is typically less than the sum of its three subcomponents due to diversification benefits derived from interactions among the three drivers.
TABLE 30: VALUE-AT-RISK
|
|
|
|
|
|
|
|
|
|
|
|
|
|
|
|
|
|
|
|
|
|
|
|
|
|
|
|
|
|
|
|
|
| (In Millions) |
Combined Trading Book VaR |
FX VaR
(FX DRIVERS ONLY) |
IR VaR
(IR DRIVERS ONLY) |
|
| THREE MONTHS ENDED |
JUNE 30, 2026 |
MARCH 31, 2026 |
JUNE 30, 2025 |
JUNE 30, 2026 |
MARCH 31, 2026 |
JUNE 30, 2025 |
JUNE 30, 2026 |
MARCH 31, 2026 |
JUNE 30, 2025 |
|
|
|
| High |
$ |
2.1
|
|
$ |
0.5 |
|
$ |
0.6 |
|
$ |
2.0
|
|
$ |
0.5 |
|
$ |
0.6 |
|
$ |
0.2
|
|
$ |
0.2 |
|
$ |
0.3 |
|
|
|
|
| Low |
0.2
|
|
0.2 |
|
0.3 |
|
0.2
|
|
0.1 |
|
0.2 |
|
—
|
|
0.1 |
|
0.1 |
|
|
|
|
| Average |
0.8
|
|
0.3 |
|
0.4 |
|
0.7
|
|
0.2 |
|
0.3 |
|
0.1
|
|
0.1 |
|
0.2 |
|
|
|
|
| Quarter-End |
0.3
|
|
0.3 |
|
0.3 |
|
0.2
|
|
0.3 |
|
0.2 |
|
0.1
|
|
0.1 |
|
0.1 |
|
|
|
|
During the three months ended June 30, 2026, Northern Trust did not incur an actual GFX trading loss in excess of the daily GFX VaR estimate.
Foreign currency balances arise not from executing trades but rather in the course of regular business operations, namely from non-U.S.-dollar-denominated revenues and expenses accruing onto the Corporation’s balance sheet.
RECONCILIATION TO FULLY TAXABLE EQUIVALENT
The following table presents a reconciliation of Interest Income, Net Interest Income, Net Interest Margin, and Total Revenue prepared in accordance with GAAP to such measures on an FTE basis, which are non-GAAP financial measures. Net Interest Margin is calculated by dividing annualized Net Interest Income by average interest-earning assets. Management believes this presentation provides a clearer indication of these financial measures for comparative purposes. When adjusted to an FTE basis, yields on taxable, nontaxable and partially taxable assets are comparable; however, the adjustment to an FTE basis has no impact on Net Income.
TABLE 31: RECONCILIATION TO FULLY TAXABLE EQUIVALENT
|
|
|
|
|
|
|
|
|
|
|
|
|
|
|
|
THREE MONTHS ENDED JUNE 30, |
SIX MONTHS ENDED JUNE 30, |
| ($ In Millions) |
2026 |
2025 |
2026 |
2025 |
| Net Interest Income |
|
|
|
|
| Interest Income - GAAP |
$ |
2,189.3
|
|
$ |
2,212.8 |
|
$ |
4,423.4
|
|
$ |
4,353.7 |
|
| Add: FTE Adjustment |
7.6
|
|
4.7 |
|
15.2
|
|
10.3 |
|
| Interest Income (FTE) - Non-GAAP |
$ |
2,196.9
|
|
$ |
2,217.5 |
|
$ |
4,438.6
|
|
$ |
4,364.0 |
|
|
|
|
|
|
| Net Interest Income - GAAP |
$ |
675.5
|
|
$ |
610.5 |
|
$ |
1,329.5
|
|
$ |
1,178.6 |
|
| Add: FTE Adjustment |
7.6
|
|
4.7 |
|
15.2
|
|
10.3 |
|
| Net Interest Income (FTE) - Non-GAAP |
$ |
683.1
|
|
$ |
615.2 |
|
$ |
1,344.7
|
|
$ |
1,188.9 |
|
| |
|
|
|
|
| Net Interest Margin - GAAP |
1.79
|
% |
1.68 |
% |
1.76
|
% |
1.67 |
% |
| Net Interest Margin (FTE) - Non-GAAP |
1.81
|
% |
1.69 |
% |
1.78
|
% |
1.69 |
% |
|
|
|
|
|
| Total Revenue |
|
|
|
|
| Total Revenue - GAAP |
$ |
2,698.0
|
|
$ |
1,997.9 |
|
$ |
4,903.7
|
|
$ |
3,937.9 |
|
| Add: FTE Adjustment |
7.6
|
|
4.7 |
|
15.2
|
|
10.3 |
|
| Total Revenue (FTE) - Non-GAAP |
$ |
2,705.6
|
|
$ |
2,002.6 |
|
$ |
4,918.9
|
|
$ |
3,948.2 |
|
FORWARD-LOOKING STATEMENTS
This report may include statements which constitute “forward-looking statements” within the meaning of the safe harbor provisions of the Private Securities Litigation Reform Act of 1995. Forward-looking statements are identified typically by words or phrases such as “believe,” “expect,” “anticipate,” “intend,” “estimate,” “project,” “likely,” “plan,” “goal,” “target,” “strategy,” and similar expressions or future or conditional verbs such as “may,” “will,” “should,” “would,” and “could.” Forward-looking statements include statements, other than those related to historical facts, that relate to Northern Trust’s financial results and outlook; capital adequacy; dividend policy and share repurchase program; accounting estimates and assumptions; credit quality including allowance levels; future pension plan contributions; effective tax rate; anticipated expense levels; contingent liabilities; acquisitions; strategies; market and industry trends; and expectations regarding the impact of accounting pronouncements and legislation. These statements are based on Northern Trust’s current beliefs and expectations of future events or future results, and involve risks and uncertainties that are difficult to predict and subject to change. These statements are also based on assumptions about many important factors, including:
•financial market disruptions or economic recession in the U.S. or other countries across the globe resulting from any of a number of factors;
•volatility or changes in financial markets, including debt and equity markets, that impact the value, liquidity, or credit ratings of financial assets in general, or financial assets held in particular investment funds or client portfolios, including those funds, portfolios, and other financial assets with respect to which Northern Trust has taken, or may in the future take, actions to provide asset value stability or additional liquidity;
•the impact of equity markets on fee revenue;
•changes in interest rates or in the monetary or other policies of various regulatory authorities or central banks;
•changes in trade policy, including the imposition of tariffs or the impacts of retaliatory tariffs;
•Northern Trust’s success in controlling the costs and expenses of its business operations and the impacts of any broader inflationary environment thereon;
•a decline in the value of securities held in Northern Trust’s investment portfolio, the liquidity and pricing of which may be negatively impacted by periods of economic turmoil and financial market disruptions;
•Northern Trust’s ability to address operating risks, including those related to cybersecurity, data privacy and security, human errors or omissions, pricing or valuation of securities, fraud, operational resilience (including systems performance), failure to maintain sustainable business practices, and breakdowns in processes or internal controls;
•Northern Trust's success in responding to and investing in changes and advancements in technology, including artificial intelligence
•geopolitical risks, risks related to global climate change and the risks of extraordinary events such as pandemics, natural disasters, terrorist events, global conflicts and war, and the responses of the U.S. and other countries to those events;
•unexpected deposit outflows;
•the effectiveness of Northern Trust’s management of its human capital, including its success in recruiting and retaining necessary and diverse personnel to support business growth and expansion and maintain sufficient expertise to support increasingly complex products and services;
•changes in the legal, regulatory and enforcement framework and oversight applicable to financial institutions, including Northern Trust;
•changes in foreign exchange trading client volumes and volatility in foreign currency exchange rates, changes in the valuation of the U.S. dollar relative to other currencies in which Northern Trust records revenue or accrues expenses, and Northern Trust’s success in assessing and mitigating the risks arising from all such changes and volatility;
•a significant downgrade of any of Northern Trust’s debt ratings;
•the health and soundness of the financial institutions and other counterparties with which Northern Trust conducts business;
•uncertainties inherent in the complex and subjective judgments required to assess credit risk and establish appropriate allowances therefor;
•increased costs of compliance and other risks associated with changes in regulation, the current regulatory environment, and areas of increased regulatory emphasis and oversight in the U.S. and other countries, such as anti-money laundering, anti-bribery, and data privacy and security;
•failure to satisfy regulatory standards or to obtain regulatory approvals when required, including for the use and distribution of capital;
•Northern Trust’s success in continuing to enhance its risk management practices and controls and managing risks inherent in its businesses, including credit risk, operational risk, market and liquidity risk, fiduciary risk, compliance risk and strategic risk;
•risks and uncertainties inherent in the litigation and regulatory process, including the possibility that losses may be in excess of Northern Trust’s recorded liability and estimated range of possible loss for litigation exposures;
FORWARD-LOOKING STATEMENTS (continued)
•the risk of damage to Northern Trust’s reputation which may undermine the confidence of clients, counterparties, rating agencies, and stockholders;
•the downgrade of U.S. government-issued and other securities;
•changes in tax laws, accounting requirements or interpretations and other legislation in the U.S. or other countries that could affect Northern Trust or its clients;
•the pace and extent of continued globalization of investment activity and growth in worldwide financial assets;
•changes in the nature and activities of Northern Trust’s competition;
•Northern Trust’s success in maintaining existing business and continuing to generate new business in existing and targeted markets and its ability to deploy deposits in a profitable manner consistent with its liquidity requirements;
•Northern Trust’s ability to address the complex needs of a global client base and manage compliance with legal, tax, regulatory and other requirements;
•Northern Trust’s ability to maintain a product mix that achieves acceptable margins;
•Northern Trust’s ability to continue to generate investment results that satisfy clients and to develop an array of investment products;
•uncertainties inherent in Northern Trust’s assumptions concerning its pension plan, including discount rates and expected contributions, returns and payouts;
•risks associated with being a holding company, including Northern Trust’s dependence on dividends from its principal subsidiary; and
•other factors identified elsewhere in the Corporation’s Annual Report on Form 10-K for the year ended December 31, 2025, including those factors described in Item 1A, “Risk Factors,” and other filings with the SEC, all of which are available on Northern Trust’s website.
Actual results may differ materially from those expressed or implied by forward-looking statements. The information contained herein is current only as of the date of that information. All forward-looking statements included in this document are based upon information presently available, and Northern Trust assumes no obligation to update its forward-looking statements.
Item 1. Consolidated Financial Statements (unaudited)
|
|
|
|
|
|
| CONSOLIDATED BALANCE SHEET (UNAUDITED) |
NORTHERN TRUST CORPORATION |
|
|
|
|
|
|
|
|
|
| (In Millions Except Share Information) |
JUNE 30, 2026 |
DECEMBER 31, 2025 |
|
|
|
| ASSETS |
|
|
| Cash and Due from Banks |
$ |
5,736.9
|
|
$ |
5,873.1 |
|
| Federal Reserve and Other Central Bank Deposits |
50,636.2
|
|
53,524.9 |
|
| Interest-Bearing Deposits with Banks |
1,544.9
|
|
1,729.4 |
|
| Federal Funds Sold and Securities Purchased under Agreements to Resell |
426.5
|
|
2,654.1 |
|
| Debt Securities |
|
|
Available for Sale (Amortized cost of $38,198.3 and $34,102.4) |
38,123.1
|
|
34,036.5 |
|
Held to Maturity (Fair value of $22,353.5 and $22,381.2) |
23,492.1
|
|
23,429.6 |
|
|
|
|
| Total Debt Securities |
61,615.2
|
|
57,466.1 |
|
| Loans |
|
|
| Commercial |
21,363.3
|
|
20,431.0 |
|
| Personal |
22,458.7
|
|
21,517.3 |
|
Total Loans (Net of unearned income of $4.9 and $5.3) |
43,822.0
|
|
41,948.3 |
|
| Allowance for Credit Losses |
(168.4) |
|
(175.0) |
|
| Buildings and Equipment |
447.6
|
|
464.6 |
|
| Goodwill |
709.6
|
|
712.9 |
|
| Other Assets |
14,526.7
|
|
12,934.3 |
|
| Total Assets |
$ |
179,297.2
|
|
$ |
177,132.7 |
|
| LIABILITIES |
|
|
| Deposits |
|
|
| Demand and Other Noninterest-Bearing |
$ |
15,315.9
|
|
$ |
14,810.7 |
|
| Savings, Money Market and Other Interest-Bearing |
34,419.1
|
|
28,984.1 |
|
| Savings Certificates and Other Time |
4,686.9
|
|
6,418.9 |
|
| Non U.S. Offices — Noninterest-Bearing |
12,884.1
|
|
12,537.9 |
|
— Interest-Bearing
|
78,274.0
|
|
80,046.1 |
|
| Total Deposits |
145,580.0
|
|
142,797.7 |
|
| Federal Funds Purchased |
1,568.9
|
|
2,141.1 |
|
| Securities Sold Under Agreements to Repurchase |
175.6
|
|
292.2 |
|
| Other Borrowings |
8,627.2
|
|
7,158.3 |
|
| Senior Notes |
3,331.2
|
|
3,351.5 |
|
| Long-Term Debt |
2,073.3
|
|
3,484.4 |
|
| Other Liabilities |
4,539.4
|
|
4,949.6 |
|
| Total Liabilities |
165,895.6
|
|
164,174.8 |
|
| STOCKHOLDERS' EQUITY |
|
|
Preferred Stock, No Par Value; Authorized 10,000,000 shares: |
|
|
Series D, authorized and outstanding shares of 5,000 |
493.5
|
|
493.5 |
|
Series E, authorized and outstanding shares of 16,000 |
391.4
|
|
391.4 |
|
Common Stock, $1.66 2/3 Par Value; Authorized 560,000,000 shares; |
|
|
Outstanding shares of 182,955,653 and 186,337,588 |
408.6
|
|
408.6 |
|
| Additional Paid-In Capital |
1,044.4
|
|
1,039.0 |
|
| Retained Earnings |
17,706.5
|
|
16,709.3 |
|
| Accumulated Other Comprehensive Loss |
(551.7) |
|
(590.5) |
|
Treasury Stock (62,215,871 and 58,833,936 shares, at cost) |
(6,091.1) |
|
(5,493.4) |
|
| Total Stockholders’ Equity |
13,401.6
|
|
12,957.9 |
|
| Total Liabilities and Stockholders’ Equity |
$ |
179,297.2
|
|
$ |
177,132.7 |
|
See accompanying notes to the consolidated financial statements.
|
|
|
|
|
|
CONSOLIDATED STATEMENTS OF INCOME
(UNAUDITED) |
NORTHERN TRUST CORPORATION |
|
|
|
|
|
|
|
|
|
|
|
|
|
|
|
|
THREE MONTHS ENDED JUNE 30, |
SIX MONTHS ENDED JUNE 30, |
| (In Millions Except Share Information) |
2026 |
2025 |
2026 |
2025 |
| Noninterest Income |
|
|
|
|
| Trust, Investment and Other Servicing Fees |
$ |
1,349.5
|
|
$ |
1,231.1 |
|
$ |
2,690.9
|
|
$ |
2,444.9 |
|
| Foreign Exchange Trading Income |
97.1
|
|
50.6 |
|
184.8
|
|
109.3 |
|
| Security Commissions and Trading Income |
55.6
|
|
39.6 |
|
107.7
|
|
78.7 |
|
Other Operating Income(1)
|
594.2
|
|
66.1 |
|
664.7
|
|
126.4 |
|
| Investment Security Gains (Losses), net |
(73.9) |
|
— |
|
(73.9) |
|
— |
|
| Total Noninterest Income |
2,022.5
|
|
1,387.4 |
|
3,574.2
|
|
2,759.3 |
|
| Net Interest Income |
|
|
|
|
| Interest Income |
2,189.3
|
|
2,212.8 |
|
4,423.4
|
|
4,353.7 |
|
| Interest Expense |
1,513.8
|
|
1,602.3 |
|
3,093.9
|
|
3,175.1 |
|
| Net Interest Income |
675.5
|
|
610.5 |
|
1,329.5
|
|
1,178.6 |
|
| Provision for Credit Losses |
(5.3) |
|
16.5 |
|
(8.3) |
|
17.5 |
|
| Net Interest Income after Provision for Credit Losses |
680.8
|
|
594.0 |
|
1,337.8
|
|
1,161.1 |
|
| Noninterest Expense |
|
|
|
|
| Compensation and Benefits |
868.0
|
|
732.5 |
|
1,690.2
|
|
1,486.6 |
|
| Outside Services |
246.3
|
|
247.0 |
|
483.0
|
|
492.2 |
|
| Equipment and Software |
378.5
|
|
293.7 |
|
686.6
|
|
574.6 |
|
| Occupancy |
53.5
|
|
52.5 |
|
104.8
|
|
105.9 |
|
| Other Operating Expense |
92.3
|
|
90.9 |
|
182.0
|
|
174.9 |
|
| Total Noninterest Expense |
1,638.6
|
|
1,416.6 |
|
3,146.6
|
|
2,834.2 |
|
| Income before Income Taxes |
1,064.7
|
|
564.8 |
|
1,765.4
|
|
1,086.2 |
|
| Provision for Income Taxes |
272.5
|
|
143.5 |
|
447.6
|
|
272.9 |
|
| Net Income |
$ |
792.2
|
|
$ |
421.3 |
|
$ |
1,317.8
|
|
$ |
813.3 |
|
| Preferred Stock Dividends |
4.7
|
|
4.7 |
|
20.9
|
|
20.9 |
|
| Net Income Applicable to Common Stock |
$ |
787.5
|
|
$ |
416.6 |
|
$ |
1,296.9
|
|
$ |
792.4 |
|
| Per Common Share |
|
|
|
|
| Net Income – Basic |
$ |
4.25
|
|
$ |
2.14 |
|
$ |
6.97
|
|
$ |
4.05 |
|
| – Diluted |
4.23
|
|
2.13 |
|
6.93
|
|
4.03 |
|
| Average Number of Common Shares Outstanding |
|
|
|
|
| – Basic |
183,993,670
|
|
192,751,910 |
|
184,742,283
|
|
193,965,606 |
|
| – Diluted |
184,889,944
|
|
193,374,888 |
|
185,709,785
|
|
194,742,332 |
|
(1) Beginning in Q1 2026, Treasury Management Fees are included within Other Operating Income. The prior period has been revised to conform to the current year presentation.
|
|
|
|
|
|
CONSOLIDATED STATEMENTS OF
COMPREHENSIVE INCOME (UNAUDITED) |
NORTHERN TRUST CORPORATION |
|
|
|
|
|
|
|
|
|
|
|
|
|
|
|
|
|
|
|
|
|
THREE MONTHS ENDED JUNE 30, |
SIX MONTHS ENDED JUNE 30, |
| (In Millions) |
2026 |
2025 |
2026 |
2025 |
| Net Income |
$ |
792.2
|
|
$ |
421.3 |
|
$ |
1,317.8
|
|
$ |
813.3 |
|
| Other Comprehensive Income (Loss) (Net of Tax and Reclassifications) |
|
|
|
|
| Net Unrealized Gains (Losses) on Available for Sale Debt Securities |
72.7
|
|
45.9 |
|
28.1
|
|
116.9 |
|
| Net Unrealized Gains (Losses) on Cash Flow Hedges |
(1.7) |
|
(0.1) |
|
(7.0) |
|
(0.6) |
|
| Net Foreign Currency Adjustments |
9.0
|
|
(7.7) |
|
10.6
|
|
(3.0) |
|
| Net Pension and Other Postretirement Benefit Adjustments |
4.9
|
|
2.2 |
|
7.1
|
|
1.5 |
|
| Other Comprehensive Income (Loss) |
84.9
|
|
40.3 |
|
38.8
|
|
114.8 |
|
| Comprehensive Income |
$ |
877.1
|
|
$ |
461.6 |
|
$ |
1,356.6
|
|
$ |
928.1 |
|
See accompanying notes to the consolidated financial statements.
|
|
|
|
|
|
CONSOLIDATED STATEMENTS OF CHANGES IN STOCKHOLDERS’ EQUITY
(UNAUDITED) |
NORTHERN TRUST CORPORATION |
|
|
|
|
|
|
|
|
|
|
|
|
|
|
|
|
|
|
|
|
|
|
|
|
|
SIX MONTHS ENDED JUNE 30, 2026 |
| (In Millions Except Per Share Information) |
PREFERRED STOCK |
COMMON STOCK |
ADDITIONAL PAID-IN CAPITAL |
RETAINED EARNINGS |
ACCUMULATED OTHER COMPREHENSIVE INCOME (LOSS) |
TREASURY STOCK |
TOTAL |
| Balance at December 31, 2025 |
$ |
884.9
|
|
$ |
408.6
|
|
$ |
1,039.0
|
|
$ |
16,709.3
|
|
$ |
(590.5) |
|
$ |
(5,493.4) |
|
$ |
12,957.9
|
|
| Net Income |
— |
|
— |
|
— |
|
525.5
|
|
— |
|
— |
|
525.5
|
|
| Other Comprehensive Income (Loss) (Net of Tax and Reclassifications) |
— |
|
— |
|
— |
|
— |
|
(46.1) |
|
— |
|
(46.1) |
|
| Dividends Declared: |
|
|
|
|
|
|
|
Common Stock, $0.80 per share |
— |
|
— |
|
— |
|
(150.8) |
|
— |
|
— |
|
(150.8) |
|
| Preferred Stock |
— |
|
— |
|
— |
|
(16.2) |
|
— |
|
— |
|
(16.2) |
|
| Stock Awards and Options Exercised |
— |
|
— |
|
(35.7) |
|
— |
|
— |
|
113.3
|
|
77.6
|
|
| Stock Purchased |
— |
|
— |
|
— |
|
— |
|
— |
|
(358.9) |
|
(358.9) |
|
| Excise Tax on Share Repurchases |
— |
|
— |
|
— |
|
— |
|
— |
|
(1.7) |
|
(1.7) |
|
| Balance at March 31, 2026 |
$ |
884.9
|
|
$ |
408.6
|
|
$ |
1,003.3
|
|
$ |
17,067.8
|
|
$ |
(636.6) |
|
$ |
(5,740.7) |
|
$ |
12,987.3
|
|
| Net Income |
—
|
|
—
|
|
—
|
|
792.2
|
|
—
|
|
—
|
|
792.2
|
|
| Other Comprehensive Income (Loss) (Net of Tax and Reclassifications) |
—
|
|
—
|
|
—
|
|
—
|
|
84.9
|
|
—
|
|
84.9
|
|
| Dividends Declared: |
|
|
|
|
|
|
|
Common Stock, $0.80 per share |
—
|
|
—
|
|
—
|
|
(148.8) |
|
—
|
|
—
|
|
(148.8) |
|
| Preferred Stock |
—
|
|
—
|
|
—
|
|
(4.7) |
|
—
|
|
—
|
|
(4.7) |
|
| Stock Awards and Options Exercised |
—
|
|
—
|
|
41.1
|
|
—
|
|
—
|
|
3.6
|
|
44.7
|
|
| Stock Purchased |
—
|
|
—
|
|
—
|
|
—
|
|
—
|
|
(350.6) |
|
(350.6) |
|
| Excise Tax on Share Repurchases |
—
|
|
—
|
|
—
|
|
—
|
|
—
|
|
(3.4) |
|
(3.4) |
|
| Balance at June 30, 2026 |
$ |
884.9
|
|
$ |
408.6
|
|
$ |
1,044.4
|
|
$ |
17,706.5
|
|
$ |
(551.7) |
|
$ |
(6,091.1) |
|
$ |
13,401.6
|
|
|
|
|
|
|
|
|
|
|
|
|
|
|
|
|
|
|
|
|
|
|
|
|
|
|
|
|
|
|
|
|
|
|
|
|
|
|
|
|
|
|
|
|
|
|
|
|
|
|
|
|
|
|
|
|
|
|
|
|
|
|
|
|
|
|
|
|
|
|
|
|
|
See accompanying notes to the consolidated financial statements.
|
|
|
|
|
|
|
|
|
|
|
|
|
|
|
|
|
|
|
|
|
|
|
|
|
SIX MONTHS ENDED JUNE 30, 2025 |
| (In Millions Except Per Share Information) |
PREFERRED STOCK |
COMMON STOCK |
ADDITIONAL PAID-IN CAPITAL |
RETAINED EARNINGS |
ACCUMULATED OTHER COMPREHENSIVE INCOME (LOSS) |
TREASURY STOCK |
TOTAL |
| Balance at December 31, 2024 |
$ |
884.9 |
|
$ |
408.6 |
|
$ |
1,025.3 |
|
$ |
15,614.7 |
|
$ |
(814.0) |
|
$ |
(4,331.1) |
|
$ |
12,788.4 |
|
| Net Income |
— |
|
— |
|
— |
|
392.0 |
|
— |
|
— |
|
392.0 |
|
| Other Comprehensive Income (Loss) (Net of Tax and Reclassifications) |
— |
|
— |
|
— |
|
— |
|
74.5 |
|
— |
|
74.5 |
|
| Dividends Declared: |
|
|
|
|
|
|
|
Common Stock, $0.75 per share |
— |
|
— |
|
— |
|
(148.2) |
|
— |
|
— |
|
(148.2) |
|
| Preferred Stock |
— |
|
— |
|
— |
|
(16.2) |
|
— |
|
— |
|
(16.2) |
|
| Stock Awards and Options Exercised |
— |
|
— |
|
(28.3) |
|
— |
|
— |
|
105.1 |
|
76.8 |
|
| Stock Purchased |
— |
|
— |
|
— |
|
— |
|
— |
|
(287.2) |
|
(287.2) |
|
| Excise Tax on Share Repurchases |
— |
|
— |
|
— |
|
— |
|
— |
|
(1.6) |
|
(1.6) |
|
| Balance at March 31, 2025 |
$ |
884.9 |
|
$ |
408.6 |
|
$ |
997.0 |
|
$ |
15,842.3 |
|
$ |
(739.5) |
|
$ |
(4,514.8) |
|
$ |
12,878.5 |
|
| Net Income |
— |
|
— |
|
— |
|
421.3 |
|
— |
|
— |
|
421.3 |
|
| Other Comprehensive Income (Loss) (Net of Tax and Reclassifications) |
— |
|
— |
|
— |
|
— |
|
40.3 |
|
— |
|
40.3 |
|
| Dividends Declared: |
|
|
|
|
|
|
|
Common Stock, $0.75 per share |
— |
|
— |
|
— |
|
(146.2) |
|
— |
|
— |
|
(146.2) |
|
| Preferred Stock |
— |
|
— |
|
— |
|
(4.7) |
|
— |
|
— |
|
(4.7) |
|
| Stock Awards and Options Exercised |
— |
|
— |
|
13.5 |
|
— |
|
— |
|
6.2 |
|
19.7 |
|
| Stock Purchased |
— |
|
— |
|
— |
|
— |
|
— |
|
(339.4) |
|
(339.4) |
|
| Excise Tax on Share Repurchases |
— |
|
— |
|
— |
|
— |
|
— |
|
(3.0) |
|
(3.0) |
|
| Balance at June 30, 2025 |
$ |
884.9 |
|
$ |
408.6 |
|
$ |
1,010.5 |
|
$ |
16,112.7 |
|
$ |
(699.2) |
|
$ |
(4,851.0) |
|
$ |
12,866.5 |
|
|
|
|
|
|
|
|
|
|
|
|
|
|
|
|
|
|
|
|
|
|
|
|
|
|
|
|
|
|
|
|
|
|
|
|
|
|
|
|
|
|
|
|
|
|
|
|
|
|
|
|
|
|
|
|
|
|
|
|
|
|
|
|
|
|
|
|
|
|
|
|
|
See accompanying notes to the consolidated financial statements.
|
|
|
|
|
|
| CONSOLIDATED STATEMENTS OF CASH FLOWS (UNAUDITED) |
NORTHERN TRUST CORPORATION |
|
|
|
|
|
|
|
|
|
|
SIX MONTHS ENDED JUNE 30, |
| (In Millions) |
2026 |
2025 |
| CASH FLOWS FROM OPERATING ACTIVITIES |
|
|
| Net Income |
$ |
1,317.8
|
|
$ |
813.3 |
|
| Adjustments to Reconcile Net Income to Net Cash (Used in) Provided by Operating Activities |
|
|
| Investment Security Losses (Gains), net |
73.9
|
|
— |
|
| Amortization and Accretion of Securities and Unearned Income, net |
(41.2) |
|
(33.9) |
|
| Provision for Credit Losses |
(8.3) |
|
17.5 |
|
| Depreciation and Amortization |
395.5
|
|
386.4 |
|
| Pension Plan Contributions |
(7.2) |
|
(137.9) |
|
| Change in Receivables |
(126.5) |
|
(10.4) |
|
| Change in Interest Payable |
(27.1) |
|
21.8 |
|
| Change in Collateral With Derivative Counterparties, net |
(1,518.3) |
|
3,086.3 |
|
| Other Operating Activities, net |
(443.5) |
|
476.2 |
|
| Net Cash (Used in) Provided by Operating Activities |
(384.9) |
|
4,619.3 |
|
| CASH FLOWS FROM INVESTING ACTIVITIES |
|
|
|
|
|
| Change in Federal Funds Sold and Securities Purchased under Agreements to Resell |
2,262.2
|
|
(459.2) |
|
| Change in Interest-Bearing Deposits with Banks |
145.1
|
|
(395.9) |
|
| Net Change in Federal Reserve and Other Central Bank Deposits |
2,498.0
|
|
(11,827.3) |
|
| Purchases of Held to Maturity Debt Securities |
(18,134.9) |
|
(14,530.1) |
|
| Proceeds from the Maturity and Redemption of Held to Maturity Debt Securities |
17,806.7
|
|
16,308.5 |
|
| Purchases of Available for Sale Debt Securities |
(9,163.0) |
|
(5,222.0) |
|
| Proceeds from the Maturity and Sales of Available for Sale Debt Securities |
4,995.0
|
|
2,397.3 |
|
| Change in Loans |
(1,901.8) |
|
147.4 |
|
| Purchases of Buildings and Equipment |
(34.8) |
|
(24.8) |
|
| Purchases and Development of Computer Software |
(339.2) |
|
(376.2) |
|
|
|
|
| Proceeds from the Sale of Visa Shares |
169.3
|
|
12.9 |
|
| Other Investing Activities, net |
338.0
|
|
62.8 |
|
| Net Cash Used in Investing Activities |
(1,359.4) |
|
(13,906.6) |
|
| CASH FLOWS FROM FINANCING ACTIVITIES |
|
|
| Change in Deposits |
3,311.8
|
|
10,727.2 |
|
| Change in Federal Funds Purchased |
(572.2) |
|
229.0 |
|
| Change in Securities Sold under Agreements to Repurchase |
(116.6) |
|
379.4 |
|
| Change in Short-Term Other Borrowings |
1,451.8
|
|
(56.7) |
|
|
|
|
|
|
|
|
|
|
| Repayments of Long-Term Debt |
(1,400.0) |
|
— |
|
| Treasury Stock Purchased |
(709.5) |
|
(626.6) |
|
| Net Proceeds from Stock Options |
2.8
|
|
4.5 |
|
| Cash Dividends Paid on Common Stock |
(295.4) |
|
(290.1) |
|
| Cash Dividends Paid on Preferred Stock |
(20.9) |
|
(20.9) |
|
| Other Financing Activities, net |
(4.8) |
|
(5.2) |
|
| Net Cash Provided by Financing Activities |
1,647.0
|
|
10,340.6 |
|
| Effect of Foreign Currency Exchange Rates on Cash |
(38.9) |
|
692.9 |
|
| Change in Cash and Due from Banks |
(136.2) |
|
1,746.2 |
|
| Cash and Due from Banks at Beginning of Period |
5,873.1
|
|
4,677.2 |
|
| Cash and Due from Banks at End of Period |
$ |
5,736.9
|
|
$ |
6,423.4 |
|
| SUPPLEMENTAL DISCLOSURES OF CASH FLOW INFORMATION |
|
|
| Interest Paid |
$ |
3,120.4
|
|
$ |
3,144.6 |
|
| Income Taxes Paid |
312.3
|
|
245.7 |
|
See accompanying notes to the consolidated financial statements.
Notes to Consolidated Financial Statements (unaudited)
Note 1 – Basis of Presentation
The consolidated financial statements include the accounts of Northern Trust Corporation (Corporation) and its wholly-owned subsidiary, The Northern Trust Company (Bank), and various other wholly-owned subsidiaries of the Corporation and Bank. Throughout the notes to the consolidated financial statements, the term “Northern Trust” refers to the Corporation and its subsidiaries. Intercompany balances and transactions have been eliminated in consolidation. The consolidated financial statements, as of and for the periods ended June 30, 2026 and 2025, have not been audited by the Corporation’s independent registered public accounting firm. In the opinion of management, all accounting entries and adjustments, including normal recurring accruals, necessary for a fair presentation of the financial position and the results of operations for the interim periods have been made. The accounting and financial reporting policies of Northern Trust conform to U.S. generally accepted accounting principles (GAAP) and reporting practices prescribed for the banking industry. For a description of Northern Trust’s significant accounting policies, refer to Note 1—Summary of Significant Accounting Policies included under Item 8. Financial Statements and Supplementary Data in the Annual Report on Form 10-K for the year ended December 31, 2025.
Note 2 – Recent Accounting Pronouncements
On January 1, 2026, Northern Trust early adopted ASU No. 2025-09, “Derivatives and Hedging (Topic 815): Hedge Accounting Improvements” (ASU 2025-09). ASU 2025-09 enhances hedge accounting guidance to better align accounting with an entity’s risk management activities by expanding eligibility and operability of hedge accounting across five targeted areas. Upon adoption, ASU 2025-09 did not impact Northern Trust’s consolidated balance sheets or consolidated statements of income. Please refer to Note 21 – Derivative Financial Instruments for further information.
Note 3 – Fair Value Measurements
Fair Value Hierarchy. The following describes the hierarchy of valuation inputs (Levels 1, 2, and 3) used to measure fair value and the primary valuation methodologies used by Northern Trust for financial instruments measured at fair value on a recurring basis. Observable inputs reflect market data obtained from sources independent of the reporting entity; unobservable inputs reflect the entity’s own assumptions about how market participants would value an asset or liability based on the best information available. GAAP requires an entity measuring fair value to maximize the use of observable inputs and minimize the use of unobservable inputs and establishes a fair value hierarchy of inputs. Financial instruments are categorized within the hierarchy based on the lowest level input that is significant to their valuation. No transfers into or out of Level 3 occurred during the six months ended June 30, 2026 or the year ended December 31, 2025.
Level 1 — Quoted, active market prices for identical assets or liabilities.
Northern Trust’s Level 1 assets are comprised primarily of AFS investments in U.S. Treasury securities.
Level 2 — Observable inputs other than Level 1 prices, such as quoted active market prices for similar assets or liabilities, quoted prices for identical or similar assets in inactive markets, and model-derived valuations in which all significant inputs are observable in active markets.
Northern Trust’s Level 2 assets include AFS debt securities, the fair values of which are determined predominantly by external pricing vendors. Prices received from vendors are compared to other vendor and third-party prices. If a security price obtained from a pricing vendor is determined to exceed predetermined tolerance levels that are assigned based on an asset type’s characteristics, the exception is researched and, if the price is not able to be validated, an alternate pricing vendor is utilized, consistent with Northern Trust’s pricing source hierarchy. As of June 30, 2026, Northern Trust’s AFS debt securities portfolio included 1,082 Level 2 debt securities with an aggregate market value of $30.2 billion, substantially all valued by external pricing vendors. As of December 31, 2025, Northern Trust’s AFS debt securities portfolio included 1,003 Level 2 debt securities with an aggregate market value of $25.9 billion, substantially all valued by external pricing vendors.
Level 2 assets and liabilities also include derivative contracts which are valued internally using widely accepted income-based models that incorporate inputs readily observable in actively quoted markets and reflect the contractual terms of the contracts. Observable inputs include foreign exchange rates and interest rates for foreign exchange contracts; interest rates for interest rate swap contracts and forward contracts; and interest rates and volatility inputs for interest rate option contracts. Northern Trust evaluates the impact of counterparty credit risk and its own credit risk on the valuation of its derivative instruments. Factors considered include the likelihood of default by Northern Trust and its counterparties, the remaining maturities of the instruments, net exposures after giving effect to master netting arrangements or similar agreements, available collateral, and other credit enhancements in determining the appropriate fair value of derivative instruments. The resulting valuation adjustments have not been considered material.
Notes to Consolidated Financial Statements (unaudited) (continued)
Level 3 — Valuation techniques in which one or more significant inputs are unobservable in the marketplace.
Northern Trust’s Level 3 liabilities consist of swaps that Northern Trust entered into in connection with the sales of Visa Class B common shares previously held by Northern Trust. Pursuant to the swaps, Northern Trust retains the risks associated with the ultimate conversion of the Visa Class B common shares into Visa Class A common shares, such that the counterparty will be compensated for any dilutive adjustments to the conversion ratio and Northern Trust will be compensated for any anti-dilutive adjustments to the ratio. The swaps also require periodic payments from Northern Trust to the counterparty calculated by reference to the market price of Visa Class A common shares and a fixed rate of interest. The fair value of the swaps is determined using a discounted cash flow methodology. The significant unobservable inputs used in the fair value measurement are Northern Trust’s own assumptions about estimated changes in the conversion rate of the Visa Class B common shares into Visa Class A common shares, the date on which such conversion is expected to occur and the estimated appreciation of the Visa Class A common share price. See “Visa Class B Common Shares and Makewhole Agreement” under Note 20—Commitments and Contingent Liabilities for further information.
Northern Trust believes its valuation methods for its assets and liabilities carried at fair value are appropriate; however, the use of different methodologies or assumptions, particularly as applied to Level 3 assets and liabilities, could have a material effect on the computation of their estimated fair values.
The following table presents the fair values of Northern Trust’s Level 3 liabilities as of June 30, 2026 and December 31, 2025, as well as the valuation techniques, significant unobservable inputs, and quantitative information used to develop significant unobservable inputs for such liabilities as of such dates.
TABLE 32: LEVEL 3 SIGNIFICANT UNOBSERVABLE INPUTS
|
|
|
|
|
|
|
|
|
|
|
|
|
|
|
|
|
|
|
|
|
|
|
|
|
|
|
|
JUNE 30, 2026 |
|
|
| FINANCIAL INSTRUMENT |
FAIR VALUE |
VALUATION TECHNIQUE |
UNOBSERVABLE INPUTS |
INPUT VALUES |
WEIGHTED-AVERAGE INPUT VALUES(1)
|
| Swaps Related to Sale of Certain Visa Class B Common Shares |
$23.0 million |
Discounted Cash Flow |
Conversion Rate |
1.50 |
x |
1.50 |
x |
| Visa Class A Appreciation |
12.88% |
12.88% |
| Expected Duration |
25 |
- |
37 months |
34 months |
(1) Weighted average of expected duration based on scenario probability.
|
|
|
|
|
|
|
|
|
|
|
|
|
|
|
|
|
|
|
|
|
|
|
|
|
|
|
|
DECEMBER 31, 2025 |
|
|
| FINANCIAL INSTRUMENT |
FAIR VALUE |
VALUATION TECHNIQUE |
UNOBSERVABLE INPUTS |
INPUT VALUES |
WEIGHTED-AVERAGE INPUT VALUES(1)
|
| Swaps Related to Sale of Certain Visa Class B Common Shares |
$29.7 million |
Discounted Cash Flow |
Conversion Rate |
1.51 |
|
x |
1.51 |
x |
| Visa Class A Appreciation |
9.69% |
9.69% |
| Expected Duration |
14 |
- |
26 months |
23 months |
(1) Weighted average of expected duration based on scenario probability.
Notes to Consolidated Financial Statements (unaudited) (continued)
The following table presents assets and liabilities measured at fair value on a recurring basis as of June 30, 2026 and December 31, 2025, segregated by fair value hierarchy level.
TABLE 33: RECURRING BASIS HIERARCHY LEVELING
|
|
|
|
|
|
|
|
|
|
|
|
|
|
|
|
|
|
|
JUNE 30, 2026 |
| (In Millions) |
LEVEL 1 |
LEVEL 2 |
LEVEL 3 |
NETTING |
ASSETS/LIABILITIES AT FAIR VALUE |
| Debt Securities |
|
|
|
|
|
| Available for Sale |
|
|
|
|
|
| U.S. Governments |
$ |
7,883.3
|
|
$ |
—
|
|
$ |
—
|
|
$ |
—
|
|
$ |
7,883.3
|
|
|
|
|
|
|
|
| Government Sponsored Agency |
—
|
|
19,302.8
|
|
—
|
|
—
|
|
19,302.8
|
|
| Non-U.S. Government |
—
|
|
408.5
|
|
—
|
|
—
|
|
408.5
|
|
| Corporate Debt |
—
|
|
271.4
|
|
—
|
|
—
|
|
271.4
|
|
| Covered Bonds |
—
|
|
275.7
|
|
—
|
|
—
|
|
275.7
|
|
|
|
|
|
|
|
| Sub-Sovereign, Supranational and Non-U.S. Agency Bonds |
—
|
|
4,670.4
|
|
—
|
|
—
|
|
4,670.4
|
|
| CLOs |
—
|
|
3,453.7
|
|
—
|
|
—
|
|
3,453.7
|
|
| Other Asset-Backed |
—
|
|
1,345.7
|
|
—
|
|
—
|
|
1,345.7
|
|
| Commercial Mortgage-Backed |
—
|
|
511.6
|
|
—
|
|
—
|
|
511.6
|
|
|
|
|
|
|
|
|
|
|
|
|
|
|
|
|
|
|
|
| Total Available for Sale Debt Securities |
7,883.3
|
|
30,239.8
|
|
—
|
|
—
|
|
38,123.1
|
|
| Other Assets |
|
|
|
|
|
Equity Securities(1)
|
110.0
|
|
450.9
|
|
—
|
|
—
|
|
560.9
|
|
| Derivative Assets |
|
|
|
|
|
| Foreign Exchange Contracts |
—
|
|
3,294.6
|
|
—
|
|
(1,768.9) |
|
1,525.7
|
|
| Interest Rate Contracts |
—
|
|
80.2
|
|
—
|
|
(61.2) |
|
19.0
|
|
Other Financial Derivatives(2)
|
—
|
|
0.3
|
|
—
|
|
(0.3) |
|
—
|
|
| Total Derivative Assets |
—
|
|
3,375.1
|
|
—
|
|
(1,830.4) |
|
1,544.7
|
|
| Other Liabilities |
|
|
|
|
|
| Derivative Liabilities |
|
|
|
|
|
| Foreign Exchange Contracts |
—
|
|
3,159.4
|
|
—
|
|
(2,729.3) |
|
430.1
|
|
| Interest Rate Contracts |
—
|
|
138.8
|
|
—
|
|
—
|
|
138.8
|
|
Other Financial Derivatives(3)
|
—
|
|
0.1
|
|
23.0
|
|
(23.1) |
|
—
|
|
| Total Derivative Liabilities |
$ |
—
|
|
$ |
3,298.3
|
|
$ |
23.0
|
|
$ |
(2,752.4) |
|
$ |
568.9
|
|
Note: Northern Trust has elected to net derivative assets and liabilities when legally enforceable master netting arrangements or similar agreements exist between Northern Trust and the counterparty. As of June 30, 2026, derivative assets and liabilities shown above also include reductions of $202.7 million and $1,124.7 million, respectively, as a result of cash collateral received from and deposited with derivative counterparties.
(1) Equity securities consists of a money market investment, Visa Class C common shares, and seed capital investments to certain funds managed by Northern Trust with a fair value of $110.0 million, $370.7 million, and $80.2 million, respectively, as of June 30, 2026.
(2) Other Financial Derivatives assets consists of total return swap contracts.
(3) Other Financial Derivatives liabilities consists of swaps related to the sale of certain Visa Class B common shares and total return swap contracts.
Notes to Consolidated Financial Statements (unaudited) (continued)
|
|
|
|
|
|
|
|
|
|
|
|
|
|
|
|
|
|
|
DECEMBER 31, 2025 |
| (In Millions) |
LEVEL 1 |
LEVEL 2 |
LEVEL 3 |
NETTING |
ASSETS/LIABILITIES AT FAIR VALUE |
| Debt Securities |
|
|
|
|
|
| Available for Sale |
|
|
|
|
|
| U.S. Governments |
$ |
8,172.4 |
|
$ |
— |
|
$ |
— |
|
$ |
— |
|
$ |
8,172.4 |
|
| Obligations of States and Political Subdivisions |
— |
|
313.1 |
|
— |
|
— |
|
313.1 |
|
| Government Sponsored Agency |
— |
|
16,567.5 |
|
— |
|
— |
|
16,567.5 |
|
| Non-U.S. Government |
— |
|
527.2 |
|
— |
|
— |
|
527.2 |
|
| Corporate Debt |
— |
|
64.4 |
|
— |
|
— |
|
64.4 |
|
| Covered Bonds |
— |
|
273.5 |
|
— |
|
— |
|
273.5 |
|
|
|
|
|
|
|
| Sub-Sovereign, Supranational and Non-U.S. Agency Bonds |
— |
|
4,984.3 |
|
— |
|
— |
|
4,984.3 |
|
| CLOs |
— |
|
2,154.9 |
|
— |
|
— |
|
2,154.9 |
|
| Other Asset-Backed |
— |
|
570.2 |
|
— |
|
— |
|
570.2 |
|
| Commercial Mortgage-Backed |
— |
|
409.0 |
|
— |
|
— |
|
409.0 |
|
|
|
|
|
|
|
|
|
|
|
|
|
|
|
|
|
|
|
| Total Available for Sale Debt Securities |
8,172.4 |
|
25,864.1 |
|
— |
|
— |
|
34,036.5 |
|
| Other Assets |
|
|
|
|
|
Equity Securities(1)
|
85.0 |
127.4 |
|
— |
|
— |
|
212.4 |
| Derivative Assets |
|
|
|
|
|
| Foreign Exchange Contracts |
— |
|
1,988.8 |
|
— |
|
(1,696.1) |
|
292.7 |
|
| Interest Rate Contracts |
— |
|
104.8 |
|
— |
|
(82.4) |
|
22.4 |
|
Other Financial Derivatives(2)
|
— |
|
0.7 |
|
— |
|
(0.7) |
|
— |
|
| Total Derivative Assets |
— |
|
2,094.3 |
|
— |
|
(1,779.2) |
|
315.1 |
|
| Other Liabilities |
|
|
|
|
|
| Derivative Liabilities |
|
|
|
|
|
| Foreign Exchange Contracts |
— |
|
2,247.9 |
|
— |
|
(1,139.4) |
|
1,108.5 |
|
| Interest Rate Contracts |
— |
|
130.4 |
|
— |
|
(5.0) |
|
125.4 |
|
Other Financial Derivatives(3)
|
— |
|
1.6 |
|
29.7 |
|
(31.3) |
|
— |
|
| Total Derivative Liabilities |
$ |
— |
|
$ |
2,379.9 |
|
$ |
29.7 |
|
$ |
(1,175.7) |
|
$ |
1,233.9 |
|
Note: Northern Trust has elected to net derivative assets and liabilities when legally enforceable master netting arrangements or similar agreements exist between Northern Trust and the counterparty. As of December 31, 2025, derivative assets and liabilities shown above also include reductions of $1.2 billion and $550.6 million, respectively, as a result of cash collateral received from and deposited with derivative counterparties.
(1) Equity securities consists of a money market investment, seed capital investments to certain funds managed by Northern Trust, and Visa Class C common shares with a fair value of $85.0 million and $112.5 million, and $14.9 million, respectively, as of December 31, 2025.
(2) Other Financial Derivatives assets consists of total return swap contracts.
(3) Other Financial Derivatives liabilities consists of swaps related to the sale of certain Visa Class B common shares and total return swap contracts.
The following table presents the changes in Level 3 liabilities for the three and six months ended June 30, 2026 and 2025.
TABLE 34: CHANGES IN LEVEL 3 LIABILITIES
|
|
|
|
|
|
|
|
|
| (In Millions) |
SWAPS RELATED TO SALE OF CERTAIN VISA CLASS B COMMON SHARES |
| THREE MONTHS ENDED JUNE 30, |
2026 |
2025 |
Fair Value at April 1 |
$ |
22.4
|
|
$ |
29.5 |
|
| Total (Gains) Losses: |
|
|
Included in Earnings(1)
|
5.9
|
|
(0.2) |
|
| Purchases, Issues, Sales, and Settlements |
|
|
| Settlements |
(5.3) |
|
(6.5) |
|
Fair Value at June 30 |
$ |
23.0
|
|
$ |
22.8 |
|
(1) (Gains) Losses are recorded in Other Operating Income on the consolidated statements of income.
Notes to Consolidated Financial Statements (unaudited) (continued)
|
|
|
|
|
|
|
|
|
| (In Millions) |
SWAPS RELATED TO SALE OF CERTAIN VISA CLASS B COMMON SHARES |
| SIX MONTHS ENDED JUNE 30, |
2026 |
2025 |
| Fair Value at January 1 |
$ |
29.7
|
|
$ |
27.2 |
|
| Total Losses: |
|
|
Included in Earnings(1)
|
3.1
|
|
5.4 |
|
| Purchases, Issues, Sales, and Settlements |
|
|
| Settlements |
(9.8) |
|
(9.8) |
|
Fair Value at June 30 |
$ |
23.0
|
|
$ |
22.8 |
|
(1) Losses are recorded in Other Operating Income on the consolidated statements of income.
Carrying values of assets and liabilities that are not measured at fair value on a recurring basis may be adjusted to fair value in periods subsequent to their initial recognition, for example, to record an impairment of an asset. GAAP requires entities to separately disclose these subsequent fair value measurements and to classify them under the fair value hierarchy.
Assets measured at fair value on a nonrecurring basis during the six months ended June 30, 2026 and year ended December 31, 2025, all of which were categorized as Level 3 under the fair value hierarchy, were comprised of nonaccrual loans whose values were based on real estate collateral
Fair values of real estate loan collateral were estimated using a market approach typically supported by third-party valuations and property-specific fees and taxes. The fair values of real estate loan collateral were subject to adjustments to reflect management’s judgment as to realizable value and consisted of a discount factor of 25.0% with a weighted average based on fair values of 25.0% and a discount factor of 40.0% with a weighted average based on fair values of 40.0%, during the six months ended June 30, 2026 and year ended December 31, 2025, respectively. Other loan collateral, which typically consists of accounts receivable, inventory and equipment, is valued using a market approach adjusted for asset-specific characteristics and in limited instances third-party valuations are used. OREO assets are carried at the lower of cost or fair value less estimated costs to sell, with fair value typically based on third-party appraisals. There was no outstanding OREO as of June 30, 2026 and December 31, 2025.
Collateral-dependant nonaccrual loans that have been adjusted to fair value totaled $1.3 million during the six months ended June 30, 2026 and year ended December 31, 2025.
The following table presents the fair values of Northern Trust’s Level 3 assets that were adjusted to fair value on a nonrecurring basis during the six months ended June 30, 2026 and the year ended December 31, 2025, as well as the valuation technique, significant unobservable inputs and quantitative information used to develop the significant unobservable inputs for such assets as of such dates.
TABLE 35: LEVEL 3 NONRECURRING BASIS SIGNIFICANT UNOBSERVABLE INPUTS
|
|
|
|
|
|
|
|
|
|
|
|
|
|
|
|
|
|
|
|
|
|
|
|
|
JUNE 30, 2026 |
|
| FINANCIAL INSTRUMENT |
FAIR VALUE(1)
|
VALUATION TECHNIQUE |
UNOBSERVABLE INPUTS |
INPUT VALUES |
WEIGHTED-AVERAGE INPUT VALUES |
| Loans |
$1.3 million |
Market Approach |
Discount factor applied to real estate collateral-dependent loans to reflect realizable value
|
25.0% |
25.0% |
|
|
|
|
|
|
|
|
(1) Includes a real estate collateral-dependent loan.
|
|
|
|
|
|
|
|
|
|
|
|
|
|
|
|
|
|
|
|
|
|
|
|
|
DECEMBER 31, 2025 |
|
| FINANCIAL INSTRUMENT |
FAIR VALUE(1)
|
VALUATION TECHNIQUE |
UNOBSERVABLE INPUTS |
INPUT VALUES |
WEIGHTED-AVERAGE INPUT VALUES |
| Loans |
$1.3 million |
Market Approach |
Discount factor applied to real estate collateral-dependent loans to reflect realizable value
|
40.0% |
40.0% |
|
|
|
|
|
|
|
|
(1) Includes a real estate collateral-dependent loan.
Notes to Consolidated Financial Statements (unaudited) (continued)
The following tables present the carrying value and estimated fair value, including the fair value hierarchy level, of Northern Trust’s financial instruments that are not measured at fair value on the consolidated balance sheets as of June 30, 2026 and December 31, 2025. The following tables exclude those items measured at fair value on a recurring basis.
TABLE 36: FAIR VALUE OF FINANCIAL INSTRUMENTS
|
|
|
|
|
|
|
|
|
|
|
|
|
|
|
|
|
|
|
JUNE 30, 2026 |
|
|
|
ESTIMATED FAIR VALUE |
| (In Millions) |
BOOK VALUE |
TOTAL ESTIMATED FAIR VALUE |
LEVEL 1 |
LEVEL 2 |
LEVEL 3 |
| FINANCIAL ASSETS |
|
|
|
| Cash and Due from Banks |
$ |
5,736.9
|
|
$ |
5,736.9
|
|
$ |
5,736.9
|
|
$ |
—
|
|
$ |
—
|
|
| Federal Reserve and Other Central Bank Deposits |
50,636.2
|
|
50,636.2
|
|
—
|
|
50,636.2
|
|
—
|
|
| Interest-Bearing Deposits with Banks |
1,544.9
|
|
1,544.9
|
|
—
|
|
1,544.9
|
|
—
|
|
| Federal Funds Sold and Securities Purchased under Agreements to Resell |
426.5
|
|
426.5
|
|
—
|
|
426.5
|
|
—
|
|
| Debt Securities - Held to Maturity |
23,492.1
|
|
22,353.5
|
|
—
|
|
22,353.5
|
|
—
|
|
| Loans |
|
|
|
|
|
| Held for Investment |
43,661.1
|
|
43,526.1
|
|
—
|
|
—
|
|
43,526.1
|
|
|
|
|
|
|
|
| Other Assets |
1,629.9
|
|
1,623.4
|
|
87.4
|
|
1,536.0
|
|
—
|
|
| FINANCIAL LIABILITIES |
|
|
|
|
|
| Deposits |
145,580.0
|
|
145,609.7
|
|
—
|
|
145,609.7
|
|
—
|
|
| Federal Funds Purchased |
1,568.9
|
|
1,568.9
|
|
—
|
|
1,568.9
|
|
—
|
|
| Securities Sold Under Agreements to Repurchase |
175.6
|
|
175.6
|
|
—
|
|
175.6
|
|
—
|
|
| Other Borrowings |
8,627.2
|
|
8,637.4
|
|
—
|
|
8,637.4
|
|
—
|
|
| Senior Notes |
3,331.2
|
|
3,378.7
|
|
—
|
|
3,378.7
|
|
—
|
|
| Long-Term Debt |
2,073.3
|
|
2,149.3
|
|
—
|
|
2,149.3
|
|
—
|
|
| Unfunded Commitments |
323.6
|
|
323.6
|
|
—
|
|
323.6
|
|
—
|
|
| Other Liabilities |
35.7
|
|
35.7
|
|
—
|
|
—
|
|
35.7
|
|
|
|
|
|
|
|
|
|
|
|
|
|
|
|
|
|
|
|
|
|
DECEMBER 31, 2025 |
|
|
|
|
ESTIMATED FAIR VALUE |
|
| (In Millions) |
BOOK VALUE |
TOTAL ESTIMATED FAIR VALUE |
LEVEL 1 |
LEVEL 2 |
LEVEL 3 |
|
| FINANCIAL ASSETS |
|
|
|
|
|
|
| Cash and Due from Banks |
$ |
5,873.1 |
|
$ |
5,873.1 |
|
$ |
5,873.1 |
|
$ |
— |
|
$ |
— |
|
|
| Federal Reserve and Other Central Bank Deposits |
53,524.9 |
|
53,524.9 |
|
— |
|
53,524.9 |
|
— |
|
|
| Interest-Bearing Deposits with Banks |
1,729.4 |
|
1,729.4 |
|
— |
|
1,729.4 |
|
— |
|
|
| Federal Funds Sold and Securities Purchased under Agreements to Resell |
2,654.1 |
|
2,654.1 |
|
— |
|
2,654.1 |
|
— |
|
|
| Debt Securities - Held to Maturity |
23,429.6 |
|
22,381.2 |
|
— |
|
22,381.2 |
|
— |
|
|
| Loans |
|
|
|
|
|
|
| Held for Investment |
41,777.1 |
|
41,661.2 |
|
— |
|
— |
|
41,661.2 |
|
|
| Held for Sale |
6.8 |
|
6.8 |
|
— |
|
6.8 |
|
— |
|
|
| Other Assets |
1,668.6 |
|
1,664.8 |
|
86.3 |
|
1,578.5 |
|
— |
|
|
| FINANCIAL LIABILITIES |
|
|
|
|
|
|
| Deposits |
142,797.7 |
|
142,348.6 |
|
— |
|
142,348.6 |
|
— |
|
|
| Federal Funds Purchased |
2,141.1 |
|
2,141.1 |
|
— |
|
2,141.1 |
|
— |
|
|
| Securities Sold Under Agreements to Repurchase |
292.2 |
|
292.2 |
|
— |
|
292.2 |
|
— |
|
|
| Other Borrowings |
7,158.3 |
|
7,185.5 |
|
— |
|
7,185.5 |
|
— |
|
|
| Senior Notes |
3,351.5 |
|
3,405.5 |
|
— |
|
3,405.5 |
|
— |
|
|
| Long-Term Debt |
3,484.4 |
|
3,596.8 |
|
— |
|
3,596.8 |
|
— |
|
|
| Unfunded Commitments |
373.0 |
|
373.0 |
|
— |
|
373.0 |
|
— |
|
|
| Other Liabilities |
37.9 |
|
37.9 |
|
— |
|
— |
|
37.9 |
|
|
Notes to Consolidated Financial Statements (unaudited) (continued)
Note 4 – Securities
The following tables provide the amortized cost, fair values, and remaining maturities of AFS debt securities and HTM debt securities by security type as of June 30, 2026 and December 31, 2025.
TABLE 37: RECONCILIATION OF AMORTIZED COST TO FAIR VALUE OF DEBT SECURITIES
|
|
|
|
|
|
|
|
|
|
|
|
|
|
|
|
JUNE 30, 2026 |
| (In Millions) |
AMORTIZED COST |
GROSS UNREALIZED GAINS |
GROSS UNREALIZED LOSSES |
FAIR VALUE |
| Available for Sale Debt Securities |
|
|
|
|
| U.S. Governments |
$ |
7,872.2
|
|
$ |
13.1
|
|
$ |
2.0
|
|
$ |
7,883.3
|
|
|
|
|
|
|
| Government Sponsored Agency |
19,381.1
|
|
26.6
|
|
104.9
|
|
19,302.8
|
|
| Non-U.S. Government |
409.0
|
|
0.6
|
|
1.1
|
|
408.5
|
|
| Corporate Debt |
271.2
|
|
0.7
|
|
0.5
|
|
271.4
|
|
| Covered Bonds |
277.4
|
|
0.2
|
|
1.9
|
|
275.7
|
|
|
|
|
|
|
| Sub-Sovereign, Supranational and Non-U.S. Agency Bonds |
4,674.2
|
|
8.3
|
|
12.1
|
|
4,670.4
|
|
| CLOs |
3,451.7
|
|
2.3
|
|
0.3
|
|
3,453.7
|
|
| Other Asset-Backed |
1,349.8
|
|
1.5
|
|
5.6
|
|
1,345.7
|
|
| Commercial Mortgage-Backed |
511.7
|
|
0.4
|
|
0.5
|
|
511.6
|
|
|
|
|
|
|
| Total Available for Sale Debt Securities |
$ |
38,198.3
|
|
$ |
53.7
|
|
$ |
128.9
|
|
$ |
38,123.1
|
|
| Held to Maturity Debt Securities |
|
|
|
|
|
|
|
|
|
| Obligations of States and Political Subdivisions |
$ |
2,384.8
|
|
$ |
1.0
|
|
$ |
38.3
|
|
$ |
2,347.5
|
|
| Government Sponsored Agency |
8,112.8
|
|
1.9
|
|
804.9
|
|
7,309.8
|
|
| Non-U.S. Government |
4,561.2
|
|
1.4
|
|
22.0
|
|
4,540.6
|
|
| Corporate Debt |
280.3
|
|
—
|
|
4.2
|
|
276.1
|
|
| Covered Bonds |
2,114.9
|
|
0.1
|
|
40.3
|
|
2,074.7
|
|
| Certificate of Deposit |
751.8
|
|
0.1
|
|
0.1
|
|
751.8
|
|
| Sub-Sovereign, Supranational and Non-U.S. Agency Bonds |
4,595.4
|
|
0.6
|
|
56.4
|
|
4,539.6
|
|
|
|
|
|
|
| Other Asset-Backed |
47.1
|
|
—
|
|
—
|
|
47.1
|
|
| Commercial Mortgage-Backed |
37.6
|
|
—
|
|
1.8
|
|
35.8
|
|
| Other |
606.2
|
|
—
|
|
175.7
|
|
430.5
|
|
| Total Held to Maturity Debt Securities |
$ |
23,492.1
|
|
$ |
5.1
|
|
$ |
1,143.7
|
|
$ |
22,353.5
|
|
| Total Debt Securities |
$ |
61,690.4
|
|
$ |
58.8
|
|
$ |
1,272.6
|
|
$ |
60,476.6
|
|
Notes to Consolidated Financial Statements (unaudited) (continued)
|
|
|
|
|
|
|
|
|
|
|
|
|
|
|
|
DECEMBER 31, 2025 |
| (In Millions) |
AMORTIZED COST |
GROSS UNREALIZED GAINS |
GROSS UNREALIZED LOSSES |
FAIR VALUE |
| Available for Sale Debt Securities |
|
|
|
|
| U.S. Governments |
$ |
8,148.0 |
|
$ |
29.5 |
|
$ |
5.1 |
|
$ |
8,172.4 |
|
| Obligations of States and Political Subdivisions |
322.4 |
|
— |
|
9.3 |
|
313.1 |
|
| Government Sponsored Agency |
16,616.7 |
|
44.1 |
|
93.3 |
|
16,567.5 |
|
| Non-U.S. Government |
534.1 |
|
— |
|
6.9 |
|
527.2 |
|
| Corporate Debt |
65.1 |
|
— |
|
0.7 |
|
64.4 |
|
| Covered Bonds |
275.3 |
|
0.4 |
|
2.2 |
|
273.5 |
|
|
|
|
|
|
| Sub-Sovereign, Supranational and Non-U.S. Agency Bonds |
5,002.9 |
|
11.0 |
|
29.6 |
|
4,984.3 |
|
| CLOs |
2,151.3 |
|
3.7 |
|
0.1 |
|
2,154.9 |
|
| Other Asset-Backed |
569.2 |
|
4.0 |
|
3.0 |
|
570.2 |
|
| Commercial Mortgage-Backed |
417.4 |
|
0.1 |
|
8.5 |
|
409.0 |
|
|
|
|
|
|
| Total Available for Sale Debt Securities |
$ |
34,102.4 |
|
$ |
92.8 |
|
$ |
158.7 |
|
$ |
34,036.5 |
|
| Held to Maturity Debt Securities |
|
|
|
|
|
|
|
|
|
| Obligations of States and Political Subdivisions |
$ |
2,457.8 |
|
$ |
4.6 |
|
$ |
13.0 |
|
$ |
2,449.4 |
|
| Government Sponsored Agency |
8,424.5 |
|
8.3 |
|
736.7 |
|
7,696.1 |
|
| Non-U.S. Government |
4,741.0 |
|
0.1 |
|
27.2 |
|
4,713.9 |
|
| Corporate Debt |
389.0 |
|
— |
|
5.0 |
|
384.0 |
|
| Covered Bonds |
1,754.5 |
|
0.1 |
|
41.4 |
|
1,713.2 |
|
| Certificate of Deposit |
444.5 |
|
— |
|
4.0 |
|
440.5 |
|
| Sub-Sovereign, Supranational and Non-U.S. Agency Bonds |
4,511.5 |
|
4.3 |
|
59.4 |
|
4,456.4 |
|
|
|
|
|
|
|
|
|
|
|
| Commercial Mortgage-Backed |
37.6 |
|
— |
|
1.3 |
|
36.3 |
|
| Other |
669.2 |
|
— |
|
177.8 |
|
491.4 |
|
| Total Held to Maturity Debt Securities |
$ |
23,429.6 |
|
$ |
17.4 |
|
$ |
1,065.8 |
|
$ |
22,381.2 |
|
| Total Debt Securities |
$ |
57,532.0 |
|
$ |
110.2 |
|
$ |
1,224.5 |
|
$ |
56,417.7 |
|
Notes to Consolidated Financial Statements (unaudited) (continued)
TABLE 38: REMAINING MATURITY OF DEBT SECURITIES
|
|
|
|
|
|
|
|
|
|
|
|
|
|
|
|
|
|
|
|
|
|
|
|
|
|
|
|
|
|
|
|
|
| JUNE 30, 2026 |
ONE YEAR OR LESS |
ONE TO FIVE YEARS |
FIVE TO TEN YEARS |
OVER TEN YEARS |
TOTAL |
| (In Millions) |
AMORTIZED COST |
FAIR VALUE |
AMORTIZED COST |
FAIR VALUE |
AMORTIZED COST |
FAIR VALUE |
AMORTIZED COST |
FAIR VALUE |
AMORTIZED COST |
FAIR VALUE |
| Available for Sale Debt Securities |
|
|
|
|
|
|
|
|
|
|
| U.S. Governments |
$ |
1,696.8
|
|
$ |
1,698.3
|
|
$ |
6,175.4
|
|
$ |
6,185.0
|
|
$ |
—
|
|
$ |
—
|
|
$ |
—
|
|
$ |
—
|
|
$ |
7,872.2
|
|
$ |
7,883.3
|
|
|
|
|
|
|
|
|
|
|
|
|
| Non-U.S. Government |
241.8
|
|
241.1
|
|
167.2
|
|
167.4
|
|
—
|
|
—
|
|
—
|
|
—
|
|
409.0
|
|
408.5
|
|
| Corporate Debt |
—
|
|
—
|
|
271.2
|
|
271.4
|
|
—
|
|
—
|
|
—
|
|
—
|
|
271.2
|
|
271.4
|
|
| Covered Bonds |
239.6
|
|
238.9
|
|
37.8
|
|
36.8
|
|
—
|
|
—
|
|
—
|
|
—
|
|
277.4
|
|
275.7
|
|
|
|
|
|
|
|
|
|
|
|
|
| Sub-Sovereign, Supranational and Non-U.S. Agency Bonds |
1,162.3
|
|
1,159.5
|
|
3,511.9
|
|
3,510.9
|
|
—
|
|
—
|
|
—
|
|
—
|
|
4,674.2
|
|
4,670.4
|
|
|
|
|
|
|
|
|
|
|
|
|
| Government Sponsored Agency |
|
|
|
|
|
|
|
|
19,381.1
|
|
19,302.8
|
|
| Commercial Mortgage-Backed |
|
|
|
|
|
|
|
|
511.7
|
|
511.6
|
|
| CLOs |
|
|
|
|
|
|
|
|
3,451.7
|
|
3,453.7
|
|
| Other Asset-Backed |
|
|
|
|
|
|
|
|
1,349.8
|
|
1,345.7
|
|
| Total Available for Sale Debt Securities |
$ |
3,340.5
|
|
$ |
3,337.8
|
|
$ |
10,163.5
|
|
$ |
10,171.5
|
|
$ |
—
|
|
$ |
—
|
|
$ |
—
|
|
$ |
—
|
|
$ |
38,198.3
|
|
$ |
38,123.1
|
|
| Held to Maturity Debt Securities |
|
|
|
|
|
|
|
|
|
|
|
|
|
|
|
|
|
|
|
|
|
| Obligations of States and Political Subdivisions |
$ |
303.5
|
|
$ |
302.8
|
|
$ |
1,332.9
|
|
$ |
1,318.0
|
|
$ |
726.6
|
|
$ |
705.8
|
|
$ |
21.8
|
|
$ |
20.9
|
|
$ |
2,384.8
|
|
$ |
2,347.5
|
|
| Non-U.S. Government |
3,413.5
|
|
3,406.3
|
|
1,147.7
|
|
1,134.3
|
|
—
|
|
—
|
|
—
|
|
—
|
|
4,561.2
|
|
4,540.6
|
|
| Corporate Debt |
109.7
|
|
108.5
|
|
170.6
|
|
167.6
|
|
—
|
|
—
|
|
—
|
|
—
|
|
280.3
|
|
276.1
|
|
| Covered Bonds |
682.5
|
|
677.6
|
|
1,432.4
|
|
1,397.1
|
|
—
|
|
—
|
|
—
|
|
—
|
|
2,114.9
|
|
2,074.7
|
|
| Certificate of Deposit |
751.8
|
|
751.8
|
|
—
|
|
—
|
|
—
|
|
—
|
|
—
|
|
—
|
|
751.8
|
|
751.8
|
|
| Sub-Sovereign, Supranational and Non-U.S. Agency Bonds |
1,508.7
|
|
1,493.4
|
|
2,997.3
|
|
2,956.6
|
|
89.4
|
|
89.6
|
|
—
|
|
—
|
|
4,595.4
|
|
4,539.6
|
|
| Other |
76.3
|
|
75.0
|
|
299.5
|
|
270.4
|
|
42.8
|
|
32.7
|
|
187.6
|
|
52.4
|
|
606.2
|
|
430.5
|
|
| Government Sponsored Agency |
|
|
|
|
|
|
|
|
8,112.8
|
|
7,309.8
|
|
| Commercial Mortgage-Backed |
|
|
|
|
|
|
|
|
37.6
|
|
35.8
|
|
|
|
|
|
|
|
|
|
|
|
|
| Other Asset-Backed |
|
|
|
|
|
|
|
|
47.1
|
|
47.1
|
|
| Total Held to Maturity Debt Securities |
$ |
6,846.0
|
|
$ |
6,815.4
|
|
$ |
7,380.4
|
|
$ |
7,244.0
|
|
$ |
858.8
|
|
$ |
828.1
|
|
$ |
209.4
|
|
$ |
73.3
|
|
$ |
23,492.1
|
|
$ |
22,353.5
|
|
| Total Debt Securities |
$ |
10,186.5
|
|
$ |
10,153.2
|
|
$ |
17,543.9
|
|
$ |
17,415.5
|
|
$ |
858.8
|
|
$ |
828.1
|
|
$ |
209.4
|
|
$ |
73.3
|
|
$ |
61,690.4
|
|
$ |
60,476.6
|
|
Credit Quality. AFS debt securities impairment reviews are conducted quarterly to identify and evaluate securities that have indications of possible credit losses. A determination as to whether a security’s decline in market value is related to credit impairment takes into consideration numerous factors and the relative significance of any single factor can vary by security. Factors Northern Trust considers in determining whether impairment is credit-related include, but are not limited to, the severity of the impairment; the cause of the impairment; the financial condition and near-term prospects of the issuer; activity in the market of the issuer, which may indicate adverse credit conditions; Northern Trust’s intent regarding the sale of the security as of the balance sheet date; and the likelihood that Northern Trust will not be required to sell the security for a period of time sufficient to allow for the recovery of the security’s amortized cost basis. For each security meeting the requirements of Northern Trust’s internal screening process, an extensive review is conducted to determine if a credit loss has occurred.
Notes to Consolidated Financial Statements (unaudited) (continued)
There was no provision for credit losses for AFS securities for the three and six months ended June 30, 2026 and a $0.9 million and $0.7 million provision for credit losses for AFS securities for the three and six months ended June 30, 2025, respectively. There was no allowance for credit losses for AFS securities as of both June 30, 2026 and December 31, 2025. The process for identifying credit losses for AFS securities is based on the best estimate of cash flows to be collected from the security, discounted using the security’s effective interest rate. If the present value of the expected cash flows is found to be less than the current amortized cost of the security, an allowance for credit losses is generally recorded equal to the difference between the two amounts, limited to the amount the amortized cost basis exceeds the fair value of the security. For additional information, please refer to Note 6, “Allowance for Credit Losses.”
The following table provides information regarding AFS debt securities with no credit losses reported that had been in a continuous unrealized loss position for less than twelve months and for twelve months or longer as of June 30, 2026 and December 31, 2025.
TABLE 39: AVAILABLE FOR SALE DEBT SECURITIES IN UNREALIZED LOSS POSITION WITH NO CREDIT LOSSES REPORTED
|
|
|
|
|
|
|
|
|
|
|
|
|
|
|
|
|
|
|
|
|
| JUNE 30, 2026 |
LESS THAN 12 MONTHS |
12 MONTHS OR LONGER |
TOTAL |
| (In Millions) |
FAIR
VALUE |
UNREALIZED
LOSSES |
FAIR
VALUE |
UNREALIZED
LOSSES |
FAIR
VALUE |
UNREALIZED
LOSSES |
| U.S. Governments |
$ |
730.2
|
|
$ |
2.0
|
|
$ |
—
|
|
$ |
—
|
|
$ |
730.2
|
|
$ |
2.0
|
|
|
|
|
|
|
|
|
| Government Sponsored Agency |
7,936.0
|
|
41.6
|
|
5,781.6
|
|
63.3
|
|
13,717.6
|
|
104.9
|
|
| Non-U.S. Government |
240.2
|
|
0.5
|
|
68.2
|
|
0.6
|
|
308.4
|
|
1.1
|
|
| Corporate Debt |
39.1
|
|
0.5
|
|
—
|
|
—
|
|
39.1
|
|
0.5
|
|
| Covered Bonds |
36.8
|
|
1.1
|
|
64.2
|
|
0.8
|
|
101.0
|
|
1.9
|
|
|
|
|
|
|
|
|
| Sub-Sovereign, Supranational and Non-U.S. Agency Bonds |
2,087.1
|
|
9.9
|
|
249.8
|
|
2.2
|
|
2,336.9
|
|
12.1
|
|
| CLOs |
371.3
|
|
0.3
|
|
—
|
|
—
|
|
371.3
|
|
0.3
|
|
| Other Asset-Backed |
906.8
|
|
5.2
|
|
47.0
|
|
0.4
|
|
953.8
|
|
5.6
|
|
| Commercial Mortgage-Backed |
100.6
|
|
0.2
|
|
122.7
|
|
0.3
|
|
223.3
|
|
0.5
|
|
|
|
|
|
|
|
|
| Total |
$ |
12,448.1
|
|
$ |
61.3
|
|
$ |
6,333.5
|
|
$ |
67.6
|
|
$ |
18,781.6
|
|
$ |
128.9
|
|
Note: There were no AFS securities with an allowance for credit losses reported as of June 30, 2026. Refer to the discussion below and Note 6, “Allowance for Credit Losses” for further information.
|
|
|
|
|
|
|
|
|
|
|
|
|
|
|
|
|
|
|
|
|
| DECEMBER 31, 2025 |
LESS THAN 12 MONTHS |
12 MONTHS OR LONGER |
TOTAL |
| (In Millions) |
FAIR
VALUE |
UNREALIZED
LOSSES |
FAIR
VALUE |
UNREALIZED
LOSSES |
FAIR
VALUE |
UNREALIZED
LOSSES |
| U.S. Governments |
$ |
— |
|
$ |
— |
|
$ |
194.2 |
|
$ |
5.1 |
|
$ |
194.2 |
|
$ |
5.1 |
|
| Obligations of States and Political Subdivisions |
— |
|
— |
|
313.1 |
|
9.3 |
|
313.1 |
|
9.3 |
|
| Government Sponsored Agency |
1,288.2 |
|
1.7 |
|
6,848.5 |
|
91.6 |
|
8,136.7 |
|
93.3 |
|
| Non-U.S. Government |
329.7 |
|
0.1 |
|
197.5 |
|
6.8 |
|
527.2 |
|
6.9 |
|
| Corporate Debt |
21.3 |
|
0.4 |
|
43.1 |
|
0.3 |
|
64.4 |
|
0.7 |
|
| Covered Bonds |
80.0 |
|
1.0 |
|
63.7 |
|
1.2 |
|
143.7 |
|
2.2 |
|
|
|
|
|
|
|
|
| Sub-Sovereign, Supranational and Non-U.S. Agency Bonds |
1,007.7 |
|
2.3 |
|
669.1 |
|
27.3 |
|
1,676.8 |
|
29.6 |
|
| CLOs |
109.9 |
|
0.1 |
|
— |
|
— |
|
109.9 |
|
0.1 |
|
| Other Asset-Backed |
— |
|
— |
|
265.4 |
|
3.0 |
|
265.4 |
|
3.0 |
|
| Commercial Mortgage-Backed |
54.9 |
|
— |
|
186.6 |
|
8.5 |
|
241.5 |
|
8.5 |
|
|
|
|
|
|
|
|
| Total |
$ |
2,891.7 |
|
$ |
5.6 |
|
$ |
8,781.2 |
|
$ |
153.1 |
|
$ |
11,672.9 |
|
$ |
158.7 |
|
Note: There were no AFS securities with an allowance for credit losses reported as of December 31, 2025. Refer to the discussion below and Note 6, “Allowance for Credit Losses” for further information.
As of June 30, 2026, 887 AFS debt securities with a combined fair value of $18.8 billion were in an unrealized loss position without an allowance for credit losses, with their unrealized losses totaling $128.9 million. As of December 31, 2025, 718 AFS debt securities with a combined fair value of $11.7 billion were in an unrealized loss position without an allowance for credit losses, with their unrealized losses totaling $158.7 million. Unrealized losses on AFS debt securities without an allowance for credit losses are primarily attributable to changes in market interest rates and credit spreads since their purchase.
Notes to Consolidated Financial Statements (unaudited) (continued)
The following table provides the amortized cost of HTM debt securities by credit ratings using ratings from Moody’s, S&P Global or Fitch Ratings. Securities not explicitly rated were grouped where possible under the credit rating of the issuer of the security.
TABLE 40: AMORTIZED COST OF HELD TO MATURITY DEBT SECURITIES BY CREDIT RATING
|
|
|
|
|
|
|
|
|
|
|
|
|
|
|
|
|
|
|
|
|
|
JUNE 30, 2026 |
| ($ In Millions) |
AAA |
AA |
A |
BBB |
NOT RATED |
TOTAL |
|
|
|
|
|
|
|
| Obligations of States and Political Subdivisions |
$ |
993.0
|
|
$ |
1,377.1
|
|
$ |
14.7
|
|
$ |
—
|
|
$ |
—
|
|
$ |
2,384.8
|
|
| Government Sponsored Agency |
41.6
|
|
8,071.2
|
|
—
|
|
—
|
|
—
|
|
8,112.8
|
|
| Non-U.S. Government |
1,275.7
|
|
1,457.5
|
|
1,813.1
|
|
14.9
|
|
—
|
|
4,561.2
|
|
| Corporate Debt |
154.6
|
|
16.0
|
|
109.7
|
|
—
|
|
—
|
|
280.3
|
|
| Covered Bonds |
2,114.9
|
|
—
|
|
—
|
|
—
|
|
—
|
|
2,114.9
|
|
| Certificate of Deposit |
—
|
|
—
|
|
—
|
|
—
|
|
751.8
|
|
751.8
|
|
| Sub-Sovereign, Supranational and Non-U.S. Agency Bonds |
3,316.3
|
|
901.7
|
|
376.2
|
|
1.2
|
|
—
|
|
4,595.4
|
|
|
|
|
|
|
|
|
| Other Asset-Backed |
47.1
|
|
—
|
|
—
|
|
—
|
|
—
|
|
47.1
|
|
| Commercial Mortgage-Backed |
—
|
|
—
|
|
37.6
|
|
—
|
|
—
|
|
37.6
|
|
| Other |
—
|
|
—
|
|
—
|
|
—
|
|
606.2
|
|
606.2
|
|
| Total Held to Maturity |
$ |
7,943.2
|
|
$ |
11,823.5
|
|
$ |
2,351.3
|
|
$ |
16.1
|
|
$ |
1,358.0
|
|
$ |
23,492.1
|
|
| Percent of Total Held to Maturity |
34
|
% |
50
|
% |
10
|
% |
—
|
% |
6
|
% |
100
|
% |
|
|
|
|
|
|
|
|
|
|
|
|
|
|
|
|
|
|
|
|
|
|
DECEMBER 31, 2025 |
| ($ In Millions) |
AAA |
AA |
A |
BBB |
NOT RATED |
TOTAL |
|
|
|
|
|
|
|
| Obligations of States and Political Subdivisions |
$ |
986.0 |
|
$ |
1,471.8 |
|
$ |
— |
|
$ |
— |
|
$ |
— |
|
$ |
2,457.8 |
|
| Government Sponsored Agency |
— |
|
8,424.5 |
|
— |
|
— |
|
— |
|
8,424.5 |
|
| Non-U.S. Government |
649.7 |
|
1,231.7 |
|
2,844.7 |
|
14.9 |
|
— |
|
4,741.0 |
|
| Corporate Debt |
159.2 |
|
150.2 |
|
79.6 |
|
— |
|
— |
|
389.0 |
|
| Covered Bonds |
1,754.5 |
|
— |
|
— |
|
— |
|
— |
|
1,754.5 |
|
| Certificate of Deposit |
— |
|
— |
|
— |
|
— |
|
444.5 |
|
444.5 |
|
| Sub-Sovereign, Supranational and Non-U.S. Agency Bonds |
3,412.9 |
|
776.2 |
|
321.2 |
|
1.2 |
|
— |
|
4,511.5 |
|
|
|
|
|
|
|
|
|
|
|
|
|
|
|
| Commercial Mortgage-Backed |
— |
|
37.6 |
|
— |
|
— |
|
— |
|
37.6 |
|
| Other |
53.0 |
|
— |
|
— |
|
— |
|
616.2 |
|
669.2 |
|
| Total Held to Maturity |
$ |
7,015.3 |
|
$ |
12,092.0 |
|
$ |
3,245.5 |
|
$ |
16.1 |
|
$ |
1,060.7 |
|
$ |
23,429.6 |
|
| Percent of Total Held to Maturity |
30 |
% |
52 |
% |
14 |
% |
— |
% |
4 |
% |
100 |
% |
Credit quality indicators are metrics that provide information regarding the relative credit risk of debt securities. Northern Trust maintains a high quality debt securities portfolio, with 94% and 96% of the HTM portfolio at June 30, 2026 and December 31, 2025, respectively, comprised of securities rated A or higher.
Investment Security Gains and Losses. Proceeds of $1.1 billion from the sale of AFS debt securities resulted in an investment security loss of $73.9 million for the three and six months ended June 30, 2026. There were no sales of debt securities and no net investment security gains (losses) for the three and six months ended June 30, 2025.
Notes to Consolidated Financial Statements (unaudited) (continued)
TABLE 41: INVESTMENT SECURITY GAINS AND LOSSES
|
|
|
|
|
|
|
|
|
|
|
|
|
|
|
|
THREE MONTHS ENDED JUNE 30, |
SIX MONTHS ENDED JUNE 30, |
| (In Millions) |
2026 |
2025 |
2026 |
2025 |
| Gross Realized Debt Securities Gains |
$ |
—
|
|
$ |
— |
|
$ |
—
|
|
$ |
— |
|
| Gross Realized Debt Securities Losses |
(73.9) |
|
— |
|
(73.9) |
|
— |
|
| Investment Security Gains (Losses), net |
$ |
(73.9) |
|
$ |
— |
|
$ |
(73.9) |
|
$ |
— |
|
TABLE 42: INVESTMENT SECURITY GAINS AND LOSSES BY SECURITY TYPE
|
|
|
|
|
|
|
|
|
|
|
|
|
|
|
|
THREE MONTHS ENDED JUNE 30, |
SIX MONTHS ENDED JUNE 30, |
| (In Millions) |
2026 |
2025 |
2026 |
2025 |
| U.S. Governments |
$ |
(4.5) |
|
$ |
— |
|
$ |
(4.5) |
|
$ |
— |
|
| Obligations of States and Political Subdivisions |
(7.9) |
|
— |
|
(7.9) |
|
— |
|
| Government Sponsored Agency |
(26.0) |
|
— |
|
(26.0) |
|
— |
|
| Non-U.S. Government |
(4.1) |
|
— |
|
(4.1) |
|
— |
|
|
|
|
|
|
|
|
|
|
|
|
|
|
|
|
| Sub-Sovereign, Supranational and Non-U.S. Agency Bonds |
(21.3) |
|
— |
|
(21.3) |
|
— |
|
|
|
|
|
|
| Other Asset-Backed |
(0.7) |
|
— |
|
(0.7) |
|
— |
|
| Commercial Mortgage-Backed |
(9.4) |
|
— |
|
(9.4) |
|
— |
|
|
|
|
|
|
| Total |
$ |
(73.9) |
|
$ |
— |
|
$ |
(73.9) |
|
$ |
— |
|
Notes to Consolidated Financial Statements (unaudited) (continued)
Note 5 – Loans
Amounts outstanding for Loans, by segment and class, are shown in the following table.
TABLE 43: LOANS
|
|
|
|
|
|
|
|
|
| (In Millions) |
JUNE 30, 2026 |
DECEMBER 31, 2025 |
Commercial(1)
|
|
|
| Commercial and Institutional |
$ |
6,776.0
|
|
$ |
6,595.3 |
|
| Commercial Real Estate |
5,316.2
|
|
5,272.2 |
|
| Subscription Finance |
4,187.8
|
|
3,603.4 |
|
| Fund Finance |
1,544.5
|
|
1,357.7 |
|
| Other |
3,538.8
|
|
3,602.4 |
|
| Total Commercial |
21,363.3
|
|
20,431.0 |
|
Personal(2)
|
|
|
| Private Client |
15,891.9
|
|
15,169.3 |
|
| Residential Real Estate |
6,050.5
|
|
6,121.0 |
|
| Other |
516.3
|
|
227.0 |
|
| Total Personal |
22,458.7
|
|
21,517.3 |
|
| Total Loans |
$ |
43,822.0
|
|
$ |
41,948.3 |
|
(1) Commercial loans include $2.8 billion and $2.2 billion of Non-U.S. exposure as of June 30, 2026, and December 31, 2025, respectively.
(2) Personal loans include $822.1 million and $657.4 million of Non-U.S. exposure as of June 30, 2026, and December 31, 2025, respectively.
As of January 1, 2026, Northern Trust refined the presentation of its commercial loan segment to enhance the alignment of segment reporting with business needs, risk characteristics, and management’s approach to monitoring and managing credit performance. As part of this refinement, Subscription Finance and Fund Finance were introduced as separate loan classes. Subscription Finance includes loans to private equity funds that are secured by investors’ contractual commitments to fund capital calls. Fund Finance includes loans and credit lines to all other collective investment funds and to investment managers primarily established for short-term liquidity needs. Fund Finance borrowers generally maintain highly diversified portfolios of liquid securities. Prior period disclosures have been revised to conform to the current period presentation.
Residential real estate loans consist of traditional first lien mortgages and equity credit lines that generally require a loan-to-collateral value of 65% to 80% at inception. Northern Trust’s equity credit line products generally have draw periods of up to 10 years and a balloon payment of any outstanding balance due at maturity. Payments are interest-only with variable interest rates. Northern Trust does not offer equity credit lines that include an option to convert the outstanding balance to an amortizing payment loan. As of June 30, 2026 and December 31, 2025, equity credit lines totaled $249.4 million and $294.0 million, respectively, and equity credit lines for which first liens were held by Northern Trust represented 98% and 96% of the total equity credit lines, respectively.
Short term advances, primarily related to the processing of custodied client investments, totaled $5.2 billion and $4.5 billion at June 30, 2026 and December 31, 2025, respectively. Demand deposit overdrafts reclassified as loan balances, primarily in the other personal class, totaled $7.5 million and $12.0 million as of June 30, 2026 and December 31, 2025, respectively.
Loans classified as held for sale are recorded at the lower of cost or fair value. There were no loans classified as held for sale as of June 30, 2026, compared with $6.8 million of loans classified as held for sale as of December 31, 2025. No loans were sold during the three months ended June 30, 2026, and $22.9 million of loans were sold during the six months ended June 30, 2026. There were no loans sold for the three and six months ended June 30, 2025.
Notes to Consolidated Financial Statements (unaudited) (continued)
Credit Quality Indicators. Credit quality indicators are statistics, measurements or other metrics that provide information regarding the relative credit risk of loans. Northern Trust uses a variety of credit quality indicators to assess the credit risk of loans at the segment, class, and individual credit exposure levels.
As part of its credit process, Northern Trust utilizes an internal borrower risk rating system to support identification, approval, and monitoring of credit risk. Borrower risk ratings are used in credit underwriting and management reporting. Risk ratings are used for ranking the credit risk of borrowers and their PD. Each borrower is rated using one of a number of ratings models or subjective assessment tools, which consider both quantitative and qualitative factors. The ratings models vary among classes of loans in order to capture the unique risk characteristics inherent within each particular type of credit exposure. Provided below are the more significant performance indicator attributes considered within Northern Trust’s borrower ratings models, by loan class:
•Commercial and Institutional: cash flow leverage, profit margin, liquidity, balance sheet leverage;
•Commercial Real Estate: debt service coverage, collateral coverage, debt yield, leasing status, guarantor support;
•Subscription Finance: leverage, return volatility, liquidity, asset quality, and capital levels;
•Fund Finance: leverage, return volatility, liquidity, asset quality, and capital levels;
•Commercial - Other: cash flow leverage, profit margin, liquidity, balance sheet leverage, type of collateral, and collateral coverage;
•Residential Real Estate: payment history, credit bureau scores, collateral coverage;
•Private Client: cash-flow-to-debt and net worth ratios, leverage, type of collateral, collateral coverage; and
•Personal - Other: debt to income metrics, income amounts, sources of income, type of collateral, collateral coverage.
While the criteria vary by model, the objective is for the borrower ratings to be consistent in both the measurement and ranking of risk. Each model is calibrated to a master rating scale to support this consistency. Ratings for borrowers not in default range from “1” for the strongest credits to “7” for the weakest non-defaulted credits. Ratings of “8” or “9” are used for defaulted borrowers. Borrower risk ratings are monitored and are revised when events or circumstances indicate a change is required. Risk ratings are generally validated at least annually.
Loan segment and class balances as of June 30, 2026 and December 31, 2025 are provided in the following table, segregated by borrower ratings into “1 to 3,” “4 to 5” and “6 to 9” (watch list, including accrual and nonaccrual status) categories by year of origination at amortized cost basis. Loans that are held for investment are reported at the principal amount outstanding, net of unearned income.
Notes to Consolidated Financial Statements (unaudited) (continued)
TABLE 44: CREDIT QUALITY INDICATOR AT AMORTIZED COST BASIS BY ORIGINATION YEAR
|
|
|
|
|
|
|
|
|
|
|
|
|
|
|
|
|
|
|
|
|
|
|
|
|
|
|
|
|
|
| June 30, 2026 |
TERM LOANS |
REVOLVING LOANS |
REVOLVING LOANS CONVERTED TO TERM LOANS |
|
| (In Millions) |
2026 |
2025 |
2024 |
2023 |
2022 |
PRIOR |
TOTAL |
| Commercial |
|
|
|
|
|
|
|
|
|
| Commercial and Institutional |
|
|
|
|
|
|
|
|
|
| Risk Rating: |
|
|
|
|
|
|
|
|
|
| 1 to 3 Category |
$ |
105.6
|
|
$ |
381.0
|
|
$ |
379.6
|
|
$ |
68.3
|
|
$ |
43.2
|
|
$ |
165.2
|
|
$ |
1,156.7
|
|
$ |
57.2
|
|
$ |
2,356.8
|
|
| 4 to 5 Category |
323.8
|
|
542.5
|
|
590.8
|
|
310.3
|
|
246.1
|
|
206.7
|
|
1,925.1
|
|
27.9
|
|
4,173.2
|
|
| 6 to 9 Category |
—
|
|
40.2
|
|
34.1
|
|
44.3
|
|
29.3
|
|
3.3
|
|
80.0
|
|
14.8
|
|
246.0
|
|
| Total Commercial and Institutional |
429.4
|
|
963.7
|
|
1,004.5
|
|
422.9
|
|
318.6
|
|
375.2
|
|
3,161.8
|
|
99.9
|
|
6,776.0
|
|
| C&I Gross Charge-offs |
—
|
|
—
|
|
—
|
|
—
|
|
—
|
|
(0.4) |
|
—
|
|
—
|
|
(0.4) |
|
| Commercial Real Estate |
|
|
|
|
|
|
|
|
|
| Risk Rating: |
|
|
|
|
|
|
|
|
|
| 1 to 3 Category |
80.8
|
|
198.5
|
|
83.0
|
|
52.5
|
|
36.5
|
|
138.3
|
|
14.3
|
|
—
|
|
603.9
|
|
| 4 to 5 Category |
459.8
|
|
930.5
|
|
605.9
|
|
1,083.9
|
|
763.7
|
|
491.4
|
|
193.3
|
|
22.8
|
|
4,551.3
|
|
| 6 to 9 Category |
—
|
|
71.9
|
|
31.7
|
|
15.1
|
|
38.2
|
|
4.1
|
|
—
|
|
—
|
|
161.0
|
|
| Total Commercial Real Estate |
540.6
|
|
1,200.9
|
|
720.6
|
|
1,151.5
|
|
838.4
|
|
633.8
|
|
207.6
|
|
22.8
|
|
5,316.2
|
|
|
|
|
|
|
|
|
|
|
|
| Subscription Finance |
|
|
|
|
|
|
|
|
|
| Risk Rating: |
|
|
|
|
|
|
|
|
|
| 1 to 3 Category |
518.4
|
|
—
|
|
90.5
|
|
12.8
|
|
—
|
|
71.7
|
|
3,071.2
|
|
—
|
|
3,764.6
|
|
| 4 to 5 Category |
11.2
|
|
1.8
|
|
—
|
|
26.3
|
|
—
|
|
—
|
|
381.8
|
|
—
|
|
421.1
|
|
| 6 to 9 Category |
—
|
|
—
|
|
—
|
|
—
|
|
—
|
|
—
|
|
2.1
|
|
—
|
|
2.1
|
|
| Total Subscription Finance |
529.6
|
|
1.8
|
|
90.5
|
|
39.1
|
|
—
|
|
71.7
|
|
3,455.1
|
|
—
|
|
4,187.8
|
|
|
|
|
|
|
|
|
|
|
|
| Fund Finance |
|
|
|
|
|
|
|
|
|
| Risk Rating: |
|
|
|
|
|
|
|
|
|
| 1 to 3 Category |
553.9
|
|
—
|
|
—
|
|
0.4
|
|
—
|
|
32.1
|
|
341.3
|
|
—
|
|
927.7
|
|
| 4 to 5 Category |
379.2
|
|
8.5
|
|
—
|
|
—
|
|
—
|
|
—
|
|
229.1
|
|
—
|
|
616.8
|
|
|
|
|
|
|
|
|
|
|
|
| Total Fund Finance |
933.1
|
|
8.5
|
|
—
|
|
0.4
|
|
—
|
|
32.1
|
|
570.4
|
|
—
|
|
1,544.5
|
|
|
|
|
|
|
|
|
|
|
|
|
|
|
|
|
|
|
|
|
|
| Other |
|
|
|
|
|
|
|
|
|
| Risk Rating: |
|
|
|
|
|
|
|
|
|
| 1 to 3 Category |
1,846.2
|
|
—
|
|
—
|
|
—
|
|
—
|
|
—
|
|
—
|
|
—
|
|
1,846.2
|
|
| 4 to 5 Category |
1,543.1
|
|
—
|
|
—
|
|
—
|
|
—
|
|
146.3
|
|
—
|
|
—
|
|
1,689.4
|
|
| 6 to 9 Category |
3.2
|
|
—
|
|
—
|
|
—
|
|
—
|
|
—
|
|
—
|
|
—
|
|
3.2
|
|
| Total Other |
3,392.5
|
|
—
|
|
—
|
|
—
|
|
—
|
|
146.3
|
|
—
|
|
—
|
|
3,538.8
|
|
|
|
|
|
|
|
|
|
|
|
| Total Commercial |
5,825.2
|
|
2,174.9
|
|
1,815.6
|
|
1,613.9
|
|
1,157.0
|
|
1,259.1
|
|
7,394.9
|
|
122.7
|
|
21,363.3
|
|
| Commercial Gross Charge-offs |
—
|
|
—
|
|
—
|
|
—
|
|
—
|
|
(0.4) |
|
—
|
|
—
|
|
(0.4) |
|
| Personal |
|
|
|
|
|
|
|
|
|
| Private Client |
|
|
|
|
|
|
|
|
|
| Risk Rating: |
|
|
|
|
|
|
|
|
|
| 1 to 3 Category |
160.0
|
|
101.6
|
|
145.1
|
|
86.4
|
|
57.8
|
|
40.0
|
|
5,339.9
|
|
83.0
|
|
6,013.8
|
|
| 4 to 5 Category |
212.7
|
|
521.8
|
|
462.3
|
|
129.8
|
|
267.5
|
|
194.4
|
|
7,537.0
|
|
459.7
|
|
9,785.2
|
|
| 6 to 9 Category |
—
|
|
17.1
|
|
42.5
|
|
14.9
|
|
—
|
|
—
|
|
18.4
|
|
—
|
|
92.9
|
|
| Total Private Client |
372.7
|
|
640.5
|
|
649.9
|
|
231.1
|
|
325.3
|
|
234.4
|
|
12,895.3
|
|
542.7
|
|
15,891.9
|
|
| Private Client Gross Charge-offs |
—
|
|
—
|
|
—
|
|
(0.2) |
|
—
|
|
—
|
|
—
|
|
—
|
|
(0.2) |
|
| Residential Real Estate |
|
|
|
|
|
|
|
|
|
| Risk Rating: |
|
|
|
|
|
|
|
|
|
| 1 to 3 Category |
178.2
|
|
356.6
|
|
194.7
|
|
172.8
|
|
527.7
|
|
1,719.1
|
|
221.7
|
|
—
|
|
3,370.8
|
|
| 4 to 5 Category |
157.6
|
|
246.7
|
|
171.4
|
|
149.5
|
|
326.8
|
|
1,314.5
|
|
226.8
|
|
1.8
|
|
2,595.1
|
|
| 6 to 9 Category |
—
|
|
1.0
|
|
—
|
|
—
|
|
8.7
|
|
62.7
|
|
12.2
|
|
—
|
|
84.6
|
|
| Total Residential Real Estate |
335.8
|
|
604.3
|
|
366.1
|
|
322.3
|
|
863.2
|
|
3,096.3
|
|
460.7
|
|
1.8
|
|
6,050.5
|
|
|
|
|
|
|
|
|
|
|
|
|
|
|
|
|
|
|
|
|
|
| Other |
|
|
|
|
|
|
|
|
|
| Risk Rating: |
|
|
|
|
|
|
|
|
|
| 1 to 3 Category |
298.9
|
|
—
|
|
—
|
|
—
|
|
—
|
|
—
|
|
—
|
|
—
|
|
298.9
|
|
| 4 to 5 Category |
217.4
|
|
—
|
|
—
|
|
—
|
|
—
|
|
—
|
|
—
|
|
—
|
|
217.4
|
|
|
|
|
|
|
|
|
|
|
|
| Total Other |
516.3
|
|
—
|
|
—
|
|
—
|
|
—
|
|
—
|
|
—
|
|
—
|
|
516.3
|
|
|
|
|
|
|
|
|
|
|
|
| Total Personal |
1,224.8
|
|
1,244.8
|
|
1,016.0
|
|
553.4
|
|
1,188.5
|
|
3,330.7
|
|
13,356.0
|
|
544.5
|
|
22,458.7
|
|
| Personal Gross Charge-offs |
—
|
|
—
|
|
—
|
|
(0.2) |
|
—
|
|
—
|
|
—
|
|
—
|
|
(0.2) |
|
| Total Loans |
$ |
7,050.0
|
|
$ |
3,419.7
|
|
$ |
2,831.6
|
|
$ |
2,167.3
|
|
$ |
2,345.5
|
|
$ |
4,589.8
|
|
$ |
20,750.9
|
|
$ |
667.2
|
|
$ |
43,822.0
|
|
| Total Loans Gross Charge-offs |
$ |
—
|
|
$ |
—
|
|
$ |
—
|
|
$ |
(0.2) |
|
$ |
—
|
|
$ |
(0.4) |
|
$ |
—
|
|
$ |
—
|
|
$ |
(0.6) |
|
Notes to Consolidated Financial Statements (unaudited) (continued)
|
|
|
|
|
|
|
|
|
|
|
|
|
|
|
|
|
|
|
|
|
|
|
|
|
|
|
|
|
|
| December 31, 2025 |
TERM LOANS |
REVOLVING LOANS |
REVOLVING LOANS CONVERTED TO TERM LOANS |
|
| (In Millions) |
2025 |
2024 |
2023 |
2022 |
2021 |
PRIOR |
TOTAL |
| Commercial |
|
|
|
|
|
|
|
|
|
| Commercial and Institutional |
|
|
|
|
|
|
|
|
|
| Risk Rating: |
|
|
|
|
|
|
|
|
|
| 1 to 3 Category |
$ |
276.9 |
|
$ |
425.1 |
|
$ |
87.8 |
|
$ |
205.4 |
|
$ |
111.8 |
|
$ |
149.5 |
|
$ |
1,205.7 |
|
$ |
57.6 |
|
$ |
2,519.8 |
|
| 4 to 5 Category |
561.4 |
|
661.5 |
|
353.9 |
|
263.7 |
|
219.0 |
|
116.6 |
|
1,566.1 |
|
35.7 |
|
3,777.9 |
|
| 6 to 9 Category |
88.8 |
|
19.9 |
|
50.3 |
|
46.2 |
|
21.9 |
|
2.7 |
|
57.5 |
|
10.3 |
|
297.6 |
|
| Total Commercial and Institutional |
927.1 |
|
1,106.5 |
|
492.0 |
|
515.3 |
|
352.7 |
|
268.8 |
|
2,829.3 |
|
103.6 |
|
6,595.3 |
|
| C&I Gross Charge-offs |
— |
|
— |
|
— |
|
— |
|
— |
|
(1.4) |
|
— |
|
— |
|
(1.4) |
|
| Commercial Real Estate |
|
|
|
|
|
|
|
|
|
| Risk Rating: |
|
|
|
|
|
|
|
|
|
| 1 to 3 Category |
118.5 |
|
98.7 |
|
80.8 |
|
52.6 |
|
157.3 |
|
20.8 |
|
37.9 |
|
— |
|
566.6 |
|
| 4 to 5 Category |
946.7 |
|
654.8 |
|
1,325.1 |
|
831.4 |
|
404.3 |
|
198.7 |
|
195.1 |
|
22.9 |
|
4,579.0 |
|
| 6 to 9 Category |
71.9 |
|
2.0 |
|
6.8 |
|
45.5 |
|
— |
|
0.4 |
|
— |
|
— |
|
126.6 |
|
| Total Commercial Real Estate |
1,137.1 |
|
755.5 |
|
1,412.7 |
|
929.5 |
|
561.6 |
|
219.9 |
|
233.0 |
|
22.9 |
|
5,272.2 |
|
| CRE Gross Charge-offs |
— |
|
— |
|
— |
|
(2.1) |
|
— |
|
— |
|
— |
|
— |
|
(2.1) |
|
| Subscription Finance |
|
|
|
|
|
|
|
|
|
| Risk Rating: |
|
|
|
|
|
|
|
|
|
| 1 to 3 Category |
281.3 |
|
68.0 |
|
15.4 |
|
— |
|
— |
|
74.9 |
|
2,879.3 |
|
— |
|
3,318.9 |
|
| 4 to 5 Category |
— |
|
— |
|
16.1 |
|
— |
|
— |
|
— |
|
268.4 |
|
— |
|
284.5 |
|
|
|
|
|
|
|
|
|
|
|
| Total Subscription Finance |
281.3 |
|
68.0 |
|
31.5 |
|
— |
|
— |
|
74.9 |
|
3,147.7 |
|
— |
|
3,603.4 |
|
|
|
|
|
|
|
|
|
|
|
| Fund Finance |
|
|
|
|
|
|
|
|
|
| Risk Rating: |
|
|
|
|
|
|
|
|
|
| 1 to 3 Category |
322.6 |
|
— |
|
— |
|
14.9 |
|
— |
|
37.6 |
|
443.7 |
|
— |
|
818.8 |
|
| 4 to 5 Category |
404.3 |
|
— |
|
0.4 |
|
— |
|
— |
|
— |
|
134.2 |
|
— |
|
538.9 |
|
|
|
|
|
|
|
|
|
|
|
| Total Fund Finance |
726.9 |
|
— |
|
0.4 |
|
14.9 |
|
— |
|
37.6 |
|
577.9 |
|
— |
|
1,357.7 |
|
|
|
|
|
|
|
|
|
|
|
| Other |
|
|
|
|
|
|
|
|
|
| Risk Rating: |
|
|
|
|
|
|
|
|
|
| 1 to 3 Category |
1,886.3 |
|
51.2 |
|
— |
|
— |
|
— |
|
— |
|
24.4 |
|
— |
|
1,961.9 |
|
| 4 to 5 Category |
1,440.3 |
|
18.6 |
|
— |
|
— |
|
— |
|
173.6 |
|
7.0 |
|
— |
|
1,639.5 |
|
| 6 to 9 Category |
1.0 |
|
— |
|
— |
|
— |
|
— |
|
— |
|
— |
|
— |
|
1.0 |
|
| Total Other |
3,327.6 |
|
69.8 |
|
— |
|
— |
|
— |
|
173.6 |
|
31.4 |
|
— |
|
3,602.4 |
|
|
|
|
|
|
|
|
|
|
|
| Total Commercial |
6,400.0 |
|
1,999.8 |
|
1,936.6 |
|
1,459.7 |
|
914.3 |
|
774.8 |
|
6,819.3 |
|
126.5 |
|
20,431.0 |
|
| Commercial Gross Charge-offs |
— |
|
— |
|
— |
|
(2.1) |
|
— |
|
(1.4) |
|
— |
|
— |
|
(3.5) |
|
| Personal |
|
|
|
|
|
|
|
|
|
| Private Client |
|
|
|
|
|
|
|
|
|
| Risk Rating: |
|
|
|
|
|
|
|
|
|
| 1 to 3 Category |
149.9 |
|
130.7 |
|
133.0 |
|
58.7 |
|
47.2 |
|
44.6 |
|
5,813.0 |
|
38.7 |
|
6,415.8 |
|
| 4 to 5 Category |
429.2 |
|
581.0 |
|
141.7 |
|
313.5 |
|
151.0 |
|
184.2 |
|
6,350.9 |
|
547.9 |
|
8,699.4 |
|
| 6 to 9 Category |
22.6 |
|
7.6 |
|
15.2 |
|
— |
|
— |
|
— |
|
8.7 |
|
— |
|
54.1 |
|
| Total Private Client |
601.7 |
|
719.3 |
|
289.9 |
|
372.2 |
|
198.2 |
|
228.8 |
|
12,172.6 |
|
586.6 |
|
15,169.3 |
|
| Private Client Gross Charge-offs |
— |
|
— |
|
— |
|
— |
|
— |
|
(0.1) |
|
— |
|
— |
|
(0.1) |
|
| Residential Real Estate (RRE) |
|
|
|
|
|
|
|
|
|
| Risk Rating: |
|
|
|
|
|
|
|
|
|
| 1 to 3 Category |
357.1 |
|
138.7 |
|
131.8 |
|
343.3 |
|
334.6 |
|
993.2 |
|
232.3 |
|
— |
|
2,531.0 |
|
| 4 to 5 Category |
256.2 |
|
264.2 |
|
232.1 |
|
576.3 |
|
658.6 |
|
1,313.0 |
|
194.3 |
|
1.9 |
|
3,496.6 |
|
| 6 to 9 Category |
1.0 |
|
— |
|
0.9 |
|
8.1 |
|
31.3 |
|
31.6 |
|
20.5 |
|
— |
|
93.4 |
|
| Total Residential Real Estate |
614.3 |
|
402.9 |
|
364.8 |
|
927.7 |
|
1,024.5 |
|
2,337.8 |
|
447.1 |
|
1.9 |
|
6,121.0 |
|
| RRE Gross Charge-offs |
— |
|
— |
|
— |
|
— |
|
— |
|
(0.1) |
|
— |
|
— |
|
(0.1) |
|
| Other |
|
|
|
|
|
|
|
|
|
| Risk Rating: |
|
|
|
|
|
|
|
|
|
| 1 to 3 Category |
86.0 |
|
— |
|
— |
|
— |
|
— |
|
— |
|
— |
|
— |
|
86.0 |
|
| 4 to 5 Category |
141.0 |
|
— |
|
— |
|
— |
|
— |
|
— |
|
— |
|
— |
|
141.0 |
|
| Total Other |
227.0 |
|
— |
|
— |
|
— |
|
— |
|
— |
|
— |
|
— |
|
227.0 |
|
| Other Gross Charge-offs |
(0.2) |
|
— |
|
— |
|
— |
|
— |
|
— |
|
— |
|
— |
|
(0.2) |
|
| Total Personal |
1,443.0 |
|
1,122.2 |
|
654.7 |
|
1,299.9 |
|
1,222.7 |
|
2,566.6 |
|
12,619.7 |
|
588.5 |
|
21,517.3 |
|
| Personal Gross Charge-Offs |
(0.2) |
|
— |
|
— |
|
— |
|
— |
|
(0.2) |
|
— |
|
— |
|
(0.4) |
|
| Total Loans |
$ |
7,843.0 |
|
$ |
3,122.0 |
|
$ |
2,591.3 |
|
$ |
2,759.6 |
|
$ |
2,137.0 |
|
$ |
3,341.4 |
|
$ |
19,439.0 |
|
$ |
715.0 |
|
$ |
41,948.3 |
|
| Total Loans Gross Charge-Offs |
$ |
(0.2) |
|
$ |
— |
|
$ |
— |
|
$ |
(2.1) |
|
$ |
— |
|
$ |
(1.6) |
|
$ |
— |
|
$ |
— |
|
$ |
(3.9) |
|
Notes to Consolidated Financial Statements (unaudited) (continued)
Past Due Status. Past due status is based on the length of time from the contractual due date a principal or interest payment has been past due. For disclosure purposes, loans that are 29 days past due or less are reported as current.
The following table provides balances and delinquency status of accrual and nonaccrual loans by segment and class as of June 30, 2026 and December 31, 2025.
TABLE 45: DELINQUENCY STATUS
|
|
|
|
|
|
|
|
|
|
|
|
|
|
|
|
|
|
|
|
|
|
|
|
|
|
|
|
ACCRUAL |
|
|
NONACCRUAL WITH NO ALLOWANCE |
| (In Millions) |
CURRENT |
30 – 59 DAYS
PAST DUE |
60 – 89 DAYS
PAST DUE |
90 DAYS
OR MORE
PAST DUE |
TOTAL ACCRUAL |
NONACCRUAL |
TOTAL LOANS |
| June 30, 2026 |
|
|
|
|
|
|
|
|
| Commercial |
|
|
|
|
|
|
|
|
| Commercial and Institutional |
$ |
6,721.3 |
|
$ |
6.8 |
|
$ |
3.3 |
|
$ |
— |
|
$ |
6,731.4 |
|
$ |
44.6 |
|
$ |
6,776.0 |
|
$ |
2.4 |
|
| Commercial Real Estate |
5,204.6 |
|
92.7 |
|
11.1 |
|
5.7 |
|
5,314.1 |
|
2.1 |
|
5,316.2 |
|
2.1 |
|
| Subscription Finance |
4,166.7 |
|
19.6 |
|
1.5 |
|
— |
|
4,187.8 |
|
— |
|
4,187.8 |
|
— |
|
| Fund Finance |
1,544.3 |
|
— |
|
0.2 |
|
— |
|
1,544.5 |
|
— |
|
1,544.5 |
|
— |
|
| Other |
3,538.3 |
|
— |
|
— |
|
— |
|
3,538.3 |
|
0.5 |
|
3,538.8 |
|
— |
|
| Total Commercial |
21,175.2 |
|
119.1 |
|
16.1 |
|
5.7 |
|
21,316.1 |
|
47.2 |
|
21,363.3 |
|
4.5 |
|
| Personal |
|
|
|
|
|
|
|
|
| Private Client |
15,693.1 |
|
84.0 |
|
91.8 |
|
17.6 |
|
15,886.5 |
|
5.4 |
|
15,891.9 |
|
— |
|
| Residential Real Estate |
6,024.4 |
|
1.1 |
|
1.6 |
|
4.7 |
|
6,031.8 |
|
18.7 |
|
6,050.5 |
|
17.7 |
|
| Other |
516.3 |
|
— |
|
— |
|
— |
|
516.3 |
|
— |
|
516.3 |
|
— |
|
| Total Personal |
22,233.8 |
|
85.1 |
|
93.4 |
|
22.3 |
|
22,434.6 |
|
24.1 |
|
22,458.7 |
|
17.7 |
|
| Total Loans |
$ |
43,409.0 |
|
$ |
204.2 |
|
$ |
109.5 |
|
$ |
28.0 |
|
$ |
43,750.7 |
|
$ |
71.3 |
|
$ |
43,822.0 |
|
$ |
22.2 |
|
|
|
|
|
|
|
|
|
|
|
|
|
|
|
|
|
|
|
|
|
|
|
|
|
|
|
|
|
|
|
|
|
|
|
|
|
|
|
ACCRUAL |
|
|
NONACCRUAL WITH NO ALLOWANCE |
| (In Millions) |
CURRENT |
30 – 59 DAYS
PAST DUE |
60 – 89 DAYS
PAST DUE |
90 DAYS
OR MORE
PAST DUE |
TOTAL ACCRUAL |
NONACCRUAL |
TOTAL LOANS |
| December 31, 2025 |
|
|
|
|
|
|
|
|
| Commercial |
|
|
|
|
|
|
|
|
| Commercial and Institutional |
$ |
6,509.6 |
|
$ |
39.2 |
|
$ |
0.8 |
|
$ |
6.0 |
|
$ |
6,555.6 |
|
$ |
39.7 |
|
$ |
6,595.3 |
|
$ |
21.3 |
|
| Commercial Real Estate |
5,222.1 |
|
37.3 |
|
3.6 |
|
9.2 |
|
5,272.2 |
|
— |
|
5,272.2 |
|
— |
|
| Subscription Finance |
3,562.4 |
|
41.0 |
|
— |
|
— |
|
3,603.4 |
|
— |
|
3,603.4 |
|
— |
|
| Fund Finance |
1,354.4 |
|
— |
|
— |
|
3.3 |
|
1,357.7 |
|
— |
|
1,357.7 |
|
— |
|
| Other |
3,601.8 |
|
— |
|
— |
|
— |
|
3,601.8 |
|
0.6 |
|
3,602.4 |
|
— |
|
| Total Commercial |
20,250.3 |
|
117.5 |
|
4.4 |
|
18.5 |
|
20,390.7 |
|
40.3 |
|
20,431.0 |
|
21.3 |
|
| Personal |
|
|
|
|
|
|
|
|
| Private Client |
15,022.2 |
|
128.8 |
|
8.5 |
|
3.1 |
|
15,162.6 |
|
6.7 |
|
15,169.3 |
|
— |
|
| Residential Real Estate |
6,050.7 |
|
11.7 |
|
25.5 |
|
3.4 |
|
6,091.3 |
|
29.7 |
|
6,121.0 |
|
26.9 |
|
| Other |
227.0 |
|
— |
|
— |
|
— |
|
227.0 |
|
— |
|
227.0 |
|
— |
|
| Total Personal |
21,299.9 |
|
140.5 |
|
34.0 |
|
6.5 |
|
21,480.9 |
|
36.4 |
|
21,517.3 |
|
26.9 |
|
| Total Loans |
$ |
41,550.2 |
|
$ |
258.0 |
|
$ |
38.4 |
|
$ |
25.0 |
|
$ |
41,871.6 |
|
$ |
76.7 |
|
$ |
41,948.3 |
|
$ |
48.2 |
|
|
|
|
|
|
|
|
|
|
|
Interest income that would have been recorded for nonaccrual loans in accordance with their original terms was $1.1 million and $2.0 million for the three and six months ended June 30, 2026, respectively, and $1.3 million and $1.9 million for the three and six months ended June 30, 2025, respectively.
Northern Trust may obtain physical possession of real estate via foreclosure or an in-substance repossession. As of June 30, 2026 and December 31, 2025, Northern Trust did not hold any foreclosed real estate properties as a result of obtaining physical possession. As of June 30, 2026 and December 31, 2025, Northern Trust had loans with a carrying value of $3.1 million and $7.9 million, respectively, for which formal foreclosure proceedings were in process.
Notes to Consolidated Financial Statements (unaudited) (continued)
Loan Modifications to Borrowers Experiencing Financial Difficulty
Northern Trust may provide payment relief by modifying the terms of the original loans for borrowers experiencing financial difficulties. Loan modifications to borrowers experiencing financial difficulty involve primarily extension of term, deferrals of principal and interest, interest rate concessions, and other modifications or a combination thereof, and totaled $12.0 million and $19.7 million for the three and six months ended June 30, 2026 respectively, and $18.9 million and $32.7 million for the three and six months ended June 30, 2025, respectively. Northern Trust considers payment deferrals of less than 90 days as insignificant, absent any material modifications to other loan terms.
The effectiveness of Northern Trust’s modification efforts is measured by the loans’ respective past-due status under the modified terms as of the end of the period. As of June 30, 2026, among loans modified within the previous 12 months, $0.6 million were 30-89 days past due and $0.6 million were 90 days or more past due. As of June 30, 2025, loans that were modified in the previous 12 months and 30-89 days past due totaled $4.4 million. There were no loan modifications 90 days past due or more. All modifications to borrowers experiencing financial difficulty continue to be reported as non-accrual loans until the requirements for returning to performing status are met. There were no charge-offs related to modifications to borrowers experiencing financial difficulty that had been modified in the last 12 month for the three and six months ended June 30, 2026, and there were $0.1 million in charge-offs for the three and six months ended June 30, 2025.
There were no undrawn loan commitments and $0.1 million in standby letters of credit issued to financially distressed borrowers for which Northern Trust has modified the payment terms of the loans as of June 30, 2026. There were no undrawn loan commitments or standby letters of credit issued to financially distressed borrowers for which Northern Trust has modified the payment terms of the loans as of December 31, 2025.
Note 6 – Allowance for Credit Losses
Allowance and Provision for Credit Losses. The allowance for credit losses—which represents management’s best estimate of lifetime expected credit losses related to various financial assets subject to credit risk, off-balance-sheet credit exposures, and specific borrower relationships—is determined by management through a disciplined credit review process. Northern Trust measures expected credit losses of financial assets with similar risk characteristics on a collective basis. A financial asset is measured individually if it does not share similar risk characteristics with other financial assets and the related allowance is determined through an individual evaluation.
Management’s estimates utilized in establishing an appropriate level of allowance for credit losses are not dependent on any single assumption. In determining an appropriate allowance level, management evaluates numerous variables and takes into consideration past events, current conditions, and reasonable and supportable forecasts. Northern Trust employs multiple scenarios over a reasonable and supportable period (currently two years) to project future conditions. Key variables determined to be relevant for projecting credit losses on the portfolios in scope include macroeconomic factors, such as GDP growth, unemployment, non-farm employment, corporate profits, consumer spending, personal income, commercial real estate prices, housing price index, credit spreads, and market volatility. For periods beyond the reasonable and supportable period, Northern Trust reverts to its own historical loss experiences on a straight-line basis over four quarters. While the primary forecast reflects expectations of steady growth, stable interest rates, and modest labor market improvement, management recognizes that current global conditions continue to be subject to elevated uncertainty. Recognizing the uncertainty in the primary forecast, an alternative scenario is also considered, which reflects a recession that incorporates the experiences of a wider set of historical economic cycles.
The results of the credit reserve estimation methodology are reviewed quarterly by Northern Trust’s Credit Loss Reserve Committee, which receives input from Financial Risk Management, Treasury, Corporate Finance, the Economic Research Department, and each of Northern Trust’s reporting business units. The Credit Loss Reserve Committee determines the probability weights applied to each forecast approved by Northern Trust’s Macroeconomic Scenario Development Committee, and also reviews and approves qualitative adjustments to the collective allowance in line with Northern Trust’s qualitative adjustment framework.
As of June 30, 2026, qualitative adjustments continued to reflect the potential for higher‑than‑anticipated losses on large individual exposures and the possible impact of climate‑related risks on CRE property values. Overall, the qualitative component of the allowance remained stable as of June 30, 2026, compared to December 31, 2025.
Northern Trust estimates expected credit losses over the contractual term of the financial assets adjusted for prepayments, unless prepayments are not relevant to specific portfolios or sub-portfolios. Extension and renewal options are typically not considered since it is not Northern Trust’s practice to enter into arrangements where the borrower has the unconditional option to renew, or a conditional extension option whereby the conditions are beyond Northern Trust’s control.
Notes to Consolidated Financial Statements (unaudited) (continued)
The Provision for Credit Losses on the consolidated statements of income represents the change in the Allowance for Credit Losses, after consideration of charge-offs and recoveries, on the consolidated balance sheets and is the charge to current period earnings. It represents the amount needed to maintain the Allowance for Credit Losses on the consolidated balance sheets at an appropriate level to absorb lifetime expected credit losses related to financial assets in scope. Actual losses may vary from current estimates and the amount of the Provision for Credit Losses may be either greater or less than actual net charge-offs.
The following table provides information regarding changes in the total Allowance for Credit Losses during the three and six months ended June 30, 2026 and 2025.
TABLE 46: CHANGES IN THE ALLOWANCE FOR CREDIT LOSSES
|
|
|
|
|
|
|
|
|
|
|
|
|
|
|
|
|
|
|
THREE MONTHS ENDED JUNE 30, 2026 |
| (In Millions) |
LOANS |
UNDRAWN LOAN COMMITMENTS AND STANDBY LETTERS OF CREDIT |
HELD TO MATURITY DEBT SECURITIES |
OTHER FINANCIAL ASSETS |
TOTAL |
| Balance at Beginning of Period |
$ |
161.1
|
|
$ |
25.5
|
|
$ |
7.7
|
|
$ |
0.9
|
|
$ |
195.2
|
|
| Charge-Offs |
(0.2) |
|
—
|
|
—
|
|
—
|
|
(0.2) |
|
| Recoveries |
0.6
|
|
—
|
|
—
|
|
—
|
|
0.6
|
|
| Net Recoveries (Charge-Offs) |
0.4
|
|
—
|
|
—
|
|
—
|
|
0.4
|
|
Provision for Credit Losses(1)
|
(0.6) |
|
(3.6) |
|
(1.1) |
|
—
|
|
(5.3) |
|
| Balance at End of Period |
$ |
160.9
|
|
$ |
21.9
|
|
$ |
6.6
|
|
$ |
0.9
|
|
$ |
190.3
|
|
(1) There was no provision for credit losses for the three months ended June 30, 2026 for AFS debt securities. See further detail in Note 4—Securities.
|
|
|
|
|
|
|
|
|
|
|
|
|
|
|
|
|
|
|
|
|
|
|
|
|
SIX MONTHS ENDED JUNE 30, 2026 |
| (In Millions) |
LOANS |
UNDRAWN LOAN COMMITMENTS AND STANDBY LETTERS OF CREDIT |
DEBT SECURITIES HELD TO MATURITY |
OTHER FINANCIAL ASSETS |
TOTAL |
| Balance at Beginning of Period |
$ |
164.3
|
|
$ |
23.3
|
|
$ |
9.3
|
|
$ |
1.4
|
|
$ |
198.3
|
|
| Charge-Offs |
(0.6) |
|
—
|
|
—
|
|
—
|
|
(0.6) |
|
| Recoveries |
0.9
|
|
—
|
|
—
|
|
—
|
|
0.9
|
|
| Net Recoveries (Charge-Offs) |
0.3
|
|
—
|
|
—
|
|
—
|
|
0.3
|
|
Provision for Credit Losses(1)
|
(3.7) |
|
(1.4) |
|
(2.7) |
|
(0.5) |
|
(8.3) |
|
| Balance at End of Period |
$ |
160.9
|
|
$ |
21.9
|
|
$ |
6.6
|
|
$ |
0.9
|
|
$ |
190.3
|
|
(1) There was no provision for credit losses for the six months ended June 30, 2026 for AFS debt securities. See further detail in Note 4—Securities.
|
|
|
|
|
|
|
|
|
|
|
|
|
|
|
|
|
|
|
THREE MONTHS ENDED JUNE 30, 2025 |
| (In Millions) |
LOANS |
UNDRAWN LOAN COMMITMENTS AND STANDBY LETTERS OF CREDIT |
HELD TO MATURITY DEBT SECURITIES |
OTHER FINANCIAL ASSETS |
TOTAL |
| Balance at Beginning of Period |
$ |
167.1 |
|
$ |
32.8 |
|
$ |
6.7 |
|
$ |
0.7 |
|
$ |
207.3 |
|
| Charge-Offs |
(0.1) |
|
— |
|
— |
|
— |
|
(0.1) |
|
| Recoveries |
0.4 |
|
— |
|
— |
|
— |
|
0.4 |
|
| Net Recoveries (Charge-Offs) |
0.3 |
|
— |
|
— |
|
— |
|
0.3 |
|
Provision for Credit Losses(1)
|
13.1 |
|
1.9 |
|
0.2 |
|
0.4 |
|
15.6 |
|
| Balance at End of Period |
$ |
180.5 |
|
$ |
34.7 |
|
$ |
6.9 |
|
$ |
1.1 |
|
$ |
223.2 |
|
(1) The table excludes a provision for credit losses of $0.9 million for the three months ended June 30, 2025 for AFS debt securities. See further detail in Note 4—Securities.
|
|
|
|
|
|
|
|
|
|
|
|
|
|
|
|
|
|
|
|
|
|
|
|
|
SIX MONTHS ENDED JUNE 30, 2025 |
| (In Millions) |
LOANS |
UNDRAWN LOAN COMMITMENTS AND STANDBY LETTERS OF CREDIT |
HELD TO MATURITY DEBT SECURITIES |
OTHER FINANCIAL ASSETS |
TOTAL |
| Balance at Beginning of Period |
$ |
168.0 |
|
$ |
30.4 |
|
$ |
6.5 |
|
$ |
1.0 |
|
$ |
205.9 |
|
| Charge-Offs |
(0.4) |
|
— |
|
— |
|
— |
|
(0.4) |
|
| Recoveries |
0.9 |
|
— |
|
— |
|
— |
|
0.9 |
|
| Net Recoveries (Charge-Offs) |
0.5 |
|
— |
|
— |
|
— |
|
0.5 |
|
Provision for Credit Losses(1)
|
12.0 |
|
4.3 |
|
0.4 |
|
0.1 |
|
16.8 |
|
| Balance at End of Period |
$ |
180.5 |
|
$ |
34.7 |
|
$ |
6.9 |
|
$ |
1.1 |
|
$ |
223.2 |
|
(1) The table excludes a provision for credit losses of $0.7 million for the six months ended June 30, 2025 for AFS debt securities. See further detail in Note 4—Securities.
Notes to Consolidated Financial Statements (unaudited) (continued)
For the three and six months ended June 30, 2026, there was a negative Provision for Credit Losses of $5.3 million and $8.3 million, respectively, as compared to a provision of $15.6 million and $16.8 million for the three and six months ended June 30, 2025, respectively, excluding the provision for AFS debt securities. The negative provision in the current quarter primarily reflected a decrease in the collective reserve, partially offset by an increase in individual reserves. The decrease in the collective reserve was primarily driven by a strengthening macroeconomic outlook and improved credit quality for the CRE and C&I portfolios. The increase in the individual reserve was driven by a small number of non-performing loans. The negative provision in the current-year period was primarily in the C&I portfolio, driven by a strengthening macroeconomic outlook and improved credit quality; partially offset by an increase in specific reserves related to a small number of non-performing loans.
The portion of the allowance assigned to loans, HTM debt securities, and other financial assets is presented as a contra asset in Allowance for Credit Losses on the consolidated balance sheets. The portion of the allowance assigned to undrawn loan commitments and standby letters of credit is reported in Other Liabilities on the consolidated balance sheets. For credit exposure and the associated allowance related to fee receivables, please refer to Note 13—Revenue from Contracts with Clients. For information related to the allowance for AFS debt securities, please refer to Note 4—Securities.
Allowance for the Loan Portfolio. The following table provides information regarding changes in the Allowance for Credit Losses related to loans, including undrawn loan commitments and standby letters of credit, by segment during the three and six months ended June 30, 2026 and 2025.
TABLE 47: CHANGES IN THE ALLOWANCE FOR CREDIT LOSSES RELATED TO LOANS
|
|
|
|
|
|
|
|
|
|
|
|
|
|
|
|
|
|
|
|
|
|
THREE MONTHS ENDED JUNE 30, 2026 |
|
LOANS |
UNDRAWN LOAN COMMITMENTS AND STANDBY LETTERS OF CREDIT |
| (In Millions) |
COMMERCIAL |
PERSONAL |
TOTAL |
COMMERCIAL |
PERSONAL |
TOTAL |
| Balance at Beginning of Period |
$ |
131.5
|
|
$ |
29.6
|
|
$ |
161.1
|
|
$ |
21.5
|
|
$ |
4.0
|
|
$ |
25.5
|
|
| Charge-Offs |
—
|
|
(0.2) |
|
(0.2) |
|
—
|
|
—
|
|
—
|
|
| Recoveries |
—
|
|
0.6
|
|
0.6
|
|
—
|
|
—
|
|
—
|
|
| Net Recoveries (Charge-Offs) |
—
|
|
0.4
|
|
0.4
|
|
—
|
|
—
|
|
—
|
|
| Provision for Credit Losses |
(0.8) |
|
0.2
|
|
(0.6) |
|
(3.6) |
|
—
|
|
(3.6) |
|
| Balance at End of Period |
$ |
130.7
|
|
$ |
30.2
|
|
$ |
160.9
|
|
$ |
17.9
|
|
$ |
4.0
|
|
$ |
21.9
|
|
|
|
|
|
|
|
|
|
|
|
|
|
|
|
|
|
|
|
|
|
|
|
|
|
|
|
|
|
|
SIX MONTHS ENDED JUNE 30, 2026 |
|
LOANS |
UNDRAWN LOAN COMMITMENTS AND STANDBY LETTERS OF CREDIT |
| (In Millions) |
COMMERCIAL |
PERSONAL |
TOTAL |
COMMERCIAL |
PERSONAL |
TOTAL |
| Balance at Beginning of Period |
$ |
132.5
|
|
$ |
31.8
|
|
$ |
164.3
|
|
$ |
21.7
|
|
$ |
1.6
|
|
$ |
23.3
|
|
| Charge-Offs |
(0.4) |
|
(0.2) |
|
(0.6) |
|
—
|
|
—
|
|
—
|
|
| Recoveries |
—
|
|
0.9
|
|
0.9
|
|
—
|
|
—
|
|
—
|
|
| Net Recoveries (Charge-Offs) |
(0.4) |
|
0.7
|
|
0.3
|
|
—
|
|
—
|
|
—
|
|
| Provision for Credit Losses |
(1.4) |
|
(2.3) |
|
(3.7) |
|
(3.8) |
|
2.4
|
|
(1.4) |
|
| Balance at End of Period |
$ |
130.7
|
|
$ |
30.2
|
|
$ |
160.9
|
|
$ |
17.9
|
|
$ |
4.0
|
|
$ |
21.9
|
|
Notes to Consolidated Financial Statements (unaudited) (continued)
|
|
|
|
|
|
|
|
|
|
|
|
|
|
|
|
|
|
|
|
|
|
THREE MONTHS ENDED JUNE 30, 2025 |
|
LOANS |
UNDRAWN LOAN COMMITMENTS AND STANDBY LETTERS OF CREDIT |
| (In Millions) |
COMMERCIAL |
PERSONAL |
TOTAL |
COMMERCIAL |
PERSONAL |
TOTAL |
| Balance at Beginning of Period |
$ |
133.6 |
|
$ |
33.5 |
|
$ |
167.1 |
|
$ |
30.7 |
|
$ |
2.1 |
|
$ |
32.8 |
|
| Charge-Offs |
— |
|
(0.1) |
|
(0.1) |
|
— |
|
— |
|
— |
|
| Recoveries |
— |
|
0.4 |
|
0.4 |
|
— |
|
— |
|
— |
|
| Net Recoveries (Charge-Offs) |
— |
|
0.3 |
|
0.3 |
|
— |
|
— |
|
— |
|
| Provision for Credit Losses |
12.2 |
|
0.9 |
|
13.1 |
|
1.8 |
|
0.1 |
|
1.9 |
|
| Balance at End of Period |
$ |
145.8 |
|
$ |
34.7 |
|
$ |
180.5 |
|
$ |
32.5 |
|
$ |
2.2 |
|
$ |
34.7 |
|
|
|
|
|
|
|
|
|
|
|
|
|
|
|
|
|
|
|
|
|
|
|
|
|
|
|
|
|
|
SIX MONTHS ENDED JUNE 30, 2025 |
|
LOANS |
UNDRAWN LOAN COMMITMENTS AND STANDBY LETTERS OF CREDIT |
| (In Millions) |
COMMERCIAL |
PERSONAL |
TOTAL |
COMMERCIAL |
PERSONAL |
TOTAL |
| Balance at Beginning of Period |
$ |
138.5 |
|
$ |
29.5 |
|
$ |
168.0 |
|
$ |
28.3 |
|
$ |
2.1 |
|
$ |
30.4 |
|
| Charge-Offs |
(0.3) |
|
(0.1) |
|
(0.4) |
|
— |
|
— |
|
— |
|
| Recoveries |
0.1 |
|
0.8 |
|
0.9 |
|
— |
|
— |
|
— |
|
| Net Recoveries (Charge-Offs) |
(0.2) |
|
0.7 |
|
0.5 |
|
— |
|
— |
|
— |
|
| Provision for Credit Losses |
7.5 |
|
4.5 |
|
12.0 |
|
4.2 |
|
0.1 |
|
4.3 |
|
| Balance at End of Period |
$ |
145.8 |
|
$ |
34.7 |
|
$ |
180.5 |
|
$ |
32.5 |
|
$ |
2.2 |
|
$ |
34.7 |
|
Allowance Related to Credit Exposure Evaluated on a Collective Basis. Expected credit losses are measured on a collective basis as long as the financial assets included in the respective pool share similar risk characteristics. If financial assets are deemed to not share similar risk characteristics, an individual assessment is warranted.
The allowance estimation methodology for the collective assessment is based on data representative of the Corporation’s financial asset portfolio from a historical observation period that includes both expansionary and recessionary periods. The estimation methodology and the related qualitative adjustment framework segregate the loan portfolio into segments and classes based on similar risk characteristics or risk monitoring methods.
Northern Trust utilizes a quantitative PD/LGD approach for the calculation of its credit allowance on a collective basis. For each of the different parameters, specific credit models or qualitative estimation methodologies for the individual loan classes were developed. For each class, PD and LGD are applied to the exposure at default for each projected quarter to determine the quantitative component of the allowance. The quantitative allowance is then reviewed within a comprehensive qualitative adjustment framework, through which management applies judgment by assessing internal risk factors, potential limitations in the quantitative methodology, and other factors that are not fully contemplated in the forecast to compute an adjustment to the quantitative allowance for each segment and class of the loan portfolio.
Allowance Related to Credit Exposure Evaluated on an Individual Basis. The individual allowance is determined through individual evaluations of loans and lending-related commitments that have defaulted, generally those with borrower ratings of 8 and 9. These evaluations are based on expected future cash flows, the value of collateral, and other factors that may impact the borrower’s ability to pay. If the loan valuation is less than the recorded value of the loan, either an allowance is established or a charge-off is recorded for the difference. For defaulted loans for which the amount of allowance, if any, is determined based on the value of the underlying real estate collateral, third-party appraisals are typically obtained and utilized by management. These appraisals are generally less than twelve months old and are subject to adjustments to reflect management’s judgment as to the realizable value of the collateral.
Notes to Consolidated Financial Statements (unaudited) (continued)
The following table provides information regarding the recorded investments in loans and the Allowance for Credit Losses for loans and undrawn loan commitments and standby letters of credit by segment as of June 30, 2026 and December 31, 2025.
TABLE 48: RECORDED INVESTMENTS IN LOANS
|
|
|
|
|
|
|
|
|
|
|
|
|
|
|
|
|
|
|
|
|
|
JUNE 30, 2026 |
DECEMBER 31, 2025 |
| (In Millions) |
COMMERCIAL |
PERSONAL |
TOTAL |
COMMERCIAL |
PERSONAL |
TOTAL |
| Loans |
|
|
|
|
|
|
| Evaluated on an Individual Basis |
$ |
56.5
|
|
$ |
39.5
|
|
$ |
96.0
|
|
$ |
55.0 |
|
$ |
45.9 |
|
$ |
100.9 |
|
| Evaluated on a Collective Basis |
21,306.8
|
|
22,419.2
|
|
43,726.0
|
|
20,376.0 |
|
21,471.4 |
|
41,847.4 |
|
| Total Loans |
21,363.3
|
|
22,458.7
|
|
43,822.0
|
|
20,431.0 |
|
21,517.3 |
|
41,948.3 |
|
| Allowance for Credit Losses on Loans |
|
|
|
|
|
|
| Evaluated on an Individual Basis |
14.2
|
|
5.0
|
|
19.2
|
|
5.9 |
|
4.3 |
|
10.2 |
|
| Evaluated on a Collective Basis |
116.5
|
|
25.2
|
|
141.7
|
|
126.6 |
|
27.5 |
|
154.1 |
|
| Allowance Assigned to Loans |
130.7
|
|
30.2
|
|
160.9
|
|
132.5 |
|
31.8 |
|
164.3 |
|
|
|
|
|
|
|
|
|
|
|
|
|
|
|
|
|
|
|
|
|
|
| Allowance Assigned to Undrawn Loan Commitments and Standby Letters of Credit - Evaluated on a Collective Basis |
17.9
|
|
4.0
|
|
21.9
|
|
21.7 |
|
1.6 |
|
23.3 |
|
| Total Allowance Assigned to Loans and Undrawn Loan Commitments and Standby Letters of Credit |
$ |
148.6
|
|
$ |
34.2
|
|
$ |
182.8
|
|
$ |
154.2 |
|
$ |
33.4 |
|
$ |
187.6 |
|
Northern Trust analyzes its exposure to credit losses from both on-balance-sheet and off-balance-sheet activity using a consistent methodology for the quantitative as well as the qualitative framework. For purposes of estimating the allowance for credit losses for undrawn loan commitments and standby letters of credit, the exposure at default includes estimated draw downs of the undrawn commitments based on credit utilization factors, resulting in a proportionate amount of expected credit losses.
Allowance for Held to Maturity Debt Securities Portfolio. The following table provides information regarding changes in the allowance for credit losses for HTM debt securities during the three and six months ended June 30, 2026 and 2025.
TABLE 49: CHANGES IN THE ALLOWANCE FOR CREDIT LOSSES RELATED TO HELD TO MATURITY DEBT SECURITIES
|
|
|
|
|
|
|
|
|
|
|
|
|
|
|
|
|
|
|
|
|
|
|
|
|
THREE MONTHS ENDED JUNE 30, 2026 |
| (In Millions) |
CORPORATE DEBT |
NON-U.S. GOVERNMENT |
SUB-SOVEREIGN, SUPRANATIONAL, AND NON-U.S. AGENCY BONDS |
OBLIGATIONS OF STATES AND POLITICAL SUBDIVISIONS(1)
|
COVERED BONDS |
OTHER |
TOTAL |
| Balance at Beginning of Period |
$ |
0.2
|
|
$ |
2.8
|
|
$ |
2.7
|
|
$ |
0.7
|
|
$ |
—
|
|
$ |
1.3
|
|
$ |
7.7
|
|
| Provision for Credit Losses |
(0.1) |
|
(0.4) |
|
(0.5) |
|
(0.2) |
|
—
|
|
0.1
|
|
(1.1) |
|
| Balance at End of Period |
$ |
0.1
|
|
$ |
2.4
|
|
$ |
2.2
|
|
$ |
0.5
|
|
$ |
—
|
|
$ |
1.4
|
|
$ |
6.6
|
|
(1) The allowance for Obligations of States and Political Subdivisions is related to (non pre-refunded) municipal securities that do not fall under Northern Trust’s zero-loss assumption.
|
|
|
|
|
|
|
|
|
|
|
|
|
|
|
|
|
|
|
|
|
|
|
|
|
|
|
|
|
|
|
|
|
SIX MONTHS ENDED JUNE 30, 2026 |
| (In Millions) |
CORPORATE DEBT |
NON-U.S. GOVERNMENT |
SUB-SOVEREIGN, SUPRANATIONAL, AND NON-U.S. AGENCY BONDS |
OBLIGATIONS OF STATES AND POLITICAL SUBDIVISIONS(1)
|
COVERED BONDS |
OTHER |
TOTAL |
| Balance at Beginning of Period |
$ |
0.3
|
|
$ |
2.8
|
|
$ |
2.8
|
|
$ |
1.1
|
|
$ |
0.1
|
|
$ |
2.2
|
|
$ |
9.3
|
|
| Provision for Credit Losses |
(0.2) |
|
(0.4) |
|
(0.6) |
|
(0.6) |
|
(0.1) |
|
(0.8) |
|
(2.7) |
|
| Balance at End of Period |
$ |
0.1
|
|
$ |
2.4
|
|
$ |
2.2
|
|
$ |
0.5
|
|
$ |
—
|
|
$ |
1.4
|
|
$ |
6.6
|
|
(1) The allowance for Obligations of States and Political Subdivisions is related to (non pre-refunded) municipal securities that do not fall under Northern Trust’s zero-loss assumption.
|
|
|
|
|
|
|
|
|
|
|
|
|
|
|
|
|
|
|
|
|
|
|
|
|
THREE MONTHS ENDED JUNE 30, 2025 |
| (In Millions) |
CORPORATE DEBT |
NON-U.S. GOVERNMENT |
SUB-SOVEREIGN, SUPRANATIONAL, AND NON-U.S. AGENCY BONDS |
OBLIGATIONS OF STATES AND POLITICAL SUBDIVISIONS(1)
|
COVERED BONDS |
OTHER |
TOTAL |
| Balance at Beginning of Period |
$ |
0.3 |
|
$ |
2.1 |
|
$ |
1.1 |
|
$ |
0.9 |
|
$ |
— |
|
$ |
2.3 |
|
$ |
6.7 |
|
| Provision for Credit Losses |
— |
|
0.1 |
|
0.1 |
|
— |
|
— |
|
— |
|
0.2 |
|
| Balance at End of Period |
$ |
0.3 |
|
$ |
2.2 |
|
$ |
1.2 |
|
$ |
0.9 |
|
$ |
— |
|
$ |
2.3 |
|
$ |
6.9 |
|
(1) The allowance for Obligations of States and Political Subdivisions is related to (non pre-refunded) municipal securities that do not fall under Northern Trust’s zero-loss assumption.
Notes to Consolidated Financial Statements (unaudited) (continued)
|
|
|
|
|
|
|
|
|
|
|
|
|
|
|
|
|
|
|
|
|
|
|
|
|
|
|
|
|
|
|
|
|
SIX MONTHS ENDED JUNE 30, 2025 |
| (In Millions) |
CORPORATE DEBT |
NON-U.S. GOVERNMENT |
SUB-SOVEREIGN, SUPRANATIONAL, AND NON-U.S. AGENCY BONDS |
OBLIGATIONS OF STATES AND POLITICAL SUBDIVISIONS(1)
|
COVERED BONDS |
OTHER |
TOTAL |
| Balance at Beginning of Period |
$ |
0.3 |
|
$ |
2.0 |
|
$ |
1.1 |
|
$ |
0.9 |
|
$ |
— |
|
$ |
2.2 |
|
$ |
6.5 |
|
| Provision for Credit Losses |
— |
|
0.2 |
|
0.1 |
|
— |
|
— |
|
0.1 |
|
0.4 |
|
| Balance at End of Period |
$ |
0.3 |
|
$ |
2.2 |
|
$ |
1.2 |
|
$ |
0.9 |
|
$ |
— |
|
$ |
2.3 |
|
$ |
6.9 |
|
(1) The allowance for Obligations of States and Political Subdivisions is related to (non pre-refunded) municipal securities that do not fall under Northern Trust’s zero-loss assumption.
HTM debt securities classified as U.S. government, government sponsored agency, and certain securities classified as obligations of states and political subdivisions are considered to be guarantees of the U.S. government or an agency of the U.S. government and, therefore, an allowance for credit losses is not estimated for such investments as the expected probability of non-payment of the amortized cost basis is zero.
HTM debt securities classified as “other” relate to investments purchased by Northern Trust to fulfill its obligations under the CRA. Northern Trust fulfills its obligations under the CRA by making qualified investments for purposes of supporting institutions and programs that benefit low-to-moderate income communities within Northern Trust’s market area. The allowance for CRA investments is assessed using a qualitative estimation approach primarily based on internal historical performance experience and default history of the underlying CRA loans to determine the quantitative allowance.
The allowance estimation methodology for all other HTM debt securities is developed using a combination of external and internal data. The estimation methodology groups securities with shared characteristics for which the PD and the LGD are applied to the total exposure at default to determine the quantitative component of the allowance.
Allowance for Other Financial Assets. The allowance for Other Financial Assets consists of the allowance for Due from Banks, Other Central Bank Deposits, Interest Bearing Deposits with Banks, and Other Assets. The Other Assets category includes other miscellaneous credit exposures reported in Other Assets on the consolidated balance sheets. The allowance estimation methodology for Other Financial Assets primarily utilizes a similar approach as the one used for the HTM debt securities portfolio. It consists of a combination of externally and internally developed loss data, adjusted for the appropriate contractual term. Northern Trust’s portfolio of Other Financial Assets is composed mostly of institutions within the “1 to 3” internal borrower rating category and is expected to exhibit minimal to modest likelihood of loss. The Allowance for Credit Losses related to Other Financial Assets was $0.9 million and $1.4 million as of June 30, 2026 and December 31, 2025, respectively.
Accrued Interest. Accrued interest balances are reported within Other Assets on the consolidated balance sheets. Northern Trust elected not to measure an allowance for credit losses for accrued interest receivables related to its loan and securities portfolio as its policy is to write-off uncollectible accrued interest receivable balances in a timely manner. Accrued interest is written off by reversing interest income during the period the financial asset is moved from an accrual to a nonaccrual status.
The following table provides the amount of accrued interest excluded from the amortized cost basis of the following portfolios.
TABLE 50: ACCRUED INTEREST
|
|
|
|
|
|
|
|
|
| (In Millions) |
JUNE 30, 2026 |
DECEMBER 31, 2025 |
| Loans |
$ |
191.1
|
|
$ |
184.6 |
|
| Debt Securities |
|
|
| Held to Maturity |
95.6
|
|
76.9 |
|
| Available for Sale |
206.4
|
|
175.0 |
|
| Other Financial Assets |
49.4
|
|
62.2 |
|
| Total |
$ |
542.5
|
|
$ |
498.7 |
|
The amount of accrued interest reversed through interest income for loans was immaterial for the three and six months ended June 30, 2026 and 2025, and there was no accrued interest reversed through interest income related to debt securities or other financial assets for the three and six months ended June 30, 2026 and 2025.
Notes to Consolidated Financial Statements (unaudited) (continued)
Note 7 – Pledged Assets, Accepted Collateral and Restricted Assets
Pledged Assets. As part of its liquidity management strategy, Northern Trust may pledge loans and/or securities to various financial market utilities to allow for client payment, clearing and settlement processing as part of our custody services. Northern Trust may also pledge loans or securities to Central Banks, Federal Home Loan Bank (FHLB) of Chicago and third parties for various purposes, for example: securing public and trust deposits, repurchase agreements, borrowings and derivative contracts.
The following table presents the carrying value of Northern Trust's pledged assets by type.
TABLE 51: TYPE OF PLEDGED ASSETS
|
|
|
|
|
|
|
|
|
| (In Billions) |
JUNE 30, 2026 |
DECEMBER 31, 2025 |
Debt Securities(1)
|
$ |
39.6
|
|
$ |
33.0 |
|
Loans(2)
|
9.1
|
|
9.4 |
|
| Total Pledged Assets |
$ |
48.7
|
|
$ |
42.4 |
|
(1) Debt securities are comprised of HTM and AFS securities.
(2) Loans pledged at the FHLB of Chicago and the Federal Reserve Bank of Chicago.
As of June 30, 2026 and December 31, 2025, $1.8 billion and $1.0 billion, respectively, of collateral pledged related to loans and/or securities, is eligible to be repledged or sold by the secured party.
Accepted Collateral. Northern Trust accepts financial assets as collateral that it may, in some instances, be permitted to repledge or sell. The collateral is generally obtained under certain reverse repurchase agreements and derivative contracts.
The following table presents the fair value of securities accepted as collateral.
TABLE 52: ACCEPTED COLLATERAL
|
|
|
|
|
|
|
|
|
| (In Millions) |
JUNE 30, 2026 |
DECEMBER 31, 2025 |
Collateral that may be repledged or sold |
|
|
Reverse repurchase agreements(1)(2)
|
$ |
92,474.8
|
|
$ |
90,475.4 |
|
| Derivative contracts |
89.7
|
|
2.7 |
|
|
|
|
|
|
|
| Total Collateral Accepted |
$ |
92,564.5
|
|
$ |
90,478.1 |
|
(1) The fair value of securities collateral that was repledged or sold totaled $92.0 billion and $89.7 billion at June 30, 2026 and December 31, 2025, respectively.
(2) This includes collateral accepted as related to the FICC sponsored member program. Refer to Note 20—Commitments and Contingent Liabilities for further information.
As of both June 30, 2026 and December 31, 2025, there were no securities accepted as collateral that could not be repledged or sold.
Restricted Assets. Certain cash may be restricted in terms of usage or withdrawal. As a result of the continuing military conflict involving Ukraine and the Russian Federation and related sanctions and legal restrictions in place, cash balances denominated in Russian rubles received for the benefit of certain clients in our Asset Servicing business are subject to distribution restrictions. As of June 30, 2026 and December 31, 2025, these balances totaled $1.9 billion and $1.8 billion, respectively, and are reported in Cash and Due from Banks on the consolidated balance sheets.
At June 30, 2026 and December 31, 2025, Northern Trust held cash of $526.7 million and $531.2 million, respectively, to meet non-U.S. reserve requirements. In March 2020, the Federal Reserve’s U.S. reserve requirement was set to zero percent. As a result, there have been no average deposits required to meet Federal Reserve Bank reserve requirements since that time.
Note 8 – Goodwill and Other Intangibles
Goodwill. Changes by reporting segment in the carrying amount of Goodwill for the six months ended June 30, 2026, including the effect of foreign exchange rates on non-U.S. dollar denominated balances, were as follows.
TABLE 53: GOODWILL
|
|
|
|
|
|
|
|
|
|
|
|
| (In Millions) |
ASSET
SERVICING |
WEALTH MANAGEMENT |
TOTAL |
| Balance at December 31, 2025 |
$ |
632.5 |
|
$ |
80.4 |
|
$ |
712.9 |
|
|
|
|
|
| Foreign Exchange Rates |
(3.3) |
|
— |
|
(3.3) |
|
| Balance at June 30, 2026 |
$ |
629.2
|
|
$ |
80.4
|
|
$ |
709.6
|
|
Other Intangible Assets. The net carrying amount of other intangible assets was $58.0 million and $59.6 million as of June 30, 2026 and December 31, 2025, respectively. Other intangible assets consist primarily of the value of acquired client relationships and are included in Other Assets on the consolidated balance sheets.
Capitalized Software. The gross carrying amount and accumulated amortization of capitalized software as of June 30, 2026 and December 31, 2025 were as follows.
Notes to Consolidated Financial Statements (unaudited) (continued)
TABLE 54: CAPITALIZED SOFTWARE
|
|
|
|
|
|
|
|
|
| (In Millions) |
JUNE 30, 2026 |
DECEMBER 31, 2025 |
| Gross Carrying Amount |
$ |
5,084.3
|
|
$ |
4,926.2 |
|
| Less: Accumulated Amortization |
2,873.4
|
|
2,574.2 |
|
| Net Book Value |
$ |
2,210.9
|
|
$ |
2,352.0 |
|
Capitalized software, which is included in Other Assets on the consolidated balance sheets, consists primarily of cost related to purchased software and internal-use software development projects that result in new or enhanced functionality, including compensation and other allowable internal costs. Fees paid for the use of software services that do not convey a software license are expensed as incurred. Amortization expense, which is included in Equipment and Software on the consolidated statements of income, totaled $173.5 million and $346.4 million for the three and six months ended June 30, 2026, respectively, and $168.0 million and $330.9 million for the three and six months ended June 30, 2025, respectively.
Northern Trust recorded a $61.5 million expense for the disposal of capitalized software, primarily related to the development of internal-use software that was no longer planned to be placed in service, which is included in Equipment and Software on the consolidated statements of income for the three and six months ended June 30, 2026.
Note 9 – Reporting Segments
Northern Trust is organized around its two client-focused reporting segments: Asset Servicing and Wealth Management. Asset management and related services are provided to Asset Servicing and Wealth Management clients primarily by the Asset Management business. The revenue and expenses of Asset Management and certain other support functions are allocated fully to Asset Servicing and Wealth Management.
Reporting segment financial information, presented on an internal management-reporting basis, is determined by accounting systems used to allocate revenue and expense to each segment, and incorporates processes for allocating assets, liabilities, equity and the applicable interest income and expense utilizing an FTP methodology. Under the methodology, assets and liabilities receive a funding charge or credit that considers interest rate risk, liquidity risk, and other product characteristics on an instrument level. Additionally, segment information is presented on an FTE basis as management believes an FTE presentation provides a clearer indication of net interest income. The adjustment to an FTE basis has no impact on Net Income.
Revenues, expenses and average assets are allocated to Asset Servicing and Wealth Management, with the exception of non-recurring activities such as certain corporate transactions and costs incurred associated with acquisitions, divestitures, litigation, restructuring, and tax adjustments not directly attributable to a specific reporting segment, which are reported within Other.
In addition to income and expenses associated with non-recurring activities, Other includes expenses for the Enterprise Chief Operating Office, Asset Management, corporate and other support functions not directly incurred by, but ultimately allocated back to Asset Servicing and Wealth Management. Other also includes the FTE adjustments of $7.6 million and $15.2 million for the three and six months ended June 30, 2026, respectively, and $4.7 million and $10.3 million for the three and six months ended June 30, 2025, respectively, in order to reconcile the segment results that are reported on an internal management-reporting basis into consolidated results.
Reporting segment results are subject to reclassification when organizational changes are made. The results are also subject to refinements in revenue and expense allocation methodologies, which are typically reflected on a retrospective basis unless it is impractical to do so.
Northern Trust’s Chief Operating Decision Maker is the Chief Executive Officer. The Chief Operating Decision Maker uses growth and profitability metrics to assess segments’ performance including segment revenue and income before income taxes. Those same measures are used by the Chief Operating Decision Maker as primary inputs into the allocation of resources in the annual planning process. Allocation of capital to each segment takes into consideration a variety of factors including average loans, average deposits and applicable regulatory capital requirements.
The following table presents the earnings contributions and certain average balances of Northern Trust’s reporting segments for the three- and six-month periods ended June 30, 2026 and 2025.
Notes to Consolidated Financial Statements (unaudited) (continued)
TABLE 55: RESULTS OF REPORTING SEGMENTS
|
|
|
|
|
|
|
|
|
|
|
|
|
|
|
|
|
|
|
|
|
|
|
|
|
|
|
| ($ In Millions) |
ASSET SERVICING |
WEALTH MANAGEMENT |
OTHER |
TOTAL CONSOLIDATED |
| THREE MONTHS ENDED JUNE 30, |
2026 |
2025 |
2026 |
2025 |
2026 |
2025 |
2026 |
2025 |
| Noninterest Income |
|
|
|
|
|
|
|
|
| Trust, Investment and Other Servicing Fees |
$ |
757.4 |
$ |
691.8 |
$ |
592.1 |
$ |
539.3 |
$ |
— |
$ |
— |
$ |
1,349.5 |
$ |
1,231.1 |
| Foreign Exchange Trading Income (Loss) |
98.9 |
61.0 |
(1.8) |
(10.4) |
— |
— |
97.1 |
50.6 |
| Other Noninterest Income |
89.3 |
70.6 |
35.8 |
34.6 |
450.8 |
0.5 |
575.9 |
105.7 |
| Total Noninterest Income |
945.6 |
823.4 |
626.1 |
563.5 |
450.8 |
0.5 |
2,022.5 |
1,387.4 |
Net Interest Income (Expense)(1)
|
416.1 |
347.2 |
265.3 |
268.3 |
(5.9) |
(5.0) |
675.5 |
610.5 |
Revenue(1)
|
1,361.7 |
1,170.6 |
891.4 |
831.8 |
444.9 |
(4.5) |
2,698.0 |
1,997.9 |
| Provision for Credit Losses |
(2.7) |
3.9 |
(1.6) |
11.2 |
(1.0) |
1.4 |
(5.3) |
16.5 |
| Noninterest Expense |
|
|
|
|
|
|
|
|
| Compensation and Benefits |
111.7 |
90.9 |
176.3 |
163.6 |
580.0 |
478.0 |
868.0 |
732.5 |
| Outside Services |
31.4 |
43.5 |
13.6 |
17.0 |
201.3 |
186.5 |
246.3 |
247.0 |
| Allocated Expense |
875.3 |
741.5 |
348.6 |
306.7 |
(1,223.9) |
(1,048.2) |
— |
— |
Other Segment Items(2)
|
22.7 |
19.4 |
21.0 |
23.7 |
480.6 |
394.0 |
524.3 |
437.1 |
| Total Noninterest Expense |
1,041.1 |
895.3 |
559.5 |
511.0 |
38.0 |
10.3 |
1,638.6 |
1,416.6 |
Income (Loss) before Income Taxes(1)
|
323.3 |
271.4 |
333.5 |
309.6 |
407.9 |
(16.2) |
1,064.7 |
564.8 |
Provision for Income Taxes(1)
|
72.9 |
58.2 |
83.2 |
75.6 |
116.4 |
9.7 |
272.5 |
143.5 |
| Net Income (Loss) |
$ |
250.4 |
$ |
213.2 |
$ |
250.3 |
$ |
234.0 |
$ |
291.5 |
$ |
(25.9) |
$ |
792.2 |
$ |
421.3 |
| Percentage of Consolidated Net Income |
32
|
% |
51 |
% |
32
|
% |
56 |
% |
36
|
% |
(7) |
% |
100
|
% |
100 |
% |
| Average Assets |
$ |
123,994.6 |
$ |
117,044.6 |
|
$ |
39,431.2 |
$ |
39,094.5 |
$ |
150.0 |
$ |
1,580.1 |
$ |
163,575.8 |
$ |
157,719.2 |
| Average Loans |
$ |
5,800.6 |
$ |
5,812.8 |
$ |
35,767.0 |
$ |
35,345.2 |
$ |
— |
$ |
— |
$ |
41,567.6 |
$ |
41,158.0 |
| Average Deposits |
$ |
100,980.6 |
$ |
95,506.7 |
$ |
26,715.1 |
$ |
25,291.0 |
$ |
150.0 |
$ |
1,580.1 |
$ |
127,845.7 |
$ |
122,377.8 |
(1) Financial measures stated on an FTE basis. The FTE adjustment was $7.6 million and $4.7 million for the three months ended June 30, 2026 and 2025, respectively, and is eliminated within “Other” in order for “Total Consolidated” to reconcile with the Consolidated Statement of Income.
(2) Other Segment Items include Occupancy, Equipment & Software and Other Operating Expense.
|
|
|
|
|
|
|
|
|
|
|
|
|
|
|
|
|
|
|
|
|
|
|
|
|
|
|
|
|
|
|
|
|
|
|
|
| (In Millions) |
ASSET SERVICING |
WEALTH MANAGEMENT |
OTHER |
TOTAL CONSOLIDATED |
| SIX MONTHS ENDED JUNE 30, |
2026 |
2025 |
2026 |
2025 |
2026 |
2025 |
2026 |
2025 |
| Noninterest Income |
|
|
|
|
|
|
|
|
| Trust, Investment and Other Servicing Fees |
$ |
1,497.9 |
$ |
1,363.7 |
$ |
1,193.0 |
$ |
1,081.2 |
$ |
— |
$ |
— |
$ |
2,690.9 |
$ |
2,444.9 |
| Foreign Exchange Trading Income (Loss) |
189.9 |
124.9 |
(5.1) |
(15.6) |
— |
— |
184.8 |
109.3 |
| Other Noninterest Income (Loss) |
174.2 |
139.2 |
69.7 |
68.1 |
454.6 |
(2.2) |
698.5 |
205.1 |
| Total Noninterest Income (Loss) |
1,862.0 |
1,627.8 |
1,257.6 |
1,133.7 |
454.6 |
(2.2) |
3,574.2 |
2,759.3 |
Net Interest Income (Expense)(1)
|
817.8 |
670.9 |
524.8 |
518.4 |
(13.1) |
(10.7) |
1,329.5 |
1,178.6 |
Revenue(1)
|
2,679.8 |
2,298.7 |
1,782.4 |
1,652.1 |
441.5 |
(12.9) |
4,903.7 |
3,937.9 |
| Provision for Credit Losses |
(5.0) |
6.0 |
— |
10.3 |
(3.3) |
1.2 |
(8.3) |
17.5 |
| Noninterest Expense |
|
|
|
|
|
|
|
|
| Compensation and Employee Benefits |
219.2 |
202.1 |
353.6 |
335.3 |
1,117.4 |
949.2 |
1,690.2 |
1,486.6 |
| Outside Services |
61.2 |
90.2 |
24.6 |
31.3 |
397.2 |
370.7 |
483.0 |
492.2 |
| Allocated Expense |
1,663.4 |
1,451.8 |
699.4 |
615.3 |
(2,362.8) |
(2,067.1) |
— |
— |
Other Segment Items(2)
|
44.4 |
41.7 |
41.0 |
46.2 |
888.0 |
767.5 |
973.4 |
855.4 |
| Total Noninterest Expense |
1,988.2 |
1,785.8 |
1,118.6 |
1,028.1 |
39.8 |
20.3 |
3,146.6 |
2,834.2 |
Income (Loss) before Income Taxes(1)
|
696.6 |
506.9 |
663.8 |
613.7 |
405.0 |
(34.4) |
1,765.4 |
1,086.2 |
Provision for Income Taxes(1)
|
156.1 |
109.1 |
165.6 |
150.0 |
125.9 |
13.8 |
447.6 |
272.9 |
| Net Income (Loss) |
$ |
540.5 |
$ |
397.8 |
$ |
498.2 |
$ |
463.7 |
$ |
279.1 |
$ |
(48.2) |
$ |
1,317.8 |
$ |
813.3 |
| Percentage of Consolidated Net Income |
41
|
% |
49 |
% |
38
|
% |
57 |
% |
21
|
% |
(6) |
% |
100
|
% |
100 |
% |
| Average Assets |
$ |
124,800.1 |
$ |
113,432.9 |
$ |
39,486.2 |
$ |
39,121.2 |
$ |
145.5 |
$ |
1,457.2 |
$ |
164,431.8 |
$ |
154,011.3 |
| Average Loans |
$ |
5,717.0 |
$ |
5,781.2 |
$ |
35,515.8 |
$ |
35,336.2 |
$ |
— |
$ |
— |
$ |
41,232.8 |
$ |
41,117.4 |
| Average Deposits |
$ |
101,696.8 |
$ |
92,418.8 |
$ |
26,593.1 |
$ |
25,290.3 |
$ |
145.5 |
$ |
1,457.2 |
$ |
128,435.4 |
$ |
119,166.3 |
(1) Financial measures stated on an FTE basis. The FTE adjustment was $15.2 million and $10.3 million for the six months ended June 30, 2026 and 2025, respectively, and is eliminated within “Other” in order for “Total Consolidated” to reconcile with the Consolidated Statement of Income.
(2) Other Segment Items include Occupancy, Equipment & Software and Other Operating Expense.
Notes to Consolidated Financial Statements (unaudited) (continued)
Note 10 – Stockholders’ Equity
Preferred Stock. The Corporation is authorized to issue 10 million shares of preferred stock without par value. The Board of Directors is authorized to fix the particular designations, preferences and relative, participating, optional and other special rights and qualifications, limitations or restrictions for each series of preferred stock issued.
As of June 30, 2026, 5,000 shares of Series D Non-Cumulative Perpetual Preferred Stock (Series D Preferred Stock) and 16,000 shares of Series E Non-Cumulative Perpetual Preferred Stock (Series E Preferred Stock) were outstanding.
Series D Preferred Stock. As of June 30, 2026, the Corporation had issued and outstanding 500,000 depositary shares, each representing a 1/100th ownership interest in a share of Series D Preferred Stock, issued in August 2016. Equity related to Series D Preferred Stock as of both June 30, 2026 and December 31, 2025 was $493.5 million. Shares of the Series D Preferred Stock have no par value and a liquidation preference of $100,000 (equivalent to $1,000 per depositary share).
Dividends on the Series D Preferred Stock, which are not mandatory, accrue and are payable on the liquidation preference amount, on a non-cumulative basis, at a rate per annum equal to (i) 4.60% from the original issue date of the Series D Preferred Stock to but excluding October 1, 2026; and (ii) a floating rate equal to the three-month CME Term Secured Overnight Finance Rate (SOFR), as administered by CME Group Benchmark Administration, Ltd., plus a statutory spread adjustment of 0.26161% (as set forth in the final rule to implement the LIBOR Act) plus 3.202% from and including October 1, 2026. Fixed rate dividends are payable in arrears on the first day of April and October of each year, through and including October 1, 2026, and floating rate dividends will be payable in arrears on the first day of January, April, July and October of each year, commencing on January 1, 2027.
Series E Preferred Stock. As of June 30, 2026, the Corporation had issued and outstanding 16 million depositary shares, each representing 1/1,000th ownership interest in a share of Series E Preferred Stock, issued in November 2019. Equity related to Series E Preferred Stock as of both June 30, 2026 and December 31, 2025 was $391.4 million. Shares of the Series E Preferred Stock have no par value and a liquidation preference of $25,000 (equivalent to $25 per depositary share).
Dividends on the Series E Preferred Stock, which are not mandatory, will accrue and be payable on the liquidation preference amount, on a non-cumulative basis, quarterly in arrears on the first day of January, April, July and October of each year, at a rate per annum equal to 4.70%. On April 21, 2026, the Corporation declared a cash dividend of $293.75 per share of Series E Preferred Stock payable on July 1, 2026, to stockholders of record as of June 15, 2026.
Common Stock. As of June 30, 2026, the Corporation had issued and outstanding shares of common stock of 245.2 million and 183.0 million, respectively. Shares are repurchased by the Corporation to, among other things, manage the Corporation’s capital levels. Repurchased shares are used for general purposes, including the issuance of shares under stock option and other incentive plans. On July 22, 2025, the Board of Directors approved a new repurchase program that authorized the Corporation to repurchase up to $2.5 billion of the Corporation’s common stock. This program has no expiration date. Repurchases prior to July 22, 2025 were made pursuant to the stock repurchase authorization approved by the Board of Directors in October 2021. For the three and six months ended June 30, 2026, the Corporation repurchased 2,129,047 and 4,617,195 shares of common stock, respectively, at a total cost of $350.6 million ($164.65 average price per share) and $709.5 million ($153.66 average price per share), respectively, including 4,861 and 456,475 shares withheld to satisfy tax withholding obligations related to share-based compensation, respectively. For the three and six months ended June 30, 2025, the Corporation repurchased 3,374,980 and 5,991,218 shares of common stock, respectively, at a total cost of $339.4 million ($100.57 average price per share) and $626.6 million ($104.59 average price per share), respectively, including 10,622 and 421,754 shares withheld to satisfy tax withholding obligations related to share-based compensation, respectively.
Notes to Consolidated Financial Statements (unaudited) (continued)
Note 11 – Accumulated Other Comprehensive Income (Loss)
The following tables summarize the components of Accumulated Other Comprehensive Income (Loss) (AOCI) at June 30, 2026 and 2025, and changes during the three and six months then ended.
TABLE 56: SUMMARY OF CHANGES IN ACCUMULATED OTHER COMPREHENSIVE INCOME (LOSS)
|
|
|
|
|
|
|
|
|
|
|
|
|
|
|
|
|
|
|
THREE MONTHS ENDED JUNE 30, 2026 |
| (In Millions) |
NET UNREALIZED GAINS (LOSSES) ON AVAILABLE FOR SALE DEBT SECURITIES(1)
|
NET UNREALIZED GAINS (LOSSES) ON CASH FLOW HEDGES |
NET FOREIGN CURRENCY ADJUSTMENTS |
NET PENSION AND OTHER POSTRETIREMENT BENEFIT ADJUSTMENTS |
TOTAL |
| Balance at March 31, 2026 |
$ |
(445.9) |
|
$ |
(4.4) |
|
$ |
250.5 |
|
$ |
(436.8) |
|
$ |
(636.6) |
|
| Net Change |
72.7
|
|
(1.7) |
|
9.0
|
|
4.9
|
|
84.9
|
|
| Balance at June 30, 2026 |
$ |
(373.2) |
|
$ |
(6.1) |
|
$ |
259.5
|
|
$ |
(431.9) |
|
$ |
(551.7) |
|
(1) Includes net unrealized gains (losses) on debt securities transferred from AFS to HTM.
|
|
|
|
|
|
|
|
|
|
|
|
|
|
|
|
|
|
|
SIX MONTHS ENDED JUNE 30, 2026 |
| (In Millions) |
NET UNREALIZED GAINS (LOSSES) ON AVAILABLE FOR SALE DEBT SECURITIES(1)
|
NET UNREALIZED GAINS (LOSSES) ON CASH FLOW HEDGES |
NET FOREIGN CURRENCY ADJUSTMENTS |
NET PENSION AND OTHER POSTRETIREMENT BENEFIT ADJUSTMENTS |
TOTAL |
| Balance at December 31, 2025 |
$ |
(401.3) |
|
$ |
0.9 |
|
$ |
248.9 |
|
$ |
(439.0) |
|
$ |
(590.5) |
|
| Net Change |
28.1
|
|
(7.0) |
|
10.6
|
|
7.1
|
|
38.8
|
|
| Balance at June 30, 2026 |
$ |
(373.2) |
|
$ |
(6.1) |
|
$ |
259.5
|
|
$ |
(431.9) |
|
$ |
(551.7) |
|
(1) Includes net unrealized gains (losses) on debt securities transferred from AFS to HTM.
|
|
|
|
|
|
|
|
|
|
|
|
|
|
|
|
|
|
|
THREE MONTHS ENDED JUNE 30, 2025 |
|
NET UNREALIZED GAINS (LOSSES) ON AVAILABLE FOR SALE DEBT SECURITIES(1)
|
NET UNREALIZED GAINS (LOSSES) ON CASH FLOW HEDGES |
NET FOREIGN CURRENCY ADJUSTMENTS |
NET PENSION AND OTHER POSTRETIREMENT BENEFIT ADJUSTMENTS |
TOTAL |
| Balance at March 31, 2025 |
$ |
(527.1) |
|
$ |
0.1 |
|
$ |
237.8 |
|
$ |
(450.3) |
|
$ |
(739.5) |
|
| Net Change |
45.9 |
|
(0.1) |
|
(7.7) |
|
2.2 |
|
40.3 |
|
| Balance at June 30, 2025 |
$ |
(481.2) |
|
$ |
— |
|
$ |
230.1 |
|
$ |
(448.1) |
|
$ |
(699.2) |
|
(1) Includes net unrealized gains (losses) on debt securities transferred from AFS to HTM.
|
|
|
|
|
|
|
|
|
|
|
|
|
|
|
|
|
|
|
SIX MONTHS ENDED JUNE 30, 2025 |
|
NET UNREALIZED GAINS (LOSSES) ON AVAILABLE FOR SALE DEBT SECURITIES(1) |
NET UNREALIZED GAINS (LOSSES) ON CASH FLOW HEDGES |
NET FOREIGN CURRENCY ADJUSTMENTS |
NET PENSION AND OTHER POSTRETIREMENT BENEFIT ADJUSTMENTS |
TOTAL |
| Balance at December 31, 2024 |
$ |
(598.1) |
|
$ |
0.6 |
|
$ |
233.1 |
|
$ |
(449.6) |
|
$ |
(814.0) |
|
| Net Change |
116.9 |
|
(0.6) |
|
(3.0) |
|
1.5 |
|
114.8 |
|
| Balance at June 30, 2025 |
$ |
(481.2) |
|
$ |
— |
|
$ |
230.1 |
|
$ |
(448.1) |
|
$ |
(699.2) |
|
(1) Includes net unrealized gains (losses) on debt securities transferred from AFS to HTM.
Notes to Consolidated Financial Statements (unaudited) (continued)
TABLE 57: DETAILS OF CHANGES IN ACCUMULATED OTHER COMPREHENSIVE INCOME (LOSS)
|
|
|
|
|
|
|
|
|
|
|
|
|
|
|
|
|
|
|
|
|
| THREE MONTHS ENDED JUNE 30, |
2026 |
2025 |
| (In Millions) |
PRE-TAX |
TAX |
AFTER TAX |
PRE-TAX |
TAX |
AFTER TAX |
| Available for Sale Debt Securities |
|
|
|
|
|
|
| Unrealized Gains (Losses) on Available for Sale Debt Securities |
$ |
5.4
|
|
$ |
(3.3) |
|
$ |
2.1
|
|
$ |
37.9 |
|
$ |
(11.4) |
|
$ |
26.5 |
|
| Reclassification Adjustments for (Gains) Losses Included in Net Income: |
|
|
|
|
|
|
Interest Income on Debt Securities(1)
|
22.7
|
|
(5.7) |
|
17.0
|
|
25.7 |
|
(6.3) |
|
19.4 |
|
Net (Gains) Losses on Debt Securities(2)
|
73.9
|
|
(20.3) |
|
53.6
|
|
— |
|
— |
|
— |
|
| Net Change |
$ |
102.0
|
|
$ |
(29.3) |
|
$ |
72.7
|
|
$ |
63.6 |
|
$ |
(17.7) |
|
$ |
45.9 |
|
| Cash Flow Hedges |
|
|
|
|
|
|
| Unrealized Gains (Losses) on Cash Flow Hedges |
$ |
6.1
|
|
$ |
(2.1) |
|
$ |
4.0
|
|
$ |
3.2 |
|
$ |
(0.7) |
|
$ |
2.5 |
|
Reclassification Adjustment for (Gains) Losses Included in Net Income(3)
|
(8.5) |
|
2.8
|
|
(5.7) |
|
(3.4) |
|
0.8 |
|
(2.6) |
|
| Net Change |
$ |
(2.4) |
|
$ |
0.7
|
|
$ |
(1.7) |
|
$ |
(0.2) |
|
$ |
0.1 |
|
$ |
(0.1) |
|
| Foreign Currency Adjustments |
|
|
|
|
|
|
| Foreign Currency Translation Adjustments |
$ |
(14.6) |
|
$ |
—
|
|
$ |
(14.6) |
|
$ |
206.0 |
|
$ |
(4.3) |
|
$ |
201.7 |
|
| Long-Term Intra-Entity Foreign Currency Transaction Gains (Losses) |
0.5
|
|
—
|
|
0.5
|
|
0.4 |
|
— |
|
0.4 |
|
| Net Investment Hedge Gains (Losses) |
30.7
|
|
(7.6) |
|
23.1
|
|
(278.1) |
|
68.3 |
|
(209.8) |
|
| Net Change |
$ |
16.6
|
|
$ |
(7.6) |
|
$ |
9.0
|
|
$ |
(71.7) |
|
$ |
64.0
|
|
$ |
(7.7) |
|
| Pension and Other Postretirement Benefit Adjustments |
|
|
|
|
|
|
| Net Actuarial Gains (Losses) |
$ |
(0.3) |
|
$ |
0.1
|
|
$ |
(0.2) |
|
$ |
— |
|
$ |
(0.1) |
|
$ |
(0.1) |
|
Reclassification Adjustment for (Gains) Losses Included in Net Income(4)
|
|
|
|
|
|
|
| Amortization of Net Actuarial Loss |
6.4
|
|
(1.5) |
|
4.9
|
|
3.0 |
|
(0.7) |
|
2.3 |
|
| Amortization of Prior Service Cost (Credit) |
0.3
|
|
(0.1) |
|
0.2
|
|
— |
|
— |
|
— |
|
|
|
|
|
|
|
|
| Net Change |
$ |
6.4
|
|
$ |
(1.5) |
|
$ |
4.9
|
|
$ |
3.0
|
|
$ |
(0.8) |
|
$ |
2.2
|
|
| Total Net Change |
$ |
122.6
|
|
$ |
(37.7) |
|
$ |
84.9
|
|
$ |
(5.3) |
|
$ |
45.6 |
|
$ |
40.3 |
|
(1) The pre-tax reclassification adjustment is related to the unrealized gains (losses) amortization on AFS debt securities that were previously transferred to HTM debt securities. Upon transfer of a debt security from the AFS to HTM classification, the amortized cost is reset to fair value. Any net unrealized gain or loss at the date of transfer will remain in AOCI and be amortized into Net Interest Income over the remaining life of the securities using the effective interest method. The amortization of amounts retained in AOCI will offset the effect on interest income of the amortization of the premium or discount resulting from transferring the securities at fair value.
(2) The net gains (losses) on AFS debt securities before-tax reclassification adjustment is recorded in Investment Security Gains (Losses), net on the consolidated statements of income.
(3) See Note 21, "Derivative Financial Instruments" for the location of the reclassification adjustment related to cash flow hedges.
(4) The pension and other postretirement benefit pre-tax reclassification adjustment is recorded in Compensation and Benefits expense on the consolidated statements of income.
Notes to Consolidated Financial Statements (unaudited) (continued)
|
|
|
|
|
|
|
|
|
|
|
|
|
|
|
|
|
|
|
|
|
| SIX MONTHS ENDED JUNE 30, |
2026 |
2025 |
| (In Millions) |
PRE-TAX |
TAX |
AFTER TAX |
PRE-TAX |
TAX |
AFTER TAX |
| Available for Sale Debt Securities |
|
|
|
|
|
|
| Unrealized Gains (Losses) on Available for Sale Debt Securities |
$ |
(80.9) |
|
$ |
19.8
|
|
$ |
(61.1) |
|
$ |
109.1 |
|
$ |
(30.3) |
|
$ |
78.8 |
|
| Reclassification Adjustments for (Gains) Losses Included in Net Income: |
|
|
|
|
|
|
Interest Income on Debt Securities(1)
|
47.2
|
|
(11.6) |
|
35.6
|
|
50.5 |
|
(12.4) |
|
38.1 |
|
Net (Gains) Losses on Debt Securities(2)
|
73.9
|
|
(20.3) |
|
53.6
|
|
— |
|
— |
|
— |
|
| Net Change |
$ |
40.2
|
|
$ |
(12.1) |
|
$ |
28.1
|
|
$ |
159.6 |
|
$ |
(42.7) |
|
$ |
116.9 |
|
| Cash Flow Hedges |
|
|
|
|
|
|
| Unrealized Gains (Losses) on Cash Flow Hedges |
$ |
12.5
|
|
$ |
(4.5) |
|
$ |
8.0
|
|
$ |
13.0 |
|
$ |
(3.1) |
|
$ |
9.9 |
|
Reclassification Adjustment for (Gains) Losses Included in Net Income(3)
|
(21.9) |
|
6.9
|
|
(15.0) |
|
(13.9) |
|
3.4 |
|
(10.5) |
|
| Net Change |
$ |
(9.4) |
|
$ |
2.4
|
|
$ |
(7.0) |
|
$ |
(0.9) |
|
$ |
0.3 |
|
$ |
(0.6) |
|
| Foreign Currency Adjustments |
|
|
|
|
|
|
| Foreign Currency Translation Adjustments |
$ |
(77.2) |
|
$ |
—
|
|
$ |
(77.2) |
|
$ |
297.4 |
|
$ |
(4.9) |
|
$ |
292.5 |
|
| Long-Term Intra-Entity Foreign Currency Transaction Gains (Losses) |
0.9
|
|
—
|
|
0.9
|
|
0.6 |
|
— |
|
0.6 |
|
| Net Investment Hedge Gains (Losses) |
115.3
|
|
(28.4) |
|
86.9
|
|
(392.4) |
|
96.3 |
|
(296.1) |
|
| Net Change |
$ |
39.0
|
|
$ |
(28.4) |
|
$ |
10.6
|
|
$ |
(94.4) |
|
$ |
91.4 |
|
$ |
(3.0) |
|
| Pension and Other Postretirement Benefit Adjustments |
|
|
|
|
|
|
| Net Actuarial Gains (Losses) |
$ |
(5.7) |
|
$ |
2.5
|
|
$ |
(3.2) |
|
$ |
(3.4) |
|
$ |
0.3 |
|
$ |
(3.1) |
|
Reclassification Adjustment for (Gains) Losses Included in Net Income(4)
|
|
|
|
|
|
|
| Amortization of Net Actuarial Loss |
12.8
|
|
(3.1) |
|
9.7
|
|
6.0 |
|
(1.4) |
|
4.6 |
|
| Amortization of Prior Service Cost (Credit) |
0.8
|
|
(0.2) |
|
0.6
|
|
— |
|
— |
|
— |
|
|
|
|
|
|
|
|
| Net Change |
$ |
7.9
|
|
$ |
(0.8) |
|
$ |
7.1
|
|
$ |
2.6 |
|
$ |
(1.1) |
|
$ |
1.5 |
|
| Total Net Change |
$ |
77.7
|
|
$ |
(38.9) |
|
$ |
38.8
|
|
$ |
66.9 |
|
$ |
47.9 |
|
$ |
114.8 |
|
(1) The pre-tax reclassification adjustment is related to the unrealized gains (losses) amortization on AFS debt securities that were previously transferred to HTM debt securities. Upon transfer of a debt security from the AFS to HTM classification, the amortized cost is reset to fair value. Any net unrealized gain or loss at the date of transfer will remain in AOCI and be amortized into Net Interest Income over the remaining life of the securities using the effective interest method. The amortization of amounts retained in AOCI will offset the effect on interest income of the amortization of the premium or discount resulting from transferring the securities at fair value.
(2) The net gains (losses) on AFS debt securities before-tax reclassification adjustment is recorded in Investment Security Gains (Losses), net on the consolidated statements of income.
(3) See Note 21, "Derivative Financial Instruments" for the location of the reclassification adjustment related to cash flow hedges.
(4) The pension and other postretirement benefit pre-tax reclassification adjustment is recorded in Compensation and Benefits expense on the consolidated statements of income.
Note 12 – Net Income Per Common Share
The computations of net income per common share are presented in the following table.
TABLE 58: NET INCOME PER COMMON SHARE
|
|
|
|
|
|
|
|
|
|
|
|
|
|
|
|
THREE MONTHS ENDED JUNE 30, |
SIX MONTHS ENDED JUNE 30, |
| ($ In Millions Except Per Common Share Information) |
2026 |
2025 |
2026 |
2025 |
| Basic Net Income Per Common Share |
|
|
|
|
| Average Number of Common Shares Outstanding |
183,993,670
|
|
192,751,910 |
|
184,742,283
|
|
193,965,606 |
|
| Net Income |
$ |
792.2
|
|
$ |
421.3 |
|
$ |
1,317.8
|
|
$ |
813.3 |
|
| Less: Dividends on Preferred Stock |
4.7
|
|
4.7 |
|
20.9
|
|
20.9 |
|
| Net Income Applicable to Common Stock |
787.5
|
|
416.6 |
|
1,296.9
|
|
792.4 |
|
| Less: Earnings Allocated to Participating Securities |
5.3
|
|
3.8 |
|
9.8
|
|
7.4 |
|
| Earnings Allocated to Common Shares Outstanding |
782.2
|
|
412.8 |
|
1,287.1
|
|
785.0 |
|
| Basic Net Income Per Common Share |
$ |
4.25
|
|
$ |
2.14 |
|
$ |
6.97
|
|
$ |
4.05 |
|
| Diluted Net Income Per Common Share |
|
|
|
|
| Average Number of Common Shares Outstanding |
183,993,670
|
|
192,751,910 |
|
184,742,283
|
|
193,965,606 |
|
| Plus: Dilutive Effect of Share-based Compensation |
896,274
|
|
622,978 |
|
967,502
|
|
776,726 |
|
| Average Common and Potential Common Shares |
184,889,944
|
|
193,374,888 |
|
185,709,785
|
|
194,742,332 |
|
| Earnings Allocated to Common and Potential Common Shares |
$ |
782.3
|
|
$ |
412.8 |
|
$ |
1,287.0
|
|
$ |
785.0 |
|
| Diluted Net Income Per Common Share |
4.23
|
|
2.13 |
|
6.93
|
|
4.03 |
|
Note: For the three and six months ended June 30, 2026 and 2025 there were no common stock equivalents excluded from the computation of diluted net income per common share because their inclusion would have been antidilutive.
Notes to Consolidated Financial Statements (unaudited) (continued)
Note 13 – Revenue from Contracts with Clients
Trust, Investment, and Other Servicing Fees. Custody and Fund Administration income is comprised of revenues received from our core asset servicing business for providing custody, fund administration, and middle-office-related services, primarily to Asset Servicing clients. Investment Management and Advisory income contains revenue received from providing asset management and related services to Asset Servicing and Wealth Management clients and to Northern Trust sponsored funds. Securities Lending income represents revenues generated from securities lending arrangements that Northern Trust enters into as agent, mainly with Asset Servicing clients. Other income largely consists of revenues received from providing employee benefit, investment risk and analytic and other services to Asset Servicing and Wealth Management clients.
Other Noninterest Income. The portion of Security Commissions and Trading Income that relates to revenue from contracts with clients is primarily comprised of commissions earned from providing securities brokerage services to Asset Servicing and Wealth Management clients. The portion of Other Operating Income attributable to revenue from contracts with clients primarily consists of service fees for banking‑related services provided to Wealth Management and Asset Servicing clients. Effective in the first quarter of 2026, treasury management fees—representing revenues from cash and liquidity management services provided to Asset Servicing and Wealth Management clients—were reclassified and included within Other Operating Income.
Performance Obligations. Clients are typically charged monthly or quarterly in arrears based on the fee arrangement agreed to with each client; payment terms will vary depending on the client and services offered.
Substantially all revenues generated from contracts with clients for asset servicing, asset management, securities lending, banking-related services, and treasury management are recognized on an accrual basis, over the period in which services are provided. The nature of Northern Trust’s performance obligations is to provide a series of distinct services in which the client simultaneously receives and consumes the benefits of the promised services as they are performed. Fee arrangements are mainly comprised of variable amounts based on market value of client assets managed and serviced, transaction volumes, number of accounts, and securities lending volume and spreads. Revenue is recognized using the output method in an amount that reflects the consideration to which Northern Trust expects to be entitled in exchange for providing each month or quarter of service. For contracts with multiple performance obligations, revenue is allocated to each performance obligation based on the price agreed to with the client, representing its relative standalone selling price.
Security brokerage revenue is primarily represented by securities commissions received in exchange for providing trade execution related services. Control is transferred at a point in time, on the trade date of the transaction, and fees are typically variable based on transaction volumes and security types.
Northern Trust’s contracts with its clients are typically open-ended arrangements and are therefore considered to have an original duration of less than one year. Northern Trust has elected the practical expedient to not disclose the value of remaining performance obligations for contracts with an original expected duration of one year or less.
The following table presents revenues disaggregated by major revenue source.
TABLE 59: REVENUE DISAGGREGATION
|
|
|
|
|
|
|
|
|
|
|
|
|
|
|
|
THREE MONTHS ENDED JUNE 30, |
SIX MONTHS ENDED JUNE 30, |
| (In Millions) |
2026 |
2025 |
2026 |
2025 |
| Noninterest Income |
|
|
|
|
| Trust, Investment and Other Servicing Fees |
|
|
|
|
| Custody and Fund Administration |
$ |
544.9
|
|
$ |
498.4 |
|
$ |
1,076.5
|
|
$ |
983.5 |
|
| Investment Management and Advisory |
712.3
|
|
649.6 |
|
1,429.7
|
|
1,297.0 |
|
| Securities Lending |
29.6
|
|
20.3 |
|
53.2
|
|
38.2 |
|
| Other |
62.7
|
|
62.8 |
|
131.5
|
|
126.2 |
|
| Total Trust, Investment and Other Servicing Fees |
$ |
1,349.5
|
|
$ |
1,231.1 |
|
$ |
2,690.9
|
|
$ |
2,444.9 |
|
| Other Noninterest Income |
|
|
|
|
| Foreign Exchange Trading Income |
$ |
97.1
|
|
$ |
50.6 |
|
$ |
184.8
|
|
$ |
109.3 |
|
| Security Commissions and Trading Income |
55.6
|
|
39.6 |
|
107.7
|
|
78.7 |
|
Other Operating Income(1)
|
594.2
|
|
66.1 |
|
664.7
|
|
126.4 |
|
| Investment Security Gains (Losses), net |
(73.9) |
|
— |
|
(73.9) |
|
— |
|
| Total Other Noninterest Income |
$ |
673.0
|
|
$ |
156.3 |
|
$ |
883.3
|
|
$ |
314.4 |
|
| Total Noninterest Income |
$ |
2,022.5
|
|
$ |
1,387.4 |
|
$ |
3,574.2
|
|
$ |
2,759.3 |
|
(1) Beginning in Q1 2026, Treasury Management Fees are included within Other Operating Income. The prior period has been revised to conform to the current year presentation.
Notes to Consolidated Financial Statements (unaudited) (continued)
On the consolidated statements of income, Trust, Investment and Other Servicing Fees represents revenue from contracts with clients. For the three months ended June 30, 2026, revenue from contracts with clients also includes $53.1 million of the $55.6 million total Security Commissions and Trading Income and $19.3 million of the $594.2 million total Other Operating Income. For the six months ended June 30, 2026 revenue from contracts with clients also includes $103.6 million of the $107.7 million total Security Commissions and Trading Income and $40.1 million of the $664.7 million total Other Operating Income.
For the three months ended June 30, 2025, revenue from contracts with clients also includes $37.7 million of the $39.6 million total Security Commissions and Trading Income and $20.1 million of the $66.1 million total Other Operating Income. For the six months ended June 30, 2025, revenue from contracts with clients also includes $75.8 million of the $78.7 million total Security Commissions and Trading Income and $40.1 million of the $126.4 million total Other Operating Income.
Receivables Balances. The table below represents receivables balances from contracts with clients, which are included in Other Assets on the consolidated balance sheets, at June 30, 2026 and December 31, 2025.
TABLE 60: CLIENT RECEIVABLES
|
|
|
|
|
|
|
|
|
| (In Millions) |
JUNE 30, 2026 |
DECEMBER 31, 2025 |
Trust Fees Receivable, net(1)
|
$ |
984.1
|
|
$ |
956.7 |
|
| Other |
93.1
|
|
105.6 |
|
| Total Client Receivables |
$ |
1,077.2
|
|
$ |
1,062.3 |
|
(1) Trust Fees Receivable is net of a $6.5 million and $5.0 million fee receivable allowance as of June 30, 2026 and December 31, 2025, respectively.
Note 14 – Net Interest Income
The components of Net Interest Income were as follows.
TABLE 61: NET INTEREST INCOME
|
|
|
|
|
|
|
|
|
|
|
|
|
|
|
|
THREE MONTHS ENDED JUNE 30, |
SIX MONTHS ENDED JUNE 30, |
| (In Millions) |
2026 |
2025 |
2026 |
2025 |
| Interest Income |
|
|
|
|
| Federal Reserve and Other Central Bank Deposits |
$ |
328.8
|
|
$ |
436.4 |
|
$ |
692.3
|
|
$ |
816.4 |
|
Interest-Bearing Due from and Deposits with Banks(1)
|
18.2
|
|
21.8 |
|
37.7
|
|
45.2 |
|
| Federal Funds Sold and Securities Purchased under Agreements to Resell |
783.6
|
|
693.2 |
|
1,610.5
|
|
1,380.0 |
|
| Securities — Taxable |
517.6
|
|
462.2 |
|
1,005.1
|
|
917.2 |
|
— Nontaxable(2)
|
0.2
|
|
0.3 |
|
0.4
|
|
0.6 |
|
| Loans |
517.1
|
|
576.3 |
|
1,029.3
|
|
1,151.2 |
|
Other Interest-Earning Assets(3)
|
23.8
|
|
22.6 |
|
48.1
|
|
43.1 |
|
| Total Interest Income |
$ |
2,189.3
|
|
$ |
2,212.8 |
|
$ |
4,423.4
|
|
$ |
4,353.7 |
|
| Interest Expense |
|
|
|
|
| Deposits |
$ |
565.0
|
|
$ |
722.0 |
|
$ |
1,156.9
|
|
$ |
1,423.9 |
|
| Federal Funds Purchased |
19.6
|
|
24.4 |
|
40.9
|
|
48.0 |
|
| Securities Sold Under Agreements to Repurchase |
769.8
|
|
680.6 |
|
1,574.2
|
|
1,353.8 |
|
| Other Borrowings |
79.9
|
|
80.4 |
|
155.4
|
|
160.1 |
|
| Senior Notes |
41.2
|
|
39.0 |
|
82.3
|
|
77.8 |
|
| Long-Term Debt |
38.3
|
|
55.9 |
|
84.2
|
|
111.5 |
|
| Total Interest Expense |
$ |
1,513.8
|
|
$ |
1,602.3 |
|
$ |
3,093.9
|
|
$ |
3,175.1 |
|
| Net Interest Income |
$ |
675.5
|
|
$ |
610.5 |
|
$ |
1,329.5
|
|
$ |
1,178.6 |
|
(1) Interest-Bearing Due from and Deposits with Banks includes the interest-bearing component of Cash and Due from Banks and Interest-Bearing Deposits with Banks as presented on the consolidated balance sheets.
(2) Non-taxable Securities represent securities that are exempt from U.S. federal income taxes.
(3) Other Interest-Earning Assets include certain community development investments, collateral deposits with certain securities depositories and clearing houses, Federal Home Loan Bank and Federal Reserve stock, and money market investments which are classified in Other Assets on the consolidated balance sheets.
Notes to Consolidated Financial Statements (unaudited) (continued)
Note 15 – Other Operating Income
The components of Other Operating Income were as follows.
TABLE 62: OTHER OPERATING INCOME
|
|
|
|
|
|
|
|
|
|
|
|
|
|
|
|
THREE MONTHS ENDED JUNE 30, |
SIX MONTHS ENDED JUNE 30, |
| (In Millions) |
2026 |
2025 |
2026 |
2025 |
| Loan Service Fees |
$ |
11.8
|
|
$ |
12.5 |
|
$ |
23.8
|
|
$ |
26.2 |
|
| Banking Service Fees |
13.1
|
|
14.1 |
|
26.4
|
|
28.4 |
|
| Bank Owned Life Insurance |
20.1
|
|
19.6 |
|
39.6
|
|
38.9 |
|
Treasury Management Fees(1)
|
9.1
|
|
9.7 |
|
19.4
|
|
19.3 |
|
Other Income(2)
|
540.1
|
|
10.2 |
|
555.4
|
|
13.6 |
|
| Total Other Operating Income |
$ |
594.2
|
|
$ |
66.1 |
|
$ |
664.7
|
|
$ |
126.4 |
|
(1) Beginning in Q1 2026, Treasury Management Fees are included within Other Operating Income. The prior period has been revised to conform to the current year presentation.
(2) Other Income includes the mark-to-market loss on derivative swap activity related to previous sales of certain Visa Class B common shares and gains related to Northern Trust’s participation in the Visa Exchange Offer program, including a $525.4 million gain for the three and six months ended June 30, 2026 related to Northern Trust’s participation in the second Visa Exchange Offer. Refer to Note 20—Commitments and Contingent Liabilities for further information.
Note 16 – Other Operating Expense
The components of Other Operating Expense were as follows.
TABLE 63: OTHER OPERATING EXPENSE
|
|
|
|
|
|
|
|
|
|
|
|
|
|
|
|
THREE MONTHS ENDED JUNE 30, |
SIX MONTHS ENDED JUNE 30, |
| In Millions) |
2026 |
2025 |
2026 |
2025 |
| Business Promotion |
$ |
19.1
|
|
$ |
22.2 |
|
$ |
37.0
|
|
$ |
39.1 |
|
| Staff Related |
12.3
|
|
7.0 |
|
22.1
|
|
11.2 |
|
| FDIC Insurance Premiums |
7.4
|
|
9.5 |
|
15.2
|
|
17.4 |
|
| Other Expenses |
53.5
|
|
52.2 |
|
107.8
|
|
107.2 |
|
| Total Other Operating Expense |
$ |
92.3
|
|
$ |
90.9 |
|
$ |
182.0
|
|
$ |
174.9 |
|
Notes to Consolidated Financial Statements (unaudited) (continued)
Note 17 – Pension
The following table sets forth the net periodic pension expense for Northern Trust’s U.S. Qualified Plan, U.S. Non-Qualified Plan, and the Non-U.S. Pension Plans for the three and six months ended June 30, 2026 and 2025.
TABLE 64: NET PERIODIC PENSION EXPENSE (BENEFIT)
|
|
|
|
|
|
|
|
|
|
|
|
|
|
|
| U.S. QUALIFIED PLAN |
THREE MONTHS ENDED JUNE 30, |
SIX MONTHS ENDED JUNE 30, |
| (In Millions) |
2026 |
2025 |
2026 |
2025 |
| Service Cost |
$ |
14.6
|
|
$ |
13.7 |
|
$ |
29.2
|
|
$ |
27.4 |
|
| Interest Cost |
15.8
|
|
15.5 |
|
31.6
|
|
31.0 |
|
| Expected Return on Plan Assets |
(29.3) |
|
(30.6) |
|
(58.6) |
|
(61.2) |
|
| Amortization |
|
|
|
|
| Net Actuarial Loss |
5.0
|
|
1.9 |
|
10.0
|
|
3.8 |
|
| Net Periodic Pension Expense |
$ |
6.1
|
|
$ |
0.5 |
|
$ |
12.2
|
|
$ |
1.0 |
|
|
|
|
|
|
|
|
|
|
|
|
|
|
|
|
|
|
|
|
|
|
|
|
|
|
| U.S. NON-QUALIFIED PLAN |
THREE MONTHS ENDED JUNE 30, |
SIX MONTHS ENDED JUNE 30, |
| (In Millions) |
2026 |
2025 |
2026 |
2025 |
| Service Cost |
$ |
1.2
|
|
$ |
1.2 |
|
$ |
2.4
|
|
$ |
2.4 |
|
| Interest Cost |
1.3
|
|
1.3 |
|
2.6
|
|
2.6 |
|
| Amortization |
|
|
|
|
| Net Actuarial Loss |
1.1
|
|
1.1 |
|
2.2
|
|
2.2 |
|
| Net Periodic Pension Expense |
$ |
3.6
|
|
$ |
3.6 |
|
$ |
7.2
|
|
$ |
7.2 |
|
|
|
|
|
|
|
|
|
|
|
|
|
|
|
|
| NON-U.S. PENSION PLANS |
THREE MONTHS ENDED JUNE 30, |
SIX MONTHS ENDED JUNE 30, |
| (In Millions) |
2026 |
2025 |
2026 |
2025 |
| Service Cost |
$ |
1.3
|
|
$ |
1.1 |
|
$ |
2.8
|
|
$ |
2.1 |
|
| Interest Cost |
1.6
|
|
1.4 |
|
3.2
|
|
2.7 |
|
| Expected Return on Plan Assets |
(2.0) |
|
(1.9) |
|
(4.1) |
|
(3.7) |
|
| Amortization |
|
|
|
|
| Net Actuarial Loss |
0.3
|
|
0.2 |
|
0.6
|
|
0.3 |
|
| Prior Service Cost |
0.3
|
|
— |
|
$ |
0.8
|
|
$ |
— |
|
| Net Periodic Pension Expense |
$ |
1.5
|
|
$ |
0.8 |
|
$ |
3.3
|
|
$ |
1.4 |
|
|
|
|
|
|
|
|
|
|
|
Note: As of January 1, 2026, certain Gratuity plans for Northern Trust's locations in India have been included in the non‑U.S. pension plan disclosures due to their increased significance. Prior period amounts have been revised to conform to the current year presentation.
The components of net periodic pension expense are recorded in Compensation and Benefits expense on the consolidated statements of income.
There were no contributions to the U.S. Qualified Plan during the six months ended June 30, 2026. There were $125.0 million of contributions to the U.S. Qualified Plan during the six months ended June 30, 2025. There were $7.2 million and $12.9 million of contributions to the U.S. Non-Qualified Plan during the six months ended June 30, 2026 and 2025, respectively.
Note 18 – Share-Based Compensation Plans
The Northern Trust Corporation 2017 Long-Term Incentive Plan provides for the grant of non-qualified and incentive stock options; tandem and free-standing stock appreciation rights; stock awards in the form of restricted stock, restricted stock units and other stock awards; and performance awards.
Restricted stock unit and performance stock unit grants continue to vest in accordance with the original terms of the award if the applicable employee retires after satisfying applicable age and service requirements.
On June 30, 2026, the Corporation granted 189,720 restricted stock unit awards with a grant-date fair value of $33.1 million, which were expensed in their entirety on the date of grant as there was no requisite service period.
Notes to Consolidated Financial Statements (unaudited) (continued)
Total compensation expense for share-based payment arrangements and the associated tax impacts were as follows for the three and six months ended June 30, 2026 and 2025.
TABLE 65: TOTAL COMPENSATION EXPENSE FOR SHARE-BASED PAYMENT ARRANGEMENTS
|
|
|
|
|
|
|
|
|
|
|
|
|
|
|
|
THREE MONTHS ENDED JUNE 30, |
SIX MONTHS ENDED JUNE 30, |
| (In Millions) |
2026 |
2025 |
2026 |
2025 |
| Restricted Stock Unit Awards |
$ |
49.7
|
|
$ |
16.3 |
|
$ |
107.3
|
|
$ |
73.8 |
|
| Performance Stock Units |
3.1
|
|
1.9 |
|
19.8
|
|
16.3 |
|
| Total Share-Based Compensation Expense |
52.8
|
|
18.2 |
|
127.1
|
|
90.1 |
|
| Tax Benefits Recognized |
$ |
12.9
|
|
$ |
4.5 |
|
$ |
31.1
|
|
$ |
22.1 |
|
Note 19 – Variable Interest Entities
Northern Trust is involved with various entities in the normal course of business that are deemed to be variable interest entities (VIEs). VIEs are defined within GAAP as entities which either (1) lack sufficient equity at risk to permit the entity to finance its activities without additional subordinated financial support, (2) have equity investors that lack attributes typical of an equity investor, such as the ability to make significant decisions through voting rights affecting the entity’s operations, or the obligation to absorb expected losses or the right to receive residual returns of the entity, or (3) are structured with voting rights that are disproportionate to the equity investor’s obligation to absorb losses or right to receive returns, and substantially all of the activities are conducted on behalf of the holder of the equity investment at risk with disproportionately few voting rights. Investors that finance a VIE through debt or equity interests are variable interest holders in the entity and the variable interest holder, if any, that has both the power to direct the activities that most significantly impact the entity’s economic performance and, through its variable interest, the obligation to absorb losses or the right to receive returns that could potentially be significant to the entity is deemed to be the VIE’s primary beneficiary and is required to consolidate the VIE.
Community Reinvestment Act (CRA) Investments. Northern Trust fulfills its obligations under the CRA by making a variety of qualified investments for purposes of supporting institutions and programs that benefit low-to-moderate income communities within Northern Trust’s market area. These investments are made in legal entities that are primarily VIEs and consist of equity in limited partnerships and beneficial interests in securitized debt. Based on its analysis, Northern Trust has determined that it is not the primary beneficiary of these VIEs under GAAP and therefore they are not consolidated.
Northern Trust’s investments in these unconsolidated entities are reported in Other Assets or HTM Debt Securities, depending on the structure of the investment.
Tax credit structures. Northern Trust holds tax-advantaged investments in unconsolidated entities that own and operate affordable housing and projects through the new markets tax credit program. These entities, which are limited partnerships and similar entities, are designed to generate a return primarily through the realization of tax credits and other tax benefits, such as tax deductions from operating losses of the investments. Northern Trust invests as a limited partner/investor member and lacks both the power to direct the entities’ most significant activities and the obligation to absorb losses or right to receive benefits that could potentially be significant to the entities. Northern Trust is not required to consolidate these entities as it does not have a controlling financial interest and thus is not the primary beneficiary.
Northern Trust’s maximum exposure to loss as a result of its involvement with tax credit structures and other CRA investments is limited to the carrying amounts of its investments, including any undrawn commitments. Northern Trust’s funding requirements are limited to its invested capital and undrawn commitments for future equity contributions. Northern Trust has no exposure to loss from liquidity arrangements and no obligation to purchase assets of these entities.
Northern Trust’s investments in these unconsolidated tax credit structures and related unfunded commitments are primarily VIEs and are reported in Other Assets and Other Liabilities, respectively, on the consolidated balance sheets.
Notes to Consolidated Financial Statements (unaudited) (continued)
TABLE 66: SUMMARY OF UNCONSOLIDATED TAX CREDIT STRUCTURES
|
|
|
|
|
|
|
|
|
| (In Millions) |
JUNE 30, 2026 |
DECEMBER 31, 2025 |
| Investment Carrying Amount |
|
|
| Affordable Housing |
$ |
786.9
|
|
$ |
834.0 |
|
| New Markets |
186.1
|
|
192.9 |
|
| Total Investment Carrying Amount |
$ |
973.0
|
|
$ |
1,026.9 |
|
|
|
|
Unfunded Commitments(1)
|
|
|
| Affordable Housing |
$ |
323.6
|
|
$ |
373.0 |
|
| Total Unfunded Commitments |
$ |
323.6
|
|
$ |
373.0 |
|
(1) As of June 30, 2026 and December 31, 2025, there were no unfunded commitments for New Markets.
Northern Trust accounts for qualifying tax credit structures under the proportional amortization method. Under the proportional amortization method, the carrying amount of the investment is amortized in proportion to the income tax credits and other income tax benefits received in the current period as compared to the total income tax credits and income tax benefits expected to be received over the life of the investment. Income tax credits and other income tax benefits and amortization expense associated with unconsolidated tax credit structures are reported in the Provision for Income Taxes on the consolidated statements of income.
TABLE 67: INCOME TAX CREDITS AND OTHER TAX BENEFITS AND AMORTIZATION EXPENSE ASSOCIATED WITH TAX CREDIT STRUCTURES
|
|
|
|
|
|
|
|
|
|
|
|
|
|
|
|
THREE MONTHS ENDED JUNE 30, |
SIX MONTHS ENDED JUNE 30, |
| (In Millions) |
2026 |
2025 |
2026 |
2025 |
| Income Tax Credits and Other Income Tax Benefits |
|
|
|
|
| Affordable Housing |
$ |
27.7
|
|
$ |
24.0 |
|
$ |
55.4
|
|
$ |
48.0 |
|
| New Markets |
3.7
|
|
3.9 |
|
7.4
|
|
7.5 |
|
| Total Income Tax Credits and Other Income Tax Benefits |
$ |
31.4
|
|
$ |
27.9 |
|
$ |
62.8
|
|
$ |
55.5 |
|
|
|
|
|
|
| Amortization Expense |
|
|
|
|
| Affordable Housing |
$ |
23.6
|
|
$ |
22.2 |
|
$ |
47.1
|
|
$ |
43.8 |
|
| New Markets |
3.4
|
|
3.6 |
|
6.8
|
|
7.1 |
|
| Total Amortization Expense |
$ |
27.0
|
|
$ |
25.8 |
|
$ |
53.9
|
|
$ |
50.9 |
|
Investment funds. Northern Trust acts as an asset manager for various funds in which clients of Northern Trust are investors. As an asset manager of funds, Northern Trust earns a competitively priced fee that is based on assets managed and varies with each fund’s investment objective. Based on its analysis, Northern Trust has determined that it is not the primary beneficiary of these VIEs under GAAP and therefore, the funds are not consolidated. Northern Trust’s maximum exposure to loss is limited to the carrying amount of its investments, including any undrawn commitments.
Certain funds for which Northern Trust acts as an asset manager comply or operate in accordance with requirements that are similar to those in Rule 2a-7 of the Investment Company Act of 1940 for registered money market funds and, therefore, the funds are exempt from the consolidation requirements in ASC 810-10. Northern Trust does not have any contractual obligations to provide financial support to the funds. Any potential future support of the funds will be at the discretion of Northern Trust after an evaluation of the specific facts and circumstances.
Periodically, Northern Trust makes seed capital investments to certain funds which are VIEs. As of June 30, 2026, Northern Trust had $80.2 million of investments valued using net asset value per share and had no unfunded commitments related to seed capital investments. As of December 31, 2025, Northern Trust had $122.9 million seed capital investments valued using net asset value per share and $19.6 million unfunded commitments related to seed capital investments.
Note 20 – Commitments and Contingent Liabilities
Off-Balance Sheet Financial Instruments, Guarantees and Other Commitments. Northern Trust, in the normal course of business, enters into various types of commitments and issues letters of credit to meet the liquidity and credit enhancement needs of its clients. The contractual amounts of these instruments represent the maximum potential credit exposure should the instrument be fully drawn upon and the client default. To control the credit risk associated with entering into commitments and issuing letters of credit, Northern Trust subjects such activities to the same credit quality and monitoring controls as its lending activities. Northern Trust does not believe the total contractual amount of these instruments to be representative of its future credit exposure or funding requirements.
Notes to Consolidated Financial Statements (unaudited) (continued)
The following table provides details of Northern Trust's off-balance sheet financial instruments as of June 30, 2026 and December 31, 2025.
TABLE 68: SUMMARY OF OFF-BALANCE SHEET FINANCIAL INSTRUMENTS
|
|
|
|
|
|
|
|
|
|
|
|
|
|
|
|
|
|
|
|
|
|
JUNE 30, 2026 |
DECEMBER 31, 2025 |
| (In Millions) |
ONE YEAR AND LESS |
OVER ONE YEAR |
TOTAL |
ONE YEAR AND LESS |
OVER ONE YEAR |
TOTAL |
Undrawn Commitments(1)
|
$ |
11,198.7
|
|
$ |
17,346.5
|
|
$ |
28,545.2
|
|
$ |
10,959.6 |
|
$ |
18,154.7 |
|
$ |
29,114.3 |
|
Standby Letters of Credit and Financial Guarantees(2)(3)
|
135,166.7
|
|
715.1
|
|
135,881.8
|
|
148,883.9 |
|
671.0 |
|
149,554.9 |
|
| Commercial Letters of Credit |
28.4
|
|
—
|
|
28.4
|
|
18.1 |
|
0.1 |
|
18.2 |
|
| Securities Lent with Indemnification |
194,000.1
|
|
—
|
|
194,000.1
|
|
170,738.8 |
|
— |
|
170,738.8 |
|
|
|
|
|
|
|
|
| Total Off-Balance Sheet Financial Instruments |
$ |
340,393.9
|
|
$ |
18,061.6
|
|
$ |
358,455.5
|
|
$ |
330,600.4 |
|
$ |
18,825.8 |
|
$ |
349,426.2 |
|
(1) These amounts exclude $142.1 million and $175.1 million of commitments participated to others at June 30, 2026 and December 31, 2025, respectively.
(2) These amounts include $67.7 million and $68.1 million of standby letters of credit secured by cash deposits or participated to others as of June 30, 2026 and December 31, 2025, respectively.
(3) These amounts include a $134.2 billion and $147.8 billion guarantee to the FICC under the sponsored member program, without taking into consideration the related collateral, as of June 30, 2026 and December 31, 2025, respectively.
Undrawn Commitments generally have fixed expiration dates or other termination clauses. Since a significant portion of the commitments are expected to expire without being drawn upon, the total commitment amount does not necessarily represent future loans or liquidity requirements.
Standby Letters of Credit obligate Northern Trust to meet certain financial obligations of its clients, if, under the contractual terms of the agreement, the clients are unable to do so. These instruments are primarily issued to support public and private financial commitments, including commercial paper, bond financing, initial margin requirements on futures exchanges and similar transactions. Northern Trust is obligated to meet the entire financial obligation of these agreements and in certain cases is able to recover the amounts paid through recourse against collateral received or other participants. Since the vast majority of the standby letters of credit are never drawn, the total standby letters of credit amount does not necessarily represent future loans or liquidity requirements.
Financial Guarantees are issued by Northern Trust to guarantee the performance of a client to a third party under certain arrangements.
Commercial Letters of Credit are instruments issued by Northern Trust on behalf of its clients that authorize a third party (the beneficiary) to draw drafts up to a stipulated amount under the specified terms and conditions of the agreement and other similar instruments. Commercial letters of credit are issued primarily to facilitate international trade.
Securities Lent with Indemnification involves Northern Trust acting as an agent in lending securities on behalf of its clients to borrowers who are reviewed and approved by the Northern Trust Capital Markets Credit Committee. In connection with these activities, Northern Trust has issued indemnifications to certain clients against losses that are a direct result of a borrower’s failure to return securities when due, should the value of such securities exceed the value of the collateral posted. Borrowers are required to fully collateralize securities which are valued on a daily basis and subject to daily collateral calls to maintain the required levels of over-collateralization. The amount of securities loaned subject to indemnification as of June 30, 2026 and December 31, 2025 was $194.0 billion and $170.7 billion, respectively. Because of the credit quality of the borrowers and the requirement to fully collateralize securities borrowed, management believes that the exposure to credit loss from this activity is not significant, and no liability was recorded as of June 30, 2026 or December 31, 2025, related to these indemnifications.
Unsettled Repurchase and Reverse Repurchase Agreements. Northern Trust enters into repurchase agreements and reverse repurchase agreements which may settle at a future date. In repurchase agreements, Northern Trust receives cash from and provides securities as collateral to a counterparty. In reverse repurchase agreements, Northern Trust advances cash to and receives securities as collateral from a counterparty. These transactions are recorded on the consolidated balance sheets on the settlement date. As of June 30, 2026 and December 31, 2025, there were no unsettled repurchase agreements.
Sponsored Member Program. Northern Trust is an approved Government Securities Division (GSD) netting and sponsoring member in the FICC sponsored member program, through which Northern Trust submits eligible repurchase and reverse repurchase transactions in U.S. government securities between Northern Trust and its sponsored member clients for novation and clearing. Northern Trust may sponsor clients to clear their eligible repurchase transactions with the FICC. As a sponsoring member, Northern Trust guarantees to the FICC the prompt and full payment and performance of its sponsored member clients’ respective obligations under the FICC GSD’s rules. To mitigate Northern Trust’s credit exposure under this guarantee, Northern Trust obtains a security interest in its sponsored member clients’ collateral. See Note 23—Offsetting of Assets and Liabilities for additional information on Northern Trust’s repurchase and reverse repurchase agreements.
Notes to Consolidated Financial Statements (unaudited) (continued)
Clearing and Settlement Organizations. The Bank is a participating member of various cash, securities and foreign exchange clearing and settlement organizations. It participates in these organizations on behalf of its clients and on its own behalf as a result of its own activities. A wide variety of cash and securities transactions are settled through these organizations, including those involving U.S. Treasuries, obligations of states and political subdivisions, asset-backed securities, commercial paper, dollar placements, and securities issued by the Government National Mortgage Association.
Certain of these industry clearing and settlement exchanges require their members to guarantee their obligations and liabilities and/or to provide liquidity support in the event other members do not honor their obligations as stipulated in each clearing organization’s membership agreement. Exposure related to these agreements varies, primarily as a result of fluctuations in the volume of transactions cleared through the organizations. As of June 30, 2026 and December 31, 2025, Northern Trust has not recorded any material liabilities under these arrangements as Northern Trust believes the likelihood that a clearing or settlement exchange (of which Northern Trust is a member) would become insolvent is remote. Controls related to these clearing transactions are closely monitored by management to protect the assets of Northern Trust and its clients.
Legal Proceedings. In the normal course of business, the Corporation and its subsidiaries are routinely defendants in or parties to pending and threatened legal actions, and are subject to regulatory examinations, information-gathering requests, investigations, and proceedings, both formal and informal. In certain legal actions, claims for substantial monetary damages are asserted. In regulatory matters, claims for disgorgement, restitution, penalties and/or other remedial actions or sanctions may be sought.
Based on current knowledge, after consultation with legal counsel and after taking into account current accruals, management does not believe that losses, fines or penalties, if any, arising from pending litigation or threatened legal actions or regulatory matters either individually or in the aggregate, after giving effect to applicable reserves and insurance coverage will have a material adverse effect on the consolidated financial position or liquidity of the Corporation, although such matters could have a material adverse effect on the Corporation’s operating results for a particular period.
Under GAAP, (i) an event is “probable” if the “future event or events are likely to occur”; (ii) an event is “reasonably possible” if “the chance of the future event or events occurring is more than remote but less than likely”; and (iii) an event is “remote” if “the chance of the future event or events occurring is slight.”
The outcome of litigation and regulatory matters is inherently difficult to predict and/or the range of loss often cannot be reasonably estimated, particularly for matters that (i) will be decided by a jury, (ii) are in early stages, (iii) involve uncertainty as to the likelihood of a class being certified or the ultimate size of the class, (iv) are subject to appeals or motions, (v) involve significant factual issues to be resolved, including with respect to the amount of damages, (vi) do not specify the amount of damages sought or (vii) seek very large damages based on novel and complex damage and liability legal theories. Accordingly, the Corporation cannot reasonably estimate the eventual outcome of these pending matters, the timing of their ultimate resolution or what the eventual loss, fines or penalties, if any, related to each pending matter will be.
In accordance with applicable accounting guidance, the Corporation records accruals for litigation and regulatory matters when those matters present loss contingencies that are both probable and reasonably estimable. When loss contingencies are not both probable and reasonably estimable, the Corporation does not record accruals. No material accruals have been recorded for pending litigation or threatened legal actions or regulatory matters.
For a limited number of matters for which a loss is reasonably possible in future periods, whether in excess of an accrued liability or where there is no accrued liability, the Corporation is able to estimate a range of possible loss. As of June 30, 2026, the Corporation has estimated the range of reasonably possible loss for these matters to be from zero to approximately $10 million in the aggregate. The Corporation’s estimate with respect to the aggregate range of reasonably possible loss is based upon currently available information and is subject to significant judgment and a variety of assumptions and known and unknown uncertainties. The matters underlying the estimated range will change from time to time, and actual results may vary significantly from the current estimate.
In certain other pending matters, there may be a range of reasonably possible loss (including reasonably possible loss in excess of amounts accrued) that cannot be reasonably estimated for the reasons described above. Such matters are not included in the estimated range of reasonably possible loss discussed above.
Notes to Consolidated Financial Statements (unaudited) (continued)
In 2015, Northern Trust Fiduciary Services (Guernsey) Limited (NTFS), an indirect subsidiary of the Corporation, was charged by a French investigating magistrate judge with complicity in estate tax fraud in connection with the administration of two trusts for which it serves as trustee. Charges also were brought against a number of other persons and entities related to this matter. NTFS provided no tax advice and was not involved in the preparation or filing of the challenged estate tax filings in this case. In 2017, a French court found no estate tax fraud had occurred and NTFS and all other persons and entities charged were acquitted. The Public Prosecutor’s Office of France appealed the court decision and in June 2018 a French appellate court issued its opinion on the matter, acquitting all persons and entities charged, including NTFS. In January 2021, the Cour de Cassation, the highest court in France, reversed the June 2018 appellate court ruling, requiring a re-trial at the appellate court level. This re-trial concluded in October 2023. On March 5, 2024 the appellate court rendered a judgment against all defendants, including NTFS. NTFS was ordered to pay a fine of €187,500 in conjunction with the judgment. In addition, the court ordered that certain of those convicted in relation to tax fraud or aiding and abetting tax fraud, including NTFS, are jointly and severally liable for any allegedly unpaid estate taxes owing, plus penalties and interest. NTFS filed an appeal of the judgment on March 5, 2024. On February 4, 2026, the Cour de Cassation affirmed the appellate court’s judgment against all of the defendants, including NTFS. The determination of the parties’ joint and several liability for the unpaid estate taxes owing, plus penalties and interest, is dependent on a final decision in a separate proceeding still pending before the tax courts.
Visa Class B Common Shares and Makewhole Agreement. Northern Trust, as a member of Visa U.S.A. Inc. (Visa U.S.A.) and in connection with the 2007 restructuring of Visa U.S.A. and its affiliates and the 2008 initial public offering of Visa Inc. (Visa), received certain Visa Class B common shares. The Visa Class B common shares are subject to certain transfer restrictions until the final resolution of certain litigation related to interchange fees involving Visa (the covered litigation), at which time the shares are convertible into Visa Class A common shares based on a conversion rate dependent upon the ultimate cost of resolving the covered litigation. Since 2018, Visa has deposited an additional $6.0 billion into an escrow account previously established with respect to the covered litigation. As a result of the additional contributions to the escrow account, the rate at which Visa Class B-3 common shares will convert into Visa Class A common shares was reduced to 1.4953 as of June 30, 2026.
In September 2018, Visa reached a proposed class settlement agreement covering damage claims but not injunctive relief claims regarding the covered litigation. In December 2019, the district court granted final approval for the proposed class settlement agreement. In March 2023, the Second Circuit Court of Appeals affirmed the district court’s approval of the class settlement agreement. Certain merchants have opted out of the class settlement and are pursuing claims separately. The ultimate resolution of the covered litigation, the timing for removal of the selling restrictions on the Visa Class B common shares and the rate at which such shares will ultimately convert into Visa Class A common shares are uncertain.
In May 2024, Northern Trust participated in an offer to exchange outstanding shares of Visa’s Class B common stock for a newly issued series of Visa Class B-2 common shares and Visa Class C common shares (Exchange Offer).
In May 2026, Northern Trust participated in a second Exchange Offer and tendered all of its Visa Class B-2 common shares in exchange for 50% in the form of a newly issued series of Visa Class B-3 common shares and 50% in the form of Visa Class C common shares.
All outstanding Visa Class B common share series have the same transfer and convertibility restrictions as those Visa Class B common shares outstanding prior to the Exchange Offers.
Participation in the Exchange Offers required Northern Trust to enter into Makewhole Agreements whereby Northern Trust is subject to the same Visa indemnity obligations as prior to its participation in the Exchange Offers. At June 30, 2026, Northern Trust has not recorded a liability under these agreements as Northern Trust believes the likelihood that a payment under the Makewhole Agreements will have to be made is remote.
Northern Trust holds the Visa Class B-3 common shares received in the second Exchange Offer at their carryover basis of zero as of June 30, 2026. Based upon the June 30, 2026 closing price of $343.09 for a Visa Class A common share, the estimated value of Northern Trust’s Visa Class B-3 common shares was approximately $529.7 million at the current conversion rate of Visa Class B-3 to Visa Class A common shares. The estimated value does not represent fair value given the shares’ limited transferability.
Northern Trust sold 129.7 thousand Visa Class C shares in the three months ended June 30, 2026, and recorded a realized gain of $169.3 million on the sales through Other Operating Income. As of June 30, 2026, Northern Trust continues to hold 270.1 thousand Visa Class C common shares which are recorded at their fair value of $370.7 million in Other Assets on the consolidated balance sheets with changes in fair value recorded in Other Operating Income on the consolidated statement of income.
Notes to Consolidated Financial Statements (unaudited) (continued)
Note 21 – Derivative Financial Instruments
Northern Trust is a party to various derivative financial instruments that are used in the normal course of business to meet the needs of its clients, as part of its trading activity for its own account and as part of its risk management activities. These instruments may include foreign exchange contracts, interest rate contracts, total return swap contracts, and swaps related to the sales of certain Visa Class B common shares.
Foreign exchange contracts are agreements to exchange specific amounts of currencies at a future date, at a specified rate of exchange. Foreign exchange contracts are entered into primarily to meet the foreign exchange needs of clients. Foreign exchange contracts are also used for trading and risk management purposes. For risk management purposes, Northern Trust uses foreign exchange contracts to reduce its exposure to changes in foreign exchange rates relating to certain forecasted non-functional-currency-denominated revenue and expenditure transactions and foreign-currency-denominated assets and liabilities, including debt securities and net investments in non-U.S. affiliates.
Interest rate contracts include swap and option contracts. Interest rate swap contracts involve the exchange of fixed and floating rate interest payment obligations without the exchange of the underlying principal amounts. Northern Trust enters into interest rate swap contracts with its clients and also may utilize such contracts to reduce or eliminate the exposure to changes in the cash flows or fair value of hedged assets or liabilities due to changes in interest rates. Interest rate option contracts may include caps, floors, collars and swaptions, and provide for the transfer or reduction of interest rate risk, typically in exchange for a fee. Northern Trust enters into option contracts primarily as a seller of interest rate protection to clients. Northern Trust receives a fee at the outset of the agreement for the assumption of the risk of an unfavorable change in interest rates. This assumed interest rate risk is then mitigated by entering into an offsetting position with an outside counterparty. Northern Trust may also purchase or enter into option contracts for risk management purposes including to reduce the exposure to changes in the cash flows of hedged assets due to changes in interest rates.
Notes to Consolidated Financial Statements (unaudited) (continued)
The following table shows the notional and fair values of all derivative financial instruments as of June 30, 2026 and December 31, 2025.
TABLE 69: NOTIONAL AND FAIR VALUES OF DERIVATIVE FINANCIAL INSTRUMENTS
|
|
|
|
|
|
|
|
|
|
|
|
|
|
|
|
|
|
|
|
|
|
JUNE 30, 2026 |
DECEMBER 31, 2025 |
|
NOTIONAL VALUE |
FAIR VALUE |
NOTIONAL VALUE |
FAIR VALUE |
| (In Millions) |
ASSET(1)
|
LIABILITY(2)
|
ASSET(1)
|
LIABILITY(2)
|
| Derivatives Designated as Hedging under GAAP |
|
|
|
|
|
|
| Interest Rate Contracts |
|
|
|
|
|
|
| Fair Value Hedges |
$ |
10,316.6
|
|
$ |
—
|
|
$ |
—
|
|
$ |
10,897.4 |
|
$ |
16.5 |
|
$ |
— |
|
| Cash Flow Hedges |
20,000.0
|
|
1.6
|
|
0.1
|
|
— |
|
— |
|
— |
|
| Foreign Exchange Contracts |
|
|
|
|
|
|
| Cash Flow Hedges |
399.9
|
|
16.8
|
|
—
|
|
1,312.0 |
|
29.6 |
|
— |
|
| Net Investment Hedges |
5,038.8
|
|
109.8
|
|
11.3
|
|
4,734.5 |
|
8.7 |
|
351.8 |
|
| Total Derivatives Designated as Hedging under GAAP |
$ |
35,755.3
|
|
$ |
128.2
|
|
$ |
11.4
|
|
$ |
16,943.9 |
|
$ |
54.8 |
|
$ |
351.8 |
|
| Derivatives Not Designated as Hedging under GAAP |
|
|
|
|
|
|
| Non-Designated Risk Management Derivatives |
|
|
|
|
|
|
Foreign Exchange Contracts |
$ |
1.5
|
|
$ |
—
|
|
$ |
—
|
|
$ |
1.6 |
|
$ |
— |
|
$ |
— |
|
Other Financial Derivatives(3)
|
366.7
|
|
0.3
|
|
23.1
|
|
606.6 |
|
0.7 |
|
31.3 |
|
| Total Non-Designated Risk Management Derivatives |
$ |
368.2
|
|
$ |
0.3
|
|
$ |
23.1
|
|
$ |
608.2 |
|
$ |
0.7 |
|
$ |
31.3 |
|
| Client-Related and Trading Derivatives |
|
|
|
|
|
|
Foreign Exchange Contracts |
$ |
489,167.1
|
|
$ |
3,168.0
|
|
$ |
3,148.1
|
|
$ |
392,874.0 |
|
$ |
1,950.5 |
|
$ |
1,896.1 |
|
Interest Rate Contracts |
9,253.1
|
|
78.6
|
|
138.7
|
|
11,132.1 |
|
88.3 |
|
130.4 |
|
| Total Client-Related and Trading Derivatives |
$ |
498,420.2
|
|
$ |
3,246.6
|
|
$ |
3,286.8
|
|
$ |
404,006.1 |
|
$ |
2,038.8 |
|
$ |
2,026.5 |
|
| Total Derivatives Not Designated as Hedging under GAAP |
$ |
498,788.4
|
|
$ |
3,246.9
|
|
$ |
3,309.9
|
|
$ |
404,614.3 |
|
$ |
2,039.5 |
|
$ |
2,057.8 |
|
| Total Gross Derivatives |
$ |
534,543.7
|
|
$ |
3,375.1
|
|
$ |
3,321.3
|
|
$ |
421,558.2 |
|
$ |
2,094.3 |
|
$ |
2,409.6 |
|
Less: Netting(4)
|
|
1,830.4
|
|
2,752.4
|
|
|
1,779.2 |
|
1,175.7 |
|
| Total Derivative Financial Instruments |
|
$ |
1,544.7
|
|
$ |
568.9
|
|
|
$ |
315.1 |
|
$ |
1,233.9 |
|
(1) Derivative assets are reported in Other Assets on the consolidated balance sheets.
(2) Derivative liabilities are reported in Other Liabilities on the consolidated balance sheets.
(3) Includes swaps related to sales of certain Visa Class B common shares and total return swap contracts.
(4) See further detail in Note 23—Offsetting of Assets and Liabilities.
Notional amounts of derivative financial instruments do not represent credit risk and are not recorded in the consolidated balance sheets. They are used merely to express the volume of this activity. Northern Trust’s credit-related risk of loss is limited to the positive fair value of the derivative instrument, net of any collateral received, which is significantly less than the notional amount.
All derivative financial instruments, whether designated as hedges or not, are recorded on the consolidated balance sheets at fair value within Other Assets or Other Liabilities. Northern Trust has elected to net derivative assets and liabilities when legally enforceable master netting arrangements or similar agreements exist between Northern Trust and the counterparty.
Hedging Derivative Instruments Designated under GAAP. Northern Trust uses derivative instruments to hedge its exposure to foreign currency and interest rate risk. Certain hedging relationships are formally designated and qualify for hedge accounting under GAAP as fair value, cash flow or net investment hedges.
In order to qualify for hedge accounting, a formal assessment is performed on a calendar-quarter basis to verify that derivatives used in designated hedging transactions continue to be highly effective in offsetting the changes in fair value or cash flows of the hedged item. If a derivative ceases to be highly effective, matures, is sold or is terminated, or if a hedged forecasted transaction is no longer probable of occurring, hedge accounting is terminated and the derivative is treated as a trading instrument.
Fair Value Hedges. Derivatives are designated as fair value hedges to limit Northern Trust’s exposure to changes in the fair value of assets and liabilities due to movements in interest rates. Northern Trust may enter into interest rate swaps to hedge changes in fair value of AFS debt securities and long-term subordinated debt and senior notes. Northern Trust applied the “shortcut” method of accounting, available under GAAP, which assumes there is perfect effectiveness in a hedge, for all of its fair value hedges during the three- and six- month periods ended June 30, 2026 and 2025. Changes in the fair value of the derivative instrument and changes in the fair value of the hedged asset or liability attributable to the hedged risk are recognized currently in earnings within the same income statement line item.
Notes to Consolidated Financial Statements (unaudited) (continued)
Cash Flow Hedges. Derivatives are also designated as cash flow hedges in order to minimize the variability in cash flows of earning assets or forecasted transactions caused by movements in interest or foreign exchange rates. Northern Trust may enter into foreign exchange contracts to hedge changes in cash flows due to movements in foreign exchange rates of forecasted foreign-currency-denominated transactions and foreign-currency-denominated debt securities. Northern Trust may also enter into interest rate contracts to hedge changes in cash flows due to movements in interest rates of AFS debt securities or loans. The change in fair value of cash flow hedging derivative instruments are recorded in AOCI and reclassified to earnings when the hedged forecasted transaction impacts earnings within the same income statement line item. For certain cash flow hedging strategies, amounts excluded from the assessment of hedge effectiveness are recorded in AOCI and amortized to earnings over the life of the derivative.
There were no material gains or losses reclassified into earnings during the three- and six- month periods ended June 30, 2026 and 2025, as a result of the discontinuance of forecasted transactions that were no longer probable of occurring. It is estimated that net losses of $3.1 million will be reclassified into Net Income within the next twelve months relating to cash flow hedges. As of June 30, 2026, 7 months was the maximum length of time over which the exposure to variability in future cash flows of forecasted foreign-currency-denominated debt securities was being hedged.
The following tables provide fair value and cash flow hedge derivative gains and losses recognized in income during the three- and six- month periods ended June 30, 2026 and 2025.
TABLE 70: LOCATION AND AMOUNT OF FAIR VALUE AND CASH FLOW HEDGE DERIVATIVE GAINS AND LOSSES RECORDED IN INCOME
|
|
|
|
|
|
|
|
|
|
|
|
|
|
|
| (In Millions) |
INTEREST INCOME |
INTEREST EXPENSE |
| THREE MONTHS ENDED JUNE 30, |
2026 |
2025 |
2026 |
2025 |
| Total amounts on the consolidated statements of income |
$ |
2,189.3
|
|
$ |
2,212.8 |
|
$ |
1,513.8
|
|
$ |
1,602.3 |
|
| Gains (Losses) on fair value hedges recognized on |
|
|
|
|
| Interest Rate Contracts |
|
|
|
|
| Recognized on derivatives |
46.9
|
|
(48.0) |
|
(23.3) |
|
25.5 |
|
| Recognized on hedged items |
(46.9) |
|
48.0 |
|
23.3
|
|
(25.5) |
|
| Amounts related to interest settlements on derivatives |
(4.4) |
|
9.2 |
|
(11.8) |
|
(14.8) |
|
| Total gains (losses) recognized on fair value hedges |
$ |
(4.4) |
|
$ |
9.2 |
|
$ |
(11.8) |
|
$ |
(14.8) |
|
| Gains (Losses) on cash flow hedges reclassified from AOCI to net income |
|
|
|
|
Interest Rate Contracts(1)
|
(2.0) |
|
— |
|
—
|
|
— |
|
| Foreign Exchange Contracts |
$ |
10.5
|
|
$ |
3.4 |
|
$ |
—
|
|
$ |
— |
|
| Total gains (losses) reclassified from AOCI to net income on cash flow hedges |
$ |
8.5
|
|
$ |
3.4
|
|
$ |
—
|
|
$ |
—
|
|
(1) Amounts relate to the amortization of excluded components.
|
|
|
|
|
|
|
|
|
|
|
|
|
|
|
| (In Millions) |
INTEREST INCOME |
INTEREST EXPENSE |
| SIX MONTHS ENDED JUNE 30, |
2026 |
2025 |
2026 |
2025 |
| Total amounts on the consolidated statements of income |
$ |
4,423.4
|
|
$ |
4,353.7 |
|
$ |
3,093.9
|
|
$ |
3,175.1 |
|
| Gains (Losses) on fair value hedges recognized on |
|
|
|
|
| Interest Rate Contracts |
|
|
|
|
| Recognized on derivatives |
99.7
|
|
(147.6) |
|
(32.9) |
|
64.7 |
|
| Recognized on hedged items |
(99.7) |
|
147.6 |
|
32.9
|
|
(64.7) |
|
| Amounts related to interest settlements on derivatives |
(8.1) |
|
18.2 |
|
(23.4) |
|
(29.4) |
|
| Total gains (losses) recognized on fair value hedges |
$ |
(8.1) |
|
$ |
18.2 |
|
$ |
(23.4) |
|
$ |
(29.4) |
|
| Gains (Losses) on cash flow hedges reclassified from AOCI to net income |
|
|
|
|
Interest Rate Contracts(1)
|
(2.4) |
|
— |
|
—
|
|
— |
|
| Foreign Exchange Contracts |
$ |
24.3
|
|
$ |
13.9 |
|
$ |
—
|
|
$ |
— |
|
| Total gains (losses) reclassified from AOCI to net income on cash flow hedges |
$ |
21.9
|
|
$ |
13.9
|
|
$ |
—
|
|
$ |
—
|
|
(1) Amounts relate to the amortization of excluded components.
Notes to Consolidated Financial Statements (unaudited) (continued)
The following table provides the impact of fair value hedge accounting on the carrying value of the designated hedged items as of June 30, 2026 and December 31, 2025.
TABLE 71: HEDGED ITEMS IN FAIR VALUE HEDGES
|
|
|
|
|
|
|
|
|
|
|
|
|
|
|
|
JUNE 30, 2026 |
DECEMBER 31, 2025 |
| (In Millions) |
CARRYING VALUE OF THE HEDGED ITEMS |
CUMULATIVE HEDGE ACCOUNTING BASIS ADJUSTMENT(1)(3)
|
CARRYING VALUE OF THE HEDGED ITEMS |
CUMULATIVE HEDGE ACCOUNTING BASIS ADJUSTMENT(2)(3)
|
Available for Sale Debt Securities(4)
|
$ |
7,006.8
|
|
$ |
(6.9) |
|
$ |
7,674.8 |
|
$ |
94.1 |
|
| Senior Notes and Long-Term Subordinated Debt |
3,058.9
|
|
(184.3) |
|
3,091.1 |
|
(151.4) |
|
(1) The cumulative hedge accounting basis adjustment includes no amounts related to discontinued hedging relationships of Available for Sale Debt Securities or Senior Notes and Long-Term Subordinated Debt as of June 30, 2026.
(2) The cumulative hedge accounting basis adjustment includes $1.3 million related to discontinued hedging relationships of Available for Sale Debt Securities and no amounts related to discontinued hedging relationships in the cumulative hedge accounting basis adjustment of Senior Notes and Long-Term Subordinated Debt as of December 31, 2025.
(3) Positive (negative) amounts related to Available for Sale Debt Securities represent cumulative fair value hedge basis adjustments that will reduce (increase) net interest income in future periods. Positive (negative) amounts related to Senior Notes and Long-Term Subordinated Debt represent cumulative fair value hedge basis adjustments that will increase (reduce) net interest income in future periods.
(4) Carrying value represents amortized cost.
Net Investment Hedges. Certain foreign exchange contracts are designated as net investment hedges to minimize Northern Trust’s exposure to variability in the foreign currency translation of net investments in non-U.S. branches and subsidiaries. Net investment hedge gains of $30.7 million and losses of $278.1 million were recognized in AOCI related to foreign exchange contracts for the three months ended June 30, 2026 and 2025, respectively. Net investment hedge gains of $115.3 million and losses of $392.4 million were recognized in AOCI related to foreign exchange contracts for the six months ended June 30, 2026 and 2025, respectively.
Derivative Instruments Not Designated as Hedging under GAAP. Northern Trust’s derivative instruments that are not designated as hedging under GAAP include derivatives for purposes of client-related and trading activities, as well as other risk management purposes. These activities consist principally of providing foreign exchange services to clients in connection with Northern Trust’s global custody business. However, in the normal course of business, Northern Trust also engages in trading of currencies for its own account.
Non-designated risk management derivatives may include foreign exchange contracts entered into to manage the foreign currency risk of non-U.S.-dollar-denominated assets and liabilities, the net investment in certain non-U.S. affiliates, commercial loans and forecasted foreign-currency-denominated transactions. Swaps related to sales of certain Visa Class B common shares were entered into pursuant to which Northern Trust retains the risks associated with the ultimate conversion of the Visa Class B common shares into Visa Class A common shares. Total return swaps are entered into to manage the equity price risk associated with certain investments.
Changes in the fair value of derivative instruments not designated as hedges under GAAP are recognized currently in income. The following table provides the location and amount of gains and losses recorded in the consolidated statements of income for the six months ended June 30, 2026 and 2025, respectively, for derivative instruments not designated as hedges under GAAP.
TABLE 72: LOCATION AND AMOUNT OF GAINS AND LOSSES RECORDED IN INCOME FOR DERIVATIVES NOT DESIGNATED AS HEDGING UNDER GAAP
|
|
|
|
|
|
|
|
|
|
|
|
|
|
|
|
|
|
| (In Millions) |
DERIVATIVE GAINS (LOSSES) LOCATION RECOGNIZED IN INCOME |
AMOUNT OF DERIVATIVE GAINS (LOSSES) RECOGNIZED IN INCOME |
| THREE MONTHS ENDED JUNE 30, |
SIX MONTHS ENDED JUNE 30, |
| 2026 |
2025 |
2026 |
2025 |
| Non-designated risk management derivatives |
|
|
|
|
|
|
|
|
|
|
Other Financial Derivatives(1)
|
Other Operating Income |
(7.0) |
|
0.2 |
|
(4.2) |
|
(5.4) |
|
| Gains (Losses) from non-designated risk management derivatives |
$ |
(7.0) |
|
$ |
0.2 |
|
$ |
(4.2) |
|
$ |
(5.4) |
|
| Client-related and trading derivatives |
|
|
|
|
| Foreign Exchange Contracts |
Foreign Exchange Trading Income |
$ |
97.1
|
|
$ |
50.6 |
|
$ |
184.8
|
|
$ |
109.3 |
|
| Interest Rate Contracts |
Security Commissions and Trading Income |
0.7
|
|
1.2 |
|
1.0
|
|
1.7 |
|
| Gains from client-related and trading derivatives |
$ |
97.8
|
|
$ |
51.8 |
|
$ |
185.8
|
|
$ |
111.0 |
|
| Total gains from derivatives not designated as hedging under GAAP |
$ |
90.8
|
|
$ |
52.0 |
|
$ |
181.6
|
|
$ |
105.6 |
|
(1) Includes swaps related to the sale of certain Visa Class B common shares and total return swap contracts.
Notes to Consolidated Financial Statements (unaudited) (continued)
Note 22 – Securities Sold Under Agreements to Repurchase
Securities sold under agreements to repurchase are accounted for as collateralized financings and recorded at the amounts at which the securities were sold plus accrued interest. To minimize any potential credit risk associated with these transactions, the fair value of the securities sold is monitored, limits are set on exposure with counterparties, and the financial condition of counterparties is regularly assessed. Securities sold under agreements to repurchase are either directly held by, or pledged to the counterparty until the repurchase. Northern Trust nets securities sold under repurchase agreements against those purchased under resale agreements when there is a legally enforceable master netting arrangement and the other conditions to net are met.
The following table provides information regarding repurchase agreements that are accounted for as secured borrowings as of June 30, 2026 and December 31, 2025.
TABLE 73: REPURCHASE AGREEMENTS ACCOUNTED FOR AS SECURED BORROWINGS
|
|
|
|
|
|
|
|
|
|
REMAINING CONTRACTUAL MATURITY OF THE AGREEMENTS |
|
JUNE 30, 2026 |
DECEMBER 31, 2025 |
| (In Millions) |
OVERNIGHT AND CONTINUOUS |
| U.S. Treasury and Agency Securities |
$ |
92,684.6
|
|
$ |
90,307.8 |
|
| Total Borrowings |
92,684.6
|
|
90,307.8 |
|
|
|
|
Note 23 – Offsetting of Assets and Liabilities
The following table provides information regarding the offsetting of derivative assets and securities purchased under agreements to resell within the consolidated balance sheets as of June 30, 2026 and December 31, 2025.
TABLE 74: OFFSETTING OF DERIVATIVE ASSETS AND SECURITIES PURCHASED UNDER AGREEMENTS TO RESELL
|
|
|
|
|
|
|
|
|
|
|
|
|
|
|
|
|
|
|
JUNE 30, 2026 |
| (In Millions) |
GROSS RECOGNIZED ASSETS |
GROSS AMOUNTS OFFSET IN THE BALANCE SHEET(3)
|
NET AMOUNTS PRESENTED IN THE BALANCE SHEET |
GROSS AMOUNTS NOT OFFSET IN THE BALANCE SHEET(4)
|
NET AMOUNT(5)
|
Derivative Assets(1)
|
|
|
|
|
|
| Foreign Exchange Contracts Over the Counter (OTC) |
$ |
2,402.2
|
|
$ |
1,768.9
|
|
$ |
633.3
|
|
$ |
89.7
|
|
$ |
543.6
|
|
| Interest Rate Swaps OTC |
74.2
|
|
61.2
|
|
13.0
|
|
—
|
|
13.0
|
|
| Other Financial Derivatives |
0.3
|
|
0.3
|
|
—
|
|
—
|
|
—
|
|
|
|
|
|
|
|
| Total Derivatives Subject to a Master Netting Arrangement |
2,476.7
|
|
1,830.4
|
|
646.3
|
|
89.7
|
|
556.6
|
|
| Total Derivatives Not Subject to a Master Netting Arrangement |
898.4
|
|
—
|
|
898.4
|
|
—
|
|
898.4
|
|
| Total Derivatives |
3,375.1
|
|
1,830.4
|
|
1,544.7
|
|
89.7
|
|
1,455.0
|
|
Securities Purchased under Agreements to Resell(2)
|
$ |
92,935.5
|
|
$ |
92,509.0
|
|
$ |
426.5
|
|
$ |
426.5
|
|
$ |
—
|
|
|
|
|
|
|
|
|
|
|
|
|
|
|
|
|
|
|
|
|
DECEMBER 31, 2025 |
| (In Millions) |
GROSS RECOGNIZED ASSETS |
GROSS AMOUNTS OFFSET IN THE BALANCE SHEET(3)
|
NET AMOUNTS PRESENTED IN THE BALANCE SHEET |
GROSS AMOUNTS NOT OFFSET IN THE BALANCE SHEET(4)
|
NET AMOUNT(5)
|
Derivative Assets(1)
|
|
|
|
|
|
| Foreign Exchange Contracts OTC |
$ |
1,707.2 |
|
$ |
1,696.1 |
|
$ |
11.1 |
|
$ |
2.7 |
|
$ |
8.4 |
|
| Interest Rate Swaps OTC |
83.4 |
|
82.4 |
|
1.0 |
|
— |
|
1.0 |
|
|
|
|
|
|
|
| Other Financial Derivative |
0.7 |
|
0.7 |
|
— |
|
— |
|
— |
|
| Total Derivatives Subject to a Master Netting Arrangement |
1,791.3 |
|
1,779.2 |
|
12.1 |
|
2.7 |
|
9.4 |
|
| Total Derivatives Not Subject to a Master Netting Arrangement |
303.0 |
|
— |
|
303.0 |
|
— |
|
303.0 |
|
| Total Derivatives |
2,094.3 |
|
1,779.2 |
|
315.1 |
|
2.7 |
|
312.4 |
|
Securities Purchased under Agreements to Resell(2)
|
$ |
92,669.7 |
|
$ |
90,015.6 |
|
$ |
2,654.1 |
|
$ |
2,654.1 |
|
$ |
— |
|
(1)Derivative assets are reported in Other Assets on the consolidated balance sheets.
(2)Offsetting of Securities Purchased under Agreements to Resell primarily relates to our involvement in the FICC.
(3)Including cash collateral received from counterparties.
(4)Including financial assets accepted as collateral which are received from counterparties.
(5)Northern Trust did not possess any cash collateral that was not offset in the consolidated balance sheets that could have been used to offset the net amounts presented in the consolidated balance sheets as of June 30, 2026 and December 31, 2025.
Notes to Consolidated Financial Statements (unaudited) (continued)
The following table provides information regarding the offsetting of derivative liabilities and securities sold under agreements to repurchase within the consolidated balance sheets as of June 30, 2026 and December 31, 2025.
TABLE 75: OFFSETTING OF DERIVATIVE LIABILITIES AND SECURITIES SOLD UNDER AGREEMENTS TO REPURCHASE
|
|
|
|
|
|
|
|
|
|
|
|
|
|
|
|
|
|
|
JUNE 30, 2026 |
| (In Millions) |
GROSS RECOGNIZED LIABILITIES |
GROSS AMOUNTS OFFSET IN THE BALANCE SHEET(3)
|
NET AMOUNTS PRESENTED IN THE BALANCE SHEET |
GROSS AMOUNTS NOT OFFSET IN THE BALANCE SHEET(4)
|
NET AMOUNT(5)
|
Derivative Liabilities(1)
|
|
|
|
|
|
| Foreign Exchange Contracts OTC |
$ |
2,859.2
|
|
$ |
2,729.3
|
|
$ |
129.9
|
|
$ |
—
|
|
$ |
129.9
|
|
| Interest Rate Swaps OTC |
2.0
|
|
—
|
|
2.0
|
|
—
|
|
2.0
|
|
|
|
|
|
|
|
| Other Financial Derivatives |
23.1
|
|
23.1
|
|
—
|
|
—
|
|
—
|
|
| Total Derivatives Subject to a Master Netting Arrangement |
2,884.3
|
|
2,752.4
|
|
131.9
|
|
—
|
|
131.9
|
|
| Total Derivatives Not Subject to a Master Netting Arrangement |
437.0
|
|
—
|
|
437.0
|
|
—
|
|
437.0
|
|
| Total Derivatives |
3,321.3
|
|
2,752.4
|
|
568.9
|
|
—
|
|
568.9
|
|
Securities Sold under Agreements to Repurchase(2)
|
$ |
92,684.6
|
|
$ |
92,509.0
|
|
$ |
175.6
|
|
$ |
175.6
|
|
$ |
—
|
|
|
|
|
|
|
|
|
|
|
|
|
|
|
|
|
|
|
|
|
DECEMBER 31, 2025 |
| (In Millions) |
GROSS RECOGNIZED LIABILITIES |
GROSS AMOUNTS OFFSET IN THE BALANCE SHEET(3)
|
NET AMOUNTS PRESENTED IN THE BALANCE SHEET |
GROSS AMOUNTS NOT OFFSET IN THE BALANCE SHEET(4)
|
NET AMOUNT(5)
|
Derivative Liabilities(1)
|
|
|
|
|
|
| Foreign Exchange Contracts OTC |
$ |
1,334.8 |
|
$ |
1,139.4 |
|
$ |
195.4 |
|
$ |
— |
|
$ |
195.4 |
|
| Interest Rate Swaps OTC |
5.0 |
|
5.0 |
|
— |
|
— |
|
— |
|
|
|
|
|
|
|
| Other Financial Derivatives |
31.3 |
|
31.3 |
|
— |
|
— |
|
— |
|
| Total Derivatives Subject to a Master Netting Arrangement |
1,371.1 |
|
1,175.7 |
|
195.4 |
|
— |
|
195.4 |
|
| Total Derivatives Not Subject to a Master Netting Arrangement |
1,038.5 |
|
— |
|
1,038.5 |
|
— |
|
1,038.5 |
|
| Total Derivatives |
2,409.6 |
|
1,175.7 |
|
1,233.9 |
|
— |
|
1,233.9 |
|
Securities Sold under Agreements to Repurchase(2)
|
$ |
90,307.8 |
|
$ |
90,015.6 |
|
$ |
292.2 |
|
$ |
292.2 |
|
$ |
— |
|
(1)Derivative liabilities are reported in Other Liabilities on the consolidated balance sheets.
(2)Offsetting of Securities Sold under Agreements to Repurchase primarily relates to our involvement in the FICC.
(3)Including cash collateral deposited with counterparties.
(4)Including financial assets accepted as collateral which are deposited with counterparties.
(5)Northern Trust did not place any cash collateral with counterparties that was not offset in the consolidated balance sheets that could have been used to offset the net amounts presented in the consolidated balance sheets as of June 30, 2026 and December 31, 2025.
All of Northern Trust’s securities sold under agreements to repurchase (repurchase agreements) and securities purchased under agreements to resell (reverse repurchase agreements) involve the transfer of financial assets in exchange for cash subject to a right and obligation to repurchase those assets for an agreed upon amount. In the event of a repurchase failure, the cash or financial assets are available for offset. Certain repurchase agreements and reverse repurchase agreements are subject to a master netting arrangement, which sets forth the rights and obligations for repurchase and offset. Under the master netting arrangement, Northern Trust is entitled to offset receivables from and collateral placed with a single counterparty against obligations owed to that counterparty. In addition, collateral held by Northern Trust can be offset against receivables from that counterparty. Northern Trust has elected to net securities sold under repurchase agreements against those purchased under resale agreements when the GAAP requirements to net are met.
Derivative asset and liability positions with a single counterparty can be offset against each other in cases where legally enforceable master netting arrangements or similar agreements exist. Derivative assets and liabilities can be further offset by cash collateral received from, and deposited with, the transacting counterparty. The basis for this view is that, upon termination of transactions subject to a master netting arrangement or similar agreement, the individual derivative receivables do not represent resources to which general creditors have rights and individual derivative payables do not represent claims that are equivalent to the claims of general creditors. Northern Trust has elected to net derivative assets and liabilities when legally enforceable master netting arrangements or similar agreements exist between Northern Trust and the counterparty.
Notes to Consolidated Financial Statements (unaudited) (continued)
Credit risk associated with derivative instruments relates to the failure of the counterparty and the failure of Northern Trust to pay based on the contractual terms of the agreement, and is generally limited to the unrealized fair value gains and losses on these instruments, net of any collateral received or deposited. The amount of credit risk will increase or decrease during the lives of the instruments as interest rates, foreign exchange rates, or equity prices fluctuate. Northern Trust’s risk is controlled by limiting such activity to an approved list of counterparties and by subjecting such activity to the same credit and quality controls as are followed in lending and investment activities. Credit support annexes and other similar agreements are currently in place with a number of Northern Trust’s counterparties which mitigate the aforementioned credit risk associated with derivative activity conducted with those counterparties by requiring that significant net unrealized fair value gains be supported by collateral placed with Northern Trust.
Additional cash collateral received from and deposited with derivative counterparties totaling $73.3 million and $423.9 million, respectively, as of June 30, 2026, and $420.8 million and $144.1 million, respectively, as of December 31, 2025, was not offset against derivative assets and liabilities in the consolidated balance sheets as the amounts exceeded the net derivative positions with those counterparties.
Certain master netting arrangements Northern Trust enters into with derivative counterparties contain credit-risk-related contingent features in which the counterparty has the option to declare Northern Trust in default and accelerate cash settlement of net derivative liabilities with the counterparty in the event Northern Trust’s credit rating falls below specified levels. The aggregate fair value of all derivative instruments with credit-risk-related contingent features that were in a liability position was $248.8 million and $306.7 million at June 30, 2026 and December 31, 2025. Cash collateral amounts deposited with derivative counterparties on those dates included $246.6 million and $299.1 million, respectively, posted against these liabilities, resulting in a net maximum amount of termination payments that could have been required at June 30, 2026 and December 31, 2025, of $2.2 million and $7.6 million, respectively. Accelerated settlement of these liabilities would not have a material effect on the consolidated financial position or liquidity of Northern Trust.
Item 4. Controls and Procedures
As of June 30, 2026, the Corporation’s management, with the participation of the Corporation’s Chief Executive Officer and Chief Financial Officer, evaluated the effectiveness of the Corporation’s disclosure controls and procedures (as defined in Rules 13a-15(e) and 15d-15(e) under the Securities Exchange Act of 1934, as amended (the Exchange Act)), that are designed to ensure that information required to be disclosed by the Corporation in the reports that it files or submits under the Exchange Act is recorded, processed, summarized and reported within the time periods specified by the SEC’s rules and forms. Based on such evaluation, such officers have concluded that, as of June 30, 2026, the Corporation’s disclosure controls and procedures are effective.
There have been no changes in the Corporation’s internal control over financial reporting identified in connection with the evaluation required by Rules 13a-15 and 15d-15 under the Exchange Act during the last fiscal quarter that have materially affected, or that are reasonably likely to materially affect, the Corporation’s internal control over financial reporting.
PART II — OTHER INFORMATION
Item 1. Legal Proceedings
The information presented under the caption “Legal Proceedings” in Note 20—Commitments and Contingent Liabilities included under Part I, Item 1 of this Form 10-Q is incorporated herein by reference.
Item 1A. Risk Factors
Refer to “Risk Factors” in our Annual Report on Form 10-K for the year ended December 31, 2025, for a discussion of risks identified as being most significant to Northern Trust.
Item 2. Unregistered Sales of Equity Securities and Use of Proceeds
(c) The following table shows certain information relating to the Corporation’s purchases of common stock for the three months ended June 30, 2026.
TABLE 76: REPURCHASES OF COMMON STOCK
|
|
|
|
|
|
|
|
|
|
|
|
|
|
|
(Dollars in millions except per share amounts; shares in thousands)
|
TOTAL NUMBER OF SHARES PURCHASED |
AVERAGE PRICE PAID PER SHARE |
TOTAL NUMBER OF SHARES PURCHASED AS PART OF A PUBLICLY ANNOUNCED PLAN |
MAXIMUM APPROXIMATE DOLLAR VALUE OF SHARES THAT MAY YET BE PURCHASED UNDER THE PUBLICLY ANNOUNCED PLAN |
| PERIOD: |
|
|
|
|
| April 1 - 30, 2026 |
481 |
|
$ |
158.48 |
|
481 |
|
$ |
1,560 |
|
| May 1 - 31, 2026 |
1,036 |
|
164.37 |
|
1,036 |
|
1,389 |
|
| June 1 - 30, 2026 |
607 |
|
169.97 |
|
607 |
|
1,286 |
|
| Total (Second Quarter) |
2,124 |
|
$ |
164.64 |
|
2,124 |
|
$ |
1,286 |
|
On July 22, 2025 the Corporation’s Board of Directors approved a new common stock repurchase authorization (the “New Stock Repurchase Authorization”) authorizing, but not obligating, the repurchase of up to $2.5 billion (the “Maximum Program Amount”) of the Corporation’s outstanding shares of common stock from time to time. The New Stock Repurchase Authorization replaces the previously announced authorization approved on October 19, 2021. All funds expected in connection with repurchases after the New Stock Repurchase Authorization shall count against the Maximum Program Amount. The New Stock Repurchase Authorization has no expiration date. Thus the Corporation retains the ability to repurchase when circumstances warrant and applicable regulation permits.
The Corporation expects to acquire shares of common stock under the New Stock Repurchase Authorization through open market transactions, block trades, privately negotiated transactions, and/or pursuant to any trading plan that may be adopted by the Corporation’s management in accordance with federal securities laws from time to time, including pursuant to Rule 10b5-1 of the Exchange Act. The timing and actual number of shares of common stock repurchased will depend on a variety of factors including price, corporate and regulatory requirements, market conditions, and other corporate liquidity requirements and priorities. The New Stock Repurchase Authorization does not obligate the Corporation to acquire a specific dollar amount or number of shares and may be modified, suspended or discontinued at any time. Please refer to Note 10—Stockholders’ Equity to the consolidated financial statements provided in Part I - Item 1. Consolidated Financial Statements (unaudited).
Item 3. Defaults Upon Senior Securities
None.
Item 4. Mine Safety Disclosures
Not applicable.
Item 5. Other Information
During the three months ended June 30, 2026, none of our directors or officers (as defined in Rule 16a-1(f) promulgated under the Securities Exchange Act of 1934, as amended) adopted, terminated or modified a Rule 10b5-1 trading arrangement or a non-Rule 10b5-1 trading arrangement (as such terms are defined in Item 408 of Regulation S-K).
Item 6. Exhibits
|
|
|
|
|
|
Exhibit
Number |
Description |
|
|
| 4.1 |
Certain instruments defining the rights of the holders of long-term debt of the Corporation and certain of its subsidiaries, none of which authorize a total amount of indebtedness in excess of 10% of the total assets of the Corporation and its subsidiaries on a consolidated basis, have not been filed as exhibits. The Corporation hereby agrees to furnish a copy of any of these agreements to the SEC upon request. |
|
|
|
|
|
|
|
|
|
|
|
|
|
|
|
|
|
|
| 101 |
Includes the following financial and related information from Northern Trust’s Quarterly Report on Form 10-Q as of and for the quarter ended June 30, 2026, formatted in Inline Extensible Business Reporting Language (iXBRL): (1) the Consolidated Balance Sheets, (2) the Consolidated Statements of Income, (3) the Consolidated Statements of Comprehensive Income, (4) the Consolidated Statements of Changes in Stockholders’ Equity, (5) the Consolidated Statements of Cash Flows, and (6) Notes to Consolidated Financial Statements. |
|
|
| 104 |
The cover page from this Quarterly Report on Form 10-Q, formatted in Inline XBRL. |
SIGNATURES
Pursuant to the requirements of the Securities Exchange Act of 1934, the registrant has duly caused this report to be signed on its behalf by the undersigned thereunto duly authorized.
|
|
|
|
|
|
|
|
|
|
|
|
|
|
NORTHERN TRUST CORPORATION |
|
|
(Registrant) |
|
|
|
|
| Date: |
July 30, 2026 |
By: |
/s/ David W. Fox, Jr. |
|
|
|
David W. Fox, Jr.
Executive Vice President and
Chief Financial Officer
(Duly Authorized Officer and Principal Financial Officer) |
|
|
|
|
| Date: |
July 30, 2026 |
By: |
/s/ John P. Landers |
|
|
|
John P. Landers
Executive Vice President and Controller
(Principal Accounting Officer) |
|
|
|
|
EX-10.1
2
ex101.htm
EX-10.1
ex101
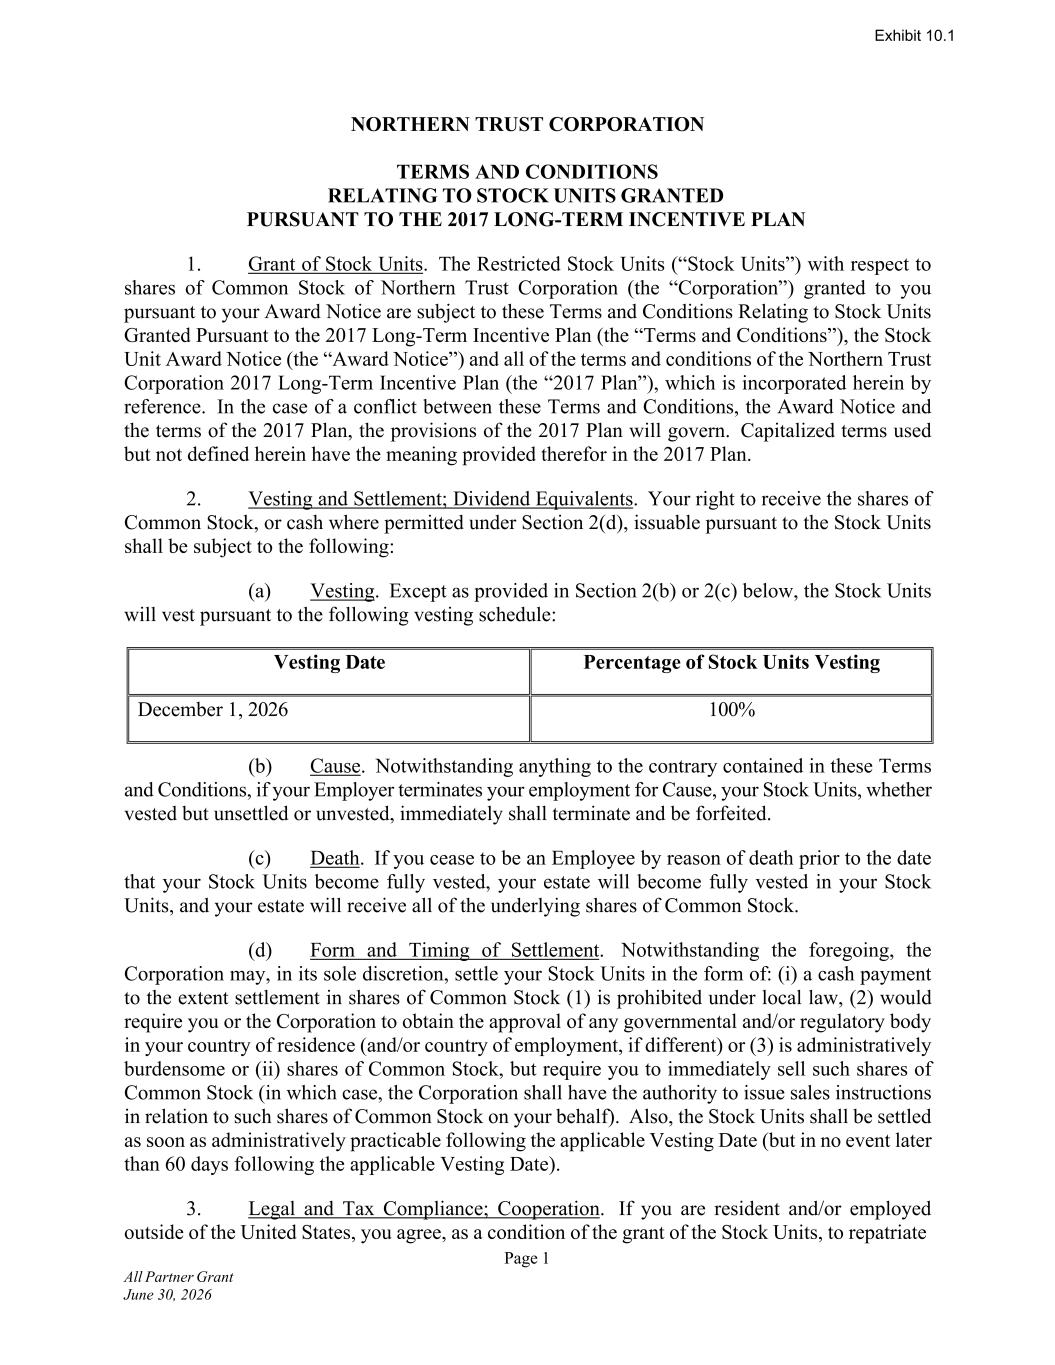
Page 1 All Partner Grant June 30, 2026 NORTHERN TRUST CORPORATION TERMS AND CONDITIONS RELATING TO STOCK UNITS GRANTED PURSUANT TO THE 2017 LONG-TERM INCENTIVE PLAN 1. Grant of Stock Units. The Restricted Stock Units (“Stock Units”) with respect to shares of Common Stock of Northern Trust Corporation (the “Corporation”) granted to you pursuant to your Award Notice are subject to these Terms and Conditions Relating to Stock Units Granted Pursuant to the 2017 Long-Term Incentive Plan (the “Terms and Conditions”), the Stock Unit Award Notice (the “Award Notice”) and all of the terms and conditions of the Northern Trust Corporation 2017 Long-Term Incentive Plan (the “2017 Plan”), which is incorporated herein by reference. In the case of a conflict between these Terms and Conditions, the Award Notice and the terms of the 2017 Plan, the provisions of the 2017 Plan will govern. Capitalized terms used but not defined herein have the meaning provided therefor in the 2017 Plan. 2. Vesting and Settlement; Dividend Equivalents. Your right to receive the shares of Common Stock, or cash where permitted under Section 2(d), issuable pursuant to the Stock Units shall be subject to the following: (a) Vesting. Except as provided in Section 2(b) or 2(c) below, the Stock Units will vest pursuant to the following vesting schedule: Vesting Date Percentage of Stock Units Vesting December 1, 2026 100% (b) Cause. Notwithstanding anything to the contrary contained in these Terms and Conditions, if your Employer terminates your employment for Cause, your Stock Units, whether vested but unsettled or unvested, immediately shall terminate and be forfeited. (c) Death. If you cease to be an Employee by reason of death prior to the date that your Stock Units become fully vested, your estate will become fully vested in your Stock Units, and your estate will receive all of the underlying shares of Common Stock. (d) Form and Timing of Settlement. Notwithstanding the foregoing, the Corporation may, in its sole discretion, settle your Stock Units in the form of: (i) a cash payment to the extent settlement in shares of Common Stock (1) is prohibited under local law, (2) would require you or the Corporation to obtain the approval of any governmental and/or regulatory body in your country of residence (and/or country of employment, if different) or (3) is administratively burdensome or (ii) shares of Common Stock, but require you to immediately sell such shares of Common Stock (in which case, the Corporation shall have the authority to issue sales instructions in relation to such shares of Common Stock on your behalf). Also, the Stock Units shall be settled as soon as administratively practicable following the applicable Vesting Date (but in no event later than 60 days following the applicable Vesting Date). 3. Legal and Tax Compliance; Cooperation. If you are resident and/or employed outside of the United States, you agree, as a condition of the grant of the Stock Units, to repatriate
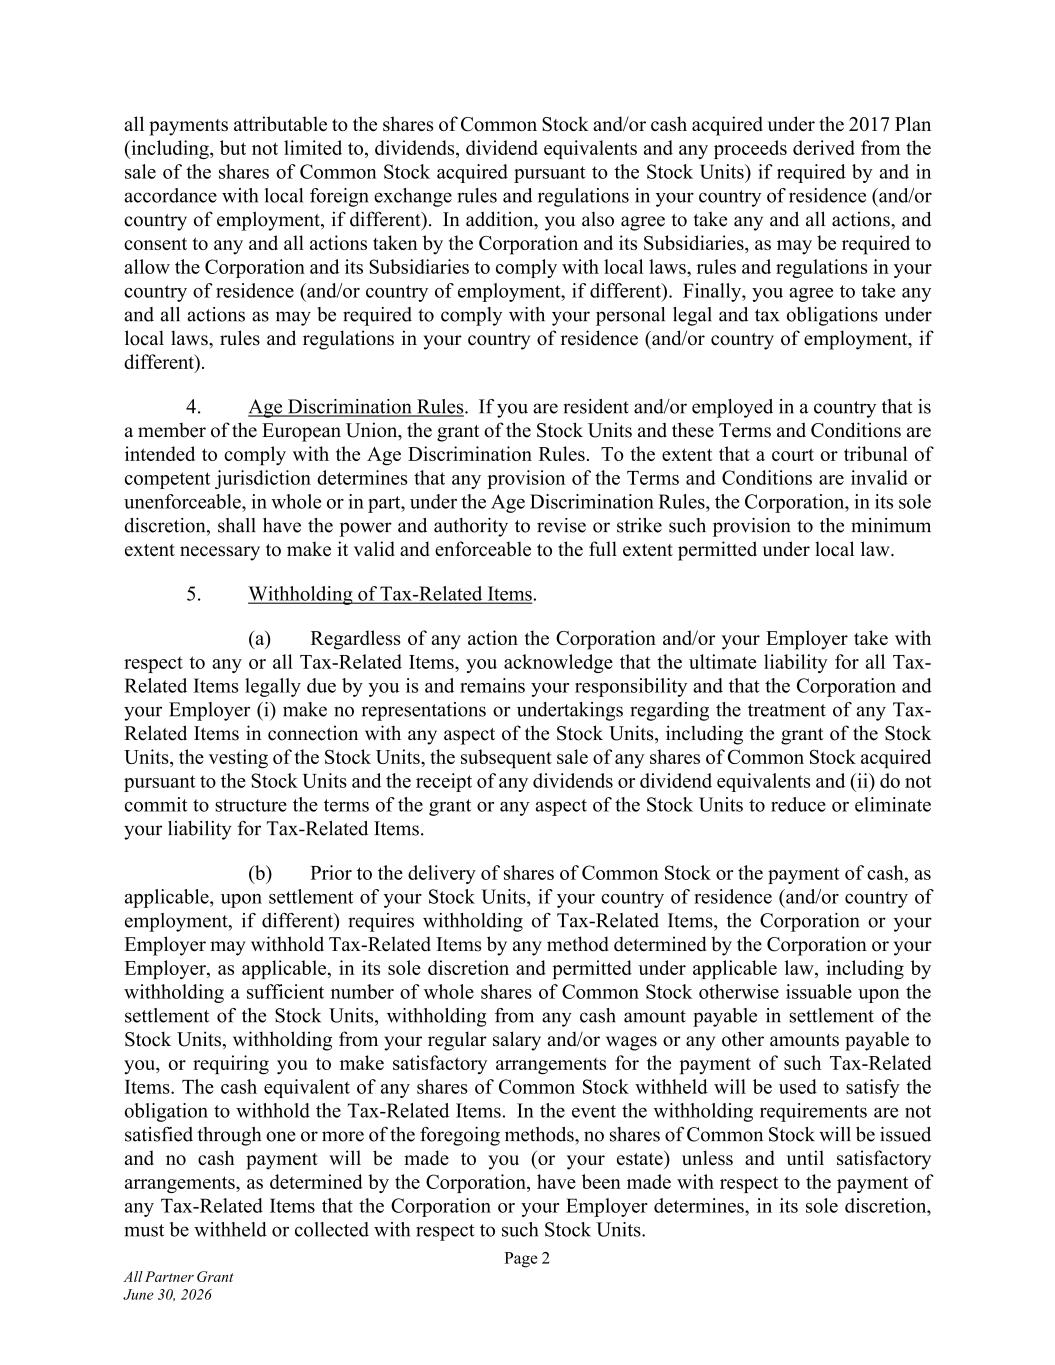
Page 2 All Partner Grant June 30, 2026 all payments attributable to the shares of Common Stock and/or cash acquired under the 2017 Plan (including, but not limited to, dividends, dividend equivalents and any proceeds derived from the sale of the shares of Common Stock acquired pursuant to the Stock Units) if required by and in accordance with local foreign exchange rules and regulations in your country of residence (and/or country of employment, if different). In addition, you also agree to take any and all actions, and consent to any and all actions taken by the Corporation and its Subsidiaries, as may be required to allow the Corporation and its Subsidiaries to comply with local laws, rules and regulations in your country of residence (and/or country of employment, if different). Finally, you agree to take any and all actions as may be required to comply with your personal legal and tax obligations under local laws, rules and regulations in your country of residence (and/or country of employment, if different). 4. Age Discrimination Rules. If you are resident and/or employed in a country that is a member of the European Union, the grant of the Stock Units and these Terms and Conditions are intended to comply with the Age Discrimination Rules. To the extent that a court or tribunal of competent jurisdiction determines that any provision of the Terms and Conditions are invalid or unenforceable, in whole or in part, under the Age Discrimination Rules, the Corporation, in its sole discretion, shall have the power and authority to revise or strike such provision to the minimum extent necessary to make it valid and enforceable to the full extent permitted under local law. 5. Withholding of Tax-Related Items. (a) Regardless of any action the Corporation and/or your Employer take with respect to any or all Tax-Related Items, you acknowledge that the ultimate liability for all Tax- Related Items legally due by you is and remains your responsibility and that the Corporation and your Employer (i) make no representations or undertakings regarding the treatment of any Tax- Related Items in connection with any aspect of the Stock Units, including the grant of the Stock Units, the vesting of the Stock Units, the subsequent sale of any shares of Common Stock acquired pursuant to the Stock Units and the receipt of any dividends or dividend equivalents and (ii) do not commit to structure the terms of the grant or any aspect of the Stock Units to reduce or eliminate your liability for Tax-Related Items. (b) Prior to the delivery of shares of Common Stock or the payment of cash, as applicable, upon settlement of your Stock Units, if your country of residence (and/or country of employment, if different) requires withholding of Tax-Related Items, the Corporation or your Employer may withhold Tax-Related Items by any method determined by the Corporation or your Employer, as applicable, in its sole discretion and permitted under applicable law, including by withholding a sufficient number of whole shares of Common Stock otherwise issuable upon the settlement of the Stock Units, withholding from any cash amount payable in settlement of the Stock Units, withholding from your regular salary and/or wages or any other amounts payable to you, or requiring you to make satisfactory arrangements for the payment of such Tax-Related Items. The cash equivalent of any shares of Common Stock withheld will be used to satisfy the obligation to withhold the Tax-Related Items. In the event the withholding requirements are not satisfied through one or more of the foregoing methods, no shares of Common Stock will be issued and no cash payment will be made to you (or your estate) unless and until satisfactory arrangements, as determined by the Corporation, have been made with respect to the payment of any Tax-Related Items that the Corporation or your Employer determines, in its sole discretion, must be withheld or collected with respect to such Stock Units.
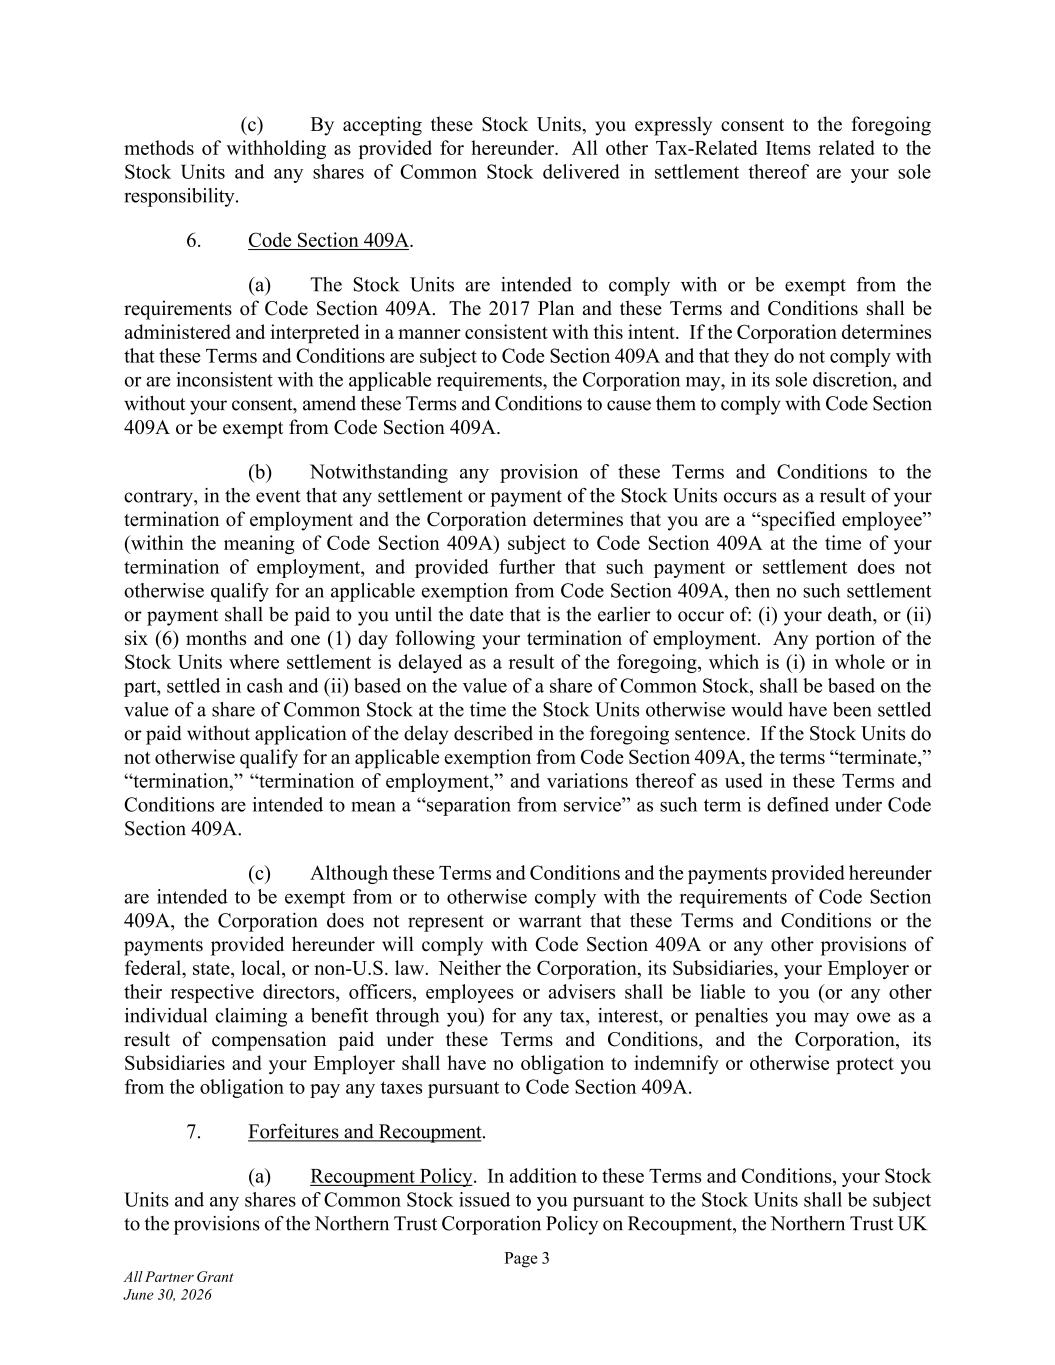
Page 3 All Partner Grant June 30, 2026 (c) By accepting these Stock Units, you expressly consent to the foregoing methods of withholding as provided for hereunder. All other Tax-Related Items related to the Stock Units and any shares of Common Stock delivered in settlement thereof are your sole responsibility. 6. Code Section 409A. (a) The Stock Units are intended to comply with or be exempt from the requirements of Code Section 409A. The 2017 Plan and these Terms and Conditions shall be administered and interpreted in a manner consistent with this intent. If the Corporation determines that these Terms and Conditions are subject to Code Section 409A and that they do not comply with or are inconsistent with the applicable requirements, the Corporation may, in its sole discretion, and without your consent, amend these Terms and Conditions to cause them to comply with Code Section 409A or be exempt from Code Section 409A. (b) Notwithstanding any provision of these Terms and Conditions to the contrary, in the event that any settlement or payment of the Stock Units occurs as a result of your termination of employment and the Corporation determines that you are a “specified employee” (within the meaning of Code Section 409A) subject to Code Section 409A at the time of your termination of employment, and provided further that such payment or settlement does not otherwise qualify for an applicable exemption from Code Section 409A, then no such settlement or payment shall be paid to you until the date that is the earlier to occur of: (i) your death, or (ii) six (6) months and one (1) day following your termination of employment. Any portion of the Stock Units where settlement is delayed as a result of the foregoing, which is (i) in whole or in part, settled in cash and (ii) based on the value of a share of Common Stock, shall be based on the value of a share of Common Stock at the time the Stock Units otherwise would have been settled or paid without application of the delay described in the foregoing sentence. If the Stock Units do not otherwise qualify for an applicable exemption from Code Section 409A, the terms “terminate,” “termination,” “termination of employment,” and variations thereof as used in these Terms and Conditions are intended to mean a “separation from service” as such term is defined under Code Section 409A. (c) Although these Terms and Conditions and the payments provided hereunder are intended to be exempt from or to otherwise comply with the requirements of Code Section 409A, the Corporation does not represent or warrant that these Terms and Conditions or the payments provided hereunder will comply with Code Section 409A or any other provisions of federal, state, local, or non-U.S. law. Neither the Corporation, its Subsidiaries, your Employer or their respective directors, officers, employees or advisers shall be liable to you (or any other individual claiming a benefit through you) for any tax, interest, or penalties you may owe as a result of compensation paid under these Terms and Conditions, and the Corporation, its Subsidiaries and your Employer shall have no obligation to indemnify or otherwise protect you from the obligation to pay any taxes pursuant to Code Section 409A. 7. Forfeitures and Recoupment. (a) Recoupment Policy. In addition to these Terms and Conditions, your Stock Units and any shares of Common Stock issued to you pursuant to the Stock Units shall be subject to the provisions of the Northern Trust Corporation Policy on Recoupment, the Northern Trust UK
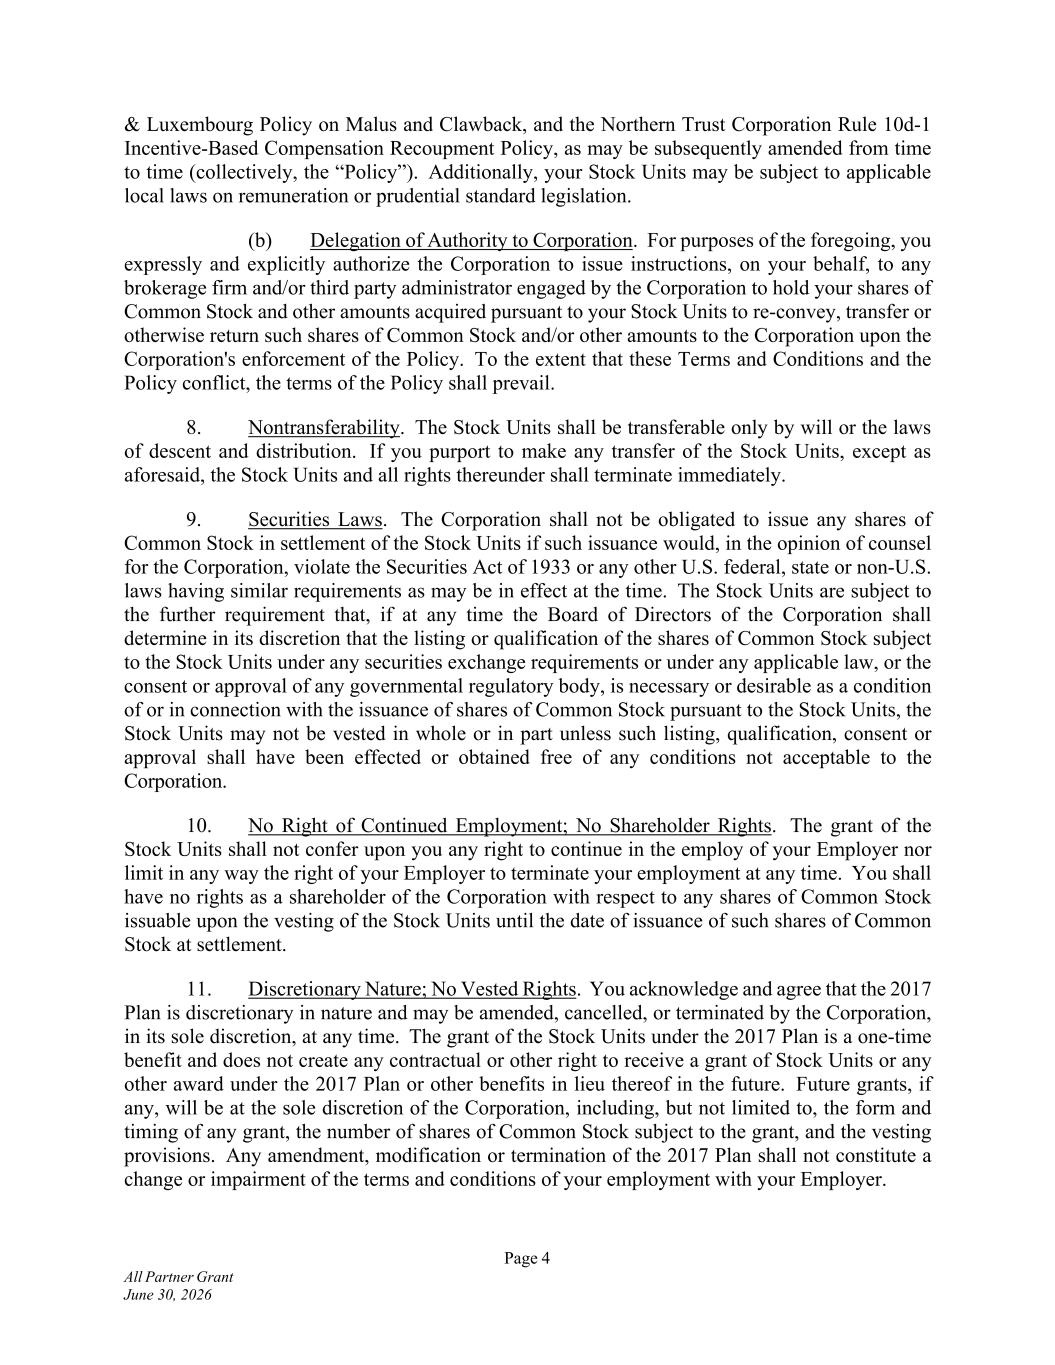
Page 4 All Partner Grant June 30, 2026 & Luxembourg Policy on Malus and Clawback, and the Northern Trust Corporation Rule 10d-1 Incentive-Based Compensation Recoupment Policy, as may be subsequently amended from time to time (collectively, the “Policy”). Additionally, your Stock Units may be subject to applicable local laws on remuneration or prudential standard legislation. (b) Delegation of Authority to Corporation. For purposes of the foregoing, you expressly and explicitly authorize the Corporation to issue instructions, on your behalf, to any brokerage firm and/or third party administrator engaged by the Corporation to hold your shares of Common Stock and other amounts acquired pursuant to your Stock Units to re-convey, transfer or otherwise return such shares of Common Stock and/or other amounts to the Corporation upon the Corporation's enforcement of the Policy. To the extent that these Terms and Conditions and the Policy conflict, the terms of the Policy shall prevail. 8. Nontransferability. The Stock Units shall be transferable only by will or the laws of descent and distribution. If you purport to make any transfer of the Stock Units, except as aforesaid, the Stock Units and all rights thereunder shall terminate immediately. 9. Securities Laws. The Corporation shall not be obligated to issue any shares of Common Stock in settlement of the Stock Units if such issuance would, in the opinion of counsel for the Corporation, violate the Securities Act of 1933 or any other U.S. federal, state or non-U.S. laws having similar requirements as may be in effect at the time. The Stock Units are subject to the further requirement that, if at any time the Board of Directors of the Corporation shall determine in its discretion that the listing or qualification of the shares of Common Stock subject to the Stock Units under any securities exchange requirements or under any applicable law, or the consent or approval of any governmental regulatory body, is necessary or desirable as a condition of or in connection with the issuance of shares of Common Stock pursuant to the Stock Units, the Stock Units may not be vested in whole or in part unless such listing, qualification, consent or approval shall have been effected or obtained free of any conditions not acceptable to the Corporation. 10. No Right of Continued Employment; No Shareholder Rights. The grant of the Stock Units shall not confer upon you any right to continue in the employ of your Employer nor limit in any way the right of your Employer to terminate your employment at any time. You shall have no rights as a shareholder of the Corporation with respect to any shares of Common Stock issuable upon the vesting of the Stock Units until the date of issuance of such shares of Common Stock at settlement. 11. Discretionary Nature; No Vested Rights. You acknowledge and agree that the 2017 Plan is discretionary in nature and may be amended, cancelled, or terminated by the Corporation, in its sole discretion, at any time. The grant of the Stock Units under the 2017 Plan is a one-time benefit and does not create any contractual or other right to receive a grant of Stock Units or any other award under the 2017 Plan or other benefits in lieu thereof in the future. Future grants, if any, will be at the sole discretion of the Corporation, including, but not limited to, the form and timing of any grant, the number of shares of Common Stock subject to the grant, and the vesting provisions. Any amendment, modification or termination of the 2017 Plan shall not constitute a change or impairment of the terms and conditions of your employment with your Employer.
Page 5 All Partner Grant June 30, 2026 12. Extraordinary Benefit. Your participation in the 2017 Plan is voluntary. The value of the Stock Units and any other awards granted under the 2017 Plan is an extraordinary item of compensation outside the scope of your employment (and your employment contract, if any). Any grant under the 2017 Plan, including the grant of the Stock Units, is not part of normal or expected compensation for purposes of calculating any severance, resignation, redundancy, end of service payments, bonuses, long-service awards, pension, or retirement benefits or similar payments. 13. Heirs. These Terms and Conditions shall bind and inure to the benefit of the Corporation, its successors and assigns, and you and your estate in the event of your death. 14. Data Privacy. The Corporation is located at 50 S. LaSalle Street, Chicago, Illinois 60603, United States of America, and grants Stock Units under the 2017 Plan to employees of the Corporation and its Subsidiaries in its sole discretion. In conjunction with the Corporation’s grant of the Stock Units under the 2017 Plan and its ongoing administration of such awards, the Corporation is providing the following information about its data collection, processing and transfer practices. In accepting the grant of the Stock Units, you expressly and explicitly consent to the personal data activities as described herein. (a) Data Collection, Processing and Usage. The Corporation collects, processes and uses your personal data, including your name, home address, email address, telephone number, date of birth, social insurance number or other identification number, salary, citizenship, job title, any shares of Common Stock or directorships held in the Corporation, and details of all Stock Units or any other equity compensation awards granted, canceled, exercised, vested, or outstanding in your favor, which the Corporation receives from you or your Employer. In granting the Stock Units under the 2017 Plan, the Corporation will collect your personal data for purposes of allocating shares of Common Stock and implementing, administering and managing the 2017 Plan. The Corporation’s legal basis for the collection, processing and usage of your personal data is your consent. (b) Stock Plan Administration Service Provider. The Corporation transfers your personal data to Fidelity Stock Plan Services, LLC, an independent service provider based in the United States of America (the “Stock Plan Administrator”), which assists the Corporation with the implementation, administration and management of the 2017 Plan and certain other service providers, including, but not limited to, the Company’s outside legal counsel and the Company’s auditor. In the future, the Corporation may select a different Stock Plan Administrator or service providers and share your personal data with other companies that serve in a similar manner. The Stock Plan Administrator will open an account for you to receive and trade shares of Common Stock acquired under the 2017 Plan. You will be asked to agree on separate terms and data processing practices with the Stock Plan Administrator, which is a condition to your ability to participate in the 2017 Plan. (c) International Data Transfers. The Corporation and the Stock Plan Administrator are based in the United States of America. You should note that your country of residence may have enacted data privacy laws that are different from the United States of America. The Corporation’s legal basis for the transfer of your personal data to the United States of America is your consent.
Page 6 All Partner Grant June 30, 2026 (d) Voluntariness and Consequences of Consent Denial or Withdrawal. Your participation in the 2017 Plan and your grant of consent is purely voluntary. You may deny or withdraw your consent at any time. If you do not consent, or if you later withdraw your consent, you may be unable to participate in the 2017 Plan. This would not affect your existing employment or salary; instead, you merely may forfeit the opportunities associated with the 2017 Plan. (e) Data Subjects Rights. You may have a number of rights under the data privacy laws in your country of residence. For example, your rights may include the right to (i) request access or copies of personal data the Corporation processes, (ii) request rectification of incorrect data, (iii) request deletion of data, (iv) place restrictions on processing, (v) lodge complaints with competent authorities in your country of residence, and/or (vi) request a list with the names and addresses of any potential recipients of your personal data. To receive clarification regarding your rights or to exercise your rights, you should contact privacy_compliance@ntrs.com. 15. Private Placement. If you are a resident and/or employed outside of the United States, you acknowledge that the grant of the Stock Units is not intended to be a public offering of securities in your country of residence (and/or country of employment, if different). You further acknowledge that the Corporation has not submitted any registration statement, prospectus or other filing with any securities authority other than the U.S. Securities and Exchange Commission with respect to the grant of the Stock Units, unless otherwise required under local law. No employee of the Corporation is permitted to advise you on whether you should acquire shares of Common Stock under the 2017 Plan or provide you with any legal, tax or financial advice with respect to the grant of the Stock Units. The acquisition of shares of Common Stock involves certain risks, and you should carefully consider all risk factors and tax considerations relevant to the acquisition of shares of Common Stock under the 2017 Plan and the disposition of them. Further, you should carefully review all of the materials related to the Stock Units and the 2017 Plan, and you should consult with your personal legal, tax and financial advisors for professional advice in relation to your personal circumstances. 16. Governing Law. All questions concerning the construction, validity and interpretation of the Stock Units and the 2017 Plan shall be governed and construed according to the laws of the state of Delaware, without regard to the application of the conflicts of laws provisions thereof. Any disputes regarding the Stock Units or the 2017 Plan shall be brought only in the state or federal courts of the state of Delaware. 17. Electronic Delivery. The Corporation may, in its sole discretion, decide to deliver any documents related to the Stock Units or other awards granted to you under the 2017 Plan by electronic means. You hereby consent to receive such documents by electronic delivery and agree to participate in the 2017 Plan through an on-line or electronic system established and maintained by the Corporation or a third party designated by the Corporation. 18. Severability. The invalidity or unenforceability of any provision of the 2017 Plan or these Terms and Conditions shall not affect the validity or enforceability of any other provision of the 2017 Plan or these Terms and Conditions. 19. English Language. If you are resident and/or employed outside of the United States, you acknowledge and agree that it is your express intent that these Terms and Conditions,
Page 7 All Partner Grant June 30, 2026 the 2017 Plan and all other documents, notices and legal proceedings entered into, given or instituted pursuant to the Stock Units be drawn up in English. If you have received these Terms and Conditions, the 2017 Plan or any other documents related to the Stock Units translated into a language other than English and the meaning of the translated version is different than the English version, the English version will control. 20. Addendum. Notwithstanding any provisions of these Terms and Conditions to the contrary, the Stock Units shall be subject to any special terms and conditions for your country of residence (and/or country of employment, if different) set forth in an addendum to these Terms and Conditions (an “Addendum”). Further, if you transfer your residence and/or employment to another country reflected in an Addendum to these Terms and Conditions at the time of transfer, the special terms and conditions for such country will apply to you to the extent the Corporation determines, in its sole discretion, that the application of such special terms and conditions is necessary or advisable in order to comply with local law, rules and regulations or to facilitate the operation and administration of the Stock Units and the 2017 Plan (or the Corporation may establish alternative terms and conditions as may be necessary or advisable to accommodate your transfer). In all circumstances, any applicable Addendum shall constitute part of these Terms and Conditions. 21. Insider Trading. By participating in the 2017 Plan, you expressly agree to comply with the Corporation’s Securities Transactions Policy and Procedures and any other of its policies regarding insider trading or personal account dealing applicable to you. Further, you expressly acknowledge and agree that, depending on the country of residence of you or your broker, or where the shares of Common Stock are listed, you may be subject to insider trading restrictions and/or market abuse laws which may affect your ability to accept, acquire, sell or otherwise dispose of shares of Common Stock, rights to shares of Common Stock (e.g., Stock Units) or rights linked to the value of the shares of Common Stock, during such times you are considered to have material non-public information, “inside information” or similar types of information regarding the Corporation as defined by laws or regulations in the applicable country. Local insider trading laws and regulations may prohibit the cancellation or amendment of orders you place before you possessed such information. Furthermore, you may be prohibited from (a) disclosing such information to any third party (other than on a “need to know” basis) and (b) “tipping” third parties or causing them otherwise to buy or sell securities (including other employees of the Corporation and its Subsidiaries). Any restriction under these laws or regulations are separate from and in addition to any restrictions that may be imposed under any applicable Corporation policies. You expressly acknowledge and agree that it is your responsibility to comply with any applicable restrictions, and you should consult your personal advisor for additional information on any trading restrictions that may apply to you. 22. Additional Requirements; Amendments. The Corporation reserves the right to impose other requirements on the Stock Units, any shares of Common Stock acquired pursuant to the Stock Units and your participation in the 2017 Plan to the extent the Corporation determines, in its sole discretion, that such other requirements are necessary or advisable in order to comply with local law, rules and regulations or to facilitate the operation and administration of the Stock Units and the 2017 Plan. Such requirements may include (but are not limited to) requiring you to sign any agreements or undertakings that may be necessary to accomplish the foregoing. In addition, the Corporation reserves the right to amend these Terms and Conditions, without your
Page 8 All Partner Grant June 30, 2026 consent, either prospectively or retroactively, to the extent that such amendment does not materially impair your rights under the Stock Units. 23. Definitions. For purposes of these Terms and Conditions: (a) “Age Discrimination Rules” means the age discrimination provisions of the EU Equal Treatment Framework Directive, as implemented into local law. (b) “Cause” means (i) a material breach or your willful and substantial non- performance of your assigned duties and responsibilities (other than as a result of incapacity due to physical or mental illness), (ii) a conviction of or no contest plea with respect to bribery, extortion, embezzlement, fraud, grand larceny, or any felony or similar conviction under local law involving abuse or misuse of your position to seek or obtain an illegal or personal gain at the expense of the Corporation, your Employer or any Subsidiary, or similar crimes, or conspiracy to commit any such crimes or attempt to commit any such crimes, (iii) your violation of any policy of the Corporation, your Employer or any of its Subsidiaries to which you may be subject or your willful engagement in any misconduct in the performance of your duties that materially injures the Corporation, your Employer or any of its Subsidiaries, (iv) your performance of any act which, if known to the customers, clients, stockholders or regulators of the Corporation, your Employer or any of its Subsidiaries, would materially and adversely impact the business of the Corporation, your Employer or any of its Subsidiaries, or (v) any act or omission by you that causes a regulatory body with jurisdiction over the Corporation, your Employer or any of its Subsidiaries, to demand, request, or recommend that you be suspended or removed from any position in which you serve with the Corporation, your Employer or any of its Subsidiaries. (c) “Employer” means the Corporation or any Subsidiary that employs you on the applicable date. (d) “Grant Date” means the date of grant reflected in your Award Notice. (e) “Tax-Related Items” means any income tax (including U.S. federal, state and local taxes or non-U.S. taxes), social insurance, payroll tax, payment on account or other tax- related withholding amounts. (f) “Vesting Date” means each date on which you acquire a non-forfeitable right in a Stock Unit as reflected in Section 2. 24. Exclusion of Claim. You acknowledge and agree that you will have no entitlement to compensation or damages in consequence of the termination of your employment under Section 2(b) with the Corporation and your Employer for any reason whatsoever and whether or not in breach of contract, insofar as any purported claim to such entitlement arises or may arise from your ceasing to have rights under or to be entitled to vest in the Stock Units as a result of such termination of employment (whether the termination is in breach of contract or otherwise), or from the loss or diminution in value of the Stock Units. Upon the grant of the Stock Units, you shall be deemed irrevocably to have waived any such entitlement.
Page 9 All Partner Grant June 30, 2026 25. Important Notices. (a) Review Period. You have a minimum of 14 calendar days to consider these Terms and Conditions (measured from the date on which the Corporation provides these Terms and Conditions to you) before accepting the grant of Stock Units (the “Review Period”). For the sake of clarity, you may accept the grant of the Stock Units and these Terms and Conditions prior to the expiration of the Review Period, but if you do, you agree that you have done so knowingly and voluntarily. (b) Attorney Consultation. The Corporation hereby advises you to consult with an attorney before accepting the grant of the Stock Units and these Terms and Conditions. (a) Illinois Residents and Illinois-Based Employees Only: Illinois Freedom to Work Act. Notwithstanding anything in these Terms and Conditions to the contrary, if (i) you are a resident of the State of Illinois or if your primary place of work for your Employer is in the State of Illinois, and (ii) your actual or expected annualized rate of earnings exceeds $75,000 per year (as subject to adjustment pursuant to the Illinois Freedom to Work Act), certain restrictive covenant, forfeiture, or post-employment provisions contained in these Terms and Conditions or any applicable Addendum may be subject to the Illinois Freedom to Work Act. You should be mindful of this potential characterization when considering these Terms and Conditions during the Review Period and consulting with an attorney before accepting the grant of the Stock Units and these Terms and Conditions. 26. Acceptance. By accepting the grant of the Stock Units, you affirmatively and expressly acknowledge that: (a) you have had fourteen (14) days to consider all Terms and Conditions; (b) you have been advised of your right to have your attorney review the Terms and Conditions, and have had an adequate amount of time to discuss it with an attorney of your choosing; (c) you have read the Terms and Conditions, the Award Notice, the Addendum to these Terms and Conditions and the 2017 Plan, and specifically accept and agree to the provisions therein in entirety and understand the meaning and application of each of its provisions; (d) you are accepting these Terms and Conditions voluntarily; and (e) you intend to be bound by these Terms and Conditions. Acceptance will occur as follows: (i) for Participants who are required to accept the Award Notice through the stock plan administrator’s website because their Stock Units will be settled in shares of Common Stock, acceptance will be deemed effective upon the Participant’s electronic acknowledgment or acceptance of the Award Notice; and (ii) for all other Participants whose Stock Units will be settled by a cash payment, the Award Notice will be deemed accepted on the grant date (or such later date as specified by the Corporation) unless the Participant affirmatively declines the Award Notice in accordance with procedures established by the Corporation within the specified acceptance period. You also affirmatively and expressly acknowledge that the Corporation, in its sole discretion, may amend these Terms and Conditions without your consent, either prospectively or retroactively, to the extent that such amendment does not materially impair your rights under the Stock Units, and you agree to be bound by such amendment regardless of whether notice is given to you of such change.
EX-31.1
3
q22026ex311.htm
EX-31.1
Document
Certification of CEO Pursuant to
Section 302 of the Sarbanes-Oxley Act of 2002
I, Michael G. O’Grady, certify that:
1.I have reviewed this report on Form 10-Q for the quarterly period ended June 30, 2026, of Northern Trust Corporation;
2.Based on my knowledge, this report does not contain any untrue statement of a material fact or omit to state a material fact necessary to make the statements made, in light of the circumstances under which such statements were made, not misleading with respect to the period covered by this report;
3.Based on my knowledge, the financial statements, and other financial information included in this report, fairly present in all material respects the financial condition, results of operations and cash flows of the registrant as of, and for, the periods presented in this report;
4.The registrant’s other certifying officer and I are responsible for establishing and maintaining disclosure controls and procedures (as defined in Exchange Act Rules 13a-15(e) and 15d-15(e)) and internal control over financial reporting (as defined in Exchange Act Rules 13a-15(f) and 15d-15(f)) for the registrant and have:
(a)Designed such disclosure controls and procedures, or caused such disclosure controls and procedures to be designed under our supervision, to ensure that material information relating to the registrant, including its consolidated subsidiaries, is made known to us by others within those entities, particularly during the period in which this report is being prepared;
(b)Designed such internal control over financial reporting, or caused such internal control over financial reporting to be designed under our supervision, to provide reasonable assurance regarding the reliability of financial reporting and the preparation of financial statements for external purposes in accordance with generally accepted accounting principles;
(c)Evaluated the effectiveness of the registrant’s disclosure controls and procedures and presented in this report our conclusions about the effectiveness of the disclosure controls and procedures, as of the end of the period covered by this report based on such evaluation; and
(d)Disclosed in this report any change in the registrant’s internal control over financial reporting that occurred during the registrant’s most recent fiscal quarter (the registrant’s fourth fiscal quarter in the case of an annual report) that has materially affected, or is reasonably likely to materially affect, the registrant’s internal control over financial reporting; and
5.The registrant’s other certifying officer and I have disclosed, based on our most recent evaluation of internal control over financial reporting, to the registrant’s auditors and the audit committee of the registrant’s board of directors (or persons performing the equivalent functions):
(a)All significant deficiencies and material weaknesses in the design or operation of internal control over financial reporting which are reasonably likely to adversely affect the registrant’s ability to record, process, summarize and report financial information; and
(b)Any fraud, whether or not material, that involves management or other employees who have a significant role in the registrant’s internal control over financial reporting.
|
|
|
|
|
|
|
|
|
|
|
/s/ Michael G. O'Grady |
| Date: |
July 30, 2026 |
Michael G. O’Grady |
|
|
Chief Executive Officer |
|
|
(Principal Executive Officer) |
EX-31.2
4
q22026ex312.htm
EX-31.2
Document
Certification of CFO Pursuant to
Section 302 of the Sarbanes-Oxley Act of 2002
I, David W. Fox, Jr., certify that:
1.I have reviewed this report on Form 10-Q for the quarterly period ended June 30, 2026, of Northern Trust Corporation;
2.Based on my knowledge, this report does not contain any untrue statement of a material fact or omit to state a material fact necessary to make the statements made, in light of the circumstances under which such statements were made, not misleading with respect to the period covered by this report;
3.Based on my knowledge, the financial statements, and other financial information included in this report, fairly present in all material respects the financial condition, results of operations and cash flows of the registrant as of, and for, the periods presented in this report;
4.The registrant’s other certifying officer and I are responsible for establishing and maintaining disclosure controls and procedures (as defined in Exchange Act Rules 13a-15(e) and 15d-15(e)) and internal control over financial reporting (as defined in Exchange Act Rules 13a-15(f) and 15d-15(f)) for the registrant and have:
(a)Designed such disclosure controls and procedures, or caused such disclosure controls and procedures to be designed under our supervision, to ensure that material information relating to the registrant, including its consolidated subsidiaries, is made known to us by others within those entities, particularly during the period in which this report is being prepared;
(b)Designed such internal control over financial reporting, or caused such internal control over financial reporting to be designed under our supervision, to provide reasonable assurance regarding the reliability of financial reporting and the preparation of financial statements for external purposes in accordance with generally accepted accounting principles;
(c)Evaluated the effectiveness of the registrant’s disclosure controls and procedures and presented in this report our conclusions about the effectiveness of the disclosure controls and procedures, as of the end of the period covered by this report based on such evaluation; and
(d)Disclosed in this report any change in the registrant’s internal control over financial reporting that occurred during the registrant’s most recent fiscal quarter (the registrant’s fourth fiscal quarter in the case of an annual report) that has materially affected, or is reasonably likely to materially affect, the registrant’s internal control over financial reporting; and
5.The registrant’s other certifying officer and I have disclosed, based on our most recent evaluation of internal control over financial reporting, to the registrant’s auditors and the audit committee of the registrant’s board of directors (or persons performing the equivalent functions):
(a)All significant deficiencies and material weaknesses in the design or operation of internal control over financial reporting which are reasonably likely to adversely affect the registrant’s ability to record, process, summarize and report financial information; and
(b)Any fraud, whether or not material, that involves management or other employees who have a significant role in the registrant’s internal control over financial reporting.
|
|
|
|
|
|
|
|
|
|
|
/s/ David W. Fox, Jr. |
| Date: |
July 30, 2026 |
David W. Fox, Jr. |
|
|
Chief Financial Officer |
|
|
(Principal Financial Officer) |
EX-32
5
q22026ex32.htm
EX-32
Document
Certifications of CEO and CFO Pursuant to
18 U.S.C. Section 1350, as Adopted Pursuant to
Section 906 of the Sarbanes-Oxley Act of 2002
In connection with the Quarterly Report of Northern Trust Corporation (the “Corporation”) on Form 10-Q for the period ended June 30, 2026, as filed with the Securities and Exchange Commission on the date hereof (the “Report”), Michael G. O’Grady, as Chief Executive Officer of the Corporation, and David W. Fox, Jr., as Chief Financial Officer of the Corporation, each hereby certifies, pursuant to 18 U.S.C. section 1350, as adopted pursuant to section 906 of the Sarbanes-Oxley Act of 2002, to the best of his knowledge, that:
(1) The Report fully complies with the requirements of section 13(a) or 15(d) of the Securities Exchange Act of 1934; and
(2) The information contained in the Report fairly presents, in all material respects, the financial condition and results of operations of the Corporation.
|
|
|
| /s/ Michael G. O'Grady |
| Michael G. O’Grady |
| Chief Executive Officer |
| (Principal Executive Officer) |
Date: July 30, 2026 |
|
|
|
| /s/ David W. Fox, Jr. |
| David W. Fox, Jr. |
| Chief Financial Officer |
| (Principal Financial Officer) |
Date: July 30, 2026 |
This certification accompanies the Report pursuant to section 906 of the Sarbanes-Oxley Act of 2002 and shall not be deemed filed by Northern Trust Corporation for purposes of section 18 of the Securities Exchange Act of 1934, as amended.
 エドガーで原本を確認する