| Delaware | 001-02979 | No. | 41-0449260 | ||||||||||||||
| (State or Other Jurisdiction of Incorporation) |
(Commission File Number) |
(IRS Employer Identification No.) |
|||||||||||||||
Title of Each Class |
Trading Symbol |
Name of Each Exchange on Which Registered |
||||||
Common Stock, par value $1-2/3 |
WFC |
New York Stock
Exchange
(NYSE)
|
||||||
7.5% Non-Cumulative Perpetual Convertible Class A Preferred Stock, Series L |
WFC.PRL |
NYSE |
||||||
Depositary Shares, each representing a 1/1000th interest in a share of Non-Cumulative Perpetual Class A Preferred Stock, Series Y |
WFC.PRY |
NYSE |
||||||
Depositary Shares, each representing a 1/1000th interest in a share of Non-Cumulative Perpetual Class A Preferred Stock, Series Z |
WFC.PRZ |
NYSE |
||||||
Depositary Shares, each representing a 1/1000th interest in a share of Non-Cumulative Perpetual Class A Preferred Stock, Series AA |
WFC.PRA |
NYSE |
||||||
| Depositary Shares, each representing a 1/1000th interest in a share of Non-Cumulative Perpetual Class A Preferred Stock, Series CC | WFC.PRC |
NYSE |
||||||
| Depositary Shares, each representing a 1/1000th interest in a share of Non-Cumulative Perpetual Class A Preferred Stock, Series DD | WFC.PRD |
NYSE |
||||||
Guarantee of Medium-Term Notes, Series A, due October 30, 2028 of Wells Fargo Finance LLC |
WFC/28A |
NYSE |
||||||
| Exhibit No. | Description | Location | ||||||
| Filed herewith | ||||||||
| Filed herewith | ||||||||
Furnished herewith |
||||||||
| 104 | Cover Page Interactive Data File | Embedded within the Inline XBRL document |
||||||
| Dated: | July 12, 2024 | WELLS FARGO & COMPANY | |||||||||
| By: | /s/ MUNEERA S. CARR | ||||||||||
| Muneera S. Carr | |||||||||||
|
Executive Vice President,
Chief Accounting Officer and Controller
|
|||||||||||
 |
News Release | July 12, 2024
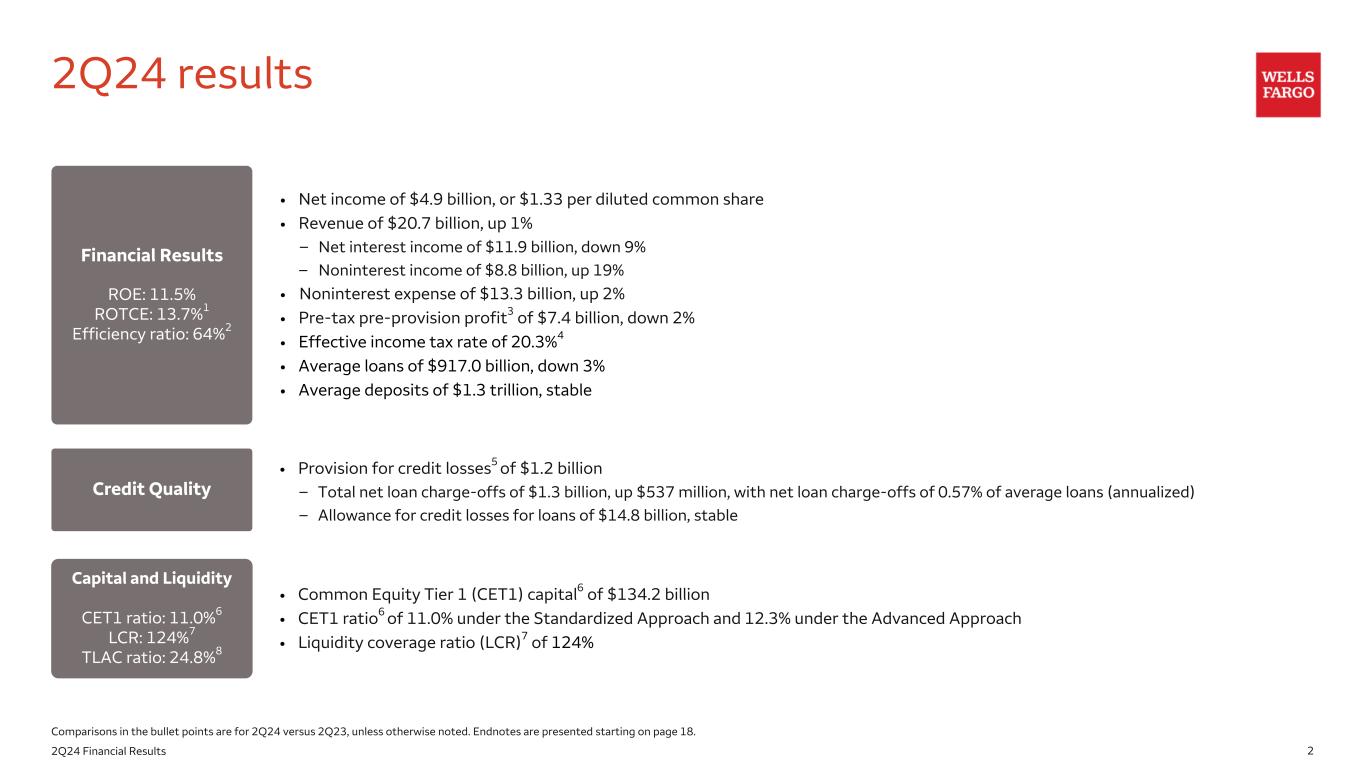
Wells Fargo Reports Second Quarter 2024 Net Income of $4.9 billion, or $1.33 per Diluted Share
|
||||
Company-wide Financial Summary |
||||||||||||||
| Quarter ended | ||||||||||||||
| Jun 30, 2024 |
Jun 30, 2023 |
|||||||||||||
|
Selected Income Statement Data
($ in millions except per share amounts)
|
||||||||||||||
| Total revenue | $ | 20,689 | 20,533 | |||||||||||
| Noninterest expense | 13,293 | 12,987 | ||||||||||||
Provision for credit losses1 |
1,236 | 1,713 | ||||||||||||
| Net income | 4,910 | 4,938 | ||||||||||||
| Diluted earnings per common share | 1.33 | 1.25 | ||||||||||||
|
Selected Balance Sheet Data
($ in billions)
|
||||||||||||||
| Average loans | $ | 917.0 | 945.9 | |||||||||||
| Average deposits | 1,346.5 | 1,347.4 | ||||||||||||
CET12 |
11.0 | % | 10.7 | |||||||||||
| Performance Metrics | ||||||||||||||
| ROE3 | 11.5 | % | 11.4 | |||||||||||
ROTCE4 |
13.7 | 13.7 | ||||||||||||
Operating Segments and Other Highlights | |||||||||||||||||||||||
| Quarter ended | Jun 30, 2024 % Change from |
||||||||||||||||||||||
| ($ in billions) | Jun 30, 2024 |
Mar 31, 2024 |
Jun 30, 2023 |
||||||||||||||||||||
| Average loans | |||||||||||||||||||||||
| Consumer Banking and Lending | $ | 325.9 | (1) | % | (3) | ||||||||||||||||||
| Commercial Banking | 224.4 | — | (1) | ||||||||||||||||||||
| Corporate and Investment Banking | 275.8 | (3) | (5) | ||||||||||||||||||||
| Wealth and Investment Management | 83.2 | 1 | — | ||||||||||||||||||||
| Average deposits | |||||||||||||||||||||||
| Consumer Banking and Lending | 778.2 | 1 | (5) | ||||||||||||||||||||
| Commercial Banking | 166.9 | 2 | — | ||||||||||||||||||||
| Corporate and Investment Banking | 187.5 | 2 | 17 | ||||||||||||||||||||
| Wealth and Investment Management | 102.8 | 1 | (8) | ||||||||||||||||||||
|
Chief Executive Officer Charlie Scharf commented, “Our efforts to transform Wells Fargo were reflected in our second quarter financial performance as diluted earnings per common share grew from both the first quarter and a year ago. We continued to see growth in our fee-based revenue offsetting an expected decline in net interest income. The investments we have been making allowed us to take advantage of the market activity in the quarter with strong performance in investment advisory, trading, and investment banking fees. Credit performance was consistent with our expectations, commercial loan demand remained tepid, we saw growth in deposit balances in all of our businesses, and the pace of customers reallocating cash into higher yielding alternatives slowed.”
“Our capital position remains strong and we continue to use it to support our customers while also prudently returning excess capital to our shareholders. We repurchased over $12 billion of common stock during the first half of this year and as we previously announced, we expect to increase our third quarter common stock dividend by 14%, subject to approval by the Company’s Board of Directors at its regularly scheduled meeting later this month.” Scharf added.
“Our risk and control work remains our top priority, and we are also continuing to execute on our strategy to better serve our customers and drive higher returns over time. In the second quarter we launched two new credit cards, a small business card and a consumer card. We have now launched nine new cards since 2021, driving strong credit card spend and account growth. We are investing in our branch network to improve the customer experience including refurbishing branches and enhancing technology. In our commercial businesses we are investing in talent and technology to capture the opportunity inherent in our franchise including hiring a new Co-CEO of Corporate and Investment Banking. I’m proud of the progress we’ve made due to the commitment of everyone who works at Wells Fargo and am excited about the opportunities ahead,” Scharf concluded.
| ||
| Quarter ended | Jun 30, 2024 % Change from |
|||||||||||||||||||||||||||||||
| Jun 30, 2024 |
Mar 31, 2024 |
Jun 30, 2023 |
Mar 31, 2024 |
Jun 30, 2023 |
||||||||||||||||||||||||||||
| Earnings ($ in millions except per share amounts) | ||||||||||||||||||||||||||||||||
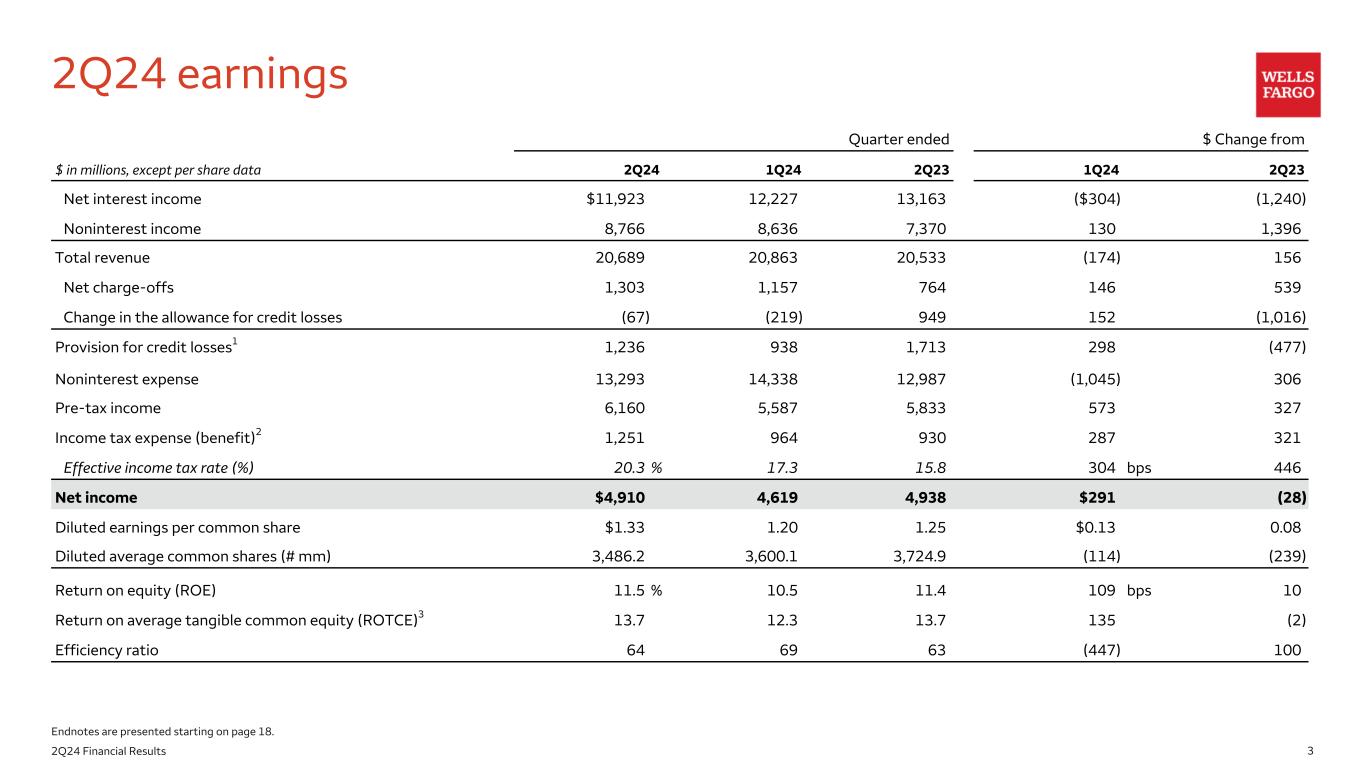
| Net interest income | $ | 11,923 | 12,227 | 13,163 | (2) | % | (9) | |||||||||||||||||||||||||
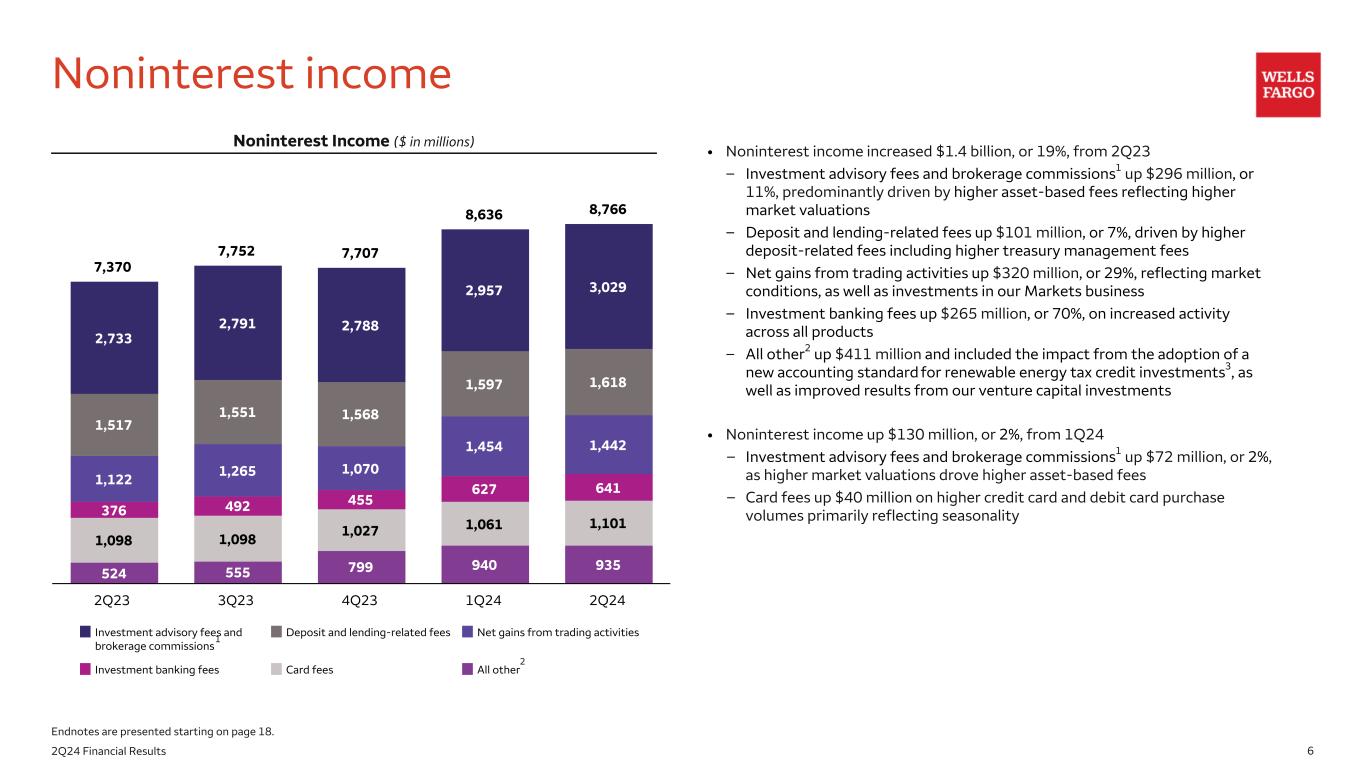
| Noninterest income | 8,766 | 8,636 | 7,370 | 2 | 19 | |||||||||||||||||||||||||||
| Total revenue | 20,689 | 20,863 | 20,533 | (1) | 1 | |||||||||||||||||||||||||||
| Net charge-offs | 1,303 | 1,157 | 764 | 13 | 71 | |||||||||||||||||||||||||||
| Change in the allowance for credit losses | (67) | (219) | 949 | 69 | NM | |||||||||||||||||||||||||||
Provision for credit losses1 |
1,236 | 938 | 1,713 | 32 | (28) | |||||||||||||||||||||||||||
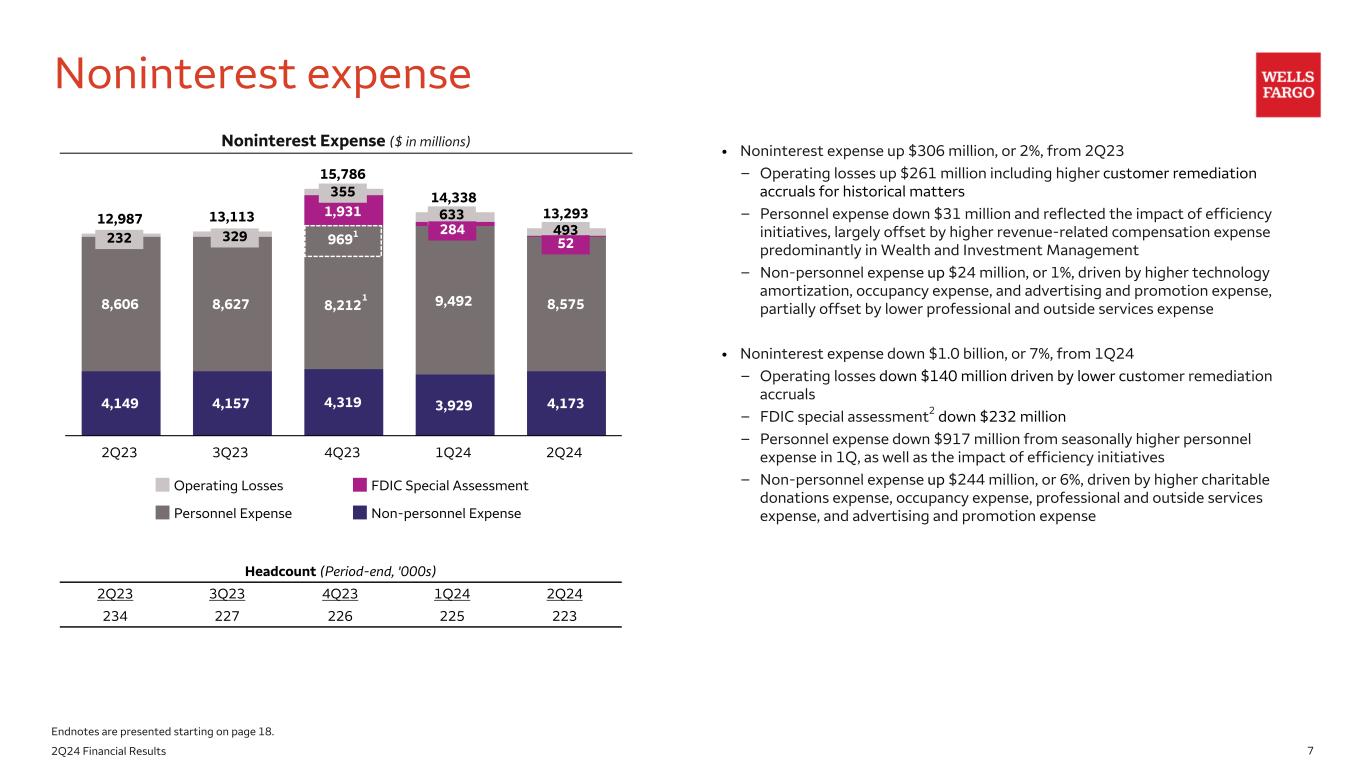
| Noninterest expense | 13,293 | 14,338 | 12,987 | (7) | 2 | |||||||||||||||||||||||||||
| Income tax expense | 1,251 | 964 | 930 | 30 | 35 | |||||||||||||||||||||||||||
| Wells Fargo net income | $ | 4,910 | 4,619 | 4,938 | 6 | (1) | ||||||||||||||||||||||||||
| Diluted earnings per common share | 1.33 | 1.20 | 1.25 | 11 | 6 | |||||||||||||||||||||||||||
| Balance Sheet Data (average) ($ in billions) | ||||||||||||||||||||||||||||||||
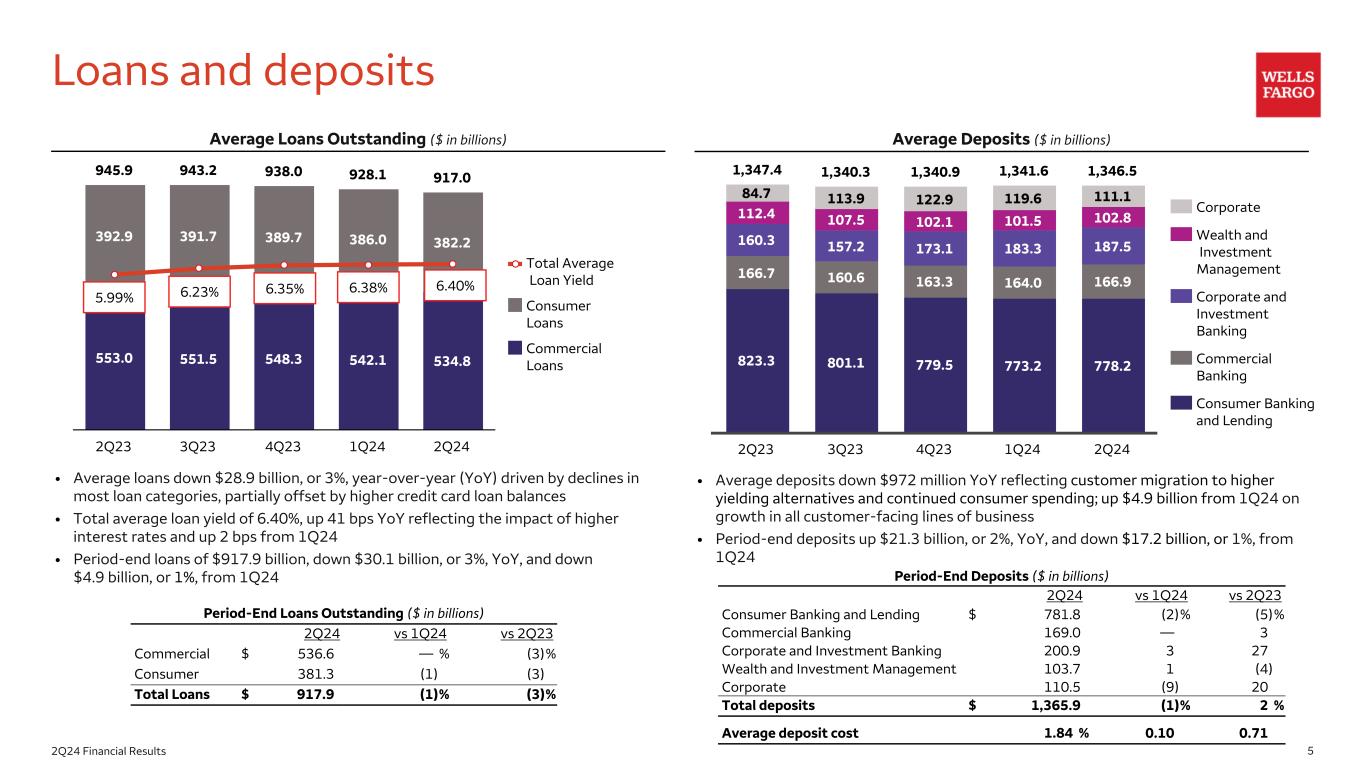
| Loans | $ | 917.0 | 928.1 | 945.9 | (1) | (3) | ||||||||||||||||||||||||||
| Deposits | 1,346.5 | 1,341.6 | 1,347.4 | — | — | |||||||||||||||||||||||||||
| Assets | 1,914.6 | 1,917.0 | 1,878.3 | — | 2 | |||||||||||||||||||||||||||
Financial Ratios |
||||||||||||||||||||||||||||||||
| Return on assets (ROA) | 1.03 | % | 0.97 | 1.05 | ||||||||||||||||||||||||||||
| Return on equity (ROE) | 11.5 | 10.5 | 11.4 | |||||||||||||||||||||||||||||
Return on average tangible common equity (ROTCE)2 |
13.7 | 12.3 | 13.7 | |||||||||||||||||||||||||||||
Efficiency ratio3 |
64 | 69 | 63 | |||||||||||||||||||||||||||||
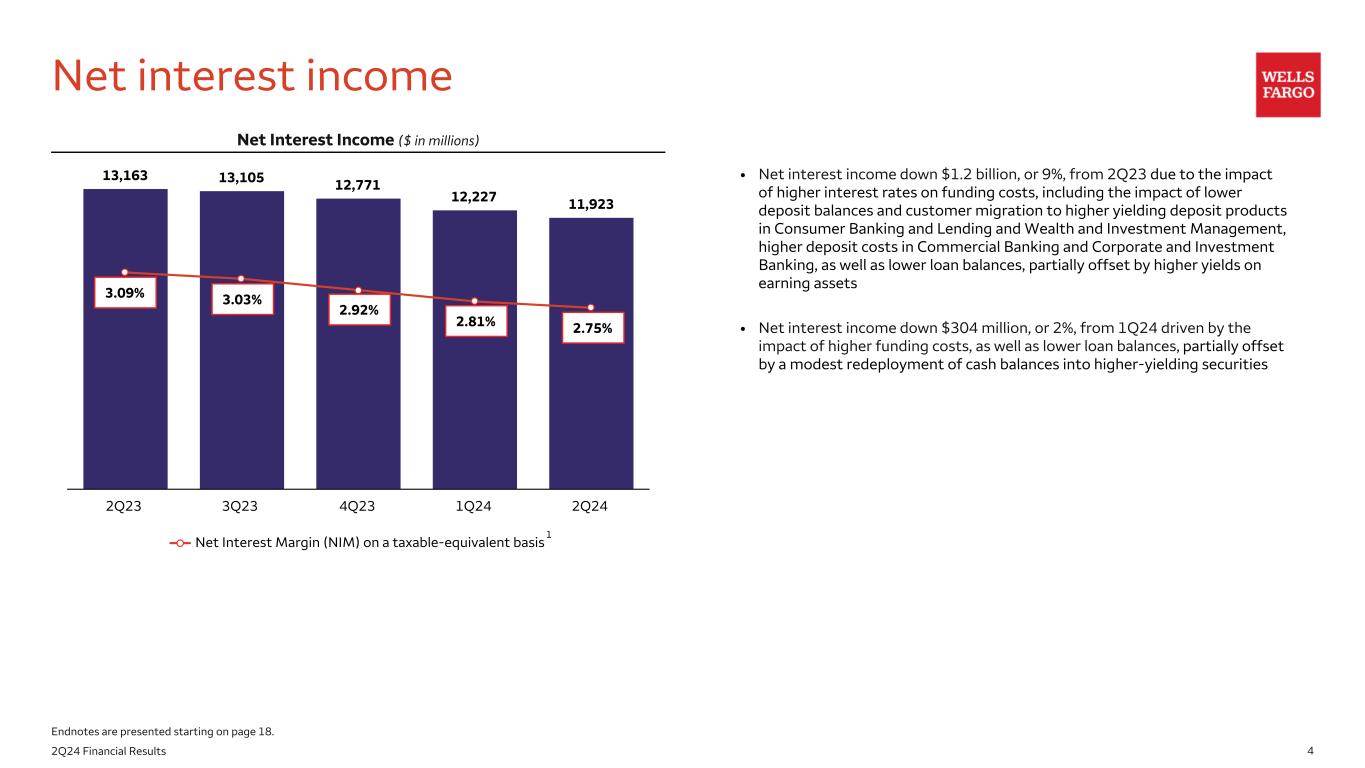
| Net interest margin on a taxable-equivalent basis | 2.75 | 2.81 | 3.09 | |||||||||||||||||||||||||||||
| Quarter ended | ||||||||||||||||||||
| ($ in billions) | Jun 30, 2024 |
Mar 31, 2024 |
Jun 30, 2023 |
|||||||||||||||||
| Capital: | ||||||||||||||||||||
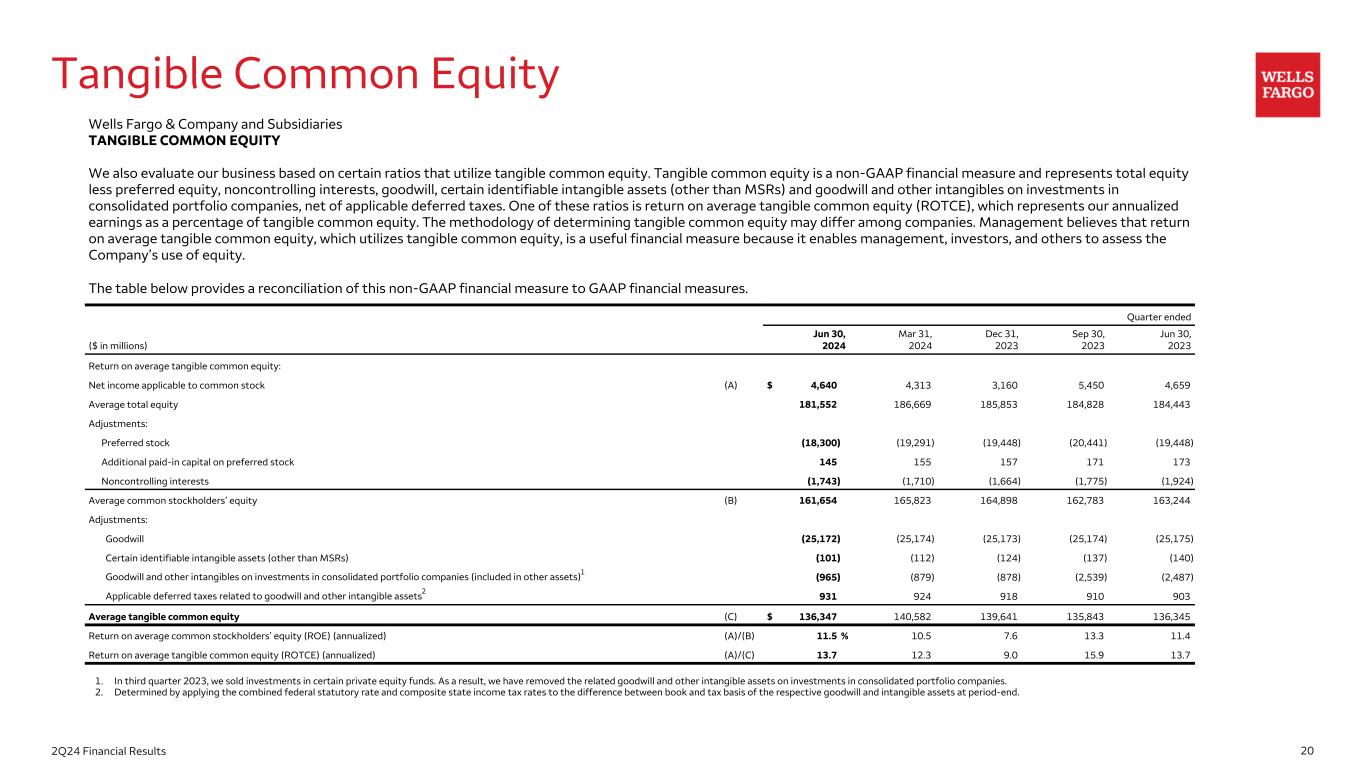
| Total equity | $ | 178.1 | 182.7 | 182.0 | ||||||||||||||||
| Common stockholders’ equity | 160.0 | 162.5 | 160.9 | |||||||||||||||||
Tangible common equity1 |
134.7 | 137.2 | 134.0 | |||||||||||||||||
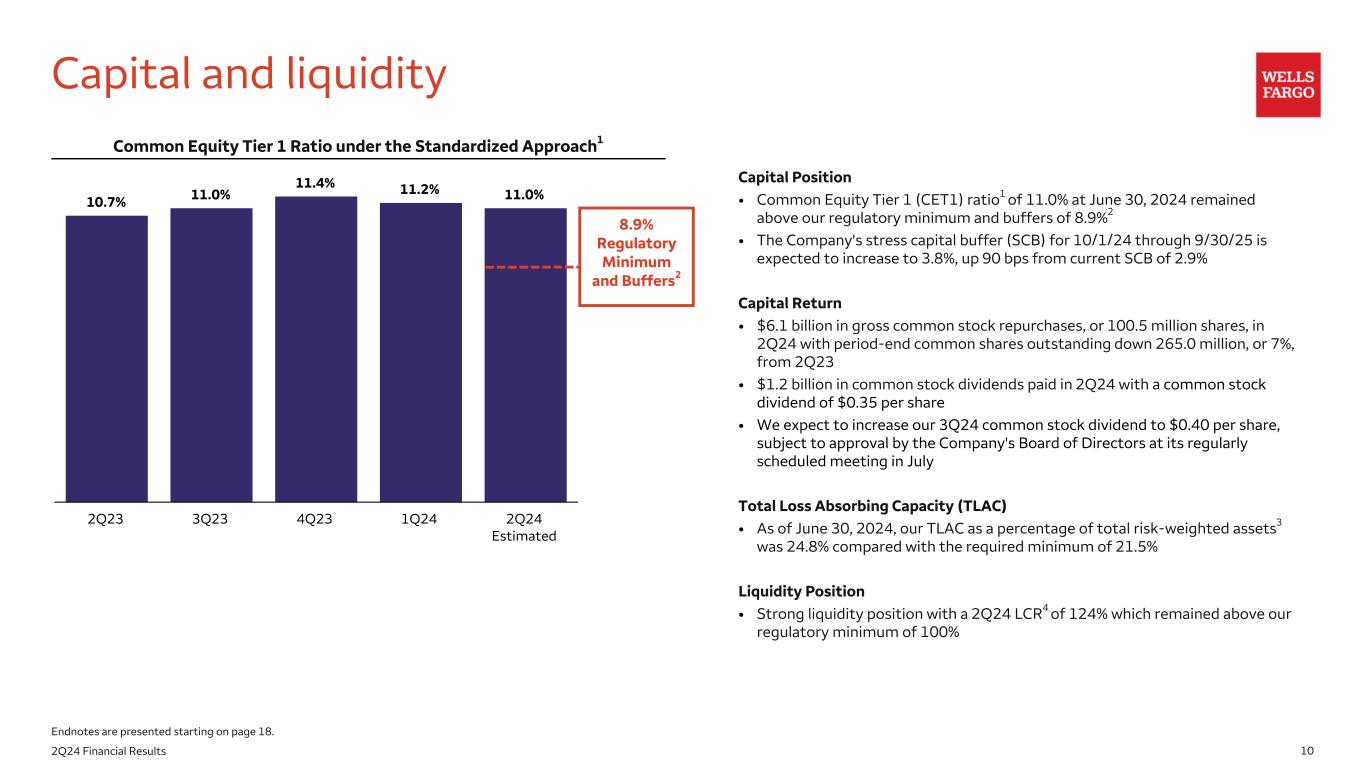
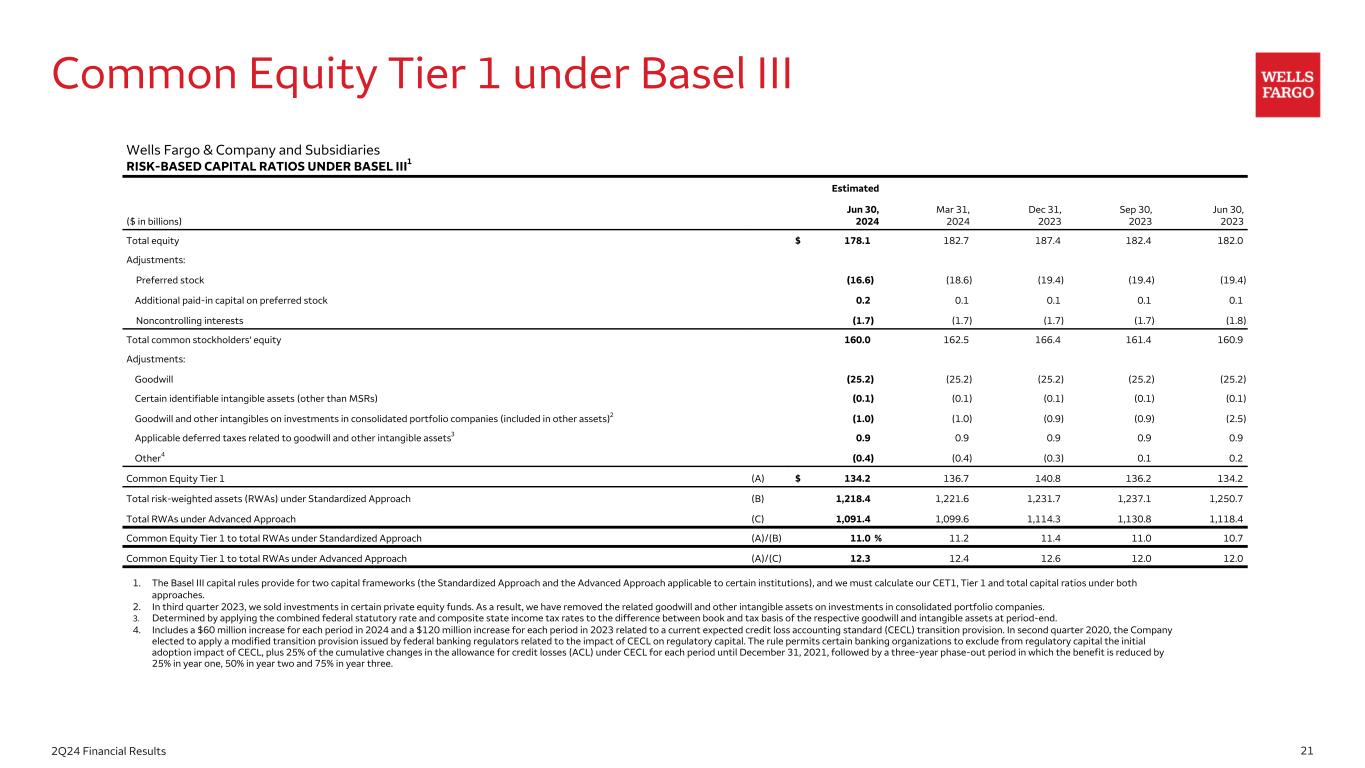
Common Equity Tier 1 (CET1) ratio2 |
11.0 | % | 11.2 | 10.7 | ||||||||||||||||
Total loss absorbing capacity (TLAC) ratio3 |
24.8 | 25.1 | 23.1 | |||||||||||||||||
Supplementary Leverage Ratio (SLR)4 |
6.7 | 6.9 | 6.9 | |||||||||||||||||
| Liquidity: | ||||||||||||||||||||
Liquidity Coverage Ratio (LCR)5 |
124 | % | 126 | 123 | ||||||||||||||||
| Quarter ended | ||||||||||||||||||||
| ($ in millions) | Jun 30, 2024 |
Mar 31, 2024 |
Jun 30, 2023 |
|||||||||||||||||
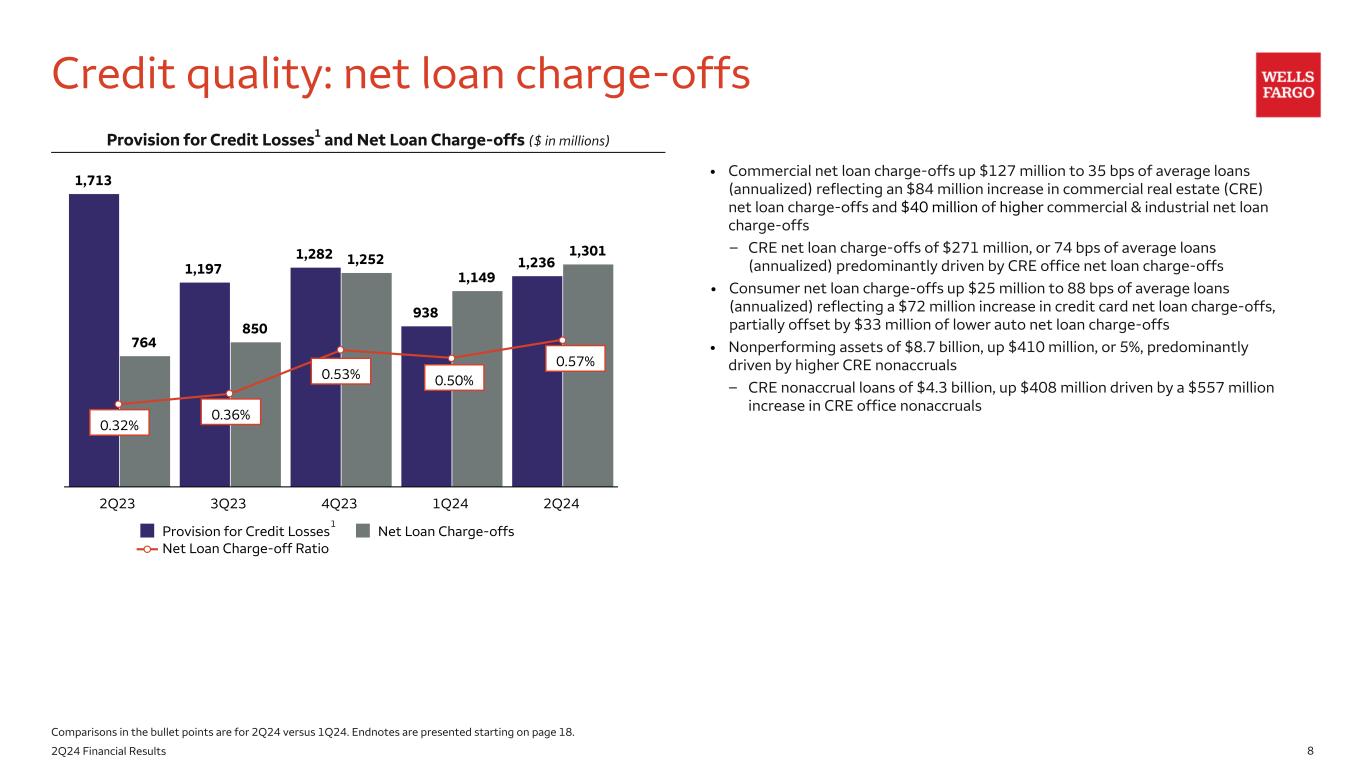
| Net loan charge-offs | $ | 1,301 | 1,149 | 764 | ||||||||||||||||
| Net loan charge-offs as a % of average total loans (annualized) | 0.57 | % | 0.50 | 0.32 | ||||||||||||||||
| Total nonaccrual loans | $ | 8,434 | 8,075 | 6,886 | ||||||||||||||||
| As a % of total loans | 0.92 | % | 0.88 | 0.73 | ||||||||||||||||
| Total nonperforming assets | $ | 8,650 | 8,240 | 7,019 | ||||||||||||||||
| As a % of total loans | 0.94 | % | 0.89 | 0.74 | ||||||||||||||||
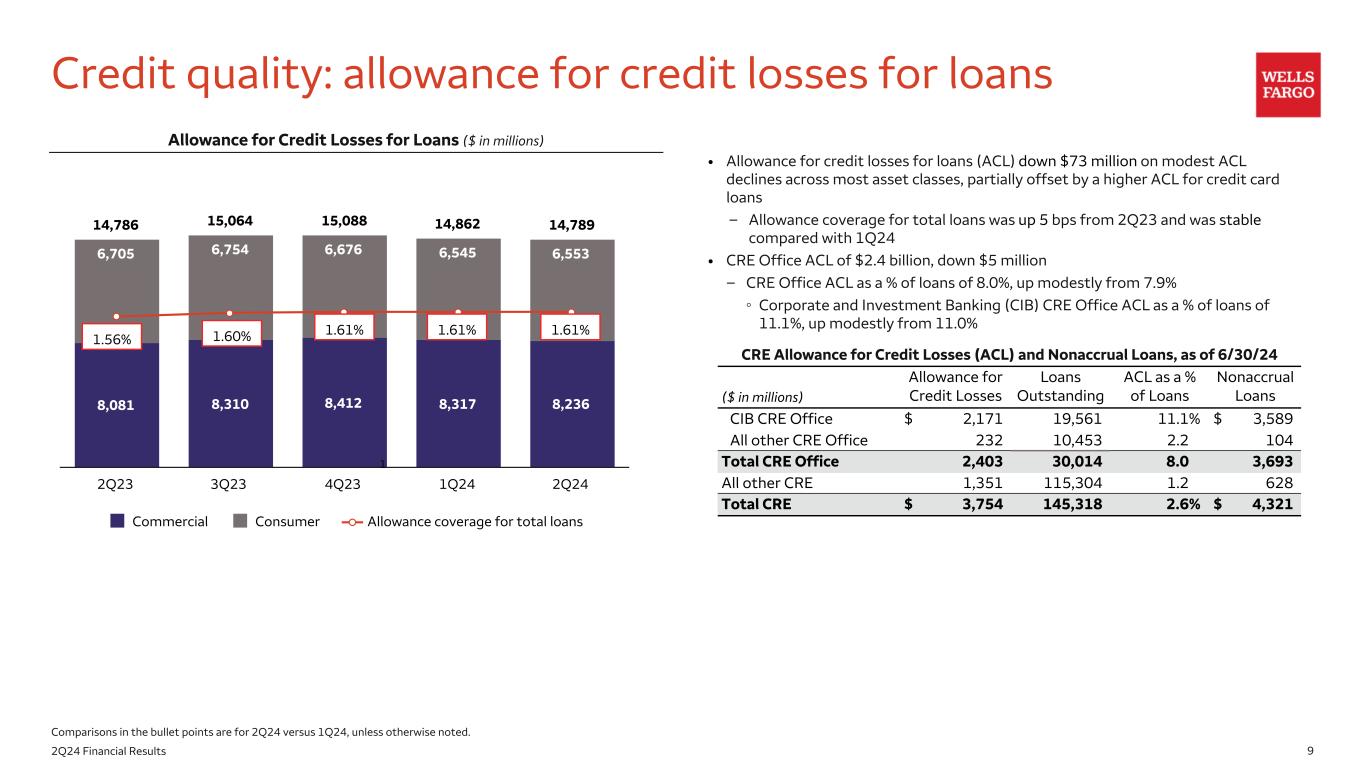
| Allowance for credit losses for loans | $ | 14,789 | 14,862 | 14,786 | ||||||||||||||||
| As a % of total loans | 1.61 | % | 1.61 | 1.56 | ||||||||||||||||
| Quarter ended | Jun 30, 2024 % Change from |
||||||||||||||||||||||||||||||||||
| Jun 30, 2024 |
Mar 31, 2024 |
Jun 30, 2023 |
Mar 31, 2024 |
Jun 30, 2023 |
|||||||||||||||||||||||||||||||
| Earnings (in millions) | |||||||||||||||||||||||||||||||||||
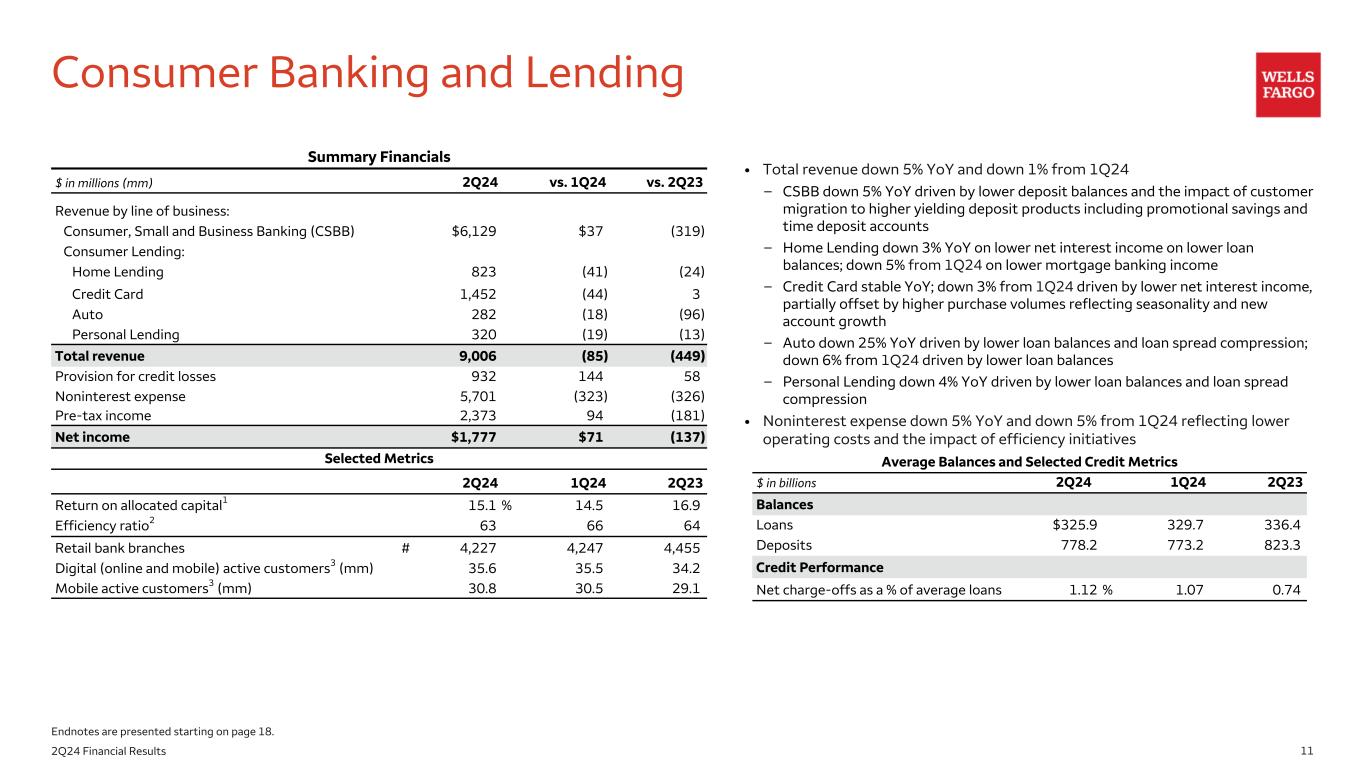
Consumer, Small and Business Banking |
$ | 6,129 | 6,092 | 6,448 | 1 | % | (5) | ||||||||||||||||||||||||||||
| Consumer Lending: | |||||||||||||||||||||||||||||||||||
| Home Lending | 823 | 864 | 847 | (5) | (3) | ||||||||||||||||||||||||||||||
Credit Card |
1,452 | 1,496 | 1,449 | (3) | — | ||||||||||||||||||||||||||||||
| Auto | 282 | 300 | 378 | (6) | (25) | ||||||||||||||||||||||||||||||
| Personal Lending | 320 | 339 | 333 | (6) | (4) | ||||||||||||||||||||||||||||||
| Total revenue | 9,006 | 9,091 | 9,455 | (1) | (5) | ||||||||||||||||||||||||||||||
| Provision for credit losses | 932 | 788 | 874 | 18 | 7 | ||||||||||||||||||||||||||||||
| Noninterest expense | 5,701 | 6,024 | 6,027 | (5) | (5) | ||||||||||||||||||||||||||||||
| Net income | $ | 1,777 | 1,706 | 1,914 | 4 | (7) | |||||||||||||||||||||||||||||
| Average balances (in billions) | |||||||||||||||||||||||||||||||||||
| Loans | $ | 325.9 | 329.7 | 336.4 | (1) | (3) | |||||||||||||||||||||||||||||
| Deposits | 778.2 | 773.2 | 823.3 | 1 | (5) | ||||||||||||||||||||||||||||||
| Quarter ended | Jun 30, 2024 % Change from |
||||||||||||||||||||||||||||||||||
| Jun 30, 2024 |
Mar 31, 2024 |
Jun 30, 2023 |
Mar 31, 2024 |
Jun 30, 2023 |
|||||||||||||||||||||||||||||||
| Earnings (in millions) | |||||||||||||||||||||||||||||||||||
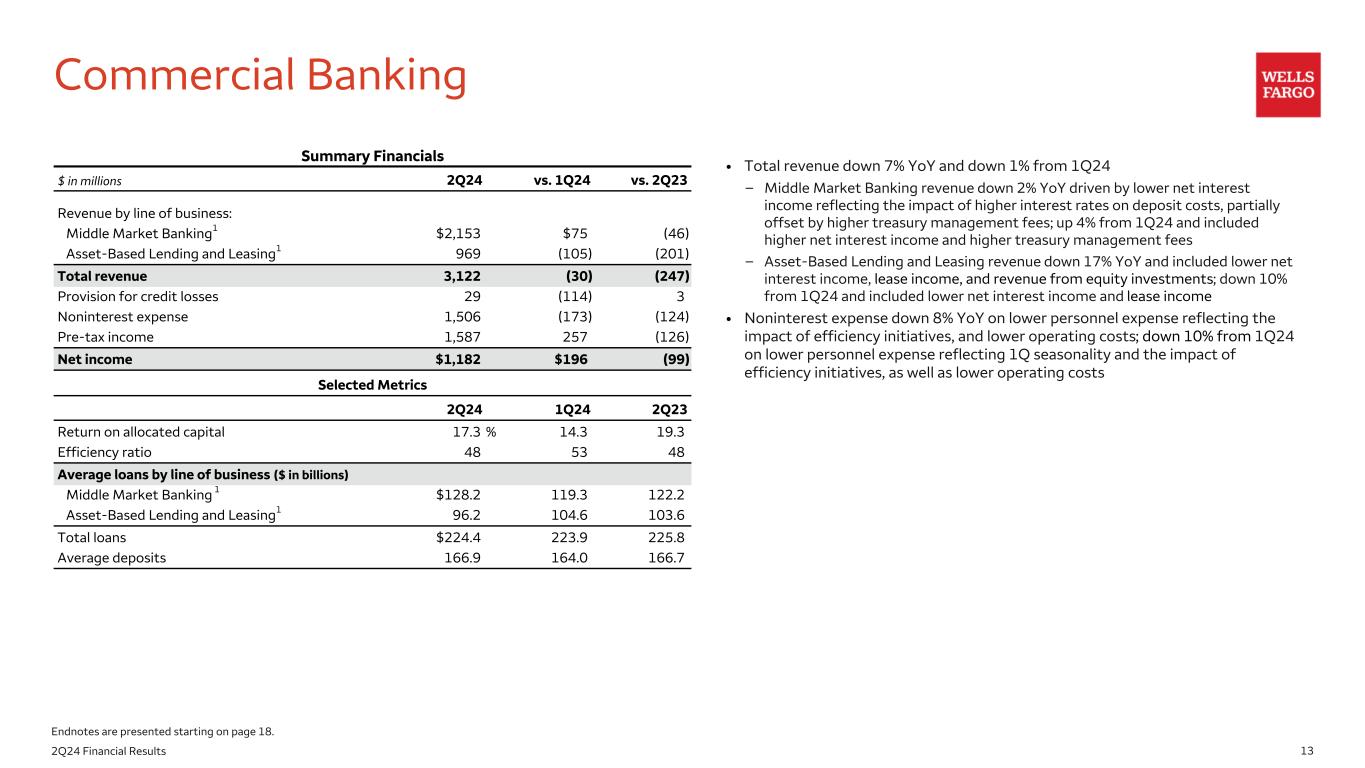
Middle Market Banking1 |
$ | 2,153 | 2,078 | 2,199 | 4 | % | (2) | ||||||||||||||||||||||||||||
Asset-Based Lending and Leasing1 |
969 | 1,074 | 1,170 | (10) | (17) | ||||||||||||||||||||||||||||||
| Total revenue | 3,122 | 3,152 | 3,369 | (1) | (7) | ||||||||||||||||||||||||||||||
| Provision for credit losses | 29 | 143 | 26 | (80) | 12 | ||||||||||||||||||||||||||||||
| Noninterest expense | 1,506 | 1,679 | 1,630 | (10) | (8) | ||||||||||||||||||||||||||||||
| Net income | $ | 1,182 | 986 | 1,281 | 20 | (8) | |||||||||||||||||||||||||||||
| Average balances (in billions) | |||||||||||||||||||||||||||||||||||
| Loans | $ | 224.4 | 223.9 | 225.8 | — | (1) | |||||||||||||||||||||||||||||
| Deposits | 166.9 | 164.0 | 166.7 | 2 | — | ||||||||||||||||||||||||||||||
| Quarter ended | Jun 30, 2024 % Change from |
||||||||||||||||||||||||||||||||||
| Jun 30, 2024 |
Mar 31, 2024 |
Jun 30, 2023 |
Mar 31, 2024 |
Jun 30, 2023 |
|||||||||||||||||||||||||||||||
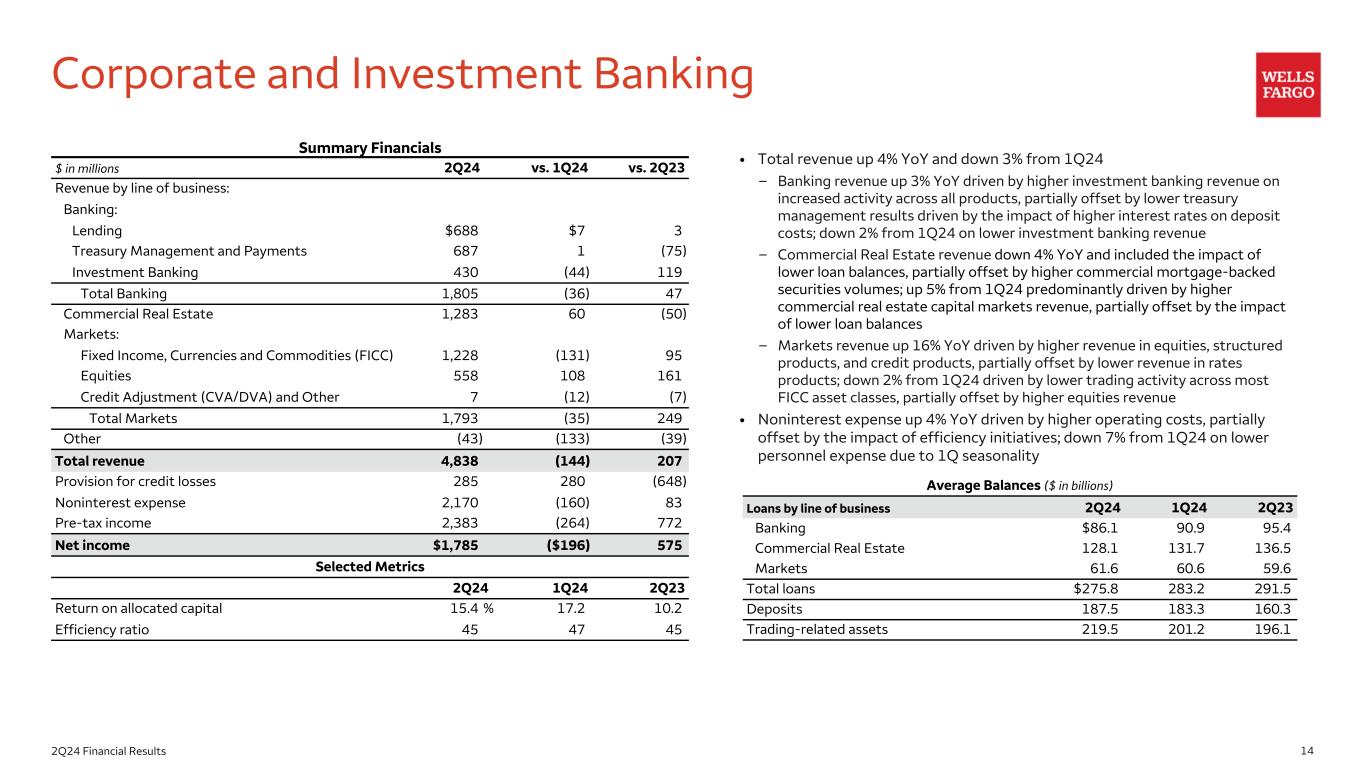
| Earnings (in millions) | |||||||||||||||||||||||||||||||||||
| Banking: | |||||||||||||||||||||||||||||||||||
| Lending | $ | 688 | 681 | 685 | 1 | % | — | ||||||||||||||||||||||||||||
| Treasury Management and Payments | 687 | 686 | 762 | — | (10) | ||||||||||||||||||||||||||||||
| Investment Banking | 430 | 474 | 311 | (9) | 38 | ||||||||||||||||||||||||||||||
| Total Banking | 1,805 | 1,841 | 1,758 | (2) | 3 | ||||||||||||||||||||||||||||||
| Commercial Real Estate | 1,283 | 1,223 | 1,333 | 5 | (4) | ||||||||||||||||||||||||||||||
| Markets: | |||||||||||||||||||||||||||||||||||
| Fixed Income, Currencies, and Commodities (FICC) | 1,228 | 1,359 | 1,133 | (10) | 8 | ||||||||||||||||||||||||||||||
| Equities | 558 | 450 | 397 | 24 | 41 | ||||||||||||||||||||||||||||||
| Credit Adjustment (CVA/DVA) and Other | 7 | 19 | 14 | (63) | (50) | ||||||||||||||||||||||||||||||
| Total Markets | 1,793 | 1,828 | 1,544 | (2) | 16 | ||||||||||||||||||||||||||||||
| Other | (43) | 90 | (4) | NM | NM | ||||||||||||||||||||||||||||||
| Total revenue | 4,838 | 4,982 | 4,631 | (3) | 4 | ||||||||||||||||||||||||||||||
| Provision for credit losses | 285 | 5 | 933 | NM | (69) | ||||||||||||||||||||||||||||||
| Noninterest expense | 2,170 | 2,330 | 2,087 | (7) | 4 | ||||||||||||||||||||||||||||||
| Net income | $ | 1,785 | 1,981 | 1,210 | (10) | 48 | |||||||||||||||||||||||||||||
| Average balances (in billions) | |||||||||||||||||||||||||||||||||||
| Loans | $ | 275.8 | 283.2 | 291.5 | (3) | (5) | |||||||||||||||||||||||||||||
| Deposits | 187.5 | 183.3 | 160.3 | 2 | 17 | ||||||||||||||||||||||||||||||
| Quarter ended | Jun 30, 2024 % Change from |
|||||||||||||||||||||||||||||||
| Jun 30, 2024 |
Mar 31, 2024 |
Jun 30, 2023 |
Mar 31, 2024 |
Jun 30, 2023 |
||||||||||||||||||||||||||||
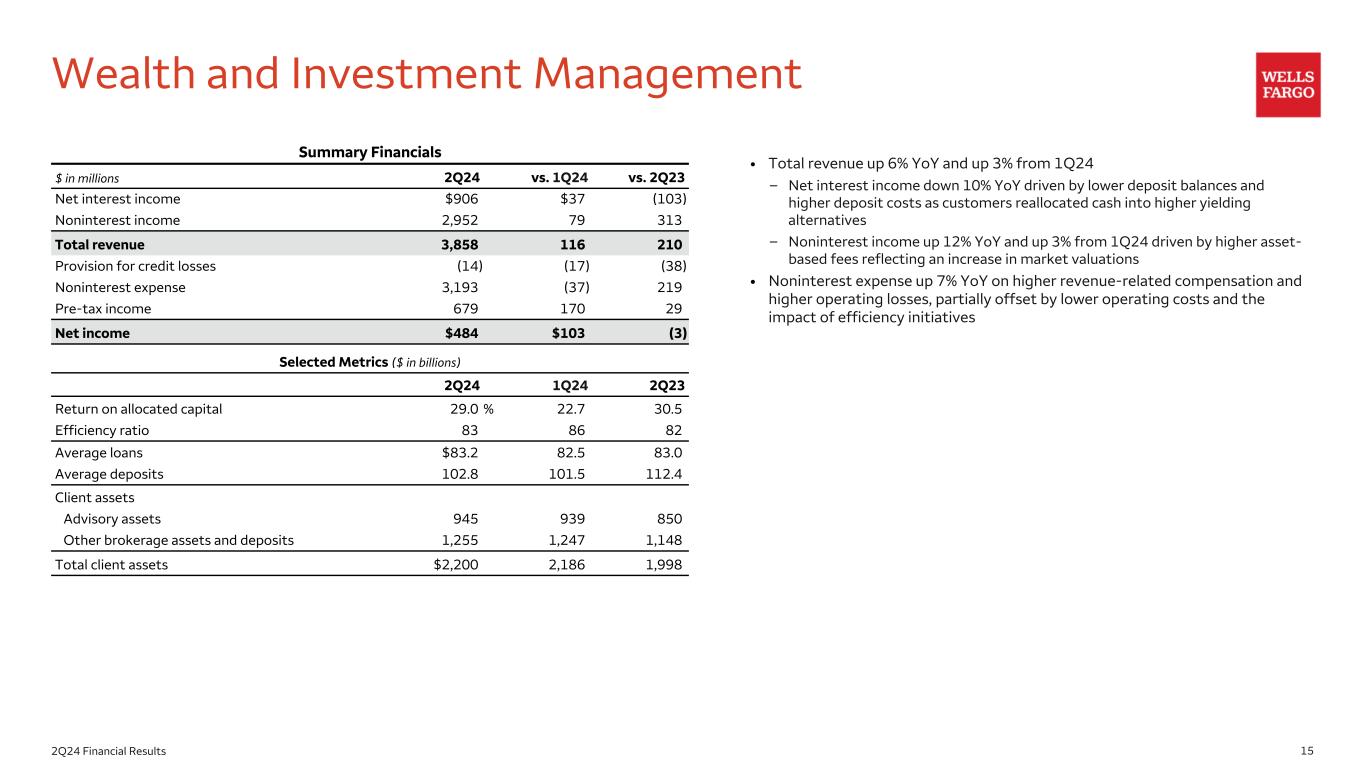
| Earnings (in millions) | ||||||||||||||||||||||||||||||||
| Net interest income | $ | 906 | 869 | 1,009 | 4 | % | (10) | |||||||||||||||||||||||||
| Noninterest income | 2,952 | 2,873 | 2,639 | 3 | 12 | |||||||||||||||||||||||||||
| Total revenue | 3,858 | 3,742 | 3,648 | 3 | 6 | |||||||||||||||||||||||||||
| Provision for credit losses | (14) | 3 | 24 | NM | NM | |||||||||||||||||||||||||||
| Noninterest expense | 3,193 | 3,230 | 2,974 | (1) | 7 | |||||||||||||||||||||||||||
| Net income | $ | 484 | 381 | 487 | 27 | (1) | ||||||||||||||||||||||||||
| Total client assets (in billions) | 2,200 | 2,186 | 1,998 | 1 | 10 | |||||||||||||||||||||||||||
| Average balances (in billions) | ||||||||||||||||||||||||||||||||
| Loans | $ | 83.2 | 82.5 | 83.0 | 1 | — | ||||||||||||||||||||||||||
| Deposits | 102.8 | 101.5 | 112.4 | 1 | (8) | |||||||||||||||||||||||||||
| Quarter ended | Jun 30, 2024 % Change from |
|||||||||||||||||||||||||||||||
| Jun 30, 2024 |
Mar 31, 2024 |
Jun 30, 2023 |
Mar 31, 2024 |
Jun 30, 2023 |
||||||||||||||||||||||||||||
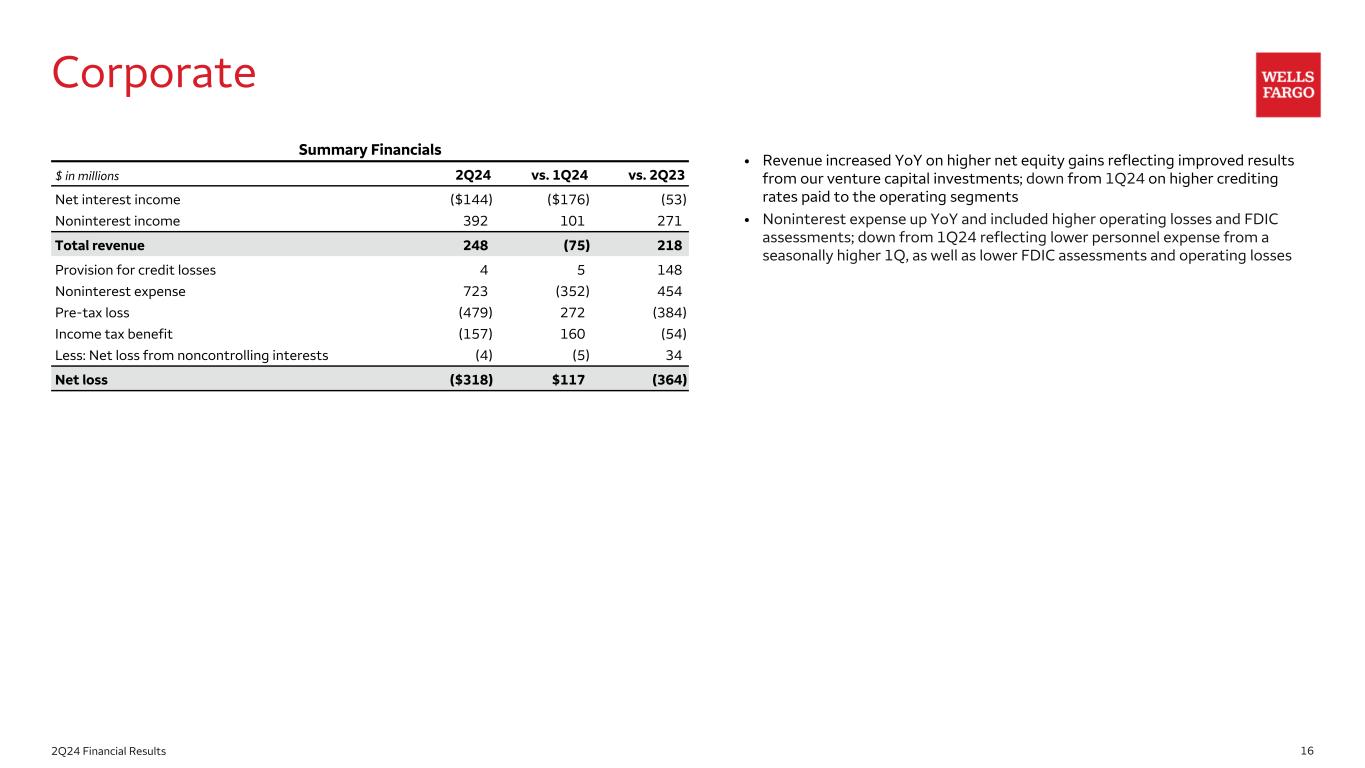
| Earnings (in millions) | ||||||||||||||||||||||||||||||||
| Net interest income | $ | (144) | 32 | (91) | NM | (58) | ||||||||||||||||||||||||||
| Noninterest income | 392 | 291 | 121 | 35 | % | 224 | ||||||||||||||||||||||||||
| Total revenue | 248 | 323 | 30 | (23) | 727 | |||||||||||||||||||||||||||
| Provision for credit losses | 4 | (1) | (144) | 500 | 103 | |||||||||||||||||||||||||||
| Noninterest expense | 723 | 1,075 | 269 | (33) | 169 | |||||||||||||||||||||||||||
Net income (loss) |
$ | (318) | (435) | 46 | 27 | NM | ||||||||||||||||||||||||||
 | ||
Page |
|||||
| Consolidated Results | |||||
| Average Balances and Interest Rates (Taxable-Equivalent Basis) | |||||
| Reportable Operating Segment Results | |||||
Combined Segment Results
|
|||||
| Consumer Banking and Lending | |||||
| Commercial Banking | |||||
| Corporate and Investment Banking | |||||
| Wealth and Investment Management | |||||
| Corporate | |||||
| Credit-Related Information | |||||
Consolidated Loans Outstanding – Period-End Balances, Average Balances, and Average Interest Rates |
|||||
| Net Loan Charge-offs | |||||
| Changes in Allowance for Credit Losses for Loans | |||||
| Allocation of the Allowance for Credit Losses for Loans | |||||
Nonperforming Assets (Nonaccrual Loans and Foreclosed Assets) |
|||||
| Commercial and Industrial Loans and Lease Financing by Industry | |||||
| Commercial Real Estate Loans by Property Type | |||||
| Equity | |||||
| Tangible Common Equity | |||||
| Risk-Based Capital Ratios Under Basel III – Standardized Approach | |||||
| Risk-Based Capital Ratios Under Basel III – Advanced Approach | |||||
| Quarter ended | Jun 30, 2024 % Change from |
Six months ended | |||||||||||||||||||||||||||||||||||||||||||||||||||||||||
| (in millions, except ratios and per share amounts) | Jun 30, 2024 |
Mar 31, 2024 |
Dec 31, 2023 |
Sep 30, 2023 |
Jun 30, 2023 |
Mar 31, 2024 |
Jun 30, 2023 |
Jun 30, 2024 |
Jun 30, 2023 |
% Change |
|||||||||||||||||||||||||||||||||||||||||||||||||
| Selected Income Statement Data | |||||||||||||||||||||||||||||||||||||||||||||||||||||||||||
| Total revenue | $ | 20,689 | 20,863 | 20,478 | 20,857 | 20,533 | (1) | % | 1 | $ | 41,552 | 41,262 | 1 | % | |||||||||||||||||||||||||||||||||||||||||||||
| Noninterest expense | 13,293 | 14,338 | 15,786 | 13,113 | 12,987 | (7) | 2 | 27,631 | 26,663 | 4 | |||||||||||||||||||||||||||||||||||||||||||||||||
| Pre-tax pre-provision profit (PTPP) (1) | 7,396 | 6,525 | 4,692 | 7,744 | 7,546 | 13 | (2) | 13,921 | 14,599 | (5) | |||||||||||||||||||||||||||||||||||||||||||||||||
| Provision for credit losses (2) | 1,236 | 938 | 1,282 | 1,197 | 1,713 | 32 | (28) | 2,174 | 2,920 | (26) | |||||||||||||||||||||||||||||||||||||||||||||||||
| Wells Fargo net income | 4,910 | 4,619 | 3,446 | 5,767 | 4,938 | 6 | (1) | 9,529 | 9,929 | (4) | |||||||||||||||||||||||||||||||||||||||||||||||||
| Wells Fargo net income applicable to common stock | 4,640 | 4,313 | 3,160 | 5,450 | 4,659 | 8 | — | 8,953 | 9,372 | (4) | |||||||||||||||||||||||||||||||||||||||||||||||||
| Common Share Data | |||||||||||||||||||||||||||||||||||||||||||||||||||||||||||
| Diluted earnings per common share | 1.33 | 1.20 | 0.86 | 1.48 | 1.25 | 11 | 6 | 2.53 | 2.48 | 2 | |||||||||||||||||||||||||||||||||||||||||||||||||
Dividends declared per common share |
0.35 | 0.35 | 0.35 | 0.35 | 0.30 | — | 17 | 0.70 | 0.60 | 17 | |||||||||||||||||||||||||||||||||||||||||||||||||
| Common shares outstanding | 3,402.7 | 3,501.7 | 3,598.9 | 3,637.9 | 3,667.7 | (3) | (7) | ||||||||||||||||||||||||||||||||||||||||||||||||||||
| Average common shares outstanding | 3,448.3 | 3,560.1 | 3,620.9 | 3,648.8 | 3,699.9 | (3) | (7) | 3,504.2 | 3,742.6 | (6) | |||||||||||||||||||||||||||||||||||||||||||||||||
| Diluted average common shares outstanding | 3,486.2 | 3,600.1 | 3,657.0 | 3,680.6 | 3,724.9 | (3) | (6) | 3,543.2 | 3,772.4 | (6) | |||||||||||||||||||||||||||||||||||||||||||||||||
| Book value per common share (3) | $ | 47.01 | 46.40 | 46.25 | 44.37 | 43.87 | 1 | 7 | |||||||||||||||||||||||||||||||||||||||||||||||||||
Tangible book value per common share (3)(4) |
39.57 | 39.17 | 39.23 | 37.43 | 36.53 | 1 | 8 | ||||||||||||||||||||||||||||||||||||||||||||||||||||
| Selected Equity Data (period-end) | |||||||||||||||||||||||||||||||||||||||||||||||||||||||||||
| Total equity | 178,148 | 182,674 | 187,443 | 182,373 | 181,952 | (2) | (2) | ||||||||||||||||||||||||||||||||||||||||||||||||||||
| Common stockholders' equity | 159,963 | 162,481 | 166,444 | 161,424 | 160,916 | (2) | (1) | ||||||||||||||||||||||||||||||||||||||||||||||||||||
Tangible common equity (4) |
134,660 | 137,163 | 141,193 | 136,153 | 133,990 | (2) | 1 | ||||||||||||||||||||||||||||||||||||||||||||||||||||
| Performance Ratios | |||||||||||||||||||||||||||||||||||||||||||||||||||||||||||
| Return on average assets (ROA) (5) | 1.03 | % | 0.97 | 0.72 | 1.21 | 1.05 | 1.00 | % | 1.07 | ||||||||||||||||||||||||||||||||||||||||||||||||||
| Return on average equity (ROE) (6) | 11.5 | 10.5 | 7.6 | 13.3 | 11.4 | 11.0 | 11.6 | ||||||||||||||||||||||||||||||||||||||||||||||||||||
Return on average tangible common equity (ROTCE) (4) |
13.7 | 12.3 | 9.0 | 15.9 | 13.7 | 13.0 | 13.9 | ||||||||||||||||||||||||||||||||||||||||||||||||||||
| Efficiency ratio (7) | 64 | 69 | 77 | 63 | 63 | 66 | 65 | ||||||||||||||||||||||||||||||||||||||||||||||||||||
| Net interest margin on a taxable-equivalent basis | 2.75 | 2.81 | 2.92 | 3.03 | 3.09 | 2.78 | 3.14 | ||||||||||||||||||||||||||||||||||||||||||||||||||||
| Average deposit cost | 1.84 | 1.74 | 1.58 | 1.36 | 1.13 | 1.79 | 0.98 | ||||||||||||||||||||||||||||||||||||||||||||||||||||
| Quarter ended | Jun 30, 2024 % Change from |
Six months ended | |||||||||||||||||||||||||||||||||||||||||||||||||||||||||
| ($ in millions, unless otherwise noted) | Jun 30, 2024 |
Mar 31, 2024 |
Dec 31, 2023 |
Sep 30, 2023 |
Jun 30, 2023 |
Mar 31, 2024 |
Jun 30, 2023 |
Jun 30, 2024 |
Jun 30, 2023 |
% Change |
|||||||||||||||||||||||||||||||||||||||||||||||||
Selected Balance Sheet Data (average) |
|||||||||||||||||||||||||||||||||||||||||||||||||||||||||||
| Loans | $ | 916,977 | 928,075 | 938,041 | 943,193 | 945,906 | (1) | % | (3) | $ | 922,526 | 947,271 | (3) | % | |||||||||||||||||||||||||||||||||||||||||||||
| Assets | 1,914,647 | 1,916,974 | 1,907,535 | 1,891,883 | 1,878,253 | — | 2 | 1,915,810 | 1,871,005 | 2 | |||||||||||||||||||||||||||||||||||||||||||||||||
| Deposits | 1,346,478 | 1,341,628 | 1,340,916 | 1,340,307 | 1,347,449 | — | — | 1,344,052 | 1,352,046 | (1) | |||||||||||||||||||||||||||||||||||||||||||||||||
| Selected Balance Sheet Data (period-end) | |||||||||||||||||||||||||||||||||||||||||||||||||||||||||||
| Debt securities | 520,254 | 506,280 | 490,458 | 490,726 | 503,468 | 3 | 3 | ||||||||||||||||||||||||||||||||||||||||||||||||||||
| Loans | 917,907 | 922,784 | 936,682 | 942,424 | 947,960 | (1) | (3) | ||||||||||||||||||||||||||||||||||||||||||||||||||||
| Allowance for credit losses for loans | 14,789 | 14,862 | 15,088 | 15,064 | 14,786 | — | — | ||||||||||||||||||||||||||||||||||||||||||||||||||||
| Equity securities | 60,763 | 59,556 | 57,336 | 56,026 | 67,471 | 2 | (10) | ||||||||||||||||||||||||||||||||||||||||||||||||||||
| Assets | 1,940,073 | 1,959,153 | 1,932,468 | 1,909,261 | 1,876,320 | (1) | 3 | ||||||||||||||||||||||||||||||||||||||||||||||||||||
| Deposits | 1,365,894 | 1,383,147 | 1,358,173 | 1,354,010 | 1,344,584 | (1) | 2 | ||||||||||||||||||||||||||||||||||||||||||||||||||||
| Headcount (#) (period-end) | 222,544 | 224,824 | 225,869 | 227,363 | 233,834 | (1) | (5) | ||||||||||||||||||||||||||||||||||||||||||||||||||||
Capital and other metrics (1) |
|||||||||||||||||||||||||||||||||||||||||||||||||||||||||||
| Risk-based capital ratios and components (2): | |||||||||||||||||||||||||||||||||||||||||||||||||||||||||||
Standardized Approach: |
|||||||||||||||||||||||||||||||||||||||||||||||||||||||||||
| Common Equity Tier 1 (CET1) | 11.0 | % | 11.2 | 11.4 | 11.0 | 10.7 | |||||||||||||||||||||||||||||||||||||||||||||||||||||
| Tier 1 capital | 12.4 | 12.7 | 13.0 | 12.6 | 12.2 | ||||||||||||||||||||||||||||||||||||||||||||||||||||||
| Total capital | 15.0 | 15.4 | 15.7 | 15.3 | 15.0 | ||||||||||||||||||||||||||||||||||||||||||||||||||||||
| Risk-weighted assets (RWAs) (in billions) | $ | 1,218.4 | 1,221.6 | 1,231.7 | 1,237.1 | 1,250.7 | — | (3) | |||||||||||||||||||||||||||||||||||||||||||||||||||
Advanced Approach: |
|||||||||||||||||||||||||||||||||||||||||||||||||||||||||||
| Common Equity Tier 1 (CET1) | 12.3 | % | 12.4 | 12.6 | 12.0 | 12.0 | |||||||||||||||||||||||||||||||||||||||||||||||||||||
| Tier 1 capital | 13.8 | 14.1 | 14.3 | 13.7 | 13.7 | ||||||||||||||||||||||||||||||||||||||||||||||||||||||
| Total capital | 15.8 | 16.2 | 16.4 | 15.8 | 15.8 | ||||||||||||||||||||||||||||||||||||||||||||||||||||||
| Risk-weighted assets (RWAs) (in billions) | $ | 1,091.4 | 1,099.6 | 1,114.3 | 1,130.8 | 1,118.4 | (1) | (2) | |||||||||||||||||||||||||||||||||||||||||||||||||||
Tier 1 leverage ratio |
8.0 | % | 8.2 | 8.5 | 8.3 | 8.3 | |||||||||||||||||||||||||||||||||||||||||||||||||||||
Supplementary Leverage Ratio (SLR) |
6.7 | 6.9 | 7.1 | 6.9 | 6.9 | ||||||||||||||||||||||||||||||||||||||||||||||||||||||
Total Loss Absorbing Capacity (TLAC) Ratio (3) |
24.8 | 25.1 | 25.0 | 24.0 | 23.1 | ||||||||||||||||||||||||||||||||||||||||||||||||||||||
Liquidity Coverage Ratio (LCR) (4) |
124 | 126 | 125 | 123 | 123 | ||||||||||||||||||||||||||||||||||||||||||||||||||||||
| Quarter ended | Jun 30, 2024 % Change from |
Six months ended | |||||||||||||||||||||||||||||||||||||||||||||||||||||||||
| (in millions, except per share amounts) | Jun 30, 2024 |
Mar 31, 2024 |
Dec 31, 2023 |
Sep 30, 2023 |
Jun 30, 2023 |
Mar 31, 2024 |
Jun 30, 2023 |
Jun 30, 2024 |
Jun 30, 2023 |
% Change |
|||||||||||||||||||||||||||||||||||||||||||||||||
| Interest income | $ | 22,884 | 22,840 | 22,839 | 22,093 | 20,830 | — | % | 10 | $ | 45,724 | 40,186 | 14 | % | |||||||||||||||||||||||||||||||||||||||||||||
| Interest expense | 10,961 | 10,613 | 10,068 | 8,988 | 7,667 | 3 | 43 | 21,574 | 13,687 | 58 | |||||||||||||||||||||||||||||||||||||||||||||||||
| Net interest income | 11,923 | 12,227 | 12,771 | 13,105 | 13,163 | (2) | (9) | 24,150 | 26,499 | (9) | |||||||||||||||||||||||||||||||||||||||||||||||||
| Noninterest income | |||||||||||||||||||||||||||||||||||||||||||||||||||||||||||
| Deposit-related fees | 1,249 | 1,230 | 1,202 | 1,179 | 1,165 | 2 | 7 | 2,479 | 2,313 | 7 | |||||||||||||||||||||||||||||||||||||||||||||||||
| Lending-related fees | 369 | 367 | 366 | 372 | 352 | 1 | 5 | 736 | 708 | 4 | |||||||||||||||||||||||||||||||||||||||||||||||||
| Investment advisory and other asset-based fees | 2,415 | 2,331 | 2,169 | 2,224 | 2,163 | 4 | 12 | 4,746 | 4,277 | 11 | |||||||||||||||||||||||||||||||||||||||||||||||||
| Commissions and brokerage services fees | 614 | 626 | 619 | 567 | 570 | (2) | 8 | 1,240 | 1,189 | 4 | |||||||||||||||||||||||||||||||||||||||||||||||||
| Investment banking fees | 641 | 627 | 455 | 492 | 376 | 2 | 70 | 1,268 | 702 | 81 | |||||||||||||||||||||||||||||||||||||||||||||||||
| Card fees | 1,101 | 1,061 | 1,027 | 1,098 | 1,098 | 4 | — | 2,162 | 2,131 | 1 | |||||||||||||||||||||||||||||||||||||||||||||||||
| Mortgage banking | 243 | 230 | 202 | 193 | 202 | 6 | 20 | 473 | 434 | 9 | |||||||||||||||||||||||||||||||||||||||||||||||||
| Net gains from trading activities | 1,442 | 1,454 | 1,070 | 1,265 | 1,122 | (1) | 29 | 2,896 | 2,464 | 18 | |||||||||||||||||||||||||||||||||||||||||||||||||
Net gains (losses) from debt securities |
— | (25) | — | 6 | 4 | 100 | (100) | (25) | 4 | NM | |||||||||||||||||||||||||||||||||||||||||||||||||
Net gains (losses) from equity securities |
80 | 18 | 35 | (25) | (94) | 344 | 185 | 98 | (451) | 122 | |||||||||||||||||||||||||||||||||||||||||||||||||
| Lease income | 292 | 421 | 292 | 291 | 307 | (31) | (5) | 713 | 654 | 9 | |||||||||||||||||||||||||||||||||||||||||||||||||
| Other | 320 | 296 | 270 | 90 | 105 | 8 | 205 | 616 | 338 | 82 | |||||||||||||||||||||||||||||||||||||||||||||||||
| Total noninterest income | 8,766 | 8,636 | 7,707 | 7,752 | 7,370 | 2 | 19 | 17,402 | 14,763 | 18 | |||||||||||||||||||||||||||||||||||||||||||||||||
| Total revenue | 20,689 | 20,863 | 20,478 | 20,857 | 20,533 | (1) | 1 | 41,552 | 41,262 | 1 | |||||||||||||||||||||||||||||||||||||||||||||||||
| Provision for credit losses (1) | 1,236 | 938 | 1,282 | 1,197 | 1,713 | 32 | (28) | 2,174 | 2,920 | (26) | |||||||||||||||||||||||||||||||||||||||||||||||||
| Noninterest expense | |||||||||||||||||||||||||||||||||||||||||||||||||||||||||||
| Personnel | 8,575 | 9,492 | 9,181 | 8,627 | 8,606 | (10) | — | 18,067 | 18,021 | — | |||||||||||||||||||||||||||||||||||||||||||||||||
| Technology, telecommunications and equipment | 1,106 | 1,053 | 1,076 | 975 | 947 | 5 | 17 | 2,159 | 1,869 | 16 | |||||||||||||||||||||||||||||||||||||||||||||||||
| Occupancy | 763 | 714 | 740 | 724 | 707 | 7 | 8 | 1,477 | 1,420 | 4 | |||||||||||||||||||||||||||||||||||||||||||||||||
| Operating losses | 493 | 633 | 355 | 329 | 232 | (22) | 113 | 1,126 | 499 | 126 | |||||||||||||||||||||||||||||||||||||||||||||||||
| Professional and outside services | 1,139 | 1,101 | 1,242 | 1,310 | 1,304 | 3 | (13) | 2,240 | 2,533 | (12) | |||||||||||||||||||||||||||||||||||||||||||||||||
| Leases (2) | 159 | 164 | 168 | 172 | 180 | (3) | (12) | 323 | 357 | (10) | |||||||||||||||||||||||||||||||||||||||||||||||||
| Advertising and promotion | 224 | 197 | 259 | 215 | 184 | 14 | 22 | 421 | 338 | 25 | |||||||||||||||||||||||||||||||||||||||||||||||||
| Other | 834 | 984 | 2,765 | 761 | 827 | (15) | 1 | 1,818 | 1,626 | 12 | |||||||||||||||||||||||||||||||||||||||||||||||||
| Total noninterest expense | 13,293 | 14,338 | 15,786 | 13,113 | 12,987 | (7) | 2 | 27,631 | 26,663 | 4 | |||||||||||||||||||||||||||||||||||||||||||||||||
| Income before income tax expense (benefit) | 6,160 | 5,587 | 3,410 | 6,547 | 5,833 | 10 | 6 | 11,747 | 11,679 | 1 | |||||||||||||||||||||||||||||||||||||||||||||||||
| Income tax expense (benefit) | 1,251 | 964 | (100) | 811 | 930 | 30 | 35 | 2,215 | 1,896 | 17 | |||||||||||||||||||||||||||||||||||||||||||||||||
| Net income before noncontrolling interests | 4,909 | 4,623 | 3,510 | 5,736 | 4,903 | 6 | — | 9,532 | 9,783 | (3) | |||||||||||||||||||||||||||||||||||||||||||||||||
Less: Net income (loss) from noncontrolling interests |
(1) | 4 | 64 | (31) | (35) | NM | 97 | 3 | (146) | 102 | |||||||||||||||||||||||||||||||||||||||||||||||||
| Wells Fargo net income | $ | 4,910 | 4,619 | 3,446 | 5,767 | 4,938 | 6 | % | (1) | $ | 9,529 | 9,929 | (4) | % | |||||||||||||||||||||||||||||||||||||||||||||
| Less: Preferred stock dividends and other | 270 | 306 | 286 | 317 | 279 | (12) | (3) | 576 | 557 | 3 | |||||||||||||||||||||||||||||||||||||||||||||||||
| Wells Fargo net income applicable to common stock | $ | 4,640 | 4,313 | 3,160 | 5,450 | 4,659 | 8 | % | — | $ | 8,953 | 9,372 | (4) | % | |||||||||||||||||||||||||||||||||||||||||||||
| Per share information | |||||||||||||||||||||||||||||||||||||||||||||||||||||||||||
| Earnings per common share | $ | 1.35 | 1.21 | 0.87 | 1.49 | 1.26 | 12 | % | 7 | $ | 2.56 | 2.50 | 2 | % | |||||||||||||||||||||||||||||||||||||||||||||
| Diluted earnings per common share | 1.33 | 1.20 | 0.86 | 1.48 | 1.25 | 11 | 6 | 2.53 | 2.48 | 2 | |||||||||||||||||||||||||||||||||||||||||||||||||
| Jun 30, 2024 % Change from |
|||||||||||||||||||||||||||||||||||||||||
| (in millions) | Jun 30, 2024 |
Mar 31, 2024 |
Dec 31, 2023 |
Sep 30, 2023 |
Jun 30, 2023 |
Mar 31, 2024 |
Jun 30, 2023 |
||||||||||||||||||||||||||||||||||
| Assets | |||||||||||||||||||||||||||||||||||||||||
| Cash and due from banks | $ | 32,701 | 30,180 | 33,026 | 30,815 | 31,915 | 8 | % | 2 | ||||||||||||||||||||||||||||||||
| Interest-earning deposits with banks | 199,322 | 239,467 | 204,193 | 187,081 | 123,418 | (17) | 62 | ||||||||||||||||||||||||||||||||||
| Federal funds sold and securities purchased under resale agreements | 82,259 | 68,751 | 80,456 | 70,431 | 66,500 | 20 | 24 | ||||||||||||||||||||||||||||||||||
| Debt securities: | |||||||||||||||||||||||||||||||||||||||||
| Trading, at fair value | 120,766 | 109,324 | 97,302 | 97,075 | 96,857 | 10 | 25 | ||||||||||||||||||||||||||||||||||
| Available-for-sale, at fair value | 148,752 | 138,245 | 130,448 | 126,437 | 134,251 | 8 | 11 | ||||||||||||||||||||||||||||||||||
| Held-to-maturity, at amortized cost | 250,736 | 258,711 | 262,708 | 267,214 | 272,360 | (3) | (8) | ||||||||||||||||||||||||||||||||||
| Loans held for sale | 7,312 | 5,473 | 4,936 | 4,308 | 6,029 | 34 | 21 | ||||||||||||||||||||||||||||||||||
| Loans | 917,907 | 922,784 | 936,682 | 942,424 | 947,960 | (1) | (3) | ||||||||||||||||||||||||||||||||||
| Allowance for loan losses | (14,360) | (14,421) | (14,606) | (14,554) | (14,258) | — | (1) | ||||||||||||||||||||||||||||||||||
| Net loans | 903,547 | 908,363 | 922,076 | 927,870 | 933,702 | (1) | (3) | ||||||||||||||||||||||||||||||||||
| Mortgage servicing rights | 8,027 | 8,248 | 8,508 | 9,526 | 9,345 | (3) | (14) | ||||||||||||||||||||||||||||||||||
| Premises and equipment, net | 9,648 | 9,426 | 9,266 | 8,559 | 8,392 | 2 | 15 | ||||||||||||||||||||||||||||||||||
| Goodwill | 25,172 | 25,173 | 25,175 | 25,174 | 25,175 | — | — | ||||||||||||||||||||||||||||||||||
| Derivative assets | 18,721 | 17,653 | 18,223 | 21,096 | 17,990 | 6 | 4 | ||||||||||||||||||||||||||||||||||
| Equity securities | 60,763 | 59,556 | 57,336 | 56,026 | 67,471 | 2 | (10) | ||||||||||||||||||||||||||||||||||
| Other assets | 72,347 | 80,583 | 78,815 | 77,649 | 82,915 | (10) | (13) | ||||||||||||||||||||||||||||||||||
| Total assets | $ | 1,940,073 | 1,959,153 | 1,932,468 | 1,909,261 | 1,876,320 | (1) | 3 | |||||||||||||||||||||||||||||||||
| Liabilities | |||||||||||||||||||||||||||||||||||||||||
| Noninterest-bearing deposits | $ | 348,525 | 356,162 | 360,279 | 384,330 | 402,322 | (2) | (13) | |||||||||||||||||||||||||||||||||
| Interest-bearing deposits | 1,017,369 | 1,026,985 | 997,894 | 969,680 | 942,262 | (1) | 8 | ||||||||||||||||||||||||||||||||||
| Total deposits | 1,365,894 | 1,383,147 | 1,358,173 | 1,354,010 | 1,344,584 | (1) | 2 | ||||||||||||||||||||||||||||||||||
| Short-term borrowings (1) | 118,834 | 109,014 | 89,559 | 93,330 | 84,255 | 9 | 41 | ||||||||||||||||||||||||||||||||||
| Derivative liabilities | 16,237 | 17,116 | 18,495 | 23,463 | 21,431 | (5) | (24) | ||||||||||||||||||||||||||||||||||
| Accrued expenses and other liabilities | 81,824 | 79,438 | 71,210 | 66,050 | 73,466 | 3 | 11 | ||||||||||||||||||||||||||||||||||
| Long-term debt (2) | 179,136 | 187,764 | 207,588 | 190,035 | 170,632 | (5) | 5 | ||||||||||||||||||||||||||||||||||
| Total liabilities | 1,761,925 | 1,776,479 | 1,745,025 | 1,726,888 | 1,694,368 | (1) | 4 | ||||||||||||||||||||||||||||||||||
| Equity | |||||||||||||||||||||||||||||||||||||||||
| Wells Fargo stockholders’ equity: | |||||||||||||||||||||||||||||||||||||||||
| Preferred stock | 16,608 | 18,608 | 19,448 | 19,448 | 19,448 | (11) | (15) | ||||||||||||||||||||||||||||||||||
Common stock – $1-2/3 par value, authorized 9,000,000,000 shares; issued 5,481,811,474 shares |
9,136 | 9,136 | 9,136 | 9,136 | 9,136 | — | — | ||||||||||||||||||||||||||||||||||
| Additional paid-in capital | 60,373 | 60,131 | 60,555 | 60,365 | 60,173 | — | — | ||||||||||||||||||||||||||||||||||
| Retained earnings | 207,281 | 203,870 | 201,136 | 199,287 | 195,164 | 2 | 6 | ||||||||||||||||||||||||||||||||||
| Accumulated other comprehensive income (loss) | (12,721) | (12,546) | (11,580) | (15,877) | (13,441) | (1) | 5 | ||||||||||||||||||||||||||||||||||
| Treasury stock (3) | (104,247) | (98,256) | (92,960) | (91,215) | (89,860) | (6) | (16) | ||||||||||||||||||||||||||||||||||
| Unearned ESOP shares | — | — | — | (429) | (429) | NM | 100 | ||||||||||||||||||||||||||||||||||
| Total Wells Fargo stockholders’ equity | 176,430 | 180,943 | 185,735 | 180,715 | 180,191 | (2) | (2) | ||||||||||||||||||||||||||||||||||
| Noncontrolling interests | 1,718 | 1,731 | 1,708 | 1,658 | 1,761 | (1) | (2) | ||||||||||||||||||||||||||||||||||
| Total equity | 178,148 | 182,674 | 187,443 | 182,373 | 181,952 | (2) | (2) | ||||||||||||||||||||||||||||||||||
| Total liabilities and equity | $ | 1,940,073 | 1,959,153 | 1,932,468 | 1,909,261 | 1,876,320 | (1) | 3 | |||||||||||||||||||||||||||||||||
| Quarter ended | Jun 30, 2024 % Change from |
Six months ended | % Change |
||||||||||||||||||||||||||||||||||||||||||||||||||||||||
| ($ in millions) | Jun 30, 2024 | Mar 31, 2024 | Dec 31, 2023 | Sep 30, 2023 | Jun 30, 2023 | Mar 31, 2024 | Jun 30, 2023 | Jun 30, 2024 | Jun 30, 2023 | ||||||||||||||||||||||||||||||||||||||||||||||||||
| Average Balances | |||||||||||||||||||||||||||||||||||||||||||||||||||||||||||
| Assets | |||||||||||||||||||||||||||||||||||||||||||||||||||||||||||
| Interest-earning deposits with banks | $ | 196,436 | 207,568 | 193,647 | 158,893 | 129,236 | (5) | % | 52 | $ | 202,002 | 122,087 | 65 | % | |||||||||||||||||||||||||||||||||||||||||||||
| Federal funds sold and securities purchased under resale agreements | 71,769 | 69,719 | 72,626 | 68,715 | 69,505 | 3 | 3 | 70,744 | 69,071 | 2 | |||||||||||||||||||||||||||||||||||||||||||||||||
| Trading debt securities | 120,590 | 112,170 | 109,340 | 109,802 | 102,605 | 8 | 18 | 116,380 | 99,522 | 17 | |||||||||||||||||||||||||||||||||||||||||||||||||
| Available-for-sale debt securities | 150,024 | 139,986 | 136,389 | 139,511 | 149,320 | 7 | — | 145,005 | 147,616 | (2) | |||||||||||||||||||||||||||||||||||||||||||||||||
| Held-to-maturity debt securities | 258,631 | 264,755 | 268,905 | 273,948 | 279,093 | (2) | (7) | 261,693 | 279,522 | (6) | |||||||||||||||||||||||||||||||||||||||||||||||||
| Loans held for sale | 7,091 | 5,835 | 4,990 | 5,437 | 6,031 | 22 | 18 | 6,463 | 6,320 | 2 | |||||||||||||||||||||||||||||||||||||||||||||||||
| Loans | 916,977 | 928,075 | 938,041 | 943,193 | 945,906 | (1) | (3) | 922,526 | 947,271 | (3) | |||||||||||||||||||||||||||||||||||||||||||||||||
| Equity securities | 26,332 | 21,350 | 22,198 | 25,019 | 27,891 | 23 | (6) | 23,841 | 28,269 | (16) | |||||||||||||||||||||||||||||||||||||||||||||||||
| Other | 8,128 | 8,940 | 8,861 | 8,565 | 10,118 | (9) | (20) | 8,534 | 10,578 | (19) | |||||||||||||||||||||||||||||||||||||||||||||||||
| Total interest-earning assets | 1,755,978 | 1,758,398 | 1,754,997 | 1,733,083 | 1,719,705 | — | 2 | 1,757,188 | 1,710,256 | 3 | |||||||||||||||||||||||||||||||||||||||||||||||||
| Total noninterest-earning assets | 158,669 | 158,576 | 152,538 | 158,800 | 158,548 | — | — | 158,622 | 160,749 | (1) | |||||||||||||||||||||||||||||||||||||||||||||||||
| Total assets | $ | 1,914,647 | 1,916,974 | 1,907,535 | 1,891,883 | 1,878,253 | — | 2 | $ | 1,915,810 | 1,871,005 | 2 | |||||||||||||||||||||||||||||||||||||||||||||||
| Liabilities | |||||||||||||||||||||||||||||||||||||||||||||||||||||||||||
| Interest-bearing deposits | $ | 1,006,806 | 996,874 | 974,890 | 953,500 | 936,886 | 1 | 7 | $ | 1,001,840 | 928,602 | 8 | |||||||||||||||||||||||||||||||||||||||||||||||
| Short-term borrowings | 106,685 | 94,988 | 92,032 | 90,078 | 83,059 | 12 | 28 | 100,836 | 70,845 | 42 | |||||||||||||||||||||||||||||||||||||||||||||||||
| Long-term debt | 182,201 | 197,116 | 196,213 | 181,955 | 170,843 | (8) | 7 | 189,659 | 171,700 | 10 | |||||||||||||||||||||||||||||||||||||||||||||||||
| Other liabilities | 34,613 | 32,821 | 31,342 | 32,564 | 34,496 | 5 | — | 33,717 | 33,964 | (1) | |||||||||||||||||||||||||||||||||||||||||||||||||
| Total interest-bearing liabilities | 1,330,305 | 1,321,799 | 1,294,477 | 1,258,097 | 1,225,284 | 1 | 9 | 1,326,052 | 1,205,111 | 10 | |||||||||||||||||||||||||||||||||||||||||||||||||
Noninterest-bearing deposits |
339,672 | 344,754 | 366,026 | 386,807 | 410,563 | (1) | (17) | 342,212 | 423,444 | (19) | |||||||||||||||||||||||||||||||||||||||||||||||||
| Other noninterest-bearing liabilities | 63,118 | 63,752 | 61,179 | 62,151 | 57,963 | (1) | 9 | 63,435 | 58,079 | 9 | |||||||||||||||||||||||||||||||||||||||||||||||||
| Total liabilities | 1,733,095 | 1,730,305 | 1,721,682 | 1,707,055 | 1,693,810 | — | 2 | 1,731,699 | 1,686,634 | 3 | |||||||||||||||||||||||||||||||||||||||||||||||||
| Total equity | 181,552 | 186,669 | 185,853 | 184,828 | 184,443 | (3) | (2) | 184,111 | 184,371 | — | |||||||||||||||||||||||||||||||||||||||||||||||||
| Total liabilities and equity | $ | 1,914,647 | 1,916,974 | 1,907,535 | 1,891,883 | 1,878,253 | — | 2 | $ | 1,915,810 | 1,871,005 | 2 | |||||||||||||||||||||||||||||||||||||||||||||||
| Average Interest Rates | |||||||||||||||||||||||||||||||||||||||||||||||||||||||||||
| Interest-earning assets | |||||||||||||||||||||||||||||||||||||||||||||||||||||||||||
| Interest-earning deposits with banks | 5.05 | % | 4.99 | 4.98 | 4.81 | 4.50 | 5.02 | % | 4.32 | ||||||||||||||||||||||||||||||||||||||||||||||||||
| Federal funds sold and securities purchased under resale agreements | 5.27 | 5.28 | 5.30 | 5.13 | 4.73 | 5.28 | 4.43 | ||||||||||||||||||||||||||||||||||||||||||||||||||||
| Trading debt securities | 4.14 | 4.08 | 3.82 | 3.86 | 3.50 | 4.11 | 3.42 | ||||||||||||||||||||||||||||||||||||||||||||||||||||
| Available-for-sale debt securities | 4.21 | 3.99 | 3.87 | 3.92 | 3.72 | 4.11 | 3.63 | ||||||||||||||||||||||||||||||||||||||||||||||||||||
| Held-to-maturity debt securities | 2.64 | 2.70 | 2.69 | 2.65 | 2.62 | 2.67 | 2.59 | ||||||||||||||||||||||||||||||||||||||||||||||||||||
| Loans held for sale | 7.53 | 7.82 | 6.75 | 6.40 | 6.22 | 7.66 | 6.05 | ||||||||||||||||||||||||||||||||||||||||||||||||||||
| Loans | 6.40 | 6.38 | 6.35 | 6.23 | 5.99 | 6.39 | 5.84 | ||||||||||||||||||||||||||||||||||||||||||||||||||||
| Equity securities | 2.99 | 2.82 | 2.99 | 2.42 | 2.79 | 2.91 | 2.59 | ||||||||||||||||||||||||||||||||||||||||||||||||||||
| Other | 5.42 | 5.14 | 4.99 | 4.93 | 4.76 | 5.27 | 4.67 | ||||||||||||||||||||||||||||||||||||||||||||||||||||
| Total interest-earning assets | 5.25 | 5.24 | 5.20 | 5.09 | 4.88 | 5.25 | 4.75 | ||||||||||||||||||||||||||||||||||||||||||||||||||||
| Interest-bearing liabilities | |||||||||||||||||||||||||||||||||||||||||||||||||||||||||||
| Interest-bearing deposits | 2.46 | 2.34 | 2.17 | 1.92 | 1.63 | 2.40 | 1.43 | ||||||||||||||||||||||||||||||||||||||||||||||||||||
| Short-term borrowings | 5.19 | 5.16 | 5.10 | 4.99 | 4.64 | 5.17 | 4.36 | ||||||||||||||||||||||||||||||||||||||||||||||||||||
| Long-term debt | 6.95 | 6.80 | 6.78 | 6.67 | 6.31 | 6.87 | 6.07 | ||||||||||||||||||||||||||||||||||||||||||||||||||||
| Other liabilities | 3.13 | 2.88 | 2.87 | 2.54 | 2.41 | 3.01 | 2.29 | ||||||||||||||||||||||||||||||||||||||||||||||||||||
| Total interest-bearing liabilities | 3.31 | 3.22 | 3.09 | 2.84 | 2.51 | 3.27 | 2.28 | ||||||||||||||||||||||||||||||||||||||||||||||||||||
| Interest rate spread on a taxable-equivalent basis (2) | 1.94 | 2.02 | 2.11 | 2.25 | 2.37 | 1.98 | 2.47 | ||||||||||||||||||||||||||||||||||||||||||||||||||||
| Net interest margin on a taxable-equivalent basis (2) | 2.75 | 2.81 | 2.92 | 3.03 | 3.09 | 2.78 | 3.14 | ||||||||||||||||||||||||||||||||||||||||||||||||||||
| Quarter ended June 30, 2024 | |||||||||||||||||||||||||||||||||||||||||
| (in millions) | Consumer Banking and Lending | Commercial Banking | Corporate and Investment Banking | Wealth and Investment Management | Corporate (2) | Reconciling Items (3) | Consolidated Company |
||||||||||||||||||||||||||||||||||
| Net interest income | $ | 7,024 | 2,281 | 1,945 | 906 | (144) | (89) | 11,923 | |||||||||||||||||||||||||||||||||
| Noninterest income | 1,982 | 841 | 2,893 | 2,952 | 392 | (294) | 8,766 | ||||||||||||||||||||||||||||||||||
| Total revenue | 9,006 | 3,122 | 4,838 | 3,858 | 248 | (383) | 20,689 | ||||||||||||||||||||||||||||||||||
| Provision for credit losses | 932 | 29 | 285 | (14) | 4 | — | 1,236 | ||||||||||||||||||||||||||||||||||
| Noninterest expense | 5,701 | 1,506 | 2,170 | 3,193 | 723 | — | 13,293 | ||||||||||||||||||||||||||||||||||
| Income (loss) before income tax expense (benefit) | 2,373 | 1,587 | 2,383 | 679 | (479) | (383) | 6,160 | ||||||||||||||||||||||||||||||||||
| Income tax expense (benefit) | 596 | 402 | 598 | 195 | (157) | (383) | 1,251 | ||||||||||||||||||||||||||||||||||
Net income (loss) before noncontrolling interests |
1,777 | 1,185 | 1,785 | 484 | (322) | — | 4,909 | ||||||||||||||||||||||||||||||||||
| Less: Net income (loss) from noncontrolling interests | — | 3 | — | — | (4) | — | (1) | ||||||||||||||||||||||||||||||||||
Net income (loss) |
$ | 1,777 | 1,182 | 1,785 | 484 | (318) | — | 4,910 | |||||||||||||||||||||||||||||||||
| Quarter ended March 31, 2024 | |||||||||||||||||||||||||||||||||||||||||
| Net interest income | $ | 7,110 | 2,278 | 2,027 | 869 | 32 | (89) | 12,227 | |||||||||||||||||||||||||||||||||
| Noninterest income | 1,981 | 874 | 2,955 | 2,873 | 291 | (338) | 8,636 | ||||||||||||||||||||||||||||||||||
| Total revenue | 9,091 | 3,152 | 4,982 | 3,742 | 323 | (427) | 20,863 | ||||||||||||||||||||||||||||||||||
| Provision for credit losses | 788 | 143 | 5 | 3 | (1) | — | 938 | ||||||||||||||||||||||||||||||||||
| Noninterest expense | 6,024 | 1,679 | 2,330 | 3,230 | 1,075 | — | 14,338 | ||||||||||||||||||||||||||||||||||
| Income (loss) before income tax expense (benefit) | 2,279 | 1,330 | 2,647 | 509 | (751) | (427) | 5,587 | ||||||||||||||||||||||||||||||||||
| Income tax expense (benefit) | 573 | 341 | 666 | 128 | (317) | (427) | 964 | ||||||||||||||||||||||||||||||||||
Net income (loss) before noncontrolling interests |
1,706 | 989 | 1,981 | 381 | (434) | — | 4,623 | ||||||||||||||||||||||||||||||||||
Less: Net income from noncontrolling interests |
— | 3 | — | — | 1 | — | 4 | ||||||||||||||||||||||||||||||||||
Net income (loss) |
$ | 1,706 | 986 | 1,981 | 381 | (435) | — | 4,619 | |||||||||||||||||||||||||||||||||
| Quarter ended June 30, 2023 | |||||||||||||||||||||||||||||||||||||||||
| Net interest income | $ | 7,490 | 2,501 | 2,359 | 1,009 | (91) | (105) | 13,163 | |||||||||||||||||||||||||||||||||
| Noninterest income | 1,965 | 868 | 2,272 | 2,639 | 121 | (495) | 7,370 | ||||||||||||||||||||||||||||||||||
| Total revenue | 9,455 | 3,369 | 4,631 | 3,648 | 30 | (600) | 20,533 | ||||||||||||||||||||||||||||||||||
| Provision for credit losses | 874 | 26 | 933 | 24 | (144) | — | 1,713 | ||||||||||||||||||||||||||||||||||
| Noninterest expense | 6,027 | 1,630 | 2,087 | 2,974 | 269 | — | 12,987 | ||||||||||||||||||||||||||||||||||
| Income (loss) before income tax expense (benefit) | 2,554 | 1,713 | 1,611 | 650 | (95) | (600) | 5,833 | ||||||||||||||||||||||||||||||||||
| Income tax expense (benefit) | 640 | 429 | 401 | 163 | (103) | (600) | 930 | ||||||||||||||||||||||||||||||||||
| Net income before noncontrolling interests | 1,914 | 1,284 | 1,210 | 487 | 8 | — | 4,903 | ||||||||||||||||||||||||||||||||||
| Less: Net income (loss) from noncontrolling interests | — | 3 | — | — | (38) | — | (35) | ||||||||||||||||||||||||||||||||||
| Net income | $ | 1,914 | 1,281 | 1,210 | 487 | 46 | — | 4,938 | |||||||||||||||||||||||||||||||||
| Six months ended June 30, 2024 | |||||||||||||||||||||||||||||||||||||||||
| (in millions) | Consumer Banking and Lending | Commercial Banking | Corporate and Investment Banking | Wealth and Investment Management | Corporate (2) | Reconciling Items (3) | Consolidated Company |
||||||||||||||||||||||||||||||||||
| Net interest income | $ | 14,134 | 4,559 | 3,972 | 1,775 | (112) | (178) | 24,150 | |||||||||||||||||||||||||||||||||
| Noninterest income | 3,963 | 1,715 | 5,848 | 5,825 | 683 | (632) | 17,402 | ||||||||||||||||||||||||||||||||||
| Total revenue | 18,097 | 6,274 | 9,820 | 7,600 | 571 | (810) | 41,552 | ||||||||||||||||||||||||||||||||||
| Provision for credit losses | 1,720 | 172 | 290 | (11) | 3 | — | 2,174 | ||||||||||||||||||||||||||||||||||
| Noninterest expense | 11,725 | 3,185 | 4,500 | 6,423 | 1,798 | — | 27,631 | ||||||||||||||||||||||||||||||||||
Income (loss) before income tax expense (benefit) |
4,652 | 2,917 | 5,030 | 1,188 | (1,230) | (810) | 11,747 | ||||||||||||||||||||||||||||||||||
| Income tax expense (benefit) | 1,169 | 743 | 1,264 | 323 | (474) | (810) | 2,215 | ||||||||||||||||||||||||||||||||||
| Net income (loss) before noncontrolling interests | 3,483 | 2,174 | 3,766 | 865 | (756) | — | 9,532 | ||||||||||||||||||||||||||||||||||
Less: Net income (loss) from noncontrolling interests |
— | 6 | — | — | (3) | — | 3 | ||||||||||||||||||||||||||||||||||
| Net income (loss) | $ | 3,483 | 2,168 | 3,766 | 865 | (753) | — | 9,529 | |||||||||||||||||||||||||||||||||
| Six months ended June 30, 2023 | |||||||||||||||||||||||||||||||||||||||||
| Net interest income | $ | 14,923 | 4,990 | 4,820 | 2,053 | (75) | (212) | 26,499 | |||||||||||||||||||||||||||||||||
| Noninterest income | 3,896 | 1,686 | 4,713 | 5,276 | 126 | (934) | 14,763 | ||||||||||||||||||||||||||||||||||
| Total revenue | 18,819 | 6,676 | 9,533 | 7,329 | 51 | (1,146) | 41,262 | ||||||||||||||||||||||||||||||||||
| Provision for credit losses | 1,741 | (17) | 1,185 | 35 | (24) | — | 2,920 | ||||||||||||||||||||||||||||||||||
| Noninterest expense | 12,065 | 3,382 | 4,304 | 6,035 | 877 | — | 26,663 | ||||||||||||||||||||||||||||||||||
Income (loss) before income tax expense (benefit) |
5,013 | 3,311 | 4,044 | 1,259 | (802) | (1,146) | 11,679 | ||||||||||||||||||||||||||||||||||
| Income tax expense (benefit) | 1,258 | 828 | 1,016 | 315 | (375) | (1,146) | 1,896 | ||||||||||||||||||||||||||||||||||
| Net income (loss) before noncontrolling interests | 3,755 | 2,483 | 3,028 | 944 | (427) | — | 9,783 | ||||||||||||||||||||||||||||||||||
| Less: Net income (loss) from noncontrolling interests | — | 6 | — | — | (152) | — | (146) | ||||||||||||||||||||||||||||||||||
| Net income (loss) | $ | 3,755 | 2,477 | 3,028 | 944 | (275) | — | 9,929 | |||||||||||||||||||||||||||||||||
| Quarter ended | Jun 30, 2024 % Change from |
Six months ended | |||||||||||||||||||||||||||||||||||||||||||||||||||||||||
| ($ in millions) | Jun 30, 2024 |
Mar 31, 2024 |
Dec 31, 2023 |
Sep 30, 2023 |
Jun 30, 2023 |
Mar 31, 2024 |
Jun 30, 2023 |
Jun 30, 2024 |
Jun 30, 2023 |
% Change |
|||||||||||||||||||||||||||||||||||||||||||||||||
| Income Statement | |||||||||||||||||||||||||||||||||||||||||||||||||||||||||||
| Net interest income | $ | 7,024 | 7,110 | 7,629 | 7,633 | 7,490 | (1) | % | (6) | $ | 14,134 | 14,923 | (5) | % | |||||||||||||||||||||||||||||||||||||||||||||
| Noninterest income: | |||||||||||||||||||||||||||||||||||||||||||||||||||||||||||
| Deposit-related fees | 690 | 677 | 694 | 670 | 666 | 2 | 4 | 1,367 | 1,338 | 2 | |||||||||||||||||||||||||||||||||||||||||||||||||
| Card fees | 1,036 | 990 | 960 | 1,027 | 1,022 | 5 | 1 | 2,026 | 1,980 | 2 | |||||||||||||||||||||||||||||||||||||||||||||||||
| Mortgage banking | 135 | 193 | 115 | 105 | 132 | (30) | 2 | 328 | 292 | 12 | |||||||||||||||||||||||||||||||||||||||||||||||||
| Other | 121 | 121 | 121 | 146 | 145 | — | (17) | 242 | 286 | (15) | |||||||||||||||||||||||||||||||||||||||||||||||||
| Total noninterest income | 1,982 | 1,981 | 1,890 | 1,948 | 1,965 | — | 1 | 3,963 | 3,896 | 2 | |||||||||||||||||||||||||||||||||||||||||||||||||
| Total revenue | 9,006 | 9,091 | 9,519 | 9,581 | 9,455 | (1) | (5) | 18,097 | 18,819 | (4) | |||||||||||||||||||||||||||||||||||||||||||||||||
| Net charge-offs | 907 | 881 | 852 | 722 | 621 | 3 | 46 | 1,788 | 1,210 | 48 | |||||||||||||||||||||||||||||||||||||||||||||||||
| Change in the allowance for credit losses | 25 | (93) | (62) | 46 | 253 | 127 | (90) | (68) | 531 | NM | |||||||||||||||||||||||||||||||||||||||||||||||||
| Provision for credit losses | 932 | 788 | 790 | 768 | 874 | 18 | 7 | 1,720 | 1,741 | (1) | |||||||||||||||||||||||||||||||||||||||||||||||||
| Noninterest expense | 5,701 | 6,024 | 6,046 | 5,913 | 6,027 | (5) | (5) | 11,725 | 12,065 | (3) | |||||||||||||||||||||||||||||||||||||||||||||||||
| Income before income tax expense | 2,373 | 2,279 | 2,683 | 2,900 | 2,554 | 4 | (7) | 4,652 | 5,013 | (7) | |||||||||||||||||||||||||||||||||||||||||||||||||
| Income tax expense | 596 | 573 | 672 | 727 | 640 | 4 | (7) | 1,169 | 1,258 | (7) | |||||||||||||||||||||||||||||||||||||||||||||||||
| Net income | $ | 1,777 | 1,706 | 2,011 | 2,173 | 1,914 | 4 | (7) | $ | 3,483 | 3,755 | (7) | |||||||||||||||||||||||||||||||||||||||||||||||
| Revenue by Line of Business | |||||||||||||||||||||||||||||||||||||||||||||||||||||||||||
| Consumer, Small and Business Banking | $ | 6,129 | 6,092 | 6,554 | 6,546 | 6,448 | 1 | (5) | $ | 12,221 | 12,822 | (5) | |||||||||||||||||||||||||||||||||||||||||||||||
| Consumer Lending: | |||||||||||||||||||||||||||||||||||||||||||||||||||||||||||
| Home Lending | 823 | 864 | 839 | 840 | 847 | (5) | (3) | 1,687 | 1,710 | (1) | |||||||||||||||||||||||||||||||||||||||||||||||||
| Credit Card | 1,452 | 1,496 | 1,449 | 1,494 | 1,449 | (3) | — | 2,948 | 2,866 | 3 | |||||||||||||||||||||||||||||||||||||||||||||||||
| Auto | 282 | 300 | 334 | 360 | 378 | (6) | (25) | 582 | 770 | (24) | |||||||||||||||||||||||||||||||||||||||||||||||||
| Personal Lending | 320 | 339 | 343 | 341 | 333 | (6) | (4) | 659 | 651 | 1 | |||||||||||||||||||||||||||||||||||||||||||||||||
| Total revenue | $ | 9,006 | 9,091 | 9,519 | 9,581 | 9,455 | (1) | (5) | $ | 18,097 | 18,819 | (4) | |||||||||||||||||||||||||||||||||||||||||||||||
| Selected Balance Sheet Data (average) | |||||||||||||||||||||||||||||||||||||||||||||||||||||||||||
| Loans by Line of Business: | |||||||||||||||||||||||||||||||||||||||||||||||||||||||||||
| Consumer, Small and Business Banking | $ | 6,370 | 6,465 | 6,494 | 6,610 | 6,831 | (1) | (7) | $ | 6,418 | 6,933 | (7) | |||||||||||||||||||||||||||||||||||||||||||||||
| Consumer Lending: | |||||||||||||||||||||||||||||||||||||||||||||||||||||||||||
| Home Lending | 211,994 | 214,335 | 216,733 | 218,546 | 220,641 | (1) | (4) | 213,164 | 221,596 | (4) | |||||||||||||||||||||||||||||||||||||||||||||||||
| Credit Card | 47,463 | 46,412 | 45,842 | 43,541 | 41,609 | 2 | 14 | 46,937 | 41,066 | 14 | |||||||||||||||||||||||||||||||||||||||||||||||||
| Auto | 45,650 | 47,621 | 49,078 | 51,578 | 52,476 | (4) | (13) | 46,636 | 53,073 | (12) | |||||||||||||||||||||||||||||||||||||||||||||||||
| Personal Lending | 14,462 | 14,896 | 15,386 | 15,270 | 14,794 | (3) | (2) | 14,679 | 14,657 | — | |||||||||||||||||||||||||||||||||||||||||||||||||
| Total loans | $ | 325,939 | 329,729 | 333,533 | 335,545 | 336,351 | (1) | (3) | $ | 327,834 | 337,325 | (3) | |||||||||||||||||||||||||||||||||||||||||||||||
| Total deposits | 778,228 | 773,248 | 779,490 | 801,061 | 823,339 | 1 | (5) | 775,738 | 832,252 | (7) | |||||||||||||||||||||||||||||||||||||||||||||||||
| Allocated capital | 45,500 | 45,500 | 44,000 | 44,000 | 44,000 | — | 3 | 45,500 | 44,000 | 3 | |||||||||||||||||||||||||||||||||||||||||||||||||
| Selected Balance Sheet Data (period-end) | |||||||||||||||||||||||||||||||||||||||||||||||||||||||||||
| Loans by Line of Business: | |||||||||||||||||||||||||||||||||||||||||||||||||||||||||||
| Consumer, Small and Business Banking | $ | 6,513 | 6,584 | 6,735 | 6,746 | 6,937 | (1) | (6) | |||||||||||||||||||||||||||||||||||||||||||||||||||
| Consumer Lending: | |||||||||||||||||||||||||||||||||||||||||||||||||||||||||||
| Home Lending | 211,172 | 213,289 | 215,823 | 217,955 | 219,595 | (1) | (4) | ||||||||||||||||||||||||||||||||||||||||||||||||||||
| Credit Card | 48,400 | 46,867 | 46,735 | 44,409 | 42,415 | 3 | 14 | ||||||||||||||||||||||||||||||||||||||||||||||||||||
| Auto | 44,780 | 46,692 | 48,283 | 50,407 | 52,175 | (4) | (14) | ||||||||||||||||||||||||||||||||||||||||||||||||||||
| Personal Lending | 14,495 | 14,575 | 15,291 | 15,439 | 15,095 | (1) | (4) | ||||||||||||||||||||||||||||||||||||||||||||||||||||
| Total loans | $ | 325,360 | 328,007 | 332,867 | 334,956 | 336,217 | (1) | (3) | |||||||||||||||||||||||||||||||||||||||||||||||||||
| Total deposits | 781,817 | 794,160 | 782,309 | 798,897 | 820,495 | (2) | (5) | ||||||||||||||||||||||||||||||||||||||||||||||||||||
| Quarter ended | Jun 30, 2024 % Change from |
Six months ended | |||||||||||||||||||||||||||||||||||||||||||||||||||||||||
| ($ in millions, unless otherwise noted) | Jun 30, 2024 |
Mar 31, 2024 |
Dec 31, 2023 |
Sep 30, 2023 |
Jun 30, 2023 |
Mar 31, 2024 |
Jun 30, 2023 |
Jun 30, 2024 |
Jun 30, 2023 |
% Change |
|||||||||||||||||||||||||||||||||||||||||||||||||
| Selected Metrics | |||||||||||||||||||||||||||||||||||||||||||||||||||||||||||
| Consumer Banking and Lending: | |||||||||||||||||||||||||||||||||||||||||||||||||||||||||||
Return on allocated capital (1) |
15.1 | % | 14.5 | 17.6 | 19.1 | 16.9 | 14.8 | % | 16.7 | ||||||||||||||||||||||||||||||||||||||||||||||||||
| Efficiency ratio (2) | 63 | 66 | 64 | 62 | 64 | 65 | 64 | ||||||||||||||||||||||||||||||||||||||||||||||||||||
Retail bank branches (#, period-end) |
4,227 | 4,247 | 4,311 | 4,355 | 4,455 | — | % | (5) | |||||||||||||||||||||||||||||||||||||||||||||||||||
Digital active customers (# in millions, period-end) (3) |
35.6 | 35.5 | 34.8 | 34.6 | 34.2 | — | 4 | ||||||||||||||||||||||||||||||||||||||||||||||||||||
Mobile active customers (# in millions, period-end) (3) |
30.8 | 30.5 | 29.9 | 29.6 | 29.1 | 1 | 6 | ||||||||||||||||||||||||||||||||||||||||||||||||||||
Consumer, Small and Business Banking: |
|||||||||||||||||||||||||||||||||||||||||||||||||||||||||||
| Deposit spread (4) | 2.5 | % | 2.5 | 2.7 | 2.7 | 2.6 | 2.5 | % | 2.6 | ||||||||||||||||||||||||||||||||||||||||||||||||||
Debit card purchase volume ($ in billions) (5) |
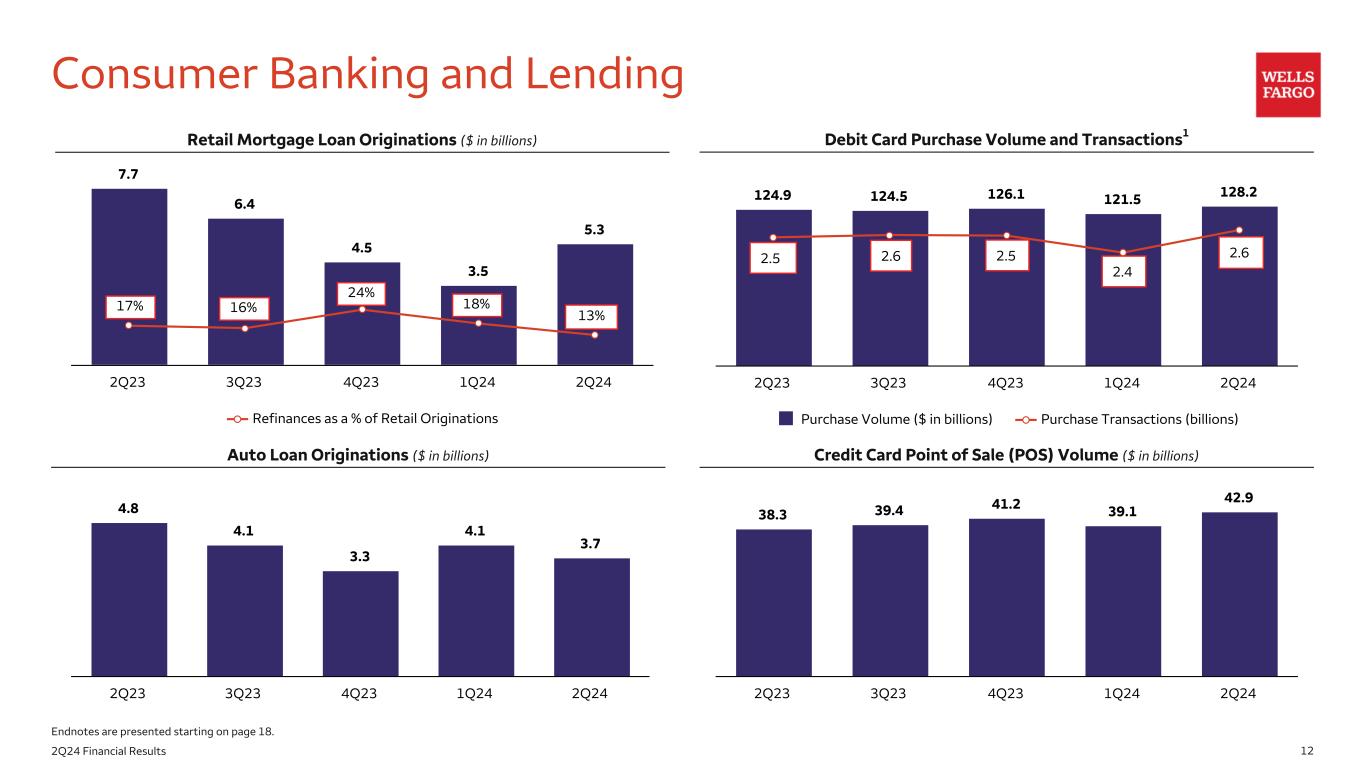
$ | 128.2 | 121.5 | 126.1 | 124.5 | 124.9 | 6 | 3 | $ | 249.7 | 242.2 | 3 | % | ||||||||||||||||||||||||||||||||||||||||||||||
Debit card purchase transactions (# in millions) (5) |
2,581 | 2,442 | 2,546 | 2,550 | 2,535 | 6 | 2 | 5,023 | 4,904 | 2 | |||||||||||||||||||||||||||||||||||||||||||||||||
| Home Lending: | |||||||||||||||||||||||||||||||||||||||||||||||||||||||||||
| Mortgage banking: | |||||||||||||||||||||||||||||||||||||||||||||||||||||||||||
| Net servicing income | $ | 89 | 91 | 113 | 41 | 62 | (2) | 44 | $ | 180 | 146 | 23 | |||||||||||||||||||||||||||||||||||||||||||||||
Net gains on mortgage loan originations/sales |
46 | 102 | 2 | 64 | 70 | (55) | (34) | 148 | 146 | 1 | |||||||||||||||||||||||||||||||||||||||||||||||||
| Total mortgage banking | $ | 135 | 193 | 115 | 105 | 132 | (30) | 2 | $ | 328 | 292 | 12 | |||||||||||||||||||||||||||||||||||||||||||||||
Retail originations ($ in billions) |
$ | 5.3 | 3.5 | 4.5 | 6.4 | 7.7 | 51 | (31) | $ | 8.8 | 13.3 | (34) | |||||||||||||||||||||||||||||||||||||||||||||||
| % of originations held for sale (HFS) | 38.6 | % | 43.5 | 45.4 | 40.7 | 45.3 | 40.6 | % | 46.0 | ||||||||||||||||||||||||||||||||||||||||||||||||||
Third party mortgage loans serviced ($ in billions, period-end) (6) |
$ | 512.8 | 527.5 | 559.7 | 591.8 | 609.1 | (3) | (16) | |||||||||||||||||||||||||||||||||||||||||||||||||||
| Mortgage servicing rights (MSR) carrying value (period-end) | 7,061 | 7,249 | 7,468 | 8,457 | 8,251 | (3) | (14) | ||||||||||||||||||||||||||||||||||||||||||||||||||||
| Ratio of MSR carrying value (period-end) to third party mortgage loans serviced (period-end) (6) | 1.38 | % | 1.37 | 1.33 | 1.43 | 1.35 | |||||||||||||||||||||||||||||||||||||||||||||||||||||
Home lending loans 30+ days delinquency rate (period-end) (7)(8)(9) |
0.33 | 0.30 | 0.32 | 0.29 | 0.25 | ||||||||||||||||||||||||||||||||||||||||||||||||||||||
| Credit Card: | |||||||||||||||||||||||||||||||||||||||||||||||||||||||||||
Point of sale (POS) volume ($ in billions) |
$ | 42.9 | 39.1 | 41.2 | 39.4 | 38.3 | 10 | 12 | $ | 82.0 | 72.5 | 13 | |||||||||||||||||||||||||||||||||||||||||||||||
New accounts (# in thousands) |
677 | 651 | 655 | 714 | 618 | 4 | 10 | 1,328 | 1,197 | 11 | |||||||||||||||||||||||||||||||||||||||||||||||||
Credit card loans 30+ days delinquency rate (period-end) (8)(9) |
2.71 | % | 2.92 | 2.80 | 2.61 | 2.31 | |||||||||||||||||||||||||||||||||||||||||||||||||||||
Credit card loans 90+ days delinquency rate (period-end) (8)(9) |
1.40 | 1.55 | 1.41 | 1.29 | 1.10 | ||||||||||||||||||||||||||||||||||||||||||||||||||||||
| Auto: | |||||||||||||||||||||||||||||||||||||||||||||||||||||||||||
| Auto originations ($ in billions) | $ | 3.7 | 4.1 | 3.3 | 4.1 | 4.8 | (10) | (23) | $ | 7.8 | 9.8 | (20) | |||||||||||||||||||||||||||||||||||||||||||||||
Auto loans 30+ days delinquency rate (period-end) (8)(9) |
2.31 | % | 2.36 | 2.80 | 2.60 | 2.55 | |||||||||||||||||||||||||||||||||||||||||||||||||||||
| Personal Lending: | |||||||||||||||||||||||||||||||||||||||||||||||||||||||||||
| New volume ($ in billions) | $ | 2.7 | 2.2 | 2.6 | 3.1 | 3.3 | 23 | (18) | $ | 4.9 | 6.2 | (21) | |||||||||||||||||||||||||||||||||||||||||||||||
| Quarter ended | Jun 30, 2024 % Change from |
Six months ended | |||||||||||||||||||||||||||||||||||||||||||||||||||||||||
| ($ in millions) | Jun 30, 2024 |
Mar 31, 2024 |
Dec 31, 2023 |
Sep 30, 2023 |
Jun 30, 2023 |
Mar 31, 2024 |
Jun 30, 2023 |
Jun 30, 2024 |
Jun 30, 2023 |
% Change |
|||||||||||||||||||||||||||||||||||||||||||||||||
| Income Statement | |||||||||||||||||||||||||||||||||||||||||||||||||||||||||||
| Net interest income | $ | 2,281 | 2,278 | 2,525 | 2,519 | 2,501 | — | % | (9) | $ | 4,559 | 4,990 | (9) | % | |||||||||||||||||||||||||||||||||||||||||||||
| Noninterest income: | |||||||||||||||||||||||||||||||||||||||||||||||||||||||||||
| Deposit-related fees | 290 | 284 | 257 | 257 | 248 | 2 | 17 | 574 | 484 | 19 | |||||||||||||||||||||||||||||||||||||||||||||||||
| Lending-related fees | 139 | 138 | 138 | 133 | 131 | 1 | 6 | 277 | 260 | 7 | |||||||||||||||||||||||||||||||||||||||||||||||||
| Lease income | 133 | 149 | 155 | 153 | 167 | (11) | (20) | 282 | 336 | (16) | |||||||||||||||||||||||||||||||||||||||||||||||||
| Other | 279 | 303 | 293 | 343 | 322 | (8) | (13) | 582 | 606 | (4) | |||||||||||||||||||||||||||||||||||||||||||||||||
| Total noninterest income | 841 | 874 | 843 | 886 | 868 | (4) | (3) | 1,715 | 1,686 | 2 | |||||||||||||||||||||||||||||||||||||||||||||||||
| Total revenue | 3,122 | 3,152 | 3,368 | 3,405 | 3,369 | (1) | (7) | 6,274 | 6,676 | (6) | |||||||||||||||||||||||||||||||||||||||||||||||||
| Net charge-offs | 97 | 75 | 35 | 37 | 63 | 29 | 54 | 172 | 24 | 617 | |||||||||||||||||||||||||||||||||||||||||||||||||
| Change in the allowance for credit losses | (68) | 68 | 5 | 15 | (37) | NM | (84) | — | (41) | 100 | |||||||||||||||||||||||||||||||||||||||||||||||||
| Provision for credit losses | 29 | 143 | 40 | 52 | 26 | (80) | 12 | 172 | (17) | NM | |||||||||||||||||||||||||||||||||||||||||||||||||
| Noninterest expense | 1,506 | 1,679 | 1,630 | 1,543 | 1,630 | (10) | (8) | 3,185 | 3,382 | (6) | |||||||||||||||||||||||||||||||||||||||||||||||||
| Income before income tax expense | 1,587 | 1,330 | 1,698 | 1,810 | 1,713 | 19 | (7) | 2,917 | 3,311 | (12) | |||||||||||||||||||||||||||||||||||||||||||||||||
| Income tax expense | 402 | 341 | 423 | 453 | 429 | 18 | (6) | 743 | 828 | (10) | |||||||||||||||||||||||||||||||||||||||||||||||||
| Less: Net income from noncontrolling interests | 3 | 3 | 2 | 3 | 3 | — | — | 6 | 6 | — | |||||||||||||||||||||||||||||||||||||||||||||||||
| Net income | $ | 1,182 | 986 | 1,273 | 1,354 | 1,281 | 20 | (8) | $ | 2,168 | 2,477 | (12) | |||||||||||||||||||||||||||||||||||||||||||||||
| Revenue by Line of Business | |||||||||||||||||||||||||||||||||||||||||||||||||||||||||||
| Middle Market Banking (1) | $ | 2,153 | 2,078 | 2,196 | 2,212 | 2,199 | 4 | (2) | $ | 4,231 | 4,354 | (3) | |||||||||||||||||||||||||||||||||||||||||||||||
| Asset-Based Lending and Leasing (1) | 969 | 1,074 | 1,172 | 1,193 | 1,170 | (10) | (17) | 2,043 | 2,322 | (12) | |||||||||||||||||||||||||||||||||||||||||||||||||
| Total revenue | $ | 3,122 | 3,152 | 3,368 | 3,405 | 3,369 | (1) | (7) | $ | 6,274 | 6,676 | (6) | |||||||||||||||||||||||||||||||||||||||||||||||
| Revenue by Product | |||||||||||||||||||||||||||||||||||||||||||||||||||||||||||
| Lending and leasing | $ | 1,308 | 1,309 | 1,337 | 1,321 | 1,332 | — | (2) | $ | 2,617 | 2,656 | (1) | |||||||||||||||||||||||||||||||||||||||||||||||
| Treasury management and payments | 1,412 | 1,421 | 1,527 | 1,541 | 1,584 | (1) | (11) | 2,833 | 3,146 | (10) | |||||||||||||||||||||||||||||||||||||||||||||||||
| Other | 402 | 422 | 504 | 543 | 453 | (5) | (11) | 824 | 874 | (6) | |||||||||||||||||||||||||||||||||||||||||||||||||
| Total revenue | $ | 3,122 | 3,152 | 3,368 | 3,405 | 3,369 | (1) | (7) | $ | 6,274 | 6,676 | (6) | |||||||||||||||||||||||||||||||||||||||||||||||
| Selected Metrics | |||||||||||||||||||||||||||||||||||||||||||||||||||||||||||
| Return on allocated capital | 17.3 | % | 14.3 | 19.0 | 20.2 | 19.3 | 15.8 | % | 18.7 | ||||||||||||||||||||||||||||||||||||||||||||||||||
| Efficiency ratio | 48 | 53 | 48 | 45 | 48 | 51 | 51 | ||||||||||||||||||||||||||||||||||||||||||||||||||||
| Quarter ended | Jun 30, 2024 % Change from |
Six months ended | |||||||||||||||||||||||||||||||||||||||||||||||||||||||||
| ($ in millions) | Jun 30, 2024 |
Mar 31, 2024 |
Dec 31, 2023 |
Sep 30, 2023 |
Jun 30, 2023 |
Mar 31, 2024 |
Jun 30, 2023 |
Jun 30, 2024 |
Jun 30, 2023 |
% Change |
|||||||||||||||||||||||||||||||||||||||||||||||||
| Selected Balance Sheet Data (average) | |||||||||||||||||||||||||||||||||||||||||||||||||||||||||||
| Loans: | |||||||||||||||||||||||||||||||||||||||||||||||||||||||||||
| Commercial and industrial | $ | 164,027 | 163,273 | 162,877 | 164,182 | 165,980 | — | % | (1) | $ | 163,650 | 164,603 | (1) | % | |||||||||||||||||||||||||||||||||||||||||||||
| Commercial real estate | 44,990 | 45,296 | 45,393 | 45,716 | 45,855 | (1) | (2) | 45,143 | 45,858 | (2) | |||||||||||||||||||||||||||||||||||||||||||||||||
| Lease financing and other | 15,406 | 15,352 | 15,062 | 14,518 | 13,989 | — | 10 | 15,379 | 13,872 | 11 | |||||||||||||||||||||||||||||||||||||||||||||||||
| Total loans | $ | 224,423 | 223,921 | 223,332 | 224,416 | 225,824 | — | (1) | $ | 224,172 | 224,333 | — | |||||||||||||||||||||||||||||||||||||||||||||||
| Loans by Line of Business: | |||||||||||||||||||||||||||||||||||||||||||||||||||||||||||
| Middle Market Banking (1) | $ | 128,259 | 119,273 | 118,971 | 120,509 | 122,204 | 8 | 5 | $ | 123,766 | 121,916 | 2 | |||||||||||||||||||||||||||||||||||||||||||||||
| Asset-Based Lending and Leasing (1) | 96,164 | 104,648 | 104,361 | 103,907 | 103,620 | (8) | (7) | 100,406 | 102,417 | (2) | |||||||||||||||||||||||||||||||||||||||||||||||||
| Total loans | $ | 224,423 | 223,921 | 223,332 | 224,416 | 225,824 | — | (1) | $ | 224,172 | 224,333 | — | |||||||||||||||||||||||||||||||||||||||||||||||
| Total deposits | 166,892 | 164,027 | 163,299 | 160,556 | 166,747 | 2 | — | 165,460 | 168,597 | (2) | |||||||||||||||||||||||||||||||||||||||||||||||||
| Allocated capital | 26,000 | 26,000 | 25,500 | 25,500 | 25,500 | — | 2 | 26,000 | 25,500 | 2 | |||||||||||||||||||||||||||||||||||||||||||||||||
| Selected Balance Sheet Data (period-end) | |||||||||||||||||||||||||||||||||||||||||||||||||||||||||||
| Loans: | |||||||||||||||||||||||||||||||||||||||||||||||||||||||||||
| Commercial and industrial | $ | 165,878 | 166,842 | 163,797 | 165,094 | 168,492 | (1) | (2) | |||||||||||||||||||||||||||||||||||||||||||||||||||
| Commercial real estate | 44,978 | 45,292 | 45,534 | 45,663 | 45,784 | (1) | (2) | ||||||||||||||||||||||||||||||||||||||||||||||||||||
| Lease financing and other | 15,617 | 15,526 | 15,443 | 15,014 | 14,435 | 1 | 8 | ||||||||||||||||||||||||||||||||||||||||||||||||||||
| Total loans | $ | 226,473 | 227,660 | 224,774 | 225,771 | 228,711 | (1) | (1) | |||||||||||||||||||||||||||||||||||||||||||||||||||
| Loans by Line of Business: | |||||||||||||||||||||||||||||||||||||||||||||||||||||||||||
| Middle Market Banking (1) | $ | 129,023 | 120,401 | 118,482 | 119,354 | 122,104 | 7 | 6 | |||||||||||||||||||||||||||||||||||||||||||||||||||
| Asset-Based Lending and Leasing (1) | 97,450 | 107,259 | 106,292 | 106,417 | 106,607 | (9) | (9) | ||||||||||||||||||||||||||||||||||||||||||||||||||||
| Total loans | $ | 226,473 | 227,660 | 224,774 | 225,771 | 228,711 | (1) | (1) | |||||||||||||||||||||||||||||||||||||||||||||||||||
| Total deposits | 168,979 | 168,547 | 162,526 | 160,368 | 164,764 | — | 3 | ||||||||||||||||||||||||||||||||||||||||||||||||||||
| Quarter ended | Jun 30, 2024 % Change from |
Six months ended | |||||||||||||||||||||||||||||||||||||||||||||||||||||||||
| ($ in millions) | Jun 30, 2024 |
Mar 31, 2024 |
Dec 31, 2023 |
Sep 30, 2023 |
Jun 30, 2023 |
Mar 31, 2024 |
Jun 30, 2023 |
Jun 30, 2024 |
Jun 30, 2023 |
% Change |
|||||||||||||||||||||||||||||||||||||||||||||||||
| Income Statement | |||||||||||||||||||||||||||||||||||||||||||||||||||||||||||
| Net interest income | $ | 1,945 | 2,027 | 2,359 | 2,319 | 2,359 | (4) | % | (18) | $ | 3,972 | 4,820 | (18) | % | |||||||||||||||||||||||||||||||||||||||||||||
| Noninterest income: | |||||||||||||||||||||||||||||||||||||||||||||||||||||||||||
| Deposit-related fees | 263 | 262 | 246 | 247 | 247 | — | 6 | 525 | 483 | 9 | |||||||||||||||||||||||||||||||||||||||||||||||||
| Lending-related fees | 205 | 203 | 199 | 206 | 191 | 1 | 7 | 408 | 385 | 6 | |||||||||||||||||||||||||||||||||||||||||||||||||
| Investment banking fees | 634 | 647 | 489 | 545 | 390 | (2) | 63 | 1,281 | 704 | 82 | |||||||||||||||||||||||||||||||||||||||||||||||||
| Net gains from trading activities | 1,387 | 1,405 | 1,022 | 1,193 | 1,081 | (1) | 28 | 2,792 | 2,338 | 19 | |||||||||||||||||||||||||||||||||||||||||||||||||
| Other | 404 | 438 | 420 | 413 | 363 | (8) | 11 | 842 | 803 | 5 | |||||||||||||||||||||||||||||||||||||||||||||||||
| Total noninterest income | 2,893 | 2,955 | 2,376 | 2,604 | 2,272 | (2) | 27 | 5,848 | 4,713 | 24 | |||||||||||||||||||||||||||||||||||||||||||||||||
| Total revenue | 4,838 | 4,982 | 4,735 | 4,923 | 4,631 | (3) | 4 | 9,820 | 9,533 | 3 | |||||||||||||||||||||||||||||||||||||||||||||||||
| Net charge-offs | 303 | 196 | 376 | 105 | 83 | 55 | 265 | 499 | 100 | 399 | |||||||||||||||||||||||||||||||||||||||||||||||||
| Change in the allowance for credit losses | (18) | (191) | 122 | 219 | 850 | 91 | NM | (209) | 1,085 | NM | |||||||||||||||||||||||||||||||||||||||||||||||||
| Provision for credit losses | 285 | 5 | 498 | 324 | 933 | NM | (69) | 290 | 1,185 | (76) | |||||||||||||||||||||||||||||||||||||||||||||||||
| Noninterest expense | 2,170 | 2,330 | 2,132 | 2,182 | 2,087 | (7) | 4 | 4,500 | 4,304 | 5 | |||||||||||||||||||||||||||||||||||||||||||||||||
| Income before income tax expense | 2,383 | 2,647 | 2,105 | 2,417 | 1,611 | (10) | 48 | 5,030 | 4,044 | 24 | |||||||||||||||||||||||||||||||||||||||||||||||||
| Income tax expense | 598 | 666 | 523 | 601 | 401 | (10) | 49 | 1,264 | 1,016 | 24 | |||||||||||||||||||||||||||||||||||||||||||||||||
| Net income | $ | 1,785 | 1,981 | 1,582 | 1,816 | 1,210 | (10) | 48 | $ | 3,766 | 3,028 | 24 | |||||||||||||||||||||||||||||||||||||||||||||||
| Revenue by Line of Business | |||||||||||||||||||||||||||||||||||||||||||||||||||||||||||
| Banking: | |||||||||||||||||||||||||||||||||||||||||||||||||||||||||||
| Lending | $ | 688 | 681 | 774 | 721 | 685 | 1 | — | $ | 1,369 | 1,377 | (1) | |||||||||||||||||||||||||||||||||||||||||||||||
| Treasury Management and Payments | 687 | 686 | 742 | 747 | 762 | — | (10) | 1,373 | 1,547 | (11) | |||||||||||||||||||||||||||||||||||||||||||||||||
| Investment Banking | 430 | 474 | 383 | 430 | 311 | (9) | 38 | 904 | 591 | 53 | |||||||||||||||||||||||||||||||||||||||||||||||||
| Total Banking | 1,805 | 1,841 | 1,899 | 1,898 | 1,758 | (2) | 3 | 3,646 | 3,515 | 4 | |||||||||||||||||||||||||||||||||||||||||||||||||
| Commercial Real Estate | 1,283 | 1,223 | 1,291 | 1,376 | 1,333 | 5 | (4) | 2,506 | 2,644 | (5) | |||||||||||||||||||||||||||||||||||||||||||||||||
| Markets: | |||||||||||||||||||||||||||||||||||||||||||||||||||||||||||
| Fixed Income, Currencies, and Commodities (FICC) | 1,228 | 1,359 | 1,122 | 1,148 | 1,133 | (10) | 8 | 2,587 | 2,418 | 7 | |||||||||||||||||||||||||||||||||||||||||||||||||
| Equities | 558 | 450 | 457 | 518 | 397 | 24 | 41 | 1,008 | 834 | 21 | |||||||||||||||||||||||||||||||||||||||||||||||||
| Credit Adjustment (CVA/DVA) and Other | 7 | 19 | (8) | (12) | 14 | (63) | (50) | 26 | 85 | (69) | |||||||||||||||||||||||||||||||||||||||||||||||||
| Total Markets | 1,793 | 1,828 | 1,571 | 1,654 | 1,544 | (2) | 16 | 3,621 | 3,337 | 9 | |||||||||||||||||||||||||||||||||||||||||||||||||
| Other | (43) | 90 | (26) | (5) | (4) | NM | NM | 47 | 37 | 27 | |||||||||||||||||||||||||||||||||||||||||||||||||
| Total revenue | $ | 4,838 | 4,982 | 4,735 | 4,923 | 4,631 | (3) | 4 | $ | 9,820 | 9,533 | 3 | |||||||||||||||||||||||||||||||||||||||||||||||
| Selected Metrics | |||||||||||||||||||||||||||||||||||||||||||||||||||||||||||
| Return on allocated capital | 15.4 | % | 17.2 | 13.4 | 15.5 | 10.2 | 16.3 | % | 13.0 | ||||||||||||||||||||||||||||||||||||||||||||||||||
| Efficiency ratio | 45 | 47 | 45 | 44 | 45 | 46 | 45 | ||||||||||||||||||||||||||||||||||||||||||||||||||||
| Quarter ended | Jun 30, 2024 % Change from |
Six months ended | |||||||||||||||||||||||||||||||||||||||||||||||||||||||||
| ($ in millions) | Jun 30, 2024 |
Mar 31, 2024 |
Dec 31, 2023 |
Sep 30, 2023 |
Jun 30, 2023 |
Mar 31, 2024 |
Jun 30, 2023 |
Jun 30, 2024 |
Jun 30, 2023 |
% Change |
|||||||||||||||||||||||||||||||||||||||||||||||||
| Selected Balance Sheet Data (average) | |||||||||||||||||||||||||||||||||||||||||||||||||||||||||||
| Loans: | |||||||||||||||||||||||||||||||||||||||||||||||||||||||||||
| Commercial and industrial | $ | 180,789 | 185,432 | 191,014 | 191,128 | 190,529 | (3) | % | (5) | $ | 183,110 | 192,141 | (5) | % | |||||||||||||||||||||||||||||||||||||||||||||
| Commercial real estate | 94,998 | 97,811 | 99,077 | 100,523 | 100,941 | (3) | (6) | 96,405 | 100,956 | (5) | |||||||||||||||||||||||||||||||||||||||||||||||||
| Total loans | $ | 275,787 | 283,243 | 290,091 | 291,651 | 291,470 | (3) | (5) | $ | 279,515 | 293,097 | (5) | |||||||||||||||||||||||||||||||||||||||||||||||
| Loans by Line of Business: | |||||||||||||||||||||||||||||||||||||||||||||||||||||||||||
| Banking | $ | 86,130 | 90,897 | 94,699 | 94,010 | 95,413 | (5) | (10) | $ | 88,513 | 97,235 | (9) | |||||||||||||||||||||||||||||||||||||||||||||||
| Commercial Real Estate | 128,107 | 131,709 | 133,921 | 135,639 | 136,473 | (3) | (6) | 129,908 | 136,639 | (5) | |||||||||||||||||||||||||||||||||||||||||||||||||
| Markets | 61,550 | 60,637 | 61,471 | 62,002 | 59,584 | 2 | 3 | 61,094 | 59,223 | 3 | |||||||||||||||||||||||||||||||||||||||||||||||||
| Total loans | $ | 275,787 | 283,243 | 290,091 | 291,651 | 291,470 | (3) | (5) | $ | 279,515 | 293,097 | (5) | |||||||||||||||||||||||||||||||||||||||||||||||
| Trading-related assets: | |||||||||||||||||||||||||||||||||||||||||||||||||||||||||||
| Trading account securities | $ | 136,101 | 121,347 | 118,938 | 122,376 | 118,462 | 12 | 15 | $ | 128,724 | 115,561 | 11 | |||||||||||||||||||||||||||||||||||||||||||||||
| Reverse repurchase agreements/securities borrowed | 64,896 | 62,856 | 65,678 | 62,284 | 60,164 | 3 | 8 | 63,876 | 58,997 | 8 | |||||||||||||||||||||||||||||||||||||||||||||||||
| Derivative assets | 18,552 | 17,033 | 19,308 | 19,760 | 17,522 | 9 | 6 | 17,793 | 17,724 | — | |||||||||||||||||||||||||||||||||||||||||||||||||
| Total trading-related assets | $ | 219,549 | 201,236 | 203,924 | 204,420 | 196,148 | 9 | 12 | $ | 210,393 | 192,282 | 9 | |||||||||||||||||||||||||||||||||||||||||||||||
| Total assets | 558,063 | 550,933 | 556,196 | 559,647 | 550,091 | 1 | 1 | 554,498 | 549,453 | 1 | |||||||||||||||||||||||||||||||||||||||||||||||||
| Total deposits | 187,545 | 183,273 | 173,117 | 157,212 | 160,251 | 2 | 17 | 185,408 | 158,908 | 17 | |||||||||||||||||||||||||||||||||||||||||||||||||
| Allocated capital | 44,000 | 44,000 | 44,000 | 44,000 | 44,000 | — | — | 44,000 | 44,000 | — | |||||||||||||||||||||||||||||||||||||||||||||||||
| Selected Balance Sheet Data (period-end) | |||||||||||||||||||||||||||||||||||||||||||||||||||||||||||
| Loans: | |||||||||||||||||||||||||||||||||||||||||||||||||||||||||||
| Commercial and industrial | $ | 181,441 | 178,986 | 189,379 | 190,547 | 190,317 | 1 | (5) | |||||||||||||||||||||||||||||||||||||||||||||||||||
| Commercial real estate | 93,889 | 96,611 | 98,053 | 99,783 | 101,028 | (3) | (7) | ||||||||||||||||||||||||||||||||||||||||||||||||||||
| Total loans | $ | 275,330 | 275,597 | 287,432 | 290,330 | 291,345 | — | (5) | |||||||||||||||||||||||||||||||||||||||||||||||||||
| Loans by Line of Business: | |||||||||||||||||||||||||||||||||||||||||||||||||||||||||||
| Banking | $ | 84,054 | 86,066 | 93,987 | 93,723 | 93,596 | (2) | (10) | |||||||||||||||||||||||||||||||||||||||||||||||||||
| Commercial Real Estate | 126,080 | 129,627 | 131,968 | 133,939 | 136,257 | (3) | (7) | ||||||||||||||||||||||||||||||||||||||||||||||||||||
| Markets | 65,196 | 59,904 | 61,477 | 62,668 | 61,492 | 9 | 6 | ||||||||||||||||||||||||||||||||||||||||||||||||||||
| Total loans | $ | 275,330 | 275,597 | 287,432 | 290,330 | 291,345 | — | (5) | |||||||||||||||||||||||||||||||||||||||||||||||||||
| Trading-related assets: | |||||||||||||||||||||||||||||||||||||||||||||||||||||||||||
| Trading account securities | $ | 140,928 | 133,079 | 115,562 | 120,547 | 130,008 | 6 | 8 | |||||||||||||||||||||||||||||||||||||||||||||||||||
| Reverse repurchase agreements/securities borrowed | 70,615 | 62,019 | 63,614 | 64,240 | 59,020 | 14 | 20 | ||||||||||||||||||||||||||||||||||||||||||||||||||||
| Derivative assets | 19,186 | 17,726 | 18,023 | 21,231 | 17,804 | 8 | 8 | ||||||||||||||||||||||||||||||||||||||||||||||||||||
| Total trading-related assets | $ | 230,729 | 212,824 | 197,199 | 206,018 | 206,832 | 8 | 12 | |||||||||||||||||||||||||||||||||||||||||||||||||||
| Total assets | 565,334 | 553,105 | 547,203 | 557,642 | 559,520 | 2 | 1 | ||||||||||||||||||||||||||||||||||||||||||||||||||||
| Total deposits | 200,920 | 195,969 | 185,142 | 162,776 | 158,770 | 3 | 27 | ||||||||||||||||||||||||||||||||||||||||||||||||||||
| Quarter ended | Jun 30, 2024 % Change from |
Six months ended | |||||||||||||||||||||||||||||||||||||||||||||||||||||||||
| ($ in millions, unless otherwise noted) | Jun 30, 2024 |
Mar 31, 2024 |
Dec 31, 2023 |
Sep 30, 2023 |
Jun 30, 2023 |
Mar 31, 2024 |
Jun 30, 2023 |
Jun 30, 2024 |
Jun 30, 2023 |
% Change |
|||||||||||||||||||||||||||||||||||||||||||||||||
| Income Statement | |||||||||||||||||||||||||||||||||||||||||||||||||||||||||||
| Net interest income | $ | 906 | 869 | 906 | 1,007 | 1,009 | 4 | % | (10) | $ | 1,775 | 2,053 | (14) | % | |||||||||||||||||||||||||||||||||||||||||||||
| Noninterest income: | |||||||||||||||||||||||||||||||||||||||||||||||||||||||||||
| Investment advisory and other asset-based fees | 2,357 | 2,267 | 2,111 | 2,164 | 2,110 | 4 | 12 | 4,624 | 4,171 | 11 | |||||||||||||||||||||||||||||||||||||||||||||||||
| Commissions and brokerage services fees | 521 | 545 | 531 | 492 | 494 | (4) | 5 | 1,066 | 1,035 | 3 | |||||||||||||||||||||||||||||||||||||||||||||||||
| Other | 74 | 61 | 112 | 39 | 35 | 21 | 111 | 135 | 70 | 93 | |||||||||||||||||||||||||||||||||||||||||||||||||
| Total noninterest income | 2,952 | 2,873 | 2,754 | 2,695 | 2,639 | 3 | 12 | 5,825 | 5,276 | 10 | |||||||||||||||||||||||||||||||||||||||||||||||||
| Total revenue | 3,858 | 3,742 | 3,660 | 3,702 | 3,648 | 3 | 6 | 7,600 | 7,329 | 4 | |||||||||||||||||||||||||||||||||||||||||||||||||
| Net charge-offs | (2) | 6 | — | 1 | (1) | NM | (100) | 4 | (2) | 300 | |||||||||||||||||||||||||||||||||||||||||||||||||
| Change in the allowance for credit losses | (12) | (3) | (19) | (11) | 25 | NM | NM | (15) | 37 | NM | |||||||||||||||||||||||||||||||||||||||||||||||||
| Provision for credit losses | (14) | 3 | (19) | (10) | 24 | NM | NM | (11) | 35 | NM | |||||||||||||||||||||||||||||||||||||||||||||||||
| Noninterest expense | 3,193 | 3,230 | 3,023 | 3,006 | 2,974 | (1) | 7 | 6,423 | 6,035 | 6 | |||||||||||||||||||||||||||||||||||||||||||||||||
| Income before income tax expense | 679 | 509 | 656 | 706 | 650 | 33 | 4 | 1,188 | 1,259 | (6) | |||||||||||||||||||||||||||||||||||||||||||||||||
| Income tax expense | 195 | 128 | 165 | 177 | 163 | 52 | 20 | 323 | 315 | 3 | |||||||||||||||||||||||||||||||||||||||||||||||||
| Net income | $ | 484 | 381 | 491 | 529 | 487 | 27 | (1) | $ | 865 | 944 | (8) | |||||||||||||||||||||||||||||||||||||||||||||||
| Selected Metrics | |||||||||||||||||||||||||||||||||||||||||||||||||||||||||||
| Return on allocated capital | 29.0 | % | 22.7 | 30.4 | 32.8 | 30.5 | 25.8 | % | 29.7 | (13) | |||||||||||||||||||||||||||||||||||||||||||||||||
| Efficiency ratio | 83 | 86 | 83 | 81 | 82 | 85 | 82 | 4 | |||||||||||||||||||||||||||||||||||||||||||||||||||
Client assets ($ in billions, period-end): |
|||||||||||||||||||||||||||||||||||||||||||||||||||||||||||
Advisory assets |
$ | 945 | 939 | 891 | 825 | 850 | 1 | 11 | |||||||||||||||||||||||||||||||||||||||||||||||||||
Other brokerage assets and deposits |
1,255 | 1,247 | 1,193 | 1,123 | 1,148 | 1 | 9 | ||||||||||||||||||||||||||||||||||||||||||||||||||||
Total client assets |
$ | 2,200 | 2,186 | 2,084 | 1,948 | 1,998 | 1 | 10 | |||||||||||||||||||||||||||||||||||||||||||||||||||
| Selected Balance Sheet Data (average) | |||||||||||||||||||||||||||||||||||||||||||||||||||||||||||
| Total loans | $ | 83,166 | 82,483 | 82,181 | 82,195 | 83,045 | 1 | — | $ | 82,824 | 83,331 | (1) | |||||||||||||||||||||||||||||||||||||||||||||||
| Total deposits | 102,843 | 101,474 | 102,130 | 107,500 | 112,360 | 1 | (8) | 102,158 | 119,443 | (14) | |||||||||||||||||||||||||||||||||||||||||||||||||
| Allocated capital | 6,500 | 6,500 | 6,250 | 6,250 | 6,250 | — | 4 | 6,500 | 6,250 | 4 | |||||||||||||||||||||||||||||||||||||||||||||||||
| Selected Balance Sheet Data (period-end) | |||||||||||||||||||||||||||||||||||||||||||||||||||||||||||
| Total loans | $ | 83,338 | 82,999 | 82,555 | 82,331 | 82,456 | — | 1 | |||||||||||||||||||||||||||||||||||||||||||||||||||
| Total deposits | 103,722 | 102,478 | 103,902 | 103,255 | 108,532 | 1 | (4) | ||||||||||||||||||||||||||||||||||||||||||||||||||||
| Quarter ended | Jun 30, 2024 % Change from |
Six months ended | |||||||||||||||||||||||||||||||||||||||||||||||||||||||||
| ($ in millions) | Jun 30, 2024 |
Mar 31, 2024 |
Dec 31, 2023 |
Sep 30, 2023 |
Jun 30, 2023 |
Mar 31, 2024 |
Jun 30, 2023 |
Jun 30, 2024 |
Jun 30, 2023 |
% Change |
|||||||||||||||||||||||||||||||||||||||||||||||||
| Income Statement | |||||||||||||||||||||||||||||||||||||||||||||||||||||||||||
| Net interest income | $ | (144) | 32 | (544) | (269) | (91) | NM | (58) | $ | (112) | (75) | (49) | % | ||||||||||||||||||||||||||||||||||||||||||||||
| Noninterest income | 392 | 291 | 284 | 21 | 121 | 35 | % | 224 | 683 | 126 | 442 | ||||||||||||||||||||||||||||||||||||||||||||||||
| Total revenue | 248 | 323 | (260) | (248) | 30 | (23) | 727 | 571 | 51 | NM | |||||||||||||||||||||||||||||||||||||||||||||||||
| Net charge-offs | (2) | (1) | (5) | (1) | (2) | (100) | — | (3) | (4) | 25 | |||||||||||||||||||||||||||||||||||||||||||||||||
| Change in the allowance for credit losses | 6 | — | (22) | 64 | (142) | NM | 104 | 6 | (20) | 130 | |||||||||||||||||||||||||||||||||||||||||||||||||
| Provision for credit losses | 4 | (1) | (27) | 63 | (144) | 500 | 103 | 3 | (24) | 113 | |||||||||||||||||||||||||||||||||||||||||||||||||
| Noninterest expense | 723 | 1,075 | 2,955 | 469 | 269 | (33) | 169 | 1,798 | 877 | 105 | |||||||||||||||||||||||||||||||||||||||||||||||||
| Loss before income tax benefit | (479) | (751) | (3,188) | (780) | (95) | 36 | NM | (1,230) | (802) | (53) | |||||||||||||||||||||||||||||||||||||||||||||||||
| Income tax benefit | (157) | (317) | (1,339) | (641) | (103) | 50 | (52) | (474) | (375) | (26) | |||||||||||||||||||||||||||||||||||||||||||||||||
Less: Net income (loss) from noncontrolling interests |
(4) | 1 | 62 | (34) | (38) | NM | 89 | (3) | (152) | 98 | |||||||||||||||||||||||||||||||||||||||||||||||||
| Net income (loss) | $ | (318) | (435) | (1,911) | (105) | 46 | 27 | NM | $ | (753) | (275) | NM | |||||||||||||||||||||||||||||||||||||||||||||||
| Selected Balance Sheet Data (average) | |||||||||||||||||||||||||||||||||||||||||||||||||||||||||||
| Cash and due from banks, and interest-earning deposits with banks | $ | 202,812 | 211,612 | 198,315 | 164,900 | 132,505 | (4) | 53 | $ | 207,212 | 125,004 | 66 | |||||||||||||||||||||||||||||||||||||||||||||||
| Available-for-sale debt securities | 131,822 | 122,794 | 115,346 | 119,745 | 130,496 | 7 | 1 | 127,308 | 129,638 | (2) | |||||||||||||||||||||||||||||||||||||||||||||||||
| Held-to-maturity debt securities | 251,100 | 257,088 | 261,103 | 266,012 | 270,999 | (2) | (7) | 254,094 | 271,854 | (7) | |||||||||||||||||||||||||||||||||||||||||||||||||
| Equity securities | 15,571 | 15,958 | 15,906 | 15,784 | 15,327 | (2) | 2 | 15,765 | 15,422 | 2 | |||||||||||||||||||||||||||||||||||||||||||||||||
| Total loans | 7,662 | 8,699 | 8,904 | 9,386 | 9,216 | (12) | (17) | 8,181 | 9,185 | (11) | |||||||||||||||||||||||||||||||||||||||||||||||||
| Total assets | 656,535 | 663,483 | 645,573 | 623,339 | 610,417 | (1) | 8 | 660,009 | 603,293 | 9 | |||||||||||||||||||||||||||||||||||||||||||||||||
| Total deposits | 110,970 | 119,606 | 122,880 | 113,978 | 84,752 | (7) | 31 | 115,288 | 72,846 | 58 | |||||||||||||||||||||||||||||||||||||||||||||||||
| Selected Balance Sheet Data (period-end) | |||||||||||||||||||||||||||||||||||||||||||||||||||||||||||
| Cash and due from banks, and interest-earning deposits with banks | $ | 211,050 | 246,057 | 211,420 | 194,653 | 128,077 | (14) | 65 | |||||||||||||||||||||||||||||||||||||||||||||||||||
| Available-for-sale debt securities | 138,087 | 127,084 | 118,923 | 115,005 | 123,169 | 9 | 12 | ||||||||||||||||||||||||||||||||||||||||||||||||||||
| Held-to-maturity debt securities | 247,746 | 255,761 | 259,748 | 264,248 | 269,414 | (3) | (8) | ||||||||||||||||||||||||||||||||||||||||||||||||||||
| Equity securities | 15,297 | 15,798 | 15,810 | 15,496 | 15,097 | (3) | 1 | ||||||||||||||||||||||||||||||||||||||||||||||||||||
| Total loans | 7,406 | 8,521 | 9,054 | 9,036 | 9,231 | (13) | (20) | ||||||||||||||||||||||||||||||||||||||||||||||||||||
| Total assets | 670,494 | 699,401 | 674,075 | 641,455 | 593,597 | (4) | 13 | ||||||||||||||||||||||||||||||||||||||||||||||||||||
| Total deposits | 110,456 | 121,993 | 124,294 | 128,714 | 92,023 | (9) | 20 | ||||||||||||||||||||||||||||||||||||||||||||||||||||
| Quarter ended | Jun 30, 2024 $ Change from |
||||||||||||||||||||||||||||||||||||||||
($ in millions) |
Jun 30, 2024 |
Mar 31, 2024 |
Dec 31, 2023 |
Sep 30, 2023 |
Jun 30, 2023 |
Mar 31, 2024 |
Jun 30, 2023 |
||||||||||||||||||||||||||||||||||
| Period-End Loans | |||||||||||||||||||||||||||||||||||||||||
| Commercial and industrial | $ | 374,588 | 372,963 | 380,388 | 382,527 | 386,011 | 1,625 | (11,423) | |||||||||||||||||||||||||||||||||
| Commercial real estate | 145,318 | 148,786 | 150,616 | 152,486 | 154,276 | (3,468) | (8,958) | ||||||||||||||||||||||||||||||||||
| Lease financing | 16,705 | 16,579 | 16,423 | 16,038 | 15,334 | 126 | 1,371 | ||||||||||||||||||||||||||||||||||
| Total commercial | 536,611 | 538,328 | 547,427 | 551,051 | 555,621 | (1,717) | (19,010) | ||||||||||||||||||||||||||||||||||
| Residential mortgage | 255,085 | 257,622 | 260,724 | 263,174 | 265,085 | (2,537) | (10,000) | ||||||||||||||||||||||||||||||||||
| Credit card | 53,756 | 52,035 | 52,230 | 49,851 | 47,717 | 1,721 | 6,039 | ||||||||||||||||||||||||||||||||||
| Auto | 44,280 | 46,202 | 47,762 | 49,865 | 51,587 | (1,922) | (7,307) | ||||||||||||||||||||||||||||||||||
| Other consumer | 28,175 | 28,597 | 28,539 | 28,483 | 27,950 | (422) | 225 | ||||||||||||||||||||||||||||||||||
| Total consumer | 381,296 | 384,456 | 389,255 | 391,373 | 392,339 | (3,160) | (11,043) | ||||||||||||||||||||||||||||||||||
| Total loans | $ | 917,907 | 922,784 | 936,682 | 942,424 | 947,960 | (4,877) | (30,053) | |||||||||||||||||||||||||||||||||
| Average Loans | |||||||||||||||||||||||||||||||||||||||||
| Commercial and industrial | $ | 371,514 | 375,593 | 380,566 | 382,277 | 383,361 | (4,079) | (11,847) | |||||||||||||||||||||||||||||||||
| Commercial real estate | 146,750 | 150,083 | 151,665 | 153,686 | 154,660 | (3,333) | (7,910) | ||||||||||||||||||||||||||||||||||
| Lease financing | 16,519 | 16,363 | 16,123 | 15,564 | 15,010 | 156 | 1,509 | ||||||||||||||||||||||||||||||||||
| Total commercial | 534,783 | 542,039 | 548,354 | 551,527 | 553,031 | (7,256) | (18,248) | ||||||||||||||||||||||||||||||||||
| Residential mortgage | 256,189 | 259,053 | 261,776 | 263,918 | 266,128 | (2,864) | (9,939) | ||||||||||||||||||||||||||||||||||
| Credit card | 52,642 | 51,708 | 51,249 | 48,889 | 46,762 | 934 | 5,880 | ||||||||||||||||||||||||||||||||||
| Auto | 45,164 | 47,114 | 48,554 | 51,014 | 51,880 | (1,950) | (6,716) | ||||||||||||||||||||||||||||||||||
| Other consumer | 28,199 | 28,161 | 28,108 | 27,845 | 28,105 | 38 | 94 | ||||||||||||||||||||||||||||||||||
| Total consumer | 382,194 | 386,036 | 389,687 | 391,666 | 392,875 | (3,842) | (10,681) | ||||||||||||||||||||||||||||||||||
| Total loans | $ | 916,977 | 928,075 | 938,041 | 943,193 | 945,906 | (11,098) | (28,929) | |||||||||||||||||||||||||||||||||
| Average Interest Rates | |||||||||||||||||||||||||||||||||||||||||
| Commercial and industrial | 7.22 | % | 7.18 | 7.20 | 7.03 | 6.70 | |||||||||||||||||||||||||||||||||||
| Commercial real estate | 6.93 | 6.94 | 6.88 | 6.83 | 6.59 | ||||||||||||||||||||||||||||||||||||
| Lease financing | 5.47 | 5.34 | 5.17 | 4.90 | 4.76 | ||||||||||||||||||||||||||||||||||||
| Total commercial | 7.08 | 7.06 | 7.05 | 6.92 | 6.62 | ||||||||||||||||||||||||||||||||||||
| Residential mortgage | 3.65 | 3.61 | 3.60 | 3.55 | 3.48 | ||||||||||||||||||||||||||||||||||||
| Credit card | 12.75 | 13.14 | 13.03 | 13.08 | 12.96 | ||||||||||||||||||||||||||||||||||||
| Auto | 5.09 | 4.98 | 4.90 | 4.78 | 4.67 | ||||||||||||||||||||||||||||||||||||
| Other consumer | 8.56 | 8.62 | 8.68 | 8.65 | 8.29 | ||||||||||||||||||||||||||||||||||||
| Total consumer | 5.43 | 5.42 | 5.37 | 5.26 | 5.11 | ||||||||||||||||||||||||||||||||||||
| Total loans | 6.40 | 6.38 | 6.35 | 6.23 | 5.99 | ||||||||||||||||||||||||||||||||||||
| Quarter ended | |||||||||||||||||||||||||||||||||||||||||||||||||||||||||||||||||||||||
| Jun 30, 2024 | Mar 31, 2024 | Dec 31, 2023 | Sep 30, 2023 | Jun 30, 2023 | Jun 30, 2024 $ Change from |
||||||||||||||||||||||||||||||||||||||||||||||||||||||||||||||||||
| ($ in millions) | Net loan charge-offs |
As a % of average loans (1) | Net loan charge-offs |
As a % of average loans (1) | Net loan charge-offs |
As a % of average loans (1) | Net loan charge-offs |
As a % of average loans (1) | Net loan charge-offs |
As a % of average loans (1) | Mar 31, 2024 |
Jun 30, 2023 |
|||||||||||||||||||||||||||||||||||||||||||||||||||||||||||
| By product: | |||||||||||||||||||||||||||||||||||||||||||||||||||||||||||||||||||||||
| Commercial and industrial | $ | 188 | 0.20 | % | $ | 148 | 0.16 | % | $ | 90 | 0.09 | % | $ | 93 | 0.10 | % | $ | 119 | 0.12 | % | $ | 40 | 69 | ||||||||||||||||||||||||||||||||||||||||||||||||
| Commercial real estate | 271 | 0.74 | 187 | 0.50 | 377 | 0.99 | 93 | 0.24 | 79 | 0.21 | 84 | 192 | |||||||||||||||||||||||||||||||||||||||||||||||||||||||||||
| Lease financing | 9 | 0.21 | 6 | 0.13 | 5 | 0.14 | 2 | 0.07 | 2 | 0.05 | 3 | 7 | |||||||||||||||||||||||||||||||||||||||||||||||||||||||||||
| Total commercial | 468 | 0.35 | 341 | 0.25 | 472 | 0.34 | 188 | 0.13 | 200 | 0.15 | 127 | 268 | |||||||||||||||||||||||||||||||||||||||||||||||||||||||||||
| Residential mortgage | (19) | (0.03) | (13) | (0.02) | 3 | — | (4) | (0.01) | (12) | (0.02) | (6) | (7) | |||||||||||||||||||||||||||||||||||||||||||||||||||||||||||
| Credit card | 649 | 4.96 | 577 | 4.48 | 520 | 4.02 | 420 | 3.41 | 396 | 3.39 | 72 | 253 | |||||||||||||||||||||||||||||||||||||||||||||||||||||||||||
| Auto | 79 | 0.70 | 112 | 0.96 | 130 | 1.06 | 138 | 1.07 | 89 | 0.68 | (33) | (10) | |||||||||||||||||||||||||||||||||||||||||||||||||||||||||||
| Other consumer | 124 | 1.77 | 132 | 1.88 | 127 | 1.79 | 108 | 1.55 | 91 | 1.31 | (8) | 33 | |||||||||||||||||||||||||||||||||||||||||||||||||||||||||||
| Total consumer | 833 | 0.88 | 808 | 0.84 | 780 | 0.79 | 662 | 0.67 | 564 | 0.58 | 25 | 269 | |||||||||||||||||||||||||||||||||||||||||||||||||||||||||||
| Total net loan charge-offs | $ | 1,301 | 0.57 | % | $ | 1,149 | 0.50 | % | $ | 1,252 | 0.53 | % | $ | 850 | 0.36 | % | $ | 764 | 0.32 | % | $ | 152 | 537 | ||||||||||||||||||||||||||||||||||||||||||||||||
By segment: |
|||||||||||||||||||||||||||||||||||||||||||||||||||||||||||||||||||||||
| Consumer Banking and Lending | $ | 907 | 1.12 | % | $ | 881 | 1.07 | % | $ | 852 | 1.01 | % | $ | 722 | 0.85 | % | $ | 621 | 0.74 | % | $ | 26 | 286 | ||||||||||||||||||||||||||||||||||||||||||||||||
| Commercial Banking | 94 | 0.17 | 75 | 0.13 | 35 | 0.06 | 29 | 0.05 | 63 | 0.11 | 19 | 31 | |||||||||||||||||||||||||||||||||||||||||||||||||||||||||||
| Corporate and Investing Banking | 303 | 0.44 | 188 | 0.27 | 370 | 0.51 | 99 | 0.13 | 83 | 0.11 | 115 | 220 | |||||||||||||||||||||||||||||||||||||||||||||||||||||||||||
| Wealth and Investment Management | (2) | (0.01) | 6 | 0.03 | — | — | 1 | — | (1) | — | (8) | (1) | |||||||||||||||||||||||||||||||||||||||||||||||||||||||||||
| Corporate | (1) | (0.05) | (1) | (0.05) | (5) | (0.22) | (1) | (0.04) | (2) | (0.09) | — | 1 | |||||||||||||||||||||||||||||||||||||||||||||||||||||||||||
| Total net loan charge-offs | $ | 1,301 | 0.57 | % | $ | 1,149 | 0.50 | % | $ | 1,252 | 0.53 | % | $ | 850 | 0.36 | % | $ | 764 | 0.32 | % | $ | 152 | 537 | ||||||||||||||||||||||||||||||||||||||||||||||||
| Quarter ended | Jun 30, 2024 $ Change from |
||||||||||||||||||||||||||||||||||||||||
| ($ in millions) | Jun 30, 2024 |
Mar 31, 2024 |
Dec 31, 2023 |
Sep 30, 2023 |
Jun 30, 2023 |
Mar 31, 2024 |
Jun 30, 2023 |
||||||||||||||||||||||||||||||||||
| Balance, beginning of period | 14,862 | 15,088 | 15,064 | 14,786 | 13,705 | (226) | 1,157 | ||||||||||||||||||||||||||||||||||
| Provision for credit losses for loans | 1,229 | 926 | 1,274 | 1,143 | 1,839 | 303 | (610) | ||||||||||||||||||||||||||||||||||
| Net loan charge-offs: | |||||||||||||||||||||||||||||||||||||||||
| Commercial and industrial | (188) | (148) | (90) | (93) | (119) | (40) | (69) | ||||||||||||||||||||||||||||||||||
| Commercial real estate | (271) | (187) | (377) | (93) | (79) | (84) | (192) | ||||||||||||||||||||||||||||||||||
| Lease financing | (9) | (6) | (5) | (2) | (2) | (3) | (7) | ||||||||||||||||||||||||||||||||||
| Total commercial | (468) | (341) | (472) | (188) | (200) | (127) | (268) | ||||||||||||||||||||||||||||||||||
| Residential mortgage | 19 | 13 | (3) | 4 | 12 | 6 | 7 | ||||||||||||||||||||||||||||||||||
| Credit card | (649) | (577) | (520) | (420) | (396) | (72) | (253) | ||||||||||||||||||||||||||||||||||
| Auto | (79) | (112) | (130) | (138) | (89) | 33 | 10 | ||||||||||||||||||||||||||||||||||
| Other consumer | (124) | (132) | (127) | (108) | (91) | 8 | (33) | ||||||||||||||||||||||||||||||||||
| Total consumer | (833) | (808) | (780) | (662) | (564) | (25) | (269) | ||||||||||||||||||||||||||||||||||
| Net loan charge-offs | (1,301) | (1,149) | (1,252) | (850) | (764) | (152) | (537) | ||||||||||||||||||||||||||||||||||
| Other | (1) | (3) | 2 | (15) | 6 | 2 | (7) | ||||||||||||||||||||||||||||||||||
| Balance, end of period | $ | 14,789 | 14,862 | 15,088 | 15,064 | 14,786 | (73) | 3 | |||||||||||||||||||||||||||||||||
| Components: | |||||||||||||||||||||||||||||||||||||||||
| Allowance for loan losses | $ | 14,360 | 14,421 | 14,606 | 14,554 | 14,258 | (61) | 102 | |||||||||||||||||||||||||||||||||
| Allowance for unfunded credit commitments | 429 | 441 | 482 | 510 | 528 | (12) | (99) | ||||||||||||||||||||||||||||||||||
| Allowance for credit losses for loans | $ | 14,789 | 14,862 | 15,088 | 15,064 | 14,786 | (73) | 3 | |||||||||||||||||||||||||||||||||
| Ratio of allowance for loan losses to total net loan charge-offs (annualized) | 2.74x | 3.12 | 2.94 | 4.32 | 4.65 | ||||||||||||||||||||||||||||||||||||
| Allowance for loan losses as a percentage of: | |||||||||||||||||||||||||||||||||||||||||
| Total loans | 1.56 | % | 1.56 | 1.56 | 1.54 | 1.50 | |||||||||||||||||||||||||||||||||||
| Nonaccrual loans | 170 | 179 | 177 | 182 | 207 | ||||||||||||||||||||||||||||||||||||
| Allowance for credit losses for loans as a percentage of: | |||||||||||||||||||||||||||||||||||||||||
| Total loans | 1.61 | 1.61 | 1.61 | 1.60 | 1.56 | ||||||||||||||||||||||||||||||||||||
| Nonaccrual loans | 175 | 184 | 183 | 188 | 215 | ||||||||||||||||||||||||||||||||||||
| Jun 30, 2024 | Mar 31, 2024 | Dec 31, 2023 | Sep 30, 2023 | Jun 30, 2023 | |||||||||||||||||||||||||||||||||||||||||||||||||||||||
| ($ in millions) | ACL | ACL as % of loan class |
ACL | ACL as % of loan class |
ACL | ACL as % of loan class |
ACL | ACL as % of loan class |
ACL | ACL as % of loan class |
|||||||||||||||||||||||||||||||||||||||||||||||||
| By product: | |||||||||||||||||||||||||||||||||||||||||||||||||||||||||||
Commercial and industrial |
$ | 4,276 | 1.14 | % | $ | 4,332 | 1.16 | % | $ | 4,272 | 1.12 | % | $ | 4,269 | 1.12 | % | $ | 4,266 | 1.11 | % | |||||||||||||||||||||||||||||||||||||||
| Commercial real estate | 3,754 | 2.58 | 3,782 | 2.54 | 3,939 | 2.62 | 3,842 | 2.52 | 3,618 | 2.35 | |||||||||||||||||||||||||||||||||||||||||||||||||
Lease financing |
206 | 1.23 | 203 | 1.22 | 201 | 1.22 | 199 | 1.24 | 197 | 1.28 | |||||||||||||||||||||||||||||||||||||||||||||||||
Total commercial |
8,236 | 1.53 | 8,317 | 1.54 | 8,412 | 1.54 | 8,310 | 1.51 | 8,081 | 1.45 | |||||||||||||||||||||||||||||||||||||||||||||||||
| Residential mortgage (1) | 521 | 0.20 | 596 | 0.23 | 652 | 0.25 | 718 | 0.27 | 734 | 0.28 | |||||||||||||||||||||||||||||||||||||||||||||||||
| Credit card | 4,517 | 8.40 | 4,321 | 8.30 | 4,223 | 8.09 | 4,021 | 8.07 | 3,865 | 8.10 | |||||||||||||||||||||||||||||||||||||||||||||||||
| Auto | 804 | 1.82 | 894 | 1.93 | 1,042 | 2.18 | 1,264 | 2.53 | 1,408 | 2.73 | |||||||||||||||||||||||||||||||||||||||||||||||||
| Other consumer | 711 | 2.52 | 734 | 2.57 | 759 | 2.66 | 751 | 2.64 | 698 | 2.50 | |||||||||||||||||||||||||||||||||||||||||||||||||
Total consumer |
6,553 | 1.72 | 6,545 | 1.70 | 6,676 | 1.72 | 6,754 | 1.73 | 6,705 | 1.71 | |||||||||||||||||||||||||||||||||||||||||||||||||
| Total allowance for credit losses for loans | $ | 14,789 | 1.61 | % | $ | 14,862 | 1.61 | % | $ | 15,088 | 1.61 | % | $ | 15,064 | 1.60 | % | $ | 14,786 | 1.56 | % | |||||||||||||||||||||||||||||||||||||||
By segment: |
|||||||||||||||||||||||||||||||||||||||||||||||||||||||||||
| Consumer Banking and Lending | $ | 7,386 | 2.27 | % | $ | 7,361 | 2.24 | % | $ | 7,453 | 2.24 | % | $ | 7,515 | 2.24 | % | $ | 7,469 | 2.22 | % | |||||||||||||||||||||||||||||||||||||||
| Commercial Banking | 2,408 | 1.06 | 2,472 | 1.09 | 2,406 | 1.07 | 2,401 | 1.06 | 2,379 | 1.04 | |||||||||||||||||||||||||||||||||||||||||||||||||
| Corporate and Investing Banking | 4,738 | 1.72 | 4,758 | 1.73 | 4,955 | 1.72 | 4,840 | 1.67 | 4,634 | 1.59 | |||||||||||||||||||||||||||||||||||||||||||||||||
| Wealth and Investment Management | 245 | 0.29 | 258 | 0.31 | 260 | 0.31 | 279 | 0.34 | 290 | 0.35 | |||||||||||||||||||||||||||||||||||||||||||||||||
| Corporate | 12 | 0.16 | 13 | 0.15 | 14 | 0.15 | 29 | 0.32 | 14 | 0.15 | |||||||||||||||||||||||||||||||||||||||||||||||||
| Total allowance for credit losses for loans | $ | 14,789 | 1.61 | % | $ | 14,862 | 1.61 | % | $ | 15,088 | 1.61 | % | $ | 15,064 | 1.60 | % | $ | 14,786 | 1.56 | % | |||||||||||||||||||||||||||||||||||||||
| Jun 30, 2024 | Mar 31, 2024 | Dec 31, 2023 | Sep 30, 2023 | Jun 30, 2023 | Jun 30, 2024 $ Change from |
||||||||||||||||||||||||||||||||||||||||||||||||||||||||||||||||||
| ($ in millions) | Balance | % of total loans |
Balance | % of total loans |
Balance | % of total loans |
Balance | % of total loans |
Balance | % of total loans |
Mar 31, 2024 |
Jun 30, 2023 |
|||||||||||||||||||||||||||||||||||||||||||||||||||||||||||
| By product: | |||||||||||||||||||||||||||||||||||||||||||||||||||||||||||||||||||||||
| Nonaccrual loans: | |||||||||||||||||||||||||||||||||||||||||||||||||||||||||||||||||||||||
| Commercial and industrial | $ | 754 | 0.20 | % | $ | 750 | 0.20 | % | $ | 662 | 0.17 | % | $ | 638 | 0.17 | % | $ | 845 | 0.22 | % | $ | 4 | (91) | ||||||||||||||||||||||||||||||||||||||||||||||||
| Commercial real estate | 4,321 | 2.97 | 3,913 | 2.63 | 4,188 | 2.78 | 3,863 | 2.53 | 2,507 | 1.63 | 408 | 1,814 | |||||||||||||||||||||||||||||||||||||||||||||||||||||||||||
| Lease financing | 86 | 0.51 | 76 | 0.46 | 64 | 0.39 | 85 | 0.53 | 77 | 0.50 | 10 | 9 | |||||||||||||||||||||||||||||||||||||||||||||||||||||||||||
| Total commercial | 5,161 | 0.96 | 4,739 | 0.88 | 4,914 | 0.90 | 4,586 | 0.83 | 3,429 | 0.62 | 422 | 1,732 | |||||||||||||||||||||||||||||||||||||||||||||||||||||||||||
| Residential mortgage (1) | 3,135 | 1.23 | 3,193 | 1.24 | 3,192 | 1.22 | 3,258 | 1.24 | 3,289 | 1.24 | (58) | (154) | |||||||||||||||||||||||||||||||||||||||||||||||||||||||||||
| Auto | 103 | 0.23 | 109 | 0.24 | 115 | 0.24 | 126 | 0.25 | 135 | 0.26 | (6) | (32) | |||||||||||||||||||||||||||||||||||||||||||||||||||||||||||
| Other consumer | 35 | 0.12 | 34 | 0.12 | 35 | 0.12 | 32 | 0.11 | 33 | 0.12 | 1 | 2 | |||||||||||||||||||||||||||||||||||||||||||||||||||||||||||
| Total consumer | 3,273 | 0.86 | 3,336 | 0.87 | 3,342 | 0.86 | 3,416 | 0.87 | 3,457 | 0.88 | (63) | (184) | |||||||||||||||||||||||||||||||||||||||||||||||||||||||||||
| Total nonaccrual loans | 8,434 | 0.92 | 8,075 | 0.88 | 8,256 | 0.88 | 8,002 | 0.85 | 6,886 | 0.73 | 359 | 1,548 | |||||||||||||||||||||||||||||||||||||||||||||||||||||||||||
| Foreclosed assets | 216 | 165 | 187 | 177 | 133 | 51 | 83 | ||||||||||||||||||||||||||||||||||||||||||||||||||||||||||||||||
| Total nonperforming assets | $ | 8,650 | 0.94 | % | $ | 8,240 | 0.89 | % | $ | 8,443 | 0.90 | % | $ | 8,179 | 0.87 | % | $ | 7,019 | 0.74 | % | $ | 410 | 1,631 | ||||||||||||||||||||||||||||||||||||||||||||||||
By segment: |
|||||||||||||||||||||||||||||||||||||||||||||||||||||||||||||||||||||||
| Consumer Banking and Lending | $ | 3,194 | 0.98 | % | $ | 3,240 | 0.99 | % | $ | 3,273 | 0.98 | % | $ | 3,354 | 1.00 | % | $ | 3,416 | 1.02 | % | $ | (46) | (222) | ||||||||||||||||||||||||||||||||||||||||||||||||
| Commercial Banking | 980 | 0.43 | 932 | 0.41 | 1,012 | 0.45 | 1,024 | 0.45 | 1,164 | 0.51 | 48 | (184) | |||||||||||||||||||||||||||||||||||||||||||||||||||||||||||
| Corporate and Investing Banking | 4,265 | 1.55 | 3,831 | 1.39 | 3,935 | 1.37 | 3,588 | 1.24 | 2,243 | 0.77 | 434 | 2,022 | |||||||||||||||||||||||||||||||||||||||||||||||||||||||||||
| Wealth and Investment Management | 211 | 0.25 | 237 | 0.29 | 223 | 0.27 | 213 | 0.26 | 196 | 0.24 | (26) | 15 | |||||||||||||||||||||||||||||||||||||||||||||||||||||||||||
| Corporate | — | — | — | — | — | — | — | — | — | — | — | — | |||||||||||||||||||||||||||||||||||||||||||||||||||||||||||
| Total nonperforming assets | $ | 8,650 | 0.94 | % | $ | 8,240 | 0.89 | % | $ | 8,443 | 0.90 | % | $ | 8,179 | 0.87 | % | $ | 7,019 | 0.74 | % | $ | 410 | 1,631 | ||||||||||||||||||||||||||||||||||||||||||||||||
| Jun 30, 2024 | Mar 31, 2024 | Jun 30, 2023 | |||||||||||||||||||||||||||||||||||||||||||||||||||||||||||||||||||||
| ($ in millions) | Nonaccrual loans |
Loans outstanding balance | % of total loans |
Total commitments (1) | Nonaccrual loans |
Loans outstanding balance | % of total loans |
Total commitments (1) | Nonaccrual loans |
Loans outstanding balance | % of total loans |
Total commitments (1) | |||||||||||||||||||||||||||||||||||||||||||||||||||||||||||
| Financials except banks | $ | 51 | 145,269 | 16 | % | $ | 231,777 | $ | 40 | 140,105 | 15 | % | $ | 230,518 | $ | 10 | 148,643 | 16 | % | $ | 232,177 | ||||||||||||||||||||||||||||||||||||||||||||||||||
| Technology, telecom and media | 87 | 24,661 | 3 | 61,246 | 95 | 25,021 | 3 | 63,450 | 43 | 27,186 | 3 | 65,437 | |||||||||||||||||||||||||||||||||||||||||||||||||||||||||||
| Real estate and construction | 87 | 26,090 | 3 | 54,542 | 64 | 25,800 | 3 | 54,633 | 61 | 25,180 | 3 | 55,929 | |||||||||||||||||||||||||||||||||||||||||||||||||||||||||||
| Equipment, machinery and parts manufacturing | 37 | 25,727 | 3 | 49,539 | 35 | 25,914 | 3 | 48,633 | 187 | 26,032 | 3 | 48,614 | |||||||||||||||||||||||||||||||||||||||||||||||||||||||||||
| Retail | 53 | 19,674 | 2 | 47,691 | 59 | 19,841 | 2 | 48,926 | 83 | 20,658 | 2 | 50,233 | |||||||||||||||||||||||||||||||||||||||||||||||||||||||||||
| Materials and commodities | 28 | 14,842 | 2 | 37,380 | 86 | 15,301 | 2 | 38,653 | 185 | 16,073 | 2 | 40,820 | |||||||||||||||||||||||||||||||||||||||||||||||||||||||||||
| Food and beverage manufacturing | 22 | 16,535 | 2 | 33,390 | 20 | 16,321 | 2 | 33,212 | 3 | 16,161 | 2 | 33,081 | |||||||||||||||||||||||||||||||||||||||||||||||||||||||||||
| Oil, gas and pipelines | 26 | 10,308 | 1 | 32,284 | 30 | 10,125 | 1 | 32,316 | 32 | 10,456 | 1 | 32,157 | |||||||||||||||||||||||||||||||||||||||||||||||||||||||||||
| Auto related | 11 | 17,224 | 2 | 30,723 | 11 | 15,669 | 2 | 29,298 | 8 | 13,888 | 1 | 28,264 | |||||||||||||||||||||||||||||||||||||||||||||||||||||||||||
| Health care and pharmaceuticals | 66 | 14,508 | 2 | 29,647 | 69 | 15,001 | 2 | 29,857 | 19 | 14,996 | 2 | 30,655 | |||||||||||||||||||||||||||||||||||||||||||||||||||||||||||
| Commercial services | 33 | 10,699 | 1 | 26,288 | 43 | 10,813 | 1 | 26,054 | 57 | 11,206 | 1 | 26,355 | |||||||||||||||||||||||||||||||||||||||||||||||||||||||||||
| Utilities | 1 | 6,839 | * | 24,269 | 1 | 7,020 | * | 24,515 | 1 | 7,709 | * | 24,736 | |||||||||||||||||||||||||||||||||||||||||||||||||||||||||||
| Diversified or miscellaneous | 56 | 8,395 | * | 21,908 | 52 | 9,191 | * | 22,072 | 2 | 8,069 | * | 20,156 | |||||||||||||||||||||||||||||||||||||||||||||||||||||||||||
| Entertainment and recreation | 22 | 13,040 | 1 | 19,429 | 20 | 13,830 | 1 | 19,837 | 25 | 12,935 | 1 | 19,273 | |||||||||||||||||||||||||||||||||||||||||||||||||||||||||||
| Insurance and fiduciaries | 1 | 5,749 | * | 17,285 | 1 | 5,230 | * | 16,482 | 1 | 5,016 | * | 15,347 | |||||||||||||||||||||||||||||||||||||||||||||||||||||||||||
| Transportation services | 161 | 9,407 | 1 | 16,360 | 133 | 8,956 | * | 15,901 | 147 | 8,993 | * | 16,057 | |||||||||||||||||||||||||||||||||||||||||||||||||||||||||||
| Agribusiness | 11 | 5,980 | * | 11,235 | 17 | 6,476 | * | 11,927 | 6 | 6,107 | * | 11,510 | |||||||||||||||||||||||||||||||||||||||||||||||||||||||||||
| Government and education | 40 | 5,566 | * | 11,075 | 24 | 5,320 | * | 11,471 | 27 | 6,168 | * | 12,320 | |||||||||||||||||||||||||||||||||||||||||||||||||||||||||||
| Banks | — | 8,276 | * | 9,314 | — | 9,163 | * | 10,307 | — | 11,080 | 1 | 11,984 | |||||||||||||||||||||||||||||||||||||||||||||||||||||||||||
| Other | 47 | 2,504 | * | 12,133 | 26 | 4,445 | * | 12,486 | 25 | 4,789 | * | 12,187 | |||||||||||||||||||||||||||||||||||||||||||||||||||||||||||
| Total | $ | 840 | 391,293 | 43 | % | $ | 777,515 | $ | 826 | 389,542 | 42 | % | $ | 780,548 | $ | 922 | 401,345 | 42 | % | $ | 787,292 | ||||||||||||||||||||||||||||||||||||||||||||||||||
| Jun 30, 2024 | Mar 31, 2024 | Jun 30, 2023 | |||||||||||||||||||||||||||||||||||||||||||||||||||||||||||||||||||||
| ($ in millions) | Nonaccrual loans |
Loans outstanding balance | % of total loans |
Total commitments (2) | Nonaccrual loans |
Loans outstanding balance | % of total loans |
Total commitments (2) | Nonaccrual loans |
Loans outstanding balance | % of total loans |
Total commitments (2) | |||||||||||||||||||||||||||||||||||||||||||||||||||||||||||
| Apartments | $ | 28 | 42,673 | 5 | % | $ | 49,996 | $ | 46 | 42,680 | 5 | % | $ | 50,220 | $ | 9 | 40,752 | 4 | % | $ | 50,699 | ||||||||||||||||||||||||||||||||||||||||||||||||||
| Office | 3,693 | 30,014 | 3 | 31,946 | 3,136 | 30,477 | 3 | 32,725 | 1,517 | 33,089 | 3 | 36,757 | |||||||||||||||||||||||||||||||||||||||||||||||||||||||||||
| Industrial/warehouse | 25 | 24,644 | 3 | 27,035 | 26 | 25,734 | 3 | 27,972 | 38 | 23,900 | 3 | 27,802 | |||||||||||||||||||||||||||||||||||||||||||||||||||||||||||
| Retail (excluding shopping center) | 114 | 11,273 | 1 | 12,197 | 264 | 11,480 | 1 | 12,220 | 357 | 11,412 | 1 | 12,334 | |||||||||||||||||||||||||||||||||||||||||||||||||||||||||||
| Hotel/motel | 252 | 11,524 | 1 | 12,053 | 186 | 12,523 | 1 | 13,239 | 149 | 12,923 | 1 | 13,910 | |||||||||||||||||||||||||||||||||||||||||||||||||||||||||||
| Shopping center | 165 | 8,718 | * | 9,256 | 177 | 8,661 | * | 9,263 | 193 | 9,249 | * | 9,816 | |||||||||||||||||||||||||||||||||||||||||||||||||||||||||||
| Institutional | 13 | 5,555 | * | 5,992 | 41 | 5,795 | * | 6,284 | 118 | 6,099 | * | 6,906 | |||||||||||||||||||||||||||||||||||||||||||||||||||||||||||
| Mixed use properties | 22 | 2,923 | * | 3,117 | 27 | 2,971 | * | 3,095 | 113 | 5,343 | * | 6,330 | |||||||||||||||||||||||||||||||||||||||||||||||||||||||||||
| Storage facility | — | 2,345 | * | 2,507 | — | 2,744 | * | 2,964 | — | 2,983 | * | 3,299 | |||||||||||||||||||||||||||||||||||||||||||||||||||||||||||
| 1-4 family structure | — | 1,143 | * | 2,455 | — | 1,397 | * | 2,756 | — | 1,255 | * | 3,185 | |||||||||||||||||||||||||||||||||||||||||||||||||||||||||||
| Other | 9 | 4,506 | * | 5,204 | 10 | 4,324 | * | 5,062 | 13 | 7,271 | * | 8,586 | |||||||||||||||||||||||||||||||||||||||||||||||||||||||||||
Total |
$ | 4,321 | 145,318 | 15 | % | $ | 161,758 | $ | 3,913 | 148,786 | 16 | % | $ | 165,800 | $ | 2,507 | 154,276 | 16 | % | $ | 179,624 | ||||||||||||||||||||||||||||||||||||||||||||||||||
| Jun 30, 2024 % Change from |
|||||||||||||||||||||||||||||||||||||||||||||||
($ in millions) |
Jun 30, 2024 |
Mar 31, 2024 |
Dec 31, 2023 |
Sep 30, 2023 |
Jun 30, 2023 |
Mar 31, 2024 |
Jun 30, 2023 |
||||||||||||||||||||||||||||||||||||||||
| Tangible book value per common share: | |||||||||||||||||||||||||||||||||||||||||||||||
| Total equity | $ | 178,148 | 182,674 | 187,443 | 182,373 | 181,952 | (2) | % | (2) | ||||||||||||||||||||||||||||||||||||||
| Adjustments: | |||||||||||||||||||||||||||||||||||||||||||||||
Preferred stock |
(16,608) | (18,608) | (19,448) | (19,448) | (19,448) | 11 | 15 | ||||||||||||||||||||||||||||||||||||||||
Additional paid-in capital on preferred stock |
141 | 146 | 157 | 157 | 173 | (3) | (18) | ||||||||||||||||||||||||||||||||||||||||
| Noncontrolling interests | (1,718) | (1,731) | (1,708) | (1,658) | (1,761) | 1 | 2 | ||||||||||||||||||||||||||||||||||||||||
| Total common stockholders' equity | (A) | 159,963 | 162,481 | 166,444 | 161,424 | 160,916 | (2) | (1) | |||||||||||||||||||||||||||||||||||||||
| Adjustments: | |||||||||||||||||||||||||||||||||||||||||||||||
| Goodwill | (25,172) | (25,173) | (25,175) | (25,174) | (25,175) | — | — | ||||||||||||||||||||||||||||||||||||||||
| Certain identifiable intangible assets (other than MSRs) | (96) | (107) | (118) | (132) | (145) | 10 | 34 | ||||||||||||||||||||||||||||||||||||||||
|
Goodwill and other intangibles on investments in consolidated portfolio companies (included in
other assets) (1)
|
(968) | (965) | (878) | (878) | (2,511) | — | 61 | ||||||||||||||||||||||||||||||||||||||||
Applicable deferred taxes related to goodwill and other intangible assets (2) |
933 | 927 | 920 | 913 | 905 | 1 | 3 | ||||||||||||||||||||||||||||||||||||||||
| Tangible common equity | (B) | $ | 134,660 | 137,163 | 141,193 | 136,153 | 133,990 | (2) | 1 | ||||||||||||||||||||||||||||||||||||||
| Common shares outstanding | (C) | 3,402.7 | 3,501.7 | 3,598.9 | 3,637.9 | 3,667.7 | (3) | (7) | |||||||||||||||||||||||||||||||||||||||
| Book value per common share | (A)/(C) | 47.01 | 46.40 | 46.25 | 44.37 | 43.87 | 1 | 7 | |||||||||||||||||||||||||||||||||||||||
| Tangible book value per common share | (B)/(C) | 39.57 | 39.17 | 39.23 | 37.43 | 36.53 | 1 | 8 | |||||||||||||||||||||||||||||||||||||||
| Quarter ended | Jun 30, 2024 % Change from |
Six months ended | ||||||||||||||||||||||||||||||||||||||||||||||||||||||||||||
($ in millions) |
Jun 30, 2024 |
Mar 31, 2024 |
Dec 31, 2023 |
Sep 30, 2023 |
Jun 30, 2023 |
Mar 31, 2024 |
Jun 30, 2023 |
Jun 30, 2024 |
Jun 30, 2023 |
% Change |
||||||||||||||||||||||||||||||||||||||||||||||||||||
Return on average tangible common equity: |
||||||||||||||||||||||||||||||||||||||||||||||||||||||||||||||
| Net income applicable to common stock | (A) | $ | 4,640 | 4,313 | 3,160 | 5,450 | 4,659 | 8 | % | — | $ | 8,953 | 9,372 | (4) | % | |||||||||||||||||||||||||||||||||||||||||||||||
| Average total equity | 181,552 | 186,669 | 185,853 | 184,828 | 184,443 | (3) | (2) | 184,111 | 184,371 | — | ||||||||||||||||||||||||||||||||||||||||||||||||||||
| Adjustments: | ||||||||||||||||||||||||||||||||||||||||||||||||||||||||||||||
Preferred stock |
(18,300) | (19,291) | (19,448) | (20,441) | (19,448) | 5 | 6 | (18,795) | (19,448) | 3 | ||||||||||||||||||||||||||||||||||||||||||||||||||||
Additional paid-in capital on preferred stock |
145 | 155 | 157 | 171 | 173 | (6) | (16) | 150 | 173 | (13) | ||||||||||||||||||||||||||||||||||||||||||||||||||||
| Noncontrolling interests | (1,743) | (1,710) | (1,664) | (1,775) | (1,924) | (2) | 9 | (1,727) | (1,971) | 12 | ||||||||||||||||||||||||||||||||||||||||||||||||||||
| Average common stockholders’ equity | (B) | 161,654 | 165,823 | 164,898 | 162,783 | 163,244 | (3) | (1) | 163,739 | 163,125 | — | |||||||||||||||||||||||||||||||||||||||||||||||||||
| Adjustments: | ||||||||||||||||||||||||||||||||||||||||||||||||||||||||||||||
| Goodwill | (25,172) | (25,174) | (25,173) | (25,174) | (25,175) | — | — | (25,173) | (25,174) | — | ||||||||||||||||||||||||||||||||||||||||||||||||||||
Certain identifiable intangible assets (other than MSRs) |
(101) | (112) | (124) | (137) | (140) | 10 | 28 | (106) | (142) | 25 | ||||||||||||||||||||||||||||||||||||||||||||||||||||
Goodwill and other intangibles on investments in consolidated portfolio companies (included in other assets) (1) |
(965) | (879) | (878) | (2,539) | (2,487) | (10) | 61 | (922) | (2,464) | 63 | ||||||||||||||||||||||||||||||||||||||||||||||||||||
Applicable deferred taxes related to goodwill and other intangible assets (2) |
931 | 924 | 918 | 910 | 903 | 1 | 3 | 928 | 899 | 3 | ||||||||||||||||||||||||||||||||||||||||||||||||||||
| Average tangible common equity | (C) | $ | 136,347 | 140,582 | 139,641 | 135,843 | 136,345 | (3) | — | $ | 138,466 | 136,244 | 2 | |||||||||||||||||||||||||||||||||||||||||||||||||
| Return on average common stockholders’ equity (ROE) (annualized) | (A)/(B) | 11.5 | % | 10.5 | 7.6 | 13.3 | 11.4 | 11.0 | % | 11.6 | ||||||||||||||||||||||||||||||||||||||||||||||||||||
| Return on average tangible common equity (ROTCE) (annualized) | (A)/(C) | 13.7 | 12.3 | 9.0 | 15.9 | 13.7 | 13.0 | 13.9 | ||||||||||||||||||||||||||||||||||||||||||||||||||||||
| Estimated | ||||||||||||||||||||||||||||||||
($ in billions) |
Jun 30, 2024 |
Mar 31, 2024 |
Dec 31, 2023 |
Sep 30, 2023 |
Jun 30, 2023 |
|||||||||||||||||||||||||||
Total equity |
$ | 178.1 | 182.7 | 187.4 | 182.4 | 182.0 | ||||||||||||||||||||||||||
| Adjustments: | ||||||||||||||||||||||||||||||||
Preferred stock |
(16.6) | (18.6) | (19.4) | (19.4) | (19.4) | |||||||||||||||||||||||||||
Additional paid-in capital on preferred stock |
0.2 | 0.1 | 0.1 | 0.1 | 0.1 | |||||||||||||||||||||||||||
| Noncontrolling interests | (1.7) | (1.7) | (1.7) | (1.7) | (1.8) | |||||||||||||||||||||||||||
| Total common stockholders' equity | 160.0 | 162.5 | 166.4 | 161.4 | 160.9 | |||||||||||||||||||||||||||
| Adjustments: | ||||||||||||||||||||||||||||||||
| Goodwill | (25.2) | (25.2) | (25.2) | (25.2) | (25.2) | |||||||||||||||||||||||||||
| Certain identifiable intangible assets (other than MSRs) | (0.1) | (0.1) | (0.1) | (0.1) | (0.1) | |||||||||||||||||||||||||||
Goodwill and other intangibles on investments in consolidated portfolio companies (included in other assets) (2) |
(1.0) | (1.0) | (0.9) | (0.9) | (2.5) | |||||||||||||||||||||||||||
Applicable deferred taxes related to goodwill and other intangible assets (3) |
0.9 | 0.9 | 0.9 | 0.9 | 0.9 | |||||||||||||||||||||||||||
| Other (4) | (0.4) | (0.4) | (0.3) | 0.1 | 0.2 | |||||||||||||||||||||||||||
| Common Equity Tier 1 | (A) | 134.2 | 136.7 | 140.8 | 136.2 | 134.2 | ||||||||||||||||||||||||||
Preferred stock |
16.6 | 18.6 | 19.4 | 19.4 | 19.4 | |||||||||||||||||||||||||||
Additional paid-in capital on preferred stock |
(0.2) | (0.1) | (0.1) | (0.1) | (0.1) | |||||||||||||||||||||||||||
| Other | (0.1) | (0.3) | (0.3) | (0.3) | (0.3) | |||||||||||||||||||||||||||
| Total Tier 1 capital | (B) | 150.5 | 154.9 | 159.8 | 155.2 | 153.2 | ||||||||||||||||||||||||||
| Long-term debt and other instruments qualifying as Tier 2 | 18.3 | 19.0 | 19.0 | 19.1 | 19.7 | |||||||||||||||||||||||||||
| Qualifying allowance for credit losses (5) | 14.7 | 14.7 | 14.9 | 14.9 | 15.1 | |||||||||||||||||||||||||||
| Other | (0.3) | (0.5) | (0.6) | (0.4) | (0.4) | |||||||||||||||||||||||||||
| Total qualifying capital | (C) | $ | 183.2 | 188.1 | 193.1 | 188.8 | 187.6 | |||||||||||||||||||||||||
| Total risk-weighted assets (RWAs) | (D) | $ | 1,218.4 | 1,221.6 | 1,231.7 | 1,237.1 | 1,250.7 | |||||||||||||||||||||||||
| Common Equity Tier 1 to total RWAs | (A)/(D) | 11.0 | % | 11.2 | 11.4 | 11.0 | 10.7 | |||||||||||||||||||||||||
| Tier 1 capital to total RWAs | (B)/(D) | 12.4 | 12.7 | 13.0 | 12.6 | 12.2 | ||||||||||||||||||||||||||
| Total capital to total RWAs | (C)/(D) | 15.0 | 15.4 | 15.7 | 15.3 | 15.0 | ||||||||||||||||||||||||||
| Estimated | ||||||||||||||||||||||||||||||||
($ in billions) |
Jun 30, 2024 |
Mar 31, 2024 |
Dec 31, 2023 |
Sep 30, 2023 |
Jun 30, 2023 |
|||||||||||||||||||||||||||
Total equity |
$ | 178.1 | 182.7 | 187.4 | 182.4 | 182.0 | ||||||||||||||||||||||||||
| Adjustments: | ||||||||||||||||||||||||||||||||
Preferred stock |
(16.6) | (18.6) | (19.4) | (19.4) | (19.4) | |||||||||||||||||||||||||||
Additional paid-in capital on preferred stock |
0.2 | 0.1 | 0.1 | 0.1 | 0.1 | |||||||||||||||||||||||||||
| Noncontrolling interests | (1.7) | (1.7) | (1.7) | (1.7) | (1.8) | |||||||||||||||||||||||||||
| Total common stockholders' equity | 160.0 | 162.5 | 166.4 | 161.4 | 160.9 | |||||||||||||||||||||||||||
| Adjustments: | ||||||||||||||||||||||||||||||||
| Goodwill | (25.2) | (25.2) | (25.2) | (25.2) | (25.2) | |||||||||||||||||||||||||||
| Certain identifiable intangible assets (other than MSRs) | (0.1) | (0.1) | (0.1) | (0.1) | (0.1) | |||||||||||||||||||||||||||
Goodwill and other intangibles on investments in consolidated portfolio companies (included in other assets) (2) |
(1.0) | (1.0) | (0.9) | (0.9) | (2.5) | |||||||||||||||||||||||||||
Applicable deferred taxes related to goodwill and other intangible assets (3) |
0.9 | 0.9 | 0.9 | 0.9 | 0.9 | |||||||||||||||||||||||||||
Other (4) |
(0.4) | (0.4) | (0.3) | 0.1 | 0.2 | |||||||||||||||||||||||||||
| Common Equity Tier 1 | (A) | 134.2 | 136.7 | 140.8 | 136.2 | 134.2 | ||||||||||||||||||||||||||
Preferred stock |
16.6 | 18.6 | 19.4 | 19.4 | 19.4 | |||||||||||||||||||||||||||
Additional paid-in capital on preferred stock |
(0.2) | (0.1) | (0.1) | (0.1) | (0.1) | |||||||||||||||||||||||||||
| Other | (0.1) | (0.3) | (0.3) | (0.3) | (0.3) | |||||||||||||||||||||||||||
| Total Tier 1 capital | (B) | 150.5 | 154.9 | 159.8 | 155.2 | 153.2 | ||||||||||||||||||||||||||
| Long-term debt and other instruments qualifying as Tier 2 | 18.3 | 19.0 | 19.0 | 19.1 | 19.7 | |||||||||||||||||||||||||||
Qualifying allowance for credit losses (5) |
4.4 | 4.4 | 4.5 | 4.5 | 4.5 | |||||||||||||||||||||||||||
| Other | (0.3) | (0.5) | (0.6) | (0.4) | (0.4) | |||||||||||||||||||||||||||
| Total qualifying capital | (C) | $ | 172.9 | 177.8 | 182.7 | 178.4 | 177.0 | |||||||||||||||||||||||||
| Total RWAs | (D) | $ | 1,091.4 | 1,099.6 | 1,114.3 | 1,130.8 | 1,118.4 | |||||||||||||||||||||||||
| Common Equity Tier 1 to total RWAs | (A)/(D) | 12.3 | % | 12.4 | 12.6 | 12.0 | 12.0 | |||||||||||||||||||||||||
| Tier 1 capital to total RWAs | (B)/(D) | 13.8 | 14.1 | 14.3 | 13.7 | 13.7 | ||||||||||||||||||||||||||
| Total capital to total RWAs | (C)/(D) | 15.8 | 16.2 | 16.4 | 15.8 | 15.8 | ||||||||||||||||||||||||||

