| Title of Each Class | Trading Symbols | Name of Each Exchange on Which Registered |
||||||
| Common Stock, par value $1-2/3 | WFC |
New York Stock
Exchange
(NYSE)
|
||||||
| 7.5% Non-Cumulative Perpetual Convertible Class A Preferred Stock, Series L | WFC.PRL | NYSE | ||||||
Depositary Shares, each representing a 1/1000th interest in a share of 6.625% Fixed-to-Floating Rate Non-Cumulative Perpetual Class A Preferred Stock, Series R |
WFC.PRR | NYSE | ||||||
| Depositary Shares, each representing a 1/1000th interest in a share of Non-Cumulative Perpetual Class A Preferred Stock, Series Y | WFC.PRY | NYSE | ||||||
| Depositary Shares, each representing a 1/1000th interest in a share of Non-Cumulative Perpetual Class A Preferred Stock, Series Z | WFC.PRZ | NYSE | ||||||
Depositary Shares, each representing a 1/1000th interest in a share of Non-Cumulative Perpetual Class A Preferred Stock, Series AA |
WFC.PRA |
NYSE |
||||||
Depositary Shares, each representing a 1/1000th interest in a share of Non-Cumulative Perpetual Class A Preferred Stock, Series CC |
WFC.PRC |
NYSE |
||||||
Depositary Shares, each representing a 1/1000th interest in a share of Non-Cumulative Perpetual Class A Preferred Stock, Series DD |
WFC.PRD |
NYSE |
||||||
| Guarantee of Medium-Term Notes, Series A, due October 30, 2028 of Wells Fargo Finance LLC | WFC/28A | NYSE | ||||||
Incorporated Documents |
Where incorporated in Form 10-K |
||||
1.Portions of the Company’s Annual Report to Shareholders for the year ended December 31, 2023 (“2023 Annual Report to Shareholders”) |
Part I – Items 1, 1A, 1C and 3; Part II – Items 5, 7, 7A, 8 and 9A; and
Part IV– Item 15
|
||||
2.Portions of the Company’s Proxy Statement for the Annual Meeting of Shareholders to be held April 23, 2024 (“2024 Proxy Statement”) |
Part III – Items 10, 11, 12, 13 and 14 | ||||
| ITEM 1. | BUSINESS | ||||
1 We do not control this website. Wells Fargo has provided this link for your convenience, but does not endorse and is not responsible for the content, links, privacy policy, or security policy of this website. | ||
| ITEM 1A. | RISK FACTORS | ||||
| ITEM 1B. | UNRESOLVED STAFF COMMENTS | ||||
| ITEM 1C. | CYBERSECURITY | ||||
| ITEM 2. | PROPERTIES |
||||
| December 31, 2023 | Approximate square footage (in millions) |
|||||||
| We occupy properties in: | ||||||||
Top U.S. locations: |
||||||||
| Charlotte-Concord-Gastonia, NC-SC | 6.6 | |||||||
| Minneapolis-St. Paul-Bloomington, MN-WI | 4.0 | |||||||
| New York-Newark-Jersey City, NY-NJ-PA | 2.9 | |||||||
| Los Angeles-Long Beach-Anaheim, CA | 2.8 | |||||||
| Phoenix-Mesa-Chandler, AZ | 2.8 | |||||||
San Francisco-Oakland-Berkeley, CA metro area (including corporate headquarters in San Francisco) |
2.4 | |||||||
| Des Moines-West Des Moines, IA | 2.2 | |||||||
| St. Louis, MO-IL | 1.9 | |||||||
| Dallas-Fort Worth-Arlington, TX | 1.5 | |||||||
| Philadelphia-Camden-Wilmington, PA-NJ-DE-MD | 1.3 | |||||||
| Miami-Fort Lauderdale-Pompano Beach, FL | 1.2 | |||||||
| All other U.S. locations | 30.0 | |||||||
| Total United States | 59.6 | |||||||
Top International locations: |
||||||||
| India | 3.6 | |||||||
| Philippines | 1.3 | |||||||
| United Kingdom | 0.2 | |||||||
| All other international locations | 0.4 | |||||||
| Total International | 5.5 | |||||||
| Total square footage of property occupied for business operations (1) | 65.1 | |||||||
| ITEM 3. | LEGAL PROCEEDINGS | ||||
| ITEM 4. | MINE SAFETY DISCLOSURES | ||||
| ITEM 5. | MARKET FOR REGISTRANT’S COMMON EQUITY, RELATED STOCKHOLDER MATTERS AND ISSUER PURCHASES OF EQUITY SECURITIES | ||||
Calendar month |
Total number of shares repurchased (1) |
Weighted average
price paid per share
|
Approximate dollar
value of shares that
may yet be
repurchased under
the authorization
(in millions)
|
|||||||||||||||||||||||
| October | 12,114,730 | $ | 41.41 | $ | 28,570 | |||||||||||||||||||||
| November | 6,004,463 | 42.88 | 28,313 | |||||||||||||||||||||||
| December | 33,566,310 | 47.40 | 26,722 | |||||||||||||||||||||||
| Total | 51,685,503 | |||||||||||||||||||||||||
| ITEM 6. | [RESERVED] | ||||
| ITEM 7. | MANAGEMENT’S DISCUSSION AND ANALYSIS OF FINANCIAL CONDITION AND RESULTS OF OPERATIONS | ||||
| ITEM 7A. | QUANTITATIVE AND QUALITATIVE DISCLOSURES ABOUT MARKET RISK | ||||
| ITEM 8. | FINANCIAL STATEMENTS AND SUPPLEMENTARY DATA | ||||
| ITEM 9. | CHANGES IN AND DISAGREEMENTS WITH ACCOUNTANTS ON ACCOUNTING AND FINANCIAL DISCLOSURE | ||||
| ITEM 9A. | CONTROLS AND PROCEDURES | ||||
| ITEM 9B. | OTHER INFORMATION | ||||
| ITEM 9C. | DISCLOSURE REGARDING FOREIGN JURISDICTIONS THAT PREVENT INSPECTIONS |
||||
| ITEM 10. | DIRECTORS, EXECUTIVE OFFICERS AND CORPORATE GOVERNANCE | ||||
| ITEM 11. | EXECUTIVE COMPENSATION | ||||
| ITEM 12. | SECURITY OWNERSHIP OF CERTAIN BENEFICIAL OWNERS AND MANAGEMENT AND RELATED STOCKHOLDER MATTERS | ||||
| Equity Compensation Plan Information | |||||||||||||||||||||||||||||||||||
| (a) | (b) | (c) | |||||||||||||||||||||||||||||||||
| Plan category | # of shares to be issued upon exercise of outstanding options, warrants and rights |
Weighted-average exercise price of outstanding options, warrants and rights (1) |
# of shares remaining available for future issuance under equity compensation plans (excluding securities reflected in column (a)) |
||||||||||||||||||||||||||||||||
| Equity compensation plans approved by security holders | 66,834,666 | (2) | $ | 0.00 | 103,265,133 | (3) | |||||||||||||||||||||||||||||
| Equity compensation plans not approved by security holders | 4,264,741 | (4) | NA | 1,993,916 | (5) | ||||||||||||||||||||||||||||||
| Total | 71,099,407 | 0.00 | 105,259,049 | ||||||||||||||||||||||||||||||||
| Plans approved by security holders | # of shares remaining available for future issuance under equity compensation plans (excluding # of shares to be issued upon exercise of outstanding options, warrants and rights) |
Award types | |||||||||||||||||||||||||||||||||
| 2022 LTIP | 101,470,398 | Stock, restricted stock, RSRs, performance shares, performance units | |||||||||||||||||||||||||||||||||
| Supplemental 401(k) Plan | 1,693,770 | Deferral distribution | |||||||||||||||||||||||||||||||||
| Directors Plan | 100,965 | Stock options, deferral distribution | |||||||||||||||||||||||||||||||||
| Total | 103,265,133 | ||||||||||||||||||||||||||||||||||
| Plans not approved by security holders | # of shares remaining available for future issuance under equity compensation plans |
Award types | |||||||||||||||||||||||||||||||||
| Deferred Compensation Plan | 1,853,363 | Deferral distribution | |||||||||||||||||||||||||||||||||
| Non-Qualified Deferred Compensation Plan for Independent Contractors | 140,553 | Deferral distribution | |||||||||||||||||||||||||||||||||
| Total | 1,993,916 | ||||||||||||||||||||||||||||||||||
| ITEM 13. | CERTAIN RELATIONSHIPS AND RELATED TRANSACTIONS, AND DIRECTOR INDEPENDENCE | ||||
| ITEM 14. | PRINCIPAL ACCOUNTANT FEES AND SERVICES | ||||
| ITEM 15. | EXHIBIT AND FINANCIAL STATEMENT SCHEDULES | ||||
|
Exhibit
Number
|
Description | Location | ||||||||||||||||||||||||||||||||||||||||||||||||||||||||||||
| 3(a) | Incorporated by reference to Exhibit 3(a) to the Company’s Quarterly Report on Form 10-Q for the quarter ended September 30, 2023. |
|||||||||||||||||||||||||||||||||||||||||||||||||||||||||||||
| 3(b) | Incorporated by reference to Exhibit 3.1 to the Company’s Current Report on Form 8-K filed January 24, 2024. |
|||||||||||||||||||||||||||||||||||||||||||||||||||||||||||||
| 4(a) | See Exhibits 3(a) and 3(b). | |||||||||||||||||||||||||||||||||||||||||||||||||||||||||||||
| 4(b) | The Company agrees to furnish upon request to the Commission a copy of each instrument defining the rights of holders of senior and subordinated debt of the Company. | |||||||||||||||||||||||||||||||||||||||||||||||||||||||||||||
| 4(c) | Filed herewith. | |||||||||||||||||||||||||||||||||||||||||||||||||||||||||||||
| 10(a)* | Incorporated by reference to Exhibit 10(a) to the Company’s Current Report on Form 8-K filed April 29, 2022. | |||||||||||||||||||||||||||||||||||||||||||||||||||||||||||||
| Incorporated by reference to Exhibit 10(b) to the Company’s Current Report on Form 8-K filed April 26, 2019. | ||||||||||||||||||||||||||||||||||||||||||||||||||||||||||||||
| Forms of Performance Share Award Agreement: | ||||||||||||||||||||||||||||||||||||||||||||||||||||||||||||||
| Filed herewith. | ||||||||||||||||||||||||||||||||||||||||||||||||||||||||||||||
Incorporated by reference to Exhibit 10(a) to the Company’s Annual Report on Form 10-K for the year ended December 31, 2022. |
||||||||||||||||||||||||||||||||||||||||||||||||||||||||||||||
| Incorporated by reference to Exhibit 10(c) to the Company’s Quarterly Report on Form 10-Q for the quarter ended June 30, 2022. | ||||||||||||||||||||||||||||||||||||||||||||||||||||||||||||||
| Incorporated by reference to Exhibit 10(a) to the Company’s Annual Report on Form 10-K for the year ended December 31, 2021. | ||||||||||||||||||||||||||||||||||||||||||||||||||||||||||||||
| Incorporated by reference to Exhibit 10(a) to the Company’s Annual Report on Form 10-K for the year ended December 31, 2020. | ||||||||||||||||||||||||||||||||||||||||||||||||||||||||||||||
| Forms of Restricted Share Rights Award Agreement: | ||||||||||||||||||||||||||||||||||||||||||||||||||||||||||||||
| Filed herewith. | ||||||||||||||||||||||||||||||||||||||||||||||||||||||||||||||
| Filed herewith. | ||||||||||||||||||||||||||||||||||||||||||||||||||||||||||||||
Incorporated by reference to Exhibit 10(a) to the Company’s Annual Report on Form 10-K for the year ended December 31, 2022. |
||||||||||||||||||||||||||||||||||||||||||||||||||||||||||||||
Incorporated by reference to Exhibit 10(a) to the Company’s Annual Report on Form 10-K for the year ended December 31, 2022. |
||||||||||||||||||||||||||||||||||||||||||||||||||||||||||||||
| * Management contract or compensatory plan or arrangement. | ||||||||||||||||||||||||||||||||||||||||||||||||||||||||||||||
|
Exhibit
Number
|
Description | Location | ||||||||||||||||||||||||||||||||||||||||||||||||||||||||||||
| Incorporated by reference to Exhibit 10(b) to the Company’s Quarterly Report on Form 10-Q for the quarter ended June 30, 2022. | ||||||||||||||||||||||||||||||||||||||||||||||||||||||||||||||
| Incorporated by reference to Exhibit 10(a) to the Company’s Annual Report on Form 10-K for the year ended December 31, 2021. | ||||||||||||||||||||||||||||||||||||||||||||||||||||||||||||||
| Incorporated by reference to Exhibit 10(a) to the Company’s Annual Report on Form 10-K for the year ended December 31, 2020. | ||||||||||||||||||||||||||||||||||||||||||||||||||||||||||||||
| Incorporated by reference to Exhibit 10(a) to the Company’s Current Report on Form 8-K filed October 25, 2019. | ||||||||||||||||||||||||||||||||||||||||||||||||||||||||||||||
| 10(b)* | Filed herewith. | |||||||||||||||||||||||||||||||||||||||||||||||||||||||||||||
| Filed herewith. | ||||||||||||||||||||||||||||||||||||||||||||||||||||||||||||||
| 10(c)* | Incorporated by reference to Exhibit 10(c) to the Company’s Annual Report on Form 10-K for the year ended December 31, 2020. | |||||||||||||||||||||||||||||||||||||||||||||||||||||||||||||
Incorporated by reference to Exhibit 10(f) to the Company’s Annual Report on Form 10-K for the year ended December 31, 2009. |
||||||||||||||||||||||||||||||||||||||||||||||||||||||||||||||
Incorporated by reference to Exhibit 10(a) to the Company’s Quarterly Report on Form 10-Q for the quarter ended June 30, 2023. |
||||||||||||||||||||||||||||||||||||||||||||||||||||||||||||||
| Incorporated by reference to Exhibit 10(a) to the Company’s Quarterly Report on Form 10-Q for the quarter ended March 31, 2022. | ||||||||||||||||||||||||||||||||||||||||||||||||||||||||||||||
| Incorporated by reference to Exhibit 10(c) to the Company’s Annual Report on Form 10-K for the year ended December 31, 2020. | ||||||||||||||||||||||||||||||||||||||||||||||||||||||||||||||
| Incorporated by reference to Exhibit 10(c) to the Company’s Annual Report on Form 10-K for the year ended December 31, 2018. | ||||||||||||||||||||||||||||||||||||||||||||||||||||||||||||||
| Incorporated by reference to Exhibit 10(c) to the Company’s Quarterly Report on Form 10-Q for the quarter ended June 30, 2017. | ||||||||||||||||||||||||||||||||||||||||||||||||||||||||||||||
| Incorporated by reference to Exhibit 10(d) to the Company’s Annual Report on Form 10-K for the year ended December 31, 2016. | ||||||||||||||||||||||||||||||||||||||||||||||||||||||||||||||
| Incorporated by reference to Exhibit 10(a) to the Company’s Quarterly Report on Form 10-Q for the quarter ended June 30, 2016. | ||||||||||||||||||||||||||||||||||||||||||||||||||||||||||||||
| Incorporated by reference to Exhibit 10(e) to the Company’s Annual Report on Form 10-K for the year ended December 31, 2015. | ||||||||||||||||||||||||||||||||||||||||||||||||||||||||||||||
| Incorporated by reference to Exhibit 10(a) to the Company’s Quarterly Report on Form 10-Q for the quarter ended June 30, 2014. | ||||||||||||||||||||||||||||||||||||||||||||||||||||||||||||||
| Incorporated by reference to Exhibit 10(e) to the Company’s Annual Report on Form 10-K for the year ended December 31, 2012. | ||||||||||||||||||||||||||||||||||||||||||||||||||||||||||||||
| Incorporated by reference to Exhibit 10(a) to the Company’s Quarterly Report on Form 10-Q for the quarter ended June 30, 2011. | ||||||||||||||||||||||||||||||||||||||||||||||||||||||||||||||
|
Exhibit
Number
|
Description |
Location |
||||||||||||||||||||||||||||||||||||||||||||||||||||||||||||
| Incorporated by reference to Exhibit 10(f) to the Company’s Annual Report on Form 10-K for the year ended December 31, 2009. | ||||||||||||||||||||||||||||||||||||||||||||||||||||||||||||||
| 10(d)* | Incorporated by reference to Exhibit 10(f) to the Company’s Annual Report on Form 10-K for the year ended December 31, 2007. | |||||||||||||||||||||||||||||||||||||||||||||||||||||||||||||
|
|
Incorporated by reference to Exhibit 10(a) to the Company’s Quarterly Report on Form 10-Q for the quarter ended June 30, 2013. | |||||||||||||||||||||||||||||||||||||||||||||||||||||||||||||
|
|
Incorporated by reference to Exhibit 10(a) to the Company’s Quarterly Report on Form 10-Q for the quarter ended March 31, 2013. | |||||||||||||||||||||||||||||||||||||||||||||||||||||||||||||
|
|
Incorporated by reference to Exhibit 10(f) to the Company’s Annual Report on Form 10-K for the year ended December 31, 2011. | |||||||||||||||||||||||||||||||||||||||||||||||||||||||||||||
|
|
Incorporated by reference to Exhibit 10(d) to the Company’s Quarterly Report on Form 10-Q for the quarter ended March 31, 2011. | |||||||||||||||||||||||||||||||||||||||||||||||||||||||||||||
|
|
Incorporated by reference to Exhibit 10(a) to the Company’s Quarterly Report on Form 10-Q for the quarter ended March 31, 2009. | |||||||||||||||||||||||||||||||||||||||||||||||||||||||||||||
|
|
Incorporated by reference to Exhibit 10(a) to the Company’s Quarterly Report on Form 10-Q for the quarter ended September 30, 2008. | |||||||||||||||||||||||||||||||||||||||||||||||||||||||||||||
| Incorporated by reference to Exhibit 10(f) to the Company’s Annual Report on Form 10-K for the year ended December 31, 2007. | ||||||||||||||||||||||||||||||||||||||||||||||||||||||||||||||
| Incorporated by reference to Exhibit 10(f) to the Company’s Annual Report on Form 10-K for the year ended December 31, 2006. | ||||||||||||||||||||||||||||||||||||||||||||||||||||||||||||||
| Incorporated by reference to Exhibit 10(b) to the Company’s Quarterly Report on Form 10-Q for the quarter ended June 30, 2013. | ||||||||||||||||||||||||||||||||||||||||||||||||||||||||||||||
| 10(e)* | Incorporated by reference to Exhibit 10(b) to the former Wells Fargo’s Annual Report on Form 10-K for the year ended December 31, 1997. | |||||||||||||||||||||||||||||||||||||||||||||||||||||||||||||
| Incorporated by reference to Exhibit 10(d) to the Company’s Quarterly Report on Form 10-Q for the quarter ended September 30, 2003. | ||||||||||||||||||||||||||||||||||||||||||||||||||||||||||||||
| 10(f)* | Incorporated by reference to Exhibit 10(c) to the Company’s Current Report on Form 8-K filed May 4, 2009. | |||||||||||||||||||||||||||||||||||||||||||||||||||||||||||||
Incorporated by reference to Exhibit 10(b) to the Company’s Quarterly Report on Form 10-Q for the quarter ended June 30, 2023. |
||||||||||||||||||||||||||||||||||||||||||||||||||||||||||||||
| Incorporated by reference to Exhibit 10(b) to the Company’s Quarterly Report on Form 10-Q for the quarter ended March 31, 2022. | ||||||||||||||||||||||||||||||||||||||||||||||||||||||||||||||
| Incorporated by reference to Exhibit 10(f) to the Company’s Annual Report on Form 10-K for the year ended December 31, 2020. | ||||||||||||||||||||||||||||||||||||||||||||||||||||||||||||||
| Incorporated by reference to Exhibit 10(b) to the Company’s Quarterly Report on Form 10-Q for the quarter ended June 30, 2020. | ||||||||||||||||||||||||||||||||||||||||||||||||||||||||||||||
| Incorporated by reference to Exhibit 10(i) to the Company’s Annual Report on Form 10-K for the year ended December 31, 2018. | ||||||||||||||||||||||||||||||||||||||||||||||||||||||||||||||
|
Exhibit
Number
|
Description |
Location |
||||||||||||||||||||||||||||||||||||||||||||||||||||||||||||
| Incorporated by reference to Exhibit 10(d) to the Company’s Quarterly Report on Form 10-Q for the quarter ended June 30, 2017. | ||||||||||||||||||||||||||||||||||||||||||||||||||||||||||||||
| Incorporated by reference to Exhibit 10(b) to the Company’s Quarterly Report on Form 10-Q for the quarter ended June 30, 2014. | ||||||||||||||||||||||||||||||||||||||||||||||||||||||||||||||
| 10(g)* | Incorporated by reference to Exhibit 10(b) to the Company’s Current Report on Form 8-K filed May 4, 2009. | |||||||||||||||||||||||||||||||||||||||||||||||||||||||||||||
Incorporated by reference to Exhibit 10(c) to the Company’s Quarterly Report on Form 10-Q for the quarter ended June 30, 2023. |
||||||||||||||||||||||||||||||||||||||||||||||||||||||||||||||
| Incorporated by reference to Exhibit 10(c) to the Company’s Quarterly Report on Form 10-Q for the quarter ended March 31, 2022. | ||||||||||||||||||||||||||||||||||||||||||||||||||||||||||||||
| Incorporated by reference to Exhibit 10(c) to the Company’s Quarterly Report on Form 10-Q for the quarter ended June 30, 2020. | ||||||||||||||||||||||||||||||||||||||||||||||||||||||||||||||
| Incorporated by reference to Exhibit 10(j) to the Company’s Annual Report on Form 10-K for the year ended December 31, 2018. | ||||||||||||||||||||||||||||||||||||||||||||||||||||||||||||||
| Incorporated by reference to Exhibit 10(h) to the Company’s Annual Report on Form 10-K for the year ended December 31, 2019. | ||||||||||||||||||||||||||||||||||||||||||||||||||||||||||||||
| Incorporated by reference to Exhibit 10(e) to the Company’s Quarterly Report on Form 10-Q for the quarter ended June 30, 2017. | ||||||||||||||||||||||||||||||||||||||||||||||||||||||||||||||
| 10(h)* | Supplemental Long-Term Disability Plan. | Incorporated by reference to Exhibit 10(f) to the Company’s Annual Report on Form 10-K for the year ended December 31, 1990. | ||||||||||||||||||||||||||||||||||||||||||||||||||||||||||||
| Amendment to Supplemental Long-Term Disability Plan. | Incorporated by reference to Exhibit 10(g) to the Company’s Annual Report on Form 10-K for the year ended December 31, 1992. | |||||||||||||||||||||||||||||||||||||||||||||||||||||||||||||
| 10(i)* | Incorporated by reference to Exhibit 10(y) to the Company’s Annual Report on Form 10-K for the year ended December 31, 2003. | |||||||||||||||||||||||||||||||||||||||||||||||||||||||||||||
| 10(j)* | Incorporated by reference to Exhibit 10(w) to the Company’s Annual Report on Form 10-K for the year ended December 31, 2008. | |||||||||||||||||||||||||||||||||||||||||||||||||||||||||||||
| 10(k)* | Incorporated by reference to Exhibit 10(f) to the Company’s Quarterly Report on Form 10-Q for the quarter ended March 31, 2022. | |||||||||||||||||||||||||||||||||||||||||||||||||||||||||||||
| 10(l)* | Incorporated by reference to Exhibit 10(g) to the Company’s Quarterly Report on Form 10-Q for the quarter ended March 31, 2022. | |||||||||||||||||||||||||||||||||||||||||||||||||||||||||||||
| 10(m)* | Incorporated by reference to Exhibit (10)(a) to Wachovia Corporation’s Current Report on Form 8-K filed December 29, 2008. | |||||||||||||||||||||||||||||||||||||||||||||||||||||||||||||
Incorporated by reference to Exhibit 10(d) to the Company’s Quarterly Report on Form 10-Q for the quarter ended June 30, 2023. |
||||||||||||||||||||||||||||||||||||||||||||||||||||||||||||||
| Incorporated by reference to Exhibit 10(d) to the Company’s Quarterly Report on Form 10-Q for the quarter ended March 31, 2022. | ||||||||||||||||||||||||||||||||||||||||||||||||||||||||||||||
| Incorporated by reference to Exhibit 10(m) to the Company’s Annual Report on Form 10-K for the year ended December 31, 2021. | ||||||||||||||||||||||||||||||||||||||||||||||||||||||||||||||
|
Exhibit
Number
|
Description |
Location |
||||||||||||||||||||||||||||||||||||||||||||||||||||||||||||
| Incorporated by reference to Exhibit 10(m) to the Company’s Annual Report on Form 10-K for the year ended December 31, 2021. | ||||||||||||||||||||||||||||||||||||||||||||||||||||||||||||||
| Incorporated by reference to Exhibit 10(m) to the Company’s Annual Report on Form 10-K for the year ended December 31, 2021. | ||||||||||||||||||||||||||||||||||||||||||||||||||||||||||||||
| Incorporated by reference to Exhibit 10(m) to the Company’s Annual Report on Form 10-K for the year ended December 31, 2021. | ||||||||||||||||||||||||||||||||||||||||||||||||||||||||||||||
| Incorporated by reference to Exhibit 10(m) to the Company’s Annual Report on Form 10-K for the year ended December 31, 2021. | ||||||||||||||||||||||||||||||||||||||||||||||||||||||||||||||
| Incorporated by reference to Exhibit 10(m) to the Company’s Annual Report on Form 10-K for the year ended December 31, 2021. | ||||||||||||||||||||||||||||||||||||||||||||||||||||||||||||||
| 10(n)* | Incorporated by reference to Exhibit (10)(d) to Wachovia Corporation’s Annual Report on Form 10-K for the year ended December 31, 1997. |
|||||||||||||||||||||||||||||||||||||||||||||||||||||||||||||
| 10(o)* | Incorporated by reference to Exhibit (99) to Wachovia Corporation’s Current Report on Form 8-K filed January 5, 2005. |
|||||||||||||||||||||||||||||||||||||||||||||||||||||||||||||
| 10(p)* | Incorporated by reference to Exhibit 10(b) to Wachovia Corporation’s Current Report on Form 8-K filed December 29, 2008. | |||||||||||||||||||||||||||||||||||||||||||||||||||||||||||||
Incorporated by reference to Exhibit 10(gg) to Wachovia Corporation’s Annual Report on Form 10-K for the year ended December 31, 2002. |
||||||||||||||||||||||||||||||||||||||||||||||||||||||||||||||
| Incorporated by reference to Exhibit 10(e) to the Company’s Quarterly Report on Form 10-Q for the quarter ended March 31, 2022. | ||||||||||||||||||||||||||||||||||||||||||||||||||||||||||||||
| Incorporated by reference to Exhibit 10(a) to the Company’s Quarterly Report on Form 10-Q for the quarter ended June 30, 2020. | ||||||||||||||||||||||||||||||||||||||||||||||||||||||||||||||
| Incorporated by reference to Exhibit 10(s) to the Company’s Annual Report on Form 10-K for the year ended December 31, 2018. | ||||||||||||||||||||||||||||||||||||||||||||||||||||||||||||||
| Incorporated by reference to Exhibit 10(f) to the Company’s Quarterly Report on Form 10-Q for the quarter ended June 30, 2017. | ||||||||||||||||||||||||||||||||||||||||||||||||||||||||||||||
| Incorporated by reference to Exhibit 10(b) to the Company’s Quarterly Report on Form 10-Q for the quarter ended June 30, 2016. | ||||||||||||||||||||||||||||||||||||||||||||||||||||||||||||||
Incorporated by reference to Exhibit 10(c) to Wachovia Corporation’s Current Report on Form 8-K filed December 29, 2008. |
||||||||||||||||||||||||||||||||||||||||||||||||||||||||||||||
Incorporated by reference to Exhibit 10(b) to Wachovia Corporation’s Current Report on Form 8-K filed December 20, 2007. |
||||||||||||||||||||||||||||||||||||||||||||||||||||||||||||||
| 10(q)* | Incorporated by reference to Exhibit 10(bb) to the Company’s Annual Report on Form 10-K for the year ended December 31, 2014. | |||||||||||||||||||||||||||||||||||||||||||||||||||||||||||||
| 10(r)* | Incorporated by reference to Exhibit 10(v) to the Company’s Annual Report on Form 10-K for the year ended December 31, 2018. | |||||||||||||||||||||||||||||||||||||||||||||||||||||||||||||
| 10(s)* | Incorporated by reference to Exhibit 10(a) to the Company’s Current Report on Form 8-K filed September 27, 2019. | |||||||||||||||||||||||||||||||||||||||||||||||||||||||||||||
|
Exhibit
Number
|
Description | Location | ||||||||||||||||||||||||||||||||||||||||||||||||||||||||||||
| 13 | Filed herewith. | |||||||||||||||||||||||||||||||||||||||||||||||||||||||||||||
| 21 | Filed herewith. | |||||||||||||||||||||||||||||||||||||||||||||||||||||||||||||
| 22 | Incorporated by reference to Exhibit 22 to the Company’s Quarterly Report on Form 10-Q for the quarter ended March 31, 2023. |
|||||||||||||||||||||||||||||||||||||||||||||||||||||||||||||
| 23 | Filed herewith. | |||||||||||||||||||||||||||||||||||||||||||||||||||||||||||||
| 24 | Filed herewith. | |||||||||||||||||||||||||||||||||||||||||||||||||||||||||||||
| 31(a) | Filed herewith. | |||||||||||||||||||||||||||||||||||||||||||||||||||||||||||||
| 31(b) | Filed herewith. | |||||||||||||||||||||||||||||||||||||||||||||||||||||||||||||
| 32(a) | Furnished herewith. | |||||||||||||||||||||||||||||||||||||||||||||||||||||||||||||
| 32(b) | Furnished herewith. | |||||||||||||||||||||||||||||||||||||||||||||||||||||||||||||
97 |
Filed herewith. | |||||||||||||||||||||||||||||||||||||||||||||||||||||||||||||
| 99 | Filed herewith. | |||||||||||||||||||||||||||||||||||||||||||||||||||||||||||||
| 101.SCH | XBRL Taxonomy Extension Schema Document. | Filed herewith. | ||||||||||||||||||||||||||||||||||||||||||||||||||||||||||||
| 101.CAL | XBRL Taxonomy Extension Calculation Linkbase Document. | Filed herewith. | ||||||||||||||||||||||||||||||||||||||||||||||||||||||||||||
| 101.LAB | XBRL Taxonomy Extension Label Linkbase Document. | Filed herewith. | ||||||||||||||||||||||||||||||||||||||||||||||||||||||||||||
| 101.PRE | XBRL Taxonomy Extension Presentation Linkbase Document. | Filed herewith. | ||||||||||||||||||||||||||||||||||||||||||||||||||||||||||||
| 101.DEF | XBRL Taxonomy Extension Definitions Linkbase Document. | Filed herewith. | ||||||||||||||||||||||||||||||||||||||||||||||||||||||||||||
| 104 | Cover Page Interactive Data File. | Formatted as Inline XBRL and contained in Exhibit 101. |
||||||||||||||||||||||||||||||||||||||||||||||||||||||||||||
| ITEM 16. | FORM 10-K SUMMARY | ||||
| By: | /s/ CHARLES W. SCHARF | |||||||||||||
| Charles W. Scharf | ||||||||||||||
| President and Chief Executive Officer | ||||||||||||||
| By: | /s/ CHARLES W. SCHARF | |||||||||||||
| Charles W. Scharf | ||||||||||||||
| President and Chief Executive Officer | ||||||||||||||
| (Principal Executive Officer) | ||||||||||||||
| February 20, 2024 | ||||||||||||||
| By: | /s/ MICHAEL P. SANTOMASSIMO | |||||||||||||
| Michael P. Santomassimo | ||||||||||||||
| Senior Executive Vice President and Chief Financial Officer | ||||||||||||||
| (Principal Financial Officer) | ||||||||||||||
| February 20, 2024 | ||||||||||||||
| By: | /s/ MUNEERA S. CARR | |||||||||||||
| Muneera S. Carr | ||||||||||||||
| Executive Vice President, Chief Accounting Officer and Controller | ||||||||||||||
| (Principal Accounting Officer) | ||||||||||||||
| February 20, 2024 | ||||||||||||||
| Steven D. Black | Richard K. Davis | Maria R. Morris | Ronald L. Sargent | ||||||||
| Mark A. Chancy | Wayne M. Hewett | Felicia F. Norwood | Charles W. Scharf | ||||||||
| Celeste A. Clark | CeCelia G. Morken | Richard B. Payne, Jr. | Suzanne M. Vautrinot | ||||||||
| Theodore F. Craver, Jr. | |||||||||||
| By: | /s/ STEVEN D. BLACK | |||||||||||||
| Steven D. Black | ||||||||||||||
| Director and Attorney-in-fact | ||||||||||||||
| February 20, 2024 | ||||||||||||||
| Make-Whole Acquisition Stock Price |
||||||||||||||||||||||||||||||||||||||
| Effective Date |
$120.54 |
$125.57 |
$138.12 |
$150.68 |
$156.71 |
$175.79 |
$203.72 |
$226.02 |
$251.13 |
$301.36 |
$401.81 |
$502.26 |
||||||||||||||||||||||||||
| April 17, 2008 | 1.9153 | 1.8855 | 1.5191 | 1.1110 | 0.9497 | 0.6471 | 0.3962 | 0.2847 | 0.2091 | 0.1354 | 0.0757 | 0.0458 | ||||||||||||||||||||||||||
| March 15, 2009 | 1.9153 | 1.8775 | 1.5052 | 1.0951 | 0.9437 | 0.6331 | 0.3763 | 0.2588 | 0.1852 | 0.1175 | 0.0697 | 0.0438 | ||||||||||||||||||||||||||
| March 15, 2010 | 1.9153 | 1.8397 | 1.4913 | 1.0871 | 0.9378 | 0.6073 | 0.3365 | 0.2210 | 0.1533 | 0.0956 | 0.0577 | 0.0358 | ||||||||||||||||||||||||||
| March 15, 2011 | 1.9153 | 1.7899 | 1.4694 | 1.0731 | 0.9238 | 0.5794 | 0.2887 | 0.1712 | 0.1075 | 0.0657 | 0.0398 | 0.0259 | ||||||||||||||||||||||||||
| March 15, 2012 | 1.9153 | 1.7561 | 1.4355 | 1.0652 | 0.9139 | 0.5356 | 0.2051 | 0.0896 | 0.0458 | 0.0299 | 0.0199 | 0.0119 | ||||||||||||||||||||||||||
| March 15, 2013 | 1.9153 | 1.6704 | 1.4275 | 1.0592 | 0.9119 | 0.5097 | 0.0916 | 0.0000 | 0.0000 | 0.0000 | 0.0000 | 0.0000 | ||||||||||||||||||||||||||
| Thereafter | 1.9153 | 1.6704 | 1.4275 | 1.0592 | 0.9119 | 0.5097 | 0.0916 | 0.0000 | 0.0000 | 0.0000 | 0.0000 | 0.0000 | ||||||||||||||||||||||||||
CR0 |
= |
the conversion rate in effect at the close of business on the record date |
||||||
CR1 |
= |
the conversion rate in effect immediately after the record date |
||||||
OS0 |
= |
the number of shares of our common stock outstanding at the close of business on the record date prior to giving effect to such event |
||||||
OS1 |
= |
the number of shares of our common stock that would be outstanding immediately after, and solely as a result of, such event |
||||||
CR0 |
= |
the conversion rate in effect at the close of business on the record date |
||||||
CR1 |
= |
the conversion rate in effect immediately after the record date |
||||||
OS0 |
= |
the number of shares of our common stock outstanding at the close of business on the record date |
||||||
X |
= |
the total number of shares of our common stock issuable pursuant to such rights or warrants (or upon conversion of such securities) |
||||||
Y |
= |
the number of shares equal to quotient of the aggregate price payable to exercise such rights or warrants (or the conversion price for such securities paid upon conversion) divided by the average of the volume-weighted average price of our common stock over each of the ten consecutive volume-weighted average price trading days prior to the Business Day immediately preceding the announcement of the issuance of such rights or warrants |
||||||
CR0 |
= |
the conversion rate in effect at the close of business on the record date |
||||||
CR1 |
= |
the conversion rate in effect immediately after the record date |
||||||
SP0 |
= |
the current market price as of the record date |
||||||
FMV |
= |
the fair market value (as determined by our board of directors) on the record date of the shares of capital stock, evidences of indebtedness or assets so distributed, applicable to one share of our common stock |
||||||
CR0 |
= |
the conversion rate in effect at the close of business on the record date |
||||||
CR1 |
= |
the conversion rate in effect immediately after the record date |
||||||
FMV0 |
= |
the average of the volume-weighted average price of the capital stock or similar equity interests distributed to holders of our common stock applicable to one share of our common stock over each of the ten consecutive volume-weighted average price trading days commencing on and including the third volume-weighted average price trading day after the date on which “ex-distribution trading” commences for such dividend or distribution on the New York Stock Exchange or such other national or regional exchange or association or over-the-counter market or if not so traded or quoted, the fair market value of the capital stock or similar equity interests distributed to holders of our common stock applicable to one share of our common stock as determined by our board of directors |
||||||
MP0 |
= |
the average of the volume-weighted average price of our common stock over each of the ten consecutive volume-weighted average price trading days commencing on and including the third volume-weighted average price trading day after the date on which “ex-distribution trading” commences for such dividend or distribution on the New York Stock Exchange or such other national or regional exchange or association or over-the-counter market on which our common stock is then traded or quoted |
||||||
CR0 |
= |
the conversion rate in effect at the close of business on the record date |
||||||
CR1 |
= |
the conversion rate in effect immediately after the record date |
||||||
SP0 |
= |
the current market price as of the record date |
||||||
C |
= |
the amount in cash per share equal to (1) in the case of a regular quarterly dividend, the amount we distribute to holders or pay, less the dividend threshold amount or (2) in any other case, the amount we distributes to holders or pay |
||||||
CR0 |
= |
the conversion rate in effect at the close of business on the expiration date |
||||||
CR1 |
= |
the conversion rate in effect immediately after the expiration date |
||||||
FMV |
= |
the fair market value (as determined by our board of directors), on the expiration date, of the aggregate value of all cash and any other consideration paid or payable for shares validly tendered or exchanged and not withdrawn as of the expiration date |
||||||
OS1 |
= |
the number of shares of our common stock outstanding as of the last time tenders or exchanges may be made pursuant to such tender or exchange offer (expiration time) less any purchased shares |
||||||
OS0 |
= |
the number of shares of our common stock outstanding at the expiration time, including any purchased shares |
||||||
SP1 |
= |
the average of the volume-weighted average price of common stock over each of the ten consecutive volume-weighted average price trading days commencing with the volume-weighted average price trading day immediately after the expiration date |
||||||
| US.361038393.02 | |||||

| Average ROTCE ([applicable %] weighting) |
Percentage of Target Award Number | ||||
[applicable ROTCE %] |
[applicable %] |
||||
[applicable ROTCE %] |
[applicable %] |
||||
[applicable ROTCE %] |
[applicable %] |
||||
[applicable ROTCE %] |
[applicable %] |
||||
[applicable ROTCE %] |
[applicable %] |
||||
| Relative ROTCE Percentile ([applicable %] weighting) |
Percentage of Target Award Number | ||||
[applicable ROTCE %] |
[applicable %] |
||||
[applicable ROTCE %] |
[applicable %] |
||||
[applicable ROTCE %] |
[applicable %] |
||||
[applicable ROTCE %] |
[applicable %] |
||||
| TSR Percentile | Percentage TSR Modifier | ||||
| [applicable percentile] | [applicable percentage] increase |
||||
| [applicable percentile] | [applicable percentage] | ||||
| [applicable percentile] | [applicable percentage] decrease |
||||
Business Division |
Applicable Job Titles and/or Job Descriptions |
Length of Required Notice Period |
||||||
Any business division of Wells Fargo & Company or its Affiliates |
•Senior Executive Vice Presiden
•Executive Vice Presiden
•Direct report of an Operating Committee member, excluding non-executive
|
90 days |
||||||
Corporate & Investment Banking (CIB) |
Managing Director |
90 days |
||||||
Executive Director |
60 days |
|||||||
Vice President |
30 days |
|||||||
Commercial Banking |
Managing Director |
90 days |
||||||
Executive Director |
60 days |
|||||||
|
(check the appropriate box)
☐ NOT TO DEFER receipt of my 202_ Equity Award[s] beyond Separation from Service.
☐ TO DEFER ________% of my 202_ Equity Award[s] beyond Separation from Service.
All deferrals of 202_ Equity Awards will be allocated to the Deferred Stock Account of the Directors Stock
Compensation and Deferral Plan. | ||
 OR
OR 
Business Division |
Applicable Job Titles and/or Job Descriptions |
Length of Required Notice Period |
||||||
Any business division of Wells Fargo & Company or its Affiliates |
•Senior Executive Vice President
•Executive Vice President
•Direct report of an Operating Committee member, excluding non-executives
|
90 days |
||||||
Corporate & Investment Banking (CIB) |
Managing Director |
90 days |
||||||
Executive Director |
60 days |
|||||||
Vice President |
30 days |
|||||||
Commercial Banking |
Managing Director |
90 days |
||||||
Executive Director |
60 days |
|||||||

C. Inquiries and Disputes |
|||||
Definitions |
|||||
| Term/Acronym | Definition | ||||
| Applicable Laws, Policies, and Expectations | All rules, laws, guidance, regulations, and all enterprise and business-specific policies, procedures, and expectations (including “Related Information” and documents referenced in the policies, and HR Services & Support (HRSS) articles or other documents describing the expectations of the Company or business), applicable to the Participant as a Wells Fargo employee and/or the performance of the Participant’s job duties in the Participant’s Wells Fargo position. | ||||
| Award | Any incentive compensation provided under the Plan. | ||||
| Award Payment Date | Calendar date on which Payroll initiates delivery of or issuance of the Award to a Participant. | ||||
|
Cause
(Applicable only to non-US Participants.)
|
For purposes of Section VII, B, c, “Terminations – Non-US Participants,” Cause includes, but is not limited to, the termination of the Participant’s employment where such termination involved one or more of the following grounds (unless the term Cause is otherwise replaced by a country-specific definition in the Country Appendix): | ||||
| Term/Acronym | Definition | ||||
|
a. the continued failure or refusal of the Participant to perform satisfactorily any duties reasonably required of the Participant, after written notification by the Company, and the failure of the Participant within thirty (30) calendar days of such notification to correct such breach, failure or refusal (other than failure by reason of incapacity due to physical or mental illness); or
b. the commission of any fraud, misappropriation, embezzlement or other dishonest act that makes the Participant ineligible for coverage under the Company’s fidelity bond or otherwise makes the Participant ineligible for continued employment; or
c. any act of gross insubordination or willful misconduct; or
d. reporting to work under the influence of alcohol, narcotics or unlawful controlled substances; or
e. any violation of the Applicable Laws, Policies, and Expectations, including but not limited to any employment policies and procedures, compliance policies or procedures, the Code of Conduct, or local work rules, in force from time to time; or
f. conviction of a felony, or of a misdemeanor or other criminal offence involving a dishonest or fraudulent act, or conduct in violation of law or conduct that would constitute a basis for criminal conviction of a felony, misdemeanor, or other criminal offense that makes the Participant ineligible for coverage under the Company’s fidelity bond or otherwise makes the Participant ineligible for continued employment; or
g. violation of any securities or commodities laws, any rules or regulations pursuant to such laws, or the rules and regulations of any securities or commodities exchange or association of which the Company is a member, or violation of any similar law, regulation, ordinance or licensing requirement applicable to employees of financial institutions; or conduct that may reasonably be expected to have an adverse effect on the financial interest or business reputation of the Company.
The foregoing does not represent a complete list of all acts or omissions that may constitute grounds for a termination for Cause. Cause also includes such other acts or omissions recognized as constituting cause (or its closest equivalent, such as grounds for summary dismissal) in a particular work location under applicable law, or the Participant’s employment agreement, or the policies or local work rules in the work location. The Plan Manager has the sole discretion to determine whether a particular individual’s employment has been terminated for Cause for the purposes of Plan administration, and its determination is final and binding upon the Company and that individual.
|
|||||
| Company or Wells Fargo | Wells Fargo & Company, its subsidiaries and affiliates. | ||||
| Corporate Transaction | Includes, but is not limited to, a transaction where another company contractually agrees to either acquire all or any portion of the assets, stock, or operations of Wells Fargo and/or enters into some other business arrangement with the Company. | ||||
| Country Appendix | Identifies where regulatory or country-specific items require deviation from the terms in this Plan and addresses those differences - see Appendix A. | ||||
|
Displacement
(Applicable only to US Participants)
|
A position elimination, substantial position change or other qualifying event described in the Wells Fargo & Company Severance Plan (the “Severance Plan”) resulting in the termination of the Participant’s employment. | ||||
| Term/Acronym | Definition | ||||
|
Displacement
(Applicable only to US Participants)
|
A position elimination, substantial position change or other qualifying event described in the Wells Fargo & Company Severance Plan (the “Severance Plan”) resulting in the termination of the Participant’s employment. | ||||
| Earn or Earned |
An Award will be deemed “Earned” under the Plan when all of the terms and conditions under the Plan have been satisfied with respect to an Award, including:
1.the Participant’s manager has determined the Participant has met the criteria set forth in Section IV;
2.the Participant’s manager has completed an Award recommendation for the Participant;
3.the aggregate recommendations for the business have been approved by the Operating Committee member; and
4.the HRC has approved Plan funding and authorized the payment of Awards.
In-Year payments for deceased Participants do not require the HRC approval of Plan funding prior to payment of the Award.
|
||||
| Eligibility Date | September 30 of each Plan Year | ||||
| Employer | The Wells Fargo entity that employs the Participant. | ||||
| Executive Officer | Executive Officers shall be those persons designated “officers” by the Wells Fargo & Company’s Board of Directors for purposes of Section 16 of the Exchange Act and the rules thereunder (“Section 16”). Additionally, any Operating Committee Member who is not designated an “officer” under Section 16 shall be considered an Executive Officer for purposes of this Plan. | ||||
| Fixed Term Employee |
A person who is an employee of Wells Fargo & Company or any of its subsidiaries on a temporary contract with a defined contract end date (unless they are in the flexible or intern classification). Employees are generally considered one of the following:
1. Full-time: with standard hours of 30 or more hours per week (unless in the flexible or intern classification).
2. Part-time: with standard hours of at least 17.5 and less than 30 hours per week are classified as “part-time” (unless in the flexible or intern classification). Standard hours and the number of hours actually worked may vary somewhat for part-time employees in a nonexempt or non-overtime eligible position, depending on business needs.
Non-US employee hours per week may be different based on the location.
|
||||
|
Good Leaver Event
(Applicable only to non-US Participants)
|
For the purpose of Section VII, B, c, vi, the following reasons are Good Leaver Events:
1.A Participant who is absent from work due to injury, ill-health, or disability for a period of 182 days (whether or not consecutive) in any period of twelve (12) consecutive months.
2.A Participant’s office or employment, by the virtue of which the participant is eligible for an Award, being transferred to a person or entity that is not an affiliated company of Wells Fargo.
3.Redundancy, where Wells Fargo has determined that the Participant’s position is no longer necessary and shall be discontinued and is expressly dismissed by reason of “redundancy”. For the avoidance of doubt, the Participant is not redundant if, in the view of Wells Fargo, they have been offered reasonable alternative employment or if their employment is terminated without Cause in circumstances other than the discontinuance of the Participant’s position.
|
||||
| Term/Acronym | Definition | ||||
| HRC | The Human Resources Committee of the Wells Fargo & Company’s Board of Directors. | ||||
Long-Term Cash Award Plan (“LTCAP”) |
The applicable Long-Term Cash Award Plan (“LTCAP”) governing the terms of long-term cash awards, which may be amended from time to time, as follows:
1.For US Participants, it is the Wells Fargo & Company Long-Term Cash Award Plan; and
2.For non-US Participants, it is the Wells Fargo & Company Long-Term Cash Award Plan for International Employees.
|
||||
| Long-Term Incentive Plan (“LTIP”) | The Wells Fargo & Company Long-Term Incentive Compensation Plan (“LTIP”) which governs equity Awards such as Restricted Share Rights (RSRs), which may be amended from time to time. | ||||
Misconduct Accountability Program (MAP) |
A Participant whose conduct has the potential to harm customers, other employees, or the Wells Fargo brand, finances, or reputation may be issued a conduct related corrective action that places them in the Misconduct Accountability Program (MAP). MAP holds these Participants accountable and maintains a consistent standard of workplace conduct across the Company. Placement in the program impacts risk overlay ratings and incentive compensation decisions. |
||||
| Notice Period |
For US Participants in certain senior management positions (Senior Executive Vice President, Executive Vice President and an Operating Committee (OC) direct report) (collectively “Senior Management”) and certain positions in Corporate & Investment Banking, Commercial Banking, or other business divisions as identified from time to time, who are subject to notice requirements with the Company, the Notice Period is the time period beginning on the date the Participant communicates their resignation to Wells Fargo and ending on the last day of the Notice Period applicable to their position. Unless terminated sooner by the Participant or Wells Fargo, the Participant’s last day of employment with their Employer is the last day of the Notice Period.
For US Participants who receive written notice of a pending Displacement, the Notice Period is the time period beginning on the date the Participant receives written notice of a qualifying event under the Severance Plan and generally ends 60 days later unless the Notice Period is required to be longer by applicable law or extended by the Administrator of the Severance Plan. Unless terminated sooner by the Participant or Wells Fargo, the Participant’s last day of employment with their Employer is the last day of the Notice Period.
For non-US Participants, the Notice Period is any period between the date either the Participant or Employer serves written notice of resignation or termination on the other and the Participant’s last day of employment with their Employer.
|
||||
| Operating Committee Member | The Chief Executive Officer (“CEO”) of the Company and identified senior managers who are direct or indirect reports to the Chief Executive Officer. | ||||
| Participant | A Regular or Fixed Term Employee who meets the eligibility and qualifying criteria for participation in the Plan set forth in Section IV. A US Participant refers to an employee on a US-based payroll; a non-US Participant refers to an employee on an non-US based payroll. |
||||
| Performance Expectations | Provided to Participants under the Performance Management Framework, which may include goals, risk management requirements and other components. |
||||
| Term/Acronym | Definition | ||||
| Performance Period | The period of time, within the Plan Year, under which a Participant’s performance is evaluated for purposes of an Award recommendation. The Performance Period is the Plan Year. | ||||
| Plan Manager | The head of Human Resources and the head of Total Rewards of the Company, each of whom may act individually or jointly as the Plan Manager, or their delegate. | ||||
| Plan Year | The 12-month period beginning each January 1 and ending on the following December 31. | ||||
| Regular Employee |
Regular Employees are generally considered one of the following time types:
1.Full-time: with standard hours of 30 or more hours per week (unless in the flexible or intern classification).
2.Part-time: with standard hours of at least 17.5 and less than 30 hours per week are classified as “part-time” (unless in the flexible or intern classification). Standard hours and the number of hours actually worked may vary somewhat for part-time employees in a nonexempt or non-overtime eligible position, depending on business needs.
Non-US employee hours per week may be different based on the location.
|
||||
| Retirement | A Participant is considered “retired” if the termination is accurately entered in the HR system of record as a retirement. |
||||
C. Inquiries |
|||||
| Term/Acronym | Definition | ||||
| Applicable Laws and Policies | All rules, laws, guidance, regulations and all enterprise and business-specific policies and procedures (including “Related Information” and documents referenced in the policies), applicable to the Participant as a Wells Fargo employee and/or the performance of the Participant’s job duties in the Participant’s Wells Fargo position. | ||||
| Award | Any incentive compensation provided under the Plan. | ||||
| Award Payment Date | Calendar date on which Payroll initiates delivery of the Award to a Participant. | ||||
|
Cause
(Definition applicable only to International Participants.)
|
For purposes of Section VII, B, c, “Terminations – International Participants,” Cause includes, but is not limited to, the termination of the Participant’s employment where such termination involved one or more of the following grounds (unless the term Cause is otherwise replaced by a country-specific definition in the Country Appendix): | ||||
| Term/Acronym | Definition | ||||
|
a. the continued failure or refusal of the Participant to perform satisfactorily any duties reasonably required of the Participant, after written notification by the Company, and the failure of the Participant within thirty (30) calendar days of such notification to correct such breach, failure or refusal (other than failure by reason of incapacity due to physical or mental illness); or
b. the commission of any fraud, misappropriation, embezzlement or other dishonest act that makes the Participant ineligible for coverage under the Company’s fidelity bond or otherwise makes the Participant ineligible for continued employment; or
c. any act of gross insubordination or willful misconduct; or
d. reporting to work under the influence of alcohol, narcotics or unlawful controlled substances; or
e. any violation of the Applicable Laws and Policies, including but not limited to any employment policies and procedures, compliance policies or procedures, the Code of Ethics and Business Conduct (or the Code applicable to the Participant’s line of business), Anti-Bribery and Corruption Policy, Information Security Policy, Risk Management Accountability policies, or local Work Rules, in force from time to time; or
f. conviction of a felony, or of a misdemeanor or other criminal offence involving a dishonest or fraudulent act, or conduct in violation of law or conduct that would constitute a basis for criminal conviction of a felony, misdemeanor, or other criminal offense that makes the Participant ineligible for coverage under the Company’s fidelity bond or otherwise makes the Participant ineligible for continued employment; or
g. violation of any securities or commodities laws, any rules or regulations pursuant to such laws, or the rules and regulations of any securities or commodities exchange or association of which the Company is a member, or violation of any similar law, regulation, ordinance or licensing requirement applicable to employees of financial institutions; or conduct that may reasonably be expected to have an adverse effect on the financial interest or business reputation of the Company.
The foregoing does not represent a complete list of all acts or omissions that may constitute grounds for a termination for Cause. Cause also includes such other acts or omissions recognized as constituting cause (or its closest equivalent, such as grounds for summary dismissal) in a particular work location under applicable law, or the Participant’s employment agreement, or the policies in the work location. The Plan Manager has the sole discretion to determine whether a particular individual’s employment has been terminated for Cause for the purposes of Plan administration, and its determination is final and binding upon the Company and that individual.
|
|||||
| Company or Wells Fargo | Wells Fargo & Company, its subsidiaries and affiliates. | ||||
| Corporate Transaction | Includes, but is not limited to, a transaction where another company contractually agrees to either acquire all or any portion of the assets, stock, or operations of Wells Fargo and/or enters into some other business arrangement with the Company. | ||||
| Country Appendix | Identifies where individual country or regional regulations/laws require deviation from the terms in this Plan and addresses those differences. | ||||
| Term/Acronym | Definition | ||||
|
Displacement
(Applicable only to US Participants)
|
A position elimination, substantial position change or other qualifying event described in the Wells Fargo & Company Severance Plan (the “Severance Plan”) resulting in the termination of the Participant’s employment. | ||||
| Earn or Earned |
An Award will be deemed “Earned” under the Plan when all of the terms and conditions under the Plan have been satisfied with respect to an Award, including:
1.the Participant’s manager has determined the Participant has met the criteria set forth in Section IV;
2.the Participant’s manager has completed an Award recommendation for the Participant;
3.aggregate recommendations for the business have been approved by the Operating Committee member; and
4.the HRC has approved Plan funding and authorized the payment of Awards.
*In-Year payments to deceased employees do not require the HRC approval of Plan funding prior to payment of the Award.
|
||||
| Employer | The Wells Fargo entity that employs the Participant. | ||||
| Executive Officer | Executive Officers shall be those persons designated “officers” by the Wells Fargo & Company’s Board of Directors for purposes of Section 16 of the Exchange Act and the rules thereunder (“Section 16”). Additionally, any Operating Committee Member who is not designated an “officer” under Section 16 shall be considered an Executive Officer for purposes of this Plan. | ||||
| Fixed Term Employee | A person who is an employee of Wells Fargo & Company or any of its subsidiaries on a temporary contract with a defined contract end date (unless they are in the flexible or intern classification). Employees are generally considered one of the following: 1. Full-time: with standard hours of 30 or more hours per week (unless in the flexible or intern classification). 2. Part-time: with standard hours of at least 17.5 and less than 30 hours per week are classified as “part-time” (unless in the flexible or intern classification). Standard hours and the number of hours actually worked may vary somewhat for part-time employees in a nonexempt position, depending on business needs. International employee hours per week may be different based on the location. Discuss hours per week with your manager as needed. |
||||
|
Good Leaver Event
(International Only)
|
For the purpose of Section VII, B, c, vi, the following reasons are Good Leaver Events:
1.An employee who is absent from work due to injury, ill-health, or disability for a period of 182 days (whether or not consecutive) in any period of twelve (12) months.
2.A Participant’s office or employment, by the virtue of which the participant is eligible for an Award, being transferred to a person or entity that is not an affiliated company of Wells Fargo.
3.Redundancy, where Wells Fargo has determined that the Participant’s position or role is no longer necessary and shall be discontinued and is expressly dismissed by reason of “redundancy”. For the avoidance of doubt, the Participant is not redundant if, in the view of Wells Fargo, they have been offered reasonable alternative employment or if their employment is terminated without Cause in circumstances other than the discontinuance of the Participant’s position or role.
|
||||
| Term/Acronym | Definition | ||||
| HRC | The Human Resources Committee of Wells Fargo & Company’s Board of Directors. | ||||
| LTCAP |
The applicable Long-Term Cash Award Plan (“LTCAP”) governing the terms of long-term cash awards, as follows:
1.For US Participants, it is the Wells Fargo & Company Long-Term Cash Award Plan; and
2.For International Participants, it is the Wells Fargo & Company Long-Term Cash Award Plan for International Employees.
|
||||
| LTIP | The Wells Fargo & Company Long-Term Incentive Plan which governs equity Awards such as Restricted Share Rights (RSRs). | ||||
| Misconduct | Inappropriate, unethical, or unlawful behavior on the part of an employee or individual acting on behalf of the Company. | ||||
| Misconduct Accountability Program (MAP) |
An employee whose conduct harms customers, other employees, or the Wells Fargo brand may be issued a corrective action that places them in the Misconduct Accountability Program. MAP aligns and strengthens the connection between Wells Fargo’s behavioral expectations and compensation principles.
The program’s objective is to implement a consistent approach for how conduct impacts an employee’s performance review and incentive compensation, and helps managers reinforce employee accountability related to conduct.
|
||||
| Notice Period |
For US Participants in certain senior management positions (Senior Executive Vice President, Executive Vice President and an Operating Committee (OC) direct report) (collectively “Senior Management”) and certain positions in Corporate & Investment Banking, Commercial Banking, or other business as identified from time to time, who are subject to notice requirements with the Company, the Notice Period is the time period beginning on the date the Participant communicates their resignation to Wells Fargo management and ending on the last day of the Notice Period applicable to their position. Unless terminated sooner by the Participant or Wells Fargo, the Participant’s last day of employment with their Employer is the last day of the Notice Period.
For US Participants who receive written notice of a pending Displacement, the Notice Period is the time period beginning on the date the Participant receives written notice of a qualifying event under the Severance Plan and generally ends 60 days later unless the Notice Period is required to be longer by applicable law or extended by the Administrator of the Severance Plan. Unless terminated sooner by the Participant or Wells Fargo, the Participant’s last day of employment with their Employer is the last day of the Notice Period.
For International Participants, the Notice Period is any period between the date either the Participant or Employer serves written notice of resignation or termination on the other and the Participant’s last day of employment with their Employer.
|
||||
| Operating Committee Member | The Chief Executive Officer (“CEO”) of the Company and identified senior managers who are direct or indirect reports to the Chief Executive Officer. | ||||
| Term/Acronym | Definition | ||||
| Participant | A Regular Full-Time, Regular Part- Time, or Fixed Term Employee who meets the eligibility and qualifying criteria for participation in this Plan set forth in Section IV. A US Participant refers to an employee on a US-based payroll; an International Participant refers to an employee on an International-based payroll. | ||||
| Performance Expectations | Provided to employees under the Performance Management Framework, which may include goals, risk management requirements and other components. | ||||
| Performance Period | The period of time, within the Plan Year, under which a Participant’s performance is evaluated for purposes of an Award recommendation. | ||||
| Plan Manager | The head of Human Resources and the head of Total Rewards of the Company, each of whom may act individually or jointly as the Plan Manager. | ||||
| Plan Year | The 12-month period beginning each January 1 and ending on the following December 31. | ||||
| Regular Employee |
A person who is an employee of Wells Fargo & Company or any of its subsidiaries without special terms or conditions of employment. Employees are generally considered one of the following time types:
1.Full-time: with standard hours of 30 or more hours per week (unless in the flexible or intern classification).
2.Part-time: with standard hours of at least 17.5 and less than 30 hours per week are classified as “part-time” (unless in the flexible or intern classification). Standard hours and the number of hours actually worked may vary somewhat for part-time employees in a nonexempt position, depending on business needs.
International employee hours per week may be different based on the location. Discuss hours per week with your manager as needed.
|
||||
| Retirement | A Participant is considered “retired” if the termination is entered in the HR system of record as a retirement. | ||||
| Financial Review | ||||||||||||||||||||||||||||||||
| Overview | 4 | Equity Securities | ||||||||||||||||||||||||||||||
| Earnings Performance | 5 | Loans and Related Allowance for Credit Losses | ||||||||||||||||||||||||||||||
| Balance Sheet Analysis | 6 | Mortgage Banking Activities | ||||||||||||||||||||||||||||||
| Off-Balance Sheet Arrangements | 7 | Intangible Assets and Other Assets | ||||||||||||||||||||||||||||||
| Risk Management | 8 | Leasing Activity | ||||||||||||||||||||||||||||||
| Capital Management | 9 | Deposits | ||||||||||||||||||||||||||||||
| Regulatory Matters | 10 | Long-Term Debt | ||||||||||||||||||||||||||||||
| Critical Accounting Policies | 11 | Preferred Stock | ||||||||||||||||||||||||||||||
| Current Accounting Developments | 12 | Common Stock and Stock Plans | ||||||||||||||||||||||||||||||
| Forward-Looking Statements | 13 | Legal Actions | ||||||||||||||||||||||||||||||
| Risk Factors | 14 | Derivatives | ||||||||||||||||||||||||||||||
| Controls and Procedures | 15 | Fair Values of Assets and Liabilities | ||||||||||||||||||||||||||||||
| Disclosure Controls and Procedures | 16 | Securitizations and Variable Interest Entities | ||||||||||||||||||||||||||||||
| Internal Control Over Financial Reporting | 17 | Guarantees and Other Commitments | ||||||||||||||||||||||||||||||
| Management’s Report on Internal Control over Financial Reporting | 18 | Securities and Other Collateralized Financing Activities | ||||||||||||||||||||||||||||||
Report of Independent Registered Public Accounting Firm (KPMG LLP, Charlotte, NC, Auditor Firm ID: 185) |
19 | Pledged Assets and Collateral | ||||||||||||||||||||||||||||||
| 20 | Operating Segments | |||||||||||||||||||||||||||||||
| Financial Statements | 21 | Revenue and Expenses | ||||||||||||||||||||||||||||||
| Consolidated Statement of Income | 22 | Employee Benefits | ||||||||||||||||||||||||||||||
| Consolidated Statement of Comprehensive Income | 23 | Income Taxes | ||||||||||||||||||||||||||||||
| Consolidated Balance Sheet | 24 | Earnings and Dividends Per Common Share | ||||||||||||||||||||||||||||||
| Consolidated Statement of Changes in Equity | 25 | Other Comprehensive Income | ||||||||||||||||||||||||||||||
| Consolidated Statement of Cash Flows | 26 | Regulatory Capital Requirements and Other Restrictions | ||||||||||||||||||||||||||||||
| 27 | Parent-Only Financial Statements | |||||||||||||||||||||||||||||||
| Notes to Financial Statements | ||||||||||||||||||||||||||||||||
| 1 | Summary of Significant Accounting Policies | Report of Independent Registered Public Accounting Firm |
||||||||||||||||||||||||||||||
| 2 | Trading Activities | Quarterly Financial Data | ||||||||||||||||||||||||||||||
| 3 | Available-for-Sale and Held-to-Maturity Debt Securities | Glossary of Acronyms | ||||||||||||||||||||||||||||||
| Wells Fargo & Company | 3 |
|||||||
| Overview | ||
4 |
Wells Fargo & Company | |||||||
| Wells Fargo & Company | 5 |
|||||||
6 |
Wells Fargo & Company | |||||||
| Year ended December 31, | |||||||||||||||||||||||||||||||||||||||||
(in millions, except per share amounts) |
2023 | 2022 | $ Change 2023/ 2022 |
% Change 2023/ 2022 |
2021 | $ Change 2022/ 2021 |
% Change 2022/ 2021 |
||||||||||||||||||||||||||||||||||
| Income statement | |||||||||||||||||||||||||||||||||||||||||
| Net interest income | $ | 52,375 | 44,950 | 7,425 | 17 | % | $ | 35,779 | 9,171 | 26 | % | ||||||||||||||||||||||||||||||
Noninterest income (1) |
30,222 | 29,418 | 804 | 3 | 43,387 | (13,969) | (32) | ||||||||||||||||||||||||||||||||||
| Total revenue | 82,597 | 74,368 | 8,229 | 11 | 79,166 | (4,798) | (6) | ||||||||||||||||||||||||||||||||||
| Net charge-offs | 3,450 | 1,609 | 1,841 | 114 | 1,582 | 27 | 2 | ||||||||||||||||||||||||||||||||||
| Change in the allowance for credit losses | 1,949 | (75) | 2,024 | NM | (5,737) | 5,662 | (99) | ||||||||||||||||||||||||||||||||||
Provision for credit losses (2) |
5,399 | 1,534 | 3,865 | 252 | (4,155) | 5,689 | NM | ||||||||||||||||||||||||||||||||||
Noninterest expense (1) |
55,562 | 57,205 | (1,643) | (3) | 53,758 | 3,447 | 6 | ||||||||||||||||||||||||||||||||||
| Net income before noncontrolling interests | 19,029 | 13,378 | 5,651 | 42 | 23,799 | (10,421) | (44) | ||||||||||||||||||||||||||||||||||
Less: Net income from noncontrolling interests |
(113) | (299) | 186 | 62 | 1,690 | (1,989) | NM | ||||||||||||||||||||||||||||||||||
Wells Fargo net income (1) |
19,142 | 13,677 | 5,465 | 40 | 22,109 | (8,432) | (38) | ||||||||||||||||||||||||||||||||||
| Earnings per common share | 4.88 | 3.30 | 1.58 | 48 | 5.13 | (1.83) | (36) | ||||||||||||||||||||||||||||||||||
| Diluted earnings per common share | 4.83 | 3.27 | 1.56 | 48 | 5.08 | (1.81) | (36) | ||||||||||||||||||||||||||||||||||
Dividends declared per common share |
1.30 | 1.10 | 0.20 | 18 | 0.60 | 0.50 | 83 | ||||||||||||||||||||||||||||||||||
Balance sheet (period-end) |
|||||||||||||||||||||||||||||||||||||||||
| Debt securities | 490,458 | 496,808 | (6,350) | (1) | 537,531 | (40,723) | (8) | ||||||||||||||||||||||||||||||||||
| Loans | 936,682 | 955,871 | (19,189) | (2) | 895,394 | 60,477 | 7 | ||||||||||||||||||||||||||||||||||
Allowance for credit losses for loans |
15,088 | 13,609 | 1,479 | 11 | 13,788 | (179) | (1) | ||||||||||||||||||||||||||||||||||
| Equity securities | 57,336 | 64,414 | (7,078) | (11) | 72,886 | (8,472) | (12) | ||||||||||||||||||||||||||||||||||
Assets (1) |
1,932,468 | 1,881,020 | 51,448 | 3 | 1,948,073 | (67,053) | (3) | ||||||||||||||||||||||||||||||||||
| Deposits | 1,358,173 | 1,383,985 | (25,812) | (2) | 1,482,479 | (98,494) | (7) | ||||||||||||||||||||||||||||||||||
| Long-term debt | 207,588 | 174,870 | 32,718 | 19 | 160,689 | 14,181 | 9 | ||||||||||||||||||||||||||||||||||
Common stockholders’ equity (1) |
166,444 | 160,952 | 5,492 | 3 | 168,111 | (7,159) | (4) | ||||||||||||||||||||||||||||||||||
Wells Fargo stockholders’ equity (1) |
185,735 | 180,227 | 5,508 | 3 | 187,386 | (7,159) | (4) | ||||||||||||||||||||||||||||||||||
Total equity (1) |
187,443 | 182,213 | 5,230 | 3 | 189,889 | (7,676) | (4) | ||||||||||||||||||||||||||||||||||
| Wells Fargo & Company | 7 |
|||||||
| Year ended December 31, | |||||||||||||||||
| 2023 | 2022 | 2021 | |||||||||||||||
| Performance ratios | |||||||||||||||||
Return on average assets (ROA) (2) |
1.02 | % | 0.72 | 1.14 | |||||||||||||
Return on average equity (ROE) (3) |
11.0 | 7.8 | 12.3 | ||||||||||||||
Return on average tangible common equity (ROTCE) (4) |
13.1 | 9.3 | 14.8 | ||||||||||||||
Efficiency ratio (5) |
67 | 77 | 68 | ||||||||||||||
Capital and other metrics (6) |
|||||||||||||||||
Wells Fargo common stockholders’ equity to assets |
8.61 | 8.56 | 8.63 | ||||||||||||||
Total equity to assets |
9.70 | 9.69 | 9.75 | ||||||||||||||
Risk-based capital ratios and components: |
|||||||||||||||||
| Standardized Approach: | |||||||||||||||||
| Common Equity Tier 1 (CET1) | 11.43 | 10.60 | 11.35 | ||||||||||||||
| Tier 1 capital | 12.98 | 12.11 | 12.89 | ||||||||||||||
| Total capital | 15.67 | 14.82 | 15.84 | ||||||||||||||
| Risk-weighted assets (RWAs) (in billions) | $ | 1,231.7 | 1,259.9 | 1,239.0 | |||||||||||||
| Advanced Approach: | |||||||||||||||||
| Common Equity Tier 1 (CET1) | 12.63 | % | 12.00 | 12.60 | |||||||||||||
| Tier 1 capital | 14.34 | 13.72 | 14.31 | ||||||||||||||
| Total capital | 16.40 | 15.94 | 16.72 | ||||||||||||||
| Risk-weighted assets (RWAs) (in billions) | $ | 1,114.3 | 1,112.3 | 1,116.1 | |||||||||||||
Tier 1 leverage ratio |
8.50 | % | 8.26 | 8.34 | |||||||||||||
Supplementary Leverage Ratio (SLR) |
7.09 | 6.86 | 6.89 | ||||||||||||||
Total Loss Absorbing Capacity (TLAC) Ratio (7) |
25.05 | 23.27 | 23.03 | ||||||||||||||
Liquidity Coverage Ratio (LCR) (8) |
125 | 122 | 118 | ||||||||||||||
Average balances: |
|||||||||||||||||
Average Wells Fargo common stockholders’ equity to average assets |
8.67 | 8.53 | 8.69 | ||||||||||||||
Average total equity to average assets |
9.80 | 9.67 | 9.81 | ||||||||||||||
| Per common share data | |||||||||||||||||
Dividend payout ratio (9) |
26.9 | 33.6 | 11.8 | ||||||||||||||
Book value (10) |
$ | 46.25 | 41.98 | 43.26 | |||||||||||||
8 |
Wells Fargo & Company | |||||||
| Earnings Performance | ||
| Wells Fargo & Company | 9 |
|||||||
| Year ended December 31, | |||||||||||||||||||||||||||||||||||||||||||||||||||||
| 2023 | 2022 | 2021 | |||||||||||||||||||||||||||||||||||||||||||||||||||
($ in millions) |
Average balance |
Interest income/ expense |
Average interest rates |
Average balance |
Interest income/ expense |
Average interest rates |
Average balance |
Interest income/ expense |
Interest rates | ||||||||||||||||||||||||||||||||||||||||||||
| Assets | |||||||||||||||||||||||||||||||||||||||||||||||||||||
| Interest-earning deposits with banks | $ | 149,401 | 6,973 | 4.67 | % | $ | 145,802 | 2,245 | 1.54 | % | $ | 236,281 | 314 | 0.13 | % | ||||||||||||||||||||||||||||||||||||||
| Federal funds sold and securities purchased under resale agreements | 69,878 | 3,374 | 4.83 | 62,137 | 859 | 1.38 | 69,720 | 14 | 0.02 | ||||||||||||||||||||||||||||||||||||||||||||
| Debt securities: | |||||||||||||||||||||||||||||||||||||||||||||||||||||
| Trading debt securities | 104,588 | 3,805 | 3.64 | 91,515 | 2,490 | 2.72 | 88,282 | 2,107 | 2.39 | ||||||||||||||||||||||||||||||||||||||||||||
| Available-for-sale debt securities | 142,743 | 5,365 | 3.76 | 141,404 | 3,167 | 2.24 | 189,237 | 2,924 | 1.55 | ||||||||||||||||||||||||||||||||||||||||||||
| Held-to-maturity debt securities | 275,441 | 7,246 | 2.63 | 296,540 | 6,480 | 2.19 | 245,304 | 4,589 | 1.87 | ||||||||||||||||||||||||||||||||||||||||||||
| Total debt securities | 522,772 | 16,416 | 3.14 | 529,459 | 12,137 | 2.29 | 522,823 | 9,620 | 1.84 | ||||||||||||||||||||||||||||||||||||||||||||
| Loans held for sale (2) | 5,762 | 363 | 6.29 | 13,900 | 513 | 3.69 | 27,554 | 865 | 3.14 | ||||||||||||||||||||||||||||||||||||||||||||
| Loans: | |||||||||||||||||||||||||||||||||||||||||||||||||||||
| Commercial and industrial – U.S. | 307,953 | 20,941 | 6.80 | 291,996 | 11,293 | 3.87 | 252,025 | 6,526 | 2.59 | ||||||||||||||||||||||||||||||||||||||||||||
| Commercial and industrial – Non-U.S. | 74,410 | 5,043 | 6.78 | 80,033 | 2,681 | 3.35 | 71,114 | 1,448 | 2.04 | ||||||||||||||||||||||||||||||||||||||||||||
| Commercial real estate mortgage | 129,437 | 8,312 | 6.42 | 131,304 | 4,974 | 3.79 | 121,638 | 3,276 | 2.69 | ||||||||||||||||||||||||||||||||||||||||||||
| Commercial real estate construction | 24,324 | 1,898 | 7.80 | 21,510 | 991 | 4.61 | 21,589 | 667 | 3.09 | ||||||||||||||||||||||||||||||||||||||||||||
| Lease financing | 15,386 | 749 | 4.87 | 14,555 | 607 | 4.17 | 15,519 | 692 | 4.46 | ||||||||||||||||||||||||||||||||||||||||||||
| Total commercial loans | 551,510 | 36,943 | 6.70 | 539,398 | 20,546 | 3.81 | 481,885 | 12,609 | 2.62 | ||||||||||||||||||||||||||||||||||||||||||||
| Residential mortgage – first lien | 252,857 | 8,477 | 3.35 | 249,985 | 7,912 | 3.17 | 249,862 | 7,903 | 3.16 | ||||||||||||||||||||||||||||||||||||||||||||
| Residential mortgage – junior lien | 12,074 | 836 | 6.92 | 14,703 | 729 | 4.95 | 19,710 | 818 | 4.15 | ||||||||||||||||||||||||||||||||||||||||||||
| Credit card | 48,202 | 6,246 | 12.96 | 41,275 | 4,752 | 11.51 | 35,471 | 4,086 | 11.52 | ||||||||||||||||||||||||||||||||||||||||||||
| Auto | 51,116 | 2,415 | 4.72 | 55,429 | 2,366 | 4.27 | 51,576 | 2,317 | 4.49 | ||||||||||||||||||||||||||||||||||||||||||||
| Other consumer | 28,157 | 2,349 | 8.34 | 29,030 | 1,489 | 5.13 | 25,784 | 962 | 3.73 | ||||||||||||||||||||||||||||||||||||||||||||
| Total consumer loans | 392,406 | 20,323 | 5.18 | 390,422 | 17,248 | 4.42 | 382,403 | 16,086 | 4.21 | ||||||||||||||||||||||||||||||||||||||||||||
| Total loans (2) | 943,916 | 57,266 | 6.07 | 929,820 | 37,794 | 4.06 | 864,288 | 28,695 | 3.32 | ||||||||||||||||||||||||||||||||||||||||||||
| Equity securities | 25,920 | 683 | 2.63 | 30,575 | 708 | 2.31 | 31,946 | 608 | 1.91 | ||||||||||||||||||||||||||||||||||||||||||||
| Other | 9,638 | 463 | 4.80 | 13,275 | 204 | 1.54 | 10,052 | 6 | 0.06 | ||||||||||||||||||||||||||||||||||||||||||||
| Total interest-earning assets | $ | 1,727,287 | 85,538 | 4.95 | % | $ | 1,724,968 | 54,460 | 3.16 | % | $ | 1,762,664 | 40,122 | 2.28 | % | ||||||||||||||||||||||||||||||||||||||
| Cash and due from banks | 27,463 | — | 25,817 | — | 24,562 | — | |||||||||||||||||||||||||||||||||||||||||||||||
| Goodwill | 25,173 | — | 25,177 | — | 26,087 | — | |||||||||||||||||||||||||||||||||||||||||||||||
| Other | 105,552 | — | 118,341 | — | 128,750 | — | |||||||||||||||||||||||||||||||||||||||||||||||
| Total noninterest-earning assets | $ | 158,188 | — | 169,335 | — | 179,399 | — | ||||||||||||||||||||||||||||||||||||||||||||||
| Total assets | $ | 1,885,475 | 85,538 | 1,894,303 | 54,460 | 1,942,063 | 40,122 | ||||||||||||||||||||||||||||||||||||||||||||||
| Liabilities | |||||||||||||||||||||||||||||||||||||||||||||||||||||
| Deposits: | |||||||||||||||||||||||||||||||||||||||||||||||||||||
| Demand deposits | $ | 418,542 | 6,947 | 1.66 | % | $ | 432,745 | 1,356 | 0.31 | % | $ | 450,131 | 127 | 0.03 | % | ||||||||||||||||||||||||||||||||||||||
| Savings deposits | 376,233 | 2,723 | 0.72 | 433,415 | 406 | 0.09 | 423,221 | 124 | 0.03 | ||||||||||||||||||||||||||||||||||||||||||||
| Time deposits | 132,492 | 6,215 | 4.69 | 33,148 | 449 | 1.36 | 36,519 | 122 | 0.33 | ||||||||||||||||||||||||||||||||||||||||||||
| Deposits in non-U.S. offices | 19,278 | 618 | 3.21 | 19,191 | 138 | 0.72 | 28,297 | 15 | 0.05 | ||||||||||||||||||||||||||||||||||||||||||||
| Total interest-bearing deposits | 946,545 | 16,503 | 1.74 | 918,499 | 2,349 | 0.26 | 938,168 | 388 | 0.04 | ||||||||||||||||||||||||||||||||||||||||||||
| Short-term borrowings: | |||||||||||||||||||||||||||||||||||||||||||||||||||||
| Federal funds purchased and securities sold under agreements to repurchase | 65,696 | 3,313 | 5.04 | 24,553 | 407 | 1.66 | 35,245 | 8 | 0.02 | ||||||||||||||||||||||||||||||||||||||||||||
| Other short-term borrowings | 15,337 | 535 | 3.49 | 15,257 | 175 | 1.15 | 12,020 | (48) | (0.41) | ||||||||||||||||||||||||||||||||||||||||||||
| Total short-term borrowings | 81,033 | 3,848 | 4.75 | 39,810 | 582 | 1.46 | 47,265 | (40) | (0.09) | ||||||||||||||||||||||||||||||||||||||||||||
| Long-term debt | 180,464 | 11,572 | 6.41 | 157,742 | 5,505 | 3.49 | 178,742 | 3,173 | 1.78 | ||||||||||||||||||||||||||||||||||||||||||||
| Other liabilities | 32,950 | 820 | 2.49 | 34,126 | 638 | 1.87 | 28,809 | 395 | 1.37 | ||||||||||||||||||||||||||||||||||||||||||||
| Total interest-bearing liabilities | $ | 1,240,992 | 32,743 | 2.64 | % | $ | 1,150,177 | 9,074 | 0.79 | % | $ | 1,192,984 | 3,916 | 0.33 | % | ||||||||||||||||||||||||||||||||||||||
| Noninterest-bearing demand deposits | 399,737 | — | 505,770 | — | 499,644 | — | |||||||||||||||||||||||||||||||||||||||||||||||
| Other noninterest-bearing liabilities | 59,886 | — | 55,189 | — | 58,933 | — | |||||||||||||||||||||||||||||||||||||||||||||||
| Total noninterest-bearing liabilities | $ | 459,623 | — | 560,959 | — | 558,577 | — | ||||||||||||||||||||||||||||||||||||||||||||||
| Total liabilities | $ | 1,700,615 | 32,743 | 1,711,136 | 9,074 | 1,751,561 | 3,916 | ||||||||||||||||||||||||||||||||||||||||||||||
| Total equity | 184,860 | — | 183,167 | — | 190,502 | — | |||||||||||||||||||||||||||||||||||||||||||||||
| Total liabilities and equity | $ | 1,885,475 | 32,743 | 1,894,303 | 9,074 | 1,942,063 | 3,916 | ||||||||||||||||||||||||||||||||||||||||||||||
| Interest rate spread on a taxable-equivalent basis (3) | 2.31 | % | 2.37 | % | 1.95 | % | |||||||||||||||||||||||||||||||||||||||||||||||
Net interest margin and net interest income on a taxable-equivalent basis (3) |
$ | 52,795 | 3.06 | % | $ | 45,386 | 2.63 | % | $ | 36,206 | 2.05 | % | |||||||||||||||||||||||||||||||||||||||||
10 |
Wells Fargo & Company | |||||||
| Year ended December 31, | |||||||||||||||||||||||||||||||||||
| 2023 vs. 2022 | 2022 vs. 2021 | ||||||||||||||||||||||||||||||||||
| (in millions) | Volume | Rate | Total | Volume | Rate | Total | |||||||||||||||||||||||||||||
| Increase (decrease) in interest income: | |||||||||||||||||||||||||||||||||||
| Interest-earning deposits with banks | $ | 56 | 4,672 | 4,728 | (162) | 2,093 | 1,931 | ||||||||||||||||||||||||||||
| Federal funds sold and securities purchased under resale agreements | 120 | 2,395 | 2,515 | (2) | 847 | 845 | |||||||||||||||||||||||||||||
| Debt securities: | |||||||||||||||||||||||||||||||||||
| Trading debt securities | 391 | 924 | 1,315 | 80 | 303 | 383 | |||||||||||||||||||||||||||||
| Available-for-sale debt securities | 30 | 2,168 | 2,198 | (858) | 1,101 | 243 | |||||||||||||||||||||||||||||
| Held-to-maturity debt securities | (482) | 1,248 | 766 | 1,039 | 852 | 1,891 | |||||||||||||||||||||||||||||
| Total debt securities | (61) | 4,340 | 4,279 | 261 | 2,256 | 2,517 | |||||||||||||||||||||||||||||
| Loans held for sale | (396) | 246 | (150) | (484) | 132 | (352) | |||||||||||||||||||||||||||||
| Loans: | |||||||||||||||||||||||||||||||||||
| Commercial and industrial – U.S. | 650 | 8,998 | 9,648 | 1,158 | 3,609 | 4,767 | |||||||||||||||||||||||||||||
| Commercial and industrial – Non-U.S. | (200) | 2,562 | 2,362 | 201 | 1,032 | 1,233 | |||||||||||||||||||||||||||||
| Commercial real estate mortgage | (72) | 3,410 | 3,338 | 276 | 1,422 | 1,698 | |||||||||||||||||||||||||||||
| Commercial real estate construction | 144 | 763 | 907 | (2) | 326 | 324 | |||||||||||||||||||||||||||||
| Lease financing | 36 | 106 | 142 | (42) | (43) | (85) | |||||||||||||||||||||||||||||
| Total commercial loans | 558 | 15,839 | 16,397 | 1,591 | 6,346 | 7,937 | |||||||||||||||||||||||||||||
| Residential mortgage – first lien | 95 | 470 | 565 | 1 | 8 | 9 | |||||||||||||||||||||||||||||
| Residential mortgage – junior lien | (146) | 253 | 107 | (230) | 141 | (89) | |||||||||||||||||||||||||||||
| Credit card | 854 | 640 | 1,494 | 670 | (4) | 666 | |||||||||||||||||||||||||||||
| Auto | (191) | 240 | 49 | 166 | (117) | 49 | |||||||||||||||||||||||||||||
| Other consumer | (46) | 906 | 860 | 132 | 395 | 527 | |||||||||||||||||||||||||||||
| Total consumer loans | 566 | 2,509 | 3,075 | 739 | 423 | 1,162 | |||||||||||||||||||||||||||||
| Total loans | 1,124 | 18,348 | 19,472 | 2,330 | 6,769 | 9,099 | |||||||||||||||||||||||||||||
| Equity securities | (116) | 91 | (25) | (26) | 126 | 100 | |||||||||||||||||||||||||||||
| Other | (70) | 329 | 259 | 3 | 195 | 198 | |||||||||||||||||||||||||||||
Total increase in interest income |
$ | 657 | 30,421 | 31,078 | 1,920 | 12,418 | 14,338 | ||||||||||||||||||||||||||||
| Increase (decrease) in interest expense: | |||||||||||||||||||||||||||||||||||
| Deposits: | |||||||||||||||||||||||||||||||||||
| Demand deposits | $ | (46) | 5,637 | 5,591 | (5) | 1,234 | 1,229 | ||||||||||||||||||||||||||||
| Savings deposits | (58) | 2,375 | 2,317 | 3 | 279 | 282 | |||||||||||||||||||||||||||||
| Time deposits | 3,173 | 2,593 | 5,766 | (12) | 339 | 327 | |||||||||||||||||||||||||||||
| Deposits in non-U.S. offices | 1 | 479 | 480 | (7) | 130 | 123 | |||||||||||||||||||||||||||||
| Total interest-bearing deposits | 3,070 | 11,084 | 14,154 | (21) | 1,982 | 1,961 | |||||||||||||||||||||||||||||
| Short-term borrowings: | |||||||||||||||||||||||||||||||||||
Federal funds purchased and securities sold under agreements to repurchase |
1,312 | 1,594 | 2,906 | (3) | 402 | 399 | |||||||||||||||||||||||||||||
| Other short-term borrowings | 1 | 359 | 360 | (10) | 233 | 223 | |||||||||||||||||||||||||||||
| Total short-term borrowings | 1,313 | 1,953 | 3,266 | (13) | 635 | 622 | |||||||||||||||||||||||||||||
| Long-term debt | 891 | 5,176 | 6,067 | (412) | 2,744 | 2,332 | |||||||||||||||||||||||||||||
| Other liabilities | (23) | 205 | 182 | 82 | 161 | 243 | |||||||||||||||||||||||||||||
| Total increase (decrease) in interest expense | 5,251 | 18,418 | 23,669 | (364) | 5,522 | 5,158 | |||||||||||||||||||||||||||||
| Increase (decrease) in net interest income on a taxable-equivalent basis | $ | (4,594) | 12,003 | 7,409 | 2,284 | 6,896 | 9,180 | ||||||||||||||||||||||||||||
| Wells Fargo & Company | 11 |
|||||||
| Year ended December 31, | |||||||||||||||||||||||||||||||||||||||||
($ in millions) |
2023 | 2022 | $ Change 2023/ 2022 |
% Change 2023/ 2022 |
2021 | $ Change 2022/ 2021 |
% Change 2022/ 2021 |
||||||||||||||||||||||||||||||||||
| Deposit-related fees | $ | 4,694 | 5,316 | (622) | (12) | % | $ | 5,475 | (159) | (3) | % | ||||||||||||||||||||||||||||||
| Lending-related fees | 1,446 | 1,397 | 49 | 4 | 1,445 | (48) | (3) | ||||||||||||||||||||||||||||||||||
| Investment advisory and other asset-based fees | 8,670 | 9,004 | (334) | (4) | 11,011 | (2,007) | (18) | ||||||||||||||||||||||||||||||||||
| Commissions and brokerage services fees | 2,375 | 2,242 | 133 | 6 | 2,299 | (57) | (2) | ||||||||||||||||||||||||||||||||||
| Investment banking fees | 1,649 | 1,439 | 210 | 15 | 2,354 | (915) | (39) | ||||||||||||||||||||||||||||||||||
| Card fees | 4,256 | 4,355 | (99) | (2) | 4,175 | 180 | 4 | ||||||||||||||||||||||||||||||||||
| Net servicing income | 436 | 533 | (97) | (18) | 194 | 339 | 175 | ||||||||||||||||||||||||||||||||||
| Net gains on mortgage loan originations/sales | 393 | 850 | (457) | (54) | 4,762 | (3,912) | (82) | ||||||||||||||||||||||||||||||||||
| Mortgage banking | 829 | 1,383 | (554) | (40) | 4,956 | (3,573) | (72) | ||||||||||||||||||||||||||||||||||
| Net gains from trading activities | 4,799 | 2,116 | 2,683 | 127 | 284 | 1,832 | 645 | ||||||||||||||||||||||||||||||||||
| Net gains from debt securities | 10 | 151 | (141) | (93) | 553 | (402) | (73) | ||||||||||||||||||||||||||||||||||
Net gains (losses) from equity securities |
(441) | (806) | 365 | 45 | 6,427 | (7,233) | NM | ||||||||||||||||||||||||||||||||||
| Lease income | 1,237 | 1,269 | (32) | (3) | 996 | 273 | 27 | ||||||||||||||||||||||||||||||||||
| Other | 698 | 1,552 | (854) | (55) | 3,412 | (1,860) | (55) | ||||||||||||||||||||||||||||||||||
| Total | $ | 30,222 | 29,418 | 804 | 3 | $ | 43,387 | (13,969) | (32) | ||||||||||||||||||||||||||||||||
12 |
Wells Fargo & Company | |||||||
| Year ended December 31, | |||||||||||||||||||||||||||||||||||||||||
| ($ in millions) | 2023 | 2022 | $ Change 2023/ 2022 |
% Change 2023/ 2022 |
2021 | $ Change 2022/ 2021 |
% Change 2022/ 2021 |
||||||||||||||||||||||||||||||||||
| Personnel | $ | 35,829 | 34,340 | 1,489 | 4 | % | $ | 35,541 | (1,201) | (3) | % | ||||||||||||||||||||||||||||||
| Technology, telecommunications and equipment | 3,920 | 3,375 | 545 | 16 | 3,227 | 148 | 5 | ||||||||||||||||||||||||||||||||||
| Occupancy | 2,884 | 2,881 | 3 | — | 2,968 | (87) | (3) | ||||||||||||||||||||||||||||||||||
Operating losses (1) |
1,183 | 6,984 | (5,801) | (83) | 1,568 | 5,416 | 345 | ||||||||||||||||||||||||||||||||||
| Professional and outside services | 5,085 | 5,188 | (103) | (2) | 5,723 | (535) | (9) | ||||||||||||||||||||||||||||||||||
Leases (2) |
697 | 750 | (53) | (7) | 867 | (117) | (13) | ||||||||||||||||||||||||||||||||||
| Advertising and promotion | 812 | 505 | 307 | 61 | 600 | (95) | (16) | ||||||||||||||||||||||||||||||||||
| Other | 5,152 | 3,182 | 1,970 | 62 | 3,264 | (82) | (3) | ||||||||||||||||||||||||||||||||||
| Total | $ | 55,562 | 57,205 | (1,643) | (3) | $ | 53,758 | 3,447 | 6 | ||||||||||||||||||||||||||||||||
| Year ended December 31, | |||||||||||||||||||||||||||||||||||||||||
($ in millions) |
2023 | 2022 | $ Change 2023/ 2022 |
% Change 2023/ 2022 |
2021 | $ Change 2022/ 2021 |
% Change 2022/ 2021 |
||||||||||||||||||||||||||||||||||
| Income before income tax expense | $ | 21,636 | 15,629 | 6,007 | 38 | % | 29,563 | (13,934) | (47 | %) | |||||||||||||||||||||||||||||||
| Income tax expense | 2,607 | 2,251 | 356 | 16 | 5,764 | (3,513) | (61) | ||||||||||||||||||||||||||||||||||
| Effective income tax rate (1) | 12.0 | % | 14.1 | 20.7 | |||||||||||||||||||||||||||||||||||||
| Wells Fargo & Company | 13 |
|||||||
| Wells Fargo & Company | ||||||||||||||||||||||||||||||||||||||||||||||||||||||||||||||||||||||||||||||||||||||
Consumer Banking and Lending |
Commercial Banking |
Corporate and Investment Banking | Wealth and Investment Management |
Corporate |
||||||||||||||||||||||||||||||||||||||||||||||||||||||||||||||||||||||||||||||||||
|
• Consumer, Small and Business Banking
• Home Lending
• Credit Card
• Auto
• Personal Lending
|
• Middle Market Banking • Asset-Based Lending and Leasing |
• Banking • Commercial Real Estate • Markets |
• Wells Fargo Advisors • The Private Bank |
• Corporate Treasury
• Enterprise Functions
• Investment Portfolio
• Venture capital and private equity investments
• Non-strategic businesses
|
||||||||||||||||||||||||||||||||||||||||||||||||||||||||||||||||||||||||||||||||||
14 |
Wells Fargo & Company | |||||||
| (in millions) | Consumer Banking and Lending | Commercial Banking | Corporate and Investment Banking | Wealth and Investment Management | Corporate (1) | Reconciling Items (2) | Consolidated Company | ||||||||||||||||||||||||||||||||||
| Year ended December 31, 2023 | |||||||||||||||||||||||||||||||||||||||||
| Net interest income | $ | 30,185 | 10,034 | 9,498 | 3,966 | (888) | (420) | 52,375 | |||||||||||||||||||||||||||||||||
| Noninterest income | 7,734 | 3,415 | 9,693 | 10,725 | 431 | (1,776) | 30,222 | ||||||||||||||||||||||||||||||||||
| Total revenue | 37,919 | 13,449 | 19,191 | 14,691 | (457) | (2,196) | 82,597 | ||||||||||||||||||||||||||||||||||
| Provision for credit losses | 3,299 | 75 | 2,007 | 6 | 12 | — | 5,399 | ||||||||||||||||||||||||||||||||||
| Noninterest expense | 24,024 | 6,555 | 8,618 | 12,064 | 4,301 | — | 55,562 | ||||||||||||||||||||||||||||||||||
| Income (loss) before income tax expense (benefit) | 10,596 | 6,819 | 8,566 | 2,621 | (4,770) | (2,196) | 21,636 | ||||||||||||||||||||||||||||||||||
| Income tax expense (benefit) | 2,657 | 1,704 | 2,140 | 657 | (2,355) | (2,196) | 2,607 | ||||||||||||||||||||||||||||||||||
| Net income (loss) before noncontrolling interests | 7,939 | 5,115 | 6,426 | 1,964 | (2,415) | — | 19,029 | ||||||||||||||||||||||||||||||||||
| Less: Net income (loss) from noncontrolling interests | — | 11 | — | — | (124) | — | (113) | ||||||||||||||||||||||||||||||||||
| Net income (loss) | $ | 7,939 | 5,104 | 6,426 | 1,964 | (2,291) | — | 19,142 | |||||||||||||||||||||||||||||||||
| Year ended December 31, 2022 | |||||||||||||||||||||||||||||||||||||||||
| Net interest income | $ | 27,044 | 7,289 | 8,733 | 3,927 | (1,607) | (436) | 44,950 | |||||||||||||||||||||||||||||||||
| Noninterest income | 8,766 | 3,631 | 6,509 | 10,895 | 1,192 | (1,575) | 29,418 | ||||||||||||||||||||||||||||||||||
| Total revenue | 35,810 | 10,920 | 15,242 | 14,822 | (415) | (2,011) | 74,368 | ||||||||||||||||||||||||||||||||||
| Provision for credit losses | 2,276 | (534) | (185) | (25) | 2 | — | 1,534 | ||||||||||||||||||||||||||||||||||
| Noninterest expense | 26,277 | 6,058 | 7,560 | 11,613 | 5,697 | — | 57,205 | ||||||||||||||||||||||||||||||||||
| Income (loss) before income tax expense (benefit) | 7,257 | 5,396 | 7,867 | 3,234 | (6,114) | (2,011) | 15,629 | ||||||||||||||||||||||||||||||||||
| Income tax expense (benefit) | 1,816 | 1,366 | 1,989 | 812 | (1,721) | (2,011) | 2,251 | ||||||||||||||||||||||||||||||||||
| Net income (loss) before noncontrolling interests | 5,441 | 4,030 | 5,878 | 2,422 | (4,393) | — | 13,378 | ||||||||||||||||||||||||||||||||||
| Less: Net income (loss) from noncontrolling interests | — | 12 | — | — | (311) | — | (299) | ||||||||||||||||||||||||||||||||||
| Net income (loss) | $ | 5,441 | 4,018 | 5,878 | 2,422 | (4,082) | — | 13,677 | |||||||||||||||||||||||||||||||||
| Year ended December 31, 2021 | |||||||||||||||||||||||||||||||||||||||||
| Net interest income | $ | 22,807 | 4,960 | 7,410 | 2,570 | (1,541) | (427) | 35,779 | |||||||||||||||||||||||||||||||||
| Noninterest income | 12,070 | 3,589 | 6,429 | 11,776 | 10,710 | (1,187) | 43,387 | ||||||||||||||||||||||||||||||||||
| Total revenue | 34,877 | 8,549 | 13,839 | 14,346 | 9,169 | (1,614) | 79,166 | ||||||||||||||||||||||||||||||||||
| Provision for credit losses | (1,178) | (1,500) | (1,439) | (95) | 57 | — | (4,155) | ||||||||||||||||||||||||||||||||||
| Noninterest expense | 24,648 | 5,862 | 7,200 | 11,734 | 4,314 | — | 53,758 | ||||||||||||||||||||||||||||||||||
| Income (loss) before income tax expense (benefit) | 11,407 | 4,187 | 8,078 | 2,707 | 4,798 | (1,614) | 29,563 | ||||||||||||||||||||||||||||||||||
| Income tax expense (benefit) | 2,852 | 1,045 | 2,019 | 680 | 782 | (1,614) | 5,764 | ||||||||||||||||||||||||||||||||||
Net income before noncontrolling interests |
8,555 | 3,142 | 6,059 | 2,027 | 4,016 | — | 23,799 | ||||||||||||||||||||||||||||||||||
|
Less: Net income (loss) from noncontrolling
interests
|
— | 8 | (3) | — | 1,685 | — | 1,690 | ||||||||||||||||||||||||||||||||||
Net income |
$ | 8,555 | 3,134 | 6,062 | 2,027 | 2,331 | — | 22,109 | |||||||||||||||||||||||||||||||||
| Wells Fargo & Company | 15 |
|||||||
| Year ended December 31, | |||||||||||||||||||||||||||||||||||||||||
| ($ in millions, unless otherwise noted) | 2023 | 2022 | $ Change 2023/ 2022 |
% Change 2023/ 2022 |
2021 | $ Change 2022/ 2021 |
% Change 2022/ 2021 |
||||||||||||||||||||||||||||||||||
| Income Statement | |||||||||||||||||||||||||||||||||||||||||
| Net interest income | $ | 30,185 | 27,044 | 3,141 | 12 | % | $ | 22,807 | 4,237 | 19 | % | ||||||||||||||||||||||||||||||
| Noninterest income: | |||||||||||||||||||||||||||||||||||||||||
| Deposit-related fees | 2,702 | 3,093 | (391) | (13) | 3,045 | 48 | 2 | ||||||||||||||||||||||||||||||||||
| Card fees | 3,967 | 4,067 | (100) | (2) | 3,930 | 137 | 3 | ||||||||||||||||||||||||||||||||||
| Mortgage banking | 512 | 1,100 | (588) | (53) | 4,490 | (3,390) | (76) | ||||||||||||||||||||||||||||||||||
| Other | 553 | 506 | 47 | 9 | 605 | (99) | (16) | ||||||||||||||||||||||||||||||||||
| Total noninterest income | 7,734 | 8,766 | (1,032) | (12) | 12,070 | (3,304) | (27) | ||||||||||||||||||||||||||||||||||
| Total revenue | 37,919 | 35,810 | 2,109 | 6 | 34,877 | 933 | 3 | ||||||||||||||||||||||||||||||||||
| Net charge-offs | 2,784 | 1,693 | 1,091 | 64 | 1,439 | 254 | 18 | ||||||||||||||||||||||||||||||||||
| Change in the allowance for credit losses | 515 | 583 | (68) | (12) | (2,617) | 3,200 | 122 | ||||||||||||||||||||||||||||||||||
| Provision for credit losses | 3,299 | 2,276 | 1,023 | 45 | (1,178) | 3,454 | 293 | ||||||||||||||||||||||||||||||||||
| Noninterest expense | 24,024 | 26,277 | (2,253) | (9) | 24,648 | 1,629 | 7 | ||||||||||||||||||||||||||||||||||
| Income before income tax expense | 10,596 | 7,257 | 3,339 | 46 | 11,407 | (4,150) | (36) | ||||||||||||||||||||||||||||||||||
| Income tax expense | 2,657 | 1,816 | 841 | 46 | 2,852 | (1,036) | (36) | ||||||||||||||||||||||||||||||||||
| Net income | $ | 7,939 | 5,441 | 2,498 | 46 | $ | 8,555 | (3,114) | (36) | ||||||||||||||||||||||||||||||||
| Revenue by Line of Business | |||||||||||||||||||||||||||||||||||||||||
Consumer, Small and Business Banking |
$ | 26,384 | 23,421 | 2,963 | 13 | $ | 18,958 | 4,463 | 24 | ||||||||||||||||||||||||||||||||
| Consumer Lending: | |||||||||||||||||||||||||||||||||||||||||
| Home Lending | 3,389 | 4,221 | (832) | (20) | 8,154 | (3,933) | (48) | ||||||||||||||||||||||||||||||||||
| Credit Card | 5,347 | 5,271 | 76 | 1 | 4,928 | 343 | 7 | ||||||||||||||||||||||||||||||||||
| Auto | 1,464 | 1,716 | (252) | (15) | 1,733 | (17) | (1) | ||||||||||||||||||||||||||||||||||
| Personal Lending | 1,335 | 1,181 | 154 | 13 | 1,104 | 77 | 7 | ||||||||||||||||||||||||||||||||||
| Total revenue | $ | 37,919 | 35,810 | 2,109 | 6 | $ | 34,877 | 933 | 3 | ||||||||||||||||||||||||||||||||
| Selected Metrics | |||||||||||||||||||||||||||||||||||||||||
| Consumer Banking and Lending: | |||||||||||||||||||||||||||||||||||||||||
| Return on allocated capital (1) | 17.5 | % | 10.8 | 17.2 | % | ||||||||||||||||||||||||||||||||||||
| Efficiency ratio (2) | 63 | 73 | 71 | ||||||||||||||||||||||||||||||||||||||
Retail bank branches (#, period-end) |
4,311 | 4,598 | (6) | 4,777 | (4) | ||||||||||||||||||||||||||||||||||||
Digital active customers (# in millions, period-end) (3) |
34.8 | 33.5 | 4 | 33.0 | 2 | ||||||||||||||||||||||||||||||||||||
Mobile active customers (# in millions, period-end) (3) |
29.9 | 28.3 | 6 | 27.3 | 4 | ||||||||||||||||||||||||||||||||||||
Consumer, Small and Business Banking: |
|||||||||||||||||||||||||||||||||||||||||
| Deposit spread (4) | 2.6 | % | 2.0 | 1.5 | % | ||||||||||||||||||||||||||||||||||||
| Debit card purchase volume ($ in billions) (5) | $ | 492.8 | 486.6 | 6.2 | 1 | $ | 471.5 | 15.1 | 3 | ||||||||||||||||||||||||||||||||
| Debit card purchase transactions (# in millions) (5) | 10,000 | 9,852 | 2 | 9,808 | — | ||||||||||||||||||||||||||||||||||||
16 |
Wells Fargo & Company | |||||||
| Year ended December 31, | |||||||||||||||||||||||||||||||||||||||||
| ($ in millions, unless otherwise noted) | 2023 | 2022 | $ Change 2023/ 2022 |
% Change 2023/ 2022 |
2021 | $ Change 2022/ 2021 |
% Change 2022/ 2021 |
||||||||||||||||||||||||||||||||||
| Home Lending: | |||||||||||||||||||||||||||||||||||||||||
| Mortgage banking: | |||||||||||||||||||||||||||||||||||||||||
| Net servicing income | $ | 300 | 368 | (68) | (18) | % | $ | 35 | 333 | 951 | % | ||||||||||||||||||||||||||||||
| Net gains on mortgage loan originations/sales | 212 | 732 | (520) | (71) | 4,455 | (3,723) | (84) | ||||||||||||||||||||||||||||||||||
| Total mortgage banking | $ | 512 | 1,100 | (588) | (53) | $ | 4,490 | (3,390) | (76) | ||||||||||||||||||||||||||||||||
| Originations ($ in billions): | |||||||||||||||||||||||||||||||||||||||||
| Retail | $ | 24.2 | 64.3 | (40.1) | (62) | $ | 138.5 | (74.2) | (54) | ||||||||||||||||||||||||||||||||
| Correspondent | 1.1 | 43.8 | (42.7) | (97) | 66.5 | (22.7) | (34) | ||||||||||||||||||||||||||||||||||
| Total originations | $ | 25.3 | 108.1 | (82.8) | (77) | $ | 205.0 | (96.9) | (47) | ||||||||||||||||||||||||||||||||
| % of originations held for sale (HFS) | 44.6 | % | 52.5 | 64.6 | % | ||||||||||||||||||||||||||||||||||||
Third-party mortgage loans serviced ($ in billions, period-end) (6) |
$ | 559.7 | 679.2 | (119.5) | (18) | $ | 716.8 | (37.6) | (5) | ||||||||||||||||||||||||||||||||
| Mortgage servicing rights (MSR) carrying value (period-end) | 7,468 | 9,310 | (1,842) | (20) | 6,920 | 2,390 | 35 | ||||||||||||||||||||||||||||||||||
| Ratio of MSR carrying value (period-end) to third-party mortgage loans serviced (period-end) (6) | 1.33 | % | 1.37 | 0.97 | % | ||||||||||||||||||||||||||||||||||||
Home lending loans 30+ days delinquency rate (period-end) (7)(8)(9) |
0.32 | 0.31 | 0.39 | ||||||||||||||||||||||||||||||||||||||
| Credit Card: | |||||||||||||||||||||||||||||||||||||||||
| Point of sale (POS) volume ($ in billions) | $ | 136.4 | 119.1 | 17.3 | 15 | $ | 95.3 | 23.8 | 25 | ||||||||||||||||||||||||||||||||
| New accounts (# in thousands) | 2,547 | 2,153 | 18 | 1,640 | 31 | ||||||||||||||||||||||||||||||||||||
Credit card loans 30+ days delinquency rate (period-end) (8) |
2.89 | % | 2.08 | 1.52 | % | ||||||||||||||||||||||||||||||||||||
Credit card loans 90+ days delinquency rate (period-end) (8) |
1.48 | 1.01 | 0.72 | ||||||||||||||||||||||||||||||||||||||
| Auto: | |||||||||||||||||||||||||||||||||||||||||
| Auto originations ($ in billions) | $ | 17.2 | 23.1 | (5.9) | (26) | $ | 33.9 | (10.8) | (32) | ||||||||||||||||||||||||||||||||
Auto loans 30+ days delinquency rate (period-end) (8)(9) |
2.80 | % | 2.64 | 1.84 | % | ||||||||||||||||||||||||||||||||||||
| Personal Lending: | |||||||||||||||||||||||||||||||||||||||||
| New volume ($ in billions) | $ | 11.9 | 12.6 | (0.7) | (6) | $ | 9.8 | 2.8 | 29 | ||||||||||||||||||||||||||||||||
| Wells Fargo & Company | 17 |
|||||||
| Year ended December 31, | |||||||||||||||||||||||||||||||||||||||||
($ in millions) |
2023 | 2022 | $ Change 2023/ 2022 |
% Change 2023/ 2022 |
2021 | $ Change 2022/ 2021 |
% Change 2022/ 2021 |
||||||||||||||||||||||||||||||||||
| Selected Balance Sheet Data (average) | |||||||||||||||||||||||||||||||||||||||||
| Loans by Line of Business: | |||||||||||||||||||||||||||||||||||||||||
Consumer, Small and Business Banking |
$ | 9,104 | 10,132 | (1,028) | (10) | % | $ | 16,625 | (6,493) | (39) | % | ||||||||||||||||||||||||||||||
| Consumer Lending: | |||||||||||||||||||||||||||||||||||||||||
| Home Lending | 219,601 | 219,157 | 444 | — | 224,446 | (5,289) | (2) | ||||||||||||||||||||||||||||||||||
| Credit Card | 40,530 | 34,151 | 6,379 | 19 | 29,052 | 5,099 | 18 | ||||||||||||||||||||||||||||||||||
| Auto | 51,689 | 55,994 | (4,305) | (8) | 52,293 | 3,701 | 7 | ||||||||||||||||||||||||||||||||||
| Personal Lending | 14,996 | 12,999 | 1,997 | 15 | 11,469 | 1,530 | 13 | ||||||||||||||||||||||||||||||||||
| Total loans | $ | 335,920 | 332,433 | 3,487 | 1 | $ | 333,885 | (1,452) | — | ||||||||||||||||||||||||||||||||
| Total deposits | 811,091 | 883,130 | (72,039) | (8) | 834,739 | 48,391 | 6 | ||||||||||||||||||||||||||||||||||
| Allocated capital | 44,000 | 48,000 | (4,000) | (8) | 48,000 | — | — | ||||||||||||||||||||||||||||||||||
| Selected Balance Sheet Data (period-end) | |||||||||||||||||||||||||||||||||||||||||
| Loans by Line of Business: | |||||||||||||||||||||||||||||||||||||||||
Consumer, Small and Business Banking |
$ | 9,042 | 9,704 | (662) | (7) | $ | 11,270 | (1,566) | (14) | ||||||||||||||||||||||||||||||||
| Consumer Lending: | |||||||||||||||||||||||||||||||||||||||||
| Home Lending | 215,823 | 223,525 | (7,702) | (3) | 214,407 | 9,118 | 4 | ||||||||||||||||||||||||||||||||||
| Credit Card | 44,428 | 38,475 | 5,953 | 15 | 31,671 | 6,804 | 21 | ||||||||||||||||||||||||||||||||||
| Auto | 48,283 | 54,281 | (5,998) | (11) | 57,260 | (2,979) | (5) | ||||||||||||||||||||||||||||||||||
| Personal Lending | 15,291 | 14,544 | 747 | 5 | 11,966 | 2,578 | 22 | ||||||||||||||||||||||||||||||||||
| Total loans | $ | 332,867 | 340,529 | (7,662) | (2) | $ | 326,574 | 13,955 | 4 | ||||||||||||||||||||||||||||||||
| Total deposits | 782,309 | 859,695 | (77,386) | (9) | 883,674 | (23,979) | (3) | ||||||||||||||||||||||||||||||||||
18 |
Wells Fargo & Company | |||||||
| Year ended December 31, | |||||||||||||||||||||||||||||||||||||||||
| ($ in millions) | 2023 | 2022 | $ Change 2023/ 2022 |
% Change 2023/ 2022 |
2021 | $ Change 2022/ 2021 |
% Change 2022/ 2021 |
||||||||||||||||||||||||||||||||||
| Income Statement | |||||||||||||||||||||||||||||||||||||||||
| Net interest income | $ | 10,034 | 7,289 | 2,745 | 38 | % | $ | 4,960 | 2,329 | 47 | % | ||||||||||||||||||||||||||||||
| Noninterest income: | |||||||||||||||||||||||||||||||||||||||||
| Deposit-related fees | 998 | 1,131 | (133) | (12) | 1,285 | (154) | (12) | ||||||||||||||||||||||||||||||||||
| Lending-related fees | 531 | 491 | 40 | 8 | 532 | (41) | (8) | ||||||||||||||||||||||||||||||||||
| Lease income | 644 | 710 | (66) | (9) | 682 | 28 | 4 | ||||||||||||||||||||||||||||||||||
| Other | 1,242 | 1,299 | (57) | (4) | 1,090 | 209 | 19 | ||||||||||||||||||||||||||||||||||
| Total noninterest income | 3,415 | 3,631 | (216) | (6) | 3,589 | 42 | 1 | ||||||||||||||||||||||||||||||||||
| Total revenue | 13,449 | 10,920 | 2,529 | 23 | 8,549 | 2,371 | 28 | ||||||||||||||||||||||||||||||||||
| Net charge-offs | 96 | 4 | 92 | NM | 101 | (97) | (96) | ||||||||||||||||||||||||||||||||||
| Change in the allowance for credit losses | (21) | (538) | 517 | 96 | (1,601) | 1,063 | 66 | ||||||||||||||||||||||||||||||||||
| Provision for credit losses | 75 | (534) | 609 | 114 | (1,500) | 966 | 64 | ||||||||||||||||||||||||||||||||||
| Noninterest expense | 6,555 | 6,058 | 497 | 8 | 5,862 | 196 | 3 | ||||||||||||||||||||||||||||||||||
| Income before income tax expense | 6,819 | 5,396 | 1,423 | 26 | 4,187 | 1,209 | 29 | ||||||||||||||||||||||||||||||||||
| Income tax expense | 1,704 | 1,366 | 338 | 25 | 1,045 | 321 | 31 | ||||||||||||||||||||||||||||||||||
| Less: Net income from noncontrolling interests | 11 | 12 | (1) | (8) | 8 | 4 | 50 | ||||||||||||||||||||||||||||||||||
| Net income | $ | 5,104 | 4,018 | 1,086 | 27 | $ | 3,134 | 884 | 28 | ||||||||||||||||||||||||||||||||
| Revenue by Line of Business | |||||||||||||||||||||||||||||||||||||||||
| Middle Market Banking | $ | 8,762 | 6,574 | 2,188 | 33 | $ | 4,642 | 1,932 | 42 | ||||||||||||||||||||||||||||||||
| Asset-Based Lending and Leasing | 4,687 | 4,346 | 341 | 8 | 3,907 | 439 | 11 | ||||||||||||||||||||||||||||||||||
| Total revenue | $ | 13,449 | 10,920 | 2,529 | 23 | $ | 8,549 | 2,371 | 28 | ||||||||||||||||||||||||||||||||
| Revenue by Product | |||||||||||||||||||||||||||||||||||||||||
| Lending and leasing | $ | 5,314 | 5,253 | 61 | 1 | $ | 4,835 | 418 | 9 | ||||||||||||||||||||||||||||||||
| Treasury management and payments | 6,214 | 4,483 | 1,731 | 39 | 2,825 | 1,658 | 59 | ||||||||||||||||||||||||||||||||||
| Other | 1,921 | 1,184 | 737 | 62 | 889 | 295 | 33 | ||||||||||||||||||||||||||||||||||
| Total revenue | $ | 13,449 | 10,920 | 2,529 | 23 | $ | 8,549 | 2,371 | 28 | ||||||||||||||||||||||||||||||||
| Selected Metrics | |||||||||||||||||||||||||||||||||||||||||
| Return on allocated capital | 19.1 | % | 19.7 | 15.1 | % | ||||||||||||||||||||||||||||||||||||
| Efficiency ratio | 49 | 55 | 69 | ||||||||||||||||||||||||||||||||||||||
| Wells Fargo & Company | 19 |
|||||||
| Year ended December 31, | |||||||||||||||||||||||||||||||||||||||||
($ in millions) |
2023 | 2022 | $ Change 2023/ 2022 |
% Change 2023/ 2022 |
2021 | $ Change 2022/ 2021 |
% Change 2022/ 2021 |
||||||||||||||||||||||||||||||||||
| Selected Balance Sheet Data (average) | |||||||||||||||||||||||||||||||||||||||||
| Loans: | |||||||||||||||||||||||||||||||||||||||||
| Commercial and industrial | $ | 164,062 | 147,379 | 16,683 | 11 | % | $ | 120,396 | 26,983 | 22 | % | ||||||||||||||||||||||||||||||
| Commercial real estate | 45,705 | 45,130 | 575 | 1 | 47,018 | (1,888) | (4) | ||||||||||||||||||||||||||||||||||
| Lease financing and other | 14,335 | 13,523 | 812 | 6 | 13,823 | (300) | (2) | ||||||||||||||||||||||||||||||||||
| Total loans | $ | 224,102 | 206,032 | 18,070 | 9 | $ | 181,237 | 24,795 | 14 | ||||||||||||||||||||||||||||||||
| Loans by Line of Business: | |||||||||||||||||||||||||||||||||||||||||
| Middle Market Banking | $ | 120,819 | 114,634 | 6,185 | 5 | $ | 102,882 | 11,752 | 11 | ||||||||||||||||||||||||||||||||
| Asset-Based Lending and Leasing | 103,283 | 91,398 | 11,885 | 13 | 78,355 | 13,043 | 17 | ||||||||||||||||||||||||||||||||||
| Total loans | $ | 224,102 | 206,032 | 18,070 | 9 | $ | 181,237 | 24,795 | 14 | ||||||||||||||||||||||||||||||||
| Total deposits | 165,235 | 186,079 | (20,844) | (11) | 197,269 | (11,190) | (6) | ||||||||||||||||||||||||||||||||||
| Allocated capital | 25,500 | 19,500 | 6,000 | 31 | 19,500 | — | — | ||||||||||||||||||||||||||||||||||
| Selected Balance Sheet Data (period-end) | |||||||||||||||||||||||||||||||||||||||||
| Loans: | |||||||||||||||||||||||||||||||||||||||||
| Commercial and industrial | $ | 163,797 | 163,797 | — | — | $ | 131,078 | 32,719 | 25 | ||||||||||||||||||||||||||||||||
| Commercial real estate | 45,534 | 45,816 | (282) | (1) | 45,467 | 349 | 1 | ||||||||||||||||||||||||||||||||||
| Lease financing and other | 15,443 | 13,916 | 1,527 | 11 | 13,803 | 113 | 1 | ||||||||||||||||||||||||||||||||||
| Total loans | $ | 224,774 | 223,529 | 1,245 | 1 | $ | 190,348 | 33,181 | 17 | ||||||||||||||||||||||||||||||||
| Loans by Line of Business: | |||||||||||||||||||||||||||||||||||||||||
| Middle Market Banking | $ | 118,482 | 121,192 | (2,710) | (2) | $ | 106,834 | 14,358 | 13 | ||||||||||||||||||||||||||||||||
| Asset-Based Lending and Leasing | 106,292 | 102,337 | 3,955 | 4 | 83,514 | 18,823 | 23 | ||||||||||||||||||||||||||||||||||
| Total loans | $ | 224,774 | 223,529 | 1,245 | 1 | $ | 190,348 | 33,181 | 17 | ||||||||||||||||||||||||||||||||
| Total deposits | 162,526 | 173,942 | (11,416) | (7) | 205,428 | (31,486) | (15) | ||||||||||||||||||||||||||||||||||
20 |
Wells Fargo & Company | |||||||
| Year ended December 31, | |||||||||||||||||||||||||||||||||||||||||
| ($ in millions) | 2023 | 2022 | $ Change 2023/ 2022 |
% Change 2023/ 2022 |
2021 | $ Change 2022/ 2021 |
% Change 2022/ 2021 |
||||||||||||||||||||||||||||||||||
| Income Statement | |||||||||||||||||||||||||||||||||||||||||
| Net interest income | $ | 9,498 | 8,733 | 765 | 9 | % | $ | 7,410 | 1,323 | 18 | % | ||||||||||||||||||||||||||||||
| Noninterest income: | |||||||||||||||||||||||||||||||||||||||||
| Deposit-related fees | 976 | 1,068 | (92) | (9) | 1,112 | (44) | (4) | ||||||||||||||||||||||||||||||||||
| Lending-related fees | 790 | 769 | 21 | 3 | 761 | 8 | 1 | ||||||||||||||||||||||||||||||||||
| Investment banking fees | 1,738 | 1,492 | 246 | 16 | 2,405 | (913) | (38) | ||||||||||||||||||||||||||||||||||
| Net gains from trading activities | 4,553 | 1,886 | 2,667 | 141 | 272 | 1,614 | 593 | ||||||||||||||||||||||||||||||||||
| Other | 1,636 | 1,294 | 342 | 26 | 1,879 | (585) | (31) | ||||||||||||||||||||||||||||||||||
| Total noninterest income | 9,693 | 6,509 | 3,184 | 49 | 6,429 | 80 | 1 | ||||||||||||||||||||||||||||||||||
| Total revenue | 19,191 | 15,242 | 3,949 | 26 | 13,839 | 1,403 | 10 | ||||||||||||||||||||||||||||||||||
| Net charge-offs | 581 | (48) | 629 | NM | (22) | (26) | NM | ||||||||||||||||||||||||||||||||||
| Change in the allowance for credit losses | 1,426 | (137) | 1,563 | NM | (1,417) | 1,280 | 90 | ||||||||||||||||||||||||||||||||||
| Provision for credit losses | 2,007 | (185) | 2,192 | NM | (1,439) | 1,254 | 87 | ||||||||||||||||||||||||||||||||||
| Noninterest expense | 8,618 | 7,560 | 1,058 | 14 | 7,200 | 360 | 5 | ||||||||||||||||||||||||||||||||||
| Income before income tax expense | 8,566 | 7,867 | 699 | 9 | 8,078 | (211) | (3) | ||||||||||||||||||||||||||||||||||
| Income tax expense | 2,140 | 1,989 | 151 | 8 | 2,019 | (30) | (1) | ||||||||||||||||||||||||||||||||||
| Less: Net loss from noncontrolling interests | — | — | — | — | (3) | 3 | 100 | ||||||||||||||||||||||||||||||||||
| Net income | $ | 6,426 | 5,878 | 548 | 9 | $ | 6,062 | (184) | (3) | ||||||||||||||||||||||||||||||||
| Revenue by Line of Business | |||||||||||||||||||||||||||||||||||||||||
| Banking: | |||||||||||||||||||||||||||||||||||||||||
| Lending | $ | 2,872 | 2,222 | 650 | 29 | $ | 1,948 | 274 | 14 | ||||||||||||||||||||||||||||||||
| Treasury Management and Payments | 3,036 | 2,369 | 667 | 28 | 1,468 | 901 | 61 | ||||||||||||||||||||||||||||||||||
| Investment Banking | 1,404 | 1,206 | 198 | 16 | 1,654 | (448) | (27) | ||||||||||||||||||||||||||||||||||
| Total Banking | 7,312 | 5,797 | 1,515 | 26 | 5,070 | 727 | 14 | ||||||||||||||||||||||||||||||||||
| Commercial Real Estate | 5,311 | 4,534 | 777 | 17 | 3,963 | 571 | 14 | ||||||||||||||||||||||||||||||||||
| Markets: | |||||||||||||||||||||||||||||||||||||||||
| Fixed Income, Currencies, and Commodities (FICC) | 4,688 | 3,660 | 1,028 | 28 | 3,710 | (50) | (1) | ||||||||||||||||||||||||||||||||||
| Equities | 1,809 | 1,115 | 694 | 62 | 897 | 218 | 24 | ||||||||||||||||||||||||||||||||||
| Credit Adjustment (CVA/DVA) and Other | 65 | 20 | 45 | 225 | 91 | (71) | (78) | ||||||||||||||||||||||||||||||||||
| Total Markets | 6,562 | 4,795 | 1,767 | 37 | 4,698 | 97 | 2 | ||||||||||||||||||||||||||||||||||
| Other | 6 | 116 | (110) | (95) | 108 | 8 | 7 | ||||||||||||||||||||||||||||||||||
| Total revenue | $ | 19,191 | 15,242 | 3,949 | 26 | $ | 13,839 | 1,403 | 10 | ||||||||||||||||||||||||||||||||
| Selected Metrics | |||||||||||||||||||||||||||||||||||||||||
| Return on allocated capital | 13.8 | % | 15.3 | 16.9 | % | ||||||||||||||||||||||||||||||||||||
| Efficiency ratio | 45 | 50 | 52 | ||||||||||||||||||||||||||||||||||||||
| Wells Fargo & Company | 21 |
|||||||
| Year ended December 31, | |||||||||||||||||||||||||||||||||||||||||
($ in millions) |
2023 | 2022 | $ Change 2023/ 2022 |
% Change 2023/ 2022 |
2021 | $ Change 2022/ 2021 |
% Change 2022/ 2021 |
||||||||||||||||||||||||||||||||||
| Selected Balance Sheet Data (average) | |||||||||||||||||||||||||||||||||||||||||
| Loans: | |||||||||||||||||||||||||||||||||||||||||
| Commercial and industrial | $ | 191,602 | 198,424 | (6,822) | (3) | % | $ | 170,713 | 27,711 | 16 | % | ||||||||||||||||||||||||||||||
| Commercial real estate | 100,373 | 98,560 | 1,813 | 2 | 86,323 | 12,237 | 14 | ||||||||||||||||||||||||||||||||||
| Total loans | $ | 291,975 | 296,984 | (5,009) | (2) | $ | 257,036 | 39,948 | 16 | ||||||||||||||||||||||||||||||||
| Loans by Line of Business: | |||||||||||||||||||||||||||||||||||||||||
| Banking | $ | 95,783 | 106,440 | (10,657) | (10) | $ | 93,766 | 12,674 | 14 | ||||||||||||||||||||||||||||||||
| Commercial Real Estate | 135,702 | 133,719 | 1,983 | 1 | 110,978 | 22,741 | 20 | ||||||||||||||||||||||||||||||||||
| Markets | 60,490 | 56,825 | 3,665 | 6 | 52,292 | 4,533 | 9 | ||||||||||||||||||||||||||||||||||
| Total loans | $ | 291,975 | 296,984 | (5,009) | (2) | $ | 257,036 | 39,948 | 16 | ||||||||||||||||||||||||||||||||
| Trading-related assets: | |||||||||||||||||||||||||||||||||||||||||
| Trading account securities | $ | 118,130 | 112,213 | 5,917 | 5 | $ | 110,386 | 1,827 | 2 | ||||||||||||||||||||||||||||||||
| Reverse repurchase agreements/securities borrowed | 61,510 | 50,491 | 11,019 | 22 | 59,044 | (8,553) | (14) | ||||||||||||||||||||||||||||||||||
| Derivative assets | 18,636 | 27,421 | (8,785) | (32) | 25,315 | 2,106 | 8 | ||||||||||||||||||||||||||||||||||
| Total trading-related assets | $ | 198,276 | 190,125 | 8,151 | 4 | $ | 194,745 | (4,620) | (2) | ||||||||||||||||||||||||||||||||
| Total assets | 553,722 | 557,396 | (3,674) | (1) | 523,344 | 34,052 | 7 | ||||||||||||||||||||||||||||||||||
| Total deposits | 162,062 | 161,720 | 342 | — | 189,176 | (27,456) | (15) | ||||||||||||||||||||||||||||||||||
| Allocated capital | 44,000 | 36,000 | 8,000 | 22 | 34,000 | 2,000 | 6 | ||||||||||||||||||||||||||||||||||
| Selected Balance Sheet Data (period-end) | |||||||||||||||||||||||||||||||||||||||||
| Loans: | |||||||||||||||||||||||||||||||||||||||||
| Commercial and industrial | $ | 189,379 | 196,529 | (7,150) | (4) | $ | 191,391 | 5,138 | 3 | ||||||||||||||||||||||||||||||||
| Commercial real estate | 98,053 | 101,848 | (3,795) | (4) | 92,983 | 8,865 | 10 | ||||||||||||||||||||||||||||||||||
| Total loans | $ | 287,432 | 298,377 | (10,945) | (4) | $ | 284,374 | 14,003 | 5 | ||||||||||||||||||||||||||||||||
| Loans by Line of Business: | |||||||||||||||||||||||||||||||||||||||||
| Banking | $ | 93,987 | 101,183 | (7,196) | (7) | $ | 101,926 | (743) | (1) | ||||||||||||||||||||||||||||||||
| Commercial Real Estate | 131,968 | 137,495 | (5,527) | (4) | 125,926 | 11,569 | 9 | ||||||||||||||||||||||||||||||||||
| Markets | 61,477 | 59,699 | 1,778 | 3 | 56,522 | 3,177 | 6 | ||||||||||||||||||||||||||||||||||
| Total loans | $ | 287,432 | 298,377 | (10,945) | (4) | $ | 284,374 | 14,003 | 5 | ||||||||||||||||||||||||||||||||
| Trading-related assets: | |||||||||||||||||||||||||||||||||||||||||
| Trading account securities | $ | 115,562 | 111,801 | 3,761 | 3 | $ | 108,697 | 3,104 | 3 | ||||||||||||||||||||||||||||||||
Reverse repurchase agreements/securities borrowed |
63,614 | 55,407 | 8,207 | 15 | 55,973 | (566) | (1) | ||||||||||||||||||||||||||||||||||
| Derivative assets | 18,023 | 22,218 | (4,195) | (19) | 21,398 | 820 | 4 | ||||||||||||||||||||||||||||||||||
| Total trading-related assets | $ | 197,199 | 189,426 | 7,773 | 4 | $ | 186,068 | 3,358 | 2 | ||||||||||||||||||||||||||||||||
| Total assets | 547,203 | 550,177 | (2,974) | (1) | 546,549 | 3,628 | 1 | ||||||||||||||||||||||||||||||||||
| Total deposits | 185,142 | 157,217 | 27,925 | 18 | 168,609 | (11,392) | (7) | ||||||||||||||||||||||||||||||||||
22 |
Wells Fargo & Company | |||||||
| Year ended December 31, | |||||||||||||||||||||||||||||||||||||||||
| ($ in millions, unless otherwise noted) | 2023 | 2022 | $ Change 2023/ 2022 |
% Change 2023/ 2022 |
2021 | $ Change 2022/ 2021 |
% Change 2022/ 2021 |
||||||||||||||||||||||||||||||||||
| Income Statement | |||||||||||||||||||||||||||||||||||||||||
| Net interest income | $ | 3,966 | 3,927 | 39 | 1 | % | $ | 2,570 | 1,357 | 53 | % | ||||||||||||||||||||||||||||||
| Noninterest income: | |||||||||||||||||||||||||||||||||||||||||
| Investment advisory and other asset-based fees | 8,446 | 8,847 | (401) | (5) | 9,574 | (727) | (8) | ||||||||||||||||||||||||||||||||||
| Commissions and brokerage services fees | 2,058 | 1,931 | 127 | 7 | 2,010 | (79) | (4) | ||||||||||||||||||||||||||||||||||
| Other | 221 | 117 | 104 | 89 | 192 | (75) | (39) | ||||||||||||||||||||||||||||||||||
| Total noninterest income | 10,725 | 10,895 | (170) | (2) | 11,776 | (881) | (7) | ||||||||||||||||||||||||||||||||||
| Total revenue | 14,691 | 14,822 | (131) | (1) | 14,346 | 476 | 3 | ||||||||||||||||||||||||||||||||||
| Net charge-offs | (1) | (7) | 6 | 86 | 10 | (17) | NM | ||||||||||||||||||||||||||||||||||
| Change in the allowance for credit losses | 7 | (18) | 25 | 139 | (105) | 87 | 83 | ||||||||||||||||||||||||||||||||||
| Provision for credit losses | 6 | (25) | 31 | 124 | (95) | 70 | 74 | ||||||||||||||||||||||||||||||||||
| Noninterest expense | 12,064 | 11,613 | 451 | 4 | 11,734 | (121) | (1) | ||||||||||||||||||||||||||||||||||
| Income before income tax expense | 2,621 | 3,234 | (613) | (19) | 2,707 | 527 | 19 | ||||||||||||||||||||||||||||||||||
| Income tax expense | 657 | 812 | (155) | (19) | 680 | 132 | 19 | ||||||||||||||||||||||||||||||||||
| Net income | $ | 1,964 | 2,422 | (458) | (19) | $ | 2,027 | 395 | 19 | ||||||||||||||||||||||||||||||||
| Selected Metrics | |||||||||||||||||||||||||||||||||||||||||
| Return on allocated capital | 30.7 | % | 27.1 | 22.6 | % | ||||||||||||||||||||||||||||||||||||
| Efficiency ratio | 82 | 78 | 82 | ||||||||||||||||||||||||||||||||||||||
| Client assets ($ in billions, period-end): | |||||||||||||||||||||||||||||||||||||||||
| Advisory assets | $ | 891 | 797 | 94 | 12 | $ | 964 | (167) | (17) | ||||||||||||||||||||||||||||||||
| Other brokerage assets and deposits | 1,193 | 1,064 | 129 | 12 | 1,219 | (155) | (13) | ||||||||||||||||||||||||||||||||||
| Total client assets | $ | 2,084 | 1,861 | 223 | 12 | $ | 2,183 | (322) | (15) | ||||||||||||||||||||||||||||||||
| Selected Balance Sheet Data (average) | |||||||||||||||||||||||||||||||||||||||||
| Total loans | $ | 82,755 | 85,228 | (2,473) | (3) | $ | 82,364 | 2,864 | 3 | ||||||||||||||||||||||||||||||||
| Total deposits | 112,069 | 164,883 | (52,814) | (32) | 176,562 | (11,679) | (7) | ||||||||||||||||||||||||||||||||||
| Allocated capital | 6,250 | 8,750 | (2,500) | (29) | 8,750 | — | — | ||||||||||||||||||||||||||||||||||
| Selected Balance Sheet Data (period-end) | |||||||||||||||||||||||||||||||||||||||||
| Total loans | $ | 82,555 | 84,273 | (1,718) | (2) | $ | 84,101 | 172 | — | ||||||||||||||||||||||||||||||||
| Total deposits | 103,902 | 138,760 | (34,858) | (25) | 192,548 | (53,788) | (28) | ||||||||||||||||||||||||||||||||||
| Wells Fargo & Company | 23 |
|||||||
| Year ended | |||||||||||||||||
| (in billions) | Balance, beginning of period | Inflows (1) | Outflows (2) | Market impact (3) |
Balance, end
of period
|
||||||||||||
| December 31, 2023 | |||||||||||||||||
| Client-directed (4) | $ | 165.2 | 33.0 | (34.7) | 21.8 | 185.3 | |||||||||||
| Financial advisor-directed (5) | 222.9 | 40.3 | (38.3) | 39.7 | 264.6 | ||||||||||||
| Separate accounts (6) | 176.5 | 24.1 | (26.5) | 24.3 | 198.4 | ||||||||||||
| Mutual fund advisory (7) | 78.6 | 7.4 | (12.8) | 10.1 | 83.3 | ||||||||||||
| Total Wells Fargo Advisors | $ | 643.2 | 104.8 | (112.3) | 95.9 | 731.6 | |||||||||||
| The Private Bank (8) | 153.6 | 25.0 | (34.5) | 15.4 | 159.5 | ||||||||||||
| Total WIM advisory assets | $ | 796.8 | 129.8 | (146.8) | 111.3 | 891.1 | |||||||||||
| December 31, 2022 | |||||||||||||||||
| Client-directed (4) | $ | 205.6 | 31.8 | (39.0) | (33.2) | 165.2 | |||||||||||
| Financial advisor-directed (5) | 255.5 | 41.6 | (44.2) | (30.0) | 222.9 | ||||||||||||
| Separate accounts (6) | 203.3 | 24.6 | (26.5) | (24.9) | 176.5 | ||||||||||||
| Mutual fund advisory (7) | 102.1 | 8.7 | (15.0) | (17.2) | 78.6 | ||||||||||||
| Total Wells Fargo Advisors | $ | 766.5 | 106.7 | (124.7) | (105.3) | 643.2 | |||||||||||
| The Private Bank (8) | 198.0 | 27.4 | (47.1) | (24.7) | 153.6 | ||||||||||||
| Total WIM advisory assets | $ | 964.5 | 134.1 | (171.8) | (130.0) | 796.8 | |||||||||||
| December 31, 2021 | |||||||||||||||||
| Client directed (4) | $ | 186.3 | 41.5 | (45.0) | 22.8 | 205.6 | |||||||||||
| Financial advisor directed (5) | 211.0 | 48.7 | (41.1) | 36.9 | 255.5 | ||||||||||||
| Separate accounts (6) | 174.6 | 31.8 | (30.7) | 27.6 | 203.3 | ||||||||||||
| Mutual fund advisory (7) | 91.4 | 15.6 | (15.0) | 10.1 | 102.1 | ||||||||||||
| Total Wells Fargo Advisors | $ | 663.3 | 137.6 | (131.8) | 97.4 | 766.5 | |||||||||||
| The Private Bank (8) | 189.4 | 40.0 | (51.1) | 19.7 | 198.0 | ||||||||||||
| Total WIM advisory assets | $ | 852.7 | 177.6 | (182.9) | 117.1 | 964.5 | |||||||||||
24 |
Wells Fargo & Company | |||||||
| Year ended December 31, | |||||||||||||||||||||||||||||||||||||||||
($ in millions) |
2023 | 2022 | $ Change 2023/ 2022 |
% Change 2023/ 2022 |
2021 | $ Change 2022/ 2021 |
% Change 2022/ 2021 |
||||||||||||||||||||||||||||||||||
| Income Statement | |||||||||||||||||||||||||||||||||||||||||
| Net interest income | $ | (888) | (1,607) | 719 | 45 | % | $ | (1,541) | (66) | (4) | % | ||||||||||||||||||||||||||||||
| Noninterest income | 431 | 1,192 | (761) | (64) | 10,710 | (9,518) | (89) | ||||||||||||||||||||||||||||||||||
| Total revenue | (457) | (415) | (42) | (10) | 9,169 | (9,584) | NM | ||||||||||||||||||||||||||||||||||
| Net charge-offs | (10) | (33) | 23 | 70 | 54 | (87) | NM | ||||||||||||||||||||||||||||||||||
| Change in the allowance for credit losses | 22 | 35 | (13) | (37) | 3 | 32 | NM | ||||||||||||||||||||||||||||||||||
| Provision for credit losses | 12 | 2 | 10 | 500 | 57 | (55) | (96) | ||||||||||||||||||||||||||||||||||
| Noninterest expense | 4,301 | 5,697 | (1,396) | (25) | 4,314 | 1,383 | 32 | ||||||||||||||||||||||||||||||||||
Income (loss) before income tax expense (benefit) |
(4,770) | (6,114) | 1,344 | 22 | 4,798 | (10,912) | NM | ||||||||||||||||||||||||||||||||||
Income tax expense (benefit) |
(2,355) | (1,721) | (634) | (37) | 782 | (2,503) | NM | ||||||||||||||||||||||||||||||||||
Less: Net income (loss) from noncontrolling interests (1) |
(124) | (311) | 187 | 60 | 1,685 | (1,996) | NM | ||||||||||||||||||||||||||||||||||
Net income (loss) |
$ | (2,291) | (4,082) | 1,791 | 44 | $ | 2,331 | (6,413) | NM | ||||||||||||||||||||||||||||||||
| Wells Fargo & Company | 25 |
|||||||
| Year ended December 31, | |||||||||||||||||||||||||||||||||||||||||
($ in millions) |
2023 | 2022 | $ Change 2023/ 2022 |
% Change 2023/ 2022 |
2021 | $ Change 2022/ 2021 |
% Change 2022/ 2021 |
||||||||||||||||||||||||||||||||||
| Selected Balance Sheet Data (average) | |||||||||||||||||||||||||||||||||||||||||
| Cash and due from banks, and interest-earning deposits with banks | $ | 153,538 | 147,192 | 6,346 | 4 | % | $ | 236,124 | (88,932) | (38) | % | ||||||||||||||||||||||||||||||
| Available-for-sale debt securities (1) | 123,542 | 124,308 | (766) | (1) | 181,841 | (57,533) | (32) | ||||||||||||||||||||||||||||||||||
| Held-to-maturity debt securities (1) | 267,672 | 290,087 | (22,415) | (8) | 244,735 | 45,352 | 19 | ||||||||||||||||||||||||||||||||||
| Equity securities | 15,635 | 15,695 | (60) | — | 12,720 | 2,975 | 23 | ||||||||||||||||||||||||||||||||||
| Total loans | 9,164 | 9,143 | 21 | — | 9,766 | (623) | (6) | ||||||||||||||||||||||||||||||||||
| Total assets | 619,002 | 638,011 | (19,009) | (3) | 743,247 | (105,236) | (14) | ||||||||||||||||||||||||||||||||||
| Total deposits | 95,825 | 28,457 | 67,368 | 237 | 40,066 | (11,609) | (29) | ||||||||||||||||||||||||||||||||||
| Selected Balance Sheet Data (period-end) | |||||||||||||||||||||||||||||||||||||||||
| Cash and due from banks, and interest-earning deposits with banks | $ | 211,420 | 127,106 | 84,314 | 66 | $ | 209,696 | (82,590) | (39) | ||||||||||||||||||||||||||||||||
| Available-for-sale debt securities (1) | 118,923 | 102,669 | 16,254 | 16 | 165,926 | (63,257) | (38) | ||||||||||||||||||||||||||||||||||
| Held-to-maturity debt securities (1) | 259,748 | 294,141 | (34,393) | (12) | 269,285 | 24,856 | 9 | ||||||||||||||||||||||||||||||||||
| Equity securities | 15,810 | 15,508 | 302 | 2 | 16,549 | (1,041) | (6) | ||||||||||||||||||||||||||||||||||
| Total loans | 9,054 | 9,163 | (109) | (1) | 9,997 | (834) | (8) | ||||||||||||||||||||||||||||||||||
| Total assets | 674,075 | 601,218 | 72,857 | 12 | 721,340 | (120,122) | (17) | ||||||||||||||||||||||||||||||||||
| Total deposits | 124,294 | 54,371 | 69,923 | 129 | 32,220 | 22,151 | 69 | ||||||||||||||||||||||||||||||||||
26 |
Wells Fargo & Company | |||||||
| Balance Sheet Analysis | ||
| December 31, 2023 | December 31, 2022 | ||||||||||||||||||||||||||||||||||||||||||||||
| ($ in millions) | Amortized cost, net (1) |
Net unrealized gains (losses) |
Fair value | Weighted average expected maturity (yrs) |
Amortized cost, net (1) |
Net unrealized gains (losses) |
Fair value | Weighted average expected maturity (yrs) | |||||||||||||||||||||||||||||||||||||||
| Available-for-sale (2) | $ | 137,155 | (6,707) | 130,448 | 4.7 | $ | 121,725 | (8,131) | 113,594 | 5.4 | |||||||||||||||||||||||||||||||||||||
| Held-to-maturity (3) | 262,708 | (35,392) | 227,316 | 7.6 | 297,059 | (41,538) | 255,521 | 8.1 | |||||||||||||||||||||||||||||||||||||||
Total |
$ | 399,863 | (42,099) | 357,764 | n/a |
$ | 418,784 | (49,669) | 369,115 | n/a |
|||||||||||||||||||||||||||||||||||||
| Wells Fargo & Company | 27 |
|||||||
| ($ in millions) | Dec 31, 2023 | Dec 31, 2022 | $ Change | % Change | |||||||||||||||||||
| Commercial | $ | 547,427 | 557,516 | (10,089) | (2) | % | |||||||||||||||||
| Consumer | 389,255 | 398,355 | (9,100) | (2) | |||||||||||||||||||
| Total loans | $ | 936,682 | 955,871 | (19,189) | (2) | ||||||||||||||||||
| December 31, 2023 | |||||||||||||||||||||||||||||||||||||||||
| Loan maturities | Loans maturing after one year |
||||||||||||||||||||||||||||||||||||||||
| (in millions) | Within one year |
After one year through five years |
After five years through fifteen years | After fifteen years |
Total | Fixed interest rates | Floating/variable interest rates | ||||||||||||||||||||||||||||||||||
| Commercial and industrial | $ | 134,720 | 224,669 | 19,883 | 1,116 | 380,388 | 23,899 | 221,769 | |||||||||||||||||||||||||||||||||
| Commercial real estate | 51,726 | 80,164 | 17,265 | 1,461 | 150,616 | 18,428 | 80,462 | ||||||||||||||||||||||||||||||||||
| Lease financing | 3,697 | 10,782 | 1,892 | 52 | 16,423 | 12,649 | 77 | ||||||||||||||||||||||||||||||||||
| Total commercial | 190,143 | 315,615 | 39,040 | 2,629 | 547,427 | 54,976 | 302,308 | ||||||||||||||||||||||||||||||||||
| Residential mortgage | 10,085 | 30,044 | 87,401 | 133,194 | 260,724 | 176,485 | 74,154 | ||||||||||||||||||||||||||||||||||
| Credit card | 52,230 | — | — | — | 52,230 | — | — | ||||||||||||||||||||||||||||||||||
| Auto | 12,205 | 34,132 | 1,425 | — | 47,762 | 35,557 | — | ||||||||||||||||||||||||||||||||||
| Other consumer | 23,421 | 4,582 | 516 | 20 | 28,539 | 4,498 | 620 | ||||||||||||||||||||||||||||||||||
| Total consumer | 97,941 | 68,758 | 89,342 | 133,214 | 389,255 | 216,540 | 74,774 | ||||||||||||||||||||||||||||||||||
| Total loans | $ | 288,084 | 384,373 | 128,382 | 135,843 | 936,682 | 271,516 | 377,082 | |||||||||||||||||||||||||||||||||
| ($ in millions) | Dec 31, 2023 |
% of
total
deposits
|
Dec 31, 2022 |
% of total deposits |
$ Change | % Change | |||||||||||||||||||||||||||||
| Noninterest-bearing demand deposits | $ | 360,279 | 26 | % | $ | 458,010 | 33 | % | $ | (97,731) | (21) | % | |||||||||||||||||||||||
| Interest-bearing demand deposits | 436,908 | 32 | 428,877 | 31 | 8,031 | 2 | |||||||||||||||||||||||||||||
| Savings deposits | 349,181 | 26 | 410,139 | 30 | (60,958) | (15) | |||||||||||||||||||||||||||||
| Time deposits | 187,989 | 14 | 66,197 | 5 | 121,792 | 184 | |||||||||||||||||||||||||||||
| Interest-bearing deposits in non-U.S. offices | 23,816 | 2 | 20,762 | 1 | 3,054 | 15 | |||||||||||||||||||||||||||||
| Total deposits | $ | 1,358,173 | 100 | % | $ | 1,383,985 | 100 | % | $ | (25,812) | (2) | ||||||||||||||||||||||||
28 |
Wells Fargo & Company | |||||||
| (in millions) | Three months or less | After three months through six months | After six months through twelve months | After twelve months | Total | ||||||||||||||||||||||||
| December 31, 2023 | |||||||||||||||||||||||||||||
| Domestic time deposits | $ | 12,625 | 11,016 | 21,000 | 644 | 45,285 | |||||||||||||||||||||||
| Non-U.S. time deposits | 1,675 | 692 | 1,911 | — | 4,278 | ||||||||||||||||||||||||
| Total | $ | 14,300 | 11,708 | 22,911 | 644 | 49,563 | |||||||||||||||||||||||
| Off-Balance Sheet Arrangements | ||
| Wells Fargo & Company | 29 |
|||||||
| Risk Management | ||
30 |
Wells Fargo & Company | |||||||
Wells Fargo & Company |
|||||||||||||||||||||||||||||||||||||||||||||||||||||||||||||||||||||||||||||||||||||||||||||||||||||||||||||||||||||||||||||||||||||||||||||||||||||||||||||||||
| Audit Committee (1) | Finance Committee |
Corporate Responsibility Committee |
Risk
Committee
|
Governance & Nominating Committee | Human Resources Committee | ||||||||||||||||||||||||||||||||||||||||||||||||||||||||||||||||||||||||||||||||||||||||||||||||||||||||||||||||||||||||||||||||||||||||||||||||||||||||||||
| Management Governance Committees | |||||||||||||||||||||||||||||||||||||||||||||||||||||||||||||||||||||||||||||||||||||||||||||||||||||||||||||||||||||||||||||||||||||||||||||||||||||||||||||||||
| Disclosure Committee | Capital Management Committee | Allowance for Credit Losses Approval Governance Committee | Enterprise Risk & Control Committee | Incentive Compensation & Performance Management Committee | |||||||||||||||||||||||||||||||||||||||||||||||||||||||||||||||||||||||||||||||||||||||||||||||||||||||||||||||||||||||||||||||||||||||||||||||||||||||||||||
| Regulatory Reporting Oversight Committee | Corporate Asset/Liability Committee | Risk & Control Committees | |||||||||||||||||||||||||||||||||||||||||||||||||||||||||||||||||||||||||||||||||||||||||||||||||||||||||||||||||||||||||||||||||||||||||||||||||||||||||||||||
Recovery & Resolution Committee |
Risk Type Committees | ||||||||||||||||||||||||||||||||||||||||||||||||||||||||||||||||||||||||||||||||||||||||||||||||||||||||||||||||||||||||||||||||||||||||||||||||||||||||||||||||
| Risk Topic Committees | |||||||||||||||||||||||||||||||||||||||||||||||||||||||||||||||||||||||||||||||||||||||||||||||||||||||||||||||||||||||||||||||||||||||||||||||||||||||||||||||||
| Wells Fargo & Company | 31 |
|||||||
32 |
Wells Fargo & Company | |||||||
| Wells Fargo & Company | 33 |
|||||||
(in millions) |
Dec 31, 2023 | Dec 31, 2022 | |||||||||
| Commercial and industrial | $ | 380,388 | 386,806 | ||||||||
| Commercial real estate | 150,616 | 155,802 | |||||||||
| Lease financing | 16,423 | 14,908 | |||||||||
| Total commercial | 547,427 | 557,516 | |||||||||
| Residential mortgage | 260,724 | 269,117 | |||||||||
| Credit card | 52,230 | 46,293 | |||||||||
| Auto | 47,762 | 53,669 | |||||||||
| Other consumer | 28,539 | 29,276 | |||||||||
| Total consumer | 389,255 | 398,355 | |||||||||
| Total loans | $ | 936,682 | 955,871 | ||||||||
($ in millions) |
Dec 31, 2023 | Dec 31, 2022 | |||||||||
| Nonaccrual loans | |||||||||||
| Commercial loans | $ | 4,914 | 1,823 | ||||||||
| Consumer loans | 3,342 | 3,803 | |||||||||
| Total nonaccrual loans | $ | 8,256 | 5,626 | ||||||||
| Nonaccrual loans as a % of total loans | 0.88 | % | 0.59 | ||||||||
| Allowance for credit losses (ACL) for loans | $ | 15,088 | 13,609 | ||||||||
| ACL for loans as a % of total loans | 1.61 | % | 1.42 | ||||||||
| Net loan charge-offs as a % of: | |||||||||||
| Average commercial loans | 0.17 | % | 0.01 | ||||||||
| Average consumer loans | 0.65 | 0.39 | |||||||||
34 |
Wells Fargo & Company | |||||||
| December 31, 2023 | December 31, 2022 | ||||||||||||||||||||||||||||||||||||||||||||||
| ($ in millions) | Nonaccrual loans | Loans outstanding balance | % of total loans | Total commitments (1) | Nonaccrual loans | Loans outstanding balance | % of total loans | Total commitments (1) | |||||||||||||||||||||||||||||||||||||||
| Financials except banks | $ | 9 | 146,635 | 16 | % | $ | 234,513 | 44 | 147,171 | 15 | % | $ | 229,822 | ||||||||||||||||||||||||||||||||||
| Technology, telecom and media | 60 | 25,460 | 3 | 59,216 | 31 | 27,767 | 3 | 66,340 | |||||||||||||||||||||||||||||||||||||||
| Real estate and construction | 55 | 24,987 | 3 | 54,345 | 73 | 24,478 | 3 | 56,393 | |||||||||||||||||||||||||||||||||||||||
| Retail | 72 | 19,596 | 2 | 48,829 | 47 | 19,487 | 2 | 49,334 | |||||||||||||||||||||||||||||||||||||||
| Equipment, machinery and parts manufacturing | 37 | 24,785 | 3 | 48,265 | 83 | 23,675 | 2 | 47,507 | |||||||||||||||||||||||||||||||||||||||
| Materials and commodities | 112 | 14,235 | 2 | 37,758 | 86 | 16,610 | 2 | 39,667 | |||||||||||||||||||||||||||||||||||||||
| Food and beverage manufacturing | 15 | 16,047 | 2 | 33,957 | 17 | 17,393 | 2 | 33,951 | |||||||||||||||||||||||||||||||||||||||
| Oil, gas and pipelines | 2 | 10,730 | 1 | 32,544 | 55 | 9,991 | 1 | 31,077 | |||||||||||||||||||||||||||||||||||||||
| Health care and pharmaceuticals | 26 | 14,863 | 2 | 30,386 | 21 | 14,861 | 2 | 30,294 | |||||||||||||||||||||||||||||||||||||||
| Auto related | 8 | 15,203 | 2 | 28,795 | 10 | 13,168 | 1 | 27,451 | |||||||||||||||||||||||||||||||||||||||
| Commercial services | 37 | 11,095 | 1 | 26,025 | 50 | 11,418 | 1 | 26,693 | |||||||||||||||||||||||||||||||||||||||
| Utilities | 1 | 8,325 | * | 25,710 | 18 | 9,457 | * | 26,899 | |||||||||||||||||||||||||||||||||||||||
| Diversified or miscellaneous | 67 | 8,284 | * | 22,877 | 2 | 8,161 | * | 21,498 | |||||||||||||||||||||||||||||||||||||||
| Entertainment and recreation | 18 | 13,968 | 1 | 20,250 | 28 | 13,085 | 1 | 18,741 | |||||||||||||||||||||||||||||||||||||||
| Transportation services | 134 | 9,277 | * | 16,750 | 237 | 8,389 | * | 16,064 | |||||||||||||||||||||||||||||||||||||||
| Insurance and fiduciaries | 1 | 4,715 | * | 15,724 | 1 | 4,691 | * | 15,592 | |||||||||||||||||||||||||||||||||||||||
| Banks | — | 11,820 | 1 | 12,981 | — | 14,403 | 2 | 16,537 | |||||||||||||||||||||||||||||||||||||||
| Agribusiness | 31 | 6,466 | * | 12,080 | 24 | 6,180 | * | 11,457 | |||||||||||||||||||||||||||||||||||||||
| Government and education | 26 | 5,603 | * | 11,552 | 25 | 6,482 | * | 12,590 | |||||||||||||||||||||||||||||||||||||||
| Other (2) | 15 | 4,717 | * | 12,297 | 13 | 4,847 | * | 12,301 | |||||||||||||||||||||||||||||||||||||||
Total |
$ | 726 | 396,811 | 42 | % | $ | 784,854 | 865 | 401,714 | 42 | % | $ | 790,208 | ||||||||||||||||||||||||||||||||||
| December 31, 2023 | December 31, 2022 | ||||||||||||||||||||||||||||||||||||||||||||||
| ($ in millions) | Nonaccrual loans | Loans outstanding balance | % of total loans | Total commitments (1) | Nonaccrual loans | Loans outstanding balance | % of total loans | Total commitments (1) | |||||||||||||||||||||||||||||||||||||||
| Asset managers and funds (2) | $ | — | 51,842 | 6 | % | $ | 98,074 | 1 | 52,254 | 5 | % | $ | 97,998 | ||||||||||||||||||||||||||||||||||
| Commercial finance (3) | 2 | 52,007 | 6 | 78,369 | 31 | 53,269 | 5 | 76,016 | |||||||||||||||||||||||||||||||||||||||
| Consumer finance (4) | — | 20,308 | 2 | 33,547 | 4 | 17,028 | 2 | 29,047 | |||||||||||||||||||||||||||||||||||||||
| Real estate finance (5) | 7 | 22,478 | 2 | 24,523 | 8 | 24,620 | 3 | 26,761 | |||||||||||||||||||||||||||||||||||||||
| Total | $ | 9 | 146,635 | 16 | % | $ | 234,513 | 44 | 147,171 | 15 | % | $ | 229,822 | ||||||||||||||||||||||||||||||||||
| Wells Fargo & Company | 35 |
|||||||
36 |
Wells Fargo & Company | |||||||
| December 31, 2023 | December 31, 2022 | ||||||||||||||||||||||||||||||||||||||||
| Real estate mortgage | Real estate construction | Total commercial real estate | Total commercial real estate | ||||||||||||||||||||||||||||||||||||||
| ($ in millions) | Nonaccrual loans | Loans outstanding balance | Nonaccrual loans | Loans outstanding balance | Nonaccrual loans | Loans outstanding balance | Loans as % of total loans | Total commitments (1) | Loans outstanding balance | Total commitments (1) | |||||||||||||||||||||||||||||||
| By state: | |||||||||||||||||||||||||||||||||||||||||
| California | $ | 1,138 | 27,565 | — | 4,054 | 1,138 | 31,619 | 3% | $ | 35,629 | 34,285 | 39,594 | |||||||||||||||||||||||||||||
| New York | 922 | 14,229 | — | 2,346 | 922 | 16,575 | 2 | 17,930 | 17,294 | 19,360 | |||||||||||||||||||||||||||||||
| Florida | 114 | 10,324 | — | 2,168 | 114 | 12,492 | 1 | 14,577 | 11,418 | 14,690 | |||||||||||||||||||||||||||||||
| Texas | 19 | 10,562 | — | 1,471 | 19 | 12,033 | 1 | 14,224 | 12,807 | 14,941 | |||||||||||||||||||||||||||||||
| Georgia | 165 | 5,111 | — | 994 | 165 | 6,105 | * | 6,804 | 5,428 | 6,651 | |||||||||||||||||||||||||||||||
| North Carolina | 45 | 4,239 | — | 1,158 | 45 | 5,397 | * | 6,408 | 5,227 | 6,650 | |||||||||||||||||||||||||||||||
| Washington | 287 | 4,076 | — | 1,171 | 287 | 5,247 | * | 5,994 | 5,603 | 6,868 | |||||||||||||||||||||||||||||||
| Arizona | 12 | 4,579 | — | 603 | 12 | 5,182 | * | 5,806 | 5,302 | 6,288 | |||||||||||||||||||||||||||||||
| New Jersey | 8 | 2,599 | — | 1,765 | 8 | 4,364 | * | 5,130 | 4,119 | 5,660 | |||||||||||||||||||||||||||||||
| Illinois | 313 | 4,125 | 24 | 279 | 337 | 4,404 | * | 4,985 | 4,591 | 5,394 | |||||||||||||||||||||||||||||||
| Other (2) | 1,140 | 39,466 | 1 | 7,732 | 1,141 | 47,198 | 5 | 53,979 | 49,728 | 59,224 | |||||||||||||||||||||||||||||||
| Total | $ | 4,163 | 126,875 | 25 | 23,741 | 4,188 | 150,616 | 16% | $ | 171,466 | 155,802 | 185,320 | |||||||||||||||||||||||||||||
By property: |
|||||||||||||||||||||||||||||||||||||||||
| Apartments | $ | 56 | 31,467 | — | 11,118 | 56 | 42,585 | 5% | $ | 51,749 | 39,743 | 51,567 | |||||||||||||||||||||||||||||
| Office (3) | 3,357 | 28,504 | — | 3,022 | 3,357 | 31,526 | 3 | 34,295 | 36,144 | 40,827 | |||||||||||||||||||||||||||||||
| Industrial/warehouse | 28 | 20,994 | — | 4,419 | 28 | 25,413 | 3 | 28,493 | 20,634 | 24,546 | |||||||||||||||||||||||||||||||
| Hotel/motel | 171 | 11,847 | — | 878 | 171 | 12,725 | 1 | 13,612 | 12,751 | 13,758 | |||||||||||||||||||||||||||||||
| Retail (excl shopping center) | 271 | 11,591 | 1 | 79 | 272 | 11,670 | 1 | 12,338 | 11,753 | 12,486 | |||||||||||||||||||||||||||||||
| Shopping center | 183 | 8,401 | — | 344 | 183 | 8,745 | * | 9,356 | 9,534 | 10,131 | |||||||||||||||||||||||||||||||
| Institutional | 57 | 4,431 | 24 | 1,555 | 81 | 5,986 | * | 6,568 | 7,725 | 9,178 | |||||||||||||||||||||||||||||||
| Mixed use properties | 32 | 3,172 | — | 339 | 32 | 3,511 | * | 3,763 | 5,887 | 7,139 | |||||||||||||||||||||||||||||||
| Storage facility | — | 2,614 | — | 168 | — | 2,782 | * | 3,002 | 2,929 | 3,201 | |||||||||||||||||||||||||||||||
| 1-4 family structure | — | 7 | — | 1,188 | — | 1,195 | * | 2,691 | 1,324 | 3,589 | |||||||||||||||||||||||||||||||
| Other | 8 | 3,847 | — | 631 | 8 | 4,478 | * | 5,600 | 7,378 | 8,898 | |||||||||||||||||||||||||||||||
| Total | $ | 4,163 | 126,875 | 25 | 23,741 | 4,188 | 150,616 | 16 | % | $ | 171,467 | 155,802 | 185,320 | ||||||||||||||||||||||||||||
| Wells Fargo & Company | 37 |
|||||||
| December 31, 2023 | |||||||||||||||||||||||||||||||||||||||||||||||||||||
Lending and deposits with banks (1) |
Securities | Derivatives and other | Total exposure | ||||||||||||||||||||||||||||||||||||||||||||||||||
(in millions) |
Sovereign | Non-sovereign | Sovereign | Non-sovereign | Sovereign | Non-sovereign | Sovereign | Non-sovereign (2) |
Total | ||||||||||||||||||||||||||||||||||||||||||||
| Top 20 country exposures: | |||||||||||||||||||||||||||||||||||||||||||||||||||||
| United Kingdom | $ | 4,096 | 22,249 | 10 | 213 | 2 | 1,212 | 4,108 | 23,674 | 27,782 | |||||||||||||||||||||||||||||||||||||||||||
| Canada | 8 | 16,547 | (11) | 352 | 133 | 513 | 130 | 17,412 | 17,542 | ||||||||||||||||||||||||||||||||||||||||||||
| Japan | 8,513 | 595 | — | 66 | — | 86 | 8,513 | 747 | 9,260 | ||||||||||||||||||||||||||||||||||||||||||||
| Cayman Islands | — | 8,173 | — | — | — | 193 | — | 8,366 | 8,366 | ||||||||||||||||||||||||||||||||||||||||||||
| Luxembourg | — | 7,526 | — | 232 | — | 288 | — | 8,046 | 8,046 | ||||||||||||||||||||||||||||||||||||||||||||
| Ireland | 5 | 4,898 | — | 163 | 1 | 215 | 6 | 5,276 | 5,282 | ||||||||||||||||||||||||||||||||||||||||||||
| France | 34 | 4,278 | — | 358 | 19 | 104 | 53 | 4,740 | 4,793 | ||||||||||||||||||||||||||||||||||||||||||||
| Bermuda | — | 3,786 | — | 12 | — | 57 | — | 3,855 | 3,855 | ||||||||||||||||||||||||||||||||||||||||||||
| Germany | — | 2,990 | (138) | 377 | 9 | 167 | (129) | 3,534 | 3,405 | ||||||||||||||||||||||||||||||||||||||||||||
| China | 13 | 1,351 | (88) | 1,456 | 21 | 8 | (54) | 2,815 | 2,761 | ||||||||||||||||||||||||||||||||||||||||||||
| Netherlands | — | 2,350 | — | 110 | — | 138 | — | 2,598 | 2,598 | ||||||||||||||||||||||||||||||||||||||||||||
| Guernsey | — | 2,482 | — | — | — | 2 | — | 2,484 | 2,484 | ||||||||||||||||||||||||||||||||||||||||||||
| South Korea | — | 1,899 | (55) | 348 | — | 4 | (55) | 2,251 | 2,196 | ||||||||||||||||||||||||||||||||||||||||||||
| Australia | — | 1,588 | — | 412 | — | 29 | — | 2,029 | 2,029 | ||||||||||||||||||||||||||||||||||||||||||||
| Norway | — | 1,427 | — | 109 | — | 1 | — | 1,537 | 1,537 | ||||||||||||||||||||||||||||||||||||||||||||
| Switzerland | — | 1,222 | — | 25 | — | 289 | — | 1,536 | 1,536 | ||||||||||||||||||||||||||||||||||||||||||||
| Chile | — | 1,475 | — | 15 | — | 1 | — | 1,491 | 1,491 | ||||||||||||||||||||||||||||||||||||||||||||
| Brazil | — | 1,246 | — | (13) | — | — | — | 1,233 | 1,233 | ||||||||||||||||||||||||||||||||||||||||||||
| Spain | — | 819 | — | 52 | — | 223 | — | 1,094 | 1,094 | ||||||||||||||||||||||||||||||||||||||||||||
| India | — | 980 | (68) | 139 | — | 1 | (68) | 1,120 | 1,052 | ||||||||||||||||||||||||||||||||||||||||||||
| Total top 20 country exposures | $ | 12,669 | 87,881 | (350) | 4,426 | 185 | 3,531 | 12,504 | 95,838 | 108,342 | |||||||||||||||||||||||||||||||||||||||||||
38 |
Wells Fargo & Company | |||||||
| Outstanding balance | % of total loans | % of loans 30 days or more past due |
Net loan charge-off rate |
||||||||||||||||||||||||||||||||||||||||||||
| December 31, | December 31, | December 31, | Year ended December 31, | ||||||||||||||||||||||||||||||||||||||||||||
| ($ in millions) | 2023 | 2022 | 2023 | 2022 | 2023 | 2022 | 2023 | 2022 | |||||||||||||||||||||||||||||||||||||||
| California (1) | $ | 109,972 | 110,877 | 11.74 | % | 11.60 | 0.36 | 0.45 | 0.01 | — | |||||||||||||||||||||||||||||||||||||
| New York | 31,322 | 31,753 | 3.34 | 3.32 | 0.79 | 0.80 | — | (0.02) | |||||||||||||||||||||||||||||||||||||||
| Washington | 10,672 | 10,523 | 1.14 | 1.10 | 0.29 | 0.30 | (0.02) | — | |||||||||||||||||||||||||||||||||||||||
| New Jersey | 10,161 | 10,416 | 1.08 | 1.09 | 1.13 | 1.24 | 0.01 | 0.01 | |||||||||||||||||||||||||||||||||||||||
| Florida | 10,065 | 10,535 | 1.07 | 1.10 | 1.11 | 1.13 | (0.07) | (0.08) | |||||||||||||||||||||||||||||||||||||||
Other (2) |
69,893 | 72,843 | 7.46 | 7.62 | 0.82 | 0.93 | 0.01 | 0.01 | |||||||||||||||||||||||||||||||||||||||
| Total | 242,085 | 246,947 | 25.83 | 25.83 | 0.61 | 0.69 | — | — | |||||||||||||||||||||||||||||||||||||||
Government insured/guaranteed loans (3) |
7,568 | 8,860 | 0.81 | 0.93 | |||||||||||||||||||||||||||||||||||||||||||
| Total first lien mortgage portfolio | $ | 249,653 | 255,807 | 26.64 | % | 26.76 | |||||||||||||||||||||||||||||||||||||||||
| Wells Fargo & Company | 39 |
|||||||
| Outstanding balance | % of total loans |
% of loans 30 days
or more past due
|
Net loan charge-off rate |
||||||||||||||||||||||||||||||||||||||||||||
| December 31, | December 31, | December 31, | Year ended December 31, | ||||||||||||||||||||||||||||||||||||||||||||
| ($ in millions) | 2023 | 2022 | 2023 | 2022 | 2023 | 2022 | 2023 | 2022 | |||||||||||||||||||||||||||||||||||||||
| California | $ | 3,101 | 3,550 | 0.33 | % | 0.37 | 1.65 | 2.02 | (0.10) | (0.26) | |||||||||||||||||||||||||||||||||||||
| New Jersey | 1,114 | 1,383 | 0.12 | 0.14 | 2.81 | 2.76 | (0.13) | 0.10 | |||||||||||||||||||||||||||||||||||||||
| Florida | 924 | 1,165 | 0.10 | 0.12 | 2.42 | 2.69 | (0.37) | (0.71) | |||||||||||||||||||||||||||||||||||||||
| Pennsylvania | 673 | 832 | 0.07 | 0.09 | 2.70 | 2.76 | (0.01) | (0.17) | |||||||||||||||||||||||||||||||||||||||
| New York | 661 | 794 | 0.07 | 0.08 | 3.26 | 2.86 | 0.07 | (0.09) | |||||||||||||||||||||||||||||||||||||||
Other (1) |
4,598 | 5,586 | 0.49 | 0.58 | 2.05 | 2.05 | (0.38) | (0.53) | |||||||||||||||||||||||||||||||||||||||
| Total junior lien mortgage portfolio | $ | 11,071 | 13,310 | 1.18 | % | 1.38 | 2.16 | 2.27 | (0.23) | (0.36) | |||||||||||||||||||||||||||||||||||||
| December 31, 2023 | December 31, 2022 | |||||||||||||||||||||||||
| ($ in millions) | Outstanding balance |
% of total loans |
Outstanding balance |
% of total loans |
||||||||||||||||||||||
| Credit card | $ | 52,230 | 5.58 | % | $ | 46,293 | 4.84 | % | ||||||||||||||||||
| Auto | 47,762 | 5.10 | 53,669 | 5.61 | ||||||||||||||||||||||
| Other consumer (1) | 28,539 | 3.05 | 29,276 | 3.06 | ||||||||||||||||||||||
| Total | $ | 128,531 | 13.73 | % | $ | 129,238 | 13.51 | % | ||||||||||||||||||
40 |
Wells Fargo & Company | |||||||
| ($ in millions) | Dec 31, 2023 | Dec 31, 2022 | ||||||||||||
| Nonaccrual loans: | ||||||||||||||
| Commercial and industrial | $ | 662 | 746 | |||||||||||
| Commercial real estate | 4,188 | 958 | ||||||||||||
| Lease financing | 64 | 119 | ||||||||||||
| Total commercial | 4,914 | 1,823 | ||||||||||||
| Residential mortgage (1) | 3,192 | 3,611 | ||||||||||||
| Auto | 115 | 153 | ||||||||||||
| Other consumer | 35 | 39 | ||||||||||||
| Total consumer | 3,342 | 3,803 | ||||||||||||
| Total nonaccrual loans | $ | 8,256 | 5,626 | |||||||||||
| As a percentage of total loans | 0.88 | % | 0.59 | |||||||||||
| Foreclosed assets: | ||||||||||||||
| Government insured/guaranteed (2) | $ | 12 | 22 | |||||||||||
Non-government insured/guaranteed |
175 | 115 | ||||||||||||
Total foreclosed assets |
187 | 137 | ||||||||||||
| Total nonperforming assets | $ | 8,443 | 5,763 | |||||||||||
| As a percentage of total loans | 0.90 | % | 0.60 | |||||||||||
| Wells Fargo & Company | 41 |
|||||||
| Year ended December 31, | |||||||||||
| (in millions) | 2023 | 2022 | |||||||||
| Commercial nonaccrual loans | |||||||||||
| Balance, beginning of period | $ | 1,823 | 2,376 | ||||||||
| Inflows | 6,524 | 1,391 | |||||||||
| Outflows: | |||||||||||
| Returned to accruing | (474) | (451) | |||||||||
| Foreclosures | (70) | (20) | |||||||||
| Charge-offs | (1,054) | (247) | |||||||||
| Payments, sales and other | (1,835) | (1,226) | |||||||||
| Total outflows | (3,433) | (1,944) | |||||||||
| Balance, end of period | 4,914 | 1,823 | |||||||||
| Consumer nonaccrual loans | |||||||||||
| Balance, beginning of period | 3,803 | 4,836 | |||||||||
| Inflows | 1,314 | 1,728 | |||||||||
| Outflows: | |||||||||||
| Returned to accruing | (737) | (1,599) | |||||||||
| Foreclosures | (101) | (85) | |||||||||
| Charge-offs | (167) | (245) | |||||||||
| Payments, sales and other | (770) | (832) | |||||||||
| Total outflows | (1,775) | (2,761) | |||||||||
| Balance, end of period | 3,342 | 3,803 | |||||||||
| Total nonaccrual loans | $ | 8,256 | 5,626 | ||||||||
| (in millions) | December 31, | ||||||||||
| 2023 | 2022 | ||||||||||
| Summary by loan segment | |||||||||||
| Government insured/guaranteed | $ | 12 | 22 | ||||||||
| Commercial | 135 | 65 | |||||||||
| Consumer | 40 | 50 | |||||||||
Total foreclosed assets |
$ | 187 | 137 | ||||||||
| (in millions) | Year ended December 31, | ||||||||||
| 2023 | 2022 | ||||||||||
| Analysis of changes in foreclosed assets | |||||||||||
| Balance, beginning of period | $ | 137 | 112 | ||||||||
Net change in government insured/guaranteed (1) |
(10) | 6 | |||||||||
Additions to foreclosed assets (2) |
576 | 420 | |||||||||
| Reductions from sales and write-downs | (516) | (401) | |||||||||
| Balance, end of period | $ | 187 | 137 | ||||||||
42 |
Wells Fargo & Company | |||||||
| Quarter ended December 31, | Year ended December 31, | |||||||||||||||||||||||||||||||||||||||||||||||||
| 2023 | 2022 | 2023 | 2022 | |||||||||||||||||||||||||||||||||||||||||||||||
| ($ in millions) | Net loan charge- offs |
% of avg. loans (1) |
Net loan charge- offs |
% of avg. loans (1) |
Net loan charge- offs |
% of
avg.
loans
|
Net loan charge- offs |
% of
avg.
loans
|
||||||||||||||||||||||||||||||||||||||||||
| Commercial and industrial | $ | 90 | 0.09 | % | $ | 66 | 0.07 | % | $ | 345 | 0.09 | % | $ | 83 | 0.02 | % | ||||||||||||||||||||||||||||||||||
| Commercial real estate | 377 | 0.99 | 10 | 0.03 | 566 | 0.37 | (11) | (0.01) | ||||||||||||||||||||||||||||||||||||||||||
| Lease financing | 5 | 0.14 | 3 | 0.06 | 12 | 0.08 | 7 | 0.04 | ||||||||||||||||||||||||||||||||||||||||||
| Total commercial | 472 | 0.34 | 79 | 0.06 | 923 | 0.17 | 79 | 0.01 | ||||||||||||||||||||||||||||||||||||||||||
| Residential mortgage | 3 | — | (12) | (0.02) | (24) | (0.01) | (63) | (0.02) | ||||||||||||||||||||||||||||||||||||||||||
| Credit card | 520 | 4.02 | 274 | 2.42 | 1,680 | 3.49 | 851 | 2.06 | ||||||||||||||||||||||||||||||||||||||||||
| Auto | 130 | 1.06 | 137 | 1.00 | 478 | 0.93 | 422 | 0.76 | ||||||||||||||||||||||||||||||||||||||||||
| Other consumer | 127 | 1.79 | 82 | 1.13 | 413 | 1.47 | 319 | 1.11 | ||||||||||||||||||||||||||||||||||||||||||
| Total consumer | 780 | 0.79 | 481 | 0.48 | 2,547 | 0.65 | 1,529 | 0.39 | ||||||||||||||||||||||||||||||||||||||||||
| Total | $ | 1,252 | 0.53 | % | $ | 560 | 0.23 | % | $ | 3,470 | 0.37 | % | $ | 1,608 | 0.17 | % | ||||||||||||||||||||||||||||||||||
| Wells Fargo & Company | 43 |
|||||||
| Dec 31, 2023 | Dec 31, 2022 | ||||||||||||||||||||||||||||||||||
| ($ in millions) | ACL | ACL as % of loan class |
Loans as % of total loans |
ACL | ACL as % of loan class |
Loans as % of total loans |
|||||||||||||||||||||||||||||
| Commercial and industrial | $ | 4,272 | 1.12 | % | 40 | $ | 4,507 | 1.17 | % | 40 | |||||||||||||||||||||||||
| Commercial real estate | 3,939 | 2.62 | 16 | 2,231 | 1.43 | 16 | |||||||||||||||||||||||||||||
| Lease financing | 201 | 1.22 | 2 | 218 | 1.46 | 2 | |||||||||||||||||||||||||||||
| Total commercial | 8,412 | 1.54 | 58 | 6,956 | 1.25 | 58 | |||||||||||||||||||||||||||||
| Residential mortgage (1) | 652 | 0.25 | 28 | 1,096 | 0.41 | 28 | |||||||||||||||||||||||||||||
| Credit card | 4,223 | 8.09 | 6 | 3,567 | 7.71 | 5 | |||||||||||||||||||||||||||||
| Auto | 1,042 | 2.18 | 5 | 1,380 | 2.57 | 6 | |||||||||||||||||||||||||||||
| Other consumer | 759 | 2.66 | 3 | 610 | 2.08 | 3 | |||||||||||||||||||||||||||||
| Total consumer | 6,676 | 1.72 | 42 | 6,653 | 1.67 | 42 | |||||||||||||||||||||||||||||
| Total | $ | 15,088 | 1.61 | % | 100 | $ | 13,609 | 1.42 | % | 100 | |||||||||||||||||||||||||
| Components: | |||||||||||||||||||||||||||||||||||
Allowance for loan losses |
$ | 14,606 | 12,985 | ||||||||||||||||||||||||||||||||
Allowance for unfunded credit commitments |
482 | 624 | |||||||||||||||||||||||||||||||||
Allowance for credit losses |
$ | 15,088 | 13,609 | ||||||||||||||||||||||||||||||||
| Ratio of allowance for loan losses to total net loan charge-offs | 4.21x | 8.08 | |||||||||||||||||||||||||||||||||
| Ratio of allowance for loan losses to total nonaccrual loans | 1.77 | 2.31 | |||||||||||||||||||||||||||||||||
Allowance for loan losses as a percentage of total loans |
1.56 | % | 1.36 | ||||||||||||||||||||||||||||||||
| 2Q 2024 | 4Q 2024 | 2Q 2025 | |||||||||||||||
| Weighted blend of economic scenarios: | |||||||||||||||||
| U.S. unemployment rate (1): | |||||||||||||||||
| December 31, 2023 | 4.4 | % | 5.3 | 5.9 | |||||||||||||
| September 30, 2023 | 4.6 | 5.6 | 6.0 | ||||||||||||||
| U.S. real GDP (2): | |||||||||||||||||
| December 31, 2023 | (1.2) | (0.5) | 0.8 | ||||||||||||||
| September 30, 2023 | (1.5) | 0.3 | 1.6 | ||||||||||||||
| Home price index (3): | |||||||||||||||||
| December 31, 2023 | (2.3) | (6.7) | (6.6) | ||||||||||||||
| September 30, 2023 | (6.1) | (6.8) | (5.8) | ||||||||||||||
| Commercial real estate asset prices (3): | |||||||||||||||||
| December 31, 2023 | (6.6) | (14.0) | (10.4) | ||||||||||||||
| September 30, 2023 | (13.8) | (10.3) | (4.5) | ||||||||||||||
44 |
Wells Fargo & Company | |||||||
| Wells Fargo & Company | 45 |
|||||||
| ($ in billions) | Dec 31, 2023 | Dec 31, 2022 | |||||||||
| Parallel shift: | |||||||||||
| +100 bps shift in interest rates | $ | 1.8 | 2.3 | ||||||||
| -100 bps shift in interest rates | (2.0) | (1.7) | |||||||||
| Steeper yield curve: | |||||||||||
| +100 bps shift in long-term interest rates | 1.1 | 0.8 | |||||||||
| -100 bps shift in short-term interest rates | (1.0) | (1.0) | |||||||||
| Flatter yield curve: | |||||||||||
| +100 bps shift in short-term interest rates | 0.7 | 1.5 | |||||||||
| -100 bps shift in long-term interest rates | (1.1) | (0.7) | |||||||||
46 |
Wells Fargo & Company | |||||||
| Wells Fargo & Company | 47 |
|||||||
| Year ended December 31, | |||||||||||||||||||||||||||||||||||||||||||||||
| 2023 | 2022 | ||||||||||||||||||||||||||||||||||||||||||||||
| (in millions) | Period end |
Average | Low | High | Period end |
Average | Low | High | |||||||||||||||||||||||||||||||||||||||
Company Trading General VaR Risk Categories |
|||||||||||||||||||||||||||||||||||||||||||||||
| Credit | $ | 30 | 35 | 20 | 52 | 29 | 32 | 19 | 85 | ||||||||||||||||||||||||||||||||||||||
| Interest rate | 16 | 33 | 9 | 65 | 25 | 25 | 9 | 88 | |||||||||||||||||||||||||||||||||||||||
| Equity | 23 | 21 | 13 | 31 | 27 | 23 | 13 | 38 | |||||||||||||||||||||||||||||||||||||||
| Commodity | 3 | 4 | 2 | 8 | 4 | 6 | 2 | 20 | |||||||||||||||||||||||||||||||||||||||
| Foreign exchange | 1 | 1 | 0 | 4 | 1 | 1 | 0 | 2 | |||||||||||||||||||||||||||||||||||||||
| Diversification benefit (1) | (36) | (59) | (47) | (52) | |||||||||||||||||||||||||||||||||||||||||||
Company Trading General VaR |
$ | 37 | 35 | 39 | 35 | ||||||||||||||||||||||||||||||||||||||||||
48 |
Wells Fargo & Company | |||||||
| Wells Fargo & Company | 49 |
|||||||
| Average for quarter ended | |||||||||||||||||
| (in millions, except ratio) | Dec 31, 2023 | Sep 30, 2023 | Dec 31, 2022 | ||||||||||||||
| HQLA (1): | |||||||||||||||||
| Eligible cash | $ | 187,133 | 154,258 | 123,446 | |||||||||||||
| Eligible securities (2) | 162,930 | 191,606 | 231,337 | ||||||||||||||
| Total HQLA | 350,063 | 345,864 | 354,783 | ||||||||||||||
| Projected net cash outflows (3) | 279,903 | 280,468 | 292,001 | ||||||||||||||
| LCR | 125 | % | 123 | 122 | |||||||||||||
| December 31, 2023 | December 31, 2022 | ||||||||||||||||||||||||||||||||||
| (in millions) | Total | Encumbered | Unencumbered | Total | Encumbered | Unencumbered | |||||||||||||||||||||||||||||
| Interest-earning deposits with banks (1) | $ | 203,026 | — | 203,026 | 124,561 | — | 124,561 | ||||||||||||||||||||||||||||
| Debt securities of U.S. Treasury and federal agencies | 47,754 | 9,351 | 38,403 | 59,570 | 12,080 | 47,490 | |||||||||||||||||||||||||||||
Federal agency mortgage-backed securities (2) |
237,966 | 28,471 | 209,495 | 230,881 | 34,151 | 196,730 | |||||||||||||||||||||||||||||
| Total | $ | 488,746 | 37,822 | 450,924 | 415,012 | 46,231 | 368,781 | ||||||||||||||||||||||||||||
50 |
Wells Fargo & Company | |||||||
(in millions) |
Dec 31, 2023 | Dec 31, 2022 | |||||||||
| Federal funds purchased and securities sold under agreements to repurchase | $ | 77,676 | 30,623 | ||||||||
| Other short-term borrowings (1) | 11,883 | 20,522 | |||||||||
Total |
$ | 89,559 | 51,145 | ||||||||
(in millions) |
December 31, 2023 | December 31, 2022 | |||||||||
| Wells Fargo & Company (Parent Only) | $ | 148,312 | 134,401 | ||||||||
| Wells Fargo Bank, N.A., and other bank entities (Bank) (1) | 58,466 | 39,189 | |||||||||
| Other consolidated subsidiaries | 810 | 1,280 | |||||||||
| Total | $ | 207,588 | 174,870 | ||||||||
| Wells Fargo & Company | Wells Fargo Bank, N.A. | ||||||||||||||||||||||||||||
| Senior debt |
Short-term
borrowings
|
Long-term
deposits
|
Short-term
borrowings
|
||||||||||||||||||||||||||
| Moody’s | A1 | P-1 | Aa1 | P-1 | |||||||||||||||||||||||||
| S&P Global Ratings | BBB+ | A-2 | A+ | A-1 | |||||||||||||||||||||||||
| Fitch Ratings | A+ | F1 | AA | F1+ | |||||||||||||||||||||||||
| DBRS Morningstar | AA (low) | R-1 (middle) | AA | R-1 (high) | |||||||||||||||||||||||||
| Wells Fargo & Company | 51 |
|||||||
| Capital Management | ||
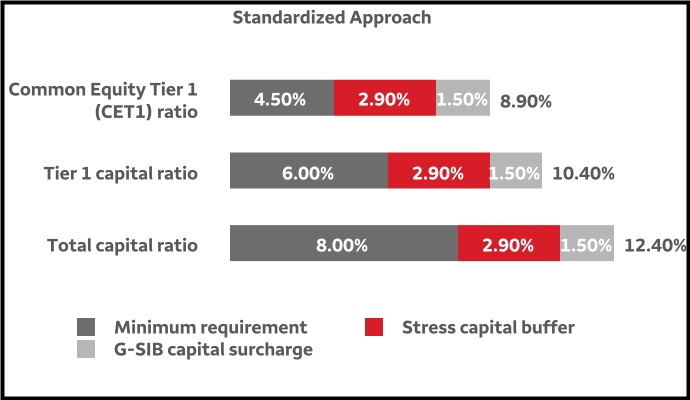
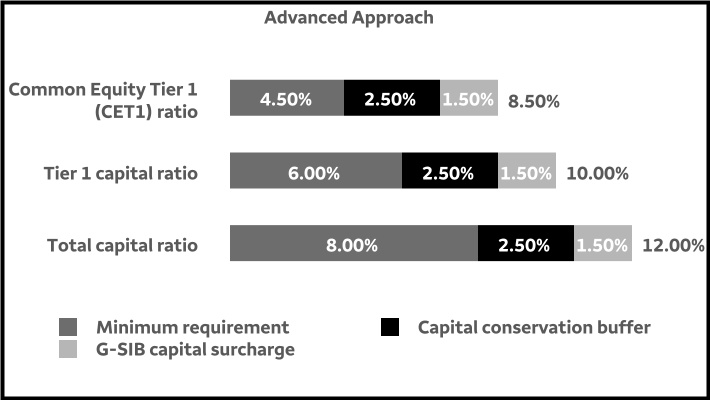
52 |
Wells Fargo & Company | |||||||
| Standardized Approach | Advanced Approach | |||||||||||||||||||||||||||||||||||||
| ($ in millions) | Required Capital Ratios (1) |
Dec 31, 2023 |
Dec 31, 2022 |
Required Capital Ratios (1) |
Dec 31, 2023 |
Dec 31, 2022 |
||||||||||||||||||||||||||||||||
| Common Equity Tier 1 | (A) | $ | 140,783 | 133,527 | 140,783 | 133,527 | ||||||||||||||||||||||||||||||||
| Tier 1 capital | (B) | 159,823 | 152,567 | 159,823 | 152,567 | |||||||||||||||||||||||||||||||||
| Total capital | (C) | 193,061 | 186,747 | 182,726 | 177,258 | |||||||||||||||||||||||||||||||||
| Risk-weighted assets | (D) | 1,231,668 | 1,259,889 | 1,114,281 | 1,112,307 | |||||||||||||||||||||||||||||||||
| Common Equity Tier 1 capital ratio | (A)/(D) | 8.90 | % | 11.43 | * | 10.60 | 8.50 | 12.63 | 12.00 | |||||||||||||||||||||||||||||
| Tier 1 capital ratio | (B)/(D) | 10.40 | 12.98 | * | 12.11 | 10.00 | 14.34 | 13.72 | ||||||||||||||||||||||||||||||
| Total capital ratio | (C)/(D) | 12.40 | 15.67 | * | 14.82 | 12.00 | 16.40 | 15.94 | ||||||||||||||||||||||||||||||
| Wells Fargo & Company | 53 |
|||||||
| (in millions) | Dec 31, 2023 |
Dec 31, 2022 |
||||||||||||
| Total equity (1) | $ | 187,443 | 182,213 | |||||||||||
| Effect of accounting policy change (1) | — | 338 | ||||||||||||
| Total equity (as reported) | 187,443 | 181,875 | ||||||||||||
| Adjustments: | ||||||||||||||
| Preferred stock | (19,448) | (19,448) | ||||||||||||
| Additional paid-in capital on preferred stock | 157 | 173 | ||||||||||||
| Noncontrolling interests | (1,708) | (1,986) | ||||||||||||
| Total common stockholders’ equity | $ | 166,444 | 160,614 | |||||||||||
| Adjustments: | ||||||||||||||
| Goodwill | (25,175) | (25,173) | ||||||||||||
| Certain identifiable intangible assets (other than MSRs) | (118) | (152) | ||||||||||||
Goodwill and other intangibles on investments in consolidated portfolio companies (included in other assets) (2) |
(878) | (2,427) | ||||||||||||
Applicable deferred taxes related to goodwill and other intangible assets (3) |
919 | 890 | ||||||||||||
CECL transition provision (4) |
120 | 180 | ||||||||||||
| Other | (529) | (405) | ||||||||||||
| Common Equity Tier 1 under the Standardized and Advanced Approaches | $ | 140,783 | 133,527 | |||||||||||
| Preferred stock | 19,448 | 19,448 | ||||||||||||
| Additional paid-in capital on preferred stock | (157) | (173) | ||||||||||||
| Other | (251) | (235) | ||||||||||||
| Total Tier 1 capital under the Standardized and Advanced Approaches | (A) | $ | 159,823 | 152,567 | ||||||||||
| Long-term debt and other instruments qualifying as Tier 2 | 19,020 | 20,503 | ||||||||||||
Qualifying allowance for credit losses (5) |
14,805 | 13,959 | ||||||||||||
| Other | (587) | (282) | ||||||||||||
| Total Tier 2 capital under the Standardized Approach | (B) | $ | 33,238 | 34,180 | ||||||||||
| Total qualifying capital under the Standardized Approach | (A)+(B) | $ | 193,061 | 186,747 | ||||||||||
| Long-term debt and other instruments qualifying as Tier 2 | 19,020 | 20,503 | ||||||||||||
Qualifying allowance for credit losses (5) |
4,470 | 4,470 | ||||||||||||
| Other | (587) | (282) | ||||||||||||
| Total Tier 2 capital under the Advanced Approach | (C) | $ | 22,903 | 24,691 | ||||||||||
| Total qualifying capital under the Advanced Approach | (A)+(C) | $ | 182,726 | 177,258 | ||||||||||
54 |
Wells Fargo & Company | |||||||
| Standardized Approach | Advanced Approach (1) | |||||||||||||||||||||||||||||||||||||
| (in millions) | Dec 31, 2023 |
Dec 31, 2022 |
$ Change 2023/ 2022 |
Dec 31, 2023 |
Dec 31, 2022 |
$ Change 2023/ 2022 |
||||||||||||||||||||||||||||||||
| Risk-weighted assets (RWAs): | ||||||||||||||||||||||||||||||||||||||
| Credit risk | $ | 1,182,805 | 1,218,006 | (35,201) | 756,905 | 757,436 | (531) | |||||||||||||||||||||||||||||||
| Market risk | 48,863 | 41,883 | 6,980 | 48,863 | 41,883 | 6,980 | ||||||||||||||||||||||||||||||||
| Operational risk | N/A |
N/A |
N/A |
308,513 | 312,988 | (4,475) | ||||||||||||||||||||||||||||||||
| Total RWAs | $ | 1,231,668 | 1,259,889 | (28,221) | 1,114,281 | 1,112,307 | 1,974 | |||||||||||||||||||||||||||||||
(in millions) |
||||||||
Common Equity Tier 1 at December 31, 2022 |
$ | 133,527 | ||||||
| Cumulative effect from change in accounting policy (1) | 323 | |||||||
| Net income applicable to common stock | 17,982 | |||||||
| Common stock dividends | (4,796) | |||||||
| Common stock issued, repurchased, and stock compensation-related items | (9,799) | |||||||
| Changes in accumulated other comprehensive income (loss) | 1,784 | |||||||
| Goodwill | (2) | |||||||
| Certain identifiable intangible assets (other than MSRs) | 34 | |||||||
Goodwill and other intangibles on investments in consolidated portfolio companies (included in other assets) (2) |
1,549 | |||||||
Applicable deferred taxes related to goodwill and other intangible assets (3) |
29 | |||||||
CECL transition provision (4) |
(60) | |||||||
Other (5) |
212 | |||||||
| Change in Common Equity Tier 1 | 7,256 | |||||||
Common Equity Tier 1 at December 31, 2023 |
$ | 140,783 | ||||||
| Wells Fargo & Company | 55 |
|||||||
| Balance at period-end | Average balance | ||||||||||||||||||||||||||||
Period ended |
Year ended | ||||||||||||||||||||||||||||
| (in millions, except ratios) | Dec 31, 2023 |
Dec 31, 2022 |
Dec 31, 2021 |
Dec 31, 2023 |
Dec 31, 2022 |
Dec 31, 2021 |
|||||||||||||||||||||||
| Total equity | $ | 187,443 | 182,213 | 189,889 | 184,860 | 183,167 | 190,502 | ||||||||||||||||||||||
| Adjustments: | |||||||||||||||||||||||||||||
| Preferred stock (1) | (19,448) | (19,448) | (20,057) | (19,698) | (19,930) | (21,151) | |||||||||||||||||||||||
| Additional paid-in capital on preferred stock (1) | 157 | 173 | 136 | 168 | 143 | 137 | |||||||||||||||||||||||
| Unearned ESOP shares (1) | — | — | 646 | — | 512 | 874 | |||||||||||||||||||||||
| Noncontrolling interests | (1,708) | (1,986) | (2,503) | (1,844) | (2,323) | (1,601) | |||||||||||||||||||||||
| Total common stockholders’ equity | (A) | 166,444 | 160,952 | 168,111 | 163,486 | 161,569 | 168,761 | ||||||||||||||||||||||
| Adjustments: | |||||||||||||||||||||||||||||
| Goodwill | (25,175) | (25,173) | (25,180) | (25,173) | (25,177) | (26,087) | |||||||||||||||||||||||
| Certain identifiable intangible assets (other than MSRs) | (118) | (152) | (225) | (136) | (190) | (294) | |||||||||||||||||||||||
Goodwill and other intangibles on investments in consolidated portfolio companies (included in other assets) (2) |
(878) | (2,427) | (2,437) | (2,083) | (2,359) | (2,226) | |||||||||||||||||||||||
| Applicable deferred taxes related to goodwill and other intangible assets (3) | 920 | 890 | 765 | 906 | 864 | 867 | |||||||||||||||||||||||
| Tangible common equity | (B) | $ | 141,193 | 134,090 | 141,034 | 137,000 | 134,707 | 141,021 | |||||||||||||||||||||
| Common shares outstanding | (C) | 3,598.9 | 3,833.8 | 3,885.8 | N/A | N/A | N/A | ||||||||||||||||||||||
| Net income applicable to common stock | (D) | N/A | N/A | N/A | $ | 17,982 | 12,562 | 20,818 | |||||||||||||||||||||
| Book value per common share | (A)/(C) | $ | 46.25 | 41.98 | 43.26 | N/A | N/A | N/A | |||||||||||||||||||||
| Tangible book value per common share | (B)/(C) | 39.23 | 34.98 | 36.29 | N/A | N/A | N/A | ||||||||||||||||||||||
| Return on average common stockholders’ equity (ROE) | (D)/(A) | N/A | N/A | N/A | 11.00 | % | 7.78 | 12.34 | |||||||||||||||||||||
| Return on average tangible common equity (ROTCE) | (D)/(B) | N/A | N/A | N/A | 13.13 | 9.33 | 14.76 | ||||||||||||||||||||||
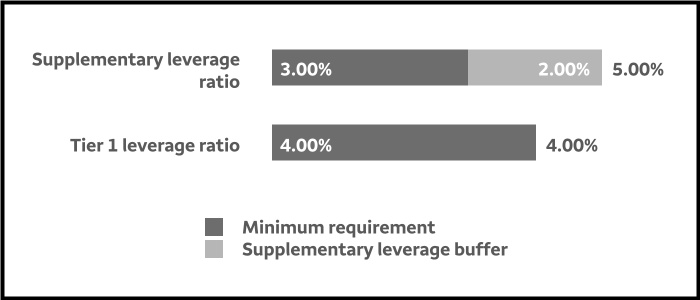
56 |
Wells Fargo & Company | |||||||
| ($ in millions) | Quarter ended December 31, 2023 | |||||||
| Tier 1 capital | (A) | $ | 159,823 | |||||
| Total average assets | 1,907,654 | |||||||
| Less: Goodwill and other permitted Tier 1 capital deductions (net of deferred tax liabilities) | 26,673 | |||||||
| Total adjusted average assets | 1,880,981 | |||||||
| Plus adjustments for off-balance sheet exposures: | ||||||||
| Derivatives (1) | 56,377 | |||||||
| Repo-style transactions (2) | 4,264 | |||||||
| Other (3) | 312,311 | |||||||
| Total off-balance sheet exposures | 372,952 | |||||||
| Total leverage exposure | (B) | $ | 2,253,933 | |||||
| Supplementary leverage ratio | (A)/(B) | 7.09 | % | |||||
| Tier 1 leverage ratio (4) | 8.50 | % | ||||||
|
TLAC requirement
Greater of:
| ||||||||||||||
| 18.00% of RWAs | 7.50% of total leverage exposure (the denominator of the SLR calculation) |
|||||||||||||
| + | + | |||||||||||||
| TLAC buffer (equal to 2.50% of RWAs + method one G-SIB capital surcharge + any countercyclical buffer) | External TLAC leverage buffer (equal to 2.00% of total leverage exposure) |
|||||||||||||
|
Minimum amount of eligible unsecured long-term debt
Greater of:
| ||||||||||||||
| 6.00% of RWAs | 4.50% of total leverage exposure | |||||||||||||
| + | ||||||||||||||
| Greater of method one and method two G-SIB capital surcharge | ||||||||||||||
| December 31, 2023 | ||||||||||||||||||||||||||
| ($ in millions) | TLAC (1) | Regulatory Minimum (2) | Eligible Unsecured Long-term Debt | Regulatory Minimum | ||||||||||||||||||||||
| Total eligible amount | $ | 308,489 | 140,760 | |||||||||||||||||||||||
| Percentage of RWAs (3) | 25.05 | % | 21.50 | 11.43 | 7.50 | |||||||||||||||||||||
| Percentage of total leverage exposure | 13.69 | 9.50 | 6.25 | 4.50 | ||||||||||||||||||||||
| Wells Fargo & Company | 57 |
|||||||
| Regulatory Matters | ||
58 |
Wells Fargo & Company | |||||||
| Wells Fargo & Company | 59 |
|||||||
60 |
Wells Fargo & Company | |||||||
| Critical Accounting Policies | ||
| Wells Fargo & Company | 61 |
|||||||
62 |
Wells Fargo & Company | |||||||
| December 31, 2023 | December 31, 2022 | ||||||||||||||||||||||
| ($ in billions) | Total balance | Level 3 (1) | Total balance | Level 3 (1) | |||||||||||||||||||
|
Assets recorded at fair
value on a recurring basis
|
$ | 276.2 | 9.5 | 264.4 | 11.5 | ||||||||||||||||||
|
As a percentage
of total assets
|
14 | % | * | 14 | * | ||||||||||||||||||
| Liabilities recorded at fair value on a recurring basis | $ | 47.7 | 6.2 | 41.9 | 4.9 | ||||||||||||||||||
|
As a percentage of
total liabilities
|
3 | % | * | 2 | * | ||||||||||||||||||
| Wells Fargo & Company | 63 |
|||||||
64 |
Wells Fargo & Company | |||||||
| Current Accounting Developments | ||
| Description and Effective Date | Financial statement impact | |||||||
|
Accounting Standards Update (ASU) 2023-02 – Investments – Equity Method and Joint Ventures (Topic 323):
Accounting for Investments in Tax Credit Structures Using the Proportional Amortization Method
| ||||||||
The Update, effective January 1, 2024, expands the use of the proportional amortization method of accounting for tax credit investments. Upon adoption, the Update permits entities to elect to account for equity investments that generate income tax credits and benefits using the proportional amortization method if certain eligibility criteria are met. |
We adopted the Update on January 1, 2024, on a modified retrospective basis with a cumulative effect adjustment to retained earnings. Upon adoption, we elected to account for eligible investments in our renewable energy tax credit portfolio using the proportional amortization method. These investments were previously accounted for using the equity method. We also elected to continue use of the proportional amortization method to account for our low-income housing tax credit investments. Under the proportional amortization method, the cost of a tax credit investment is amortized in proportion to the income tax credits and benefits received by the investor, with both amortization and the related income tax credits and benefits recorded on a net basis within income tax expense.
We recorded the impact of this accounting change to the opening balance sheet as of January 1, 2024, as an increase to total assets and total liabilities of approximately $2 billion. The adoption impact on retained earnings was insignificant. Prior periods were not impacted.
|
|||||||
ASU 2023-07 – Segment Reporting (Topic 280): Improvements to Reportable Segment Disclosures | ||||||||
The Update, effective December 31, 2024 (with early adoption permitted), enhances reportable segment disclosure requirements, primarily through enhanced disclosures related to significant segment expenses and additional interim disclosure requirements. |
The Update impacts disclosure only, and therefore does not have an impact on our consolidated financial statements. We are currently evaluating the impact of the Update to our operating segment disclosures. The following aspects of the Update may result in disclosure changes:
•Requirement to disclose significant segment expenses by reportable segment if they are regularly provided to the chief operating decision maker (CODM) and included in the reported measure of segment profit or loss.
•Requirement to disclose an amount for “other segment items” by reportable segment and provide a description of its composition; other segment items is measured as the difference between reported segment revenues less the significant segment expenses disclosed in accordance with the principle described above and reported segment profit or loss.
•Requirement to disclose the CODM’s title and position and explain how the CODM uses the reported segment profit or loss measure in assessing segment performance and deciding how to allocate resources.
|
|||||||
ASU 2023-09 - Income Taxes (Topic 740): Improvements to Income Tax Disclosures | ||||||||
The Update, effective January 1, 2025 (with early adoption permitted), enhances annual income tax disclosures primarily to further disaggregate existing disclosures related to the effective income tax rate reconciliation and income taxes paid. |
The impact of the Update is limited to our annual income tax disclosures. We are currently evaluating the impact of the Update to our income tax disclosures. Upon adoption, those disclosures may change as follows:
•For the tabular effective income tax rate reconciliation, alignment to specific categories (where applicable) and further disaggregation of certain categories (where applicable) by nature and/or jurisdiction if the reconciling item is 5% or more of the statutory tax expense.
•Description of states and local jurisdictions that contribute the majority of the effect of the state and local income tax category of the effective income tax rate reconciliation.
•Disaggregate the amount of income taxes paid (net of refunds) by federal, state, and non-U.S. taxes and further disaggregate by individual jurisdictions where income taxes paid (net of refunds) is 5% or more of total income taxes paid (net of refunds).
•Disaggregate net income (or loss) before income tax expense (or benefit) between domestic and non-U.S.
|
|||||||
| Wells Fargo & Company | 65 |
|||||||
Forward-Looking Statements | ||
66 |
Wells Fargo & Company | |||||||
1 We do not control this website. Wells Fargo has provided this link for your convenience, but does not endorse and is not responsible for the content, links, privacy policy, or security policy of this website. | ||
| Wells Fargo & Company | 67 |
|||||||
Risk Factors | ||
68 |
Wells Fargo & Company | |||||||
| Wells Fargo & Company | 69 |
|||||||
70 |
Wells Fargo & Company | |||||||
| Wells Fargo & Company | 71 |
|||||||
72 |
Wells Fargo & Company | |||||||
| Wells Fargo & Company | 73 |
|||||||
74 |
Wells Fargo & Company | |||||||
| Wells Fargo & Company | 75 |
|||||||
76 |
Wells Fargo & Company | |||||||
| Wells Fargo & Company | 77 |
|||||||
78 |
Wells Fargo & Company | |||||||
| Wells Fargo & Company | 79 |
|||||||
80 |
Wells Fargo & Company | |||||||
| Wells Fargo & Company | 81 |
|||||||
| Controls and Procedures | ||
Disclosure Controls and Procedures | ||
| Internal Control Over Financial Reporting | ||
82 |
Wells Fargo & Company | |||||||

| Wells Fargo & Company | 83 |
|||||||
| Wells Fargo & Company and Subsidiaries | |||||||||||||||||
| Consolidated Statement of Income | |||||||||||||||||
| Year ended December 31, | |||||||||||||||||
| (in millions, except per share amounts) | 2023 | 2022 | 2021 | ||||||||||||||
| Interest income | |||||||||||||||||
| Debt securities | $ | 16,108 | 11,781 | 9,253 | |||||||||||||
| Loans held for sale | 363 | 513 | 865 | ||||||||||||||
| Loans | 57,155 | 37,715 | 28,634 | ||||||||||||||
| Equity securities | 682 | 707 | 608 | ||||||||||||||
| Other interest income | 10,810 | 3,308 | 334 | ||||||||||||||
| Total interest income | 85,118 | 54,024 | 39,694 | ||||||||||||||
| Interest expense | |||||||||||||||||
| Deposits | 16,503 | 2,349 | 388 | ||||||||||||||
| Short-term borrowings | 3,848 | 582 | (41) | ||||||||||||||
| Long-term debt | 11,572 | 5,505 | 3,173 | ||||||||||||||
| Other interest expense | 820 | 638 | 395 | ||||||||||||||
| Total interest expense | 32,743 | 9,074 | 3,915 | ||||||||||||||
| Net interest income | 52,375 | 44,950 | 35,779 | ||||||||||||||
| Noninterest income | |||||||||||||||||
| Deposit and lending-related fees | 6,140 | 6,713 | 6,920 | ||||||||||||||
| Investment advisory and other asset-based fees | 8,670 | 9,004 | 11,011 | ||||||||||||||
| Commissions and brokerage services fees | 2,375 | 2,242 | 2,299 | ||||||||||||||
| Investment banking fees | 1,649 | 1,439 | 2,354 | ||||||||||||||
| Card fees | 4,256 | 4,355 | 4,175 | ||||||||||||||
| Mortgage banking | 829 | 1,383 | 4,956 | ||||||||||||||
Net gains from trading and securities |
4,368 | 1,461 | 7,264 | ||||||||||||||
| Other (1) | 1,935 | 2,821 | 4,408 | ||||||||||||||
| Total noninterest income | 30,222 | 29,418 | 43,387 | ||||||||||||||
| Total revenue | 82,597 | 74,368 | 79,166 | ||||||||||||||
| Provision for credit losses | 5,399 | 1,534 | (4,155) | ||||||||||||||
| Noninterest expense | |||||||||||||||||
| Personnel | 35,829 | 34,340 | 35,541 | ||||||||||||||
| Technology, telecommunications and equipment | 3,920 | 3,375 | 3,227 | ||||||||||||||
| Occupancy | 2,884 | 2,881 | 2,968 | ||||||||||||||
| Operating losses | 1,183 | 6,984 | 1,568 | ||||||||||||||
| Professional and outside services | 5,085 | 5,188 | 5,723 | ||||||||||||||
| Advertising and promotion | 812 | 505 | 600 | ||||||||||||||
| Other (1) | 5,849 | 3,932 | 4,131 | ||||||||||||||
| Total noninterest expense | 55,562 | 57,205 | 53,758 | ||||||||||||||
| Income before income tax expense | 21,636 | 15,629 | 29,563 | ||||||||||||||
| Income tax expense (1) | 2,607 | 2,251 | 5,764 | ||||||||||||||
| Net income before noncontrolling interests | 19,029 | 13,378 | 23,799 | ||||||||||||||
Less: Net income (loss) from noncontrolling interests |
(113) | (299) | 1,690 | ||||||||||||||
| Wells Fargo net income (1) | $ | 19,142 | 13,677 | 22,109 | |||||||||||||
| Less: Preferred stock dividends and other | 1,160 | 1,115 | 1,291 | ||||||||||||||
| Wells Fargo net income applicable to common stock | $ | 17,982 | 12,562 | 20,818 | |||||||||||||
| Per share information | |||||||||||||||||
| Earnings per common share | $ | 4.88 | 3.30 | 5.13 | |||||||||||||
| Diluted earnings per common share | 4.83 | 3.27 | 5.08 | ||||||||||||||
| Average common shares outstanding | 3,688.3 | 3,805.2 | 4,061.9 | ||||||||||||||
| Diluted average common shares outstanding | 3,720.4 | 3,837.0 | 4,096.2 | ||||||||||||||
84 |
Wells Fargo & Company | |||||||
| Wells Fargo & Company and Subsidiaries | |||||||||||||||||
| Consolidated Statement of Comprehensive Income | |||||||||||||||||
| Year ended December 31, | |||||||||||||||||
| (in millions) | 2023 | 2022 | 2021 | ||||||||||||||
| Net income before noncontrolling interests (1) | $ | 19,029 | 13,378 | 23,799 | |||||||||||||
| Other comprehensive income (loss), after tax: | |||||||||||||||||
| Net change in debt securities | 1,271 | (10,500) | (2,374) | ||||||||||||||
| Net change in derivatives and hedging activities | 411 | (1,090) | 159 | ||||||||||||||
| Defined benefit plans adjustments | 68 | 154 | 349 | ||||||||||||||
| Other (1) | 34 | (178) | (94) | ||||||||||||||
Other comprehensive income (loss), after tax |
1,784 | (11,614) | (1,960) | ||||||||||||||
Total comprehensive income before noncontrolling interests |
20,813 | 1,764 | 21,839 | ||||||||||||||
| Less: Other comprehensive income from noncontrolling interests | 2 | 2 | — | ||||||||||||||
Less: Net income (loss) from noncontrolling interests |
(113) | (299) | 1,690 | ||||||||||||||
Wells Fargo comprehensive income |
$ | 20,924 | 2,061 | 20,149 | |||||||||||||
| Wells Fargo & Company | 85 |
|||||||
| Wells Fargo & Company and Subsidiaries | |||||||||||
Consolidated Balance Sheet | |||||||||||
(in millions, except shares) |
Dec 31, 2023 |
Dec 31, 2022 |
|||||||||
| Assets | |||||||||||
| Cash and due from banks | $ | 33,026 | 34,596 | ||||||||
| Interest-earning deposits with banks | 204,193 | 124,561 | |||||||||
Federal funds sold and securities purchased under resale agreements |
80,456 | 68,036 | |||||||||
| Debt securities: | |||||||||||
Trading, at fair value (includes assets pledged as collateral of $62,537 and $26,932) |
97,302 | 86,155 | |||||||||
Available-for-sale, at fair value (amortized cost of $137,155 and $121,725, and includes assets pledged as collateral of $5,055 and $0) |
130,448 | 113,594 | |||||||||
Held-to-maturity, at amortized cost (fair value $227,316 and $255,521) |
262,708 | 297,059 | |||||||||
Loans held for sale (includes $2,892 and $4,220 carried at fair value) |
4,936 | 7,104 | |||||||||
| Loans | 936,682 | 955,871 | |||||||||
| Allowance for loan losses | (14,606) | (12,985) | |||||||||
| Net loans | 922,076 | 942,886 | |||||||||
Mortgage servicing rights (includes $7,468 and $9,310 carried at fair value) |
8,508 | 10,480 | |||||||||
| Premises and equipment, net | 9,266 | 8,350 | |||||||||
| Goodwill | 25,175 | 25,173 | |||||||||
| Derivative assets | 18,223 | 22,774 | |||||||||
Equity securities (includes $19,841 and $28,383 carried at fair value; and assets pledged as collateral of $2,683 and $747) |
57,336 | 64,414 | |||||||||
| Other assets (1) | 78,815 | 75,838 | |||||||||
| Total assets (2) | $ | 1,932,468 | 1,881,020 | ||||||||
| Liabilities | |||||||||||
Noninterest-bearing deposits |
$ | 360,279 | 458,010 | ||||||||
Interest-bearing deposits (includes $1,297 and $0 carried at fair value) |
997,894 | 925,975 | |||||||||
| Total deposits | 1,358,173 | 1,383,985 | |||||||||
Short-term borrowings (includes $219 and $181 carried at fair value) |
89,559 | 51,145 | |||||||||
| Derivative liabilities (1) | 18,495 | 20,067 | |||||||||
Accrued expenses and other liabilities (includes $25,335 and $20,290 carried at fair value) (1) |
71,210 | 68,740 | |||||||||
Long-term debt (includes $2,308 and $1,346 carried at fair value) |
207,588 | 174,870 | |||||||||
| Total liabilities (3) | 1,745,025 | 1,698,807 | |||||||||
| Equity | |||||||||||
| Wells Fargo stockholders’ equity: | |||||||||||
Preferred stock – aggregate liquidation preference of $20,216 and $20,216 |
19,448 | 19,448 | |||||||||
Common stock – $1-2/3 par value, authorized 9,000,000,000 shares; issued 5,481,811,474 shares |
9,136 | 9,136 | |||||||||
| Additional paid-in capital | 60,555 | 60,319 | |||||||||
| Retained earnings (1) | 201,136 | 187,968 | |||||||||
| Accumulated other comprehensive loss (1) | (11,580) | (13,362) | |||||||||
Treasury stock, at cost – 1,882,948,892 shares and 1,648,007,022 shares |
(92,960) | (82,853) | |||||||||
| Unearned ESOP shares | — | (429) | |||||||||
| Total Wells Fargo stockholders’ equity | 185,735 | 180,227 | |||||||||
| Noncontrolling interests | 1,708 | 1,986 | |||||||||
| Total equity | 187,443 | 182,213 | |||||||||
| Total liabilities and equity | $ | 1,932,468 | 1,881,020 | ||||||||
86 |
Wells Fargo & Company | |||||||
| Wells Fargo & Company and Subsidiaries | |||||||||||||||||||||||||||||||||||||||||||||||||||||||||||||||||
| Consolidated Statement of Changes in Equity | |||||||||||||||||||||||||||||||||||||||||||||||||||||||||||||||||
Wells Fargo stockholders’ equity |
|||||||||||||||||||||||||||||||||||||||||||||||||||||||||||||||||
| Preferred stock | Common stock | ||||||||||||||||||||||||||||||||||||||||||||||||||||||||||||||||
| ($ and shares in millions) | Shares | Amount | Shares | Amount | Additional paid-in capital |
Retained earnings |
Accumulated other comprehensive income (loss) |
Treasury stock |
Unearned ESOP shares |
Noncontrolling interests |
Total equity |
||||||||||||||||||||||||||||||||||||||||||||||||||||||
Balance December 31, 2020 |
5.5 | $ | 21,136 | 4,144.0 | $ | 9,136 | 60,197 | 162,683 | 194 | (67,791) | (875) | 1,032 | 185,712 | ||||||||||||||||||||||||||||||||||||||||||||||||||||
Cumulative effect from change in accounting policy (1) |
(738) | 20 | (718) | ||||||||||||||||||||||||||||||||||||||||||||||||||||||||||||||
| Balance January 1, 2021 | 5.5 | 21,136 | 4,144.0 | 9,136 | 60,197 | 161,945 | 214 | (67,791) | (875) | 1,032 | 184,994 | ||||||||||||||||||||||||||||||||||||||||||||||||||||||
Net income (1) |
22,109 | 1,690 | 23,799 | ||||||||||||||||||||||||||||||||||||||||||||||||||||||||||||||
|
Other comprehensive loss,
net of tax (1)
|
(1,960) | — | (1,960) | ||||||||||||||||||||||||||||||||||||||||||||||||||||||||||||||
| Noncontrolling interests | (219) | (219) | |||||||||||||||||||||||||||||||||||||||||||||||||||||||||||||||
| Common stock issued | 43.8 | (7) | (162) | 2,265 | 2,096 | ||||||||||||||||||||||||||||||||||||||||||||||||||||||||||||
| Common stock repurchased | (306.4) | (14,464) | (14,464) | ||||||||||||||||||||||||||||||||||||||||||||||||||||||||||||||
| Preferred stock issued | 0.2 | 5,810 | (54) | 5,756 | |||||||||||||||||||||||||||||||||||||||||||||||||||||||||||||
Preferred stock redeemed (2) |
(0.2) | (6,676) | 86 | (86) | — | (6,676) | |||||||||||||||||||||||||||||||||||||||||||||||||||||||||||
| Preferred stock issued to ESOP | — | — | — | — | — | — | — | ||||||||||||||||||||||||||||||||||||||||||||||||||||||||||
| Preferred stock released by ESOP | (16) | 229 | 213 | ||||||||||||||||||||||||||||||||||||||||||||||||||||||||||||||
|
Preferred stock converted to
common shares
|
(0.2) | (213) | 4.4 | (8) | 221 | — | |||||||||||||||||||||||||||||||||||||||||||||||||||||||||||
| Common stock dividends | 29 | (2,455) | (2,426) | ||||||||||||||||||||||||||||||||||||||||||||||||||||||||||||||
| Preferred stock dividends | (1,205) | (1,205) | |||||||||||||||||||||||||||||||||||||||||||||||||||||||||||||||
| Stock-based compensation | 1,043 | 1,043 | |||||||||||||||||||||||||||||||||||||||||||||||||||||||||||||||
| Net change in deferred compensation and related plans | (1,074) | 12 | (1,062) | ||||||||||||||||||||||||||||||||||||||||||||||||||||||||||||||
| Net change | (0.2) | (1,079) | (258.2) | — | (1) | 18,201 | (1,960) | (11,966) | 229 | 1,471 | 4,895 | ||||||||||||||||||||||||||||||||||||||||||||||||||||||
Balance December 31, 2021 |
5.3 | $ | 20,057 | 3,885.8 | $ | 9,136 | 60,196 | 180,146 | (1,746) | (79,757) | (646) | 2,503 | 189,889 | ||||||||||||||||||||||||||||||||||||||||||||||||||||
Net income (loss) (1) |
13,677 | (299) | 13,378 | ||||||||||||||||||||||||||||||||||||||||||||||||||||||||||||||
|
Other comprehensive income (loss),
net of tax (1)
|
(11,616) | 2 | (11,614) | ||||||||||||||||||||||||||||||||||||||||||||||||||||||||||||||
| Noncontrolling interests | (220) | (220) | |||||||||||||||||||||||||||||||||||||||||||||||||||||||||||||||
| Common stock issued | 43.5 | 129 | (497) | 2,181 | 1,813 | ||||||||||||||||||||||||||||||||||||||||||||||||||||||||||||
| Common stock repurchased | (110.4) | (6,033) | (6,033) | ||||||||||||||||||||||||||||||||||||||||||||||||||||||||||||||
| Preferred stock issued | — | — | — | — | |||||||||||||||||||||||||||||||||||||||||||||||||||||||||||||
Preferred stock redeemed (3) |
(0.6) | (609) | (37) | — | 646 | — | |||||||||||||||||||||||||||||||||||||||||||||||||||||||||||
Common stock issued to ESOP (3) |
— | — | 14.9 | (129) | 747 | (618) | — | ||||||||||||||||||||||||||||||||||||||||||||||||||||||||||
Common stock released by ESOP |
(1) | 189 | 188 | ||||||||||||||||||||||||||||||||||||||||||||||||||||||||||||||
|
Preferred stock converted to
common shares
|
— | — | — | — | — | — | |||||||||||||||||||||||||||||||||||||||||||||||||||||||||||
| Common stock dividends | 59 | (4,243) | (4,184) | ||||||||||||||||||||||||||||||||||||||||||||||||||||||||||||||
| Preferred stock dividends | (1,115) | (1,115) | |||||||||||||||||||||||||||||||||||||||||||||||||||||||||||||||
| Stock-based compensation | 1,002 | 1,002 | |||||||||||||||||||||||||||||||||||||||||||||||||||||||||||||||
| Net change in deferred compensation and related plans | (900) | 9 | (891) | ||||||||||||||||||||||||||||||||||||||||||||||||||||||||||||||
| Net change | (0.6) | (609) | (52.0) | — | 123 | 7,822 | (11,616) | (3,096) | 217 | (517) | (7,676) | ||||||||||||||||||||||||||||||||||||||||||||||||||||||
Balance December 31, 2022 |
4.7 | $ | 19,448 | 3,833.8 | $ | 9,136 | 60,319 | 187,968 | (13,362) | (82,853) | (429) | 1,986 | 182,213 | ||||||||||||||||||||||||||||||||||||||||||||||||||||
| Wells Fargo & Company | 87 |
|||||||
| Wells Fargo & Company and Subsidiaries | |||||||||||||||||||||||||||||||||||||||||||||||||||||||||||||||||
| Consolidated Statement of Changes in Equity | |||||||||||||||||||||||||||||||||||||||||||||||||||||||||||||||||
Wells Fargo stockholders’ equity |
|||||||||||||||||||||||||||||||||||||||||||||||||||||||||||||||||
| Preferred stock | Common stock | ||||||||||||||||||||||||||||||||||||||||||||||||||||||||||||||||
| ($ and shares in millions) | Shares | Amount | Shares | Amount | Additional paid-in capital |
Retained earnings |
Accumulated other comprehensive income (loss) |
Treasury stock |
Unearned ESOP shares |
Noncontrolling interests |
Total equity |
||||||||||||||||||||||||||||||||||||||||||||||||||||||
Balance December 31, 2022 |
4.7 | $ | 19,448 | 3,833.8 | $ | 9,136 | 60,319 | 187,968 | (13,362) | (82,853) | (429) | 1,986 | 182,213 | ||||||||||||||||||||||||||||||||||||||||||||||||||||
Cumulative effect from change in accounting policy (1) |
323 | 323 | |||||||||||||||||||||||||||||||||||||||||||||||||||||||||||||||
| Balance January 1, 2023 | 4.7 | 19,448 | 3,833.8 | 9,136 | 60,319 | 188,291 | (13,362) | (82,853) | (429) | 1,986 | 182,536 | ||||||||||||||||||||||||||||||||||||||||||||||||||||||
| Net income (loss) | 19,142 | (113) | 19,029 | ||||||||||||||||||||||||||||||||||||||||||||||||||||||||||||||
|
Other comprehensive income,
net of tax
|
1,782 | 2 | 1,784 | ||||||||||||||||||||||||||||||||||||||||||||||||||||||||||||||
| Noncontrolling interests | (167) | (167) | |||||||||||||||||||||||||||||||||||||||||||||||||||||||||||||||
| Common stock issued | 37.2 | — | (258) | 1,892 | 1,634 | ||||||||||||||||||||||||||||||||||||||||||||||||||||||||||||
| Common stock repurchased | (272.1) | (11,954) | (11,954) | ||||||||||||||||||||||||||||||||||||||||||||||||||||||||||||||
| Preferred stock issued | 0.1 | 1,725 | (3) | 1,722 | |||||||||||||||||||||||||||||||||||||||||||||||||||||||||||||
Preferred stock redeemed (2) |
(0.1) | (1,725) | 19 | (19) | — | (1,725) | |||||||||||||||||||||||||||||||||||||||||||||||||||||||||||
Common stock issued to ESOP |
— | — | — | — | — | — | — | ||||||||||||||||||||||||||||||||||||||||||||||||||||||||||
Common stock released by ESOP (3) |
1 | 429 | 430 | ||||||||||||||||||||||||||||||||||||||||||||||||||||||||||||||
|
Preferred stock converted to
common shares
|
— | — | — | — | — | — | |||||||||||||||||||||||||||||||||||||||||||||||||||||||||||
| Common stock dividends | 83 | (4,879) | (4,796) | ||||||||||||||||||||||||||||||||||||||||||||||||||||||||||||||
| Preferred stock dividends | (1,141) | (1,141) | |||||||||||||||||||||||||||||||||||||||||||||||||||||||||||||||
| Stock-based compensation | 1,122 | 1,122 | |||||||||||||||||||||||||||||||||||||||||||||||||||||||||||||||
| Net change in deferred compensation and related plans | (986) | (45) | (1,031) | ||||||||||||||||||||||||||||||||||||||||||||||||||||||||||||||
| Net change | — | — | (234.9) | — | 236 | 12,845 | 1,782 | (10,107) | 429 | (278) | 4,907 | ||||||||||||||||||||||||||||||||||||||||||||||||||||||
Balance December 31, 2023 |
4.7 | $ | 19,448 | 3,598.9 | $ | 9,136 | 60,555 | 201,136 | (11,580) | (92,960) | — | 1,708 | 187,443 | ||||||||||||||||||||||||||||||||||||||||||||||||||||
88 |
Wells Fargo & Company | |||||||
Wells Fargo & Company and Subsidiaries | |||||||||||||||||
| Consolidated Statement of Cash Flows | |||||||||||||||||
| Year ended December 31, | |||||||||||||||||
| (in millions) | 2023 | 2022 | 2021 | ||||||||||||||
| Cash flows from operating activities: | |||||||||||||||||
| Net income before noncontrolling interests (1) | $ | 19,029 | 13,378 | 23,799 | |||||||||||||
| Adjustments to reconcile net income to net cash provided by operating activities: | |||||||||||||||||
| Provision for credit losses | 5,399 | 1,534 | (4,155) | ||||||||||||||
| Changes in fair value of MSRs and LHFS carried at fair value | 851 | (1,326) | (1,188) | ||||||||||||||
| Depreciation, amortization and accretion | 6,271 | 6,832 | 7,890 | ||||||||||||||
Deferred income tax expense (benefit) (1) |
(50) | 1,239 | (1,106) | ||||||||||||||
| Other, net | 7,149 | (14,524) | (12,194) | ||||||||||||||
| Originations and purchases of loans held for sale | (30,365) | (74,910) | (158,923) | ||||||||||||||
| Proceeds from sales of and paydowns on loans originally classified as held for sale | 26,793 | 65,418 | 101,293 | ||||||||||||||
| Net change in: | |||||||||||||||||
| Debt and equity securities, held for trading | 3,349 | 31,579 | 19,334 | ||||||||||||||
| Derivative assets and liabilities (1) | 4,155 | 7,850 | (2,484) | ||||||||||||||
Other assets (1) |
(6,838) | (9,162) | 15,477 | ||||||||||||||
| Other accrued expenses and liabilities (1) | 4,615 | (860) | 732 | ||||||||||||||
Net cash provided (used) by operating activities |
40,358 | 27,048 | (11,525) | ||||||||||||||
| Cash flows from investing activities: | |||||||||||||||||
| Net change in: | |||||||||||||||||
Federal funds sold and securities purchased under resale agreements |
(12,729) | (704) | (551) | ||||||||||||||
| Available-for-sale debt securities: | |||||||||||||||||
| Proceeds from sales | 14,651 | 16,895 | 17,958 | ||||||||||||||
| Paydowns and maturities | 14,872 | 19,791 | 75,701 | ||||||||||||||
| Purchases | (26,051) | (40,104) | (110,431) | ||||||||||||||
| Held-to-maturity debt securities: | |||||||||||||||||
| Paydowns and maturities | 18,372 | 27,666 | 79,517 | ||||||||||||||
| Purchases | (4,225) | (2,360) | (71,245) | ||||||||||||||
| Equity securities, not held for trading: | |||||||||||||||||
| Proceeds from sales and capital returns | 2,244 | 4,326 | 4,933 | ||||||||||||||
| Purchases | (5,811) | (6,984) | (7,680) | ||||||||||||||
| Loans: | |||||||||||||||||
| Loans originated by banking subsidiaries, net of principal collected | 10,296 | (74,861) | (28,809) | ||||||||||||||
| Proceeds from sales of loans originally classified as held for investment | 4,275 | 12,446 | 31,847 | ||||||||||||||
| Purchases of loans | (1,637) | (741) | (389) | ||||||||||||||
| Principal collected on nonbank entities’ loans | 4,871 | 5,173 | 8,985 | ||||||||||||||
| Loans originated by nonbank entities | (3,476) | (3,824) | (11,237) | ||||||||||||||
| Other, net | 391 | 805 | 3,782 | ||||||||||||||
| Net cash provided (used) by investing activities | 16,043 | (42,476) | (7,619) | ||||||||||||||
| Cash flows from financing activities: | |||||||||||||||||
| Net change in: | |||||||||||||||||
| Deposits | (25,812) | (98,494) | 78,582 | ||||||||||||||
| Short-term borrowings | 38,414 | 16,564 | (24,590) | ||||||||||||||
| Long-term debt: | |||||||||||||||||
| Proceeds from issuance | 49,071 | 53,737 | 1,275 | ||||||||||||||
| Repayment | (22,886) | (19,587) | (47,134) | ||||||||||||||
| Preferred stock: | |||||||||||||||||
| Proceeds from issuance | 1,722 | — | 5,756 | ||||||||||||||
| Redeemed | (1,725) | — | (6,675) | ||||||||||||||
| Cash dividends paid | (1,141) | (1,115) | (1,205) | ||||||||||||||
| Common stock: | |||||||||||||||||
| Repurchased | (11,851) | (6,033) | (14,464) | ||||||||||||||
| Cash dividends paid | (4,789) | (4,178) | (2,422) | ||||||||||||||
| Other, net | (509) | (539) | (361) | ||||||||||||||
Net cash provided (used) by financing activities |
20,494 | (59,645) | (11,238) | ||||||||||||||
| Net change in cash, cash equivalents, and restricted cash | 76,895 | (75,073) | (30,382) | ||||||||||||||
| Cash, cash equivalents, and restricted cash at beginning of period (2) | 159,157 | 234,230 | 264,612 | ||||||||||||||
| Cash, cash equivalents, and restricted cash at end of period (2) | $ | 236,052 | 159,157 | 234,230 | |||||||||||||
| Supplemental cash flow disclosures: | |||||||||||||||||
| Cash paid for interest | $ | 30,431 | 8,289 | 4,384 | |||||||||||||
| Net cash paid (refunded) for income taxes | (1,786) | 3,376 | 3,166 | ||||||||||||||
| Wells Fargo & Company | 89 |
|||||||
Note 1: Summary of Significant Accounting Policies | ||
90 |
Wells Fargo & Company | |||||||
Year ended December 31, 2022 |
Year ended December 31, 2021 |
||||||||||||||||||||||||||||||||||||||||
| ($ in millions, except per share amounts) | As reported | Effect of adoption | As revised | As reported | Effect of adoption | As revised | |||||||||||||||||||||||||||||||||||
| Selected Income Statement Data | |||||||||||||||||||||||||||||||||||||||||
| Noninterest income | 28,835 | 583 | 29,418 | 42,713 | 674 | 43,387 | |||||||||||||||||||||||||||||||||||
| Noninterest expense | 57,282 | (77) | 57,205 | 53,831 | (73) | 53,758 | |||||||||||||||||||||||||||||||||||
| Income tax expense | 2,087 | 164 | 2,251 | 5,578 | 186 | 5,764 | |||||||||||||||||||||||||||||||||||
| Net income | 13,182 | 495 | 13,677 | 21,548 | 561 | 22,109 | |||||||||||||||||||||||||||||||||||
| Diluted earnings per common share | 3.14 | 0.13 | 3.27 | 4.95 | 0.13 | 5.08 | |||||||||||||||||||||||||||||||||||
| At December 31, 2022 | |||||||||||||||||||||||||||||||||||||||||
| As reported | Effect of adoption | As revised | |||||||||||||||||||||||||||||||||||||||
| Selected Balance Sheet Data | |||||||||||||||||||||||||||||||||||||||||
| Other assets | $ | 75,834 | 4 | 75,838 | |||||||||||||||||||||||||||||||||||||
| Derivative liabilities | 20,085 | (18) | 20,067 | ||||||||||||||||||||||||||||||||||||||
| Accrued expenses and other liabilities | 69,056 | (316) | 68,740 | ||||||||||||||||||||||||||||||||||||||
| Retained earnings | 187,649 | 319 | 187,968 | ||||||||||||||||||||||||||||||||||||||
| Accumulated other comprehensive income (loss) | (13,381) | 19 | (13,362) | ||||||||||||||||||||||||||||||||||||||
| Wells Fargo & Company | 91 |
|||||||
| Dec 31, 2020 |
Transition adjustment upon adoption | Jan 1, 2021 | |||||||||||||||||||||
| Selected Balance Sheet Data | |||||||||||||||||||||||
| Other assets | $ | 87,337 | 159 | 87,496 | |||||||||||||||||||
| Derivative liabilities | 16,509 | (27) | 16,482 | ||||||||||||||||||||
| Accrued expenses and other liabilities | 74,360 | 903 | 75,263 | ||||||||||||||||||||
| Retained earnings | 162,683 | (738) | 161,945 | ||||||||||||||||||||
| Accumulated other comprehensive income | 194 | 20 | 214 | ||||||||||||||||||||
92 |
Wells Fargo & Company | |||||||
| Wells Fargo & Company | 93 |
|||||||
94 |
Wells Fargo & Company | |||||||
| Loan Portfolio | Key economic variables | |||||||
| Total commercial |
• Gross domestic product
• Commercial real estate asset prices, where applicable
• Unemployment rate
|
|||||||
| Residential mortgage |
• Home price index
• Unemployment rate
|
|||||||
| Other consumer (including credit card, auto, and other consumer) | • Unemployment rate |
|||||||
| Wells Fargo & Company | 95 |
|||||||
96 |
Wells Fargo & Company | |||||||
| Wells Fargo & Company | 97 |
|||||||
98 |
Wells Fargo & Company | |||||||
| Wells Fargo & Company | 99 |
|||||||
100 |
Wells Fargo & Company | |||||||
| Wells Fargo & Company | 101 |
|||||||
| Year ended December 31, | |||||||||||||||||
| (in millions) | 2023 | 2022 | 2021 | ||||||||||||||
Held-to-maturity debt securities purchased from securitization of loans held for sale |
$ | 94 | 745 | 20,265 | |||||||||||||
Transfers from loans to loans held for sale |
1,920 | 6,586 | 19,297 | ||||||||||||||
| Transfers from available-for-sale debt securities to held-to-maturity debt securities | 3,687 | 50,132 | 55,993 | ||||||||||||||
| Transfers from held-to-maturity debt securities to available-for-sale debt securities (1) | 23,919 | — | — | ||||||||||||||
102 |
Wells Fargo & Company | |||||||
Note 2: Trading Activities | ||
(in millions) |
Dec 31, 2023 |
Dec 31, 2022 |
|||||||||
| Trading assets: | |||||||||||
| Debt securities | $ | 97,302 | 86,155 | ||||||||
| Equity securities | 18,449 | 26,910 | |||||||||
| Loans held for sale | 1,793 | 1,466 | |||||||||
| Gross trading derivative assets | 71,990 | 77,148 | |||||||||
| Netting (1) | (54,069) | (54,922) | |||||||||
| Total trading derivative assets | 17,921 | 22,226 | |||||||||
| Total trading assets | 135,465 | 136,757 | |||||||||
| Trading liabilities: | |||||||||||
| Short sale and other liabilities | 25,471 | 20,304 | |||||||||
| Interest-bearing deposits | 1,297 | — | |||||||||
| Long-term debt | 2,308 | 1,346 | |||||||||
| Gross trading derivative liabilities | 77,807 | 77,698 | |||||||||
| Netting (1) | (60,366) | (59,232) | |||||||||
| Total trading derivative liabilities | 17,441 | 18,466 | |||||||||
| Total trading liabilities | $ | 46,517 | 40,116 | ||||||||
| Year ended December 31, | |||||||||||||||||
| (in millions) | 2023 | 2022 | 2021 | ||||||||||||||
Net interest income: |
|||||||||||||||||
Interest income (1) |
$ | 4,229 | 3,011 | 2,567 | |||||||||||||
Interest expense |
643 | 592 | 405 | ||||||||||||||
Total net interest income |
3,586 | 2,419 | 2,162 | ||||||||||||||
Net gains (losses) from trading activities, by risk type: |
|||||||||||||||||
| Interest rate | 444 | 456 | (587) | ||||||||||||||
| Commodity | 372 | 345 | 10 | ||||||||||||||
| Equity | 1,106 | 883 | 52 | ||||||||||||||
| Foreign exchange | 2,124 | 1,168 | 839 | ||||||||||||||
Credit |
753 | (736) | (30) | ||||||||||||||
| Total net gains from trading activities | 4,799 | 2,116 | 284 | ||||||||||||||
| Total trading-related net interest and noninterest income | $ | 8,385 | 4,535 | 2,446 | |||||||||||||
| Wells Fargo & Company | 103 |
|||||||
Note 3: Available-for-Sale and Held-to-Maturity Debt Securities | ||
| (in millions) | Amortized cost, net (1) |
Gross unrealized gains |
Gross unrealized losses |
Net unrealized gains (losses) | Fair value | ||||||||||||||||||||||||
| December 31, 2023 | |||||||||||||||||||||||||||||
| Available-for-sale debt securities: | |||||||||||||||||||||||||||||
| Securities of U.S. Treasury and federal agencies | $ | 47,351 | 2 | (1,886) | (1,884) | 45,467 | |||||||||||||||||||||||
| Non-U.S. government securities | 164 | — | — | — | 164 | ||||||||||||||||||||||||
| Securities of U.S. states and political subdivisions (2) | 20,654 | 36 | (624) | (588) | 20,066 | ||||||||||||||||||||||||
| Federal agency mortgage-backed securities | 63,741 | 111 | (4,274) | (4,163) | 59,578 | ||||||||||||||||||||||||
| Non-agency mortgage-backed securities (3) | 2,892 | 1 | (144) | (143) | 2,749 | ||||||||||||||||||||||||
| Collateralized loan obligations | 1,538 | — | (5) | (5) | 1,533 | ||||||||||||||||||||||||
| Other debt securities | 861 | 46 | (16) | 30 | 891 | ||||||||||||||||||||||||
| Total available-for-sale debt securities, excluding portfolio level basis adjustments | 137,201 | 196 | (6,949) | (6,753) | 130,448 | ||||||||||||||||||||||||
| Portfolio level basis adjustments (4) | (46) | 46 | — | ||||||||||||||||||||||||||
| Total available-for-sale debt securities | 137,155 | 196 | (6,949) | (6,707) | 130,448 | ||||||||||||||||||||||||
| Held-to-maturity debt securities: | |||||||||||||||||||||||||||||
| Securities of U.S. Treasury and federal agencies | 3,790 | — | (1,503) | (1,503) | 2,287 | ||||||||||||||||||||||||
| Securities of U.S. states and political subdivisions | 18,624 | 3 | (2,939) | (2,936) | 15,688 | ||||||||||||||||||||||||
| Federal agency mortgage-backed securities | 209,170 | 136 | (30,918) | (30,782) | 178,388 | ||||||||||||||||||||||||
| Non-agency mortgage-backed securities (3) | 1,276 | 18 | (120) | (102) | 1,174 | ||||||||||||||||||||||||
| Collateralized loan obligations | 28,122 | 75 | (63) | 12 | 28,134 | ||||||||||||||||||||||||
| Other debt securities | 1,726 | — | (81) | (81) | 1,645 | ||||||||||||||||||||||||
| Total held-to-maturity debt securities | 262,708 | 232 | (35,624) | (35,392) | 227,316 | ||||||||||||||||||||||||
| Total | $ | 399,863 | 428 | (42,573) | (42,099) | 357,764 | |||||||||||||||||||||||
| December 31, 2022 | |||||||||||||||||||||||||||||
| Available-for-sale debt securities: | |||||||||||||||||||||||||||||
| Securities of U.S. Treasury and federal agencies | $ | 47,536 | 9 | (2,260) | (2,251) | 45,285 | |||||||||||||||||||||||
| Non-U.S. government securities | 162 | — | — | — | 162 | ||||||||||||||||||||||||
| Securities of U.S. states and political subdivisions (2) | 10,958 | 20 | (533) | (513) | 10,445 | ||||||||||||||||||||||||
| Federal agency mortgage-backed securities | 53,302 | 2 | (5,167) | (5,165) | 48,137 | ||||||||||||||||||||||||
| Non-agency mortgage-backed securities (3) | 3,423 | 1 | (140) | (139) | 3,284 | ||||||||||||||||||||||||
| Collateralized loan obligations | 4,071 | — | (90) | (90) | 3,981 | ||||||||||||||||||||||||
| Other debt securities | 2,273 | 75 | (48) | 27 | 2,300 | ||||||||||||||||||||||||
| Total available-for-sale debt securities | 121,725 | 107 | (8,238) | (8,131) | 113,594 | ||||||||||||||||||||||||
| Held-to-maturity debt securities: | |||||||||||||||||||||||||||||
| Securities of U.S. Treasury and federal agencies | 16,202 | — | (1,917) | (1,917) | 14,285 | ||||||||||||||||||||||||
| Securities of U.S. states and political subdivisions | 30,985 | 8 | (4,385) | (4,377) | 26,608 | ||||||||||||||||||||||||
| Federal agency mortgage-backed securities | 216,966 | 30 | (34,252) | (34,222) | 182,744 | ||||||||||||||||||||||||
| Non-agency mortgage-backed securities (3) | 1,253 | — | (147) | (147) | 1,106 | ||||||||||||||||||||||||
| Collateralized loan obligations | 29,926 | 1 | (727) | (726) | 29,200 | ||||||||||||||||||||||||
| Other debt securities | 1,727 | — | (149) | (149) | 1,578 | ||||||||||||||||||||||||
| Total held-to-maturity debt securities | 297,059 | 39 | (41,577) | (41,538) | 255,521 | ||||||||||||||||||||||||
| Total | $ | 418,784 | 146 | (49,815) | (49,669) | 369,115 | |||||||||||||||||||||||
104 |
Wells Fargo & Company | |||||||
| Year ended December 31, | |||||||||||||||||
| (in millions) | 2023 | 2022 | 2021 | ||||||||||||||
| Purchases of held-to-maturity debt securities (1): | |||||||||||||||||
Securities of U.S. states and political subdivisions |
$ | — | 843 | 5,198 | |||||||||||||
| Federal agency mortgage-backed securities | 4,225 | 2,051 | 76,010 | ||||||||||||||
| Non-agency mortgage-backed securities | 94 | 211 | 235 | ||||||||||||||
| Collateralized loan obligations | — | — | 9,379 | ||||||||||||||
Total purchases of held-to-maturity debt securities |
4,319 | 3,105 | 90,822 | ||||||||||||||
| Transfers from available-for-sale debt securities to held-to-maturity debt securities (2): | |||||||||||||||||
Securities of U.S. states and political subdivisions |
— | — | 2,954 | ||||||||||||||
| Federal agency mortgage-backed securities | 3,687 | 50,132 | 41,298 | ||||||||||||||
| Collateralized loan obligations | — | — | 10,003 | ||||||||||||||
| Other debt securities | — | — | 1,738 | ||||||||||||||
| Total transfers from available-for-sale debt securities to held-to-maturity debt securities | $ | 3,687 | 50,132 | 55,993 | |||||||||||||
| Year ended December 31, | |||||||||||||||||
| (in millions) | 2023 | 2022 | 2021 | ||||||||||||||
| Interest income (1): | |||||||||||||||||
Available-for-sale |
$ | 5,202 | 3,095 | 2,808 | |||||||||||||
Held-to-maturity |
7,118 | 6,220 | 4,359 | ||||||||||||||
| Total interest income | 12,320 | 9,315 | 7,167 | ||||||||||||||
| Provision for credit losses: | |||||||||||||||||
Available-for-sale |
(26) | 1 | (2) | ||||||||||||||
Held-to-maturity |
7 | (11) | 54 | ||||||||||||||
| Total provision for credit losses | (19) | (10) | 52 | ||||||||||||||
| Realized gains and losses (2): | |||||||||||||||||
| Gross realized gains | 37 | 276 | 571 | ||||||||||||||
| Gross realized losses | (27) | (125) | (10) | ||||||||||||||
| Impairment write-downs | — | — | (8) | ||||||||||||||
| Net realized gains | $ | 10 | 151 | 553 | |||||||||||||
| Wells Fargo & Company | 105 |
|||||||
| Available-for-Sale | Held-to-Maturity | ||||||||||||||||
| ($ in millions) | Fair value | % investment grade | Amortized cost | % investment grade | |||||||||||||
| December 31, 2023 | |||||||||||||||||
| Total portfolio (1) | $ | 130,448 | 99 | % | $ | 262,801 | 99 | % | |||||||||
| Breakdown by category: | |||||||||||||||||
| Securities of U.S. Treasury and federal agencies (2) | $ | 105,045 | 100 | % | $ | 212,960 | 100 | % | |||||||||
| Securities of U.S. states and political subdivisions | 20,066 | 99 | 18,635 | 100 | |||||||||||||
| Collateralized loan obligations (3) | 1,533 | 100 | 28,154 | 100 | |||||||||||||
| All other debt securities (4) | 3,804 | 95 | 3,052 | 64 | |||||||||||||
| December 31, 2022 | |||||||||||||||||
| Total portfolio (1) | $ | 113,594 | 99 | % | $ | 297,144 | 99 | % | |||||||||
| Breakdown by category: | |||||||||||||||||
| Securities of U.S. Treasury and federal agencies (2) | $ | 93,422 | 100 | % | $ | 233,169 | 100 | % | |||||||||
| Securities of U.S. states and political subdivisions | 10,445 | 99 | 31,000 | 100 | |||||||||||||
| Collateralized loan obligations (3) | 3,981 | 100 | 29,972 | 100 | |||||||||||||
| All other debt securities (4) | 5,746 | 89 | 3,003 | 63 | |||||||||||||
106 |
Wells Fargo & Company | |||||||
| Less than 12 months | 12 months or more | Total | |||||||||||||||||||||||||||||||||
| (in millions) | Gross unrealized losses (1) |
Fair value | Gross unrealized losses (1) | Fair value | Gross unrealized losses (1) |
Fair value | |||||||||||||||||||||||||||||
| December 31, 2023 | |||||||||||||||||||||||||||||||||||
| Available-for-sale debt securities: | |||||||||||||||||||||||||||||||||||
Securities of U.S. Treasury and federal agencies |
$ | (5) | 942 | (1,881) | 43,722 | (1,886) | 44,664 | ||||||||||||||||||||||||||||
Securities of U.S. states and political subdivisions |
(12) | 1,405 | (612) | 11,247 | (624) | 12,652 | |||||||||||||||||||||||||||||
| Federal agency mortgage-backed securities | (76) | 7,149 | (4,198) | 41,986 | (4,274) | 49,135 | |||||||||||||||||||||||||||||
| Non-agency mortgage-backed securities | (1) | 42 | (143) | 2,697 | (144) | 2,739 | |||||||||||||||||||||||||||||
Collateralized loan obligations |
— | — | (5) | 979 | (5) | 979 | |||||||||||||||||||||||||||||
| Other debt securities | — | — | (16) | 420 | (16) | 420 | |||||||||||||||||||||||||||||
| Total available-for-sale debt securities | $ | (94) | 9,538 | (6,855) | 101,051 | (6,949) | 110,589 | ||||||||||||||||||||||||||||
| December 31, 2022 | |||||||||||||||||||||||||||||||||||
| Available-for-sale debt securities: | |||||||||||||||||||||||||||||||||||
Securities of U.S. Treasury and federal agencies |
$ | (291) | 9,870 | (1,969) | 27,899 | (2,260) | 37,769 | ||||||||||||||||||||||||||||
Securities of U.S. states and political subdivisions |
(72) | 2,154 | (461) | 2,382 | (533) | 4,536 | |||||||||||||||||||||||||||||
| Federal agency mortgage-backed securities | (3,580) | 39,563 | (1,587) | 8,481 | (5,167) | 48,044 | |||||||||||||||||||||||||||||
| Non-agency mortgage-backed securities | (43) | 1,194 | (97) | 2,068 | (140) | 3,262 | |||||||||||||||||||||||||||||
Collateralized loan obligations |
(65) | 3,195 | (25) | 786 | (90) | 3,981 | |||||||||||||||||||||||||||||
| Other debt securities | (31) | 1,591 | (17) | 471 | (48) | 2,062 | |||||||||||||||||||||||||||||
| Total available-for-sale debt securities | $ | (4,082) | 57,567 | (4,156) | 42,087 | (8,238) | 99,654 | ||||||||||||||||||||||||||||
| Wells Fargo & Company | 107 |
|||||||
| By remaining contractual maturity ($ in millions) | Total | Within one year |
After one year through five years |
After five years through ten years |
After ten years |
||||||||||||||||||||||||
| December 31, 2023 | |||||||||||||||||||||||||||||
| Available-for-sale debt securities (1)(2): | |||||||||||||||||||||||||||||
| Securities of U.S. Treasury and federal agencies | |||||||||||||||||||||||||||||
| Amortized cost, net | $ | 47,351 | 16,750 | 27,577 | 1,545 | 1,479 | |||||||||||||||||||||||
| Fair value | 45,467 | 16,485 | 26,142 | 1,422 | 1,418 | ||||||||||||||||||||||||
| Weighted average yield | 1.62 | % | 1.91 | 1.46 | 1.48 | 1.44 | |||||||||||||||||||||||
| Non-U.S. government securities | |||||||||||||||||||||||||||||
| Amortized cost, net | $ | 164 | 2 | 138 | 24 | — | |||||||||||||||||||||||
| Fair value | 164 | 2 | 138 | 24 | — | ||||||||||||||||||||||||
| Weighted average yield | 4.80 | % | 5.80 | 4.64 | 5.61 | — | |||||||||||||||||||||||
| Securities of U.S. states and political subdivisions | |||||||||||||||||||||||||||||
| Amortized cost, net | $ | 20,654 | 1,124 | 5,311 | 4,738 | 9,481 | |||||||||||||||||||||||
| Fair value | 20,066 | 1,120 | 5,278 | 4,420 | 9,248 | ||||||||||||||||||||||||
| Weighted average yield | 3.08 | % | 2.87 | 3.73 | 2.97 | 2.81 | |||||||||||||||||||||||
| Federal agency mortgage-backed securities | |||||||||||||||||||||||||||||
| Amortized cost, net | $ | 63,741 | 5 | 160 | 731 | 62,845 | |||||||||||||||||||||||
| Fair value | 59,578 | 5 | 155 | 690 | 58,728 | ||||||||||||||||||||||||
| Weighted average yield | 3.69 | % | 2.92 | 2.09 | 2.54 | 3.71 | |||||||||||||||||||||||
| Non-agency mortgage-backed securities | |||||||||||||||||||||||||||||
| Amortized cost, net | $ | 2,892 | — | — | 105 | 2,787 | |||||||||||||||||||||||
| Fair value | 2,749 | — | — | 73 | 2,676 | ||||||||||||||||||||||||
| Weighted average yield | 5.28 | % | — | — | 4.60 | 5.31 | |||||||||||||||||||||||
| Collateralized loan obligations | |||||||||||||||||||||||||||||
| Amortized cost, net | $ | 1,538 | — | — | 1,113 | 425 | |||||||||||||||||||||||
| Fair value | 1,533 | — | — | 1,110 | 423 | ||||||||||||||||||||||||
| Weighted average yield | 7.08 | % | — | — | 7.10 | 7.02 | |||||||||||||||||||||||
| Other debt securities | |||||||||||||||||||||||||||||
| Amortized cost, net | $ | 861 | 3 | 44 | 470 | 344 | |||||||||||||||||||||||
| Fair value | 891 | 3 | 45 | 472 | 371 | ||||||||||||||||||||||||
| Weighted average yield | 6.74 | % | 7.02 | 9.14 | 5.87 | 7.62 | |||||||||||||||||||||||
| Total available-for-sale debt securities | |||||||||||||||||||||||||||||
| Amortized cost, net | $ | 137,201 | 17,884 | 33,230 | 8,726 | 77,361 | |||||||||||||||||||||||
| Fair value | 130,448 | 17,615 | 31,758 | 8,211 | 72,864 | ||||||||||||||||||||||||
| Weighted average yield | 2.97 | % | 1.97 | 1.83 | 3.36 | 3.65 | |||||||||||||||||||||||
108 |
Wells Fargo & Company | |||||||
| By remaining contractual maturity ($ in millions) | Total | Within one year |
After one year through five years |
After five years through ten years |
After ten years |
||||||||||||||||||||||||
| December 31, 2023 | |||||||||||||||||||||||||||||
| Held-to-maturity debt securities (1): | |||||||||||||||||||||||||||||
| Securities of U.S. Treasury and federal agencies | |||||||||||||||||||||||||||||
| Amortized cost, net | $ | 3,790 | — | — | — | 3,790 | |||||||||||||||||||||||
| Fair value | 2,287 | — | — | — | 2,287 | ||||||||||||||||||||||||
Weighted average yield |
1.59 | % | — | — | — | 1.59 | |||||||||||||||||||||||
| Securities of U.S. states and political subdivisions | |||||||||||||||||||||||||||||
| Amortized cost, net | $ | 18,624 | 132 | 491 | 704 | 17,297 | |||||||||||||||||||||||
| Fair value | 15,688 | 132 | 475 | 691 | 14,390 | ||||||||||||||||||||||||
Weighted average yield |
2.37 | % | 2.40 | 1.66 | 2.84 | 2.37 | |||||||||||||||||||||||
| Federal agency mortgage-backed securities | |||||||||||||||||||||||||||||
| Amortized cost, net | $ | 209,170 | — | — | — | 209,170 | |||||||||||||||||||||||
| Fair value | 178,388 | — | — | — | 178,388 | ||||||||||||||||||||||||
Weighted average yield |
2.36 | % | — | — | — | 2.36 | |||||||||||||||||||||||
| Non-agency mortgage-backed securities | |||||||||||||||||||||||||||||
| Amortized cost, net | $ | 1,276 | — | 30 | 36 | 1,210 | |||||||||||||||||||||||
| Fair value | 1,174 | — | 34 | 35 | 1,105 | ||||||||||||||||||||||||
Weighted average yield |
3.27 | % | — | 4.62 | 4.34 | 3.21 | |||||||||||||||||||||||
| Collateralized loan obligations | |||||||||||||||||||||||||||||
| Amortized cost, net | $ | 28,122 | — | 5 | 15,199 | 12,918 | |||||||||||||||||||||||
| Fair value | 28,134 | — | 5 | 15,226 | 12,903 | ||||||||||||||||||||||||
Weighted average yield |
7.07 | % | — | 6.66 | 7.18 | 6.94 | |||||||||||||||||||||||
| Other debt securities | |||||||||||||||||||||||||||||
| Amortized cost, net | $ | 1,726 | — | 1,726 | — | — | |||||||||||||||||||||||
| Fair value | 1,645 | — | 1,645 | — | — | ||||||||||||||||||||||||
| Weighted average yield | 4.47 | % | — | 4.47 | — | — | |||||||||||||||||||||||
| Total held-to-maturity debt securities | |||||||||||||||||||||||||||||
| Amortized cost, net | $ | 262,708 | 132 | 2,252 | 15,939 | 244,385 | |||||||||||||||||||||||
| Fair value | 227,316 | 132 | 2,159 | 15,952 | 209,073 | ||||||||||||||||||||||||
Weighted average yield |
2.87 | % | 2.40 | 3.87 | 6.99 | 2.59 | |||||||||||||||||||||||
| Wells Fargo & Company | 109 |
|||||||
Note 4: Equity Securities | ||
| (in millions) | Dec 31, 2023 |
Dec 31, 2022 |
|||||||||
| Held for trading at fair value: | |||||||||||
| Marketable equity securities | $ | 9,509 | 17,180 | ||||||||
| Nonmarketable equity securities (1) | 8,940 | 9,730 | |||||||||
| Total equity securities held for trading (2) | 18,449 | 26,910 | |||||||||
| Not held for trading: | |||||||||||
| Fair value: | |||||||||||
| Marketable equity securities | 1,355 | 1,436 | |||||||||
| Nonmarketable equity securities | 37 | 37 | |||||||||
| Total equity securities not held for trading at fair value | 1,392 | 1,473 | |||||||||
| Equity method: | |||||||||||
| Private equity | 3,130 | 2,836 | |||||||||
| Tax-advantaged renewable energy (3) | 6,840 | 6,535 | |||||||||
| New market tax credit and other | 278 | 298 | |||||||||
| Total equity method | 10,248 | 9,669 | |||||||||
| Other methods: | |||||||||||
| Low-income housing tax credit (LIHTC) investments (3) | 12,898 | 12,186 | |||||||||
| Private equity (4) | 9,073 | 9,276 | |||||||||
| Federal Reserve Bank stock and other at cost (5) | 5,276 | 4,900 | |||||||||
| Total equity securities not held for trading | 38,887 | 37,504 | |||||||||
| Total equity securities | $ | 57,336 | 64,414 | ||||||||
| Year ended December 31, | |||||||||||||||||
| (in millions) | 2023 | 2022 | 2021 | ||||||||||||||
| Net gains (losses) from equity securities carried at fair value: | |||||||||||||||||
| Marketable equity securities | $ | 86 | (225) | (202) | |||||||||||||
| Nonmarketable equity securities | (2) | (82) | (188) | ||||||||||||||
| Total equity securities carried at fair value | 84 | (307) | (390) | ||||||||||||||
| Net gains (losses) from nonmarketable equity securities not carried at fair value (1): | |||||||||||||||||
| Impairment write-downs | (1,307) | (2,452) | (121) | ||||||||||||||
Net unrealized gains (2)(3) |
578 | 1,101 | 4,862 | ||||||||||||||
Net realized gains from sale (3) |
204 | 852 | 1,581 | ||||||||||||||
| Total nonmarketable equity securities not carried at fair value | (525) | (499) | 6,322 | ||||||||||||||
Net gains from economic hedge derivatives |
— | — | 495 | ||||||||||||||
Total net gains (losses) from equity securities not held for trading |
$ | (441) | (806) | 6,427 | |||||||||||||
110 |
Wells Fargo & Company | |||||||
| Year ended December 31, | |||||||||||||||||
| (in millions) | 2023 | 2022 | 2021 | ||||||||||||||
| Net gains (losses) recognized in earnings during the period: | |||||||||||||||||
| Gross unrealized gains from observable price changes | $ | 607 | 1,115 | 4,569 | |||||||||||||
| Gross unrealized losses from observable price changes | (29) | (14) | — | ||||||||||||||
Impairment write-downs |
(1,113) | (2,263) | (109) | ||||||||||||||
| Net realized gains from sale | 42 | 98 | 456 | ||||||||||||||
Total net gains (losses) recognized during the period |
$ | (493) | (1,064) | 4,916 | |||||||||||||
| Year ended December 31, | |||||||||||||||||
| (in millions) | 2023 | 2022 | 2021 | ||||||||||||||
| Cumulative gains (losses): | |||||||||||||||||
| Gross unrealized gains from observable price changes | $ | 7,614 | 7,141 | 6,278 | |||||||||||||
| Gross unrealized losses from observable price changes | (44) | (14) | (3) | ||||||||||||||
| Impairment write-downs | (3,772) | (2,896) | (821) | ||||||||||||||
| Wells Fargo & Company | 111 |
|||||||
Note 5: Loans and Related Allowance for Credit Losses | ||
| (in millions) | Dec 31, 2023 |
Dec 31, 2022 |
|||||||||
| Commercial and industrial | $ | 380,388 | 386,806 | ||||||||
| Commercial real estate | 150,616 | 155,802 | |||||||||
| Lease financing | 16,423 | 14,908 | |||||||||
| Total commercial | 547,427 | 557,516 | |||||||||
| Residential mortgage | 260,724 | 269,117 | |||||||||
| Credit card | 52,230 | 46,293 | |||||||||
| Auto | 47,762 | 53,669 | |||||||||
| Other consumer (1) | 28,539 | 29,276 | |||||||||
| Total consumer | 389,255 | 398,355 | |||||||||
| Total loans | $ | 936,682 | 955,871 | ||||||||
| (in millions) | Dec 31, 2023 |
Dec 31, 2022 |
|||||||||
| Commercial and industrial | $ | 72,215 | 78,981 | ||||||||
| Commercial real estate | 6,916 | 7,619 | |||||||||
| Lease financing | 697 | 670 | |||||||||
| Total non-U.S. commercial loans | $ | 79,828 | 87,270 | ||||||||
112 |
Wells Fargo & Company | |||||||
| Year ended December 31, | |||||||||||||||||||||||||||||||||||
| 2023 | 2022 | ||||||||||||||||||||||||||||||||||
| (in millions) | Commercial | Consumer | Total | Commercial | Consumer | Total | |||||||||||||||||||||||||||||
| Purchases | $ | 1,340 | 306 | 1,646 | 740 | 5 | 745 | ||||||||||||||||||||||||||||
| Sales and net transfers (to)/from LHFS | (3,313) | (917) | (4,230) | (3,182) | (1,135) | (4,317) | |||||||||||||||||||||||||||||
| (in millions) | Dec 31, 2023 |
Dec 31, 2022 |
|||||||||
| Commercial and industrial (1) | $ | 388,043 | 388,504 | ||||||||
| Commercial real estate | 20,851 | 29,518 | |||||||||
| Total commercial | 408,894 | 418,022 | |||||||||
| Residential mortgage (2) | 29,754 | 39,155 | |||||||||
| Credit card | 156,012 | 145,526 | |||||||||
| Other consumer (3) | 8,847 | 69,244 | |||||||||
| Total consumer | 194,613 | 253,925 | |||||||||
| Total unfunded credit commitments | $ | 603,507 | 671,947 | ||||||||
| Wells Fargo & Company | 113 |
|||||||
| Year ended December 31, | |||||||||||
| ($ in millions) | 2023 | 2022 | |||||||||
| Balance, beginning of period | $ | 13,609 | 13,788 | ||||||||
| Cumulative effect from change in accounting policy (1) | (429) | — | |||||||||
| Balance, beginning of period, adjusted | 13,180 | 13,788 | |||||||||
| Provision for credit losses | 5,385 | 1,544 | |||||||||
| Interest income on certain loans (2) | — | (108) | |||||||||
| Loan charge-offs: | |||||||||||
| Commercial and industrial | (510) | (307) | |||||||||
| Commercial real estate | (593) | (21) | |||||||||
| Lease financing | (31) | (27) | |||||||||
| Total commercial | (1,134) | (355) | |||||||||
| Residential mortgage | (136) | (175) | |||||||||
| Credit card | (2,009) | (1,195) | |||||||||
| Auto | (832) | (734) | |||||||||
| Other consumer | (485) | (407) | |||||||||
| Total consumer | (3,462) | (2,511) | |||||||||
| Total loan charge-offs | (4,596) | (2,866) | |||||||||
| Loan recoveries: | |||||||||||
| Commercial and industrial | 165 | 224 | |||||||||
| Commercial real estate | 27 | 32 | |||||||||
| Lease financing | 19 | 20 | |||||||||
| Total commercial | 211 | 276 | |||||||||
| Residential mortgage | 160 | 238 | |||||||||
| Credit card | 329 | 344 | |||||||||
| Auto | 354 | 312 | |||||||||
| Other consumer | 72 | 88 | |||||||||
| Total consumer | 915 | 982 | |||||||||
| Total loan recoveries | 1,126 | 1,258 | |||||||||
| Net loan charge-offs | (3,470) | (1,608) | |||||||||
| Other | (7) | (7) | |||||||||
| Balance, end of period | $ | 15,088 | 13,609 | ||||||||
| Components: | |||||||||||
| Allowance for loan losses | $ | 14,606 | 12,985 | ||||||||
| Allowance for unfunded credit commitments | 482 | 624 | |||||||||
| Allowance for credit losses | $ | 15,088 | 13,609 | ||||||||
Net loan charge-offs as a percentage of average total loans |
0.37 | % | 0.17 | ||||||||
| Allowance for loan losses as a percentage of total loans | 1.56 | 1.36 | |||||||||
| Allowance for credit losses for loans as a percentage of total loans | 1.61 | 1.42 | |||||||||
114 |
Wells Fargo & Company | |||||||
| Year ended December 31, | |||||||||||||||||||||||||||||||||||
| 2023 | 2022 | ||||||||||||||||||||||||||||||||||
| (in millions) | Commercial | Consumer | Total | Commercial | Consumer | Total | |||||||||||||||||||||||||||||
| Balance, beginning of period | $ | 6,956 | 6,653 | 13,609 | 7,791 | 5,997 | 13,788 | ||||||||||||||||||||||||||||
Cumulative effect from change in accounting policy (1) |
27 | (456) | (429) | — | — | — | |||||||||||||||||||||||||||||
| Balance, beginning of period, adjusted | 6,983 | 6,197 | 13,180 | 7,791 | 5,997 | 13,788 | |||||||||||||||||||||||||||||
| Provision for credit losses | 2,365 | 3,020 | 5,385 | (721) | 2,265 | 1,544 | |||||||||||||||||||||||||||||
Interest income on certain loans (2) |
— | — | — | (29) | (79) | (108) | |||||||||||||||||||||||||||||
Loan charge-offs |
(1,134) | (3,462) | (4,596) | (355) | (2,511) | (2,866) | |||||||||||||||||||||||||||||
Loan recoveries |
211 | 915 | 1,126 | 276 | 982 | 1,258 | |||||||||||||||||||||||||||||
| Net loan charge-offs | (923) | (2,547) | (3,470) | (79) | (1,529) | (1,608) | |||||||||||||||||||||||||||||
Other |
(13) | 6 | (7) | (6) | (1) | (7) | |||||||||||||||||||||||||||||
| Balance, end of period | $ | 8,412 | 6,676 | 15,088 | 6,956 | 6,653 | 13,609 | ||||||||||||||||||||||||||||
| Wells Fargo & Company | 115 |
|||||||
| Term loans by origination year | Revolving loans | Revolving loans converted to term loans | Total | ||||||||||||||||||||||||||||||||||||||||||||||||||
| (in millions) | 2023 | 2022 | 2021 | 2020 | 2019 | Prior | |||||||||||||||||||||||||||||||||||||||||||||||
| December 31, 2023 | |||||||||||||||||||||||||||||||||||||||||||||||||||||
| Commercial and industrial | |||||||||||||||||||||||||||||||||||||||||||||||||||||
Pass |
$ | 40,966 | 38,756 | 21,702 | 7,252 | 10,024 | 8,342 | 239,456 | 348 | 366,846 | |||||||||||||||||||||||||||||||||||||||||||
Criticized |
892 | 1,594 | 1,237 | 160 | 204 | 480 | 8,975 | — | 13,542 | ||||||||||||||||||||||||||||||||||||||||||||
| Total commercial and industrial | 41,858 | 40,350 | 22,939 | 7,412 | 10,228 | 8,822 | 248,431 | 348 | 380,388 | ||||||||||||||||||||||||||||||||||||||||||||
| Gross charge-offs (1) | 102 | 22 | 53 | 11 | 8 | 7 | 307 | — | 510 | ||||||||||||||||||||||||||||||||||||||||||||
| Commercial real estate | |||||||||||||||||||||||||||||||||||||||||||||||||||||
Pass |
18,181 | 33,557 | 30,629 | 12,001 | 11,532 | 19,686 | 6,537 | 163 | 132,286 | ||||||||||||||||||||||||||||||||||||||||||||
| Criticized | 2,572 | 4,091 | 4,597 | 1,822 | 2,748 | 2,141 | 359 | — | 18,330 | ||||||||||||||||||||||||||||||||||||||||||||
| Total commercial real estate | 20,753 | 37,648 | 35,226 | 13,823 | 14,280 | 21,827 | 6,896 | 163 | 150,616 | ||||||||||||||||||||||||||||||||||||||||||||
| Gross charge-offs | 20 | 107 | 32 | 134 | 197 | 103 | — | — | 593 | ||||||||||||||||||||||||||||||||||||||||||||
| Lease financing | |||||||||||||||||||||||||||||||||||||||||||||||||||||
Pass |
5,593 | 3,846 | 2,400 | 1,182 | 798 | 1,518 | — | — | 15,337 | ||||||||||||||||||||||||||||||||||||||||||||
Criticized |
345 | 292 | 182 | 98 | 84 | 85 | — | — | 1,086 | ||||||||||||||||||||||||||||||||||||||||||||
Total lease financing |
5,938 | 4,138 | 2,582 | 1,280 | 882 | 1,603 | — | — | 16,423 | ||||||||||||||||||||||||||||||||||||||||||||
| Gross charge-offs | 3 | 8 | 8 | 5 | 4 | 3 | — | — | 31 | ||||||||||||||||||||||||||||||||||||||||||||
Total commercial loans |
$ | 68,549 | 82,136 | 60,747 | 22,515 | 25,390 | 32,252 | 255,327 | 511 | 547,427 | |||||||||||||||||||||||||||||||||||||||||||
| Term loans by origination year | Revolving loans | Revolving loans converted to term loans | Total | ||||||||||||||||||||||||||||||||||||||||||||||||||
| 2022 | 2021 | 2020 | 2019 | 2018 | Prior | ||||||||||||||||||||||||||||||||||||||||||||||||
| December 31, 2022 | |||||||||||||||||||||||||||||||||||||||||||||||||||||
| Commercial and industrial | |||||||||||||||||||||||||||||||||||||||||||||||||||||
| Pass | $ | 61,646 | 31,376 | 11,128 | 13,656 | 3,285 | 5,739 | 247,594 | 842 | 375,266 | |||||||||||||||||||||||||||||||||||||||||||
| Criticized | 872 | 1,244 | 478 | 505 | 665 | 532 | 7,244 | — | 11,540 | ||||||||||||||||||||||||||||||||||||||||||||
| Total commercial and industrial | 62,518 | 32,620 | 11,606 | 14,161 | 3,950 | 6,271 | 254,838 | 842 | 386,806 | ||||||||||||||||||||||||||||||||||||||||||||
| Commercial real estate | |||||||||||||||||||||||||||||||||||||||||||||||||||||
| Pass | 38,022 | 38,709 | 16,564 | 16,409 | 10,587 | 16,159 | 6,765 | 150 | 143,365 | ||||||||||||||||||||||||||||||||||||||||||||
| Criticized | 2,785 | 2,794 | 965 | 2,958 | 1,088 | 1,688 | 159 | — | 12,437 | ||||||||||||||||||||||||||||||||||||||||||||
| Total commercial real estate | 40,807 | 41,503 | 17,529 | 19,367 | 11,675 | 17,847 | 6,924 | 150 | 155,802 | ||||||||||||||||||||||||||||||||||||||||||||
| Lease financing | |||||||||||||||||||||||||||||||||||||||||||||||||||||
| Pass | 4,543 | 3,336 | 1,990 | 1,427 | 765 | 1,752 | — | — | 13,813 | ||||||||||||||||||||||||||||||||||||||||||||
| Criticized | 330 | 275 | 190 | 169 | 94 | 37 | — | — | 1,095 | ||||||||||||||||||||||||||||||||||||||||||||
| Total lease financing | 4,873 | 3,611 | 2,180 | 1,596 | 859 | 1,789 | — | — | 14,908 | ||||||||||||||||||||||||||||||||||||||||||||
| Total commercial loans | $ | 108,198 | 77,734 | 31,315 | 35,124 | 16,484 | 25,907 | 261,762 | 992 | 557,516 | |||||||||||||||||||||||||||||||||||||||||||
116 |
Wells Fargo & Company | |||||||
| Still accruing | Nonaccrual loans | Total commercial loans |
|||||||||||||||||||||||||||
| (in millions) | Current-29 DPD | 30-89 DPD | 90+ DPD | ||||||||||||||||||||||||||
| December 31, 2023 | |||||||||||||||||||||||||||||
| Commercial and industrial | $ | 379,099 | 584 | 43 | 662 | 380,388 | |||||||||||||||||||||||
| Commercial real estate | 145,721 | 562 | 145 | 4,188 | 150,616 | ||||||||||||||||||||||||
| Lease financing | 16,177 | 182 | — | 64 | 16,423 | ||||||||||||||||||||||||
Total commercial loans |
$ | 540,997 | 1,328 | 188 | 4,914 | 547,427 | |||||||||||||||||||||||
| December 31, 2022 | |||||||||||||||||||||||||||||
| Commercial and industrial | $ | 384,164 | 1,313 | 583 | 746 | 386,806 | |||||||||||||||||||||||
| Commercial real estate | 153,877 | 833 | 134 | 958 | 155,802 | ||||||||||||||||||||||||
| Lease financing | 14,623 | 166 | — | 119 | 14,908 | ||||||||||||||||||||||||
Total commercial loans |
$ | 552,664 | 2,312 | 717 | 1,823 | 557,516 | |||||||||||||||||||||||
| Wells Fargo & Company | 117 |
|||||||
| Term loans by origination year | Revolving loans | Revolving loans converted to term loans | |||||||||||||||||||||||||||||||||||||||||||||||||||
| (in millions) | 2023 | 2022 | 2021 | 2020 | 2019 | Prior | Total | ||||||||||||||||||||||||||||||||||||||||||||||
| December 31, 2023 | |||||||||||||||||||||||||||||||||||||||||||||||||||||
| By delinquency status: | |||||||||||||||||||||||||||||||||||||||||||||||||||||
| Current-29 DPD | $ | 13,192 | 46,065 | 62,529 | 35,124 | 19,364 | 60,391 | 8,044 | 6,735 | 251,444 | |||||||||||||||||||||||||||||||||||||||||||
| 30-89 DPD | 6 | 70 | 58 | 28 | 30 | 724 | 41 | 151 | 1,108 | ||||||||||||||||||||||||||||||||||||||||||||
| 90+ DPD | — | 18 | 12 | 8 | 14 | 327 | 24 | 201 | 604 | ||||||||||||||||||||||||||||||||||||||||||||
| Government insured/guaranteed loans (1) | 5 | 15 | 39 | 97 | 112 | 7,300 | — | — | 7,568 | ||||||||||||||||||||||||||||||||||||||||||||
| Total residential mortgage | $ | 13,203 | 46,168 | 62,638 | 35,257 | 19,520 | 68,742 | 8,109 | 7,087 | 260,724 | |||||||||||||||||||||||||||||||||||||||||||
By updated FICO: |
|||||||||||||||||||||||||||||||||||||||||||||||||||||
| 740+ | $ | 12,243 | 42,550 | 58,827 | 33,232 | 18,000 | 50,938 | 6,291 | 4,092 | 226,173 | |||||||||||||||||||||||||||||||||||||||||||
| 700-739 | 679 | 2,324 | 2,510 | 1,219 | 888 | 4,478 | 883 | 979 | 13,960 | ||||||||||||||||||||||||||||||||||||||||||||
| 660-699 | 185 | 843 | 861 | 422 | 310 | 2,261 | 417 | 601 | 5,900 | ||||||||||||||||||||||||||||||||||||||||||||
| 620-659 | 45 | 227 | 179 | 110 | 66 | 978 | 150 | 322 | 2,077 | ||||||||||||||||||||||||||||||||||||||||||||
| <620 | 11 | 122 | 100 | 64 | 46 | 1,245 | 174 | 464 | 2,226 | ||||||||||||||||||||||||||||||||||||||||||||
| No FICO available | 35 | 87 | 122 | 113 | 98 | 1,542 | 194 | 629 | 2,820 | ||||||||||||||||||||||||||||||||||||||||||||
| Government insured/guaranteed loans (1) | 5 | 15 | 39 | 97 | 112 | 7,300 | — | — | 7,568 | ||||||||||||||||||||||||||||||||||||||||||||
| Total residential mortgage | $ | 13,203 | 46,168 | 62,638 | 35,257 | 19,520 | 68,742 | 8,109 | 7,087 | 260,724 | |||||||||||||||||||||||||||||||||||||||||||
By updated LTV: |
|||||||||||||||||||||||||||||||||||||||||||||||||||||
| 0-80% | $ | 12,434 | 39,624 | 61,421 | 34,833 | 19,123 | 61,043 | 7,903 | 6,923 | 243,304 | |||||||||||||||||||||||||||||||||||||||||||
80.01-100% |
687 | 6,286 | 1,065 | 232 | 203 | 207 | 103 | 114 | 8,897 | ||||||||||||||||||||||||||||||||||||||||||||
| >100% (2) | 51 | 193 | 57 | 33 | 31 | 38 | 21 | 24 | 448 | ||||||||||||||||||||||||||||||||||||||||||||
| No LTV available | 26 | 50 | 56 | 62 | 51 | 154 | 82 | 26 | 507 | ||||||||||||||||||||||||||||||||||||||||||||
| Government insured/guaranteed loans (1) | 5 | 15 | 39 | 97 | 112 | 7,300 | — | — | 7,568 | ||||||||||||||||||||||||||||||||||||||||||||
| Total residential mortgage | $ | 13,203 | 46,168 | 62,638 | 35,257 | 19,520 | 68,742 | 8,109 | 7,087 | 260,724 | |||||||||||||||||||||||||||||||||||||||||||
| Gross charge-offs | $ | — | 1 | — | — | 2 | 63 | 4 | 66 | 136 | |||||||||||||||||||||||||||||||||||||||||||
| Term loans by origination year | Revolving loans | Revolving loans converted to term loans | Total | ||||||||||||||||||||||||||||||||||||||||||||||||||
| (in millions) | 2022 | 2021 | 2020 | 2019 | 2018 | Prior | |||||||||||||||||||||||||||||||||||||||||||||||
| December 31, 2022 | |||||||||||||||||||||||||||||||||||||||||||||||||||||
| By delinquency status: | |||||||||||||||||||||||||||||||||||||||||||||||||||||
| Current-29 DPD | $ | 48,581 | 65,705 | 37,289 | 20,851 | 6,190 | 61,680 | 11,031 | 6,913 | 258,240 | |||||||||||||||||||||||||||||||||||||||||||
| 30-89 DPD | 65 | 66 | 32 | 33 | 21 | 683 | 58 | 159 | 1,117 | ||||||||||||||||||||||||||||||||||||||||||||
| 90+ DPD | 6 | 17 | 15 | 25 | 15 | 530 | 32 | 260 | 900 | ||||||||||||||||||||||||||||||||||||||||||||
| Government insured/guaranteed loans (1) | 9 | 59 | 133 | 148 | 200 | 8,311 | — | — | 8,860 | ||||||||||||||||||||||||||||||||||||||||||||
| Total residential mortgage | $ | 48,661 | 65,847 | 37,469 | 21,057 | 6,426 | 71,204 | 11,121 | 7,332 | 269,117 | |||||||||||||||||||||||||||||||||||||||||||
By updated FICO: |
|||||||||||||||||||||||||||||||||||||||||||||||||||||
| 740+ | $ | 43,976 | 61,450 | 35,221 | 19,437 | 5,610 | 51,551 | 8,664 | 4,139 | 230,048 | |||||||||||||||||||||||||||||||||||||||||||
| 700-739 | 3,245 | 2,999 | 1,419 | 941 | 314 | 4,740 | 1,159 | 1,021 | 15,838 | ||||||||||||||||||||||||||||||||||||||||||||
| 660-699 | 1,060 | 851 | 438 | 306 | 169 | 2,388 | 567 | 656 | 6,435 | ||||||||||||||||||||||||||||||||||||||||||||
| 620-659 | 211 | 248 | 106 | 82 | 50 | 1,225 | 223 | 349 | 2,494 | ||||||||||||||||||||||||||||||||||||||||||||
| <620 | 59 | 81 | 44 | 46 | 28 | 1,323 | 227 | 466 | 2,274 | ||||||||||||||||||||||||||||||||||||||||||||
| No FICO available | 101 | 159 | 108 | 97 | 55 | 1,666 | 281 | 701 | 3,168 | ||||||||||||||||||||||||||||||||||||||||||||
| Government insured/guaranteed loans (1) | 9 | 59 | 133 | 148 | 200 | 8,311 | — | — | 8,860 | ||||||||||||||||||||||||||||||||||||||||||||
| Total residential mortgage | $ | 48,661 | 65,847 | 37,469 | 21,057 | 6,426 | 71,204 | 11,121 | 7,332 | 269,117 | |||||||||||||||||||||||||||||||||||||||||||
By updated LTV: |
|||||||||||||||||||||||||||||||||||||||||||||||||||||
| 0-80% | $ | 40,869 | 64,613 | 37,145 | 20,744 | 6,155 | 62,593 | 10,923 | 7,188 | 250,230 | |||||||||||||||||||||||||||||||||||||||||||
| 80.01-100% | 7,670 | 1,058 | 112 | 97 | 30 | 107 | 109 | 97 | 9,280 | ||||||||||||||||||||||||||||||||||||||||||||
| >100% (2) | 48 | 20 | 13 | 6 | 3 | 23 | 28 | 16 | 157 | ||||||||||||||||||||||||||||||||||||||||||||
| No LTV available | 65 | 97 | 66 | 62 | 38 | 170 | 61 | 31 | 590 | ||||||||||||||||||||||||||||||||||||||||||||
| Government insured/guaranteed loans (1) | 9 | 59 | 133 | 148 | 200 | 8,311 | — | — | 8,860 | ||||||||||||||||||||||||||||||||||||||||||||
| Total residential mortgage | $ | 48,661 | 65,847 | 37,469 | 21,057 | 6,426 | 71,204 | 11,121 | 7,332 | 269,117 | |||||||||||||||||||||||||||||||||||||||||||
118 |
Wells Fargo & Company | |||||||
| December 31, 2023 | December 31, 2022 | |||||||||||||||||||||||||||||||||||||
| Revolving loans | Revolving loans converted to term loans | Revolving loans | Revolving loans converted to term loans | |||||||||||||||||||||||||||||||||||
| (in millions) | Total | Total | ||||||||||||||||||||||||||||||||||||
| By delinquency status: | ||||||||||||||||||||||||||||||||||||||
| Current-29 DPD | $ | 50,428 | 350 | 50,778 | 45,131 | 223 | 45,354 | |||||||||||||||||||||||||||||||
| 30-89 DPD | 660 | 49 | 709 | 457 | 27 | 484 | ||||||||||||||||||||||||||||||||
| 90+ DPD | 717 | 26 | 743 | 441 | 14 | 455 | ||||||||||||||||||||||||||||||||
| Total credit cards | $ | 51,805 | 425 | 52,230 | 46,029 | 264 | 46,293 | |||||||||||||||||||||||||||||||
By updated FICO: |
||||||||||||||||||||||||||||||||||||||
| 740+ | $ | 19,153 | 21 | 19,174 | 16,681 | 19 | 16,700 | |||||||||||||||||||||||||||||||
| 700-739 | 11,727 | 51 | 11,778 | 10,640 | 37 | 10,677 | ||||||||||||||||||||||||||||||||
| 660-699 | 10,592 | 84 | 10,676 | 9,573 | 55 | 9,628 | ||||||||||||||||||||||||||||||||
| 620-659 | 5,273 | 76 | 5,349 | 4,885 | 45 | 4,930 | ||||||||||||||||||||||||||||||||
| <620 | 4,861 | 192 | 5,053 | 4,071 | 107 | 4,178 | ||||||||||||||||||||||||||||||||
| No FICO available | 199 | 1 | 200 | 179 | 1 | 180 | ||||||||||||||||||||||||||||||||
| Total credit cards | $ | 51,805 | 425 | 52,230 | 46,029 | 264 | 46,293 | |||||||||||||||||||||||||||||||
| Wells Fargo & Company | 119 |
|||||||
| Term loans by origination year | |||||||||||||||||||||||||||||||||||||||||
| (in millions) | 2023 | 2022 | 2021 | 2020 | 2019 | Prior | Total | ||||||||||||||||||||||||||||||||||
| December 31, 2023 | |||||||||||||||||||||||||||||||||||||||||
| By delinquency status: | |||||||||||||||||||||||||||||||||||||||||
| Current-29 DPD | $ | 14,022 | 13,052 | 12,376 | 4,335 | 2,161 | 448 | 46,394 | |||||||||||||||||||||||||||||||||
| 30-89 DPD | 43 | 328 | 545 | 195 | 106 | 40 | 1,257 | ||||||||||||||||||||||||||||||||||
| 90+ DPD | 4 | 34 | 49 | 14 | 7 | 3 | 111 | ||||||||||||||||||||||||||||||||||
| Total auto | $ | 14,069 | 13,414 | 12,970 | 4,544 | 2,274 | 491 | 47,762 | |||||||||||||||||||||||||||||||||
By updated FICO: |
|||||||||||||||||||||||||||||||||||||||||
| 740+ | $ | 9,460 | 6,637 | 5,487 | 1,853 | 963 | 176 | 24,576 | |||||||||||||||||||||||||||||||||
| 700-739 | 2,232 | 1,969 | 1,861 | 701 | 347 | 68 | 7,178 | ||||||||||||||||||||||||||||||||||
| 660-699 | 1,405 | 1,745 | 1,729 | 623 | 295 | 61 | 5,858 | ||||||||||||||||||||||||||||||||||
| 620-659 | 572 | 1,162 | 1,228 | 425 | 195 | 46 | 3,628 | ||||||||||||||||||||||||||||||||||
| <620 | 388 | 1,876 | 2,621 | 915 | 452 | 130 | 6,382 | ||||||||||||||||||||||||||||||||||
| No FICO available | 12 | 25 | 44 | 27 | 22 | 10 | 140 | ||||||||||||||||||||||||||||||||||
| Total auto | $ | 14,069 | 13,414 | 12,970 | 4,544 | 2,274 | 491 | 47,762 | |||||||||||||||||||||||||||||||||
| Gross charge-offs | $ | 15 | 265 | 392 | 99 | 52 | 9 | 832 | |||||||||||||||||||||||||||||||||
| Term loans by origination year | |||||||||||||||||||||||||||||||||||||||||
| (in millions) | 2022 | 2021 | 2020 | 2019 | 2018 | Prior | Total | ||||||||||||||||||||||||||||||||||
| December 31, 2022 | |||||||||||||||||||||||||||||||||||||||||
| By delinquency status: | |||||||||||||||||||||||||||||||||||||||||
| Current-29 DPD | $ | 19,101 | 19,126 | 7,507 | 4,610 | 1,445 | 421 | 52,210 | |||||||||||||||||||||||||||||||||
| 30-89 DPD | 218 | 585 | 253 | 167 | 69 | 45 | 1,337 | ||||||||||||||||||||||||||||||||||
| 90+ DPD | 23 | 56 | 22 | 13 | 4 | 4 | 122 | ||||||||||||||||||||||||||||||||||
| Total auto | $ | 19,342 | 19,767 | 7,782 | 4,790 | 1,518 | 470 | 53,669 | |||||||||||||||||||||||||||||||||
By updated FICO: |
|||||||||||||||||||||||||||||||||||||||||
| 740+ | $ | 9,361 | 8,233 | 3,193 | 2,146 | 664 | 166 | 23,763 | |||||||||||||||||||||||||||||||||
| 700-739 | 3,090 | 3,033 | 1,287 | 788 | 238 | 64 | 8,500 | ||||||||||||||||||||||||||||||||||
| 660-699 | 2,789 | 2,926 | 1,163 | 641 | 192 | 58 | 7,769 | ||||||||||||||||||||||||||||||||||
| 620-659 | 2,021 | 2,156 | 796 | 421 | 130 | 47 | 5,571 | ||||||||||||||||||||||||||||||||||
| <620 | 2,062 | 3,389 | 1,316 | 756 | 263 | 126 | 7,912 | ||||||||||||||||||||||||||||||||||
| No FICO available | 19 | 30 | 27 | 38 | 31 | 9 | 154 | ||||||||||||||||||||||||||||||||||
| Total auto | $ | 19,342 | 19,767 | 7,782 | 4,790 | 1,518 | 470 | 53,669 | |||||||||||||||||||||||||||||||||
120 |
Wells Fargo & Company | |||||||
| Term loans by origination year | Revolving loans | Revolving loans converted to term loans | |||||||||||||||||||||||||||||||||||||||||||||||||||
| (in millions) | 2023 | 2022 | 2021 | 2020 | 2019 | Prior | Total | ||||||||||||||||||||||||||||||||||||||||||||||
| December 31, 2023 | |||||||||||||||||||||||||||||||||||||||||||||||||||||
| By delinquency status: | |||||||||||||||||||||||||||||||||||||||||||||||||||||
| Current-29 DPD | $ | 3,273 | 2,132 | 571 | 167 | 93 | 61 | 21,988 | 106 | 28,391 | |||||||||||||||||||||||||||||||||||||||||||
| 30-89 DPD | 24 | 32 | 9 | 1 | 1 | 2 | 17 | 6 | 92 | ||||||||||||||||||||||||||||||||||||||||||||
| 90+ DPD | 9 | 14 | 3 | 1 | — | 1 | 15 | 13 | 56 | ||||||||||||||||||||||||||||||||||||||||||||
| Total other consumer | $ | 3,306 | 2,178 | 583 | 169 | 94 | 64 | 22,020 | 125 | 28,539 | |||||||||||||||||||||||||||||||||||||||||||
By updated FICO: |
|||||||||||||||||||||||||||||||||||||||||||||||||||||
| 740+ | $ | 1,911 | 926 | 265 | 85 | 36 | 28 | 1,152 | 27 | 4,430 | |||||||||||||||||||||||||||||||||||||||||||
| 700-739 | 642 | 409 | 107 | 27 | 14 | 10 | 507 | 16 | 1,732 | ||||||||||||||||||||||||||||||||||||||||||||
| 660-699 | 403 | 365 | 93 | 16 | 11 | 8 | 395 | 16 | 1,307 | ||||||||||||||||||||||||||||||||||||||||||||
| 620-659 | 129 | 166 | 45 | 6 | 6 | 5 | 147 | 11 | 515 | ||||||||||||||||||||||||||||||||||||||||||||
| <620 | 75 | 152 | 49 | 8 | 8 | 6 | 152 | 17 | 467 | ||||||||||||||||||||||||||||||||||||||||||||
| No FICO available (1) | 146 | 160 | 24 | 27 | 19 | 7 | 19,667 | 38 | 20,088 | ||||||||||||||||||||||||||||||||||||||||||||
| Total other consumer | $ | 3,306 | 2,178 | 583 | 169 | 94 | 64 | 22,020 | 125 | 28,539 | |||||||||||||||||||||||||||||||||||||||||||
| Gross charge-offs (2) | $ | 178 | 158 | 52 | 9 | 9 | 6 | 62 | 11 | 485 | |||||||||||||||||||||||||||||||||||||||||||
| Term loans by origination year | Revolving loans | Revolving loans converted to term loans | Total | ||||||||||||||||||||||||||||||||||||||||||||||||||
| (in millions) | 2022 | 2021 | 2020 | 2019 | 2018 | Prior | |||||||||||||||||||||||||||||||||||||||||||||||
| December 31, 2022 | |||||||||||||||||||||||||||||||||||||||||||||||||||||
| By delinquency status: | |||||||||||||||||||||||||||||||||||||||||||||||||||||
| Current-29 DPD | $ | 3,718 | 1,184 | 341 | 240 | 63 | 83 | 23,431 | 117 | 29,177 | |||||||||||||||||||||||||||||||||||||||||||
| 30-89 DPD | 17 | 12 | 2 | 3 | 1 | 2 | 14 | 8 | 59 | ||||||||||||||||||||||||||||||||||||||||||||
| 90+ DPD | 5 | 5 | 1 | 1 | — | 1 | 13 | 14 | 40 | ||||||||||||||||||||||||||||||||||||||||||||
| Total other consumer | $ | 3,740 | 1,201 | 344 | 244 | 64 | 86 | 23,458 | 139 | 29,276 | |||||||||||||||||||||||||||||||||||||||||||
By updated FICO: |
|||||||||||||||||||||||||||||||||||||||||||||||||||||
| 740+ | $ | 1,908 | 546 | 174 | 112 | 21 | 50 | 1,660 | 43 | 4,514 | |||||||||||||||||||||||||||||||||||||||||||
| 700-739 | 726 | 216 | 62 | 44 | 10 | 13 | 568 | 18 | 1,657 | ||||||||||||||||||||||||||||||||||||||||||||
| 660-699 | 527 | 177 | 34 | 33 | 9 | 8 | 449 | 19 | 1,256 | ||||||||||||||||||||||||||||||||||||||||||||
| 620-659 | 204 | 81 | 13 | 14 | 4 | 5 | 181 | 11 | 513 | ||||||||||||||||||||||||||||||||||||||||||||
| <620 | 89 | 64 | 14 | 16 | 5 | 5 | 154 | 18 | 365 | ||||||||||||||||||||||||||||||||||||||||||||
| No FICO available (1) | 286 | 117 | 47 | 25 | 15 | 5 | 20,446 | 30 | 20,971 | ||||||||||||||||||||||||||||||||||||||||||||
| Total other consumer | $ | 3,740 | 1,201 | 344 | 244 | 64 | 86 | 23,458 | 139 | 29,276 | |||||||||||||||||||||||||||||||||||||||||||
| Wells Fargo & Company | 121 |
|||||||
| Amortized cost | Recognized interest income | ||||||||||||||||||||||||||||||||||
| Nonaccrual loans | Nonaccrual loans without related allowance for credit losses (1) | Year ended December 31, | |||||||||||||||||||||||||||||||||
| (in millions) | Dec 31, 2023 |
Dec 31, 2022 |
Dec 31, 2023 |
Dec 31, 2022 |
2023 | 2022 | |||||||||||||||||||||||||||||
| Commercial and industrial | $ | 662 | 746 | 149 | 174 | 17 | 63 | ||||||||||||||||||||||||||||
| Commercial real estate | 4,188 | 958 | 107 | 134 | 29 | 54 | |||||||||||||||||||||||||||||
| Lease financing | 64 | 119 | 10 | 5 | — | — | |||||||||||||||||||||||||||||
| Total commercial | 4,914 | 1,823 | 266 | 313 | 46 | 117 | |||||||||||||||||||||||||||||
| Residential mortgage | 3,192 | 3,611 | 2,047 | 2,316 | 192 | 211 | |||||||||||||||||||||||||||||
| Auto | 115 | 153 | — | — | 18 | 26 | |||||||||||||||||||||||||||||
| Other consumer | 35 | 39 | — | — | 4 | 4 | |||||||||||||||||||||||||||||
| Total consumer | 3,342 | 3,803 | 2,047 | 2,316 | 214 | 241 | |||||||||||||||||||||||||||||
| Total nonaccrual loans | $ | 8,256 | 5,626 | 2,313 | 2,629 | 260 | 358 | ||||||||||||||||||||||||||||
| (in millions) | Dec 31, 2023 |
Dec 31, 2022 |
|||||||||
| Total: | $ | 3,751 | 4,340 | ||||||||
| Less: FHA insured/VA guaranteed (1) | 2,646 | 3,005 | |||||||||
| Total, not government insured/guaranteed | $ | 1,105 | 1,335 | ||||||||
By segment and class, not government insured/guaranteed: |
|||||||||||
| Commercial and industrial | $ | 43 | 583 | ||||||||
| Commercial real estate | 145 | 134 | |||||||||
| Total commercial | 188 | 717 | |||||||||
| Residential mortgage | 31 | 28 | |||||||||
| Credit card | 743 | 455 | |||||||||
| Auto | 101 | 111 | |||||||||
| Other consumer | 42 | 24 | |||||||||
| Total consumer | 917 | 618 | |||||||||
| Total, not government insured/guaranteed | $ | 1,105 | 1,335 | ||||||||
122 |
Wells Fargo & Company | |||||||
| Modification type (1) | Modifications as a % of loan class |
||||||||||||||||||||||||||||||||||||||||
| ($ in millions) | Interest rate reduction |
Payment delay | Term extension | Term extension & payment delay | All other modifications and combinations | Total | |||||||||||||||||||||||||||||||||||
| Year ended December 31, 2023 | |||||||||||||||||||||||||||||||||||||||||
| Commercial and industrial | $ | 18 | 25 | 286 | 100 | 1 | 430 | 0.11 | % | ||||||||||||||||||||||||||||||||
| Commercial real estate | 7 | 1 | 458 | — | 1 | 467 | 0.31 | ||||||||||||||||||||||||||||||||||
| Total commercial | $ | 25 | 26 | 744 | 100 | 2 | 897 | 0.17 | |||||||||||||||||||||||||||||||||
| Weighted average interest rate reduction | Weighted average payments deferred (months) | Weighted average term extension (months) | |||||||||||||||
| Year ended December 31, 2023 | |||||||||||||||||
| Commercial and industrial | 15.17 | % | 11 | 15 | |||||||||||||
| Commercial real estate | 3.50 | 6 | 24 | ||||||||||||||
| Wells Fargo & Company | 123 |
|||||||
| By delinquency status | Gross charge-offs | ||||||||||||||||||||||||||||
| (in millions) | Current-29 days past due (DPD) | 30-89 DPD | 90+ DPD | Total | Year ended | ||||||||||||||||||||||||
| December 31, 2023 | |||||||||||||||||||||||||||||
| Commercial and industrial | $ | 308 | 8 | 8 | 324 | 45 | |||||||||||||||||||||||
| Commercial real estate | 380 | 87 | — | 467 | 2 | ||||||||||||||||||||||||
| Total commercial | $ | 688 | 95 | 8 | 791 | 47 | |||||||||||||||||||||||
| Modification type | |||||||||||||||||||||||||||||||||||||||||||||||||||||
| ($ in millions) | Interest rate reduction |
Payment delay (1) | Term extension | Interest rate reduction & term extension | Term extension & payment delay | Interest rate reduction, term extension & payment delay | All other modifications and combinations (2) | Total | Modifications as a % of loan class | ||||||||||||||||||||||||||||||||||||||||||||
| Year ended December 31, 2023 | |||||||||||||||||||||||||||||||||||||||||||||||||||||
| Residential mortgage | $ | 10 | 472 | 67 | 40 | 88 | 80 | 7 | 764 | 0.29 | % | ||||||||||||||||||||||||||||||||||||||||||
| Credit card | 459 | — | — | — | — | — | — | 459 | 0.88 | ||||||||||||||||||||||||||||||||||||||||||||
| Auto | 4 | 20 | — | — | — | — | — | 24 | 0.05 | ||||||||||||||||||||||||||||||||||||||||||||
| Other consumer | 11 | 2 | — | 31 | — | — | — | 44 | 0.15 | ||||||||||||||||||||||||||||||||||||||||||||
| Total consumer | $ | 484 | 494 | 67 | 71 | 88 | 80 | 7 | 1,291 | 0.33 | |||||||||||||||||||||||||||||||||||||||||||
| Weighted average interest rate reduction | Weighted average payments deferred (months) | Weighted average term extension (years) | |||||||||||||||
| Year ended December 31, 2023 | |||||||||||||||||
| Residential mortgage (2) | 1.65 | % | 5 | 9.8 | |||||||||||||
| Credit card | 21.63 | N/A | N/A | ||||||||||||||
| Auto | 4.09 | 6 | N/A | ||||||||||||||
| Other consumer | 11.09 | 4 | 2.1 | ||||||||||||||
124 |
Wells Fargo & Company | |||||||
| By delinquency status | Gross charge-offs | ||||||||||||||||||||||||||||
| (in millions) | Current-29 days past due (DPD) | 30-89 DPD | 90+ DPD | Total | Year ended | ||||||||||||||||||||||||
| December 31, 2023 | |||||||||||||||||||||||||||||
| Residential mortgage (1) | $ | 460 | 120 | 180 | 760 | 9 | |||||||||||||||||||||||
| Credit card (2) | 344 | 68 | 47 | 459 | 82 | ||||||||||||||||||||||||
| Auto | 19 | 4 | 1 | 24 | 3 | ||||||||||||||||||||||||
| Other consumer | 37 | 5 | 2 | 44 | 4 | ||||||||||||||||||||||||
| Total | $ | 860 | 197 | 230 | 1,287 | 98 | |||||||||||||||||||||||
| Wells Fargo & Company | 125 |
|||||||
| Primary modification type (1) | Financial effects of modifications | ||||||||||||||||||||||||||||||||||||||||
| ($ in millions) | Principal forgiveness | Interest rate reduction |
Other concessions (2) |
Total | Charge- offs (3) |
Weighted average interest rate reduction |
Recorded investment related to interest rate reduction (4) |
||||||||||||||||||||||||||||||||||
| Year ended December 31, 2022 | |||||||||||||||||||||||||||||||||||||||||
| Commercial and industrial | $ | 24 | 24 | 349 | 397 | — | 10.69 | % | $ | 24 | |||||||||||||||||||||||||||||||
| Commercial real estate | — | 12 | 112 | 124 | — | 0.92 | 12 | ||||||||||||||||||||||||||||||||||
| Lease financing | — | — | 2 | 2 | — | — | — | ||||||||||||||||||||||||||||||||||
| Total commercial | 24 | 36 | 463 | 523 | — | 7.51 | 36 | ||||||||||||||||||||||||||||||||||
| Residential mortgage | 1 | 369 | 1,357 | 1,727 | 6 | 1.61 | 369 | ||||||||||||||||||||||||||||||||||
| Credit card | — | 311 | — | 311 | — | 20.33 | 311 | ||||||||||||||||||||||||||||||||||
| Auto | 2 | 7 | 63 | 72 | 16 | 4.33 | 7 | ||||||||||||||||||||||||||||||||||
| Other consumer | — | 19 | 3 | 22 | 1 | 11.48 | 19 | ||||||||||||||||||||||||||||||||||
| Trial modifications (5) | — | — | 228 | 228 | — | — | — | ||||||||||||||||||||||||||||||||||
| Total consumer | 3 | 706 | 1,651 | 2,360 | 23 | 10.14 | 706 | ||||||||||||||||||||||||||||||||||
| Total | $ | 27 | 742 | 2,114 | 2,883 | 23 | 10.02 | % | $ | 742 | |||||||||||||||||||||||||||||||
| Year ended December 31, 2021 | |||||||||||||||||||||||||||||||||||||||||
| Commercial and industrial | $ | 2 | 9 | 879 | 890 | 20 | 0.81 | % | $ | 9 | |||||||||||||||||||||||||||||||
| Commercial real estate | 41 | 15 | 259 | 315 | — | 1.28 | 14 | ||||||||||||||||||||||||||||||||||
| Lease financing | — | — | 7 | 7 | — | — | — | ||||||||||||||||||||||||||||||||||
| Total commercial | 43 | 24 | 1,145 | 1,212 | 20 | 1.11 | 23 | ||||||||||||||||||||||||||||||||||
| Residential mortgage | — | 70 | 1,324 | 1,394 | 3 | 1.80 | 70 | ||||||||||||||||||||||||||||||||||
| Credit card | — | 106 | — | 106 | — | 19.12 | 106 | ||||||||||||||||||||||||||||||||||
| Auto | 1 | 4 | 131 | 136 | 54 | 3.82 | 4 | ||||||||||||||||||||||||||||||||||
| Other consumer | — | 18 | 1 | 19 | — | 11.83 | 18 | ||||||||||||||||||||||||||||||||||
| Trial modifications (5) | — | — | (3) | (3) | — | — | — | ||||||||||||||||||||||||||||||||||
| Total consumer | 1 | 198 | 1,453 | 1,652 | 57 | 12.01 | 198 | ||||||||||||||||||||||||||||||||||
| Total | $ | 44 | 222 | 2,598 | 2,864 | 77 | 10.84 | % | $ | 221 | |||||||||||||||||||||||||||||||
| Recorded investment of defaults | |||||||||||
| Year ended December 31, | |||||||||||
| (in millions) | 2022 | 2021 | |||||||||
| Commercial and industrial | $ | 55 | 132 | ||||||||
| Commercial real estate | 14 | 34 | |||||||||
| Lease financing | — | 1 | |||||||||
| Total commercial | 69 | 167 | |||||||||
| Residential mortgage | 142 | 13 | |||||||||
| Credit card | 43 | 25 | |||||||||
| Auto | 21 | 43 | |||||||||
| Other consumer | 2 | 3 | |||||||||
| Total consumer | 208 | 84 | |||||||||
| Total | $ | 277 | 251 | ||||||||
126 |
Wells Fargo & Company | |||||||
Note 6: Mortgage Banking Activities | ||
| Year ended December 31, | |||||||||||||||||
| (in millions) | 2023 | 2022 | 2021 | ||||||||||||||
Residential MSRs at fair value, beginning of period |
$ | 9,310 | 6,920 | 6,125 | |||||||||||||
| Originations/purchases | 161 | 1,003 | 1,645 | ||||||||||||||
| Sales and other (1) | (902) | (614) | (8) | ||||||||||||||
| Net additions | (741) | 389 | 1,637 | ||||||||||||||
| Changes in fair value: | |||||||||||||||||
| Due to valuation inputs or assumptions: | |||||||||||||||||
| Market interest rates (2) | 228 | 3,417 | 1,625 | ||||||||||||||
| Servicing and foreclosure costs | (14) | (17) | (9) | ||||||||||||||
| Discount rates | (149) | 42 | (56) | ||||||||||||||
| Prepayment estimates and other (3) | 21 | (188) | (390) | ||||||||||||||
| Net changes in valuation inputs or assumptions | 86 | 3,254 | 1,170 | ||||||||||||||
| Changes due to collection/realization of expected cash flows (4) | (1,187) | (1,253) | (2,012) | ||||||||||||||
| Total changes in fair value | (1,101) | 2,001 | (842) | ||||||||||||||
Residential MSRs at fair value, end of period |
7,468 | 9,310 | 6,920 | ||||||||||||||
Commercial MSRs at amortized cost, end of period (5) |
1,040 | 1,170 | 1,269 | ||||||||||||||
Total MSRs |
$ | 8,508 | 10,480 | 8,189 | |||||||||||||
($ in millions, except cost to service amounts) |
Dec 31, 2023 | Dec 31, 2022 | |||||||||
| Fair value of interests held | $ | 7,468 | 9,310 | ||||||||
| Expected weighted-average life (in years) | 6.3 | 6.3 | |||||||||
| Key assumptions: | |||||||||||
| Prepayment rate assumption (1) | 8.9 | % | 9.4 | ||||||||
| Impact on fair value from 10% adverse change | $ | 224 | 288 | ||||||||
| Impact on fair value from 25% adverse change | 538 | 688 | |||||||||
| Discount rate assumption | 9.4 | % | 9.1 | ||||||||
| Impact on fair value from 100 basis point increase | $ | 294 | 368 | ||||||||
| Impact on fair value from 200 basis point increase | 565 | 707 | |||||||||
| Cost to service assumption ($ per loan) | 105 | 102 | |||||||||
| Impact on fair value from 10% adverse change | 148 | 171 | |||||||||
| Impact on fair value from 25% adverse change | 369 | 427 | |||||||||
| Wells Fargo & Company | 127 |
|||||||
(in billions) |
Dec 31, 2023 | Dec 31, 2022 | |||||||||
| Residential mortgage servicing: | |||||||||||
| Serviced and subserviced for others | $ | 560 | 681 | ||||||||
| Owned loans serviced | 262 | 273 | |||||||||
| Total residential servicing | 822 | 954 | |||||||||
| Commercial mortgage servicing: | |||||||||||
| Serviced and subserviced for others | 548 | 577 | |||||||||
| Owned loans serviced | 128 | 133 | |||||||||
| Total commercial servicing | 676 | 710 | |||||||||
| Total managed servicing portfolio | $ | 1,498 | 1,664 | ||||||||
| Total serviced for others, excluding subserviced for others | $ | 1,099 | 1,246 | ||||||||
| MSRs as a percentage of loans serviced for others | 0.77 | % | 0.84 | ||||||||
| Weighted average note rate (mortgage loans serviced for others) | 4.50 | 4.30 | |||||||||
| Year ended December 31, | ||||||||||||||||||||
| (in millions) | 2023 | 2022 | 2021 | |||||||||||||||||
| Contractually specified servicing fees, late charges and ancillary fees | $ | 2,124 | 2,475 | 2,801 | ||||||||||||||||
| Unreimbursed servicing costs (1) | (115) | (189) | (332) | |||||||||||||||||
| Amortization for commercial MSRs (2) | (238) | (247) | (225) | |||||||||||||||||
| Changes due to collection/realization of expected cash flows (3) | (A) | (1,187) | (1,253) | (2,012) | ||||||||||||||||
| Net servicing fees | 584 | 786 | 232 | |||||||||||||||||
| Changes in fair value of MSRs due to valuation inputs or assumptions (4) | (B) | 86 | 3,254 | 1,170 | ||||||||||||||||
| Net derivative losses from economic hedges (5) | (234) | (3,507) | (1,208) | |||||||||||||||||
| Market-related valuation changes to residential MSRs, net of hedge results | (148) | (253) | (38) | |||||||||||||||||
| Total net servicing income | 436 | 533 | 194 | |||||||||||||||||
| Net gains on mortgage loan originations/sales (6) | 393 | 850 | 4,762 | |||||||||||||||||
| Total mortgage banking noninterest income | $ | 829 | 1,383 | 4,956 | ||||||||||||||||
| Total changes in residential MSRs carried at fair value | (A)+(B) | $ | (1,101) | 2,001 | (842) | |||||||||||||||
128 |
Wells Fargo & Company | |||||||
Note 7: Intangible Assets and Other Assets | ||
| (in millions) | Consumer Banking and Lending | Commercial Banking | Corporate and Investment Banking | Wealth and Investment Management | Corporate | Consolidated Company | |||||||||||||||||||||||||||||
| December 31, 2021 | $ | 16,418 | 2,938 | 5,375 | 344 | 105 | 25,180 | ||||||||||||||||||||||||||||
| Foreign currency translation | — | (7) | — | — | — | (7) | |||||||||||||||||||||||||||||
| December 31, 2022 | 16,418 | 2,931 | 5,375 | 344 | 105 | 25,173 | |||||||||||||||||||||||||||||
| Foreign currency translation | — | 2 | — | — | — | 2 | |||||||||||||||||||||||||||||
| December 31, 2023 | $ | 16,418 | 2,933 | 5,375 | 344 | 105 | 25,175 | ||||||||||||||||||||||||||||
| (in millions) | Dec 31, 2023 | Dec 31, 2022 | |||||||||
| Corporate/bank-owned life insurance (1) | $ | 19,705 | 20,807 | ||||||||
| Accounts receivable (2) | 30,541 | 23,646 | |||||||||
| Interest receivable: | |||||||||||
| AFS and HTM debt securities | 1,616 | 1,572 | |||||||||
| Loans | 3,933 | 3,470 | |||||||||
| Trading and other | 1,211 | 767 | |||||||||
| Operating lease assets (lessor) | 5,558 | 5,790 | |||||||||
| Operating lease ROU assets (lessee) | 3,412 | 3,837 | |||||||||
| Other (3)(4) | 12,839 | 15,949 | |||||||||
| Total other assets | $ | 78,815 | 75,838 | ||||||||
| Wells Fargo & Company | 129 |
|||||||
Note 8: Leasing Activity | ||
| Year ended December 31, | |||||||||||||||||
| (in millions) | 2023 | 2022 | 2021 | ||||||||||||||
| Interest income on lease financing | $ | 740 | 600 | 683 | |||||||||||||
| Other lease revenue: | |||||||||||||||||
| Variable revenue on lease financing | 97 | 114 | 101 | ||||||||||||||
| Fixed revenue on operating leases | 968 | 972 | 995 | ||||||||||||||
| Variable revenue on operating leases | 43 | 58 | 64 | ||||||||||||||
| Other lease-related revenue (1) | 129 | 125 | (164) | ||||||||||||||
| Noninterest income on leases | 1,237 | 1,269 | 996 | ||||||||||||||
| Total leasing revenue | $ | 1,977 | 1,869 | 1,679 | |||||||||||||
| (in millions) | Dec 31, 2023 | Dec 31, 2022 | ||||||
| Lease receivables | $ | 15,142 | 13,139 | |||||
| Residual asset values | 3,678 | 3,554 | ||||||
| Unearned income | (2,397) | (1,785) | ||||||
| Lease financing | $ | 16,423 | 14,908 | |||||
| December 31, 2023 | ||||||||
| (in millions) | Direct financing and sales- type leases | Operating leases | ||||||
| 2024 | $ | 4,470 | 577 | |||||
| 2025 | 3,663 | 453 | ||||||
| 2026 | 2,489 | 308 | ||||||
| 2027 | 1,593 | 216 | ||||||
| 2028 | 905 | 133 | ||||||
| Thereafter | 2,022 | 219 | ||||||
| Total lease receivables | $ | 15,142 | 1,906 | |||||
| (in millions) | Dec 31, 2023 | Dec 31, 2022 | ||||||
| ROU assets | $ | 3,412 | 3,837 | |||||
| Lease liabilities | 4,060 | 4,465 | ||||||
| Year ended December 31, | |||||||||||||||||
| (in millions) | 2023 | 2022 | 2021 | ||||||||||||||
| Fixed lease expense – operating leases | $ | 990 | 1,022 | 1,048 | |||||||||||||
| Variable lease expense | 268 | 277 | 289 | ||||||||||||||
| Other (1) | (52) | (37) | (93) | ||||||||||||||
| Total lease costs | $ | 1,206 | 1,262 | 1,244 | |||||||||||||
130 |
Wells Fargo & Company | |||||||
| (in millions, except for weighted averages) | Dec 31, 2023 | ||||
| 2024 | $ | 875 | |||
| 2025 | 887 | ||||
| 2026 | 747 | ||||
| 2027 | 598 | ||||
| 2028 | 453 | ||||
Thereafter |
930 | ||||
| Total lease payments | 4,490 | ||||
| Less: imputed interest | 430 | ||||
| Total operating lease liabilities | $ | 4,060 | |||
| Weighted average remaining lease term (in years) | 6.5 | ||||
| Weighted average discount rate | 3.0 | % | |||
| Wells Fargo & Company | 131 |
|||||||
Note 9: Deposits | ||
| December 31, | |||||||||||||||||
| (in millions) | 2023 | 2022 | |||||||||||||||
| Total domestic and Non-U.S. | $ | 192,267 | 66,887 | ||||||||||||||
| Time deposits in excess of $250,000 | 57,489 | 9,133 | |||||||||||||||
(in millions) |
December 31, 2023 | ||||
| 2024 | $ | 163,235 | |||
| 2025 | 22,565 | ||||
| 2026 | 1,962 | ||||
| 2027 | 1,582 | ||||
| 2028 | 2,579 | ||||
| Thereafter | 344 | ||||
| Total | $ | 192,267 | |||
132 |
Wells Fargo & Company | |||||||
Note 10: Long-Term Debt | ||
| December 31, | |||||||||||||||||||||||
| 2023 | 2022 | ||||||||||||||||||||||
| (in millions) | Maturity date(s) | Stated interest rate(s) | |||||||||||||||||||||
| Wells Fargo & Company (Parent only) | |||||||||||||||||||||||
| Senior | |||||||||||||||||||||||
| Fixed-rate notes | 2024-2045 |
0.50-6.75% |
$ | 42,384 | 43,749 | ||||||||||||||||||
| Floating-rate notes | 2026-2048 |
5.38-6.65% |
1,046 | 1,046 | |||||||||||||||||||
| FixFloat notes | 2025-2053 |
0.81-6.49% |
77,958 | 60,752 | |||||||||||||||||||
| Structured notes (1) | 6,900 | 6,305 | |||||||||||||||||||||
| Total senior debt – Parent | 128,288 | 111,852 | |||||||||||||||||||||
| Subordinated | |||||||||||||||||||||||
| Fixed-rate notes (2) | 2024-2046 |
3.87-7.57% |
18,841 | 21,379 | |||||||||||||||||||
| Total subordinated debt – Parent | 18,841 | 21,379 | |||||||||||||||||||||
| Junior subordinated | |||||||||||||||||||||||
| Fixed-rate notes | 2029-2036 |
5.95-7.95% |
828 | 827 | |||||||||||||||||||
| Floating-rate notes | 2027 |
6.16-6.66% |
355 | 343 | |||||||||||||||||||
| Total junior subordinated debt – Parent (3) | 1,183 | 1,170 | |||||||||||||||||||||
| Total long-term debt – Parent (2) | 148,312 | 134,401 | |||||||||||||||||||||
| Wells Fargo Bank, N.A., and other bank entities (Bank) | |||||||||||||||||||||||
| Senior | |||||||||||||||||||||||
| Fixed-rate notes | 2025-2026 |
5.25-5.55% |
6,506 | — | |||||||||||||||||||
| Floating-rate notes | 2025-2053 |
5.32-6.40% |
1,416 | 117 | |||||||||||||||||||
| Floating-rate advances – Federal Home Loan Bank (FHLB) (4) | 2024-2028 |
5.63-6.32% |
38,000 | 27,000 | |||||||||||||||||||
| Structured notes (1) | 1,137 | 262 | |||||||||||||||||||||
| Finance leases | 2024-2029 |
1.13-2.87% |
19 | 22 | |||||||||||||||||||
| Total senior debt – Bank | 47,078 | 27,401 | |||||||||||||||||||||
| Subordinated | |||||||||||||||||||||||
| Fixed-rate notes | 2025-2038 |
5.85-7.74% |
3,416 | 4,305 | |||||||||||||||||||
| Total subordinated debt – Bank | 3,416 | 4,305 | |||||||||||||||||||||
| Junior subordinated | |||||||||||||||||||||||
| Floating-rate notes | 2027 |
6.21-6.31% |
414 | 401 | |||||||||||||||||||
| Total junior subordinated debt – Bank (3) | 414 | 401 | |||||||||||||||||||||
| Other bank debt (5) | 2024-2063 |
0.50-9.00% |
7,558 | 7,082 | |||||||||||||||||||
| Total long-term debt – Bank | $ | 58,466 | 39,189 | ||||||||||||||||||||
| Wells Fargo & Company | 133 |
|||||||
| December 31, | |||||||||||||||||||||||
| 2023 | 2022 | ||||||||||||||||||||||
| (in millions) | Maturity date(s) | Stated interest rate(s) | |||||||||||||||||||||
| Other consolidated subsidiaries | |||||||||||||||||||||||
| Senior | |||||||||||||||||||||||
| Fixed-rate notes | $ | — | 369 | ||||||||||||||||||||
| Structured notes (1) | 810 | 911 | |||||||||||||||||||||
| Total long-term debt – Other consolidated subsidiaries | 810 | 1,280 | |||||||||||||||||||||
| Total long-term debt (6) | $ | 207,588 | 174,870 | ||||||||||||||||||||
| December 31, 2023 | |||||||||||||||||||||||||||||||||||||||||
| (in millions) | 2024 | 2025 | 2026 | 2027 | 2028 |
Thereafter | Total | ||||||||||||||||||||||||||||||||||
| Wells Fargo & Company (Parent Only) | |||||||||||||||||||||||||||||||||||||||||
| Senior debt | $ | 8,721 | 14,546 | 24,229 | 7,843 | 13,659 | 59,290 | 128,288 | |||||||||||||||||||||||||||||||||
| Subordinated debt | 722 | 978 | 2,662 | 2,384 | — | 12,095 | 18,841 | ||||||||||||||||||||||||||||||||||
| Junior subordinated debt | — | — | — | 355 | — | 828 | 1,183 | ||||||||||||||||||||||||||||||||||
| Total long-term debt – Parent | 9,443 | 15,524 | 26,891 | 10,582 | 13,659 | 72,213 | 148,312 | ||||||||||||||||||||||||||||||||||
| Wells Fargo Bank, N.A., and other bank entities (Bank) | |||||||||||||||||||||||||||||||||||||||||
| Senior debt | 17,741 | 3,696 | 5,475 | 3 | 20,003 | 160 | 47,078 | ||||||||||||||||||||||||||||||||||
| Subordinated debt | — | 149 | — | 27 | 196 | 3,044 | 3,416 | ||||||||||||||||||||||||||||||||||
| Junior subordinated debt | — | — | — | 414 | — | — | 414 | ||||||||||||||||||||||||||||||||||
| Other bank debt | 2,843 | 1,082 | 712 | 518 | 62 | 2,341 | 7,558 | ||||||||||||||||||||||||||||||||||
| Total long-term debt – Bank | 20,584 | 4,927 | 6,187 | 962 | 20,261 | 5,545 | 58,466 | ||||||||||||||||||||||||||||||||||
| Other consolidated subsidiaries | |||||||||||||||||||||||||||||||||||||||||
| Senior debt | 72 | 403 | 220 | — | 5 | 110 | 810 | ||||||||||||||||||||||||||||||||||
| Total long-term debt – Other consolidated subsidiaries | 72 | 403 | 220 | — | 5 | 110 | 810 | ||||||||||||||||||||||||||||||||||
| Total long-term debt | $ | 30,099 | 20,854 | 33,298 | 11,544 | 33,925 | 77,868 | 207,588 | |||||||||||||||||||||||||||||||||
134 |
Wells Fargo & Company | |||||||
Note 11: Preferred Stock | ||
| December 31, 2023 | December 31, 2022 | |||||||||||||||||||||||||||||||||||||||||||||||||||||||
| (in millions, except shares) | Earliest redemption date | Shares authorized and designated |
Shares issued and outstanding | Liquidation preference value | Carrying value |
Shares authorized and designated |
Shares issued and outstanding |
Liquidation preference value | Carrying value | |||||||||||||||||||||||||||||||||||||||||||||||
| DEP Shares | ||||||||||||||||||||||||||||||||||||||||||||||||||||||||
| Dividend Equalization Preferred Shares (DEP) | Currently redeemable | 97,000 | 96,546 | $ | — | — | 97,000 | 96,546 | $ | — | — | |||||||||||||||||||||||||||||||||||||||||||||
| Preferred Stock: | ||||||||||||||||||||||||||||||||||||||||||||||||||||||||
Series L (1) |
||||||||||||||||||||||||||||||||||||||||||||||||||||||||
7.50% Non-Cumulative Perpetual Convertible Class A |
— | 4,025,000 | 3,967,981 | 3,968 | 3,200 | 4,025,000 | 3,967,986 | 3,968 | 3,200 | |||||||||||||||||||||||||||||||||||||||||||||||
| Series Q | ||||||||||||||||||||||||||||||||||||||||||||||||||||||||
5.85% Fixed-to-Floating Non-Cumulative Perpetual Class A |
Redeemed | — | — | — | — | 69,000 | 69,000 | 1,725 | 1,725 | |||||||||||||||||||||||||||||||||||||||||||||||
| Series R | ||||||||||||||||||||||||||||||||||||||||||||||||||||||||
6.625% Fixed-to-Floating Non-Cumulative Perpetual Class A |
3/15/2024 | 34,500 | 33,600 | 840 | 840 | 34,500 | 33,600 | 840 | 840 | |||||||||||||||||||||||||||||||||||||||||||||||
| Series S | ||||||||||||||||||||||||||||||||||||||||||||||||||||||||
5.90% Fixed-to-Floating Non-Cumulative Perpetual Class A |
6/15/2024 | 80,000 | 80,000 | 2,000 | 2,000 | 80,000 | 80,000 | 2,000 | 2,000 | |||||||||||||||||||||||||||||||||||||||||||||||
| Series U | ||||||||||||||||||||||||||||||||||||||||||||||||||||||||
5.875% Fixed-to-Floating Non-Cumulative Perpetual Class A |
6/15/2025 | 80,000 | 80,000 | 2,000 | 2,000 | 80,000 | 80,000 | 2,000 | 2,000 | |||||||||||||||||||||||||||||||||||||||||||||||
| Series Y | ||||||||||||||||||||||||||||||||||||||||||||||||||||||||
5.625% Non-Cumulative Perpetual Class A |
Currently redeemable | 27,600 | 27,600 | 690 | 690 | 27,600 | 27,600 | 690 | 690 | |||||||||||||||||||||||||||||||||||||||||||||||
| Series Z | ||||||||||||||||||||||||||||||||||||||||||||||||||||||||
4.75% Non-Cumulative Perpetual Class A |
3/15/2025 | 80,500 | 80,500 | 2,013 | 2,013 | 80,500 | 80,500 | 2,013 | 2,013 | |||||||||||||||||||||||||||||||||||||||||||||||
| Series AA | ||||||||||||||||||||||||||||||||||||||||||||||||||||||||
4.70% Non-Cumulative Perpetual Class A |
12/15/2025 | 46,800 | 46,800 | 1,170 | 1,170 | 46,800 | 46,800 | 1,170 | 1,170 | |||||||||||||||||||||||||||||||||||||||||||||||
| Series BB | ||||||||||||||||||||||||||||||||||||||||||||||||||||||||
3.90% Fixed-Reset Non-Cumulative Perpetual Class A |
3/15/2026 | 140,400 | 140,400 | 3,510 | 3,510 | 140,400 | 140,400 | 3,510 | 3,510 | |||||||||||||||||||||||||||||||||||||||||||||||
| Series CC | ||||||||||||||||||||||||||||||||||||||||||||||||||||||||
4.375% Non-Cumulative Perpetual Class A |
3/15/2026 | 46,000 | 42,000 | 1,050 | 1,050 | 46,000 | 42,000 | 1,050 | 1,050 | |||||||||||||||||||||||||||||||||||||||||||||||
| Series DD | ||||||||||||||||||||||||||||||||||||||||||||||||||||||||
4.25% Non-Cumulative Perpetual Class A |
9/15/2026 | 50,000 | 50,000 | 1,250 | 1,250 | 50,000 | 50,000 | 1,250 | 1,250 | |||||||||||||||||||||||||||||||||||||||||||||||
| Series EE | ||||||||||||||||||||||||||||||||||||||||||||||||||||||||
7.625% Fixed-Reset Non-Cumulative Perpetual Class A |
9/15/2028 | 69,000 | 69,000 | 1,725 | 1,725 | — | — | — | — | |||||||||||||||||||||||||||||||||||||||||||||||
| Total | 4,776,800 | 4,714,427 | $ | 20,216 | 19,448 | 4,776,800 | 4,714,432 | $ | 20,216 | 19,448 | ||||||||||||||||||||||||||||||||||||||||||||||
| Wells Fargo & Company | 135 |
|||||||
Note 12: Common Stock and Stock Plans | ||
| Number of shares | |||||
| Shares reserved (1) | 259,837,463 | ||||
| Shares issued | 5,481,811,474 | ||||
| Shares not reserved or issued | 3,258,351,063 | ||||
| Total shares authorized | 9,000,000,000 | ||||
| Year ended December 31, | |||||||||||||||||
| (in millions) | 2023 | 2022 | 2021 | ||||||||||||||
| RSRs | $ | 1,069 | 947 | 931 | |||||||||||||
| Performance shares (1) | 53 | 31 | 74 | ||||||||||||||
| Total stock compensation expense | $ | 1,122 | 978 | 1,005 | |||||||||||||
| Related recognized tax benefit | $ | 277 | 242 | 248 | |||||||||||||
| Number | Weighted- average grant-date fair value |
||||||||||
Nonvested at January 1, 2023 |
53,237,143 | $ | 42.44 | ||||||||
| Granted | 29,938,962 | 44.15 | |||||||||
| Vested | (21,562,727) | 42.92 | |||||||||
| Canceled or forfeited | (2,066,131) | 43.91 | |||||||||
Nonvested at December 31, 2023 |
59,547,247 | 43.07 | |||||||||
| Number |
Weighted-
average
grant-date
fair value (1)
|
||||||||||
Nonvested at January 1, 2023 |
4,508,337 | $ | 36.81 | ||||||||
| Granted | 1,193,556 | 44.33 | |||||||||
| Vested | (766,527) | 42.67 | |||||||||
| Canceled or forfeited | (647,543) | 45.73 | |||||||||
Nonvested at December 31, 2023 |
4,287,823 | 36.51 | |||||||||
136 |
Wells Fargo & Company | |||||||
| December 31, | |||||||||||||||||
| (in millions, except shares) | 2023 | 2022 | 2021 | ||||||||||||||
| Allocated shares outstanding (common) | 144,140,446 | 152,438,152 | 149,638,081 | ||||||||||||||
| Unreleased shares outstanding (common) | — | 10,329,650 | — | ||||||||||||||
| Fair value of unreleased shares outstanding (common) | $ | — | 427 | — | |||||||||||||
| Unreleased shares outstanding (preferred) | — | — | 609,434 | ||||||||||||||
| Conversion value of unreleased ESOP preferred shares | $ | — | — | 609 | |||||||||||||
| Fair value of unreleased ESOP preferred shares based on redemption | — | — | 700 | ||||||||||||||
| Year ended December 31, | |||||||||||||||||
| Dividends paid on (in millions): | 2023 | 2022 | 2021 | ||||||||||||||
| Allocated shares (common) | $ | 161 | 134 | 74 | |||||||||||||
| Unreleased shares (common) (1) | 13 | 4 | — | ||||||||||||||
| Unreleased shares (preferred) | — | 36 | 66 | ||||||||||||||
| Wells Fargo & Company | 137 |
|||||||
Note 13: Legal Actions | ||
138 |
Wells Fargo & Company | |||||||
| Wells Fargo & Company | 139 |
|||||||
Note 14: Derivatives | ||
| December 31, 2023 | December 31, 2022 | ||||||||||||||||||||||||||||||||||
| Notional or contractual amount | Fair value | Notional or contractual amount | Fair value | ||||||||||||||||||||||||||||||||
| Derivative assets | Derivative liabilities | Derivative assets | Derivative liabilities | ||||||||||||||||||||||||||||||||
| (in millions) | |||||||||||||||||||||||||||||||||||
| Derivatives designated as hedging instruments | |||||||||||||||||||||||||||||||||||
| Interest rate contracts | $ | 357,096 | 639 | 570 | 263,876 | 670 | 579 | ||||||||||||||||||||||||||||
| Commodity contracts | 2,600 | 24 | 12 | 1,681 | 9 | 25 | |||||||||||||||||||||||||||||
| Foreign exchange contracts | 4,193 | 60 | 395 | 15,544 | 161 | 1,015 | |||||||||||||||||||||||||||||
| Total derivatives designated as qualifying hedging instruments | 723 | 977 | 840 | 1,619 | |||||||||||||||||||||||||||||||
| Derivatives not designated as hedging instruments | |||||||||||||||||||||||||||||||||||
| Interest rate contracts | 10,409,720 | 31,806 | 36,312 | 10,222,027 | 40,416 | 42,894 | |||||||||||||||||||||||||||||
| Commodity contracts | 88,491 | 2,717 | 2,734 | 96,001 | 5,991 | 3,420 | |||||||||||||||||||||||||||||
Equity contracts (1) |
438,458 | 13,305 | 13,810 | 393,753 | 9,573 | 8,254 | |||||||||||||||||||||||||||||
| Foreign exchange contracts | 2,273,383 | 24,707 | 26,762 | 1,513,363 | 22,052 | 25,671 | |||||||||||||||||||||||||||||
| Credit contracts | 60,439 | 113 | 44 | 45,649 | 66 | 36 | |||||||||||||||||||||||||||||
| Total derivatives not designated as hedging instruments | 72,648 | 79,662 | 78,098 | 80,275 | |||||||||||||||||||||||||||||||
| Total derivatives before netting | 73,371 | 80,639 | 78,938 | 81,894 | |||||||||||||||||||||||||||||||
| Netting | (55,148) | (62,144) | (56,164) | (61,827) | |||||||||||||||||||||||||||||||
| Total | $ | 18,223 | 18,495 | 22,774 | 20,067 | ||||||||||||||||||||||||||||||
140 |
Wells Fargo & Company | |||||||
| December 31, 2023 | December 31, 2022 | ||||||||||||||||||||||
| (in millions) | Derivative Assets | Derivative Liabilities | Derivative Assets | Derivative Liabilities | |||||||||||||||||||
| Interest rate contracts | |||||||||||||||||||||||
| Over-the-counter (OTC) | $ | 29,040 | 31,809 | 37,000 | 37,598 | ||||||||||||||||||
| OTC cleared | 1,581 | 1,397 | 649 | 845 | |||||||||||||||||||
| Exchange traded | 195 | 201 | 262 | 193 | |||||||||||||||||||
| Total interest rate contracts | 30,816 | 33,407 | 37,911 | 38,636 | |||||||||||||||||||
| Commodity contracts | |||||||||||||||||||||||
| OTC | 2,014 | 2,254 | 4,833 | 2,010 | |||||||||||||||||||
| Exchange traded | 512 | 356 | 876 | 1,134 | |||||||||||||||||||
| Total commodity contracts | 2,526 | 2,610 | 5,709 | 3,144 | |||||||||||||||||||
| Equity contracts | |||||||||||||||||||||||
| OTC | 5,375 | 8,501 | 4,269 | 4,475 | |||||||||||||||||||
| Exchange traded | 4,790 | 3,970 | 3,742 | 2,409 | |||||||||||||||||||
| Total equity contracts | 10,165 | 12,471 | 8,011 | 6,884 | |||||||||||||||||||
| Foreign exchange contracts | |||||||||||||||||||||||
| OTC | 24,511 | 26,961 | 21,537 | 26,127 | |||||||||||||||||||
| Total foreign exchange contracts | 24,511 | 26,961 | 21,537 | 26,127 | |||||||||||||||||||
| Credit contracts | |||||||||||||||||||||||
| OTC | 77 | 39 | 39 | 22 | |||||||||||||||||||
| Total credit contracts | 77 | 39 | 39 | 22 | |||||||||||||||||||
| Total derivatives subject to enforceable master netting arrangements, gross | 68,095 | 75,488 | 73,207 | 74,813 | |||||||||||||||||||
| Less: Gross amounts offset | |||||||||||||||||||||||
| Counterparty netting (1) | (50,692) | (50,606) | (49,115) | (49,073) | |||||||||||||||||||
| Cash collateral netting | (4,456) | (11,538) | (7,049) | (12,754) | |||||||||||||||||||
| Total derivatives subject to enforceable master netting arrangements, net | 12,947 | 13,344 | 17,043 | 12,986 | |||||||||||||||||||
| Derivatives not subject to enforceable master netting arrangements (2) | 5,276 | 5,151 | 5,731 | 7,081 | |||||||||||||||||||
| Total derivatives recognized in consolidated balance sheet, net | 18,223 | 18,495 | 22,774 | 20,067 | |||||||||||||||||||
| Non-cash collateral | (2,587) | (4,388) | (3,517) | (582) | |||||||||||||||||||
| Total Derivatives, net | $ | 15,636 | 14,107 | 19,257 | 19,485 | ||||||||||||||||||
| Wells Fargo & Company | 141 |
|||||||
| Net interest income | Total recorded in net income | Total recorded in OCI | ||||||||||||||||||
| (in millions) | Loans | Other interest income | Long-term debt | Derivative gains (losses) | Derivative gains (losses) | |||||||||||||||
| Year ended December 31, 2023 | ||||||||||||||||||||
| Total amounts presented in the consolidated statement of income and other comprehensive income | $ | 57,155 | 10,810 | (11,572) | N/A | 545 | ||||||||||||||
| Interest rate contracts: | ||||||||||||||||||||
| Realized gains (losses) (pre-tax) reclassified from OCI into net income | (267) | (449) | — | (716) | 716 | |||||||||||||||
| Net unrealized gains (losses) (pre-tax) recognized in OCI | N/A | N/A | N/A | N/A | (201) | |||||||||||||||
| Total gains (losses) (pre-tax) on interest rate contracts | (267) | (449) | — | (716) | 515 | |||||||||||||||
| Foreign exchange contracts: | ||||||||||||||||||||
| Realized gains (losses) (pre-tax) reclassified from OCI into net income | — | — | (8) | (8) | 8 | |||||||||||||||
| Net unrealized gains (losses) (pre-tax) recognized in OCI | N/A | N/A | N/A | N/A | — | |||||||||||||||
| Total gains (losses) (pre-tax) on foreign exchange contracts | — | — | (8) | (8) | 8 | |||||||||||||||
| Total gains (losses) (pre-tax) recognized on cash flow hedges | $ | (267) | (449) | (8) | (724) | 523 | ||||||||||||||
| Year ended December 31, 2022 | ||||||||||||||||||||
| Total amounts presented in the consolidated statement of income and other comprehensive income | $ | 37,715 | 3,308 | (5,505) | N/A | (1,448) | ||||||||||||||
| Interest rate contracts: | ||||||||||||||||||||
| Realized gains (losses) (pre-tax) reclassified from OCI into net income | (20) | 24 | — | 4 | (4) | |||||||||||||||
| Net unrealized gains (losses) (pre-tax) recognized in OCI | N/A | N/A | N/A | N/A | (1,524) | |||||||||||||||
| Total gains (losses) (pre-tax) on interest rate contracts | (20) | 24 | — | 4 | (1,528) | |||||||||||||||
| Foreign exchange contracts: | ||||||||||||||||||||
| Realized gains (losses) (pre-tax) reclassified from OCI into net income | — | — | (10) | (10) | 10 | |||||||||||||||
| Net unrealized gains (losses) (pre-tax) recognized in OCI | N/A | N/A | N/A | N/A | (17) | |||||||||||||||
| Total gains (losses) (pre-tax) on foreign exchange contracts | — | — | (10) | (10) | (7) | |||||||||||||||
| Total gains (losses) (pre-tax) recognized on cash flow hedges | $ | (20) | 24 | (10) | (6) | (1,535) | ||||||||||||||
| Year ended December 31, 2021 | ||||||||||||||||||||
| Total amounts presented in the consolidated statement of income and other comprehensive income | $ | 28,634 | 334 | (3,173) | N/A | 212 | ||||||||||||||
| Interest rate contracts: | ||||||||||||||||||||
| Realized gains (losses) (pre-tax) reclassified from OCI into net income | (137) | — | — | (137) | 137 | |||||||||||||||
| Net unrealized gains (losses) (pre-tax) recognized in OCI | N/A | N/A | N/A | N/A | 7 | |||||||||||||||
| Total gains (losses) (pre-tax) on interest rate contracts | (137) | — | — | (137) | 144 | |||||||||||||||
| Foreign exchange contracts: | ||||||||||||||||||||
| Realized gains (losses) (pre-tax) reclassified from OCI into net income | — | — | (6) | (6) | 6 | |||||||||||||||
| Net unrealized gains (losses) (pre-tax) recognized in OCI | N/A | N/A | N/A | N/A | (19) | |||||||||||||||
| Total gains (losses) (pre-tax) on foreign exchange contracts | — | — | (6) | (6) | (13) | |||||||||||||||
| Total gains (losses) (pre-tax) recognized on cash flow hedges | $ | (137) | — | (6) | (143) | 131 | ||||||||||||||
142 |
Wells Fargo & Company | |||||||
| Net interest income | Noninterest income | Total recorded in net income | Total recorded in OCI | ||||||||||||||||||||||||||
| (in millions) | Debt securities | Deposits | Long-term debt | Other | Derivative gains (losses) | Derivative gains (losses) | |||||||||||||||||||||||
| Year ended December 31, 2023 | |||||||||||||||||||||||||||||
Total amounts presented in the consolidated statement of income and other comprehensive income |
$ | 16,108 | (16,503) | (11,572) | 1,935 | N/A | 545 | ||||||||||||||||||||||
| Interest contracts | |||||||||||||||||||||||||||||
| Amounts related to cash flows on derivatives | 1,137 | (346) | (3,490) | — | (2,699) | N/A | |||||||||||||||||||||||
| Recognized on derivatives | (536) | 312 | 2,634 | — | 2,410 | — | |||||||||||||||||||||||
| Recognized on hedged items | 534 | (304) | (2,631) | — | (2,401) | N/A | |||||||||||||||||||||||
| Total gains (losses) (pre-tax) on interest rate contracts | 1,135 | (338) | (3,487) | — | (2,690) | — | |||||||||||||||||||||||
| Foreign exchange contracts | |||||||||||||||||||||||||||||
| Amounts related to cash flows on derivatives | — | — | (223) | — | (223) | N/A | |||||||||||||||||||||||
| Recognized on derivatives | — | — | 75 | 108 | 183 | 22 | |||||||||||||||||||||||
| Recognized on hedged items | — | — | (98) | (99) | (197) | N/A | |||||||||||||||||||||||
| Total gains (losses) (pre-tax) on foreign exchange contracts | — | — | (246) | 9 | (237) | 22 | |||||||||||||||||||||||
| Commodity contracts | |||||||||||||||||||||||||||||
| Recognized on derivatives | — | — | — | 34 | 34 | — | |||||||||||||||||||||||
| Recognized on hedged items | — | — | — | 45 | 45 | N/A | |||||||||||||||||||||||
| Total gains (losses) (pre-tax) on commodity contracts | — | — | — | 79 | 79 | — | |||||||||||||||||||||||
Total gains (losses) (pre-tax) recognized on fair value hedges |
$ | 1,135 | (338) | (3,733) | 88 | (2,848) | 22 | ||||||||||||||||||||||
| Year ended December 31, 2022 | |||||||||||||||||||||||||||||
| Total amounts presented in the consolidated statement of income and other comprehensive income | $ | 11,781 | (2,349) | (5,505) | 2,821 | N/A | (1,448) | ||||||||||||||||||||||
| Interest contracts | |||||||||||||||||||||||||||||
| Amounts related to cash flows on derivatives | 143 | 65 | 313 | — | 521 | N/A | |||||||||||||||||||||||
| Recognized on derivatives | 3,616 | (345) | (18,056) | — | (14,785) | — | |||||||||||||||||||||||
| Recognized on hedged items | (3,576) | 350 | 17,919 | — | 14,693 | N/A | |||||||||||||||||||||||
| Total gains (losses) (pre-tax) on interest rate contracts | 183 | 70 | 176 | — | 429 | — | |||||||||||||||||||||||
| Foreign exchange contracts | |||||||||||||||||||||||||||||
| Amounts related to cash flows on derivatives | — | — | (189) | — | (189) | N/A | |||||||||||||||||||||||
| Recognized on derivatives | — | — | (1,120) | (1,021) | (2,141) | 87 | |||||||||||||||||||||||
| Recognized on hedged items | — | — | 1,097 | 1,005 | 2,102 | N/A | |||||||||||||||||||||||
| Total gains (losses) (pre-tax) on foreign exchange contracts | — | — | (212) | (16) | (228) | 87 | |||||||||||||||||||||||
| Commodity contracts | |||||||||||||||||||||||||||||
| Recognized on derivatives | — | — | — | 57 | 57 | — | |||||||||||||||||||||||
| Recognized on hedged items | — | — | — | (43) | (43) | N/A | |||||||||||||||||||||||
| Total gains (losses) (pre-tax) on commodity contracts | — | — | — | 14 | 14 | — | |||||||||||||||||||||||
Total gains (losses) (pre-tax) recognized on fair value hedges |
$ | 183 | 70 | (36) | (2) | 215 | 87 | ||||||||||||||||||||||
| Year ended December 31, 2021 | |||||||||||||||||||||||||||||
Total amounts presented in the consolidated statement of income and other comprehensive income |
$ | 9,253 | (388) | (3,173) | 4,408 | N/A | 212 | ||||||||||||||||||||||
| Interest contracts | |||||||||||||||||||||||||||||
| Amounts related to cash flows on derivatives | (253) | 289 | 2,136 | — | 2,172 | N/A | |||||||||||||||||||||||
| Recognized on derivatives | 1,129 | (336) | (6,351) | — | (5,558) | — | |||||||||||||||||||||||
| Recognized on hedged items | (1,117) | 333 | 6,288 | — | 5,504 | N/A | |||||||||||||||||||||||
| Total gains (losses) (pre-tax) on interest rate contracts | (241) | 286 | 2,073 | — | 2,118 | — | |||||||||||||||||||||||
| Foreign exchange contracts | |||||||||||||||||||||||||||||
| Amounts related to cash flows on derivatives | 57 | — | 10 | — | 67 | N/A | |||||||||||||||||||||||
| Recognized on derivatives | 4 | — | (516) | (99) | (611) | 81 | |||||||||||||||||||||||
| Recognized on hedged items | (3) | — | 438 | 82 | 517 | N/A | |||||||||||||||||||||||
| Total gains (losses) (pre-tax) on foreign exchange contracts | 58 | — | (68) | (17) | (27) | 81 | |||||||||||||||||||||||
| Commodity contracts | |||||||||||||||||||||||||||||
| Recognized on derivatives | — | — | — | 113 | 113 | — | |||||||||||||||||||||||
| Recognized on hedged items | — | — | — | (124) | (124) | N/A | |||||||||||||||||||||||
| Total gains (losses) (pre-tax) on commodity contracts | — | — | — | (11) | (11) | — | |||||||||||||||||||||||
Total gains (losses) (pre-tax) recognized on fair value hedges |
$ | (183) | 286 | 2,005 | (28) | 2,080 | 81 | ||||||||||||||||||||||
| Wells Fargo & Company | 143 |
|||||||
| Hedged items currently designated | Hedged items no longer designated | ||||||||||||||||
| (in millions) | Carrying amount of assets/(liabilities) (1)(2) | Hedge accounting basis adjustment assets/(liabilities) (3) |
Carrying amount of assets/(liabilities) (2) | Hedge accounting basis adjustment assets/(liabilities) |
|||||||||||||
| December 31, 2023 | |||||||||||||||||
| Available-for-sale debt securities (4)(5) | $ | 55,898 | (2,384) | 13,418 | 504 | ||||||||||||
| Other assets | 2,262 | 67 | — | — | |||||||||||||
| Deposits | (89,641) | (101) | — | — | |||||||||||||
| Long-term debt | (146,940) | 10,990 | — | — | |||||||||||||
| December 31, 2022 | |||||||||||||||||
| Available-for-sale debt securities (4) | $ | 39,423 | (3,859) | 16,100 | 722 | ||||||||||||
| Other assets | 1,663 | 38 | — | — | |||||||||||||
| Deposits | (41,687) | 205 | (10) | — | |||||||||||||
| Long-term debt | (130,997) | 13,862 | (5) | — | |||||||||||||
| Year ended December 31, | |||||||||||||||||
| (in millions) | 2023 | 2022 | 2021 | ||||||||||||||
Interest rate contracts (1) |
$ | (321) | (2,202) | — | |||||||||||||
Equity contracts (2)(3) |
(177) | (1,147) | 647 | ||||||||||||||
Foreign exchange contracts (4) |
(824) | 547 | 335 | ||||||||||||||
Credit contracts (5) |
13 | 6 | (12) | ||||||||||||||
| Net gains (losses) recognized related to derivatives not designated as hedging instruments | $ | (1,309) | (2,796) | 970 | |||||||||||||
144 |
Wells Fargo & Company | |||||||
| Notional amount | ||||||||
| (in millions) | Protection sold | Protection sold – non-investment grade | ||||||
| December 31, 2023 | ||||||||
| Credit default swaps | $ | 18,453 | 1,399 | |||||
| Risk participation swaps | 6,632 | 6,485 | ||||||
| Total credit derivatives | $ | 25,085 | 7,884 | |||||
| December 31, 2022 | ||||||||
| Credit default swaps | $ | 12,733 | 1,860 | |||||
| Risk participation swaps | 6,728 | 6,518 | ||||||
| Total credit derivatives | $ | 19,461 | 8,378 | |||||
| (in billions) | Dec 31, 2023 |
Dec 31, 2022 |
||||||
| Net derivative liabilities with credit-risk contingent features | $ | 23.7 | 20.7 | |||||
| Collateral posted | 21.4 | 17.4 | ||||||
| Additional collateral to be posted upon a below investment grade credit rating (1) | 2.3 | 3.3 | ||||||
| Wells Fargo & Company | 145 |
|||||||
Note 15: Fair Values of Assets and Liabilities | ||
146 |
Wells Fargo & Company | |||||||
| Wells Fargo & Company | 147 |
|||||||
148 |
Wells Fargo & Company | |||||||
| December 31, 2023 | December 31, 2022 | ||||||||||||||||||||||||||||||||||||||||||||||
| (in millions) | Level 1 | Level 2 | Level 3 | Total | Level 1 | Level 2 | Level 3 | Total | |||||||||||||||||||||||||||||||||||||||
| Trading debt securities: | |||||||||||||||||||||||||||||||||||||||||||||||
| Securities of U.S. Treasury and federal agencies | $ | 32,178 | 3,027 | — | 35,205 | 28,844 | 4,530 | — | 33,374 | ||||||||||||||||||||||||||||||||||||||
| Collateralized loan obligations | — | 762 | 64 | 826 | — | 540 | 150 | 690 | |||||||||||||||||||||||||||||||||||||||
| Corporate debt securities | — | 12,859 | 82 | 12,941 | — | 10,344 | 23 | 10,367 | |||||||||||||||||||||||||||||||||||||||
| Federal agency mortgage-backed securities | — | 42,944 | — | 42,944 | — | 34,447 | — | 34,447 | |||||||||||||||||||||||||||||||||||||||
| Non-agency mortgage-backed securities | — | 1,477 | 10 | 1,487 | — | 1,243 | 12 | 1,255 | |||||||||||||||||||||||||||||||||||||||
| Other debt securities | — | 3,898 | 1 | 3,899 | — | 6,022 | — | 6,022 | |||||||||||||||||||||||||||||||||||||||
| Total trading debt securities | 32,178 | 64,967 | 157 | 97,302 | 28,844 | 57,126 | 185 | 86,155 | |||||||||||||||||||||||||||||||||||||||
| Available-for-sale debt securities: | |||||||||||||||||||||||||||||||||||||||||||||||
| Securities of U.S. Treasury and federal agencies | 45,467 | — | — | 45,467 | 45,285 | — | — | 45,285 | |||||||||||||||||||||||||||||||||||||||
| Non-U.S. government securities | — | 164 | — | 164 | — | 162 | — | 162 | |||||||||||||||||||||||||||||||||||||||
| Securities of U.S. states and political subdivisions | — | 20,009 | 57 | 20,066 | — | 10,332 | 113 | 10,445 | |||||||||||||||||||||||||||||||||||||||
| Federal agency mortgage-backed securities | — | 59,578 | — | 59,578 | — | 48,137 | — | 48,137 | |||||||||||||||||||||||||||||||||||||||
| Non-agency mortgage-backed securities | — | 2,748 | 1 | 2,749 | — | 3,284 | — | 3,284 | |||||||||||||||||||||||||||||||||||||||
| Collateralized loan obligations | — | 1,533 | — | 1,533 | — | 3,981 | — | 3,981 | |||||||||||||||||||||||||||||||||||||||
| Other debt securities | — | 728 | 163 | 891 | — | 2,137 | 163 | 2,300 | |||||||||||||||||||||||||||||||||||||||
| Total available-for-sale debt securities | 45,467 | 84,760 | 221 | 130,448 | 45,285 | 68,033 | 276 | 113,594 | |||||||||||||||||||||||||||||||||||||||
| Loans held for sale | — | 2,444 | 448 | 2,892 | — | 3,427 | 793 | 4,220 | |||||||||||||||||||||||||||||||||||||||
| Mortgage servicing rights (residential) | — | — | 7,468 | 7,468 | — | — | 9,310 | 9,310 | |||||||||||||||||||||||||||||||||||||||
| Derivative assets (gross): | |||||||||||||||||||||||||||||||||||||||||||||||
| Interest rate contracts | 195 | 31,434 | 816 | 32,445 | 262 | 40,503 | 321 | 41,086 | |||||||||||||||||||||||||||||||||||||||
| Commodity contracts | — | 2,723 | 18 | 2,741 | — | 5,866 | 134 | 6,000 | |||||||||||||||||||||||||||||||||||||||
| Equity contracts | 71 | 13,041 | 193 | 13,305 | 112 | 9,051 | 410 | 9,573 | |||||||||||||||||||||||||||||||||||||||
| Foreign exchange contracts | — | 24,730 | 37 | 24,767 | 27 | 22,175 | 11 | 22,213 | |||||||||||||||||||||||||||||||||||||||
| Credit contracts | — | 74 | 39 | 113 | — | 44 | 22 | 66 | |||||||||||||||||||||||||||||||||||||||
| Total derivative assets (gross) | 266 | 72,002 | 1,103 | 73,371 | 401 | 77,639 | 898 | 78,938 | |||||||||||||||||||||||||||||||||||||||
| Equity securities: | |||||||||||||||||||||||||||||||||||||||||||||||
| Marketable | 10,849 | 9 | 6 | 10,864 | 18,527 | 86 | 3 | 18,616 | |||||||||||||||||||||||||||||||||||||||
| Nonmarketable | — | 8,940 | 37 | 8,977 | — | 9,750 | 17 | 9,767 | |||||||||||||||||||||||||||||||||||||||
| Total equity securities | 10,849 | 8,949 | 43 | 19,841 | 18,527 | 9,836 | 20 | 28,383 | |||||||||||||||||||||||||||||||||||||||
| Other assets (1) | — | — | 49 | 49 | — | — | — | — | |||||||||||||||||||||||||||||||||||||||
| Total assets prior to derivative netting | $ | 88,760 | 233,122 | 9,489 | 331,371 | 93,057 | 216,061 | 11,482 | 320,600 | ||||||||||||||||||||||||||||||||||||||
| Derivative netting (2) | (55,148) | (56,164) | |||||||||||||||||||||||||||||||||||||||||||||
| Total assets after derivative netting | $ | 276,223 | 264,436 | ||||||||||||||||||||||||||||||||||||||||||||
| Derivative liabilities (gross): | |||||||||||||||||||||||||||||||||||||||||||||||
| Interest rate contracts | $ | (201) | (32,298) | (4,383) | (36,882) | (193) | (40,377) | (2,903) | (43,473) | ||||||||||||||||||||||||||||||||||||||
| Commodity contracts | — | (2,719) | (27) | (2,746) | — | (3,325) | (120) | (3,445) | |||||||||||||||||||||||||||||||||||||||
| Equity contracts (1) | (35) | (12,108) | (1,667) | (13,810) | (118) | (6,502) | (1,634) | (8,254) | |||||||||||||||||||||||||||||||||||||||
| Foreign exchange contracts | — | (27,138) | (19) | (27,157) | (29) | (26,622) | (35) | (26,686) | |||||||||||||||||||||||||||||||||||||||
| Credit contracts | — | (39) | (5) | (44) | — | (33) | (3) | (36) | |||||||||||||||||||||||||||||||||||||||
| Total derivative liabilities (gross) | (236) | (74,302) | (6,101) | (80,639) | (340) | (76,859) | (4,695) | (81,894) | |||||||||||||||||||||||||||||||||||||||
| Short-sale and other liabilities (1) | (19,695) | (5,776) | (83) | (25,554) | (14,791) | (5,513) | (167) | (20,471) | |||||||||||||||||||||||||||||||||||||||
Interest-bearing deposits |
— | (1,297) | — | (1,297) | — | — | — | — | |||||||||||||||||||||||||||||||||||||||
| Long-term debt | — | (2,308) | — | (2,308) | — | (1,346) | — | (1,346) | |||||||||||||||||||||||||||||||||||||||
| Total liabilities prior to derivative netting | $ | (19,931) | $ | (83,683) | (6,184) | (109,798) | (15,131) | (83,718) | (4,862) | (103,711) | |||||||||||||||||||||||||||||||||||||
| Derivative netting (2) | 62,144 | 61,827 | |||||||||||||||||||||||||||||||||||||||||||||
| Total liabilities after derivative netting | $ | (47,654) | (41,884) | ||||||||||||||||||||||||||||||||||||||||||||
| Wells Fargo & Company | 149 |
|||||||
| Net unrealized gains (losses) related to assets and liabilities held at period end |
||||||||||||||||||||||||||||||||||||||||||||||||||||||||
| (in millions) | Balance, beginning of period |
Net gains/(losses) (1) | Purchases (2) | Sales | Settlements | Transfers into Level 3 (3) |
Transfers out of Level 3 (4) |
Balance, end of period |
(5) | |||||||||||||||||||||||||||||||||||||||||||||||
| Year ended December 31, 2023 | ||||||||||||||||||||||||||||||||||||||||||||||||||||||||
| Trading debt securities | $ | 185 | (14) | 141 | (167) | (11) | 104 | (81) | 157 | (12) | (6) | |||||||||||||||||||||||||||||||||||||||||||||
| Available-for-sale debt securities | 276 | (8) | 113 | (31) | (19) | 304 | (414) | 221 | (32) | (6) | ||||||||||||||||||||||||||||||||||||||||||||||
| Loans held for sale | 793 | 1 | 298 | (373) | (120) | 126 | (277) | 448 | (17) | (7) | ||||||||||||||||||||||||||||||||||||||||||||||
| Mortgage servicing rights (residential) (8) | 9,310 | (1,101) | 161 | (902) | — | — | — | 7,468 | 86 | (7) | ||||||||||||||||||||||||||||||||||||||||||||||
| Net derivative assets and liabilities: | ||||||||||||||||||||||||||||||||||||||||||||||||||||||||
| Interest rate contracts | (2,582) | (2,062) | 3 | (3) | 2,548 | (1,493) | 22 | (3,567) | 93 | |||||||||||||||||||||||||||||||||||||||||||||||
| Equity contracts | (1,224) | (801) | — | — | 521 | (108) | 138 | (1,474) | (314) | |||||||||||||||||||||||||||||||||||||||||||||||
| Other derivative contracts | 9 | (52) | 14 | (4) | 81 | (3) | (2) | 43 | 42 | |||||||||||||||||||||||||||||||||||||||||||||||
| Total derivative contracts | (3,797) | (2,915) | 17 | (7) | 3,150 | (1,604) | 158 | (4,998) | (179) | (9) | ||||||||||||||||||||||||||||||||||||||||||||||
| Equity securities | 20 | (2) | 10 | (8) | — | 23 | — | 43 | (1) | (6) | ||||||||||||||||||||||||||||||||||||||||||||||
| Other assets and liabilities | (167) | 133 | — | — | — | — | — | (34) | 133 | (10) | ||||||||||||||||||||||||||||||||||||||||||||||
| Year ended December 31, 2022 | ||||||||||||||||||||||||||||||||||||||||||||||||||||||||
| Trading debt securities | $ | 241 | (72) | 218 | (186) | (6) | 22 | (32) | 185 | (73) | (6) | |||||||||||||||||||||||||||||||||||||||||||||
| Available-for-sale debt securities | 186 | (36) | 327 | (26) | (25) | 460 | (610) | 276 | (10) | (6) | ||||||||||||||||||||||||||||||||||||||||||||||
| Loans held for sale | 1,033 | (252) | 389 | (391) | (207) | 237 | (16) | 793 | (170) | (7) | ||||||||||||||||||||||||||||||||||||||||||||||
| Mortgage servicing rights (residential) (8) | 6,920 | 2,001 | 1,003 | (614) | — | — | — | 9,310 | 3,254 | (7) | ||||||||||||||||||||||||||||||||||||||||||||||
| Net derivative assets and liabilities: | ||||||||||||||||||||||||||||||||||||||||||||||||||||||||
| Interest rate contracts | 127 | (3,280) | — | — | 994 | (435) | 12 | (2,582) | (2,073) | |||||||||||||||||||||||||||||||||||||||||||||||
| Equity contracts (11) | (417) | 35 | — | (9) | 718 | (584) | (967) | (1,224) | 276 | |||||||||||||||||||||||||||||||||||||||||||||||
| Other derivative contracts | 5 | (68) | 19 | (9) | 118 | (16) | (40) | 9 | (16) | |||||||||||||||||||||||||||||||||||||||||||||||
| Total derivative contracts | (285) | (3,313) | 19 | (18) | 1,830 | (1,035) | (995) | (3,797) | (1,813) | (9) | ||||||||||||||||||||||||||||||||||||||||||||||
| Equity securities | 8,910 | 4 | 1 | (2) | — | 3 | (8,896) | 20 | (2) | (6) | ||||||||||||||||||||||||||||||||||||||||||||||
| Other assets and liabilities (11) | (791) | 624 | — | — | — | — | — | (167) | 624 | (10) | ||||||||||||||||||||||||||||||||||||||||||||||
| Year ended December 31, 2021 | ||||||||||||||||||||||||||||||||||||||||||||||||||||||||
| Trading debt securities | $ | 173 | 7 | 518 | (448) | (12) | 34 | (31) | 241 | (8) | (6) | |||||||||||||||||||||||||||||||||||||||||||||
| Available-for-sale debt securities | 2,994 | 21 | 809 | (112) | (278) | 353 | (3,601) | 186 | (4) | (6) | ||||||||||||||||||||||||||||||||||||||||||||||
| Loans held for sale | 1,234 | (25) | 477 | (534) | (377) | 394 | (136) | 1,033 | (26) | (7) | ||||||||||||||||||||||||||||||||||||||||||||||
| Mortgage servicing rights (residential) (8) | 6,125 | (842) | 1,645 | (8) | — | — | — | 6,920 | 1,170 | (7) | ||||||||||||||||||||||||||||||||||||||||||||||
| Net derivative assets and liabilities: | ||||||||||||||||||||||||||||||||||||||||||||||||||||||||
| Interest rate contracts | 446 | 27 | — | — | (340) | (5) | (1) | 127 | (75) | |||||||||||||||||||||||||||||||||||||||||||||||
Equity contracts (11) |
(288) | (482) | — | — | 379 | (228) | 202 | (417) | (280) | |||||||||||||||||||||||||||||||||||||||||||||||
| Other derivative contracts | 39 | (114) | 3 | (3) | 77 | — | 3 | 5 | (36) | |||||||||||||||||||||||||||||||||||||||||||||||
| Total derivative contracts | 197 | (569) | 3 | (3) | 116 | (233) | 204 | (285) | (391) | (9) | ||||||||||||||||||||||||||||||||||||||||||||||
| Equity securities | 9,233 | (267) | 1 | (68) | — | 11 | — | 8,910 | (316) | (6) | ||||||||||||||||||||||||||||||||||||||||||||||
Other assets and liabilities (11) |
(1,483) | 771 | — | — | (79) | — | — | (791) | 645 | (10) |
||||||||||||||||||||||||||||||||||||||||||||||
150 |
Wells Fargo & Company | |||||||
| ($ in millions, except cost to service amounts) | Fair Value Level 3 | Valuation Technique | Significant Unobservable Input |
Range of Inputs | Weighted Average |
|||||||||||||||||||||||||||||||||
| December 31, 2023 | ||||||||||||||||||||||||||||||||||||||
| Trading and available-for-sale debt securities | $ | 60 | Discounted cash flow | Discount rate | 2.7 | - | 7.3 | % | 4.7 | |||||||||||||||||||||||||||||
| 157 | Market comparable pricing | Comparability adjustment | (27.1) | - | 20.1 | (1.9) | ||||||||||||||||||||||||||||||||
| 161 | Market comparable pricing | Multiples | 1.2x | - | 10.3x | 5.6x | ||||||||||||||||||||||||||||||||
| Loans held for sale | 359 | Discounted cash flow | Default rate | 0.0 | - | 28.0 | % | 1.1 | ||||||||||||||||||||||||||||||
| Discount rate | 1.7 | - | 15.4 | 9.8 | ||||||||||||||||||||||||||||||||||
| Loss severity | 0.0 | - | 58.1 | 15.7 | ||||||||||||||||||||||||||||||||||
| Prepayment rate | 2.6 | - | 12.1 | 10.6 | ||||||||||||||||||||||||||||||||||
| 89 | Market comparable pricing | Comparability adjustment | (6.4) | - | 1.1 | (1.1) | ||||||||||||||||||||||||||||||||
| Mortgage servicing rights (residential) | 7,468 | Discounted cash flow | Cost to service per loan (1) | $ | 52 | - | 527 | 105 | ||||||||||||||||||||||||||||||
| Discount rate | 8.9 | - | 13.9 | % | 9.4 | |||||||||||||||||||||||||||||||||
| Prepayment rate (2) | 7.3 | - | 24.3 | 8.9 | ||||||||||||||||||||||||||||||||||
| Net derivative assets and (liabilities): | ||||||||||||||||||||||||||||||||||||||
| Interest rate contracts | (3,501) | Discounted cash flow | Discount rate | 3.6 | - | 5.4 | 4.2 | |||||||||||||||||||||||||||||||
| (36) | Discounted cash flow | Default rate | 0.4 | - | 5.0 | 1.2 | ||||||||||||||||||||||||||||||||
| Loss severity | 50.0 | - | 50.0 | 50.0 | ||||||||||||||||||||||||||||||||||
| Prepayment rate | 22.0 | - | 22.0 | 22.0 | ||||||||||||||||||||||||||||||||||
|
Interest rate contracts: derivative loan
commitments
|
(30) | Discounted cash flow | Fall-out factor | 1.0 | - | 99.0 | 30.2 | |||||||||||||||||||||||||||||||
| Initial-value servicing | (5.5) | - | 141.0 | bps | 10.0 | |||||||||||||||||||||||||||||||||
| Equity contracts | (1,020) | Discounted cash flow | Conversion factor | (6.9) | - | 0.0 | % | (6.4) | ||||||||||||||||||||||||||||||
| Weighted average life | 0.5 | - | 2.0 | yrs | 1.1 | |||||||||||||||||||||||||||||||||
| (454) | Option model | Correlation factor | (67.0) | - | 99.0 | % | 73.8 | |||||||||||||||||||||||||||||||
| Volatility factor | 6.5 | - | 147.0 | 38.6 | ||||||||||||||||||||||||||||||||||
| Insignificant Level 3 assets, net of liabilities (3) | 52 | |||||||||||||||||||||||||||||||||||||
| Total Level 3 assets, net of liabilities | $ | 3,305 | (4) | |||||||||||||||||||||||||||||||||||
| December 31, 2022 | ||||||||||||||||||||||||||||||||||||||
| Trading and available-for-sale debt securities | $ | 157 | Discounted cash flow | Discount rate | 2.7 | - | 12.5 | % | 6.4 | |||||||||||||||||||||||||||||
| 185 | Market comparable pricing | Comparability adjustment | (33.6) | - | 14.1 | (4.8) | ||||||||||||||||||||||||||||||||
| 119 | Market comparable pricing | Multiples | 1.1x | - | 7.4x | 4.0x | ||||||||||||||||||||||||||||||||
| Loans held for sale | 793 | Discounted cash flow | Default rate | 0.0 | - | 25.0 | % | 0.7 | ||||||||||||||||||||||||||||||
| Discount rate | 2.9 | - | 13.4 | 9.5 | ||||||||||||||||||||||||||||||||||
| Loss severity | 0.0 | - | 53.6 | 15.7 | ||||||||||||||||||||||||||||||||||
| Prepayment rate | 3.5 | - | 14.2 | 10.7 | ||||||||||||||||||||||||||||||||||
| Mortgage servicing rights (residential) | 9,310 | Discounted cash flow | Cost to service per loan (1) | $ | 52 | - | 550 | 102 | ||||||||||||||||||||||||||||||
| Discount rate | 8.7 | - | 14.1 | % | 9.1 | |||||||||||||||||||||||||||||||||
| Prepayment rate (2) | 8.1 | - | 21.9 | 9.4 | ||||||||||||||||||||||||||||||||||
| Net derivative assets and (liabilities): | ||||||||||||||||||||||||||||||||||||||
| Interest rate contracts | (2,411) | Discounted cash flow | Discount rate | 3.2 | - | 4.9 | 4.2 | |||||||||||||||||||||||||||||||
| (63) | Discounted cash flow | Default rate | 0.4 | - | 5.0 | 2.3 | ||||||||||||||||||||||||||||||||
| Loss severity | 50.0 | - | 50.0 | 50.0 | ||||||||||||||||||||||||||||||||||
| Prepayment rate | 2.8 | - | 22.0 | 18.7 | ||||||||||||||||||||||||||||||||||
|
Interest rate contracts: derivative loan
commitments
|
(108) | Discounted cash flow | Fall-out factor | 1.0 | - | 99.0 | 41.0 | |||||||||||||||||||||||||||||||
| Initial-value servicing | (9.3) | - | 141.0 | bps | 11.5 | |||||||||||||||||||||||||||||||||
| Equity contracts (3) | (1,000) | Discounted cash flow | Conversion factor | (12.2) | - | 0.0 | % | (9.9) | ||||||||||||||||||||||||||||||
| Weighted average life | 0.5 | - | 1.5 | yrs | 0.8 | |||||||||||||||||||||||||||||||||
| (224) | Option model | Correlation factor | (77.0) | - | 99.0 | % | 49.5 | |||||||||||||||||||||||||||||||
| Volatility factor | 6.5 | - | 96.5 | 37.3 | ||||||||||||||||||||||||||||||||||
| Insignificant Level 3 liabilities, net of assets (3) | (138) | |||||||||||||||||||||||||||||||||||||
| Total Level 3 assets, net of liabilities | $ | 6,620 | (4) | |||||||||||||||||||||||||||||||||||
| Wells Fargo & Company | 151 |
|||||||
152 |
Wells Fargo & Company | |||||||
| December 31, 2023 | December 31, 2022 | ||||||||||||||||||||||||||||||||||
| (in millions) | Level 2 | Level 3 | Total | Level 2 | Level 3 | Total | |||||||||||||||||||||||||||||
| Loans held for sale (1) | $ | 326 | 297 | 623 | 838 | 554 | 1,392 | ||||||||||||||||||||||||||||
| Loans: | |||||||||||||||||||||||||||||||||||
| Commercial | 1,565 | — | 1,565 | 285 | — | 285 | |||||||||||||||||||||||||||||
| Consumer | 97 | — | 97 | 512 | — | 512 | |||||||||||||||||||||||||||||
| Total loans | 1,662 | — | 1,662 | 797 | — | 797 | |||||||||||||||||||||||||||||
| Mortgage servicing rights (commercial) | — | — | — | — | 75 | 75 | |||||||||||||||||||||||||||||
| Nonmarketable equity securities | 2,086 | 2,354 | 4,440 | 1,926 | 2,818 | 4,744 | |||||||||||||||||||||||||||||
| Other assets | 2,451 | 58 | 2,509 | 1,862 | 296 | 2,158 | |||||||||||||||||||||||||||||
| Total assets at fair value on a nonrecurring basis | $ | 6,525 | 2,709 | 9,234 | 5,423 | 3,743 | 9,166 | ||||||||||||||||||||||||||||
| Wells Fargo & Company | 153 |
|||||||
| Year ended December 31, | |||||||||||||||||
| (in millions) | 2023 | 2022 | 2021 | ||||||||||||||
| Loans held for sale | $ | (9) | (120) | 33 | |||||||||||||
| Loans: | |||||||||||||||||
| Commercial | (716) | (96) | (230) | ||||||||||||||
| Consumer | (706) | (739) | (564) | ||||||||||||||
| Total loans | (1,422) | (835) | (794) | ||||||||||||||
| Mortgage servicing rights (commercial) | — | 4 | 33 | ||||||||||||||
| Nonmarketable equity securities (1) | (718) | (1,191) | 4,407 | ||||||||||||||
| Other assets (2) | (122) | (275) | (388) | ||||||||||||||
| Total | $ | (2,271) | (2,417) | 3,291 | |||||||||||||
|
($ in millions)
|
Fair Value Level 3 |
Valuation Technique (1) |
Significant Unobservable Input (1) |
Range of Inputs Positive (Negative) |
Weighted Average |
|||||||||||||||||||||||||||
| December 31, 2023 | ||||||||||||||||||||||||||||||||
| Loans held for sale | $ | 297 | Discounted cash flow | Default rate | 0.1 | - | 95.8 | % | 17.5 | |||||||||||||||||||||||
| Discount rate | 3.0 | - | 13.2 | 5.8 | ||||||||||||||||||||||||||||
| Loss severity | 5.4 | - | 58.6 | 16.6 | ||||||||||||||||||||||||||||
| Prepayment rate | 2.1 | - | 33.8 | 11.8 | ||||||||||||||||||||||||||||
| Nonmarketable equity securities | 591 | Market comparable pricing | Comparability adjustment | (100.0) | - | (11.5) | (42.9) | |||||||||||||||||||||||||
| 1,721 | Market comparable pricing | Multiples | 0.7x | - | 27.1x | 8.4x | ||||||||||||||||||||||||||
| 42 | Discounted cash flow | Discount rate | 5.0 | - | 5.0% | 5.0 | ||||||||||||||||||||||||||
| Insignificant Level 3 assets | 58 | |||||||||||||||||||||||||||||||
| Total | $ | 2,709 | ||||||||||||||||||||||||||||||
| December 31, 2022 | ||||||||||||||||||||||||||||||||
| Loans held for sale | $ | 143 | Discounted cash flow | Default rate | 0.1 | - | 86.1 | % | 13.8 | |||||||||||||||||||||||
| Discount rate | 3.8 | - | 13.8 | 9.0 | ||||||||||||||||||||||||||||
| Loss severity | 8.1 | - | 43.8 | 18.6 | ||||||||||||||||||||||||||||
| Prepayment rate | 2.3 | - | 23.4 | 18.6 | ||||||||||||||||||||||||||||
| 411 | Market comparable pricing | Comparability adjustment | (8.2) | - | (0.9) | (4.3) | ||||||||||||||||||||||||||
| Mortgage servicing rights (commercial) | 75 | Discounted cash flow | Cost to service per loan | $ | 3,775 | - | 3,775 | 3,775 | ||||||||||||||||||||||||
| Discount rate | 5.2 | - | 5.2 | % | 5.2 | |||||||||||||||||||||||||||
| Prepayment rate | 0.0 | - | 20.6 | 6.7 | ||||||||||||||||||||||||||||
| Nonmarketable equity securities | 1,461 | Market comparable pricing | Comparability adjustment | (100.0) | - | (4.0) | (30.1) | |||||||||||||||||||||||||
| 1,352 | Market comparable pricing | Multiples | 0.8x | - | 18.7x | 9.9x | ||||||||||||||||||||||||||
| Other assets (2) | 234 | Market comparable pricing | Multiples | 6.4 | - | 8.0 | 7.1 | |||||||||||||||||||||||||
| Insignificant Level 3 assets | 67 | |||||||||||||||||||||||||||||||
| Total | $ | 3,743 | ||||||||||||||||||||||||||||||
154 |
Wells Fargo & Company | |||||||
| December 31, 2023 | December 31, 2022 | ||||||||||||||||||||||||||||||||||
| (in millions) | Fair value carrying amount | Aggregate unpaid principal | Fair value carrying amount less aggregate unpaid principal | Fair value carrying amount | Aggregate unpaid principal | Fair value carrying amount less aggregate unpaid principal |
|||||||||||||||||||||||||||||
| Loans held for sale (1) | $ | 2,892 | 3,119 | (227) | 4,220 | 4,614 | (394) | ||||||||||||||||||||||||||||
| Interest-bearing deposits | (1,297) | (1,298) | 1 | — | — | — | |||||||||||||||||||||||||||||
| Long-term debt (2) | (2,308) | (2,864) | 556 | (1,346) | (1,775) | 429 | |||||||||||||||||||||||||||||
| Year ended December 31, | |||||||||||||||||||||||||||||||||||||||||||||||||||||
| 2023 | 2022 | 2021 | |||||||||||||||||||||||||||||||||||||||||||||||||||
| (in millions) | Mortgage banking noninterest income | Net gains from trading and securities | Other noninterest income | Mortgage banking noninterest income | Net gains from trading and securities | Other noninterest income | Mortgage banking noninterest income | Net gains from trading and securities | Other noninterest income | ||||||||||||||||||||||||||||||||||||||||||||
| Loans held for sale | $ | 230 | 46 | (26) | (681) | 6 | — | 1,972 | 54 | 2 | |||||||||||||||||||||||||||||||||||||||||||
Interest-bearing deposits |
— | (22) | — | — | — | — | — | — | — | ||||||||||||||||||||||||||||||||||||||||||||
| Long-term debt | — | (81) | — | — | 52 | — | — | — | — | ||||||||||||||||||||||||||||||||||||||||||||
| Wells Fargo & Company | 155 |
|||||||
| Estimated fair value | |||||||||||||||||||||||||||||
| (in millions) | Carrying amount | Level 1 | Level 2 | Level 3 | Total | ||||||||||||||||||||||||
| December 31, 2023 | |||||||||||||||||||||||||||||
| Financial assets | |||||||||||||||||||||||||||||
| Cash and due from banks (1) | $ | 33,026 | 33,026 | — | — | 33,026 | |||||||||||||||||||||||
| Interest-earning deposits with banks (1) | 204,193 | 203,960 | 233 | — | 204,193 | ||||||||||||||||||||||||
| Federal funds sold and securities purchased under resale agreements (1) | 80,456 | — | 80,456 | — | 80,456 | ||||||||||||||||||||||||
| Held-to-maturity debt securities | 262,708 | 2,288 | 222,209 | 2,819 | 227,316 | ||||||||||||||||||||||||
| Loans held for sale | 2,044 | — | 848 | 1,237 | 2,085 | ||||||||||||||||||||||||
| Loans, net (2) | 905,764 | — | 52,127 | 818,358 | 870,485 | ||||||||||||||||||||||||
| Nonmarketable equity securities (cost method) | 5,276 | — | — | 5,344 | 5,344 | ||||||||||||||||||||||||
| Total financial assets | $ | 1,493,467 | 239,274 | 355,873 | 827,758 | 1,422,905 | |||||||||||||||||||||||
| Financial liabilities | |||||||||||||||||||||||||||||
| Deposits (3) | $ | 190,970 | — | 127,738 | 62,372 | 190,110 | |||||||||||||||||||||||
| Short-term borrowings | 89,340 | — | 89,340 | — | 89,340 | ||||||||||||||||||||||||
| Long-term debt (4) | 205,261 | — | 205,705 | 2,028 | 207,733 | ||||||||||||||||||||||||
| Total financial liabilities | $ | 485,571 | — | 422,783 | 64,400 | 487,183 | |||||||||||||||||||||||
| December 31, 2022 | |||||||||||||||||||||||||||||
| Financial assets | |||||||||||||||||||||||||||||
| Cash and due from banks (1) | $ | 34,596 | 34,596 | — | — | 34,596 | |||||||||||||||||||||||
| Interest-earning deposits with banks (1) | 124,561 | 124,338 | 223 | — | 124,561 | ||||||||||||||||||||||||
| Federal funds sold and securities purchased under resale agreements (1) | 68,036 | — | 68,036 | — | 68,036 | ||||||||||||||||||||||||
| Held-to-maturity debt securities | 297,059 | 14,285 | 238,552 | 2,684 | 255,521 | ||||||||||||||||||||||||
| Loans held for sale | 2,884 | — | 2,208 | 719 | 2,927 | ||||||||||||||||||||||||
| Loans, net (2) | 928,049 | — | 57,532 | 836,831 | 894,363 | ||||||||||||||||||||||||
| Nonmarketable equity securities (cost method) | 4,900 | — | — | 4,961 | 4,961 | ||||||||||||||||||||||||
| Total financial assets | $ | 1,460,085 | 173,219 | 366,551 | 845,195 | 1,384,965 | |||||||||||||||||||||||
| Financial liabilities | |||||||||||||||||||||||||||||
| Deposits (3) | $ | 66,887 | — | 46,745 | 18,719 | 65,464 | |||||||||||||||||||||||
| Short-term borrowings | 50,964 | — | 50,970 | — | 50,970 | ||||||||||||||||||||||||
| Long-term debt (4) | 173,502 | — | 172,783 | 999 | 173,782 | ||||||||||||||||||||||||
| Total financial liabilities | $ | 291,353 | — | 270,498 | 19,718 | 290,216 | |||||||||||||||||||||||
156 |
Wells Fargo & Company | |||||||
Note 16: Securitizations and Variable Interest Entities | ||
| Wells Fargo & Company | 157 |
|||||||
| Year ended December 31, | ||||||||||||||||||||||||||||||||
| 2023 | 2022 | 2021 | ||||||||||||||||||||||||||||||
| (in millions) | Residential mortgages | Commercial mortgages | Residential mortgages | Commercial mortgages | Residential mortgages | Commercial mortgages | ||||||||||||||||||||||||||
| Assets sold | $ | 13,823 | 8,872 | 75,582 | 13,735 | 157,063 | 18,247 | |||||||||||||||||||||||||
| Proceeds from transfer (1) | 13,823 | 9,017 | 75,634 | 13,963 | 157,852 | 18,563 | ||||||||||||||||||||||||||
| Net gains (losses) on sale | — | 145 | 52 | 228 | 789 | 316 | ||||||||||||||||||||||||||
| Continuing involvement (2): | ||||||||||||||||||||||||||||||||
| Servicing rights recognized | $ | 157 | 73 | 966 | 128 | 1,636 | 166 | |||||||||||||||||||||||||
| Securities recognized (3) | — | 94 | 2,062 | 189 | 23,188 | 173 | ||||||||||||||||||||||||||
| Loans recognized | — | — | — | — | 926 | — | ||||||||||||||||||||||||||
| Year ended December 31, | |||||||||||||||||
| 2023 | 2022 | 2021 | |||||||||||||||
| Prepayment rate (1) | 16.8 | % | 12.4 | 13.7 | |||||||||||||
| Discount rate | 9.7 | 8.0 | 5.9 | ||||||||||||||
| Cost to service ($ per loan) | $ | 178 | 110 | 91 | |||||||||||||
158 |
Wells Fargo & Company | |||||||
| Net charge-offs | |||||||||||||||||||||||||||||||||||
| Total loans | Delinquent loans and foreclosed assets (1) |
Year ended December 31, | |||||||||||||||||||||||||||||||||
| (in millions) | Dec 31, 2023 | Dec 31, 2022 | Dec 31, 2023 | Dec 31, 2022 | 2023 | 2022 | |||||||||||||||||||||||||||||
| Commercial | $ | 67,232 | 67,029 | 1,000 | 912 | 114 | 49 | ||||||||||||||||||||||||||||
| Residential | 8,311 | 9,201 | 393 | 501 | 19 | 14 | |||||||||||||||||||||||||||||
| Total off-balance sheet sold or securitized loans | $ | 75,543 | 76,230 | 1,393 | 1,413 | 133 | 63 | ||||||||||||||||||||||||||||
| Wells Fargo & Company | 159 |
|||||||
Carrying value – asset (liability) |
|||||||||||||||||||||||||||||||||||||||||
| (in millions) | Total VIE assets |
Loans | Debt securities (1) |
Equity securities | All other assets (2) |
Debt and other liabilities | Net assets | ||||||||||||||||||||||||||||||||||
| December 31, 2023 | |||||||||||||||||||||||||||||||||||||||||
| Nonconforming mortgage loan securitizations | $ | 154,730 | — | 2,471 | — | 591 | (8) | 3,054 | |||||||||||||||||||||||||||||||||
| Commercial real estate loans | 5,588 | 5,571 | — | — | 17 | — | 5,588 | ||||||||||||||||||||||||||||||||||
| Other | 1,898 | 213 | — | 47 | 17 | — | 277 | ||||||||||||||||||||||||||||||||||
| Total | $ | 162,216 | 5,784 | 2,471 | 47 | 625 | (8) | 8,919 | |||||||||||||||||||||||||||||||||
| Maximum exposure to loss | |||||||||||||||||||||||||||||||||||||||||
| Loans | Debt securities (1) |
Equity securities | All other assets (2) |
Debt, guarantees, and other commitments |
Total exposure | ||||||||||||||||||||||||||||||||||||
| Nonconforming mortgage loan securitizations | $ | — | 2,471 | — | 591 | 8 | 3,070 | ||||||||||||||||||||||||||||||||||
| Commercial real estate loans | 5,571 | — | — | 17 | 700 | 6,288 | |||||||||||||||||||||||||||||||||||
| Other | 213 | — | 47 | 17 | 158 | 435 | |||||||||||||||||||||||||||||||||||
| Total | $ | 5,784 | 2,471 | 47 | 625 | 866 | 9,793 | ||||||||||||||||||||||||||||||||||
Carrying value – asset (liability) |
|||||||||||||||||||||||||||||||||||||||||
|
(in millions)
|
Total VIE assets |
Loans | Debt securities (1) |
Equity securities |
All other assets (2) |
Debt and other liabilities | Net assets | ||||||||||||||||||||||||||||||||||
December 31, 2022 |
|||||||||||||||||||||||||||||||||||||||||
| Nonconforming mortgage loan securitizations | $ | 154,464 | — | 2,420 | — | 617 | (13) | 3,024 | |||||||||||||||||||||||||||||||||
| Commercial real estate loans | 5,627 | 5,611 | — | — | 16 | — | 5,627 | ||||||||||||||||||||||||||||||||||
| Other | 2,174 | 292 | 1 | 43 | 21 | — | 357 | ||||||||||||||||||||||||||||||||||
| Total | $ | 162,265 | 5,903 | 2,421 | 43 | 654 | (13) | 9,008 | |||||||||||||||||||||||||||||||||
| Maximum exposure to loss | |||||||||||||||||||||||||||||||||||||||||
| Loans | Debt securities (1) |
Equity securities |
All other assets (2) |
Debt, guarantees, and other commitments |
Total exposure | ||||||||||||||||||||||||||||||||||||
| Nonconforming mortgage loan securitizations | $ | — | 2,420 | — | 617 | 13 | 3,050 | ||||||||||||||||||||||||||||||||||
| Commercial real estate loans | 5,611 | — | — | 16 | 705 | 6,332 | |||||||||||||||||||||||||||||||||||
| Other | 292 | 1 | 43 | 21 | 228 | 585 | |||||||||||||||||||||||||||||||||||
| Total | $ | 5,903 | 2,421 | 43 | 654 | 946 | 9,967 | ||||||||||||||||||||||||||||||||||
| Year ended December 31, | |||||||||||||||||
| (in millions) | 2023 | 2022 | 2021 | ||||||||||||||
| Proportional amortization of investments | $ | 1,650 | 1,549 | 1,545 | |||||||||||||
| Tax credits and other tax benefits | (1,899) | (1,834) | (1,783) | ||||||||||||||
| Net expense/(benefit) recognized within income tax expense | $ | (249) | (285) | (238) | |||||||||||||
160 |
Wells Fargo & Company | |||||||
Carrying value – asset (liability) |
|||||||||||||||||||||||||||||
| (in millions) | Total VIE assets |
Loans | Debt securities |
All other assets (1) |
Liabilities (2) | ||||||||||||||||||||||||
| December 31, 2023 | |||||||||||||||||||||||||||||
| Commercial and industrial loans and leases | $ | 7,579 | 4,880 | — | 203 | (115) | |||||||||||||||||||||||
| Other | 232 | — | — | 232 | — | ||||||||||||||||||||||||
| Total consolidated VIEs | $ | 7,811 | 4,880 | — | 435 | (115) | |||||||||||||||||||||||
| December 31, 2022 | |||||||||||||||||||||||||||||
| Commercial and industrial loans and leases | $ | 7,148 | 4,802 | — | 190 | (129) | |||||||||||||||||||||||
| Other | 72 | — | 71 | 1 | (72) | ||||||||||||||||||||||||
| Total consolidated VIEs | $ | 7,220 | 4,802 | 71 | 191 | (201) | |||||||||||||||||||||||
| Wells Fargo & Company | 161 |
|||||||
Note 17: Guarantees and Other Commitments | ||
| Maximum exposure to loss | |||||||||||||||||||||||||||||||||||||||||
| (in millions) | Carrying value of obligation | Expires in one year or less | Expires after one year through three years | Expires after three years through five years | Expires after five years | Total | Non-investment grade | ||||||||||||||||||||||||||||||||||
| December 31, 2023 | |||||||||||||||||||||||||||||||||||||||||
Standby letters of credit (1) |
$ | 90 | 14,211 | 5,209 | 2,931 | 105 | 22,456 | 7,711 | |||||||||||||||||||||||||||||||||
| Direct pay letters of credit (1) | 8 | 1,446 | 2,268 | 247 | 5 | 3,966 | 957 | ||||||||||||||||||||||||||||||||||
Loans and LHFS sold with recourse |
72 | 249 | 2,957 | 3,385 | 7,228 | 13,819 | 10,612 | ||||||||||||||||||||||||||||||||||
| Exchange and clearing house guarantees | — | 13,550 | — | — | — | 13,550 | — | ||||||||||||||||||||||||||||||||||
Other guarantees and indemnifications (2) |
22 | 687 | 854 | 116 | 463 | 2,120 | 634 | ||||||||||||||||||||||||||||||||||
| Total guarantees | $ | 192 | 30,143 | 11,288 | 6,679 | 7,801 | 55,911 | 19,914 | |||||||||||||||||||||||||||||||||
| December 31, 2022 | |||||||||||||||||||||||||||||||||||||||||
| Standby letters of credit (1) | $ | 112 | 14,014 | 4,694 | 3,058 | 53 | 21,819 | 7,071 | |||||||||||||||||||||||||||||||||
| Direct pay letters of credit (1) | 13 | 1,593 | 2,734 | 465 | 5 | 4,797 | 1,283 | ||||||||||||||||||||||||||||||||||
Loans and LHFS sold with recourse |
16 | 322 | 1,078 | 3,408 | 8,906 | 13,714 | 11,399 | ||||||||||||||||||||||||||||||||||
| Exchange and clearing house guarantees | — | 4,623 | — | — | — | 4,623 | — | ||||||||||||||||||||||||||||||||||
Other guarantees and indemnifications (2) |
— | 548 | 1 | 10 | 201 | 760 | 515 | ||||||||||||||||||||||||||||||||||
| Total guarantees | $ | 141 | 21,100 | 8,507 | 6,941 | 9,165 | 45,713 | 20,268 | |||||||||||||||||||||||||||||||||
162 |
Wells Fargo & Company | |||||||
| Wells Fargo & Company | 163 |
|||||||
164 |
Wells Fargo & Company | |||||||
Note 18: Securities and Other Collateralized Financing Activities | ||
(in millions) |
Dec 31, 2023 |
Dec 31, 2022 |
|||||||||
| Assets: | |||||||||||
| Resale and securities borrowing agreements | |||||||||||
| Gross amounts recognized | $ | 129,282 | 114,729 | ||||||||
| Gross amounts offset in consolidated balance sheet (1) | (28,402) | (24,464) | |||||||||
| Net amounts in consolidated balance sheet (2) | 100,880 | 90,265 | |||||||||
Collateral received not recognized in consolidated balance sheet (3) |
(99,970) | (89,592) | |||||||||
| Net amount (4) | $ | 910 | 673 | ||||||||
| Liabilities: | |||||||||||
| Repurchase and securities lending agreements | |||||||||||
| Gross amounts recognized | $ | 106,060 | 55,054 | ||||||||
| Gross amounts offset in consolidated balance sheet (1) | (28,402) | (24,464) | |||||||||
| Net amounts in consolidated balance sheet (5) | 77,658 | 30,590 | |||||||||
| Collateral pledged but not netted in consolidated balance sheet (6) | (77,529) | (30,383) | |||||||||
| Net amount (4) | $ | 129 | 207 | ||||||||
| Wells Fargo & Company | 165 |
|||||||
(in millions) |
Dec 31, 2023 |
Dec 31, 2022 |
||||||||||||
| Repurchase agreements: | ||||||||||||||
| Securities of U.S. Treasury and federal agencies | $ | 38,742 | 27,857 | |||||||||||
| Securities of U.S. States and political subdivisions | 579 | 83 | ||||||||||||
| Federal agency mortgage-backed securities | 48,019 | 8,386 | ||||||||||||
| Non-agency mortgage-backed securities | 1,889 | 682 | ||||||||||||
| Corporate debt securities | 7,925 | 6,541 | ||||||||||||
| Asset-backed securities | 2,176 | 1,529 | ||||||||||||
| Equity securities | 635 | 711 | ||||||||||||
| Other | 541 | 300 | ||||||||||||
| Total repurchases | 100,506 | 46,089 | ||||||||||||
| Securities lending arrangements: | ||||||||||||||
| Securities of U.S. Treasury and federal agencies | 251 | 278 | ||||||||||||
| Federal agency mortgage-backed securities | 31 | 58 | ||||||||||||
| Corporate debt securities | 293 | 206 | ||||||||||||
| Equity securities (1) | 4,965 | 8,356 | ||||||||||||
| Other | 14 | 67 | ||||||||||||
| Total securities lending | 5,554 | 8,965 | ||||||||||||
| Total repurchases and securities lending | $ | 106,060 | 55,054 | |||||||||||
| (in millions) | Repurchase agreements | Securities lending agreements | ||||||
| December 31, 2023 | ||||||||
| Overnight/continuous | $ | 54,810 | 4,903 | |||||
| Up to 30 days | 13,704 | — | ||||||
| 30-90 days | 23,264 | 200 | ||||||
| >90 days | 8,728 | 451 | ||||||
| Total gross obligation | 100,506 | 5,554 | ||||||
| December 31, 2022 | ||||||||
| Overnight/continuous | $ | 36,251 | 8,965 | |||||
| Up to 30 days | 734 | — | ||||||
| 30-90 days | 2,884 | — | ||||||
| >90 days | 6,220 | — | ||||||
| Total gross obligation | 46,089 | 8,965 | ||||||
166 |
Wells Fargo & Company | |||||||
Note 19: Pledged Assets and Collateral | ||
(in millions) |
Dec 31, 2023 |
Dec 31, 2022 |
|||||||||
| Pledged to counterparties that had the right to sell or repledge: | |||||||||||
| Debt securities: | |||||||||||
Trading |
$ | 62,537 | 26,932 | ||||||||
Available-for-sale |
5,055 | — | |||||||||
| Equity securities | 2,683 | 747 | |||||||||
All other assets |
495 | 784 | |||||||||
| Total assets pledged to counterparties that had the right to sell or repledge | 70,770 | 28,463 | |||||||||
| Pledged to counterparties that did not have the right to sell or repledge: | |||||||||||
| Debt securities: | |||||||||||
Trading |
2,757 | 1,129 | |||||||||
Available-for-sale |
64,511 | 50,465 | |||||||||
| Held-to-maturity | 246,218 | 17,477 | |||||||||
| Loans | 445,092 | 343,289 | |||||||||
| Equity securities | 1,502 | 871 | |||||||||
All other assets |
1,195 | 223 | |||||||||
| Total assets pledged to counterparties that did not have the right to sell or repledge | 761,275 | 413,454 | |||||||||
| Total pledged assets | $ | 832,045 | 441,917 | ||||||||
| Wells Fargo & Company | 167 |
|||||||
Note 20: Operating Segments | ||
168 |
Wells Fargo & Company | |||||||
|
(in millions)
|
Consumer Banking and Lending | Commercial Banking | Corporate and Investment Banking | Wealth and Investment Management | Corporate (1) | Reconciling Items (2) | Consolidated Company |
||||||||||||||||||||||||||||||||||
| Year ended December 31, 2023 | |||||||||||||||||||||||||||||||||||||||||
| Net interest income (3) | $ | 30,185 | 10,034 | 9,498 | 3,966 | (888) | (420) | 52,375 | |||||||||||||||||||||||||||||||||
| Noninterest income | 7,734 | 3,415 | 9,693 | 10,725 | 431 | (1,776) | 30,222 | ||||||||||||||||||||||||||||||||||
| Total revenue | 37,919 | 13,449 | 19,191 | 14,691 | (457) | (2,196) | 82,597 | ||||||||||||||||||||||||||||||||||
| Provision for credit losses | 3,299 | 75 | 2,007 | 6 | 12 | — | 5,399 | ||||||||||||||||||||||||||||||||||
| Noninterest expense | 24,024 | 6,555 | 8,618 | 12,064 | 4,301 | — | 55,562 | ||||||||||||||||||||||||||||||||||
| Income (loss) before income tax expense (benefit) | 10,596 | 6,819 | 8,566 | 2,621 | (4,770) | (2,196) | 21,636 | ||||||||||||||||||||||||||||||||||
| Income tax expense (benefit) | 2,657 | 1,704 | 2,140 | 657 | (2,355) | (2,196) | 2,607 | ||||||||||||||||||||||||||||||||||
| Net income (loss) before noncontrolling interests | 7,939 | 5,115 | 6,426 | 1,964 | (2,415) | — | 19,029 | ||||||||||||||||||||||||||||||||||
| Less: Net income (loss) from noncontrolling interests | — | 11 | — | — | (124) | — | (113) | ||||||||||||||||||||||||||||||||||
| Net income (loss) | $ | 7,939 | 5,104 | 6,426 | 1,964 | (2,291) | — | 19,142 | |||||||||||||||||||||||||||||||||
| Year ended December 31, 2022 | |||||||||||||||||||||||||||||||||||||||||
| Net interest income (3) | $ | 27,044 | 7,289 | 8,733 | 3,927 | (1,607) | (436) | 44,950 | |||||||||||||||||||||||||||||||||
| Noninterest income | 8,766 | 3,631 | 6,509 | 10,895 | 1,192 | (1,575) | 29,418 | ||||||||||||||||||||||||||||||||||
| Total revenue | 35,810 | 10,920 | 15,242 | 14,822 | (415) | (2,011) | 74,368 | ||||||||||||||||||||||||||||||||||
| Provision for credit losses | 2,276 | (534) | (185) | (25) | 2 | — | 1,534 | ||||||||||||||||||||||||||||||||||
| Noninterest expense | 26,277 | 6,058 | 7,560 | 11,613 | 5,697 | — | 57,205 | ||||||||||||||||||||||||||||||||||
| Income (loss) before income tax expense (benefit) | 7,257 | 5,396 | 7,867 | 3,234 | (6,114) | (2,011) | 15,629 | ||||||||||||||||||||||||||||||||||
| Income tax expense (benefit) | 1,816 | 1,366 | 1,989 | 812 | (1,721) | (2,011) | 2,251 | ||||||||||||||||||||||||||||||||||
| Net income (loss) before noncontrolling interests | 5,441 | 4,030 | 5,878 | 2,422 | (4,393) | — | 13,378 | ||||||||||||||||||||||||||||||||||
| Less: Net income (loss) from noncontrolling interests | — | 12 | — | — | (311) | — | (299) | ||||||||||||||||||||||||||||||||||
| Net income (loss) | $ | 5,441 | 4,018 | 5,878 | 2,422 | (4,082) | — | 13,677 | |||||||||||||||||||||||||||||||||
| Year ended December 31, 2021 | |||||||||||||||||||||||||||||||||||||||||
Net interest income (3) |
$ | 22,807 | 4,960 | 7,410 | 2,570 | (1,541) | (427) | 35,779 | |||||||||||||||||||||||||||||||||
| Noninterest income | 12,070 | 3,589 | 6,429 | 11,776 | 10,710 | (1,187) | 43,387 | ||||||||||||||||||||||||||||||||||
| Total revenue | 34,877 | 8,549 | 13,839 | 14,346 | 9,169 | (1,614) | 79,166 | ||||||||||||||||||||||||||||||||||
| Provision for credit losses | (1,178) | (1,500) | (1,439) | (95) | 57 | — | (4,155) | ||||||||||||||||||||||||||||||||||
| Noninterest expense | 24,648 | 5,862 | 7,200 | 11,734 | 4,314 | — | 53,758 | ||||||||||||||||||||||||||||||||||
| Income (loss) before income tax expense (benefit) | 11,407 | 4,187 | 8,078 | 2,707 | 4,798 | (1,614) | 29,563 | ||||||||||||||||||||||||||||||||||
| Income tax expense (benefit) | 2,852 | 1,045 | 2,019 | 680 | 782 | (1,614) | 5,764 | ||||||||||||||||||||||||||||||||||
Net income before noncontrolling interests |
8,555 | 3,142 | 6,059 | 2,027 | 4,016 | — | 23,799 | ||||||||||||||||||||||||||||||||||
| Less: Net income (loss) from noncontrolling interests | — | 8 | (3) | — | 1,685 | — | 1,690 | ||||||||||||||||||||||||||||||||||
Net income |
$ | 8,555 | 3,134 | 6,062 | 2,027 | 2,331 | — | 22,109 | |||||||||||||||||||||||||||||||||
| Year ended December 31, 2023 | |||||||||||||||||||||||||||||||||||||||||
| Loans (average) | $ | 335,920 | 224,102 | 291,975 | 82,755 | 9,164 | — | 943,916 | |||||||||||||||||||||||||||||||||
| Assets (average) | 377,434 | 245,520 | 553,722 | 89,797 | 619,002 | — | 1,885,475 | ||||||||||||||||||||||||||||||||||
| Deposits (average) | 811,091 | 165,235 | 162,062 | 112,069 | 95,825 | — | 1,346,282 | ||||||||||||||||||||||||||||||||||
| Loans (period-end) | 332,867 | 224,774 | 287,432 | 82,555 | 9,054 | — | 936,682 | ||||||||||||||||||||||||||||||||||
| Assets (period-end) | 375,484 | 245,568 | 547,203 | 90,138 | 674,075 | — | 1,932,468 | ||||||||||||||||||||||||||||||||||
| Deposits (period-end) | 782,309 | 162,526 | 185,142 | 103,902 | 124,294 | — | 1,358,173 | ||||||||||||||||||||||||||||||||||
| Year ended December 31, 2022 | |||||||||||||||||||||||||||||||||||||||||
| Loans (average) | $ | 332,433 | 206,032 | 296,984 | 85,228 | 9,143 | — | 929,820 | |||||||||||||||||||||||||||||||||
| Assets (average) | 379,213 | 227,935 | 557,396 | 91,748 | 638,011 | — | 1,894,303 | ||||||||||||||||||||||||||||||||||
| Deposits (average) | 883,130 | 186,079 | 161,720 | 164,883 | 28,457 | — | 1,424,269 | ||||||||||||||||||||||||||||||||||
| Loans (period-end) | 340,529 | 223,529 | 298,377 | 84,273 | 9,163 | — | 955,871 | ||||||||||||||||||||||||||||||||||
| Assets (period-end) | 387,710 | 250,198 | 550,177 | 91,717 | 601,218 | — | 1,881,020 | ||||||||||||||||||||||||||||||||||
| Deposits (period-end) | 859,695 | 173,942 | 157,217 | 138,760 | 54,371 | — | 1,383,985 | ||||||||||||||||||||||||||||||||||
| Wells Fargo & Company | 169 |
|||||||
Note 21: Revenue and Expenses | ||
|
(in millions)
|
Consumer Banking and Lending | Commercial Banking | Corporate and Investment Banking | Wealth and Investment Management | Corporate | Reconciling Items (1) |
Consolidated Company |
||||||||||||||||||||||||||||||||||
| Year ended December 31, 2023 | |||||||||||||||||||||||||||||||||||||||||
| Net interest income (2) | $ | 30,185 | 10,034 | 9,498 | 3,966 | (888) | (420) | 52,375 | |||||||||||||||||||||||||||||||||
| Noninterest income: | |||||||||||||||||||||||||||||||||||||||||
| Deposit-related fees | 2,702 | 998 | 976 | 22 | (4) | — | 4,694 | ||||||||||||||||||||||||||||||||||
| Lending-related fees (2) | 117 | 531 | 790 | 8 | — | — | 1,446 | ||||||||||||||||||||||||||||||||||
| Investment advisory and other asset-based fees (3) | — | 74 | 150 | 8,446 | — | — | 8,670 | ||||||||||||||||||||||||||||||||||
| Commissions and brokerage services fees | — | — | 317 | 2,058 | — | — | 2,375 | ||||||||||||||||||||||||||||||||||
| Investment banking fees | (6) | 61 | 1,738 | — | (144) | — | 1,649 | ||||||||||||||||||||||||||||||||||
| Card fees: | |||||||||||||||||||||||||||||||||||||||||
| Card interchange and network revenue (4) | 3,540 | 223 | 60 | 4 | 2 | — | 3,829 | ||||||||||||||||||||||||||||||||||
| Other card fees (2) | 427 | — | — | — | — | — | 427 | ||||||||||||||||||||||||||||||||||
| Total card fees | 3,967 | 223 | 60 | 4 | 2 | — | 4,256 | ||||||||||||||||||||||||||||||||||
| Mortgage banking (2) | 512 | — | 329 | (12) | — | — | 829 | ||||||||||||||||||||||||||||||||||
| Net gains (losses) from trading activities (2) | — | (10) | 4,553 | 162 | 94 | — | 4,799 | ||||||||||||||||||||||||||||||||||
| Net gains (losses) from debt securities (2) | — | 25 | — | — | (15) | — | 10 | ||||||||||||||||||||||||||||||||||
Net losses from equity securities (2) |
— | (58) | (4) | (2) | (377) | — | (441) | ||||||||||||||||||||||||||||||||||
| Lease income (2) | — | 644 | 57 | — | 536 | — | 1,237 | ||||||||||||||||||||||||||||||||||
| Other (2) | 442 | 927 | 727 | 39 | 339 | (1,776) | 698 | ||||||||||||||||||||||||||||||||||
| Total noninterest income | 7,734 | 3,415 | 9,693 | 10,725 | 431 | (1,776) | 30,222 | ||||||||||||||||||||||||||||||||||
| Total revenue | $ | 37,919 | 13,449 | 19,191 | 14,691 | (457) | (2,196) | 82,597 | |||||||||||||||||||||||||||||||||
| Year ended December 31, 2022 | |||||||||||||||||||||||||||||||||||||||||
| Net interest income (2) | $ | 27,044 | 7,289 | 8,733 | 3,927 | (1,607) | (436) | 44,950 | |||||||||||||||||||||||||||||||||
| Noninterest income: | |||||||||||||||||||||||||||||||||||||||||
| Deposit-related fees | 3,093 | 1,131 | 1,068 | 24 | — | — | 5,316 | ||||||||||||||||||||||||||||||||||
| Lending-related fees (2) | 129 | 491 | 769 | 8 | — | — | 1,397 | ||||||||||||||||||||||||||||||||||
| Investment advisory and other asset-based fees (3) | — | 42 | 107 | 8,847 | 8 | — | 9,004 | ||||||||||||||||||||||||||||||||||
| Commissions and brokerage services fees | — | — | 311 | 1,931 | — | — | 2,242 | ||||||||||||||||||||||||||||||||||
| Investment banking fees | (3) | 60 | 1,492 | — | (110) | — | 1,439 | ||||||||||||||||||||||||||||||||||
| Card fees: | |||||||||||||||||||||||||||||||||||||||||
| Card interchange and network revenue (4) | 3,590 | 224 | 60 | 4 | — | — | 3,878 | ||||||||||||||||||||||||||||||||||
| Other card fees (2) | 477 | — | — | — | — | — | 477 | ||||||||||||||||||||||||||||||||||
| Total card fees | 4,067 | 224 | 60 | 4 | — | — | 4,355 | ||||||||||||||||||||||||||||||||||
| Mortgage banking (2) | 1,100 | — | 296 | (12) | (1) | — | 1,383 | ||||||||||||||||||||||||||||||||||
| Net gains (losses) from trading activities (2) | — | (6) | 1,886 | 58 | 178 | — | 2,116 | ||||||||||||||||||||||||||||||||||
| Net gains from debt securities (2) | — | 5 | — | — | 146 | — | 151 | ||||||||||||||||||||||||||||||||||
| Net gains (losses) from equity securities (2) | (5) | 64 | (5) | (2) | (858) | — | (806) | ||||||||||||||||||||||||||||||||||
| Lease income (2) | — | 710 | 15 | — | 544 | — | 1,269 | ||||||||||||||||||||||||||||||||||
| Other (2)(5) | 385 | 910 | 510 | 37 | 1,285 | (1,575) | 1,552 | ||||||||||||||||||||||||||||||||||
| Total noninterest income | 8,766 | 3,631 | 6,509 | 10,895 | 1,192 | (1,575) | 29,418 | ||||||||||||||||||||||||||||||||||
| Total revenue | $ | 35,810 | 10,920 | 15,242 | 14,822 | (415) | (2,011) | 74,368 | |||||||||||||||||||||||||||||||||
170 |
Wells Fargo & Company | |||||||
|
(in millions)
|
Consumer Banking and Lending | Commercial Banking | Corporate and Investment Banking | Wealth and Investment Management | Corporate | Reconciling Items (1) |
Consolidated Company |
||||||||||||||||||||||||||||||||||
| Year ended December 31, 2021 | |||||||||||||||||||||||||||||||||||||||||
| Net interest income (2) | $ | 22,807 | 4,960 | 7,410 | 2,570 | (1,541) | (427) | 35,779 | |||||||||||||||||||||||||||||||||
| Noninterest income: | |||||||||||||||||||||||||||||||||||||||||
| Deposit-related fees | 3,045 | 1,285 | 1,112 | 28 | 5 | — | 5,475 | ||||||||||||||||||||||||||||||||||
| Lending-related fees (2) | 145 | 532 | 761 | 8 | (1) | — | 1,445 | ||||||||||||||||||||||||||||||||||
| Investment advisory and other asset-based fees (3) | — | 10 | 52 | 9,574 | 1,375 | — | 11,011 | ||||||||||||||||||||||||||||||||||
| Commissions and brokerage services fees | — | — | 290 | 2,010 | (1) | — | 2,299 | ||||||||||||||||||||||||||||||||||
| Investment banking fees | (11) | 53 | 2,405 | 1 | (94) | — | 2,354 | ||||||||||||||||||||||||||||||||||
| Card fees: | |||||||||||||||||||||||||||||||||||||||||
| Card interchange and network revenue (4) | 3,426 | 196 | 45 | 4 | — | — | 3,671 | ||||||||||||||||||||||||||||||||||
| Other card fees (2) | 504 | — | — | — | — | — | 504 | ||||||||||||||||||||||||||||||||||
| Total card fees | 3,930 | 196 | 45 | 4 | — | — | 4,175 | ||||||||||||||||||||||||||||||||||
| Mortgage banking (2) | 4,490 | — | 480 | (12) | (2) | — | 4,956 | ||||||||||||||||||||||||||||||||||
| Net gains (losses) from trading activities (2) | — | — | 272 | 21 | (9) | — | 284 | ||||||||||||||||||||||||||||||||||
| Net gains from debt securities (2) | — | 44 | — | — | 509 | — | 553 | ||||||||||||||||||||||||||||||||||
| Net gains (losses) from equity securities (2) | (2) | 132 | 289 | 79 | 5,929 | — | 6,427 | ||||||||||||||||||||||||||||||||||
| Lease income (2) | — | 682 | 33 | — | 281 | — | 996 | ||||||||||||||||||||||||||||||||||
Other (2)(5) |
473 | 655 | 690 | 63 | 2,718 | (1,187) | 3,412 | ||||||||||||||||||||||||||||||||||
| Total noninterest income | 12,070 | 3,589 | 6,429 | 11,776 | 10,710 | (1,187) | 43,387 | ||||||||||||||||||||||||||||||||||
| Total revenue | $ | 34,877 | 8,549 | 13,839 | 14,346 | 9,169 | (1,614) | 79,166 | |||||||||||||||||||||||||||||||||
| Wells Fargo & Company | 171 |
|||||||
| Year ended December 31, | |||||||||||||||||
($ in millions) |
2023 | 2022 | 2021 | ||||||||||||||
Legal actions |
$ | 179 | 3,308 | 341 | |||||||||||||
Customer remediation |
207 | 2,691 | 536 | ||||||||||||||
Other |
797 | 985 | 691 | ||||||||||||||
| Total operating losses | $ | 1,183 | 6,984 | 1,568 | |||||||||||||
| Year ended December 31, | |||||||||||||||||
| (in millions) | 2023 |
2022 |
2021 | ||||||||||||||
| Balance, beginning of period | $ | 166 | 565 | 1,214 | |||||||||||||
Restructuring charges: |
|||||||||||||||||
Current period restructuring charges |
— | — | 726 | ||||||||||||||
| Changes in estimates | — | 5 | (650) | ||||||||||||||
Total restructuring charges |
— | 5 | 76 | ||||||||||||||
| Payments and utilization | (166) | (404) | (725) | ||||||||||||||
| Balance, end of period | $ | — | 166 | 565 | |||||||||||||
172 |
Wells Fargo & Company | |||||||
Note 22: Employee Benefits | ||
| December 31, 2023 | December 31, 2022 | ||||||||||||||||||||||||||||||||||
| Pension benefits | Pension benefits | ||||||||||||||||||||||||||||||||||
| (in millions) | Qualified | Non- qualified |
Other benefits |
Qualified | Non- qualified |
Other benefits |
|||||||||||||||||||||||||||||
| Change in benefit obligation: | |||||||||||||||||||||||||||||||||||
| Benefit obligation at beginning of period | $ | 8,141 | 391 | 309 | 11,032 | 501 | 439 | ||||||||||||||||||||||||||||
| Service cost | 25 | — | — | 19 | — | — | |||||||||||||||||||||||||||||
| Interest cost | 403 | 18 | 15 | 348 | 12 | 9 | |||||||||||||||||||||||||||||
| Plan participants’ contributions | — | — | 37 | — | — | 39 | |||||||||||||||||||||||||||||
| Actuarial loss (gain) | 191 | 8 | (8) | (2,256) | (76) | (103) | |||||||||||||||||||||||||||||
| Benefits paid | (634) | (42) | (66) | (966) | (46) | (75) | |||||||||||||||||||||||||||||
| Settlements, Curtailments, and Amendments | — | — | — | (29) | — | — | |||||||||||||||||||||||||||||
| Foreign exchange impact | — | — | — | (7) | — | — | |||||||||||||||||||||||||||||
| Benefit obligation at end of period | 8,126 | 375 | 287 | 8,141 | 391 | 309 | |||||||||||||||||||||||||||||
| Change in plan assets: | |||||||||||||||||||||||||||||||||||
| Fair value of plan assets at beginning of period | 8,600 | — | 476 | 11,581 | — | 550 | |||||||||||||||||||||||||||||
| Actual return on plan assets | 653 | — | 44 | (1,998) | — | (45) | |||||||||||||||||||||||||||||
| Employer contribution | 15 | 42 | 6 | 16 | 46 | 7 | |||||||||||||||||||||||||||||
| Plan participants’ contributions | — | — | 37 | — | — | 39 | |||||||||||||||||||||||||||||
| Benefits paid | (634) | (42) | (66) | (966) | (46) | (75) | |||||||||||||||||||||||||||||
| Settlement | — | — | — | (29) | — | — | |||||||||||||||||||||||||||||
| Foreign exchange impact | — | — | — | (4) | — | — | |||||||||||||||||||||||||||||
| Fair value of plan assets at end of period | 8,634 | — | 497 | 8,600 | — | 476 | |||||||||||||||||||||||||||||
| Funded status at end of period | $ | 508 | (375) | 210 | 459 | (391) | 167 | ||||||||||||||||||||||||||||
| Amounts recognized on the consolidated balance sheet at end of period: | |||||||||||||||||||||||||||||||||||
| Assets | $ | 585 | — | 224 | 522 | — | 181 | ||||||||||||||||||||||||||||
| Liabilities | (77) | (375) | (14) | (63) | (391) | (14) | |||||||||||||||||||||||||||||
| Wells Fargo & Company | 173 |
|||||||
| December 31, 2023 | December 31, 2022 | ||||||||||||||||||||||
| (in millions) | Pension Benefits | Other Benefits | Pension Benefits | Other Benefits | |||||||||||||||||||
| Projected benefit obligation | $ | 549 | — | 539 | — | ||||||||||||||||||
| Accumulated benefit obligation | 511 | 14 | 509 | 14 | |||||||||||||||||||
| Fair value of plan assets | 97 | — | 86 | — | |||||||||||||||||||
| December 31, 2023 | December 31, 2022 | December 31, 2021 | |||||||||||||||||||||||||||||||||||||||||||||||||||
| Pension benefits | Pension benefits | Pension benefits | |||||||||||||||||||||||||||||||||||||||||||||||||||
| (in millions) | Qualified | Non- qualified |
Other benefits |
Qualified | Non- qualified |
Other benefits |
Qualified | Non- qualified |
Other benefits |
||||||||||||||||||||||||||||||||||||||||||||
| Service cost | $ | 25 | — | — | 19 | — | — | 17 | — | — | |||||||||||||||||||||||||||||||||||||||||||
| Interest cost | 403 | 18 | 15 | 348 | 12 | 9 | 296 | 12 | 11 | ||||||||||||||||||||||||||||||||||||||||||||
| Expected return on plan assets | (503) | — | (25) | (511) | — | (22) | (598) | — | (19) | ||||||||||||||||||||||||||||||||||||||||||||
| Amortization of net actuarial loss (gain) | 139 | 5 | (25) | 136 | 11 | (22) | 140 | 15 | (20) | ||||||||||||||||||||||||||||||||||||||||||||
| Amortization of prior service cost (credit) | — | — | (10) | 1 | — | (10) | — | — | (10) | ||||||||||||||||||||||||||||||||||||||||||||
| Settlement loss | — | — | — | 226 | 1 | — | 134 | 2 | — | ||||||||||||||||||||||||||||||||||||||||||||
| Net periodic benefit cost | 64 | 23 | (45) | 219 | 24 | (45) | (11) | 29 | (38) | ||||||||||||||||||||||||||||||||||||||||||||
| Other changes in plan assets and benefit obligations recognized in other comprehensive income: | |||||||||||||||||||||||||||||||||||||||||||||||||||||
| Net actuarial loss (gain) | 41 | 8 | (27) | 253 | (76) | (36) | (142) | (18) | (40) | ||||||||||||||||||||||||||||||||||||||||||||
| Amortization of net actuarial gain (loss) | (139) | (5) | 25 | (136) | (11) | 22 | (140) | (15) | 20 | ||||||||||||||||||||||||||||||||||||||||||||
| Amortization of prior service credit (cost) | — | — | 10 | (1) | — | 10 | — | — | 10 | ||||||||||||||||||||||||||||||||||||||||||||
| Settlement (loss) | — | — | — | (226) | (1) | — | (134) | (2) | — | ||||||||||||||||||||||||||||||||||||||||||||
| Total recognized in other comprehensive income | (98) | 3 | 8 | (110) | (88) | (4) | (416) | (35) | (10) | ||||||||||||||||||||||||||||||||||||||||||||
Total recognized in net periodic benefit cost and other comprehensive income |
$ | (34) | 26 | (37) | 109 | (64) | (49) | (427) | (6) | (48) | |||||||||||||||||||||||||||||||||||||||||||
| December 31, 2023 | December 31, 2022 | ||||||||||||||||||||||||||||||||||
| Pension benefits | Pension benefits | ||||||||||||||||||||||||||||||||||
| (in millions) | Qualified | Non- qualified |
Other benefits |
Qualified | Non- qualified |
Other benefits |
|||||||||||||||||||||||||||||
| Net actuarial loss (gain) | $ | 2,842 | 74 | (406) | 2,940 | 71 | (404) | ||||||||||||||||||||||||||||
| Net prior service cost (credit) | — | — | (106) | — | — | (116) | |||||||||||||||||||||||||||||
| Total | $ | 2,842 | 74 | (512) | 2,940 | 71 | (520) | ||||||||||||||||||||||||||||
174 |
Wells Fargo & Company | |||||||
| December 31, 2023 | December 31, 2022 | ||||||||||||||||||||||||||||||||||
| Pension benefits | Pension benefits | ||||||||||||||||||||||||||||||||||
| Qualified | Non- qualified |
Other benefits |
Qualified | Non- qualified |
Other benefits |
||||||||||||||||||||||||||||||
| Discount rate | 4.99 | % | 4.87 | 4.90 | 5.18 | 5.08 | 5.12 | ||||||||||||||||||||||||||||
| Interest crediting rate | 3.91 | 3.39 | N/A | 4.10 | 3.58 | N/A | |||||||||||||||||||||||||||||
| December 31, 2023 | December 31, 2022 | December 31, 2021 | |||||||||||||||||||||||||||||||||||||||||||||||||||
| Pension benefits | Pension benefits | Pension benefits | |||||||||||||||||||||||||||||||||||||||||||||||||||
| Qualified | Non- qualified |
Other benefits |
Qualified | Non- qualified |
Other benefits |
Qualified | Non- qualified |
Other benefits |
|||||||||||||||||||||||||||||||||||||||||||||
| Discount rate | 5.12 | % | 5.04 | 5.06 | 3.93 | 2.34 | 2.11 | 2.63 | 2.32 | 2.31 | |||||||||||||||||||||||||||||||||||||||||||
| Interest crediting rate | 4.10 | 3.58 | N/A | 3.37 | 1.51 | N/A | 2.68 | 1.08 | N/A | ||||||||||||||||||||||||||||||||||||||||||||
| Expected return on plan assets | 6.09 | N/A | 5.34 | 5.35 | N/A | 4.00 | 5.17 | N/A | 3.50 | ||||||||||||||||||||||||||||||||||||||||||||
| Pension benefits | |||||||||||||||||
| (in millions) | Qualified | Non- qualified |
Other benefits | ||||||||||||||
| Period ended December 31, | |||||||||||||||||
| 2024 | $ | 751 | 42 | 30 | |||||||||||||
| 2025 | 679 | 40 | 29 | ||||||||||||||
| 2026 | 646 | 38 | 28 | ||||||||||||||
| 2027 | 639 | 37 | 26 | ||||||||||||||
| 2028 | 632 | 35 | 25 | ||||||||||||||
2029-2033 |
2,991 | 147 | 109 | ||||||||||||||
| Wells Fargo & Company | 175 |
|||||||
Carrying value at period-end |
|||||||||||||||||||||||||||||||||||||||||||||||
| Pension plan assets | Other benefits plan assets | ||||||||||||||||||||||||||||||||||||||||||||||
| (in millions) | Level 1 | Level 2 | Level 3 | Total | Level 1 | Level 2 | Level 3 | Total | |||||||||||||||||||||||||||||||||||||||
| December 31, 2023 | |||||||||||||||||||||||||||||||||||||||||||||||
| Cash and cash equivalents | $ | 199 | 2 | — | 201 | 47 | 135 | — | 182 | ||||||||||||||||||||||||||||||||||||||
| Long duration fixed income (1) | 1,618 | 4,884 | — | 6,502 | — | — | — | — | |||||||||||||||||||||||||||||||||||||||
| Intermediate (core) fixed income | — | 159 | — | 159 | — | 161 | — | 161 | |||||||||||||||||||||||||||||||||||||||
| High-yield fixed income | — | 102 | — | 102 | — | — | — | — | |||||||||||||||||||||||||||||||||||||||
| International fixed income | — | 99 | — | 99 | — | — | — | — | |||||||||||||||||||||||||||||||||||||||
| Domestic large-cap stocks | 261 | 85 | — | 346 | — | 68 | — | 68 | |||||||||||||||||||||||||||||||||||||||
| Domestic mid-cap stocks | 37 | 20 | — | 57 | — | 18 | — | 18 | |||||||||||||||||||||||||||||||||||||||
| Domestic small-cap stocks | 37 | 1 | — | 38 | — | 6 | — | 6 | |||||||||||||||||||||||||||||||||||||||
| Global stocks | — | 129 | — | 129 | — | — | — | — | |||||||||||||||||||||||||||||||||||||||
| International stocks | 117 | 156 | — | 273 | 10 | 21 | — | 31 | |||||||||||||||||||||||||||||||||||||||
| Emerging market stocks | 33 | 70 | — | 103 | — | — | — | — | |||||||||||||||||||||||||||||||||||||||
| Real estate | 45 | — | — | 45 | — | — | — | — | |||||||||||||||||||||||||||||||||||||||
| Hedge funds/absolute return | — | 32 | — | 32 | — | — | — | — | |||||||||||||||||||||||||||||||||||||||
| Other | 21 | 22 | 10 | 53 | 7 | — | 24 | 31 | |||||||||||||||||||||||||||||||||||||||
| Plan investments – excluding investments at NAV | $ | 2,368 | 5,761 | 10 | 8,139 | 64 | 409 | 24 | 497 | ||||||||||||||||||||||||||||||||||||||
| Investments at NAV (2) | 264 | — | |||||||||||||||||||||||||||||||||||||||||||||
| Net receivables | 231 | — | |||||||||||||||||||||||||||||||||||||||||||||
| Total plan assets | $ | 8,634 | 497 | ||||||||||||||||||||||||||||||||||||||||||||
| December 31, 2022 | |||||||||||||||||||||||||||||||||||||||||||||||
| Cash and cash equivalents | $ | 214 | 4 | — | 218 | 41 | 135 | — | 176 | ||||||||||||||||||||||||||||||||||||||
| Long duration fixed income (1) | 1,398 | 4,919 | — | 6,317 | — | — | — | — | |||||||||||||||||||||||||||||||||||||||
| Intermediate (core) fixed income | — | 227 | — | 227 | — | 154 | — | 154 | |||||||||||||||||||||||||||||||||||||||
| High-yield fixed income | — | 91 | — | 91 | — | — | — | — | |||||||||||||||||||||||||||||||||||||||
| International fixed income | — | 84 | — | 84 | — | — | — | — | |||||||||||||||||||||||||||||||||||||||
| Domestic large-cap stocks | 232 | 35 | — | 267 | — | 60 | — | 60 | |||||||||||||||||||||||||||||||||||||||
| Domestic mid-cap stocks | 74 | 40 | — | 114 | — | 16 | — | 16 | |||||||||||||||||||||||||||||||||||||||
| Domestic small-cap stocks | 64 | 4 | — | 68 | — | 9 | — | 9 | |||||||||||||||||||||||||||||||||||||||
| Global stocks | — | 152 | — | 152 | — | — | — | — | |||||||||||||||||||||||||||||||||||||||
| International stocks | 105 | 141 | — | 246 | 9 | 19 | — | 28 | |||||||||||||||||||||||||||||||||||||||
| Emerging market stocks | 29 | 57 | — | 86 | — | — | — | — | |||||||||||||||||||||||||||||||||||||||
| Real estate | 46 | — | — | 46 | — | — | — | — | |||||||||||||||||||||||||||||||||||||||
| Hedge funds/absolute return | — | 42 | — | 42 | — | — | — | — | |||||||||||||||||||||||||||||||||||||||
| Other | 90 | 23 | 10 | 123 | 6 | — | 24 | 30 | |||||||||||||||||||||||||||||||||||||||
| Plan investments – excluding investments at NAV | $ | 2,252 | 5,819 | 10 | 8,081 | 56 | 393 | 24 | 473 | ||||||||||||||||||||||||||||||||||||||
| Investments at NAV (2) | 415 | — | |||||||||||||||||||||||||||||||||||||||||||||
| Net receivables | 104 | 3 | |||||||||||||||||||||||||||||||||||||||||||||
| Total plan assets | $ | 8,600 | 476 | ||||||||||||||||||||||||||||||||||||||||||||
176 |
Wells Fargo & Company | |||||||
|
Balance beginning
of period
|
Gains (losses) (1) |
Purchases, sales and settlements (net) | Transfer into/(out of) Level 3 |
Balance
end of
period
|
|||||||||||||||||||||||||
| (in millions) | |||||||||||||||||||||||||||||
December 31, 2023 |
|||||||||||||||||||||||||||||
| Pension plan assets | $ | 10 | — | — | — | 10 | |||||||||||||||||||||||
| Other benefits plan assets | 24 | — | — | — | 24 | ||||||||||||||||||||||||
December 31, 2022 |
|||||||||||||||||||||||||||||
| Pension plan assets | $ | 11 | — | — | (1) | 10 | |||||||||||||||||||||||
| Other benefits plan assets | 24 | — | — | — | 24 | ||||||||||||||||||||||||
| Wells Fargo & Company | 177 |
|||||||
Note 23: Income Taxes | ||
| Year ended December 31, | |||||||||||||||||
| (in millions) | 2023 | 2022 | 2021 | ||||||||||||||
| Current: | |||||||||||||||||
| U.S. Federal | $ | 2,883 | 888 | 5,850 | |||||||||||||
| U.S. State and local | (453) | (45) | 849 | ||||||||||||||
| Non-U.S. | 227 | 169 | 171 | ||||||||||||||
| Total current | 2,657 | 1,012 | 6,870 | ||||||||||||||
| Deferred: | |||||||||||||||||
U.S. Federal (1) |
(662) | 767 | (1,296) | ||||||||||||||
U.S. State and local (1) |
586 | 481 | 236 | ||||||||||||||
| Non-U.S. | 26 | (9) | (46) | ||||||||||||||
| Total deferred | (50) | 1,239 | (1,106) | ||||||||||||||
| Total | $ | 2,607 | 2,251 | 5,764 | |||||||||||||
| December 31, | |||||||||||||||||||||||||||||||||||
| 2023 | 2022 | 2021 | |||||||||||||||||||||||||||||||||
| (in millions) | Amount | Rate | Amount | Rate | Amount | Rate | |||||||||||||||||||||||||||||
| Statutory federal income tax expense and rate | $ | 4,567 | 21.0 | % | $ | 3,345 | 21.0 | % | $ | 5,854 | 21.0 | % | |||||||||||||||||||||||
| Change in tax rate resulting from: | |||||||||||||||||||||||||||||||||||
| State and local taxes on income, net of federal income tax benefit | 855 | 3.9 | 581 | 3.7 | 1,075 | 3.9 | |||||||||||||||||||||||||||||
| Tax-exempt interest | (308) | (1.4) | (321) | (2.0) | (316) | (1.1) | |||||||||||||||||||||||||||||
Tax credits, net of amortization (2) |
(1,546) | (7.1) | (1,264) | (8.0) | (1,001) | (3.6) | |||||||||||||||||||||||||||||
Nondeductible expenses (3) |
214 | 1.0 | 560 | 3.5 | 368 | 1.3 | |||||||||||||||||||||||||||||
| Changes in prior year unrecognized tax benefits, inclusive of interest | (1,009) | (4.6) | (503) | (3.2) | (122) | (0.4) | |||||||||||||||||||||||||||||
| Other | (166) | (0.8) | (147) | (0.9) | (94) | (0.4) | |||||||||||||||||||||||||||||
Effective income tax expense and rate |
$ | 2,607 | 12.0 | % | $ | 2,251 | 14.1 | % | $ | 5,764 | 20.7 | % | |||||||||||||||||||||||
178 |
Wells Fargo & Company | |||||||
| (in millions) | Dec 31, 2023 |
Dec 31, 2022 |
|||||||||
| Deferred tax assets | |||||||||||
Net operating loss and tax credit carryforwards |
$ | 4,369 | 5,513 | ||||||||
| Allowance for credit losses | 3,648 | 3,393 | |||||||||
Deferred compensation and employee benefits |
3,201 | 2,799 | |||||||||
| Net unrealized losses on debt securities | 2,784 | 3,193 | |||||||||
| Accrued expenses | 1,416 | 1,843 | |||||||||
Capitalized research expenses (1) |
1,389 | 938 | |||||||||
| Lease liabilities | 1,011 | 1,132 | |||||||||
Other (1) |
962 | 1,106 | |||||||||
| Total deferred tax assets | 18,780 | 19,917 | |||||||||
| Deferred tax assets valuation allowance | (222) | (232) | |||||||||
| Deferred tax liabilities | |||||||||||
| Mark to market, net | (12,571) | (11,081) | |||||||||
| Leasing and fixed assets | (2,794) | (2,792) | |||||||||
| Mortgage servicing rights | (1,552) | (2,153) | |||||||||
| Intangible assets | (874) | (753) | |||||||||
| Right-of-use assets | (818) | (935) | |||||||||
| Basis difference in investments | (60) | (1,095) | |||||||||
Other (2) |
(520) | (1,119) | |||||||||
| Total deferred tax liabilities | (19,189) | (19,928) | |||||||||
Net deferred tax liability (3) |
$ | (631) | (243) | ||||||||
| (in millions) | Dec 31, 2023 | ||||
| U.S. Federal tax credits | $ | 3,978 | |||
| U.S. State NOLs and credits | 309 | ||||
| Non-U.S. NOLs and credits | 82 | ||||
| Total net operating loss and tax credit carryforwards | $ | 4,369 | |||
| Wells Fargo & Company | 179 |
|||||||
| Year ended December 31, |
|||||||||||
| (in millions) | 2023 | 2022 | |||||||||
| Balance, beginning of period | $ | 5,437 | 5,218 | ||||||||
| Additions: | |||||||||||
| For tax positions related to the current year | 246 | 695 | |||||||||
| For tax positions related to prior years | 352 | 358 | |||||||||
| Reductions: | |||||||||||
| For tax positions related to prior years | (765) | (514) | |||||||||
| Lapse of statute of limitations | (389) | (13) | |||||||||
| Settlements with tax authorities | (767) | (307) | |||||||||
| Balance, end of period | $ | 4,114 | 5,437 | ||||||||
| Jurisdiction | Tax Year(s) | Status | ||||||||||||
| United States | 2015-2016 | Administrative appeals | ||||||||||||
| United States | 2017-2020 | Field examination | ||||||||||||
| California | 2015-2020 | Field examination | ||||||||||||
| New York State | 2017-2019 | Field examination | ||||||||||||
| New York City | 2015-2019 | Field examination | ||||||||||||
180 |
Wells Fargo & Company | |||||||
Note 24: Earnings and Dividends Per Common Share | ||
| Year ended December 31, | ||||||||||||||||||||
| (in millions, except per share amounts) | 2023 | 2022 | 2021 | |||||||||||||||||
| Wells Fargo net income (1) | $ | 19,142 | 13,677 | 22,109 | ||||||||||||||||
| Less: Preferred stock dividends and other (2) | 1,160 | 1,115 | 1,291 | |||||||||||||||||
| Wells Fargo net income applicable to common stock (numerator) | $ | 17,982 | 12,562 | 20,818 | ||||||||||||||||
| Earnings per common share | ||||||||||||||||||||
| Average common shares outstanding (denominator) | 3,688.3 | 3,805.2 | 4,061.9 | |||||||||||||||||
| Per share | $ | 4.88 | 3.30 | 5.13 | ||||||||||||||||
| Diluted earnings per common share | ||||||||||||||||||||
| Average common shares outstanding | 3,688.3 | 3,805.2 | 4,061.9 | |||||||||||||||||
| Add: | Restricted share rights (3) | 32.1 | 31.8 | 34.3 | ||||||||||||||||
| Diluted average common shares outstanding (denominator) | 3,720.4 | 3,837.0 | 4,096.2 | |||||||||||||||||
| Per share | $ | 4.83 | 3.27 | 5.08 | ||||||||||||||||
| Weighted-average shares | |||||||||||||||||
| Year ended December 31, | |||||||||||||||||
| (in millions) | 2023 | 2022 | 2021 | ||||||||||||||
| Convertible Preferred Stock, Series L (1) | 25.3 | 25.3 | 25.3 | ||||||||||||||
| Restricted share rights (2) | 0.1 | 0.2 | 0.2 | ||||||||||||||
| Year ended December 31, | |||||||||||||||||
| 2023 | 2022 | 2021 | |||||||||||||||
| Per common share | $ | 1.30 | 1.10 | 0.60 | |||||||||||||
| Wells Fargo & Company | 181 |
|||||||
Note 25: Other Comprehensive Income | ||
| Twelve months ended December 31, | |||||||||||||||||||||||||||||||||||||||||||||||||||||
| 2023 | 2022 | 2021 | |||||||||||||||||||||||||||||||||||||||||||||||||||
| (in millions) | Before tax |
Tax effect |
Net of tax |
Before tax |
Tax effect |
Net of tax |
Before tax |
Tax effect |
Net of tax |
||||||||||||||||||||||||||||||||||||||||||||
| Debt securities: | |||||||||||||||||||||||||||||||||||||||||||||||||||||
| Net unrealized gains (losses) arising during the period | $ | 1,136 | (278) | 858 | (14,320) | 3,526 | (10,794) | (3,069) | 759 | (2,310) | |||||||||||||||||||||||||||||||||||||||||||
| Reclassification of net (gains) losses to net income | 549 | (136) | 413 | 391 | (97) | 294 | (82) | 18 | (64) | ||||||||||||||||||||||||||||||||||||||||||||
| Net change | 1,685 | (414) | 1,271 | (13,929) | 3,429 | (10,500) | (3,151) | 777 | (2,374) | ||||||||||||||||||||||||||||||||||||||||||||
| Derivatives and hedging activities: | |||||||||||||||||||||||||||||||||||||||||||||||||||||
| Fair Value Hedges: | |||||||||||||||||||||||||||||||||||||||||||||||||||||
| Change in fair value of excluded components on fair value hedges (1) | 22 | (6) | 16 | 87 | (21) | 66 | 81 | (20) | 61 | ||||||||||||||||||||||||||||||||||||||||||||
| Cash Flow Hedges: | |||||||||||||||||||||||||||||||||||||||||||||||||||||
| Net unrealized gains (losses) arising during the period on cash flow hedges | (201) | 50 | (151) | (1,541) | 381 | (1,160) | (12) | 3 | (9) | ||||||||||||||||||||||||||||||||||||||||||||
| Reclassification of net (gains) losses to net income | 724 | (178) | 546 | 6 | (2) | 4 | 143 | (36) | 107 | ||||||||||||||||||||||||||||||||||||||||||||
| Net change | 545 | (134) | 411 | (1,448) | 358 | (1,090) | 212 | (53) | 159 | ||||||||||||||||||||||||||||||||||||||||||||
| Defined benefit plans adjustments: | |||||||||||||||||||||||||||||||||||||||||||||||||||||
| Net actuarial and prior service gains (losses) arising during the period | (22) | 5 | (17) | (141) | 35 | (106) | 200 | (50) | 150 | ||||||||||||||||||||||||||||||||||||||||||||
| Reclassification of amounts to noninterest expense (2) | 109 | (24) | 85 | 343 | (83) | 260 | 261 | (62) | 199 | ||||||||||||||||||||||||||||||||||||||||||||
| Net change | 87 | (19) | 68 | 202 | (48) | 154 | 461 | (112) | 349 | ||||||||||||||||||||||||||||||||||||||||||||
| Debit valuation adjustments (DVA) and other: | |||||||||||||||||||||||||||||||||||||||||||||||||||||
| Net unrealized gains (losses) arising during the period (3) | (38) | 9 | (29) | 73 | (15) | 58 | (81) | 17 | (64) | ||||||||||||||||||||||||||||||||||||||||||||
| Reclassification of net (gains) losses to net income | — | — | — | — | — | — | — | — | — | ||||||||||||||||||||||||||||||||||||||||||||
| Net change | (38) | 9 | (29) | 73 | (15) | 58 | (81) | 17 | (64) | ||||||||||||||||||||||||||||||||||||||||||||
| Foreign currency translation adjustments: | |||||||||||||||||||||||||||||||||||||||||||||||||||||
| Net unrealized gains (losses) arising during the period | 65 | (2) | 63 | (233) | (3) | (236) | (30) | 1 | (29) | ||||||||||||||||||||||||||||||||||||||||||||
| Reclassification of net (gains) losses to net income | — | — | — | — | — | — | (1) | — | (1) | ||||||||||||||||||||||||||||||||||||||||||||
| Net change | 65 | (2) | 63 | (233) | (3) | (236) | (31) | 1 | (30) | ||||||||||||||||||||||||||||||||||||||||||||
| Other comprehensive income (loss) | $ | 2,344 | (560) | 1,784 | (15,335) | 3,721 | (11,614) | (2,590) | 630 | (1,960) | |||||||||||||||||||||||||||||||||||||||||||
| Less: Other comprehensive income from noncontrolling interests, net of tax | 2 | 2 | — | ||||||||||||||||||||||||||||||||||||||||||||||||||
Wells Fargo other comprehensive income (loss), net of tax |
$ | 1,782 | (11,616) | (1,960) | |||||||||||||||||||||||||||||||||||||||||||||||||
182 |
Wells Fargo & Company | |||||||
| (in millions) | Debt securities |
Fair value hedges (1) | Cash flow hedges (2) | Defined benefit plans adjustments |
Debit valuation adjustments (DVA) and other |
Foreign currency translation adjustments |
Accumulated other comprehensive income (loss) |
||||||||||||||||||||||||||||||||||
Balance, December 31, 2020 |
$ | 3,039 | (204) | (125) | (2,404) | — | (112) | 194 | |||||||||||||||||||||||||||||||||
| Transition adjustment | — | — | — | — | 20 | — | 20 | ||||||||||||||||||||||||||||||||||
Balance, January 1, 2021 |
3,039 | (204) | (125) | (2,404) | 20 | (112) | 214 | ||||||||||||||||||||||||||||||||||
| Net unrealized gains (losses) arising during the period | (2,310) | 61 | (9) | 150 | (64) | (29) | (2,201) | ||||||||||||||||||||||||||||||||||
| Amounts reclassified from accumulated other comprehensive income | (64) | — | 107 | 199 | — | (1) | 241 | ||||||||||||||||||||||||||||||||||
| Net change | (2,374) | 61 | 98 | 349 | (64) | (30) | (1,960) | ||||||||||||||||||||||||||||||||||
| Less: Other comprehensive income from noncontrolling interests | — | — | — | — | — | — | — | ||||||||||||||||||||||||||||||||||
Balance, December 31, 2021 |
665 | (143) | (27) | (2,055) | (44) | (142) | (1,746) | ||||||||||||||||||||||||||||||||||
| Net unrealized gains (losses) arising during the period | (10,794) | 66 | (1,160) | (106) | 58 | (236) | (12,172) | ||||||||||||||||||||||||||||||||||
| Amounts reclassified from accumulated other comprehensive income | 294 | — | 4 | 260 | — | — | 558 | ||||||||||||||||||||||||||||||||||
| Net change | (10,500) | 66 | (1,156) | 154 | 58 | (236) | (11,614) | ||||||||||||||||||||||||||||||||||
| Less: Other comprehensive loss from noncontrolling interests | — | — | — | — | — | 2 | 2 | ||||||||||||||||||||||||||||||||||
Balance, December 31, 2022 (3)(4) |
(9,835) | (77) | (1,183) | (1,901) | 14 | (380) | (13,362) | ||||||||||||||||||||||||||||||||||
| Net unrealized gains (losses) arising during the period | 858 | 16 | (151) | (17) | (29) | 63 | 740 | ||||||||||||||||||||||||||||||||||
| Amounts reclassified from accumulated other comprehensive income | 413 | — | 546 | 85 | — | — | 1,044 | ||||||||||||||||||||||||||||||||||
| Net change | 1,271 | 16 | 395 | 68 | (29) | 63 | 1,784 | ||||||||||||||||||||||||||||||||||
| Less: Other comprehensive income from noncontrolling interests | — | — | — | — | — | 2 | 2 | ||||||||||||||||||||||||||||||||||
Balance, December 31, 2023 (3)(4) |
$ | (8,564) | (61) | (788) | (1,833) | (15) | (319) | (11,580) | |||||||||||||||||||||||||||||||||
| Wells Fargo & Company | 183 |
|||||||
Note 26: Regulatory Capital Requirements and Other Restrictions | ||
| Wells Fargo & Company | Wells Fargo Bank, N.A. | ||||||||||||||||||||||||||||||||||||||||||||||
| Standardized Approach | Advanced Approach | Standardized Approach | Advanced Approach | ||||||||||||||||||||||||||||||||||||||||||||
| (in millions, except ratios) | December 31, 2023 | December 31, 2022 | December 31, 2023 | December 31, 2022 | December 31, 2023 | December 31, 2022 | December 31, 2023 | December 31, 2022 | |||||||||||||||||||||||||||||||||||||||
| Regulatory capital: | |||||||||||||||||||||||||||||||||||||||||||||||
| Common Equity Tier 1 | $ | 140,783 | 133,527 | 140,783 | 133,527 | 142,108 | 140,644 | 142,108 | 140,644 | ||||||||||||||||||||||||||||||||||||||
| Tier 1 | 159,823 | 152,567 | 159,823 | 152,567 | 142,108 | 140,644 | 142,108 | 140,644 | |||||||||||||||||||||||||||||||||||||||
| Total | 193,061 | 186,747 | 182,726 | 177,258 | 165,634 | 163,885 | 155,560 | 154,292 | |||||||||||||||||||||||||||||||||||||||
| Assets: | |||||||||||||||||||||||||||||||||||||||||||||||
| Risk-weighted assets | 1,231,668 | 1,259,889 | 1,114,281 | 1,112,307 | 1,137,605 | 1,177,300 | 956,545 | 977,713 | |||||||||||||||||||||||||||||||||||||||
Adjusted average assets (1) |
1,880,981 | 1,846,954 | 1,880,981 | 1,846,954 | 1,682,199 | 1,685,401 | 1,682,199 | 1,685,401 | |||||||||||||||||||||||||||||||||||||||
| Regulatory capital ratios: | |||||||||||||||||||||||||||||||||||||||||||||||
| Common Equity Tier 1 capital | 11.43 | % | * | 10.60 | 12.63 | 12.00 | 12.49 | * | 11.95 | 14.86 | 14.39 | ||||||||||||||||||||||||||||||||||||
| Tier 1 capital | 12.98 | * | 12.11 | 14.34 | 13.72 | 12.49 | * | 11.95 | 14.86 | 14.39 | |||||||||||||||||||||||||||||||||||||
| Total capital | 15.67 | * | 14.82 | 16.40 | 15.94 | 14.56 | * | 13.92 | 16.26 | 15.78 | |||||||||||||||||||||||||||||||||||||
| Required minimum capital ratios: | |||||||||||||||||||||||||||||||||||||||||||||||
| Common Equity Tier 1 capital | 8.90 | 9.20 | 8.50 | 8.50 | 7.00 | 7.00 | 7.00 | 7.00 | |||||||||||||||||||||||||||||||||||||||
| Tier 1 capital | 10.40 | 10.70 | 10.00 | 10.00 | 8.50 | 8.50 | 8.50 | 8.50 | |||||||||||||||||||||||||||||||||||||||
| Total capital | 12.40 | 12.70 | 12.00 | 12.00 | 10.50 | 10.50 | 10.50 | 10.50 | |||||||||||||||||||||||||||||||||||||||
| Wells Fargo & Company | Wells Fargo Bank, N.A. | ||||||||||||||||||||||||||||||||||||||||||||||
| December 31, 2023 | December 31, 2022 | December 31, 2023 | December 31, 2022 | ||||||||||||||||||||||||||||||||||||||||||||
| Regulatory leverage: | |||||||||||||||||||||||||||||||||||||||||||||||
Total leverage exposure (1) |
$ | 2,253,933 | 2,224,789 | 2,048,633 | 2,058,568 | ||||||||||||||||||||||||||||||||||||||||||
Supplementary leverage ratio (1) |
7.09 | % | 6.86 | 6.94 | 6.83 | ||||||||||||||||||||||||||||||||||||||||||
Tier 1 leverage ratio (2) |
8.50 | 8.26 | 8.45 | 8.34 | |||||||||||||||||||||||||||||||||||||||||||
| Required minimum leverage: | |||||||||||||||||||||||||||||||||||||||||||||||
| Supplementary leverage ratio | 5.00 | 5.00 | 6.00 | 6.00 | |||||||||||||||||||||||||||||||||||||||||||
| Tier 1 leverage ratio | 4.00 | 4.00 | 4.00 | 4.00 | |||||||||||||||||||||||||||||||||||||||||||
184 |
Wells Fargo & Company | |||||||
| (in millions) | Dec 31, 2023 |
Dec 31, 2022 |
|||||||||
| Reserve balance for non-U.S. central banks | $ | 230 | 238 | ||||||||
| Segregated for benefit of brokerage customers under federal and other brokerage regulations | 986 | 898 | |||||||||
| Wells Fargo & Company | 185 |
|||||||
Note 27: Parent-Only Financial Statements | ||
| Year ended December 31, | |||||||||||||||||
| (in millions) | 2023 | 2022 | 2021 | ||||||||||||||
| Income | |||||||||||||||||
| Dividends from subsidiaries (1) | $ | 22,300 | 14,590 | 17,895 | |||||||||||||
| Interest income from subsidiaries | 10,845 | 4,759 | 3,934 | ||||||||||||||
| Other interest income | 6 | 2 | 1 | ||||||||||||||
| Other income | 211 | (53) | (418) | ||||||||||||||
| Total income | 33,362 | 19,298 | 21,412 | ||||||||||||||
| Expense | |||||||||||||||||
| Interest expense: | |||||||||||||||||
| Indebtedness to nonbank subsidiaries | 2,567 | 1,124 | 89 | ||||||||||||||
| Long-term debt | 9,909 | 4,994 | 2,823 | ||||||||||||||
| Noninterest expense | 504 | 2,043 | 309 | ||||||||||||||
| Total expense | 12,980 | 8,161 | 3,221 | ||||||||||||||
| Income before income tax benefit and equity in undistributed income of subsidiaries | 20,382 | 11,137 | 18,191 | ||||||||||||||
Income tax benefit (2) |
(1,076) | (1,497) | (816) | ||||||||||||||
Equity in undistributed income of subsidiaries (2) |
(2,316) | 1,043 | 3,102 | ||||||||||||||
Net income (2) |
$ | 19,142 | 13,677 | 22,109 | |||||||||||||
| Year ended December 31, | |||||||||||||||||
| (in millions) | 2023 | 2022 | 2021 | ||||||||||||||
Net income (1) |
$ | 19,142 | 13,677 | 22,109 | |||||||||||||
| Other comprehensive income (loss), after tax: | |||||||||||||||||
| Debt securities | 2 | 34 | 5 | ||||||||||||||
| Derivatives and hedging activities | 22 | 57 | 49 | ||||||||||||||
| Defined benefit plans adjustments | 70 | 145 | 347 | ||||||||||||||
Debit valuation adjustments (DVA) and other |
(18) | (6) | — | ||||||||||||||
Equity in other comprehensive income (loss) of subsidiaries (1) |
1,706 | (11,846) | (2,361) | ||||||||||||||
Other comprehensive income (loss), after tax |
1,782 | (11,616) | (1,960) | ||||||||||||||
Total comprehensive income (1) |
$ | 20,924 | 2,061 | 20,149 | |||||||||||||
186 |
Wells Fargo & Company | |||||||
| (in millions) | Dec 31, 2023 |
Dec 31, 2022 |
|||||||||
| Assets | |||||||||||
| Cash, cash equivalents, and restricted cash due from subsidiary banks | $ | 15,856 | 16,171 | ||||||||
| Loans to nonbank subsidiaries | 187,306 | 182,656 | |||||||||
Investments in subsidiaries (1) (2) |
161,698 | 161,970 | |||||||||
| Equity securities | 120 | 143 | |||||||||
Other assets (2) |
11,207 | 9,409 | |||||||||
| Total assets | $ | 376,187 | 370,349 | ||||||||
| Liabilities and equity | |||||||||||
Accrued expenses and other liabilities (2) |
$ | 8,933 | 8,264 | ||||||||
| Long-term debt | 148,053 | 134,159 | |||||||||
| Indebtedness to nonbank subsidiaries | 33,466 | 47,699 | |||||||||
| Total liabilities | 190,452 | 190,122 | |||||||||
Stockholders’ equity (2) |
185,735 | 180,227 | |||||||||
| Total liabilities and equity | $ | 376,187 | 370,349 | ||||||||
| Year ended December 31, | |||||||||||||||||
| (in millions) | 2023 | 2022 | 2021 | ||||||||||||||
| Cash flows from operating activities: | |||||||||||||||||
| Net cash provided (used) by operating activities | $ | 25,972 | (4,575) | 11,938 | |||||||||||||
| Cash flows from investing activities: | |||||||||||||||||
| Equity securities, not held for trading: | |||||||||||||||||
| Proceeds from sales and capital returns | 44 | 3 | 11 | ||||||||||||||
| Purchases | (13) | (8) | (18) | ||||||||||||||
| Loans: | |||||||||||||||||
| Capital notes and term loans made to subsidiaries | (5,420) | (3,567) | (3,500) | ||||||||||||||
| Principal collected on notes/loans made to subsidiaries | 1,730 | 4,062 | 2,618 | ||||||||||||||
| Other, net | 9 | (263) | 14 | ||||||||||||||
| Net cash provided (used) by investing activities | (3,650) | 227 | (875) | ||||||||||||||
| Cash flows from financing activities: | |||||||||||||||||
| Net increase (decrease) in short-term borrowings and indebtedness to subsidiaries | (14,238) | 8,153 | 35,958 | ||||||||||||||
| Long-term debt: | |||||||||||||||||
| Proceeds from issuance | 19,070 | 26,520 | 1,001 | ||||||||||||||
| Repayment | (9,311) | (17,618) | (28,331) | ||||||||||||||
| Preferred stock: | |||||||||||||||||
| Proceeds from issuance | 1,722 | — | 5,756 | ||||||||||||||
| Redeemed | (1,725) | — | (6,675) | ||||||||||||||
| Cash dividends paid | (1,141) | (1,115) | (1,205) | ||||||||||||||
| Common stock: | |||||||||||||||||
| Repurchased | (11,851) | (6,033) | (14,464) | ||||||||||||||
| Cash dividends paid | (4,789) | (4,178) | (2,422) | ||||||||||||||
| Other, net | (374) | (344) | (364) | ||||||||||||||
| Net cash provided (used) by financing activities | (22,637) | 5,385 | (10,746) | ||||||||||||||
| Net change in cash, cash equivalents, and restricted cash | (315) | 1,037 | 317 | ||||||||||||||
| Cash, cash equivalents, and restricted cash at beginning of period | 16,171 | 15,134 | 14,817 | ||||||||||||||
| Cash, cash equivalents, and restricted cash at end of period | $ | 15,856 | 16,171 | 15,134 | |||||||||||||
| Wells Fargo & Company | 187 |
|||||||
Report of Independent Registered Public Accounting Firm | ||
188 |
Wells Fargo & Company | |||||||
| Wells Fargo & Company | 189 |
|||||||
190 |
Wells Fargo & Company | |||||||
| Wells Fargo & Company | 191 |
|||||||
| Quarterly Financial Data | |||||||||||||||||||||||||||||||||||||||||||||||
| Condensed Consolidated Statement of Income – Quarterly (Unaudited) | |||||||||||||||||||||||||||||||||||||||||||||||
| 2023 | 2022 | ||||||||||||||||||||||||||||||||||||||||||||||
| Quarter ended | Quarter ended | ||||||||||||||||||||||||||||||||||||||||||||||
| (in millions, except per share amounts) | Dec 31, | Sep 30, | Jun 30, | Mar 31, | Dec 31, | Sep 30, | Jun 30, | Mar 31, | |||||||||||||||||||||||||||||||||||||||
| Interest income | $ | 22,839 | 22,093 | 20,830 | 19,356 | 17,793 | 14,494 | 11,556 | 10,181 | ||||||||||||||||||||||||||||||||||||||
| Interest expense | 10,068 | 8,988 | 7,667 | 6,020 | 4,360 | 2,396 | 1,358 | 960 | |||||||||||||||||||||||||||||||||||||||
| Net interest income | 12,771 | 13,105 | 13,163 | 13,336 | 13,433 | 12,098 | 10,198 | 9,221 | |||||||||||||||||||||||||||||||||||||||
| Noninterest income | |||||||||||||||||||||||||||||||||||||||||||||||
| Deposit and lending-related fees | 1,568 | 1,551 | 1,517 | 1,504 | 1,522 | 1,647 | 1,729 | 1,815 | |||||||||||||||||||||||||||||||||||||||
| Investment advisory and other asset-based fees | 2,169 | 2,224 | 2,163 | 2,114 | 2,049 | 2,111 | 2,346 | 2,498 | |||||||||||||||||||||||||||||||||||||||
| Commissions and brokerage services fees | 619 | 567 | 570 | 619 | 601 | 562 | 542 | 537 | |||||||||||||||||||||||||||||||||||||||
| Investment banking fees | 455 | 492 | 376 | 326 | 331 | 375 | 286 | 447 | |||||||||||||||||||||||||||||||||||||||
| Card fees | 1,027 | 1,098 | 1,098 | 1,033 | 1,095 | 1,119 | 1,112 | 1,029 | |||||||||||||||||||||||||||||||||||||||
| Mortgage banking | 202 | 193 | 202 | 232 | 79 | 324 | 287 | 693 | |||||||||||||||||||||||||||||||||||||||
| Net gains (losses) from trading and securities | 1,105 | 1,246 | 1,032 | 985 | (181) | 872 | (26) | 796 | |||||||||||||||||||||||||||||||||||||||
| Other | 562 | 381 | 412 | 580 | 1,105 | 458 | 566 | 692 | |||||||||||||||||||||||||||||||||||||||
| Total noninterest income | 7,707 | 7,752 | 7,370 | 7,393 | 6,601 | 7,468 | 6,842 | 8,507 | |||||||||||||||||||||||||||||||||||||||
| Total revenue | 20,478 | 20,857 | 20,533 | 20,729 | 20,034 | 19,566 | 17,040 | 17,728 | |||||||||||||||||||||||||||||||||||||||
| Provision for credit losses | 1,282 | 1,197 | 1,713 | 1,207 | 957 | 784 | 580 | (787) | |||||||||||||||||||||||||||||||||||||||
| Noninterest expense | |||||||||||||||||||||||||||||||||||||||||||||||
| Personnel | 9,181 | 8,627 | 8,606 | 9,415 | 8,415 | 8,212 | 8,442 | 9,271 | |||||||||||||||||||||||||||||||||||||||
| Technology, telecommunications and equipment | 1,076 | 975 | 947 | 922 | 902 | 798 | 799 | 876 | |||||||||||||||||||||||||||||||||||||||
| Occupancy | 740 | 724 | 707 | 713 | 722 | 732 | 705 | 722 | |||||||||||||||||||||||||||||||||||||||
| Operating losses | 355 | 329 | 232 | 267 | 3,517 | 2,218 | 576 | 673 | |||||||||||||||||||||||||||||||||||||||
| Professional and outside services | 1,242 | 1,310 | 1,304 | 1,229 | 1,357 | 1,235 | 1,310 | 1,286 | |||||||||||||||||||||||||||||||||||||||
| Advertising and promotion | 259 | 215 | 184 | 154 | 178 | 126 | 102 | 99 | |||||||||||||||||||||||||||||||||||||||
| Other | 2,933 | 933 | 1,007 | 976 | 1,095 | 985 | 928 | 924 | |||||||||||||||||||||||||||||||||||||||
| Total noninterest expense | 15,786 | 13,113 | 12,987 | 13,676 | 16,186 | 14,306 | 12,862 | 13,851 | |||||||||||||||||||||||||||||||||||||||
| Income before income tax expense (benefit) | 3,410 | 6,547 | 5,833 | 5,846 | 2,891 | 4,476 | 3,598 | 4,664 | |||||||||||||||||||||||||||||||||||||||
| Income tax expense (benefit) | (100) | 811 | 930 | 966 | (29) | 912 | 622 | 746 | |||||||||||||||||||||||||||||||||||||||
| Net income before noncontrolling interests | 3,510 | 5,736 | 4,903 | 4,880 | 2,920 | 3,564 | 2,976 | 3,918 | |||||||||||||||||||||||||||||||||||||||
| Less: Net income (loss) from noncontrolling interests | 64 | (31) | (35) | (111) | (235) | (28) | (166) | 130 | |||||||||||||||||||||||||||||||||||||||
| Wells Fargo net income | $ | 3,446 | 5,767 | 4,938 | 4,991 | 3,155 | 3,592 | 3,142 | 3,788 | ||||||||||||||||||||||||||||||||||||||
| Less: Preferred stock dividends and other | 286 | 317 | 279 | 278 | 278 | 279 | 279 | 279 | |||||||||||||||||||||||||||||||||||||||
| Wells Fargo net income applicable to common stock | $ | 3,160 | 5,450 | 4,659 | 4,713 | 2,877 | 3,313 | 2,863 | 3,509 | ||||||||||||||||||||||||||||||||||||||
| Per share information | |||||||||||||||||||||||||||||||||||||||||||||||
| Earnings per common share | $ | 0.87 | 1.49 | 1.26 | 1.24 | 0.76 | 0.87 | 0.75 | 0.92 | ||||||||||||||||||||||||||||||||||||||
| Diluted earnings per common share | 0.86 | 1.48 | 1.25 | 1.23 | 0.75 | 0.86 | 0.75 | 0.91 | |||||||||||||||||||||||||||||||||||||||
| Average common shares outstanding | 3,620.9 | 3,648.8 | 3,699.9 | 3,785.6 | 3,799.9 | 3,796.5 | 3,793.8 | 3,831.1 | |||||||||||||||||||||||||||||||||||||||
| Diluted average common shares outstanding | 3,657.0 | 3,680.6 | 3,724.9 | 3,818.7 | 3,832.7 | 3,825.1 | 3,819.6 | 3,868.9 | |||||||||||||||||||||||||||||||||||||||
192 |
Wells Fargo & Company | |||||||
| Glossary of Acronyms | |||||||||||
| ACL | Allowance for credit losses | HTM | Held-to-maturity | ||||||||
| AFS | Available-for-sale | LCR | Liquidity coverage ratio | ||||||||
| AOCI | Accumulated other comprehensive income | LHFS | Loans held for sale | ||||||||
| ARM | Adjustable-rate mortgage | LIHTC | Low-income housing tax credit | ||||||||
| ASC | Accounting Standards Codification | LOCOM | Lower of cost or fair value | ||||||||
| ASU | Accounting Standards Update | LTV | Loan-to-value | ||||||||
| AVM | Automated valuation model | MBS | Mortgage-backed securities | ||||||||
| BCBS | Basel Committee on Banking Supervision | MSR | Mortgage servicing right | ||||||||
| BHC | Bank holding company | NAV | Net asset value | ||||||||
| CCAR | Comprehensive Capital Analysis and Review | NPA | Nonperforming asset | ||||||||
| CD | Certificate of deposit | NSFR | Net stable funding ratio | ||||||||
| CECL | Current expected credit loss | OCC | Office of the Comptroller of the Currency | ||||||||
| CET1 | Common Equity Tier 1 | OCI | Other comprehensive income | ||||||||
| CFPB | Consumer Financial Protection Bureau | OTC | Over-the-counter | ||||||||
| CLO | Collateralized loan obligation | PCD | Purchased credit-deteriorated | ||||||||
| CRE | Commercial real estate | RMBS | Residential mortgage-backed securities | ||||||||
| DPD | Days past due | ROA | Return on average assets | ||||||||
| ESOP | Employee Stock Ownership Plan | ROE | Return on average equity | ||||||||
| FASB | Financial Accounting Standards Board | ROTCE | Return on average tangible common equity | ||||||||
| FDIC | Federal Deposit Insurance Corporation | RWAs | Risk-weighted assets | ||||||||
| FHA | Federal Housing Administration | SEC | Securities and Exchange Commission | ||||||||
| FHLB | Federal Home Loan Bank | S&P | Standard & Poor’s Global Ratings | ||||||||
| FHLMC | Federal Home Loan Mortgage Corporation | SLR | Supplementary leverage ratio | ||||||||
| FICO | Fair Isaac Corporation (credit rating) | SOFR | Secured Overnight Financing Rate | ||||||||
| FNMA | Federal National Mortgage Association | SPE | Special purpose entity | ||||||||
| FRB | Board of Governors of the Federal Reserve System | TDR | Troubled debt restructuring | ||||||||
| GAAP | Generally accepted accounting principles | TLAC | Total Loss Absorbing Capacity | ||||||||
| GNMA | Government National Mortgage Association | VA | Department of Veterans Affairs | ||||||||
| GSE | Government-sponsored entity | VaR | Value-at-Risk | ||||||||
| G-SIB | Global systemically important bank | VIE | Variable interest entity | ||||||||
| HQLA | High-quality liquid assets | WIM | Wealth and Investment Management | ||||||||
| Wells Fargo & Company | 193 |
|||||||
| SUBSIDIARIES OF THE PARENT | ||||||||
The table below is a list of direct and indirect subsidiaries of the Parent as of December 31, 2023, and the state or jurisdiction in which the subsidiaries are organized. Pursuant to Item 601(b)(21)(ii) of Regulation S-K, certain subsidiaries of the Parent have been omitted from this list because, considered in the aggregate as a single subsidiary, such subsidiaries would not constitute a “significant subsidiary” as that term is defined in Rule 1-02(w) of Regulation S-X. | ||||||||
| Subsidiary | Jurisdiction of Incorporation or Organization | |||||||
| EVEREN Capital Corporation | Delaware | |||||||
| Omniplus Capital Corporation | Delaware | |||||||
| Peony Asset Management, Inc. | Delaware | |||||||
| Wells Fargo Advisors Financial Network, LLC | Delaware | |||||||
| Wells Fargo Bank, National Association | United States | |||||||
| Wells Fargo Clearing Services, LLC | Delaware | |||||||
| Wells Fargo Equipment Finance, Inc. | Minnesota | |||||||
| Wells Fargo Funding, LLC | Minnesota | |||||||
| Wells Fargo International Solutions Private Limited | India | |||||||
| Wells Fargo Municipal Capital Strategies, LLC | Delaware | |||||||
| Wells Fargo National Bank West | United States | |||||||
| Wells Fargo Securities, LLC | Delaware | |||||||
| WFC Holdings, LLC | Delaware | |||||||
| File Number | Form | Description | ||||||
| 333-269514 | S-3 | Universal Shelf 2023 | ||||||
| 333-270532 333-270532-01 |
S-3 | Debt Shelf 2023 | ||||||
| 333-253886 | S-3 | Wells Fargo Direct Purchase and Dividend Reinvestment Plan | ||||||
| 333-154879 | S-4/S-8 | Wachovia Corporation | ||||||
| 333-265104 | S-8 | Long-Term Incentive Plan | ||||||
| 333-232389 | S-8 | Long-Term Incentive Compensation Plan | ||||||
| 333-192903 | S-8 | Long-Term Incentive Compensation Plan | ||||||
| 333-168819 | S-8 | Long-Term Incentive Compensation Plan | ||||||
| 333-211639 | S-8 | 401(k) Plan | ||||||
| 333-200400 | S-8 | Supplemental 401(k) Plan | ||||||
| 333-180997 | S-8 | Directors Stock Compensation and Deferral Plan | ||||||
| 333-176266 | S-8 | Special Deferral Plan for Select Employees and Special Award Plan | ||||||
| 333-275685 | S-8 | Deferred Compensation Plan | ||||||
| 333-232390 | S-8 | Deferred Compensation Plan | ||||||
| 333-207636 | S-8 | Deferred Compensation Plan | ||||||
| 333-142941 | S-8 | Deferred Compensation Plan | ||||||
| 333-260403 | S-8 | Wells Fargo Stock Purchase Plan | ||||||
| 333-211638 | S-8 | Wells Fargo Stock Purchase Plan | ||||||
| 333-161529 | S-8 | Wachovia Deferred Compensation Obligations | ||||||

| /s/ STEVEN D. BLACK | /s/ MARIA R. MORRIS | ||||
| /s/ MARK A. CHANCY | /s/ FELICIA F. NORWOOD | ||||
| /s/ CELESTE A. CLARK | /s/ RICHARD B. PAYNE, JR. | ||||
| /s/ THEODORE F. CRAVER, JR. | /s/ RONALD L. SARGENT | ||||
| /s/ RICHARD K. DAVIS | /s/ CHARLES W. SCHARF | ||||
| /s/ WAYNE M. HEWETT | /s/ SUZANNE M. VAUTRINOT | ||||
| /s/ CECELIA G. MORKEN | |||||
| /s/ CHARLES W. SCHARF | ||||||||
| Charles W. Scharf | ||||||||
| Chief Executive Officer | ||||||||
| Date: | February 20, 2024 | |||||||
| /s/ MICHAEL P. SANTOMASSIMO | ||||||||
| Michael P. Santomassimo | ||||||||
| Chief Financial Officer | ||||||||
| Date: | February 20, 2024 | |||||||
| /s/ CHARLES W. SCHARF | ||||||||
| Charles W. Scharf | ||||||||
| Chief Executive Officer | ||||||||
| Date: | February 20, 2024 | |||||||
| /s/ MICHAEL P. SANTOMASSIMO | ||||||||
| Michael P. Santomassimo | ||||||||
| Chief Financial Officer | ||||||||
| Date: | February 20, 2024 | |||||||