| New York | 1-5837 | 13-1102020 | |||||||||||||||
| (State or other jurisdiction of incorporation) |
(Commission File Number) |
(I.R.S. Employer Identification No.) |
|||||||||||||||
| 620 Eighth Avenue, | New York, | New York | 10018 | ||||||||||||||
| (Address and zip code of principal executive offices) | |||||||||||||||||
| Title of each class | Trading Symbol(s) | Name of each exchange on which registered | ||||||
| Class A Common Stock | NYT | New York Stock Exchange | ||||||
| Exhibit Number | Description | |||||||
| Exhibit 99.1 | ||||||||
Exhibit 104 |
|
Cover Page Interactive Data File (embedded within the Inline XBRL document) |
||||||
| THE NEW YORK TIMES COMPANY | ||||||||
Date: November 8, 2023 |
By: | /s/ Diane Brayton | ||||||
| Diane Brayton | ||||||||
|
Executive Vice President and
General Counsel
|
||||||||

| Q3 2023 | Q2 2023 | Q1 2023 | Q4 2022 | Q3 2022 | ||||||||||||||||||||||||||||
Total subscribers(1) |
10,080 | 9,880 | 9,730 | 9,550 | 9,330 | |||||||||||||||||||||||||||
Digital-only subscribers(1) |
9,410 | 9,190 | 9,020 | 8,830 | 8,590 | |||||||||||||||||||||||||||
Digital-only subscribers quarterly net additions(1) |
210 | 180 | 190 | 240 | 180 | |||||||||||||||||||||||||||
| Total digital-only ARPU | $ | 9.28 | $ | 9.15 | $ | 9.04 | $ | 8.93 | $ | 8.87 | ||||||||||||||||||||||
| % change year-over-year | 4.6 | % | 3.6 | % | (1.0) | % | (7.0) | % | (8.0) | % | ||||||||||||||||||||||
| Digital-only subscription revenues | $ | 282.2 | $ | 269.8 | $ | 258.8 | $ | 269.2 | $ | 243.9 | ||||||||||||||||||||||
| % change year-over-year | 15.7 | % | 13.0 | % | 14.1 | % | 31.0 | % | 22.8 | % | ||||||||||||||||||||||
| Digital advertising revenues | $ | 75.0 | $ | 73.8 | $ | 61.3 | $ | 111.9 | $ | 70.3 | ||||||||||||||||||||||
| % change year-over-year | 6.7 | % | 6.5 | % | (8.5) | % | 0.6 | % | 4.9 | % | ||||||||||||||||||||||
| Total revenues | $ | 598.3 | $ | 590.9 | $ | 560.7 | $ | 667.5 | $ | 547.7 | ||||||||||||||||||||||
| % change year-over-year | 9.3 | % | 6.3 | % | 4.3 | % | 12.3 | % | 7.6 | % | ||||||||||||||||||||||
Total operating costs(2) |
$ | 534.8 | $ | 535.1 | $ | 532.8 | $ | 574.5 | $ | 496.7 | ||||||||||||||||||||||
% change year-over-year(2) |
7.7 | % | 6.2 | % | 0.3 | % | 14.9 | % | 7.9 | % | ||||||||||||||||||||||
Adjusted operating costs(3) |
$ | 508.6 | $ | 498.7 | $ | 506.8 | $ | 525.7 | $ | 478.7 | ||||||||||||||||||||||
| % change year-over-year | 6.2 | % | 4.0 | % | 6.4 | % | 8.4 | % | 7.8 | % | ||||||||||||||||||||||
| Operating profit | $ | 63.6 | $ | 55.8 | $ | 27.9 | $ | 93.0 | $ | 51.0 | ||||||||||||||||||||||
| Operating profit margin % | 10.6 | % | 9.4 | % | 5.0 | % | 13.9 | % | 9.3 | % | ||||||||||||||||||||||
AOP - New York Times Group (“NYTG”)(4) |
$ | 97.7 | $ | 100.0 | $ | 65.3 | $ | 151.5 | $ | 81.0 | ||||||||||||||||||||||
AOP margin % - NYTG(4) |
17.3 | % | 17.8 | % | 12.3 | % | 23.7 | % | 15.5 | % | ||||||||||||||||||||||
AOP - The Athletic(4) |
$ | (7.9) | $ | (7.8) | $ | (11.3) | $ | (9.6) | $ | (12.1) | ||||||||||||||||||||||
Adjusted operating profit (“AOP”)(3) |
$ | 89.8 | $ | 92.2 | $ | 54.0 | $ | 141.8 | $ | 69.0 | ||||||||||||||||||||||
AOP margin %(3) |
15.0 | % | 15.6 | % | 9.6 | % | 21.2 | % | 12.6 | % | ||||||||||||||||||||||
| Diluted earnings per share (“EPS”) | $ | 0.32 | $ | 0.28 | $ | 0.13 | $ | 0.43 | $ | 0.22 | ||||||||||||||||||||||
Adjusted diluted EPS(3) |
$ | 0.37 | $ | 0.38 | $ | 0.19 | $ | 0.59 | $ | 0.24 | ||||||||||||||||||||||
| Diluted shares | 165.4 | 165.0 | 165.4 | 165.9 | 166.5 | |||||||||||||||||||||||||||
(1) Subscribers (including net subscriber additions) are rounded to the nearest ten thousand. | ||||||||||||||||||||||||||||||||
(2) Recast to conform to the current presentation of total operating costs. See “Comparisons” for more details. | ||||||||||||||||||||||||||||||||
(3) Non-GAAP financial measure. See “Comparisons” and “Reconciliation of Non-GAAP Information” for more details. | ||||||||||||||||||||||||||||||||
(4) Recast to reflect updated bundle allocation methodology. | ||||||||||||||||||||||||||||||||
| The New York Times Company | |||||||||||
| Reported Basis (52 vs. 53 Week) |
Adjusted Basis (52 vs. 52 Week) |
Impact of additional six days on Q4’22 ($M) | |||||||||
| Digital-only subscription revenues | increase 6 - 9% | increase 13 - 16% | $17.0 | ||||||||
| Total subscription revenues | increase 2 - 5% | increase 8 - 11% | $22.1 | ||||||||
| Digital advertising revenues | decrease low-single-digits to increase mid-single digits | increase low-to-high- single-digits |
$5.4 | ||||||||
| Total advertising revenues | decrease mid-single-digits to increase low-single-digits | decrease low-single-digits to increase mid-single-digits | $6.7 | ||||||||
| Other revenue | decrease low-single-digits to increase low-single-digits | increase low-to-mid- single-digits |
$1.7 | ||||||||
| Adjusted operating costs | flat to increase 2% | - | - | ||||||||
| THE NEW YORK TIMES COMPANY | |||||||||||||||||||||||||||||||||||
| CONDENSED CONSOLIDATED STATEMENTS OF OPERATIONS | |||||||||||||||||||||||||||||||||||
| (Dollars and shares in thousands, except per share data) | |||||||||||||||||||||||||||||||||||
| Third Quarter | Nine Months | ||||||||||||||||||||||||||||||||||
| 2023 | 2022 | % Change | 2023 | 2022 | % Change | ||||||||||||||||||||||||||||||
| Revenues | |||||||||||||||||||||||||||||||||||
Subscription(a) |
$ | 418,577 | $ | 382,672 | 9.4 | % | $ | 1,225,709 | $ | 1,138,270 | 7.7 | % | |||||||||||||||||||||||
Advertising(b) |
117,113 | 110,467 | 6.0 | % | 341,124 | 344,116 | (0.9) | % | |||||||||||||||||||||||||||
Other(c) |
62,655 | 54,541 | 14.9 | % | 183,104 | 158,399 | 15.6 | % | |||||||||||||||||||||||||||
| Total revenues | 598,345 | 547,680 | 9.3 | % | 1,749,937 | 1,640,785 | 6.7 | % | |||||||||||||||||||||||||||
| Operating costs | |||||||||||||||||||||||||||||||||||
| Cost of revenue (excluding depreciation and amortization) | 311,135 | 294,856 | 5.5 | % | 927,910 | 876,804 | 5.8 | % | |||||||||||||||||||||||||||
| Sales and marketing | 62,635 | 64,732 | (3.2) | % | 191,910 | 205,089 | (6.4) | % | |||||||||||||||||||||||||||
| Product development | 57,433 | 50,474 | 13.8 | % | 170,542 | 148,729 | 14.7 | % | |||||||||||||||||||||||||||
| General and administrative | 81,870 | 71,970 | 13.8 | % | 235,194 | 212,468 | 10.7 | % | |||||||||||||||||||||||||||
| Depreciation and amortization | 21,475 | 21,760 | (1.3) | % | 64,173 | 61,150 | 4.9 | % | |||||||||||||||||||||||||||
Acquisition-related costs(d) |
— | — | — | — | 34,712 | * | |||||||||||||||||||||||||||||
Impairment charges(e) |
2,503 | — | * | 15,239 | — | * | |||||||||||||||||||||||||||||
Multiemployer pension plan liability adjustment(f) |
(2,273) | (7,127) | (68.1) | % | (2,273) | (7,127) | (68.1) | % | |||||||||||||||||||||||||||
Total operating costs(1) |
534,778 | 496,665 | 7.7 | % | 1,602,695 | 1,531,825 | 4.6 | % | |||||||||||||||||||||||||||
| Operating profit | 63,567 | 51,015 | 24.6 | % | 147,242 | 108,960 | 35.1 | % | |||||||||||||||||||||||||||
| Other components of net periodic benefit (income)/costs | (684) | 1,757 | * | (2,053) | 4,903 | * | |||||||||||||||||||||||||||||
Interest income and other, net(g) |
5,736 | 1,579 | * | 13,426 | 38,258 | (64.9) | % | ||||||||||||||||||||||||||||
| Income before income taxes | 69,987 | 50,837 | 37.7 | % | 162,721 | 142,315 | 14.3 | % | |||||||||||||||||||||||||||
| Income tax expense | 16,372 | 14,220 | 15.1 | % | 40,211 | 39,196 | 2.6 | % | |||||||||||||||||||||||||||
| Net income | $ | 53,615 | $ | 36,617 | 46.4 | % | $ | 122,510 | $ | 103,119 | 18.8 | % | |||||||||||||||||||||||
| Average number of common shares outstanding: | |||||||||||||||||||||||||||||||||||
| Basic | 164,568 | 166,433 | (1.1) | % | 164,752 | 167,290 | (1.5) | % | |||||||||||||||||||||||||||
| Diluted | 165,406 | 166,497 | (0.7) | % | 165,436 | 167,418 | (1.2) | % | |||||||||||||||||||||||||||
| Basic earnings per share attributable to common stockholders | $ | 0.33 | $ | 0.22 | 50.0 | % | $ | 0.74 | $ | 0.62 | 19.4 | % | |||||||||||||||||||||||
| Diluted earnings per share attributable to common stockholders | $ | 0.32 | $ | 0.22 | 45.5 | % | $ | 0.74 | $ | 0.62 | 19.4 | % | |||||||||||||||||||||||
| Dividends declared per share | $ | 0.11 | $ | 0.09 | 22.2 | % | $ | 0.33 | $ | 0.18 | 83.3 | % | |||||||||||||||||||||||
(1) Third quarter and nine months of 2022 were recast to conform to the current presentation of total operating costs. See “Comparisons” for more details. | |||||||||||||||||||||||||||||||||||
| * Represents a change equal to or in excess of 100% or not meaningful. | |||||||||||||||||||||||||||||||||||
| See footnotes pages for additional information. | |||||||||||||||||||||||||||||||||||
| THE NEW YORK TIMES COMPANY | ||||||||||||||||||||||||||||||||||||||
| FOOTNOTES | ||||||||||||||||||||||||||||||||||||||
| (Amounts in thousands) | ||||||||||||||||||||||||||||||||||||||
| (a) The following table summarizes digital and print subscription revenues for the third quarters and first nine months of 2023 and 2022: | ||||||||||||||||||||||||||||||||||||||
| Third Quarter | Nine Months | |||||||||||||||||||||||||||||||||||||
| 2023 | 2022 | % Change | 2023 | 2022 | % Change | |||||||||||||||||||||||||||||||||
Digital-only subscription revenues(1) |
$ | 282,228 | $ | 243,889 | 15.7 | % | $ | 810,770 | $ | 709,378 | 14.3 | % | ||||||||||||||||||||||||||
Print subscription revenues(2) |
136,349 | 138,783 | (1.8) | % | 414,939 | 428,892 | (3.3) | % | ||||||||||||||||||||||||||||||
| Total subscription revenues | $ | 418,577 | $ | 382,672 | 9.4 | % | $ | 1,225,709 | $ | 1,138,270 | 7.7 | % | ||||||||||||||||||||||||||
(1) Includes revenue from bundled and standalone subscriptions to our news product, as well as to The Athletic and to our Cooking, Games and Wirecutter products. | ||||||||||||||||||||||||||||||||||||||
(2) Includes domestic home-delivery subscriptions, which include access to our digital products. Also includes single-copy, NYT International and Other subscription revenues. | ||||||||||||||||||||||||||||||||||||||
| (b) The following table summarizes digital and print advertising revenues for the third quarters and first nine months of 2023 and 2022: | ||||||||||||||||||||||||||||||||||||||
| Third Quarter | Nine Months | |||||||||||||||||||||||||||||||||||||
| 2023 | 2022 | % Change | 2023 | 2022 | % Change | |||||||||||||||||||||||||||||||||
| Advertising revenues: | ||||||||||||||||||||||||||||||||||||||
| Digital | $ | 75,001 | $ | 70,282 | 6.7 | % | $ | 210,076 | $ | 206,588 | 1.7 | % | ||||||||||||||||||||||||||
| 42,112 | 40,185 | 4.8 | % | 131,048 | 137,528 | (4.7) | % | |||||||||||||||||||||||||||||||
| Total advertising | $ | 117,113 | $ | 110,467 | 6.0 | % | $ | 341,124 | $ | 344,116 | (0.9) | % | ||||||||||||||||||||||||||
| (c) Other revenues primarily consist of revenues from licensing, Wirecutter affiliate referrals, commercial printing, the leasing of floors in the Company headquarters, television and film, our live events business, retail commerce and our student subscription sponsorship program. Digital other revenues, which consist primarily of Wirecutter affiliate referral revenue, digital licensing revenues and our student subscription sponsorship program, totaled $37.2 million and $101.3 million for the third quarter and first nine months of 2023, respectively. | ||||||||||||||||||||||||||||||||||||||
| (d) In the first quarter of 2022, the Company recorded acquisition-related costs, which primarily included expenses paid in connection with the acceleration of The Athletic stock options, and legal, accounting, financial advisory and integration planning expenses. | ||||||||||||||||||||||||||||||||||||||
| (e) In the second quarter of 2023, the Company recorded a $12.7 million impairment charge ($9.3 million or $0.06 per share after tax) related to excess leased office space that is being marketed for sublet (the “lease-related impairment”). In the third quarter of 2023, the Company recorded a $2.5 million impairment charge ($1.8 million or $0.01 per share after tax) related to an indefinite-lived intangible asset. | ||||||||||||||||||||||||||||||||||||||
| (f) In the third quarters of 2023 and 2022, the Company recorded favorable adjustments related to a reduction in its multiemployer pension plan liability of $2.3 million and $7.1 million, respectively. | ||||||||||||||||||||||||||||||||||||||
| (h) In the second quarter of 2022, the Company recorded a $34.2 million gain ($24.9 million or $0.15 per share after tax) related to an agreement to lease and subsequently sell approximately four acres of land at our printing and distribution facility in College Point, N.Y. | ||||||||||||||||||||||||||||||||||||||
| THE NEW YORK TIMES COMPANY | ||||||||||||||||||||||||||||||||
| SUPPLEMENTAL SUBSCRIBER, ARPU AND SUBSCRIPTION REVENUES INFORMATION | ||||||||||||||||||||||||||||||||
| (Amounts in thousands, except for ARPU) | ||||||||||||||||||||||||||||||||
The following table sets forth subscribers as of the end of the five most recent fiscal quarters: | ||||||||||||||||||||||||||||||||
| Q3 2023 | Q2 2023 | Q1 2023 | Q4 2022 | Q3 2022 | ||||||||||||||||||||||||||||
| Digital-only subscribers: | ||||||||||||||||||||||||||||||||
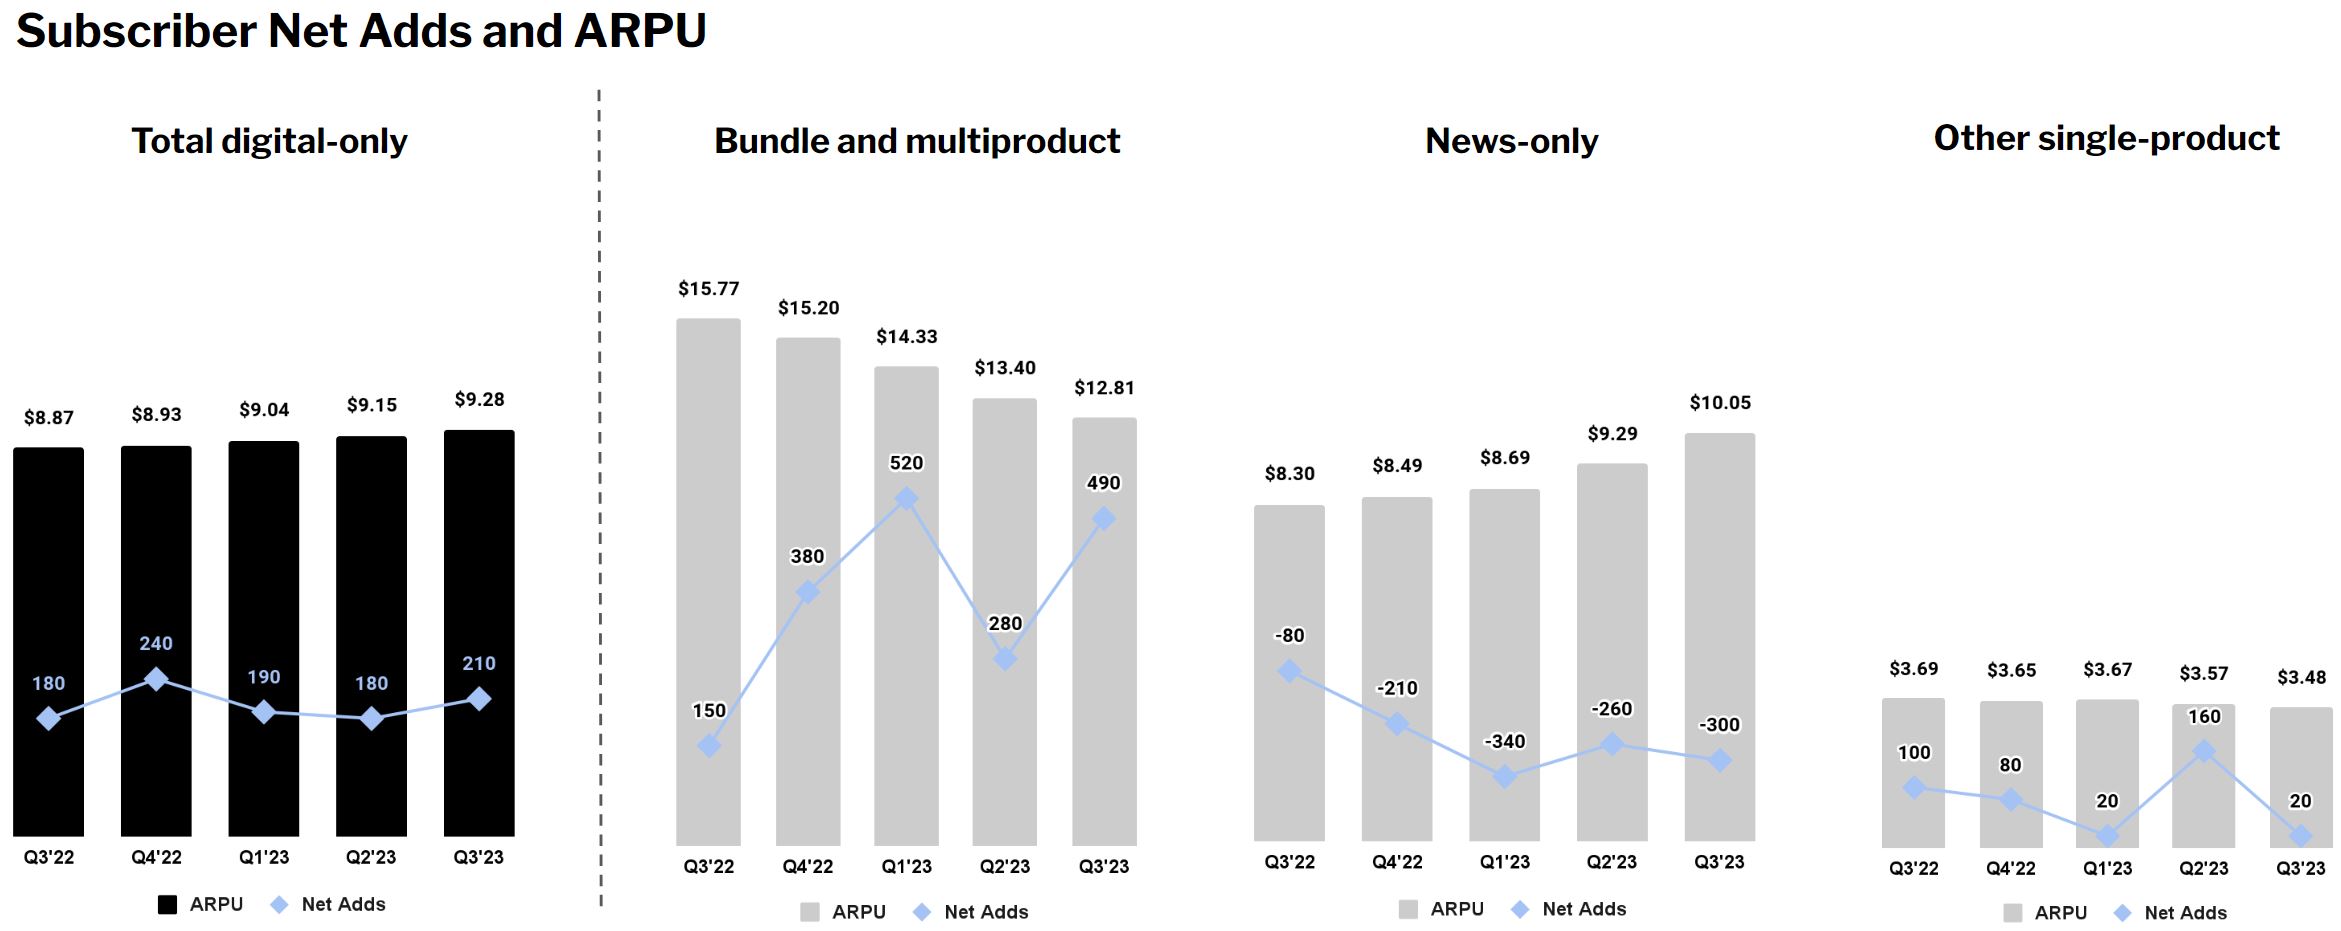
Bundle and multiproduct(1)(2) |
3,790 | 3,300 | 3,020 | 2,500 | 2,130 | |||||||||||||||||||||||||||
News-only(2)(3) |
3,020 | 3,320 | 3,580 | 3,920 | 4,130 | |||||||||||||||||||||||||||
Other single-product(2)(4) |
2,600 | 2,580 | 2,420 | 2,410 | 2,330 | |||||||||||||||||||||||||||
Total digital-only subscribers(2)(5) |
9,410 | 9,190 | 9,020 | 8,830 | 8,590 | |||||||||||||||||||||||||||
Print subscribers(6) |
670 | 690 | 710 | 730 | 740 | |||||||||||||||||||||||||||
| Total subscribers | 10,080 | 9,880 | 9,730 | 9,550 | 9,330 | |||||||||||||||||||||||||||
(1) Subscribers with a bundle subscription or standalone digital-only subscriptions to two or more of the Company’s products. | ||||||||||||||||||||||||||||||||
(2) Includes group corporate and group education subscriptions, which collectively represented approximately 5% of total digital-only subscribers as of the end of the third quarter of 2023. The number of group subscribers is derived using the value of the relevant contract and a discounted subscription rate. | ||||||||||||||||||||||||||||||||
(3) Subscribers with only a digital-only news product subscription. | ||||||||||||||||||||||||||||||||
(4) Subscribers with only one digital-only subscription to The Athletic or to our Cooking, Games or Wirecutter products. | ||||||||||||||||||||||||||||||||
(5) Subscribers with digital-only subscriptions to one or more of our news product, The Athletic, or our Cooking, Games and Wirecutter products. | ||||||||||||||||||||||||||||||||
(6) Subscribers with a domestic home-delivery or mail print subscription to The New York Times, which includes access to our digital products, or a print subscription to our Book Review or Large Type Weekly products. | ||||||||||||||||||||||||||||||||
The sum of individual metrics may not always equal total amounts indicated due to rounding. Subscribers (including net subscriber additions) are rounded to the nearest ten thousand. | ||||||||||||||||||||||||||||||||
The following table sets forth ARPU metrics relating to the above digital-only subscriber categories for the five most recent fiscal quarters: | ||||||||||||||||||||||||||||||||
| Q3 2023 | Q2 2023 | Q1 2023 | Q4 2022 | Q3 2022 | ||||||||||||||||||||||||||||
| Digital-only ARPU: | ||||||||||||||||||||||||||||||||
| Bundle and multiproduct | $ | 12.81 | $ | 13.40 | $ | 14.33 | $ | 15.20 | $ | 15.77 | ||||||||||||||||||||||
| News-only | $ | 10.05 | $ | 9.29 | $ | 8.69 | $ | 8.49 | $ | 8.30 | ||||||||||||||||||||||
Other single-product |
$ | 3.48 | $ | 3.57 | $ | 3.67 | $ | 3.65 | $ | 3.69 | ||||||||||||||||||||||
| Total digital-only ARPU | $ | 9.28 | $ | 9.15 | $ | 9.04 | $ | 8.93 | $ | 8.87 | ||||||||||||||||||||||
ARPU metrics are calculated by dividing the digital subscription revenues in the quarter by the average number of digital-only subscribers divided by the number of days in the quarter multiplied by 28 to reflect a 28-day billing cycle. In calculating ARPU metrics, for our subscriber categories (Bundle and multiproduct, News-only and Other single-product), we use the monthly average number of digital-only subscribers (calculated as the sum of the number of subscribers in each category at the beginning and end of the month, divided by two) and for Total digital-only ARPU, we use the daily average number of digital-only subscribers. | ||||||||||||||||||||||||||||||||
| THE NEW YORK TIMES COMPANY | ||||||||||||||||||||||||||||||||
| SUPPLEMENTAL SUBSCRIBER, ARPU AND SUBSCRIPTION REVENUES INFORMATION | ||||||||||||||||||||||||||||||||
| (Amounts in thousands, except for ARPU) | ||||||||||||||||||||||||||||||||
The following table sets forth the subset of subscribers above who have a digital-only standalone subscription to The Athletic or a bundle subscription that includes the ability to access The Athletic as of the end of the five most recent fiscal quarters: | ||||||||||||||||||||||||||||||||
| Q3 2023 | Q2 2023 | Q1 2023 | Q4 2022 | Q3 2022 | ||||||||||||||||||||||||||||
Digital-only subscribers with The Athletic(1)(2) |
4,180 | 3,640 | 3,270 | 2,680 | 2,290 | |||||||||||||||||||||||||||
(1) In June 2022, we provided all bundle subscribers with the ability to access The Athletic and all bundle subscribers are included in this metric. | ||||||||||||||||||||||||||||||||
(2) Subscribers (including net subscriber additions) are rounded to the nearest ten thousand. | ||||||||||||||||||||||||||||||||
| THE NEW YORK TIMES COMPANY | ||||||||||||||||||||||||||||||||||||||
| SEGMENT INFORMATION | ||||||||||||||||||||||||||||||||||||||
| (Amounts in thousands) | ||||||||||||||||||||||||||||||||||||||
|
Since the acquisition of The Athletic in the first quarter of 2022, we have had two reportable segments: NYTG and The Athletic. Management uses adjusted operating profit (loss) by segment in assessing performance and allocating resources. The Company includes in its presentation revenues and adjusted operating costs to arrive at adjusted operating profit (loss) by segment. Adjusted operating costs are defined as operating costs before depreciation and amortization, severance, multiemployer pension plan withdrawal costs and special items. Adjusted operating profit is defined as operating profit before depreciation and amortization, severance, multiemployer pension plan withdrawal costs and special items. Adjusted operating profit expressed as a percentage of revenues is referred to as adjusted operating profit margin.
Subscription revenues from and expenses associated with our bundle are allocated to NYTG and The Athletic. The Athletic was first introduced into our bundle in June 2022. Therefore, The Athletic’s results for the second quarter of 2022 include bundle revenues and expenses for only part of the quarter, whereas the second quarter of 2023 included bundle revenues and expenses for the entire quarter.
Prior to April 1, 2023, we allocated bundle revenues first to our digital news product based on its standalone list price and then the remaining bundle revenues were allocated to the other products in the bundle, including The Athletic, based on their relative standalone list prices. Starting April 1, 2023, we allocate 10% of bundle revenues to The Athletic based on management’s view of The Athletic’s relative value to the bundle, which is derived based on analysis of various metrics.
Prior to April 1, 2023, we allocated to NYTG and The Athletic direct variable expenses associated with the bundle, which include credit card fees, third party fees and sales taxes, based on a historical actual percentage of these costs to bundle revenues. Starting April 1, 2023, we allocate 10% of product development, marketing and subscriber servicing expenses (including the direct variable expenses referenced above) associated with the bundle to The Athletic, and the remaining costs are allocated to NYTG, in each case, in line with the revenues allocations.
For comparison purposes, the Company previously recast segment results for the quarters following the second quarter of 2022 to reflect the updated allocation methodology. The second quarter of 2022 was not recast as the change was de minimis for that quarter in light of the timing of the introduction of The Athletic to the bundle.
The results of The Athletic have been included in our Condensed Consolidated Financial Statements beginning February 1, 2022, the date of the acquisition. Results for the first nine months 2022 included The Athletic for approximately eight months while results for the first nine months 2023 included the Athletic for the full nine months.
| ||||||||||||||||||||||||||||||||||||||
| Third Quarter | Nine Months | |||||||||||||||||||||||||||||||||||||
| 2023 | 2022 (1)(2) |
% Change | 2023 | 2022 (1)(2) |
% Change | |||||||||||||||||||||||||||||||||
| Revenues | ||||||||||||||||||||||||||||||||||||||
| NYTG | $ | 563,903 | $ | 524,061 | 7.6 | % | $ | 1,657,179 | $ | 1,585,463 | 4.5 | % | ||||||||||||||||||||||||||
| The Athletic | 34,442 | 23,619 | 45.8 | % | 92,758 | 55,322 | 67.7 | % | ||||||||||||||||||||||||||||||
| Total revenues | $ | 598,345 | $ | 547,680 | 9.3 | % | $ | 1,749,937 | $ | 1,640,785 | 6.7 | % | ||||||||||||||||||||||||||
| Adjusted operating costs | ||||||||||||||||||||||||||||||||||||||
| NYTG | $ | 466,249 | $ | 443,031 | 5.2 | % | $ | 1,394,268 | $ | 1,347,891 | 3.4 | % | ||||||||||||||||||||||||||
| The Athletic | 42,341 | 35,672 | 18.7 | % | 119,774 | 86,795 | 38.0 | % | ||||||||||||||||||||||||||||||
| Total adjusted operating costs | $ | 508,590 | $ | 478,703 | 6.2 | % | $ | 1,514,042 | $ | 1,434,686 | 5.5 | % | ||||||||||||||||||||||||||
| Adjusted operating profit (loss) | ||||||||||||||||||||||||||||||||||||||
| NYTG | $ | 97,654 | $ | 81,030 | 20.5 | % | $ | 262,911 | $ | 237,572 | 10.7 | % | ||||||||||||||||||||||||||
| The Athletic | (7,899) | (12,053) | (34.5) | % | (27,016) | (31,473) | (14.2) | % | ||||||||||||||||||||||||||||||
| Total adjusted operating profit | $ | 89,755 | $ | 68,977 | 30.1 | % | $ | 235,895 | $ | 206,099 | 14.5 | % | ||||||||||||||||||||||||||
| AOP margin % - NYTG | 17.3 | % | 15.5 | % | 180 bps | 15.9 | % | 15.0 | % | 90 bps | ||||||||||||||||||||||||||||
(1) Recast to reflect updated bundle allocation methodology. | ||||||||||||||||||||||||||||||||||||||
(2) Recast to conform to the current presentation of total operating costs. See “Comparisons” for more details. | ||||||||||||||||||||||||||||||||||||||
| * Represents a change equal to or in excess of 100% or not meaningful. | ||||||||||||||||||||||||||||||||||||||
| THE NEW YORK TIMES COMPANY | ||||||||||||||||||||||||||||||||||||||
| SEGMENT INFORMATION | ||||||||||||||||||||||||||||||||||||||
| (Amounts in thousands) | ||||||||||||||||||||||||||||||||||||||
| Revenues detail by segment | Third Quarter | Nine Months | ||||||||||||||||||||||||||||||||||||
| 2023 | 2022 (1) |
% Change | 2023 | 2022 (1) |
% Change | |||||||||||||||||||||||||||||||||
| NYTG | ||||||||||||||||||||||||||||||||||||||
| Subscription | $ | 392,937 | $ | 361,488 | 8.7 | % | $ | 1,152,130 | $ | 1,089,710 | 5.7 | % | ||||||||||||||||||||||||||
| Advertising | 108,672 | 108,134 | 0.5 | % | 323,091 | 337,456 | (4.3) | % | ||||||||||||||||||||||||||||||
| Other | 62,294 | 54,439 | 14.4 | % | 181,958 | 158,297 | 14.9 | % | ||||||||||||||||||||||||||||||
| Total | $ | 563,903 | $ | 524,061 | 7.6 | % | $ | 1,657,179 | $ | 1,585,463 | 4.5 | % | ||||||||||||||||||||||||||
| The Athletic | ||||||||||||||||||||||||||||||||||||||
| Subscription | $ | 25,640 | $ | 21,184 | 21.0 | % | $ | 73,579 | $ | 48,560 | 51.5 | % | ||||||||||||||||||||||||||
| Advertising | 8,441 | 2,333 | * | 18,033 | 6,660 | * | ||||||||||||||||||||||||||||||||
| Other | 361 | 102 | * | 1,146 | 102 | * | ||||||||||||||||||||||||||||||||
| Total | $ | 34,442 | $ | 23,619 | 45.8 | % | $ | 92,758 | $ | 55,322 | 67.7 | % | ||||||||||||||||||||||||||
| The New York Times Company | ||||||||||||||||||||||||||||||||||||||
| Subscription | $ | 418,577 | $ | 382,672 | 9.4 | % | $ | 1,225,709 | $ | 1,138,270 | 7.7 | % | ||||||||||||||||||||||||||
| Advertising | 117,113 | 110,467 | 6.0 | % | 341,124 | 344,116 | (0.9) | % | ||||||||||||||||||||||||||||||
| Other | 62,655 | 54,541 | 14.9 | % | 183,104 | 158,399 | 15.6 | % | ||||||||||||||||||||||||||||||
| Total | $ | 598,345 | $ | 547,680 | 9.3 | % | $ | 1,749,937 | $ | 1,640,785 | 6.7 | % | ||||||||||||||||||||||||||
(1) Recast to reflect updated bundle allocation methodology. | ||||||||||||||||||||||||||||||||||||||
| * Represents a change equal to or in excess of 100% or not meaningful. | ||||||||||||||||||||||||||||||||||||||
| THE NEW YORK TIMES COMPANY | ||||||||||||||||||||||||||||||||||||||
| SEGMENT INFORMATION | ||||||||||||||||||||||||||||||||||||||
| (Amounts in thousands) | ||||||||||||||||||||||||||||||||||||||
| Adjusted operating costs (operating costs before depreciation and amortization, severance, multiemployer pension plan withdrawal costs and special items) detail by segment | ||||||||||||||||||||||||||||||||||||||
| Third Quarter | Nine Months | |||||||||||||||||||||||||||||||||||||
| 2023 | 2022 (1) |
% Change | 2023 | 2022 (1) |
% Change | |||||||||||||||||||||||||||||||||
| NYTG | ||||||||||||||||||||||||||||||||||||||
| Cost of revenue (excluding depreciation and amortization) | $ | 288,228 | $ | 274,506 | 5.0 | % | $ | 860,340 | $ | 823,966 | 4.4 | % | ||||||||||||||||||||||||||
| Sales and marketing | 51,956 | 56,503 | (8.0) | % | 165,135 | 189,146 | (12.7) | % | ||||||||||||||||||||||||||||||
| Product development | 50,930 | 45,546 | 11.8 | % | 151,810 | 137,498 | 10.4 | % | ||||||||||||||||||||||||||||||
Adjusted general and administrative(2) |
75,135 | 66,476 | 13.0 | % | 216,983 | 197,281 | 10.0 | % | ||||||||||||||||||||||||||||||
| Total | $ | 466,249 | $ | 443,031 | 5.2 | % | $ | 1,394,268 | $ | 1,347,891 | 3.4 | % | ||||||||||||||||||||||||||
| The Athletic | ||||||||||||||||||||||||||||||||||||||
| Cost of revenue (excluding depreciation and amortization) | $ | 22,907 | $ | 20,350 | 12.6 | % | $ | 67,570 | $ | 52,838 | 27.9 | % | ||||||||||||||||||||||||||
| Sales and marketing | 10,679 | 8,229 | 29.8 | % | 26,775 | 15,943 | 67.9 | % | ||||||||||||||||||||||||||||||
| Product development | 6,503 | 4,928 | 32.0 | % | 18,732 | 11,231 | 66.8 | % | ||||||||||||||||||||||||||||||
Adjusted general and administrative(3) |
2,252 | 2,165 | 4.0 | % | 6,697 | 6,783 | (1.3) | % | ||||||||||||||||||||||||||||||
| Total | $ | 42,341 | $ | 35,672 | 18.7 | % | $ | 119,774 | $ | 86,795 | 38.0 | % | ||||||||||||||||||||||||||
| The New York Times Company | ||||||||||||||||||||||||||||||||||||||
| Cost of revenue (excluding depreciation and amortization) | $ | 311,135 | $ | 294,856 | 5.5 | % | $ | 927,910 | $ | 876,804 | 5.8 | % | ||||||||||||||||||||||||||
| Sales and marketing | 62,635 | 64,732 | (3.2) | % | 191,910 | 205,089 | (6.4) | % | ||||||||||||||||||||||||||||||
| Product development | 57,433 | 50,474 | 13.8 | % | 170,542 | 148,729 | 14.7 | % | ||||||||||||||||||||||||||||||
| Adjusted general and administrative | 77,387 | 68,641 | 12.7 | % | 223,680 | 204,064 | 9.6 | % | ||||||||||||||||||||||||||||||
| Total | $ | 508,590 | $ | 478,703 | 6.2 | % | $ | 1,514,042 | $ | 1,434,686 | 5.5 | % | ||||||||||||||||||||||||||
(1) Recast to reflect updated bundle allocation methodology. | ||||||||||||||||||||||||||||||||||||||
(2) Excludes severance of $3.1 million and $6.4 million for the third quarter and first nine months of 2023, respectively. Excludes multiemployer pension withdrawal costs of $1.4 million and $3.9 million for the third quarter and first nine months of 2023, respectively. Excludes severance of $2.0 million and $4.5 million for the third quarter and first nine months of 2022, respectively, and multiemployer pension withdrawal costs of $1.3 million and $3.7 million for the third quarter and first nine months of 2022, respectively. | ||||||||||||||||||||||||||||||||||||||
(3) Excludes severance of $1.2 million for the first nine months of 2023. Excludes severance of $0.2 million for the first nine months of 2022. | ||||||||||||||||||||||||||||||||||||||
| * Represents a change equal to or in excess of 100% or not meaningful. | ||||||||||||||||||||||||||||||||||||||
| THE NEW YORK TIMES COMPANY | ||||||||||||||||||||||||||||||||||||||
| RECONCILIATION OF NON-GAAP INFORMATION | ||||||||||||||||||||||||||||||||||||||
In this release, the Company has referred to non-GAAP financial information with respect to diluted EPS excluding amortization of acquired intangible assets, severance, non-operating retirement costs and special items (or adjusted diluted EPS); operating profit before depreciation, amortization, severance, multiemployer pension plan withdrawal costs and special items (or adjusted operating profit, and as divided by revenues, adjusted operating profit margin); operating costs before depreciation, amortization, severance, multiemployer pension withdrawal costs and special items (or adjusted operating costs); and net cash provided by operating activities less capital expenditures (or free cash flow). The Company has included these non-GAAP financial measures because management reviews them on a regular basis and uses them to evaluate and manage the performance of the Company’s operations. Management believes that, for the reasons outlined below, these non-GAAP financial measures provide useful information to investors as a supplement to reported diluted earnings/(loss) per share, operating profit/(loss) and operating costs. However, these measures should be evaluated only in conjunction with the comparable GAAP financial measures and should not be viewed as alternative or superior measures of GAAP results. | ||||||||||||||||||||||||||||||||||||||
| Adjusted diluted EPS provides useful information in evaluating the Company’s period-to-period performance because it eliminates items that the Company does not consider to be indicative of earnings from ongoing operating activities. Adjusted operating profit and adjusted operating profit margin are useful in evaluating the ongoing performance of the Company’s business as they exclude the significant non-cash impact of depreciation and amortization as well as items not indicative of ongoing operating activities. Total operating costs include depreciation, amortization, severance, multiemployer pension plan withdrawal costs and special items. Adjusted operating costs provide investors with helpful supplemental information on the Company’s underlying operating costs that is used by management in its financial and operational decision-making. | ||||||||||||||||||||||||||||||||||||||
| Management considers special items, which may include impairment charges, pension settlement charges, acquisition-related costs and other items that arise from time to time, to be outside the ordinary course of our operations. Management believes that excluding these items provides a better understanding of the underlying trends in the Company’s operating performance and allows more accurate comparisons of the Company’s operating results to historical performance. In addition, management excludes severance costs, which may fluctuate significantly from quarter to quarter, because it believes these costs do not necessarily reflect expected future operating costs and do not contribute to a meaningful comparison of the Company’s operating results to historical performance. | ||||||||||||||||||||||||||||||||||||||
| The Company considers free cash flow as providing useful information to management and investors about the amount of cash that is available to be used to strengthen the Company’s balance sheet, for strategic opportunities, including investing in the Company’s business and strategic acquisitions, and/or for the return of capital to stockholders in the form of dividends and stock repurchases. | ||||||||||||||||||||||||||||||||||||||
| Non-operating retirement costs include (i) interest cost, expected return on plan assets, amortization of actuarial gains and loss components and amortization of prior service credits of single-employer pension expense, (ii) interest cost, amortization of actuarial gains and loss components and amortization of prior service credits of retirement medical expense and (iii) all multiemployer pension plan withdrawal costs. These non-operating retirement costs are primarily tied to financial market performance including changes in market interest rates and investment performance. Management considers non-operating retirement costs to be outside the performance of the business and believes that presenting adjusted diluted EPS excluding non-operating retirement costs and presenting adjusted operating results excluding multiemployer pension plan withdrawal costs, in addition to the Company’s GAAP diluted EPS and GAAP operating results, provide increased transparency and a better understanding of the underlying trends in the Company’s operating business performance. | ||||||||||||||||||||||||||||||||||||||
| Reconciliations of these non-GAAP financial measures to the most directly comparable GAAP measures are set out in the tables below. | ||||||||||||||||||||||||||||||||||||||
| THE NEW YORK TIMES COMPANY | ||||||||||||||||||||||||||||||||||||||
| RECONCILIATION OF NON-GAAP INFORMATION | ||||||||||||||||||||||||||||||||||||||
| (Dollars in thousands, except per share data) | ||||||||||||||||||||||||||||||||||||||
| Reconciliation of diluted EPS excluding amortization of acquired intangible assets, severance, non-operating retirement costs and special items (or adjusted diluted EPS) | ||||||||||||||||||||||||||||||||||||||
| Third Quarter | Nine Months | |||||||||||||||||||||||||||||||||||||
| 2023 | 2022 | % Change | 2023 | 2022 | % Change | |||||||||||||||||||||||||||||||||
| Diluted EPS | $ | 0.32 | $ | 0.22 | 45.5 | % | $ | 0.74 | $ | 0.62 | 19.4 | % | ||||||||||||||||||||||||||
| Add: | ||||||||||||||||||||||||||||||||||||||
| Amortization of acquired intangible assets | 0.04 | 0.04 | — | 0.13 | 0.12 | 8.3 | % | |||||||||||||||||||||||||||||||
| Severance | 0.02 | 0.01 | * | 0.05 | 0.03 | 66.7 | % | |||||||||||||||||||||||||||||||
| Non-operating retirement costs: | ||||||||||||||||||||||||||||||||||||||
| Multiemployer pension plan withdrawal costs | 0.01 | 0.01 | — | 0.02 | 0.02 | — | ||||||||||||||||||||||||||||||||
| Other components of net periodic benefit costs/(income) | — | 0.01 | * | (0.01) | 0.03 | * | ||||||||||||||||||||||||||||||||
| Special items: | ||||||||||||||||||||||||||||||||||||||
| Acquisition-related costs | — | — | — | — | 0.21 | * | ||||||||||||||||||||||||||||||||
| Impairment charges | 0.02 | — | * | 0.10 | — | * | ||||||||||||||||||||||||||||||||
| Gain on the sale of land | — | — | — | — | (0.20) | * | ||||||||||||||||||||||||||||||||
| Multiemployer pension plan liability adjustment | (0.01) | (0.04) | (75.0) | % | (0.01) | (0.04) | (75.0) | % | ||||||||||||||||||||||||||||||
| Income tax expense of adjustments | (0.02) | (0.01) | * | (0.07) | (0.04) | 75.0 | % | |||||||||||||||||||||||||||||||
Adjusted diluted EPS(1) |
$ | 0.37 | $ | 0.24 | 54.2 | % | $ | 0.94 | $ | 0.73 | 28.8 | % | ||||||||||||||||||||||||||
(1) Amounts may not add due to rounding. | ||||||||||||||||||||||||||||||||||||||
| * Represents a change equal to or in excess of 100% or not meaningful. | ||||||||||||||||||||||||||||||||||||||
| THE NEW YORK TIMES COMPANY | ||||||||||||||||||||||||||||||||||||||
| RECONCILIATION OF NON-GAAP INFORMATION | ||||||||||||||||||||||||||||||||||||||
| (Dollars in thousands, except per share data) | ||||||||||||||||||||||||||||||||||||||
| Reconciliation of operating profit before depreciation and amortization, severance, multiemployer pension plan withdrawal costs and special items (or adjusted operating profit) | ||||||||||||||||||||||||||||||||||||||
| Third Quarter | Nine Months | |||||||||||||||||||||||||||||||||||||
| 2023 | 2022 (1) |
% Change | 2023 | 2022 (1) |
% Change | |||||||||||||||||||||||||||||||||
| Operating profit | $ | 63,567 | $ | 51,015 | 24.6 | % | $ | 147,242 | $ | 108,960 | 35.1 | % | ||||||||||||||||||||||||||
| Add: | ||||||||||||||||||||||||||||||||||||||
| Depreciation and amortization | 21,475 | 21,760 | (1.3) | % | 64,173 | 61,150 | 4.9 | % | ||||||||||||||||||||||||||||||
| Severance | 3,086 | 2,010 | 53.5 | % | 7,578 | 4,670 | 62.3 | % | ||||||||||||||||||||||||||||||
| Multiemployer pension plan withdrawal costs | 1,397 | 1,319 | 5.9 | % | 3,936 | 3,734 | 5.4 | % | ||||||||||||||||||||||||||||||
| Acquisition-related costs | — | — | — | — | 34,712 | * | ||||||||||||||||||||||||||||||||
| Impairment charges | 2,503 | — | * | 15,239 | — | * | ||||||||||||||||||||||||||||||||
| Multiemployer pension plan liability adjustment | (2,273) | (7,127) | (68.1) | % | (2,273) | (7,127) | (68.1) | % | ||||||||||||||||||||||||||||||
| Adjusted operating profit | $ | 89,755 | $ | 68,977 | 30.1 | % | $ | 235,895 | $ | 206,099 | 14.5 | % | ||||||||||||||||||||||||||
| Divided by: | ||||||||||||||||||||||||||||||||||||||
| Revenues | $ | 598,345 | $ | 547,680 | 9.3 | % | $ | 1,749,937 | $ | 1,640,785 | 6.7 | % | ||||||||||||||||||||||||||
| Operating profit margin | 10.6 | % | 9.3% | 130 bps | 8.4% | 6.6% | 180 bps | |||||||||||||||||||||||||||||||
| Adjusted operating profit margin | 15.0 | % | 12.6% | 240 bps | 13.5% | 12.6% | 90 bps | |||||||||||||||||||||||||||||||
(1) Recast to reflect updated bundle allocation methodology. | ||||||||||||||||||||||||||||||||||||||
| * Represents a change equal to or in excess of 100% or not meaningful. | ||||||||||||||||||||||||||||||||||||||
| THE NEW YORK TIMES COMPANY | ||||||||||||||||||||||||||||||||||||||
| RECONCILIATION OF NON-GAAP INFORMATION | ||||||||||||||||||||||||||||||||||||||
| (Dollars in thousands, except per share data) | ||||||||||||||||||||||||||||||||||||||
| Reconciliation of total operating costs before depreciation and amortization, severance, multiemployer pension plan withdrawal costs and special items (or adjusted operating costs) | ||||||||||||||||||||||||||||||||||||||
| Third Quarter | Nine Months | |||||||||||||||||||||||||||||||||||||
| 2023 | 2022 (1)(2) |
% Change | 2023 | 2022 (1)(2) |
% Change | |||||||||||||||||||||||||||||||||
| Total operating costs | $ | 534,778 | $ | 496,665 | 7.7 | % | $ | 1,602,695 | $ | 1,531,825 | 4.6 | % | ||||||||||||||||||||||||||
| Less: | ||||||||||||||||||||||||||||||||||||||
| Depreciation and amortization | 21,475 | 21,760 | (1.3) | % | 64,173 | 61,150 | 4.9 | % | ||||||||||||||||||||||||||||||
| Severance | 3,086 | 2,010 | 53.5 | % | 7,578 | 4,670 | 62.3 | % | ||||||||||||||||||||||||||||||
| Multiemployer pension plan withdrawal costs | 1,397 | 1,319 | 5.9 | % | 3,936 | 3,734 | 5.4 | % | ||||||||||||||||||||||||||||||
| Acquisition-related costs | — | — | — | — | 34,712 | * | ||||||||||||||||||||||||||||||||
| Impairment charges | 2,503 | — | * | 15,239 | — | * | ||||||||||||||||||||||||||||||||
| Multiemployer pension plan liability adjustment | (2,273) | (7,127) | (68.1) | % | (2,273) | (7,127) | (68.1) | % | ||||||||||||||||||||||||||||||
| Adjusted operating costs | $ | 508,590 | $ | 478,703 | 6.2 | % | $ | 1,514,042 | $ | 1,434,686 | 5.5 | % | ||||||||||||||||||||||||||
| Adjusted operating costs by segment | ||||||||||||||||||||||||||||||||||||||
| NYTG | $ | 466,249 | $ | 443,031 | 5.2 | % | $ | 1,394,268 | $ | 1,347,891 | 3.4 | % | ||||||||||||||||||||||||||
| The Athletic | 42,341 | 35,672 | 18.7 | % | 119,774 | 86,795 | 38.0 | % | ||||||||||||||||||||||||||||||
| Total adjusted operating costs | $ | 508,590 | $ | 478,703 | 6.2 | % | $ | 1,514,042 | $ | 1,434,686 | 5.5 | % | ||||||||||||||||||||||||||
(1) Recast to reflect updated bundle allocation methodology. | ||||||||||||||||||||||||||||||||||||||
(2) Recast to conform to the current presentation of total operating costs. See “Comparisons” for more details. | ||||||||||||||||||||||||||||||||||||||
| * Represents a change equal to or in excess of 100% or not meaningful. | ||||||||||||||||||||||||||||||||||||||
| Reconciliation of net cash provided by/(used in) operating activities before capital expenditures (or free cash flow) | ||||||||||||||
| Nine Months | ||||||||||||||
| 2023 | 2022 | |||||||||||||
| Net cash provided by operating activities | $ | 224,100 | $ | 85,024 | ||||||||||
| Less: Capital expenditures | (16,539) | (27,809) | ||||||||||||
| Free cash flow | $ | 207,561 | $ | 57,215 | ||||||||||