Document
|
|
|
|
|
|
|
55 Water Street
New York, NY 10041
www.spglobal.com
Press Release
For Immediate Release
|
S&P Global Reports Fourth Quarter and Full-Year 2025 Results
New York, NY, February 10, 2026 – S&P Global (NYSE: SPGI) today reported fourth quarter and full-year 2025 results. This earnings release and supplemental materials are available at http://investor.spglobal.com/Quarterly-Earnings.
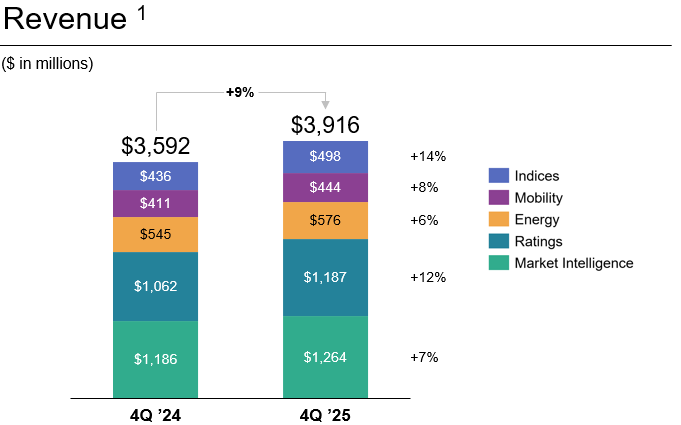
The Company reported fourth quarter 2025 reported revenue of $3.916 billion, an increase of 9% compared to the fourth quarter of 2024. Fourth quarter GAAP net income increased 29% to $1,134 million and GAAP diluted earnings per share increased 32% to $3.75 driven primarily by strong revenue and operating profit growth in Ratings and Indices. Adjusted net income for the fourth quarter increased 12% to $1.299 billion and adjusted diluted earnings per share increased 14% to $4.30.
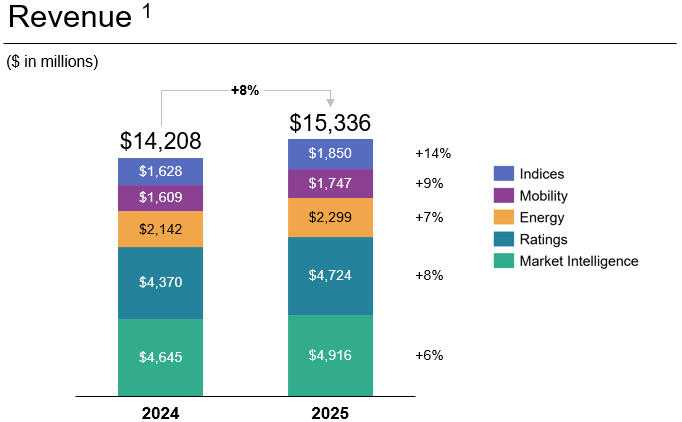
For the full-year 2025, reported revenue increased 8% year over year to $15.336 billion. 2025 GAAP net income increased 16% to $4.471 billion and GAAP diluted earnings per share increased 19% to $14.66, driven primarily by revenue and operating profit growth in the Company's Ratings, Indices, and Market Intelligence divisions. 2025 adjusted net income increased 11% to $5.441 billion compared to 2024 adjusted net income, and adjusted diluted earnings per share increased 14% to $17.83 compared to 2024 adjusted diluted earnings per share.
|
|
|
|
|
|
|
•S&P Global delivered revenue growth of 8% y/y in 2025. GAAP operating margin improved by approximately 3 percentage points y/y, and adjusted operating margin increased 140 basis points.
•GAAP diluted EPS of $14.66 increased 19% y/y, while adjusted diluted EPS of $17.83 increased 14% y/y.
•The Company returned $6.2 billion to shareholders in 2025, including $1.2 billion in dividends and $5.0 billion in share repurchases. This represents 113% of adjusted free cash flow for the year.
•2026 adjusted guidance calls for organic constant currency revenue growth of 6.0% to 8.0%, and diluted EPS in the range of $19.40 to $19.65, GAAP guidance to be provided upon completion of the Mobility spin (expected mid-2026).
|
“We delivered a strong quarter driven by performance in all divisions, momentum in private markets, and expansion with our CCO clients.
I'm very proud of what we accomplished in 2025. We outlined our new mission of Advancing Essential Intelligence, and our medium-term strategy designed to drive durable, profitable growth. Our unified leadership team and the talent of our people enabled us to execute very well. The scale of innovation and pace of AI integration in our products and internal processes was a leap forward for our clients and the business.
Our strategy, coupled with the resilience of our business model, and favorable secular and cyclical tailwinds, position us well to deliver the vision and financial targets we established at our Investor Day in November."
Martina Cheung
President and CEO
|
|
|
|
Fourth Quarter 2025 Revenue |
|
|
|
|
|
|
|
|
|
|
|
Fourth quarter revenue increased 9%, driven by strong growth in all divisions. Revenue from subscription products increased 8%.
(1) Total revenue for the fourth quarter 2024 and the fourth quarter 2025 includes the impact of inter-segment eliminations of $48M and $53M, respectively.
|
Market Intelligence revenue increased 7%, driven by strong organic subscription revenue growth and the acquisition of With Intelligence in November 2025, partly offset by slower growth in volume-driven products and year-over-year declines in non-subscription revenue. Ratings revenue increased 12%, driven by double-digit transaction and non-transaction revenue growth. Transaction revenue growth was driven by a 28% increase in Billed Issuance. Energy revenue increased 6% primarily due to strong subscription and usage-based revenue growth, partly offset by declines in consulting and conference revenue, as well as a negative impact related to government sanctions on select customers. Mobility revenue increased by 8% driven by double-digit growth in Dealer revenue and Financial & Other revenue, partially offset by slower growth in Manufacturing. Indices revenue increased 14%, largely driven by growth in asset-linked fees, which benefited from higher AUM and inflows, as well as strength in Exchange-Traded Derivatives and Data & Custom Subscriptions revenue growth.
|
|
|
Fourth Quarter 2025 Operating Profit, Expense, and Operating Margin |

Note: All presentations of revenue above refer to reported revenue. Adjusted financials refer to non-GAAP adjusted metrics in all periods.
The Company’s fourth quarter reported operating profit margin increased approximately 6 percentage points to 42.7%, primarily due to the increase in GAAP revenue. Adjusted operating profit margin increased 60 basis points to 47.3%, primarily due to profit growth in our Ratings and Indices divisions. GAAP operating margin also benefitted from a gain on divestiture, while adjusted operating margin improvement was slightly offset by the timing of investment expense and the acquisition of With Intelligence.
|
|
|
Fourth Quarter 2025 Diluted Earnings Per Share |
|
|
|
|
|
|
|
|
|
|
|
|
|
4Q '25 |
4Q '24 |
y/y change |
| GAAP Diluted EPS |
$3.75 |
$2.85 |
32% |
| Adjusted Diluted EPS |
$4.30 |
$3.77 |
14% |
Fourth quarter GAAP diluted earnings per share increased 32% to $3.75 primarily due to a 29% increase in net income, and a 2% decrease in diluted shares outstanding. Adjusted diluted earnings per share increased 14% to $4.30 due to a 12% increase in adjusted net income and a 2% decrease in diluted shares outstanding. Currency positively impacted GAAP diluted EPS by $0.04 and adjusted diluted EPS by $0.04. The largest non-core adjustments to earnings in the fourth quarter of 2025 were for a gain on disposition and deal-related amortization.
|
|
|
|
|
|
|
|
|
|
|
Full-year 2025 revenue increased 8%, with strong growth in all five divisions.
(1) Revenue in 2024 and 2025 includes the impact of inter-segment eliminations of $186M and $200M, respectively.
|
Market Intelligence revenue increased by 6%, driven by strong subscription and volume-driven revenue growth, partly offset by the loss of revenue from Fincentric, which was divested in August 2024. Ratings revenue increased 8%, driven by 10% non-transaction and 6% transaction revenue growth. Energy revenue increased by 7% driven by strong subscription and usage-based revenue growth, partly offset by declines in non-subscription revenue and a negative impact related to government sanctions on select customers. Mobility revenue increased by 9% driven by double-digit growth in Dealer and Financial & Other revenue, partially offset by slower growth in Manufacturing. Indices revenue increased 14%, primarily due to growth in asset-linked fees, which benefited from higher AUM and inflows, as well as growth in Exchange-Traded Derivatives and Data & Custom Subscriptions revenue.
|
|
|
Full-Year 2025 Operating Profit, Expense, and Operating Margin |
Note: All presentations of revenue above refer to reported revenue. Adjusted financials refer to non-GAAP adjusted metrics in all periods.
The Company’s full-year reported operating margin increased by approximately 3 percentage points to 42.2%, and adjusted operating margin increased 140 basis points to 50.4%. Growth in both GAAP and adjusted operating margin was primarily driven by revenue growth across all five divisions. GAAP margin improvement also benefitted from a gain on divestiture. Adjusted operating margin improvements were slightly offset by the timing of investment expense and the acquisition of With Intelligence.
|
|
|
Full-Year 2025 Diluted Earnings Per Share |
|
|
|
|
|
|
|
|
|
|
|
|
|
2025 |
2024 |
y/y change |
| GAAP Diluted EPS |
$14.66 |
$12.35 |
19% |
| Adjusted Diluted EPS |
$17.83 |
$15.70 |
14% |
Full-year 2025 GAAP diluted earnings per share increased 19% to $14.66.
Adjusted diluted earnings per share increased 14% to $17.83 compared to 2024, due to an 11% increase in adjusted net income and a 2% decrease in diluted shares outstanding. Currency positively impacted GAAP diluted EPS by $0.11 and adjusted diluted EPS by $0.11. The largest non-core adjustments to earnings in 2025 were for deal-related amortization and a gain on disposition.
|
|
|
|
|
|
|
Adjusted, unless specifically noted as GAAP |
| Organic, Constant Currency Revenue growth |
6.0% to 8.0% |
| Reported Revenue growth (GAAP) |
6.6% to 8.6% |
| Corporate unallocated expense |
$220 to $230 million |
| Deal-related amortization |
~$1.11 billion |
| Operating profit margin expansion |
10 to 35 bps |
Operating profit margin expansion,
excluding OSTTRA |
50 to 75 bps |
| Interest expense, net |
$395 to $405 million |
| Tax rate |
22.0% to 23.0% |
| Diluted EPS |
$19.40 to $19.65 |
| Capital expenditures (GAAP) |
$215 to $225 million |
In addition to the above, the Company expects adjusted free cash flow, excluding certain items, to grow mid-single digits year over year.
Non-GAAP adjusted guidance excludes merger expenses and amortization of intangibles related to acquisitions.
The Company is not providing 2026 GAAP guidance at this time, other than reported revenue growth and capital expenditures. Given the inherent uncertainty around the timing of the spin of the Company’s Mobility division, and other related factors, management cannot reliably predict all of the necessary components of GAAP measures without unreasonable effort. Guidance assumes contributions from Mobility for the full year and excludes any impact from anticipated stranded costs. The Company expects to update adjusted guidance to exclude Mobility and institute GAAP guidance upon completion of the spin.
Beginning with January 2026 data, the Company expects to release its monthly billed issuance data and exchange-traded derivatives data on the 15th of each month (or the next business day thereafter), one month in arrears.
Capital Return: For the full-year 2026, the Company maintains its target of returning 85% or more of adjusted free cash flow to shareholders through dividends and share repurchases. The Board of Directors has authorized a quarterly cash dividend of $0.97, marking the 53rd consecutive year of dividend increases for the Company.
Supplemental Information/Conference Call/Webcast Details: The Company’s senior management will review the fourth quarter and full-year 2025 earnings results on a conference call scheduled for today, February 10, at 8:30 a.m. ET. Additional information presented on the conference call, as well as the Company’s Supplemental slide content, may be found on the Company’s Investor Relations Website at http://investor.spglobal.com/Quarterly-Earnings.
The Webcast will be available live and in replay at http://investor.spglobal.com/Quarterly-Earnings.
Telephone access is available. U.S. participants may call (888) 603-9623; international participants may call +1 (630) 395-0220 (long-distance charges will apply). The passcode is “S&P Global” and the conference leader is Martina Cheung. A recorded telephone replay will be available approximately two hours after the meeting concludes and will remain available until March 10, 2026. U.S. participants may call (866) 360-7720; international participants may call +1 (203) 369-0172 (long-distance charges will apply). No passcode is required.
Comparison of Adjusted Information to U.S. GAAP Information: The Company reports its financial results in accordance with accounting principles generally accepted in the United States ("GAAP"). The Company also refers to and presents certain additional non-GAAP financial measures, within the meaning of Regulation G under the Securities Exchange Act of 1934. These measures are: organic constant currency revenue; adjusted net income; adjusted diluted EPS; adjusted operating profit and margin; adjusted expenses; adjusted corporate unallocated expense; adjusted deal-related amortization; adjusted other (income) expense, net; adjusted interest expense, net; adjusted provision for income taxes; adjusted effective tax rate; adjusted equity in income on unconsolidated subsidiaries; and free cash flow and adjusted free cash flow excluding certain items.
The Company has included reconciliations of these non-GAAP financial measures to the most directly comparable financial measures calculated in accordance with GAAP on Exhibits 5 and 7. The Company is not able to provide reconciliations of certain forward-looking non-GAAP financial measures to comparable GAAP measures because certain items required for such reconciliations are outside of the Company's control and/or cannot be reasonably predicted without unreasonable effort.
The Company's non-GAAP measures include adjustments that reflect how management views our businesses. The Company believes these non-GAAP financial measures provide useful supplemental information that, in the case of non-GAAP financial measures other than free cash flow and adjusted free cash flow excluding certain items, enables investors to better compare the Company's performance across periods, and management also uses these measures internally to assess the operating performance of its business, to assess performance for employee compensation purposes and to decide how to allocate resources. The Company believes that the presentation of free cash flow and adjusted free cash flow excluding certain items allows investors to evaluate the cash generated from our underlying operations in a manner similar to the method used by management and that such measures are useful in evaluating the cash available to us to prepay debt, make strategic acquisitions and investments, and repurchase stock. However, investors should not consider any of these non-GAAP measures in isolation from, or as a substitute for, the financial information that the Company reports.
Forward-Looking Statements: This press release contains “forward-looking statements,” as defined in the Private Securities Litigation Reform Act of 1995. These statements, which express management’s current views concerning future events, trends, contingencies or results, appear at various places in this press release and use words like “anticipate,” “assume,” “believe,” “continue,” “estimate,” “expect,” “forecast,” “future,” “intend,” “plan,” “potential,” “predict,” “project,” “strategy,” “target” and similar terms, and future or conditional tense verbs like “could,” “may,” “might,” “should,” “will” and “would.” For example, management may use forward-looking statements when addressing topics such as: the outcome of contingencies; future actions by regulators; changes in the Company’s business strategies and methods of generating revenue; the development and performance of the Company’s services and products; the expected impact of acquisitions and dispositions; the Company’s effective tax rates; the Company’s cost structure, dividend policy, cash flows or liquidity; and the anticipated separation of S&P Global Mobility (“Mobility”) into a standalone public company.
Forward-looking statements are subject to inherent risks and uncertainties. Factors that could cause actual results to differ materially from those expressed or implied in forward-looking statements include, among other things:
▪worldwide economic, financial, political, and regulatory conditions (including slower GDP growth or recession, restrictions on trade (e.g., tariffs), instability in the banking sector and inflation), and factors that contribute to uncertainty and volatility (e.g., supply chain risk), geopolitical uncertainty (including military conflict), natural and man-made disasters, civil unrest, public health crises (e.g., pandemics), and conditions that result from legislative, regulatory, trade and policy changes, including from the U.S. administration;
▪the volatility and health of debt, equity, commodities, energy and automotive markets, including credit quality and spreads, the composition and mix of credit maturity profiles, the level of liquidity and future debt issuances, equity flows from active to passive, fluctuations in average asset prices in global equities, demand for investment products that track indices and assessments and trading volumes of certain exchange-traded derivatives;
▪the demand and market for credit ratings in and across the sectors and geographies where the Company operates;
▪the Company’s ability to maintain adequate physical, technical and administrative safeguards to protect the security of confidential information and data, and the potential for a system or network disruption that results in regulatory penalties and remedial costs or improper disclosure of confidential information or data;
▪the outcome of litigation, government and regulatory proceedings, investigations and inquiries; ▪concerns in the marketplace affecting the Company’s credibility or otherwise affecting market perceptions of the integrity or utility of independent credit ratings, benchmarks, indices and other services;
▪the level of merger and acquisition activity in the United States and abroad;
▪the level of the Company’s future cash flows and capital investments;
▪the effect of competitive products (including those incorporating artificial intelligence ("AI")) and pricing, including the level of success of new product developments and global expansion;
▪the impact of customer cost-cutting pressures;
▪a decline in the demand for our products and services by our customers and other market participants;
▪our ability to develop new products or technologies, to integrate our products with new technologies (e.g., AI), or to compete with new products or technologies offered by new or existing competitors;
▪the introduction of competing products (including those developed by AI) or technologies by other companies;
▪our ability to protect our intellectual property from unauthorized use and infringement, including by others using AI technologies, and to operate our business without violating third-party intellectual property rights, including through our own use of AI in our products and services;
▪our ability to attract, incentivize and retain key employees, especially in a competitive business environment;
▪our ability to successfully navigate key organizational changes;
▪the continuously evolving regulatory environment in Europe, the United States, and elsewhere around the globe affecting each of our businesses and the products they offer, and our compliance therewith;
▪the Company’s exposure to potential criminal sanctions or civil penalties for noncompliance with foreign and U.S. laws and regulations that are applicable in the jurisdictions in which it operates, including sanctions laws relating to countries such as Iran, Russia and Venezuela, anti-corruption laws such as the U.S. Foreign Corrupt Practices Act and the U.K. Bribery Act of 2010, and local laws prohibiting corrupt payments to government officials, as well as import and export restrictions;
▪the Company’s ability to make acquisitions and dispositions and successfully integrate the businesses we acquire;
▪consolidation of the Company’s customers, suppliers or competitors;
▪the ability of the Company, and its third-party service providers, to maintain adequate physical and technological infrastructure;
▪the Company’s ability to successfully recover from a disaster or other business continuity problem, such as an earthquake, hurricane, flood, civil unrest, protests, military conflict, terrorist attack, outbreak of pandemic or contagious diseases, security breach, cyber attack, data breach, power loss, telecommunications failure or other natural or man-made event;
▪the impact on the Company’s revenue and net income caused by fluctuations in foreign currency exchange rates;
▪the impact of changes in applicable tax or accounting requirements on the Company;
▪the separation of Mobility not being consummated within the anticipated time period or at all;
▪the ability of the separation of Mobility to qualify for tax-free treatment for U.S. federal income tax purposes;
▪any disruption to the Company’s business in connection with the proposed separation of Mobility;
▪any loss of synergies from separating the businesses of Mobility and the Company that adversely impact the results of operations of both businesses, or the companies resulting from the separation of Mobility not realizing all of the expected benefits of the separation; and
▪following the separation of Mobility, the combined value of the common stock of the two publicly-traded companies not being equal to or greater than the value of the Company’s common stock had the separation not occurred.
The factors noted above are not exhaustive. The Company and its subsidiaries operate in a dynamic business environment in which new risks emerge frequently. Accordingly, the Company cautions readers not to place undue reliance on any forward-looking statements, which speak only as of the dates on which they are made. The Company undertakes no obligation to update or revise any forward-looking statement to reflect events or circumstances arising after the date on which it is made, except as required by applicable law. Further information about the Company’s businesses, including information about factors that could materially affect its results of operations and financial condition, is contained in the Company’s filings with the SEC, including Item 1A, Risk Factors in our most recently filed Annual Report on Form 10-K.
About S&P Global
S&P Global (NYSE: SPGI) enables businesses, governments, and individuals with trusted data, expertise and technology to make decisions with conviction. We are Advancing Essential Intelligence through world-leading benchmarks, data, and insights that customers need in order to plan confidently, act decisively, and thrive economically in a rapidly changing global landscape.
From helping our customers assess new investments across the capital and commodities markets to guiding them through the energy expansion, acceleration of artificial intelligence, and evolution of public and private markets, we enable the world's leading organizations to unlock opportunities, solve challenges, and plan for tomorrow – today. Learn more at www.spglobal.com.
Investor Relations: http://investor.spglobal.com
Contact:
Investor Relations:
Mark Grant
Senior Vice President, Investor Relations and Treasurer (dollars in millions, except per share data)
Tel: +1 (347) 640-1521
mark.grant@spglobal.com
Media:
Christina Twomey
Chief Communications Officer
Tel: +1 (410) 382-3316
christina.twomey@spglobal.com
###
S&P Global
Condensed Consolidated Statements of Income
Periods ended December 31, 2025 and 2024
|
|
|
|
|
|
|
|
|
|
|
|
|
|
|
|
|
|
|
|
|
|
|
|
|
|
|
|
|
|
|
|
|
|
|
|
|
|
|
|
|
|
|
|
|
| (unaudited) |
Three Months |
Twelve Months |
|
|
2025 |
|
2024 |
|
% Change |
|
|
2025 |
|
2024 |
|
% Change |
|
| |
|
|
|
|
|
|
|
|
|
|
|
|
|
|
| Revenue |
|
$ |
3,916 |
|
|
$ |
3,592 |
|
|
9% |
|
|
$ |
15,336 |
|
|
$ |
14,208 |
|
|
8% |
|
| Expenses |
|
2,511 |
|
|
2,333 |
|
|
8% |
|
|
9,159 |
|
|
8,730 |
|
|
5% |
|
| Gain on dispositions, net |
|
(270) |
|
|
(38) |
|
|
N/M |
|
|
(273) |
|
|
(59) |
|
|
N/M |
|
| Equity in income on unconsolidated subsidiaries |
|
1 |
|
|
(12) |
|
|
N/M |
|
|
(28) |
|
|
(43) |
|
|
(35)% |
|
| Operating profit |
|
1,674 |
|
|
1,309 |
|
|
28% |
|
|
6,478 |
|
|
5,580 |
|
|
16% |
|
| Other income, net |
|
(11) |
|
|
(14) |
|
|
21% |
|
|
(36) |
|
|
(25) |
|
|
(45)% |
|
| Interest expense, net |
|
54 |
|
|
69 |
|
|
(21)% |
|
|
287 |
|
|
297 |
|
|
(3)% |
|
Income before taxes on income |
|
1,631 |
|
|
1,254 |
|
|
30% |
|
|
6,227 |
|
|
5,308 |
|
|
17% |
|
| Provision for taxes on income |
|
407 |
|
|
287 |
|
|
42% |
|
|
1,407 |
|
|
1,141 |
|
|
23% |
|
|
|
|
|
|
|
|
|
|
|
|
|
|
|
|
|
|
|
|
|
|
|
|
|
|
|
|
|
|
|
|
|
|
|
|
|
|
|
|
|
|
|
|
|
|
|
|
|
|
|
|
|
|
|
|
|
|
|
|
|
| Net income |
|
1,224 |
|
|
967 |
|
|
27% |
|
|
4,820 |
|
|
4,167 |
|
|
16% |
|
Less: net income attributable to noncontrolling interests |
|
(90) |
|
|
(87) |
|
|
(4)% |
|
|
(349) |
|
|
(315) |
|
|
(11)% |
|
Net income attributable to S&P Global Inc. |
|
$ |
1,134 |
|
|
$ |
880 |
|
|
29% |
|
|
$ |
4,471 |
|
|
$ |
3,852 |
|
|
16% |
|
| |
|
|
|
|
|
|
|
|
|
|
|
|
|
|
|
|
|
|
|
|
|
|
|
|
|
|
|
|
|
|
|
|
|
|
|
|
|
|
|
|
|
|
|
|
|
|
|
|
|
|
|
|
|
|
|
|
|
|
|
|
|
|
|
|
|
|
|
|
|
|
|
|
|
|
|
|
|
|
|
|
|
|
|
|
|
|
|
|
|
Earnings per share attributable to S&P Global Inc. common shareholders: |
|
|
|
|
|
|
|
|
|
|
|
|
|
|
|
|
|
|
|
|
|
|
|
|
|
|
|
|
|
|
|
|
|
|
|
|
|
|
|
|
|
|
|
|
|
|
|
|
|
|
|
|
|
|
|
|
|
|
|
|
|
|
|
|
|
|
|
|
|
|
|
|
|
|
|
|
|
|
|
|
|
|
|
|
|
|
|
|
|
|
|
|
|
|
|
|
|
|
|
|
|
|
|
|
| Net income: |
|
|
|
|
|
|
|
|
|
|
|
|
|
|
| Basic |
|
$ |
3.76 |
|
|
$ |
2.85 |
|
|
32% |
|
|
$ |
14.67 |
|
|
$ |
12.36 |
|
|
19% |
|
| Diluted |
|
$ |
3.75 |
|
|
$ |
2.85 |
|
|
32% |
|
|
$ |
14.66 |
|
|
$ |
12.35 |
|
|
19% |
|
| |
|
|
|
|
|
|
|
|
|
|
|
|
|
|
Weighted-average number of common shares outstanding: |
|
|
|
|
|
|
|
|
|
|
|
|
|
|
| Basic |
|
301.8 |
|
|
308.5 |
|
|
|
|
|
304.8 |
|
|
311.6 |
|
|
|
|
| Diluted |
|
302.1 |
|
|
308.9 |
|
|
|
|
|
305.1 |
|
|
311.9 |
|
|
|
|
|
|
|
|
|
|
|
|
|
|
|
|
|
|
|
| Actual shares outstanding at year end |
|
|
|
|
|
|
|
|
298.8 |
|
|
307.8 |
|
|
|
|
| |
|
|
|
|
|
|
|
|
|
|
|
|
|
|
N/M - Represents a change equal to or in excess of 100% or not meaningful.
Note - % change in the tables throughout the exhibits are calculated off of the actual number, not the rounded number presented.
S&P Global
Condensed Consolidated Balance Sheets
December 31, 2025 and 2024
(dollars in millions)
|
|
|
|
|
|
|
|
|
|
|
|
|
|
|
|
|
|
|
|
|
| (unaudited) |
|
2025 |
|
|
2024 |
|
| |
|
|
|
|
|
|
| Assets: |
|
|
|
|
|
|
| Cash, cash equivalents, and restricted cash |
|
$ |
1,745 |
|
|
|
$ |
1,666 |
|
|
| Other current assets |
|
4,355 |
|
|
|
3,793 |
|
|
Assets held for sale 1 |
|
196 |
|
|
|
— |
|
|
| Total current assets |
|
6,296 |
|
|
|
5,459 |
|
|
| Property and equipment, net |
|
278 |
|
|
|
265 |
|
|
| Right of use assets |
|
413 |
|
|
|
413 |
|
|
| Goodwill and other intangible assets, net |
|
52,746 |
|
|
|
51,473 |
|
|
| Equity investments in unconsolidated subsidiaries |
|
603 |
|
|
|
1,774 |
|
|
| Other non-current assets |
|
864 |
|
|
|
837 |
|
|
| Total assets |
|
$ |
61,200 |
|
|
|
$ |
60,221 |
|
|
| |
|
|
|
|
|
|
| Liabilities and Equity: |
|
|
|
|
|
|
| Short-term debt |
|
$ |
718 |
|
|
|
$ |
4 |
|
|
| Unearned revenue |
|
4,088 |
|
|
|
3,694 |
|
|
| Other current liabilities |
|
2,788 |
|
|
|
2,694 |
|
|
Liabilities held for sale 1 |
|
43 |
|
|
|
— |
|
|
| Long-term debt |
|
12,370 |
|
|
|
11,394 |
|
|
| Lease liabilities — non-current |
|
494 |
|
|
|
535 |
|
|
| Deferred tax liability — non-current |
|
3,262 |
|
|
|
3,397 |
|
|
Pension, other postretirement benefits and other non-current liabilities |
|
1,285 |
|
|
|
995 |
|
|
| Total liabilities |
|
25,048 |
|
|
|
22,713 |
|
|
| Redeemable noncontrolling interest |
|
4,917 |
|
|
|
4,252 |
|
|
| Total equity |
|
31,235 |
|
|
|
33,256 |
|
|
| Total liabilities and equity |
|
$ |
61,200 |
|
|
|
$ |
60,221 |
|
|
| |
|
|
|
|
|
|
1 Assets and liabilities held for sale as of December 31, 2025 relate to the divestitures of the Enterprise Data Management and thinkFolio businesses within our Market Intelligence segment. Additionally, assets held for sale include fixed assets related to our intent to sell our facility in Centennial, Colorado.
S&P Global
Condensed Consolidated Statements of Cash Flows
Years ended December 31, 2025 and 2024
(dollars in millions)
|
|
|
|
|
|
|
|
|
|
|
|
|
|
|
|
|
|
|
|
|
| (unaudited) |
|
2025 |
|
|
2024 |
|
| |
|
|
|
|
|
|
| Operating Activities: |
|
|
|
|
|
|
| Net income |
|
$ |
4,820 |
|
|
|
$ |
4,167 |
|
|
Adjustments to reconcile net income to cash provided by operating activities: |
|
|
|
|
|
|
| Depreciation |
|
110 |
|
|
|
96 |
|
|
| Amortization of intangibles |
|
1,069 |
|
|
|
1,077 |
|
|
| Deferred income taxes |
|
(242) |
|
|
|
(323) |
|
|
| Stock-based compensation |
|
236 |
|
|
|
247 |
|
|
| Gain on dispositions, net |
|
(273) |
|
|
|
(59) |
|
|
|
|
|
|
|
|
|
|
|
|
|
|
|
|
|
|
|
|
|
|
|
| Other |
|
363 |
|
|
|
249 |
|
|
| Net changes in other operating assets and liabilities |
|
(432) |
|
|
|
235 |
|
|
| Cash provided by operating activities |
|
5,651 |
|
|
|
5,689 |
|
|
|
|
|
|
|
|
|
| Investing Activities: |
|
|
|
|
|
|
| Capital expenditures |
|
(195) |
|
|
|
(124) |
|
|
| Acquisitions, net of cash acquired |
|
(2,023) |
|
|
|
(305) |
|
|
| Proceeds from dispositions |
|
1,549 |
|
|
|
168 |
|
|
| Changes in short-term investments |
|
(35) |
|
|
|
6 |
|
|
| Cash used for investing activities |
|
(704) |
|
|
|
(255) |
|
|
|
|
|
|
|
|
|
| Financing Activities: |
|
|
|
|
|
|
| Additions to short-term debt, net |
|
715 |
|
|
|
— |
|
|
| Proceeds from issuance of senior notes, net |
|
993 |
|
|
|
— |
|
|
| Payments on senior notes |
|
(4) |
|
|
|
(47) |
|
|
| Dividends paid to shareholders |
|
(1,170) |
|
|
|
(1,134) |
|
|
| Distributions to noncontrolling interest holders |
|
(321) |
|
|
|
(287) |
|
|
|
|
|
|
|
|
|
| Repurchase of treasury shares |
|
(5,001) |
|
|
|
(3,301) |
|
|
| Employee withholding tax on share-based payments, excise tax payments on share repurchases, contingent consideration payments and other |
|
(142) |
|
|
|
(229) |
|
|
| Cash used for financing activities |
|
(4,930) |
|
|
|
(4,998) |
|
|
| Effect of exchange rate changes on cash |
|
62 |
|
|
|
(61) |
|
|
|
|
|
|
|
|
|
|
|
|
|
|
|
|
| Net change in cash, cash equivalents, and restricted cash |
|
79 |
|
|
|
375 |
|
|
| Cash, cash equivalents, and restricted cash at beginning of year |
|
1,666 |
|
|
|
1,291 |
|
|
| Cash, cash equivalents, and restricted cash at end of year |
|
$ |
1,745 |
|
|
|
$ |
1,666 |
|
|
| |
|
|
|
|
|
|
S&P Global
Operating Results by Segment
Periods ended December 31, 2025 and 2024
(dollars in millions)
|
|
|
|
|
|
|
|
|
|
|
|
|
|
|
|
|
|
|
|
|
|
|
|
|
|
|
|
|
|
|
|
|
|
|
|
|
|
|
|
|
|
|
|
|
| (unaudited) |
Three Months |
Twelve Months |
| |
|
Revenue |
|
|
Revenue |
|
|
|
|
|
|
|
|
|
|
|
|
|
|
|
|
| |
|
2025 |
|
2024 |
|
% Change |
|
|
2025 |
|
2024 |
|
% Change |
|
Market Intelligence |
|
$ |
1,264 |
|
|
$ |
1,186 |
|
|
7% |
|
|
$ |
4,916 |
|
|
$ |
4,645 |
|
|
6% |
|
| Ratings |
|
1,187 |
|
|
1,062 |
|
|
12% |
|
|
4,724 |
|
|
4,370 |
|
|
8% |
|
| Energy |
|
576 |
|
|
545 |
|
|
6% |
|
|
2,299 |
|
|
2,142 |
|
|
7% |
|
| Mobility |
|
444 |
|
|
411 |
|
|
8% |
|
|
1,747 |
|
|
1,609 |
|
|
9% |
|
| Indices |
|
498 |
|
|
436 |
|
|
14% |
|
|
1,850 |
|
|
1,628 |
|
|
14% |
|
|
|
|
|
|
|
|
|
|
|
|
|
|
|
|
| Intersegment Elimination |
|
(53) |
|
|
(48) |
|
|
(10)% |
|
|
(200) |
|
|
(186) |
|
|
(8)% |
|
| Total revenue |
|
$ |
3,916 |
|
|
$ |
3,592 |
|
|
9% |
|
|
$ |
15,336 |
|
|
$ |
14,208 |
|
|
8% |
|
| |
|
|
|
|
|
|
|
|
|
|
|
|
|
|
| |
|
|
|
|
|
|
|
|
|
|
|
|
|
|
| |
|
Expenses |
|
|
Expenses |
|
|
|
|
|
|
|
|
|
|
|
|
|
|
|
|
| |
|
2025 |
|
2024 |
|
% Change |
|
|
2025 |
|
2024 |
|
% Change |
|
| |
|
|
|
|
|
|
|
|
|
|
|
|
|
|
| Market Intelligence (a) |
|
$ |
1,029 |
|
|
$ |
960 |
|
|
7% |
|
|
$ |
3,925 |
|
|
$ |
3,770 |
|
|
4% |
|
| Ratings (b) |
|
464 |
|
|
435 |
|
|
7% |
|
|
1,711 |
|
|
1,663 |
|
|
3% |
|
| Energy (c) |
|
356 |
|
|
343 |
|
|
4% |
|
|
1,356 |
|
|
1,297 |
|
|
5% |
|
| Mobility (d) |
|
373 |
|
|
346 |
|
|
8% |
|
|
1,369 |
|
|
1,297 |
|
|
6% |
|
| Indices (e) |
|
168 |
|
|
149 |
|
|
13% |
|
|
579 |
|
|
525 |
|
|
10% |
|
| Corporate Unallocated expense (f) |
|
(96) |
|
|
110 |
|
|
N/M |
|
|
146 |
|
|
305 |
|
|
(52)% |
|
| Equity in Income on Unconsolidated Subsidiaries (g) |
|
1 |
|
|
(12) |
|
|
N/M |
|
|
(28) |
|
|
(43) |
|
|
35% |
|
| Intersegment Elimination |
|
(53) |
|
|
(48) |
|
|
(10)% |
|
|
(200) |
|
|
(186) |
|
|
(8)% |
|
Total expenses |
|
$ |
2,242 |
|
|
$ |
2,283 |
|
|
(2)% |
|
|
$ |
8,858 |
|
|
$ |
8,628 |
|
|
3% |
|
| |
|
|
|
|
|
|
|
|
|
|
|
|
|
|
| |
|
|
|
|
|
|
|
|
|
|
|
|
|
|
| |
|
Operating Profit |
|
|
Operating Profit |
|
|
|
|
|
|
|
|
|
|
|
|
|
|
|
|
| |
|
2025 |
|
2024 |
|
% Change |
|
|
2025 |
|
2024 |
|
% Change |
|
| |
|
|
|
|
|
|
|
|
|
|
|
|
|
|
| Market Intelligence (a) |
|
$ |
235 |
|
|
$ |
226 |
|
|
4% |
|
|
$ |
991 |
|
|
$ |
875 |
|
|
13% |
|
| Ratings (b) |
|
723 |
|
|
627 |
|
|
15% |
|
|
3,013 |
|
|
2,707 |
|
|
11% |
|
| Energy (c) |
|
220 |
|
|
202 |
|
|
9% |
|
|
943 |
|
|
845 |
|
|
12% |
|
| Mobility (d) |
|
71 |
|
|
65 |
|
|
9% |
|
|
378 |
|
|
312 |
|
|
21% |
|
| Indices (e) |
|
330 |
|
|
287 |
|
|
15% |
|
|
1,271 |
|
|
1,103 |
|
|
15% |
|
| Total reportable segments |
|
1,579 |
|
|
1,407 |
|
|
12% |
|
|
6,596 |
|
|
5,842 |
|
|
13% |
|
| Corporate Unallocated expense (f) |
|
96 |
|
|
(110) |
|
|
N/M |
|
|
(146) |
|
|
(305) |
|
|
52% |
|
| Equity in Income on Unconsolidated Subsidiaries (g) |
|
(1) |
|
|
12 |
|
|
N/M |
|
|
28 |
|
|
43 |
|
|
(35)% |
|
Total operating profit |
|
$ |
1,674 |
|
|
$ |
1,309 |
|
|
28% |
|
|
$ |
6,478 |
|
|
$ |
5,580 |
|
|
16% |
|
| |
|
|
|
|
|
|
|
|
|
|
|
|
|
|
N/M - Represents a change equal to or in excess of 100% or not meaningful.
(a) The three and twelve months ended December 31, 2025 include employee severance charges of $12 million and $56 million, respectively, acquisition-related costs of $8 million and $21 million, respectively, disposition-related costs of $4 million and $10 million, respectively, and a statutorily required labor law accrual adjustment of $3 million. The twelve months ended December 31, 2025 include Executive Leadership Team transition costs of $5 million and a gain on disposition of $3 million. The three and twelve months ended December 31, 2024 include employee severance charges of $42 million and $77 million, respectively, gain on dispositions of $38 million and $59 million, respectively, IHS Markit merger costs of $7 million and $36 million, respectively, a net acquisition-related benefit of $4 million and $12 million, respectively, and Executive Leadership Team transition costs of $3 million. The three months ended December 31, 2024 include a liability write-off of $1 million. Additionally, amortization of intangibles from acquisitions of $145 million and $152 million is included for the three months ended December 31, 2025 and 2024, respectively, and $588 million and $591 million for the twelve months ended December 31, 2025 and 2024, respectively.
(b) The three and twelve months ended December 31, 2025 include employee severance charges of $6 million and $17 million, respectively, and legal costs of $3 million and $42 million, respectively. The three and twelve months ended December 31, 2024 include employee severance charges of $3 million and $5 million, respectively. The twelve months ended December 31, 2024 include legal settlement costs of $20 million and a statutorily required bonus accrual adjustment of $6 million. Additionally, amortization of intangibles from acquisitions of $1 million and $3 million is included for the three months ended December 31, 2025 and 2024, respectively, and $6 million and $14 million for the twelve months ended December 31, 2025 and 2024, respectively.
(c) The three and twelve months ended December 31, 2025 include employee severance charges of $9 million and $19 million, respectively, and a statutorily required labor law accrual adjustment of $1 million. The three and twelve months ended December 31, 2024 include employee severance charges of $9 million and $13 million, respectively, and IHS Markit merger costs of $1 million and $14 million, respectively. The twelve months ended December 31, 2024 include an asset write-off of $1 million and disposition-related costs of $1 million. Additionally, amortization of intangibles from acquisitions of $32 million and $33 million is included for the three months ended December 31, 2025 and 2024, respectively, and $130 million for the twelve months ended December 31, 2025 and 2024.
(d) The three and twelve months ended December 31, 2025 include disposition-related costs of $6 million and $7 million, respectively, and employee severance charges of $4 million and $15 million, respectively. The twelve months ended December 31, 2025 include Executive Leadership Team transition benefit of $4 million and a legal settlement recovery of $3 million. The three and twelve months ended December 31, 2024 include IHS Markit merger costs of $1 million and $4 million, respectively, acquisition-related costs of $1 million and $2 million, respectively, and a liability write-off of $1 million. The twelve months ended December 31, 2024 include employee severance charges of $7 million. Additionally, amortization of intangibles from acquisitions of $76 million is included for the three months ended December 31, 2025 and 2024, and $303 million for the twelve months ended December 31, 2025 and 2024.
(e) The three and twelve months ended December 31, 2025 include employee severance charges of $3 million and $4 million, respectively. The twelve months ended December 31, 2025 include acquisition-related costs of $1 million. The twelve months ended December 31, 2024 include IHS Markit merger costs of $4 million, a loss on disposition of $1 million and employee severance charges of $1 million. Additionally, amortization of intangibles from acquisitions of $10 million and $9 million is included for the three months ended December 31, 2025 and 2024, respectively, and $37 million and $36 million for the twelve months ended December 31, 2025 and 2024, respectively.
(f) The three and twelve months ended December 31, 2025 include a gain on disposition of $270 million, disposition-related costs of $50 million and $74 million, respectively, acquisition-related costs of $20 million and $25 million, respectively, employee severance charges of $19 million and $47 million, respectively, Executive Leadership Team transition costs of $18 million and $41 million, respectively, lease impairments of $7 million and $21 million, respectively, a statutorily required labor law accrual adjustment of $5 million and legal costs of $3 million and $6 million, respectively. The twelve months ended December 31, 2025 include an asset write-off of $1 million. The three and twelve months ended December 31, 2024 include employee severance charges of $22 million and $24 million, respectively, IHS Markit merger costs of $21 million and $75 million, respectively, disposition-related costs of $6 million and $8 million, respectively, Executive Leadership Team transition costs of $5 million, lease impairments of $3 million and $1 million, respectively, and a net acquisition-related benefit and cost of $1 million and $8 million, respectively. The twelve months ended December 31, 2024 include a gain on disposition of $2 million and an asset write-off of $1 million. Additionally, amortization of intangibles from acquisitions of $2 million and $1 million is included for the three months ended December 31, 2025 and 2024, respectively, and $4 million and $3 million for the twelve months ended December 31, 2025 and 2024, respectively.
(g) Amortization of intangibles from acquisitions of $1 million and $14 million is included for the three months ended December 31, 2025 and 2024, respectively, and $41 million and $56 million for the twelve months ended December 31, 2025 and 2024, respectively.
S&P Global
Operating Results - Reported vs. Adjusted
Non-GAAP Financial Information
Periods ended December 31, 2025 and 2024
(dollars in millions, except per share amounts)
Adjusted Expenses
|
|
|
|
|
|
|
|
|
|
|
|
|
|
|
|
|
|
|
|
|
|
|
|
|
|
|
|
|
|
|
|
|
|
|
|
|
|
|
|
|
|
|
|
|
|
|
|
|
| (unaudited) |
|
Three Months |
|
Twelve Months |
|
|
|
2025 |
|
2024 |
|
% Change |
|
|
|
2025 |
|
2024 |
|
% Change |
|
|
|
|
|
|
|
|
|
|
|
|
|
|
|
|
|
|
| Market Intelligence |
Expenses |
|
$ |
1,029 |
|
|
$ |
960 |
|
|
7% |
|
|
|
$ |
3,925 |
|
|
$ |
3,770 |
|
|
4% |
|
| Non-GAAP adjustments (a) |
|
(27) |
|
|
(9) |
|
|
|
|
|
|
(91) |
|
|
(46) |
|
|
|
|
| Deal-related amortization |
|
(145) |
|
|
(152) |
|
|
|
|
|
|
(588) |
|
|
(591) |
|
|
|
|
| Adjusted expenses |
|
$ |
857 |
|
|
$ |
799 |
|
|
7% |
|
|
|
$ |
3,246 |
|
|
$ |
3,133 |
|
|
4% |
|
|
|
|
|
|
|
|
|
|
|
|
|
|
|
|
|
|
|
|
|
|
|
|
|
|
|
|
|
|
|
|
|
|
|
| Ratings |
Expenses |
|
$ |
464 |
|
|
$ |
435 |
|
|
7% |
|
|
|
1,711 |
|
|
$ |
1,663 |
|
|
3% |
|
| Non-GAAP adjustments (b) |
|
(10) |
|
|
(4) |
|
|
|
|
|
|
(60) |
|
|
(32) |
|
|
|
|
| Deal-related amortization |
|
(1) |
|
|
(3) |
|
|
|
|
|
|
(6) |
|
|
(14) |
|
|
|
|
| Adjusted expenses |
|
$ |
453 |
|
|
$ |
428 |
|
|
6% |
|
|
|
$ |
1,645 |
|
|
$ |
1,617 |
|
|
2% |
|
|
|
|
|
|
|
|
|
|
|
|
|
|
|
|
|
|
|
|
|
|
|
|
|
|
|
|
|
|
|
|
|
|
|
| Energy |
Expenses |
|
$ |
356 |
|
|
$ |
343 |
|
|
4% |
|
|
|
1,356 |
|
|
$ |
1,297 |
|
|
5% |
|
| Non-GAAP adjustments (c) |
|
(10) |
|
|
(10) |
|
|
|
|
|
|
(21) |
|
|
(28) |
|
|
|
|
| Deal-related amortization |
|
(32) |
|
|
(33) |
|
|
|
|
|
|
(130) |
|
|
(130) |
|
|
|
|
| Adjusted expenses |
|
$ |
314 |
|
|
$ |
300 |
|
|
5% |
|
|
|
$ |
1,205 |
|
|
$ |
1,139 |
|
|
6% |
|
|
|
|
|
|
|
|
|
|
|
|
|
|
|
|
|
|
|
|
|
|
|
|
|
|
|
|
|
|
|
|
|
|
|
| Mobility |
Expenses |
|
$ |
373 |
|
|
$ |
346 |
|
|
8% |
|
|
|
$ |
1,369 |
|
|
$ |
1,297 |
|
|
6% |
|
| Non-GAAP adjustments (d) |
|
(10) |
|
|
(2) |
|
|
|
|
|
|
(15) |
|
|
(12) |
|
|
|
|
| Deal-related amortization |
|
(76) |
|
|
(76) |
|
|
|
|
|
|
(303) |
|
|
(303) |
|
|
|
|
| Adjusted expenses |
|
$ |
287 |
|
|
$ |
268 |
|
|
7% |
|
|
|
$ |
1,051 |
|
|
$ |
982 |
|
|
7% |
|
|
|
|
|
|
|
|
|
|
|
|
|
|
|
|
|
|
|
|
|
|
|
|
|
|
|
|
|
|
|
|
|
|
|
| Indices |
Expenses |
|
$ |
168 |
|
|
$ |
149 |
|
|
13% |
|
|
|
$ |
579 |
|
|
$ |
525 |
|
|
10% |
|
| Non-GAAP adjustments (e) |
|
(3) |
|
|
— |
|
|
|
|
|
|
(5) |
|
|
(6) |
|
|
|
|
| Deal-related amortization |
|
(10) |
|
|
(9) |
|
|
|
|
|
|
(37) |
|
|
(36) |
|
|
|
|
| Adjusted expenses |
|
$ |
155 |
|
|
$ |
140 |
|
|
11% |
|
|
|
$ |
537 |
|
|
$ |
483 |
|
|
11% |
|
|
|
|
|
|
|
|
|
|
|
|
|
|
|
|
|
|
|
|
|
|
|
|
|
|
|
|
|
|
|
|
|
|
|
| Corporate Unallocated Expense |
Corporate Unallocated expense |
|
$ |
(96) |
|
|
$ |
110 |
|
|
NM |
|
|
|
$ |
146 |
|
|
$ |
305 |
|
|
(52)% |
|
| Non-GAAP adjustments (f) |
|
149 |
|
|
(55) |
|
|
|
|
|
|
50 |
|
|
(121) |
|
|
|
|
| Deal-related amortization |
|
(2) |
|
|
(1) |
|
|
|
|
|
|
(4) |
|
|
(3) |
|
|
|
|
| Adjusted Corporate Unallocated expenses |
|
$ |
51 |
|
|
$ |
54 |
|
|
(5)% |
|
|
|
$ |
192 |
|
|
$ |
181 |
|
|
6% |
|
|
|
|
|
|
|
|
|
|
|
|
|
|
|
|
|
|
|
|
|
|
|
|
|
|
|
|
|
|
|
|
|
|
|
| Equity in Income on Unconsolidated Subsidiaries |
Equity in income on unconsolidated subsidiaries |
|
$ |
1 |
|
|
$ |
(12) |
|
|
N/M |
|
|
|
$ |
(28) |
|
|
$ |
(43) |
|
|
35% |
|
|
|
|
|
|
|
|
|
|
|
|
|
|
|
|
|
| Deal-related amortization |
|
(1) |
|
|
(14) |
|
|
|
|
|
|
(41) |
|
|
(56) |
|
|
|
|
| Adjusted equity in income on unconsolidated subsidiaries |
|
$ |
— |
|
|
$ |
(26) |
|
|
98% |
|
|
|
$ |
(69) |
|
|
$ |
(99) |
|
|
30% |
|
|
|
|
|
|
|
|
|
|
|
|
|
|
|
|
|
|
|
|
|
|
|
|
|
|
|
|
|
|
|
|
|
|
|
| Total SPGI |
Expenses |
|
$ |
2,242 |
|
|
$ |
2,283 |
|
|
(2)% |
|
|
|
$ |
8,858 |
|
|
$ |
8,628 |
|
|
3% |
|
| Non-GAAP adjustments (a)(b)(c)(d)(e)(f) |
|
89 |
|
|
(80) |
|
|
|
|
|
|
(142) |
|
|
(245) |
|
|
|
|
| Deal-related amortization |
|
(267) |
|
|
(288) |
|
|
|
|
|
|
(1,109) |
|
|
(1,133) |
|
|
|
|
| Adjusted expenses |
|
$ |
2,064 |
|
|
$ |
1,915 |
|
|
8% |
|
|
|
$ |
7,607 |
|
|
$ |
7,250 |
|
|
5% |
|
|
|
|
|
|
|
|
|
|
|
|
|
|
|
|
|
|
Adjusted Operating Profit
|
|
|
|
|
|
|
|
|
|
|
|
|
|
|
|
|
|
|
|
|
|
|
|
|
|
|
|
|
|
|
|
|
|
|
|
|
|
|
|
|
|
|
|
|
|
|
|
| (unaudited) |
|
Three Months |
Twelve Months |
|
|
|
2025 |
|
2024 |
|
% Change |
|
|
2025 |
|
2024 |
|
% Change |
|
|
|
|
|
|
|
|
|
|
|
|
|
|
|
|
|
| Market Intelligence |
Operating profit |
|
$ |
235 |
|
|
$ |
226 |
|
|
4% |
|
|
$ |
991 |
|
|
$ |
875 |
|
|
13% |
|
| Non-GAAP adjustments (a) |
|
27 |
|
|
9 |
|
|
|
|
|
91 |
|
|
46 |
|
|
|
|
| Deal-related amortization |
|
145 |
|
|
152 |
|
|
|
|
|
588 |
|
|
591 |
|
|
|
|
| Adjusted operating profit |
|
$ |
408 |
|
|
$ |
387 |
|
|
5% |
|
|
$ |
1,671 |
|
|
$ |
1,512 |
|
|
11% |
|
|
|
|
|
|
|
|
|
|
|
|
|
|
|
|
|
|
|
|
|
|
|
|
|
|
|
|
|
|
|
|
|
| Ratings |
Operating profit |
|
$ |
723 |
|
|
$ |
627 |
|
|
15% |
|
|
$ |
3,013 |
|
|
$ |
2,707 |
|
|
11% |
|
| Non-GAAP adjustments (b) |
|
10 |
|
|
4 |
|
|
|
|
|
60 |
|
|
32 |
|
|
|
|
| Deal-related amortization |
|
1 |
|
|
3 |
|
|
|
|
|
6 |
|
|
14 |
|
|
|
|
| Adjusted operating profit |
|
$ |
734 |
|
|
$ |
634 |
|
|
16% |
|
|
$ |
3,079 |
|
|
$ |
2,753 |
|
|
12% |
|
|
|
|
|
|
|
|
|
|
|
|
|
|
|
|
|
|
|
|
|
|
|
|
|
|
|
|
|
|
|
|
| Energy |
Operating profit |
|
$ |
220 |
|
|
$ |
202 |
|
|
9% |
|
|
$ |
943 |
|
|
$ |
845 |
|
|
12% |
|
| Non-GAAP adjustments (c) |
|
10 |
|
|
10 |
|
|
|
|
|
21 |
|
|
28 |
|
|
|
|
| Deal-related amortization |
|
32 |
|
|
33 |
|
|
|
|
|
130 |
|
|
130 |
|
|
|
|
| Adjusted operating profit |
|
$ |
262 |
|
|
$ |
245 |
|
|
7% |
|
|
$ |
1,093 |
|
|
$ |
1,003 |
|
|
9% |
|
|
|
|
|
|
|
|
|
|
|
|
|
|
|
|
|
|
|
|
|
|
|
|
|
|
|
|
|
|
|
|
|
| Mobility |
Operating profit |
|
$ |
71 |
|
|
$ |
65 |
|
|
9% |
|
|
$ |
378 |
|
|
$ |
312 |
|
|
21% |
|
| Non-GAAP adjustments (d) |
|
10 |
|
|
2 |
|
|
|
|
|
15 |
|
|
12 |
|
|
|
|
| Deal-related amortization |
|
76 |
|
|
76 |
|
|
|
|
|
303 |
|
|
303 |
|
|
|
|
| Adjusted operating profit |
|
$ |
157 |
|
|
$ |
143 |
|
|
10% |
|
|
$ |
697 |
|
|
$ |
627 |
|
|
11% |
|
|
|
|
|
|
|
|
|
|
|
|
|
|
|
|
|
|
|
|
|
|
|
|
|
|
|
|
|
|
|
|
|
| Indices |
Operating profit |
|
$ |
330 |
|
|
$ |
287 |
|
|
15% |
|
|
$ |
1,271 |
|
|
$ |
1,103 |
|
|
15% |
|
| Non-GAAP adjustments (e) |
|
3 |
|
|
— |
|
|
|
|
|
5 |
|
|
6 |
|
|
|
|
| Deal-related amortization |
|
10 |
|
|
9 |
|
|
|
|
|
37 |
|
|
36 |
|
|
|
|
| Adjusted operating profit |
|
$ |
342 |
|
|
$ |
296 |
|
|
16% |
|
|
$ |
1,313 |
|
|
$ |
1,145 |
|
|
15% |
|
|
|
|
|
|
|
|
|
|
|
|
|
|
|
|
|
|
|
|
|
|
|
|
|
|
|
|
|
|
|
|
|
| Total Segments |
Operating profit |
|
$ |
1,579 |
|
|
$ |
1,407 |
|
|
12% |
|
|
$ |
6,596 |
|
|
$ |
5,842 |
|
|
13% |
|
| Non-GAAP adjustments (a) (b) (c)(d) (e) |
|
60 |
|
|
25 |
|
|
|
|
|
192 |
|
|
124 |
|
|
|
|
| Deal-related amortization |
|
264 |
|
|
273 |
|
|
|
|
|
1,064 |
|
|
1,074 |
|
|
|
|
| Adjusted operating profit |
|
$ |
1,903 |
|
|
$ |
1,705 |
|
|
12% |
|
|
$ |
7,853 |
|
|
$ |
7,040 |
|
|
12% |
|
|
|
|
|
|
|
|
|
|
|
|
|
|
|
|
|
|
|
|
|
|
|
|
|
|
|
|
|
|
|
|
|
| Corporate Unallocated Expense |
Corporate unallocated expense |
|
$ |
96 |
|
|
$ |
(110) |
|
|
N/M |
|
|
$ |
(146) |
|
|
$ |
(305) |
|
|
52% |
|
| Non-GAAP adjustments (f) |
|
(149) |
|
|
55 |
|
|
|
|
|
(50) |
|
|
121 |
|
|
|
|
| Deal-related amortization |
|
2 |
|
|
1 |
|
|
|
|
|
4 |
|
|
3 |
|
|
|
|
| Adjusted corporate unallocated expense |
|
$ |
(51) |
|
|
$ |
(54) |
|
|
5% |
|
|
$ |
(192) |
|
|
$ |
(181) |
|
|
(6)% |
|
|
|
|
|
|
|
|
|
|
|
|
|
|
|
|
|
|
|
|
|
|
|
|
|
|
|
|
|
|
|
|
|
|
|
|
|
|
|
|
|
|
|
|
|
|
|
|
|
|
|
|
|
|
|
|
|
|
|
|
|
|
|
|
|
| (unaudited) |
|
Three Months |
Twelve Months |
|
|
|
2025 |
|
2024 |
|
% Change |
|
|
2025 |
|
2024 |
|
% Change |
|
|
|
|
|
|
|
|
|
|
|
|
|
|
|
|
|
|
|
|
|
|
|
|
|
|
|
|
|
|
|
|
|
|
|
|
|
|
|
|
|
|
|
|
|
|
|
|
|
| Equity in Income on Unconsolidated Subsidiaries |
Equity in income on unconsolidated subsidiaries |
|
$ |
(1) |
|
|
$ |
12 |
|
|
N/M |
|
|
$ |
28 |
|
|
$ |
43 |
|
|
(35)% |
|
|
|
|
|
|
|
|
|
|
|
|
|
|
|
|
| Deal-related amortization |
|
1 |
|
|
14 |
|
|
|
|
|
41 |
|
|
56 |
|
|
|
|
| Adjusted equity in income on unconsolidated subsidiaries |
|
$ |
— |
|
|
$ |
26 |
|
|
(98)% |
|
|
$ |
69 |
|
|
$ |
99 |
|
|
(30)% |
|
|
|
|
|
|
|
|
|
|
|
|
|
|
|
|
|
|
|
|
|
|
|
|
|
|
|
|
|
|
|
|
|
| Total SPGI |
Operating profit |
|
$ |
1,674 |
|
|
$ |
1,309 |
|
|
28% |
|
|
$ |
6,478 |
|
|
$ |
5,580 |
|
|
16% |
|
| Non-GAAP adjustments (a) (b) (c)(d) (e) (f) |
|
(89) |
|
|
80 |
|
|
|
|
|
142 |
|
|
245 |
|
|
|
|
| Deal-related amortization |
|
267 |
|
|
288 |
|
|
|
|
|
1,109 |
|
|
1,133 |
|
|
|
|
| Adjusted operating profit |
|
$ |
1,852 |
|
|
$ |
1,677 |
|
|
10% |
|
|
$ |
7,730 |
|
|
$ |
6,958 |
|
|
11% |
|
|
|
|
|
|
|
|
|
|
|
|
|
|
|
|
|
Adjusted Other Income, Net
|
|
|
|
|
|
|
|
|
|
|
|
|
|
|
|
|
|
|
|
|
|
|
|
|
|
|
|
|
|
|
|
|
|
|
|
|
|
|
|
|
|
|
|
|
| (unaudited) |
|
Three Months |
|
|
Twelve Months |
|
|
|
2025 |
|
2024 |
|
% Change |
|
|
2025 |
|
2024 |
|
% Change |
|
|
|
|
|
|
|
|
|
|
|
|
|
|
|
|
| Other income, net |
|
$ |
(11) |
|
|
$ |
(14) |
|
|
21% |
|
|
$ |
(36) |
|
|
$ |
(25) |
|
|
(45)% |
|
|
|
|
|
|
|
|
|
|
|
|
|
|
|
|
| Deal-related amortization |
|
— |
|
|
(6) |
|
|
|
|
|
— |
|
|
(6) |
|
|
|
|
| Adjusted other income, net |
|
$ |
(11) |
|
|
$ |
(20) |
|
|
44% |
|
|
$ |
(36) |
|
|
$ |
(31) |
|
|
(17)% |
|
| |
|
|
|
|
|
|
|
|
|
|
|
|
|
|
Adjusted Interest Expense, Net
|
|
|
|
|
|
|
|
|
|
|
|
|
|
|
|
|
|
|
|
|
|
|
|
|
|
|
|
|
|
|
|
|
|
|
|
|
|
|
|
|
|
|
|
|
| (unaudited) |
|
Three Months |
|
|
Twelve Months |
|
|
|
2025 |
|
2024 |
|
% Change |
|
|
2025 |
|
2024 |
|
% Change |
|
|
|
|
|
|
|
|
|
|
|
|
|
|
|
|
| Interest expense, net |
|
$ |
54 |
|
|
$ |
69 |
|
|
(21)% |
|
|
$ |
287 |
|
|
$ |
297 |
|
|
(3)% |
|
| Non-GAAP adjustments (g) |
|
6 |
|
|
6 |
|
|
|
|
|
26 |
|
|
26 |
|
|
|
|
|
|
|
|
|
|
|
|
|
|
|
|
|
|
|
|
|
|
|
|
|
|
|
|
|
|
|
|
|
|
| Adjusted interest expense, net |
|
$ |
61 |
|
|
$ |
75 |
|
|
(20)% |
|
|
$ |
313 |
|
|
$ |
323 |
|
|
(3)% |
|
| |
|
|
|
|
|
|
|
|
|
|
|
|
|
|
Adjusted Provision for Income Taxes
|
|
|
|
|
|
|
|
|
|
|
|
|
|
|
|
|
|
|
|
|
|
|
|
|
|
|
|
|
|
|
|
|
|
|
|
|
|
|
|
|
|
|
|
|
| (unaudited) |
|
Three Months |
|
|
Twelve Months |
|
|
|
2025 |
|
2024 |
|
% Change |
|
|
2025 |
|
2024 |
|
% Change |
|
|
|
|
|
|
|
|
|
|
|
|
|
|
|
|
| Provision for income taxes |
|
$ |
407 |
|
|
$ |
287 |
|
|
42% |
|
|
$ |
1,407 |
|
|
$ |
1,141 |
|
|
23% |
|
| Non-GAAP adjustments (a) (b) (c)(d) (e) (f) (g) (h) |
|
(61) |
|
|
12 |
|
|
|
|
|
(15) |
|
|
34 |
|
|
|
|
| Deal-related amortization |
|
68 |
|
|
72 |
|
|
|
|
|
272 |
|
|
278 |
|
|
|
|
| Adjusted provision for income taxes |
|
$ |
413 |
|
|
$ |
371 |
|
|
11% |
|
|
$ |
1,663 |
|
|
$ |
1,453 |
|
|
14% |
|
| |
|
|
|
|
|
|
|
|
|
|
|
|
|
|
Adjusted Effective Tax Rate
|
|
|
|
|
|
|
|
|
|
|
|
|
|
|
|
|
|
|
|
|
|
|
|
|
|
|
|
|
|
|
|
|
|
|
|
|
|
|
|
|
|
|
|
|
| (unaudited) |
|
Three Months |
|
|
Twelve Months |
|
|
|
2025 |
|
2024 |
|
% Change |
|
|
2025 |
|
2024 |
|
% Change |
|
|
|
|
|
|
|
|
|
|
|
|
|
|
|
|
| Adjusted operating profit |
|
$ |
1,852 |
|
|
$ |
1,677 |
|
|
10% |
|
|
$ |
7,730 |
|
|
$ |
6,958 |
|
|
11% |
|
| Adjusted other income, net |
|
(11) |
|
|
(20) |
|
|
|
|
|
(36) |
|
|
(31) |
|
|
|
|
| Adjusted interest expense, net |
|
61 |
|
|
75 |
|
|
|
|
|
313 |
|
|
323 |
|
|
|
|
| Adjusted income before taxes on income |
|
$ |
1,802 |
|
|
$ |
1,622 |
|
|
11% |
|
|
$ |
7,453 |
|
|
$ |
6,666 |
|
|
12% |
|
| Adjusted provision for income taxes |
|
$ |
413 |
|
|
$ |
371 |
|
|
|
|
|
$ |
1,663 |
|
|
$ |
1,453 |
|
|
|
|
| Effective tax rate |
|
24.9 |
% |
|
22.9 |
% |
|
|
|
|
22.6 |
% |
|
21.5 |
% |
|
|
|
Adjusted effective tax rate 1 |
|
22.9 |
% |
|
22.9 |
% |
|
|
|
|
22.3 |
% |
|
21.8 |
% |
|
|
|
| |
|
|
|
|
|
|
|
|
|
|
|
|
|
|
1 The adjusted effective tax rate is calculated by dividing adjusted provision for income taxes by the adjusted income before taxes, which includes income from unconsolidated subsidiaries. The adjusted effective tax rate excluding income from unconsolidated subsidiaries for the three months ended December 31, 2025 and 2024 was 22.9% and 23.3%, respectively. The adjusted effective tax rate excluding income from unconsolidated subsidiaries for the twelve months ended December 31, 2025 and 2024 was 22.5% and 22.1%, respectively.
Adjusted Net Income attributable to SPGI and Diluted EPS
|
|
|
|
|
|
|
|
|
|
|
|
|
|
|
|
|
|
|
|
|
|
|
|
|
|
|
|
|
|
|
|
|
|
|
|
|
|
|
|
|
|
|
|
|
|
|
|
| (unaudited) |
|
2025 |
|
|
2024 |
|
|
% Change |
|
|
|
Net Income attributable to SPGI |
|
Diluted EPS |
|
|
Net Income attributable to SPGI |
|
Diluted EPS |
|
|
Net Income attributable to SPGI |
|
Diluted EPS |
|
|
|
|
|
|
|
|
|
|
|
|
|
|
|
|
|
|
|
Three Months |
|
|
|
|
|
|
| Reported |
|
$ |
1,134 |
|
|
$ |
3.75 |
|
|
|
$ |
880 |
|
|
$ |
2.85 |
|
|
|
29% |
|
32% |
|
| Non-GAAP adjustments |
|
(34) |
|
|
(0.11) |
|
|
|
61 |
|
|
0.20 |
|
|
|
|
|
|
|
| Deal-related amortization |
|
199 |
|
|
0.66 |
|
|
|
222 |
|
|
0.72 |
|
|
|
|
|
|
|
| Adjusted |
|
$ |
1,299 |
|
|
$ |
4.30 |
|
|
|
$ |
1,163 |
|
|
$ |
3.77 |
|
|
|
12% |
|
14% |
|
| |
|
|
|
|
|
|
|
|
|
|
|
|
|
|
|
|
|
Twelve Months |
|
|
|
|
|
|
| Reported |
|
$ |
4,471 |
|
|
$ |
14.66 |
|
|
|
$ |
3,852 |
|
|
$ |
12.35 |
|
|
|
16% |
|
19% |
|
| Non-GAAP adjustments |
|
131 |
|
|
0.43 |
|
|
|
185 |
|
|
0.59 |
|
|
|
|
|
|
|
| Deal-related amortization |
|
838 |
|
|
2.75 |
|
|
|
861 |
|
|
2.76 |
|
|
|
|
|
|
|
| Adjusted |
|
$ |
5,441 |
|
|
$ |
17.83 |
|
|
|
$ |
4,898 |
|
|
$ |
15.70 |
|
|
|
11% |
|
14% |
|
|
|
|
|
|
|
|
|
|
|
|
|
|
|
|
|
N/M - Represents a change equal to or in excess of 100% or not meaningful
Note - Totals presented may not sum due to rounding.
Note - Operating profit margin for Market Intelligence, Ratings, Energy, Mobility and Indices was 19%, 61%, 38%, 16% and 66%, respectively, for the three months ended December 31, 2025. Operating profit margin for the Company was 43% for the three months ended December 31, 2025. Operating profit margin for Market Intelligence, Ratings, Energy, Mobility and Indices was 20%, 64%, 41%, 22% and 69% for the twelve months ended December 31, 2025. Operating profit margin for the Company was 42% for the twelve months ended December 31, 2025. Adjusted operating profit margin for Market Intelligence, Ratings, Energy, Mobility and Indices was 32%, 62%, 45%, 35% and 69%, respectively, for the three months ended December 31, 2025. Adjusted operating profit margin for the Company was 47% for the three months ended December 31, 2025. Adjusted operating profit margin for Market Intelligence, Ratings, Energy, Mobility and Indices was 34%, 65%, 48%, 40% and 71% for the twelve months ended December 31, 2025. Adjusted operating profit margin for the Company was 50% for the twelve months ended December 31, 2025. Operating profit margin for Market Intelligence, Ratings, Energy, Mobility and Indices was 19%, 59%, 37%, 16% and 66%, respectively, for the three months ended December 31, 2024. Operating profit margin for the Company was 36% for the three months ended December 31, 2024. Operating profit margin for Market Intelligence, Ratings, Energy, Mobility and Indices was 19%, 62%, 39%, 19% and 68% for the twelve months ended December 31, 2024. Operating profit margin for the Company was 39% for the twelve months ended December 31, 2024. Adjusted operating profit margin for Market Intelligence, Ratings, Energy, Mobility and Indices was 33%, 60%, 45%, 35% and 68%, respectively, for the three months ended December 31, 2024. Adjusted operating profit margin for the Company was 47% for the three months ended December 31, 2024. Adjusted operating profit margin for Market Intelligence, Ratings, Energy, Mobility and Indices was 33%, 63%, 47%, 39% and 70% for the twelve months ended December 31, 2024. Adjusted operating profit margin for the Company was 49% for the twelve months ended December 31, 2024. Adjusted operating profit margin is calculated as adjusted operating profit divided by revenue. Adjusted operating profit margin for the Company excluding OSTTRA was 47% and 46% for the three months ended December 31, 2025 and 2024, respectively, and 50% and 48% for the twelve months ended December 31, 2025 and 2024, respectively. Adjusted operating profit margin excluding OSTTRA is calculated as adjusted operating profit less adjusted equity in income on unconsolidated subsidiaries divided by revenue.
(a) The three and twelve months ended December 31, 2025 include employee severance charges of $12 million ($8 million after-tax) and $56 million ($41 million after-tax), respectively, acquisition-related costs of $8 million ($8 million after-tax) and $21 million ($18 million after-tax), respectively, disposition-related costs of $4 million ($3 million after-tax) and $10 million ($8 million after-tax), respectively, and a statutorily required labor law accrual adjustment of $3 million ($2 million after-tax). The twelve months ended December 31, 2025 include Executive Leadership Team transition costs of $5 million ($4 million after-tax) and a gain on disposition of $3 million ($2 million after-tax). The three and twelve months ended December 31, 2024 include employee severance charges of $42 million ($31 million after-tax) and $77 million ($58 million after-tax), respectively, gain on dispositions of $38 million ($27 million after-tax) and $59 million ($39 million after-tax), respectively, IHS Markit merger costs of $7 million ($5 million after-tax) and $36 million ($27 million after-tax), respectively, a net acquisition-related benefit of $4 million ($3 million after-tax) and $12 million ($11 million after-tax), respectively, and Executive Leadership Team transition costs of $3 million ($2 million after-tax). The three months ended December 31, 2024 include a liability write-off of $1 million ($1 million after-tax).
(b) The three and twelve months ended December 31, 2025 include employee severance charges of $6 million ($5 million after-tax) and $17 million ($12 million after-tax), respectively, and legal costs of $3 million ($2 million after-tax) and $42 million ($32 million after-tax), respectively. The three and twelve months ended December 31, 2024 include employee severance charges of $3 million ($3 million after- tax) and $5 million ($4 million after-tax), respectively. The twelve months ended December 31, 2024 include legal settlement costs of $20 million ($20 million after-tax) and a statutorily required bonus accrual adjustment of $6 million ($5 million after-tax).
(c) The three and twelve months ended December 31, 2025 include employee severance charges of $9 million ($6 million after-tax) and $19 million ($14 million after-tax), respectively, and a statutorily required labor law accrual adjustment of $1 million ($1 million after-tax). The three and twelve months ended December 31, 2024 include employee severance charges of $9 million ($7 million after-tax) and $13 million ($10 million after-tax), respectively, and IHS Markit merger costs of $1 million ($1 million after-tax) and $14 million ($10 million after-tax), respectively. The twelve months ended December 31, 2024 include an asset write-off of $1 million ($1 million after-tax) and disposition-related costs of $1 million ($1 million after-tax).
(d) The three and twelve months ended December 31, 2025 include disposition-related costs of $6 million ($6 million after-tax) and $7 million ($7 million after-tax), respectively, and employee severance charges of $4 million ($3 million after-tax) and $15 million ($11 million after-tax), respectively. The twelve months ended December 31, 2025 include Executive Leadership Team transition benefit of $4 million ($3 million after-tax) and a legal settlement recovery of $3 million ($2 million after-tax). The three and twelve months ended December 31, 2024 include IHS Markit merger costs of $1 million ($1 million after-tax) and $4 million ($3 million after-tax), respectively, acquisition-related costs of $1 million ($1 million after-tax) and $2 million ($2 million after-tax), respectively, and a liability write-off of $1 million (less than $1 million after-tax). The twelve months ended December 31, 2024 include employee severance charges of $7 million ($5 million after-tax).
(e) The three and twelve months ended December 31, 2025 include employee severance charges of $3 million ($2 million after-tax) and $4 million ($3 million after-tax), respectively. The twelve months ended December 31, 2025 include acquisition-related costs of $1 million ($1 million after-tax). The twelve months ended December 31, 2024 include IHS Markit merger costs of $4 million ($3 million after-tax), a loss on disposition of $1 million ($1 million after-tax) and employee severance charges of $1 million ($1 million after-tax).
(f) The three and twelve months ended December 31, 2025 include gain on disposition of $270 million ($187 million after-tax), disposition-related costs of $50 million ($50 million after-tax) and $74 million ($74 million after-tax), respectively, acquisition-related costs of $20 million ($20 million after-tax) and $25 million ($25 million after-tax), respectively, employee severance charges of $19 million ($14 million after-tax) and $47 million ($35 million after-tax), respectively, Executive Leadership Team transition costs of $18 million ($14 million after-tax) and $41 million ($30 million after-tax), respectively, lease impairments of $7 million ($5 million after-tax) and $21 million ($16 million after-tax), respectively, a statutorily required labor law accrual adjustment of $5 million ($3 million after-tax) and legal costs of $3 million ($2 million after-tax) and $6 million ($4 million after-tax), respectively. The twelve months ended December 31, 2025 include an asset write-off of $1 million ($1 million after-tax). The three and twelve months ended December 31, 2024 include employee severance charges of $22 million ($17 million after-tax) and $24 million ($19 million after-tax), respectively, IHS Markit merger costs of $21 million ($16 million after-tax) and $75 million ($56 million after-tax), respectively, disposition-related costs of $6 million ($6 million after-tax) and $8 million ($8 million after-tax), respectively, Executive Leadership Team transition costs of $5 million ($5 million after-tax), lease impairments of $3 million ($2 million after- tax) and $1 million ($1 million after-tax), respectively, and a net acquisition-related benefit and cost of $1 million (less than $1 million after-tax) and $8 million ($8 million after-tax), respectively. The twelve months ended December 31, 2024 include a gain on disposition of $2 million ($1 million after-tax) and an asset write-off of $1 million ($1 million after-tax).
(g) The three and twelve months ended December 31, 2025 include a premium amortization benefit of $6 million ($5 million after-tax) and $26 million ($19 million after-tax), respectively. The three and twelve months ended December 31, 2024 include a premium amortization benefit of $6 million ($5 million after-tax) and $26 million ($20 million after-tax), respectively.
(h) The three months ended December 31, 2025 include a tax expense of $2 million due to annualized effective tax rate differences for GAAP. The three and twelve months ended December 31, 2024 include a tax expense of $1 million due to annualized effective tax rate differences for GAAP and $6 million associated with IHS Markit prior to acquisition, respectively.
S&P Global
Revenue Information
Periods ended December 31, 2025 and 2024
(dollars in millions)
Revenue by Type
|
|
|
|
|
|
|
|
|
|
|
|
|
|
|
|
|
|
|
|
|
|
|
|
|
|
|
|
|
|
|
|
|
|
|
|
|
|
|
|
|
|
|
|
|
|
|
|
|
|
|
|
|
|
|
|
|
|
|
|
|
|
|
|
|
|
|
|
|
|
|
|
|
|
|
|
|
|
|
|
|
|
|
|
|
|
|
|
|
|
|
|
|
|
|
|
| (unaudited) |
Three Months |
|
|
|
|
|
|
|
|
|
|
|
|
|
|
|
|
|
|
|
|
|
|
|
|
|
|
|
|
|
|
|
|
Subscription (a) |
|
|
Non-subscription / Transaction (b) |
|
|
Non-transaction (c) |
|
|
|
|
|
|
|
|
|
|
|
|
|
|
|
|
|
|
|
|
|
|
|
|
|
2025 |
|
2024 |
|
% Change |
|
|
2025 |
|
2024 |
|
% Change |
|
|
2025 |
|
2024 |
|
% Change |
|
|
|
|
|
|
|
|
|
|
|
|
|
|
|
|
|
|
|
|
|
|
|
|
|
|
|
|
|
|
|
|
|
|
|
|
|
|
|
|
|
|
|
|
|
|
|
|
|
|
|
|
|
|
|
|
|
|
|
|
|
|
|
|
|
|
|
|
|
|
|
|
|
|
|
|
|
|
|
|
|
|
|
| Market Intelligence |
|
$ |
1,062 |
|
|
$ |
989 |
|
|
7% |
|
|
45 |
|
|
48 |
|
|
(6)% |
|
|
$ |
— |
|
|
$ |
— |
|
|
N/M |
|
|
|
|
|
|
|
|
|
|
|
|
|
|
|
|
|
|
|
|
|
|
|
|
|
|
|
|
|
|
|
| Ratings |
|
— |
|
|
— |
|
|
N/M |
|
|
585 |
|
|
521 |
|
|
12% |
|
|
602 |
|
|
541 |
|
|
11% |
|
|
|
|
|
|
|
|
|
|
|
|
|
|
|
|
|
|
|
|
|
|
|
|
|
|
|
|
|
|
|
| Energy |
|
523 |
|
|
486 |
|
|
8% |
|
|
23 |
|
|
33 |
|
|
(29)% |
|
|
— |
|
|
— |
|
|
N/M |
|
|
|
|
|
|
|
|
|
|
|
|
|
|
|
|
|
|
|
|
|
|
|
|
|
|
|
|
|
|
|
| Mobility |
|
361 |
|
|
333 |
|
|
8% |
|
|
83 |
|
|
78 |
|
|
8% |
|
|
— |
|
|
— |
|
|
N/M |
|
|
|
|
|
|
|
|
|
|
|
|
|
|
|
|
|
|
|
|
|
|
|
|
|
|
|
|
|
|
|
| Indices |
|
84 |
|
|
74 |
|
|
13% |
|
|
— |
|
|
— |
|
|
N/M |
|
|
— |
|
|
— |
|
|
N/M |
|
|
|
|
|
|
|
|
|
|
|
|
|
|
|
|
|
|
|
|
|
|
|
|
|
|
|
|
|
|
|
| Intersegment elimination |
|
— |
|
|
— |
|
|
N/M |
|
|
— |
|
|
— |
|
|
N/M |
|
|
(53) |
|
|
(48) |
|
|
(10)% |
|
|
|
|
|
|
|
|
|
|
|
|
|
|
|
|
|
|
|
|
|
|
|
|
|
|
|
|
|
|
|
| Total revenue |
|
$ |
2,030 |
|
|
$ |
1,882 |
|
|
8% |
|
|
$ |
736 |
|
|
$ |
680 |
|
|
8% |
|
|
$ |
549 |
|
|
$ |
493 |
|
|
11% |
|
|
|
|
|
|
|
|
|
|
|
|
|
|
|
|
|
|
|
|
|
|
|
|
|
|
|
|
|
|
|
|
|
|
|
|
|
|
|
|
|
|
|
|
|
|
|
|
|
|
|
|
|
|
|
|
|
|
|
|
|
|
|
|
|
|
|
|
|
|
|
|
|
|
|
|
|
|
|
|
|
|
|
|
|
Asset-linked fees (d) |
|
|
Sales usage-based royalties (e) |
|
|
Recurring variable (f) |
|
|
|
|
|
|
|
|
|
|
|
|
|
|
|
|
|
|
|
|
|
|
|
|
|
2025 |
|
2024 |
|
% Change |
|
|
2025 |
|
2024 |
|
% Change |
|
|
2025 |
|
2024 |
|
% Change |
|
|
|
|
|
|
|
|
|
|
|
|
|
|
|
|
|
|
|
|
|
|
|
|
|
|
|
|
|
|
|
|
|
|
|
|
|
|
|
|
|
|
|
|
|
|
|
|
|
|
|
|
|
|
|
|
|
|
|
|
|
|
|
|
|
|
|
|
|
|
|
|
|
|
|
|
|
|
|
|
|
|
|
| Market Intelligence |
|
$ |
— |
|
|
$ |
— |
|
|
N/M |
|
|
$ |
— |
|
|
$ |
— |
|
|
N/M |
|
|
$ |
157 |
|
|
$ |
149 |
|
|
5% |
|
|
|
|
|
|
|
|
|
|
|
|
|
|
|
|
|
|
|
|
|
|
|
|
|
|
|
|
|
|
|
| Ratings |
|
— |
|
|
— |
|
|
N/M |
|
|
— |
|
|
— |
|
|
N/M |
|
|
— |
|
|
— |
|
|
N/M |
|
|
|
|
|
|
|
|
|
|
|
|
|
|
|
|
|
|
|
|
|
|
|
|
|
|
|
|
|
|
|
| Energy |
|
— |
|
|
— |
|
|
N/M |
|
|
30 |
|
|
26 |
|
|
16% |
|
|
— |
|
|
— |
|
|
N/M |
|
|
|
|
|
|
|
|
|
|
|
|
|
|
|
|
|
|
|
|
|
|
|
|
|
|
|
|
|
|
|
| Mobility |
|
— |
|
|
— |
|
|
N/M |
|
|
— |
|
|
— |
|
|
N/M |
|
|
— |
|
|
— |
|
|
N/M |
|
|
|
|
|
|
|
|
|
|
|
|
|
|
|
|
|
|
|
|
|
|
|
|
|
|
|
|
|
|
|
| Indices |
|
329 |
|
|
291 |
|
|
13% |
|
|
85 |
|
|
71 |
|
|
20% |
|
|
— |
|
|
— |
|
|
N/M |
|
|
|
|
|
|
|
|
|
|
|
|
|
|
|
|
|
|
|
|
|
|
|
|
|
|
|
|
|
|
|
|
|
|
|
|
|
|
|
|
|
|
|
|
|
|
|
|
|
|
|
|
|
|
|
|
|
|
|
|
|
|
|
|
|
|
|
|
|
|
|
|
|
|
|
|
|
|
|
|
|
|
|
| Total revenue |
|
$ |
329 |
|
|
$ |
291 |
|
|
13% |
|
|
$ |
115 |
|
|
$ |
97 |
|
|
19% |
|
|
$ |
157 |
|
|
$ |
149 |
|
|
5% |
|
|
|
|
|
|
|
|
|
|
|
|
|
|
|
|
|
|
|
|
|
|
|
|
|
|
|
|
|
|
|
|
|
|
|
|
|
|
|
|
|
|
|
|
|
|
|
|
|
|
|
|
|
|
|
|
|
|
|
|
|
|
|
|
|
|
|
|
|
|
|
|
|
|
|
|
|
|
|
|
|
|
|
|
Twelve Months |
|
|
|
|
|
|
|
|
|
|
|
|
|
|
|
|
|
|
|
|
|
|
|
|
|
|
|
|
|
|
|
|
Subscription (a) |
|
|
Non-subscription / Transaction (b) |
|
|
Non-transaction (c) |
|
|
|
|
|
|
|
|
|
|
|
|
|
|
|
|
|
|
|
|
|
|
|
|
|
2025 |
|
2024 |
|
% Change |
|
|
2025 |
|
2024 |
|
% Change |
|
|
2025 |
|
2024 |
|
% Change |
|
|
|
|
|
|
|
|
|
|
|
|
|
|
|
|
|
|
|
|
|
|
|
|
|
|
|
|
|
|
|
| Market Intelligence |
|
$ |
4,107 |
|
|
$ |
3,882 |
|
|
6% |
|
|
$ |
186 |
|
|
$ |
184 |
|
|
2% |
|
|
$ |
— |
|
|
$ |
— |
|
|
N/M |
|
|
|
|
|
|
|
|
|
|
|
|
|
|
|
|
|
|
|
|
|
|
|
|
|
|
|
|
|
|
|
| Ratings |
|
— |
|
|
— |
|
|
N/M |
|
|
2,470 |
|
|
2,326 |
|
|
6% |
|
|
2,254 |
|
|
2,044 |
|
|
10% |
|
|
|
|
|
|
|
|
|
|
|
|
|
|
|
|
|
|
|
|
|
|
|
|
|
|
|
|
|
|
|
| Energy |
|
2,016 |
|
|
1,873 |
|
|
8% |
|
|
163 |
|
|
166 |
|
|
(2)% |
|
|
— |
|
|
— |
|
|
N/M |
|
|
|
|
|
|
|
|
|
|
|
|
|
|
|
|
|
|
|
|
|
|
|
|
|
|
|
|
|
|
|
| Mobility |
|
1,422 |
|
|
1,299 |
|
|
10% |
|
|
325 |
|
|
310 |
|
|
5% |
|
|
— |
|
|
— |
|
|
N/M |
|
|
|
|
|
|
|
|
|
|
|
|
|
|
|
|
|
|
|
|
|
|
|
|
|
|
|
|
|
|
|
| Indices |
|
320 |
|
|
292 |
|
|
10% |
|
|
— |
|
|
— |
|
|
N/M |
|
|
— |
|
|
— |
|
|
N/M |
|
|
|
|
|
|
|
|
|
|
|
|
|
|
|
|
|
|
|
|
|
|
|
|
|
|
|
|
|
|
|
| Intersegment elimination |
|
— |
|
|
— |
|
|
N/M |
|
|
— |
|
|
— |
|
|
N/M |
|
|
(200) |
|
|
(186) |
|
|
(8)% |
|
|
|
|
|
|
|
|
|
|
|
|
|
|
|
|
|
|
|
|
|
|
|
|
|
|
|
|
|
|
|
| Total revenue |
|
$ |
7,865 |
|
|
$ |
7,346 |
|
|
7% |
|
|
$ |
3,144 |
|
|
$ |
2,986 |
|
|
5% |
|
|
$ |
2,054 |
|
|
$ |
1,858 |
|
|
11% |
|
|
|
|
|
|
|
|
|
|
|
|
|
|
|
|
|
|
|
|
|
|
|
|
|
|
|
|
|
|
|
|
|
|
|
|
|
|
|
|
|
|
|
|
|
|
|
|
|
|
|
|
|
|
|
|
|
|
|
|
|
|
|
|
|
|
|
|
|
|
|
|
|
|
|
|
|
|
|
|
|
|
|
|
|
Asset-linked fees (d) |
|
|
Sales usage-based royalties (e) |
|
|
Recurring variable (f) |
|
|
|
|
|
|
|
|
|
|
|
|
|
|
|
|
|
|
|
|
|
|
|
|
|
2025 |
|
2024 |
|
% Change |
|
|
2025 |
|
2024 |
|
% Change |
|
|
2025 |
|
2024 |
|
% Change |
|
|
|
|
|
|
|
|
|
|
|
|
|
|
|
|
|
|
|
|
|
|
|
|
|
|
|
|
|
|
|
|
|
|
|
|
|
|
|
|
|
|
|
|
|
|
|
|
|
|
|
|
|
|
|
|
|
|
|
|
|
|
|
|
|
|
|
|
|
|
|
|
|
|
|
|
|
|
|
|
|
|
|
| Market Intelligence |
|
$ |
— |
|
|
$ |
— |
|
|
N/M |
|
|
$ |
— |
|
|
$ |
— |
|
|
N/M |
|
|
$ |
623 |
|
|
$ |
579 |
|
|
8% |
|
|
|
|
|
|
|
|
|
|
|
|
|
|
|
|
|
|
|
|
|
|
|
|
|
|
|
|
|
|
|
| Ratings |
|
— |
|
|
— |
|
|
N/M |
|
|
— |
|
|
— |
|
|
N/M |
|
|
— |
|
|
— |
|
|
N/M |
|
|
|
|
|
|
|
|
|
|
|
|
|
|
|
|
|
|
|
|
|
|
|
|
|
|
|
|
|
|
|
| Energy |
|
— |
|
|
— |
|
|
N/M |
|
|
120 |
|
|
103 |
|
|
17% |
|
|
— |
|
|
— |
|
|
N/M |
|
|
|
|
|
|
|
|
|
|
|
|
|
|
|
|
|
|
|
|
|
|
|
|
|
|
|
|
|
|
|
| Mobility |
|
— |
|
|
— |
|
|
N/M |
|
|
— |
|
|
— |
|
|
N/M |
|
|
— |
|
|
— |
|
|
N/M |
|
|
|
|
|
|
|
|
|
|
|
|
|
|
|
|
|
|
|
|
|
|
|
|
|
|
|
|
|
|
|
| Indices |
|
1,206 |
|
|
1,046 |
|
|
15% |
|
|
324 |
|
|
290 |
|
|
12% |
|
|
— |
|
|
— |
|
|
N/M |
|
|
|
|
|
|
|
|
|
|
|
|
|
|
|
|
|
|
|
|
|
|
|
|
|
|
|
|
|
|
|
|
|
|
|
|
|
|
|
|
|
|
|
|
|
|
|
|
|
|
|
|
|
|
|
|
|
|
|
|
|
|
|
|
|
|
|
|
|
|
|
|
|
|
|
|
|
|
|
|
|
|
|
| Total revenue |
|
$ |
1,206 |
|
|
$ |
1,046 |
|
|
15% |
|
|
$ |
444 |
|
|
$ |
393 |
|
|
13% |
|
|
$ |
623 |
|
|
$ |
579 |
|
|
8% |
|
|
|
|
|
|
|
|
|
|
|
|
|
|
|
|
|
|
|
|
|
|
|
|
|
|
|
|
|
|
|
|
|
|
|
|
|
|
|
|
|
|
|
|
|
|
|
|
|
|
|
|
|
|
|
|
|
|
|
|
|
|
|
|
|
|
|
|
|
|
|
|
|
|
|
|
|
|
|
|
|
|
|
N/M - Represents a change equal to or in excess of 100% or not meaningful.
(a) Subscription revenue is primarily derived from distribution of data, valuation services, analytics, third party research, and credit ratings-related information through both feed and web-based channels, market data and market insights along with other information products and software term licenses, and Mobility’s core information products.
(b) Non-subscription / transaction revenue is primarily related to ratings of publicly-issued debt and bank loan ratings.
(c) Non-transaction revenue is primarily related to surveillance of a credit rating, annual fees for customer relationship-based pricing programs, fees for entity credit ratings and global research and analytics at Crisil. Non-transaction revenue also includes an intersegment revenue elimination charged to Market Intelligence for the rights to use and distribute content and data developed by Ratings.
(d) Asset-linked fees is primarily related to fees based on assets underlying exchange-traded funds, mutual funds and insurance products.
(e) Sales usage-based royalty revenue is primarily related to trading based fees from exchange-traded derivatives and licensing proprietary market price data and price assessments to commodity exchanges.
(f) Recurring variable revenue represents revenue from contracts for services that specify a fee based on, among other factors, the number of trades processed, assets under management, or the number of positions valued.
S&P Global
Non-GAAP Financial Information
Periods ended December 31, 2025 and 2024
(dollars in millions)
Computation of Free Cash Flow and Adjusted
Free Cash Flow Excluding Certain Items
|
|
|
|
|
|
|
|
|
|
|
|
|
|
|
|
|
|
|
|
|
|
|
|
|
|
|
|
|
|
|
|
|
| (unaudited) |
|
Three Months |
|
|
Twelve Months |
|
|
|
2025 |
|
2024 |
|
|
2025 |
|
2024 |
|
| Cash provided by operating activities |
|
$ |
1,748 |
|
|
$ |
1,740 |
|
|
|
$ |
5,651 |
|
|
$ |
5,689 |
|
|
| Capital expenditures |
|
(46) |
|
|
(33) |
|
|
|
(195) |
|
|
(124) |
|
|
| Distributions to noncontrolling interest holders |
|
(87) |
|
|
(74) |
|
|
|
(321) |
|
|
(287) |
|
|
| Free cash flow |
|
$ |
1,615 |
|
|
$ |
1,633 |
|
|
|
$ |
5,135 |
|
|
$ |
5,278 |
|
|
| Employee severance charges |
|
32 |
|
|
— |
|
|
|
168 |
|
|
— |
|
|
| Tax on gain from divestitures |
|
83 |
|
|
27 |
|
|
|
83 |
|
|
30 |
|
|
| Acquisition-related prepayment |
|
(48) |
|
|
— |
|
|
|
— |
|
|
— |
|
|
| IHS Markit merger costs |
|
7 |
|
|
65 |
|
|
|
35 |
|
|
376 |
|
|
| Disposition-related costs |
|
28 |
|
|
— |
|
|
|
28 |
|
|
— |
|
|
| Payment of legal costs |
|
— |
|
|
— |
|
|
|
20 |
|
|
20 |
|
|
| Executive Leadership Team transition costs |
|
— |
|
|
— |
|
|
|
12 |
|
|
— |
|
|
|
|
|
|
|
|
|
|
|
|
|
|
|
|
|
|
|
|
|
|
|
|
|
|
|
|
|
|
|
|
|
|
|
| Adjusted free cash flow excluding certain items |
|
$ |
1,717 |
|
|
$ |
1,725 |
|
|
|
$ |
5,481 |
|
|
$ |
5,704 |
|
|
| |
|
|
|
|
|
|
|
|
|
|
S&P Global Organic, Constant Currency Revenue
|
|
|
|
|
|
|
|
|
|
|
|
|
|
|
|
|
|
|
|
|
|
|
|
|
|
|
|
|
|
|
|
|
|
|
|
|
|
|
|
|
|
|
|
|
| (unaudited) |
|
Three Months |
|
|
Twelve Months |
|
|
|
2025 |
|
2024 |
|
% Change |
|
|
2025 |
|
2024 |
|
% Change |
|
| Total revenue |
|
$ |
3,916 |
|
|
$ |
3,592 |
|
|
9% |
|
|
$ |
15,336 |
|
|
$ |
14,208 |
|
|
8% |
|
| Market Intelligence acquisitions and divestitures |
|
(11) |
|
|
(2) |
|
|
|
|
|
(60) |
|
|
(81) |
|
|
|
|
| Energy acquisition |
|
— |
|
|
— |
|
|
|
|
|
(2) |
|
|
(2) |
|
|
|
|
| Indices acquisition and divestiture |
|
(1) |
|
|
— |
|
|
|
|
|
(1) |
|
|
(1) |
|
|
|
|
| Total organic revenue |
|
$ |
3,904 |
|
|
$ |
3,590 |
|
|
9% |
|
|
$ |
15,273 |
|
|
$ |
14,124 |
|
|
8% |
|
| Fx impact (favorable) |
|
25 |
|
|
— |
|
|
|
|
|
44 |
|
|
— |
|
|
|
|
| Organic revenue constant currency basis |
|
$ |
3,879 |
|
|
$ |
3,590 |
|
|
8% |
|
|
$ |
15,229 |
|
|
$ |
14,124 |
|
|
8% |
|
| |
|
|
|
|
|
|
|
|
|
|
|
|
|
|
Market Intelligence Organic, Constant Currency Revenue
|
|
|
|
|
|
|
|
|
|
|
|
|
|
|
|
|
|
|
|
|
|
|
|
|
|
|
|
|
|
|
|
|
|
|
|
|
|
|
|
|
|
|
|
|
| (unaudited) |
|
Three Months |
|
|
Twelve Months |
|
|
|
2025 |
|
2024 |
|
% Change |
|
|
2025 |
|
2024 |
|
% Change |
|
| Market Intelligence revenue |
|
$ |
1,264 |
|
|
$ |
1,186 |
|
|
7% |
|
|
$ |
4,916 |
|
|
$ |
4,645 |
|
|
6% |
|
| Acquisitions and divestitures |
|
(11) |
|
|
(2) |
|
|
|
|
|
(60) |
|
|
(81) |
|
|
|
|
| Organic revenue |
|
$ |
1,253 |
|
|
$ |
1,184 |
|
|
6% |
|
|
$ |
4,856 |
|
|
$ |
4,564 |
|
|
6% |
|
| Fx impact (favorable) |
|
4 |
|
|
— |
|
|
|
|
|
8 |
|
|
— |
|
|
|
|
| Organic revenue constant currency basis |
|
$ |
1,249 |
|
|
$ |
1,184 |
|
|
5% |
|
|
$ |
4,848 |
|
|
$ |
4,564 |
|
|
6% |
|
| |
|
|
|
|
|
|
|
|
|
|
|
|
|
|
Ratings Organic, Constant Currency Revenue
|
|
|
|
|
|
|
|
|
|
|
|
|
|
|
|
|
|
|
|
|
|
|
|
|
|
|
|
|
|
|
|
|
|
|
|
|
|
|
|
|
|
|
|
|
| (unaudited) |
|
Three Months |
|
|
Twelve Months |
|
|
|
2025 |
|
2024 |
|
% Change |
|
|
2025 |
|
2024 |
|
% Change |
|
| Ratings revenue |
|
$ |
1,187 |
|
|
$ |
1,062 |
|
|
12% |
|
|
$ |
4,724 |
|
|
$ |
4,370 |
|
|
8% |
|
| Fx impact (favorable) |
|
18 |
|
|
— |
|
|
|
|
|
35 |
|
|
— |
|
|
|
|
| Organic revenue constant currency basis |
|
$ |
1,169 |
|
|
$ |
1,062 |
|
|
10% |
|
|
$ |
4,689 |
|
|
$ |
4,370 |
|
|
7% |
|
| |
|
|
|
|
|
|
|
|
|
|
|
|
|
|
Energy Organic, Constant Currency Revenue
|
|
|
|
|
|
|
|
|
|
|
|
|
|
|
|
|
|
|
|
|
|
|
|
|
|
|
|
|
|
|
|
|
|
|
|
|
|
|
|
|
|
|
|
|
| (unaudited) |
|
Three Months |
|
|
Twelve Months |
|
|
|
2025 |
|
2024 |
|
% Change |
|
|
2025 |
|
2024 |
|
% Change |
|
| Energy revenue |
|
$ |
576 |
|
|
$ |
545 |
|
|
6% |
|
|
$ |
2,299 |
|
|
$ |
2,142 |
|
|
7% |
|
| Acquisition |
|
— |
|
|
— |
|
|
|
|
|
(2) |
|
|
(2) |
|
|
|
|
| Organic revenue |
|
$ |
576 |
|
|
$ |
545 |
|
|
6% |
|
|
$ |
2,297 |
|
|
$ |
2,140 |
|
|
7% |
|
| Fx impact |
|
— |
|
|
— |
|
|
|
|
|
— |
|
|
— |
|
|
|
|
| Organic revenue constant currency basis |
|
$ |
576 |
|
|
$ |
545 |
|
|
6% |
|
|
$ |
2,297 |
|
|
$ |
2,140 |
|
|
7% |
|
|
|
|
|
|
|
|
|
|
|
|
|
|
|
|
Mobility Organic, Constant Currency Revenue
|
|
|
|
|
|
|
|
|
|
|
|
|
|
|
|
|
|
|
|
|
|
|
|
|
|
|
|
|
|
|
|
|
|
|
|
|
|
|
|
|
|
|
|
|
| (unaudited) |
|
Three Months |
|
|
Twelve Months |
|
|
|
2025 |
|
2024 |
|
% Change |
|
|
2025 |
|
2024 |
|
% Change |
|
| Mobility revenue |
|
$ |
444 |
|
|
$ |
411 |
|
|
8% |
|
|
$ |
1,747 |
|
|
$ |
1,609 |
|
|
9% |
|
| Fx impact (favorable/unfavorable) |
|
1 |
|
|
— |
|
|
|
|
|
(1) |
|
|
— |
|
|
|
|
| Organic revenue constant currency basis |
|
$ |
443 |
|
|
$ |
411 |
|
|
8% |
|
|
$ |
1,748 |
|
|
$ |
1,609 |
|
|
9% |
|
| |
|
|
|
|
|
|
|
|
|
|
|
|
|
|
Indices Organic, Constant Currency Revenue
|
|
|
|
|
|
|
|
|
|
|
|
|
|
|
|
|
|
|
|
|
|
|
|
|
|
|
|
|
|
|
|
|
|
|
|
|
|
|
|
|
|
|
|
|
| (unaudited) |
|
Three Months |
|
|
Twelve Months |
|
|
|
2025 |
|
2024 |
|
% Change |
|
|
2025 |
|
2024 |
|
% Change |
|
| Indices revenue |
|
$ |
498 |
|
|
$ |
436 |
|
|
14% |
|
|
$ |
1,850 |
|
|
$ |
1,628 |
|
|
14% |
|
| Acquisition and divestiture |
|
(1) |
|
|
— |
|
|
|
|
|
(1) |
|
|
(1) |
|
|
|
|
| Organic revenue |
|
497 |
|
|
436 |
|
|
14% |
|
|
1,849 |
|
|
1,627 |
|
|
14% |
|
| Fx impact (favorable) |
|
1 |
|
|
— |
|
|
|
|
|
2 |
|
|
— |
|
|
|
|
| Organic revenue constant currency basis |
|
$ |
496 |
|
|
$ |
436 |
|
|
14% |
|
|
$ |
1,847 |
|
|
$ |
1,627 |
|
|
13% |
|
| |
|
|
|
|
|
|
|
|
|
|
|
|
|
|
Note - The impact of foreign exchange rates refers to constant currency comparisons estimated by recalculating current year results of foreign operations using the average exchange rate from the prior year.