UNITED STATES
SECURITIES AND EXCHANGE COMMISSION
Washington, D.C. 20549
FORM 8-K
CURRENT REPORT
Pursuant to Section 13 or 15(d) of the Securities Exchange Act of 1934
May 9, 2023
Date of Report (Date of earliest event reported)
Lincoln National Corporation
(Exact name of registrant as specified in its charter)
|
|
|
|
|
Indiana |
|
1-6028 |
|
35-1140070 |
(State or other jurisdiction |
|
(Commission |
|
(IRS Employer |
of incorporation) |
|
File Number) |
|
Identification No.) |
150 N. Radnor Chester Road, Radnor, PA 19087
(Address of principal executive offices) (Zip Code)
Registrant’s telephone number, including area code: (484) 583-1400
Check the appropriate box below if the Form 8-K filing is intended to simultaneously satisfy the filing obligation of the registrant under any of the following provisions:
[ ] Written communications pursuant to Rule 425 under the Securities Act (17 CFR 230.425)
[ ] Soliciting material pursuant to Rule 14a-12 under the Exchange Act (17 CFR 240.14a-12)
[ ] Pre-commencement communications pursuant to Rule 14d-2(b) under the Exchange Act (17 CFR 240.14d-2(b))
[ ] Pre-commencement communications pursuant to Rule 13e-4(c) under the Exchange Act (17 CFR 240.13e-4(c))
__________________________________
Securities registered pursuant to Section 12(b) of the Act:
|
|
|
Title of each class |
Trading symbol(s) |
Name of each exchange on which registered |
Common Stock |
LNC |
New York Stock Exchange |
Depositary Shares, each representing a 1/1000th interest in a share of 9.000% Non-Cumulative Preferred Stock, Series D |
LNC PRD |
New York Stock Exchange |
__________________________________
Indicate by check mark whether the registrant is an emerging growth company as defined in Rule 405 of the Securities Act of 1933 (§230.405 of this chapter) or Rule 12b-2 of the Securities Exchange Act of 1934 (§240.12b-2 of this chapter).
Emerging growth company [ ]
If an emerging growth company, indicate by check mark if the registrant has elected not to use the extended transition period for complying with any new or revised financial accounting standards provided pursuant to Section 13(a) of the Exchange Act. [ ]
Item 2.02. Results of Operations and Financial Condition.
On May 9, 2023, Lincoln National Corporation (the “Company”) issued a press release announcing its financial results for the quarter ended March 31, 2023, a copy of which is attached as Exhibit 99.1 and is incorporated herein by reference. The Company’s statistical supplement for the quarter ended March 31, 2023, is attached as Exhibit 99.2 and is incorporated herein by reference.
The information, including exhibits attached hereto, furnished under this Item 2.02 shall not be deemed “filed” for the purposes of Section 18 of the Securities Exchange Act of 1934, as amended, or otherwise subject to the liabilities of that Section. The information in this Current Report shall not be incorporated by reference into any registration statement or other document pursuant to the Securities Act of 1933, as amended, except as otherwise expressly stated in such filing.
Item 7.01. Regulation FD Disclosure.
On May 9, 2023, in connection with the Company’s first quarter 2023 earnings conference call scheduled for May 10, 2023, the Company made available on its website a first quarter 2023 investment supplement presentation, a copy of which is attached hereto as Exhibit 99.3 and is incorporated herein by reference.
This presentation is being furnished under this Item 7.01 and shall not be deemed “filed” for the purposes of Section 18 of the Exchange Act or otherwise subject to the liabilities of that Section. The information in Exhibit 99.3 shall not be incorporated by reference into any registration statement or other document pursuant to the Securities Act, except as otherwise expressly stated in such filing.
Item 9.01. Financial Statements and Exhibits.
(d)Exhibits.
The following exhibits are being furnished with this Form 8-K.
|
|
|
|
Exhibit Number |
Description |
99.1 |
|
99.2 |
Lincoln National Corporation Statistical Supplement for the quarter ended March 31, 2023. |
99.3 |
|
|
|
|
|
SIGNATURES
Pursuant to the requirements of the Securities Exchange Act of 1934, the Registrant has duly caused this report to be signed on its behalf by the undersigned hereunto duly authorized.
|
|
|
|
|
|
|
|
|
|
LINCOLN NATIONAL CORPORATION |
|
|
|
|
|
|
|
|
|
|
|
By |
/s/ Adam Cohen |
|
|
|
|
Name: |
Adam Cohen |
|
|
|
|
Title: |
Senior Vice President and Chief |
|
|
|
|
|
Accounting Officer |
Date: May 9, 2023

FOR IMMEDIATE RELEASE
LINCOLN FINANCIAL GROUP REPORTS FIRST QUARTER 2023 RESULTS
____________________________________
|
v |
Net loss available to common stockholders of $(5.37) per diluted share includes unfavorable impacts from the new accounting for market risk benefits (“MRBs”) as a result of the recent adoption of Accounting Standards Update 2018-12 (“LDTI”) |
|
v |
Adjusted operating income available to common stockholders of $1.52 per diluted share |
|
v |
Executing on our objectives to rebuild capital and increase ongoing free cash flow |
|
v |
Delivered robust level of sales while shifting to a more capital-efficient product mix |
|
v |
High-quality and diversified investment portfolio is well-positioned |
Radnor, PA, May 9, 2023 – Lincoln Financial Group (NYSE: LNC) today reported a net loss available to common stockholders for the first quarter of 2023 of $(909) million, or $(5.37) per diluted share, compared to net income available to common stockholders in the first quarter of 2022 of $1,481 million, or $8.39 per diluted share. The net loss available to common stockholders this quarter was primarily driven by unfavorable impacts from a portion of the MRB and hedge instrument fair value changes. A favorable portion of the MRB fair value change flowed through AOCI, approximately offsetting the impact to total stockholders’ equity.
First quarter adjusted income from operations available to common stockholders was $260 million, or $1.52 per diluted share, compared to adjusted income from operations available to common stockholders of $273 million, or $1.55 per diluted share, in the first quarter of 2022.
“We are continuing to take swift action and I am pleased with the substantial progress we have made to rebuild capital and increase our ongoing pace of capital generation,” said Ellen Cooper, president and CEO of Lincoln Financial Group. “We are delivering profitable new-business growth with a more capital-efficient product mix in 2023 across our retail and workplace solutions businesses, while maintaining a robust level of sales. Last week’s announcement of our $28 billion block reinsurance transaction with Fortitude Re is an important step to further advance our enterprise strategic objectives and continue bolstering the balance sheet. While we are experiencing earnings headwinds in 2023, as we continue to execute, I remain confident that the earnings power of the business will begin to re-emerge more materially in 2024 and beyond.”
|
|
As of or For the |
||||
|
|
Three Months Ended |
||||
|
|
March 31, |
||||
|
(in millions, except per share data) |
2023 |
2022 |
|||
|
Net Income (Loss) |
$ |
(881) |
$ |
1,482 | |
|
Net Income (Loss) Available to Common Stockholders |
(909) | 1,481 | |||
|
Net Income (Loss) per Diluted Share Available to Common Stockholders (1) |
(5.37) | 8.39 | |||
|
Revenues |
3,814 | 4,720 | |||
|
Adjusted Income (Loss) from Operations |
288 | 274 | |||
|
Adjusted Income (Loss) from Operations Available to Common Stockholders |
260 | 273 | |||
|
Adjusted Income (Loss) from Operations per Diluted Share Available to |
|||||
|
Common Stockholders |
1.52 | 1.55 | |||
|
Average Basic Shares |
169.4 | 174.2 | |||
|
Average Diluted Shares |
170.5 | 176.4 | |||
|
Net Income (Loss) Return on Equity ("ROE") |
-59.6% |
34.7% | |||
|
Adjusted Income (Loss) from Operations Available to Common Stockholders, |
|||||
|
Excluding AOCI and Preferred Stock ROE |
10.4% | 10.5% | |||
|
Adjusted Income (Loss) from Operations ROE |
9.5% | 8.4% | |||
|
Book Value per Share (BVPS), Including AOCI |
$ |
33.89 |
$ |
82.93 | |
|
Book Value per Share, Excluding AOCI |
56.04 | 63.64 | |||
|
Adjusted Book Value per Share |
66.05 | 75.77 | |||
|
|
|||||
|
(1) In periods where a net loss or adjusted loss from operations is presented, basic shares are used in the diluted EPS and adjusted diluted EPS |
|||||
|
calculations, as the use of diluted shares would result in a lower loss per share. Prior year numbers have been restated to reflect LDTI |
|||||
|
accounting. |
|||||
Operating Highlights – First Quarter 2023
|
· |
Annuities deposits of $3.2 billion, up 17% from the prior-year quarter |
|
· |
Shifting and reducing Life Insurance sales, driven by a more capital-efficient mix with sales down 16% |
|
· |
Group Protection operating margin of 5.6%, with a loss ratio of 75% |
|
· |
Retirement Plan Services trailing-twelve months positive net flows of $2.3 billion |
There were no notable items within adjusted income from operations for the current quarter or the prior-year quarter. First quarter 2023 adjusted operating income available to common stock shareholders per diluted share included:
|
· |
A favorable impact of $0.06 in Annuities related to a dividends received deduction true-up, |
|
· |
Alternative investment income $(0.11) below a targeted 10% long-term annualized return, and |
|
· |
Prepayment income of $0.02. |
Adjusted operating income available to common stock shareholders per diluted share for the prior-year period included:
|
· |
An unfavorable impact of $(0.11) from one-time claims adjustments in Group Protection, |
|
· |
Alternative investment income in line with a targeted 10% long-term annualized return, and |
|
· |
Prepayment income of $0.23. |
First Quarter 2023 – Segment Results
Annuities
Annuities reported income from operations of $274 million, down 14% compared to the prior-year quarter. The decrease was primarily due to lower fee income driven by unfavorable capital markets, partially offset by a favorable tax adjustment in the current quarter.
Total annuity deposits of $3.2 billion were up 17% from the prior-year quarter as sales growth in fixed annuities and indexed variable annuities more than offset a decline in sales of traditional variable annuities. Net outflows were $331 million in the quarter compared to net outflows of $525 million in the prior-year quarter.
Average account balances for the quarter of $146 billion were down 9% from the prior-year quarter, primarily driven by unfavorable capital markets. Variable annuities with living benefits represented 46% of total annuity account balances, a decrease of four percentage points compared to the prior-year quarter.
Life Insurance
Life Insurance reported a loss from operations of $(13) million compared to income of $23 million in the prior-year quarter. The decrease was primarily driven by the run-rate impact from the company’s third quarter 2022 annual review of DAC and reserve assumptions and lower alternative investment income, prepayment income and base spreads, partially offset by an improvement in COVID-19 mortality experience.
Total Life sales for the quarter were $130 million compared to $155 million in the prior-year quarter, driven primarily by the shift to a more capital-efficient product mix with lower sales of Variable Universal Life, Executive Benefits and Term products, partially offset by increased sales of Indexed Universal Life products.
Average Life Insurance in-force of $1.1 trillion increased 9% over the prior-year quarter. For the quarter, average account balances were $49 billion, down 4% compared to the prior-year quarter.
Group Protection
Group Protection reported income from operations of $71 million in the quarter compared to a loss from operations of $46 million in the prior-year quarter. The increase was primarily driven by improved disability underwriting results and lower COVID-19 mortality claims.
The total loss ratio was 75% in the current quarter compared to 89% in the prior-year quarter with the decrease driven primarily by better disability incidence and resolutions and lower life claims. The operating margin expanded 950 basis points from the prior-year quarter to 5.6%.
Group Protection sales for the quarter were $128 million, up 22% compared to the prior-year quarter. Supplemental Health products represented 24% of total Group Protection sales, compared to 9% in the prior-year quarter.
Insurance premiums of $1.3 billion in the quarter were up 7% compared to the prior-year quarter.
Retirement Plan Services
Retirement Plan Services reported income from operations of $43 million, down 26% compared to the prior-year quarter. The decrease was primarily driven by lower prepayment income and higher expenses, partly offset by the earnings impact related to positive net flows and higher base spreads.
Total deposits for the quarter of $3.2 billion were down 12% compared to the prior-year quarter. Net flows totaled $535 million for the quarter, contributing to trailing-twelve months’ net flows of $2.3 billion.
Average account balances for the quarter of $91 billion were down 5% from the prior-year quarter primarily driven by lower equity markets.
Other Operations
Other Operations reported a loss from operations of $87 million versus a loss of $78 million in the prior-year quarter.
First Quarter Highlights - Realized Gains and Losses / Impacts to Net Income
Realized gains/losses and other impacts to net income (after-tax) in the quarter were primarily driven by:
|
· |
A $506 million loss associated with unfavorable impacts from a portion of the MRB fair value change, as a result of the adoption of LDTI. A favorable portion of the MRB fair value change flowed through AOCI more than offsetting the impact to total stockholders’ equity. |
|
· |
A $377 million loss associated with changes in the fair value of Guaranteed Living Benefits and Guaranteed Death Benefits hedge instruments, net of hedge allowance. |
|
· |
$49 million of net realized credit losses. |
Unrealized Gains and Losses
The company reported a net unrealized loss of $(9.6) billion, pre-tax, on its available-for-sale securities at March 31, 2023. This compares to a net unrealized gain of $3.1 billion, pre-tax, at March 31, 2022, with the year-over-year decrease primarily driven by higher treasury rates.
Share Count
The quarter’s average diluted share count of 170.5 million was down 3% from the first quarter of 2022, the result of repurchasing 2.8 million shares of stock at a cost of $150 million since March 31, 2022.
Book Value
Versus the prior-year period, as of March 31, 2023, book value per share, including AOCI, decreased 59% to $33.89, book value per share, excluding AOCI, decreased 12% to $56.04 and adjusted book value per share decreased 13% to $66.05.
The tables attached to this release define and reconcile the non-GAAP measures adjusted income (loss) from operations, adjusted income (loss) from operations available to common stockholders, adjusted income (loss) from operations available to common stockholders, excluding AOCI and preferred stock ROE, adjusted income from operations ROE, BVPS, excluding AOCI, and adjusted BVPS to net income (loss), net income (loss) available to common stockholders, net income (loss) ROE and BVPS, including AOCI, calculated in accordance with GAAP.
This press release contains statements that are forward-looking, and actual results may differ materially. Please see the Forward-looking Statements – Cautionary Language at the end of this release for factors that may cause actual results to differ materially from the company’s current expectations.
For other financial information, please refer to the company’s first quarter 2023 statistical supplement and investment portfolio supplement available on its website http://www.lincolnfinancial.com/investor.
Conference Call Information
Lincoln Financial Group will discuss the company’s first quarter results with investors in a conference call beginning at 10:00 a.m. Eastern Time on Wednesday, May 10, 2023.
The conference call will be broadcast live through the company website at www.lincolnfinancial.com/webcast. Please log on to the webcast at least 15 minutes prior to the start of the conference call to download and install any necessary streaming media software. A replay of the call will be available by 1:00 p.m. Eastern Time on May 10, 2023 at www.lincolnfinancial.com/webcast.
About Lincoln Financial Group
Lincoln Financial Group provides advice and solutions that help people take charge of their financial lives with confidence and optimism. Today, approximately 16 million customers trust our retirement, insurance and wealth protection expertise to help address their lifestyle, savings and income goals, and guard against long-term care expenses. Headquartered in Radnor, Pennsylvania, Lincoln Financial Group is the marketing name for Lincoln National Corporation (NYSE:LNC) and its affiliates.
The company had $280 billion in end-of-period account balances net of reinsurance as of December 31, 2022. Lincoln Financial Group is a committed corporate citizen included on major sustainability indices including the Dow Jones Sustainability Index North America and ranks among Newsweek’s Most Responsible Companies. Dedicated to diversity, equity and inclusion, we are included on transparency benchmarking tools such as the Corporate Equality Index, the Disability Equality Index and the Bloomberg Gender-Equality Index. Committed to providing our employees with flexible work arrangements, we were named to FlexJobs’ list of the Top 100 Companies to Watch for Remote Jobs in 2022. With a long and rich legacy of acting ethically, telling the truth and speaking up for what is right, Lincoln was recognized as one of Ethisphere’s 2022 World’s Most Ethical Companies®. We create opportunities for early career talent through our intern development program, which ranks among WayUp and Yello’s annual list of Top 100 Internship Programs. Learn more at: www.LincolnFinancial.com. Follow us on Facebook, Twitter, LinkedIn, and Instagram. Sign up for email alerts at http://newsroom.lfg.com.
Explanatory Notes on Use of Non-GAAP Measures
Management believes that adjusted income from operations (or adjusted operating income), adjusted income from operations available to common stockholders, adjusted income from operations available to common stockholders, excluding AOCI and preferred stock ROE, adjusted income from operations ROE, adjusted operating revenues, and adjusted income from operations per diluted share available to common stockholders better explain the results of the company’s ongoing businesses in a manner that allows for a better understanding of the underlying trends in the company’s current business because the excluded items are unpredictable and not necessarily indicative of current operating fundamentals or future performance of the business segments, and, in most instances, decisions regarding these items do not necessarily relate to the operations of the individual segments. Management also believes that using book value, excluding accumulated other comprehensive income (“AOCI”) , and adjusted book value per share enables investors to analyze the amount of our net worth that is primarily attributable to our business operations. Book value per share, excluding AOCI is useful to investors because it eliminates the effect of items that are unpredictable and can fluctuate significantly from period to period, primarily based on changes in interest rates. Adjusted book value per share is useful to investors because it eliminates the effect of items that are unpredictable and can fluctuate significantly from period to period, primarily based on changes in equity markets and interest rates.
For the historical periods, reconciliations of non-GAAP measures used in this press release to the most directly comparable GAAP measure may be included in this Appendix to the press release and/or are included in the Statistical Reports for the corresponding periods contained in the Earnings section of the Investor Relations page on our website: www.lfg.com/investor.
Definitions of Non-GAAP Measures Used in this Press Release
Adjusted income (loss) from operations, adjusted income (loss) from operations available to common stockholders, adjusted operating revenues, adjusted income (loss) from operations available to common stockholders, excluding AOCI and preferred stock ROE and adjusted income (loss) from operations ROE (in each case including and excluding the effect of average goodwill), BVPS, excluding AOCI, and adjusted BVPS are financial measures we use to evaluate and assess our results. Adjusted income (loss) from operations, adjusted income (loss) from operations available to common stockholders, adjusted operating revenues, adjusted income (loss) from operations available to common stockholders, excluding AOCI and preferred stock ROE, adjusted income (loss) from operations ROE, BVPS, excluding AOCI, and adjusted BVPS, as used in the press release, are non-GAAP financial measures and do not replace GAAP net income (loss), net income (loss) available to common stockholders, revenues, net income (loss) ROE and BVPS, including AOCI, the most directly comparable GAAP measures.
Adjusted Income (Loss) from Operations
Adjusted income (loss) from operations is GAAP net income (loss) excluding the after-tax effects of the following items, as applicable:
|
· |
Changes in market risk benefits (“MRBs”), including gains and losses and benefit payments (“MRB-related impacts”); |
|
· |
Investment and reinsurance-related realized gain (loss): |
|
o |
Changes in the carrying value of mortgage loans on real estate attributable to current expected credit losses (“CECL”) (“changes in CECL reserve for mortgage loans on real estate”); |
|
o |
Changes in the carrying value of reinsurance-related assets attributable to CECL (“changes in CECL reserve for reinsurance-related assets”); |
|
o |
Changes in the carrying value of fixed maturity AFS securities attributable to the estimation of credit losses (“changes in the credit loss allowance for fixed maturity AFS securities”); and |
|
o |
Changes in the fair value of investments, including trading securities, equity securities, certain derivatives, and mortgage loans on real estate electing the fair value option, and of embedded derivatives within certain reinsurance arrangements, as well as sales or disposals of investments (“changes in investments and reinsurance-related embedded derivatives”); |
|
· |
Changes in the fair value of the derivative instruments we hold to hedge GLB and GDB riders, net of fee income allocated to support the cost of hedging them (“changes in fair value of GLB and GDB hedge instruments, net of hedge allowance”); |
|
· |
Changes in the fair value of the embedded derivative liabilities of our indexed annuity and indexed universal life insurance contracts and the associated index options we hold to hedge them, including collateral expense associated with hedge programs; (“indexed product net derivative results”); |
|
· |
Changes in reserves resulting from benefit ratio unlocking on variable universal life insurance products with secondary guarantees (“benefit ratio unlocking”); |
|
· |
Income (loss) from the initial adoption of new accounting standards, regulations and policy changes; |
|
· |
Income (loss) from reserve changes, net of related amortization, on business sold through reinsurance; |
|
· |
Transaction and integration costs related to mergers and acquisitions including the acquisition or divestiture, through reinsurance or other means, of businesses or blocks of business; |
|
· |
Gains (losses) on modification or early extinguishment of debt; |
|
· |
Losses from the impairment of intangible assets and gains (losses) on other non-financial assets; and |
|
· |
Income (loss) from discontinued operations. |
Adjusted Income (Loss) from Operations Available to Common Stockholders
Adjusted income (loss) from operations available to common stockholders is defined as after-tax adjusted income (loss) from operations less preferred stock dividends and the adjustment for deferred units of LNC stock in our deferred compensation plans.
Adjusted Operating Revenues
Adjusted operating revenues represent GAAP revenues excluding the pre-tax effects of the following items, as applicable:
|
· |
Investment and reinsurance-related realized gain (loss); |
|
· |
Changes in fair value of GLB and GDB hedge instruments, net of hedge allowance; |
|
· |
Indexed product net derivative results; |
|
· |
Revenue adjustments from the initial adoption of new accounting standards; and |
|
· |
Amortization of deferred gains arising from reserve changes on business sold through reinsurance. |
Adjusted Income (Loss) From Operations Available to Common Stockholders, Excluding AOCI and Preferred Stock ROE
Adjusted income (loss) from operations available to common stockholders, excluding AOCI and preferred stock ROE measures how efficiently we generate profits from the resources provided by our net assets.
|
· |
It is calculated by dividing annualized adjusted income (loss) from operations available to common stockholders by average stockholders’ equity, excluding AOCI and preferred stock. |
|
· |
Management believes this metric is useful to investors because it eliminates the effect of market movements on ROE that are unpredictable and can fluctuate significantly from period to period, primarily related to changes in interest rates. |
|
· |
Management evaluates ROE by both including and excluding the effect of average goodwill. |
Adjusted Income (Loss) from Operations ROE
Adjusted income (loss) from operations ROE is calculated based upon a non-GAAP financial measure.
|
· |
It is calculated by dividing annualized adjusted income (loss) from operations available to common stockholders by adjusted average stockholders’ equity. |
|
· |
Management believes this metric is useful to investors because it eliminates the effect of market movements on ROE that are unpredictable and can fluctuate significantly from period to period, primarily related to changes in equity markets and interest rates. |
|
· |
Management evaluates ROE by both including and excluding the effect of average goodwill. |
Book Value Per Share, Excluding AOCI
Book value per share, excluding AOCI, is calculated based upon a non-GAAP financial measure.
|
|
It is calculated by dividing (a) stockholders’ equity, excluding AOCI and preferred stock by (b) common shares outstanding. |
|
|
We provide book value per share, excluding AOCI, to enable investors to analyze the amount of our net worth that is primarily attributable to our business operations. |
|
|
Management believes book value per share, excluding AOCI, is useful to investors because it eliminates the effect of items that can fluctuate significantly from period to period, primarily based on changes in interest rates. |
|
|
Book value per share is the most directly comparable GAAP measure. |
Adjusted Book Value Per Share
Adjusted book value per share is calculated based upon a non-GAAP financial measure.
|
· |
It is calculated by dividing (a) stockholders’ equity, excluding AOCI, preferred stock and MRB-related impacts by (b) common shares outstanding. |
|
· |
We provide adjusted book value per share to enable investors to analyze the amount of our net worth that is primarily attributable to our business operations. |
|
· |
Management believes adjusted book value per share is useful to investors because it eliminates the effect of market movements that are unpredictable that can fluctuate significantly from period to period, primarily based on changes in equity markets and interest rates. |
|
· |
Book value per share is the most directly comparable GAAP measure. |
Definition of Notable Items
Notable items are items which, in management’s view, do not reflect the company’s normal, ongoing operations.
|
· |
We believe highlighting notable items included in adjusted income (loss) from operations enables investors to better understand the fundamental trends in its results of operations and financial condition. |
Special Note
Sales
Sales as reported consist of the following:
|
· |
Universal life insurance (“UL”), indexed universal life insurance (“IUL”), variable universal life insurance (“VUL”) – first-year commissionable premiums plus 5% of excess premiums received; |
|
· |
MoneyGuard® linked-benefit products – MoneyGuard® (UL), 15% of total expected premium deposits, and MoneyGuard Market AdvantageSM (VUL), 150% of commissionable premiums; |
|
· |
Executive Benefits – insurance and corporate-owned UL and VUL, first-year commissionable premiums plus 5% of excess premium received, and single premium bank-owned UL and VUL, 15% of single premium deposits; |
|
· |
Term – 100% of annualized first-year premiums; |
|
· |
Annuities and Retirement Plan Services – deposits from new and existing customers; and |
|
· |
Group Protection – annualized first-year premiums from new policies. |
Lincoln National Corporation
Reconciliation of Net Income to Adjusted Income from Operations
|
|
For the |
|||||
|
(in millions, except per share data) |
Three Months Ended |
|||||
|
|
March 31, |
|||||
|
|
2023 |
2022 |
||||
|
|
||||||
|
Net Income (Loss) Available to Common |
||||||
|
Stockholders – Diluted |
$ |
(909) |
$ |
1,481 | ||
|
Less: |
||||||
|
Preferred stock dividends declared |
(25) |
- |
||||
|
Adjustment for deferred units of LNC stock in our |
||||||
|
deferred compensation plans (1) |
(3) | (1) | ||||
|
Net Income (Loss) |
(881) | 1,482 | ||||
|
Less: |
||||||
|
MRB-related impacts, after-tax |
(506) | 1,062 | ||||
|
Investment and reinsurance-related realized gain (loss), after-tax |
(154) | 1 | ||||
|
Changes in fair value of GLB and GDB hedge instruments, net of hedge allowance, after-tax |
(377) | 58 | ||||
|
Indexed product net derivative results, after-tax |
(135) | 87 | ||||
|
Benefit ratio unlocking, after-tax |
3 |
- |
||||
|
Total adjustments |
(1,169) | 1,208 | ||||
|
Adjusted Income (Loss) from Operations |
$ |
288 |
$ |
274 | ||
|
|
||||||
|
Earnings (Loss) Per Common Share – Diluted (2) |
||||||
|
Net income (loss) (2) |
$ |
(5.37) |
$ |
8.39 | ||
|
Adjusted income (loss) from operations |
1.52 | 1.55 | ||||
|
|
||||||
|
Stockholders’ Equity, Average |
||||||
|
Stockholders' equity |
$ |
5,917 |
$ |
17,085 | ||
|
Less: |
||||||
|
Preferred stock |
986 |
- |
||||
|
AOCI |
(5,053) | 6,650 | ||||
|
Stockholders’ equity, excluding AOCI and preferred stock |
9,984 | 10,435 | ||||
|
MRB-related impacts |
(905) | (2,616) | ||||
|
GLB and GDB hedge instruments gains (losses) (3) |
(269) |
N/A |
||||
|
Adjusted average stockholders' equity |
$ |
11,158 |
$ |
13,051 | ||
|
|
||||||
|
|
||||||
|
Return on Equity |
||||||
|
Net income (loss) ROE |
-59.6% |
34.7% | ||||
|
Adjusted income (loss) from operations available to common stockholders, |
||||||
|
excluding AOCI and preferred stock ROE |
10.4% | 10.5% | ||||
|
Adjusted income (loss) from operations ROE |
9.5% | 8.4% | ||||
|
|
||||||
|
(1) We exclude deferred units of LNC stock that are antidilutive from our diluted earnings per share calculation. |
||||||
|
(2) In periods where a net loss or adjusted loss from operations is presented, basic shares are used in the diluted EPS and adjusted diluted EPS |
||||||
|
calculations, as the use of diluted shares would result in a lower loss per share. |
||||||
|
(3) For periods beginning on or after January 1, 2023, gains (losses) on our GLB and GDB hedge instruments are excluded from adjusted |
||||||
|
stockholders' equity to align to the updated hedge program. |
||||||
|
|
||||||
|
|
||||||
Lincoln National Corporation
Reconciliation of Book Value per Share
|
|
As of March 31, |
||||
|
|
2023 |
2022 |
|||
|
Book Value Per Common Share |
|||||
|
Book value per share |
$ |
33.89 |
$ |
82.93 | |
|
Less: |
|||||
|
AOCI |
(22.15) | 19.29 | |||
|
Book value per share, excluding AOCI |
56.04 | 63.64 | |||
|
Less: |
|||||
|
MRB-related gains (losses) |
(6.83) | (12.13) | |||
|
GLB and GDB hedge instruments gains (losses)(1) |
(3.18) |
N/A |
|||
|
Adjusted book value per share |
$ |
66.05 |
$ |
75.77 | |
|
|
|||||
|
(1) For periods beginning on or after January 1, 2023, gains (losses) on our GLB and GDB hedge instruments are excluded from adjusted |
|||||
|
stockholders' equity to align to the updated hedge program. |
|||||
Lincoln National Corporation
Digest of Earnings
|
|
|||||
|
|
For the |
||||
|
(in millions, except per share data) |
Three Months Ended |
||||
|
|
March 31, |
||||
|
|
2023 |
2022 |
|||
|
|
|||||
|
Revenues |
$ |
3,814 |
$ |
4,720 | |
|
|
|||||
|
Net Income (Loss) |
$ |
(881) |
$ |
1,482 | |
|
Preferred stock dividends declared |
(25) |
- |
|||
|
Adjustment for deferred units of LNC stock in our |
|||||
|
deferred compensation plans (1) |
(3) | (1) | |||
|
Net Income (Loss) Available to Common |
|||||
|
Stockholders – Diluted |
$ |
(909) |
$ |
1,481 | |
|
|
|||||
|
Earnings (Loss) Per Common Share – Basic |
$ |
(5.35) |
$ |
8.50 | |
|
Earnings (Loss) Per Common Share – Diluted (2) |
(5.37) | 8.39 | |||
|
|
|||||
|
Average Shares – Basic |
169,357,846 | 174,153,475 | |||
|
Average Shares – Diluted |
170,485,160 | 176,434,549 | |||
|
|
|||||
|
|
|||||
|
(1) We exclude deferred units of LNC stock that are antidilutive from our diluted earnings per share calculation. |
|||||
|
(2) In periods where a net loss or adjusted loss from operations is presented, basic shares are used in the diluted EPS and adjusted diluted |
|||||
|
EPS calculations, as the use of diluted shares would result in a lower loss per share. |
|||||
|
|
|||||
FORWARD-LOOKING STATEMENTS – CAUTIONARY LANGUAGE
Certain statements made in this press release and in other written or oral statements made by Lincoln or on Lincoln’s behalf are “forward-looking statements” within the meaning of the Private Securities Litigation Reform Act of 1995 (“PSLRA”). A forward-looking statement is a statement that is not a historical fact and, without limitation, includes any statement that may predict, forecast, indicate or imply future results, performance or achievements. Forward-looking statements may contain words like: “anticipate,” “believe,” “estimate,” “expect,” “project,” “shall,” “will” and other words or phrases with similar meaning in connection with a discussion of future operating or financial performance. In particular, these include statements relating to future actions, trends in Lincoln’s businesses, prospective services or products, future performance or financial results and the outcome of contingencies, such as legal proceedings. Lincoln claims the protection afforded by the safe harbor for forward-looking statements provided by the PSLRA.
Forward-looking statements are subject to risks and uncertainties. Actual results could differ materially from those expressed in or implied by such forward-looking statements due to a variety of factors, including:
|
· |
Weak general economic and business conditions that may affect demand for our products, account balances, investment results, guaranteed benefit liabilities, premium levels and claims experience; |
|
· |
Adverse global capital and credit market conditions that may affect our ability to raise capital, if necessary, and may cause us to realize impairments on investments and certain intangible assets, including goodwill and the valuation allowance against deferred tax assets, which may reduce future earnings and/or affect our financial condition and ability to raise additional capital or refinance existing debt as it matures; |
|
· |
The inability of our subsidiaries to pay dividends to the holding company in sufficient amounts, which could harm the holding company’s ability to meet its obligations; |
|
· |
Legislative, regulatory or tax changes, both domestic and foreign, that affect: the cost of, or demand for, our subsidiaries’ products; the required amount of reserves and/or surplus; our ability to conduct business and our captive reinsurance arrangements as well as restrictions on the payment of revenue sharing and 12b-1 distribution fees; |
|
· |
The impact of U.S. federal tax reform legislation on our business, earnings and capital; |
|
· |
The impact of regulations adopted by the Securities and Exchange Commission (“SEC”), the Department of Labor or other federal or state regulators or self-regulatory organizations relating to the standard of care owed by investment advisers and/or broker-dealers that could affect our distribution model; |
|
· |
The impact of new and emerging privacy regulations that may lead to increased compliance costs and reputation risk; |
|
· |
Increasing scrutiny and evolving expectations and regulations regarding ESG matters that may adversely affect our reputation and our investment portfolio; |
|
· |
Actions taken by reinsurers to raise rates on in-force business; |
|
· |
Declines in or sustained low interest rates causing a reduction in investment income, the interest margins of our businesses and demand for our products; |
|
· |
Rapidly increasing interest rates causing policyholders to surrender life insurance and annuity policies, thereby causing realized investment losses; |
|
· |
The impact of the implementation of the provisions of the European Market Infrastructure Regulation relating to the regulation of derivatives transactions; |
|
· |
The initiation of legal or regulatory proceedings against us, and the outcome of any legal or regulatory proceedings, such as: adverse actions related to present or past business practices common in businesses in which we compete; adverse decisions in significant actions including, but not limited to, actions brought by federal and state authorities and class action cases; new decisions that result in changes in law; and unexpected trial court rulings; |
|
· |
A decline or continued volatility in the equity markets causing a reduction in the sales of our subsidiaries’ products; a reduction of asset-based fees that our subsidiaries charge on various investment and insurance products; and an increase in liabilities related to guaranteed benefit riders, which are accounted for as market risk benefits, of our subsidiaries’ variable annuity products; |
|
· |
Ineffectiveness of our risk management policies and procedures, including our various hedging strategies; |
|
· |
A deviation in actual experience regarding future policyholder behavior, mortality, morbidity, interest rates or equity market returns from the assumptions used in pricing our subsidiaries’ products and in establishing related insurance reserves, which may reduce future earnings; |
|
· |
Changes in accounting principles that may affect our consolidated financial statements; |
|
· |
Lowering of one or more of our debt ratings issued by nationally recognized statistical rating organizations and the adverse effect such action may have on our ability to raise capital and on our liquidity and financial condition; |
|
· |
Lowering of one or more of the insurer financial strength ratings of our insurance subsidiaries and the adverse effect such action may have on the premium writings, policy retention, profitability of our insurance subsidiaries and liquidity; |
|
· |
Significant credit, accounting, fraud, corporate governance or other issues that may adversely affect the value of certain financial assets, as well as counterparties to which we are exposed to credit risk, requiring that we realize losses on financial assets; |
|
· |
Interruption in telecommunication, information technology or other operational systems or failure to safeguard the confidentiality or privacy of sensitive data on such systems, including from cyberattacks or other breaches of our data security systems; |
|
· |
The effect of acquisitions and divestitures, restructurings, product withdrawals and other unusual items; |
|
· |
The inability to realize or sustain the benefits we expect from, greater than expected investments in, and the potential impact of efforts related to, our strategic initiatives, including the Spark Initiative; |
|
· |
The adequacy and collectability of reinsurance that we have obtained; |
|
· |
Pandemics, acts of terrorism, war or other man-made and natural catastrophes that may adversely impact liabilities for policyholder claims, affect our businesses and increase the cost and availability of reinsurance; |
|
· |
Competitive conditions, including pricing pressures, new product offerings and the emergence of new competitors, that may affect the level of premiums and fees that our subsidiaries can charge for their products; |
|
· |
The unknown effect on our subsidiaries’ businesses resulting from evolving market preferences and the changing demographics of our client base; and |
|
· |
The unanticipated loss of key management, financial planners or wholesalers. |
The risks and uncertainties included here are not exhaustive. Our most recent Form 10-K, as well as other reports that we file with the SEC, include additional factors that could affect our businesses and financial performance. Moreover, we operate in a rapidly changing and competitive environment. New risk factors emerge from time to time, and it is not possible for management to predict all such risk factors.
Further, it is not possible to assess the effect of all risk factors on our businesses or the extent to which any factor, or combination of factors, may cause actual results to differ materially from those contained in any forward-looking statements. Given these risks and uncertainties, investors should not place undue reliance on forward-looking statements as a prediction of actual results. In addition, Lincoln disclaims any obligation to update any forward-looking statements to reflect events or circumstances that occur after the date of this press release.
The reporting of Risk-Based Capital (“RBC”) measures is not intended for the purpose of ranking any insurance company or for use in connection with any marketing, advertising or promotional activities.
|
|
Lincoln Financial Group |
||
|
|
Table of Contents |
||
|
|
|||
|
|
|||
|
|
Notes |
1 | |
|
|
Credit Ratings |
2 | |
|
|
Consolidated |
||
|
|
Consolidated Statements of Income (Loss) |
3 | |
|
|
Consolidated Balance Sheets |
4 | |
|
|
Earnings, Shares and Return on Equity |
5 | |
|
|
Key Stakeholder Metrics |
6 | |
|
|
Select Earnings Drivers By Segment |
7 | |
|
|
Sales By Segment |
8 | |
|
|
Operating Revenues and General and Administrative Expenses By Segment |
9 | |
|
|
Operating Commissions and Other Expenses |
10 | |
|
|
Interest Rate Yields and Spreads By Segment |
11 | |
|
|
Select Earnings and Operational Data from Business Segments |
||
|
|
Income (Loss) from Operations Summary |
12 | |
|
|
Life Insurance |
13 | |
|
|
Annuities |
14 | |
|
|
Group Protection |
15 | |
|
|
Retirement Plan Services |
16 | |
|
|
Other Operations |
17 | |
|
|
DAC & Account Balance Roll Forwards |
||
|
|
Consolidated DAC, VOBA, DSI and DFEL Roll Forwards |
18 | |
|
|
Account Balance Roll Forwards: |
||
|
|
Life Insurance |
19 | |
|
|
Annuities |
20 | |
|
|
Retirement Plan Services |
21 | |
|
|
Investment Information |
||
|
|
Fixed-Income Asset Class |
22 | |
|
|
Fixed-Income Credit Quality |
23 | |
|
|
GAAP to Non-GAAP Reconciliations |
||
|
|
Select GAAP to Non-GAAP Reconciliations |
24-26 | |
|
|
|||
|
|
|||
|
|
|||
|
|
Lincoln Financial Group |
|||||||||||||||||||||||||
|
|
Notes |
|||||||||||||||||||||||||
|
|
||||||||||||||||||||||||||
|
|
||||||||||||||||||||||||||
|
|
Non-GAAP Performance Measures |
|||||||||||||||||||||||||
|
|
Non-GAAP measures do not replace the most directly comparable GAAP measures, and we have included detailed reconciliations herein beginning on page 24. |
|||||||||||||||||||||||||
|
|
||||||||||||||||||||||||||
|
|
Adjusted Income (Loss) From Operations |
|||||||||||||||||||||||||
|
|
Adjusted income (loss) from operations is GAAP net income excluding the after-tax effects of the following items, as applicable: |
|||||||||||||||||||||||||
|
|
• Changes in market risk benefits (“MRBs”), including gains and losses and benefit payments (“MRB-related impacts”); |
|||||||||||||||||||||||||
|
|
• Investment and reinsurance-related realized gain (loss): |
|||||||||||||||||||||||||
|
|
▪ Changes in the carrying value of mortgage loans on real estate attributable to current expected credit losses (“CECL”) (“changes in CECL reserve for mortgage loans on real estate”); |
|||||||||||||||||||||||||
|
|
▪ Changes in the carrying value of reinsurance-related assets attributable to CECL (“changes in CECL reserve for reinsurance-related assets”); |
|||||||||||||||||||||||||
|
|
▪ Changes in the carrying value of fixed maturity AFS securities attributable to the estimation of credit losses (“changes in the credit loss allowance for fixed maturity AFS securities”); and |
|||||||||||||||||||||||||
|
|
▪ Changes in the fair value of investments, including trading securities, equity securities, certain derivatives, and mortgage loans on real estate electing the fair value option, and of |
|||||||||||||||||||||||||
|
|
embedded derivatives within certain reinsurance arrangements, as well as sales or disposals of investments (“changes in investments and reinsurance-related embedded derivatives”); |
|||||||||||||||||||||||||
|
|
• Changes in the fair value of the derivative instruments we hold to hedge GLB and GDB, net of fee income allocated to support the cost of hedging them (“changes in fair value of GLB and GDB |
|||||||||||||||||||||||||
|
|
hedge instruments, net of hedge allowance”); |
|||||||||||||||||||||||||
|
|
• Changes in the fair value of the embedded derivative liabilities of our indexed annuity and indexed universal life insurance contracts and the associated index options we hold to hedge them, including |
|||||||||||||||||||||||||
|
|
collateral expense associated with hedge programs (“indexed product net derivative results”); |
|||||||||||||||||||||||||
|
|
• Changes in reserves resulting from benefit ratio unlocking on variable universal life insurance products with secondary guarantees (“benefit ratio unlocking”); |
|||||||||||||||||||||||||
|
|
• Income (loss) from the initial adoption of new accounting standards, regulations and policy changes; |
|||||||||||||||||||||||||
|
|
• Income (loss) from reserve changes, net of related amortization, on business sold through reinsurance; |
|||||||||||||||||||||||||
|
|
• Transaction and integration costs related to mergers and acquisitions including the acquisition or divestiture, through reinsurance or other means, of businesses or blocks of business; |
|||||||||||||||||||||||||
|
|
• Gains (losses) on modification or early extinguishment of debt; |
|||||||||||||||||||||||||
|
|
• Losses from the impairment of intangible assets and gains (losses) on other non-financial assets; and |
|||||||||||||||||||||||||
|
|
• Income (loss) from discontinued operations. |
|||||||||||||||||||||||||
|
|
||||||||||||||||||||||||||
|
|
Adjusted income (loss) from operations available to common stockholders is defined as after-tax adjusted income (loss) from operations less preferred stock dividends and the adjustment for deferred |
|||||||||||||||||||||||||
|
|
units of LNC stock in our deferred compensation plans. |
|||||||||||||||||||||||||
|
|
||||||||||||||||||||||||||
|
|
Adjusted Operating Revenues |
|||||||||||||||||||||||||
|
|
Adjusted operating revenues represent GAAP revenues excluding the pre-tax effects of the following items, as applicable: |
|||||||||||||||||||||||||
|
|
• Investment and reinsurance-related realized gain (loss); |
|||||||||||||||||||||||||
|
|
• Changes in fair value of GLB and GDB hedge instruments, net of hedge allowance; |
|||||||||||||||||||||||||
|
|
• Indexed product net derivative results; |
|||||||||||||||||||||||||
|
|
• Revenue adjustments from the initial adoption of new accounting standards; and |
|||||||||||||||||||||||||
|
|
• Amortization of deferred gains arising from reserve changes on business sold through reinsurance. |
|||||||||||||||||||||||||
|
|
||||||||||||||||||||||||||
|
|
Management believes that the non-GAAP performance measures discussed above explain the results of our ongoing businesses in a manner that allows for a better understanding of the underlying trends |
|||||||||||||||||||||||||
|
|
in our current business as the excluded items are unpredictable and not necessarily indicative of current operating fundamentals or future performance of the business segments, and, in many instances, |
|||||||||||||||||||||||||
|
|
decisions regarding these items do not necessarily relate to the operations of the individual segments. In addition, we believe that our definitions of adjusted operating revenues and adjusted income (loss) |
|||||||||||||||||||||||||
|
|
from operations provide investors with more valuable measures of our performance as they better reveal trends in our business. |
|||||||||||||||||||||||||
|
|
||||||||||||||||||||||||||
|
|
Page 1a |
|||||||||||||||||||||||||
|
|
Lincoln Financial Group |
|||||||||||||||||||||||||
|
|
Notes |
|||||||||||||||||||||||||
|
|
||||||||||||||||||||||||||
|
|
||||||||||||||||||||||||||
|
|
Non-GAAP Performance Measures, Continued |
|||||||||||||||||||||||||
|
|
Stockholders’ Equity, Excluding AOCI and Preferred Stock |
|||||||||||||||||||||||||
|
|
Stockholders’ equity, excluding AOCI is stockholders’ equity, excluding AOCI and preferred stock. Management believes this metric is useful to investors because it eliminates market movements that are |
|||||||||||||||||||||||||
|
|
unpredictable and can fluctuate significantly from period to period, primarily related to changes in interest rates. Stockholders’ equity is the most directly comparable GAAP measure. |
|||||||||||||||||||||||||
|
|
||||||||||||||||||||||||||
|
|
Adjusted Stockholders’ Equity |
|||||||||||||||||||||||||
|
|
For presented periods prior to January 1, 2023, adjusted stockholders’ equity is stockholders’ equity, excluding AOCI, preferred stock and MRB-related impacts. For periods beginning on or after January 1, 2023, |
|||||||||||||||||||||||||
|
|
adjusted stockholders’ equity is stockholders’ equity, excluding AOCI, preferred stock, MRB-related impacts and GLB and GDB hedged instruments gains (losses), to align to updates made to our variable |
|||||||||||||||||||||||||
|
|
annuity hedge program effective January 1, 2023. Management believes this metric is useful to investors because it eliminates the effect of market movements that are unpredictable and can fluctuate significantly |
|||||||||||||||||||||||||
|
|
from period to period, primarily related to changes in equity markets and interest rates. Stockholders’ equity is the most directly comparable GAAP measure. |
|||||||||||||||||||||||||
|
|
||||||||||||||||||||||||||
|
|
Book Value per Share, Excluding AOCI |
|||||||||||||||||||||||||
|
|
Book value per share, excluding AOCI, is calculated by dividing stockholders’ equity, excluding AOCI and preferred stock, by common shares outstanding. We provide book value per share, excluding AOCI, to |
|||||||||||||||||||||||||
|
|
enable investors to analyze the amount of our net worth that is attributable primarily to our business operations. Management believes book value per share, excluding AOCI, is useful to investors because it |
|||||||||||||||||||||||||
|
|
eliminates the effect of items that are unpredictable and can fluctuate significantly from period to period, primarily based on changes in interest rates. Book value per share is the most directly comparable GAAP |
|||||||||||||||||||||||||
|
|
measure. |
|||||||||||||||||||||||||
|
|
||||||||||||||||||||||||||
|
|
Adjusted Book Value per Share |
|||||||||||||||||||||||||
|
|
Adjusted book value per share is calculated by dividing stockholders’ equity, excluding AOCI, preferred stock and MRB-related impacts, by common shares outstanding. We provide adjusted book value per share |
|||||||||||||||||||||||||
|
|
to enable investors to analyze the amount of our net worth that is attributable primarily to our business operations. Management believes adjusted book value per share is useful to investors because it eliminates |
|||||||||||||||||||||||||
|
|
the effect of items that are unpredictable and can fluctuate significantly from period to period, primarily based on changes in equity markets and interest rates. Stockholders’ equity is the most directly comparable |
|||||||||||||||||||||||||
|
|
GAAP measure. |
|||||||||||||||||||||||||
|
|
||||||||||||||||||||||||||
|
|
Adjusted Income (Loss) From Operations Available to Common Stockholders, Excluding AOCI and Preferred Stock ROE |
|||||||||||||||||||||||||
|
|
Adjusted income (loss) from operations available to common stockholders, excluding AOCI and preferred stock ROE is calculated by dividing annualized adjusted income (loss) from operations available |
|||||||||||||||||||||||||
|
|
to common stockholders by average stockholders’ equity, excluding AOCI and preferred stock. Management believes this metric is useful to investors because it eliminates the effect of market movements |
|||||||||||||||||||||||||
|
|
on ROE that are unpredictable and can fluctuate significantly from period to period, primarily related to changes in interest rates. Net income (loss) ROE is the most directly comparable GAAP measure. |
|||||||||||||||||||||||||
|
|
||||||||||||||||||||||||||
|
|
Adjusted Income (Loss) From Operations ROE |
|||||||||||||||||||||||||
|
|
Adjusted income (loss) from operations ROE is calculated by dividing annualized adjusted income (loss) from operations available to common stockholders by adjusted average stockholders’ equity. |
|||||||||||||||||||||||||
|
|
Management believes this metric is useful to investors because it eliminates the effect of market movements on ROE that are unpredictable and can fluctuate significantly from period to period, primarily |
|||||||||||||||||||||||||
|
|
related to changes in equity markets and interest rates. Net income (loss) ROE is the most directly comparable GAAP measure. |
|||||||||||||||||||||||||
|
|
||||||||||||||||||||||||||
|
|
Management believes that the non-GAAP measures discussed above allow for a better understanding of the underlying trends in our current business as the excluded items are unpredictable and not necessarily |
|||||||||||||||||||||||||
|
|
indicative of current operating fundamentals or future performance of the business. |
|||||||||||||||||||||||||
|
|
||||||||||||||||||||||||||
|
|
Computations |
|||||||||||||||||||||||||
|
|
• The quarterly financial information for the current year may not sum to the corresponding year-to-date amount as both are rounded to millions. |
|||||||||||||||||||||||||
|
|
• The financial ratios reported herein are calculated using whole dollars instead of dollars rounded to millions. |
|||||||||||||||||||||||||
|
|
• We exclude deferred units of LNC stock that are antidilutive from our diluted earnings per share calculation. In addition, for any period where a net loss or adjusted loss from operations is experienced, shares |
|||||||||||||||||||||||||
|
|
used in the diluted EPS calculation represent basic shares, as the use of diluted shares would result in a lower loss per share. |
|||||||||||||||||||||||||
|
|
• Pre-tax net margin is calculated by dividing adjusted income (loss) from operations before taxes by net revenue, which is defined as total adjusted operating revenues less interest credited. |
|||||||||||||||||||||||||
|
|
||||||||||||||||||||||||||
|
|
Page 1b |
|||||||||||||||||||||||||
|
|
Lincoln Financial Group |
|||||||||||||||||||||||||
|
|
Notes |
|||||||||||||||||||||||||
|
|
||||||||||||||||||||||||||
|
|
||||||||||||||||||||||||||
|
|
Definitions |
|||||||||||||||||||||||||
|
|
Holding company available liquidity consists of cash and invested cash, excluding cash held as collateral, and certain short-term investments that can be readily converted into cash, net of commercial paper |
|||||||||||||||||||||||||
|
|
outstanding. |
|||||||||||||||||||||||||
|
|
Return on equity (“ROE”) measures how efficiently we generate profits from the resources provided by our net assets. See adjusted income (loss) from operations ROE and adjusted income (loss) from |
|||||||||||||||||||||||||
|
|
operations available to common stockholders, excluding AOCI and preferred stock ROE metrics on page 1b for further information on how these metrics are calculated. Management evaluates consolidated |
|||||||||||||||||||||||||
|
|
ROE by both including and excluding the effect of average goodwill. |
|||||||||||||||||||||||||
|
|
||||||||||||||||||||||||||
|
|
Sales as reported consist of the following: |
|||||||||||||||||||||||||
|
|
• Universal life insurance (“UL”), indexed universal life insurance (“IUL”), variable universal life insurance (“VUL”) – first-year commissionable premiums plus 5% of excess premiums received; |
|||||||||||||||||||||||||
|
|
• MoneyGuard® linked-benefit products – MoneyGuard® (UL), 15% of total expected premium deposits, and MoneyGuard Market AdvantageSM (VUL), 150% of commissionable premiums; |
|||||||||||||||||||||||||
|
|
• Executive Benefits – insurance and corporate-owned UL and VUL, first-year commissionable premiums plus 5% of excess premium received, and single premium bank-owned UL and VUL, 15% of |
|||||||||||||||||||||||||
|
|
single premium deposits; |
|||||||||||||||||||||||||
|
|
• Term – 100% of annualized first-year premiums; |
|||||||||||||||||||||||||
|
|
• Annuities and Retirement Plan Services – deposits from new and existing customers; and |
|||||||||||||||||||||||||
|
|
• Group Protection – annualized first-year premiums from new policies. |
|||||||||||||||||||||||||
|
|
||||||||||||||||||||||||||
|
|
Statistical Supplement is Dated |
|||||||||||||||||||||||||
|
|
This document is dated May 9, 2023, and has not been updated since that date. Lincoln Financial Group does not intend to update this document. |
|||||||||||||||||||||||||
|
|
||||||||||||||||||||||||||
|
|
||||||||||||||||||||||||||
|
|
||||||||||||||||||||||||||
|
|
||||||||||||||||||||||||||
|
|
||||||||||||||||||||||||||
|
|
||||||||||||||||||||||||||
|
|
||||||||||||||||||||||||||
|
|
||||||||||||||||||||||||||
|
|
||||||||||||||||||||||||||
|
|
||||||||||||||||||||||||||
|
|
||||||||||||||||||||||||||
|
|
||||||||||||||||||||||||||
|
|
||||||||||||||||||||||||||
|
|
||||||||||||||||||||||||||
|
|
||||||||||||||||||||||||||
|
|
||||||||||||||||||||||||||
|
|
||||||||||||||||||||||||||
|
|
||||||||||||||||||||||||||
|
|
||||||||||||||||||||||||||
|
|
||||||||||||||||||||||||||
|
|
||||||||||||||||||||||||||
|
|
Page 1c |
|||||||||||||||||||||||||
|
|
Lincoln Financial Group |
|||||||||||||||||||||||||
|
|
Credit Ratings |
|||||||||||||||||||||||||
|
|
||||||||||||||||||||||||||
|
|
||||||||||||||||||||||||||
|
|
||||||||||||||||||||||||||
|
|
Ratings as of May 9, 2023 |
|||||||||||||||||||||||||
|
|
Standard |
|||||||||||||||||||||||||
|
|
AM Best |
Fitch |
Moody's |
& Poor's |
||||||||||||||||||||||
|
|
Senior Debt Ratings |
bbb+ |
BBB+ |
Baa1 |
BBB+ |
|||||||||||||||||||||
|
|
Financial Strength Ratings |
|||||||||||||||||||||||||
|
|
The Lincoln National Life Insurance Company |
A |
A+ |
A1 |
A+ |
|||||||||||||||||||||
|
|
First Penn-Pacific Life Insurance Company |
A |
A+ |
A1 |
A- |
|||||||||||||||||||||
|
|
Lincoln Life & Annuity Company of New York |
A |
A+ |
A1 |
A+ |
|||||||||||||||||||||
|
|
||||||||||||||||||||||||||
|
|
||||||||||||||||||||||||||
|
|
||||||||||||||||||||||||||
|
|
||||||||||||||||||||||||||
|
|
||||||||||||||||||||||||||
|
|
||||||||||||||||||||||||||
|
|
||||||||||||||||||||||||||
|
|
||||||||||||||||||||||||||
|
|
||||||||||||||||||||||||||
|
|
||||||||||||||||||||||||||
|
|
||||||||||||||||||||||||||
|
|
||||||||||||||||||||||||||
|
|
||||||||||||||||||||||||||
|
|
||||||||||||||||||||||||||
|
|
||||||||||||||||||||||||||
|
|
||||||||||||||||||||||||||
|
|
||||||||||||||||||||||||||
|
|
||||||||||||||||||||||||||
|
|
||||||||||||||||||||||||||
|
|
||||||||||||||||||||||||||
|
|
||||||||||||||||||||||||||
|
|
||||||||||||||||||||||||||
|
|
||||||||||||||||||||||||||
|
|
Investor Inquiries May Be Directed To: |
|||||||||||||||||||||||||
|
|
Albert Copersino, Vice President, Investor Relations |
|||||||||||||||||||||||||
|
|
Email: InvestorRelations@lfg.com |
|||||||||||||||||||||||||
|
|
Phone: 800-237-2920 |
|||||||||||||||||||||||||
|
|
||||||||||||||||||||||||||
|
|
Page 2 |
|||||||||||||||||||||||||

|
|
Lincoln Financial Group |
|||||||||||||||||
|
|
Consolidated Statements of Income (Loss) |
|||||||||||||||||
|
|
Unaudited (millions of dollars, except per share data) |
|||||||||||||||||
|
|
||||||||||||||||||
|
|
For the Three Months Ended |
|||||||||||||||||
|
|
3/31/22 |
6/30/22 |
9/30/22 |
12/31/22 |
3/31/23 |
Change |
||||||||||||
|
|
Revenues |
|||||||||||||||||
|
|
Insurance premiums |
$ |
1,477 |
$ |
1,498 |
$ |
1,548 |
$ |
1,564 |
$ |
1,579 | 6.9% | ||||||
|
|
Fee income |
1,458 | 1,409 | 1,381 | 1,354 | 1,379 |
-5.4% |
|||||||||||
|
|
Net investment income |
1,411 | 1,398 | 1,295 | 1,412 | 1,466 | 3.9% | |||||||||||
|
|
Realized gain (loss) |
181 | 1,101 | 249 | (692) | (828) |
NM |
|||||||||||
|
|
Amortization of deferred gain on business |
|||||||||||||||||
|
|
sold through reinsurance |
11 | 11 | 10 | 10 | 9 |
-18.2% |
|||||||||||
|
|
Other revenues |
182 | 160 | 189 | 193 | 209 | 14.8% | |||||||||||
|
|
Total revenues |
4,720 | 5,577 | 4,672 | 3,841 | 3,814 |
-19.2% |
|||||||||||
|
|
||||||||||||||||||
|
|
Expenses |
|||||||||||||||||
|
|
Benefits |
2,156 | 1,954 | 2,149 | 2,220 | 2,291 | 6.3% | |||||||||||
|
|
Interest credited |
697 | 710 | 726 | 744 | 785 | 12.6% | |||||||||||
|
|
Market risk benefit (gain) loss |
(1,359) | 477 | (798) | (1,567) | 619 | 145.5% | |||||||||||
|
|
Policyholder liability remeasurement (gain) loss |
41 | 85 | 2,692 | (52) | (118) |
NM |
|||||||||||
|
|
Commissions and other expenses |
1,253 | 1,208 | 1,280 | 1,385 | 1,300 | 3.8% | |||||||||||
|
|
Interest and debt expense |
66 | 68 | 71 | 77 | 83 | 25.8% | |||||||||||
|
|
Spark program expense |
31 | 43 | 44 | 49 | 24 |
-22.6% |
|||||||||||
|
|
Impairment of intangibles |
- |
- |
634 |
- |
- |
NM |
|||||||||||
|
|
Total expenses |
2,885 | 4,545 | 6,798 | 2,856 | 4,984 | 72.8% | |||||||||||
|
|
Income (loss) before taxes |
1,835 | 1,032 | (2,126) | 985 | (1,170) |
NM |
|||||||||||
|
|
Federal income tax expense (benefit) |
353 | 192 | (351) | 173 | (289) |
NM |
|||||||||||
|
|
Net income (loss) |
1,482 | 840 | (1,775) | 812 | (881) |
NM |
|||||||||||
|
|
Preferred stock dividends declared |
- |
- |
- |
- |
(25) |
NM |
|||||||||||
|
|
Adjustment for deferred units of LNC stock |
|||||||||||||||||
|
|
in our deferred compensation plans |
(1) | (7) | (1) | (5) | (3) |
NM |
|||||||||||
|
|
Net income (loss) available to common |
|||||||||||||||||
|
|
stockholders – diluted |
$ |
1,481 |
$ |
833 |
$ |
(1,776) |
$ |
807 |
$ |
(909) |
NM |
||||||
|
|
||||||||||||||||||
|
|
Earnings (Loss) Per Common Share – Diluted |
|||||||||||||||||
|
|
Net income (loss) |
$ |
8.39 |
$ |
4.83 |
$ |
(10.47) |
$ |
4.73 |
$ |
(5.37) |
NM |
||||||
|
|
||||||||||||||||||
|
|
||||||||||||||||||
|
|
||||||||||||||||||
|
|
||||||||||||||||||
|
|
||||||||||||||||||
|
|
Page 3 |
|||||||||||||||||
|
|
Lincoln Financial Group |
|||||||||||||||||
|
|
Consolidated Balance Sheets |
|||||||||||||||||
|
|
Unaudited (millions of dollars) |
|||||||||||||||||
|
|
||||||||||||||||||
|
|
As of |
|||||||||||||||||
|
|
3/31/22 |
6/30/22 |
9/30/22 |
12/31/22 |
3/31/23 |
Change |
||||||||||||
|
|
ASSETS |
|||||||||||||||||
|
|
Investments: |
|||||||||||||||||
|
|
Fixed maturity available-for-sale (“AFS”) securities, net of allowance for |
|||||||||||||||||
|
|
credit losses: |
|||||||||||||||||
|
|
Corporate bonds |
$ |
90,561 |
$ |
83,158 |
$ |
77,446 |
$ |
79,023 |
$ |
80,448 |
-11.2% |
||||||
|
|
U.S. government bonds |
418 | 415 | 384 | 379 | 383 |
-8.4% |
|||||||||||
|
|
State and municipal bonds |
6,001 | 5,523 | 5,089 | 5,070 | 5,257 |
-12.4% |
|||||||||||
|
|
Foreign government bonds |
383 | 348 | 338 | 318 | 309 |
-19.3% |
|||||||||||
|
|
Residential mortgage-backed securities |
2,338 | 2,181 | 2,048 | 2,009 | 2,050 |
-12.3% |
|||||||||||
|
|
Commercial mortgage-backed securities |
1,592 | 1,557 | 1,549 | 1,674 | 1,671 | 5.0% | |||||||||||
|
|
Asset-backed securities |
8,929 | 9,711 | 10,347 | 10,904 | 11,458 | 28.3% | |||||||||||
|
|
Hybrid and redeemable preferred securities |
441 | 423 | 371 | 359 | 360 |
-18.4% |
|||||||||||
|
|
Total fixed maturity AFS securities, net of allowance for credit losses |
110,663 | 103,316 | 97,572 | 99,736 | 101,936 |
-7.9% |
|||||||||||
|
|
Trading securities |
4,364 | 3,803 | 3,580 | 3,498 | 3,266 |
-25.2% |
|||||||||||
|
|
Equity securities |
399 | 412 | 427 | 427 | 414 | 3.8% | |||||||||||
|
|
Mortgage loans on real estate, net of allowance for credit losses |
17,892 | 17,922 | 18,066 | 18,301 | 18,327 | 2.4% | |||||||||||
|
|
Policy loans |
2,339 | 2,368 | 2,347 | 2,359 | 2,383 | 1.9% | |||||||||||
|
|
Derivative investments |
4,574 | 3,167 | 3,456 | 3,594 | 4,005 |
-12.4% |
|||||||||||
|
|
Other investments |
4,121 | 4,078 | 3,812 | 3,739 | 3,892 |
-5.6% |
|||||||||||
|
|
Total investments |
144,352 | 135,066 | 129,260 | 131,654 | 134,223 |
-7.0% |
|||||||||||
|
|
Cash and invested cash |
1,960 | 1,567 | 1,472 | 3,343 | 3,766 | 92.1% | |||||||||||
|
|
Deferred acquisition costs, value of business acquired and deferred sales inducements |
11,965 | 12,050 | 12,140 | 12,235 | 12,277 | 2.6% | |||||||||||
|
|
Reinsurance recoverables, net of allowance for credit losses |
21,158 | 19,874 | 19,460 | 19,443 | 19,309 |
-8.7% |
|||||||||||
|
|
Market risk benefit assets |
2,291 | 2,205 | 2,428 | 2,807 | 3,445 | 50.4% | |||||||||||
|
|
Accrued investment income |
1,247 | 1,226 | 1,283 | 1,253 | 1,277 | 2.4% | |||||||||||
|
|
Goodwill |
1,778 | 1,778 | 1,144 | 1,144 | 1,144 |
-35.7% |
|||||||||||
|
|
Other assets |
16,493 | 16,708 | 18,435 | 18,802 | 19,280 | 16.9% | |||||||||||
|
|
Separate account assets |
168,879 | 145,791 | 137,295 | 143,536 | 148,421 |
-12.1% |
|||||||||||
|
|
Total assets |
$ |
370,123 |
$ |
336,265 |
$ |
322,917 |
$ |
334,217 |
$ |
343,142 |
-7.3% |
||||||
|
|
||||||||||||||||||
|
|
||||||||||||||||||
|
|
||||||||||||||||||
|
|
||||||||||||||||||
|
|
||||||||||||||||||
|
|
||||||||||||||||||
|
|
Page 4a |
|||||||||||||||||
|
|
Lincoln Financial Group |
|||||||||||||||||
|
|
Consolidated Balance Sheets |
|||||||||||||||||
|
|
Unaudited (millions of dollars) |
|||||||||||||||||
|
|
||||||||||||||||||
|
|
As of |
|||||||||||||||||
|
|
3/31/22 |
6/30/22 |
9/30/22 |
12/31/22 |
3/31/23 |
Change |
||||||||||||
|
|
LIABILITIES AND STOCKHOLDERS’ EQUITY |
|||||||||||||||||
|
|
Liabilities |
|||||||||||||||||
|
|
Policyholder account balances |
$ |
110,606 |
$ |
110,202 |
$ |
111,732 |
$ |
114,435 |
$ |
116,167 | 5.0% | ||||||
|
|
Future contract benefits |
38,887 | 36,453 | 38,087 | 38,826 | 39,757 | 2.2% | |||||||||||
|
|
Market risk benefit liabilities |
3,312 | 3,195 | 2,756 | 2,078 | 1,976 |
-40.3% |
|||||||||||
|
|
Deferred front-end loads |
4,416 | 4,623 | 4,834 | 5,052 | 5,250 | 18.9% | |||||||||||
|
|
Payables for collateral on investments |
8,927 | 7,524 | 6,865 | 6,712 | 6,803 |
-23.8% |
|||||||||||
|
|
Short-term debt |
- |
- |
500 | 500 | 500 |
NM |
|||||||||||
|
|
Long-term debt by rating agency leverage definitions: |
|||||||||||||||||
|
|
Operating (see note (2) on page 6 for details) |
867 | 867 | 867 | 867 | 867 | 0.0% | |||||||||||
|
|
Financial |
5,694 | 5,631 | 5,092 | 5,088 | 5,107 |
-10.3% |
|||||||||||
|
|
Other liabilities |
14,280 | 12,648 | 12,106 | 12,021 | 11,562 |
-19.0% |
|||||||||||
|
|
Separate account liabilities |
168,879 | 145,791 | 137,295 | 143,536 | 148,421 |
-12.1% |
|||||||||||
|
|
Total liabilities |
355,868 | 326,934 | 320,134 | 329,115 | 336,410 |
-5.5% |
|||||||||||
|
|
||||||||||||||||||
|
|
Stockholders’ Equity |
|||||||||||||||||
|
|
Preferred stock |
- |
- |
- |
986 | 986 |
NM |
|||||||||||
|
|
Common stock |
4,586 | 4,546 | 4,534 | 4,544 | 4,560 |
-0.6% |
|||||||||||
|
|
Retained earnings |
6,354 | 7,065 | 5,189 | 5,924 | 4,940 |
-22.3% |
|||||||||||
|
|
Accumulated other comprehensive income (loss): |
|||||||||||||||||
|
|
Unrealized investment gain (loss) |
2,033 | (4,623) | (9,677) | (8,528) | (6,754) |
NM |
|||||||||||
|
|
Market risk benefit non-performance risk gain (loss) |
1,971 | 2,325 | 2,175 | 1,741 | 2,766 | 40.3% | |||||||||||
|
|
Policyholder liability discount rate remeasurement gain (loss) |
(454) | 257 | 806 | 747 | 545 | 220.0% | |||||||||||
|
|
Foreign currency translation adjustment |
(19) | (33) | (47) | (34) | (31) |
-63.2% |
|||||||||||
|
|
Funded status of employee benefit plans |
(216) | (206) | (197) | (278) | (280) |
-29.6% |
|||||||||||
|
|
Total accumulated other comprehensive income (loss) |
3,315 | (2,280) | (6,940) | (6,352) | (3,754) |
NM |
|||||||||||
|
|
Total stockholders’ equity |
14,255 | 9,331 | 2,783 | 5,102 | 6,732 |
-52.8% |
|||||||||||
|
|
Total liabilities and stockholders’ equity |
$ |
370,123 |
$ |
336,265 |
$ |
322,917 |
$ |
334,217 |
$ |
343,142 |
-7.3% |
||||||
|
|
||||||||||||||||||
|
|
||||||||||||||||||
|
|
||||||||||||||||||
|
|
||||||||||||||||||
|
|
||||||||||||||||||
|
|
||||||||||||||||||
|
|
||||||||||||||||||
|
|
Page 4b |
|||||||||||||||||
|
|
Lincoln Financial Group |
|||||||||||||||||
|
|
Earnings, Shares and Return on Equity |
|||||||||||||||||
|
|
Unaudited (millions of dollars, except per share data) |
|||||||||||||||||
|
|
||||||||||||||||||
|
|
As of or For the Three Months Ended |
|||||||||||||||||
|
|
3/31/22 |
6/30/22 |
9/30/22 |
12/31/22 |
3/31/23 |
Change |
||||||||||||
|
|
Income (Loss) |
|||||||||||||||||
|
|
Net income (loss) |
$ |
1,482 |
$ |
840 |
$ |
(1,775) |
$ |
812 |
$ |
(881) |
NM |
||||||
|
|
Pre-tax adjusted income (loss) from operations |
307 | 441 | (2,513) | 127 | 310 | 1.0% | |||||||||||
|
|
After-tax adjusted income (loss) from operations (1) |
274 | 374 | (1,949) | 134 | 288 | 5.1% | |||||||||||
|
|
Adjusted operating tax rate |
10.7% | 15.3% | 22.5% |
-5.5% |
7.2% | ||||||||||||
|
|
Adjusted income (loss) from operations available to common stockholders |
273 | 367 | (1,950) | 129 | 260 |
-4.8% |
|||||||||||
|
|
||||||||||||||||||
|
|
ROE |
|||||||||||||||||
|
|
Net income (loss) ROE |
34.7% | 28.5% |
NM |
82.3% |
-59.6% |
||||||||||||
|
|
Adjusted income (loss) from operations available to common stockholders, |
|||||||||||||||||
|
|
excluding AOCI and preferred stock ROE |
10.5% | 13.0% |
-73.1% |
5.1% | 10.4% | ||||||||||||
|
|
Adjusted income (loss) from operations ROE |
8.4% | 10.8% |
-60.7% |
4.6% | 9.5% | ||||||||||||
|
|
||||||||||||||||||
|
|
Per Common Share |
|||||||||||||||||
|
|
Net income (loss) (diluted) |
$ |
8.39 |
$ |
4.83 |
$ |
(10.47) |
$ |
4.73 |
$ |
(5.37) |
NM |
||||||
|
|
Adjusted income (loss) from operations (diluted) (2) |
1.55 | 2.13 | (11.49) | 0.76 | 1.52 |
-1.9% |
|||||||||||
|
|
Dividends declared during the period |
0.45 | 0.45 | 0.45 | 0.45 | 0.45 | 0.0% | |||||||||||
|
|
||||||||||||||||||
|
|
Book Value Per Common Share |
|||||||||||||||||
|
|
Book value per share |
$ |
82.93 |
$ |
54.81 |
$ |
16.45 |
$ |
24.32 |
$ |
33.89 |
-59.1% |
||||||
|
|
Book value per share, excluding AOCI (3) |
63.64 | 68.21 | 57.46 | 61.86 | 56.04 |
-11.9% |
|||||||||||
|
|
Adjusted book value per share (3) |
75.77 | 82.78 | 68.53 | 65.72 | 66.05 |
-12.8% |
|||||||||||
|
|
||||||||||||||||||
|
|
Common Shares |
|||||||||||||||||
|
|
Repurchased during the period |
5.8 | 1.8 | 1.0 |
- |
- |
-100.0% |
|||||||||||
|
|
End-of-period – basic |
171.9 | 170.2 | 169.2 | 169.2 | 169.5 |
-1.4% |
|||||||||||
|
|
Average for the period – basic |
174.2 | 171.1 | 169.7 | 169.2 | 169.4 |
-2.8% |
|||||||||||
|
|
End-of-period – diluted |
173.8 | 171.6 | 170.7 | 170.5 | 170.5 |
-1.9% |
|||||||||||
|
|
Average for the period – diluted |
176.4 | 172.7 | 171.1 | 170.6 | 170.5 |
-3.3% |
|||||||||||
|
|
||||||||||||||||||
|
|
(1) See reconciliation to net income (loss) on page 24. |
|||||||||||||||||
|
|
(2) See reconciliation to earnings (loss) per common share - diluted on page 25. |
|||||||||||||||||
|
|
(3) See reconciliation to stockholders’ equity and book value per common share on page 26. |
|||||||||||||||||
|
|
||||||||||||||||||
|
|
||||||||||||||||||
|
|
Page 5 |
|||||||||||||||||
|
|
Lincoln Financial Group |
|||||||||||||||||
|
|
Key Stakeholder Metrics |
|||||||||||||||||
|
|
Unaudited (millions of dollars, except per share data) |
|||||||||||||||||
|
|
||||||||||||||||||
|
|
As of or For the Three Months Ended |
|||||||||||||||||
|
|
3/31/22 |
6/30/22 |
9/30/22 |
12/31/22 |
3/31/23 |
Change |
||||||||||||
|
|
Cash Returned to Common Stockholders |
|||||||||||||||||
|
|
Shares repurchased |
$ |
400 |
$ |
100 |
$ |
50 |
$ |
- |
$ |
- |
-100.0% |
||||||
|
|
Common dividends |
80 | 77 | 77 | 76 | 76 |
-5.0% |
|||||||||||
|
|
Total cash returned to common stockholders |
$ |
480 |
$ |
177 |
$ |
127 |
$ |
76 |
$ |
76 |
-84.2% |
||||||
|
|
||||||||||||||||||
|
|
Cash Returned to Preferred Stockholders |
|||||||||||||||||
|
|
Preferred dividends |
$ |
- |
$ |
- |
$ |
- |
$ |
- |
$ |
25 |
NM |
||||||
|
|
||||||||||||||||||
|
|
Leverage Ratio |
|||||||||||||||||
|
|
Short-term debt |
$ |
- |
$ |
- |
$ |
500 |
$ |
500 |
$ |
500 |
NM |
||||||
|
|
Long-term debt |
6,561 | 6,498 | 5,959 | 5,955 | 5,974 |
-8.9% |
|||||||||||
|
|
Total debt (1) |
6,561 | 6,498 | 6,459 | 6,455 | 6,474 |
-1.3% |
|||||||||||
|
|
Preferred stock |
- |
- |
- |
986 | 986 |
NM |
|||||||||||
|
|
Total debt and preferred stock |
6,561 | 6,498 | 6,459 | 7,441 | 7,460 | 13.7% | |||||||||||
|
|
Less: |
|||||||||||||||||
|
|
Operating debt (2) |
867 | 867 | 867 | 867 | 867 | 0.0% | |||||||||||
|
|
Pre-funding of upcoming debt maturities |
300 | 300 | 300 | 500 | 500 | 66.7% | |||||||||||
|
|
25% of capital securities and subordinated notes |
302 | 302 | 302 | 302 | 302 | 0.0% | |||||||||||
|
|
50% of preferred stock |
- |
- |
- |
493 | 493 |
NM |
|||||||||||
|
|
Carrying value of fair value hedges and other items |
273 | 209 | 169 | 164 | 182 |
-33.3% |
|||||||||||
|
|
Total numerator |
$ |
4,819 |
$ |
4,820 |
$ |
4,821 |
$ |
5,115 |
$ |
5,116 | 6.2% | ||||||
|
|
||||||||||||||||||
|
|
Adjusted stockholders’ equity (3) |
$ |
13,025 |
$ |
14,094 |
$ |
11,595 |
$ |
11,120 |
$ |
11,197 |
-14.0% |
||||||
|
|
Add: |
|||||||||||||||||
|
|
25% of capital securities and subordinated notes |
302 | 302 | 302 | 302 | 302 | 0.0% | |||||||||||
|
|
50% of preferred stock |
- |
- |
- |
493 | 493 |
NM |
|||||||||||
|
|
Total numerator |
4,819 | 4,820 | 4,821 | 5,115 | 5,116 | 6.2% | |||||||||||
|
|
Total denominator |
$ |
18,146 |
$ |
19,216 |
$ |
16,718 |
$ |
17,030 |
$ |
17,108 |
-5.7% |
||||||
|
|
||||||||||||||||||
|
|
Leverage ratio |
26.6% | 25.1% | 28.8% | 30.0% | 29.9% | ||||||||||||
|
|
||||||||||||||||||
|
|
Holding Company Available Liquidity |
$ |
755 |
$ |
756 |
$ |
756 |
$ |
960 |
$ |
954 | 26.4% | ||||||
|
|
||||||||||||||||||
|
|
(1) Excludes obligations under finance leases and certain financing arrangements of $649 million that are reported in other liabilities on our Consolidated Balance Sheets. |
|||||||||||||||||
|
|
(2) We have categorized as operating debt the senior notes issued in October 2007 and June 2010 because the proceeds were used as a long-term structured solution to reduce |
|||||||||||||||||
|
|
the strain on increasing statutory reserves associated with secondary guarantee UL and term policies. |
|||||||||||||||||
|
|
(3) See reconciliation to stockholders’ equity on page 26. |
|||||||||||||||||
|
|
||||||||||||||||||
|
|
Page 6 |
|||||||||||||||||
|
|
Lincoln Financial Group |
|||||||||||||||||
|
|
Select Earnings Drivers By Segment |
|||||||||||||||||
|
|
Unaudited (millions of dollars) |
|||||||||||||||||
|
|
||||||||||||||||||
|
|
For the Three Months Ended |
|||||||||||||||||
|
|
3/31/22 |
6/30/22 |
9/30/22 |
12/31/22 |
3/31/23 |
Change |
||||||||||||
|
|
Life Insurance |
|||||||||||||||||
|
|
Operating revenues |
$ |
1,729 |
$ |
1,705 |
$ |
1,623 |
$ |
1,688 |
$ |
1,757 | 1.6% | ||||||
|
|
Deposits |
1,351 | 1,459 | 1,406 | 1,605 | 1,320 |
-2.3% |
|||||||||||
|
|
Net flows |
911 | 1,063 | 1,002 | 1,149 | 852 |
-6.5% |
|||||||||||
|
|
Average account balances, net of reinsurance |
51,203 | 49,316 | 47,663 | 47,963 | 49,100 |
-4.1% |
|||||||||||
|
|
Average in-force face amount |
985,286 | 1,010,659 | 1,037,952 | 1,061,415 | 1,075,614 | 9.2% | |||||||||||
|
|
||||||||||||||||||
|
|
Annuities |
|||||||||||||||||
|
|
Operating revenues |
$ |
1,147 |
$ |
1,097 |
$ |
1,113 |
$ |
1,125 |
$ |
1,141 |
-0.5% |
||||||
|
|
Deposits |
2,704 | 2,701 | 3,232 | 3,198 | 3,164 | 17.0% | |||||||||||
|
|
Net flows |
(525) | (285) | 322 | 152 | (331) | 37.0% | |||||||||||
|
|
Average account balances, net of reinsurance |
161,411 | 149,824 | 144,858 | 142,099 | 146,331 |
-9.3% |
|||||||||||
|
|
||||||||||||||||||
|
|
Group Protection |
|||||||||||||||||
|
|
Operating revenues |
$ |
1,303 |
$ |
1,323 |
$ |
1,333 |
$ |
1,346 |
$ |
1,388 | 6.5% | ||||||
|
|
Insurance premiums |
1,169 | 1,187 | 1,200 | 1,213 | 1,251 | 7.0% | |||||||||||
|
|
||||||||||||||||||
|
|
Retirement Plan Services |
|||||||||||||||||
|
|
Operating revenues |
$ |
318 |
$ |
315 |
$ |
316 |
$ |
325 |
$ |
328 | 3.1% | ||||||
|
|
Deposits |
3,637 | 3,200 | 3,091 | 2,973 | 3,209 |
-11.8% |
|||||||||||
|
|
Net flows |
927 | 913 | 805 | 51 | 535 |
-42.3% |
|||||||||||
|
|
Average account balances |
95,798 | 90,628 | 88,196 | 87,987 | 91,457 |
-4.5% |
|||||||||||
|
|
||||||||||||||||||
|
|
Consolidated |
|||||||||||||||||
|
|
Adjusted operating revenues (1) |
$ |
4,537 |
$ |
4,474 |
$ |
4,421 |
$ |
4,531 |
$ |
4,657 | 2.6% | ||||||
|
|
Deposits |
7,692 | 7,360 | 7,729 | 7,776 | 7,693 | 0.0% | |||||||||||
|
|
Net flows |
1,313 | 1,691 | 2,129 | 1,352 | 1,056 |
-19.6% |
|||||||||||
|
|
Average account balances, net of reinsurance |
308,412 | 289,768 | 280,717 | 278,049 | 286,888 |
-7.0% |
|||||||||||
|
|
||||||||||||||||||
|
|
(1) See reconciliation to total revenues on page 25. |
|||||||||||||||||
|
|
||||||||||||||||||
|
|
||||||||||||||||||
|
|
||||||||||||||||||
|
|
||||||||||||||||||
|
|
||||||||||||||||||
|
|
Page 7 |
|||||||||||||||||
|
|
Lincoln Financial Group |
|||||||||||||||||
|
|
Sales By Segment |
|||||||||||||||||
|
|
Unaudited (millions of dollars) |
|||||||||||||||||
|
|
||||||||||||||||||
|
|
For the Three Months Ended |
|||||||||||||||||
|
|
3/31/22 |
6/30/22 |
9/30/22 |
12/31/22 |
3/31/23 |
Change |
||||||||||||
|
|
Sales |
|||||||||||||||||
|
|
Life Insurance: |
|||||||||||||||||
|
|
IUL/UL |
$ |
26 |
$ |
27 |
$ |
40 |
$ |
41 |
$ |
34 | 30.8% | ||||||
|
|
MoneyGuard® |
22 | 24 | 22 | 26 | 21 |
-4.5% |
|||||||||||
|
|
VUL |
34 | 44 | 36 | 49 | 30 |
-11.8% |
|||||||||||
|
|
Term |
43 | 48 | 47 | 39 | 30 |
-30.2% |
|||||||||||
|
|
Executive Benefits |
30 | 50 | 26 | 31 | 15 |
-50.0% |
|||||||||||
|
|
Total Life Insurance |
$ |
155 |
$ |
193 |
$ |
171 |
$ |
186 |
$ |
130 |
-16.1% |
||||||
|
|
||||||||||||||||||
|
|
Annuities: |
|||||||||||||||||
|
|
Indexed variable |
$ |
1,048 |
$ |
1,220 |
$ |
1,246 |
$ |
1,211 |
$ |
1,147 | 9.4% | ||||||
|
|
Other variable without GLBs |
605 | 422 | 374 | 303 | 255 |
-57.9% |
|||||||||||
|
|
Other variable with GLBs |
678 | 536 | 475 | 432 | 445 |
-34.4% |
|||||||||||
|
|
Total variable |
2,331 | 2,178 | 2,095 | 1,946 | 1,847 |
-20.8% |
|||||||||||
|
|
Fixed |
374 | 524 | 1,167 | 1,264 | 1,317 | 252.1% | |||||||||||
|
|
Total Annuities |
$ |
2,705 |
$ |
2,702 |
$ |
3,262 |
$ |
3,210 |
$ |
3,164 | 17.0% | ||||||
|
|
Percent with GLBs |
25.1% | 19.8% | 14.6% | 13.5% | 14.1% | ||||||||||||
|
|
Percent with GLBs, including the impact of VA reinsurance |
17.9% | 14.0% | 11.4% | 11.0% | 12.0% | ||||||||||||
|
|
||||||||||||||||||
|
|
Group Protection: |
|||||||||||||||||
|
|
Life |
$ |
53 |
$ |
62 |
$ |
41 |
$ |
141 |
$ |
82 | 54.7% | ||||||
|
|
Disability |
47 | 59 | 37 | 195 | 40 |
-14.9% |
|||||||||||
|
|
Dental |
5 | 6 | 10 | 20 | 6 | 20.0% | |||||||||||
|
|
Total Group Protection |
$ |
105 |
$ |
127 |
$ |
88 |
$ |
356 |
$ |
128 | 21.9% | ||||||
|
|
Percent employee-paid |
57.0% | 48.5% | 49.4% | 35.7% | 70.3% | ||||||||||||
|
|
||||||||||||||||||
|
|
Retirement Plan Services: |
|||||||||||||||||
|
|
First-year sales |
$ |
1,198 |
$ |
1,210 |
$ |
991 |
$ |
1,059 |
$ |
736 |
-38.6% |
||||||
|
|
Recurring deposits |
2,439 | 1,990 | 2,100 | 1,914 | 2,473 | 1.4% | |||||||||||
|
|
Total Retirement Plan Services |
$ |
3,637 |
$ |
3,200 |
$ |
3,091 |
$ |
2,973 |
$ |
3,209 |
-11.8% |
||||||
|
|
||||||||||||||||||
|
|
||||||||||||||||||
|
|
||||||||||||||||||
|
|
||||||||||||||||||
|
|
||||||||||||||||||
|
|
Page 8 |
|||||||||||||||||
|
|
Lincoln Financial Group |
|||||||||||||||||
|
|
Operating Revenues and General and Administrative Expenses By Segment |
|||||||||||||||||
|
|
Unaudited (millions of dollars) |
|||||||||||||||||
|
|
||||||||||||||||||
|
|
For the Three Months Ended |
|||||||||||||||||
|
|
3/31/22 |
6/30/22 |
9/30/22 |
12/31/22 |
3/31/23 |
Change |
||||||||||||
|
|
Operating Revenues |
|||||||||||||||||
|
|
Life Insurance |
$ |
1,729 |
$ |
1,705 |
$ |
1,623 |
$ |
1,688 |
$ |
1,757 | 1.6% | ||||||
|
|
Annuities |
1,147 | 1,097 | 1,113 | 1,125 | 1,141 |
-0.5% |
|||||||||||
|
|
Group Protection |
1,303 | 1,323 | 1,333 | 1,346 | 1,388 | 6.5% | |||||||||||
|
|
Retirement Plan Services |
318 | 315 | 316 | 325 | 328 | 3.1% | |||||||||||
|
|
Other Operations |
40 | 34 | 36 | 47 | 43 | 7.5% | |||||||||||
|
|
Total segment operating revenues |
$ |
4,537 |
$ |
4,474 |
$ |
4,421 |
$ |
4,531 |
$ |
4,657 | 2.6% | ||||||
|
|
||||||||||||||||||
|
|
General and Administrative Expenses, |
|||||||||||||||||
|
|
Net of Amounts Capitalized |
|||||||||||||||||
|
|
Life Insurance |
$ |
117 |
$ |
115 |
$ |
132 |
$ |
123 |
$ |
134 | 14.5% | ||||||
|
|
Annuities |
112 | 108 | 118 | 110 | 123 | 9.8% | |||||||||||
|
|
Group Protection |
165 | 166 | 182 | 173 | 191 | 15.8% | |||||||||||
|
|
Retirement Plan Services |
69 | 69 | 75 | 75 | 79 | 14.5% | |||||||||||
|
|
Other Operations |
48 | 48 | 70 | 212 | 38 |
-20.8% |
|||||||||||
|
|
Total |
$ |
511 |
$ |
506 |
$ |
577 |
$ |
693 |
$ |
565 | 10.6% | ||||||
|
|
||||||||||||||||||
|
|
General and Administrative Expenses, |
|||||||||||||||||
|
|
Net of Amounts Capitalized, as a Percentage |
|||||||||||||||||
|
|
of Operating Revenues |
|||||||||||||||||
|
|
Life Insurance |
6.8% | 6.8% | 8.2% | 7.3% | 7.6% | ||||||||||||
|
|
Annuities |
9.8% | 9.9% | 10.6% | 9.8% | 10.8% | ||||||||||||
|
|
Group Protection |
12.7% | 12.5% | 13.7% | 12.9% | 13.8% | ||||||||||||
|
|
Retirement Plan Services |
21.8% | 21.9% | 23.7% | 23.2% | 24.0% | ||||||||||||
|
|
Other Operations |
115.7% | 140.2% | 193.6% | 457.7% | 90.0% | ||||||||||||
|
|
Total |
11.3% | 11.3% | 13.1% | 15.3% | 12.1% | ||||||||||||
|
|
||||||||||||||||||
|
|
||||||||||||||||||
|
|
||||||||||||||||||
|
|
||||||||||||||||||
|
|
||||||||||||||||||
|
|
||||||||||||||||||
|
|
||||||||||||||||||
|
|
||||||||||||||||||
|
|
||||||||||||||||||
|
|
Page 9 |
|||||||||||||||||
|
|
Lincoln Financial Group |
|||||||||||||||||
|
|
Operating Commissions and Other Expenses |
|||||||||||||||||
|
|
Unaudited (millions of dollars) |
|||||||||||||||||
|
|
||||||||||||||||||
|
|
For the Three Months Ended |
|||||||||||||||||
|
|
3/31/22 |
6/30/22 |
9/30/22 |
12/31/22 |
3/31/23 |
Change |
||||||||||||
|
|
Operating Commissions and |
|||||||||||||||||
|
|
Other Expenses Incurred |
|||||||||||||||||
|
|
General and administrative expenses |
$ |
562 |
$ |
559 |
$ |
634 |
$ |
750 |
$ |
617 | 9.8% | ||||||
|
|
Commissions |
655 | 652 | 660 | 654 | 615 |
-6.1% |
|||||||||||
|
|
Taxes, licenses and fees |
97 | 79 | 81 | 88 | 94 |
-3.1% |
|||||||||||
|
|
Interest and debt expense |
66 | 68 | 71 | 77 | 83 | 25.8% | |||||||||||
|
|
Expenses associated with reserve financing |
|||||||||||||||||
|
|
and letters of credit |
26 | 27 | 27 | 28 | 30 | 15.4% | |||||||||||
|
|
Total adjusted operating commissions and other |
|||||||||||||||||
|
|
expenses incurred |
1,406 | 1,385 | 1,473 | 1,597 | 1,439 | 2.3% | |||||||||||
|
|
||||||||||||||||||
|
|
Less Amounts Capitalized |
|||||||||||||||||
|
|
General and administrative expenses |
(51) | (53) | (57) | (57) | (52) |
-2.0% |
|||||||||||
|
|
Commissions |
(265) | (281) | (283) | (287) | (242) | 8.7% | |||||||||||
|
|
Taxes, licenses and fees |
(11) | (10) | (9) | (10) | (9) | 18.2% | |||||||||||
|
|
Total amounts capitalized |
(327) | (344) | (349) | (354) | (303) | 7.3% | |||||||||||
|
|
Total expenses incurred, net of amounts |
|||||||||||||||||
|
|
capitalized, excluding amortization |
1,079 | 1,041 | 1,124 | 1,243 | 1,136 | 5.3% | |||||||||||
|
|
||||||||||||||||||
|
|
Amortization |
|||||||||||||||||
|
|
Amortization of DAC, VOBA and other intangibles |
263 | 265 | 265 | 266 | 268 | 1.9% | |||||||||||
|
|
Total operating commissions and other expenses |
$ |
1,342 |
$ |
1,306 |
$ |
1,389 |
$ |
1,509 |
$ |
1,404 | 4.6% | ||||||
|
|
||||||||||||||||||
|
|
||||||||||||||||||
|
|
||||||||||||||||||
|
|
||||||||||||||||||
|
|
||||||||||||||||||
|
|
||||||||||||||||||
|
|
||||||||||||||||||
|
|
||||||||||||||||||
|
|
||||||||||||||||||
|
|
||||||||||||||||||
|
|
||||||||||||||||||
|
|
||||||||||||||||||
|
|
||||||||||||||||||
|
|
Page 10 |
|||||||||||||||||
|
|
Lincoln Financial Group |
|||||||||||||||||
|
|
Interest Rate Yields and Spreads By Segment |
|||||||||||||||||
|
|
Unaudited |
|||||||||||||||||
|
|
||||||||||||||||||
|
|
For the Three Months Ended |
|||||||||||||||||
|
|
3/31/22 |
6/30/22 |
9/30/22 |
12/31/22 |
3/31/23 |
Change |
||||||||||||
|
|
Life Insurance – Interest-Sensitive |
|||||||||||||||||
|
|
Earned rate on reserves |
4.60% | 4.50% | 4.49% | 4.47% | 4.43% | (17) | |||||||||||
|
|
Variable investment income on reserves (1) |
0.54% | 0.36% |
-0.35% |
0.12% | 0.39% | (15) | |||||||||||
|
|
Net investment income yield on reserves |
5.14% | 4.86% | 4.14% | 4.59% | 4.82% | (32) | |||||||||||
|
|
Interest rate credited to contract holders |
3.76% | 3.74% | 3.80% | 3.75% | 3.77% | 1 | |||||||||||
|
|
Interest rate spread |
1.38% | 1.12% | 0.34% | 0.84% | 1.05% | (33) | |||||||||||
|
|
||||||||||||||||||
|
|
Base spreads excluding alternative investment income |
1.07% | 0.99% | 0.93% | 0.95% | 0.90% | (17) | |||||||||||
|
|
Base spreads assuming 10% annualized yield on alternative investments |
1.31% | 1.25% | 1.18% | 1.21% | 1.18% | (13) | |||||||||||
|
|
||||||||||||||||||
|
|
Annuities |
|||||||||||||||||
|
|
Earned rate on reserves |
2.99% | 3.08% | 3.25% | 3.59% | 3.75% | 76 | |||||||||||
|
|
Variable investment income on reserves (1) |
0.23% | 0.11% | 0.01% | 0.01% | 0.01% | (22) | |||||||||||
|
|
Net investment income yield on reserves |
3.22% | 3.19% | 3.26% | 3.60% | 3.76% | 54 | |||||||||||
|
|
Interest rate credited to contract holders |
1.85% | 1.90% | 1.93% | 2.09% | 2.25% | 40 | |||||||||||
|
|
Interest rate spread |
1.37% | 1.29% | 1.33% | 1.51% | 1.51% | 14 | |||||||||||
|
|
Base spreads excluding variable investment income |
1.14% | 1.18% | 1.32% | 1.50% | 1.50% | 36 | |||||||||||
|
|
||||||||||||||||||
|
|
Retirement Plan Services |
|||||||||||||||||
|
|
Earned rate on reserves |
3.45% | 3.49% | 3.62% | 3.74% | 3.81% | 36 | |||||||||||
|
|
Variable investment income on reserves (1) |
0.19% | 0.14% | 0.03% | 0.01% | 0.00% | (19) | |||||||||||
|
|
Net investment income yield on reserves |
3.64% | 3.63% | 3.65% | 3.75% | 3.81% | 17 | |||||||||||
|
|
Interest rate credited to contract holders |
2.56% | 2.55% | 2.57% | 2.56% | 2.67% | 11 | |||||||||||
|
|
Interest rate spread |
1.09% | 1.08% | 1.08% | 1.19% | 1.14% | 5 | |||||||||||
|
|
Base spreads excluding variable investment income |
0.89% | 0.94% | 1.05% | 1.18% | 1.14% | 25 | |||||||||||
|
|
||||||||||||||||||
|
|
Total (2) |
|||||||||||||||||
|
|
Earned rate (3) |
3.80% | 3.77% | 4.01% | 3.98% | 4.08% | 28 | |||||||||||
|
|
Variable investment income (1) (3) |
0.36% | 0.30% |
-0.13% |
0.06% | 0.16% | (20) | |||||||||||
|
|
Net investment income yield (3) |
4.16% | 4.07% | 3.88% | 4.04% | 4.24% | 8 | |||||||||||
|
|
||||||||||||||||||
|
|
(1) Variable investment income consists of commercial mortgage loan prepayment and bond make-whole premiums and investment income on alternative investments. |
|||||||||||||||||
|
|
(2) Includes the results of all of our business segments and Other Operations. |
|||||||||||||||||
|
|
(3) Includes investment yields on reserves and surplus. |
|||||||||||||||||
|
|
||||||||||||||||||
|
|
||||||||||||||||||
|
|
||||||||||||||||||
|
|
Page 11 |
|||||||||||||||||

|
|
Lincoln Financial Group |
|||||||||||||||||
|
|
Income (Loss) from Operations Summary |
|||||||||||||||||
|
|
Unaudited (millions of dollars) |
|||||||||||||||||
|
|
||||||||||||||||||
|
|
For the Three Months Ended |
|||||||||||||||||
|
|
3/31/22 |
6/30/22 |
9/30/22 |
12/31/22 |
3/31/23 |
Change |
||||||||||||
|
|
Income (Loss) from Operations, Pre-Tax |
|||||||||||||||||
|
|
Life Insurance |
$ |
21 |
$ |
74 |
$ |
(2,758) |
$ |
(18) |
$ |
(23) |
NM |
||||||
|
|
Annuities |
371 | 343 | 313 | 319 | 300 |
-19.1% |
|||||||||||
|
|
Group Protection |
(58) | 62 | 15 | 33 | 89 | 253.4% | |||||||||||
|
|
Retirement Plan Services |
67 | 66 | 53 | 61 | 51 |
-23.9% |
|||||||||||
|
|
Other Operations |
(94) | (104) | (136) | (268) | (107) |
-13.8% |
|||||||||||
|
|
Adjusted income (loss) from operations, before |
|||||||||||||||||
|
|
income taxes |
$ |
307 |
$ |
441 |
$ |
(2,513) |
$ |
127 |
$ |
310 | 1.0% | ||||||
|
|
||||||||||||||||||
|
|
Income (Loss) from Operations, After-Tax |
|||||||||||||||||
|
|
Life Insurance |
$ |
23 |
$ |
63 |
$ |
(2,171) |
$ |
(9) |
$ |
(13) |
NM |
||||||
|
|
Annuities |
317 | 294 | 275 | 275 | 274 |
-13.6% |
|||||||||||
|
|
Group Protection |
(46) | 49 | 12 | 26 | 71 | 254.3% | |||||||||||
|
|
Retirement Plan Services |
58 | 55 | 47 | 52 | 43 |
-25.9% |
|||||||||||
|
|
Other Operations |
(78) | (87) | (112) | (210) | (87) |
-11.5% |
|||||||||||
|
|
Adjusted income (loss) from operations, after income |
|||||||||||||||||
|
|
taxes |
$ |
274 |
$ |
374 |
$ |
(1,949) |
$ |
134 |
$ |
288 | 5.1% | ||||||
|
|
||||||||||||||||||
|
|
||||||||||||||||||
|
|
||||||||||||||||||
|
|
||||||||||||||||||
|
|
||||||||||||||||||
|
|
||||||||||||||||||
|
|
||||||||||||||||||
|
|
||||||||||||||||||
|
|
||||||||||||||||||
|
|
||||||||||||||||||
|
|
||||||||||||||||||
|
|
||||||||||||||||||
|
|
||||||||||||||||||
|
|
||||||||||||||||||
|
|
||||||||||||||||||
|
|
||||||||||||||||||
|
|
||||||||||||||||||
|
|
||||||||||||||||||
|
|
||||||||||||||||||
|
|
Page 12 |
|||||||||||||||||
|
|
Lincoln Financial Group |
|||||||||||||||||
|
|
Life Insurance – Select Earnings and Operational Data |
|||||||||||||||||
|
|
Unaudited (millions of dollars) |
|||||||||||||||||
|
|
||||||||||||||||||
|
|
As of or For the Three Months Ended |
|||||||||||||||||
|
|
3/31/22 |
6/30/22 |
9/30/22 |
12/31/22 |
3/31/23 |
Change |
||||||||||||
|
|
Income (Loss) from Operations |
|||||||||||||||||
|
|
Operating revenues: |
|||||||||||||||||
|
|
Insurance premiums |
$ |
277 |
$ |
283 |
$ |
289 |
$ |
297 |
$ |
285 | 2.9% | ||||||
|
|
Fee income |
761 | 754 | 745 | 735 | 776 | 2.0% | |||||||||||
|
|
Net investment income |
688 | 664 | 585 | 650 | 687 |
-0.1% |
|||||||||||
|
|
Operating realized gain (loss) |
(2) | (2) | (2) | (2) | (2) | 0.0% | |||||||||||
|
|
Amortization of deferred gain on |
|||||||||||||||||
|
|
business sold through reinsurance |
4 | 4 | 4 | 4 | 4 | 0.0% | |||||||||||
|
|
Other revenues |
1 | 2 | 2 | 4 | 7 |
NM |
|||||||||||
|
|
Total operating revenues |
1,729 | 1,705 | 1,623 | 1,688 | 1,757 | 1.6% | |||||||||||
|
|
Operating expenses: |
|||||||||||||||||
|
|
Benefits |
1,025 | 926 | 1,041 | 1,079 | 1,152 | 12.4% | |||||||||||
|
|
Interest credited |
325 | 329 | 329 | 325 | 328 | 0.9% | |||||||||||
|
|
Policyholder liability remeasurement (gain) loss |
62 | 85 | 2,708 | (2) | (13) |
NM |
|||||||||||
|
|
Commissions incurred |
156 | 176 | 177 | 189 | 148 |
-5.1% |
|||||||||||
|
|
Other expenses incurred |
202 | 199 | 208 | 210 | 216 | 6.9% | |||||||||||
|
|
Amounts capitalized |
(182) | (204) | (202) | (217) | (174) | 4.4% | |||||||||||
|
|
Amortization |
120 | 120 | 120 | 122 | 123 | 2.5% | |||||||||||
|
|
Total operating expenses |
1,708 | 1,631 | 4,381 | 1,706 | 1,780 | 4.2% | |||||||||||
|
|
Income (loss) from operations before taxes |
21 | 74 | (2,758) | (18) | (23) |
NM |
|||||||||||
|
|
Federal income tax expense (benefit) |
(2) | 11 | (587) | (9) | (10) |
NM |
|||||||||||
|
|
Income (loss) from operations |
$ |
23 |
$ |
63 |
$ |
(2,171) |
$ |
(9) |
$ |
(13) |
NM |
||||||
|
|
||||||||||||||||||
|
|
Effective Federal Income Tax Rate |
-8.7% |
14.7% | 21.3% | 52.0% | 45.0% | ||||||||||||
|
|
||||||||||||||||||
|
|
Average Account Balances, Net of Reinsurance |
$ |
51,203 |
$ |
49,316 |
$ |
47,663 |
$ |
47,963 |
$ |
49,100 |
-4.1% |
||||||
|
|
||||||||||||||||||
|
|
In-Force Face Amount |
|||||||||||||||||
|
|
UL and other |
$ |
361,490 |
$ |
361,565 |
$ |
362,098 |
$ |
363,884 |
$ |
364,101 | 0.7% | ||||||
|
|
Term insurance |
635,123 | 663,140 | 689,101 | 707,747 | 715,495 | 12.7% | |||||||||||
|
|
Total in-force face amount |
$ |
996,613 |
$ |
1,024,705 |
$ |
1,051,199 |
$ |
1,071,631 |
$ |
1,079,596 | 8.3% | ||||||
|
|
||||||||||||||||||
|
|
||||||||||||||||||
|
|
||||||||||||||||||
|
|
||||||||||||||||||
|
|
||||||||||||||||||
|
|
||||||||||||||||||
|
|
Page 13 |
|||||||||||||||||
|
|
Lincoln Financial Group |
|||||||||||||||||
|
|
Annuities – Select Earnings and Operational Data |
|||||||||||||||||
|
|
Unaudited (millions of dollars) |
|||||||||||||||||
|
|
||||||||||||||||||
|
|
As of or For the Three Months Ended |
|||||||||||||||||
|
|
3/31/22 |
6/30/22 |
9/30/22 |
12/31/22 |
3/31/23 |
Change |
||||||||||||
|
|
Income (Loss) from Operations |
|||||||||||||||||
|
|
Operating revenues: |
|||||||||||||||||
|
|
Insurance premiums |
$ |
30 |
$ |
25 |
$ |
57 |
$ |
52 |
$ |
38 | 26.7% | ||||||
|
|
Fee income (1) |
628 | 591 | 574 | 556 | 540 |
-14.0% |
|||||||||||
|
|
Net investment income |
359 | 367 | 348 | 389 | 421 | 17.3% | |||||||||||
|
|
Amortization of deferred gain on |
|||||||||||||||||
|
|
business sold through reinsurance |
6 | 6 | 6 | 6 | 5 |
-16.7% |
|||||||||||
|
|
Other revenues |
124 | 108 | 128 | 122 | 137 | 10.5% | |||||||||||
|
|
Total operating revenues |
1,147 | 1,097 | 1,113 | 1,125 | 1,141 |
-0.5% |
|||||||||||
|
|
Operating expenses: |
|||||||||||||||||
|
|
Benefits |
52 | 48 | 79 | 72 | 63 | 21.2% | |||||||||||
|
|
Interest credited |
207 | 215 | 224 | 248 | 278 | 34.3% | |||||||||||
|
|
Policyholder liability remeasurement (gain) loss |
1 | 1 | 1 |
- |
(1) |
NM |
|||||||||||
|
|
Commissions incurred |
269 | 254 | 254 | 240 | 240 |
-10.8% |
|||||||||||
|
|
Other expenses incurred |
259 | 239 | 251 | 242 | 251 |
-3.1% |
|||||||||||
|
|
Amounts capitalized |
(118) | (110) | (117) | (103) | (98) | 16.9% | |||||||||||
|
|
Amortization |
106 | 107 | 108 | 107 | 108 | 1.9% | |||||||||||
|
|
Total operating expenses |
776 | 754 | 800 | 806 | 841 | 8.4% | |||||||||||
|
|
Income (loss) from operations before taxes |
371 | 343 | 313 | 319 | 300 |
-19.1% |
|||||||||||
|
|
Federal income tax expense (benefit) |
54 | 49 | 38 | 44 | 26 |
-51.9% |
|||||||||||
|
|
Income (loss) from operations |
$ |
317 |
$ |
294 |
$ |
275 |
$ |
275 |
$ |
274 |
-13.6% |
||||||
|
|
||||||||||||||||||
|
|
Effective Federal Income Tax Rate |
14.3% | 14.2% | 12.3% | 13.7% | 8.6% | ||||||||||||
|
|
||||||||||||||||||
|
|
Return on Average Account Balances |
79 | 79 | 76 | 77 | 75 | (4) | |||||||||||
|
|
||||||||||||||||||
|
|
Income (Loss) from Operations |
|||||||||||||||||
|
|
Variable annuity |
279 | 264 | 256 | 238 | 238 |
-14.7% |
|||||||||||
|
|
Fixed annuity |
38 | 30 | 19 | 37 | 36 |
-5.3% |
|||||||||||
|
|
Account Balances, Net of Reinsurance – End-of-Period |
|||||||||||||||||
|
|
Variable account balances without GLBs |
$ |
66,538 |
$ |
59,128 |
$ |
57,720 |
$ |
61,872 |
$ |
64,824 |
-2.6% |
||||||
|
|
Variable account balances with GLBs |
78,837 | 68,468 | 64,057 | 65,877 | 67,274 |
-14.7% |
|||||||||||
|
|
Fixed account balances |
14,557 | 14,469 | 14,810 | 14,989 | 15,053 | 3.4% | |||||||||||
|
|
Total account balances |
$ |
159,932 |
$ |
142,065 |
$ |
136,587 |
$ |
142,738 |
$ |
147,151 |
-8.0% |
||||||
|
|
Percent variable account balances with GLBs |
49.3% | 48.2% | 46.9% | 46.2% | 45.7% | ||||||||||||
|
|
||||||||||||||||||
|
|
(1) Presented net of GLB and GDB hedge allowance of $161 million, $152 million, $148 million, $143 million and $162 million for the periods ended March 31, 2022, June 30, 2022, |
|||||||||||||||||
|
|
September 30, 2022, December 31, 2022 and March 31, 2023, respectively. |
|||||||||||||||||
|
|
||||||||||||||||||
|
|
||||||||||||||||||
|
|
Page 14 |
|||||||||||||||||
|
|
Lincoln Financial Group |
|||||||||||||||||
|
|
Group Protection – Select Earnings and Operational Data |
|||||||||||||||||
|
|
Unaudited (millions of dollars) |
|||||||||||||||||
|
|
||||||||||||||||||
|
|
As of or For the Three Months Ended |
|||||||||||||||||
|
|
3/31/22 |
6/30/22 |
9/30/22 |
12/31/22 |
3/31/23 |
Change |
||||||||||||
|
|
Income (Loss) from Operations |
|||||||||||||||||
|
|
Operating revenues: |
|||||||||||||||||
|
|
Insurance premiums |
$ |
1,169 |
$ |
1,187 |
$ |
1,200 |
$ |
1,213 |
$ |
1,251 | 7.0% | ||||||
|
|
Net investment income |
85 | 86 | 83 | 81 | 85 | 0.0% | |||||||||||
|
|
Other revenues |
49 | 50 | 50 | 52 | 52 | 6.1% | |||||||||||
|
|
Total operating revenues |
1,303 | 1,323 | 1,333 | 1,346 | 1,388 | 6.5% | |||||||||||
|
|
Operating expenses: |
|||||||||||||||||
|
|
Benefits |
1,060 | 952 | 994 | 1,030 | 1,037 |
-2.2% |
|||||||||||
|
|
Interest credited |
1 | 2 | 1 | 1 | 1 | 0.0% | |||||||||||
|
|
Policyholder liability remeasurement (gain) loss |
(22) | (11) | (22) | (48) | (100) |
NM |
|||||||||||
|
|
Commissions incurred |
94 | 96 | 101 | 103 | 106 | 12.8% | |||||||||||
|
|
Other expenses incurred |
217 | 214 | 235 | 223 | 248 | 14.3% | |||||||||||
|
|
Amounts capitalized |
(21) | (24) | (23) | (29) | (25) |
-19.0% |
|||||||||||
|
|
Amortization |
32 | 32 | 32 | 33 | 32 | 0.0% | |||||||||||
|
|
Total operating expenses |
1,361 | 1,261 | 1,318 | 1,313 | 1,299 |
-4.6% |
|||||||||||
|
|
Income (loss) from operations before taxes |
(58) | 62 | 15 | 33 | 89 | 253.4% | |||||||||||
|
|
Federal income tax expense (benefit) |
(12) | 13 | 3 | 7 | 18 | 250.0% | |||||||||||
|
|
Income (loss) from operations |
$ |
(46) |
$ |
49 |
$ |
12 |
$ |
26 |
$ |
71 | 254.3% | ||||||
|
|
||||||||||||||||||
|
|
Effective Federal Income Tax Rate |
21.0% | 21.0% | 21.0% | 21.0% | 21.0% | ||||||||||||
|
|
||||||||||||||||||
|
|
Loss Ratios by Product Line |
|||||||||||||||||
|
|
Life |
91.1% | 80.6% | 71.8% | 74.8% | 80.4% | ||||||||||||
|
|
Disability |
88.8% | 78.7% | 87.7% | 85.7% | 71.4% | ||||||||||||
|
|
Dental |
71.1% | 76.9% | 72.0% | 74.0% | 76.4% | ||||||||||||
|
|
Total |
88.9% | 79.3% | 81.0% | 81.1% | 75.0% | ||||||||||||
|
|
||||||||||||||||||
|
|
||||||||||||||||||
|
|
||||||||||||||||||
|
|
||||||||||||||||||
|
|
||||||||||||||||||
|
|
||||||||||||||||||
|
|
||||||||||||||||||
|
|
||||||||||||||||||
|
|
||||||||||||||||||
|
|
||||||||||||||||||
|
|
Page 15 |
|||||||||||||||||
|
|
Lincoln Financial Group |
|||||||||||||||||
|
|
Retirement Plan Services – Select Earnings and Operational Data |
|||||||||||||||||
|
|
Unaudited (millions of dollars) |
|||||||||||||||||
|
|
||||||||||||||||||
|
|
As of or For the Three Months Ended |
|||||||||||||||||
|
|
3/31/22 |
6/30/22 |
9/30/22 |
12/31/22 |
3/31/23 |
Change |
||||||||||||
|
|
Income (Loss) from Operations |
|||||||||||||||||
|
|
Operating revenues: |
|||||||||||||||||
|
|
Fee income |
$ |
70 |
$ |
65 |
$ |
64 |
$ |
63 |
$ |
64 |
-8.6% |
||||||
|
|
Net investment income |
238 | 241 | 244 | 253 | 255 | 7.1% | |||||||||||
|
|
Other revenues |
10 | 9 | 8 | 9 | 9 |
-10.0% |
|||||||||||
|
|
Total operating revenues |
318 | 315 | 316 | 325 | 328 | 3.1% | |||||||||||
|
|
Operating expenses: |
|||||||||||||||||
|
|
Interest credited |
152 | 155 | 161 | 161 | 167 | 9.9% | |||||||||||
|
|
Commissions incurred |
20 | 18 | 20 | 21 | 21 | 5.0% | |||||||||||
|
|
Other expenses incurred |
79 | 75 | 83 | 83 | 89 | 12.7% | |||||||||||
|
|
Amounts capitalized |
(5) | (5) | (6) | (5) | (5) | 0.0% | |||||||||||
|
|
Amortization |
5 | 6 | 5 | 4 | 5 | 0.0% | |||||||||||
|
|
Total operating expenses |
251 | 249 | 263 | 264 | 277 | 10.4% | |||||||||||
|
|
Income (loss) from operations before taxes |
67 | 66 | 53 | 61 | 51 |
-23.9% |
|||||||||||
|
|
Federal income tax expense (benefit) |
9 | 11 | 6 | 9 | 8 |
-11.1% |
|||||||||||
|
|
Income (loss) from operations |
$ |
58 |
$ |
55 |
$ |
47 |
$ |
52 |
$ |
43 |
-25.9% |
||||||
|
|
||||||||||||||||||
|
|
Effective Federal Income Tax Rate |
14.0% | 15.6% | 12.3% | 15.0% | 16.4% | ||||||||||||
|
|
||||||||||||||||||
|
|
Return on Average Account Balances |
24 | 24 | 21 | 24 | 19 | (5) | |||||||||||
|
|
||||||||||||||||||
|
|
Pre-tax Net Margin |
40.4% | 41.1% | 34.2% | 37.1% | 31.8% | ||||||||||||
|
|
||||||||||||||||||
|
|
Net Flows by Market |
|||||||||||||||||
|
|
Small Market |
$ |
(116) |
$ |
80 |
$ |
157 |
$ |
174 |
$ |
148 | 227.6% | ||||||
|
|
Mid - Large Market |
1,331 | 1,073 | 899 | 298 | 711 |
-46.6% |
|||||||||||
|
|
Multi-Fund® and Other |
(288) | (240) | (251) | (421) | (324) |
-12.5% |
|||||||||||
|
|
||||||||||||||||||
|
|
Net Flows – Trailing Twelve Months |
$ |
931 |
$ |
1,394 |
$ |
2,199 |
$ |
2,696 |
$ |
2,304 | 147.5% | ||||||
|
|
||||||||||||||||||
|
|
||||||||||||||||||
|
|
||||||||||||||||||
|
|
||||||||||||||||||
|
|
||||||||||||||||||
|
|
||||||||||||||||||
|
|
||||||||||||||||||
|
|
||||||||||||||||||
|
|
||||||||||||||||||
|
|
Page 16 |
|||||||||||||||||
|
|
Lincoln Financial Group |
|||||||||||||||||
|
|
Other Operations – Select Earnings and Operational Data |
|||||||||||||||||
|
|
Unaudited (millions of dollars) |
|||||||||||||||||
|
|
||||||||||||||||||
|
|
For the Three Months Ended |
|||||||||||||||||
|
|
3/31/22 |
6/30/22 |
9/30/22 |
12/31/22 |
3/31/23 |
Change |
||||||||||||
|
|
Other Operations |
|||||||||||||||||
|
|
Operating revenues: |
|||||||||||||||||
|
|
Insurance premiums |
$ |
1 |
$ |
3 |
$ |
2 |
$ |
2 |
$ |
5 |
NM |
||||||
|
|
Net investment income |
41 | 40 | 35 | 39 | 35 |
-14.6% |
|||||||||||
|
|
Other revenues |
(2) | (9) | (1) | 6 | 3 | 250.0% | |||||||||||
|
|
Total operating revenues |
40 | 34 | 36 | 47 | 43 | 7.5% | |||||||||||
|
|
Operating expenses: |
|||||||||||||||||
|
|
Benefits |
12 | 14 | 20 | 19 | 20 | 66.7% | |||||||||||
|
|
Interest credited |
12 | 9 | 9 | 8 | 10 |
-16.7% |
|||||||||||
|
|
Policyholder liability remeasurement (gain) loss |
1 | 2 |
- |
2 |
- |
-100.0% |
|||||||||||
|
|
Commissions and other expenses |
12 | 2 | 28 | 160 | 13 | 8.3% | |||||||||||
|
|
Interest and debt expense |
66 | 68 | 71 | 77 | 83 | 25.8% | |||||||||||
|
|
Spark program expense |
31 | 43 | 44 | 49 | 24 |
-22.6% |
|||||||||||
|
|
Total operating expenses |
134 | 138 | 172 | 315 | 150 | 11.9% | |||||||||||
|
|
Income (loss) from operations before taxes |
(94) | (104) | (136) | (268) | (107) |
-13.8% |
|||||||||||
|
|
Federal income tax expense (benefit) |
(16) | (17) | (24) | (58) | (20) |
-25.0% |
|||||||||||
|
|
Income (loss) from operations |
$ |
(78) |
$ |
(87) |
$ |
(112) |
$ |
(210) |
$ |
(87) |
-11.5% |
||||||
|
|
||||||||||||||||||
|
|
||||||||||||||||||
|
|
||||||||||||||||||
|
|
||||||||||||||||||
|
|
||||||||||||||||||
|
|
||||||||||||||||||
|
|
||||||||||||||||||
|
|
||||||||||||||||||
|
|
||||||||||||||||||
|
|
||||||||||||||||||
|
|
||||||||||||||||||
|
|
||||||||||||||||||
|
|
||||||||||||||||||
|
|
||||||||||||||||||
|
|
||||||||||||||||||
|
|
||||||||||||||||||
|
|
||||||||||||||||||
|
|
||||||||||||||||||
|
|
Page 17 |
|||||||||||||||||

|
|
Lincoln Financial Group |
|||||||||||||||||
|
|
Consolidated – DAC, VOBA, DSI and DFEL Roll Forwards |
|||||||||||||||||
|
|
Unaudited (millions of dollars) |
|||||||||||||||||
|
|
||||||||||||||||||
|
|
For the Three Months Ended |
|||||||||||||||||
|
|
3/31/22 |
6/30/22 |
9/30/22 |
12/31/22 |
3/31/23 |
Change |
||||||||||||
|
|
DAC, VOBA and DSI |
|||||||||||||||||
|
|
Balance as of beginning-of-period |
$ |
11,896 |
$ |
11,965 |
$ |
12,050 |
$ |
12,140 |
$ |
12,235 | 2.8% | ||||||
|
|
Deferrals |
328 | 345 | 350 | 357 | 306 |
-6.7% |
|||||||||||
|
|
Operating amortization |
(259) | (260) | (260) | (262) | (264) |
-1.9% |
|||||||||||
|
|
Balance as of end-of-period |
$ |
11,965 |
$ |
12,050 |
$ |
12,140 |
$ |
12,235 |
$ |
12,277 | 2.6% | ||||||
|
|
||||||||||||||||||
|
|
DFEL |
|||||||||||||||||
|
|
Balance as of beginning-of-period |
$ |
4,225 |
$ |
4,416 |
$ |
4,623 |
$ |
4,834 |
$ |
5,052 | 19.6% | ||||||
|
|
Deferrals |
256 | 270 | 273 | 284 | 267 | 4.3% | |||||||||||
|
|
Operating amortization |
(65) | (63) | (62) | (66) | (69) |
-6.2% |
|||||||||||
|
|
Balance as of end-of-period |
$ |
4,416 |
$ |
4,623 |
$ |
4,834 |
$ |
5,052 |
$ |
5,250 | 18.9% | ||||||
|
|
||||||||||||||||||
|
|
DAC, VOBA, DSI and DFEL |
|||||||||||||||||
|
|
Balance as of End-of-Period, After-Tax |
$ |
5,964 |
$ |
5,867 |
$ |
5,772 |
$ |
5,675 |
$ |
5,551 |
-6.9% |
||||||
|
|
||||||||||||||||||
|
|
||||||||||||||||||
|
|
||||||||||||||||||
|
|
||||||||||||||||||
|
|
||||||||||||||||||
|
|
||||||||||||||||||
|
|
||||||||||||||||||
|
|
||||||||||||||||||
|
|
||||||||||||||||||
|
|
||||||||||||||||||
|
|
||||||||||||||||||
|
|
||||||||||||||||||
|
|
||||||||||||||||||
|
|
||||||||||||||||||
|
|
||||||||||||||||||
|
|
||||||||||||||||||
|
|
||||||||||||||||||
|
|
||||||||||||||||||
|
|
||||||||||||||||||
|
|
||||||||||||||||||
|
|
||||||||||||||||||
|
|
Page 18 |
|||||||||||||||||
|
|
Lincoln Financial Group |
|||||||||||||||||
|
|
Life Insurance – Account Balance Roll Forwards |
|||||||||||||||||
|
|
Unaudited (millions of dollars) |
|||||||||||||||||
|
|
||||||||||||||||||
|
|
For the Three Months Ended |
|||||||||||||||||
|
|
3/31/22 |
6/30/22 |
9/30/22 |
12/31/22 |
3/31/23 |
Change |
||||||||||||
|
|
General Account |
|||||||||||||||||
|
|
Balance as of beginning-of-period |
$ |
38,200 |
$ |
38,005 |
$ |
37,791 |
$ |
37,691 |
$ |
37,694 |
-1.3% |
||||||
|
|
Gross deposits |
913 | 935 | 963 | 1,110 | 926 | 1.4% | |||||||||||
|
|
Withdrawals and deaths |
(331) | (300) | (284) | (328) | (393) |
-18.7% |
|||||||||||
|
|
Net flows |
582 | 635 | 679 | 782 | 533 |
-8.4% |
|||||||||||
|
|
Transfers between general and separate accounts |
(6) | 34 | (12) | (14) | 32 |
NM |
|||||||||||
|
|
Policyholder assessments |
(1,113) | (1,121) | (1,123) | (1,138) | (1,128) |
-1.3% |
|||||||||||
|
|
Reinvested interest credited |
371 | 373 | 377 | 374 | 373 | 0.5% | |||||||||||
|
|
Change in fair value of embedded derivative instruments |
(29) | (135) | (21) | (1) | 29 | 200.0% | |||||||||||
|
|
Balance as of end-of-period, gross |
38,005 | 37,791 | 37,691 | 37,694 | 37,533 |
-1.2% |
|||||||||||
|
|
Account balances reinsured |
(5,572) | (5,584) | (5,575) | (5,558) | (5,525) | 0.8% | |||||||||||
|
|
Balance as of end-of-period, net |
$ |
32,433 |
$ |
32,207 |
$ |
32,116 |
$ |
32,136 |
$ |
32,008 |
-1.3% |
||||||
|
|
||||||||||||||||||
|
|
Separate Account |
|||||||||||||||||
|
|
Balance as of beginning-of-period |
$ |
24,785 |
$ |
23,376 |
$ |
20,327 |
$ |
19,382 |
$ |
20,920 |
-15.6% |
||||||
|
|
Gross deposits |
438 | 524 | 443 | 495 | 394 |
-10.0% |
|||||||||||
|
|
Withdrawals and deaths |
(109) | (96) | (120) | (128) | (75) | 31.2% | |||||||||||
|
|
Net flows |
329 | 428 | 323 | 367 | 319 |
-3.0% |
|||||||||||
|
|
Transfers between general and separate accounts |
7 | (34) | 12 | 14 | (32) |
NM |
|||||||||||
|
|
Policyholder assessments |
(225) | (233) | (236) | (244) | (238) |
-5.8% |
|||||||||||
|
|
Change in market value and reinvestment |
(1,520) | (3,210) | (1,044) | 1,401 | 1,193 | 178.5% | |||||||||||
|
|
Balance as of end-of-period, gross |
23,376 | 20,327 | 19,382 | 20,920 | 22,162 |
-5.2% |
|||||||||||
|
|
Account balances reinsured |
(5,215) | (4,498) | (4,209) | (4,421) | (4,606) | 11.7% | |||||||||||
|
|
Balance as of end-of-period, net |
$ |
18,161 |
$ |
15,829 |
$ |
15,173 |
$ |
16,499 |
$ |
17,556 |
-3.3% |
||||||
|
|
||||||||||||||||||
|
|
Total |
|||||||||||||||||
|
|
Balance as of beginning-of-period |
$ |
62,985 |
$ |
61,381 |
$ |
58,118 |
$ |
57,073 |
$ |
58,614 |
-6.9% |
||||||
|
|
Gross deposits |
1,351 | 1,459 | 1,406 | 1,605 | 1,320 |
-2.3% |
|||||||||||
|
|
Withdrawals and deaths |
(440) | (396) | (404) | (456) | (468) |
-6.4% |
|||||||||||
|
|
Net flows |
911 | 1,063 | 1,002 | 1,149 | 852 |
-6.5% |
|||||||||||
|
|
Policyholder assessments |
(1,338) | (1,354) | (1,359) | (1,382) | (1,366) |
-2.1% |
|||||||||||
|
|
Change in market value and reinvestment |
(1,149) | (2,837) | (667) | 1,775 | 1,566 | 236.3% | |||||||||||
|
|
Change in fair value of embedded derivative instruments |
(29) | (135) | (21) | (1) | 29 | 200.0% | |||||||||||
|
|
Balance as of end-of-period, gross |
61,381 | 58,118 | 57,073 | 58,614 | 59,695 |
-2.7% |
|||||||||||
|
|
Account balances reinsured |
(10,787) | (10,082) | (9,784) | (9,979) | (10,131) | 6.1% | |||||||||||
|
|
Balance as of end-of-period, net |
$ |
50,594 |
$ |
48,036 |
$ |
47,289 |
$ |
48,635 |
$ |
49,564 |
-2.0% |
||||||
|
|
||||||||||||||||||
|
|
||||||||||||||||||
|
|
Page 19 |
|||||||||||||||||
|
|
Lincoln Financial Group |
|||||||||||||||||
|
|
Annuities – Account Balance Roll Forwards |
|||||||||||||||||
|
|
Unaudited (millions of dollars) |
|||||||||||||||||
|
|
||||||||||||||||||
|
|
For the Three Months Ended |
|||||||||||||||||
|
|
3/31/22 |
6/30/22 |
9/30/22 |
12/31/22 |
3/31/23 |
Change |
||||||||||||
|
|
Fixed Annuities |
|||||||||||||||||
|
|
Balance as of beginning-of-period |
$ |
22,552 |
$ |
22,307 |
$ |
22,099 |
$ |
22,670 |
$ |
23,365 | 3.6% | ||||||
|
|
Gross deposits |
373 | 523 | 1,137 | 1,252 | 1,317 | 253.1% | |||||||||||
|
|
Full surrenders and deaths |
(420) | (457) | (489) | (547) | (728) |
-73.3% |
|||||||||||
|
|
Other contract benefits |
(143) | (144) | (134) | (181) | (161) |
-12.6% |
|||||||||||
|
|
Net flows |
(190) | (78) | 514 | 524 | 428 |
NM |
|||||||||||
|
|
Policyholder assessments |
(15) | (13) | (10) | (12) | (15) | 0.0% | |||||||||||
|
|
Reinvested interest credited |
124 | 131 | 134 | 143 | 154 | 24.2% | |||||||||||
|
|
Change in fair value of embedded derivative instruments |
(164) | (248) | (67) | 40 | 87 | 153.0% | |||||||||||
|
|
Balance as of end-of-period, gross |
22,307 | 22,099 | 22,670 | 23,365 | 24,019 | 7.7% | |||||||||||
|
|
Account balances reinsured |
(7,750) | (7,630) | (7,860) | (8,376) | (8,966) |
-15.7% |
|||||||||||
|
|
Balance as of end-of-period, net |
$ |
14,557 |
$ |
14,469 |
$ |
14,810 |
$ |
14,989 |
$ |
15,053 | 3.4% | ||||||
|
|
||||||||||||||||||
|
|
Variable Annuities |
|||||||||||||||||
|
|
Balance as of beginning-of-period |
$ |
155,813 |
$ |
145,382 |
$ |
127,604 |
$ |
121,785 |
$ |
127,757 |
-18.0% |
||||||
|
|
Gross deposits |
2,331 | 2,178 | 2,095 | 1,946 | 1,847 |
-20.8% |
|||||||||||
|
|
Full surrenders and deaths |
(1,567) | (1,366) | (1,302) | (1,210) | (1,592) |
-1.6% |
|||||||||||
|
|
Other contract benefits |
(1,099) | (1,019) | (985) | (1,108) | (1,014) | 7.7% | |||||||||||
|
|
Net flows |
(335) | (207) | (192) | (372) | (759) |
NM |
|||||||||||
|
|
Policyholder assessments |
(692) | (655) | (638) | (619) | (624) | 9.8% | |||||||||||
|
|
Change in market value and reinvestment |
(9,007) | (14,974) | (4,650) | 5,804 | 5,191 | 157.6% | |||||||||||
|
|
Change in fair value of embedded derivative instruments |
(397) | (1,942) | (339) | 1,159 | 540 | 236.0% | |||||||||||
|
|
Balance as of end-of-period, gross |
145,382 | 127,604 | 121,785 | 127,757 | 132,105 |
-9.1% |
|||||||||||
|
|
Account balances reinsured |
(7) | (8) | (8) | (8) | (7) | 0.0% | |||||||||||
|
|
Balance as of end-of-period, net |
$ |
145,375 |
$ |
127,596 |
$ |
121,777 |
$ |
127,749 |
$ |
132,098 |
-9.1% |
||||||
|
|
||||||||||||||||||
|
|
Total |
|||||||||||||||||
|
|
Balance as of beginning-of-period |
$ |
178,365 |
$ |
167,689 |
$ |
149,703 |
$ |
144,455 |
$ |
151,122 |
-15.3% |
||||||
|
|
Gross deposits |
2,704 | 2,701 | 3,232 | 3,198 | 3,164 | 17.0% | |||||||||||
|
|
Full surrenders and deaths |
(1,987) | (1,823) | (1,791) | (1,757) | (2,320) |
-16.8% |
|||||||||||
|
|
Other contract benefits |
(1,242) | (1,163) | (1,119) | (1,289) | (1,175) | 5.4% | |||||||||||
|
|
Net flows |
(525) | (285) | 322 | 152 | (331) | 37.0% | |||||||||||
|
|
Policyholder assessments |
(707) | (668) | (648) | (631) | (639) | 9.6% | |||||||||||
|
|
Change in market value, reinvestment and interest credited |
(8,883) | (14,843) | (4,516) | 5,947 | 5,345 | 160.2% | |||||||||||
|
|
Change in fair value of embedded derivative instruments |
(561) | (2,190) | (406) | 1,199 | 627 | 211.8% | |||||||||||
|
|
Balance as of end-of-period, gross |
167,689 | 149,703 | 144,455 | 151,122 | 156,124 |
-6.9% |
|||||||||||
|
|
Account balances reinsured |
(7,757) | (7,638) | (7,868) | (8,384) | (8,973) |
-15.7% |
|||||||||||
|
|
Balance as of end-of-period, net |
$ |
159,932 |
$ |
142,065 |
$ |
136,587 |
$ |
142,738 |
$ |
147,151 |
-8.0% |
||||||
|
|
||||||||||||||||||
|
|
||||||||||||||||||
|
|
Page 20 |
|||||||||||||||||
|
|
Lincoln Financial Group |
|||||||||||||||||
|
|
Retirement Plan Services – Account Balance Roll Forwards |
|||||||||||||||||
|
|
Unaudited (millions of dollars) |
|||||||||||||||||
|
|
||||||||||||||||||
|
|
For the Three Months Ended |
|||||||||||||||||
|
|
3/31/22 |
6/30/22 |
9/30/22 |
12/31/22 |
3/31/23 |
Change |
||||||||||||
|
|
General Account |
|||||||||||||||||
|
|
Balance as of beginning-of-period |
$ |
23,579 |
$ |
23,958 |
$ |
24,917 |
$ |
25,276 |
$ |
25,138 | 6.6% | ||||||
|
|
Gross deposits |
842 | 1,389 | 994 | 787 | 701 |
-16.7% |
|||||||||||
|
|
Withdrawals |
(844) | (743) | (873) | (1,119) | (1,113) |
-31.9% |
|||||||||||
|
|
Net flows |
(2) | 646 | 121 | (332) | (412) |
NM |
|||||||||||
|
|
Transfers between fixed and variable accounts |
234 | 161 | 79 | 36 | 103 |
-56.0% |
|||||||||||
|
|
Policyholder assessments |
(3) | (3) | (3) | (3) | (3) | 0.0% | |||||||||||
|
|
Reinvested interest credited |
150 | 155 | 162 | 161 | 168 | 12.0% | |||||||||||
|
|
Balance as of end-of-period |
$ |
23,958 |
$ |
24,917 |
$ |
25,276 |
$ |
25,138 |
$ |
24,994 | 4.3% | ||||||
|
|
||||||||||||||||||
|
|
Separate Account and Mutual Funds |
|||||||||||||||||
|
|
Balance as of beginning-of-period |
$ |
75,465 |
$ |
71,376 |
$ |
61,782 |
$ |
59,064 |
$ |
63,592 |
-15.7% |
||||||
|
|
Gross deposits |
2,795 | 1,811 | 2,097 | 2,186 | 2,508 |
-10.3% |
|||||||||||
|
|
Withdrawals |
(1,866) | (1,544) | (1,413) | (1,803) | (1,561) | 16.3% | |||||||||||
|
|
Net flows |
929 | 267 | 684 | 383 | 947 | 1.9% | |||||||||||
|
|
Transfers between fixed and variable accounts |
(231) | (166) | (42) | (55) | (104) | 55.0% | |||||||||||
|
|
Policyholder assessments |
(64) | (60) | (57) | (57) | (58) | 9.4% | |||||||||||
|
|
Change in market value and reinvestment |
(4,723) | (9,635) | (3,303) | 4,257 | 3,608 | 176.4% | |||||||||||
|
|
Balance as of end-of-period |
$ |
71,376 |
$ |
61,782 |
$ |
59,064 |
$ |
63,592 |
$ |
67,985 |
-4.8% |
||||||
|
|
||||||||||||||||||
|
|
Total |
|||||||||||||||||
|
|
Balance as of beginning-of-period |
$ |
99,044 |
$ |
95,334 |
$ |
86,699 |
$ |
84,340 |
$ |
88,730 |
-10.4% |
||||||
|
|
Gross deposits |
3,637 | 3,200 | 3,091 | 2,973 | 3,209 |
-11.8% |
|||||||||||
|
|
Withdrawals |
(2,710) | (2,287) | (2,286) | (2,922) | (2,674) | 1.3% | |||||||||||
|
|
Net flows |
927 | 913 | 805 | 51 | 535 |
-42.3% |
|||||||||||
|
|
Transfers between fixed and variable accounts |
3 | (5) | 37 | (19) | (1) |
NM |
|||||||||||
|
|
Policyholder assessments |
(67) | (63) | (60) | (60) | (61) | 9.0% | |||||||||||
|
|
Change in market value and reinvestment |
(4,573) | (9,480) | (3,141) | 4,418 | 3,776 | 182.6% | |||||||||||
|
|
Balance as of end-of-period |
$ |
95,334 |
$ |
86,699 |
$ |
84,340 |
$ |
88,730 |
$ |
92,979 |
-2.5% |
||||||
|
|
||||||||||||||||||
|
|
||||||||||||||||||
|
|
||||||||||||||||||
|
|
||||||||||||||||||
|
|
||||||||||||||||||
|
|
||||||||||||||||||
|
|
||||||||||||||||||
|
|
Page 21 |
|||||||||||||||||

|
|
Lincoln Financial Group |
||||||||||||||||||
|
|
Fixed-Income Asset Class |
||||||||||||||||||
|
|
Unaudited (millions of dollars) |
||||||||||||||||||
|
|
|||||||||||||||||||
|
|
As of 3/31/22 |
As of 12/31/22 |
As of 3/31/23 |
||||||||||||||||
|
|
Amount |
% |
Amount |
% |
Amount |
% |
|||||||||||||
|
|
Fixed Maturity AFS Securities, Net of Allowance for Credit Losses, at Amortized Cost |
||||||||||||||||||
|
|
Industry corporate bonds: |
||||||||||||||||||
|
|
Financial services |
$ |
16,969 | 15.8% |
$ |
17,762 | 15.9% |
$ |
17,615 | 15.8% | |||||||||
|
|
Basic industry |
4,532 | 4.2% | 4,353 | 3.9% | 4,200 | 3.8% | ||||||||||||
|
|
Capital goods |
7,400 | 6.9% | 7,374 | 6.6% | 7,227 | 6.5% | ||||||||||||
|
|
Communications |
4,234 | 3.9% | 4,239 | 3.8% | 4,236 | 3.8% | ||||||||||||
|
|
Consumer cyclical |
6,070 | 5.6% | 6,056 | 5.4% | 5,890 | 5.3% | ||||||||||||
|
|
Consumer non-cyclical |
17,082 | 15.9% | 17,080 | 15.3% | 16,930 | 15.2% | ||||||||||||
|
|
Energy |
4,871 | 4.5% | 4,776 | 4.3% | 4,735 | 4.2% | ||||||||||||
|
|
Technology |
5,242 | 4.9% | 5,581 | 5.0% | 5,724 | 5.1% | ||||||||||||
|
|
Transportation |
3,536 | 3.3% | 3,665 | 3.3% | 3,639 | 3.3% | ||||||||||||
|
|
Industrial other |
2,283 | 2.1% | 2,330 | 2.1% | 2,341 | 2.1% | ||||||||||||
|
|
Utilities |
14,036 | 13.1% | 14,204 | 12.8% | 14,342 | 12.9% | ||||||||||||
|
|
Government-related entities |
1,820 | 1.7% | 1,820 | 1.6% | 1,807 | 1.6% | ||||||||||||
|
|
Residential mortgage-backed securities ("RMBS") |
||||||||||||||||||
|
|
Agency backed |
1,921 | 1.8% | 1,845 | 1.7% | 1,852 | 1.7% | ||||||||||||
|
|
Non-agency backed |
367 | 0.3% | 364 | 0.3% | 365 | 0.3% | ||||||||||||
|
|
Commercial mortgage-backed securities ("CMBS") |
1,656 | 1.5% | 1,917 | 1.7% | 1,905 | 1.7% | ||||||||||||
|
|
Asset-backed securities ("ABS") |
||||||||||||||||||
|
|
Collateralized loan obligations ("CLOs") |
6,646 | 6.2% | 8,498 | 7.6% | 8,721 | 7.8% | ||||||||||||
|
|
Other ABS |
2,399 | 2.2% | 3,294 | 2.9% | 3,479 | 3.1% | ||||||||||||
|
|
Municipals |
5,380 | 5.0% | 5,410 | 4.8% | 5,386 | 4.8% | ||||||||||||
|
|
Government: |
||||||||||||||||||
|
|
United States |
392 | 0.4% | 405 | 0.4% | 399 | 0.4% | ||||||||||||
|
|
Foreign |
358 | 0.3% | 348 | 0.3% | 334 | 0.3% | ||||||||||||
|
|
Hybrid & redeemable preferred securities |
408 | 0.4% | 364 | 0.3% | 362 | 0.3% | ||||||||||||
|
|
Total fixed maturity AFS securities, net of allowance for credit losses, at amortized cost |
107,602 | 100.0% | 111,685 | 100.0% | 111,489 | 100.0% | ||||||||||||
|
|
Trading Securities |
4,348 | 3,833 | 3,546 | |||||||||||||||
|
|
Equity Securities |
307 | 383 | 383 | |||||||||||||||
|
|
Total fixed maturity AFS, trading and equity securities |
$ |
112,257 |
$ |
115,901 |
$ |
115,418 | ||||||||||||
|
|
|||||||||||||||||||
|
|
|||||||||||||||||||
|
|
|||||||||||||||||||
|
|
|||||||||||||||||||
|
|
|||||||||||||||||||
|
|
Page 22 |
||||||||||||||||||
|
|
Lincoln Financial Group |
||||||||||||||||||
|
|
Fixed-Income Credit Quality |
||||||||||||||||||
|
|
Unaudited (millions of dollars) |
||||||||||||||||||
|
|
|||||||||||||||||||
|
|
As of 3/31/22 |
As of 12/31/22 |
As of 3/31/23 |
||||||||||||||||
|
|
Amount |
% |
Amount |
% |
Amount |
% |
|||||||||||||
|
|
Fixed Maturity AFS Securities, Net of Allowance for Credit Losses, at Amortized Cost (1) |
||||||||||||||||||
|
|
NAIC 1 (AAA-A) |
$ |
59,694 | 55.5% |
$ |
63,741 | 57.1% |
$ |
64,244 | 57.6% | |||||||||
|
|
NAIC 2 (BBB) |
44,120 | 41.0% | 44,103 | 39.5% | 43,664 | 39.2% | ||||||||||||
|
|
Total investment grade |
103,814 | 96.5% | 107,844 | 96.6% | 107,908 | 96.8% | ||||||||||||
|
|
|||||||||||||||||||
|
|
NAIC 3 (BB) |
2,148 | 1.9% | 2,101 | 1.9% | 1,900 | 1.7% | ||||||||||||
|
|
NAIC 4 (B) |
1,479 | 1.4% | 1,679 | 1.4% | 1,591 | 1.4% | ||||||||||||
|
|
NAIC 5 (CCC and lower) |
95 | 0.1% | 59 | 0.1% | 70 | 0.1% | ||||||||||||
|
|
NAIC 6 (in or near default) |
66 | 0.1% | 2 | 0.0% | 20 | 0.0% | ||||||||||||
|
|
Total below investment grade |
3,788 | 3.5% | 3,841 | 3.4% | 3,581 | 3.2% | ||||||||||||
|
|
Total |
$ |
107,602 | 100.0% |
$ |
111,685 | 100.0% |
$ |
111,489 | 100.0% | |||||||||
|
|
|||||||||||||||||||
|
|
Commercial Mortgage Loans, at Amortized Cost (1)(2) |
||||||||||||||||||
|
|
CM1 (AAA-A) |
$ |
13,912 | 82.4% |
$ |
13,361 | 78.5% |
$ |
13,195 | 77.5% | |||||||||
|
|
CM2 (BBB) |
2,695 | 16.0% | 3,382 | 19.9% | 3,540 | 20.8% | ||||||||||||
|
|
CM3-7 (BB and lower) |
263 | 1.6% | 271 | 1.6% | 284 | 1.7% | ||||||||||||
|
|
Total |
$ |
16,870 | 100.0% |
$ |
17,014 | 100.0% |
$ |
17,019 | 100.0% | |||||||||
|
|
|||||||||||||||||||
|
|
Total Fixed Maturity AFS Securities and Commercial Mortgage Loans, at Amortized Cost (1)(2) |
||||||||||||||||||
|
|
AAA-A |
$ |
73,606 | 59.1% |
$ |
77,102 | 59.9% |
$ |
77,439 | 60.3% | |||||||||
|
|
BBB |
46,815 | 37.6% | 47,485 | 36.9% | 47,204 | 36.7% | ||||||||||||
|
|
BB and lower |
4,051 | 3.3% | 4,112 | 3.2% | 3,865 | 3.0% | ||||||||||||
|
|
Total |
$ |
124,472 | 100.0% |
$ |
128,699 | 100.0% |
$ |
128,508 | 100.0% | |||||||||
|
|
|||||||||||||||||||
|
|
(1) Ratings are based upon the designations determined and provided by the National Association of Insurance Commissioners (“NAIC”) or based upon ratings from credit rating |
||||||||||||||||||
|
|
agencies to derive the NAIC designation. |
||||||||||||||||||
|
|
(2) CM ratings reflect the risk-based capital risk category for commercial mortgage loans. Letter ratings are assumed NAIC equivalent ratings where NAIC 1 = CM1, NAIC 2 = CM2 |
||||||||||||||||||
|
|
and NAIC 3-6 = CM3-7. |
||||||||||||||||||
|
|
|||||||||||||||||||
|
|
|||||||||||||||||||
|
|
|||||||||||||||||||
|
|
|||||||||||||||||||
|
|
|||||||||||||||||||
|
|
|||||||||||||||||||
|
|
|||||||||||||||||||
|
|
Page 23 |
||||||||||||||||||

|
|
Lincoln Financial Group |
|||||||||||||||||
|
|
Select GAAP to Non-GAAP Reconciliations |
|||||||||||||||||
|
|
Unaudited (millions of dollars) |
|||||||||||||||||
|
|
||||||||||||||||||
|
|
For the Three Months Ended |
|||||||||||||||||
|
|
3/31/22 |
6/30/22 |
9/30/22 |
12/31/22 |
3/31/23 |
Change |
||||||||||||
|
|
Net Income |
|||||||||||||||||
|
|
Net income (loss) |
$ |
1,482 |
$ |
840 |
$ |
(1,775) |
$ |
812 |
$ |
(881) |
NM |
||||||
|
|
Less: |
|||||||||||||||||
|
|
MRB-related impacts, after-tax |
1,062 | (399) | 612 | 1,219 | (506) |
NM |
|||||||||||
|
|
Investment and reinsurance-related realized gain (loss), after-tax: |
|||||||||||||||||
|
|
Changes in CECL reserve for mortgage loans on real estate |
14 | (3) | (7) | (6) | (3) |
NM |
|||||||||||
|
|
Changes in CECL reserve for reinsurance-related assets |
(1) | 3 | (93) | 2 | (1) | 0.0% | |||||||||||
|
|
Changes in the credit loss allowance for fixed maturity AFS securities |
(1) | (3) | (4) | (4) | (14) |
NM |
|||||||||||
|
|
Total credit loss adjustments |
12 | (3) | (104) | (8) | (18) |
NM |
|||||||||||
|
|
Changes in investments and reinsurance-related embedded derivatives (1) |
(11) | (17) | 20 | 10 | (136) |
NM |
|||||||||||
|
|
Total investment and reinsurance-related realized gain (loss), after-tax |
1 | (20) | (84) | 2 | (154) |
NM |
|||||||||||
|
|
Changes in fair value of GLB and GDB hedge instruments, net of hedge allowance, after-tax |
58 | 868 | 302 | (516) | (377) |
NM |
|||||||||||
|
|
Indexed product net derivative results, after-tax |
87 | 23 | (20) | (31) | (135) |
NM |
|||||||||||
|
|
Benefit ratio unlocking, after-tax |
- |
(6) | (2) | 4 | 3 |
NM |
|||||||||||
|
|
Impairment of intangibles |
- |
- |
(634) |
- |
- |
NM |
|||||||||||
|
|
Total adjustments |
1,208 | 466 | 174 | 678 | (1,169) |
NM |
|||||||||||
|
|
Adjusted income (loss) from operations |
$ |
274 |
$ |
374 |
$ |
(1,949) |
$ |
134 |
$ |
288 | 5.1% | ||||||
|
|
||||||||||||||||||
|
|
(1) Includes net losses on disposals of $(31) million on fixed maturity AFS securities, after-tax, and mark-to-market adjustments of $(11) million on equity securities, after-tax, for the quarter |
|||||||||||||||||
|
|
ended March 31, 2023. |
|||||||||||||||||
|
|
||||||||||||||||||
|
|
||||||||||||||||||
|
|
||||||||||||||||||
|
|
||||||||||||||||||
|
|
||||||||||||||||||
|
|
||||||||||||||||||
|
|
||||||||||||||||||
|
|
||||||||||||||||||
|
|
||||||||||||||||||
|
|
||||||||||||||||||
|
|
||||||||||||||||||
|
|
||||||||||||||||||
|
|
||||||||||||||||||
|
|
||||||||||||||||||
|
|
||||||||||||||||||
|
|
Page 24 |
|||||||||||||||||
|
|
Lincoln Financial Group |
|||||||||||||||||
|
|
Select GAAP to Non-GAAP Reconciliations |
|||||||||||||||||
|
|
Unaudited (millions of dollars) |
|||||||||||||||||
|
|
||||||||||||||||||
|
|
For the Three Months Ended |
|||||||||||||||||
|
|
3/31/22 |
6/30/22 |
9/30/22 |
12/31/22 |
3/31/23 |
Change |
||||||||||||
|
|
Revenues |
|||||||||||||||||
|
|
Total revenues |
$ |
4,720 |
$ |
5,577 |
$ |
4,672 |
$ |
3,841 |
$ |
3,814 |
-19.2% |
||||||
|
|
Less: |
|||||||||||||||||
|
|
Investment and reinsurance-related realized gain (loss) |
1 | (25) | (105) | 3 | (196) |
NM |
|||||||||||
|
|
Changes in fair value of GLB and GDB hedge instruments, net of hedge allowance |
73 | 1,099 | 382 | (653) | (476) |
NM |
|||||||||||
|
|
Indexed product net derivative results |
109 | 29 | (25) | (39) | (171) |
NM |
|||||||||||
|
|
Adjusted operating revenues |
$ |
4,537 |
$ |
4,474 |
$ |
4,421 |
$ |
4,531 |
$ |
4,657 | 2.6% | ||||||
|
|
||||||||||||||||||
|
|
Earnings (Loss) Per Common Share – Diluted |
|||||||||||||||||
|
|
Net income (loss) |
$ |
8.39 |
$ |
4.83 |
$ |
(10.47) |
$ |
4.73 |
$ |
(5.37) |
NM |
||||||
|
|
Less: |
|||||||||||||||||
|
|
MRB-related impacts, after-tax |
6.02 | (2.30) | 3.60 | 7.14 | (3.00) |
NM |
|||||||||||
|
|
Investment and reinsurance-related realized gain (loss), after-tax |
- |
(0.12) | (0.49) | 0.01 | (0.91) |
NM |
|||||||||||
|
|
Changes in fair value of GLB and GDB hedge instruments, net of hedge allowance, after-tax |
0.33 | 5.03 | 1.77 | (3.02) | (2.23) |
NM |
|||||||||||
|
|
Indexed product net derivative results, after-tax |
0.49 | 0.13 | (0.11) | (0.18) | (0.79) |
NM |
|||||||||||
|
|
Benefit ratio unlocking, after-tax |
- |
(0.04) | (0.02) | 0.02 | 0.02 |
NM |
|||||||||||
|
|
Impairment of intangibles |
- |
- |
(3.73) |
- |
- |
NM |
|||||||||||
|
|
Adjustment attributable to using different average |
|||||||||||||||||
|
|
diluted shares for adjusted income from operations |
|||||||||||||||||
|
|
as compared to net loss (1) |
- |
- |
- |
- |
0.02 |
NM |
|||||||||||
|
|
Adjusted income (loss) from operations |
$ |
1.55 |
$ |
2.13 |
$ |
(11.49) |
$ |
0.76 |
$ |
1.52 |
-1.9% |
||||||
|
|
||||||||||||||||||
|
|
(1) In periods where a net loss or adjusted loss from operations is presented, basic shares are used in the diluted EPS and adjusted diluted EPS calculations, as the use of diluted shares |
|||||||||||||||||
|
|
would result in a lower loss per share. Due to reporting adjusted income from operations per common share on a different share basis than net loss per common share, we have |
|||||||||||||||||
|
|
included an adjustment to reconcile the two metrics. |
|||||||||||||||||
|
|
||||||||||||||||||
|
|
||||||||||||||||||
|
|
||||||||||||||||||
|
|
||||||||||||||||||
|
|
||||||||||||||||||
|
|
||||||||||||||||||
|
|
||||||||||||||||||
|
|
||||||||||||||||||
|
|
||||||||||||||||||
|
|
||||||||||||||||||
|
|
Page 25 |
|||||||||||||||||
|
|
Lincoln Financial Group |
|||||||||||||||||
|
|
Select GAAP to Non-GAAP Reconciliations |
|||||||||||||||||
|
|
Unaudited (millions of dollars, except per share data) |
|||||||||||||||||
|
|
||||||||||||||||||
|
|
For the Three Months Ended |
|||||||||||||||||
|
|
3/31/22 |
6/30/22 |
9/30/22 |
12/31/22 |
3/31/23 |
Change |
||||||||||||
|
|
Stockholders’ Equity, End-of-Period |
|||||||||||||||||
|
|
Stockholders' equity |
$ |
14,255 |
$ |
9,331 |
$ |
2,783 |
$ |
5,102 |
$ |
6,732 |
-52.8% |
||||||
|
|
Less: |
|||||||||||||||||
|
|
Preferred stock |
- |
- |
- |
986 | 986 |
NM |
|||||||||||
|
|
AOCI |
3,315 | (2,280) | (6,940) | (6,352) | (3,754) |
NM |
|||||||||||
|
|
Stockholders’ equity, excluding AOCI and preferred stock |
10,940 | 11,611 | 9,723 | 10,468 | 9,500 |
-13.2% |
|||||||||||
|
|
MRB-related impacts |
(2,085) | (2,483) | (1,872) | (652) | (1,158) | 44.5% | |||||||||||
|
|
GLB and GDB hedge instruments gains (losses)(1) |
N/A |
N/A |
N/A |
N/A |
(539) | ||||||||||||
|
|
Adjusted stockholders' equity |
$ |
13,025 |
$ |
14,094 |
$ |
11,595 |
$ |
11,120 |
$ |
11,197 |
-14.0% |
||||||
|
|
||||||||||||||||||
|
|
Stockholders’ Equity, Average |
|||||||||||||||||
|
|
Stockholders' equity |
$ |
17,085 |
$ |
11,793 |
$ |
6,057 |
$ |
3,943 |
$ |
5,917 |
-65.4% |
||||||
|
|
Less: |
|||||||||||||||||
|
|
Preferred stock |
- |
- |
- |
493 | 986 |
NM |
|||||||||||
|
|
AOCI |
6,650 | 518 | (4,610) | (6,646) | (5,053) |
NM |
|||||||||||
|
|
Stockholders’ equity, excluding AOCI and preferred stock |
10,435 | 11,275 | 10,667 | 10,096 | 9,984 |
-4.3% |
|||||||||||
|
|
MRB-related impacts |
(2,616) | (2,284) | (2,177) | (1,262) | (905) | 65.4% | |||||||||||
|
|
GLB and GDB hedge instruments gains (losses)(1) |
N/A |
N/A |
N/A |
N/A |
(269) | ||||||||||||
|
|
Adjusted average stockholders' equity |
$ |
13,051 |
$ |
13,559 |
$ |
12,844 |
$ |
11,358 |
$ |
11,158 |
-14.5% |
||||||
|
|
||||||||||||||||||
|
|
Book Value Per Common Share |
|||||||||||||||||
|
|
Book value per share |
$ |
82.93 |
$ |
54.81 |
$ |
16.45 |
$ |
24.32 |
$ |
33.89 |
-59.1% |
||||||
|
|
Less: |
|||||||||||||||||
|
|
AOCI |
19.29 | (13.40) | (41.01) | (37.54) | (22.15) |
NM |
|||||||||||
|
|
Book value per share, excluding AOCI |
63.64 | 68.21 | 57.46 | 61.86 | 56.04 |
-11.9% |
|||||||||||
|
|
Less: |
|||||||||||||||||
|
|
MRB-related gains (losses) |
(12.13) | (14.57) | (11.07) | (3.86) | (6.83) | 43.7% | |||||||||||
|
|
GLB and GDB hedge instruments gains (losses)(1) |
N/A |
N/A |
N/A |
N/A |
(3.18) | ||||||||||||
|
|
Adjusted book value per share |
$ |
75.77 |
$ |
82.78 |
$ |
68.53 |
$ |
65.72 |
$ |
66.05 |
-12.8% |
||||||
|
|
||||||||||||||||||
|
|
(1) For periods beginning on or after January 1, 2023, gains (losses) on our GLB and GDB hedge instruments are excluded from adjusted stockholders' equity to align to the |
|||||||||||||||||
|
|
updated hedge program. |
|||||||||||||||||
|
|
||||||||||||||||||
|
|
||||||||||||||||||
|
|
||||||||||||||||||
|
|
Page 26 |
|||||||||||||||||
This document may not be accurate after its date, and LNC does not undertake to update or keep it accurate after such date.Al CopersinoHead of Investor Relations203-257-4493Albert.Copersino@LFG.com1Q23 Investment SupplementMay 9, 2023 Forward looking statements –cautionary languageCertain statements made in this presentation and in other written or oral statements made by Lincoln or on Lincoln’s behalf are “forward-looking statements” within the meaning of the Private Securities Litigation Reform Act of 1995 (“PSLRA”).
A forward-looking statement is a statement that is not a historical fact and, without limitation, includes any statement that may predict, forecast, indicate or imply future results, performance or achievements. Forward-looking statements may contain words like: “anticipate,”“believe,” “estimate,” “expect,” “project,” “shall,” “will” and other words or phrases with similar meaning in connection with a discussion of future operating or financial performance. In particular, these include statements relating to future actions, trends in Lincoln’s businesses, prospective services or products, future performance or financial results and the outcome of contingencies, such as legal proceedings. Lincoln claims the protection afforded by the safe harbor for forward-looking statements provided by the PSLRA.Forward-looking statements are subject to risks and uncertainties. Actual results could differ materially from those expressed in or implied by such forward-looking statements due to a variety of factors, including: •Weak general economic and business conditions that may affect demand for our products, account balances, investment results, guaranteed benefit liabilities, premium levels and claims experience; •Adverse global capital and credit market conditions that may affect our ability to raise capital, if necessary, and may causeusto realize impairments on investments and certain intangible assets, including goodwill and the valuation allowance against deferred tax assets, which may reduce future earnings and/or affect our financial condition and ability to raise additional capital or refinance existing debt as it matures; •The inability of our subsidiaries to pay dividends to the holding company in sufficient amounts, which could harm the holdingcompany’s ability to meet its obligations;•Legislative, regulatory or tax changes, both domestic and foreign, that affect: the cost of, or demand for, our subsidiaries’products; the required amount of reserves and/or surplus; our ability to conduct business and our captive reinsurance arrangements as well as restrictions on the payment of revenue sharing and 12b-1 distribution fees;•The impact of U.S.
federal tax reform legislation on our business, earnings and capital; •The impact of regulations adopted by the Securities and Exchange Commission (“SEC”), the Department of Labor or other federalorstate regulators or self-regulatory organizations relating to the standard of care owed by investment advisers and/or broker-dealers that could affect our distribution model; •The impact of new and emerging privacy regulations that may lead to increased compliance costs and reputation risk;•Increasing scrutiny and evolving expectations and regulations regarding ESG matters that may adversely affect our reputation andour investment portfolio;•Actions taken by reinsurers to raise rates on in-force business;•Declines in or sustained low interest rates causing a reduction in investment income, the interest margins of our businesses anddemand for our products; •Rapidly increasing interest rates causing policyholders to surrender life insurance and annuity policies, thereby causing realized investment losses;•The impact of the implementation of the provisions of the European Market Infrastructure Regulation relating to the regulation of derivatives transactions;•The initiation of legal or regulatory proceedings against us, and the outcome of any legal or regulatory proceedings, such as: adverse actions related to present or past business practices common in businesses in which we compete; adverse decisions in significant actions including, but not limited to, actions brought byfederal and state authorities and class action cases; new decisions that result in changes in law; and unexpected trial court rulings; Forward looking statements –cautionary language (contd.)•A decline or continued volatility in the equity markets causing a reduction in the sales of our subsidiaries’ products; a reduction of asset-based fees that our subsidiaries charge on various investment and insurance products; and an increase in liabilities related to guaranteed benefit riders, which are accounted for as market risk benefits, of our subsidiaries’ variable annuity products;•Ineffectiveness of our risk management policies and procedures, including our various hedging strategies; •A deviation in actual experience regarding future policyholder behavior, mortality, morbidity, interest rates or equity market returns from the assumptions used in pricing our subsidiaries’ products and in establishing related insurance reserves, which may reduce future earnings; •Changes in accounting principles that may affect our consolidated financial statements;•Lowering of one or more of our debt ratings issued by nationally recognized statistical rating organizations and the adverse effect such action may have on our ability to raise capital and on our liquidity and financial condition;•Lowering of one or more of the insurer financial strength ratings of our insurance subsidiaries and the adverse effect such action may have on the premium writings, policy retention, profitability of our insurance subsidiaries and liquidity;•Significant credit, accounting, fraud, corporate governance or other issues that may adversely affect the value of certain financial assets, as well as counterparties to which we are exposed to credit risk, requiring that we realize losses on financial assets;•Interruption in telecommunication, information technology or other operational systems or failure to safeguard the confidentiality or privacy of sensitive data on such systems, including from cyberattacks or other breaches of our data security systems;•The effect of acquisitions and divestitures, restructurings, product withdrawals and other unusual items;•The inability to realize or sustain the benefits we expect from, greater than expected investments in, and the potential impact of efforts related to, our strategic initiatives, including the Spark Initiative; •The adequacy and collectability of reinsurance that we have obtained;•Pandemics, acts of terrorism, war or other man-made and natural catastrophes that may adversely impact liabilities for policyholder claims, affect our businesses and increase the cost and availability of reinsurance;•Competitive conditions, including pricing pressures, new product offerings and the emergence of new competitors, that may affectthe level of premiums and fees that our subsidiaries can charge for their products;•The unknown effect on our subsidiaries’ businesses resulting from evolving market preferences and the changing demographics of our client base; and•The unanticipated loss of key management, financial planners or wholesalers.The risks and uncertainties included here are not exhaustive. Our most recent Form 10-K, as well as other reports that we file with the SEC, include additional factors that could affect our businesses and financial performance. Moreover, we operate in a rapidly changing and competitive environment. New risk factors emerge from time to time, and it is not possible for management to predict all such risk factors.Further, it is not possible to assess the effect of all risk factors on our businesses or the extent to which any factor, or combination of factors, may cause actual results to differ materially from those contained in any forward-looking statements. Given these risks and uncertainties, investors should not place undue reliance on forward-looking statements as a prediction of actual results. In addition, Lincoln disclaims any obligation to update any forward-looking statements to reflect events or circumstances that occur after the date of this presentation. The reporting of Risk-Based Capital (“RBC”) measures is not intended for the purpose of ranking any insurance company or for usein connection with any marketing, advertising or promotional activities.
 Special note regarding data•All information regarding LNC’s investment portfolio excludes assets related to certain modified coinsurance (“Modco”) transactions. The Modcoinvestment portfolio has counterparty protections in place including investment guidelines, as well as additional support through over-collateralization and a letter of credit that were established to meet LNC’s risk management objectives.
 Portfolio overview
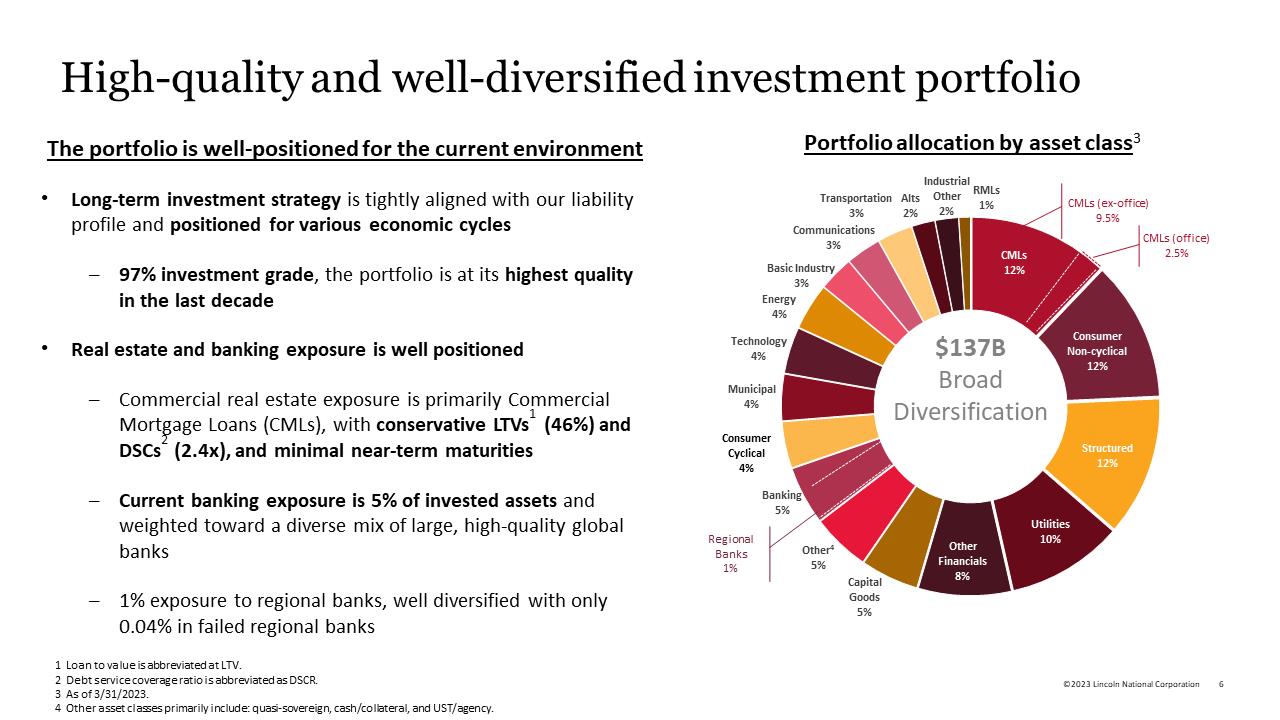 High-quality and well-diversified investment portfolioThe portfolio is well-positionedfor the current environment•Long-term investment strategyistightlyaligned with our liabilityprofile andpositioned forvarious economiccycles–97%investment grade, theportfoliois at its highest qualityin the last decade•Realestate andbanking exposureis well positioned–Commercial real estateexposureisprimarily Commercial MortgageLoans (CMLs), with conservative LTVs1(46%) and DSCs2(2.4x), and minimalnear-term maturities–Currentbanking exposureis 5% ofinvested assetsand weighted toward a diversemixoflarge, high-quality global banks–1%exposure to regional banks, well diversified with only0.04%in failed regional banksPortfolio allocation byasset class3©2023 LincolnNationalCorporationIndustrialRMLsOtherTransportationAlts1%CMLs (ex-office)CMLs (office)3%2%2%9.5%Communications3%CMLs12%ConsumerNoncyclical12%Structured12%Utilities10%OtherFinancials8%2.5%Basic Industry3%Energy4%Technology$137B4%BroadMunicipal4%DiversificationConsumerCyclical4%Banking5%RegionalBanksOther45%CapitalGoods5%1%1Loan tovalueisabbreviatedat LTV.2 Debtservice coverage ratio is abbreviated as DSCR.3 As of 3/31/2023.4Otherasset classes primarilyinclude:quasi-sovereign,cash/collateral, and UST/agency.
High-quality and well-performing fixed incomeportfolioThe portfolioisat its highest qualityinthe last decade•Thefixed incomeportfolioexperienced theseventhconsecutivequarterofpositivenet ratings migration•BBB rated exposure is“up in quality” with majority of exposurerated BBB+/BBBNAIC-2/CM2–~0.1% BBB-onnegative outlook37%•Leveraged multi-manager platform to further de-risk regional bankingexposure during 1Q23–Total net credit losses were$49M3NAIC1/CM160%BBB+14%BBB18%BBB5%NAIC-3-6/CM33%CM30.4%Portfolioallocation byrating197% IG1($128B TotalRated Assets)~0.1% BBB-onnegative outlook21As of 3/31/23.As a % of ratedassetsincludingrated CML assetswhere CM1=NAIC1, CM2=NAIC2, CM3=NAIC3.2NAIC 5-6represents less than $100Mof portfolio| CM4-CM7represents less than $2Mof portfolio3After-tax losses; inclusiveofcreditallowance.©2023 LincolnNationalCorporation Bank exposure is high-quality and well diversifiedby issuerand geography Well-positioned exposureto the banking sector•Banking makesup 5% of invested assetsand is70%senior in capital structure priority•98%ofexposureis investment gradewith averagerating ofA-•Geographically diversifiedin highly-rated developed countries–Focused onlargest banks in each respectivecountry–Noexposure to Swiss AT1 securities•Regional bankexposure at1% ofinvestedassets,highquality,and diversified –$19M of Silicon Valley Bank and $37M of FirstRepublicexposure (0.04% of invested assets)–No exposure to PacWest Bancorp,SilvergateCapital,Signature Bank orWestern Alliance Bancorp1 As of 3/31/2023.Total bank exposureby rating1BIGBBB-BBB9%A59%AA4%BBB+23%$7.5B2%3%Avg.
Rating:A-©2023 LincolnNationalCorporation
High-quality commercialmortgageloan portfolioConservatively positionedCMLportfolio•Disciplinedportfolioconstruction delivering consistentloan performance–Portfolio46%loan tovalueand 2.4x debt service coverage–Virtuallynocreditlosses since2019 or currentloan modifications•Middle marketinvestmentstrategy focused 100%on fixed rate, stabilized seniorloans using conservativelyunderwritten valuation andcashflowassumptions •Robustsurveillance process (e.g.
loan level financialreview, rentroll analysis, stress testing,etc.)•Manageable near-term portfolio maturitiesin 2023 (1%),2024 (3%) and 2025 (4%)–$7.3M average loan sizein 2023-2025•Portfoliowell diversifiedbypropertytype andgeography–Reduced office loan exposure by 400 bpssince 2020 to21%of theCML portfolio–Increased Industrial exposureby 600 bps since2020•No direct commercialreal estateequityexposure1 As of 3/31/2023.2 Excludesassets managedbynon-LFG third-party managers.Property typesOtherMobile Home4%$16.5BApartments33%2%Industrial25%Office21%Retail15%CML portfoliostatistics112.1%Inv Assets$11MAvg Loan Size100%Fixed Rate9.8 YearsRemaining Term2.4xDebtService Coverage46%Loan toValueCredit Quality80%CM120%CM2<1%CM3-6©2023 LincolnNationalCorporation Office portfolio conservatively positioned with limited near-term maturitiesStable performance from office portfolio•Office portfolio credit quality delivering stable loan performance•Position sizing provides diversified exposure across portfolio•Less than 1% of office portfolio or $21.5M is below 1.0x debt service coverage and loan to value greater than 70%•Manageable near-term office loan maturity schedule with average loan size of $7.7M–Remaining 2023 office loan maturities of $34M (1% of office portfolio)–Office loan maturities in 2024 of $164M (5% of office portfolio) and in 2025 $189M (6% of office portfolio)•Disciplined portfolio construction and stress testing reflects our conservative positioning1 As of 3/31/2023.>1.50x1.25 - <1.50x1.00 - <1.25x<1.00xTotal<50%48%1%2%1%52%50-<60%21%5%3%0%28%60-<70%14%1%1%0%16%70-<80%0%0%0%1%1%80-<100%1%1%0%0%2%>100%0%0%0%0%0%Total84%8%6%2%100%Debt service coverageLoan to value$3.4B CML Office Portfolio CML portfolio statistics121%Portion of CML Portfolio2.5%Portion of Total Invested Assets$16MAvg Loan Size8.8 yearsRemaining Term2.3xDebt Service Coverage46%Loan to Value88%OccupancyCredit Quality83%CM117%CM2<1%CM3-6 Othercommercial real estate exposure islimited,high-quality and well-diversifiedREITportfolio highlights1•Total exposureis $1.7B•Portfolio is diversifiedacrossgeographies, MSAs, and propertytypes•Averagerating is BBB+with anaverageposition size of$26M•Office REIT exposure is lessthan $240M orlessthan 0.2% of invested assetsCMBSPortfolio Highlights1•Total exposureis $1.9B•CMBSportfolio is 70%/30% AAA/AA withaveragecredit enhancement of 29%•AverageSASB CMBS position sizeis less than $6M•CMBS office exposure2is 0.1%ofinvested assetsand is rated 59%/38%/3% AAA/AA/A1 Asof3/31/2023.2OfficewithinCMBS definedasSASB OfficeplusCMBS conduitdeals with> 50%exposure to office.Percent oftotal invested assetsREITSCMBS1.3%1.4%1.1%0.2%1.3%0.1%Other REITsOffice REITsOther CMBSOffice CMBS©2023 LincolnNationalCorporation11
 Reinsurance transaction impacts
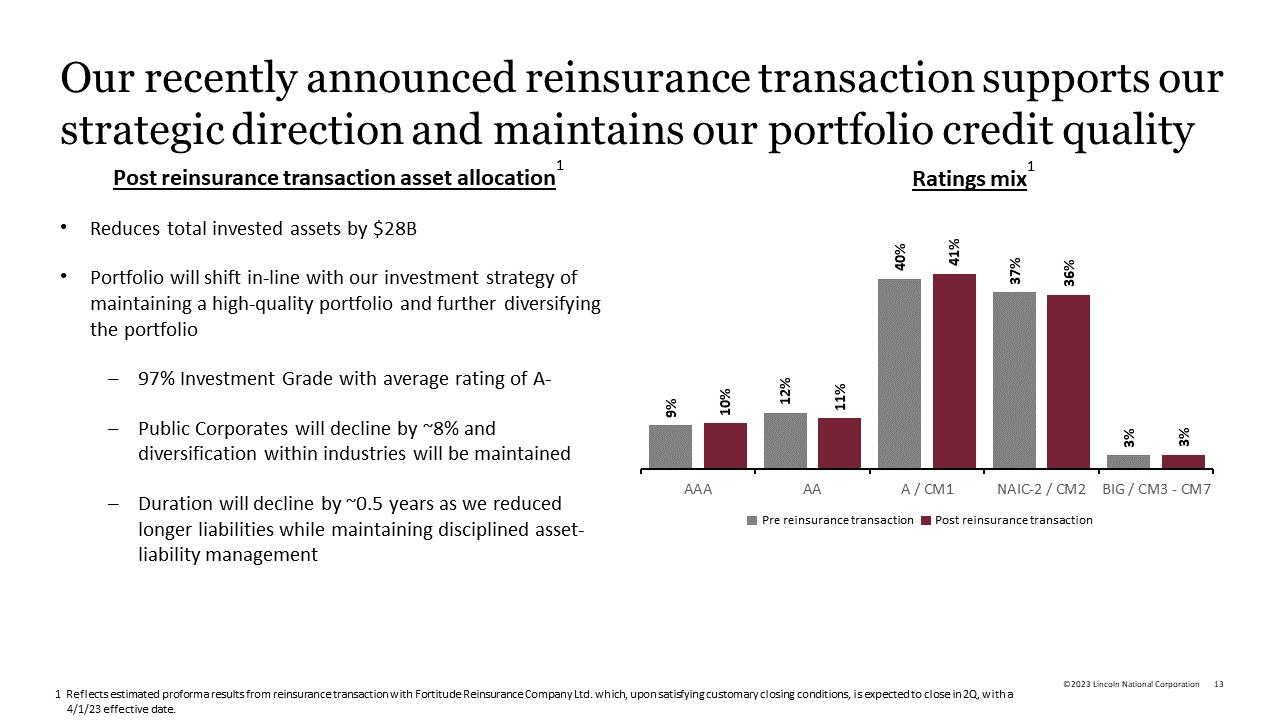 Ourrecently announced reinsurancetransaction supportsourstrategic direction and maintains our portfolio credit qualityPost reinsurance transaction asset allocation1Ratings mix1•Reduces total investedassets by$28B •Portfoliowill shift in-linewithourinvestment strategy ofmaintaining ahigh-quality portfolioand further