株探米国株
日本語 英語
エドガーで原本を確認する
0000051143falseCHX00000511432024-04-242024-04-240000051143exch:XCHIus-gaap:CommonStockMember2024-04-242024-04-240000051143us-gaap:CommonStockMemberexch:XNYS2024-04-242024-04-240000051143ibm:Notes1.125PercentDue2024Memberexch:XNYS2024-04-242024-04-240000051143exch:XNYSibm:Notes2.875PercentDue2025Member2024-04-242024-04-240000051143exch:XNYSibm:Notes0.950PercentDue2025Member2024-04-242024-04-240000051143exch:XNYSibm:Notes0.875PercentDue2025Member2024-04-242024-04-240000051143ibm:Notes0.300PercentDue2026Memberexch:XNYS2024-04-242024-04-240000051143ibm:Notes1.250PercentDue2027Memberexch:XNYS2024-04-242024-04-240000051143ibm:A3375NotesDue2027Memberexch:XNYS2024-04-242024-04-240000051143ibm:Notes0.300PercentDue2028Memberexch:XNYS2024-04-242024-04-240000051143ibm:Notes1.750PercentDue2028Memberexch:XNYS2024-04-242024-04-240000051143ibm:Notes1.500PercentDue2029Memberexch:XNYS2024-04-242024-04-240000051143ibm:Notes0.875PercentDue2030Memberexch:XNYS2024-04-242024-04-240000051143exch:XNYSibm:Notes1.750PercentDue2031Member2024-04-242024-04-240000051143exch:XNYSibm:A3625NotesDue2031Member2024-04-242024-04-240000051143ibm:Notes0.650PercentDue2032Memberexch:XNYS2024-04-242024-04-240000051143ibm:Notes1.250PercentDue2034Memberexch:XNYS2024-04-242024-04-240000051143exch:XNYSibm:A3750NotesDue2035Member2024-04-242024-04-240000051143ibm:A4875NotesDue2038Memberexch:XNYS2024-04-242024-04-240000051143ibm:Notes1.200PercentDue2040Memberexch:XNYS2024-04-242024-04-240000051143exch:XNYSibm:A4000NotesDue2043Member2024-04-242024-04-240000051143ibm:Debentures7.00PercentDue2025Memberexch:XNYS2024-04-242024-04-240000051143ibm:Debentures6.22PercentDue2027Memberexch:XNYS2024-04-242024-04-240000051143ibm:Debentures6.50PercentDue2028Memberexch:XNYS2024-04-242024-04-240000051143ibm:Debentures5.875PercentDue2032Memberexch:XNYS2024-04-242024-04-240000051143exch:XNYSibm:Debentures7.00PercentDue2045Member2024-04-242024-04-240000051143exch:XNYSibm:Debentures7.125PercentDue2096Member2024-04-242024-04-24

UNITED STATES
SECURITIES AND EXCHANGE COMMISSION
WASHINGTON, D.C. 20549
FORM 8-K
CURRENT REPORT PURSUANT TO SECTION 13 OR 15 (d)
OF THE SECURITIES EXCHANGE ACT OF 1934
Date of Report: April 24, 2024
(Date of earliest event reported)
INTERNATIONAL BUSINESS MACHINES CORPORATION
(Exact name of registrant as specified in its charter)
New York 1-2360 13-0871985
(State of Incorporation) (Commission File Number) (IRS employer Identification No.)
One New Orchard Road
Armonk, New York
10504
(Address of principal executive offices) (Zip Code)
914-499-1900
(Registrant’s telephone number)
Check the appropriate box below if the Form 8-K filing is intended to simultaneously satisfy the filing obligation of the registrant under any of the following provisions:
Written communications pursuant to Rule 425 under the Securities Act (17 CFR 230.425)
Soliciting material pursuant to Rule 14a-12 under the Exchange Act (17 CFR 240.14a-12)
Pre-commencement communications pursuant to Rule 14d-2(b) under the Exchange Act (17 CFR 240.14d-2(b))
Pre-commencement communications pursuant to Rule 13e-4(c) under the Exchange Act (17 CFR 240.13e-4(c))
Securities registered pursuant to Section 12(b) of the Act:
Title of each class Trading symbol(s)

Name of each exchange on which registered
Capital stock, par value $.20 per share IBM New York Stock Exchange
NYSE Chicago
1.125% Notes due 2024 IBM 24A New York Stock Exchange
2.875% Notes due 2025 IBM 25A New York Stock Exchange
0.950% Notes due 2025 IBM 25B New York Stock Exchange
0.875% Notes due 2025 IBM 25C New York Stock Exchange
0.300% Notes due 2026 IBM 26B New York Stock Exchange
1.250% Notes due 2027 IBM 27B New York Stock Exchange
3.375% Notes due 2027 IBM 27F New York Stock Exchange
0.300% Notes due 2028 IBM 28B New York Stock Exchange
1.750% Notes due 2028 IBM 28A New York Stock Exchange
1.500% Notes due 2029 IBM 29 New York Stock Exchange
0.875% Notes due 2030 IBM 30A New York Stock Exchange
1.750% Notes due 2031 IBM 31 New York Stock Exchange
3.625% Notes due 2031 IBM 31B New York Stock Exchange
0.650% Notes due 2032 IBM 32A New York Stock Exchange
1.250% Notes due 2034 IBM 34 New York Stock Exchange
3.750% Notes due 2035 IBM 35 New York Stock Exchange
4.875% Notes due 2038 IBM 38 New York Stock Exchange
1.200% Notes due 2040 IBM 40 New York Stock Exchange
4.000% Notes due 2043 IBM 43 New York Stock Exchange
7.00% Debentures due 2025 IBM 25 New York Stock Exchange
6.22% Debentures due 2027 IBM 27 New York Stock Exchange
6.50% Debentures due 2028 IBM 28 New York Stock Exchange
5.875% Debentures due 2032 IBM 32D New York Stock Exchange
7.00% Debentures due 2045 IBM 45 New York Stock Exchange
7.125% Debentures due 2096 IBM 96 New York Stock Exchange
Indicate by check mark whether the registrant is an emerging growth company as defined in Rule 405 of the Securities Act of 1933 (§230.405 of this chapter) or Rule 12b-2 of the Securities Exchange Act of 1934 (§240.12b-2 of this chapter).
Emerging growth company ☐
If an emerging growth company, indicate by check mark if the registrant has elected not to use the extended transition period for complying with any new or revised financial accounting standards provided pursuant to Section 13(a) of the Exchange Act. ☐


Item 7.01. Regulation FD Disclosure.
Exhibit 99.1 of this Form 8-K contains the prepared remarks for IBM's Chairman and Chief Executive Officer Arvind Krishna and Chief Financial Officer Jim Kavanaugh's first-quarter 2024 earnings presentation to investors on April 24, 2024.
The slides for IBM's Chairman and Chief Executive Officer Arvind Krishna and Chief Financial Officer Jim Kavanaugh's first-quarter 2024 earnings presentation on April 24, 2024, are Exhibit 99.2 to this Form 8-K.
Reconciliations of non-GAAP financial measures discussed in the earnings presentation to the most directly comparable financial measures calculated and presented in accordance with GAAP are included in Exhibit 99.2 to this Form 8-K.
The information in this Item 7.01, including the corresponding Exhibits 99.1 and 99.2, is being furnished with the Commission and shall not be deemed “filed” for purposes of Section 18 of the Securities Exchange Act of 1934.
Item 9.01. Financial Statements and Exhibits.
(d)Exhibits
The following exhibits are being furnished as part of this report:
Exhibit No. Description of Exhibit
99.1
99.2

The following exhibit is being filed as part of this report:
Exhibit No. Description of Exhibit
104 Cover Page Interactive Data File (embedded within the Inline XBRL Document)

IBM’s web site (www.ibm.com) contains a significant amount of information about IBM, including financial and other information for investors (www.ibm.com/investor/). IBM encourages investors to visit its various web sites from time to time, as information is updated and new information is posted.
2


SIGNATURE
Pursuant to the requirements of the Securities Exchange Act of 1934, the registrant has duly caused this report to be signed on its behalf by the undersigned, hereunto duly authorized.
Date: April 25, 2024
By: /s/ Nicolás A. Fehring
Nicolás A. Fehring
Vice President and Controller
3
EX-99.1 2 a1q24-ex99x1.htm EX-99.1 a1q24-ex99x1
IBM 1Q24 Earnings Prepared Remarks 1 Introduction Thank you. I’d like to welcome you to IBM’s first quarter 2024 earnings presentation. I’m Olympia McNerney, and I’m here today with Arvind Krishna, IBM’s Chairman and Chief Executive Officer, and Jim Kavanaugh, IBM’s Senior Vice President and Chief Financial Officer. We’ll post today’s prepared remarks on the IBM investor website within a couple of hours, and a replay will be available by this time tomorrow. To provide additional information to our investors, our presentation includes certain non-GAAP measures. For example, all of our references to revenue and signings growth are at constant currency. We’ve provided reconciliation charts for these and other non-GAAP financial measures at the end of the presentation, which is posted to our investor website. Finally, some comments made in this presentation may be considered forward looking under the Private Securities Litigation Reform Act of 1995. These statements involve factors that could cause our actual results to differ materially. Additional information about these factors is included in the company’s SEC filings. So with that, I’ll turn the call over to Arvind. Exhibit 99.1


IBM 1Q24 Earnings Prepared Remarks 2 CEO Perspective Thank you for joining us. In the first quarter, we had solid performance across revenue and cash flow. These results are further proof of the quality of our portfolio and our hybrid cloud and AI strategy. We had good performance in Software, at the high end of our model, continued strength in Infrastructure, above of our model, while Consulting was below model. On a relative basis, Consulting outperformed the market. Our cash flow generation is the strongest first quarter level we have reported in many years. This performance speaks to the strength of our diversified business model.


IBM 1Q24 Earnings Prepared Remarks 3 Creates Leading End-to-End Hybrid and Multi-Cloud Platform Before we get into more detail on the quarter, let me address the announcement of our agreement to acquire HashiCorp, a company we have partnered with for a long time and believe is a tremendous strategic fit with IBM. Enterprise clients are wrestling with an unprecedented expansion in infrastructure and applications across public and private clouds, as well as on-prem environments, making this the ideal time to pursue this acquisition. As generative AI deployment accelerates alongside traditional workloads, developers are working with increasingly heterogeneous, dynamic, and complex infrastructure strategies. HashiCorp has a proven track record of helping clients manage the complexity of today’s infrastructure by automating, orchestrating, and securing hybrid and multi-cloud environments. HashiCorp is a great strategic addition to our portfolio, extending Red Hat’s hybrid cloud capabilities to provide end-to-end automated infrastructure and security lifecycle management. HashiCorp’s technology is foundational to enabling the transition to hybrid and multi-cloud and Terraform is the industry standard for infrastructure automation for these environments. With security top of mind for every enterprise, Vault is a powerful secrets management offering to automate identity security across applications. The combination will also bolster our leading IT automation platform to address the sprawling complexity of AI driven application and infrastructure growth. HashiCorp’s products have widescale adoption in the developer community, highlighting the pervasive nature of their technology – used by


IBM 1Q24 Earnings Prepared Remarks 4 over 85% of the Fortune 500 and downloaded over half a billion times. The acquisition of HashiCorp builds on IBM’s commitment to industry collaboration, the developer community and open-source hybrid cloud and AI innovation. Today’s acquisition is consistent with our M&A strategy. We have taken a disciplined approach to M&A and HashiCorp aligns well across all our key criteria to continue to focus and strengthen our portfolio on hybrid cloud and AI, deliver synergies with the rest of IBM and be near term accretive to free cash flow. I will now turn it to Jim to discuss the financial implications.


IBM 1Q24 Earnings Prepared Remarks 5 Together We Unlock Value and Drive Growth Thank you, Arvind. Let me start with the details of the transaction. We have agreed to acquire HashiCorp for $6.4 billion of enterprise value, to be funded by cash on hand. The transaction was approved by HashiCorp’s board of directors. Closing is anticipated by the end of 2024, subject to approval by HashiCorp’s shareholders, regulatory approvals and other customary closing conditions. We have been executing a disciplined capital allocation strategy and the acquisition of HashiCorp meets all of our criteria including strategic fit as Arvind just walked through, synergies across IBM, and financial accretion. Let me start by addressing synergies. We see multiple drivers of product synergies within IBM and accelerating growth for HashiCorp. Product synergies span across multiple strategic growth areas for IBM including Red Hat, watsonx, data security, IT Automation, and Consulting. For example, the powerful combination of Red Hat’s Ansible Automation Platform’s configuration management and Terraform’s automation will simplify provisioning and configuration of applications across hybrid cloud environments. We are well positioned to drive growth for HashiCorp by leveraging IBM’s enterprise incumbency and global reach. With 70% of their revenue today coming from the U.S., the opportunity to scale HashiCorp across IBM’s operations in 175 countries is significant. We also believe we can accelerate HashiCorp’s adoption with IBM clients. To put this in perspective, only about 20% of the Forbes Global 2000 are HashiCorp customers and just a quarter of HashiCorp’s customers result in more than $100k annual recurring revenue, underscoring the opportunity to better monetize and upsell their products. Bringing it all together, the acquisition allows us to deliver a more comprehensive hybrid


IBM 1Q24 Earnings Prepared Remarks 6 cloud offering to enterprise clients, enhancing IBM’s ability to capture global cloud opportunity. This will drive a higher growth profile over time. Finally, we expect to realize operating efficiencies and expect the transaction to be accretive to Adjusted EBITDA within the first full year post close and to free cash flow in year two. Significant near-term cost synergies underpin the financial profile of the transaction, while product synergies represent further upside. We are very comfortable with our strong balance sheet, liquidity profile, and solid investment grade rating and remain committed to our dividend policy. I’ll now turn it back to Arvind.


IBM 1Q24 Earnings Prepared Remarks 7 CEO Perspective Now turning back to the quarter, let me start with a few comments on the macro-economic environment. We expect the global economy to behave similarly to last year albeit with some uncertainty due to persistently high interest rates. There are reasons to believe technology will be even more important in 2024 as clients focus on productivity improvements and customer experience. AI-driven productivity in particular continues to be a top priority for businesses for both cost reductions and new revenue opportunities. I will now provide some details on the execution of our strategy around hybrid cloud and AI. Enterprise AI continues to gain traction. This year we anticipate more clients moving from experimenting to deploying AI at scale to unlock productivity. We are pleased with the solid progress of our AI offerings. Each quarter, we are winning more clients, expanding partnerships and introducing new innovations. Inception to date, our book of business related to watsonx and generative AI is greater than $1 billion, with sequential quarter over quarter growth. Similar to last quarter, this remains weighted towards Consulting. We believe our comprehensive AI strategy is well positioned to help clients scale AI. We developed our watsonx platform for clients to build their AI solutions, spanning from foundation model training to data preparation and governance. This includes both IBM Granite models and third-party models, giving our clients variety as well as the efficiency and focus on enterprise domains that IBM brings. We have leveraged watsonx to build AI assistants through our software portfolio. Our consultants are helping clients navigate the AI landscape. And finally, we are seeing our


IBM 1Q24 Earnings Prepared Remarks 8 Infrastructure segment play a larger role as clients leverage their hardware investments in their AI strategies. Let me touch on these Infrastructure dynamics briefly. As AI becomes widely adopted, IBM Z is uniquely advantaged. We believe a lot of AI inferencing will happen where the data is for security, efficiency and latency reasons. Our full stack focus, from on-chip AI processing, to AI accelerator cards, to watsonx platform support, allows models to be built and trained on any platform, and easily deployed on IBM Z. The Telum chip is a unique differentiator, enabling real-time AI inferencing. Generative AI is also driving lift for our Storage offerings where industry- leading performance and scalability is utilized for data-curation, model- building, and fine-tuning. For enterprises to deploy AI at scale, AI is not a one-size-fits-all proposition. It requires tuned, domain specific models trained with quality data to maximize its impact. Clients value the flexibility of our approach. They appreciate having the ability to leverage a combination of AI models, whether they are IBM’s, their own models, or open-source models, such as Llama from Meta and Mixtral from Mistral. And they can deploy these AI models across multiple environments. The flexibility we offer is resonating as there are use cases for both large and more efficient models. We are committed to an open innovation ecosystem around AI, to help our clients maximize flexibility and leverage skills. Let me spend a minute on our progress in this area. We see early parallels to Linux in making open- source AI models performant for enterprise use. We believe that IBM with Red Hat can be a key driver of open-source AI. As you know, we have done a lot of work with AI models and recently released a family of state-of-the- art open-source code models from our Granite series. Red Hat and IBM also recently launched InstructLab to evolve and improve AI models


IBM 1Q24 Earnings Prepared Remarks 9 through incremental community contributions, much like open-source software. This open strategy is resonating around the world. We recently announced a collaboration with the Spanish government to leverage IBM’s investments across the entire AI stack and open source to build the world’s leading suite of foundation models proficient in the Spanish language. Enterprise use cases addressing code modernization, customer service and digital labor remain top of mind for our clients. This quarter we signed a multiyear contract with Providence Health to reimagine talent and HR workflows with AI from IBM and partners. We’re also providing data- driven insights and enabling Spanish-language narration for this year’s Masters golf tournament. Our partner ecosystem remains essential to both AI and hybrid cloud growth. This quarter, we progressed strategic partnerships with a number of industry leaders. Consulting joined forces with NVIDIA to accelerate clients' AI journeys. ServiceNow will embed watsonx AI capabilities into the ServiceNow platform to accelerate enterprise digital transformation. We also expanded our relationship with Adobe around OpenShift and watsonx as it relates to the Adobe Experience Platform. We continue to invest in emerging technology as well, bringing new innovations to the market. Since we put the world’s first quantum system on the cloud in 2016, we have deployed over 80 quantum systems and our users have run over three trillion programs to date. We just installed a Quantum System One at Rensselaer Polytechnic Institute. This is the first IBM quantum system on a college campus anywhere in the world. This installation will advance research in critical areas such as energy storage, materials science, and financial modeling. As always, focusing our portfolio remains a key priority. We closed the sale of The Weather


IBM 1Q24 Earnings Prepared Remarks 10 Company in the first quarter and expect to close the announced acquisition of StreamSets and webMethods from Software AG by mid- year. Overall, we had a positive start to the year which gives us confidence in our next quarter and full year expectations. Jim will now take you through the details of the quarter. Jim, over to you.


IBM 1Q24 Earnings Prepared Remarks 11 Financial Highlights Thanks Arvind. In the first quarter, we delivered $14.5 billion in revenue, $3.0 billion of adjusted EBITDA, $1.7 billion of operating pre-tax income and $1.68 operating earnings per share. And we generated free cash flow of $1.9 billion, up approximately $600 million year over year. Our revenue for the quarter was up 3% at constant currency. We saw an impact to our top-line performance from the closing of The Weather Company earlier than expected in the quarter. Software grew by 6%, with growth across Hybrid Platform & Solutions and Transaction Processing, and continued strength in our recurring revenue base. Consulting was up 2%, reflecting organic growth. We continue to have solid signings performance and a trailing twelve-month book to bill of over 1.15. Infrastructure had strong performance, delivering growth across all of our hardware offerings. Looking at our profit metrics, we expanded operating gross margin by 100 basis points and operating pre-tax margin by 130 basis points over last year, inclusive of about a 100-basis point currency headwind to pre-tax margin. At the end of January, we closed on the divestiture of The Weather Company, generating a pre-tax gain of $241 million in the quarter. Mitigating that benefit, we took charges of $374 million to address workforce rebalancing. Operating pre-tax margin was up 50 basis points, excluding the year-over-year impacts of workforce rebalancing and divestiture dynamics. We are pleased with this performance, in line with our guidance of roughly 50 basis points of operating pre-tax margin improvement in 2024. Margin expansion was driven by our operating leverage, product mix and ongoing productivity initiatives. This allowed for continued investments to drive innovation which you can see in our higher


IBM 1Q24 Earnings Prepared Remarks 12 R&D expense. The timing of discrete tax items this quarter resulted in an operating tax rate of about 6%. We are still expecting a full year operating tax rate consistent with last year. Overall, the combination of our revenue and operating margin performance resulted in 7% growth in our Adjusted EBITDA. This contributed to our free cash flow performance. For the quarter, we generated $1.9 billion of free cash flow, up $600 million year over year. This growth reflects the performance of our underlying business with Adjusted EBITDA up $200 million year-over-year and about $400 million from timing of balance sheet dynamics and capex. Over the last twelve months, we generated free cash flow of $11.8 billion. This puts us on track to deliver about $12 billion of free cash flow for the year with the growth largely driven by Adjusted EBITDA. Since our acquisition of Red Hat, excluding 2021 when we spun off Kyndryl, our operating net income to free cash flow realization averaged 120%. Two factors drive this. One is stock based compensation which today represents 15 points of realization. And two, given the shift in our portfolio to a growing software business, deferred income also contributes to our realization. In terms of cash uses, we returned $1.5 billion to shareholders in the form of dividends. From a balance sheet perspective, we have a very strong liquidity position with cash of $19.3 billion, up from $13.5 billion at year end 2023. Our debt balance at the end of the first quarter was $59.5 billion, including $9.9 billion from our financing business.


IBM 1Q24 Earnings Prepared Remarks 13 Software Turning to the segments, Software revenue grew 6%, with good performance across both Hybrid Platform & Solutions and Transaction Processing. As mentioned in January, the Software revenue growth drivers for the year include Red Hat growth, acquisitions, strong recurring revenue and Transaction Processing – and this is just how the first quarter played out. Hybrid Platforms & Solutions revenue was up 7%. Let me spend a minute on the various elements. Red Hat revenue grew 9%, reflecting solid performance across the three key solutions – RHEL, OpenShift and Ansible. Annual bookings growth was again in the mid-teens with OpenShift up over 40% this quarter and RHEL and Ansible each up double digits. Beyond Red Hat, recent acquisitions contributed to the growth profile of Hybrid Platforms & Solutions, as did new innovation areas including watsonx. The combination of Apptio, acquired mid-last year, and our IT Automation portfolio has delivered strong results, unlocking the full benefits of a FinOps solution for technology investments across hybrid cloud environments. In fact, just this quarter we partnered with Microsoft to bring Apptio to Azure and will co-sell to our joint customers and Microsoft has agreed to adopt Apptio’s capabilities in parts of their organization. Our revenue performance continues to reflect growth in our high-value, recurring revenue base. Our ARR, after removing The Weather Company and security services, is now $13.9 billion, up over 8% since last year. Transaction Processing, with its strong base of recurring revenue, delivered revenue growth of 4%. Clients continue to value this portfolio of mission-critical software, supporting growing workloads on our hardware


IBM 1Q24 Earnings Prepared Remarks 14 platforms. And there’s an increasing interest in generative AI application modernization capabilities like watsonx Code Assistant for Z. Software segment profit was up 80 basis points while absorbing both key investments in innovation and about a point of currency impact in the quarter. We continue to deliver operating leverage driven by our revenue performance this quarter.


IBM 1Q24 Earnings Prepared Remarks 15 Consulting Our Consulting revenue was up 2%. We continue to see clients prioritizing large data and technology transformation projects focused on driving productivity with AI and analytics. These results reflect the organic performance of our business. Solid demand for our offerings led to signings growth of 4%, our highest absolute first quarter signings in recent history and our trailing twelve-month book-to-bill ratio remains over 1.15. Our overall backlog remains healthy, up 7% year over year and backlog erosion levels remain stable. At the same time, we saw both a lengthening of backlog duration driven by large scale digital transformations and a reduced level of revenue realization in the quarter as clients tightened discretionary spending. Contributing to growth across the business this quarter, our strategic partnerships continue to make up over 40% of our Consulting revenue with both AWS and Azure practices growing double digits. Additionally, our Red Hat practice grew revenue double digits. Expanding upon our partnerships, we are leveraging Microsoft Copilot to drive productivity for our clients. Just as we quickly ramped a meaningful book of business around Red Hat to address the hybrid cloud opportunity, we are ahead of pace at this stage with our generative AI book of business. Turning to our lines of business, Business Transformation revenue grew 3%, led by supply chain and finance transformations. Customer experience transformations also contributed to growth. Technology Consulting revenue was also up 3% with double digit growth in cloud modernization projects and both strategic partnerships and Red Hat engagements delivered double digit growth. Application Operations revenue declined reflecting weakness in on-prem custom application


IBM 1Q24 Earnings Prepared Remarks 16 management projects, partially offset by strength in cloud-based application management offerings. Moving to Consulting profit, we delivered over 8% of segment profit margin, which is flat year to year. Our segment profit margin was impacted by about a point of currency, offsetting improvements from pricing and productivity actions we have taken.


IBM 1Q24 Earnings Prepared Remarks 17 Infrastructure Moving to Infrastructure, revenue grew reflecting growth in Hybrid Infrastructure of 6% and declines in Infrastructure Support of 7%. Within Hybrid Infrastructure, growth was broad-based with strong demand for our hardware offerings across IBM Z, Power and Storage. In IBM Z revenue was up 5% in the eighth quarter of z16 product availability. Now two years in, this product cycle continues to resonate with clients and surpass z15 revenue performance. IBM Z is uniquely positioned for AI with the first processor designed with on-chip acceleration for real-time AI inferencing. In fact, we’re working with over 100 clients on the application of AI on z16. Use cases range from fraud detection to anti- money laundering to anomaly detection. This remains an enduring platform, driving not just hardware adoption but also related software, storage and services. Distributed Infrastructure delivered 7% revenue growth with strength in both Power and Storage. Power performance was fueled by demand for data intensive workloads. Storage delivered strong double digit revenue growth including demand for high-end storage tied to the z16 cycle. And clients are also looking to our storage offerings for data-curation, model-building, and fine-tuning in support of generative AI. Looking at Infrastructure profit, we delivered both gross profit and segment profit margin expansion. Segment profit margin expanded 20 basis points in the quarter, reflecting benefits from productivity, while absorbing about a point of impact from currency.


IBM 1Q24 Earnings Prepared Remarks 18 Summary Now, let me bring it back to the IBM level to wrap up. More than two years into our mid-term model, we are a more focused business that has delivered sustained revenue and free cash flow growth. Over this time, we’ve continued to invest organically and inorganically, bring new products and innovation to market, expand our ecosystem and drive productivity across our business. Our first quarter performance is another proof point of this progress with constant currency revenue growth, operating gross margin and operating pre-tax margin expansion, and the strongest first quarter free cash flow in many years. Looking to the full year 2024, we are holding our view on our two primary metrics, revenue and free cash flow. We see full year constant currency revenue growth in line with our mid-single digit model, still prudently at the low-end. And for free cash flow, we expect to generate about $12 billion dollars, driven primarily by growth in Adjusted EBITDA. On the segments, in Software, we had a solid start to the year and continue to expect growth slightly above the high-end of our mid-single digit model. In Consulting, we continue to see strong demand for digital transformations– though as I said, we are seeing some pressure on smaller more discretionary projects. We now see mid-single digit revenue growth in Consulting, with acceleration throughout the year. Given our ongoing productivity initiatives and investment in innovation, we expect to see about a point of segment profit margin expansion in both of these segments. And in Infrastructure, given product cycle dynamics, we expect revenue to decline, driving about a half a point impact to our overall growth. Given IBM Z cycle dynamics, we expect segment profit margin to be lower year over year.


IBM 1Q24 Earnings Prepared Remarks 19 With these segment dynamics, we continue to expect IBM’s operating pre- tax margin to expand by about a half a point year to year, consistent with our view 90 days ago. And we are maintaining our view of operating tax for the year, to be consistent with last year, in the mid-teens range. We took a workforce rebalancing charge this quarter and as I mentioned 90 days ago, we continue to see the overall amount this year consistent with last year. We expect this to pay back by the end of the year. On currency, given the strengthening of the dollar, we now expect a 150 to 200 basis point impact to revenue growth for the year, which is about one point worse than 90 days ago. For the second quarter, I expect our constant currency revenue growth rate to be consistent with the full year. Our tax rate is expected to be in the high teens. And for profit, we expect the first half skew of net income will remain a couple points ahead of the prior year. In closing, we are pleased with our performance to start the quarter. We are positioned to grow revenue, expand operating profit margin and grow free cash flow for the year. Arvind and I are now happy to take your questions. Olympia, lets get started.


IBM 1Q24 Earnings Prepared Remarks 20 Closing Thank you, Jim. Before we begin the Q&A, I’d like to mention a couple of items. First, supplemental information is provided at the end of the presentation. And then second, as always, I’d ask you to refrain from multi-part questions. Operator, let’s please open it up for questions.


EX-99.2 3 a1q24-ex99x2.htm EX-99.2 a1q24-ex99x2
April 24, 2024 ibm.com/investor 1Q 2024 Earnings Exhibit 99.2


Forward-looking statements and non-GAAP information Certain comments made in this presentation may be characterized as forward looking under the Private Securities Litigation Reform Act of 1995. Forward- looking statements are based on the company’s current assumptions regarding future business and financial performance. Those statements by their nature address matters that are uncertain to different degrees. Those statements involve a number of factors that could cause actual results to differ materially. Additional information concerning these factors is contained in the Company’s filings with the SEC. Copies are available from the SEC, from the IBM website, or from IBM Investor Relations. Statements in this communication regarding IBM and HashiCorp that are forward-looking may include projections as to closing date for the transaction, the extent of, and the time necessary to obtain, the regulatory approvals required for the transaction, the anticipated benefits of the transaction, the impact of the transaction on IBM’s business, the synergies from the transaction or the combined company’s future operating results. Any forward-looking statement made during this presentation speaks only as of the date on which it is made. The company assumes no obligation to update or revise any forward-looking statements except as required by law; these charts and the associated remarks and comments are integrally related and are intended to be presented and understood together. In an effort to provide additional and useful information regarding the company’s financial results and other financial information as determined by generally accepted accounting principles (GAAP), the company also discusses, in its earnings press release and presentation materials, certain non-GAAP information including operating earnings and other “operating” financial measures, free cash flow, net cash from operating activities excluding IBM Financing receivables, adjusted EBITDA and adjustments for currency. The rationale for management’s use of this non-GAAP information is included as Exhibit 99.2 to the company’s Form 8-K submitted to the SEC on April 24, 2024. The reconciliation of non- GAAP information to GAAP is included in the press release within Exhibit 99.1 to the company’s Form 8-K submitted to the SEC on April 24, 2024, as well as on the slides entitled “Non-GAAP supplemental materials” in this presentation. To provide better transparency, the company also discusses management performance metrics including annual recurring revenue, annual bookings, signings, and book-to-bill. The metrics are used to monitor the performance of the business and are viewed as useful decision-making information for management and stakeholders. The rationale for management’s use of these performance metrics and their calculation are included in Exhibit 99.2 to the company’s Form 8-K submitted to the SEC on April 24, 2024, and in the Management Discussion section of the company’s 2023 Annual Report, which is Exhibit 13 to the Form 10-K submitted with the SEC on February 26, 2024. For other related information please visit the Company’s investor relations website at: https://www.ibm.com/investor/events/earnings-1Q24 2


3 Arvind Krishna Chairman and Chief Executive Officer James Kavanaugh SVP, Finance & Operations and Chief Financial Officer


“We began the year with solid revenue and free cash flow growth, reflecting the strength of our hybrid cloud and AI strategy. We continue to capitalize on the excitement and demand for enterprise AI from our clients. Our book of business for watsonx and generative AI again showed strong momentum, growing quarter over quarter, and has now eclipsed one billion dollars since we launched watsonx in mid-2023. As a result, for the full year, we continue to expect revenue performance in line with our mid-single digit model and about $12 billion in free cash flow. To strengthen our position in today’s hybrid cloud and AI- driven technology landscape, we also announced our intent to acquire HashiCorp. IBM’s and HashiCorp’s combined portfolios will help clients manage growing application and infrastructure complexity and create a comprehensive hybrid cloud platform designed for the AI era.” Arvind Krishna IBM Chairman and CEO 4 CEO perspective
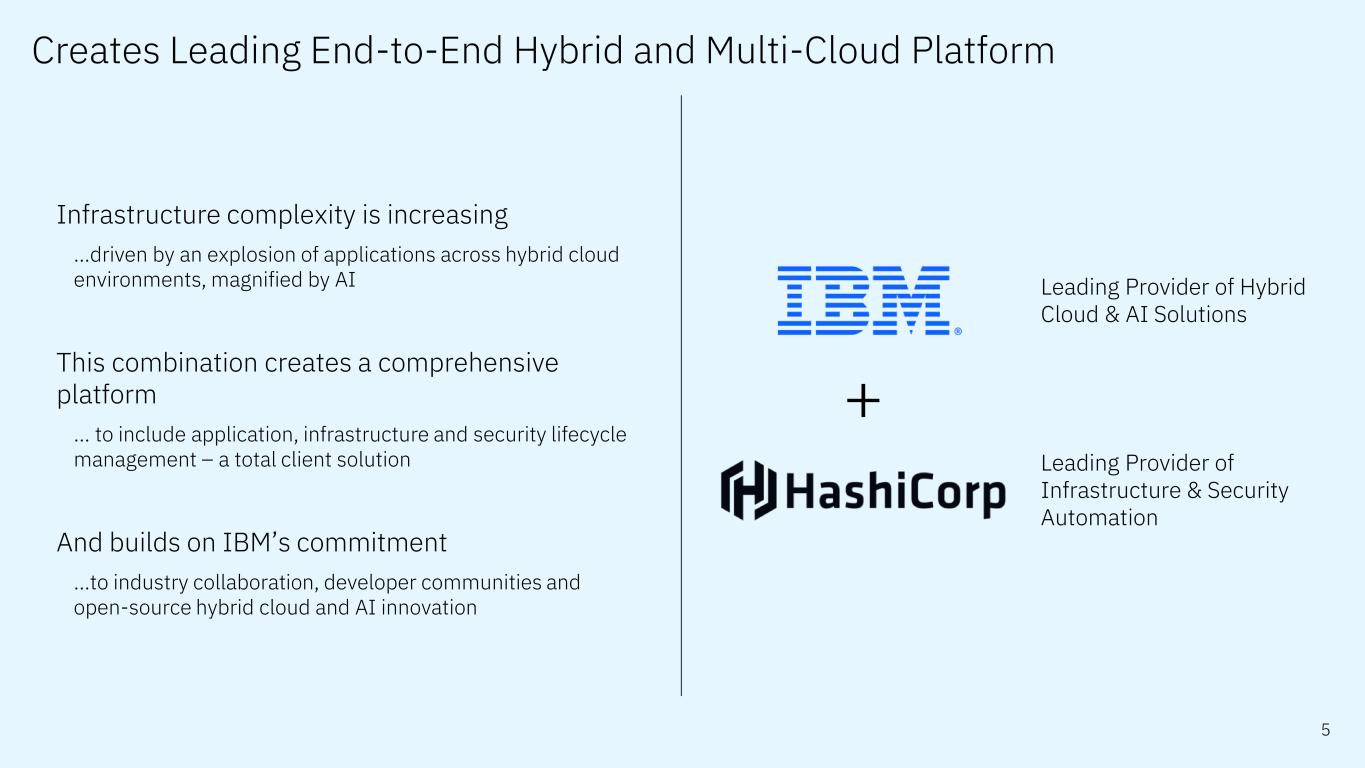

 
5 Creates Leading End-to-End Hybrid and Multi-Cloud Platform Infrastructure complexity is increasing …driven by an explosion of applications across hybrid cloud environments, magnified by AI This combination creates a comprehensive platform … to include application, infrastructure and security lifecycle management – a total client solution And builds on IBM’s commitment …to industry collaboration, developer communities and open-source hybrid cloud and AI innovation Leading Provider of Hybrid Cloud & AI Solutions Leading Provider of Infrastructure & Security Automation +
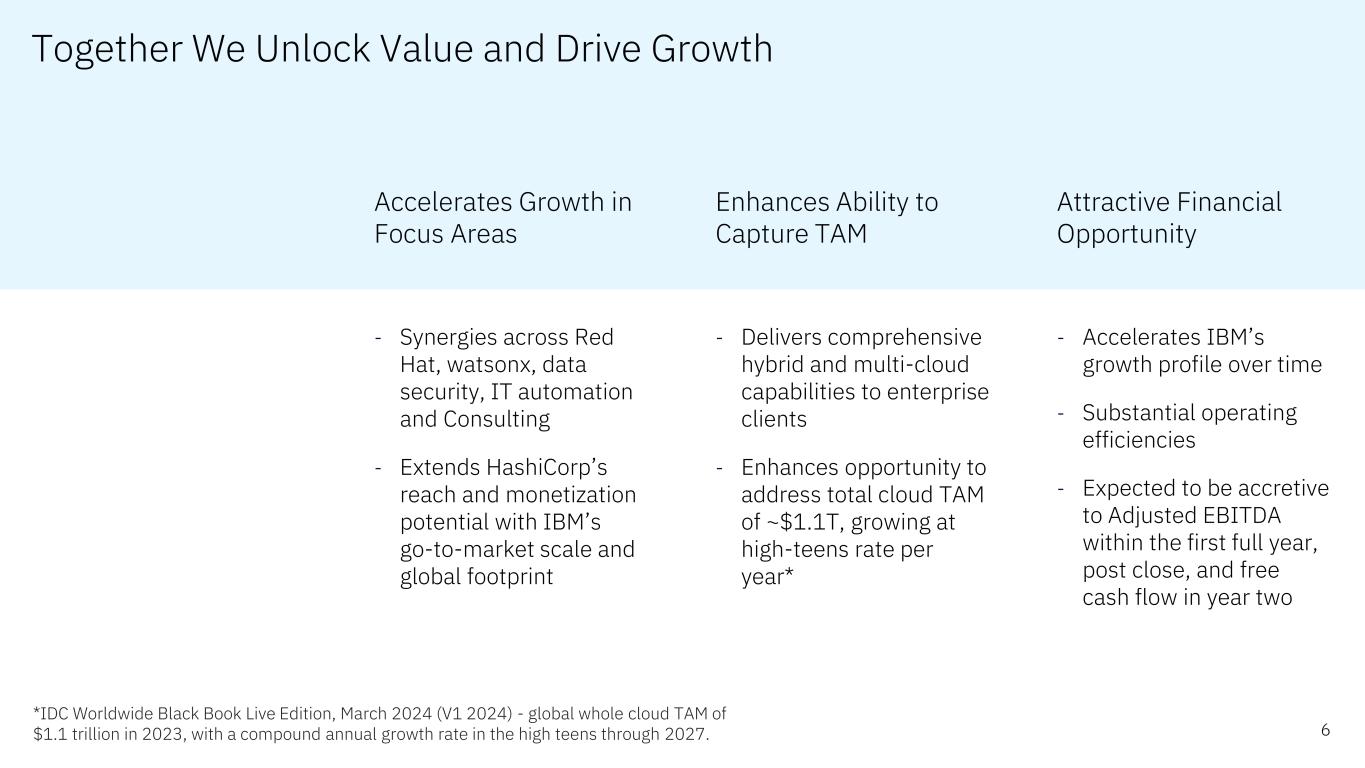

 
Together We Unlock Value and Drive Growth Accelerates Growth in Focus Areas - Synergies across Red Hat, watsonx, data security, IT automation and Consulting - Extends HashiCorp’s reach and monetization potential with IBM’s go-to-market scale and global footprint Enhances Ability to Capture TAM - Delivers comprehensive hybrid and multi-cloud capabilities to enterprise clients - Enhances opportunity to address total cloud TAM of ~$1.1T, growing at high-teens rate per year* Attractive Financial Opportunity - Accelerates IBM’s growth profile over time - Substantial operating efficiencies - Expected to be accretive to Adjusted EBITDA within the first full year, post close, and free cash flow in year two *IDC Worldwide Black Book Live Edition, March 2024 (V1 2024) - global whole cloud TAM of $1.1 trillion in 2023, with a compound annual growth rate in the high teens through 2027. 6

 
7 1Q24 Performance Investments, innovation and clients Generative AI CEO perspective “We began the year with solid revenue and free cash flow growth, reflecting the strength of our hybrid cloud and AI strategy. We continue to capitalize on the excitement and demand for enterprise AI from our clients. Our book of business for watsonx and generative AI again showed strong momentum, growing quarter over quarter, and has now eclipsed one billion dollars since we launched watsonx in mid-2023. As a result, for the full year, we continue to expect revenue performance in line with our mid-single digit model and about $12 billion in free cash flow. To strengthen our position in today’s hybrid cloud and AI- driven technology landscape, we also announced our intent to acquire HashiCorp. IBM’s and HashiCorp’s combined portfolios will help clients manage growing application and infrastructure complexity and create a comprehensive hybrid cloud platform designed for the AI era.” Arvind Krishna IBM Chairman and CEO


$0.6B Free cash flow yr/yr 100bps Gross margin expansion (operating) 130bps Pre-tax margin expansion (operating) Financial highlights 8 3% Revenue growth >75% Revenue mix in software and consulting $19.3B Cash and marketable securities Revenue growth rates @CC $14.5B Revenue $1.9B Free cash flow 1Q24 “In the quarter we continued to focus on the fundamentals of our business, growing revenue, expanding operating margins, improving profit performance and increasing productivity and operating leverage. These fundamentals, combined with our strong cash generation, position us to invest both organically and through strategic acquisitions like today’s announcement with HashiCorp. At the same time, we continue to return value to shareholders through our dividend.” James Kavanaugh IBM SVP & CFO


9 Revenue categories Red Hat +9% Automation +13% Data & AI +1% Security (3%) Software 1Q24 results; revenue growth rates @CC *Annual recurring revenue for Hybrid Platform & Solutions, growth rate @CC Transaction Processing +4% yr/yr Hybrid Platform & Solutions +7% yr/yr Strong growth across Hybrid Platform & Solutions and Transaction Processing Strength in OpenShift, Apptio and watsonx Solid and growing recurring revenue base; ARR* of $13.9 billion, +8% yr/yr Continued investment in innovation $5.9B Revenue +6% Revenue growth
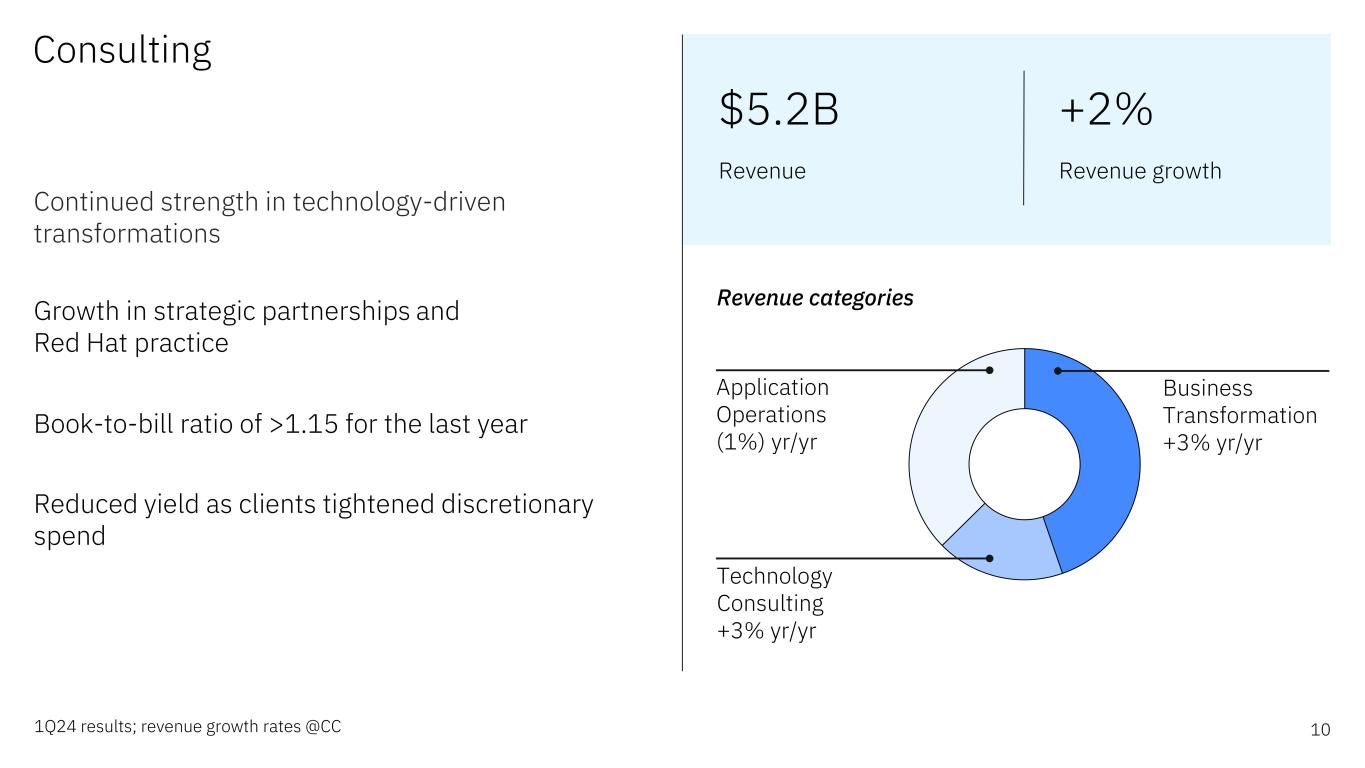

 
10 Technology Consulting +3% yr/yr Consulting 1Q24 results; revenue growth rates @CC Revenue categories Application Operations (1%) yr/yr Business Transformation +3% yr/yr Continued strength in technology-driven transformations Growth in strategic partnerships and Red Hat practice Book-to-bill ratio of >1.15 for the last year Reduced yield as clients tightened discretionary spend $5.2B Revenue +2% Revenue growth
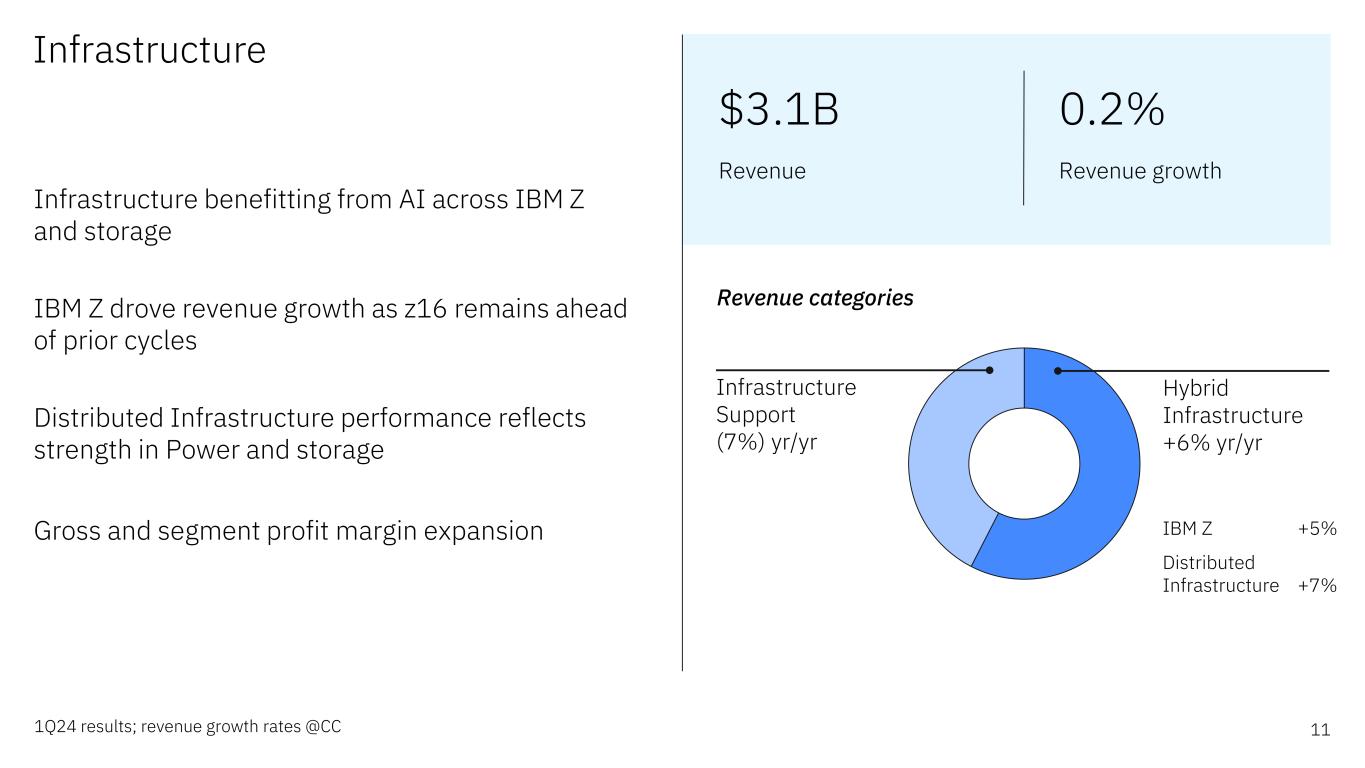

 
11 Infrastructure 1Q24 results; revenue growth rates @CC Revenue categories IBM Z +5% Distributed Infrastructure +7% Infrastructure Support (7%) yr/yr Hybrid Infrastructure +6% yr/yr Infrastructure benefitting from AI across IBM Z and storage IBM Z drove revenue growth as z16 remains ahead of prior cycles Distributed Infrastructure performance reflects strength in Power and storage Gross and segment profit margin expansion $3.1B Revenue 0.2% Revenue growth


12 Summary 1Q24 Summary Results demonstrate strength of diversified portfolio watsonx continued to gain traction across Software and Consulting Operating leverage and productivity initiatives drove margin performance Strongest first quarter level of free cash flow generation in many years 2024 Expectations Revenue growth @CC in line with mid-single digit model Free cash flow of ~$12 billion


ibm.com/investor


Supplemental material 14Some columns and rows in these materials, including the supplemental exhibits, may not add due to rounding Revenue and P&L highlights Adjusted EBITDA performance Cash flow and balance sheet highlights Currency impact on revenue growth Software & Infrastructure segment details Consulting segment details Expense summary Balance sheet summary Cash flow summary Cash flow (ASC 230) Software segment categories Consulting segment categories Infrastructure segment categories Non-GAAP supplemental materials
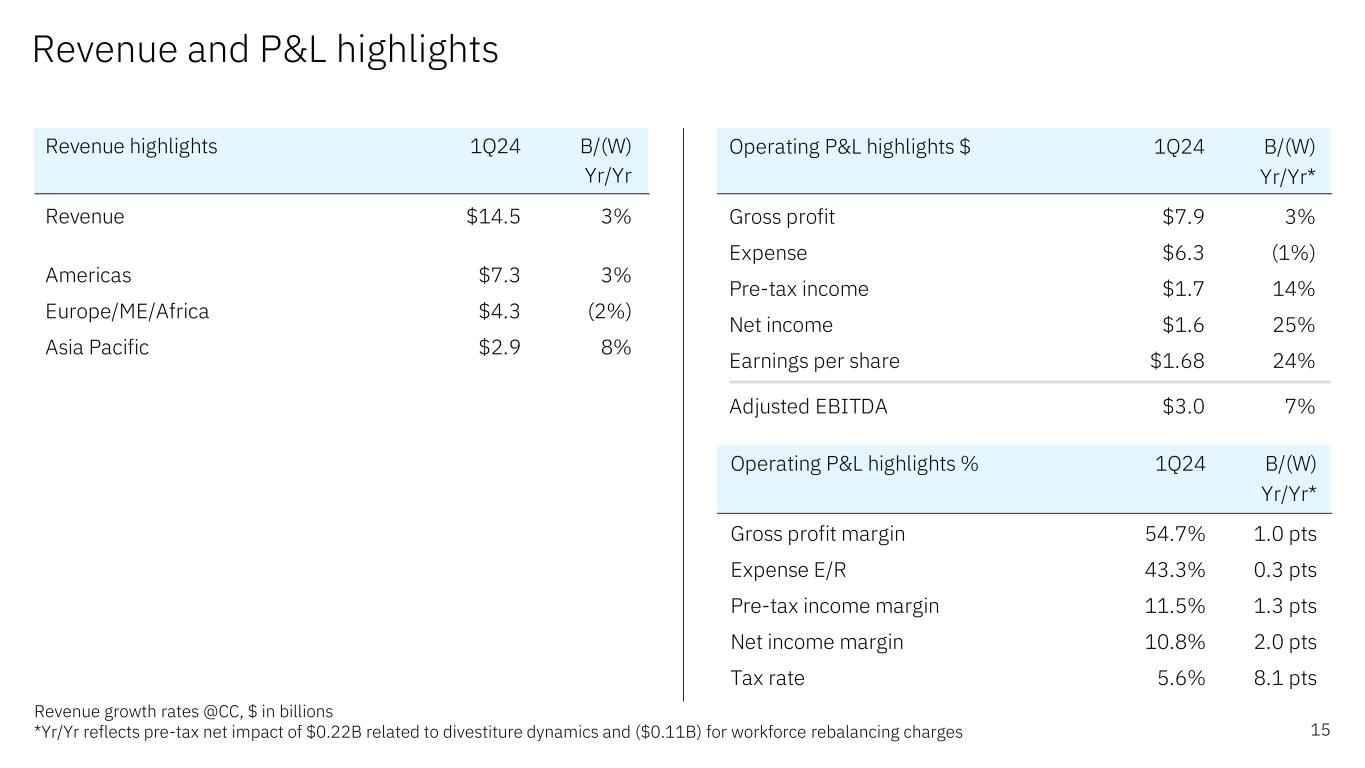

 
Revenue and P&L highlights 15 Revenue growth rates @CC, $ in billions *Yr/Yr reflects pre-tax net impact of $0.22B related to divestiture dynamics and ($0.11B) for workforce rebalancing charges Revenue highlights 1Q24 B/(W) Yr/Yr Revenue $14.5 3% Americas $7.3 3% Europe/ME/Africa $4.3 (2%) Asia Pacific $2.9 8% Operating P&L highlights $ 1Q24 B/(W) Yr/Yr* Gross profit $7.9 3% Expense $6.3 (1%) Pre-tax income $1.7 14% Net income $1.6 25% Earnings per share $1.68 24% Adjusted EBITDA $3.0 7% Operating P&L highlights % 1Q24 B/(W) Yr/Yr* Gross profit margin 54.7% 1.0 pts Expense E/R 43.3% 0.3 pts Pre-tax income margin 11.5% 1.3 pts Net income margin 10.8% 2.0 pts Tax rate 5.6% 8.1 pts


Adjusted EBITDA performance 16 $ in billions *Corporate (gains) and charges primarily consists of unique corporate actions such as gains on divestitures 1Q24 Yr/Yr Operating (non-GAAP) pre-tax income from continuing operations $1.7 $0.2 Net interest expense $0.2 $0.0 Depreciation/Amortization of non-acquired intangible assets $0.7 $0.0 Stock-based compensation $0.3 $0.1 Workforce rebalancing charges $0.4 $0.1 Corporate (gains) and charges* ($0.2) ($0.2) Adjusted EBITDA $3.0 $0.2
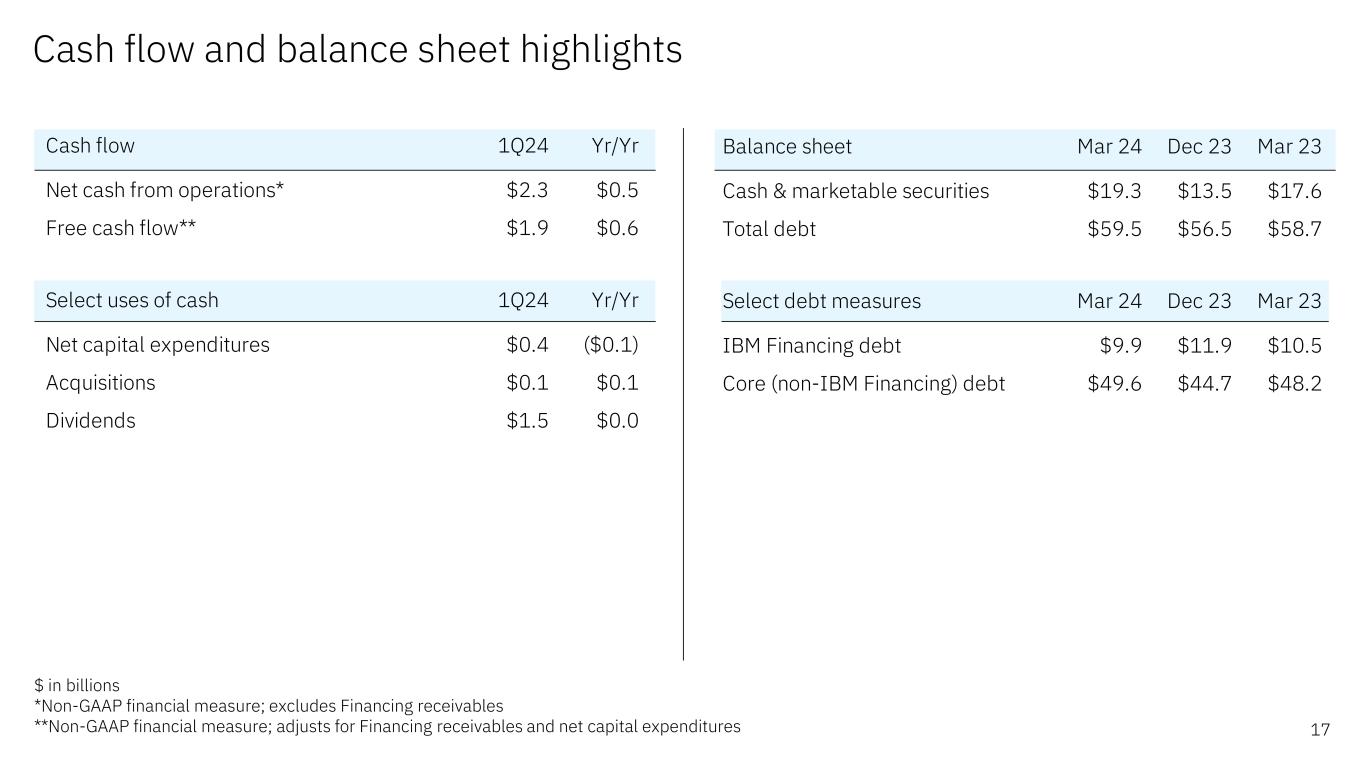

 
Cash flow and balance sheet highlights 17 $ in billions *Non-GAAP financial measure; excludes Financing receivables **Non-GAAP financial measure; adjusts for Financing receivables and net capital expenditures Balance sheet Mar 24 Dec 23 Mar 23 Cash & marketable securities $19.3 $13.5 $17.6 Total debt $59.5 $56.5 $58.7 Select debt measures Mar 24 Dec 23 Mar 23 IBM Financing debt $9.9 $11.9 $10.5 Core (non-IBM Financing) debt $49.6 $44.7 $48.2 Cash flow 1Q24 Yr/Yr Net cash from operations* $2.3 $0.5 Free cash flow** $1.9 $0.6 Select uses of cash 1Q24 Yr/Yr Net capital expenditures $0.4 ($0.1) Acquisitions $0.1 $0.1 Dividends $1.5 $0.0


Currency impact on revenue growth 18 Quarterly averages per US $ 1Q24 Yr/Yr Spot 2Q24 3Q24 4Q24 FY24 assumed Euro 0.92 1% 0.94 (2%) (2%) (1%) (1%) Pound 0.79 4% 0.80 (0%) (2%) 0% 1% Yen 148 (12%) 154 (12%) (7%) (5%) (9%) Revenue impact, future @assumed Spot (1 pts) ~(2.5 pts) (1.5-2 pts) (1-1.5 pts) (1.5-2 pts) Prior view (1-1.5 pts) (1-1.5 pts) (0-1 pts) ~0 pts ~(1 pts) US $B Yr/Yr Revenue as reported $14.5 1.5% Currency impact ($0.1) (1 pts) Revenue @CC 2.5%
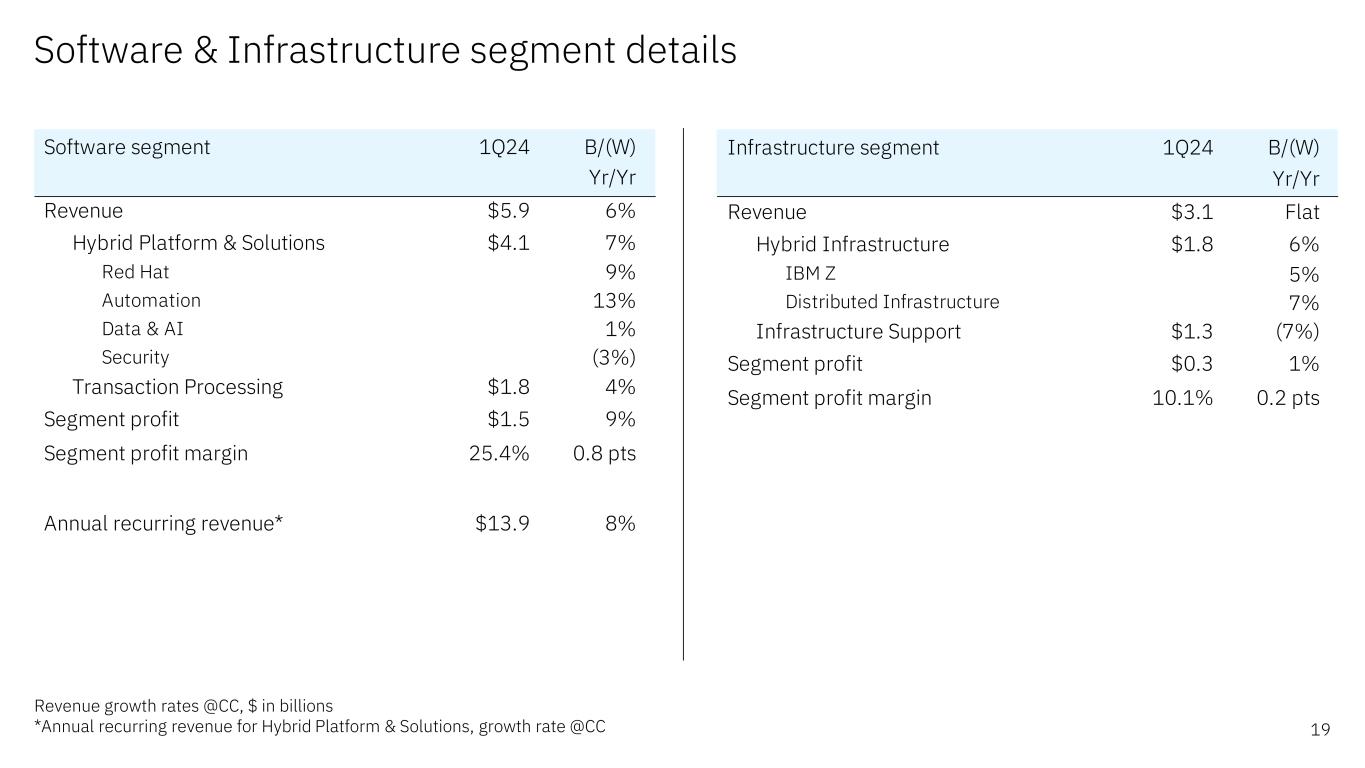

 
Software & Infrastructure segment details 19 Revenue growth rates @CC, $ in billions *Annual recurring revenue for Hybrid Platform & Solutions, growth rate @CC Software segment 1Q24 B/(W) Yr/Yr Revenue $5.9 6% Hybrid Platform & Solutions $4.1 7% Red Hat 9% Automation 13% Data & AI 1% Security (3%) Transaction Processing $1.8 4% Segment profit $1.5 9% Segment profit margin 25.4% 0.8 pts Annual recurring revenue* $13.9 8% Infrastructure segment 1Q24 B/(W) Yr/Yr Revenue $3.1 Flat Hybrid Infrastructure $1.8 6% IBM Z 5% Distributed Infrastructure 7% Infrastructure Support $1.3 (7%) Segment profit $0.3 1% Segment profit margin 10.1% 0.2 pts


IBM Confidential- Do not copy Consulting segment details 20Revenue & signings growth rates @CC, $ in billions Consulting segment 1Q24 B/(W) Yr/Yr Revenue $5.2 2% Business Transformation $2.3 3% Technology Consulting $0.9 3% Application Operations $1.9 (1%) Gross profit margin 25.3% (0.2 pts) Segment profit $0.4 (1%) Segment profit margin 8.2% Flat Signings $5.5 4% Book-to-bill ratio (TTM) >1.15


Expense summary 21 $ in billions *includes acquisitions in the last twelve months net of non-operating acquisition-related charges and includes impact of closed divested businesses **represents the percentage change after excluding the impact of currency translation & hedges, acquisitions and divestitures Expense 1Q24 B/(W) Acq/ Yr/Yr Currency Divest* Base** Operating expense & other income $6.3 (1%) (1 pts) 3 pts (2 pts) impact of workforce rebalancing $0.4 (2 pts) SG&A – operating $4.7 (2%) 0 pts (1 pts) (2 pts) impact of workforce rebalancing $0.4 (3 pts) RD&E $1.8 (9%) 0 pts (1 pts) (8 pts) IP and custom development income ($0.2) 20% Other (income)/expense - operating ($0.5) 92% Interest expense $0.4 (18%)


Balance sheet summary 22 $ in billions *includes eliminations of inter-company activity Mar 24 Dec 23 Mar 23 Cash & marketable securities $19.3 $13.5 $17.6 Core (non-IBM Financing) assets* $106.4 $107.9 $103.6 IBM Financing assets $11.5 $13.9 $12.5 Total assets $137.2 $135.2 $133.6 Other liabilities $54.3 $56.1 $53.3 Core (non-IBM Financing) debt* $49.6 $44.7 $48.2 IBM Financing debt $9.9 $11.9 $10.5 Total debt $59.5 $56.5 $58.7 Total liabilities $113.8 $112.6 $112.0 Equity $23.3 $22.6 $21.7


Cash flow summary 23$ in billions B/(W) 1Q24 Yr/Yr Net cash from operations $4.2 $0.4 Less: IBM Financing receivables $1.9 ($0.1) Net cash from operations (excluding IBM Financing receivables) $2.3 $0.5 Net capital expenditures ($0.4) $0.1 Free cash flow (excluding IBM Financing receivables) $1.9 $0.6 Acquisitions ($0.1) ($0.1) Divestitures $0.7 $0.7 Dividends ($1.5) ($0.0) Non-IBM Financing debt $5.2 ($4.4) Other (includes IBM Financing net A/R & IBM Financing debt) ($0.4) $0.3 Change in cash & marketable securities $5.8 ($2.9)


Cash flow (ASC230) 24$ in billions 1Q24 1Q23 Net income from operations $1.6 $0.9 Depreciation / amortization of intangibles $1.1 $1.1 Stock-based compensation $0.3 $0.3 Operating assets and liabilities / other, net ($0.8) ($0.5) IBM Financing A/R $1.9 $2.0 Net cash provided by operating activities $4.2 $3.8 Capital expenditures, net of payments & proceeds ($0.4) ($0.5) Divestitures, net of cash transferred $0.7 - Acquisitions, net of cash acquired ($0.1) ($0.0) Marketable securities / other investments, net ($4.5) ($7.5) Net cash provided by/(used in) investing activities ($4.2) ($8.0) Debt, net of payments & proceeds $3.4 $7.3 Dividends ($1.5) ($1.5) Financing - other $0.0 ($0.1) Net cash provided by/(used in) financing activities $1.9 $5.7 Effect of exchange rate changes on cash ($0.2) $0.0 Net change in cash, cash equivalents & restricted cash $1.7 $1.5


Software segment categories Revenue categories – FY 2023 Hybrid Platform & Solutions Transaction Processing Hybrid Platform & Solutions Software, infused with AI, to help clients operate, manage, and optimize their IT resources and business processes within hybrid, multi-cloud environments: – Red Hat: incl. RHEL, OpenShift, Ansible – Automation: incl. business automation, AIOps and management, integration, and application servers – Data & AI: incl. data fabric, customer care, data management, business analytics, dataops & governance, asset & supply chain management, and information exchange – Security: incl. software for threat, data and identity Transaction Processing Software that supports clients’ mission-critical on-premise workloads in industries such as banking, airlines and retail incl. transaction processing software such as Customer Information Control System and storage software, and analytics and integration software running on IBM operating systems (e.g., DB2 and WebSphere running on z/OS). Revenue categories Red Hat Data & AI Security Automation 25


Business Transformation Technology Consulting Application Operations Consulting segment categories Business Transformation Strategy, process design, system implementation and operations services to improve and transform key business processes. Deploys AI and automation in business processes to exploit the value of data and includes an ecosystem of partners alongside IBM technology, including strategic partnerships with Adobe, Oracle, Salesforce and SAP, among others. Technology Consulting Skills to architect and implement solutions across cloud platforms, including Amazon, Microsoft and IBM, and strategies to transform the enterprise experience and enable innovation, including transformation using AI with watsonx and application modernization for hybrid cloud with Red Hat OpenShift. Application Operations Manages, optimizes, orchestrates and secures custom applications and ISV packages for clients. Provides application management, platform engineering, and security services across hybrid cloud environments. Revenue categories – FY 2023 26 Revenue categories


Infrastructure segment categories Hybrid Infrastructure Innovative infrastructure platforms to help meet the new requirements of hybrid multi-cloud and enterprise AI workloads leveraging flexible and as-a-service consumption models: – IBM Z: incl. hardware and operating system – Distributed Infrastructure: incl. Power hardware and operating system, storage hardware, IBM Cloud IaaS, OEM asset recovery service Infrastructure Support Comprehensive, proactive and AI enabled services to maintain and improve the availability and value of clients’ IT infrastructure (hardware and software) both on-premises and in the cloud incl. maintenance for IBM products and other technology platforms. Hybrid Infrastructure Infrastructure Support Revenue categories – FY 2023 27 Revenue categories IBM Z Distributed Infrastructure
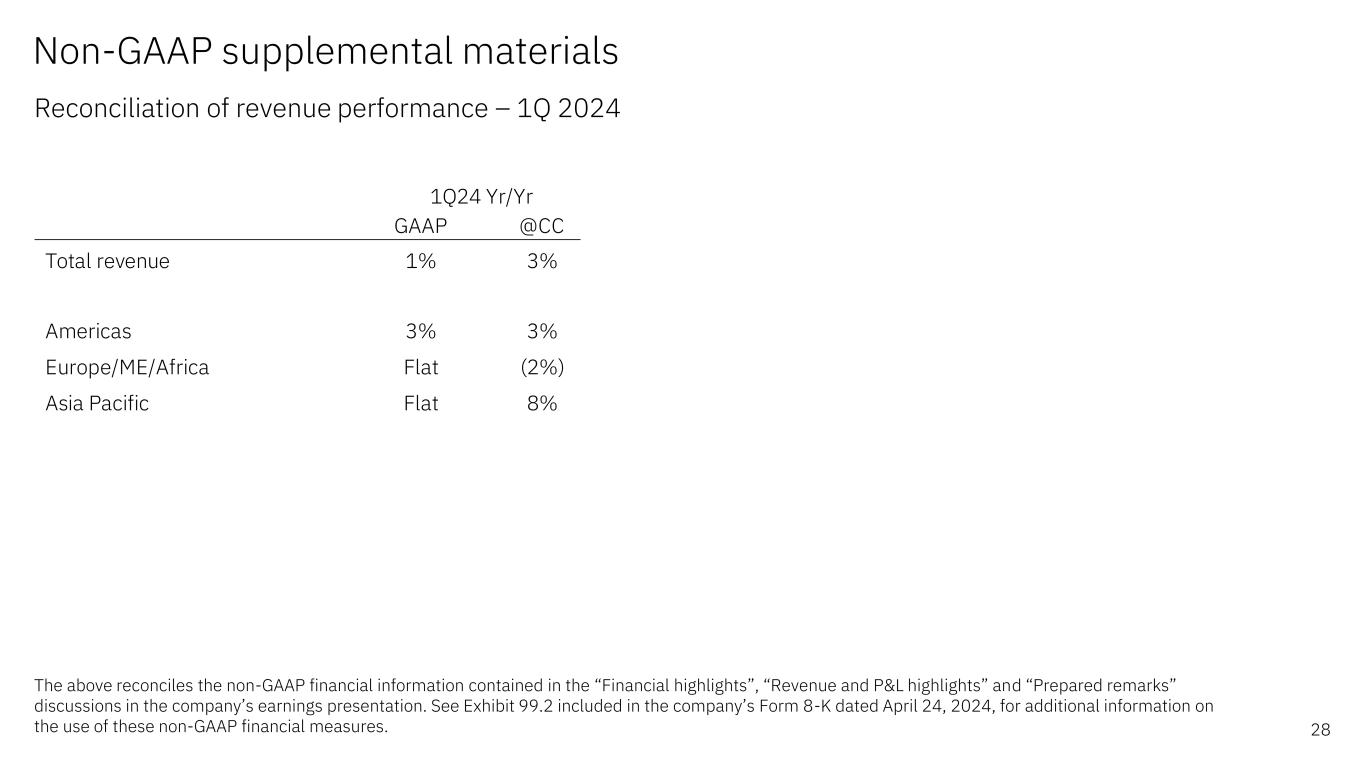

 
Non-GAAP supplemental materials Reconciliation of revenue performance – 1Q 2024 28 The above reconciles the non-GAAP financial information contained in the “Financial highlights”, “Revenue and P&L highlights” and “Prepared remarks” discussions in the company’s earnings presentation. See Exhibit 99.2 included in the company’s Form 8-K dated April 24, 2024, for additional information on the use of these non-GAAP financial measures. GAAP @CC Total revenue 1% 3% Americas 3% 3% Europe/ME/Africa Flat (2%) Asia Pacific Flat 8% 1Q24 Yr/Yr


GAAP @CC Software 5% 6% Hybrid Platform & Solutions 6% 7% Red Hat 9% 9% Automation 13% 13% Data & AI 1% 1% Security (3%) (3%) Transaction Processing 3% 4% 1Q24 Yr/Yr GAAP @CC Consulting Flat 2% Business Transformation 1% 3% Technology Consulting 1% 3% Application Operations (3%) (1%) Infrastructure (1%) Flat Hybrid Infrastructure 5% 6% IBM Z 4% 5% Distributed Infrastructure 6% 7% Infrastructure Support (8%) (7%) 1Q24 Yr/Yr Non-GAAP supplemental materials Reconciliation of segment revenue performance – 1Q 2024 29 The above reconciles the non-GAAP financial information contained in the “Software”, “Consulting”, “Infrastructure”, “Software & Infrastructure segment details”, “Consulting segment details” and “Prepared remarks” discussions in the company’s earnings presentation. See Exhibit 99.2 included in the company’s Form 8-K dated April 24, 2024, for additional information on the use of these non-GAAP financial measures.


Non-GAAP supplemental materials Reconciliation of expense summary – 1Q 2024 30 *Represents the percentage change after excluding the impact of currency translation & hedges, acquisitions and divestitures The above reconciles the non-GAAP financial information contained in the “Expense summary” discussion in the company’s earnings presentation. See Exhibit 99.2 included in the company’s Form 8-K dated April 24, 2024, for additional information on the use of these non-GAAP financial measures. Non-GAAP Operating GAAP adjustments (non-GAAP) SG&A Currency 0 pts 0 pts 0 pts Acquisitions/divestitures (1 pts) 0 pts (1 pts) Base* (2 pts) 0 pts (2 pts) RD&E Currency 0 pts 0 pts 0 pts Acquisitions/divestitures (1 pts) 0 pts (1 pts) Base* (8 pts) 0 pts (8 pts) Operating expense & other income Currency (2 pts) 1 pts (1 pts) Acquisitions/divestitures 3 pts 0 pts 3 pts Base* (4 pts) 2 pts (2 pts) 1Q24


Non-GAAP supplemental materials Reconciliation of continuing operations – 1Q 2024 31 $ in millions (except EPS which is in whole dollars) *Includes a net benefit from discrete tax events The above reconciles the non-GAAP financial information contained in the “Revenue and P&L highlights”, “Expense summary” and “Prepared remarks” discussions in the company’s earnings presentation. See Exhibit 99.2 included in the company’s Form 8-K dated April 24, 2024, for additional information on the use of these non-GAAP financial measures. GAAP Acquisition- related adjustments Retirement- related adjustments Tax reform impacts* Operating (non-GAAP) Gross profit $7,742 $170 — — $7,913 Gross profit margin 53.5% 1.2 pts — — 54.7% SG&A 4,974 (268) — — 4,706 Other (income) & expense (317) (50) (96) — (463) Total expense  6,669 (318) (96) — 6,255 Pre-tax income 1,074 488 96 — 1,658 Pre-tax income margin 7.4% 3.4 pts 0.7 pts — 11.5% Tax rate (46.7%) 22.3 pts 3.0 pts 27.0 pts 5.6% Net income 1,575 346 91 (448) 1,564 Net income margin 10.9% 2.4 pts 0.6 pts (3.1 pts) 10.8% Earnings per share $1.69 $0.37 $0.10 ($0.48) $1.68 1Q24


Non-GAAP supplemental materials Reconciliation of GAAP net income to adjusted EBITDA 32 $ in billions *Primarily consists of amortization of acquired intangible assets **Corporate (gains) and charges primarily consists of unique corporate actions such as gains on divestitures The above reconciles the non-GAAP financial information contained in the “Revenue and P&L highlights", "Prepared remarks” and “Adjusted EBITDA performance” discussions in the company’s earnings presentation. See Exhibit 99.2 included in the company’s Form 8-K dated April 24, 2024, for additional information on the use of these non-GAAP financial measures. 1Q24 Yr/Yr Net income as reported (GAAP) $1.6 $0.7 Less: Income/(loss) from discontinued operations, net of tax $0.0 $0.0 Income from continuing operations $1.6 $0.6 Provision for/(Benefit from) income taxes from continuing operations ($0.5) ($0.6) Pre-tax income from continuing operations (GAAP) $1.1 $0.0 Non-operating adjustments (before tax) Acquisition-related charges* $0.5 $0.1 Non-operating retirement-related costs/(income) $0.1 $0.1 Operating (non-GAAP) pre-tax income from continuing operations $1.7 $0.2 Net interest expense $0.2 $0.0 Depreciation/Amortization of non-acquired intangible assets $0.7 $0.0 Stock-based compensation $0.3 $0.1 Workforce rebalancing charges $0.4 $0.1 Corporate (gains) and charges** ($0.2) ($0.2) Adjusted EBITDA $3.0 $0.2


Non-GAAP supplemental materials Reconciliation of net cash from operations to adjusted EBITDA 33 $ in billions *Other assets and liabilities/other, net mainly consists of operating assets and liabilities/other, net in the “Cash flow (ASC230)” discussion, workforce rebalancing charges, non-operating impacts and corporate (gains) and charges The above reconciles the non-GAAP financial information contained in the “Prepared remarks” discussion in the company’s earnings presentation. See Exhibit 99.2 included in the company’s Form 8-K dated April 24, 2024, for additional information on the use of these non-GAAP financial measures. 1Q24 1Q23 Net cash provided by operating activities $4.2 $3.8 Add: Net interest expense $0.2 $0.2 Provision for/(Benefit from) income taxes from continuing operations ($0.5) $0.1 Less change in: Financing receivables $1.9 $2.0 Other assets and liabilities/other, net* ($1.0) ($0.7) Adjusted EBITDA $3.0 $2.8


Pre-tax margin B/(W) GAAP 0.0 Pts Non-operating adjustments* 1.3 Pts Operating (non-GAAP) 1.3 Pts Adjusted to exclude workforce rebalancing and divesture dynamics** (0.8) Pts Operating (non-GAAP) excl. impacts of workforce rebalancing and divesture dynamics 0.5 Pts Non-GAAP supplemental materials Reconciliation of Pre-tax income margin – 1Q 2024 *Excludes the effects of certain acquisition-related charges and non-operating retirement related (income)/expense. For details on these adjustments, see slide entitled “Reconciliation of continuing operations – 1Q 2024” in this presentation **Yr/yr impacts of workforce rebalancing and divestiture dynamics The above reconciles the non-GAAP financial information contained in the “Prepared remarks” discussion in the company’s earnings presentation. See Exhibit 99.2 included in the company’s Form 8-K dated April 24, 2024, for additional information on the use of these non-GAAP financial measures. 34


~ Non-GAAP supplemental materials Reconciliation of tax rate and Pre-tax income margin – FY 2024 expectations *Includes estimated discrete tax events for the year, actual events will be recorded as they occur The above reconciles the non-GAAP financial information contained in the “Prepared remarks” discussion in the company’s earnings presentation. See Exhibit 99.2 included in the company’s Form 8-K dated April 24, 2024, for additional information on the use of these non-GAAP financial measures. Tax rate GAAP Operating (Non-GAAP) Full-Year 2024* Mid-to-High Single Digits Mid Teens GAAP Operating (non-GAAP) Pre-tax income margin B/(W) B/(W) Pre-tax income margin Yr/Yr Flat 0.5 Pts 35
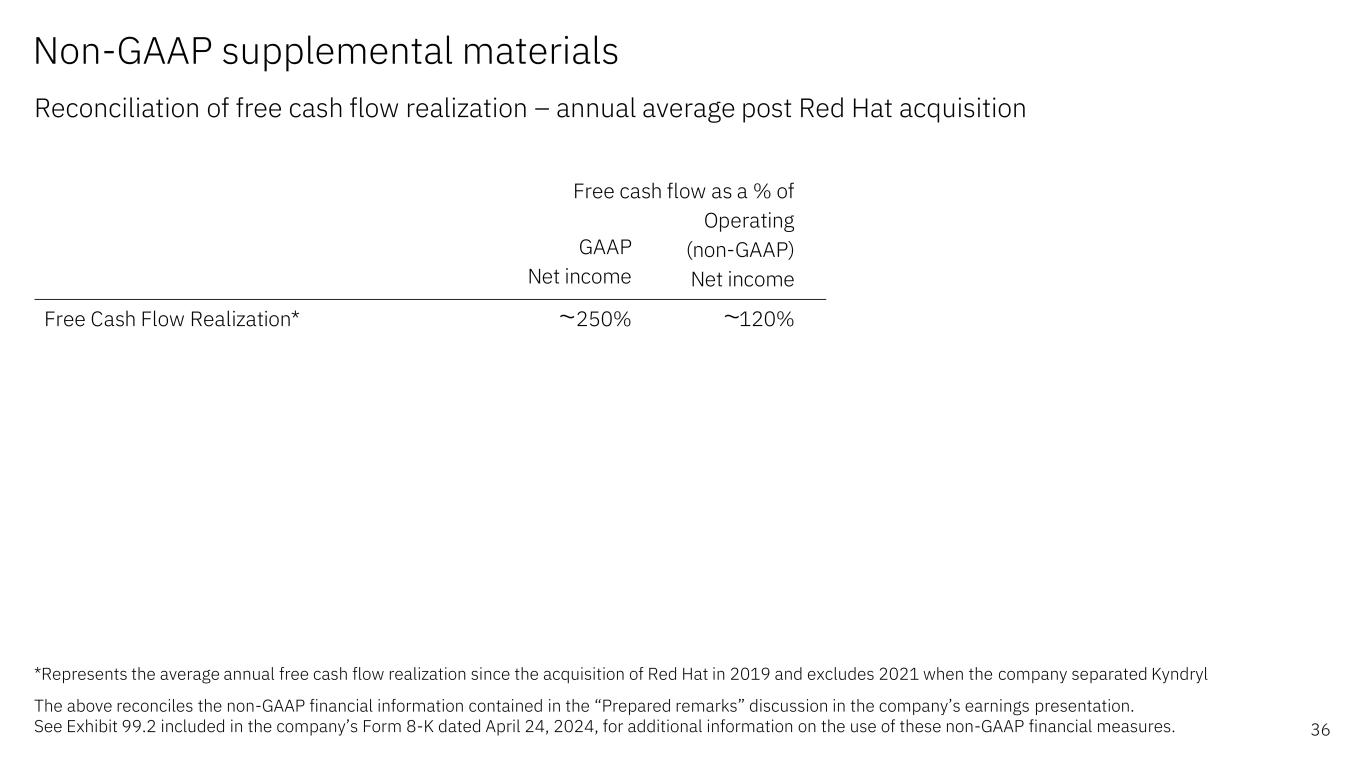

 
GAAP Net income Operating (non-GAAP) Net income Free Cash Flow Realization* 250% 120% Free cash flow as a % of Non-GAAP supplemental materials Reconciliation of free cash flow realization – annual average post Red Hat acquisition *Represents the average annual free cash flow realization since the acquisition of Red Hat in 2019 and excludes 2021 when the company separated Kyndryl The above reconciles the non-GAAP financial information contained in the “Prepared remarks” discussion in the company’s earnings presentation. See Exhibit 99.2 included in the company’s Form 8-K dated April 24, 2024, for additional information on the use of these non-GAAP financial measures. ~ ~ 36


12 Months Ended Mar 2024 Net cash from operating activities per GAAP $14.3 Less: change in IBM Financing receivables $1.2 Net cash from operating activities (excluding IBM Financing receivables) $13.2 Net capital expenditures ($1.4) Free cash flow (excluding IBM Financing receivables) $11.8 Non-GAAP supplemental materials Reconciliation of free cash flow – last 12 months $ in billions The above reconciles the non-GAAP financial information contained in the “Prepared remarks” discussion in the company’s earnings presentation. See Exhibit 99.2 included in the company’s Form 8-K dated April 24, 2024, for additional information on the use of these non-GAAP financial measures. 37


ibm.com/investor