Document
|
|
|
|
|
|
Calgary, October 31, 2025 |
Exhibit 99.1 |
Imperial announces third quarter 2025 financial and operating results
•Quarterly net income of $539 million and quarterly net income excluding identified items1 of $1,094 million
•Cash flows from operating activities of $1,798 million
•Upstream achieved the highest quarterly production in over 30 years of 462,000 gross oil-equivalent barrels per day
•Kearl achieved the highest-ever quarterly production of 316,000 total gross oil-equivalent barrels per day (224,000 barrels Imperial's share)
•Strong Downstream operating performance with refinery capacity utilization of 98 percent
•Returned $1,835 million to shareholders with $366 million in dividend payments and $1,469 million of share repurchases
•Announced restructuring to further advance the company's well-established strategy of increasing cash flow and delivering industry-leading shareholder returns
|
|
|
|
|
|
|
|
|
|
|
|
|
|
|
|
|
|
|
|
|
|
Third quarter |
Nine months |
| millions of Canadian dollars, unless noted |
2025 |
|
2024 |
∆I |
2025 |
|
2024 |
∆I |
Net income (loss) (U.S. GAAP) |
539 |
|
1,237 |
|
(698) |
2,776 |
|
3,565 |
|
(789) |
Net income (loss) excluding identified items1 |
1,094 |
|
1,237 |
|
(143) |
3,331 |
|
3,565 |
|
(234) |
Net income (loss) per common share, assuming dilution (dollars) |
1.07 |
|
2.33 |
|
(1.26) |
5.46 |
|
6.66 |
|
(1.20) |
Net income (loss) excluding identified items1 per common share, assuming dilution (dollars) |
2.17 |
|
2.33 |
|
(0.16) |
6.55 |
|
6.66 |
|
(0.11) |
| Capital and exploration expenditures |
505 |
|
486 |
|
+19 |
1,376 |
|
1,444 |
|
(68) |
Imperial reported estimated net income in the third quarter of $539 million, compared to net income of $949 million in the second quarter of 2025, primarily driven by a non-cash impairment of the Calgary Imperial Campus and the previously announced restructuring charge. Excluding identified items1, estimated net income was $1,094 million up $145 million driven by strong operating performance. Quarterly cash flows from operating activities were $1,798 million, up from $1,465 million generated in the second quarter of 2025. Cash flows from operating activities excluding working capital1 were $1,600 million – which included a $149 million unfavourable impact from the restructuring charge included in identified items1. Cash flows from operating activities excluding working capital1 were $1,413 million in the second quarter of 2025.
“Our operations delivered strong results across the board, as we continued to execute on our strategy to maximize value from our assets by growing volumes at lower unit cash costs1, and returning surplus cash to our shareholders in a timely manner," said John Whelan, chairman, president and chief executive officer. "Our Upstream delivered the highest crude production in company history including record production at Kearl, while our Downstream achieved very strong utilization rates across our refining network."
Upstream production averaged 462,000 gross oil-equivalent barrels per day, the highest quarterly production in over 30 years. Kearl recorded its highest-ever quarterly total gross production averaging 316,000 barrels per day (224,000 barrels Imperial's share). Cold Lake averaged 150,000 barrels per day of gross production and progressed work at the Leming SAGD project. The company's share of Syncrude production averaged 78,000 gross barrels per day.
|
|
|
|
|
|
|
|
|
|
|
|
1 Non-GAAP financial measure - see Attachment VI for definition and reconciliation |
|
After more than a century, Imperial continues to be an industry leader in applying technology and innovation to responsibly develop Canada’s energy resources. As Canada’s largest petroleum refiner, a major producer of crude oil, a key petrochemical producer and a leading fuels marketer from coast to coast, our company remains committed to high standards across all areas of our business.
imperialoil.ca ∙ youtube.com/ImperialOil ∙ x.com/ImperialOil ∙ linkedin.com/company/Imperial-Oil ∙ facebook.com/ImperialOilLimited
Downstream throughput in the quarter averaged 425,000 barrels per day, resulting in an overall refinery capacity utilization of 98 percent, including progressing planned turnaround work at Sarnia. Petroleum product sales averaged 464,000 barrels per day.
During the quarter, Imperial returned $1,835 million to shareholders through dividend payments and share repurchases under the accelerated normal course issuer bid (NCIB) program, which is anticipated to be completed prior to year end. The company also declared a fourth quarter dividend of 72 cents per share.
In late September, Imperial announced restructuring plans to further improve the company’s industry-leading performance by centralizing additional corporate and technical activities in global business and technology centres, realizing substantial efficiency and effectiveness benefits from scale, integration and technology. These restructuring plans leverage the rapidly advancing technology environment and the growth of global capability centres to advance Imperial’s long-standing strategy of maximizing the value of existing assets.
“Throughout this transition, Imperial remains highly committed to safety, operational excellence, reliability and the delivery of winning results,” said Whelan. “The company is taking these actions to further enhance our foundation for future growth and position us to continue delivering industry-leading returns and long-term value for our shareholders."
After more than a century, Imperial continues to be an industry leader in applying technology and innovation to responsibly develop Canada’s energy resources. As Canada’s largest petroleum refiner, a major producer of crude oil, a key petrochemical producer and a leading fuels marketer from coast to coast, our company remains committed to high standards across all areas of our business.
imperialoil.ca ∙ youtube.com/ImperialOil ∙ x.com/ImperialOil ∙ linkedin.com/company/Imperial-Oil ∙ facebook.com/ImperialOilLimited
Third quarter highlights
•Net income of $539 million or $1.07 per share on a diluted basis, compared to $1,237 million or $2.33 per share in the third quarter of 2024. Results in the current quarter include identified items1 of a $306 million after-tax non-cash impairment of the Calgary Imperial Campus and a $249 million after-tax restructuring charge.
•Cash flows from operating activities of $1,798 million, up from cash flows from operating activities of $1,487 million in the third quarter of 2024. Cash flows from operating activities excluding working capital1 of $1,600 million – which included a $149 million unfavourable impact from the restructuring charge included in identified items1 – compared to $1,797 million in the third quarter of 2024.
•Capital and exploration expenditures totaled $505 million, up from $486 million in the third quarter of 2024.
•The company returned $1,835 million to shareholders in the third quarter of 2025, including $366 million in dividends paid and $1,469 million in share repurchases under the NCIB. Imperial anticipates completing its accelerated NCIB program before year end.
•Upstream production averaged 462,000 gross oil-equivalent barrels per day, the highest quarterly production in over 30 years, up from 447,000 gross oil-equivalent barrels per day in the third quarter of 2024, primarily driven by record Kearl production.
•Record total gross bitumen production at Kearl averaged 316,000 barrels per day (224,000 barrels Imperial's share), up from 295,000 barrels per day (209,000 barrels Imperial's share) in the third quarter of 2024, primarily due to improved reliability and recovery.
•Gross bitumen production at Cold Lake averaged 150,000 barrels per day, up from 147,000 barrels per day in the third quarter of 2024.
•Leming SAGD project's first oil anticipated in the coming weeks, with production expected to ramp up to a peak of around 9,000 barrels per day.
•The company's share of gross production from Syncrude averaged 78,000 barrels per day, compared to 81,000 barrels per day in the third quarter of 2024.
•Refinery throughput averaged 425,000 barrels per day, up from 389,000 barrels per day in the third quarter of 2024. Capacity utilization was 98 percent, up from 90 percent in the third quarter of 2024. Higher refinery throughput and capacity utilization were primarily due to lower turnaround impacts.
•Petroleum product sales were 464,000 barrels per day, compared to 487,000 barrels per day in the third quarter of 2024, driven by lower volumes in the supply and wholesale channels.
•Chemical net income of $21 million in the quarter, compared to $28 million in the third quarter of 2024.
|
|
|
|
|
|
|
|
|
|
|
|
1 Non-GAAP financial measure - see Attachment VI for definition and reconciliation |
|
Recent business environment
During the third quarter of 2025, the price of crude oil increased slightly relative to second quarter of 2025, while the Canadian WTI/WCS spread remained relatively flat with the second quarter of 2025. Industry refining margins improved in the third quarter of 2025, driven by strong seasonal demand and global diesel supply disruptions.
During 2025, the United States announced a variety of trade-related actions, including the imposition of tariffs on imports from Canada and several other countries. In response, Canada announced its own retaliatory tariffs. Despite the current uncertainty as to what effects these actions will ultimately have on Imperial, its suppliers and its customers, the company does not anticipate any material near-term financial impacts.
Operating results
Third quarter 2025 vs. third quarter 2024
|
|
|
|
|
|
|
|
|
|
|
Third Quarter |
|
| millions of Canadian dollars, unless noted |
2025 |
2024 |
|
Net income (loss) (U.S. GAAP) |
539 |
1,237 |
|
Net income (loss) per common share, assuming dilution (dollars) |
1.07 |
2.33 |
|
Net income (loss) excluding identified items1 |
1,094 |
1,237 |
|
|
|
|
|
Current quarter results include identified items1 of a $306 million after-tax ($406 million before-tax) non-cash impairment charge and a $249 million after-tax ($330 million before-tax) restructuring charge.
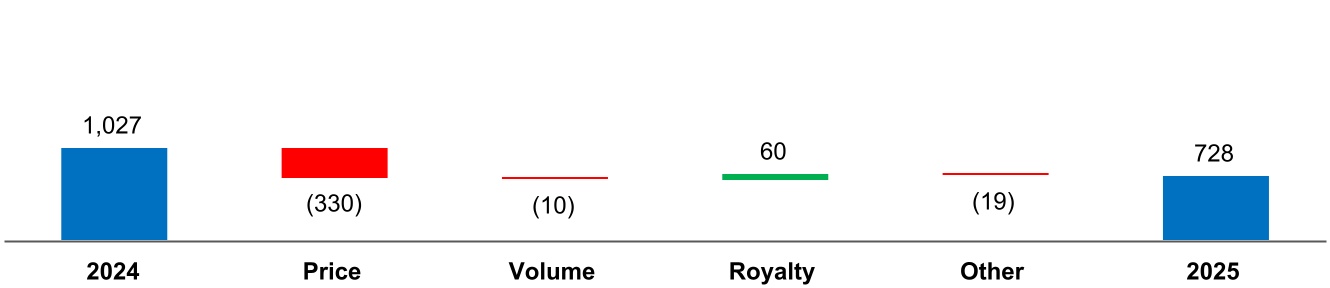
Upstream
Net income (loss) factor analysis
millions of Canadian dollars
Price – Average bitumen realizations decreased by $9.02 per barrel, primarily driven by lower marker prices partially offset by narrowing WTI/WCS spread. Synthetic crude oil realizations decreased by $13.29 per barrel, primarily driven by lower WTI and a weaker Synthetic/WTI spread.
Volume – Inventory impacts partially offset by higher production.
Royalty – Lower royalties were primarily driven by lower commodity prices.
|
|
|
|
|
|
|
|
|
|
|
|
1 Non-GAAP financial measure - see Attachment VI for definition and reconciliation |
|
Marker prices and average realizations
|
|
|
|
|
|
|
|
|
|
Third Quarter |
| Canadian dollars, unless noted |
2025 |
|
2024 |
|
West Texas Intermediate (US$ per barrel) |
64.97 |
|
75.27 |
|
Western Canada Select (US$ per barrel) |
54.62 |
|
61.76 |
|
WTI/WCS Spread (US$ per barrel) |
10.35 |
|
13.51 |
|
Bitumen (per barrel) |
68.22 |
|
77.24 |
|
Synthetic crude oil (per barrel) |
91.12 |
|
104.41 |
|
Average foreign exchange rate (US$) |
0.73 |
|
0.73 |
|
Production
|
|
|
|
|
|
|
|
|
|
Third Quarter |
| thousands of barrels per day |
2025 |
|
2024 |
|
Kearl (Imperial's share) |
224 |
|
209 |
|
Cold Lake |
150 |
|
147 |
|
Syncrude |
78 |
|
81 |
|
|
|
|
Kearl total gross production (thousands of barrels per day) |
316 |
|
295 |
|
Higher production at Kearl was primarily driven by improved reliability and recovery.
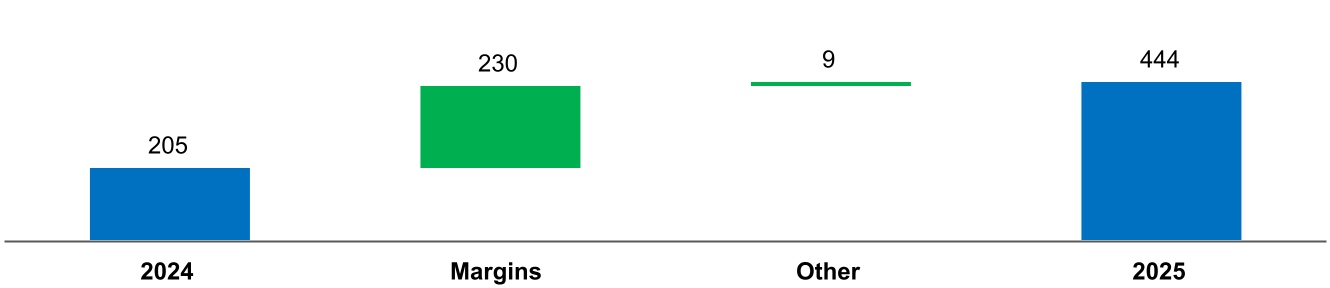
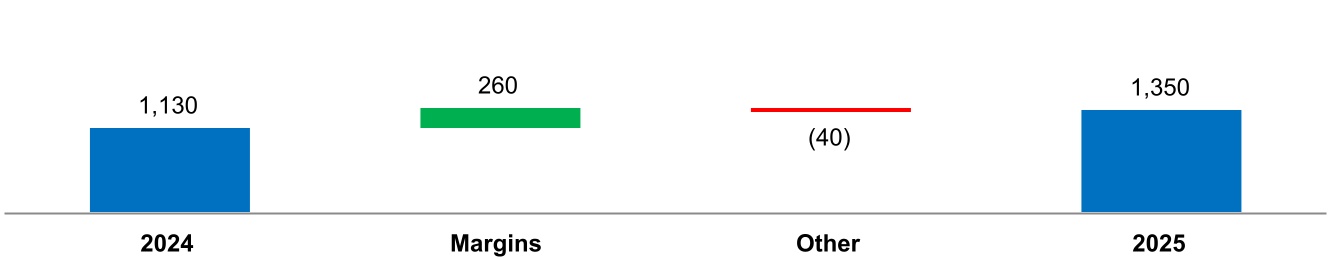
Downstream
Net income (loss) factor analysis
millions of Canadian dollars
Margins - Higher margins primarily reflect improved market conditions.
Other - Includes lower turnaround impacts of about $70 million.
Refinery utilization and petroleum product sales
|
|
|
|
|
|
|
|
|
|
Third Quarter |
| thousands of barrels per day, unless noted |
2025 |
|
2024 |
|
| Refinery throughput |
425 |
|
389 |
|
Refinery capacity utilization (percent) |
98 |
|
90 |
|
Petroleum product sales |
464 |
|
487 |
|
Higher refinery throughput was primarily due to lower turnaround impacts.
Lower petroleum product sales were primarily due to lower volumes in the supply and wholesale channels.
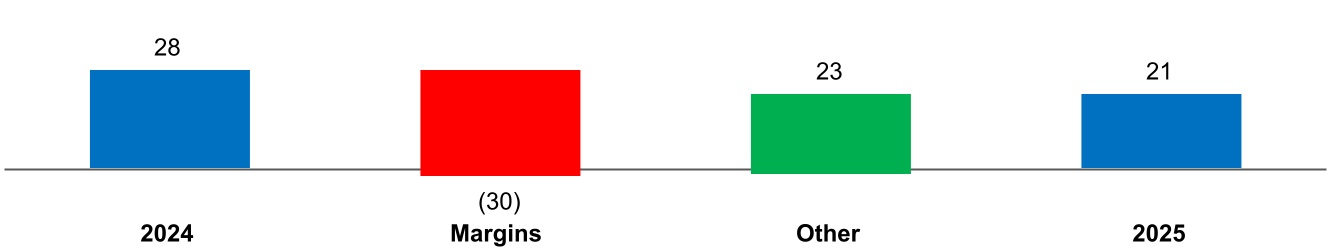
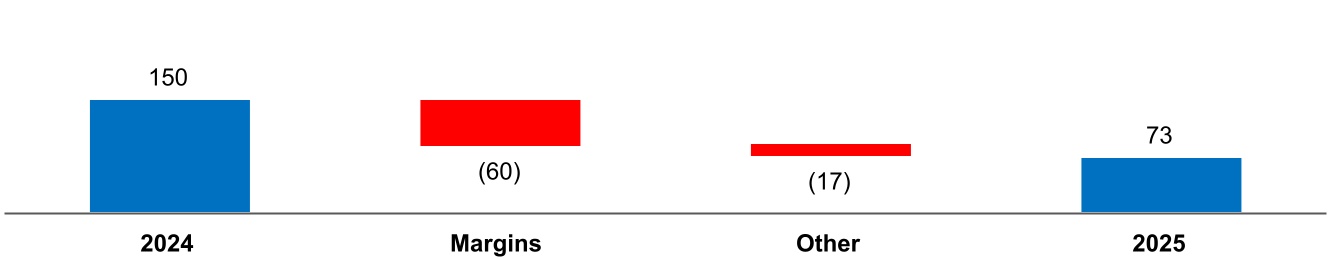
Chemicals
Net income (loss) factor analysis
millions of Canadian dollars
Corporate and other
|
|
|
|
|
|
|
|
|
|
Third Quarter |
| millions of Canadian dollars |
2025 |
|
2024 |
|
Net income (loss) (U.S. GAAP) |
(654) |
|
(23) |
|
Current quarter results include identified items1 of a $306 million after-tax ($406 million before-tax) non-cash impairment charge and a $249 million after-tax ($330 million before-tax) restructuring charge.
Liquidity and capital resources
|
|
|
|
|
|
|
|
|
|
Third Quarter |
| millions of Canadian dollars |
2025 |
|
2024 |
|
| Cash flows from (used in): |
|
|
| Operating activities |
1,798 |
|
1,487 |
|
| Investing activities |
(482) |
|
(484) |
|
| Financing activities |
(1,841) |
|
(1,533) |
|
| Increase (decrease) in cash and cash equivalents |
(525) |
|
(530) |
|
|
|
|
| Cash and cash equivalents at period end |
1,861 |
|
1,490 |
|
Cash flows from operating activities primarily reflect favourable working capital impacts.
Cash flows used in financing activities primarily reflect:
|
|
|
|
|
|
|
|
|
|
Third Quarter |
| millions of Canadian dollars, unless noted |
2025 |
|
2024 |
|
Dividends paid |
366 |
|
322 |
|
Per share dividend paid (dollars) |
0.72 |
|
0.60 |
|
Share repurchases (a) |
1,469 |
|
1,206 |
|
Number of shares purchased (millions) (a) |
12.2 |
|
12.4 |
|
(a)Share repurchases were made under the company’s normal course issuer bid program, and include shares purchased from Exxon Mobil Corporation.
|
|
|
|
|
|
|
|
|
|
|
|
1 Non-GAAP financial measure - see Attachment VI for definition and reconciliation |
|
Nine months 2025 vs. nine months 2024
|
|
|
|
|
|
|
|
|
|
Nine Months |
| millions of Canadian dollars, unless noted |
2025 |
2024 |
Net income (loss) (U.S. GAAP) |
2,776 |
3,565 |
Net income (loss) per common share, assuming dilution (dollars) |
5.46 |
6.66 |
Net income (loss) excluding identified items1 |
3,331 |
3,565 |
|
|
|
Current year results include identified items1 of a $306 million after-tax ($406 million before-tax) non-cash impairment charge and a $249 million after-tax ($330 million before-tax) restructuring charge.
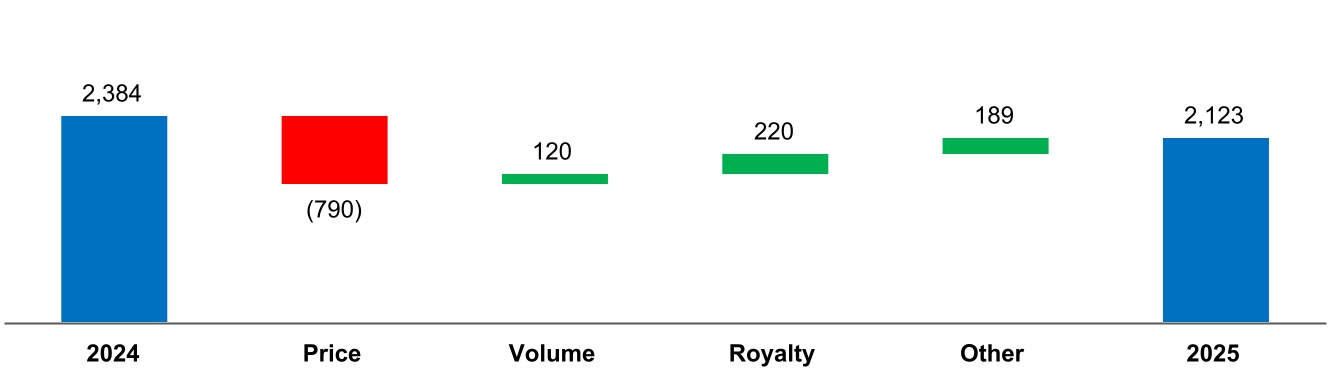
Upstream
Net income (loss) factor analysis
millions of Canadian dollars
Price – Average bitumen realizations decreased by $5.92 per barrel, primarily driven by lower marker prices partially offset by narrowing WTI/WCS spread. Synthetic crude oil realizations decreased by $10.51 per barrel, primarily driven by lower WTI partially offset by an improved Synthetic/WTI spread.
Volume – Higher volumes were driven by higher production at Syncrude, Kearl and Cold Lake.
Royalty – Lower royalties were primarily driven by lower commodity prices.
Other – Primarily due to favourable foreign exchange impacts of about $200 million.
Marker prices and average realizations
|
|
|
|
|
|
|
|
|
|
Nine Months |
| Canadian dollars, unless noted |
2025 |
|
2024 |
|
West Texas Intermediate (US$ per barrel) |
66.65 |
|
77.59 |
|
Western Canada Select (US$ per barrel) |
55.70 |
|
62.15 |
|
WTI/WCS Spread (US$ per barrel) |
10.95 |
|
15.44 |
|
Bitumen (per barrel) |
69.68 |
|
75.60 |
|
Synthetic crude oil (per barrel) |
92.44 |
|
102.95 |
|
Average foreign exchange rate (US$) |
0.71 |
|
0.74 |
|
|
|
|
|
|
|
|
|
|
|
|
|
1 Non-GAAP financial measure - see Attachment VI for definition and reconciliation |
|
Production
|
|
|
|
|
|
|
|
|
|
Nine Months |
| thousands of barrels per day |
2025 |
|
2024 |
|
Kearl (Imperial's share) |
200 |
|
195 |
|
Cold Lake |
150 |
|
145 |
|
Syncrude (a) |
76 |
|
73 |
|
|
|
|
Kearl total gross production (thousands of barrels per day) |
282 |
|
275 |
|
(a)In 2025, Syncrude gross production included about 2 thousand barrels per day of bitumen and other products (2024 - 1 thousand barrels per day) that were exported to the operator's facilities using an existing interconnect pipeline.
Downstream
Net income (loss) factor analysis
millions of Canadian dollars
Margins – Higher margins primarily reflect improved market conditions.
Other – Primarily due to unfavourable wholesale volume impacts of about $70 million, higher operating expenses of about $70 million driven by higher energy costs, and unplanned downtime of about $60 million, partially offset by lower turnaround impacts of about $100 million.
Refinery utilization and petroleum product sales
|
|
|
|
|
|
|
|
|
|
Nine Months |
| thousands of barrels per day, unless noted |
2025 |
|
2024 |
|
| Refinery throughput |
400 |
|
395 |
|
Refinery capacity utilization (percent) |
92 |
|
91 |
|
Petroleum product sales |
466 |
|
469 |
|
Chemicals
Net income (loss) factor analysis
millions of Canadian dollars
Margins - Lower margins primarily reflect weaker industry polyethylene margins.
Corporate and other
|
|
|
|
|
|
|
|
|
|
Nine Months |
| millions of Canadian dollars |
2025 |
|
2024 |
|
Net income (loss) (U.S. GAAP) |
(770) |
|
(99) |
|
Current year results include identified items1 of a $306 million after-tax ($406 million before-tax) non-cash impairment charge and a $249 million after-tax ($330 million before-tax) restructuring charge; results also reflect higher incentive compensation as a result of the higher share price.
Liquidity and capital resources
|
|
|
|
|
|
|
|
|
|
Nine Months |
| millions of Canadian dollars |
2025 |
|
2024 |
|
| Cash flows from (used in): |
|
|
| Operating activities |
4,790 |
|
4,192 |
|
| Investing activities |
(1,331) |
|
(1,421) |
|
| Financing activities |
(2,577) |
|
(2,145) |
|
| Increase (decrease) in cash and cash equivalents |
882 |
|
626 |
|
Cash flows from operating activities primarily reflect favourable working capital impacts.
Cash flows used in investing activities primarily reflect lower additions to property, plant and equipment.
Cash flows used in financing activities primarily reflect:
|
|
|
|
|
|
|
|
|
|
Nine Months |
| millions of Canadian dollars, unless noted |
2025 |
|
2024 |
|
Dividends paid |
1,040 |
|
921 |
|
Per share dividend paid (dollars) |
2.04 |
|
1.70 |
|
Share repurchases (a) |
1,469 |
|
1,206 |
|
Number of shares purchased (millions) (a) |
12.2 |
|
12.4 |
|
(a)Share repurchases were made under the company’s normal course issuer bid program, and include shares purchased from Exxon Mobil Corporation.
On June 23, 2025, the company announced by news release that it had received final approval from the Toronto Stock Exchange for a new normal course issuer bid and will continue its existing share purchase program. The program enables the company to purchase up to a maximum of 25,452,248 common shares during the period June 29, 2025 to June 28, 2026. This maximum includes shares purchased under the normal course issuer bid from Exxon Mobil Corporation. As in the past, Exxon Mobil Corporation has advised the company that it intends to participate to maintain its ownership percentage at approximately 69.6 percent. The program will end should the company purchase the maximum allowable number of shares or otherwise on June 28, 2026. Imperial plans to continue its acceleration of its share purchases under the normal course issuer bid program, and anticipates repurchasing all remaining allowable shares prior to year end. Purchase plans may be modified at any time without prior notice.
Key financial and operating data follow.
|
|
|
|
|
|
|
|
|
|
|
|
1 Non-GAAP financial measure - see Attachment VI for definition and reconciliation |
|
Forward-looking statements
Statements of future events or conditions in this report, including projections, targets, expectations, estimates, and business plans, are forward-looking statements. Similarly, discussion of roadmaps or future plans related to carbon capture, transportation and storage, biofuel, hydrogen, and other future plans to reduce emissions and emission intensity of the company, its affiliates and third parties are dependent on future market factors, such as continued technological progress, policy support and timely rule-making and permitting, and represent forward-looking statements. Forward-looking statements can be identified by words such as believe, anticipate, intend, propose, plan, goal, seek, estimate, expect, future, continue, likely, may, should, will and similar references to future periods. Forward-looking statements in this report include, but are not limited to, references to purchases under the normal course issuer bid and plans to accelerate purchases to complete the program prior to year end; the company’s strategies of increasing cash flow, delivering shareholder returns, growing volumes, lowering unit cash costs, returning surplus cash to shareholders, and leveraging the technology environment and the growth of global capability centres; the company’s restructuring plans and the expected impacts of such plans, including impacts on shareholder returns and value, access to global business and technology centres, improved performance, efficiency and effectiveness, and enhancing the company’s foundation for future growth; and the company’s Leming SAGD redevelopment project, including timing and anticipated production.
Forward-looking statements are based on the company's current expectations, estimates, projections and assumptions at the time the statements are made. Actual future financial and operating results, including expectations and assumptions concerning future energy demand, supply and mix; production rates, growth and mix across various assets; project plans, timing, costs, technical evaluations and capacities and the company’s ability to effectively execute on these plans and operate its assets, including the Strathcona renewable diesel project and the Leming SAGD redevelopment project; the adoption and impact of new facilities or technologies on reductions to greenhouse gas emissions intensity, including but not limited to technologies using solvents to replace energy intensive steam at Cold Lake, Strathcona renewable diesel, carbon capture and storage including in connection with hydrogen for the renewable diesel project, recovery technologies and efficiency projects, and any changes in the scope, terms, or costs of such projects; for shareholder returns, assumptions such as cash flow forecasts, financing sources and capital structure, participation of the company’s majority shareholder in the normal course issuer bid, and the results of periodic and ongoing evaluation of alternate uses of capital; for renewable diesel, the availability and cost of locally-sourced and grown feedstock and the supply of renewable diesel to British Columbia in connection with its low-carbon fuel legislation; the amount and timing of emissions reductions, including the impact of lower carbon fuels; the degree and timeliness of support that will be provided by policymakers and other stakeholders for various new technologies such as carbon capture and storage will be provided; receipt of regulatory approvals in a timely manner, especially with respect to large scale emissions reduction projects; performance of third-party service providers including service providers located outside of Canada and ExxonMobil global capability centres; refinery utilization and product sales; applicable laws and government policies, including with respect to climate change, greenhouse gas emissions reductions and low carbon fuels; the ability to offset any ongoing or renewed inflationary pressures; capital and environmental expenditures; cash generation, financing sources and capital structure, such as dividends and shareholder returns, including the timing and amounts of share repurchases; and commodity prices, foreign exchange rates and general market conditions, could differ materially depending on a number of factors.
These factors include global, regional or local changes in supply and demand for oil, natural gas, and petroleum and petrochemical products and resulting price, differential and margin impacts, including Canadian and foreign government action with respect to supply levels, prices, trade tariffs, trade controls, the occurrence of disruptions in trade or military alliances, and wars; political or regulatory events, including changes in law or government policy, applicable royalty rates, and tax laws; third-party opposition to company and service provider operations, projects and infrastructure; competition from alternative energy sources and competitors who may be more experienced or established in these markets; availability and allocation of capital; the receipt, in a timely manner, of regulatory and third-party approvals, including for new technologies relating to the company’s lower emissions business activities; failure, delay, reduction, revocation or uncertainty regarding supportive policy and market development for the adoption of emerging lower emission energy technologies and other technologies that support emissions reductions; environmental regulation, including climate change and greenhouse gas regulation and changes to such regulation; unanticipated technical or operational difficulties; project management and schedules and timely completion of projects; the results of research programs and new technologies, including with respect to greenhouse gas emissions, and the ability to bring new technologies to scale on a commercially competitive basis, and the competitiveness of alternative energy and other emission reduction technologies; availability and performance of third-party service providers including those located outside of Canada and ExxonMobil global capability centres; environmental risks inherent in oil and gas exploration and production activities; management effectiveness and disaster response preparedness; operational hazards and risks; cybersecurity incidents including incidents caused by actors employing emerging technologies such as artificial intelligence; currency exchange rates; general economic conditions, including inflation and the occurrence and duration of economic recessions or downturns; and other factors discussed in Item 1A risk factors and Item 7 management’s discussion and analysis of financial condition and results of operations of Imperial’s most recent annual report on Form 10-K.
Forward-looking statements are not guarantees of future performance and involve a number of risks and uncertainties, some that are similar to other oil and gas companies and some that are unique to Imperial. Imperial’s actual results may differ materially from those expressed or implied by its forward-looking statements and readers are cautioned not to place undue reliance on them. Imperial undertakes no obligation to update any forward-looking statements contained herein, except as required by applicable law.
Forward-looking and other statements regarding Imperial's environmental, social and other sustainability efforts and aspirations are not an indication that these statements are material to investors or require disclosure in the company's filings with securities regulators. In addition, historical, current and forward-looking environmental, social and sustainability-related statements may be based on standards for measuring progress that are still developing, internal controls and processes that continue to evolve, and assumptions that are subject to change in the future, including future rule-making. Individual projects or opportunities may advance based on a number of factors, including availability of stable and supportive policy, technology for cost-effective abatement, company planning process, and alignment with partners and other stakeholders.
In this release all dollar amounts are expressed in Canadian dollars unless otherwise stated. This release should be read in conjunction with Imperial’s most recent Form 10-K. Note that numbers may not add due to rounding.
The term “project” as used in this release can refer to a variety of different activities and does not necessarily have the same meaning as in any government payment transparency reports.
In this release, unless the context otherwise indicates, reference to “the company” or “Imperial” includes Imperial Oil Limited and its subsidiaries.
|
|
|
|
|
|
|
|
|
|
|
|
|
|
|
|
Attachment I |
|
|
|
|
|
|
|
|
|
|
|
Third Quarter |
Nine Months |
| millions of Canadian dollars, unless noted |
2025 |
|
2024 |
|
2025 |
|
2024 |
|
|
|
|
|
|
| Net income (loss) (U.S. GAAP) |
|
|
|
|
| Total revenues and other income |
12,049 |
13,259 |
35,798 |
38,925 |
| Total expenses |
11,348 |
11,656 |
32,165 |
34,261 |
| Income (loss) before income taxes |
701 |
1,603 |
3,633 |
4,664 |
| Income taxes |
162 |
366 |
857 |
1,099 |
| Net income (loss) |
539 |
1,237 |
2,776 |
3,565 |
|
|
|
|
|
Net income (loss) per common share (dollars) |
1.07 |
2.33 |
|
5.47 |
6.67 |
Net income (loss) per common share - assuming dilution (dollars) |
1.07 |
2.33 |
|
5.46 |
6.66 |
|
|
|
|
|
| Other financial data |
|
|
|
|
| Gain (loss) on asset sales, after tax |
(24) |
2 |
(14) |
5 |
|
|
|
|
|
Total assets at September 30 |
|
|
42,963 |
42,529 |
|
|
|
|
|
Total debt at September 30 |
|
|
3,997 |
4,115 |
|
|
|
|
|
Shareholders' equity at September 30 |
|
|
23,684 |
23,639 |
|
|
|
|
|
|
|
|
|
|
|
|
|
|
|
| Dividends declared on common stock |
|
|
|
|
| Total |
361 |
317 |
1,094 |
960 |
Per common share (dollars) |
0.72 |
0.60 |
2.16 |
1.80 |
|
|
|
|
|
| Millions of common shares outstanding |
|
|
|
|
At September 30 |
|
|
496.9 |
523.4 |
| Average - assuming dilution |
505.1 |
531.9 |
508.6 |
535.3 |
|
|
|
|
|
|
|
|
|
|
|
|
|
|
|
|
|
|
|
|
|
Attachment II |
|
|
|
|
|
|
|
|
|
|
|
Third Quarter |
Nine Months |
| millions of Canadian dollars |
2025 |
|
2024 |
|
2025 |
|
2024 |
|
|
|
|
|
|
| Total cash and cash equivalents at period end |
1,861 |
|
1,490 |
|
1,861 |
|
1,490 |
|
|
|
|
|
|
| Operating activities |
|
|
|
|
| Net income (loss) |
539 |
|
1,237 |
|
2,776 |
|
3,565 |
|
| Adjustments for non-cash items: |
|
|
|
|
| Depreciation and depletion (includes impairments) |
911 |
|
508 |
|
1,920 |
|
1,454 |
|
|
|
|
|
|
| (Gain) loss on asset sales |
22 |
|
(2) |
|
11 |
|
(5) |
|
| Deferred income taxes and other |
(200) |
|
53 |
|
(231) |
|
(186) |
|
| Changes in operating assets and liabilities |
198 |
|
(310) |
|
17 |
|
(634) |
|
| All other items - net |
328 |
|
1 |
|
297 |
|
(2) |
|
| Cash flows from (used in) operating activities |
1,798 |
|
1,487 |
|
4,790 |
|
4,192 |
|
|
|
|
|
|
| Investing activities |
|
|
|
|
| Additions to property, plant and equipment |
(504) |
|
(486) |
|
(1,373) |
|
(1,444) |
|
| Proceeds from asset sales |
21 |
|
— |
|
34 |
|
7 |
|
| Additional investments |
— |
|
— |
|
(4) |
|
— |
|
| Loans to equity companies - net |
1 |
|
2 |
|
12 |
|
16 |
|
| Cash flows from (used in) investing activities |
(482) |
|
(484) |
|
(1,331) |
|
(1,421) |
|
| Cash flows from (used in) financing activities |
(1,841) |
|
(1,533) |
|
(2,577) |
|
(2,145) |
|
|
|
|
|
|
|
|
|
|
|
|
|
|
|
|
|
Attachment III |
|
|
|
|
|
|
|
|
|
|
|
Third Quarter |
Nine Months |
| millions of Canadian dollars |
2025 |
|
2024 |
|
2025 |
|
2024 |
|
|
|
|
|
|
Net income (loss) (U.S. GAAP) |
|
|
|
|
| Upstream |
728 |
1,027 |
2,123 |
2,384 |
Downstream |
444 |
205 |
1,350 |
1,130 |
Chemical |
21 |
28 |
73 |
150 |
| Corporate and other |
(654) |
|
(23) |
|
(770) |
|
(99) |
|
| Net income (loss) |
539 |
1,237 |
2,776 |
3,565 |
|
|
|
|
|
| Revenues and other income |
|
|
|
|
| Upstream |
4,109 |
4,609 |
12,351 |
13,329 |
Downstream |
13,223 |
14,570 |
39,669 |
42,843 |
Chemical |
343 |
255 |
1,071 |
1,092 |
| Eliminations / Corporate and other |
(5,626) |
|
(6,175) |
|
(17,293) |
|
(18,339) |
|
| Revenues and other income |
12,049 |
13,259 |
35,798 |
38,925 |
|
|
|
|
|
| Purchases of crude oil and products |
|
|
|
|
| Upstream |
1,612 |
1,766 |
4,843 |
5,479 |
Downstream |
11,578 |
13,014 |
34,517 |
37,549 |
Chemical |
231 |
157 |
724 |
673 |
| Eliminations / Corporate and other |
(5,645) |
|
(6,203) |
|
(17,337) |
|
(18,405) |
|
| Purchases of crude oil and products |
7,776 |
8,734 |
22,747 |
25,296 |
|
|
|
|
|
| Production and manufacturing |
|
|
|
|
| Upstream |
1,098 |
1,050 |
3,401 |
3,441 |
Downstream |
462 |
423 |
1,385 |
1,279 |
Chemical |
58 |
36 |
171 |
137 |
| Eliminations / Corporate and other |
7 |
8 |
18 |
13 |
| Production and manufacturing |
1,625 |
1,517 |
4,975 |
4,870 |
|
|
|
|
|
| Selling and general |
|
|
|
|
| Upstream |
— |
— |
— |
— |
Downstream |
169 |
170 |
518 |
503 |
Chemical |
22 |
22 |
64 |
71 |
| Eliminations / Corporate and other |
431 |
31 |
550 |
116 |
| Selling and general |
622 |
223 |
1,132 |
690 |
|
|
|
|
|
| Capital and exploration expenditures |
|
|
|
|
| Upstream |
353 |
300 |
972 |
857 |
Downstream |
114 |
133 |
292 |
435 |
Chemical |
4 |
3 |
8 |
11 |
| Corporate and other |
34 |
50 |
104 |
141 |
| Capital and exploration expenditures |
505 |
486 |
1,376 |
1,444 |
| Exploration expenses charged to Upstream income included above |
1 |
1 |
3 |
3 |
|
|
|
|
|
|
|
|
|
|
|
|
|
|
|
|
Attachment IV |
|
|
|
|
|
|
|
|
|
|
| Operating statistics |
Third Quarter |
Nine Months |
|
2025 |
|
2024 |
|
2025 |
|
2024 |
|
|
|
|
|
|
Gross crude oil production (thousands of barrels per day) |
|
|
|
|
Kearl |
224 |
|
209 |
|
200 |
|
195 |
|
| Cold Lake |
150 |
|
147 |
|
150 |
|
145 |
|
Syncrude (a) |
78 |
|
81 |
|
76 |
|
73 |
|
| Conventional |
5 |
|
5 |
|
5 |
|
6 |
|
| Total crude oil production |
457 |
|
442 |
|
431 |
|
419 |
|
|
|
|
|
|
|
|
|
|
|
|
|
|
|
|
Gross natural gas production (millions of cubic feet per day) |
28 |
|
31 |
|
29 |
|
30 |
|
|
|
|
|
|
Gross oil-equivalent production (b) |
462 |
|
447 |
|
436 |
|
424 |
|
| (thousands of oil-equivalent barrels per day) |
|
|
|
|
|
|
|
|
|
Net crude oil production (thousands of barrels per day) |
|
|
|
|
Kearl |
211 |
|
194 |
|
188 |
|
181 |
|
| Cold Lake |
116 |
|
114 |
|
120 |
|
110 |
|
Syncrude (a) |
67 |
|
68 |
|
66 |
|
61 |
|
| Conventional |
5 |
|
5 |
|
4 |
|
6 |
|
| Total crude oil production |
399 |
|
381 |
|
378 |
|
358 |
|
|
|
|
|
|
|
|
|
|
|
|
|
|
|
|
Net natural gas production (millions of cubic feet per day) |
28 |
|
30 |
|
28 |
|
30 |
|
|
|
|
|
|
Net oil-equivalent production (b) |
404 |
|
386 |
|
383 |
|
363 |
|
| (thousands of oil-equivalent barrels per day) |
|
|
|
|
|
|
|
|
|
Kearl blend sales (thousands of barrels per day) |
301 |
|
281 |
|
277 |
|
269 |
|
Cold Lake blend sales (thousands of barrels per day) |
194 |
|
189 |
|
198 |
|
192 |
|
|
|
|
|
|
|
|
|
|
|
Average realizations (Canadian dollars) |
|
|
|
|
Bitumen (per barrel) |
68.22 |
|
77.24 |
|
69.68 |
|
75.60 |
|
Synthetic crude oil (per barrel) |
91.12 |
|
104.41 |
|
92.44 |
|
102.95 |
|
Conventional crude oil (per barrel) |
41.24 |
|
60.91 |
|
43.20 |
|
59.42 |
|
|
|
|
|
|
|
|
|
|
|
|
|
|
|
|
Refinery throughput (thousands of barrels per day) |
425 |
|
389 |
|
400 |
|
395 |
|
Refinery capacity utilization (percent) |
98 |
|
90 |
|
92 |
|
91 |
|
|
|
|
|
|
Petroleum product sales (thousands of barrels per day) |
|
|
|
|
| Gasolines |
226 |
|
227 |
|
222 |
|
223 |
|
| Heating, diesel and jet fuels |
169 |
|
185 |
|
176 |
|
177 |
|
Lube oils and other products |
48 |
|
55 |
|
48 |
|
47 |
|
| Heavy fuel oils |
21 |
|
20 |
|
20 |
|
22 |
|
| Net petroleum products sales |
464 |
|
487 |
|
466 |
|
469 |
|
Petrochemical sales (thousands of tonnes) |
173 |
|
76 |
|
524 |
|
510 |
|
(a)Syncrude gross and net production included bitumen and other products that were exported to the operator’s facilities using an existing interconnect pipeline.
|
|
|
|
|
|
|
|
|
|
|
|
|
|
|
Gross bitumen and other products production (thousands of barrels per day) |
— |
|
— |
|
2 |
|
1 |
|
Net bitumen and other products production (thousands of barrels per day) |
— |
|
— |
|
2 |
|
1 |
|
(b)Gas converted to oil-equivalent at six million cubic feet per one thousand barrels.
|
|
|
|
|
|
|
|
|
|
Attachment V |
|
|
|
|
|
|
|
|
Net income (loss) per |
|
Net income (loss) (U.S. GAAP) |
common share - diluted (a) |
|
millions of Canadian dollars |
Canadian dollars |
|
|
|
| 2021 |
|
|
| First Quarter |
392 |
|
0.53 |
|
| Second Quarter |
366 |
|
0.50 |
|
| Third Quarter |
908 |
|
1.29 |
|
| Fourth Quarter |
813 |
|
1.18 |
|
| Year |
2,479 |
|
3.48 |
|
|
|
|
| 2022 |
|
|
| First Quarter |
1,173 |
|
1.75 |
|
| Second Quarter |
2,409 |
|
3.63 |
|
| Third Quarter |
2,031 |
|
3.24 |
|
| Fourth Quarter |
1,727 |
|
2.86 |
|
| Year |
7,340 |
|
11.44 |
|
|
|
|
| 2023 |
|
|
| First Quarter |
1,248 |
2.13 |
| Second Quarter |
675 |
1.15 |
| Third Quarter |
1,601 |
2.76 |
| Fourth Quarter |
1,365 |
2.47 |
| Year |
4,889 |
8.49 |
|
|
|
| 2024 |
|
|
| First Quarter |
1,195 |
2.23 |
| Second Quarter |
1,133 |
2.11 |
| Third Quarter |
1,237 |
2.33 |
| Fourth Quarter |
1,225 |
2.37 |
| Year |
4,790 |
9.03 |
|
|
|
| 2025 |
|
|
| First Quarter |
1,288 |
2.52 |
| Second Quarter |
949 |
1.86 |
| Third Quarter |
539 |
1.07 |
|
|
|
| Year |
2,776 |
5.46 |
|
|
|
|
|
|
|
|
|
|
|
|
(a)Computed using the average number of shares outstanding during each period. The sum of the quarters presented may not add to the year total.
Attachment VI
Non-GAAP financial measures and other specified financial measures
Certain measures included in this document are not prescribed by U.S. Generally Accepted Accounting Principles (GAAP). These measures constitute "non-GAAP financial measures" under Securities and Exchange Commission Regulation G and Item 10(e) of Regulation S-K, and "specified financial measures" under National Instrument 52-112 Non-GAAP and Other Financial Measures Disclosure of the Canadian Securities Administrators.
Reconciliation of these non-GAAP financial measures to the most comparable GAAP measure, and other information required by these regulations, have been provided. Non-GAAP financial measures and specified financial measures are not standardized financial measures under GAAP and do not have a standardized definition. As such, these measures may not be directly comparable to measures presented by other companies, and should not be considered a substitute for GAAP financial measures.
Cash flows from (used in) operating activities excluding working capital
Cash flows from (used in) operating activities excluding working capital is a non-GAAP financial measure that is the total cash flows from operating activities less the changes in operating assets and liabilities in the period. The most directly comparable financial measure that is disclosed in the financial statements is "Cash flows from (used in) operating activities" within the company’s Consolidated statement of cash flows. Management believes it is useful for investors to consider these numbers in comparing the underlying performance of the company’s business across periods when there are significant period-to-period differences in the amount of changes in working capital. Changes in working capital is equal to “Changes in operating assets and liabilities” as disclosed in the company’s Consolidated statement of cash flows and in Attachment II of this document. This measure assesses the cash flows at an operating level, and as such, does not include proceeds from asset sales as defined in Cash flows from operating activities and asset sales in the Frequently Used Terms section of the company’s annual Form 10-K.
Reconciliation of cash flows from (used in) operating activities excluding working capital
|
|
|
|
|
|
|
|
|
|
|
|
|
|
|
|
Third Quarter |
Nine Months |
| millions of Canadian dollars |
2025 |
|
2024 |
|
2025 |
|
2024 |
|
| From Imperial's Consolidated statement of cash flows |
|
|
|
|
| Cash flows from (used in) operating activities |
1,798 |
1,487 |
4,790 |
4,192 |
|
|
|
|
|
|
| Less changes in working capital |
|
|
|
|
| Changes in operating assets and liabilities |
198 |
|
(310) |
|
17 |
|
(634) |
|
Cash flows from (used in) operating activities excl. working capital (a) |
1,600 |
|
1,797 |
|
4,773 |
|
4,826 |
|
(a)Includes a $149 million unfavourable impact associated with the short-term component of the restructuring charge included in the identified items1.
Free cash flow
Free cash flow is a non-GAAP financial measure that is cash flows from operating activities less additions to property, plant and equipment and equity company investments plus proceeds from asset sales. The most directly comparable financial measure that is disclosed in the financial statements is "Cash flows from (used in) operating activities" within the company’s Consolidated statement of cash flows. This measure is used to evaluate cash available for financing activities (including but not limited to dividends and share purchases) after investment in the business.
Reconciliation of free cash flow
|
|
|
|
|
|
|
|
|
|
|
|
|
|
|
|
Third Quarter |
Nine Months |
| millions of Canadian dollars |
2025 |
|
2024 |
|
2025 |
|
2024 |
|
| From Imperial's Consolidated statement of cash flows |
|
|
|
|
| Cash flows from (used in) operating activities |
1,798 |
|
1,487 |
|
4,790 |
|
4,192 |
|
|
|
|
|
|
| Cash flows from (used in) investing activities |
|
|
|
|
| Additions to property, plant and equipment |
(504) |
|
(486) |
|
(1,373) |
|
(1,444) |
|
| Proceeds from asset sales |
21 |
|
— |
|
34 |
|
7 |
|
| Additional investments |
— |
|
— |
|
(4) |
|
— |
|
| Loans to equity companies - net |
1 |
|
2 |
|
12 |
|
16 |
|
| Free cash flow |
1,316 |
|
1,003 |
|
3,459 |
|
2,771 |
|
Net income (loss) excluding identified items
Net income (loss) excluding identified items is a non-GAAP financial measure that is total net income (loss) excluding individually significant non-operational events with an absolute corporate total earnings impact of at least $100 million in a given quarter. Net income (loss) excluding identified items per common share is a non-GAAP ratio which is calculated by dividing Net income (loss) excluding identified items by the weighted-average number of common shares outstanding, assuming dilution. The net income (loss) impact of an identified item for an individual segment may be less than $100 million when the item impacts several segments or several periods. The most directly comparable financial measure that is disclosed in the financial statements is "Net income (loss)" within the company’s Consolidated statement of income. Management uses these figures to improve comparability of the underlying business across multiple periods by isolating and removing significant non-operational events from business results. The company believes this view provides investors increased transparency into business results and trends, and provides investors with a view of the business as seen through the eyes of management. Net income (loss) excluding identified items is not meant to be viewed in isolation or as a substitute for net income (loss) as prepared in accordance with U.S. GAAP. All identified items are presented on an after-tax basis.
Reconciliation of net income (loss) excluding identified items
|
|
|
|
|
|
|
|
|
|
|
|
|
|
|
|
Third Quarter |
Nine Months |
| millions of Canadian dollars |
2025 |
2024 |
2025 |
2024 |
| From Imperial's Consolidated statement of income |
|
|
|
|
| Net income (loss) (U.S. GAAP) |
539 |
|
1,237 |
|
2,776 |
|
3,565 |
|
|
|
|
|
|
| Less identified items included in Net income (loss) |
|
|
|
|
|
|
|
|
|
| Impairments |
(306) |
|
— |
|
(306) |
|
— |
|
| Restructuring charges |
(249) |
|
— |
|
(249) |
|
— |
|
| Subtotal of identified items |
(555) |
|
— |
|
(555) |
|
— |
|
|
|
|
|
|
| Net income (loss) excluding identified items |
1,094 |
|
1,237 |
|
3,331 |
|
3,565 |
|
Reconciliation of net income (loss) excluding identified items per common share, assuming dilution
|
|
|
|
|
|
|
|
|
|
|
|
|
|
|
|
Third Quarter |
Nine Months |
| Canadian dollars |
2025 |
2024 |
2025 |
2024 |
| From Imperial's Consolidated statement of income |
|
|
|
|
Net income (loss) per common share, assuming dilution |
1.07 |
|
2.33 |
|
5.46 |
|
6.66 |
|
|
|
|
|
|
| Less identified items included in Net income (loss) per common share, assuming dilution |
|
|
|
|
|
|
|
|
|
| Impairments |
(0.61) |
|
— |
|
(0.60) |
|
— |
|
| Restructuring charges |
(0.49) |
|
— |
|
(0.49) |
|
— |
|
| Subtotal of identified items per common share, assuming dilution |
(1.10) |
|
— |
|
(1.09) |
|
— |
|
|
|
|
|
|
| Net income (loss) excluding identified items per common share, assuming dilution |
2.17 |
|
2.33 |
|
6.55 |
|
6.66 |
|
Cash operating costs (cash costs)
Cash operating costs is a non-GAAP financial measure that consists of total expenses, less purchases of crude oil and products, federal excise taxes and fuel charge, financing, and costs that are non-cash in nature, including depreciation and depletion, and non-service pension and postretirement benefit. The components of cash operating costs include "Production and manufacturing", "Selling and general" and "Exploration" from the company’s Consolidated statement of income, and as disclosed in Attachment III of this document. The sum of these income statement lines serves as an indication of cash operating costs and does not reflect the total cash expenditures of the company. The most directly comparable financial measure that is disclosed in the financial statements is "Total expenses" within the company’s Consolidated statement of income. This measure is useful for investors to understand the company’s efforts to optimize cash through disciplined expense management.
Reconciliation of cash operating costs
|
|
|
|
|
|
|
|
|
|
|
|
|
|
|
|
Third Quarter |
Nine Months |
| millions of Canadian dollars |
2025 |
|
2024 |
|
2025 |
|
2024 |
|
| From Imperial's Consolidated statement of income |
|
|
|
|
| Total expenses |
11,348 |
11,656 |
32,165 |
34,261 |
| Less: |
|
|
|
|
| Purchases of crude oil and products |
7,776 |
8,734 |
22,747 |
25,296 |
| Federal excise taxes and fuel charge |
380 |
661 |
1,344 |
1,908 |
| Depreciation and depletion (includes impairments) |
911 |
508 |
1,920 |
1,454 |
| Non-service pension and postretirement benefit |
25 |
1 |
36 |
3 |
| Financing |
8 |
11 |
8 |
|
37 |
| Cash operating costs |
2,248 |
1,741 |
6,110 |
5,563 |
Components of cash operating costs
|
|
|
|
|
|
|
|
|
|
|
|
|
|
|
|
Third Quarter |
Nine Months |
| millions of Canadian dollars |
2025 |
|
2024 |
|
2025 |
|
2024 |
|
| From Imperial's Consolidated statement of income |
|
|
|
|
| Production and manufacturing |
1,625 |
1,517 |
4,975 |
4,870 |
| Selling and general |
622 |
223 |
1,132 |
690 |
| Exploration |
1 |
1 |
3 |
3 |
| Cash operating costs |
2,248 |
1,741 |
6,110 |
5,563 |
Segment contributions to total cash operating costs
|
|
|
|
|
|
|
|
|
|
|
|
|
|
|
|
Third Quarter |
Nine Months |
| millions of Canadian dollars |
2025 |
|
2024 |
|
2025 |
|
2024 |
|
| Upstream |
1,099 |
1,051 |
3,404 |
3,444 |
| Downstream |
631 |
593 |
1,903 |
1,782 |
| Chemicals |
80 |
58 |
235 |
208 |
| Eliminations / Corporate and other |
438 |
39 |
568 |
129 |
| Cash operating costs |
2,248 |
1,741 |
6,110 |
5,563 |
Unit cash operating costs (unit cash costs)
Unit cash operating costs is a non-GAAP ratio. Unit cash operating costs (unit cash costs) is calculated by dividing cash operating costs by total gross oil-equivalent production, and is calculated for the Upstream segment, as well as the major Upstream assets. Cash operating costs is a non-GAAP financial measure and is disclosed and reconciled above. This measure is useful for investors to understand the expense management efforts of the company’s major assets as a component of the overall Upstream segment. Unit cash operating cost, as used by management, does not directly align with the definition of “Average unit production costs” as set out by the U.S. Securities and Exchange Commission (SEC), and disclosed in the company’s SEC Form 10-K.
Components of unit cash operating costs
|
|
|
|
|
|
|
|
|
|
|
|
|
|
|
|
|
|
|
|
|
|
|
|
|
|
|
|
Third Quarter |
|
2025 |
2024 |
| millions of Canadian dollars |
Upstream
(a)
|
Kearl
|
Cold Lake
|
Syncrude |
Upstream (a) |
Kearl |
Cold Lake |
Syncrude |
| Production and manufacturing |
1,098 |
427 |
253 |
369 |
1,050 |
461 |
238 |
313 |
| Selling and general |
— |
— |
— |
— |
— |
— |
— |
— |
| Exploration |
1 |
— |
— |
— |
1 |
— |
— |
— |
| Cash operating costs |
1,099 |
427 |
253 |
369 |
1,051 |
461 |
238 |
313 |
|
|
|
|
|
|
|
|
|
| Gross oil-equivalent production |
462 |
224 |
150 |
78 |
447 |
209 |
147 |
81 |
| (thousands of barrels per day) |
|
|
|
|
|
|
|
|
|
|
|
|
|
|
|
|
|
| Unit cash operating cost ($/oeb) |
25.86 |
20.72 |
18.33 |
51.42 |
25.56 |
23.98 |
17.60 |
42.00 |
|
USD converted at the quarterly average forex
2025 US$0.73; 2024 US$0.73
|
18.88 |
15.13 |
13.38 |
37.54 |
18.66 |
17.51 |
12.85 |
30.66 |
Components of unit cash operating costs
|
|
|
|
|
|
|
|
|
|
|
|
|
|
|
|
|
|
|
|
|
|
|
|
|
|
|
|
Nine Months |
|
2025 |
2024 |
| millions of Canadian dollars |
Upstream
(a)
|
Kearl
|
Cold Lake
|
Syncrude |
Upstream (a) |
Kearl |
Cold Lake |
Syncrude |
| Production and manufacturing |
3,401 |
1,376 |
810 |
1,051 |
3,441 |
1,459 |
809 |
1,055 |
| Selling and general |
— |
— |
— |
— |
— |
— |
— |
— |
| Exploration |
3 |
— |
— |
— |
3 |
— |
— |
— |
| Cash operating costs |
3,404 |
1,376 |
810 |
1,051 |
3,444 |
1,459 |
809 |
1,055 |
|
|
|
|
|
|
|
|
|
| Gross oil-equivalent production |
436 |
200 |
150 |
76 |
424 |
195 |
145 |
73 |
| (thousands of barrels per day) |
|
|
|
|
|
|
|
|
|
|
|
|
|
|
|
|
|
| Unit cash operating cost ($/oeb) |
28.60 |
25.20 |
19.78 |
50.66 |
29.64 |
27.31 |
20.36 |
52.74 |
|
USD converted at the YTD average forex
2025 US$0.71; 2024 US$0.74
|
20.31 |
17.89 |
14.04 |
35.97 |
21.93 |
20.21 |
15.07 |
39.03 |
(a)Upstream includes Imperial's share of Kearl, Cold Lake, Syncrude and other.