FALSE2023Q3000004993812/31
|
|
|
|
|
|
|
|
|
|
|
|
|
|
|
|
|
|
|
|
| (a) Amounts from related parties included in revenues. |
3,553 |
|
4,454 |
|
10,245 |
|
13,588 |
|
|
|
|
|
|
|
|
|
|
|
|
|
|
|
|
|
|
|
|
|
| (b) Amounts to related parties included in purchases of crude oil and products. |
1,228 |
|
1,086 |
|
3,270 |
|
2,865 |
|
|
|
|
|
|
|
|
|
|
|
|
|
|
|
|
|
|
|
|
|
(c) Amounts to related parties included in production and manufacturing,
and selling and general expenses. |
121 |
|
120 |
|
381 |
|
354 |
|
|
|
|
|
|
|
|
|
|
|
|
|
|
|
|
|
|
|
|
|
| (d) Amounts to related parties included in financing. |
44 |
|
28 |
|
124 |
|
45 |
|
|
|
|
|
|
|
|
|
|
|
|
|
|
|
|
|
|
|
|
|
| (b) Included contributions to registered pension plans. |
(43) |
|
(41) |
|
(129) |
|
(137) |
|
http://fasb.org/us-gaap/2023#LongTermDebtAndCapitalLeaseObligationshttp://fasb.org/us-gaap/2023#LongTermDebtAndCapitalLeaseObligations
00000499382023-01-012023-09-3000000499382023-09-30xbrli:shares00000499382023-07-012023-09-30iso4217:CAD00000499382022-07-012022-09-3000000499382022-01-012022-09-30iso4217:CADxbrli:shares0000049938us-gaap:RelatedPartyMember2023-07-012023-09-300000049938us-gaap:RelatedPartyMember2022-07-012022-09-300000049938us-gaap:RelatedPartyMember2023-01-012023-09-300000049938us-gaap:RelatedPartyMember2022-01-012022-09-3000000499382022-12-310000049938us-gaap:RelatedPartyMember2023-09-300000049938us-gaap:RelatedPartyMember2022-12-310000049938us-gaap:CommonStockMember2023-06-300000049938us-gaap:CommonStockMember2022-06-300000049938us-gaap:CommonStockMember2022-12-310000049938us-gaap:CommonStockMember2021-12-310000049938us-gaap:CommonStockMember2023-07-012023-09-300000049938us-gaap:CommonStockMember2022-07-012022-09-300000049938us-gaap:CommonStockMember2023-01-012023-09-300000049938us-gaap:CommonStockMember2022-01-012022-09-300000049938us-gaap:CommonStockMember2023-09-300000049938us-gaap:CommonStockMember2022-09-300000049938us-gaap:RetainedEarningsMember2023-06-300000049938us-gaap:RetainedEarningsMember2022-06-300000049938us-gaap:RetainedEarningsMember2022-12-310000049938us-gaap:RetainedEarningsMember2021-12-310000049938us-gaap:RetainedEarningsMember2023-07-012023-09-300000049938us-gaap:RetainedEarningsMember2022-07-012022-09-300000049938us-gaap:RetainedEarningsMember2023-01-012023-09-300000049938us-gaap:RetainedEarningsMember2022-01-012022-09-300000049938us-gaap:RetainedEarningsMember2023-09-300000049938us-gaap:RetainedEarningsMember2022-09-300000049938us-gaap:AccumulatedOtherComprehensiveIncomeMember2023-06-300000049938us-gaap:AccumulatedOtherComprehensiveIncomeMember2022-06-300000049938us-gaap:AccumulatedOtherComprehensiveIncomeMember2022-12-310000049938us-gaap:AccumulatedOtherComprehensiveIncomeMember2021-12-310000049938us-gaap:AccumulatedOtherComprehensiveIncomeMember2023-07-012023-09-300000049938us-gaap:AccumulatedOtherComprehensiveIncomeMember2022-07-012022-09-300000049938us-gaap:AccumulatedOtherComprehensiveIncomeMember2023-01-012023-09-300000049938us-gaap:AccumulatedOtherComprehensiveIncomeMember2022-01-012022-09-300000049938us-gaap:AccumulatedOtherComprehensiveIncomeMember2023-09-300000049938us-gaap:AccumulatedOtherComprehensiveIncomeMember2022-09-3000000499382022-09-3000000499382023-06-3000000499382022-06-3000000499382021-12-310000049938imo:UpstreamMember2023-07-012023-09-300000049938imo:UpstreamMember2022-07-012022-09-300000049938imo:DownstreamMember2023-07-012023-09-300000049938imo:DownstreamMember2022-07-012022-09-300000049938imo:ChemicalMember2023-07-012023-09-300000049938imo:ChemicalMember2022-07-012022-09-300000049938imo:UpstreamMemberus-gaap:IntersegmentEliminationMember2023-07-012023-09-300000049938imo:UpstreamMemberus-gaap:IntersegmentEliminationMember2022-07-012022-09-300000049938imo:DownstreamMemberus-gaap:IntersegmentEliminationMember2023-07-012023-09-300000049938imo:DownstreamMemberus-gaap:IntersegmentEliminationMember2022-07-012022-09-300000049938us-gaap:IntersegmentEliminationMemberimo:ChemicalMember2023-07-012023-09-300000049938us-gaap:IntersegmentEliminationMemberimo:ChemicalMember2022-07-012022-09-300000049938imo:UpstreamMemberus-gaap:OperatingSegmentsMember2023-07-012023-09-300000049938imo:UpstreamMemberus-gaap:OperatingSegmentsMember2022-07-012022-09-300000049938imo:DownstreamMemberus-gaap:OperatingSegmentsMember2023-07-012023-09-300000049938imo:DownstreamMemberus-gaap:OperatingSegmentsMember2022-07-012022-09-300000049938us-gaap:OperatingSegmentsMemberimo:ChemicalMember2023-07-012023-09-300000049938us-gaap:OperatingSegmentsMemberimo:ChemicalMember2022-07-012022-09-300000049938us-gaap:CorporateNonSegmentMember2023-07-012023-09-300000049938us-gaap:CorporateNonSegmentMember2022-07-012022-09-300000049938srt:ConsolidationEliminationsMember2023-07-012023-09-300000049938srt:ConsolidationEliminationsMember2022-07-012022-09-300000049938country:US2023-07-012023-09-300000049938country:US2022-07-012022-09-300000049938imo:UpstreamMember2023-01-012023-09-300000049938imo:UpstreamMember2022-01-012022-09-300000049938imo:DownstreamMember2023-01-012023-09-300000049938imo:DownstreamMember2022-01-012022-09-300000049938imo:ChemicalMember2023-01-012023-09-300000049938imo:ChemicalMember2022-01-012022-09-300000049938imo:UpstreamMemberus-gaap:IntersegmentEliminationMember2023-01-012023-09-300000049938imo:UpstreamMemberus-gaap:IntersegmentEliminationMember2022-01-012022-09-300000049938imo:DownstreamMemberus-gaap:IntersegmentEliminationMember2023-01-012023-09-300000049938imo:DownstreamMemberus-gaap:IntersegmentEliminationMember2022-01-012022-09-300000049938us-gaap:IntersegmentEliminationMemberimo:ChemicalMember2023-01-012023-09-300000049938us-gaap:IntersegmentEliminationMemberimo:ChemicalMember2022-01-012022-09-300000049938imo:UpstreamMemberus-gaap:OperatingSegmentsMember2023-01-012023-09-300000049938imo:UpstreamMemberus-gaap:OperatingSegmentsMember2022-01-012022-09-300000049938imo:DownstreamMemberus-gaap:OperatingSegmentsMember2023-01-012023-09-300000049938imo:DownstreamMemberus-gaap:OperatingSegmentsMember2022-01-012022-09-300000049938us-gaap:OperatingSegmentsMemberimo:ChemicalMember2023-01-012023-09-300000049938us-gaap:OperatingSegmentsMemberimo:ChemicalMember2022-01-012022-09-300000049938imo:UpstreamMemberus-gaap:OperatingSegmentsMember2023-09-300000049938imo:UpstreamMemberus-gaap:OperatingSegmentsMember2022-09-300000049938imo:DownstreamMemberus-gaap:OperatingSegmentsMember2023-09-300000049938imo:DownstreamMemberus-gaap:OperatingSegmentsMember2022-09-300000049938us-gaap:OperatingSegmentsMemberimo:ChemicalMember2023-09-300000049938us-gaap:OperatingSegmentsMemberimo:ChemicalMember2022-09-300000049938us-gaap:CorporateNonSegmentMember2023-01-012023-09-300000049938us-gaap:CorporateNonSegmentMember2022-01-012022-09-300000049938srt:ConsolidationEliminationsMember2023-01-012023-09-300000049938srt:ConsolidationEliminationsMember2022-01-012022-09-300000049938us-gaap:CorporateNonSegmentMember2023-09-300000049938us-gaap:CorporateNonSegmentMember2022-09-300000049938srt:ConsolidationEliminationsMember2023-09-300000049938srt:ConsolidationEliminationsMember2022-09-300000049938country:US2023-01-012023-09-300000049938country:US2022-01-012022-09-300000049938imo:XtoEnergyCanadaMember2022-07-012022-09-300000049938us-gaap:PensionPlansDefinedBenefitMember2023-07-012023-09-300000049938us-gaap:PensionPlansDefinedBenefitMember2022-07-012022-09-300000049938us-gaap:PensionPlansDefinedBenefitMember2023-01-012023-09-300000049938us-gaap:PensionPlansDefinedBenefitMember2022-01-012022-09-300000049938us-gaap:OtherPostretirementBenefitPlansDefinedBenefitMember2023-07-012023-09-300000049938us-gaap:OtherPostretirementBenefitPlansDefinedBenefitMember2022-07-012022-09-300000049938us-gaap:OtherPostretirementBenefitPlansDefinedBenefitMember2023-01-012023-09-300000049938us-gaap:OtherPostretirementBenefitPlansDefinedBenefitMember2022-01-012022-09-300000049938us-gaap:AccountsPayableAndAccruedLiabilitiesMember2023-09-300000049938us-gaap:AccountsPayableAndAccruedLiabilitiesMember2022-12-310000049938imo:CrudeBarrelsMember2023-09-30utr:bbl0000049938imo:CrudeBarrelsMember2022-12-310000049938imo:ProductsBarrelsMember2023-09-300000049938imo:ProductsBarrelsMember2022-12-310000049938us-gaap:FairValueInputsLevel1Member2023-09-300000049938us-gaap:FairValueInputsLevel2Member2023-09-300000049938us-gaap:FairValueInputsLevel3Member2023-09-300000049938imo:DerivativeFairValueOfDerivativeAmountEffectOfCounterPartyNettingMember2023-09-300000049938imo:DerivativeFairValueOfDerivativeAmountEffectOfCollateralNettingMember2023-09-300000049938imo:NetCarryingValueMember2023-09-300000049938us-gaap:FairValueInputsLevel1Member2022-12-310000049938us-gaap:FairValueInputsLevel2Member2022-12-310000049938us-gaap:FairValueInputsLevel3Member2022-12-310000049938imo:DerivativeFairValueOfDerivativeAmountEffectOfCounterPartyNettingMember2022-12-310000049938imo:DerivativeFairValueOfDerivativeAmountEffectOfCollateralNettingMember2022-12-310000049938imo:NetCarryingValueMember2022-12-310000049938imo:MasterNettingArrangementsMember2023-09-300000049938imo:MasterNettingArrangementsMember2022-12-3100000499382023-06-292023-06-290000049938imo:NormalCourseIssuerBidEffectiveFromJuneTwentyNinthTwoThousandAndTwentyThreeMember2023-06-290000049938imo:NormalCourseIssuerBidEffectiveFromJuneTwentyNinthTwoThousandAndTwentyThreeMemberimo:ExxonMobilCorporationMember2023-06-29xbrli:pure0000049938imo:NormalCourseIssuerBidEffectiveFromOctoberTwentySeventhTwoThousandAndTwentyThreeMemberus-gaap:SubsequentEventMemberimo:ExxonMobilCorporationMember2023-10-270000049938us-gaap:CommonStockMember2022-01-012022-12-310000049938us-gaap:AccumulatedDefinedBenefitPlansAdjustmentMember2022-12-310000049938us-gaap:AccumulatedDefinedBenefitPlansAdjustmentMember2021-12-310000049938us-gaap:AccumulatedDefinedBenefitPlansAdjustmentMember2023-01-012023-09-300000049938us-gaap:AccumulatedDefinedBenefitPlansAdjustmentMember2022-01-012022-09-300000049938us-gaap:AccumulatedDefinedBenefitPlansAdjustmentMember2023-09-300000049938us-gaap:AccumulatedDefinedBenefitPlansAdjustmentMember2022-09-300000049938imo:AccumulatedDefinedBenefitPlansAdjustmentBeforeTaxMember2023-07-012023-09-300000049938imo:AccumulatedDefinedBenefitPlansAdjustmentBeforeTaxMember2022-07-012022-09-300000049938imo:AccumulatedDefinedBenefitPlansAdjustmentBeforeTaxMember2023-01-012023-09-300000049938imo:AccumulatedDefinedBenefitPlansAdjustmentBeforeTaxMember2022-01-012022-09-30
UNITED STATES
SECURITIES AND EXCHANGE COMMISSION
Washington, D.C. 20549
FORM 10-Q
☑ QUARTERLY REPORT PURSUANT TO SECTION 13 OR 15(d)
OF THE SECURITIES EXCHANGE ACT OF 1934
For the quarterly period ended September 30, 2023
OR
☐ TRANSITION REPORT PURSUANT TO SECTION 13 OR 15(d)
OF THE SECURITIES EXCHANGE ACT OF 1934
For the transition period from ___ to ___
Commission file number 0-12014
IMPERIAL OIL LIMITED
(Exact name of registrant as specified in its charter)
|
|
|
|
|
|
|
|
|
| Canada |
|
98-0017682 |
| (State or other jurisdiction |
|
(I.R.S. Employer |
| of incorporation or organization) |
|
Identification No.) |
|
|
505 Quarry Park Boulevard S.E. Calgary, Alberta, Canada |
|
T2C 5N1 |
| (Address of principal executive offices) |
|
(Postal Code) |
1-800-567-3776
(Registrant’s telephone number, including area code)
Securities registered pursuant to Section 12(b) of the Act:
|
|
|
|
|
|
|
|
|
|
|
|
|
|
|
| Title of each class |
|
Trading symbol |
|
Name of each exchange on
which registered
|
| None |
|
|
|
None |
Indicate by check mark whether the registrant (1) has filed all reports required to be filed by Section 13 or 15(d) of the Securities Exchange Act of 1934 during the preceding 12 months (or for such shorter period that the registrant was required to file such reports), and (2) has been subject to such filing requirements for the past 90 days.
Indicate by check mark whether the registrant has submitted electronically every Interactive Data File required to be submitted pursuant to Rule 405 of Regulation S-T (§ 232.405 of this chapter) during the preceding 12 months (or for such shorter period that the registrant was required to submit such files).
Indicate by check mark whether the registrant is a large accelerated filer, an accelerated filer, a non-accelerated filer, smaller reporting company, or an emerging growth company. See the definition of “large accelerated filer”, “accelerated filer”, “smaller reporting company” and “emerging growth company” in Rule 12b-2 of the Exchange Act of 1934.
|
|
|
|
|
|
|
|
|
|
|
|
|
|
|
|
|
|
| Large accelerated filer |
✓ |
|
Smaller reporting company |
|
|
| Non-accelerated filer |
|
|
Emerging growth company |
|
|
| Accelerated filer |
|
|
|
|
|
If an emerging growth company, indicate by check mark if the registrant has elected not to use the extended transition period for complying with any new or revised financial accounting standards provided pursuant to Section 13(a) of the Exchange Act. ___
Indicate by check mark whether the registrant is a shell company (as defined in Rule 12b-2 of the Exchange Act of 1934).
The number of common shares outstanding, as of September 30, 2023 was 566,667,118.
Table of contents
|
|
|
|
|
|
|
Page |
|
|
| PART I. FINANCIAL INFORMATION |
|
| Item 1. Financial statements |
|
| Consolidated statement of income |
|
| Consolidated statement of comprehensive income |
|
| Consolidated balance sheet |
|
| Consolidated statement of shareholders’ equity |
|
| Consolidated statement of cash flows |
|
| Notes to consolidated financial statements |
|
| Item 2. Management’s discussion and analysis of financial condition and results of operations |
|
| Item 3. Quantitative and qualitative disclosures about market risk |
|
| Item 4. Controls and procedures |
|
|
|
| PART II. OTHER INFORMATION |
|
| Item 1. Legal proceedings |
|
| Item 2. Unregistered sales of equity securities and use of proceeds |
|
| Item 5. Other information |
|
| Item 6. Exhibits |
|
|
|
| SIGNATURES |
|
In this report, all dollar amounts are expressed in Canadian dollars unless otherwise stated. This report should be read in conjunction with the company’s annual report on Form 10-K for the year ended December 31, 2022. Note that numbers may not add due to rounding.
The term “project” as used in this report can refer to a variety of different activities and does not necessarily have the same meaning as in any government payment transparency reports.
In this report, unless the context otherwise indicates, reference to “the company” or “Imperial” includes Imperial Oil Limited and its subsidiaries.
PART I. FINANCIAL INFORMATION
Item 1. Financial statements
|
|
|
|
|
|
|
|
|
|
|
|
|
|
|
Consolidated statement of income (U.S. GAAP, unaudited) |
|
|
|
|
|
|
|
|
|
|
|
|
|
|
|
| |
Third Quarter |
Nine Months
to September 30
|
| millions of Canadian dollars |
2023 |
|
2022 |
|
2023 |
|
2022 |
|
| Revenues and other income |
|
|
|
|
Revenues (a) |
13,873 |
|
15,071 |
|
37,694 |
|
45,013 |
|
Investment and other income (note 3) |
47 |
|
153 |
|
166 |
|
204 |
|
| Total revenues and other income |
13,920 |
|
15,224 |
|
37,860 |
|
45,217 |
|
| |
|
|
|
|
| Expenses |
|
|
|
|
| Exploration |
1 |
|
1 |
|
3 |
|
4 |
|
Purchases of crude oil and products (b) |
8,748 |
|
9,478 |
|
24,082 |
|
28,849 |
|
Production and manufacturing (c) |
1,666 |
|
1,872 |
|
5,207 |
|
5,439 |
|
Selling and general (c) |
237 |
|
209 |
|
629 |
|
625 |
|
| Federal excise tax and fuel charge |
654 |
|
584 |
|
1,781 |
|
1,616 |
|
| Depreciation and depletion |
475 |
|
555 |
|
1,418 |
|
1,432 |
|
| Non-service pension and postretirement benefit |
20 |
|
4 |
|
60 |
|
13 |
|
Financing (d) (note 5) |
19 |
|
16 |
|
51 |
|
34 |
|
| Total expenses |
11,820 |
|
12,719 |
|
33,231 |
|
38,012 |
|
| |
|
|
|
|
| Income (loss) before income taxes |
2,100 |
|
2,505 |
|
4,629 |
|
7,205 |
|
|
|
|
|
|
| Income taxes |
499 |
|
474 |
|
1,105 |
|
1,592 |
|
|
|
|
|
|
| Net income (loss) |
1,601 |
|
2,031 |
|
3,524 |
|
5,613 |
|
|
|
|
|
|
Per share information (Canadian dollars) |
|
|
|
|
Net income (loss) per common share - basic (note 9) |
2.77 |
|
3.25 |
|
6.05 |
|
8.60 |
|
Net income (loss) per common share - diluted (note 9) |
2.76 |
|
3.24 |
|
6.04 |
|
8.58 |
|
| (a) Amounts from related parties included in revenues. |
3,553 |
|
4,454 |
|
10,245 |
|
13,588 |
|
| (b) Amounts to related parties included in purchases of crude oil and products. |
1,228 |
|
1,086 |
|
3,270 |
|
2,865 |
|
| (c) Amounts to related parties included in production and manufacturing, and selling and general expenses.
|
121 |
|
120 |
|
381 |
|
354 |
|
| (d) Amounts to related parties included in financing. |
44 |
|
28 |
|
124 |
|
45 |
|
|
|
|
|
|
| The information in the notes to consolidated financial statements is an integral part of these statements. |
Consolidated statement of comprehensive income (U.S. GAAP, unaudited)
|
|
|
|
|
|
|
|
|
|
|
|
|
|
|
| |
Third Quarter |
Nine Months
to September 30
|
| millions of Canadian dollars |
2023 |
|
2022 |
|
2023 |
|
2022 |
|
| Net income (loss) |
1,601 |
|
2,031 |
|
3,524 |
|
5,613 |
|
|
|
|
|
|
| Other comprehensive income (loss), net of income taxes |
|
|
|
|
| Postretirement benefits liability adjustment (excluding amortization) |
— |
|
— |
|
21 |
|
24 |
|
|
|
|
|
|
| Amortization of postretirement benefits liability adjustment included in net benefit costs
|
9 |
|
21 |
|
29 |
|
63 |
|
| Total other comprehensive income (loss) |
9 |
|
21 |
|
50 |
|
87 |
|
|
|
|
|
|
| Comprehensive income (loss) |
1,610 |
|
2,052 |
|
3,574 |
|
5,700 |
|
|
|
|
|
|
| The information in the notes to consolidated financial statements is an integral part of these statements. |
|
|
|
|
|
|
|
|
|
|
|
|
|
|
|
Consolidated balance sheet (U.S. GAAP, unaudited) |
|
|
|
|
|
|
|
|
|
|
As at
Sep 30
|
As at
Dec 31
|
| millions of Canadian dollars |
2023 |
2022 |
| Assets |
|
|
| Current assets |
|
|
| Cash and cash equivalents |
2,716 |
|
3,749 |
|
Accounts receivable - net (a) |
5,390 |
|
4,719 |
|
| Inventories of crude oil and products |
1,744 |
|
1,514 |
|
| Materials, supplies and prepaid expenses |
910 |
|
754 |
|
| Total current assets |
10,760 |
|
10,736 |
|
Investments and long-term receivables (b) |
1,048 |
|
893 |
|
| Property, plant and equipment, |
55,780 |
|
54,568 |
|
| less accumulated depreciation and depletion |
(25,399) |
|
(24,062) |
|
Property, plant and equipment, net |
30,381 |
|
30,506 |
|
| Goodwill |
166 |
|
166 |
|
| Other assets, including intangibles - net |
1,231 |
|
1,223 |
|
| Total assets |
43,586 |
|
43,524 |
|
|
| Liabilities |
|
|
| Current liabilities |
|
|
| Notes and loans payable |
121 |
|
122 |
|
Accounts payable and accrued liabilities (a) (note 7) |
7,234 |
|
6,194 |
|
| Income taxes payable |
418 |
|
2,582 |
|
| Total current liabilities |
7,773 |
|
8,898 |
|
Long-term debt (c) (note 6) |
4,017 |
|
4,033 |
|
Other long-term obligations (note 7) |
3,462 |
|
3,467 |
|
| Deferred income tax liabilities |
4,526 |
|
4,713 |
|
| Total liabilities |
19,778 |
|
21,111 |
|
|
| Shareholders’ equity |
|
|
Common shares at stated value (d) (note 9) |
1,047 |
|
1,079 |
|
| Earnings reinvested |
23,223 |
|
21,846 |
|
Accumulated other comprehensive income (loss) (note 10) |
(462) |
|
(512) |
|
| Total shareholders’ equity |
23,808 |
|
22,413 |
|
| |
|
|
| Total liabilities and shareholders’ equity |
43,586 |
|
43,524 |
|
(a) Accounts receivable - net included net amounts receivable from related parties of $1,139 million (2022 - $1,108 million). |
(b) Investments and long-term receivables included amounts from related parties of $285 million (2022 - $288 million). |
(c) Long-term debt included amounts to related parties of $3,447 million (2022 - $3,447 million). |
(d) Number of common shares authorized and outstanding were 1,100 million and 567 million, respectively (2022 - 1,100 million and 584 million, respectively). |
|
|
|
| The information in the notes to consolidated financial statements is an integral part of these statements. |
|
|
|
|
|
|
|
|
|
|
|
|
|
|
|
Consolidated statement of shareholders’ equity (U.S. GAAP, unaudited) |
|
|
|
|
|
|
|
|
|
|
|
|
|
|
|
| |
Third Quarter |
Nine Months
to September 30
|
| millions of Canadian dollars |
2023 |
|
2022 |
|
2023 |
|
2022 |
|
Common shares at stated value (note 9) |
|
|
|
|
| At beginning of period |
1,079 |
|
1,177 |
|
1,079 |
|
1,252 |
|
| Share purchases at stated value |
(32) |
|
(48) |
|
(32) |
|
(123) |
|
| At end of period |
1,047 |
|
1,129 |
|
1,047 |
|
1,129 |
|
|
|
|
|
|
| Earnings reinvested |
|
|
|
|
| At beginning of period |
23,220 |
|
21,913 |
|
21,846 |
|
21,660 |
|
| Net income (loss) for the period |
1,601 |
|
2,031 |
|
3,524 |
|
5,613 |
|
| Share purchases in excess of stated value |
(1,310) |
|
(1,464) |
|
(1,310) |
|
(4,338) |
|
| Dividends declared |
(288) |
|
(211) |
|
(837) |
|
(666) |
|
| At end of period |
23,223 |
|
22,269 |
|
23,223 |
|
22,269 |
|
| |
|
|
|
|
Accumulated other comprehensive income (loss) (note 10) |
|
|
|
|
| At beginning of period |
(471) |
|
(1,111) |
|
(512) |
|
(1,177) |
|
| Other comprehensive income (loss) |
9 |
|
21 |
|
50 |
|
87 |
|
| At end of period |
(462) |
|
(1,090) |
|
(462) |
|
(1,090) |
|
|
|
|
|
|
| Shareholders’ equity at end of period |
23,808 |
|
22,308 |
|
23,808 |
|
22,308 |
|
|
|
|
|
|
The information in the notes to consolidated financial statements is an integral part of these statements. |
|
|
|
|
|
|
|
|
|
|
|
|
|
|
|
Consolidated statement of cash flows (U.S. GAAP, unaudited) |
|
|
|
|
|
|
|
|
|
|
|
|
|
|
|
|
Third Quarter |
Nine Months
to September 30
|
| millions of Canadian dollars |
2023 |
|
2022 |
|
2023 |
|
2022 |
|
| Operating activities |
|
|
|
|
| Net income (loss) |
1,601 |
|
2,031 |
|
3,524 |
|
5,613 |
|
| Adjustments for non-cash items: |
|
|
|
|
| Depreciation and depletion |
475 |
|
555 |
|
1,418 |
|
1,432 |
|
(Gain) loss on asset sales (note 3) |
3 |
|
(131) |
|
(19) |
|
(155) |
|
| Deferred income taxes and other |
(168) |
|
122 |
|
(239) |
|
(358) |
|
| Changes in operating assets and liabilities: |
|
|
|
|
| Accounts receivable |
(805) |
|
1,648 |
|
(671) |
|
(1,322) |
|
| Inventories, materials, supplies and prepaid expenses |
(330) |
|
(70) |
|
(389) |
|
(461) |
|
| Income taxes payable |
234 |
|
296 |
|
(2,164) |
|
1,608 |
|
| Accounts payable and accrued liabilities |
1,314 |
|
(1,328) |
|
1,011 |
|
1,315 |
|
All other items - net (b) |
35 |
|
(34) |
|
(48) |
|
13 |
|
| Cash flows from (used in) operating activities |
2,359 |
|
3,089 |
|
2,423 |
|
7,685 |
|
| |
|
|
|
|
| Investing activities |
|
|
|
|
| Additions to property, plant and equipment |
(387) |
|
(397) |
|
(1,315) |
|
(1,034) |
|
Proceeds from asset sales (note 3) |
6 |
|
760 |
|
29 |
|
886 |
|
| Additional investments |
— |
|
(6) |
|
— |
|
(6) |
|
| Loans to equity companies - net |
1 |
|
7 |
|
3 |
|
9 |
|
| Cash flows from (used in) investing activities |
(380) |
|
364 |
|
(1,283) |
|
(145) |
|
|
|
|
|
|
| Financing activities |
|
|
|
|
|
|
|
|
|
Long-term debt - reduction (note 6) |
— |
|
(1,000) |
|
— |
|
(1,000) |
|
Finance lease obligations - reduction (note 6) |
(5) |
|
(5) |
|
(16) |
|
(16) |
|
| Dividends paid |
(292) |
|
(227) |
|
(815) |
|
(640) |
|
Common shares purchased (note 9) |
(1,342) |
|
(1,512) |
|
(1,342) |
|
(4,461) |
|
| Cash flows from (used in) financing activities |
(1,639) |
|
(2,744) |
|
(2,173) |
|
(6,117) |
|
| |
|
|
|
|
| Increase (decrease) in cash and cash equivalents |
340 |
|
709 |
|
(1,033) |
|
1,423 |
|
| Cash and cash equivalents at beginning of period |
2,376 |
|
2,867 |
|
3,749 |
|
2,153 |
|
Cash and cash equivalents at end of period (a) |
2,716 |
|
3,576 |
|
2,716 |
|
3,576 |
|
| (a) Cash equivalents are all highly liquid securities with maturity of three months or less. |
| (b) Included contributions to registered pension plans. |
(43) |
|
(41) |
|
(129) |
|
(137) |
|
| |
|
|
|
|
| Income taxes (paid) refunded. |
(438) |
|
(64) |
|
(3,627) |
|
(339) |
|
| Interest (paid), net of capitalization. |
(15) |
|
(19) |
|
(52) |
|
(41) |
|
|
|
|
|
|
| The information in the notes to consolidated financial statements is an integral part of these statements. |
Notes to consolidated financial statements (unaudited)
1. Basis of financial statement preparation
These unaudited consolidated financial statements have been prepared in accordance with United States Generally Accepted Accounting Principles (GAAP) and follow the same accounting policies and methods of computation as, and should be read in conjunction with, the most recent annual consolidated financial statements filed with the U.S. Securities and Exchange Commission (SEC) in the company’s 2022 annual report on Form 10-K. In the opinion of the company, the information furnished herein reflects all known accruals and adjustments necessary for a fair statement of the results for the periods reported herein. All such adjustments are of a normal recurring nature.
The company’s exploration and production activities are accounted for under the “successful efforts” method.
The results for the nine months ended September 30, 2023, are not necessarily indicative of the operations to be expected for the full year.
All amounts are in Canadian dollars unless otherwise indicated.
2. Business segments
|
|
|
|
|
|
|
|
|
|
|
|
|
|
|
|
|
|
|
|
|
|
Third Quarter |
Upstream |
Downstream |
Chemical |
|
| millions of Canadian dollars |
2023 |
2022 |
2023 |
2022 |
2023 |
2022 |
|
| Revenues and other income |
|
|
|
|
|
|
|
Revenues (a) (b) |
43 |
|
156 |
|
13,540 |
|
14,537 |
|
290 |
|
378 |
|
|
Intersegment sales |
4,768 |
|
4,665 |
|
1,560 |
|
1,693 |
|
92 |
|
142 |
|
|
Investment and other income (note 3) |
(4) |
|
128 |
|
12 |
|
6 |
|
— |
|
— |
|
|
| |
4,807 |
|
4,949 |
|
15,112 |
|
16,236 |
|
382 |
|
520 |
|
|
| Expenses |
|
|
|
|
|
|
|
| Exploration |
1 |
|
1 |
|
— |
|
— |
|
— |
|
— |
|
|
Purchases of crude oil and products |
1,852 |
|
1,937 |
|
13,061 |
|
13,686 |
|
254 |
|
354 |
|
|
| Production and manufacturing |
1,187 |
|
1,381 |
|
405 |
|
419 |
|
74 |
|
72 |
|
|
| Selling and general |
— |
|
— |
|
177 |
|
174 |
|
21 |
|
17 |
|
|
| Federal excise tax and fuel charge |
— |
|
— |
|
653 |
|
583 |
|
1 |
|
1 |
|
|
| Depreciation and depletion |
418 |
|
501 |
|
46 |
|
44 |
|
2 |
|
4 |
|
|
| Non-service pension and postretirement benefit |
— |
|
— |
|
— |
|
— |
|
— |
|
— |
|
|
Financing (note 5) |
3 |
|
— |
|
— |
|
— |
|
— |
|
— |
|
|
| Total expenses |
3,461 |
|
3,820 |
|
14,342 |
|
14,906 |
|
352 |
|
448 |
|
|
| Income (loss) before income taxes |
1,346 |
|
1,129 |
|
770 |
|
1,330 |
|
30 |
|
72 |
|
|
| Income tax expense (benefit) |
318 |
|
143 |
|
184 |
|
318 |
|
7 |
|
18 |
|
|
Net income (loss) |
1,028 |
|
986 |
|
586 |
|
1,012 |
|
23 |
|
54 |
|
|
Cash flows from (used in) operating activities |
1,771 |
|
1,280 |
|
378 |
|
1,532 |
|
74 |
|
109 |
|
|
Capital and exploration expenditures (c) |
244 |
|
309 |
|
103 |
|
64 |
|
2 |
|
2 |
|
|
|
|
|
|
|
|
|
|
|
|
|
|
|
|
|
|
|
|
|
|
|
|
|
|
Third Quarter |
Corporate and other |
Eliminations |
|
|
|
Consolidated |
| millions of Canadian dollars |
2023 |
2022 |
2023 |
2022 |
|
|
|
2023 |
2022 |
| Revenues and other income |
|
|
|
|
|
|
|
|
|
Revenues (a) (b) |
— |
|
— |
|
— |
|
— |
|
|
|
|
13,873 |
|
15,071 |
|
Intersegment sales |
— |
|
— |
|
(6,420) |
|
(6,500) |
|
|
|
|
— |
|
— |
|
Investment and other income (note 3) |
39 |
|
19 |
|
— |
|
— |
|
|
|
|
47 |
|
153 |
|
| |
39 |
|
19 |
|
(6,420) |
|
(6,500) |
|
|
|
|
13,920 |
|
15,224 |
|
| Expenses |
|
|
|
|
|
|
|
|
|
| Exploration |
— |
|
— |
|
— |
|
— |
|
|
|
|
1 |
|
1 |
|
Purchases of crude oil and products |
— |
|
— |
|
(6,419) |
|
(6,499) |
|
|
|
|
8,748 |
|
9,478 |
|
| Production and manufacturing |
— |
|
— |
|
— |
|
— |
|
|
|
|
1,666 |
|
1,872 |
|
| Selling and general |
40 |
|
19 |
|
(1) |
|
(1) |
|
|
|
|
237 |
|
209 |
|
| Federal excise tax and fuel charge |
— |
|
— |
|
— |
|
— |
|
|
|
|
654 |
|
584 |
|
| Depreciation and depletion |
9 |
|
6 |
|
— |
|
— |
|
|
|
|
475 |
|
555 |
|
| Non-service pension and postretirement benefit |
20 |
|
4 |
|
— |
|
— |
|
|
|
|
20 |
|
4 |
|
Financing (note 5) |
16 |
|
16 |
|
— |
|
— |
|
|
|
|
19 |
|
16 |
|
| Total expenses |
85 |
|
45 |
|
(6,420) |
|
(6,500) |
|
|
|
|
11,820 |
|
12,719 |
|
| Income (loss) before income taxes |
(46) |
|
(26) |
|
— |
|
— |
|
|
|
|
2,100 |
|
2,505 |
|
| Income tax expense (benefit) |
(10) |
|
(5) |
|
— |
|
— |
|
|
|
|
499 |
|
474 |
|
Net income (loss) |
(36) |
|
(21) |
|
— |
|
— |
|
|
|
|
1,601 |
|
2,031 |
|
Cash flows from (used in) operating activities |
136 |
|
168 |
|
— |
|
— |
|
|
|
|
2,359 |
|
3,089 |
|
Capital and exploration expenditures (c) |
38 |
|
17 |
|
— |
|
— |
|
|
|
|
387 |
|
392 |
|
(a)Includes export sales to the United States of $2,180 million (2022 - $3,176 million).
(b)Revenues include both revenue within the scope of ASC 606 and outside the scope of ASC 606. Trade receivables in "Accounts receivable – net" reported on the Consolidated balance sheet include both receivables within the scope of ASC 606 and those outside the scope of ASC 606. Revenue and receivables outside the scope of ASC 606 primarily relate to physically settled commodity contracts accounted for as derivatives. Contractual terms, credit quality, and type of customer are generally similar between those revenues and receivables within the scope of ASC 606 and those outside it.
|
|
|
|
|
|
|
|
|
| Revenues |
Third Quarter |
| millions of Canadian dollars |
2023 |
|
2022 |
|
| Revenue from contracts with customers |
12,271 |
|
13,223 |
|
Revenue outside the scope of ASC 606 |
1,602 |
|
1,848 |
|
| Total |
13,873 |
|
15,071 |
|
(c)Capital and exploration expenditures (CAPEX) include exploration expenses, additions to property, plant and equipment, additions to finance leases, additional investments and acquisitions and the company’s share of similar costs for equity companies. CAPEX excludes the purchase of carbon emission credits.
|
|
|
|
|
|
|
|
|
|
|
|
|
|
|
|
|
|
|
|
|
|
Nine Months to September 30 |
Upstream |
Downstream |
Chemical |
|
| millions of Canadian dollars |
2023 |
2022 |
2023 |
2022 |
2023 |
2022 |
|
| Revenues and other income |
|
|
|
|
|
|
|
Revenues (a) (b) |
180 |
|
374 |
|
36,534 |
|
43,480 |
|
980 |
|
1,159 |
|
|
Intersegment sales |
11,909 |
|
14,923 |
|
4,748 |
|
5,550 |
|
272 |
|
395 |
|
|
Investment and other income (note 3) |
8 |
|
135 |
|
47 |
|
36 |
|
— |
|
— |
|
|
|
12,097 |
|
15,432 |
|
41,329 |
|
49,066 |
|
1,252 |
|
1,554 |
|
|
| Expenses |
|
|
|
|
|
|
|
| Exploration |
3 |
|
4 |
|
— |
|
— |
|
— |
|
— |
|
|
Purchases of crude oil and products |
4,827 |
|
6,184 |
|
35,390 |
|
42,459 |
|
791 |
|
1,070 |
|
|
| Production and manufacturing |
3,730 |
|
4,053 |
|
1,291 |
|
1,193 |
|
186 |
|
193 |
|
|
| Selling and general |
— |
|
— |
|
494 |
|
474 |
|
69 |
|
62 |
|
|
| Federal excise tax and fuel charge |
— |
|
— |
|
1,778 |
|
1,615 |
|
3 |
|
1 |
|
|
| Depreciation and depletion |
1,250 |
|
1,269 |
|
135 |
|
130 |
|
10 |
|
13 |
|
|
| Non-service pension and postretirement benefit |
— |
|
— |
|
— |
|
— |
|
— |
|
— |
|
|
Financing (note 5) |
3 |
|
1 |
|
— |
|
— |
|
— |
|
— |
|
|
| Total expenses |
9,813 |
|
11,511 |
|
39,088 |
|
45,871 |
|
1,059 |
|
1,339 |
|
|
| Income (loss) before income taxes |
2,284 |
|
3,921 |
|
2,241 |
|
3,195 |
|
193 |
|
215 |
|
|
| Income tax expense (benefit) |
542 |
|
807 |
|
535 |
|
761 |
|
46 |
|
52 |
|
|
Net income (loss) |
1,742 |
|
3,114 |
|
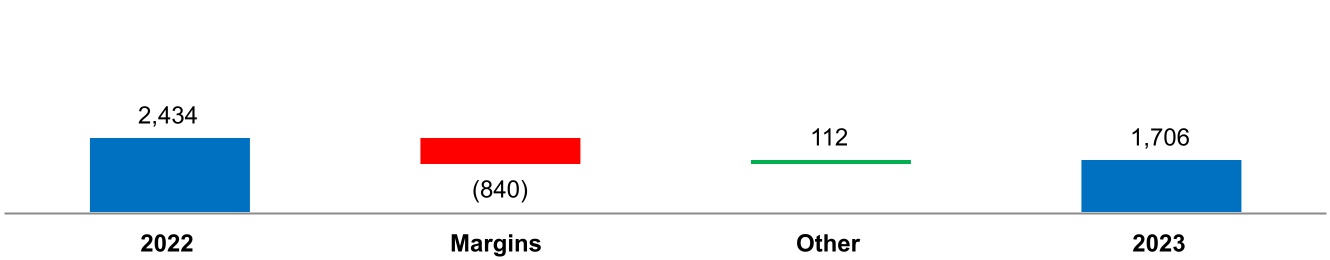
1,706 |
|
2,434 |
|
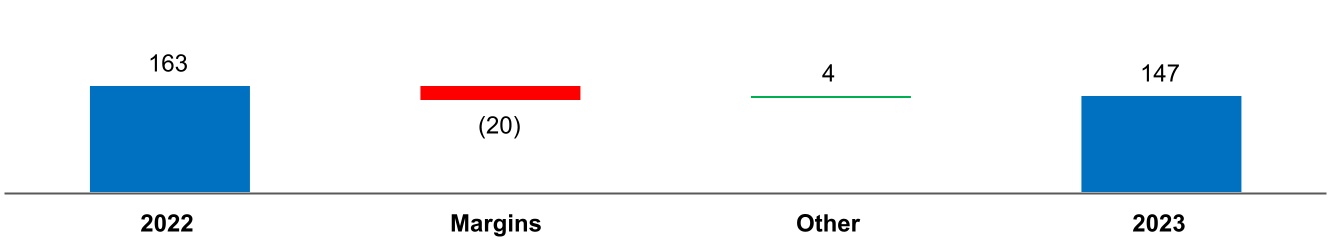
147 |
|
163 |
|
|
Cash flows from (used in) operating activities |
1,946 |
|
4,814 |
|
187 |
|
2,548 |
|
97 |
|
240 |
|
|
Capital and exploration expenditures (c) |
868 |
|
764 |
|
329 |
|
201 |
|
11 |
|
5 |
|
|
Total assets as at September 30 |
28,356 |
|
28,099 |
|
10,912 |
|
9,972 |
|
441 |
|
482 |
|
|
|
|
|
|
|
|
|
|
|
|
|
|
|
|
|
|
|
|
|
|
|
|
|
|
Nine Months to September 30 |
Corporate and other |
Eliminations |
|
|
|
Consolidated |
| millions of Canadian dollars |
2023 |
2022 |
2023 |
2022 |
|
|
|
2023 |
2022 |
| Revenues and other income |
|
|
|
|
|
|
|
|
|
Revenues (a) (b) |
— |
|
— |
|
— |
|
— |
|
|
|
|
37,694 |
|
45,013 |
|
Intersegment sales |
— |
|
— |
|
(16,929) |
|
(20,868) |
|
|
|
|
— |
|
— |
|
Investment and other income (note 3) |
111 |
|
33 |
|
— |
|
— |
|
|
|
|
166 |
|
204 |
|
|
111 |
|
33 |
|
(16,929) |
|
(20,868) |
|
|
|
|
37,860 |
|
45,217 |
|
| Expenses |
|
|
|
|
|
|
|
|
|
| Exploration |
— |
|
— |
|
— |
|
— |
|
|
|
|
3 |
|
4 |
|
Purchases of crude oil and products |
— |
|
— |
|
(16,926) |
|
(20,864) |
|
|
|
|
24,082 |
|
28,849 |
|
| Production and manufacturing |
— |
|
— |
|
— |
|
— |
|
|
|
|
5,207 |
|
5,439 |
|
| Selling and general |
69 |
|
93 |
|
(3) |
|
(4) |
|
|
|
|
629 |
|
625 |
|
| Federal excise tax and fuel charge |
— |
|
— |
|
— |
|
— |
|
|
|
|
1,781 |
|
1,616 |
|
| Depreciation and depletion |
23 |
|
20 |
|
— |
|
— |
|
|
|
|
1,418 |
|
1,432 |
|
| Non-service pension and postretirement benefit |
60 |
|
13 |
|
— |
|
— |
|
|
|
|
60 |
|
13 |
|
Financing (note 5) |
48 |
|
33 |
|
— |
|
— |
|
|
|
|
51 |
|
34 |
|
| Total expenses |
200 |
|
159 |
|
(16,929) |
|
(20,868) |
|
|
|
|
33,231 |
|
38,012 |
|
| Income (loss) before income taxes |
(89) |
|
(126) |
|
— |
|
— |
|
|
|
|
4,629 |
|
7,205 |
|
| Income tax expense (benefit) |
(18) |
|
(28) |
|
— |
|
— |
|
|
|
|
1,105 |
|
1,592 |
|
Net income (loss) |
(71) |
|
(98) |
|
— |
|
— |
|
|
|
|
3,524 |
|
5,613 |
|
Cash flows from (used in) operating activities |
193 |
|
83 |
|
— |
|
— |
|
|
|
|
2,423 |
|
7,685 |
|
Capital and exploration expenditures (c) |
101 |
|
32 |
|
— |
|
— |
|
|
|
|
1,309 |
|
1,002 |
|
Total assets as at September 30 |
4,346 |
|
4,704 |
|
(469) |
|
(271) |
|
|
|
|
43,586 |
|
42,986 |
|
(a)Includes export sales to the United States of $6,589 million (2022 - $9,551 million).
(b)Revenues include both revenue within the scope of ASC 606 and outside the scope of ASC 606. Trade receivables in "Accounts receivable – net" reported on the Consolidated balance sheet include both receivables within the scope of ASC 606 and those outside the scope of ASC 606. Revenue and receivables outside the scope of ASC 606 primarily relate to physically settled commodity contracts accounted for as derivatives. Contractual terms, credit quality, and type of customer are generally similar between those revenues and receivables within the scope of ASC 606 and those outside it.
|
|
|
|
|
|
|
|
|
| Revenues |
Nine Months
to September 30
|
| millions of Canadian dollars |
2023 |
|
2022 |
|
| Revenue from contracts with customers |
33,713 |
|
39,958 |
|
Revenue outside the scope of ASC 606 |
3,981 |
|
5,055 |
|
| Total |
37,694 |
|
45,013 |
|
(c)Capital and exploration expenditures (CAPEX) include exploration expenses, additions to property, plant and equipment, additions to finance leases, additional investments and acquisitions and the company’s share of similar costs for equity companies. CAPEX excludes the purchase of carbon emission credits.
3. Investment and other income
Investment and other income included gains and losses on asset sales as follows:
|
|
|
|
|
|
|
|
|
|
|
|
|
|
|
|
|
|
|
|
|
|
|
|
|
Third Quarter |
Nine Months
to September 30
|
|
|
|
| millions of Canadian dollars |
2023 |
|
2022 |
|
2023 |
|
2022 |
|
|
|
|
| Proceeds from asset sales |
6 |
|
854 |
|
29 |
|
886 |
|
|
|
|
| Book value of asset sales |
9 |
|
723 |
|
10 |
|
731 |
|
|
|
|
Gain (loss) on asset sales, before tax (a) |
(3) |
|
131 |
|
19 |
|
155 |
|
|
|
|
Gain (loss) on asset sales, after tax (a) |
(2) |
|
222 |
|
16 |
|
241 |
|
|
|
|
(a)The third quarter of 2022 included a gain of $116 million ($208 million, after tax) from the sale of interests in XTO Energy Canada, which included the removal of a deferred tax liability. |
|
|
|
4. Employee retirement benefits
The components of net benefit cost were as follows:
|
|
|
|
|
|
|
|
|
|
|
|
|
|
|
| |
Third Quarter |
Nine Months
to September 30
|
| millions of Canadian dollars |
2023 |
|
2022 |
|
2023 |
|
2022 |
|
| Pension benefits: |
|
|
|
|
| Service cost |
41 |
|
70 |
|
122 |
|
210 |
|
| Interest cost |
94 |
|
74 |
|
280 |
|
221 |
|
| Expected return on plan assets |
(94) |
|
(103) |
|
(280) |
|
(309) |
|
| Amortization of prior service cost |
5 |
|
4 |
|
13 |
|
12 |
|
| Amortization of actuarial loss (gain) |
10 |
|
21 |
|
32 |
|
64 |
|
| Net benefit cost |
56 |
|
66 |
|
167 |
|
198 |
|
|
|
|
|
|
| Other postretirement benefits: |
|
|
|
|
| Service cost |
3 |
|
6 |
|
9 |
|
17 |
|
| Interest cost |
7 |
|
6 |
|
21 |
|
18 |
|
| Amortization of actuarial loss (gain) |
(2) |
|
2 |
|
(6) |
|
7 |
|
| Net benefit cost |
8 |
|
14 |
|
24 |
|
42 |
|
5. Financing costs
|
|
|
|
|
|
|
|
|
|
|
|
|
|
|
|
Third Quarter |
Nine Months
to September 30
|
| millions of Canadian dollars |
2023 |
|
2022 |
|
2023 |
|
2022 |
|
Debt-related interest |
53 |
|
34 |
|
148 |
|
66 |
|
Capitalized interest |
(37) |
|
(18) |
|
(100) |
|
(33) |
|
Net interest expense |
16 |
|
16 |
|
48 |
|
33 |
|
Other interest |
3 |
|
— |
|
3 |
|
1 |
|
Total financing |
19 |
|
16 |
|
51 |
|
34 |
|
6. Long-term debt
|
|
|
|
|
|
|
|
|
|
As at
Sep 30
|
As at
Dec 31
|
| millions of Canadian dollars |
2023 |
|
2022 |
|
Long-term debt |
3,447 |
|
3,447 |
|
Finance leases |
570 |
|
586 |
|
| Total long-term debt |
4,017 |
|
4,033 |
|
|
7. Other long-term obligations
|
|
|
|
|
|
|
|
|
| |
As at
Sep 30
|
As at
Dec 31
|
| millions of Canadian dollars |
2023 |
|
2022 |
|
Employee retirement benefits (a) |
876 |
|
902 |
|
Asset retirement obligations and other environmental liabilities (b) |
2,189 |
|
2,150 |
|
Share-based incentive compensation liabilities |
130 |
|
101 |
|
Operating lease liability (c) |
122 |
|
151 |
|
Other obligations |
145 |
|
163 |
|
| Total other long-term obligations |
3,462 |
|
3,467 |
|
|
(a)Total recorded employee retirement benefits obligations also included $63 million in current liabilities (2022 - $63 million).
(b)Total asset retirement obligations and other environmental liabilities also included $116 million in current liabilities (2022 - $116 million).
(c)Total operating lease liability also included $107 million in current liabilities (2022 - $100 million). In addition to the total operating lease liability, undiscounted commitments for leases not yet commenced totalled $55 million (2022 - $14 million).
|
8. Financial and derivative instruments
Financial instruments
The fair value of the company’s financial instruments is determined by reference to various market data and other appropriate valuation techniques. There are no material differences between the fair value of the company’s financial instruments and the recorded carrying value. At September 30, 2023 and December 31, 2022, the fair value of long-term debt ($3,447 million, excluding finance lease obligations) was primarily a level 2 measurement.
Derivative instruments
The company’s size, strong capital structure and the complementary nature of its business segments reduce the company’s enterprise-wide risk from changes in commodity prices and currency exchange rates. In addition, the company uses commodity-based contracts, including derivatives, to manage commodity price risk and to generate returns from trading. Commodity contracts held for trading purposes are presented in the Consolidated statement of income on a net basis in the line “Revenues” and in the Consolidated statement of cash flows in "Cash flow from (used in) operating activities". The company does not designate derivative instruments as a hedge for hedge accounting purposes.
Credit risk associated with the company’s derivative position is mitigated by several factors, including the use of derivative clearing exchanges and the quality of and financial limits placed on derivative counterparties. The company maintains a system of controls that includes the authorization, reporting and monitoring of derivative activity.
The net notional long/(short) position of derivative instruments was:
|
|
|
|
|
|
|
|
|
| |
As at
Sep 30
|
As at Dec 31 |
| thousands of barrels |
2023 |
2022 |
| Crude |
3,280 |
|
1,800 |
|
| Products |
(850) |
|
(350) |
|
Realized and unrealized gain/(loss) on derivative instruments recognized in the Consolidated statement of income is included in the following lines on a before-tax basis:
|
|
|
|
|
|
|
|
|
|
|
|
|
|
|
| |
Third Quarter |
Nine Months
to September 30
|
| millions of Canadian dollars |
2023 |
|
2022 |
|
2023 |
|
2022 |
|
| Revenues |
6 |
|
105 |
|
(7) |
|
91 |
|
|
|
|
|
|
|
|
|
|
|
The estimated fair value of derivative instruments, and the related hierarchy level for the fair value measurement were as follows:
|
|
|
|
|
|
|
|
|
|
|
|
|
|
|
|
|
|
|
|
|
|
|
|
At September 30, 2023 |
| millions of Canadian dollars |
|
Fair value |
Effect of
counterparty
netting |
Effect of
collateral
netting |
Net
carrying
value |
|
Level 1 |
Level 2 |
Level 3 |
Total |
| Assets |
|
|
|
|
|
|
|
Derivative assets (a) |
24 |
|
33 |
|
— |
|
57 |
|
(23) |
|
(1) |
|
33 |
|
|
|
|
|
|
|
|
|
| Liabilities |
|
|
|
|
|
|
|
Derivative liabilities (b) |
24 |
|
39 |
|
— |
|
63 |
|
(23) |
|
— |
|
40 |
|
|
(a)Included in the Consolidated balance sheet line: “Materials, supplies and prepaid expenses”, “Accounts receivable - net” and “Other assets, including intangibles - net”.
(b)Included in the Consolidated balance sheet line: “Accounts payable and accrued liabilities” and “Other long-term obligations”.
|
|
|
|
|
|
|
|
|
|
|
|
|
|
|
|
|
|
|
|
|
|
|
|
|
At December 31, 2022 |
| millions of Canadian dollars |
|
Fair value |
Effect of
counterparty
netting |
Effect of
collateral
netting |
Net
carrying
value |
|
Level 1 |
Level 2 |
Level 3 |
Total |
| Assets |
|
|
|
|
|
|
|
Derivative assets (a) |
17 |
|
32 |
|
— |
|
49 |
|
(27) |
|
— |
|
22 |
|
|
|
|
|
|
|
|
|
| Liabilities |
|
|
|
|
|
|
|
Derivative liabilities (b) |
21 |
|
20 |
|
— |
|
41 |
|
(27) |
|
(4) |
|
10 |
|
|
(a)Included in the Consolidated balance sheet line: “Materials, supplies and prepaid expenses”, “Accounts receivable - net” and “Other assets, including intangibles - net”.
(b)Included in the Consolidated balance sheet line: “Accounts payable and accrued liabilities” and “Other long-term obligations”.
|
At September 30, 2023 and December 31, 2022, the company had $21 million and $14 million, respectively, of collateral under a master netting arrangement not offset against the derivatives on the Consolidated balance sheet in “Accounts receivable - net”, primarily related to initial margin requirements.
9. Common shares
|
|
|
|
|
|
|
|
|
thousands of shares |
As at
Sep 30
2023
|
As at
Dec 31
2022
|
| Authorized |
1,100,000 |
|
1,100,000 |
|
| Outstanding |
566,667 |
|
584,153 |
|
The most recent 12-month normal course issuer bid program came into effect June 29, 2023 under which Imperial continued its existing share purchase program. The program enabled the company to purchase up to a maximum of 29,207,635 common shares (5 percent of the total shares on June 15, 2023) which included shares purchased under the normal course issuer bid and from Exxon Mobil Corporation concurrent with, but outside of, the normal course issuer bid. As in the past, Exxon Mobil Corporation advised the company that it intended to participate to maintain its ownership percentage at approximately 69.6 percent. Imperial accelerated its share purchases under the normal course issuer bid program during the third quarter and, subsequent to the end of the third quarter, the program completed on October 19, 2023 as a result of the company purchasing the maximum allowable number of shares under the program.
The excess of the purchase cost over the stated value of shares purchased has been recorded as a distribution of earnings reinvested.
On October 27, 2023, the company announced its intention to launch a substantial issuer bid pursuant to which the company will offer to purchase for cancellation up to $1.5 billion of its common shares. The substantial issuer bid will be made through a modified Dutch auction, with a tender price range to be determined by the company at the time of commencement of the offer. Shares may also be tendered by way of a proportionate tender, which will result in a shareholder maintaining their proportionate share ownership. ExxonMobil has advised Imperial that it intends to make a proportionate tender in connection with the offer in order to maintain its proportionate share ownership at approximately 69.6 percent following completion of the offer. Nothing in this report shall constitute an offer to purchase or a solicitation of an offer to sell any shares.
The company’s common share activities are summarized below:
|
|
|
|
|
|
|
|
|
| |
Thousands of
shares |
Millions of
dollars |
Balance as at December 31, 2021 |
678,080 |
|
1,252 |
|
| Issued under employee share-based awards |
— |
|
— |
|
| Purchases at stated value |
(93,927) |
|
(173) |
|
Balance as at December 31, 2022 |
584,153 |
|
1,079 |
|
| Issued under employee share-based awards |
— |
|
— |
|
| Purchases at stated value |
(17,486) |
|
(32) |
|
Balance as at September 30, 2023 |
566,667 |
|
1,047 |
|
The following table provides the calculation of basic and diluted earnings per common share and the dividends declared by the company on its outstanding common shares:
|
|
|
|
|
|
|
|
|
|
|
|
|
|
|
| |
Third Quarter |
Nine Months
to September 30
|
|
2023 |
2022 |
2023 |
2022 |
| Net income (loss) per common share – basic |
|
|
|
|
Net income (loss) (millions of Canadian dollars) |
1,601 |
2,031 |
3,524 |
5,613 |
Weighted-average number of common shares outstanding (millions of shares) |
578.0 |
625.3 |
582.1 |
652.9 |
Net income (loss) per common share (dollars) |
2.77 |
3.25 |
6.05 |
8.60 |
| Net income (loss) per common share – diluted |
|
|
|
|
Net income (loss) (millions of Canadian dollars) |
1,601 |
2,031 |
3,524 |
5,613 |
Weighted-average number of common shares outstanding (millions of shares) |
578.0 |
625.3 |
582.1 |
652.9 |
Effect of employee share-based awards (millions of shares) |
1.3 |
1.6 |
1.2 |
1.5 |
|
Weighted-average number of common shares outstanding,
assuming dilution (millions of shares)
|
579.3 |
626.9 |
583.3 |
654.4 |
Net income (loss) per common share (dollars) |
2.76 |
3.24 |
6.04 |
8.58 |
Dividends per common share – declared (dollars) |
0.50 |
0.34 |
1.44 |
1.02 |
10. Other comprehensive income (loss) information
Changes in accumulated other comprehensive income (loss):
|
|
|
|
|
|
|
|
|
| millions of Canadian dollars |
2023 |
|
2022 |
|
| Balance at January 1 |
(512) |
|
(1,177) |
|
| Postretirement benefits liability adjustment: |
|
|
| Current period change excluding amounts reclassified from accumulated other comprehensive income
|
21 |
|
24 |
|
| Amounts reclassified from accumulated other comprehensive income |
29 |
|
63 |
|
| Balance at September 30 |
(462) |
|
(1,090) |
|
|
|
|
|
|
|
|
|
|
|
|
|
|
|
|
| Amounts reclassified out of accumulated other comprehensive income (loss) - before-tax income (expense): |
|
|
|
|
|
|
|
|
|
|
|
|
|
|
|
| |
Third Quarter |
Nine Months
to September 30
|
| millions of Canadian dollars |
2023 |
|
2022 |
|
2023 |
|
2022 |
|
|
Amortization of postretirement benefits liability adjustment
included in net benefit cost (a)
|
(13) |
|
(28) |
|
(39) |
|
(83) |
|
(a) This accumulated other comprehensive income component is included in the computation of net benefit cost (note 4). |
|
|
|
|
|
|
|
|
|
|
|
|
|
|
|
| Income tax expense (credit) for components of other comprehensive income (loss): |
|
|
|
|
|
|
|
|
|
|
|
|
|
|
|
|
Third Quarter |
Nine Months
to September 30
|
| millions of Canadian dollars |
2023 |
|
2022 |
|
2023 |
|
2022 |
|
| Postretirement benefits liability adjustments: |
|
|
|
|
| Postretirement benefits liability adjustment (excluding amortization) |
— |
|
— |
|
7 |
|
8 |
|
| Amortization of postretirement benefits liability adjustment included in net benefit cost
|
4 |
|
7 |
|
10 |
|
20 |
|
| Total |
4 |
|
7 |
|
17 |
|
28 |
|
Item 2. Management’s discussion and analysis of financial condition and results of operations
Non-GAAP financial measures and other specified financial measures
Certain measures included in this document are not prescribed by U.S. Generally Accepted Accounting Principles (GAAP). These measures constitute “non-GAAP financial measures” under Securities and Exchange Commission Regulation G and Item 10(e) of Regulation S-K, and “specified financial measures” under National Instrument 52-112 Non-GAAP and Other Financial Measures Disclosure of the Canadian Securities Administrators.
Reconciliation of these non-GAAP financial measures to the most comparable GAAP measure, and other information required by these regulations, have been provided. Non-GAAP financial measures and specified financial measures are not standardized financial measures under GAAP and do not have a standardized definition. As such, these measures may not be directly comparable to measures presented by other companies, and should not be considered a substitute for GAAP financial measures.
Net income (loss) excluding identified items
Net income (loss) excluding identified items is a non-GAAP financial measure that is total net income (loss) excluding individually significant non-operational events with an absolute corporate total earnings impact of at least $100 million in a given quarter. The net income (loss) impact of an identified item for an individual segment in a given quarter may be less than $100 million when the item impacts several segments or several periods. The most directly comparable financial measure that is disclosed in the financial statements is "Net income (loss)" within the company’s Consolidated statement of income. Management uses these figures to improve comparability of the underlying business across multiple periods by isolating and removing significant non-operational events from business results. The company believes this view provides investors increased transparency into business results and trends, and provides investors with a view of the business as seen through the eyes of management. Net income (loss) excluding identified items is not meant to be viewed in isolation or as a substitute for net income (loss) as prepared in accordance with U.S. GAAP. All identified items are presented on an after-tax basis.
Reconciliation of net income (loss) excluding identified items
|
|
|
|
|
|
|
|
|
|
|
|
|
|
|
|
Third Quarter |
Nine Months |
| millions of Canadian dollars |
2023 |
|
2022 |
|
2023 |
|
2022 |
|
| From Imperial's Consolidated statement of income |
|
|
|
|
| Net income (loss) (U.S. GAAP) |
1,601 |
|
2,031 |
|
3,524 |
|
5,613 |
|
|
|
|
|
|
| Less identified items included in Net income (loss) |
|
|
|
|
| Gain/(loss) on sale of assets |
— |
|
208 |
|
— |
|
208 |
|
| Subtotal of identified items |
— |
|
208 |
|
— |
|
208 |
|
|
|
|
|
|
| Net income (loss) excluding identified items |
1,601 |
|
1,823 |
|
3,524 |
|
5,405 |
|
Recent business environment
During the first quarter of 2023, the price of crude oil declined, impacted by higher inventory levels, and the price of crude oil remained relatively flat during the second quarter. In the third quarter, crude oil prices increased as demand exceeded supply after OPEC+ oil producers further reduced oil output. In addition, the Canadian WTI/WCS spread continued to recover in the third quarter, but remains weaker than 2022 on an annual basis. Similarly, 2023 refining margins remain strong but fall short of 2022 levels on an annual basis.
Operating results
Third quarter 2023 vs. third quarter 2022
|
|
|
|
|
|
|
|
|
| |
Third Quarter |
| millions of Canadian dollars, unless noted |
2023 |
2022 |
Net income (loss) (U.S. GAAP) |
1,601 |
2,031 |
Net income (loss) per common share, assuming dilution (dollars) |
2.76 |
3.24 |
| Net income (loss) excluding identified items¹ |
1,601 |
1,823 |
Prior year third quarter results included favourable identified items1 of $208 million related to the company's gain on the sale of interests in XTO Energy Canada.
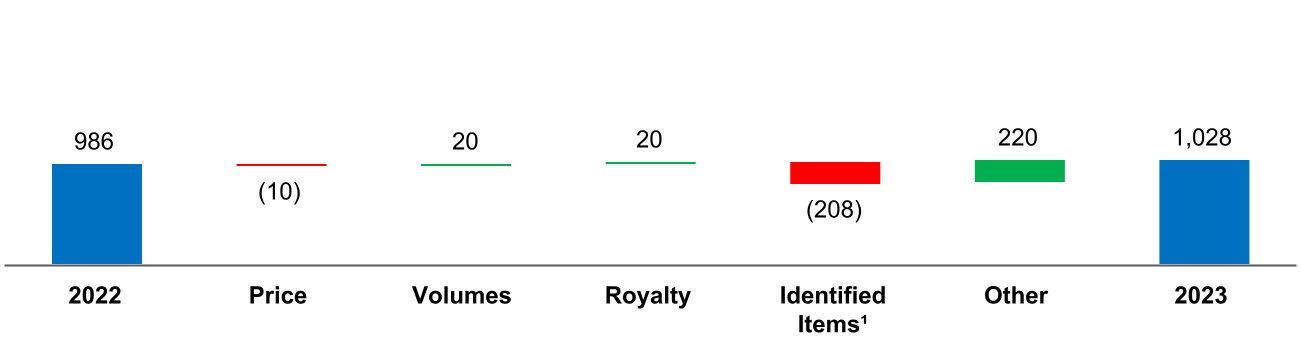
Upstream
Net income (loss) factor analysis
millions of Canadian dollars
Price – Synthetic crude oil realizations decreased by $11.82 per barrel, generally in line with WTI. Average bitumen realizations increased by $4.47 per barrel. Higher bitumen realizations were primarily driven by the narrowing of the WTI/WCS spread, partially offset by lower marker prices.
Volumes – Higher volumes were primarily driven by increased plant capacity utilization and mine equipment productivity at Kearl, and annual turnaround timing and duration at Syncrude, partially offset by steam cycle timing and planned turnaround activity at Cold Lake.
Identified Items1 – Prior year third quarter results included favourable identified items1 related to the company's gain on the sale of interests in XTO Energy Canada.
Other – Includes lower operating expenses of about $160 million, and favourable foreign exchange impacts of about $80 million.
|
|
|
|
|
|
|
|
1 non-GAAP financial measure - see non-GAAP financial measures and other specified financial measures for definition and reconciliation |
Marker prices and average realizations
|
|
|
|
|
|
|
|
|
| |
Third Quarter |
| Canadian dollars, unless noted |
2023 |
|
2022 |
|
West Texas Intermediate (US$ per barrel) |
82.32 |
|
91.43 |
|
Western Canada Select (US$ per barrel) |
69.39 |
|
71.53 |
|
WTI/WCS Spread (US$ per barrel) |
12.93 |
|
19.90 |
|
Bitumen (per barrel) |
86.05 |
|
81.58 |
|
Synthetic crude oil (per barrel) |
112.98 |
|
124.80 |
|
Average foreign exchange rate (US$) |
0.75 |
|
0.77 |
|
Production
|
|
|
|
|
|
|
|
|
| |
Third Quarter |
| thousands of barrels per day |
2023 |
|
2022 |
|
Kearl (Imperial's share) |
209 |
|
193 |
|
Cold Lake |
128 |
|
150 |
|
Syncrude (a) |
75 |
|
62 |
|
|
|
|
Kearl total gross production (thousands of barrels per day) |
295 |
|
271 |
|
(a)In the third quarter of 2023, Syncrude gross production included about 0 thousand barrels per day of bitumen and other products (2022 - 7 thousand barrels per day) that were exported to the operator's facilities using an existing interconnect pipeline.
Higher production at Kearl was primarily driven by increased plant capacity utilization and mine equipment productivity.
Lower production at Cold Lake was primarily driven by steam cycle timing and planned turnaround activity.
Higher production at Syncrude was primarily driven by annual turnaround timing and duration.
Downstream
Net income (loss) factor analysis
millions of Canadian dollars
Margins – Lower margins primarily reflect weaker market conditions.
Other – Includes favourable foreign exchange impacts of about $50 million, partially offset by higher turnaround impacts of about $50 million reflecting the planned turnaround activities at Sarnia refinery.
Refinery utilization and petroleum product sales
|
|
|
|
|
|
|
|
|
| |
Third Quarter |
| thousands of barrels per day, unless noted |
2023 |
|
2022 |
|
| Refinery throughput |
416 |
|
426 |
|
Refinery capacity utilization (percent) |
96 |
|
100 |
|
| Petroleum product sales |
478 |
|
484 |
|
Lower refinery throughput in the third quarter of 2023 reflects the impact of planned turnaround activities at Sarnia refinery.
Chemicals
Net income (loss) factor analysis
millions of Canadian dollars
Corporate and other
|
|
|
|
|
|
|
|
|
| |
Third Quarter |
| millions of Canadian dollars |
2023 |
|
2022 |
|
Net income (loss) (U.S. GAAP) |
(36) |
|
(21) |
|
Liquidity and capital resources
|
|
|
|
|
|
|
|
|
| |
Third Quarter |
| millions of Canadian dollars |
2023 |
|
2022 |
|
| Cash flows from (used in): |
|
|
| Operating activities |
2,359 |
|
3,089 |
|
| Investing activities |
(380) |
|
364 |
|
| Financing activities |
(1,639) |
|
(2,744) |
|
| Increase (decrease) in cash and cash equivalents |
340 |
|
709 |
|
|
|
|
| Cash and cash equivalents at period end |
2,716 |
|
3,576 |
|
Cash flows from operating activities primarily reflect lower Downstream margins.
Cash flows used in investing activities primarily reflect the absence of proceeds from the sale of interests in XTO Energy Canada.
Cash flows used in financing activities primarily reflect:
|
|
|
|
|
|
|
|
|
| |
Third Quarter |
| millions of Canadian dollars, unless noted |
2023 |
|
2022 |
|
Dividends paid |
292 |
|
227 |
|
Per share dividend paid (dollars) |
0.50 |
|
0.34 |
|
Share repurchases (a) |
1,342 |
|
1,512 |
|
Number of shares purchased (millions) (a) |
17.5 |
|
25.2 |
|
(a)Share repurchases were made under the company's normal course issuer bid program, and include shares purchased from Exxon Mobil Corporation concurrent with, but outside of, the normal course issuer bid.
Nine months 2023 vs. nine months 2022
|
|
|
|
|
|
|
|
|
| |
Nine Months |
| millions of Canadian dollars, unless noted |
2023 |
2022 |
Net income (loss) (U.S. GAAP) |
3,524 |
5,613 |
Net income (loss) per common share, assuming dilution (dollars) |
6.04 |
8.58 |
| Net income (loss) excluding identified items¹ |
3,524 |
5,405 |
Prior year results included favourable identified items1 of $208 million related to the company's gain on the sale of interests in XTO Energy Canada.
Upstream
Net income (loss) factor analysis
millions of Canadian dollars
Price – Lower bitumen realizations were primarily driven by lower marker prices and the widening WTI/WCS spread. Average bitumen realizations decreased by $25.31 per barrel, generally in line with WCS, and synthetic crude oil realizations decreased by $23.87 per barrel, generally in line with WTI.
Volumes – Lower volumes were primarily driven by steam cycle timing at Cold Lake, and the absence of XTO Energy Canada production, partially offset by improved reliability and absence of extreme cold weather at Kearl.
Royalty – Lower royalties were primarily driven by weakened commodity prices.
Identified Items1 – Prior year results included favourable identified items1 related to the company's gain on the sale of interests in XTO Energy Canada.
Other – Includes favourable foreign exchange impacts of about $400 million, and lower operating expenses of about $220 million, primarily due to lower energy prices.
Marker prices and average realizations
|
|
|
|
|
|
|
|
|
| |
Nine Months |
| Canadian dollars, unless noted |
2023 |
|
2022 |
|
West Texas Intermediate (US$ per barrel) |
77.29 |
|
98.25 |
|
Western Canada Select (US$ per barrel) |
59.67 |
|
82.60 |
|
WTI/WCS Spread (US$ per barrel) |
17.62 |
|
15.65 |
|
Bitumen (per barrel) |
68.70 |
|
94.01 |
|
Synthetic crude oil (per barrel) |
105.65 |
|
129.52 |
|
Average foreign exchange rate (US$) |
0.74 |
|
0.78 |
|
|
|
|
|
|
|
|
|
1 non-GAAP financial measure - see non-GAAP financial measures and other specified financial measures for definition and reconciliation |
Production
|
|
|
|
|
|
|
|
|
| |
Nine Months |
| thousands of barrels per day |
2023 |
|
2022 |
|
Kearl (Imperial's share) |
182 |
|
162 |
|
Cold Lake |
134 |
|
145 |
|
Syncrude (a) |
72 |
|
74 |
|
|
|
|
Kearl total gross production (thousands of barrels per day) |
257 |
|
228 |
|
(a)In 2023, Syncrude gross production included about 1 thousand barrels per day of bitumen and other products (2022 - 4 thousand barrels per day) that were exported to the operator's facilities using an existing interconnect pipeline.
Higher production at Kearl was primarily driven by improved reliability as a result of the successful rollout of the winterization strategy, the absence of extreme cold weather, increased plant capacity utilization, and mine equipment productivity.
Lower production at Cold Lake was primarily driven by steam cycle timing.
Downstream
Net income (loss) factor analysis
millions of Canadian dollars
Margins – Lower margins primarily reflect weaker market conditions.
Other – Favourable foreign exchange impacts of about $240 million and improved volumes of about $140 million, partially offset by higher turnaround impacts of about $300 million, associated with the planned turnaround activities at the Strathcona and Sarnia refineries.
Refinery utilization and petroleum product sales
|
|
|
|
|
|
|
|
|
| |
Nine Months |
| thousands of barrels per day, unless noted |
2023 |
|
2022 |
|
| Refinery throughput |
407 |
|
413 |
|
Refinery capacity utilization (percent) |
94 |
|
96 |
|
| Petroleum product sales |
469 |
|
471 |
|
Chemicals
Net income (loss) factor analysis
millions of Canadian dollars
Corporate and other
|
|
|
|
|
|
|
|
|
|
Nine Months |
| millions of Canadian dollars |
2023 |
|
2022 |
|
Net income (loss) (U.S. GAAP) |
(71) |
|
(98) |
|
Liquidity and capital resources
|
|
|
|
|
|
|
|
|
| |
Nine Months |
| millions of Canadian dollars |
2023 |
|
2022 |
|
| Cash flows from (used in): |
|
|
| Operating activities |
2,423 |
|
7,685 |
|
| Investing activities |
(1,283) |
|
(145) |
|
| Financing activities |
(2,173) |
|
(6,117) |
|
| Increase (decrease) in cash and cash equivalents |
(1,033) |
|
1,423 |
|
Cash flows from operating activities primarily reflect unfavourable working capital impacts, including an income tax catch-up payment of $2.1 billion, as well as lower Upstream realizations and Downstream margins.
Cash flows used in investing activities primarily reflect the absence of proceeds from the sale of interests in XTO Energy Canada, and higher additions to property, plant and equipment.
Cash flows used in financing activities primarily reflect:
|
|
|
|
|
|
|
|
|
|
Nine Months |
| millions of Canadian dollars, unless noted |
2023 |
|
2022 |
|
Dividends paid |
815 |
|
640 |
|
Per share dividend paid (dollars) |
1.38 |
|
0.95 |
|
Share repurchases (a) |
1,342 |
|
4,461 |
|
Number of shares purchased (millions) (a) |
17.5 |
|
66.6 |
|
(a)Share repurchases were made under the company's normal course issuer bid program. In the second quarter of 2022, share repurchases were made under the company's substantial issuer bid that commenced on May 6, 2022 and expired on June 10, 2022. Includes shares purchased from Exxon Mobil Corporation concurrent with, but outside of, the normal course issuer bid, and by way of a proportionate tender under the company's substantial issuer bid. |
On June 27, 2023, the company announced by news release that it had received final approval from the Toronto Stock Exchange for a new normal course issuer bid to continue its then existing share purchase program. The program enabled the company to purchase up to a maximum of 29,207,635 common shares during the period June 29, 2023 to June 28, 2024. This maximum included shares purchased under the normal course issuer bid and from Exxon Mobil Corporation concurrent with, but outside of, the normal course issuer bid. As in the past, Exxon Mobil Corporation advised the company that it intended to participate to maintain its ownership percentage at approximately 69.6 percent. Imperial accelerated share purchases under the normal course issuer bid program during the third quarter and, subsequent to the end of the third quarter, the program completed on October 19, 2023 as a result of the company purchasing the maximum allowable number of shares under the program.
On October 27, 2023, the company announced its intention to launch a substantial issuer bid pursuant to which the company will offer to purchase for cancellation up to $1.5 billion of its common shares. The substantial issuer bid will be made through a modified Dutch auction, with a tender price range to be determined by the company at the time of commencement of the offer. Shares may also be tendered by way of a proportionate tender, which will result in a shareholder maintaining their proportionate share ownership. ExxonMobil has advised Imperial that it intends to make a proportionate tender in connection with the offer in order to maintain its proportionate share ownership at approximately 69.6 percent following completion of the offer. Nothing in this report shall constitute an offer to purchase or a solicitation of an offer to sell any shares.
Contractual obligations
As previously communicated, in the second quarter of 2023, the company entered into a long-term purchase agreement with a third party for about $3 billion. It has no impact on the 2023 and 2024 obligations disclosed in Imperial's 2022 annual report on Form 10-K. The company does not believe that the increased obligation will have a material effect on Imperial's operations, financial condition or financial statements.
Forward-looking statements
Statements of future events or conditions in this report, including projections, targets, expectations, estimates, and business plans are forward-looking statements. Forward-looking statements can be identified by words such as believe, anticipate, intend, propose, plan, goal, seek, project, predict, target, estimate, expect, strategy, outlook, schedule, future, continue, likely, may, should, will and similar references to future periods. Forward-looking statements in this release include, but are not limited to, the company’s intention to initiate a substantial issuer bid, including the size, structure, timing for determining the terms, pricing and commencement, and ExxonMobil’s intent to make a proportionate tender; the continued evaluation of the share purchase program in context of overall capital activities; references to the use of derivative instruments and effectiveness of risk mitigation; and the company’s belief that the commitment related to the long-term purchase agreement will not have a material effect on the company’s operations, financial condition or financial statements.
Forward-looking statements are based on the company's current expectations, estimates, projections and assumptions at the time the statements are made. Actual future financial and operating results, including expectations and assumptions concerning demand growth and energy source, supply and mix; production rates, growth and mix; for shareholder returns, assumptions such as cash flow forecasts, financing sources and capital structure, that the necessary exemptive relief to proceed with the substantial issuer bid under applicable securities laws will be received on the timeline anticipated, and ExxonMobil making a proportionate tender in connection with the substantial issuer bid; project plans, timing, costs, technical evaluations and capacities and the company’s ability to effectively execute on these plans and operate its assets; capital and environmental expenditures; and commodity prices, foreign exchange rates and general market conditions, could differ materially depending on a number of factors.
These factors include global, regional or local changes in supply and demand for oil, natural gas, and petroleum and petrochemical products and resulting price, differential and margin impacts, including foreign government action with respect to supply levels and prices, and the occurrence of wars; the receipt, in a timely manner, of regulatory and third-party approvals, including for the company’s substantial issuer bid;availability and allocation of capital; project management and schedules and timely completion of projects; unanticipated technical or operational difficulties; availability and performance of third-party service providers; environmental risks inherent in oil and gas exploration and production activities; political or regulatory events, including changes in law or government policy; management effectiveness and disaster response preparedness; operational hazards and risks; cybersecurity incidents, including increased reliance on remote working arrangements; currency exchange rates; general economic conditions; and other factors discussed in Item 1A risk factors and Item 7 management’s discussion and analysis of financial condition and results of operations of Imperial Oil Limited’s most recent annual report on Form 10-K and subsequent interim reports.
Forward-looking statements are not guarantees of future performance and involve a number of risks and uncertainties, some that are similar to other oil and gas companies and some that are unique to Imperial. Imperial’s actual results may differ materially from those expressed or implied by its forward-looking statements and readers are cautioned not to place undue reliance on them. Imperial undertakes no obligation to update any forward-looking statements contained herein, except as required by applicable law.
The term "project" as used in this report can refer to a variety of different activities and does not necessarily have the same meaning as in any government payment transparency reports.
Item 3. Quantitative and qualitative disclosures about market risk
Information about market risks for the nine months ended September 30, 2023, does not differ materially from that discussed on page 32 of the company’s annual report on Form 10-K for the year ended December 31, 2022.
Item 4. Controls and procedures
As indicated in the certifications in Exhibit 31 of this report, the company’s principal executive officer and principal financial officer have evaluated the company’s disclosure controls and procedures as of September 30, 2023. Based on that evaluation, these officers have concluded that the company’s disclosure controls and procedures are effective in ensuring that information required to be disclosed by the company in the reports that it files or submits under the Securities Exchange Act of 1934, as amended, is accumulated and communicated to them in a manner that allows for timely decisions regarding required disclosures and are effective in ensuring that such information is recorded, processed, summarized and reported within the time periods specified in the Securities and Exchange Commission’s rules and forms. There has not been any change in the company’s internal control over financial reporting during the last fiscal quarter that has materially affected, or is reasonably likely to materially affect, the company’s internal control over financial reporting.
PART II. OTHER INFORMATION
Item 1. Legal proceedings
Imperial has elected to use a $1 million (U.S. dollars) threshold for disclosing environmental proceedings.
Item 2. Unregistered sales of equity securities and use of proceeds
Issuer purchases of equity securities
|
|
|
|
|
|
|
|
|
|
|
|
|
|
|
| |
Total number of
shares purchased
|
Average price paid
per share
(Canadian dollars)
|
Total number of
shares purchased
as part of publicly
announced plans
or programs
|
Maximum number
of shares that may
yet be purchased
under the plans or
programs (a) |
July 2023 |
|
|
|
|
(July 1 - July 31) |
2,283,731 |
|
66.72 |
|
2,283,731 |
|
26,923,904 |
|
August 2023 |
|
|
|
|
(August 1 - August 31) |
5,923,101 |
|
74.12 |
|
5,923,101 |
|
21,000,803 |
|
September 2023 |
|
|
|
|
| (September 1 - September 30) |
9,278,768 |
|
80.91 |
|
9,278,768 |
|
11,722,035 |
|
|
|
|
|
|
|
|
|
|
|
(a)On June 27, 2023, the company announced by news release that it had received final approval from the Toronto Stock Exchange for a new normal course issuer bid and to continue its existing share purchase program. The program enabled the company to purchase up to a maximum of 29,207,635 common shares during the period June 29, 2023 to June 28, 2024. This maximum included shares purchased under the normal course issuer bid and from Exxon Mobil Corporation concurrent with, but outside of, the normal course issuer bid. As in the past, Exxon Mobil Corporation advised the company that it intended to participate to maintain its ownership percentage at approximately 69.6 percent. Imperial accelerated its share purchases under the normal course issuer bid program during the third quarter and, subsequent to the end of the third quarter, the program completed on October 19, 2023 as a result of the company purchasing the maximum allowable number of shares under the program.
On October 27, 2023, the company announced its intention to launch a substantial issuer bid pursuant to which the company will offer to purchase for cancellation up to $1.5 billion of its common shares. The substantial issuer bid will be made through a modified Dutch auction, with a tender price range to be determined by the company at the time of commencement of the offer. Shares may also be tendered by way of a proportionate tender, which will result in a shareholder maintaining their proportionate share ownership. ExxonMobil has advised Imperial that it intends to make a proportionate tender in connection with the offer in order to maintain its proportionate share ownership at approximately 69.6 percent following completion of the offer. Nothing in this report shall constitute an offer to purchase or a solicitation of an offer to sell any shares.
The company will continue to evaluate its share purchase program in the context of its overall capital activities. Purchase plans may be modified at any time without prior notice.
Item 5. Other information
During the three months ended September 30, 2023, none of the Company's directors or officers adopted or terminated a "Rule 10b5-1 trading arrangement" or "non-Rule 10b5-1 trading arrangement," as each term is defined in Item 408(a) of Regulation S-K.
Item 6. Exhibits
(31.1) Certification by the principal executive officer of the company pursuant to Rule 13a-14(a).
(31.2) Certification by the principal financial officer of the company pursuant to Rule 13a-14(a).
(32.1) Certification by the chief executive officer of the company pursuant to Rule 13a-14(b) and 18 U.S.C. Section 1350.
(32.2) Certification by the chief financial officer of the company pursuant to Rule 13a-14(b) and 18 U.S.C. Section 1350.
(101) Interactive Data Files (formatted as Inline XBRL).
(104) Cover Page Interactive Data File (formatted as Inline XBRL and contained in Exhibit 101).
SIGNATURES
Pursuant to the requirements of the Securities Exchange Act of 1934, the registrant has duly caused this report to be signed on its behalf by the undersigned thereunto duly authorized.
|
|
|
|
|
|
|
|
|
|
|
Imperial Oil Limited |
|
|
(Registrant) |
|
|
|
| Date: |
October 31, 2023 |
/s/ Daniel E. Lyons |
|
|
|
(Signature) |
|
|
Daniel E. Lyons |
|
|
Senior vice-president, finance and
administration, and controller |
|
|
|
|
(Principal accounting officer) |
|
|
|
| Date: |
October 31, 2023 |
/s/ Cathryn Walker |
|
|
|
(Signature) |
|
|
Cathryn Walker |
|
|
Assistant corporate secretary |
EX-31.1
2
imoex31110-q2023q3.htm
EX-31.1
Document
Exhibit (31.1)
Certification
Pursuant to Securities Exchange Act Rule 13a-14(a)
I, Bradley W. Corson, certify that:
1.I have reviewed this quarterly report on Form 10-Q of Imperial Oil Limited;
2.Based on my knowledge, this report does not contain any untrue statement of a material fact or omit to state a material fact necessary to make the statements made, in light of the circumstances under which such statements were made, not misleading with respect to the period covered by this report;
3.Based on my knowledge, the financial statements, and other financial information included in this report, fairly present in all material respects the financial condition, results of operations and cash flows of the registrant as of, and for, the periods presented in this report;
4.The registrant’s other certifying officer(s) and I are responsible for establishing and maintaining disclosure controls and procedures (as defined in Exchange Act Rules 13a-15(e) and 15d-15(e)) and internal control over financial reporting (as defined in Exchange Act Rules 13a-15(f) and 15d-15(f)) for the registrant and have:
(a)Designed such disclosure controls and procedures, or caused such disclosure controls and procedures to be designed under our supervision, to ensure that material information relating to the registrant, including its consolidated subsidiaries, is made known to us by others within those entities, particularly during the period in which this report is being prepared;
(b)Designed such internal control over financial reporting, or caused such internal control over financial reporting to be designed under our supervision, to provide reasonable assurance regarding the reliability of financial reporting and the preparation of financial statements for external purposes in accordance with generally accepted accounting principles;
(c)Evaluated the effectiveness of the registrant’s disclosure controls and procedures and presented in this report our conclusions about the effectiveness of the disclosure controls and procedures, as of the end of the period covered by this report based on such evaluation; and
(d)Disclosed in this report any change in the registrant’s internal control over financial reporting that occurred during the registrant’s most recent fiscal quarter (the registrant’s fourth fiscal quarter in the case of an annual report) that has materially affected, or is reasonably likely to materially affect, the registrant’s internal control over financial reporting; and
5.The registrant’s other certifying officer(s) and I have disclosed, based on our most recent evaluation of internal control over financial reporting, to the registrant’s auditors and the audit committee of the registrant’s board of directors (or persons performing the equivalent functions):
(a)All significant deficiencies and material weaknesses in the design or operation of internal control over financial reporting which are reasonably likely to adversely affect the registrant’s ability to record, process, summarize and report financial information; and
(b)Any fraud, whether or not material, that involves management or other employees who have a significant role in the registrant’s internal control over financial reporting.
Date: October 31, 2023
Bradley W. Corson
Chairman, president and
chief executive officer
(Principal executive officer)
EX-31.2
3
imoex31210-q2023q3.htm
EX-31.2
Document
Exhibit (31.2)
Certification
Pursuant to Securities Exchange Act Rule 13a-14(a)
I, Daniel E. Lyons, certify that:
1.I have reviewed this quarterly report on Form 10-Q of Imperial Oil Limited;
2.Based on my knowledge, this report does not contain any untrue statement of a material fact or omit to state a material fact necessary to make the statements made, in light of the circumstances under which such statements were made, not misleading with respect to the period covered by this report;
3.Based on my knowledge, the financial statements, and other financial information included in this report, fairly present in all material respects the financial condition, results of operations and cash flows of the registrant as of, and for, the periods presented in this report;
4.The registrant’s other certifying officer(s) and I are responsible for establishing and maintaining disclosure controls and procedures (as defined in Exchange Act Rules 13a-15(e) and 15d-15(e)) and internal control over financial reporting (as defined in Exchange Act Rules 13a-15(f) and 15d-15(f)) for the registrant and have:
(a)Designed such disclosure controls and procedures, or caused such disclosure controls and procedures to be designed under our supervision, to ensure that material information relating to the registrant, including its consolidated subsidiaries, is made known to us by others within those entities, particularly during the period in which this report is being prepared;
(b)Designed such internal control over financial reporting, or caused such internal control over financial reporting to be designed under our supervision, to provide reasonable assurance regarding the reliability of financial reporting and the preparation of financial statements for external purposes in accordance with generally accepted accounting principles;
(c)Evaluated the effectiveness of the registrant’s disclosure controls and procedures and presented in this report our conclusions about the effectiveness of the disclosure controls and procedures, as of the end of the period covered by this report based on such evaluation; and
(d)Disclosed in this report any change in the registrant’s internal control over financial reporting that occurred during the registrant’s most recent fiscal quarter (the registrant’s fourth fiscal quarter in the case of an annual report) that has materially affected, or is reasonably likely to materially affect, the registrant’s internal control over financial reporting; and
5.The registrant’s other certifying officer(s) and I have disclosed, based on our most recent evaluation of internal control over financial reporting, to the registrant’s auditors and the audit committee of the registrant’s board of directors (or persons performing the equivalent functions):
(a)All significant deficiencies and material weaknesses in the design or operation of internal control over financial reporting which are reasonably likely to adversely affect the registrant’s ability to record, process, summarize and report financial information; and
(b)Any fraud, whether or not material, that involves management or other employees who have a significant role in the registrant’s internal control over financial reporting.
Date: October 31, 2023
Daniel E. Lyons
Senior vice-president, finance and
administration, and controller
(Principal financial officer)
EX-32.1
4
imoex32110-q2023q3.htm
EX-32.1
Document
Exhibit (32.1)
Certification of Periodic Financial Report
Pursuant to 18 U.S.C. Section 1350
For purposes of 18 U.S.C. Section 1350, as adopted pursuant to Section 906 of the Sarbanes-Oxley Act of 2002, the undersigned, Bradley W. Corson, the chief executive officer of Imperial Oil Limited (the “company”), hereby certifies that, to his knowledge:
(i)The quarterly report on Form 10-Q of the company for the quarter ended September 30, 2023 as filed with the Securities and Exchange Commission (the “Report”), fully complies with the requirements of section 13(a) or 15(d) of the Securities Exchange Act of 1934; and
(ii)The information contained in the report fairly presents, in all material respects, the financial condition and results of operations of the company.
|
|
|
|
Date: October 31, 2023 |
|
/s/ Bradley W. Corson |
|
Bradley W. Corson |
|
Chairman, president and
chief executive officer
|
| (Principal executive officer) |
EX-32.2
5
imoex32210-q2023q3.htm
EX-32.2
Document
Exhibit (32.2)
Certification of Periodic Financial Report
Pursuant to 18 U.S.C. Section 1350
For purposes of 18 U.S.C. Section 1350, as adopted pursuant to Section 906 of the Sarbanes-Oxley Act of 2002, the undersigned, Daniel E. Lyons, the chief financial officer of Imperial Oil Limited (the “company”), hereby certifies that, to his knowledge:
(i)The quarterly report on Form 10-Q of the company for the quarter ended September 30, 2023 as filed with the Securities and Exchange Commission (the “Report”), fully complies with the requirements of section 13(a) or 15(d) of the Securities Exchange Act of 1934; and
(ii)The information contained in the report fairly presents, in all material respects, the financial condition and results of operations of the company.
|
|
|
|
Date: October 31, 2023 |
|
/s/ Daniel E. Lyons |
|
Daniel E. Lyons |
| Senior vice-president, finance and |
| administration, and controller |
| (Chief financial officer) |