| (Exact name of registrant as specified in its charter) | ||
| Delaware | 1-5975 | 61-0647538 | ||||||
| (State or other jurisdiction of incorporation) | (Commission File Number) | (IRS Employer Identification No.) | ||||||
| ☐ | Written communications pursuant to Rule 425 under the Securities Act (17 CFR 230.425) | ||||
| ☐ | Soliciting material pursuant to Rule 14a-12 under the Exchange Act (17 CFR 240.14a-12) | ||||
| ☐ | Pre-commencement communications pursuant to Rule 14d-2(b) under the Exchange Act (17 CFR 240.14d-2(b)) | ||||
| ☐ | Pre-commencement communications pursuant to Rule 13e-4(c) under the Exchange Act (17 CFR 240.13e-4(c)) | ||||
| Title of each class | Trading Symbol(s) | Name of each exchange on which registered | ||||||
| Common Stock | HUM | New York Stock Exchange | ||||||
| Exhibit No. | Description | ||||||||||
| 99.1 | |||||||||||
| 99.2 | |||||||||||
| 99.3 | |||||||||||
| 104 | Cover Page Interactive Data File (embedded within the Inline XBRL document) | ||||||||||
| HUMANA INC. | |||||
| BY: | /s/ John-Paul W. Felter | ||||
| John-Paul W. Felter | |||||
| Senior Vice President, Chief Accounting Officer & Controller | |||||
| (Principal Accounting Officer) | |||||
n e w s r e l e a s e |
Exhibit 99.1
Humana Inc.
500 West Main Street
P.O. Box 1438
Louisville, KY 40202
http://www.humana.com
|
||||
| Lisa Stoner Humana Investor Relations (502) 580-2652 e-mail: LStamper@humana.com |
 |
||||
Consolidated (loss) income before income taxes and equity in net losses (pretax results) In millions |
4Q24 (a) | 4Q23 (a) | FY 2024 (a) | FY 2023 (a) | ||||||||||
| Generally Accepted Accounting Principles (GAAP) | ($862) | ($591) | $1,721 | $3,383 | ||||||||||
| Amortization associated with identifiable intangibles | 14 | 15 | 60 | 67 | ||||||||||
| Put/call valuation adjustments associated with the company's non-consolidating minority interest investments | 155 | 179 | 296 | 320 | ||||||||||
| Impact of exit of employer group commercial medical products business | 67 | 1 | 144 | 16 | ||||||||||
| Value creation initiatives | 130 | 384 | 281 | 436 | ||||||||||
| Impairment charges | 200 | 91 | 200 | 91 | ||||||||||
| Transaction and integration costs | — | — | — | (48) | ||||||||||
| Accrued charge related to certain anticipated litigation expenses | — | — | — | 105 | ||||||||||
| Change in fair market value of publicly-traded equity securities | — | — | — | (1) | ||||||||||
| Adjusted (non-GAAP) | ($296) | $79 | $2,702 | $4,369 | ||||||||||
| (Net loss per share) EPS | 4Q24 (a) | 4Q23 (a) | FY 2024 (a) | FY 2023 (a) | ||||||||||
| GAAP | ($5.76) | ($4.42) | $9.98 | $20.00 | ||||||||||
| Amortization associated with identifiable intangibles | 0.12 | 0.13 | 0.50 | 0.54 | ||||||||||
| Put/call valuation adjustments associated with the company's non-consolidating minority interest investments | 1.29 | 1.46 | 2.45 | 2.57 | ||||||||||
| Impact of exit of employer group commercial medical products business | 0.55 | 0.01 | 1.19 | 0.13 | ||||||||||
| Value creation initiatives | 1.08 | 3.13 | 2.33 | 3.50 | ||||||||||
| Impairment charges | 1.66 | 0.74 | 1.65 | 0.73 | ||||||||||
| Transaction and integration costs | — | — | — | (0.38) | ||||||||||
| Accrued charge related to certain anticipated litigation expenses | — | — | — | 0.84 | ||||||||||
| Change in fair market value of publicly-traded equity securities | — | — | — | (0.01) | ||||||||||
| Cumulative net tax impact of non-GAAP adjustments | (1.10) | (1.16) | (1.89) | (1.83) | ||||||||||
| Adjusted (non-GAAP) | ($2.16) | ($0.11) | $16.21 | $26.09 | ||||||||||
|
Diluted earnings per share |
FY 2025 Guidance |
FY 2024 (a) | ||||||
| GAAP | approximately $15.88 |
$9.98 | ||||||
| Amortization associated with identifiable intangibles | 0.49 | 0.50 | ||||||
| Put/call valuation adjustments associated with the company's non-consolidating minority interest investments | — | 2.45 | ||||||
| Impact of exit of employer group commercial medical products business | — | 1.19 | ||||||
| Value creation initiatives | — | 2.33 | ||||||
| Impairment charges | — | 1.65 | ||||||
| Cumulative net tax impact of non-GAAP adjustments | (0.12) | (1.89) | ||||||
| Adjusted (non-GAAP) – FY 2025 projected (b); FY 2024 Reported | approximately $16.25 |
$16.21 | ||||||
| 4Q24 | 4Q23 | FY 2024 | FY 2023 | |||||||||||
| Insurance segment | $4 | $4 | $17 | $22 | ||||||||||
| CenterWell segment | $10 | $11 | $43 | $45 | ||||||||||
| Revenues - CONSOLIDATED (in millions) |
4Q24 | 4Q23 | FY 2024 | FY 2023 | ||||||||||
| GAAP | $29,213 | $26,462 | $117,761 | $106,374 | ||||||||||
| Change in fair market value of publicly-traded equity securities | — | — | — | (1) | ||||||||||
| Impact of exit of employer group commercial medical products business | (14) | (764) | (551) | (3,764) | ||||||||||
| Impairment charges | — | 36 | — | 36 | ||||||||||
| Adjusted (non-GAAP) | $29,199 | $25,734 | $117,210 | $102,645 | ||||||||||
| Revenues - INSURANCE SEGMENT (in millions) |
4Q24 | 4Q23 | FY 2024 | FY 2023 | ||||||||||
| GAAP | $28,170 | $25,565 | $113,764 | $102,854 | ||||||||||
| Impact of exit of employer group commercial medical products business | (14) | (764) | (551) | (3,764) | ||||||||||
| Adjusted (non-GAAP) | $28,156 | $24,801 | $113,213 | $99,090 | ||||||||||
| Benefit ratio - CONSOLIDATED | 4Q24 | 4Q23 | FY 2024 | FY 2023 | ||||||||||
| GAAP | 91.5 | % | 90.7 | % | 89.8 | % | 87.3 | % | ||||||
| Impact of exit of employer group commercial medical products business | (0.2) | % | (0.2) | % | (0.1) | % | (0.1) | % | ||||||
| Adjusted (non-GAAP) | 91.3 | % | 90.5 | % | 89.7 | % | 87.2 | % | ||||||
| Benefit ratio - INSURANCE SEGMENT | 4Q24 | 4Q23 | FY 2024 | FY 2023 | ||||||||||
| GAAP | 92.1 | % | 91.5 | % | 90.4 | % | 88.0 | % | ||||||
| Impact of exit of employer group commercial medical products business | (0.2) | % | (0.1) | % | (0.1) | % | — | % | ||||||
| Adjusted (non-GAAP) | 91.9 | % | 91.4 | % | 90.3 | % | 88.0 | % | ||||||
| Operating cost ratio - CONSOLIDATED | 4Q24 | 4Q23 | FY 2024 | FY 2023 | ||||||||||
| GAAP | 14.4 | % | 14.6 | % | 11.8 | % | 12.5 | % | ||||||
| Impact of exit of employer group commercial medical products business | — | % | — | % | (0.1) | % | (0.2) | % | ||||||
| Value creation initiatives | (0.5) | % | (1.5) | % | (0.2) | % | (0.4) | % | ||||||
| Accrued charge related to certain anticipated litigation expenses | — | % | — | % | — | % | (0.1) | % | ||||||
| Impairment charges | (0.7) | % | (0.2) | % | (0.2) | % | (0.1) | % | ||||||
| Adjusted (non-GAAP) | 13.2 | % | 12.9 | % | 11.3 | % | 11.7 | % | ||||||
| Operating cost ratio - INSURANCE SEGMENT | 4Q24 | 4Q23 | FY 2024 | FY 2023 | ||||||||||
| GAAP | 11.0 | % | 11.1 | % | 9.2 | % | 10.2 | % | ||||||
| Impact of exit of employer group commercial medical products business | — | % | (0.2) | % | — | % | (0.3) | % | ||||||
| Accrued charge related to certain anticipated litigation expenses | — | % | — | % | — | % | (0.1) | % | ||||||
| Adjusted (non-GAAP) | 11.0 | % | 10.9 | % | 9.2 | % | 9.8 | % | ||||||
| (Loss) income from operations - INSURANCE SEGMENT (in millions) |
4Q24 | 4Q23 | FY 2024 | FY 2023 | ||||||||||
| GAAP | ($646) | ($426) | $1,289 | $2,654 | ||||||||||
| Amortization associated with identifiable intangibles | 4 | 4 | 17 | 22 | ||||||||||
| Impact of exit of employer group commercial medical products business | 67 | 61 | 177 | 116 | ||||||||||
| Accrued charge related to certain anticipated litigation expenses | — | — | — | 105 | ||||||||||
| Adjusted (non-GAAP) | ($575) | ($361) | $1,483 | $2,897 | ||||||||||
| n e w s r e l e a s e | ||
|
Humana Inc.
500 West Main Street
P.O. Box 1438
Louisville, KY 40202
http://www.humana.com
| ||
| Lisa Stoner Humana Investor Relations (502) 580-2652 e-mail: LStamper@humana.com |
 |
||||
Consolidated (loss) income before income taxes and equity in net losses (pretax results) In millions |
4Q24 (a) | 4Q23 (a) | FY 2024 (a) | FY 2023 (a) | ||||||||||
| Generally Accepted Accounting Principles (GAAP) | ($862) | ($591) | $1,721 | $3,383 | ||||||||||
| Amortization associated with identifiable intangibles | 14 | 15 | 60 | 67 | ||||||||||
| Put/call valuation adjustments associated with the company's non-consolidating minority interest investments | 155 | 179 | 296 | 320 | ||||||||||
| Impact of exit of employer group commercial medical products business | 67 | 1 | 144 | 16 | ||||||||||
| Value creation initiatives | 130 | 384 | 281 | 436 | ||||||||||
| Impairment charges | 200 | 91 | 200 | 91 | ||||||||||
| Transaction and integration costs | — | — | — | (48) | ||||||||||
| Accrued charge related to certain anticipated litigation expenses | — | — | — | 105 | ||||||||||
| Change in fair market value of publicly-traded equity securities | — | — | — | (1) | ||||||||||
| Adjusted (non-GAAP) | ($296) | $79 | $2,702 | $4,369 | ||||||||||
| (Net loss per share) EPS | 4Q24 (a) | 4Q23 (a) | FY 2024 (a) | FY 2023 (a) | ||||||||||
| GAAP | ($5.76) | ($4.42) | $9.98 | $20.00 | ||||||||||
| Amortization associated with identifiable intangibles | 0.12 | 0.13 | 0.50 | 0.54 | ||||||||||
| Put/call valuation adjustments associated with the company's non-consolidating minority interest investments | 1.29 | 1.46 | 2.45 | 2.57 | ||||||||||
| Impact of exit of employer group commercial medical products business | 0.55 | 0.01 | 1.19 | 0.13 | ||||||||||
| Value creation initiatives | 1.08 | 3.13 | 2.33 | 3.50 | ||||||||||
| Impairment charges | 1.66 | 0.74 | 1.65 | 0.73 | ||||||||||
| Transaction and integration costs | — | — | — | (0.38) | ||||||||||
| Accrued charge related to certain anticipated litigation expenses | — | — | — | 0.84 | ||||||||||
| Change in fair market value of publicly-traded equity securities | — | — | — | (0.01) | ||||||||||
| Cumulative net tax impact of non-GAAP adjustments | (1.10) | (1.16) | (1.89) | (1.83) | ||||||||||
| Adjusted (non-GAAP) | ($2.16) | ($0.11) | $16.21 | $26.09 | ||||||||||
|
Diluted earnings per share |
FY 2025 Guidance |
FY 2024 (a) | ||||||
| GAAP | approximately $15.88 |
$9.98 | ||||||
| Amortization associated with identifiable intangibles | 0.49 | 0.50 | ||||||
| Put/call valuation adjustments associated with the company's non-consolidating minority interest investments | — | 2.45 | ||||||
| Impact of exit of employer group commercial medical products business | — | 1.19 | ||||||
| Value creation initiatives | — | 2.33 | ||||||
| Impairment charges | — | 1.65 | ||||||
| Cumulative net tax impact of non-GAAP adjustments | (0.12) | (1.89) | ||||||
| Adjusted (non-GAAP) – FY 2025 projected (b); FY 2024 Reported | approximately $16.25 |
$16.21 | ||||||
Humana Inc. Summary of Results ($ in millions, except per share amounts) |
4Q24 (a) | 4Q23 (a) | FY 2024 (a) | FY 2023 (a) | ||||||||||
| Revenues | $29,213 | $26,462 | $117,761 | $106,374 | ||||||||||
| Revenues - Adjusted (non-GAAP) | $29,199 | $25,734 | $117,210 | $102,645 | ||||||||||
| Pretax results | ($862) | ($591) | $1,721 | $3,383 | ||||||||||
| Pretax results - Adjusted (non-GAAP) | ($296) | $79 | $2,702 | $4,369 | ||||||||||
| (Net loss per share) EPS | ($5.76) | ($4.42) | $9.98 | $20.00 | ||||||||||
| (Net loss per share) EPS - Adjusted (non-GAAP) | ($2.16) | ($0.11) | $16.21 | $26.09 | ||||||||||
| Benefits expense ratio | 91.5 | % | 90.7 | % | 89.8 | % | 87.3 | % | ||||||
| Benefits expense ratio - Adjusted (non-GAAP) | 91.3 | % | 90.5 | % | 89.7 | % | 87.2 | % | ||||||
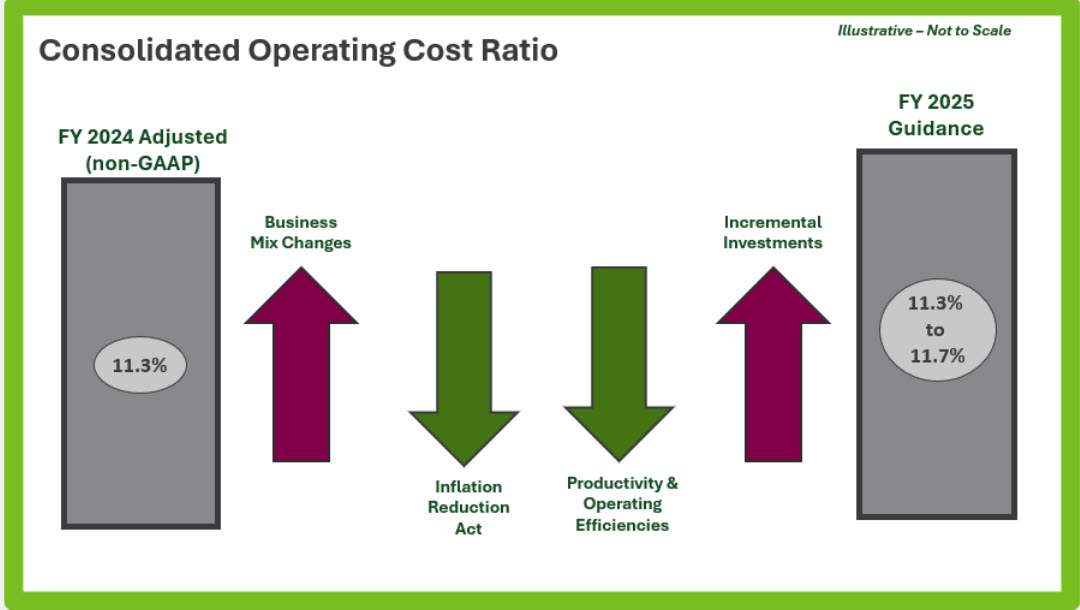
| Operating cost ratio | 14.4 | % | 14.6 | % | 11.8 | % | 12.5 | % | ||||||
| Operating cost ratio - Adjusted (non-GAAP) | 13.2 | % | 12.9 | % | 11.3 | % | 11.7 | % | ||||||
| Operating cash flows | $2,966 | $3,981 | ||||||||||||
| Parent company cash and short term investments | $562 | $510 | ||||||||||||
| Debt-to-total capitalization | 41.9 | % | 41.8 | % | ||||||||||
| Days in Claims Payable (DCP) | 37.8 | 41.4 | ||||||||||||
|
Consolidated Favorable Prior Period Development
$ in millions
Basis points (bps)
|
First Quarter |
Second Quarter |
Third Quarter |
Fourth Quarter |
FY | ||||||||||||||||||
Prior Period Development from prior years recognized in 2024 (c) |
$535 | $134 | $24 | $8 | $701 | ||||||||||||||||||
| Decrease to GAAP benefit ratio | (190 bps) | (50 bps) | (10 bps) | (0 bps) | (60 bps) | ||||||||||||||||||
Prior Period Development from prior years recognized in 2023 (c) |
$522 | $232 | $4 | $114 | $872 | ||||||||||||||||||
| Decrease to GAAP benefit ratio | (200 bps) | (90 bps) | (0 bps) | (50 bps) | (90 bps) | ||||||||||||||||||
Insurance Segment Results ($ in millions) |
4Q24 (a) | 4Q23 (a) | FY 2024 (a) | FY 2023 (a) | ||||||||||
| Revenues | $28,170 | $25,565 | $113,764 | $102,854 | ||||||||||
| Revenues - Adjusted (non-GAAP) | $28,156 | $24,801 | $113,213 | $99,090 | ||||||||||
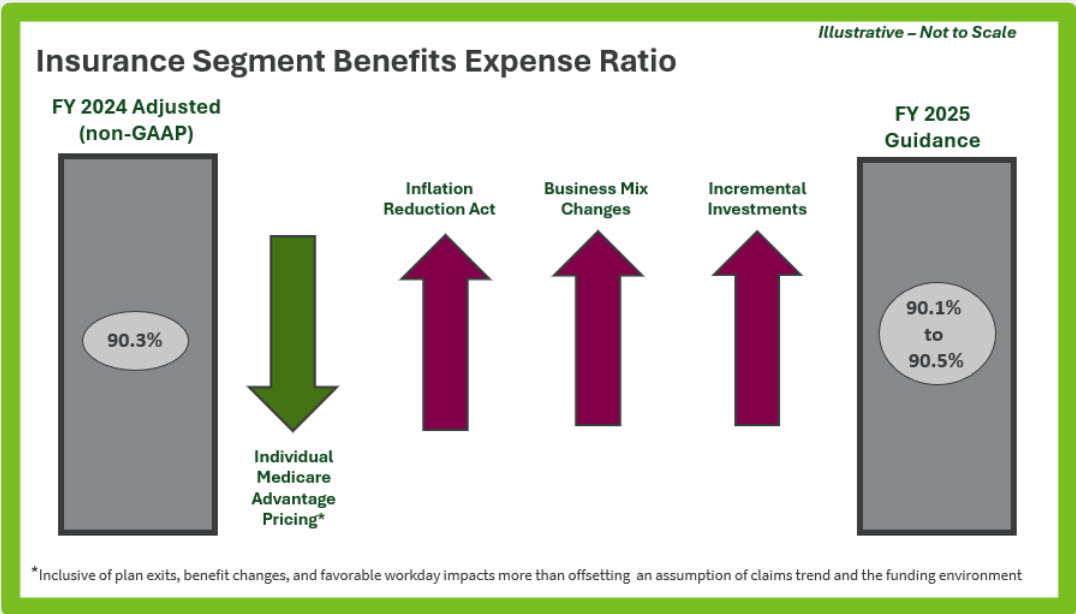
| Benefits expense ratio | 92.1 | % | 91.5 | % | 90.4 | % | 88.0 | % | ||||||
| Benefits expense ratio - Adjusted (non-GAAP) | 91.9 | % | 91.4 | % | 90.3 | % | 88.0 | % | ||||||
| Operating cost ratio | 11.0 | % | 11.1 | % | 9.2 | % | 10.2 | % | ||||||
| Operating cost ratio - Adjusted (non-GAAP) | 11.0 | % | 10.9 | % | 9.2 | % | 9.8 | % | ||||||
| (Loss) income from operations | ($646) | ($426) | $1,289 | $2,654 | ||||||||||
| (Loss) income from operations - Adjusted (non-GAAP) | ($575) | ($361) | $1,483 | $2,897 | ||||||||||
CenterWell Segment Results ($ in millions) |
4Q24 | 4Q23 | FY 2024 | FY 2023 | ||||||||||
| Revenues | $5,130 | $4,710 | $19,936 | $18,405 | ||||||||||
| Operating cost ratio | 92.5 | % | 90.6 | % | 92.2 | % | 91.2 | % | ||||||
| Income from operations | $327 | $387 | $1,329 | $1,404 | ||||||||||
| Income from operations - Adjusted (non-GAAP) (d) | $385 | $445 | $1,553 | $1,614 | ||||||||||
| 4Q24 | 4Q23 | FY 2024 | FY 2023 | |||||||||||
| Insurance segment | $4 | $4 | $17 | $22 | ||||||||||
| CenterWell segment | $10 | $11 | $43 | $45 | ||||||||||
|
Revenues - CONSOLIDATED
(in millions)
|
4Q24 | 4Q23 | FY 2024 | FY 2023 | ||||||||||
| GAAP | $29,213 | $26,462 | $117,761 | $106,374 | ||||||||||
| Change in fair market value of publicly-traded equity securities | — | — | — | (1) | ||||||||||
| Impact of exit of employer group commercial medical products business | (14) | (764) | (551) | (3,764) | ||||||||||
| Impairment charges | — | 36 | — | 36 | ||||||||||
| Adjusted (non-GAAP) | $29,199 | $25,734 | $117,210 | $102,645 | ||||||||||
|
Revenues - INSURANCE SEGMENT
(in millions)
|
4Q24 | 4Q23 | FY 2024 | FY 2023 | ||||||||||
| GAAP | $28,170 | $25,565 | $113,764 | $102,854 | ||||||||||
| Impact of exit of employer group commercial medical products business | (14) | (764) | (551) | (3,764) | ||||||||||
| Adjusted (non-GAAP) | $28,156 | $24,801 | $113,213 | $99,090 | ||||||||||
| Benefit ratio - CONSOLIDATED | 4Q24 | 4Q23 | FY 2024 | FY 2023 | ||||||||||
| GAAP | 91.5 | % | 90.7 | % | 89.8 | % | 87.3 | % | ||||||
| Impact of exit of employer group commercial medical products business | (0.2) | % | (0.2) | % | (0.1) | % | (0.1) | % | ||||||
| Adjusted (non-GAAP) | 91.3 | % | 90.5 | % | 89.7 | % | 87.2 | % | ||||||
| Benefit ratio - INSURANCE SEGMENT | 4Q24 | 4Q23 | FY 2024 | FY 2023 | ||||||||||
| GAAP | 92.1 | % | 91.5 | % | 90.4 | % | 88.0 | % | ||||||
| Impact of exit of employer group commercial medical products business | (0.2) | % | (0.1) | % | (0.1) | % | — | % | ||||||
| Adjusted (non-GAAP) | 91.9 | % | 91.4 | % | 90.3 | % | 88.0 | % | ||||||
| Operating cost ratio - CONSOLIDATED | 4Q24 | 4Q23 | FY 2024 | FY 2023 | ||||||||||
| GAAP | 14.4 | % | 14.6 | % | 11.8 | % | 12.5 | % | ||||||
| Impact of exit of employer group commercial medical products business | — | % | — | % | (0.1) | % | (0.2) | % | ||||||
| Value creation initiatives | (0.5) | % | (1.5) | % | (0.2) | % | (0.4) | % | ||||||
| Accrued charge related to certain anticipated litigation expenses | — | % | — | % | — | % | (0.1) | % | ||||||
| Impairment charges | (0.7) | % | (0.2) | % | (0.2) | % | (0.1) | % | ||||||
| Adjusted (non-GAAP) | 13.2 | % | 12.9 | % | 11.3 | % | 11.7 | % | ||||||
| Operating cost ratio - INSURANCE SEGMENT | 4Q24 | 4Q23 | FY 2024 | FY 2023 | ||||||||||
| GAAP | 11.0 | % | 11.1 | % | 9.2 | % | 10.2 | % | ||||||
| Impact of exit of employer group commercial medical products business | — | % | (0.2) | % | — | % | (0.3) | % | ||||||
| Accrued charge related to certain anticipated litigation expenses | — | % | — | % | — | % | (0.1) | % | ||||||
| Adjusted (non-GAAP) | 11.0 | % | 10.9 | % | 9.2 | % | 9.8 | % | ||||||
|
(Loss) income from operations - INSURANCE SEGMENT
(in millions)
|
4Q24 | 4Q23 | FY 2024 | FY 2023 | ||||||||||
| GAAP | ($646) | ($426) | $1,289 | $2,654 | ||||||||||
| Amortization associated with identifiable intangibles | 4 | 4 | 17 | 22 | ||||||||||
| Impact of exit of employer group commercial medical products business | 67 | 61 | 177 | 116 | ||||||||||
| Accrued charge related to certain anticipated litigation expenses | — | — | — | 105 | ||||||||||
| Adjusted (non-GAAP) | ($575) | ($361) | $1,483 | $2,897 | ||||||||||
| Favorable (Unfavorable) Prior Period Development | First Quarter | Second Quarter |
Third Quarter | Fourth Quarter |
FY | ||||||||||||
Prior Period Development from prior years recognized in 2024 |
$34 | ($9) | ($1) | ($3) | $21 | ||||||||||||
Prior Period Development from prior years recognized in 2023 |
$23 | ($20) | ($2) | $— | $1 | ||||||||||||
|
Income from operations - CENTERWELL SEGMENT
(in millions)
|
4Q24 | 4Q23 | FY 2024 | FY 2023 | ||||||||||
| GAAP | $327 | $387 | $1,329 | $1,404 | ||||||||||
| Depreciation and amortization expense | 58 | 58 | 224 | 210 | ||||||||||
| Adjusted (non-GAAP) | $385 | $445 | $1,553 | $1,614 | ||||||||||
| Humana Inc. Full Year 2025 Projections - As of February 11, 2025 | ||||||||
| Diluted earnings per common share | ||||||||
GAAP: approximately $15.88 |
||||||||
Non-GAAP: approximately $16.25 |
||||||||
| Total Revenues | ||||||||
| Consolidated | GAAP: $126 billion to $128 billion |
Consolidated and segment level revenue projections include expected investment income. Segment level revenues include amounts that eliminate in consolidation. |
||||||
| Insurance segment | GAAP: $121 billion to $123 billion |
|||||||
| CenterWell segment | GAAP: $20.5 billion to $21.5 billion |
|||||||
| Change in year-end medical membership from prior year-end | ||||||||
| Individual Medicare Advantage | Decline of approximately 550,000 | |||||||
| Group Medicare Advantage | Relatively flat | |||||||
| Medicare stand-alone PDP | Growth of approximately 200,000 | |||||||
| State-based contracts |
Growth within 175,000 to 250,000 range
|
State-based contracts guidance includes membership in Florida, Illinois, Indiana, Kentucky, Louisiana, Ohio, Oklahoma, South Carolina, Virginia, and Wisconsin. | ||||||
|
Benefit Ratio
Insurance segment
|
GAAP: 90.1% to 90.5% |
Ratio calculation: benefits expense as a percent of premiums revenues. | ||||||
Operating Cost Ratio Consolidated |
GAAP: 11.3% to 11.7% |
Ratio calculation: operating costs excluding depreciation and amortization as a percent of revenues excluding investment income. | ||||||
| Segment Results | ||||||||
| Insurance segment income from operations | GAAP: $1.5 billion to $2.0 billion |
CenterWell segment Non-GAAP income from operations excludes the projected impact of segment depreciation and amortization. |
||||||
| CenterWell segment income from operations |
GAAP: $1.0 billion to $1.5 billion
Non-GAAP: $1.2 billion to $1.7 billion
|
|||||||
| Effective Tax Rate | GAAP: approximately 25.0% |
|||||||
| Weighted Avg. Share Count for Diluted EPS | approximately 121.5 million | |||||||
| Cash flows from operations | GAAP: $2.4 billion to $2.9 billion |
|||||||
| Capital expenditures | approximately $650 million | |||||||
| Humana Inc. Statistical Schedules and Supplementary Information 4Q24 Earnings Release | |||||
| (S-3) | Summary of Results - Consolidated and Segment Quarter and FY | ||||
| (S-4) | Consolidated Statements of Income - Quarter and FY | ||||
| (S-5) | Consolidated Balance Sheets | ||||
| (S-6) | Consolidated Statements of Cash Flows - FY | ||||
| (S-7) - (S-8) | Consolidating Statements of Income - Quarter | ||||
| (S-9) - (S-10) | Consolidating Statements of Income - FY | ||||
| (S-11) | Membership Detail | ||||
| (S-12) | Premiums and Services Revenue Detail | ||||
| (S-13) - (S-15) | CenterWell Segment - Pharmacy Solutions, Primary Care, & Home Solutions | ||||
| (S-16) | Footnotes | ||||
Humana Inc. Summary of Results ($ in millions, except per share amounts) |
4Q24 (a) | 4Q23 (a) | FY 2024 (a) | FY 2023 (a) | ||||||||||
| CONSOLIDATED | ||||||||||||||
| Revenues | $29,213 | $26,462 | $117,761 | $106,374 | ||||||||||
| Revenues - Adjusted (non-GAAP) | $29,199 | $25,734 | $117,210 | $102,645 | ||||||||||
| Pretax results | ($862) | ($591) | $1,721 | $3,383 | ||||||||||
| Pretax results - Adjusted (non-GAAP) | ($296) | $79 | $2,702 | $4,369 | ||||||||||
| (Net loss per share) EPS | ($5.76) | ($4.42) | $9.98 | $20.00 | ||||||||||
| (Net loss per share) EPS - Adjusted (non-GAAP) | ($2.16) | ($0.11) | $16.21 | $26.09 | ||||||||||
| Benefits expense ratio | 91.5 | % | 90.7 | % | 89.8 | % | 87.3 | % | ||||||
| Benefits expense ratio - Adjusted (non-GAAP) | 91.3 | % | 90.5 | % | 89.7 | % | 87.2 | % | ||||||
| Operating cost ratio | 14.4 | % | 14.6 | % | 11.8 | % | 12.5 | % | ||||||
| Operating cost ratio - Adjusted (non-GAAP) | 13.2 | % | 12.9 | % | 11.3 | % | 11.7 | % | ||||||
| Operating cash flows | $2,966 | $3,981 | ||||||||||||
| Parent company cash and short term investments | $562 | $510 | ||||||||||||
| Debt-to-total capitalization | 41.9 | % | 41.8 | % | ||||||||||
| Days in Claims Payable (DCP) | 37.8 | 41.4 | ||||||||||||
| INSURANCE SEGMENT | ||||||||||||||
| Revenues | $28,170 | $25,565 | $113,764 | $102,854 | ||||||||||
| Revenues - Adjusted (non-GAAP) | $28,156 | $24,801 | $113,213 | $99,090 | ||||||||||
| Benefits expense ratio | 92.1 | % | 91.5 | % | 90.4 | % | 88.0 | % | ||||||
| Benefits expense ratio - Adjusted (non-GAAP) | 91.9 | % | 91.4 | % | 90.3 | % | 88.0 | % | ||||||
| Operating cost ratio | 11.0 | % | 11.1 | % | 9.2 | % | 10.2 | % | ||||||
| Operating cost ratio - Adjusted (non-GAAP) | 11.0 | % | 10.9 | % | 9.2 | % | 9.8 | % | ||||||
| (Loss) income from operations | ($646) | ($426) | $1,289 | $2,654 | ||||||||||
| (Loss) income from operations - Adjusted (non-GAAP) | ($575) | ($361) | $1,483 | $2,897 | ||||||||||
| CENTERWELL SEGMENT | ||||||||||||||
| Revenues | $5,130 | $4,710 | $19,936 | $18,405 | ||||||||||
| Operating cost ratio | 92.5 | % | 90.6 | % | 92.2 | % | 91.2 | % | ||||||
| Income from operations | $327 | $387 | $1,329 | $1,404 | ||||||||||
| Income from operations - Adjusted (non-GAAP) (d) | $385 | $445 | $1,553 | $1,614 | ||||||||||
| For the three months ended December 31, |
For the year ended December 31, |
||||||||||||||||
| 2024 | 2023 | 2024 | 2023 | ||||||||||||||
| Revenues: | |||||||||||||||||
| Premiums | $ | 27,750 | $ | 25,128 | $ | 112,104 | $ | 101,272 | |||||||||
| Services | 1,166 | 1,040 | 4,431 | 4,033 | |||||||||||||
| Investment income | 297 | 294 | 1,226 | 1,069 | |||||||||||||
| Total revenues | 29,213 | 26,462 | 117,761 | 106,374 | |||||||||||||
| Operating expenses: | |||||||||||||||||
| Benefits | 25,381 | 22,782 | 100,664 | 88,394 | |||||||||||||
| Operating costs | 4,167 | 3,827 | 13,696 | 13,188 | |||||||||||||
| Depreciation and amortization | 208 | 201 | 839 | 779 | |||||||||||||
| Total operating expenses | 29,756 | 26,810 | 115,199 | 102,361 | |||||||||||||
| (Loss) income from operations | (543) | (348) | 2,562 | 4,013 | |||||||||||||
| Interest expense | 164 | 146 | 660 | 493 | |||||||||||||
| Other expense, net | 155 | 97 | 181 | 137 | |||||||||||||
| (Loss) income before income taxes and equity in net losses | (862) | (591) | 1,721 | 3,383 | |||||||||||||
| (Benefit) provision from income taxes | (216) | (75) | 413 | 836 | |||||||||||||
| Equity in net losses (A) | (37) | (24) | (94) | (63) | |||||||||||||
| Net (loss) income | (683) | (540) | 1,214 | 2,484 | |||||||||||||
| Net (income) loss attributable to noncontrolling interests | (10) | (1) | (7) | 5 | |||||||||||||
| Net (loss) income attributable to Humana | $ | (693) | $ | (541) | $ | 1,207 | $ | 2,489 | |||||||||
| Basic (loss) earnings per common share | $ | (5.76) | $ | (4.42) | $ | 10.01 | $ | 20.09 | |||||||||
| Diluted (loss) earnings per common share | $ | (5.76) | $ | (4.42) | $ | 9.98 | $ | 20.00 | |||||||||
| Shares used in computing basic earnings per common share (000’s) | 120,455 | 122,461 | 120,571 | 123,866 | |||||||||||||
| Shares used in computing diluted earnings (loss) per common share (000’s) | 120,455 | 122,461 | 120,869 | 124,441 | |||||||||||||
| December 31, | December 31, | |||||||
| 2024 | 2023 | |||||||
| Assets | ||||||||
| Current assets: | ||||||||
| Cash and cash equivalents | $ | 2,221 | $ | 4,694 | ||||
| Investment securities | 18,214 | 16,626 | ||||||
| Receivables, net | 2,704 | 2,035 | ||||||
| Other current assets | 6,676 | 6,631 | ||||||
| Total current assets | 29,815 | 29,986 | ||||||
| Property and equipment, net | 2,532 | 3,030 | ||||||
| Long-term investment securities | 421 | 382 | ||||||
| Equity method investments | 697 | 740 | ||||||
| Goodwill | 9,631 | 9,550 | ||||||
| Other long-term assets | 3,383 | 3,377 | ||||||
| Total assets | $ | 46,479 | $ | 47,065 | ||||
| Liabilities and Stockholders’ Equity | ||||||||
| Current liabilities: | ||||||||
| Benefits payable | $ | 10,440 | $ | 10,241 | ||||
| Trade accounts payable and accrued expenses | 5,259 | 6,569 | ||||||
| Book overdraft | 403 | 353 | ||||||
| Unearned revenues | 260 | 266 | ||||||
| Short-term debt | 577 | 1,443 | ||||||
| Total current liabilities | 16,939 | 18,872 | ||||||
| Long-term debt | 11,144 | 10,213 | ||||||
| Other long-term liabilities | 1,951 | 1,662 | ||||||
| Total liabilities | 30,034 | 30,747 | ||||||
| Commitments and contingencies | ||||||||
| Stockholders’ equity: | ||||||||
| Preferred stock, $1 par; 10,000,000 shares authorized, none issued | — | — | ||||||
| Common stock, $0.16 2/3 par; 300,000,000 shares authorized; 198,718,810 issued at December 31, 2024 | 33 | 33 | ||||||
| Capital in excess of par value | 3,463 | 3,346 | ||||||
| Retained earnings | 28,317 | 27,540 | ||||||
| Accumulated other comprehensive loss | (1,067) | (999) | ||||||
| Treasury stock, at cost, 78,077,195 shares at December 31, 2024 | (14,371) | (13,658) | ||||||
| Total stockholders’ equity | 16,375 | 16,262 | ||||||
| Noncontrolling interests | 70 | 56 | ||||||
| Total equity | 16,445 | 16,318 | ||||||
| Total liabilities and equity | $ | 46,479 | $ | 47,065 | ||||
| Debt-to-total capitalization ratio | 41.9 | % | 41.8 | % | ||||
| For the year ended December 31, | ||||||||
| 2024 | 2023 | |||||||
| Cash flows from operating activities | ||||||||
| Net income | $1,214 | $2,484 | ||||||
| Adjustments to reconcile net income to net cash provided by operating activities: | ||||||||
| (Gain) loss on investment securities, net | (24) | 54 | ||||||
| Equity in net losses | 94 | 63 | ||||||
| Stock-based compensation | 207 | 175 | ||||||
| Impairment of indefinite-lived intangible assets | 200 | 55 | ||||||
| Depreciation | 908 | 850 | ||||||
| Amortization | 60 | 67 | ||||||
| Impairment of property and equipment | 237 | 206 | ||||||
| Deferred income taxes | (192) | (167) | ||||||
| Changes in operating assets and liabilities, net of effect of businesses acquired and disposed: | ||||||||
| Receivables | (669) | (337) | ||||||
| Other assets | 1,003 | (1,318) | ||||||
| Benefits payable | 199 | 915 | ||||||
| Other liabilities | (373) | 841 | ||||||
| Unearned revenues | (6) | (20) | ||||||
| Other, net | 108 | 113 | ||||||
| Net cash provided by operating activities | 2,966 | 3,981 | ||||||
| Cash flows from investing activities | ||||||||
| Acquisitions, net of cash and cash equivalents acquired | (89) | (233) | ||||||
| Purchases of property and equipment | (575) | (1,004) | ||||||
| Proceeds from sale of property and equipment | 7 | 210 | ||||||
| Changes in securities lending collateral receivable | (418) | — | ||||||
| Purchases of investment securities | (8,185) | (7,552) | ||||||
| Maturities of investment securities | 2,982 | 1,292 | ||||||
| Proceeds from sales of investment securities | 3,376 | 3,795 | ||||||
| Other | (50) | — | ||||||
| Net cash used in investing activities | (2,952) | (3,492) | ||||||
| Cash flows from financing activities | ||||||||
| (Payments) receipts from contract deposits, net | (1,933) | 828 | ||||||
| Proceeds from issuance of senior notes, net | 2,232 | 2,544 | ||||||
| Repayments of senior notes | (1,107) | (1,832) | ||||||
| (Repayments) proceeds from issuance of commercial paper, net | (907) | 211 | ||||||
| Proceeds from short-term borrowings | — | 100 | ||||||
| Repayments of short-term borrowings | — | (100) | ||||||
| Repayment of term loan | — | (500) | ||||||
| Debt issue costs | (7) | (7) | ||||||
| Change in book overdraft | 50 | 55 | ||||||
| Common stock repurchases | (817) | (1,573) | ||||||
| Dividends paid | (431) | (431) | ||||||
| Change in securities lending payable | 418 | — | ||||||
| Change in rebate factor payable | 123 | — | ||||||
| Other, net | (108) | (151) | ||||||
| Net cash used in financing activities | (2,487) | (856) | ||||||
| Decrease in cash and cash equivalents | (2,473) | (367) | ||||||
| Cash and cash equivalents at beginning of period | 4,694 | 5,061 | ||||||
| Cash and cash equivalents at end of period | $2,221 | $4,694 | ||||||
| Insurance | CenterWell | Eliminations/ Corporate |
Consolidated | ||||||||||||||||||||
| Revenues—external customers Premiums: | |||||||||||||||||||||||
| Individual Medicare Advantage | $ | 21,500 | $ | — | $ | — | $ | 21,500 | |||||||||||||||
| Group Medicare Advantage | 1,891 | — | — | 1,891 | |||||||||||||||||||
| Medicare stand-alone PDP | 728 | — | — | 728 | |||||||||||||||||||
| Total Medicare | 24,119 | — | — | 24,119 | |||||||||||||||||||
| State-based contracts and other | 3,159 | — | — | 3,159 | |||||||||||||||||||
| Commercial fully-insured | 8 | — | — | 8 | |||||||||||||||||||
| Specialty benefits | 238 | — | — | 238 | |||||||||||||||||||
| Medicare Supplement | 226 | — | — | 226 | |||||||||||||||||||
| Total premiums | 27,750 | — | — | 27,750 | |||||||||||||||||||
| Services revenue: | |||||||||||||||||||||||
| Home solutions | — | 317 | — | 317 | |||||||||||||||||||
| Primary care | — | 366 | — | 366 | |||||||||||||||||||
| Pharmacy solutions | — | 232 | — | 232 | |||||||||||||||||||
| Military services and other | 245 | — | — | 245 | |||||||||||||||||||
| Commercial ASO | 6 | — | — | 6 | |||||||||||||||||||
| Total services revenue | 251 | 915 | — | 1,166 | |||||||||||||||||||
| Total revenues—external customers | 28,001 | 915 | — | 28,916 | |||||||||||||||||||
| Intersegment revenues | 1 | 4,215 | (4,216) | — | |||||||||||||||||||
| Investment income | 168 | — | 129 | 297 | |||||||||||||||||||
| Total revenues | 28,170 | 5,130 | (4,087) | 29,213 | |||||||||||||||||||
| Operating expenses: | |||||||||||||||||||||||
| Benefits | 25,547 | — | (166) | 25,381 | |||||||||||||||||||
| Operating costs | 3,089 | 4,745 | (3,667) | 4,167 | |||||||||||||||||||
| Depreciation and amortization | 180 | 58 | (30) | 208 | |||||||||||||||||||
| Total operating expenses | 28,816 | 4,803 | (3,863) | 29,756 | |||||||||||||||||||
| (Loss) income from operations | $ | (646) | $ | 327 | $ | (224) | $ | (543) | |||||||||||||||
| Benefit ratio | 92.1 | % | 91.5 | % | |||||||||||||||||||
| Operating cost ratio | 11.0 | % | 92.5 | % | 14.4 | % | |||||||||||||||||
| Insurance | CenterWell | Eliminations/ Corporate |
Consolidated | ||||||||||||||||||||
| Revenues—external customers Premiums: | |||||||||||||||||||||||
| Individual Medicare Advantage | $ | 19,642 | $ | — | $ | — | $ | 19,642 | |||||||||||||||
| Group Medicare Advantage | 1,677 | — | — | 1,677 | |||||||||||||||||||
| Medicare stand-alone PDP | 512 | — | — | 512 | |||||||||||||||||||
| Total Medicare | 21,831 | — | — | 21,831 | |||||||||||||||||||
| State-based contracts and other | 2,142 | — | — | 2,142 | |||||||||||||||||||
| Commercial fully-insured | 717 | — | — | 717 | |||||||||||||||||||
| Specialty benefits | 249 | — | — | 249 | |||||||||||||||||||
Medicare Supplement |
189 | — | — | 189 | |||||||||||||||||||
| Total premiums | 25,128 | — | — | 25,128 | |||||||||||||||||||
| Services revenue: | |||||||||||||||||||||||
| Home solutions | — | 345 | — | 345 | |||||||||||||||||||
| Primary care | — | 237 | — | 237 | |||||||||||||||||||
| Pharmacy solutions | — | 188 | — | 188 | |||||||||||||||||||
| Military services and other | 223 | — | — | 223 | |||||||||||||||||||
| Commercial ASO | 47 | — | — | 47 | |||||||||||||||||||
| Total services revenue | 270 | 770 | — | 1,040 | |||||||||||||||||||
| Total revenues—external customers | 25,398 | 770 | — | 26,168 | |||||||||||||||||||
| Intersegment revenues | 1 | 3,940 | (3,941) | — | |||||||||||||||||||
| Investment income | 166 | — | 128 | 294 | |||||||||||||||||||
| Total revenues | 25,565 | 4,710 | (3,813) | 26,462 | |||||||||||||||||||
| Operating expenses: | |||||||||||||||||||||||
| Benefits | 23,004 | — | (222) | 22,782 | |||||||||||||||||||
| Operating costs | 2,811 | 4,265 | (3,249) | 3,827 | |||||||||||||||||||
| Depreciation and amortization | 176 | 58 | (33) | 201 | |||||||||||||||||||
| Total operating expenses | 25,991 | 4,323 | (3,504) | 26,810 | |||||||||||||||||||
| (Loss) income from operations | $ | (426) | $ | 387 | $ | (309) | $ | (348) | |||||||||||||||
| Benefit ratio | 91.5 | % | 90.7 | % | |||||||||||||||||||
| Operating cost ratio | 11.1 | % | 90.6 | % | 14.6 | % | |||||||||||||||||
| Insurance | CenterWell | Eliminations/ Corporate |
Consolidated | ||||||||||||||||||||
| Revenues—external customers Premiums: | |||||||||||||||||||||||
| Individual Medicare Advantage | $ | 88,019 | $ | — | $ | — | $ | 88,019 | |||||||||||||||
| Group Medicare Advantage | 7,731 | — | — | 7,731 | |||||||||||||||||||
| Medicare stand-alone PDP | 3,137 | — | — | 3,137 | |||||||||||||||||||
| Total Medicare | 98,887 | — | — | 98,887 | |||||||||||||||||||
| State-based contracts and other | 10,915 | — | — | 10,915 | |||||||||||||||||||
| Commercial fully-insured | 501 | — | — | 501 | |||||||||||||||||||
| Specialty benefits | 955 | — | — | 955 | |||||||||||||||||||
| Medicare Supplement | 846 | — | — | 846 | |||||||||||||||||||
| Total premiums | 112,104 | — | — | 112,104 | |||||||||||||||||||
| Services revenue: | |||||||||||||||||||||||
| Home solutions | — | 1,313 | — | 1,313 | |||||||||||||||||||
| Primary care | — | 1,248 | — | 1,248 | |||||||||||||||||||
| Pharmacy solutions | — | 904 | — | 904 | |||||||||||||||||||
| Military services and other | 916 | — | — | 916 | |||||||||||||||||||
| Commercial ASO | 50 | — | — | 50 | |||||||||||||||||||
| Total services revenue | 966 | 3,465 | — | 4,431 | |||||||||||||||||||
| Total revenues—external customers | 113,070 | 3,465 | — | 116,535 | |||||||||||||||||||
| Intersegment revenues | 4 | 16,471 | (16,475) | — | |||||||||||||||||||
| Investment income | 690 | — | 536 | 1,226 | |||||||||||||||||||
| Total revenues | 113,764 | 19,936 | (15,939) | 117,761 | |||||||||||||||||||
| Operating expenses: | |||||||||||||||||||||||
| Benefits | 101,299 | — | (635) | 100,664 | |||||||||||||||||||
| Operating costs | 10,443 | 18,383 | (15,130) | 13,696 | |||||||||||||||||||
| Depreciation and amortization | 733 | 224 | (118) | 839 | |||||||||||||||||||
| Total operating expenses | 112,475 | 18,607 | (15,883) | 115,199 | |||||||||||||||||||
| Income (loss) from operations | $ | 1,289 | $ | 1,329 | $ | (56) | $ | 2,562 | |||||||||||||||
| Benefit ratio | 90.4 | % | 89.8 | % | |||||||||||||||||||
| Operating cost ratio | 9.2 | % | 92.2 | % | 11.8 | % | |||||||||||||||||
| Insurance | CenterWell | Eliminations/ Corporate |
Consolidated | |||||||||||||||||||||||
| Revenues—external customers Premiums: | ||||||||||||||||||||||||||
| Individual Medicare Advantage | $ | 78,837 | $ | — | $ | — | $ | 78,837 | ||||||||||||||||||
| Group Medicare Advantage | 6,869 | — | — | 6,869 | ||||||||||||||||||||||
| Medicare stand-alone PDP | 2,189 | — | — | 2,189 | ||||||||||||||||||||||
| Total Medicare | 87,895 | — | — | 87,895 | ||||||||||||||||||||||
| State-based contracts and other | 8,108 | — | — | 8,108 | ||||||||||||||||||||||
| Commercial fully-insured | 3,527 | — | — | 3,527 | ||||||||||||||||||||||
| Specialty benefits | 1,007 | — | — | 1,007 | ||||||||||||||||||||||
| Medicare Supplement | 735 | — | — | 735 | ||||||||||||||||||||||
| Total premiums | 101,272 | — | — | 101,272 | ||||||||||||||||||||||
| Services revenue: | ||||||||||||||||||||||||||
| Home solutions | — | 1,342 | — | 1,342 | ||||||||||||||||||||||
| Primary care | — | 842 | — | 842 | ||||||||||||||||||||||
| Pharmacy solutions | — | 849 | — | 849 | ||||||||||||||||||||||
| Military services and other | 763 | — | — | 763 | ||||||||||||||||||||||
| Commercial ASO | 237 | — | — | 237 | ||||||||||||||||||||||
| Total services revenue | 1,000 | 3,033 | — | 4,033 | ||||||||||||||||||||||
| Total revenues—external customers | 102,272 | 3,033 | — | 105,305 | ||||||||||||||||||||||
| Intersegment revenues | 31 | 15,372 | (15,403) | — | ||||||||||||||||||||||
| Investment income | 551 | — | 518 | 1,069 | ||||||||||||||||||||||
| Total revenues | 102,854 | 18,405 | (14,885) | 106,374 | ||||||||||||||||||||||
| Operating expenses: | ||||||||||||||||||||||||||
| Benefits | 89,100 | — | (706) | 88,394 | ||||||||||||||||||||||
| Operating costs | 10,408 | 16,791 | (14,011) | 13,188 | ||||||||||||||||||||||
| Depreciation and amortization | 692 | 210 | (123) | 779 | ||||||||||||||||||||||
| Total operating expenses | 100,200 | 17,001 | (14,840) | 102,361 | ||||||||||||||||||||||
| Income (loss) from operations | $ | 2,654 | $ | 1,404 | $ | (45) | $ | 4,013 | ||||||||||||||||||
| Benefit ratio | 88.0 | % | 87.3 | % | ||||||||||||||||||||||
| Operating cost ratio | 10.2 | % | 91.2 | % | 12.5 | % | ||||||||||||||||||||
| December 31, 2024 | Average 4Q24 | December 31, 2023 | September 30, 2024 | |||||||||||||||||
| Medical Membership: | ||||||||||||||||||||
| Individual Medicare Advantage* | 5,661.8 | 5,670.2 | 5,408.9 | 5,659.2 | ||||||||||||||||
| Group Medicare Advantage | 545.7 | 546.1 | 509.6 | 546.7 | ||||||||||||||||
| Total Medicare Advantage | 6,207.5 | 6,216.3 | 5,918.5 | 6,205.9 | ||||||||||||||||
| Medicare stand-alone PDP | 2,288.2 | 2,297.5 | 2,849.1 | 2,315.7 | ||||||||||||||||
| Total Medicare | 8,495.7 | 8,513.8 | 8,767.6 | 8,521.6 | ||||||||||||||||
| Medicare Supplement | 377.3 | 370.2 | 307.2 | 357.3 | ||||||||||||||||
| State-based contracts and other | 1,459.9 | 1,455.1 | 1,228.8 | 1,446.1 | ||||||||||||||||
| Military services | 6,009.1 | 5,995.3 | 5,960.2 | 5,984.8 | ||||||||||||||||
| Total excluding employer group commercial medical | 16,342.0 | 16,334.4 | 16,263.8 | 16,309.8 | ||||||||||||||||
| Fully-insured commercial medical | 0.3 | 5.8 | 338.7 | 25.9 | ||||||||||||||||
| ASO commercial | 4.8 | 7.2 | 255.3 | 22.4 | ||||||||||||||||
| Total employer group commercial medical | 5.1 | 13.0 | 594.0 | 48.3 | ||||||||||||||||
| Total Medical Membership | 16,347.1 | 16,347.4 | 16,857.8 | 16,358.1 | ||||||||||||||||
| Specialty Membership: | ||||||||||||||||||||
| Dental—fully-insured (B) | 2,054.5 | 2,058.1 | 2,205.0 | 2,070.6 | ||||||||||||||||
| Dental—ASO | 301.3 | 301.2 | 307.0 | 291.3 | ||||||||||||||||
| Total Dental | 2,355.8 | 2,359.3 | 2,512.0 | 2,361.9 | ||||||||||||||||
| Vision | 1,843.6 | 1,842.0 | 1,971.4 | 1,846.5 | ||||||||||||||||
| Other supplemental benefits | 362.6 | 360.4 | 384.9 | 358.4 | ||||||||||||||||
| Total Specialty Membership | 4,562.0 | 4,561.7 | 4,868.3 | 4,566.8 | ||||||||||||||||
| December 31, 2024 | Member Mix December 31, 2024 |
December 31, 2023 | Member Mix December 31, 2023 |
|||||||||||||||||
| Individual Medicare Advantage Membership | ||||||||||||||||||||
| HMO | 2,857.7 | 50 | % | 2,853.0 | 53 | % | ||||||||||||||
| PPO/PFFS | 2,804.1 | 50 | % | 2,555.9 | 47 | % | ||||||||||||||
Total Individual Medicare Advantage |
5,661.8 | 100 | % | 5,408.9 | 100 | % | ||||||||||||||
| Individual Medicare Advantage Membership | ||||||||||||||||||||
| Shared Risk (C) | 2,114.9 | 38 | % | 1,917.3 | 36 | % | ||||||||||||||
| Path to Risk (D) | 1,879.4 | 33 | % | 1,847.0 | 34 | % | ||||||||||||||
| Total Value-based | 3,994.3 | 71 | % | 3,764.3 | 70 | % | ||||||||||||||
| Other | 1,667.5 | 29 | % | 1,644.6 | 30 | % | ||||||||||||||
| Total Individual Medicare Advantage | 5,661.8 | 100 | % | 5,408.9 | 100 | % | ||||||||||||||
| For the three months ended December 31, |
For the year ended December 31, |
Per Member per Month (I) For the three months ended December 31, |
Per Member per Month (I) For the year ended December 31, |
|||||||||||||||||||||||||||||
| 2024 | 2023 | 2024 | 2023 | 2024 | 2023 | 2024 | 2023 | |||||||||||||||||||||||||
| Insurance | ||||||||||||||||||||||||||||||||
| Individual Medicare Advantage | $ | 21,500 | $ | 19,642 | $ | 88,019 | $ | 78,837 | $ | 1,264 | $ | 1,210 | $ | 1,307 | $ | 1,246 | ||||||||||||||||
| Group Medicare Advantage | 1,891 | 1,677 | 7,731 | 6,869 | 1,154 | 1,096 | 1,176 | 1,121 | ||||||||||||||||||||||||
| Medicare stand-alone PDP | 728 | 512 | 3,137 | 2,189 | 106 | 60 | 112 | 63 | ||||||||||||||||||||||||
| State-based contracts and other (E) | 3,159 | 2,142 | 10,915 | 8,108 | 699 | 560 | 627 | 496 | ||||||||||||||||||||||||
| Commercial fully-insured (F) | 8 | 717 | 501 | 3,527 | 345 | 570 | 563 | 556 | ||||||||||||||||||||||||
| Specialty benefits (G) | 238 | 249 | 955 | 1,007 | 19 | 18 | 18 | 18 | ||||||||||||||||||||||||
| Medicare Supplement | 226 | 189 | 846 | 735 | 203 | 207 | 205 | 206 | ||||||||||||||||||||||||
| Military and other (H) | 246 | 224 | 920 | 794 | ||||||||||||||||||||||||||||
| Commercial ASO | 6 | 47 | 50 | 237 | ||||||||||||||||||||||||||||
| Total | 28,002 | 25,399 | 113,074 | 102,303 | ||||||||||||||||||||||||||||
| CenterWell | ||||||||||||||||||||||||||||||||
| Pharmacy solutions | 2,993 | 2,791 | 11,628 | 11,300 | ||||||||||||||||||||||||||||
| Primary care | 1,279 | 1,073 | 4,945 | 4,174 | ||||||||||||||||||||||||||||
| Home solutions | 858 | 846 | 3,363 | 2,931 | ||||||||||||||||||||||||||||
| Total | 5,130 | 4,710 | 19,936 | 18,405 | ||||||||||||||||||||||||||||
| For the three months ended December 31, 2024 |
For the three months ended December 31, 2023 |
For the three months ended September 30, 2024 |
||||||||||||||||||
| Generic Dispense Rate | ||||||||||||||||||||
| Total Medicare | 90.9 | % | 91.8 | % | 90.8 | % | ||||||||||||||
| Mail-Order Penetration | ||||||||||||||||||||
| Total Medicare | 27.6 | % | 29.0 | % | 28.1 | % | ||||||||||||||
| For the year ended December 31, 2024 |
For the year ended December 31, 2023 |
|||||||||||||||||||
| Generic Dispense Rate | ||||||||||||||||||||
| Total Medicare | 91.0 | % | 91.4 | % | ||||||||||||||||
| Mail-Order Penetration | ||||||||||||||||||||
| Total Medicare | 28.3 | % | 29.7 | % | ||||||||||||||||
| As of December 31, 2024 | As of December 31, 2023 | Year-over-Year Growth | |||||||||||||||||||||||||||||||||
| Primary | Primary | Primary | |||||||||||||||||||||||||||||||||
| Center | Care | Patients | Center | Care | Patients | Center | Care | Patients | |||||||||||||||||||||||||||
| Count | Providers | Served (K) | Count | Providers | Served (K) | Count | Providers | Served | |||||||||||||||||||||||||||
| De novo | 133 | 327 | 79,400 | 108 | 274 | 43,100 | 23.1 | % | 19.3 | % | 84.2 | % | |||||||||||||||||||||||
| Wholly-owned | 211 | 675 | 246,500 | 188 | 617 | 189,600 | 12.2 | % | 9.4 | % | 30.0 | % | |||||||||||||||||||||||
| Independent Physician Associations | 64,600 | 61,500 | 5.0 | % | |||||||||||||||||||||||||||||||
| 344 | 1,002 | 390,500 | 296 | 891 | 294,200 | 16.2 | % | 12.5 | % | 32.7 | % | ||||||||||||||||||||||||
| As of September 30, 2024 | Sequential Growth | |||||||||||||||||||||||||
| Primary | Primary | |||||||||||||||||||||||||
| Center | Care | Patients | Center | Care | Patients | |||||||||||||||||||||
| Count | Providers | Served (K) | Count | Providers | Served | |||||||||||||||||||||
| De novo | 120 | 295 | 64,100 | 10.8 | % | 10.8 | % | 23.9 | % | |||||||||||||||||
| Wholly-owned | 181 | 658 | 217,300 | 16.6 | % | 2.6 | % | 13.4 | % | |||||||||||||||||
| Independent Physician Associations | 62,800 | 2.9 | % | |||||||||||||||||||||||
| 301 | 953 | 344,200 | 14.3 | % | 5.1 | % | 13.5 | % | ||||||||||||||||||
| For the three months ended December 31, 2024 |
For the three months ended December 31, 2023 |
Year-over-Year Growth | |||||||||
| Episodic Admissions (L) | 77,429 | 75,921 | 2.0 | % | |||||||
| Total Admissions - Same Store (M) | 100,580 | 97,363 | 3.3 | % | |||||||
| For the year ended December 31, 2024 |
For the year ended December 31, 2023 |
Year-over-Year Growth | |||||||||
| Episodic Admissions (L) | 321,862 | 301,642 | 6.7 | % | |||||||
| Total Admissions - Same Store (M) | 416,133 | 384,552 | 8.2 | % | |||||||