Document
Exhibit 99.1

|
|
|
|
|
|
|
|
|
| 11011 Sunset Hills Road |
|
|
| Reston, Virginia 20190 |
|
News |
| www.gd.com |
|
Contact: Jeff A. Davis
Tel: 703 876 3483
press@generaldynamics.com
General Dynamics Reports Third-Quarter 2023 Financial Results
October 25, 2023
•Revenue $10.6 billion, up 6% year over year
•Net earnings $836 million, diluted EPS $3.04
•$1.3 billion net cash provided by operating activities
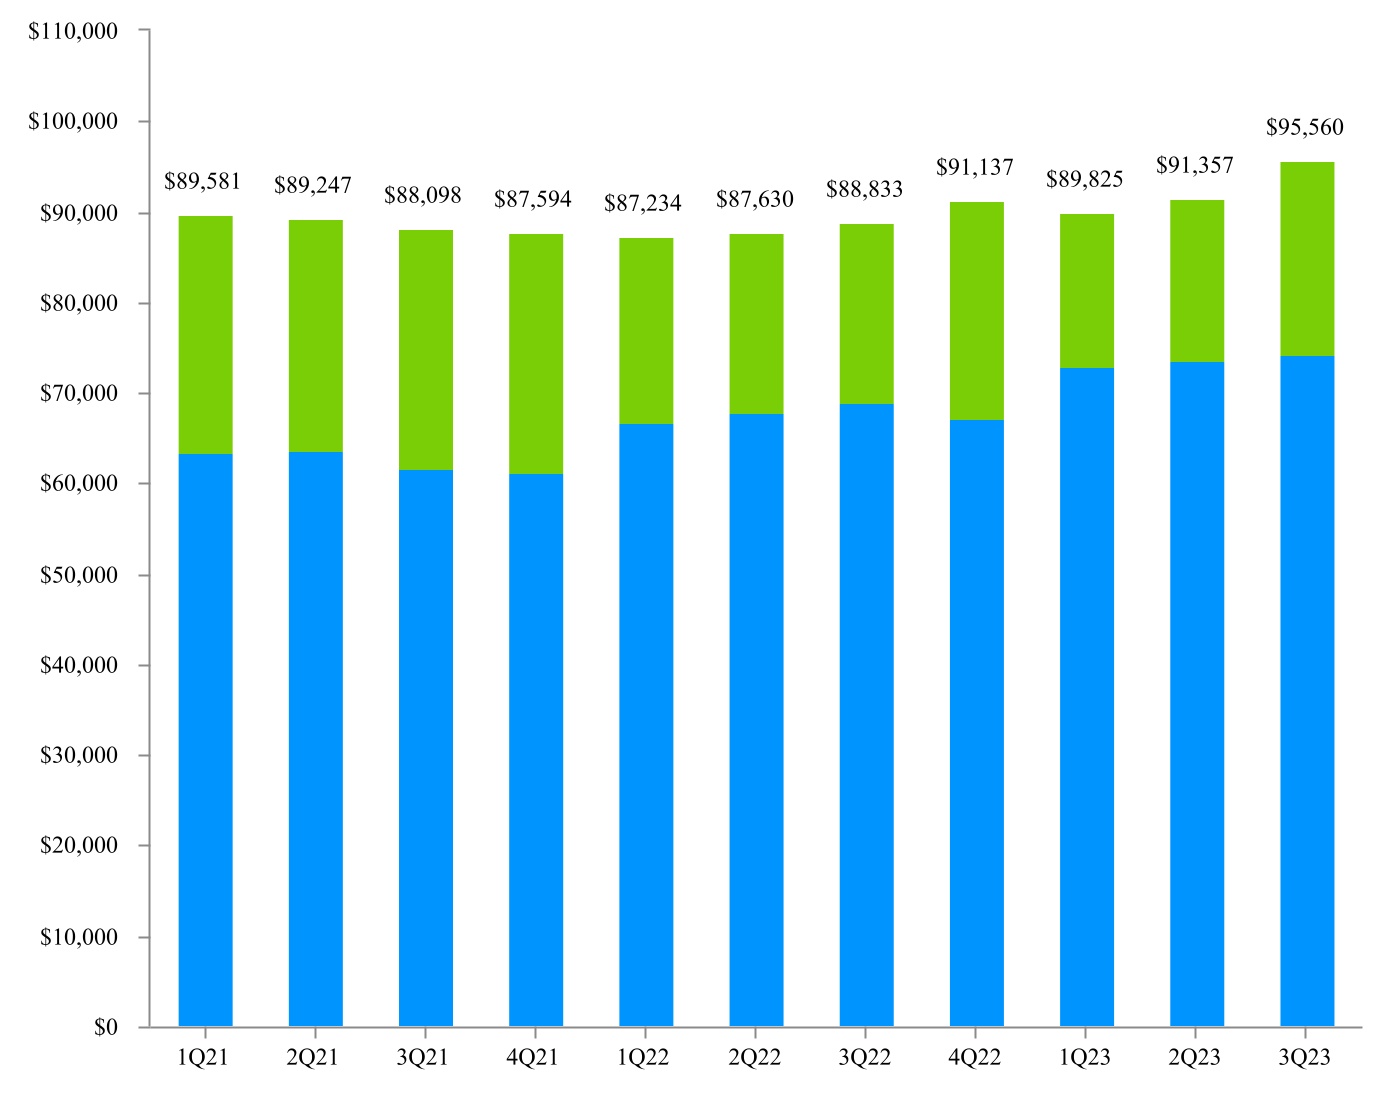
•Record-high $95.6 billion backlog, 1.4-to-1 book-to-bill
RESTON, Va. – General Dynamics (NYSE: GD) today reported third-quarter 2023 net earnings of $836 million on revenue of $10.6 billion. Diluted earnings per share (EPS) were $3.04.
“We continue to see strong demand and steady revenue growth across the business, resulting in significant growth in backlog,” said Phebe N. Novakovic, chairman and chief executive officer. “Both operating earnings and net earnings increased over last quarter, and cash from operations was a highlight.”
Cash
Net cash provided by operating activities in the quarter totaled $1.3 billion, or 158% of net earnings. After $227 million in capital expenditures, the company generated free cash flow from operations of $1.1 billion, or 131% of net earnings. During the quarter, the company repaid $500 million in fixed-rate notes, paid $363 million in dividends, and used $56 million to repurchase shares.
Backlog
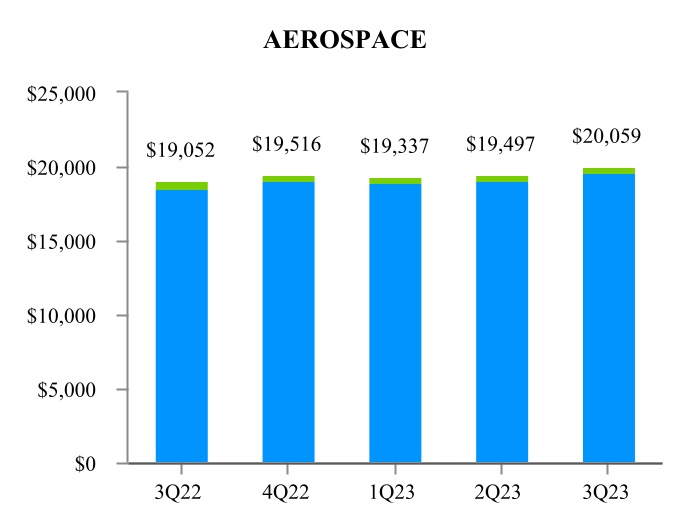
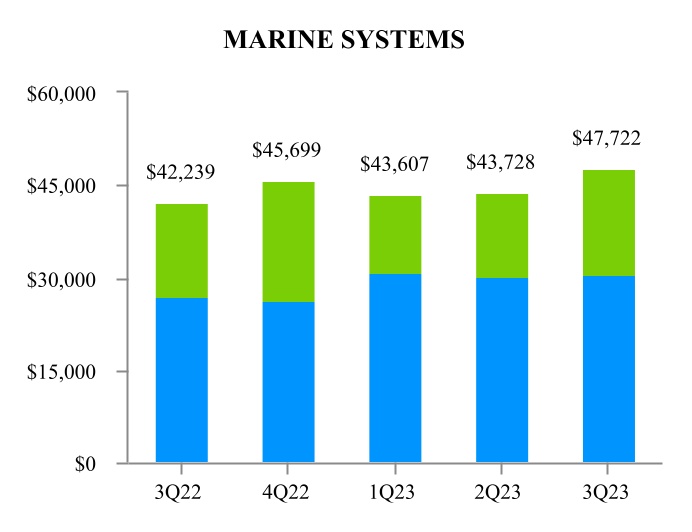
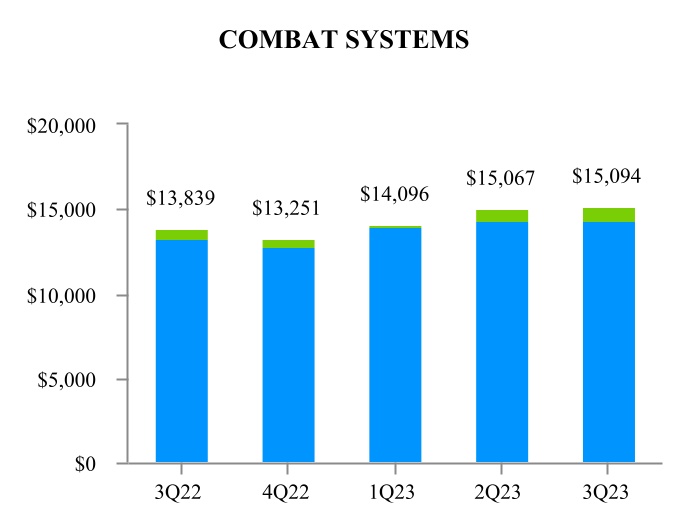
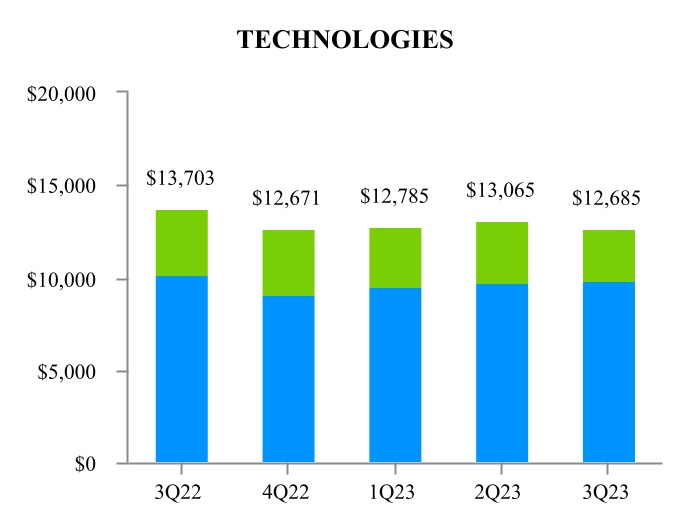
Orders remained strong across the company with a consolidated book-to-bill ratio, defined as orders divided by revenue, of 1.4-to-1 for the quarter, with particular strength in the Marine Systems and Aerospace segments. Company-wide backlog of $95.6 billion was the highest in the company’s history. Estimated potential contract value, which represents management’s estimate of additional value in unfunded indefinite delivery, indefinite quantity (IDIQ) contracts and unexercised options, was $37.3 billion. Total estimated contract value, the sum of all backlog components, was $132.9 billion at the end of the quarter.
Aerospace received $2.9 billion in new orders during the quarter, growing backlog to $20.1 billion.
Significant awards in the quarter for the three defense segments included a U.S. Navy contract for an undisclosed amount for construction of three Flight III Arleigh Burke-class guided-missile destroyers; $1.5 billion in contracts for Virginia-class submarine lead yard services, development studies and design efforts, as well as spare parts for maintenance availabilities; $140 million, with a maximum potential value of $1.3 billion, for Columbia-class submarine advanced nuclear plant studies (ANPS); $1.1 billion, with maximum potential value up to $1.9 billion, for munitions, ordnance, and the establishment of additional production capacity; a Department of Homeland Security contract with maximum potential value of $710 million to continue infrastructure modernization of its St. Elizabeth’s campus in Washington, D.C.; and $365 million, with maximum potential value of $775 million, for several key contracts for classified customers.
About General Dynamics
Headquartered in Reston, Virginia, General Dynamics is a global aerospace and defense company that offers a broad portfolio of products and services in business aviation; ship construction and repair; land combat vehicles, weapons systems and munitions; and technology products and services. General Dynamics employs more than 100,000 people worldwide and generated $39.4 billion in revenue in 2022. More information is available at GD.com.
WEBCAST INFORMATION: General Dynamics will webcast its third-quarter 2023 financial results conference call today at 9 a.m. EDT. The webcast will be a listen-only audio event available at GD.com. An on-demand replay of the webcast will be available by telephone two hours after the end of the call through November 1, 2023, at 800-770-2030 (international: +1 647-362-9199), conference ID 4299949. Charts furnished to investors and securities analysts in connection with the announcement of financial results are available at GD.com.
This press release contains forward-looking statements (FLS), including statements about the company’s future operational and financial performance, which are based on management’s expectations, estimates, projections and assumptions. Words such as “expects,” “anticipates,” “plans,” “believes,” “forecasts,” “scheduled,” “outlook,” “estimates,” “should” and variations of these words and similar expressions are intended to identify FLS. In making FLS, we rely on assumptions and analyses based on our experience and perception of historical trends; current conditions and expected future developments; and other factors, estimates and judgments we consider reasonable and appropriate based on information available to us at the time. FLS are made pursuant to the safe harbor provisions of the Private Securities Litigation Reform Act of 1995, as amended. FLS are not guarantees of future performance and involve factors, risks and uncertainties that are difficult to predict. Actual future results and trends may differ materially from what is forecast in the FLS. All FLS speak only as of the date they were made. We do not undertake any obligation to update or publicly release revisions to FLS to reflect events, circumstances or changes in expectations after the date of this press release. Additional information regarding these factors is contained in the company’s filings with the SEC, and these factors may be revised or supplemented in future SEC filings. In addition, this press release contains some financial measures not prepared in accordance with U.S. generally accepted accounting principles (GAAP). While we believe these non-GAAP metrics provide useful information for investors, there are limitations associated with their use, and our calculations of these metrics may not be comparable to similarly titled measures of other companies. Non-GAAP metrics should not be considered in isolation from, or as a substitute for, GAAP measures. Reconciliations to comparable GAAP measures and other information relating to our non-GAAP measures are included in other filings with the SEC, which are available at investorrelations.gd.com.
EXHIBIT A
CONSOLIDATED STATEMENT OF EARNINGS - (UNAUDITED)
DOLLARS IN MILLIONS, EXCEPT PER SHARE AMOUNTS
|
|
|
|
|
|
|
|
|
|
|
|
|
|
|
|
|
|
|
|
|
|
|
|
| |
Three Months Ended |
|
Variance |
| |
October 1, 2023 |
|
October 2, 2022 |
|
$ |
|
% |
| Revenue |
$ |
10,571 |
|
|
$ |
9,975 |
|
|
$ |
596 |
|
|
6.0 |
% |
| Operating costs and expenses |
(9,514) |
|
|
(8,877) |
|
|
(637) |
|
|
|
| Operating earnings |
1,057 |
|
|
1,098 |
|
|
(41) |
|
|
(3.7) |
% |
| Other, net |
19 |
|
|
41 |
|
|
(22) |
|
|
|
| Interest, net |
(85) |
|
|
(86) |
|
|
1 |
|
|
|
| Earnings before income tax |
991 |
|
|
1,053 |
|
|
(62) |
|
|
(5.9) |
% |
| Provision for income tax, net |
(155) |
|
|
(151) |
|
|
(4) |
|
|
|
| Net earnings |
$ |
836 |
|
|
$ |
902 |
|
|
$ |
(66) |
|
|
(7.3) |
% |
| Earnings per share—basic |
$ |
3.07 |
|
|
$ |
3.29 |
|
|
$ |
(0.22) |
|
|
(6.7) |
% |
| Basic weighted average shares outstanding |
272.6 |
|
|
273.9 |
|
|
|
|
|
| Earnings per share—diluted |
$ |
3.04 |
|
|
$ |
3.26 |
|
|
$ |
(0.22) |
|
|
(6.7) |
% |
| Diluted weighted average shares outstanding |
274.7 |
|
|
276.4 |
|
|
|
|
|
EXHIBIT B
CONSOLIDATED STATEMENT OF EARNINGS - (UNAUDITED)
DOLLARS IN MILLIONS, EXCEPT PER SHARE AMOUNTS
|
|
|
|
|
|
|
|
|
|
|
|
|
|
|
|
|
|
|
|
|
|
|
|
| |
Nine Months Ended |
|
Variance |
| |
October 1, 2023 |
|
October 2, 2022 |
|
$ |
|
% |
| Revenue |
$ |
30,604 |
|
|
$ |
28,556 |
|
|
$ |
2,048 |
|
|
7.2 |
% |
| Operating costs and expenses |
(27,647) |
|
|
(25,572) |
|
|
(2,075) |
|
|
|
| Operating earnings |
2,957 |
|
|
2,984 |
|
|
(27) |
|
|
(0.9) |
% |
| Other, net |
65 |
|
|
120 |
|
|
(55) |
|
|
|
| Interest, net |
(265) |
|
|
(279) |
|
|
14 |
|
|
|
| Earnings before income tax |
2,757 |
|
|
2,825 |
|
|
(68) |
|
|
(2.4) |
% |
| Provision for income tax, net |
(447) |
|
|
(427) |
|
|
(20) |
|
|
|
| Net earnings |
$ |
2,310 |
|
|
$ |
2,398 |
|
|
$ |
(88) |
|
|
(3.7) |
% |
| Earnings per share—basic |
$ |
8.45 |
|
|
$ |
8.70 |
|
|
$ |
(0.25) |
|
|
(2.9) |
% |
| Basic weighted average shares outstanding |
273.2 |
|
|
275.8 |
|
|
|
|
|
| Earnings per share—diluted |
$ |
8.39 |
|
|
$ |
8.61 |
|
|
$ |
(0.22) |
|
|
(2.6) |
% |
| Diluted weighted average shares outstanding |
275.4 |
|
|
278.4 |
|
|
|
|
|
EXHIBIT C
REVENUE AND OPERATING EARNINGS BY SEGMENT - (UNAUDITED)
DOLLARS IN MILLIONS
|
|
|
|
|
|
|
|
|
|
|
|
|
|
|
|
|
|
|
|
|
|
|
|
| |
Three Months Ended |
|
Variance |
| |
October 1, 2023 |
|
October 2, 2022 |
|
$ |
|
% |
| Revenue: |
|
|
|
|
|
|
|
| Aerospace |
$ |
2,032 |
|
|
$ |
2,347 |
|
|
$ |
(315) |
|
|
(13.4) |
% |
| Marine Systems |
3,002 |
|
|
2,769 |
|
|
233 |
|
|
8.4 |
% |
| Combat Systems |
2,224 |
|
|
1,788 |
|
|
436 |
|
|
24.4 |
% |
| Technologies |
3,313 |
|
|
3,071 |
|
|
242 |
|
|
7.9 |
% |
| Total |
$ |
10,571 |
|
|
$ |
9,975 |
|
|
$ |
596 |
|
|
6.0 |
% |
| Operating earnings: |
|
|
|
|
|
|
|
| Aerospace |
$ |
268 |
|
|
$ |
312 |
|
|
$ |
(44) |
|
|
(14.1) |
% |
| Marine Systems |
211 |
|
|
238 |
|
|
(27) |
|
|
(11.3) |
% |
| Combat Systems |
300 |
|
|
271 |
|
|
29 |
|
|
10.7 |
% |
| Technologies |
315 |
|
|
285 |
|
|
30 |
|
|
10.5 |
% |
| Corporate |
(37) |
|
|
(8) |
|
|
(29) |
|
|
(362.5) |
% |
| Total |
$ |
1,057 |
|
|
$ |
1,098 |
|
|
$ |
(41) |
|
|
(3.7) |
% |
| Operating margin: |
|
|
|
|
|
|
|
| Aerospace |
13.2 |
% |
|
13.3 |
% |
|
|
|
|
| Marine Systems |
7.0 |
% |
|
8.6 |
% |
|
|
|
|
| Combat Systems |
13.5 |
% |
|
15.2 |
% |
|
|
|
|
| Technologies |
9.5 |
% |
|
9.3 |
% |
|
|
|
|
| Total |
10.0 |
% |
|
11.0 |
% |
|
|
|
|
EXHIBIT D
REVENUE AND OPERATING EARNINGS BY SEGMENT - (UNAUDITED)
DOLLARS IN MILLIONS
|
|
|
|
|
|
|
|
|
|
|
|
|
|
|
|
|
|
|
|
|
|
|
|
| |
Nine Months Ended |
|
Variance |
| |
October 1, 2023 |
|
October 2, 2022 |
|
$ |
|
% |
| Revenue: |
|
|
|
|
|
|
|
| Aerospace |
$ |
5,877 |
|
|
$ |
6,117 |
|
|
$ |
(240) |
|
|
(3.9) |
% |
| Marine Systems |
9,053 |
|
|
8,071 |
|
|
982 |
|
|
12.2 |
% |
| Combat Systems |
5,904 |
|
|
5,129 |
|
|
775 |
|
|
15.1 |
% |
| Technologies |
9,770 |
|
|
9,239 |
|
|
531 |
|
|
5.7 |
% |
| Total |
$ |
30,604 |
|
|
$ |
28,556 |
|
|
$ |
2,048 |
|
|
7.2 |
% |
| Operating earnings: |
|
|
|
|
|
|
|
| Aerospace |
$ |
733 |
|
|
$ |
793 |
|
|
$ |
(60) |
|
|
(7.6) |
% |
| Marine Systems |
657 |
|
|
660 |
|
|
(3) |
|
|
(0.5) |
% |
| Combat Systems |
796 |
|
|
743 |
|
|
53 |
|
|
7.1 |
% |
| Technologies |
897 |
|
|
887 |
|
|
10 |
|
|
1.1 |
% |
| Corporate |
(126) |
|
|
(99) |
|
|
(27) |
|
|
(27.3) |
% |
| Total |
$ |
2,957 |
|
|
$ |
2,984 |
|
|
$ |
(27) |
|
|
(0.9) |
% |
| Operating margin: |
|
|
|
|
|
|
|
| Aerospace |
12.5 |
% |
|
13.0 |
% |
|
|
|
|
| Marine Systems |
7.3 |
% |
|
8.2 |
% |
|
|
|
|
| Combat Systems |
13.5 |
% |
|
14.5 |
% |
|
|
|
|
| Technologies |
9.2 |
% |
|
9.6 |
% |
|
|
|
|
| Total |
9.7 |
% |
|
10.4 |
% |
|
|
|
|
EXHIBIT E
CONSOLIDATED BALANCE SHEET
DOLLARS IN MILLIONS
|
|
|
|
|
|
|
|
|
|
|
|
|
(Unaudited) |
|
|
|
October 1, 2023 |
|
December 31, 2022 |
| ASSETS |
|
|
|
| Current assets: |
|
|
|
| Cash and equivalents |
$ |
1,352 |
|
|
$ |
1,242 |
|
| Accounts receivable |
3,132 |
|
|
3,008 |
|
| Unbilled receivables |
8,453 |
|
|
8,795 |
|
| Inventories |
8,282 |
|
|
6,322 |
|
| Other current assets |
1,560 |
|
|
1,696 |
|
| Total current assets |
22,779 |
|
|
21,063 |
|
| Noncurrent assets: |
|
|
|
| Property, plant and equipment, net |
6,013 |
|
|
5,900 |
|
| Intangible assets, net |
1,681 |
|
|
1,824 |
|
| Goodwill |
20,386 |
|
|
20,334 |
|
| Other assets |
2,666 |
|
|
2,464 |
|
| Total noncurrent assets |
30,746 |
|
|
30,522 |
|
| Total assets |
$ |
53,525 |
|
|
$ |
51,585 |
|
| LIABILITIES AND SHAREHOLDERS’ EQUITY |
|
|
|
| Current liabilities: |
|
|
|
| Short-term debt and current portion of long-term debt |
$ |
7 |
|
|
$ |
1,253 |
|
| Accounts payable |
3,315 |
|
|
3,398 |
|
| Customer advances and deposits |
9,351 |
|
|
7,436 |
|
| Other current liabilities |
3,289 |
|
|
3,254 |
|
| Total current liabilities |
15,962 |
|
|
15,341 |
|
| Noncurrent liabilities: |
|
|
|
| Long-term debt |
9,248 |
|
|
9,243 |
|
| Other liabilities |
8,358 |
|
|
8,433 |
|
| Total noncurrent liabilities |
17,606 |
|
|
17,676 |
|
| Shareholders’ equity: |
|
|
|
| Common stock |
482 |
|
|
482 |
|
| Surplus |
3,671 |
|
|
3,556 |
|
| Retained earnings |
38,626 |
|
|
37,403 |
|
| Treasury stock |
(21,124) |
|
|
(20,721) |
|
| Accumulated other comprehensive loss |
(1,698) |
|
|
(2,152) |
|
| Total shareholders’ equity |
19,957 |
|
|
18,568 |
|
| Total liabilities and shareholders’ equity |
$ |
53,525 |
|
|
$ |
51,585 |
|
EXHIBIT F
CONSOLIDATED STATEMENT OF CASH FLOWS - (UNAUDITED)
DOLLARS IN MILLIONS
|
|
|
|
|
|
|
|
|
|
|
|
|
Nine Months Ended |
| |
October 1, 2023 |
|
October 2, 2022 |
| Cash flows from operating activities—continuing operations: |
|
|
|
| Net earnings |
$ |
2,310 |
|
|
$ |
2,398 |
|
| Adjustments to reconcile net earnings to net cash from operating activities: |
|
|
|
| Depreciation of property, plant and equipment |
446 |
|
|
420 |
|
| Amortization of intangible and finance lease right-of-use assets |
195 |
|
|
224 |
|
| Equity-based compensation expense |
136 |
|
|
140 |
|
| Deferred income tax benefit |
(158) |
|
|
(132) |
|
| (Increase) decrease in assets, net of effects of business acquisitions: |
|
|
|
| Accounts receivable |
(89) |
|
|
259 |
|
| Unbilled receivables |
448 |
|
|
422 |
|
| Inventories |
(1,904) |
|
|
(915) |
|
| Increase (decrease) in liabilities, net of effects of business acquisitions: |
|
|
|
| Accounts payable |
(83) |
|
|
(68) |
|
| Customer advances and deposits |
2,171 |
|
|
1,598 |
|
|
|
|
|
| Other, net |
42 |
|
|
(436) |
|
| Net cash provided by operating activities |
3,514 |
|
|
3,910 |
|
| Cash flows from investing activities: |
|
|
|
| Capital expenditures |
(600) |
|
|
(620) |
|
| Other, net |
(8) |
|
|
(378) |
|
| Net cash used by investing activities |
(608) |
|
|
(998) |
|
| Cash flows from financing activities: |
|
|
|
| Repayment of fixed-rate notes |
(1,250) |
|
|
— |
|
| Dividends paid |
(1,068) |
|
|
(1,024) |
|
|
|
|
|
|
|
|
|
|
|
|
|
| Purchases of common stock |
(434) |
|
|
(1,119) |
|
| Other, net |
(40) |
|
|
103 |
|
| Net cash used by financing activities |
(2,792) |
|
|
(2,040) |
|
| Net cash (used) provided by discontinued operations |
(4) |
|
|
21 |
|
| Net increase in cash and equivalents |
110 |
|
|
893 |
|
| Cash and equivalents at beginning of period |
1,242 |
|
|
1,603 |
|
| Cash and equivalents at end of period |
$ |
1,352 |
|
|
$ |
2,496 |
|
EXHIBIT G
ADDITIONAL FINANCIAL INFORMATION - (UNAUDITED)
DOLLARS IN MILLIONS, EXCEPT PER SHARE AMOUNTS
|
|
|
|
|
|
|
|
|
|
|
|
|
|
|
|
|
|
|
|
|
|
|
|
|
|
|
|
| Other Financial Information: |
|
|
|
|
|
|
|
|
|
|
|
| |
October 1, 2023 |
|
December 31, 2022 |
|
|
|
|
|
|
|
|
| Debt-to-equity (a) |
46.4 |
% |
|
56.5 |
% |
|
|
|
|
|
|
|
|
| Book value per share (b) |
$ |
73.13 |
|
|
$ |
67.66 |
|
|
|
|
|
|
|
|
|
| Shares outstanding |
272,896,860 |
|
|
274,411,106 |
|
|
|
|
|
|
|
|
|
|
|
|
|
|
|
|
|
|
|
|
|
|
Third Quarter |
|
Nine Months |
|
|
|
2023 |
|
2022 |
|
2023 |
|
2022 |
|
|
|
|
| Income tax payments, net |
$ |
167 |
|
|
$ |
202 |
|
|
$ |
493 |
|
|
$ |
767 |
|
|
|
|
|
| Company-sponsored research and development (c) |
$ |
140 |
|
|
$ |
124 |
|
|
$ |
395 |
|
|
$ |
361 |
|
|
|
|
|
| Return on sales (d) |
7.9 |
% |
|
9.0 |
% |
|
7.5 |
% |
|
8.4 |
% |
|
|
|
|
|
|
|
|
|
|
|
|
|
|
|
|
| Non-GAAP Financial Measures: |
|
|
|
|
|
|
|
|
|
|
|
|
Third Quarter |
|
Nine Months |
|
|
|
2023 |
|
2022 |
|
2023 |
|
2022 |
|
|
|
|
| Free cash flow: |
|
|
|
|
|
|
|
|
|
|
|
| Net cash provided by operating activities |
$ |
1,321 |
|
|
$ |
1,283 |
|
|
$ |
3,514 |
|
|
$ |
3,910 |
|
|
|
|
|
| Capital expenditures |
(227) |
|
|
(255) |
|
|
(600) |
|
|
(620) |
|
|
|
|
|
| Free cash flow (e) |
$ |
1,094 |
|
|
$ |
1,028 |
|
|
$ |
2,914 |
|
|
$ |
3,290 |
|
|
|
|
|
|
|
|
|
|
|
|
|
|
|
|
|
| |
October 1, 2023 |
|
December 31, 2022 |
|
|
|
|
|
|
|
|
| Net debt: |
|
|
|
|
|
|
|
|
|
|
|
| Total debt |
$ |
9,255 |
|
|
$ |
10,496 |
|
|
|
|
|
|
|
|
|
| Less cash and equivalents |
1,352 |
|
|
1,242 |
|
|
|
|
|
|
|
|
|
Net debt (f) |
$ |
7,903 |
|
|
$ |
9,254 |
|
|
|
|
|
|
|
|
|
(a)Debt-to-equity ratio is calculated as total debt divided by total equity as of the end of the period.
(b)Book value per share is calculated as total equity divided by total outstanding shares as of the end of the period.
(c)Includes independent research and development and Aerospace product-development costs.
(d)Return on sales is calculated as net earnings divided by revenue.
(e)We define free cash flow as net cash provided by operating activities less capital expenditures. We believe free cash flow is a useful measure for investors because it portrays our ability to generate cash from our businesses for purposes such as repaying debt, funding business acquisitions, repurchasing our common stock and paying dividends. We use free cash flow to assess the quality of our earnings and as a key performance measure in evaluating management.
(f)We define net debt as short- and long-term debt (total debt) less cash and equivalents. We believe net debt is a useful measure for investors because it reflects the borrowings that support our operations and capital deployment strategy. We use net debt as an important indicator of liquidity and financial position.
EXHIBIT H
BACKLOG - (UNAUDITED)
DOLLARS IN MILLIONS
|
|
|
|
|
|
|
|
|
|
|
|
|
|
|
|
|
|
|
|
|
|
|
|
|
|
|
|
|
|
|
|
|
|
|
Funded |
|
Unfunded |
|
Total
Backlog |
|
Estimated
Potential
Contract Value*
|
|
Total
Estimated
Contract Value |
| Third Quarter 2023: |
|
|
|
|
|
|
|
|
|
|
| Aerospace |
|
$ |
19,654 |
|
|
$ |
405 |
|
|
$ |
20,059 |
|
|
$ |
785 |
|
|
$ |
20,844 |
|
| Marine Systems |
|
30,445 |
|
|
17,277 |
|
|
47,722 |
|
|
3,113 |
|
|
50,835 |
|
| Combat Systems |
|
14,375 |
|
|
719 |
|
|
15,094 |
|
|
6,098 |
|
|
21,192 |
|
| Technologies |
|
9,833 |
|
|
2,852 |
|
|
12,685 |
|
|
27,302 |
|
|
39,987 |
|
| Total |
|
$ |
74,307 |
|
|
$ |
21,253 |
|
|
$ |
95,560 |
|
|
$ |
37,298 |
|
|
$ |
132,858 |
|
| Second Quarter 2023: |
|
|
|
|
|
|
|
|
|
|
| Aerospace |
|
$ |
19,050 |
|
|
$ |
447 |
|
|
$ |
19,497 |
|
|
$ |
888 |
|
|
$ |
20,385 |
|
| Marine Systems |
|
30,318 |
|
|
13,410 |
|
|
43,728 |
|
|
3,238 |
|
|
46,966 |
|
| Combat Systems |
|
14,349 |
|
|
718 |
|
|
15,067 |
|
|
6,196 |
|
|
21,263 |
|
| Technologies |
|
9,732 |
|
|
3,333 |
|
|
13,065 |
|
|
27,639 |
|
|
40,704 |
|
| Total |
|
$ |
73,449 |
|
|
$ |
17,908 |
|
|
$ |
91,357 |
|
|
$ |
37,961 |
|
|
$ |
129,318 |
|
| Third Quarter 2022: |
|
|
|
|
|
|
|
|
|
|
| Aerospace |
|
$ |
18,536 |
|
|
$ |
516 |
|
|
$ |
19,052 |
|
|
$ |
773 |
|
|
$ |
19,825 |
|
| Marine Systems |
|
26,966 |
|
|
15,273 |
|
|
42,239 |
|
|
3,263 |
|
|
45,502 |
|
| Combat Systems |
|
13,305 |
|
|
534 |
|
|
13,839 |
|
|
5,754 |
|
|
19,593 |
|
| Technologies |
|
10,130 |
|
|
3,573 |
|
|
13,703 |
|
|
27,162 |
|
|
40,865 |
|
| Total |
|
$ |
68,937 |
|
|
$ |
19,896 |
|
|
$ |
88,833 |
|
|
$ |
36,952 |
|
|
$ |
125,785 |
|
*The estimated potential contract value includes work awarded on unfunded indefinite delivery, indefinite quantity (IDIQ) contracts and unexercised options associated with existing firm contracts, including options and other agreements with existing customers to purchase new aircraft and aircraft services. We recognize options in backlog when the customer exercises the option and establishes a firm order. For IDIQ contracts, we evaluate the amount of funding we expect to receive and include this amount in our estimated potential contract value. The actual amount of funding received in the future may be higher or lower than our estimate of potential contract value.
EXHIBIT H-1
BACKLOG - (UNAUDITED)
DOLLARS IN MILLIONS
|
|
|
|
|
|
|
|
|
|
|
|
|
|
|
|
|
|
|
|
|
|
|
|
|
|
|
|
|
|
|
|
|
|
|
|
|
|
|
|
|
|
|
|
|
|
|
|
Funded Backlog |
|
|
|
Unfunded Backlog |
|
|
|
|
|
|
|
|
|
|
|
|
|
EXHIBIT H-2
BACKLOG BY SEGMENT - (UNAUDITED)
DOLLARS IN MILLIONS
|
|
|
|
|
|
|
|
|
|
|
|
|
|
|
|
|
|
|
|
|
|
|
|
|
|
|
|
|
|
|
|
|
|
|
|
|
|
|
|
|
|
|
|
|
|
|
|
Funded Backlog |
|
|
|
Unfunded Backlog |
|
|
|
|
|
|
|
|
|
|
|
|
|
|
|
|
EXHIBIT I
THIRD QUARTER 2023 SIGNIFICANT ORDERS - (UNAUDITED)
DOLLARS IN MILLIONS
We received the following significant contract awards during the third quarter of 2023:
Marine Systems:
•$140 from the U.S. Navy for advanced nuclear plant studies (ANPS) in support of the Columbia-class submarine program. The contract including options has a maximum potential value of $1.3 billion.
•$965 from the Navy for lead yard services, development studies and design efforts for Virginia-class submarines.
•$515 from the Navy for procurement and delivery of initial Virginia-class spare parts to support maintenance availabilities.
•$220 from the Navy to provide in-service support of systems and components on the USS Jimmy Carter (SSN23).
•$40 from the Navy to provide maintenance for submarines at the Naval Submarine Base New London in Connecticut. The contract including options has a maximum potential value of $185.
•A contract from the Navy for the construction of three Flight III Arleigh Burke-class (DDG-51) guided-missile destroyers.
Combat Systems:
•$770 for various munitions and ordnance with a maximum potential value of $1.2 billion.
•$345 for two contracts from the U.S. Army to establish additional capacity for 155mm M795 load, assemble and pack (LAP) production, and projectile metal parts. These contracts have a maximum potential value of $730.
•$145 from the Army to provide system and sustainment technical support services for Abrams main battle tanks.
•$135 to produce launch pod containers for the Guided Multiple Launch Rocket System (GMLRS) for the Army.
•$100 from the Army to produce Stryker maneuver short-range air defense (M-SHORAD) vehicles.
•$95 from the Army for the production of Hydra-70 rockets.
Technologies:
•$365 for several key contracts for classified customers. These contracts have a maximum potential value of $775.
•$55 to continue infrastructure modernization of the U.S. Department of Homeland Security’s (DHS) St. Elizabeth’s Campus in Washington, D.C. The contract including options has a maximum potential value of $710.
•$10 from the U.S. Air Force to manufacture high-altitude electromagnetic pulse and radiation-hardened general area alerting, personal area alerting and ultra-high frequency line of sight communications for the Global Aircrew Strategic Network Terminal Increment 2 (GASNTi2) system. The contract has a maximum potential value of $225.
•$30 to provide software development, integration, testing, technical support, configuration control and sustainment services for the Air Force. The contract including options has a maximum potential value of $140.
•$20 from the Administrative Office of the United States Courts (AOUSC) to provide risk management, monitoring and oversight and support services to the Administrative Office Technology Office (AOTO). The contract including options has a maximum potential value of $115.
•$105 from the Army for computing and communications equipment under the Common Hardware Systems-5 program.
•$95 for development, production and support of all hardware and software required for the Airborne Ruggedized Tactical Environment Mission Information System (ARTEMIS) for the Navy.
•$90 to modernize the Payments, Claims, and Enhanced Reconciliation (PACER) application for the U.S. Department of the Treasury.
EXHIBIT J
AEROSPACE SUPPLEMENTAL DATA - (UNAUDITED)
DOLLARS IN MILLIONS
|
|
|
|
|
|
|
|
|
|
|
|
|
|
|
|
|
|
|
|
|
|
|
|
|
|
|
|
|
Third Quarter |
Nine Months |
| |
|
2023 |
|
2022 |
|
2023 |
|
2022 |
| Gulfstream Aircraft Deliveries (units): |
|
|
|
|
|
|
|
|
| Large-cabin aircraft |
|
22 |
|
|
28 |
|
|
57 |
|
|
66 |
|
| Mid-cabin aircraft |
|
5 |
|
|
7 |
|
|
15 |
|
|
16 |
|
| Total |
|
27 |
|
|
35 |
|
|
72 |
|
|
82 |
|
|
|
|
|
|
|
|
|
|
| Aerospace Book-to-Bill: |
|
|
|
|
|
|
|
|
| Orders* |
|
$ |
2,916 |
|
|
$ |
2,705 |
|
|
$ |
7,119 |
|
|
$ |
9,600 |
|
| Revenue |
|
2,032 |
|
|
2,347 |
|
|
5,877 |
|
|
6,117 |
|
| Book-to-Bill Ratio |
|
1.44x |
|
1.15x |
|
1.21x |
|
1.57x |
*Does not include customer defaults, liquidated damages, cancellations, foreign exchange fluctuations and other backlog adjustments.