Document
Exhibit 99.1

|
|
|
|
|
|
|
|
|
| 11011 Sunset Hills Road |
|
|
| Reston, Virginia 20190 |
|
News |
| www.gd.com |
|
Contact: Jeff A. Davis
Tel: 703 876 3483
press@generaldynamics.com
General Dynamics Reports Second-Quarter 2023 Financial Results
July 26, 2023
•Revenue of $10.2 billion, up 10.5% year-over-year, with growth in all four segments
•Net earnings $744 million, diluted EPS $2.70
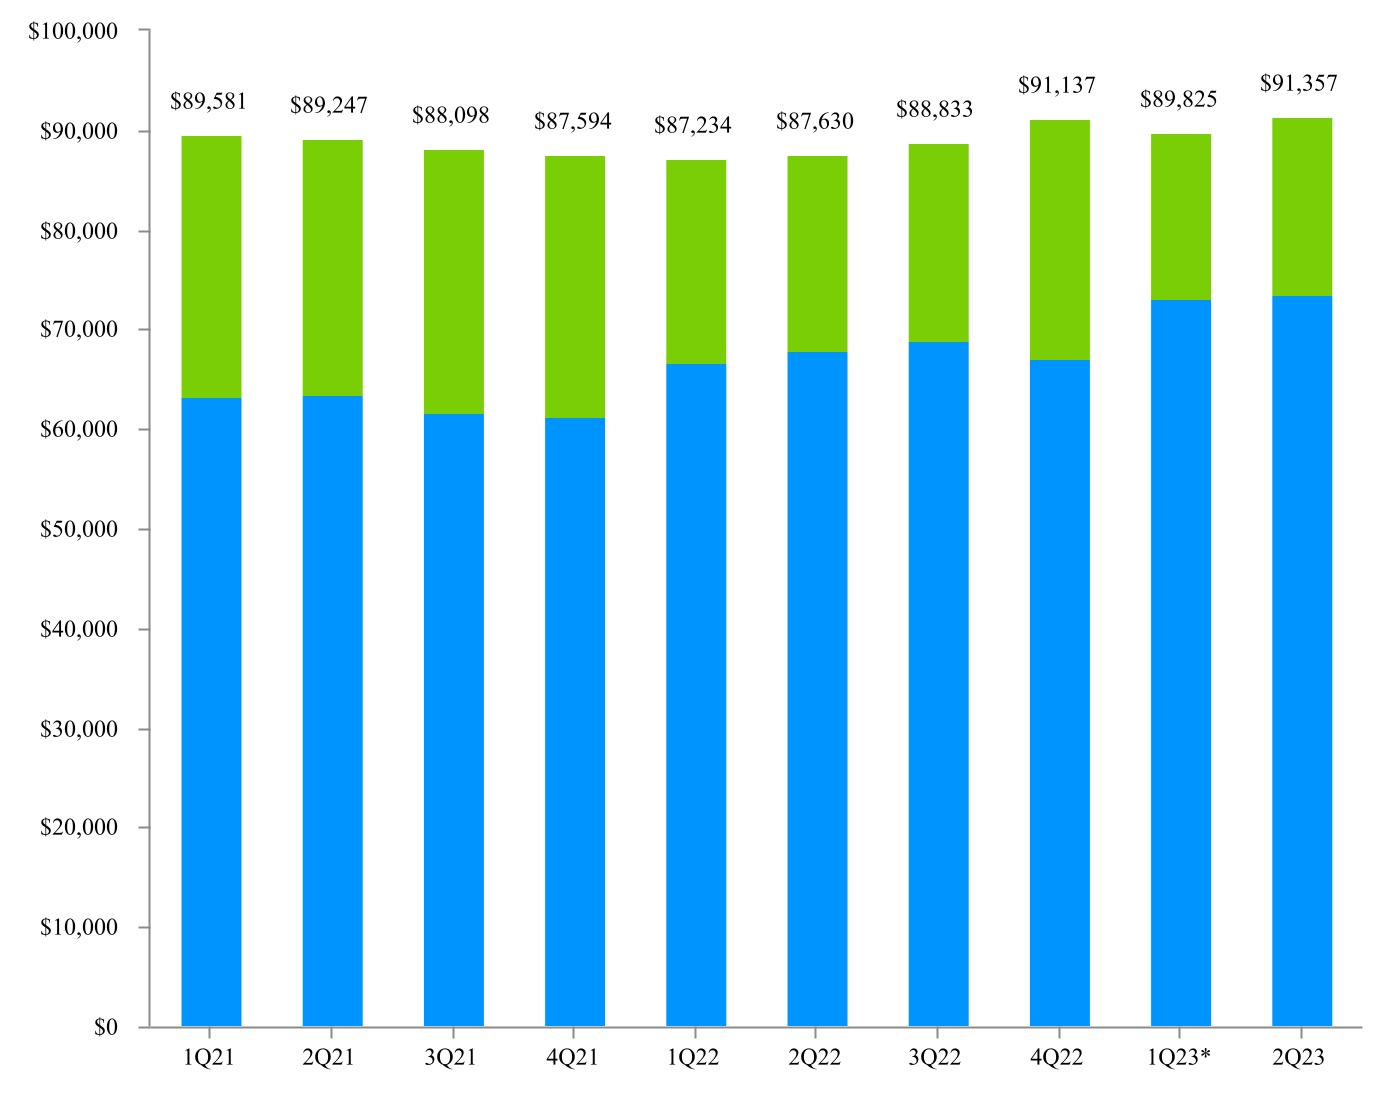
•Record-high backlog of $91.4 billion, 1.2-to-1 book-to-bill
RESTON, Va. – General Dynamics Corporation (NYSE: GD) today reported second-quarter 2023 net earnings of $744 million on revenue of $10.2 billion. Diluted earnings per share (EPS) were $2.70.
“Our businesses demonstrated solid momentum despite continued supply chain headwinds in several units, achieving the highest-ever revenue for a mid-year quarter, record-high backlog and very strong cash flow,” said Phebe N. Novakovic, chairman and chief executive officer. “We are well positioned to continue to perform for the remainder of the year.”
Cash
Net cash provided by operating activities in the quarter totaled $731 million. For the first half of the year, net cash provided by operating activities totaled $2.2 billion, or 149% of net earnings. During the quarter, the company repaid $750 million in fixed-rate notes, invested $212 million in capital expenditures, paid $360 million in dividends, and used $288 million to repurchase shares, ending the quarter with $1.2 billion in cash and cash equivalents on hand. In the previous 12 months, the company reduced total debt by $1.7 billion.
Backlog
Good order activity across the segments yielded a consolidated book-to-bill ratio, defined as orders divided by revenue, of 1.2-to-1 for the quarter. The company ended the quarter with record-high backlog of $91.4 billion, a 4.3% increase from the year-ago quarter. Estimated potential contract value, representing management’s estimate of additional value in unfunded indefinite delivery, indefinite quantity (IDIQ) contracts and unexercised options, was $38 billion. Total estimated contract value, the sum of all backlog components, was $129.3 billion at the end of the quarter.
The Aerospace segment booked $2.5 billion in new orders, driven by strong demand for Gulfstream aircraft.
Significant awards in the quarter for the three defense segments included $340 million from the U.S. Army for various munitions and ordnance with maximum potential value of $1.4 billion; $1.1 billion from the U.S. Navy for long-lead materials and advance construction for Block V Virginia-class submarines; $735 million from the Navy for construction of an additional John Lewis-
class (T-AO-205) fleet replenishment oiler; $695 million from the Army to design, build and test prototype XM30 Mechanized Infantry Combat Vehicles, with additional option value of $75 million; $710 million from the Army to upgrade Stryker vehicles to the double-V-hull A1 configuration; and $435 million for several key contracts for classified customers, with additional options and potential contract value of $935 million.
About General Dynamics
Headquartered in Reston, Virginia, General Dynamics is a global aerospace and defense company that offers a broad portfolio of products and services in business aviation; ship construction and repair; land combat vehicles, weapons systems and munitions; and technology products and services. General Dynamics employs more than 100,000 people worldwide and generated $39.4 billion in revenue in 2022. More information is available at www.gd.com.
WEBCAST INFORMATION: General Dynamics will webcast its second-quarter 2023 financial results conference call at 9 a.m. EDT on Wednesday, July 26, 2023. The webcast will be a listen-only audio event available at www.gd.com. An on-demand replay of the webcast will be available by telephone two hours after the end of the call through August 2, 2023, at 800-770-2030 (international: +1 647-362-9199), conference ID 4299949. Charts furnished to investors and securities analysts in connection with General Dynamics’ announcement of its financial results are available at www.gd.com.
This press release contains forward-looking statements (FLS), including statements about the company’s future operational and financial performance, which are based on management’s expectations, estimates, projections and assumptions. Words such as “expects,” “anticipates,” “plans,” “believes,” “forecasts,” “scheduled,” “outlook,” “estimates,” “should” and variations of these words and similar expressions are intended to identify FLS. In making FLS, we rely on assumptions and analyses based on our experience and perception of historical trends; current conditions and expected future developments; and other factors, estimates and judgments we consider reasonable and appropriate based on information available to us at the time. FLS are made pursuant to the safe harbor provisions of the Private Securities Litigation Reform Act of 1995, as amended. FLS are not guarantees of future performance and involve factors, risks and uncertainties that are difficult to predict. Actual future results and trends may differ materially from what is forecast in the FLS. All FLS speak only as of the date they were made. We do not undertake any obligation to update or publicly release revisions to FLS to reflect events, circumstances or changes in expectations after the date of this press release. Additional information regarding these factors is contained in the company’s filings with the SEC, and these factors may be revised or supplemented in future SEC filings. In addition, this press release contains some financial measures not prepared in accordance with U.S. generally accepted accounting principles (GAAP). While we believe these non-GAAP metrics provide useful information for investors, there are limitations associated with their use, and our calculations of these metrics may not be comparable to similarly titled measures of other companies. Non-GAAP metrics should not be considered in isolation from, or as a substitute for, GAAP measures. Reconciliations to comparable GAAP measures and other information relating to our non-GAAP measures are included in other filings with the SEC, which are available at http://investorrelations.gd.com.
EXHIBIT A
CONSOLIDATED STATEMENT OF EARNINGS - (UNAUDITED)
DOLLARS IN MILLIONS, EXCEPT PER SHARE AMOUNTS
|
|
|
|
|
|
|
|
|
|
|
|
|
|
|
|
|
|
|
|
|
|
|
|
| |
Three Months Ended |
|
Variance |
| |
July 2, 2023 |
|
July 3, 2022 |
|
$ |
|
% |
| Revenue |
$ |
10,152 |
|
|
$ |
9,189 |
|
|
$ |
963 |
|
|
10.5 |
% |
| Operating costs and expenses |
(9,190) |
|
|
(8,211) |
|
|
(979) |
|
|
|
| Operating earnings |
962 |
|
|
978 |
|
|
(16) |
|
|
(1.6) |
% |
| Other, net |
13 |
|
|
40 |
|
|
(27) |
|
|
|
| Interest, net |
(89) |
|
|
(95) |
|
|
6 |
|
|
|
| Earnings before income tax |
886 |
|
|
923 |
|
|
(37) |
|
|
(4.0) |
% |
| Provision for income tax, net |
(142) |
|
|
(157) |
|
|
15 |
|
|
|
| Net earnings |
$ |
744 |
|
|
$ |
766 |
|
|
$ |
(22) |
|
|
(2.9) |
% |
| Earnings per share—basic |
$ |
2.72 |
|
|
$ |
2.77 |
|
|
$ |
(0.05) |
|
|
(1.8) |
% |
| Basic weighted average shares outstanding |
273.1 |
|
|
276.3 |
|
|
|
|
|
| Earnings per share—diluted |
$ |
2.70 |
|
|
$ |
2.75 |
|
|
$ |
(0.05) |
|
|
(1.8) |
% |
| Diluted weighted average shares outstanding |
275.1 |
|
|
278.9 |
|
|
|
|
|
EXHIBIT B
CONSOLIDATED STATEMENT OF EARNINGS - (UNAUDITED)
DOLLARS IN MILLIONS, EXCEPT PER SHARE AMOUNTS
|
|
|
|
|
|
|
|
|
|
|
|
|
|
|
|
|
|
|
|
|
|
|
|
| |
Six Months Ended |
|
Variance |
| |
July 2, 2023 |
|
July 3, 2022 |
|
$ |
|
% |
| Revenue |
$ |
20,033 |
|
|
$ |
18,581 |
|
|
$ |
1,452 |
|
|
7.8 |
% |
| Operating costs and expenses |
(18,133) |
|
|
(16,695) |
|
|
(1,438) |
|
|
|
| Operating earnings |
1,900 |
|
|
1,886 |
|
|
14 |
|
|
0.7 |
% |
| Other, net |
46 |
|
|
79 |
|
|
(33) |
|
|
|
| Interest, net |
(180) |
|
|
(193) |
|
|
13 |
|
|
|
| Earnings before income tax |
1,766 |
|
|
1,772 |
|
|
(6) |
|
|
(0.3) |
% |
| Provision for income tax, net |
(292) |
|
|
(276) |
|
|
(16) |
|
|
|
| Net earnings |
$ |
1,474 |
|
|
$ |
1,496 |
|
|
$ |
(22) |
|
|
(1.5) |
% |
| Earnings per share—basic |
$ |
5.39 |
|
|
$ |
5.41 |
|
|
$ |
(0.02) |
|
|
(0.4) |
% |
| Basic weighted average shares outstanding |
273.6 |
|
|
276.7 |
|
|
|
|
|
| Earnings per share—diluted |
$ |
5.34 |
|
|
$ |
5.35 |
|
|
$ |
(0.01) |
|
|
(0.2) |
% |
| Diluted weighted average shares outstanding |
275.8 |
|
|
279.4 |
|
|
|
|
|
EXHIBIT C
REVENUE AND OPERATING EARNINGS BY SEGMENT - (UNAUDITED)
DOLLARS IN MILLIONS
|
|
|
|
|
|
|
|
|
|
|
|
|
|
|
|
|
|
|
|
|
|
|
|
| |
Three Months Ended |
|
Variance |
| |
July 2, 2023 |
|
July 3, 2022 |
|
$ |
|
% |
| Revenue: |
|
|
|
|
|
|
|
| Aerospace |
$ |
1,953 |
|
|
$ |
1,867 |
|
|
$ |
86 |
|
|
4.6 |
% |
| Marine Systems |
3,059 |
|
|
2,651 |
|
|
408 |
|
|
15.4 |
% |
| Combat Systems |
1,924 |
|
|
1,666 |
|
|
258 |
|
|
15.5 |
% |
| Technologies |
3,216 |
|
|
3,005 |
|
|
211 |
|
|
7.0 |
% |
| Total |
$ |
10,152 |
|
|
$ |
9,189 |
|
|
$ |
963 |
|
|
10.5 |
% |
| Operating earnings: |
|
|
|
|
|
|
|
| Aerospace |
$ |
236 |
|
|
$ |
238 |
|
|
$ |
(2) |
|
|
(0.8) |
% |
| Marine Systems |
235 |
|
|
211 |
|
|
24 |
|
|
11.4 |
% |
| Combat Systems |
251 |
|
|
245 |
|
|
6 |
|
|
2.4 |
% |
| Technologies |
283 |
|
|
304 |
|
|
(21) |
|
|
(6.9) |
% |
| Corporate |
(43) |
|
|
(20) |
|
|
(23) |
|
|
(115.0) |
% |
| Total |
$ |
962 |
|
|
$ |
978 |
|
|
$ |
(16) |
|
|
(1.6) |
% |
| Operating margin: |
|
|
|
|
|
|
|
| Aerospace |
12.1 |
% |
|
12.7 |
% |
|
|
|
|
| Marine Systems |
7.7 |
% |
|
8.0 |
% |
|
|
|
|
| Combat Systems |
13.0 |
% |
|
14.7 |
% |
|
|
|
|
| Technologies |
8.8 |
% |
|
10.1 |
% |
|
|
|
|
| Total |
9.5 |
% |
|
10.6 |
% |
|
|
|
|
EXHIBIT D
REVENUE AND OPERATING EARNINGS BY SEGMENT - (UNAUDITED)
DOLLARS IN MILLIONS
|
|
|
|
|
|
|
|
|
|
|
|
|
|
|
|
|
|
|
|
|
|
|
|
| |
Six Months Ended |
|
Variance |
| |
July 2, 2023 |
|
July 3, 2022 |
|
$ |
|
% |
| Revenue: |
|
|
|
|
|
|
|
| Aerospace |
$ |
3,845 |
|
|
$ |
3,770 |
|
|
$ |
75 |
|
|
2.0 |
% |
| Marine Systems |
6,051 |
|
|
5,302 |
|
|
749 |
|
|
14.1 |
% |
| Combat Systems |
3,680 |
|
|
3,341 |
|
|
339 |
|
|
10.1 |
% |
| Technologies |
6,457 |
|
|
6,168 |
|
|
289 |
|
|
4.7 |
% |
| Total |
$ |
20,033 |
|
|
$ |
18,581 |
|
|
$ |
1,452 |
|
|
7.8 |
% |
| Operating earnings: |
|
|
|
|
|
|
|
| Aerospace |
$ |
465 |
|
|
$ |
481 |
|
|
$ |
(16) |
|
|
(3.3) |
% |
| Marine Systems |
446 |
|
|
422 |
|
|
24 |
|
|
5.7 |
% |
| Combat Systems |
496 |
|
|
472 |
|
|
24 |
|
|
5.1 |
% |
| Technologies |
582 |
|
|
602 |
|
|
(20) |
|
|
(3.3) |
% |
| Corporate |
(89) |
|
|
(91) |
|
|
2 |
|
|
2.2 |
% |
| Total |
$ |
1,900 |
|
|
$ |
1,886 |
|
|
$ |
14 |
|
|
0.7 |
% |
| Operating margin: |
|
|
|
|
|
|
|
| Aerospace |
12.1 |
% |
|
12.8 |
% |
|
|
|
|
| Marine Systems |
7.4 |
% |
|
8.0 |
% |
|
|
|
|
| Combat Systems |
13.5 |
% |
|
14.1 |
% |
|
|
|
|
| Technologies |
9.0 |
% |
|
9.8 |
% |
|
|
|
|
| Total |
9.5 |
% |
|
10.2 |
% |
|
|
|
|
EXHIBIT E
CONSOLIDATED BALANCE SHEET
DOLLARS IN MILLIONS
|
|
|
|
|
|
|
|
|
|
|
|
|
(Unaudited) |
|
|
|
July 2, 2023 |
|
December 31, 2022 |
| ASSETS |
|
|
|
| Current assets: |
|
|
|
| Cash and equivalents |
$ |
1,154 |
|
|
$ |
1,242 |
|
| Accounts receivable |
3,167 |
|
|
3,008 |
|
| Unbilled receivables |
8,291 |
|
|
8,795 |
|
| Inventories |
7,642 |
|
|
6,322 |
|
| Other current assets |
1,571 |
|
|
1,696 |
|
| Total current assets |
21,825 |
|
|
21,063 |
|
| Noncurrent assets: |
|
|
|
| Property, plant and equipment, net |
5,947 |
|
|
5,900 |
|
| Intangible assets, net |
1,732 |
|
|
1,824 |
|
| Goodwill |
20,443 |
|
|
20,334 |
|
| Other assets |
2,609 |
|
|
2,464 |
|
| Total noncurrent assets |
30,731 |
|
|
30,522 |
|
| Total assets |
$ |
52,556 |
|
|
$ |
51,585 |
|
| LIABILITIES AND SHAREHOLDERS’ EQUITY |
|
|
|
| Current liabilities: |
|
|
|
| Short-term debt and current portion of long-term debt |
$ |
508 |
|
|
$ |
1,253 |
|
| Accounts payable |
3,365 |
|
|
3,398 |
|
| Customer advances and deposits |
8,628 |
|
|
7,436 |
|
| Other current liabilities |
3,185 |
|
|
3,254 |
|
| Total current liabilities |
15,686 |
|
|
15,341 |
|
| Noncurrent liabilities: |
|
|
|
| Long-term debt |
9,247 |
|
|
9,243 |
|
| Other liabilities |
8,145 |
|
|
8,433 |
|
| Total noncurrent liabilities |
17,392 |
|
|
17,676 |
|
| Shareholders’ equity: |
|
|
|
| Common stock |
482 |
|
|
482 |
|
| Surplus |
3,614 |
|
|
3,556 |
|
| Retained earnings |
38,154 |
|
|
37,403 |
|
| Treasury stock |
(21,077) |
|
|
(20,721) |
|
| Accumulated other comprehensive loss |
(1,695) |
|
|
(2,152) |
|
| Total shareholders’ equity |
19,478 |
|
|
18,568 |
|
| Total liabilities and shareholders’ equity |
$ |
52,556 |
|
|
$ |
51,585 |
|
EXHIBIT F
CONSOLIDATED STATEMENT OF CASH FLOWS - (UNAUDITED)
DOLLARS IN MILLIONS
|
|
|
|
|
|
|
|
|
|
|
|
|
Six Months Ended |
| |
July 2, 2023 |
|
July 3, 2022 |
| Cash flows from operating activities—continuing operations: |
|
|
|
| Net earnings |
$ |
1,474 |
|
|
$ |
1,496 |
|
| Adjustments to reconcile net earnings to net cash from operating activities: |
|
|
|
| Depreciation of property, plant and equipment |
297 |
|
|
278 |
|
| Amortization of intangible and finance lease right-of-use assets |
136 |
|
|
147 |
|
| Equity-based compensation expense |
87 |
|
|
120 |
|
| Deferred income tax benefit |
(154) |
|
|
(218) |
|
| (Increase) decrease in assets, net of effects of business acquisitions: |
|
|
|
| Accounts receivable |
(159) |
|
|
(172) |
|
| Unbilled receivables |
513 |
|
|
695 |
|
| Inventories |
(1,264) |
|
|
(816) |
|
| Increase (decrease) in liabilities, net of effects of business acquisitions: |
|
|
|
| Accounts payable |
(33) |
|
|
(29) |
|
| Customer advances and deposits |
1,286 |
|
|
1,402 |
|
|
|
|
|
| Other, net |
10 |
|
|
(276) |
|
| Net cash provided by operating activities |
2,193 |
|
|
2,627 |
|
| Cash flows from investing activities: |
|
|
|
| Capital expenditures |
(373) |
|
|
(365) |
|
| Other, net |
(31) |
|
|
— |
|
| Net cash used by investing activities |
(404) |
|
|
(365) |
|
| Cash flows from financing activities: |
|
|
|
| Repayment of fixed-rate notes |
(750) |
|
|
— |
|
| Dividends paid |
(705) |
|
|
(679) |
|
|
|
|
|
|
|
|
|
|
|
|
|
| Purchases of common stock |
(378) |
|
|
(1,094) |
|
| Other, net |
(42) |
|
|
110 |
|
| Net cash used by financing activities |
(1,875) |
|
|
(1,663) |
|
| Net cash (used) provided by discontinued operations |
(2) |
|
|
21 |
|
| Net (decrease) increase in cash and equivalents |
(88) |
|
|
620 |
|
| Cash and equivalents at beginning of period |
1,242 |
|
|
1,603 |
|
| Cash and equivalents at end of period |
$ |
1,154 |
|
|
$ |
2,223 |
|
EXHIBIT G
ADDITIONAL FINANCIAL INFORMATION - (UNAUDITED)
DOLLARS IN MILLIONS, EXCEPT PER SHARE AMOUNTS
|
|
|
|
|
|
|
|
|
|
|
|
|
|
|
|
|
|
|
|
|
|
|
|
|
|
|
|
| Other Financial Information: |
|
|
|
|
|
|
|
|
|
|
|
| |
July 2, 2023 |
|
December 31, 2022 |
|
|
|
|
|
|
|
|
| Debt-to-equity (a) |
50.1 |
% |
|
56.5 |
% |
|
|
|
|
|
|
|
|
| Book value per share (b) |
$ |
71.34 |
|
|
$ |
67.66 |
|
|
|
|
|
|
|
|
|
| Shares outstanding |
273,042,571 |
|
|
274,411,106 |
|
|
|
|
|
|
|
|
|
|
|
|
|
|
|
|
|
|
|
|
|
|
Second Quarter |
|
Six Months |
|
|
|
2023 |
|
2022 |
|
2023 |
|
2022 |
|
|
|
|
| Income tax payments, net |
$ |
269 |
|
|
$ |
550 |
|
|
$ |
327 |
|
|
$ |
565 |
|
|
|
|
|
| Company-sponsored research and development (c) |
$ |
145 |
|
|
$ |
130 |
|
|
$ |
255 |
|
|
$ |
237 |
|
|
|
|
|
| Return on sales (d) |
7.3 |
% |
|
8.3 |
% |
|
7.4 |
% |
|
8.1 |
% |
|
|
|
|
|
|
|
|
|
|
|
|
|
|
|
|
| Non-GAAP Financial Measures: |
|
|
|
|
|
|
|
|
|
|
|
|
Second Quarter |
|
Six Months |
|
|
|
2023 |
|
2022 |
|
2023 |
|
2022 |
|
|
|
|
| Free cash flow: |
|
|
|
|
|
|
|
|
|
|
|
| Net cash provided by operating activities |
$ |
731 |
|
|
$ |
659 |
|
|
$ |
2,193 |
|
|
$ |
2,627 |
|
|
|
|
|
| Capital expenditures |
(212) |
|
|
(224) |
|
|
(373) |
|
|
(365) |
|
|
|
|
|
| Free cash flow (e) |
$ |
519 |
|
|
$ |
435 |
|
|
$ |
1,820 |
|
|
$ |
2,262 |
|
|
|
|
|
|
|
|
|
|
|
|
|
|
|
|
|
| |
July 2, 2023 |
|
December 31, 2022 |
|
|
|
|
|
|
|
|
| Net debt: |
|
|
|
|
|
|
|
|
|
|
|
| Total debt |
$ |
9,755 |
|
|
$ |
10,496 |
|
|
|
|
|
|
|
|
|
| Less cash and equivalents |
1,154 |
|
|
1,242 |
|
|
|
|
|
|
|
|
|
Net debt (f) |
$ |
8,601 |
|
|
$ |
9,254 |
|
|
|
|
|
|
|
|
|
(a)Debt-to-equity ratio is calculated as total debt divided by total equity as of the end of the period.
(b)Book value per share is calculated as total equity divided by total outstanding shares as of the end of the period.
(c)Includes independent research and development and Aerospace product-development costs.
(d)Return on sales is calculated as net earnings divided by revenue.
(e)We define free cash flow as net cash provided by operating activities less capital expenditures. We believe free cash flow is a useful measure for investors because it portrays our ability to generate cash from our businesses for purposes such as repaying debt, funding business acquisitions, repurchasing our common stock and paying dividends. We use free cash flow to assess the quality of our earnings and as a key performance measure in evaluating management.
(f)We define net debt as short- and long-term debt (total debt) less cash and equivalents. We believe net debt is a useful measure for investors because it reflects the borrowings that support our operations and capital deployment strategy. We use net debt as an important indicator of liquidity and financial position.
EXHIBIT H
BACKLOG - (UNAUDITED)
DOLLARS IN MILLIONS
|
|
|
|
|
|
|
|
|
|
|
|
|
|
|
|
|
|
|
|
|
|
|
|
|
|
|
|
|
|
|
|
|
|
|
Funded |
|
Unfunded |
|
Total
Backlog |
|
Estimated
Potential
Contract Value**
|
|
Total
Estimated
Contract Value |
| Second Quarter 2023: |
|
|
|
|
|
|
|
|
|
|
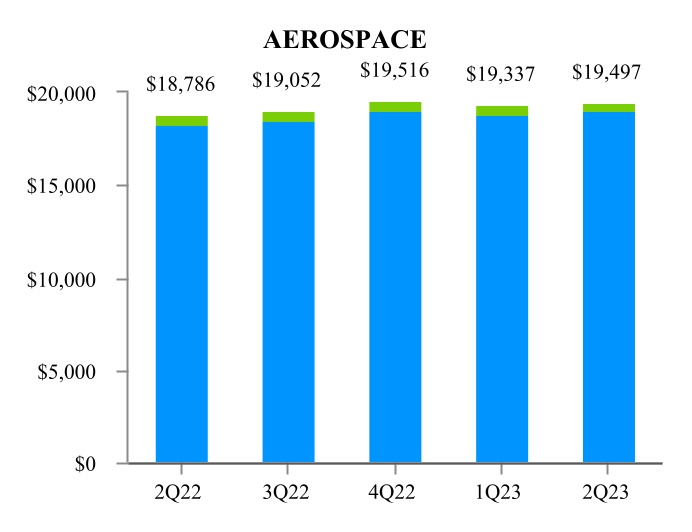
| Aerospace |
|
$ |
19,050 |
|
|
$ |
447 |
|
|
$ |
19,497 |
|
|
$ |
888 |
|
|
$ |
20,385 |
|
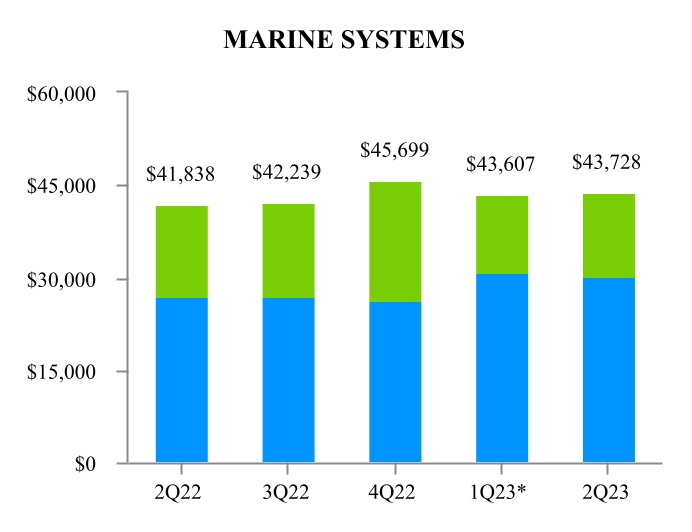
| Marine Systems |
|
30,318 |
|
|
13,410 |
|
|
43,728 |
|
|
3,238 |
|
|
46,966 |
|
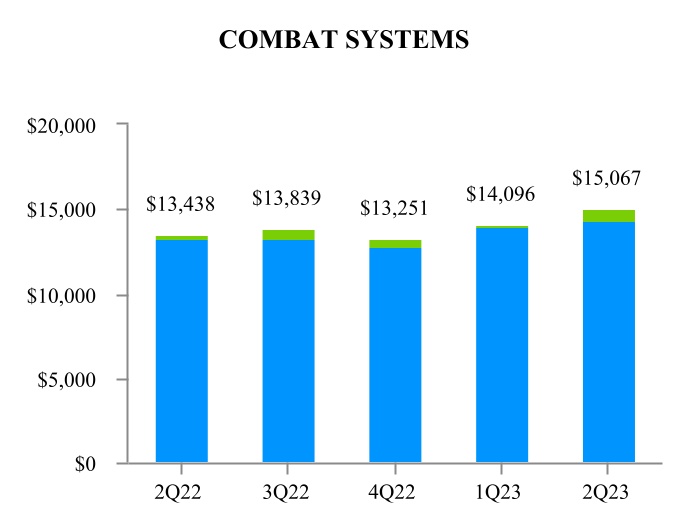
| Combat Systems |
|
14,349 |
|
|
718 |
|
|
15,067 |
|
|
6,196 |
|
|
21,263 |
|
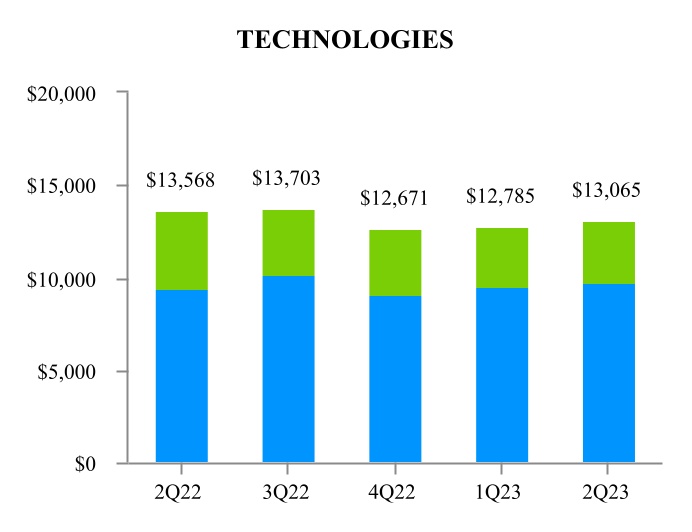
| Technologies |
|
9,732 |
|
|
3,333 |
|
|
13,065 |
|
|
27,639 |
|
|
40,704 |
|
| Total |
|
$ |
73,449 |
|
|
$ |
17,908 |
|
|
$ |
91,357 |
|
|
$ |
37,961 |
|
|
$ |
129,318 |
|
| First Quarter 2023: |
|
|
|
|
|
|
|
|
|
|
| Aerospace |
|
$ |
18,853 |
|
|
$ |
484 |
|
|
$ |
19,337 |
|
|
$ |
804 |
|
|
$ |
20,141 |
|
| Marine Systems |
|
30,722 |
|
* |
12,885 |
|
* |
43,607 |
|
|
3,499 |
|
|
47,106 |
|
| Combat Systems |
|
13,953 |
|
|
143 |
|
|
14,096 |
|
|
5,599 |
|
|
19,695 |
|
| Technologies |
|
9,465 |
|
|
3,320 |
|
|
12,785 |
|
|
28,637 |
|
|
41,422 |
|
| Total |
|
$ |
72,993 |
|
|
$ |
16,832 |
|
|
$ |
89,825 |
|
|
$ |
38,539 |
|
|
$ |
128,364 |
|
| Second Quarter 2022: |
|
|
|
|
|
|
|
|
|
|
| Aerospace |
|
$ |
18,237 |
|
|
$ |
549 |
|
|
$ |
18,786 |
|
|
$ |
877 |
|
|
$ |
19,663 |
|
| Marine Systems |
|
26,965 |
|
|
14,873 |
|
|
41,838 |
|
|
3,904 |
|
|
45,742 |
|
| Combat Systems |
|
13,236 |
|
|
202 |
|
|
13,438 |
|
|
6,939 |
|
|
20,377 |
|
| Technologies |
|
9,448 |
|
|
4,120 |
|
|
13,568 |
|
|
27,028 |
|
|
40,596 |
|
| Total |
|
$ |
67,886 |
|
|
$ |
19,744 |
|
|
$ |
87,630 |
|
|
$ |
38,748 |
|
|
$ |
126,378 |
|
*Revised
** The estimated potential contract value includes work awarded on unfunded indefinite delivery, indefinite quantity (IDIQ) contracts and unexercised options associated with existing firm contracts, including options and other agreements with existing customers to purchase new aircraft and aircraft services. We recognize options in backlog when the customer exercises the option and establishes a firm order. For IDIQ contracts, we evaluate the amount of funding we expect to receive and include this amount in our estimated potential contract value. The actual amount of funding received in the future may be higher or lower than our estimate of potential contract value.
EXHIBIT H-1
BACKLOG - (UNAUDITED)
DOLLARS IN MILLIONS
|
|
|
|
|
|
|
|
|
|
|
|
|
|
|
|
|
|
|
|
|
|
|
|
|
|
|
|
|
|
|
|
|
|
|
|
|
|
|
|
|
|
|
|
|
|
|
|
Funded Backlog |
|
|
|
Unfunded Backlog |
|
|
|
|
|
|
|
|
|
|
|
|
|
*Revised
EXHIBIT H-2
BACKLOG BY SEGMENT - (UNAUDITED)
DOLLARS IN MILLIONS
|
|
|
|
|
|
|
|
|
|
|
|
|
|
|
|
|
|
|
|
|
|
|
|
|
|
|
|
|
|
|
|
|
|
|
|
|
|
|
|
|
|
|
|
|
|
|
|
Funded Backlog |
|
|
|
Unfunded Backlog |
|
|
|
|
|
|
|
|
|
|
|
|
|
|
|
|
*Revised
EXHIBIT I
SECOND QUARTER 2023 SIGNIFICANT ORDERS - (UNAUDITED)
DOLLARS IN MILLIONS
We received the following significant contract awards during the second quarter of 2023:
Marine Systems:
•$1.1 billion from the U.S. Navy for long-lead materials and advance construction for Block V Virginia-class submarines.
•$735 from the Navy for construction of an additional John Lewis-class (T-AO-205) fleet replenishment oiler.
•$55 from the Navy to support non-nuclear maintenance on submarines based at the New London Naval Submarine Support Facility. The award includes additional option value of $220.
•$160 from the Navy for advanced nuclear plant studies (ANPS) in support of the Columbia-class submarine program.
•$75 from the Navy for lead yard services, development studies and design efforts for Virginia-class submarines.
•$65 from the Navy for maintenance and modernization on the USS Makin Island, a Wasp-class amphibious assault ship.
Combat Systems:
•$340 from the U.S. Army for various munitions and ordnance with a maximum potential value of $1.4 billion.
•$695 from the Army to advance to the detailed design and prototype build and test phases of the XM30 Mechanized Infantry Combat Vehicle (MICV) competition, formerly known as the Optionally Manned Fighting Vehicle (OMFV). The award includes additional option value of $75.
•$710 from the Army to upgrade Stryker vehicles to the double-V-hull (DVH) A1 configuration.
•$260 from the Army for the second phase of low-rate initial production (LRIP) of the M10 Booker Combat Vehicle, formerly known as Mobile Protected Firepower (MPF).
•$140 from the Army to establish additional capacity for 155mm artillery projectile metal parts production.
•$65 to provide light armored vehicle (LAV) spare parts for an international customer.
•$60 from the Army to provide system and sustainment technical support services for Abrams main battle tanks.
Technologies:
•$435 for several key contracts for classified customers with additional options and potential contract value of $935.
•$60 to provide training support services to the Navy, and options totaling $325 of additional potential value.
•$95 from the U.S. Department of State (DoS) to provide overseas consular services to support visa application and issuance at U.S. embassies and consulates throughout the world under the Global Support Strategy (GSS) program, and options totaling $265 of additional potential value.
•$270 from the National Geospatial-Intelligence Agency (NGA) to provide hybrid cloud services and information technology (IT) design, engineering, and operations and sustainment services.
•$15 to modernize the Payments, Claims, and Enhanced Reconciliation (PACER) application for the U.S. Department of the Treasury. The contract has a maximum potential value of $190.
•$185 to manufacture and deliver hardware in support of the SPY-6 radar program.
•$160 from the Centers for Medicare and Medicaid Services (CMS) to provide cloud services and software tools.
•$145 to provide ship modernization services for the Navy.
•$60 from the DoS to provide IT end-user support services to the Bureau of Information Resource Management (IRM); the contract including options has a maximum potential value of $125.
EXHIBIT J
AEROSPACE SUPPLEMENTAL DATA - (UNAUDITED)
DOLLARS IN MILLIONS
|
|
|
|
|
|
|
|
|
|
|
|
|
|
|
|
|
|
|
|
|
|
|
|
|
|
|
|
|
Second Quarter |
Six Months |
| |
|
2023 |
|
2022 |
|
2023 |
|
2022 |
| Gulfstream Aircraft Deliveries (units): |
|
|
|
|
|
|
|
|
| Large-cabin aircraft |
|
18 |
|
|
17 |
|
|
35 |
|
|
38 |
|
| Mid-cabin aircraft |
|
6 |
|
|
5 |
|
|
10 |
|
|
9 |
|
| Total |
|
24 |
|
|
22 |
|
|
45 |
|
|
47 |
|
|
|
|
|
|
|
|
|
|
| Aerospace Book-to-Bill: |
|
|
|
|
|
|
|
|
| Orders* |
|
$ |
2,476 |
|
|
$ |
3,652 |
|
|
$ |
4,203 |
|
|
$ |
6,895 |
|
| Revenue |
|
1,953 |
|
|
1,867 |
|
|
3,845 |
|
|
3,770 |
|
| Book-to-Bill Ratio |
|
1.27x |
|
1.96x |
|
1.09x |
|
1.83x |
*Does not include customer defaults, liquidated damages, cancellations, foreign exchange fluctuations and other backlog adjustments.