| ☒ | ANNUAL REPORT PURSUANT TO SECTION 13 OR 15(d) OF THE SECURITIES EXCHANGE ACT OF 1934 | ||||
| ☐ | TRANSITION REPORT PURSUANT TO SECTION 13 or 15(d) OF THE SECURITIES EXCHANGE ACT OF 1934 | ||||

| TN | 62-0803242 | ||||||||||
| (State or other jurisdiction incorporation of organization) |
(IRS Employer Identification No.) |
||||||||||
| 165 Madison Avenue | |||||||||||
| Memphis, | Tennessee | 38103 | |||||||||
| (Address of principal executive office) | (Zip Code) | ||||||||||
| Title of Each Class | Trading Symbol(s) | Name of Exchange on which Registered | ||||||
| $.625 Par Value Common Capital Stock | FHN | New York Stock Exchange LLC | ||||||
| Depositary Shares, each representing a 1/400th interest in a share of Non-Cumulative Perpetual Preferred Stock, Series B |
FHN PR B | New York Stock Exchange LLC | ||||||
| Depositary Shares, each representing a 1/400th interest in a share of Non-Cumulative Perpetual Preferred Stock, Series C |
FHN PR C | New York Stock Exchange LLC | ||||||
| Depositary Shares, each representing a 1/400th interest in a share of Non-Cumulative Perpetual Preferred Stock, Series D |
FHN PR D | New York Stock Exchange LLC | ||||||
| Depositary Shares, each representing a 1/4,000th interest in a share of Non-Cumulative Perpetual Preferred Stock, Series E |
FHN PR E | New York Stock Exchange LLC | ||||||
| Depositary Shares, each representing a 1/4,000th interest in a share of Non-Cumulative Perpetual Preferred Stock, Series F |
FHN PR F | New York Stock Exchange LLC | ||||||
| Large Accelerated Filer | ☒ | Accelerated filer | ☐ | Non-accelerated filer | ☐ | ||||||||||||||||||
| Smaller reporting company | ☐ | Emerging Growth Company | ☐ | ||||||||||||||||||||
| TABLE OF CONTENTS and GLOSSARY | ||
| Page | Page | |||||||||||||||||||
| Glossary | Item 8. | Financial Statements and Supplementary Data | ||||||||||||||||||
| Executive Summary of Principal Investment Risks | Item 9. | Changes in and Disagreements with | ||||||||||||||||||
| Forward-Looking Statements | Accountants on Accounting and Financial | |||||||||||||||||||
Part I |
Disclosure | |||||||||||||||||||
| Item 1. | Business | Item 9A. | Controls and Procedures | |||||||||||||||||
| Item 1A. | Risk Factors | Item 9B. | Other Information | |||||||||||||||||
| Item 1B. | Unresolved Staff Comments | Item 9C. | Disclosure Regarding Foreign Jurisdictions that | |||||||||||||||||
| Item 1C. | Cybersecurity | Prevent Inspections | ||||||||||||||||||
| Item 2. | Properties | Part III | ||||||||||||||||||
| Item 3. | Legal Proceedings | Item 10. | Directors, Executive Officers and Corporate | |||||||||||||||||
| Item 4. | Mine Safety Disclosures | Governance | ||||||||||||||||||
| Supplemental Part I Information | Item 11. | Executive Compensation | ||||||||||||||||||
| Part II | Item 12. | Security Ownership of Certain Beneficial | ||||||||||||||||||
| Item 5. | Market for the Registrant’s Common Equity, | Owners and Management and Related | ||||||||||||||||||
| Related Stockholder Matters, and Issuer | Stockholder Matters | |||||||||||||||||||
| Purchases of Equity Securities | Item 13. | Certain Relationships and Related Transactions, | ||||||||||||||||||
| Item 6. | [Reserved] | and Director Independence | ||||||||||||||||||
| Item 7. | Management’s Discussion and Analysis of | Item 14. | Principal Accountant Fees and Services | |||||||||||||||||
| Financial Condition and Results of | Part IV | |||||||||||||||||||
| Operations | Item 15. | Exhibits and Financial Statement Schedules | ||||||||||||||||||
| Item 7A. | Quantitative and Qualitative Disclosures | Item 16. | Form 10-K Summary | |||||||||||||||||
| about Market Risk | Signatures | |||||||||||||||||||
| ACL | Allowance for credit losses | ||||
| AFS | Available for sale | ||||
| AIR | Accrued interest receivable | ||||
| ALCO | Asset/Liability Committee | ||||
| ALLL | Allowance for loan and lease losses | ||||
| ALM | Asset/liability management | ||||
| AOCI | Accumulated other comprehensive income | ||||
| ASC | FASB Accounting Standards Codification | ||||
| Associate | Person employed by FHN | ||||
| ASU | Accounting Standards Update | ||||
| Bank | First Horizon Bank | ||||
| BOLI | Bank-owned life insurance | ||||
BTFP |
Bank Term Funding Program |
||||
| C&I | Commercial, financial, and industrial loan portfolio | ||||
| CAS | Credit Assurance Services | ||||
| CARES Act | Coronavirus Aid, Relief, and Economic Security Act | ||||
| CBF | Capital Bank Financial | ||||
| CCAR | Comprehensive Capital Analysis and Review | ||||
| CECL | Current expected credit loss | ||||
| CEO | Chief Executive Officer | ||||
| CFPB | Consumer Financial Protection Bureau | ||||
| CMO | Collateralized mortgage obligations | ||||
CODM |
Chief Operating Decision-Maker |
||||
 |
1 |
2023 FORM 10-K ANNUAL REPORT | ||||||
| TABLE OF CONTENTS and GLOSSARY | ||
| Company | First Horizon Corporation | ||||
| Corporation | First Horizon Corporation | ||||
| CRA | Community Reinvestment Act | ||||
| CRE | Commercial Real Estate | ||||
| CRMC | Credit Risk Management Committee | ||||
| DTA | Deferred tax asset | ||||
| DTL | Deferred tax liability | ||||
EAD |
Exposure as default |
||||
| ECP | Equity Compensation Plan | ||||
| EPS | Earnings per share | ||||
Fannie Mae |
Federal National Mortgage Association | ||||
| FASB | Financial Accounting Standards Board | ||||
| FDIC | Federal Deposit Insurance Corporation | ||||
| Federal Reserve | Federal Reserve Board | ||||
| Fed | Federal Reserve Board | ||||
| FHA | Federal Housing Administration | ||||
| FHLB | Federal Home Loan Bank | ||||
| FHN | First Horizon Corporation | ||||
| FHNF | FHN Financial; FHN's fixed income division | ||||
| FICO | Fair Isaac Corporation | ||||
| First Horizon | First Horizon Corporation | ||||
| FRB | Federal Reserve Bank or the Federal Reserve Board | ||||
Freddie Mac |
Federal Home Loan Mortgage Corporation | ||||
| FTE | Fully taxable equivalent | ||||
| FTRESC | FT Real Estate Securities Company, Inc. | ||||
| GAAP | Generally accepted accounting principles (U.S.) |
||||
GHG |
Greenhouse Gas |
||||
GNMA |
Government National Mortgage Association or Ginnie Mae |
||||
| GSE | Government sponsored enterprises, in this filing references Fannie Mae and Freddie Mac | ||||
| HELOC | Home equity line of credit | ||||
| HFS | Held for sale | ||||
HR |
Human Resources |
||||
| HTM | Held to maturity | ||||
| IBKC | IBERIABANK Corporation | ||||
| IBKC merger | FHN's merger of equals with IBKC that closed July 2020 | ||||
| ISDA | International Swap and Derivatives Association | ||||
| IRS | Internal Revenue Service | ||||
| LGD | Loss given default | ||||
| LIBOR | London Inter-Bank Offered Rate | ||||
| LIHTC | Low Income Housing Tax Credit | ||||
| LLC | Limited Liability Company | ||||
| LMC | Loans to mortgage companies | ||||
| LOCOM | Lower of cost or market | ||||
| LRRD | Loan Rehab and Recovery Department | ||||
| LTV | Loan-to-value | ||||
| MBS | Mortgage-backed securities | ||||
| MD&A | Management’s Discussion and Analysis of Financial Condition and Results of Operations | ||||
| NAICS | North American Industry Classification System | ||||
| NII | Net interest income | ||||
| NM | Not meaningful | ||||
| NMTC | New Market Tax Credit | ||||
| NPA | Nonperforming asset | ||||
| Non-PCD | Non-Purchased Credit Deteriorated Financial Assets | ||||
| NPL | Nonperforming loan | ||||
| OREO | Other Real Estate Owned |
||||
| PCAOB | Public Company Accounting Oversight Board | ||||
| PCD | Purchased credit deteriorated financial assets |
||||
| PCI | Purchased credit impaired | ||||
| PD | Probability of default | ||||
| PM | Portfolio managers | ||||
| PPP | Paycheck Protection Program | ||||
| PSU | Performance Stock Unit | ||||
| RE | Real estate | ||||
| RM | Relationship managers | ||||
| ROA | Return on Assets | ||||
| ROU | Right of use | ||||
| RPL | Reasonably possible loss | ||||
| SBA | Small Business Administration | ||||
| SEC | Securities and Exchange Commission | ||||
| SOFR | Secure Overnight Funding Rate | ||||
| SVaR | Stressed Value-at-Risk | ||||
| TD | The Toronto-Dominion Bank | ||||
| TD Merger Agreement | Merger agreement between FHN, TD, and certain TD subsidiaries, signed in February 2022 and terminated in May 2023 |
||||
TD Transaction |
The acquisition of FHN by TD contemplated by the TD Merger Agreement |
||||
| TDR | Troubled Debt Restructuring | ||||
| TRUP | Trust preferred loan | ||||
| UPB | Unpaid principal balance | ||||
| USDA | United States Department of Agriculture | ||||
| VaR | Value-at-Risk | ||||
| VIE | Variable Interest Entities | ||||
| we/us/our | First Horizon Corporation | ||||
|
2 |
2023 FORM 10-K ANNUAL REPORT | ||||||
| EXECUTIVE SUMMARY OF PRINCIPAL INVESTMENT RISKS | ||||||||
|
3 |
2023 FORM 10-K ANNUAL REPORT | ||||||
| EXECUTIVE SUMMARY OF PRINCIPAL INVESTMENT RISKS | ||||||||
|
4 |
2023 FORM 10-K ANNUAL REPORT | ||||||
| FORWARD-LOOKING STATEMENTS | ||||||||
|
5 |
2023 FORM 10-K ANNUAL REPORT | ||||||
| ITEM 1. BUSINESS | ||||||||
| PART I | ||
| Businesses | Principal Brands | ||||
| Banking & financial services generally |
First Horizon &
First Horizon Bank
|
||||
| Fixed income / capital markets | FHN Financial |
||||
| Mortgage lending | First Horizon Bank |
||||
| Insurance brokerage & management services | First Horizon Advisors |
||||
| Wealth management & brokerage services | First Horizon Advisors |
||||
| State | # | State | # | |||||||||||
| Tennessee | 135 | Arkansas | 12 | |||||||||||
| North Carolina | 79 | South Carolina | 10 | |||||||||||
| Florida | 76 | Texas | 8 | |||||||||||
| Louisiana | 56 | Virginia | 8 | |||||||||||
| Alabama | 13 | Mississippi | 4 | |||||||||||
| Georgia | 13 | New York | 1 | |||||||||||
|
6 |
2023 FORM 10-K ANNUAL REPORT | ||||||
| ITEM 1. BUSINESS | ||||||||
| Commercial | $47 B |
76 | % | ||||||||
| Consumer | $14 B |
24 | % | ||||||||
| Total Loans | $61 B |
100 | % | ||||||||
| Commercial Portfolios | % of Type | % of Total | |||||||||
| C&I | 70 | % | 53 | % | |||||||
| CRE | 30 | 23 | |||||||||
| Consumer Portfolios | % of Type | % of Total | |||||||||
| Consumer real estate | 95 | % | 23 | % | |||||||
| Credit card/other | 5 | 1 | |||||||||
C&I ($33B) |
CRE ($14B) |
Cons. RE ($14B) |
|||||||||||||||||||||
| Tennessee | 21 | % | Florida | 27 | % | Florida | 29 | % | |||||||||||||||
| Florida | 13 | % | Texas | 13 | % | Tennessee | 22 | % | |||||||||||||||
| Texas | 11 | % | N. Carolina | 12 | % | Texas | 11 | % | |||||||||||||||
| N. Carolina | 7 | % | Georgia | 9 | % | Louisiana | 8 | % | |||||||||||||||
| Louisiana | 6 | % | Tennessee | 9 | % | N. Carolina | 7 | % | |||||||||||||||
| Georgia | 5 | % | Louisiana | 8 | % | New York | 5 | % | |||||||||||||||
| California | 5 | % | All other | 22 | % | Georgia | 5 | % | |||||||||||||||
| All other | 32 | % | All other | 13 | % | ||||||||||||||||||
| Finance and insurance | 12 | % | ||||||
| Real estate and rental and leasing (a) | 12 | |||||||
| Health care and social assistance | 8 | |||||||
| Accommodation and food service | 7 | |||||||
| Manufacturing | 7 | |||||||
| Wholesale trade | 7 | |||||||
| Loans to mortgage companies | 6 | |||||||
| Retail trade | 6 | |||||||
| Transportation and warehousing | 5 | |||||||
| Energy | 4 | |||||||
| Other C&I | 26 | |||||||
| Multi-family | 31 | % | ||||||
| Office | 20 | |||||||
| Retail | 16 | |||||||
| Industrial | 16 | |||||||
| Hospitality | 10 | |||||||
| Land/land development | 2 | |||||||
| Other CRE | 5 | |||||||
|
7 |
2023 FORM 10-K ANNUAL REPORT | ||||||
| ITEM 1. BUSINESS | ||||||||
| Client Types | % of Total | Acct Types | % of Total | FDIC Insured Status | % of Total | Source | % of Total | |||||||||||||||||||||||||
| Commercial | 55% | Savings | 38% | Estimated Insured | 59% | Tennessee | 38% |
|||||||||||||||||||||||||
| Consumer | 45% | Time deposits | 10% | Est. Uninsured - Total | 41% | Florida | 18% |
|||||||||||||||||||||||||
| Other interest | 26% | Est. Uninsured - Collateralized | 8% | Louisiana | 12% |
|||||||||||||||||||||||||||
| Noninterest | 26% | N. Carolina | 12% |
|||||||||||||||||||||||||||||
| All other | 20% | |||||||||||||||||||||||||||||||
| (Dollars in millions) | Regional | Specialty | |||||||||
2023 Average assets |
$ | 45,858 | $ | 20,161 | |||||||
2023 Net interest income |
$ | 2,354 | $ | 518 | |||||||
2023 Noninterest income |
$ | 433 | $ | 209 | |||||||
2023 Pre-tax income |
$ | 1,262 | $ | 313 | |||||||
|
8 |
2023 FORM 10-K ANNUAL REPORT | ||||||
| ITEM 1. BUSINESS | ||||||||
|
9 |
2023 FORM 10-K ANNUAL REPORT | ||||||
| ITEM 1. BUSINESS | ||||||||
| 2023 | 2022 | 2021 | 2020 | 2019 | |||||||||||||
| Net interest income | $ | 2,540 | $ | 2,392 | $ | 1,994 | $ | 1,662 | $ | 1,210 | |||||||
| Noninterest income | 927 | 815 | 1,076 | 1,492 | 654 | ||||||||||||
| Net income available to common shareholders | 865 | 868 | 962 | 822 | 435 | ||||||||||||
| Total loans and leases | 61,292 | 58,102 | 54,859 | 58,232 | 31,061 | ||||||||||||
| Provision (benefit) for credit losses | 260 | 95 | (310) | 503 | 45 | ||||||||||||
| Net Charge-offs | 170 | 59 | 2 | 120 | 27 | ||||||||||||
| Net interest margin | 3.42 | % | 3.10 | % | 2.48 | % | 2.86 | % | 3.28 | % | |||||||
| Total assets | 81,661 | 78,953 | 89,092 | 84,209 | 43,311 | ||||||||||||
| Total deposits | 65,780 | 63,489 | 74,895 | 69,982 | 32,430 | ||||||||||||
| Total term borrowings | 1,150 | 1,597 | 1,590 | 1,670 | 791 | ||||||||||||
| Total liabilities | 72,370 | 70,406 | 80,598 | 75,902 | 38,235 | ||||||||||||
| Preferred stock | 520 | 1,014 | 520 | 470 | 96 | ||||||||||||
| Total shareholders’ equity (financial statement) | 9,291 | 8,547 | 8,494 | 8,307 | 5,076 | ||||||||||||
| Common Equity Tier 1 Capital (regulatory) | 8,104 | 7,032 | 6,367 | 6,110 | 3,409 | ||||||||||||
|
10 |
2023 FORM 10-K ANNUAL REPORT | ||||||
| ITEM 1. BUSINESS | ||||||||
|
11 |
2023 FORM 10-K ANNUAL REPORT | ||||||
| ITEM 1. BUSINESS | ||||||||
|
12 |
2023 FORM 10-K ANNUAL REPORT | ||||||
| ITEM 1. BUSINESS | ||||||||
|
13 |
2023 FORM 10-K ANNUAL REPORT | ||||||
| ITEM 1. BUSINESS | ||||||||
|
14 |
2023 FORM 10-K ANNUAL REPORT | ||||||
| ITEM 1. BUSINESS | ||||||||
|
15 |
2023 FORM 10-K ANNUAL REPORT | ||||||
| ITEM 1. BUSINESS | ||||||||
|
16 |
2023 FORM 10-K ANNUAL REPORT | ||||||
| ITEM 1. BUSINESS | ||||||||
| Federal Reserve Policy Phase | |||||||||||
| Tightening | Neutral | Easing | |||||||||
| Fixed Income Performance Tends to be |
Weaker | Average | Stronger | ||||||||
|
17 |
2023 FORM 10-K ANNUAL REPORT | ||||||
| ITEM 1. BUSINESS | ||||||||
| Driver | If Driver Is: | FI Revenues Tend to Be: | ||||||
| Interest rates | Rising/up | Lower | ||||||
| Falling/down | Higher | |||||||
| Market volatility |
Extreme
(low or high)
|
Lower | ||||||
| Moderate | Higher | |||||||
| Yield curve | Flat or Inverted | Lower | ||||||
| Steep | Higher | |||||||
| Credit spreads | Tighter | Lower | ||||||
| Wider | Higher | |||||||
| Depository Liquidity | Lower | Lower | ||||||
| Greater | Higher | |||||||
| Economy outlook | Positive | Lower | ||||||
| Negative | Higher | |||||||
|
18 |
2023 FORM 10-K ANNUAL REPORT | ||||||
| ITEM 1. BUSINESS | ||||||||
|
19 |
2023 FORM 10-K ANNUAL REPORT | ||||||
| ITEM 1. BUSINESS | ||||||||
|
20 |
2023 FORM 10-K ANNUAL REPORT | ||||||
| ITEM 1. BUSINESS | ||||||||
|
21 |
2023 FORM 10-K ANNUAL REPORT | ||||||
| ITEM 1. BUSINESS | ||||||||
|
22 |
2023 FORM 10-K ANNUAL REPORT | ||||||
| ITEM 1. BUSINESS | ||||||||
| Well capitalized |
•Common Equity Tier 1 Capital ratio of at least 6.5%
•Tier 1 Capital ratio of at least 8%
•Total Capital ratio of at least 10%
•Leverage ratio of at least 5%
•Not subject to a directive, order, or written agreement to meet and maintain specific capital levels
|
||||
| Adequately capitalized |
•Common Equity Tier 1 Capital ratio of at least 4.5%
•Tier 1 Capital ratio of at least 6%
•Total Capital ratio of at least 8%
•Leverage ratio of at least 4%
•Not subject to a directive, order, or written agreement to meet and maintain specific capital levels
|
||||
| Undercapitalized | Failure to maintain any requirement to be adequately capitalized | ||||
| Significantly Undercapitalized | Failure to maintain Common Equity Tier 1 Capital ratio of at least 3%, Tier 1 Capital ratio of at least 4%, Total Capital ratio of at least 6%, or a Leverage ratio of at least 3% | ||||
| Critically Undercapitalized | Failure to maintain a level of tangible equity equal to at least 2% of total assets | ||||
|
23 |
2023 FORM 10-K ANNUAL REPORT | ||||||
| ITEM 1. BUSINESS | ||||||||
|
24 |
2023 FORM 10-K ANNUAL REPORT | ||||||
| ITEM 1. BUSINESS | ||||||||
|
25 |
2023 FORM 10-K ANNUAL REPORT | ||||||
| ITEM 1. BUSINESS | ||||||||
|
26 |
2023 FORM 10-K ANNUAL REPORT | ||||||
| ITEM 1. BUSINESS | ||||||||
|
27 |
2023 FORM 10-K ANNUAL REPORT | ||||||
| ITEM 1. BUSINESS | ||||||||
|
28 |
2023 FORM 10-K ANNUAL REPORT | ||||||
| ITEM 1A. RISK FACTORS | ||||||||
| Topic | Page | Topic | Page | |||||||||||||||||
| Traditional Competition Risks | Risks of Expense Control | |||||||||||||||||||
| Traditional Strategic Risks | Geographic Risks | |||||||||||||||||||
| Industry Disruption | Insurance | |||||||||||||||||||
| Operational Risks | Liquidity & Funding Risks | |||||||||||||||||||
| Cybersecurity Risks | Credit Ratings | |||||||||||||||||||
| Risks from Economic Downturns & Changes | Interest Rate & Yield Curve Risks | |||||||||||||||||||
| Risks Associated with Monetary Events | Asset Inventories & Market Risks | |||||||||||||||||||
| Risks Related to Businesses We May Exit | Mortgage Business Risks | |||||||||||||||||||
| Reputation Risks | Pre-2009 Mortgage Business Risks | |||||||||||||||||||
| Credit Risks | Accounting Risks | |||||||||||||||||||
| Service Risks | Share Owning & Governance Risks | |||||||||||||||||||
| Regulatory, Legislative, and Legal Risks | ||||||||||||||||||||
|
29 |
2023 FORM 10-K ANNUAL REPORT | ||||||
| ITEM 1A. RISK FACTORS | ||||||||
|
30 |
2023 FORM 10-K ANNUAL REPORT | ||||||
| ITEM 1A. RISK FACTORS | ||||||||
|
31 |
2023 FORM 10-K ANNUAL REPORT | ||||||
| ITEM 1A. RISK FACTORS | ||||||||
|
32 |
2023 FORM 10-K ANNUAL REPORT | ||||||
| ITEM 1A. RISK FACTORS | ||||||||
|
33 |
2023 FORM 10-K ANNUAL REPORT | ||||||
| ITEM 1A. RISK FACTORS | ||||||||
|
34 |
2023 FORM 10-K ANNUAL REPORT | ||||||
| ITEM 1A. RISK FACTORS | ||||||||
|
35 |
2023 FORM 10-K ANNUAL REPORT | ||||||
| ITEM 1A. RISK FACTORS | ||||||||
|
36 |
2023 FORM 10-K ANNUAL REPORT | ||||||
| ITEM 1A. RISK FACTORS | ||||||||
|
37 |
2023 FORM 10-K ANNUAL REPORT | ||||||
| ITEM 1A. RISK FACTORS | ||||||||
|
38 |
2023 FORM 10-K ANNUAL REPORT | ||||||
| ITEM 1A. RISK FACTORS | ||||||||
|
39 |
2023 FORM 10-K ANNUAL REPORT | ||||||
| ITEM 1A. RISK FACTORS | ||||||||
|
40 |
2023 FORM 10-K ANNUAL REPORT | ||||||
| ITEM 1A. RISK FACTORS | ||||||||
|
41 |
2023 FORM 10-K ANNUAL REPORT | ||||||
| ITEM 1A. RISK FACTORS | ||||||||
|
42 |
2023 FORM 10-K ANNUAL REPORT | ||||||
| ITEM 1A. RISK FACTORS | ||||||||
|
43 |
2023 FORM 10-K ANNUAL REPORT | ||||||
| ITEM 1A. RISK FACTORS | ||||||||
|
44 |
2023 FORM 10-K ANNUAL REPORT | ||||||
| ITEM 1A. RISK FACTORS | ||||||||
|
45 |
2023 FORM 10-K ANNUAL REPORT | ||||||
| ITEM 1A. RISK FACTORS | ||||||||
|
46 |
2023 FORM 10-K ANNUAL REPORT | ||||||
| ITEM 1A. RISK FACTORS | ||||||||
|
47 |
2023 FORM 10-K ANNUAL REPORT | ||||||
| ITEM 1A. RISK FACTORS | ||||||||
|
48 |
2023 FORM 10-K ANNUAL REPORT | ||||||
ITEM 1B. UNRESOLVED STAFF COMMENTS THRU ITEM 4. MINE SAFETY DISCLOSURES | ||||||||
|
49 |
2023 FORM 10-K ANNUAL REPORT | ||||||
| SUPPLEMENTAL PART I INFORMATION | ||||||||
| Name & Age | Current (Year First Elected to Office) and Recent Offices & Positions | ||||
|
Terry L. Akins
Age: 60
|
Senior Executive Vice President—Chief Risk Officer of First Horizon & the Bank (2020)
Following the closing of the merger of equals between First Horizon and IBKC, Ms. Akins assumed the role of Senior Executive Vice President—Chief Risk Officer of First Horizon and the Bank. Prior to the merger, she had several roles with IBERIABANK Corporation and IBERIABANK starting in 2002, the most recent of which was Senior Executive Vice President and Chief Risk Officer (2017-2020).
|
||||
|
Elizabeth A. Ardoin
Age: 54
|
Senior Executive Vice President—Chief Communications Officer of First Horizon & the Bank (2020)
Following the closing of the merger of equals between First Horizon and IBKC, Ms. Ardoin assumed the role of Senior Executive Vice President—Chief Communications Officer of First Horizon and the Bank. Prior to the merger, she had several roles with IBERIABANK Corporation and IBERIABANK starting in 2002, the most recent of which was Senior Executive Vice President and Director of Communications (2002-2020), which included marketing, public relations, human resources, and corporate real estate, and she served as chief of staff to the CEO.
|
||||
|
Hope Dmuchowski
Age: 45
Principal Financial Officer
|
Senior Executive Vice President—Chief Financial Officer of First Horizon & the Bank (2021)
Ms. Dmuchowski was elected to her current position in November 2021. Previously, she was Executive Vice President, Head of Financial Planning and Analysis and Management Reporting for Truist Financial Corp. (Sept.-Nov. 2021); Executive Vice President, Chief Financial Officer Corporate Banking, Commercial Banking and Corporate Groups for Truist (2019-2021); Executive Vice President, Chief Financial Officer Group Director for BB&T Corp. (2017-2019); and Sr. Vice President, Chief Financial and Operations Officer—Enterprise Operations Services for BB&T (2013-2017). Her career with BB&T, a predecessor of Truist, started in 2007.
|
||||
|
Jeff L. Fleming
Age: 62
Principal Accounting Officer
|
Executive Vice President—Chief Accounting Officer and Corporate Controller of First Horizon & the Bank (2012)
Mr. Fleming assumed the role of Executive Vice President—Chief Accounting Officer and Corporate Controller in 2012. Previously, starting in 1984, he held several positions with us, most recently (before his current role) Executive Vice President—Corporate Controller (2010-2011).
|
||||
|
D. Bryan Jordan
Age: 62
Principal Executive Officer
|
President and Chief Executive Officer (2008) and Chairman of the Board (2012-2020 and since 2022) of First Horizon & the Bank
Mr. Jordan became President and Chief Executive Officer in 2008. He was Chairman of the Board from 2012 until we closed the merger of equals between First Horizon and IBKC in 2020. He resumed being Chairman in 2022 on the second anniversary of the IBKC merger. From 2007 until 2008 Mr. Jordan was Executive Vice President and Chief Financial Officer of First Horizon and the Bank. From 2000 until 2002 Mr. Jordan was Comptroller, and from 2002 until 2007 Mr. Jordan was Chief Financial Officer, of Regions Financial Corp. During that time he was also an Executive Vice President and a Senior Executive Vice President of Regions.
|
||||
|
50 |
2023 FORM 10-K ANNUAL REPORT | ||||||
| SUPPLEMENTAL PART I INFORMATION | ||||||||
| Name & Age | Current (Year First Elected to Office) and Recent Offices & Positions | ||||
|
Tammy S. LoCascio
Age: 55
|
Senior Executive Vice President—Chief Operating Officer of First Horizon & the Bank (2021)
Following the closing of the merger of equals between First Horizon and IBKC in 2020, Ms. LoCascio assumed the role of Senior Executive Vice President—Chief Human Resources Officer of First Horizon and the Bank. Prior to the merger, starting in 2011, she served in several roles with the Bank, most recently Executive Vice President—Consumer Banking (2017-2020). In that role she led the retail, private client/wealth management, mortgage, and small business units.
|
||||
|
David T. Popwell
Age: 64
|
President—Specialty Banking of First Horizon & the Bank (2020)
Following the closing of the merger of equals between First Horizon and IBKC, Mr. Popwell assumed the role of President—Specialty Banking of First Horizon and the Bank. Prior to the merger, starting in 2007, he served in several roles, the most recent of which (before his current role) was President—Regional Banking (2013-2020). From 2004 to 2007 Mr. Popwell was President of SunTrust Bank—Memphis, and prior to that was an Executive Vice President of National Commerce Financial Corp.
|
||||
|
Anthony J. Restel
Age: 54
|
President—Regional Banking of First Horizon & the Bank (2021)
Following the closing of the merger of equals between First Horizon and IBKC in 2020, Mr. Restel assumed the role of Senior Executive Vice President—Chief Operating Officer of First Horizon and the Bank. From July to November 2021, Mr. Restel also acted as interim Chief Financial Officer. Prior to the merger, he had several roles with IBERIABANK Corporation and IBERIABANK starting in 2001, the most recent of which was Vice Chairman and Chief Financial Officer (2005-2020). During his tenure as Chief Financial Officer, Mr. Restel also served as Chief Credit Officer of IBERIABANK (2007-2009).
|
||||
|
Susan L. Springfield
Age: 59
|
Senior Executive Vice President—Chief Credit Officer of First Horizon & the Bank (2013)
Ms. Springfield assumed the role of Executive Vice President—Chief Credit Officer of First Horizon & the Bank in 2013, with “Senior” added to her title in 2020. Previously, starting in 1998, she served the Bank in several roles, the most recent of which (before her current role) was Executive Vice President—Commercial Banking (2011-2013).
|
||||
|
51 |
2023 FORM 10-K ANNUAL REPORT | ||||||
ITEM 5. MARKET FOR COMMON EQUITY, STOCKHOLDER MATTERS, & EQUITY PURCHASES AND ITEM 6. | ||||||||
| PART II | ||
|
52 |
2023 FORM 10-K ANNUAL REPORT | ||||||
ITEM 5. MARKET FOR COMMON EQUITY, STOCKHOLDER MATTERS, & EQUITY PURCHASES AND ITEM 6. | ||||||||
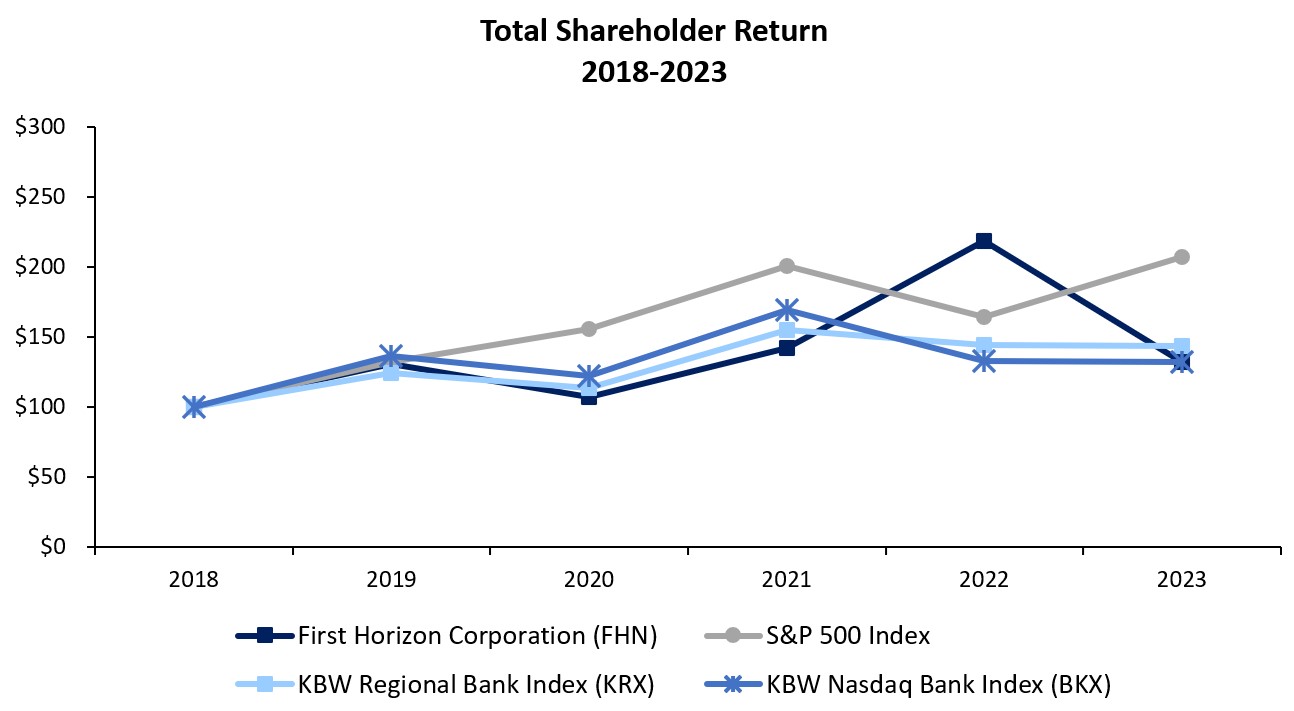
| 2018 | 2019 | 2020 | 2021 | 2022 | 2023 | |||||||||||||||
| First Horizon Corporation (FHN) | $ | 100.00 | $ | 130.43 | $ | 106.73 | $ | 141.55 | $ | 217.90 | $ | 131.82 | ||||||||
| S&P 500 Index | 100.00 | 131.47 | 155.65 | 200.29 | 163.98 | 207.04 | ||||||||||||||
| KBW Regional Bank Index (KRX) | 100.00 | 123.87 | 113.11 | 154.57 | 143.87 | 143.30 | ||||||||||||||
| KBW Nasdaq Bank Index (BKX) | 100.00 | 136.12 | 122.09 | 168.90 | 132.76 | 131.58 | ||||||||||||||
|
53 |
2023 FORM 10-K ANNUAL REPORT | ||||||
| ITEM 7. MANAGEMENT'S DISCUSSION & ANALYSIS (MD&A) | ||||||||
|
54 |
2023 FORM 10-K ANNUAL REPORT | ||||||
| ITEM 7. MANAGEMENT'S DISCUSSION & ANALYSIS (MD&A) | ||||||||
|
55 |
2023 FORM 10-K ANNUAL REPORT | ||||||
| ITEM 7. MANAGEMENT'S DISCUSSION & ANALYSIS (MD&A) | ||||||||
| For the years ended December 31, | |||||||||||||||||
| (Dollars in millions, except per share data) | 2023 | 2022 | 2021 | ||||||||||||||
| Pre-provision net revenue (a) | $ | 1,388 | $ | 1,254 | $ | 974 | |||||||||||
| Diluted earnings per common share | $ | 1.54 | $ | 1.53 | $ | 1.74 | |||||||||||
| Return on average assets (b) | 1.12 | % | 1.08 | % | 1.15 | % | |||||||||||
| Return on average common equity (c) | 11.01 | % | 11.81 | % | 12.53 | % | |||||||||||
| Return on average tangible common equity (a) (d) | 14.11 | % | 15.58 | % | 16.46 | % | |||||||||||
| Net interest margin (e) | 3.42 | % | 3.10 | % | 2.48 | % | |||||||||||
| Noninterest income to total revenue (f) | 26.82 | % | 24.99 | % | 34.77 | % | |||||||||||
| Efficiency ratio (g) | 59.90 | % | 61.24 | % | 68.56 | % | |||||||||||
| Allowance for loan and lease losses to total loans and leases | 1.26 | % | 1.18 | % | 1.22 | % | |||||||||||
| Net charge-offs (recoveries) to average loans and leases | 0.28 | % | 0.11 | % | — | % | |||||||||||
| Total period-end equity to period-end assets | 11.38 | % | 10.83 | % | 9.53 | % | |||||||||||
| Tangible common equity to tangible assets (a) | 8.48 | % | 7.12 | % | 6.73 | % | |||||||||||
| Cash dividends declared per common share | $ | 0.60 | $ | 0.60 | $ | 0.60 | |||||||||||
| Book value per common share | $ | 15.17 | $ | 13.48 | $ | 14.39 | |||||||||||
| Tangible book value per common share (a) | $ | 12.13 | $ | 10.23 | $ | 11.00 | |||||||||||
| Common equity Tier 1 | 11.40 | % | 10.17 | % | 9.92 | % | |||||||||||
| Market capitalization | $ | 7,913 | $ | 13,159 | $ | 8,713 | |||||||||||
|
56 |
2023 FORM 10-K ANNUAL REPORT | ||||||
| ITEM 7. MANAGEMENT'S DISCUSSION & ANALYSIS (MD&A) | ||||||||
| (Dollars in millions) | 2023 | 2022 | 2021 | |||||||||||||||||||||||||||||||||||||||||||||||||||||
| Assets: | Average Balance | Interest Income/Expense | Yield/Rate | Average Balance | Interest Income/Expense | Yield/Rate | Average Balance | Interest Income/Expense | Yield/Rate | |||||||||||||||||||||||||||||||||||||||||||||||
| Loans and leases: | ||||||||||||||||||||||||||||||||||||||||||||||||||||||||
| Commercial loans and leases | $ | 46,175 | $ | 2,958 | 6.41 | % | $ | 43,691 | $ | 1,823 | 4.18 | % | $ | 44,325 | $ | 1,498 | 3.38 | % | ||||||||||||||||||||||||||||||||||||||
| Consumer loans | 13,994 | 630 | 4.48 | 12,261 | 479 | 3.89 | 11,973 | 469 | 3.92 | |||||||||||||||||||||||||||||||||||||||||||||||
| Total loans and leases | 60,169 | 3,588 | 5.96 | 55,952 | 2,302 | 4.11 | 56,298 | 1,967 | 3.49 | |||||||||||||||||||||||||||||||||||||||||||||||
| Loans held for sale | 664 | 51 | 7.71 | 884 | 39 | 4.41 | 956 | 33 | 3.44 | |||||||||||||||||||||||||||||||||||||||||||||||
| Investment securities | 9,912 | 250 | 2.52 | 9,976 | 200 | 2.01 | 8,623 | 123 | 1.43 | |||||||||||||||||||||||||||||||||||||||||||||||
| Trading securities | 1,179 | 78 | 6.62 | 1,438 | 58 | 4.04 | 1,366 | 30 | 2.17 | |||||||||||||||||||||||||||||||||||||||||||||||
| Federal funds sold | 61 | 4 | 5.56 | 191 | 4 | 2.09 | 37 | — | 0.15 | |||||||||||||||||||||||||||||||||||||||||||||||
| Securities purchased under agreements to resell (a) | 318 | 15 | 4.81 | 522 | 6 | 1.12 | 584 | — | (0.09) | |||||||||||||||||||||||||||||||||||||||||||||||
| Interest-bearing deposits with banks | 2,504 | 130 | 5.20 | 8,672 | 87 | 1.00 | 13,123 | 17 | 0.13 | |||||||||||||||||||||||||||||||||||||||||||||||
| Total earning assets / Total interest income | $ | 74,807 | $ | 4,116 | 5.50 | % | $ | 77,635 | $ | 2,696 | 3.47 | % | $ | 80,987 | $ | 2,170 | 2.68 | % | ||||||||||||||||||||||||||||||||||||||
| Cash and due from banks | 1,012 | 1,217 | 1,261 | |||||||||||||||||||||||||||||||||||||||||||||||||||||
| Goodwill and other intangible assets, net | 1,720 | 1,777 | 1,836 | |||||||||||||||||||||||||||||||||||||||||||||||||||||
| Premises and equipment, net | 596 | 636 | 712 | |||||||||||||||||||||||||||||||||||||||||||||||||||||
| Allowance for loan and lease losses | (740) | (648) | (834) | |||||||||||||||||||||||||||||||||||||||||||||||||||||
| Other assets | 4,288 | 3,600 | 3,647 | |||||||||||||||||||||||||||||||||||||||||||||||||||||
| Total assets | $ | 81,683 | $ | 84,217 | $ | 87,609 | ||||||||||||||||||||||||||||||||||||||||||||||||||
| Liabilities and Shareholders' Equity: | ||||||||||||||||||||||||||||||||||||||||||||||||||||||||
| Interest-bearing deposits: | ||||||||||||||||||||||||||||||||||||||||||||||||||||||||
| Savings | $ | 23,547 | $ | 679 | 2.88 | % | $ | 24,292 | $ | 94 | 0.39 | % | $ | 27,283 | $ | 36 | 0.13 | % | ||||||||||||||||||||||||||||||||||||||
| Other interest-bearing deposits | 15,300 | 351 | 2.30 | 15,641 | 72 | 0.47 | 15,688 | 20 | 0.13 | |||||||||||||||||||||||||||||||||||||||||||||||
| Time deposits | 6,095 | 236 | 3.87 | 2,963 | 18 | 0.60 | 4,281 | 25 | 0.57 | |||||||||||||||||||||||||||||||||||||||||||||||
| Total interest-bearing deposits | 44,942 | 1,266 | 2.82 | 42,896 | 184 | 0.43 | 47,252 | 81 | 0.17 | |||||||||||||||||||||||||||||||||||||||||||||||
| Federal funds purchased | 349 | 18 | 5.12 | 699 | 11 | 1.56 | 949 | 1 | 0.12 | |||||||||||||||||||||||||||||||||||||||||||||||
| Securities sold under agreements to repurchase | 1,426 | 52 | 3.66 | 881 | 7 | 0.77 | 1,235 | 4 | 0.30 | |||||||||||||||||||||||||||||||||||||||||||||||
| Trading liabilities | 301 | 12 | 4.16 | 480 | 12 | 2.56 | 540 | 6 | 1.11 | |||||||||||||||||||||||||||||||||||||||||||||||
| Other short-term borrowings | 2,688 | 140 | 5.19 | 229 | 5 | 2.26 | 124 | — | 0.09 | |||||||||||||||||||||||||||||||||||||||||||||||
| Term borrowings | 1,335 | 72 | 5.39 | 1,596 | 72 | 4.51 | 1,645 | 72 | 4.37 | |||||||||||||||||||||||||||||||||||||||||||||||
| Total interest-bearing liabilities / Total interest expense | $ | 51,041 | $ | 1,560 | 3.06 | % | $ | 46,781 | $ | 291 | 0.62 | % | $ | 51,745 | $ | 164 | 0.32 | % | ||||||||||||||||||||||||||||||||||||||
| Noninterest-bearing deposits | 19,341 | 26,851 | 25,879 | |||||||||||||||||||||||||||||||||||||||||||||||||||||
| Other liabilities | 2,396 | 2,006 | 1,506 | |||||||||||||||||||||||||||||||||||||||||||||||||||||
| Total liabilities | 72,778 | 75,638 | 79,130 | |||||||||||||||||||||||||||||||||||||||||||||||||||||
| Shareholders' equity | 8,610 | 8,284 | 8,184 | |||||||||||||||||||||||||||||||||||||||||||||||||||||
| Noncontrolling interest | 295 | 295 | 295 | |||||||||||||||||||||||||||||||||||||||||||||||||||||
| Total shareholders' equity | 8,905 | 8,579 | 8,479 | |||||||||||||||||||||||||||||||||||||||||||||||||||||
| Total liabilities and shareholders' equity | $ | 81,683 | $ | 84,217 | $ | 87,609 | ||||||||||||||||||||||||||||||||||||||||||||||||||
| Net earnings assets / Net interest income (TE) / Net interest spread | $ | 23,766 | $ | 2,556 | 2.44 | % | $ | 30,854 | $ | 2,405 | 2.85 | % | $ | 29,242 | $ | 2,006 | 2.36 | % | ||||||||||||||||||||||||||||||||||||||
| Taxable equivalent adjustment | (16) | 0.98 | (13) | 0.25 | (12) | 0.12 | ||||||||||||||||||||||||||||||||||||||||||||||||||
| Net interest income / Net interest margin (b) | $ | 2,540 | 3.42 | % | $ | 2,392 | 3.10 | % | $ | 1,994 | 2.48 | % | ||||||||||||||||||||||||||||||||||||||||||||
|
57 |
2023 FORM 10-K ANNUAL REPORT | ||||||
| ITEM 7. MANAGEMENT'S DISCUSSION & ANALYSIS (MD&A) | ||||||||
| 2023 Compared to 2022 | 2022 Compared to 2021 | |||||||||||||||||||||||||||||||||||||
Increase (Decrease) Due to (a) |
Increase (Decrease) Due to (a) |
|||||||||||||||||||||||||||||||||||||
| (Dollars in millions) | Rate (b) |
Volume (b) |
Total | Rate (b) |
Volume (b) |
Total | ||||||||||||||||||||||||||||||||
| Interest income: | ||||||||||||||||||||||||||||||||||||||
| Loans and leases (c) | $ | 1,101 | $ | 185 | $ | 1,286 | $ | 347 | $ | (12) | $ | 335 | ||||||||||||||||||||||||||
| Loans held for sale | 24 | (12) | 12 | 9 | (3) | 6 | ||||||||||||||||||||||||||||||||
| Investment securities (c) | 51 | (1) | 50 | 56 | 21 | 77 | ||||||||||||||||||||||||||||||||
| Trading securities | 32 | (12) | 20 | 27 | 1 | 28 | ||||||||||||||||||||||||||||||||
| Other earning assets: | ||||||||||||||||||||||||||||||||||||||
| Federal funds sold | 3 | (3) | — | 3 | 1 | 4 | ||||||||||||||||||||||||||||||||
| Securities purchased under agreements to resell | 13 | (4) | 9 | 6 | — | 6 | ||||||||||||||||||||||||||||||||
| Interest-bearing deposits with banks | 143 | (100) | 43 | 77 | (8) | 69 | ||||||||||||||||||||||||||||||||
| Total other earning assets | 159 | (107) | 52 | 86 | (7) | 79 | ||||||||||||||||||||||||||||||||
| Total change in interest income - earning assets | $ | 1,367 | $ | 53 | $ | 1,420 | $ | 525 | $ | — | $ | 525 | ||||||||||||||||||||||||||
| Interest expense: | ||||||||||||||||||||||||||||||||||||||
| Interest-bearing deposits: | ||||||||||||||||||||||||||||||||||||||
| Savings | $ | 588 | $ | (3) | $ | 585 | $ | 63 | $ | (5) | $ | 58 | ||||||||||||||||||||||||||
| Other interest-bearing deposits | 280 | (1) | 279 | 53 | (1) | 52 | ||||||||||||||||||||||||||||||||
| Time deposits | 183 | 35 | 218 | 1 | (8) | (7) | ||||||||||||||||||||||||||||||||
| Total interest-bearing deposits | 1,051 | 31 | 1,082 | 117 | (14) | 103 | ||||||||||||||||||||||||||||||||
| Federal funds purchased | 15 | (8) | 7 | 10 | — | 10 | ||||||||||||||||||||||||||||||||
| Securities sold under agreements to repurchase | 39 | 6 | 45 | 4 | (1) | 3 | ||||||||||||||||||||||||||||||||
| Trading liabilities | 6 | (6) | — | 7 | (1) | 6 | ||||||||||||||||||||||||||||||||
| Other short-term borrowings | 15 | 120 | 135 | 5 | — | 5 | ||||||||||||||||||||||||||||||||
| Term borrowings | 13 | (13) | — | 2 | (2) | — | ||||||||||||||||||||||||||||||||
| Total change in interest expense - interest-bearing liabilities | 1,139 | 130 | 1,269 | 145 | (18) | 127 | ||||||||||||||||||||||||||||||||
| Net interest income, taxable-equivalent | $ | 228 | $ | (77) | $ | 151 | $ | 380 | $ | 18 | $ | 398 | ||||||||||||||||||||||||||
|
58 |
2023 FORM 10-K ANNUAL REPORT | ||||||
| ITEM 7. MANAGEMENT'S DISCUSSION & ANALYSIS (MD&A) | ||||||||
| 2023 vs. 2022 | 2022 vs. 2021 | |||||||||||||||||||||||||||||||||||||||||||
| (Dollars in millions) | 2023 | 2022 | 2021 | $ Change | % Change | $ Change | % Change | |||||||||||||||||||||||||||||||||||||
| Noninterest income | ||||||||||||||||||||||||||||||||||||||||||||
| Deposit transactions and cash management | $ | 179 | $ | 171 | $ | 175 | $ | 8 | 5 | % | $ | (4) | (2) | % | ||||||||||||||||||||||||||||||
| Fixed income | 133 | 205 | 406 | (72) | (35) | (201) | (50) | |||||||||||||||||||||||||||||||||||||
| Brokerage, management fees and commissions | 90 | 92 | 88 | (2) | (2) | 4 | 5 | |||||||||||||||||||||||||||||||||||||
| Card and digital banking fees | 77 | 84 | 78 | (7) | (8) | 6 | 8 | |||||||||||||||||||||||||||||||||||||
| Other service charges and fees | 54 | 54 | 44 | — | — | 10 | 23 | |||||||||||||||||||||||||||||||||||||
| Trust services and investment management | 47 | 48 | 51 | (1) | (2) | (3) | (6) | |||||||||||||||||||||||||||||||||||||
| Mortgage banking and title income | 23 | 68 | 154 | (45) | (66) | (86) | (56) | |||||||||||||||||||||||||||||||||||||
| Gain on merger termination | 225 | — | — | 225 | 100 | — | — | |||||||||||||||||||||||||||||||||||||
| Securities gains (losses), net | (4) | 18 | 13 | (22) | (122) | 5 | 38 | |||||||||||||||||||||||||||||||||||||
| Other income | 103 | 75 | 67 | 28 | 37 | 8 | 12 | |||||||||||||||||||||||||||||||||||||
| Total noninterest income | $ | 927 | $ | 815 | $ | 1,076 | $ | 112 | 14 | % | $ | (261) | (24) | % | ||||||||||||||||||||||||||||||
|
59 |
2023 FORM 10-K ANNUAL REPORT | ||||||
| ITEM 7. MANAGEMENT'S DISCUSSION & ANALYSIS (MD&A) | ||||||||
| 2023 vs. 2022 | 2022 vs. 2021 | |||||||||||||||||||||||||||||||||||||||||||
| (Dollars in millions) | 2023 | 2022 | 2021 | $ Change | % Change | $ Change | % Change | |||||||||||||||||||||||||||||||||||||
| Noninterest expense | ||||||||||||||||||||||||||||||||||||||||||||
| Personnel expense | $ | 1,100 | $ | 1,101 | $ | 1,210 | $ | (1) | — | % | $ | (109) | (9) | % | ||||||||||||||||||||||||||||||
| Net occupancy expense | 123 | 128 | 137 | (5) | (4) | (9) | (7) | |||||||||||||||||||||||||||||||||||||
| Deposit insurance expense | 122 | 32 | 24 | 90 | 281 | 8 | 33 | |||||||||||||||||||||||||||||||||||||
| Computer software | 111 | 113 | 116 | (2) | (2) | (3) | (3) | |||||||||||||||||||||||||||||||||||||
| Operations services | 87 | 87 | 80 | — | — | 7 | 9 | |||||||||||||||||||||||||||||||||||||
| Advertising and public relations | 71 | 50 | 37 | 21 | 42 | 13 | 35 | |||||||||||||||||||||||||||||||||||||
| Contributions | 61 | 7 | 14 | 54 | 771 | (7) | (50) | |||||||||||||||||||||||||||||||||||||
| Legal and professional fees | 49 | 62 | 68 | (13) | (21) | (6) | (9) | |||||||||||||||||||||||||||||||||||||
| Contract employment and outsourcing | 49 | 54 | 67 | (5) | (9) | (13) | (19) | |||||||||||||||||||||||||||||||||||||
| Amortization of intangible assets | 47 | 51 | 56 | (4) | (8) | (5) | (9) | |||||||||||||||||||||||||||||||||||||
| Equipment expense | 42 | 45 | 47 | (3) | (7) | (2) | (4) | |||||||||||||||||||||||||||||||||||||
| Communications and delivery | 35 | 37 | 37 | (2) | (5) | — | — | |||||||||||||||||||||||||||||||||||||
| Impairment of long-lived assets | — | — | 34 | — | — | (34) | (100) | |||||||||||||||||||||||||||||||||||||
| Other expense | 182 | 186 | 169 | (4) | (2) | 17 | 10 | |||||||||||||||||||||||||||||||||||||
| Total noninterest expense | $ | 2,079 | $ | 1,953 | $ | 2,096 | $ | 126 | 6 | % | $ | (143) | (7) | % | ||||||||||||||||||||||||||||||
|
60 |
2023 FORM 10-K ANNUAL REPORT | ||||||
| ITEM 7. MANAGEMENT'S DISCUSSION & ANALYSIS (MD&A) | ||||||||
|
61 |
2023 FORM 10-K ANNUAL REPORT | ||||||
| ITEM 7. MANAGEMENT'S DISCUSSION & ANALYSIS (MD&A) | ||||||||
| 2023 | 2022 | ||||||||||||||||||||||
| (Dollars in millions) | Balance | Mix | Balance | Mix | |||||||||||||||||||
| Securities available for sale at fair value: | |||||||||||||||||||||||
| Government agency issued MBS and CMO | $ | 6,630 | 68 | % | $ | 7,076 | 69 | % | |||||||||||||||
| Other U.S. government agencies (a) | 1,172 | 12 | 1,163 | 12 | |||||||||||||||||||
| States and municipalities | 589 | 6 | 597 | 6 | |||||||||||||||||||
| Total securities available for sale | $ | 8,391 | 86 | % | $ | 8,836 | 87 | % | |||||||||||||||
| Securities held to maturity at amortized cost: | |||||||||||||||||||||||
| Government agency issued MBS and CMO | $ | 1,323 | 14 | % | $ | 1,371 | 13 | % | |||||||||||||||
| Total investment securities | $ | 9,714 | 100 | % | $ | 10,207 | 100 | % | |||||||||||||||
|
62 |
2023 FORM 10-K ANNUAL REPORT | ||||||
| ITEM 7. MANAGEMENT'S DISCUSSION & ANALYSIS (MD&A) | ||||||||
As of December 31, 2023 |
||||||||||||||||||||||||||||||||||||||||||||||||||||||||||||||
| After 1 year | After 5 years | |||||||||||||||||||||||||||||||||||||||||||||||||||||||||||||
| Within 1 year | Within 5 years | Within 10 years | After 10 years | Total | ||||||||||||||||||||||||||||||||||||||||||||||||||||||||||
| (Dollars in millions) | Amount | Yield (b) | Amount | Yield (b) | Amount | Yield (b) | Amount | Yield (b) | Amount | Yield (b) | ||||||||||||||||||||||||||||||||||||||||||||||||||||
| Securities available for sale: | ||||||||||||||||||||||||||||||||||||||||||||||||||||||||||||||
| Government agency issued MBS and CMO (a) | $ | 29 | 2.30 | % | $ | 980 | 1.86 | % | $ | 1,060 | 2.22 | % | $ | 5,479 | 2.07 | % | $ | 7,548 | 2.34 | % | ||||||||||||||||||||||||||||||||||||||||||
| Other U.S. government agencies | — | — | 12 | 1.70 | 219 | 1.98 | 1,090 | 2.97 | 1,321 | 3.04 | ||||||||||||||||||||||||||||||||||||||||||||||||||||
| States and municipalities | 36 | 2.38 | 87 | 0.73 | 178 | 1.72 | 326 | 2.74 | 627 | 2.66 | ||||||||||||||||||||||||||||||||||||||||||||||||||||
| Total securities available for sale | $ | 65 | 2.34 | % | $ | 1,079 | 1.77 | % | $ | 1,457 | 2.12 | % | $ | 6,895 | 2.24 | % | $ | 9,496 | 2.46 | % | ||||||||||||||||||||||||||||||||||||||||||
| Securities held to maturity: | ||||||||||||||||||||||||||||||||||||||||||||||||||||||||||||||
| Government agency issued MBS and CMO (a) | $ | — | — | % | $ | 148 | 3.56 | % | $ | 170 | 3.44 | % | $ | 1,005 | 2.73 | % | $ | 1,323 | 2.91 | % | ||||||||||||||||||||||||||||||||||||||||||
| Total securities held to maturity | $ | — | — | % | $ | 148 | 3.56 | % | $ | 170 | 3.44 | % | $ | 1,005 | 2.73 | % | $ | 1,323 | 2.91 | % | ||||||||||||||||||||||||||||||||||||||||||
| (Dollars in millions) | 2023 | Percent of total | 2023 Growth Rate | 2022 | Percent of total | 2022 Growth Rate | 2021 | Percent of total | 2021 Growth Rate | |||||||||||||||||||||||||||||||||||||||||||||||
| Commercial: | ||||||||||||||||||||||||||||||||||||||||||||||||||||||||
| Commercial, financial, and industrial (a) | $ | 32,633 | 53 | % | 3 | % | $ | 31,781 | 55 | % | 2 | % | $ | 31,068 | 57 | % | (6) | % | ||||||||||||||||||||||||||||||||||||||
| Commercial real estate | 14,216 | 23 | 7 | 13,228 | 23 | 9 | 12,109 | 22 | (1) | |||||||||||||||||||||||||||||||||||||||||||||||
| Total commercial | 46,849 | 76 | 4 | 45,009 | 78 | 4 | 43,177 | 79 | (5) | |||||||||||||||||||||||||||||||||||||||||||||||
| Consumer: | ||||||||||||||||||||||||||||||||||||||||||||||||||||||||
| Consumer real estate | 13,650 | 23 | 11 | 12,253 | 21 | 14 | 10,772 | 20 | (8) | |||||||||||||||||||||||||||||||||||||||||||||||
| Credit card and other | 793 | 1 | (6) | 840 | 1 | (8) | 910 | 1 | (19) | |||||||||||||||||||||||||||||||||||||||||||||||
| Total consumer | 14,443 | 24 | 10 | 13,093 | 22 | 12 | 11,682 | 21 | (9) | |||||||||||||||||||||||||||||||||||||||||||||||
| Total loans and leases | $ | 61,292 | 100 | % | 5 | % | $ | 58,102 | 100 | % | 6 | % | $ | 54,859 | 100 | % | (6) | % | ||||||||||||||||||||||||||||||||||||||
|
63 |
2023 FORM 10-K ANNUAL REPORT | ||||||
| ITEM 7. MANAGEMENT'S DISCUSSION & ANALYSIS (MD&A) | ||||||||
| (Dollars in millions) | Within 1 Year | After 1 Year Within 5 Years |
After 5 Years Within 15 Years | After 15 Years | Total | ||||||||||||||||||||||||
| Commercial, financial, and industrial | $ | 6,864 | $ | 17,159 | $ | 7,666 | $ | 944 | $ | 32,633 | |||||||||||||||||||
| Commercial real estate | 2,641 | 8,691 | 2,834 | 50 | 14,216 | ||||||||||||||||||||||||
| Consumer real estate | 74 | 241 | 1,369 | 11,966 | 13,650 | ||||||||||||||||||||||||
| Credit card and other | 208 | 313 | 75 | 197 | 793 | ||||||||||||||||||||||||
| Total loans and leases | $ | 9,787 | $ | 26,404 | $ | 11,944 | $ | 13,157 | $ | 61,292 | |||||||||||||||||||
| For maturities over one year at fixed interest rates: | |||||||||||||||||||||||||||||
| Commercial, financial, and industrial | $ | 4,492 | $ | 5,211 | $ | 734 | $ | 10,437 | |||||||||||||||||||||
| Commercial real estate | 2,441 | 1,129 | 36 | 3,606 | |||||||||||||||||||||||||
| Consumer real estate | 181 | 1,180 | 3,325 | 4,686 | |||||||||||||||||||||||||
| Credit card and other | 76 | 43 | 171 | 290 | |||||||||||||||||||||||||
| Total loans and leases at fixed interest rates | $ | 7,190 | $ | 7,563 | $ | 4,266 | $ | 19,019 | |||||||||||||||||||||
| For maturities over one year at floating interest rates: | |||||||||||||||||||||||||||||
| Commercial, financial, and industrial | $ | 12,666 | $ | 2,456 | $ | 209 | $ | 15,331 | |||||||||||||||||||||
| Commercial real estate | 6,250 | 1,705 | 15 | 7,970 | |||||||||||||||||||||||||
| Consumer real estate | 60 | 188 | 8,641 | 8,889 | |||||||||||||||||||||||||
| Credit card and other | 238 | 32 | 26 | 296 | |||||||||||||||||||||||||
| Total loans and leases at floating interest rates | $ | 19,214 | $ | 4,381 | $ | 8,891 | $ | 32,486 | |||||||||||||||||||||
| Total maturities over one year | $ | 26,404 | $ | 11,944 | $ | 13,157 | $ | 51,505 | |||||||||||||||||||||
|
64 |
2023 FORM 10-K ANNUAL REPORT | ||||||
| ITEM 7. MANAGEMENT'S DISCUSSION & ANALYSIS (MD&A) | ||||||||
|
65 |
2023 FORM 10-K ANNUAL REPORT | ||||||
| ITEM 7. MANAGEMENT'S DISCUSSION & ANALYSIS (MD&A) | ||||||||
| December 31, 2023 | December 31, 2022 | |||||||||||||||||||||||||
| (Dollars in millions) | Amount | Percent | Amount | Percent | ||||||||||||||||||||||
| Industry: | ||||||||||||||||||||||||||
| Finance and insurance | $ | 4,083 | 12 | % | $ | 4,120 | 13 | % | ||||||||||||||||||
| Real estate and rental and leasing (a) | 3,858 | 12 | 3,277 | 10 | ||||||||||||||||||||||
| Health care and social assistance | 2,676 | 8 | 2,657 | 8 | ||||||||||||||||||||||
| Accommodation and food service | 2,288 | 7 | 2,238 | 7 | ||||||||||||||||||||||
| Manufacturing | 2,267 | 7 | 2,206 | 7 | ||||||||||||||||||||||
| Wholesale trade | 2,147 | 7 | 2,212 | 7 | ||||||||||||||||||||||
| Loans to mortgage companies | 2,019 | 6 | 2,258 | 7 | ||||||||||||||||||||||
| Retail trade | 1,866 | 6 | 1,835 | 6 | ||||||||||||||||||||||
| Transportation and warehousing | 1,580 | 5 | 1,432 | 4 | ||||||||||||||||||||||
| Energy | 1,293 | 4 | 1,364 | 4 | ||||||||||||||||||||||
| Other (professional, construction, education, etc.) (b) | 8,556 | 26 | 8,182 | 27 | ||||||||||||||||||||||
| Total C&I loan portfolio | $ | 32,633 | 100 | % | $ | 31,781 | 100 | % | ||||||||||||||||||
|
66 |
2023 FORM 10-K ANNUAL REPORT | ||||||
| ITEM 7. MANAGEMENT'S DISCUSSION & ANALYSIS (MD&A) | ||||||||
|
67 |
2023 FORM 10-K ANNUAL REPORT | ||||||
| ITEM 7. MANAGEMENT'S DISCUSSION & ANALYSIS (MD&A) | ||||||||
| December 31, 2023 | December 31, 2022 | |||||||||||||||||||||||||
| Amount | Percent | Amount | Percent | |||||||||||||||||||||||
| Property Type: | ||||||||||||||||||||||||||
| Multi-family | $ | 4,409 | 31 | % | $ | 3,484 | 27 | % | ||||||||||||||||||
| Office | 2,782 | 20 | 2,814 | 21 | ||||||||||||||||||||||
| Retail | 2,310 | 16 | 2,331 | 18 | ||||||||||||||||||||||
| Industrial | 2,236 | 16 | 2,076 | 16 | ||||||||||||||||||||||
| Hospitality | 1,467 | 10 | 1,418 | 11 | ||||||||||||||||||||||
| Land/land development | 307 | 2 | 309 | 2 | ||||||||||||||||||||||
| Other CRE (a) | 705 | 5 | 796 | 5 | ||||||||||||||||||||||
| Total CRE loan portfolio | $ | 14,216 | 100 | % | $ | 13,228 | 100 | % | ||||||||||||||||||
|
68 |
2023 FORM 10-K ANNUAL REPORT | ||||||
| ITEM 7. MANAGEMENT'S DISCUSSION & ANALYSIS (MD&A) | ||||||||
| December 31, 2023 | December 31, 2022 | |||||||||||||||||||||||||
| (Dollars in millions) | Repayment Amount |
Percent | Repayment Amount |
Percent | ||||||||||||||||||||||
| Months remaining in draw period: | ||||||||||||||||||||||||||
| 0-12 | $ | 30 | 1 | % | $ | 31 | 2 | % | ||||||||||||||||||
| 13-24 | 90 | 4 | 40 | 2 | ||||||||||||||||||||||
| 25-36 | 110 | 5 | 109 | 6 | ||||||||||||||||||||||
| 37-48 | 163 | 8 | 135 | 7 | ||||||||||||||||||||||
| 49-60 | 178 | 9 | 204 | 11 | ||||||||||||||||||||||
| >60 | 1,530 | 73 | 1,356 | 72 | ||||||||||||||||||||||
| Total | $ | 2,101 | 100 | % | $ | 1,875 | 100 | % | ||||||||||||||||||
|
69 |
2023 FORM 10-K ANNUAL REPORT | ||||||
| ITEM 7. MANAGEMENT'S DISCUSSION & ANALYSIS (MD&A) | ||||||||
| December 31, | |||||||||||||||||||||||
| (Dollars in millions) | 2023 | 2022 | 2021 | ||||||||||||||||||||
| Allowance for loan and lease losses | |||||||||||||||||||||||
| C&I | $ | 339 | $ | 308 | $ | 334 | |||||||||||||||||
| CRE | 172 | 146 | 154 | ||||||||||||||||||||
| Consumer real estate | 233 | 200 | 163 | ||||||||||||||||||||
| Credit card and other | 29 | 31 | 19 | ||||||||||||||||||||
| Total allowance for loan and lease losses | $ | 773 | $ | 685 | $ | 670 | |||||||||||||||||
| Reserve for remaining unfunded commitments | |||||||||||||||||||||||
| C&I | $ | 49 | $ | 55 | $ | 46 | |||||||||||||||||
| CRE | 22 | 22 | 12 | ||||||||||||||||||||
| Consumer real estate | 12 | 10 | 8 | ||||||||||||||||||||
| Credit card and other | — | — | — | ||||||||||||||||||||
| Total reserve for remaining unfunded commitments | $ | 83 | $ | 87 | $ | 66 | |||||||||||||||||
| Allowance for credit losses | |||||||||||||||||||||||
| C&I | $ | 388 | $ | 363 | $ | 380 | |||||||||||||||||
| CRE | 194 | 168 | 166 | ||||||||||||||||||||
| Consumer real estate | 245 | 210 | 171 | ||||||||||||||||||||
| Credit card and other | 29 | 31 | 19 | ||||||||||||||||||||
| Total allowance for credit losses | $ | 856 | $ | 772 | $ | 736 | |||||||||||||||||
| Period-end loans and leases | |||||||||||||||||||||||
| C&I | $ | 32,633 | $ | 31,781 | $ | 31,068 | |||||||||||||||||
| CRE | 14,216 | 13,228 | 12,109 | ||||||||||||||||||||
| Consumer real estate | 13,650 | 12,253 | 10,772 | ||||||||||||||||||||
| Credit card and other | 793 | 840 | 910 | ||||||||||||||||||||
| Total period-end loans and leases | $ | 61,292 | $ | 58,102 | $ | 54,859 | |||||||||||||||||
| ALLL / loans and leases % | |||||||||||||||||||||||
| C&I | 1.04 | % | 0.97 | % | 1.07 | % | |||||||||||||||||
| CRE | 1.21 | 1.10 | 1.27 | ||||||||||||||||||||
| Consumer real estate | 1.71 | 1.63 | 1.51 | ||||||||||||||||||||
| Credit card and other | 3.63 | 3.72 | 2.14 | ||||||||||||||||||||
| Total ALLL / loans and leases % | 1.26 | % | 1.18 | % | 1.22 | % | |||||||||||||||||
|
70 |
2023 FORM 10-K ANNUAL REPORT | ||||||
| ITEM 7. MANAGEMENT'S DISCUSSION & ANALYSIS (MD&A) | ||||||||
| ACL / loans and leases % | |||||||||||||||||||||||
| C&I | 1.19 | % | 1.14 | % | 1.22 | % | |||||||||||||||||
| CRE | 1.36 | 1.27 | 1.37 | ||||||||||||||||||||
| Consumer real estate | 1.79 | 1.71 | 1.59 | ||||||||||||||||||||
| Credit card and other | 3.63 | 3.72 | 2.09 | ||||||||||||||||||||
| Total ACL / loans and leases % | 1.40 | % | 1.33 | % | 1.34 | % | |||||||||||||||||
| Net charge-offs (recoveries) | |||||||||||||||||||||||
| C&I | $ | 142 | $ | 53 | $ | 13 | |||||||||||||||||
| CRE | 15 | — | — | ||||||||||||||||||||
| Consumer real estate | (5) | (14) | (22) | ||||||||||||||||||||
| Credit card and other | 18 | 20 | 11 | ||||||||||||||||||||
| Total net charge-offs | $ | 170 | $ | 59 | $ | 2 | |||||||||||||||||
| Average loans and leases | |||||||||||||||||||||||
| C&I | $ | 32,390 | $ | 30,969 | $ | 32,010 | |||||||||||||||||
| CRE | 13,785 | 12,722 | 12,314 | ||||||||||||||||||||
| Consumer real estate | 13,179 | 11,397 | 10,969 | ||||||||||||||||||||
| Credit card and other | 815 | 864 | 1,005 | ||||||||||||||||||||
| Total average loans and leases | $ | 60,169 | $ | 55,952 | $ | 56,298 | |||||||||||||||||
| Charge-off % | |||||||||||||||||||||||
| C&I | 0.44 | % | 0.17 | % | 0.04 | % | |||||||||||||||||
| CRE | 0.10 | — | 0.01 | ||||||||||||||||||||
| Consumer real estate | NM | NM | NM | ||||||||||||||||||||
| Credit card and other | 2.18 | 2.39 | 1.05 | ||||||||||||||||||||
| Total charge-off % | 0.28 | % | 0.11 | % | — | % | |||||||||||||||||
| ALLL / net charge-offs | |||||||||||||||||||||||
| C&I | 239 | % | 578 | % | 2,645 | % | |||||||||||||||||
| CRE | 1,097 | NM | 13,189 | ||||||||||||||||||||
| Consumer real estate | NM | NM | NM | ||||||||||||||||||||
| Credit card and other | 162 | 151 | 185 | ||||||||||||||||||||
| Total ALLL / net charge-offs | 455 | % | 1,155 | % | 30,641 | % | |||||||||||||||||
|
71 |
2023 FORM 10-K ANNUAL REPORT | ||||||
| ITEM 7. MANAGEMENT'S DISCUSSION & ANALYSIS (MD&A) | ||||||||
| December 31, | |||||||||||||||||||||||
| (Dollars in millions) | 2023 | 2022 | 2021 | ||||||||||||||||||||
| Nonperforming loans and leases | |||||||||||||||||||||||
| C&I | $ | 184 | $ | 153 | $ | 125 | |||||||||||||||||
| CRE | 136 | 9 | 9 | ||||||||||||||||||||
| Consumer real estate | 140 | 152 | 138 | ||||||||||||||||||||
| Credit card and other | 2 | 2 | 3 | ||||||||||||||||||||
| Total nonperforming loans and leases (a) (c) | $ | 462 | $ | 316 | $ | 275 | |||||||||||||||||
| Nonperforming loans held for sale (a) | $ | 3 | $ | 8 | $ | 7 | |||||||||||||||||
| Foreclosed real estate and other assets (b) | 4 | 3 | 3 | ||||||||||||||||||||
| Total nonperforming assets (a) (b) | $ | 469 | $ | 327 | $ | 285 | |||||||||||||||||
| Nonperforming loans and leases to total loans and leases | |||||||||||||||||||||||
| C&I | 0.57 | % | 0.48 | % | 0.40 | % | |||||||||||||||||
| CRE | 0.96 | 0.07 | 0.08 | ||||||||||||||||||||
| Consumer real estate | 1.02 | 1.24 | 1.29 | ||||||||||||||||||||
| Credit card and other | 0.30 | 0.27 | 0.31 | ||||||||||||||||||||
| Total NPL % | 0.75 | % | 0.54 | % | 0.50 | % | |||||||||||||||||
| ALLL / NPLs | |||||||||||||||||||||||
| C&I | 184 | % | 202 | % | 268 | % | |||||||||||||||||
| CRE | 126 | 1,554 | 1,671 | ||||||||||||||||||||
| Consumer real estate | 167 | 131 | 118 | ||||||||||||||||||||
| Credit card and other | 1,202 | 1,364 | 699 | ||||||||||||||||||||
| Total ALLL / NPLs | 167 | % | 217 | % | 244 | % | |||||||||||||||||
|
72 |
2023 FORM 10-K ANNUAL REPORT | ||||||
| ITEM 7. MANAGEMENT'S DISCUSSION & ANALYSIS (MD&A) | ||||||||
| December 31, | |||||||||||||||||||||||
| (Dollars in millions) | 2023 | 2022 | 2021 | ||||||||||||||||||||
| Nonperforming loans and leases (a) (b) | |||||||||||||||||||||||
| Regional Banking | $ | 323 | $ | 227 | $ | 163 | |||||||||||||||||
| Specialty Banking | 116 | 60 | 78 | ||||||||||||||||||||
| Corporate | 23 | 29 | 34 | ||||||||||||||||||||
| Consolidated | $ | 462 | $ | 316 | $ | 275 | |||||||||||||||||
| Foreclosed real estate (c) | |||||||||||||||||||||||
| Regional Banking | $ | 1 | $ | — | $ | 2 | |||||||||||||||||
| Specialty Banking | 3 | 2 | — | ||||||||||||||||||||
| Corporate | — | 1 | 1 | ||||||||||||||||||||
| Consolidated | $ | 4 | $ | 3 | $ | 3 | |||||||||||||||||
| Nonperforming Assets (a) (b) (c) | |||||||||||||||||||||||
| Regional Banking | $ | 324 | $ | 227 | $ | 165 | |||||||||||||||||
| Specialty Banking | 119 | 62 | 78 | ||||||||||||||||||||
| Corporate | 23 | 30 | 35 | ||||||||||||||||||||
| Consolidated | $ | 466 | $ | 319 | $ | 278 | |||||||||||||||||
| Nonperforming loans and leases to total loans and leases | |||||||||||||||||||||||
| Regional Banking | 0.74 | % | 0.54 | % | 0.43 | % | |||||||||||||||||
| Specialty Banking | 0.68 | 0.37 | 0.48 | ||||||||||||||||||||
| Corporate | 4.87 | 6.28 | 5.39 | ||||||||||||||||||||
| Consolidated | 0.75 | % | 0.54 | % | 0.50 | % | |||||||||||||||||
| NPA % (d) | |||||||||||||||||||||||
| Regional Banking | 0.74 | % | 0.55 | % | 0.44 | % | |||||||||||||||||
| Specialty Banking | 0.70 | 0.39 | 0.48 | ||||||||||||||||||||
| Corporate | 4.96 | 6.54 | 5.51 | ||||||||||||||||||||
| Consolidated | 0.76 | % | 0.55 | % | 0.51 | % | |||||||||||||||||
|
73 |
2023 FORM 10-K ANNUAL REPORT | ||||||
| ITEM 7. MANAGEMENT'S DISCUSSION & ANALYSIS (MD&A) | ||||||||
| December 31, | |||||||||||||||||||||||
| (Dollars in millions) | 2023 | 2022 | 2021 | ||||||||||||||||||||
| Accruing loans and leases 30+ days past due | |||||||||||||||||||||||
| C&I | $ | 32 | $ | 61 | $ | 58 | |||||||||||||||||
| CRE | 8 | 11 | 13 | ||||||||||||||||||||
| Consumer real estate | 57 | 55 | 70 | ||||||||||||||||||||
| Credit card and other | 8 | 11 | 7 | ||||||||||||||||||||
| Total accruing loans and leases 30+ days past due | $ | 105 | $ | 138 | $ | 148 | |||||||||||||||||
| Accruing loans and leases 30+ days past due % | |||||||||||||||||||||||
| C&I | 0.10 | % | 0.19 | % | 0.19 | % | |||||||||||||||||
| CRE | 0.06 | 0.08 | 0.11 | ||||||||||||||||||||
| Consumer real estate | 0.42 | 0.44 | 0.65 | ||||||||||||||||||||
| Credit card and other | 1.03 | 1.28 | 0.76 | ||||||||||||||||||||
| Total accruing loans and leases 30+ days past due % | 0.17 | % | 0.24 | % | 0.27 | % | |||||||||||||||||
| Accruing loans and leases 90+ days past due (a) (b) (c) | |||||||||||||||||||||||
| C&I | $ | 1 | $ | 11 | $ | 5 | |||||||||||||||||
| CRE | — | — | — | ||||||||||||||||||||
| Consumer real estate | 17 | 18 | 33 | ||||||||||||||||||||
| Credit card and other | 3 | 4 | 2 | ||||||||||||||||||||
| Total accruing loans and leases 90+ days past due | $ | 21 | $ | 33 | $ | 40 | |||||||||||||||||
| Loans held for sale | |||||||||||||||||||||||
| 30 to 89 days past due (b) | $ | 12 | $ | 10 | $ | 7 | |||||||||||||||||
| 30 to 89 days past due - guaranteed portion (b) (d) | 8 | 7 | 2 | ||||||||||||||||||||
| 90+ days past due (b) | 9 | 16 | 24 | ||||||||||||||||||||
| 90+ days past due - guaranteed portion (b) (d) | 4 | 6 | 12 | ||||||||||||||||||||
|
74 |
2023 FORM 10-K ANNUAL REPORT | ||||||
| ITEM 7. MANAGEMENT'S DISCUSSION & ANALYSIS (MD&A) | ||||||||
|
75 |
2023 FORM 10-K ANNUAL REPORT | ||||||
| ITEM 7. MANAGEMENT'S DISCUSSION & ANALYSIS (MD&A) | ||||||||
| (Dollars in millions) | 2023 | Percent of Total | 2023 Growth Rate | 2022 | Percent of Total | 2022 Growth Rate | ||||||||||||||||||||||||||||||||
| Savings | $ | 25,082 | 38 | % | 14 | % | $ | 21,971 | 35 | % | (17) | % | ||||||||||||||||||||||||||
| Time deposits | 6,804 | 10 | 136 | 2,887 | 4 | (18) | ||||||||||||||||||||||||||||||||
| Other interest-bearing deposits | 16,690 | 26 | 10 | 15,165 | 24 | (11) | ||||||||||||||||||||||||||||||||
| Total interest-bearing deposits | 48,576 | 74 | 21 | 40,023 | 63 | (15) | ||||||||||||||||||||||||||||||||
| Noninterest-bearing deposits | 17,204 | 26 | (27) | 23,466 | 37 | (16) | ||||||||||||||||||||||||||||||||
| Total deposits | $ | 65,780 | 100 | % | 4 | % | $ | 63,489 | 100 | % | (15) | % | ||||||||||||||||||||||||||
| For the Year Ended December 31, | ||||||||||||||
| (Dollars in millions) | 2023 | 2022 | ||||||||||||
| Uninsured deposits | $ | 26,752 | $ | 30,304 | ||||||||||
| (Dollars in millions) | December 31, 2023 | December 31, 2022 | ||||||||||||
| Portion of U.S. time deposits in excess of insurance limit | $ | 1,143 | $ | 643 | ||||||||||
| Time deposits otherwise uninsured with a maturity of: | ||||||||||||||
| 3 months or less | 304 | 198 | ||||||||||||
| Over 3 months through 6 months | 519 | 147 | ||||||||||||
| Over 6 months through 12 months | 282 | 225 | ||||||||||||
| Over 12 months | 38 | 73 | ||||||||||||
|
76 |
2023 FORM 10-K ANNUAL REPORT | ||||||
| ITEM 7. MANAGEMENT'S DISCUSSION & ANALYSIS (MD&A) | ||||||||
|
77 |
2023 FORM 10-K ANNUAL REPORT | ||||||
| ITEM 7. MANAGEMENT'S DISCUSSION & ANALYSIS (MD&A) | ||||||||
| (Dollars in millions) | December 31, 2023 | December 31, 2022 | ||||||||||||
| FHN shareholders’ equity | $ | 8,996 | $ | 8,252 | ||||||||||
| Modified CECL transitional amount (a) | 57 | 85 | ||||||||||||
| FHN non-cumulative perpetual preferred | (520) | (1,014) | ||||||||||||
| Common equity tier 1 before regulatory adjustments | $ | 8,533 | $ | 7,323 | ||||||||||
| Regulatory adjustments: | ||||||||||||||
| Disallowed goodwill and other intangibles | $ | (1,617) | $ | (1,658) | ||||||||||
| Net unrealized (gains) losses on securities available for sale | 836 | 972 | ||||||||||||
| Net unrealized (gains) losses on pension and other postretirement plans | 273 | 269 | ||||||||||||
| Net unrealized (gains) losses on cash flow hedges | 79 | 126 | ||||||||||||
| Common equity tier 1 | $ | 8,104 | $ | 7,032 | ||||||||||
| FHN non-cumulative perpetual preferred (b) | 426 | 920 | ||||||||||||
| Qualifying noncontrolling interest—First Horizon Bank preferred stock | 295 | 295 | ||||||||||||
| Tier 1 capital | $ | 8,825 | $ | 8,247 | ||||||||||
| Tier 2 capital | 1,097 | 975 | ||||||||||||
| Total regulatory capital | $ | 9,922 | $ | 9,222 | ||||||||||
| Risk-Weighted Assets | ||||||||||||||
| First Horizon Corporation | $ | 71,074 | $ | 69,163 | ||||||||||
| First Horizon Bank | 70,635 | 68,728 | ||||||||||||
| Average Assets for Leverage | ||||||||||||||
| First Horizon Corporation | $ | 82,540 | $ | 79,583 | ||||||||||
| First Horizon Bank | 81,898 | 78,923 | ||||||||||||
| December 31, 2023 | December 31, 2022 | |||||||||||||||||||||||||
| (Dollars in millions) | Ratio | Amount | Ratio | Amount | ||||||||||||||||||||||
| Common Equity Tier 1 | ||||||||||||||||||||||||||
| First Horizon Corporation | 11.40 | % | $ | 8,104 | 10.17 | % | $ | 7,032 | ||||||||||||||||||
| First Horizon Bank | 11.40 | 8,055 | 10.77 | 7,405 | ||||||||||||||||||||||
| Tier 1 | ||||||||||||||||||||||||||
| First Horizon Corporation | 12.42 | 8,825 | 11.92 | 8,247 | ||||||||||||||||||||||
| First Horizon Bank | 11.82 | 8,350 | 11.20 | 7,700 | ||||||||||||||||||||||
| Total | ||||||||||||||||||||||||||
| First Horizon Corporation | 13.96 | 9,922 | 13.33 | 9,222 | ||||||||||||||||||||||
| First Horizon Bank | 13.17 | 9,303 | 12.41 | 8,532 | ||||||||||||||||||||||
| Tier 1 Leverage | ||||||||||||||||||||||||||
| First Horizon Corporation | 10.69 | 8,825 | 10.36 | 8,247 | ||||||||||||||||||||||
| First Horizon Bank | 10.20 | 8,350 | 9.76 | 7,700 | ||||||||||||||||||||||
| Other Capital Ratios | ||||||||||||||||||||||||||
| Total period-end equity to period-end assets | 11.38 | 10.83 | ||||||||||||||||||||||||
| Tangible common equity to tangible assets (c) | 8.48 | 7.12 | ||||||||||||||||||||||||
| Adjusted tangible common equity to risk weighted assets (c) | 10.72 | 9.35 | ||||||||||||||||||||||||
|
78 |
2023 FORM 10-K ANNUAL REPORT | ||||||
| ITEM 7. MANAGEMENT'S DISCUSSION & ANALYSIS (MD&A) | ||||||||
|
79 |
2023 FORM 10-K ANNUAL REPORT | ||||||
| ITEM 7. MANAGEMENT'S DISCUSSION & ANALYSIS (MD&A) | ||||||||
| (Dollar values and volume in thousands, except per share data) | Total number of shares purchased | Average price paid per share (a) | Total number of shares purchased as part of publicly announced programs | Maximum approximate dollar value that may yet be purchased under the programs (b) | ||||||||||||||||||||||
| 2023 | ||||||||||||||||||||||||||
| October 1 to October 31 | — | N/A | — | $ | 598,646 | |||||||||||||||||||||
| November 1 to November 30 | — | N/A | — | — | ||||||||||||||||||||||
| December 1 to December 31 | — | N/A | — | — | ||||||||||||||||||||||
| Total | — | N/A | — | |||||||||||||||||||||||
|
80 |
2023 FORM 10-K ANNUAL REPORT | ||||||
| ITEM 7. MANAGEMENT'S DISCUSSION & ANALYSIS (MD&A) | ||||||||
| (Volume in thousands, except per share data) | Total number of shares purchased |
Average price paid per share |
Total number of shares purchased as part of publicly announced programs |
Maximum number of shares that may yet be purchased under the programs (a) |
||||||||||||||||||||||
| 2023 | ||||||||||||||||||||||||||
| October 1 to October 31 | 31 | $ | 10.71 | 31 | 21,724 | |||||||||||||||||||||
| November 1 to November 30 | 1 | 11.74 | 1 | 21,723 | ||||||||||||||||||||||
| December 1 to December 31 | 23 | 13.35 | 23 | 21,700 | ||||||||||||||||||||||
| Total | 55 | $ | 11.82 | 55 | ||||||||||||||||||||||
|
81 |
2023 FORM 10-K ANNUAL REPORT | ||||||
| ITEM 7. MANAGEMENT'S DISCUSSION & ANALYSIS (MD&A) | ||||||||
|
82 |
2023 FORM 10-K ANNUAL REPORT | ||||||
| ITEM 7. MANAGEMENT'S DISCUSSION & ANALYSIS (MD&A) | ||||||||
| Year Ended December 31, 2023 | As of December 31, 2023 |
|||||||||||||||||||||||||
| (Dollars in millions) | Mean | High | Low | |||||||||||||||||||||||
| 1-day | ||||||||||||||||||||||||||
| VaR | $ | 3 | $ | 4 | $ | 2 | $ | 3 | ||||||||||||||||||
| SVaR | 6 | 8 | 3 | 6 | ||||||||||||||||||||||
| 10-day | ||||||||||||||||||||||||||
| VaR | 8 | 11 | 4 | 10 | ||||||||||||||||||||||
| SVaR | 24 | 34 | 12 | 28 | ||||||||||||||||||||||
| Year Ended December 31, 2022 | As of December 31, 2022 |
|||||||||||||||||||||||||
| (Dollars in millions) | Mean | High | Low | |||||||||||||||||||||||
| 1-day | ||||||||||||||||||||||||||
| VaR | $ | 2 | $ | 4 | $ | 2 | $ | 3 | ||||||||||||||||||
| SVaR | 5 | 7 | 4 | 6 | ||||||||||||||||||||||
| 10-day | ||||||||||||||||||||||||||
| VaR | 8 | 11 | 3 | 10 | ||||||||||||||||||||||
| SVaR | 24 | 34 | 18 | 29 | ||||||||||||||||||||||
| As of December 31, 2023 | As of December 31, 2022 | |||||||||||||||||||||||||
| (Dollars in millions) | 1-day | 10-day | 1-day | 10-day | ||||||||||||||||||||||
| Interest rate risk | $ | 1 | $ | 2 | $ | 1 | $ | 3 | ||||||||||||||||||
| Credit spread risk | 1 | 1 | 1 | 2 | ||||||||||||||||||||||
|
83 |
2023 FORM 10-K ANNUAL REPORT | ||||||
| ITEM 7. MANAGEMENT'S DISCUSSION & ANALYSIS (MD&A) | ||||||||
| Shifts in Interest Rates (in bps) |
% Change in Projected Net Interest Income | |||||||
| -100 | (3.6)% | |||||||
| -50 | (1.7)% | |||||||
| -25 | (0.9)% | |||||||
| +25 | 0.7% | |||||||
| +50 | 1.4% | |||||||
| +100 | 2.6% | |||||||
| +200 | 3.3% | |||||||
|
84 |
2023 FORM 10-K ANNUAL REPORT | ||||||
| ITEM 7. MANAGEMENT'S DISCUSSION & ANALYSIS (MD&A) | ||||||||
|
85 |
2023 FORM 10-K ANNUAL REPORT | ||||||
| ITEM 7. MANAGEMENT'S DISCUSSION & ANALYSIS (MD&A) | ||||||||
|
86 |
2023 FORM 10-K ANNUAL REPORT | ||||||
| ITEM 7. MANAGEMENT'S DISCUSSION & ANALYSIS (MD&A) | ||||||||
|
87 |
2023 FORM 10-K ANNUAL REPORT | ||||||
| ITEM 7. MANAGEMENT'S DISCUSSION & ANALYSIS (MD&A) | ||||||||
|
88 |
2023 FORM 10-K ANNUAL REPORT | ||||||
| ITEM 7. MANAGEMENT'S DISCUSSION & ANALYSIS (MD&A) | ||||||||
| (Dollars in millions) | Total Capacity |
Outstanding Borrowings | Available Liquidity | |||||||||||||||||
| Cash on deposit with FRB (a) | $ | 1,201 | $ | — | $ | 1,201 | ||||||||||||||
| FHLB | 9,352 | — | 9,352 | |||||||||||||||||
| FRB: | ||||||||||||||||||||
| Discount Window | 23,417 | — | 23,417 | |||||||||||||||||
| BTFP | 834 | — | 834 | |||||||||||||||||
| Unencumbered securities (b) | 812 | — | 812 | |||||||||||||||||
| Total Available Liquidity | $ | 35,616 | ||||||||||||||||||
|
89 |
2023 FORM 10-K ANNUAL REPORT | ||||||
| ITEM 7. MANAGEMENT'S DISCUSSION & ANALYSIS (MD&A) | ||||||||
| Dividend/Share | Record Date | Payment Date | ||||||||||||||||||
| Common Stock | $ | 0.15 | 3/15/2024 | 4/1/2024 | ||||||||||||||||
| Preferred Stock | ||||||||||||||||||||
| Series C | $ | 165.00 | 4/16/2024 | 5/1/2024 | ||||||||||||||||
| Series D | $ | 305.00 | 4/16/2024 | 5/1/2024 | ||||||||||||||||
| Series E | $ | 1,625.00 | 3/26/2024 | 4/10/2024 | ||||||||||||||||
| Series F | $ | 1,175.00 | 3/26/2024 | 4/10/2024 | ||||||||||||||||
| Payments due by period (a) | ||||||||||||||||||||||||||||||||
| Less than | 1 year - | 3 years - | After 5 | |||||||||||||||||||||||||||||
| (Dollars in millions) | 1 year | < 3 years | < 5 years | years | Total | |||||||||||||||||||||||||||
| Contractual obligations: | ||||||||||||||||||||||||||||||||
| Time deposit maturities (b) (c) | $ | 6,528 | $ | 194 | $ | 75 | $ | 7 | $ | 6,804 | ||||||||||||||||||||||
| Short-term borrowings (b) (d) | 3,058 | — | — | — | 3,058 | |||||||||||||||||||||||||||
| Term borrowings (b) (e) | 6 | 350 | — | 812 | 1,168 | |||||||||||||||||||||||||||
| Annual rental commitments under noncancelable leases (b) (f) | 44 | 85 | 76 | 204 | 409 | |||||||||||||||||||||||||||
| Purchase obligations | 224 | 120 | 30 | 3 | 377 | |||||||||||||||||||||||||||
| Total contractual obligations | $ | 9,860 | $ | 749 | $ | 181 | $ | 1,026 | $ | 11,816 | ||||||||||||||||||||||
|
90 |
2023 FORM 10-K ANNUAL REPORT | ||||||
| ITEM 7. MANAGEMENT'S DISCUSSION & ANALYSIS (MD&A) | ||||||||
| Moody's (a) | Fitch (b) | ||||||||||||||||
| First Horizon Corporation | |||||||||||||||||
| Overall credit rating: Long-term/Short-term/Outlook | Baa3/--/NEG | BBB/F2/Stable | |||||||||||||||
| Long-term senior debt | Baa3 | BBB | |||||||||||||||
| Subordinated debt (c) | Baa3 | BBB- | |||||||||||||||
| Junior subordinated debt (c) | Ba1 | BB- | |||||||||||||||
| Preferred stock | Ba2 | BB- | |||||||||||||||
| First Horizon Bank | |||||||||||||||||
| Overall credit rating: Long-term/Short-term/Outlook | Baa3/P-2/NEG | BBB/F2/Stable | |||||||||||||||
| Long-term/short-term deposits | A3/P-2 | BBB+/F2 | |||||||||||||||
| Long-term/short-term senior debt (c) | Baa3/P-2 | BBB/F2 | |||||||||||||||
| Subordinated debt | Baa3 | BBB- | |||||||||||||||
| Preferred stock | Ba2 | BB- | |||||||||||||||
| FT Real Estate Securities Company, Inc. | |||||||||||||||||
| Preferred stock | Ba1 | ||||||||||||||||
|
91 |
2023 FORM 10-K ANNUAL REPORT | ||||||
| ITEM 7. MANAGEMENT'S DISCUSSION & ANALYSIS (MD&A) | ||||||||
|
92 |
2023 FORM 10-K ANNUAL REPORT | ||||||
| ITEM 7. MANAGEMENT'S DISCUSSION & ANALYSIS (MD&A) | ||||||||
|
93 |
2023 FORM 10-K ANNUAL REPORT | ||||||
| ITEM 7. MANAGEMENT'S DISCUSSION & ANALYSIS (MD&A) | ||||||||
|
94 |
2023 FORM 10-K ANNUAL REPORT | ||||||
| ITEM 7. MANAGEMENT'S DISCUSSION & ANALYSIS (MD&A) | ||||||||
|
95 |
2023 FORM 10-K ANNUAL REPORT | ||||||
| ITEM 7. MANAGEMENT'S DISCUSSION & ANALYSIS (MD&A) | ||||||||
|
96 |
2023 FORM 10-K ANNUAL REPORT | ||||||
| ITEM 7. MANAGEMENT'S DISCUSSION & ANALYSIS (MD&A) | ||||||||
|
97 |
2023 FORM 10-K ANNUAL REPORT | ||||||
| ITEM 7. MANAGEMENT'S DISCUSSION & ANALYSIS (MD&A) | ||||||||
|
98 |
2023 FORM 10-K ANNUAL REPORT | ||||||
| ITEM 7. MANAGEMENT'S DISCUSSION & ANALYSIS (MD&A) | ||||||||
| (Dollars in millions; shares in thousands) | 2023 | 2022 | 2021 | |||||||||||||||||
| Pre-provision Net Revenue (Non-GAAP) | ||||||||||||||||||||
| Net interest income (GAAP) | $ | 2,540 | $ | 2,392 | $ | 1,994 | ||||||||||||||
| Plus: Noninterest income (GAAP) | 927 | 815 | 1,076 | |||||||||||||||||
| Total Revenues (GAAP) | 3,467 | 3,207 | 3,070 | |||||||||||||||||
| Less: Noninterest expense (GAAP) | 2,079 | 1,953 | 2,096 | |||||||||||||||||
| Pre-provision Net Revenue (Non-GAAP) | $ | 1,388 | $ | 1,254 | $ | 974 | ||||||||||||||
| Tangible Common Equity (Non-GAAP) | ||||||||||||||||||||
| (A) Total equity (GAAP) | $ | 9,291 | $ | 8,547 | $ | 8,494 | ||||||||||||||
| Less: Noncontrolling interest (a) | 295 | 295 | 295 | |||||||||||||||||
| Less: Preferred stock (a) | 520 | 1,014 | 520 | |||||||||||||||||
| (B) Total common equity | 8,476 | 7,238 | 7,679 | |||||||||||||||||
| Less: Goodwill and other intangible assets (GAAP) (b) | 1,696 | 1,745 | 1,809 | |||||||||||||||||
| (C) Tangible common equity (Non-GAAP) | 6,780 | 5,493 | 5,870 | |||||||||||||||||
| Less: Unrealized gains (losses) on AFS securities, net of tax | (836) | (972) | (36) | |||||||||||||||||
| (D) Adjusted tangible common equity (Non-GAAP) | $ | 7,616 | $ | 6,465 | $ | 5,906 | ||||||||||||||
| Tangible Assets (Non-GAAP) | ||||||||||||||||||||
| (E) Total assets (GAAP) | $ | 81,661 | $ | 78,953 | $ | 89,092 | ||||||||||||||
| Less: Goodwill and other intangible assets (GAAP) (b) | 1,696 | 1,745 | 1,809 | |||||||||||||||||
| (F) Tangible assets (Non-GAAP) | $ | 79,965 | $ | 77,208 | $ | 87,283 | ||||||||||||||
| Average Tangible Common Equity (Non-GAAP) | ||||||||||||||||||||
| Average total equity (GAAP) | $ | 8,905 | $ | 8,579 | $ | 8,479 | ||||||||||||||
| Less: Average noncontrolling interest (a) | 295 | 295 | 295 | |||||||||||||||||
| Less: Average preferred stock (a) | 758 | 935 | 506 | |||||||||||||||||
| (G) Total average common equity | 7,852 | 7,349 | 7,678 | |||||||||||||||||
| Less: Average goodwill and other intangible assets (GAAP) (b) | 1,720 | 1,777 | 1,836 | |||||||||||||||||
| (H) Average tangible common equity (Non-GAAP) | $ | 6,132 | $ | 5,572 | $ | 5,842 | ||||||||||||||
| Net Income Available to Common Shareholders | ||||||||||||||||||||
| (I) Net income available to common shareholders | $ | 865 | $ | 868 | $ | 962 | ||||||||||||||
| Risk Weighted Assets | ||||||||||||||||||||
| (J) Risk weighted assets (c) | $ | 71,074 | $ | 69,163 | $ | 64,183 | ||||||||||||||
| Period-end shares outstanding | ||||||||||||||||||||
| (K) Period-end shares outstanding | 558,839 | 537,101 | 533,577 | |||||||||||||||||
| Ratios | ||||||||||||||||||||
| (A)/(E) Total period-end equity to period-end assets (GAAP) | 11.38 | % | 10.83 | % | 9.53 | % | ||||||||||||||
| (C)/(F) Tangible common equity to tangible assets (Non-GAAP) | 8.48 | 7.12 | 6.73 | |||||||||||||||||
| (D)/(J) Adjusted tangible common equity to risk weighted assets (Non-GAAP) | 10.72 | 9.35 | 9.20 | |||||||||||||||||
| (I)/(G) Return on average common equity (GAAP) | 11.01 | 11.81 | 12.53 | |||||||||||||||||
| (I)/(H) Return on average tangible common equity (Non-GAAP) | 14.11 | 15.58 | 16.46 | |||||||||||||||||
| (B)/(K) Book value per common share (GAAP) | $ | 15.17 | $ | 13.48 | $ | 14.39 | ||||||||||||||
| (C)/(K) Tangible book value per common share (Non-GAAP) | $ | 12.13 | $ | 10.23 | $ | 11.00 | ||||||||||||||
|
99 |
2023 FORM 10-K ANNUAL REPORT | ||||||
| ITEM 7A. QUANTITATIVE & QUALITATIVE DISCLOSURES ABOUT MARKET RISK | ||||||||
|
100 |
2023 FORM 10-K ANNUAL REPORT | ||||||
| ITEM 8. FINANCIAL STATEMENTS & SUPPLEMENTARY DATA | ||||||||
| ITEM 8 TOPICS | ||||||||
|
101 |
2023 FORM 10-K ANNUAL REPORT | ||||||
| ITEM 8. FINANCIAL STATEMENTS & SUPPLEMENTARY DATA | ||||||||
| ITEM 8 TOPICS | ||||||||
|
102 |
2023 FORM 10-K ANNUAL REPORT | ||||||
| ITEM 8. FINANCIAL STATEMENTS & SUPPLEMENTARY DATA | ||||||||
| MANAGEMENT REPORT ON ICOFR | ||||||||
|
103 |
2023 FORM 10-K ANNUAL REPORT | ||||||
| ITEM 8. FINANCIAL STATEMENTS & SUPPLEMENTARY DATA | ||||||||
| OPINION ON ICOFR | ||||||||

|
104 |
2023 FORM 10-K ANNUAL REPORT | ||||||
| ITEM 8. FINANCIAL STATEMENTS & SUPPLEMENTARY DATA | ||||||||
| OPINION ON CONSOLIDATED FINANCIAL STATEMENTS | ||||||||
|
105 |
2023 FORM 10-K ANNUAL REPORT | ||||||
| ITEM 8. FINANCIAL STATEMENTS & SUPPLEMENTARY DATA | ||||||||
| OPINION ON CONSOLIDATED FINANCIAL STATEMENTS | ||||||||
|
106 |
2023 FORM 10-K ANNUAL REPORT | ||||||
| ITEM 8. FINANCIAL STATEMENTS & SUPPLEMENTARY DATA | ||||||||
| OPINION ON CONSOLIDATED FINANCIAL STATEMENTS | ||||||||
|
107 |
2023 FORM 10-K ANNUAL REPORT | ||||||
| ITEM 8. FINANCIAL STATEMENTS & SUPPLEMENTARY DATA | ||||||||
| CONSOLIDATED BALANCE SHEETS | ||||||||
| December 31, | ||||||||||||||
| (Dollars in millions, except per share amounts) | 2023 | 2022 | ||||||||||||
| Assets | ||||||||||||||
| Cash and due from banks | $ | 1,012 | $ | 1,061 | ||||||||||
| Interest-bearing deposits with banks | 1,328 | 1,384 | ||||||||||||
| Federal funds sold and securities purchased under agreements to resell | 719 | 482 | ||||||||||||
| Trading securities | 1,412 | 1,375 | ||||||||||||
| Securities available for sale at fair value | 8,391 | 8,836 | ||||||||||||
Securities held to maturity (fair value of $1,161 and $1,209, respectively) |
1,323 | 1,371 | ||||||||||||
Loans held for sale (including $68 and $51 at fair value, respectively) |
502 | 590 | ||||||||||||
| Loans and leases | 61,292 | 58,102 | ||||||||||||
| Allowance for loan and lease losses | (773) | (685) | ||||||||||||
| Net loans and leases | 60,519 | 57,417 | ||||||||||||
| Premises and equipment | 590 | 612 | ||||||||||||
| Goodwill | 1,510 | 1,511 | ||||||||||||
| Other intangible assets | 186 | 234 | ||||||||||||
| Other assets | 4,169 | 4,080 | ||||||||||||
| Total assets | $ | 81,661 | $ | 78,953 | ||||||||||
| Liabilities | ||||||||||||||
| Noninterest-bearing deposits | $ | 17,204 | $ | 23,466 | ||||||||||
| Interest-bearing deposits | 48,576 | 40,023 | ||||||||||||
| Total deposits | 65,780 | 63,489 | ||||||||||||
| Trading liabilities | 509 | 335 | ||||||||||||
| Short-term borrowings | 2,549 | 2,506 | ||||||||||||
| Term borrowings | 1,150 | 1,597 | ||||||||||||
| Other liabilities | 2,382 | 2,479 | ||||||||||||
| Total liabilities | 72,370 | 70,406 | ||||||||||||
| Equity | ||||||||||||||
Preferred stock, Non-cumulative perpetual, no par value; authorized 5,000,000 shares; issued 26,750 and 31,686 shares, respectively |
520 | 1,014 | ||||||||||||
Common stock, $0.625 par value; authorized 700,000,000 shares; issued 558,838,694 and 537,100,615 shares, respectively |
349 | 336 | ||||||||||||
| Capital surplus | 5,351 | 4,840 | ||||||||||||
| Retained earnings | 3,964 | 3,430 | ||||||||||||
| Accumulated other comprehensive loss, net | (1,188) | (1,368) | ||||||||||||
| FHN shareholders' equity | 8,996 | 8,252 | ||||||||||||
| Noncontrolling interest | 295 | 295 | ||||||||||||
| Total equity | 9,291 | 8,547 | ||||||||||||
| Total liabilities and equity | $ | 81,661 | $ | 78,953 | ||||||||||
|
108 |
2023 FORM 10-K ANNUAL REPORT | ||||||
| ITEM 8. FINANCIAL STATEMENTS & SUPPLEMENTARY DATA | ||||||||
| CONSOLIDATED STATEMENTS OF INCOME | ||||||||
| Year Ended December 31 | ||||||||||||||||||||
| (Dollars in millions, except per share data; shares in thousands) | 2023 | 2022 | 2021 | |||||||||||||||||
| Interest income | ||||||||||||||||||||
| Interest and fees on loans and leases | $ | 3,575 | $ | 2,292 | $ | 1,957 | ||||||||||||||
| Interest and fees on loans held for sale | 51 | 39 | 33 | |||||||||||||||||
| Interest on investment securities | 247 | 198 | 121 | |||||||||||||||||
| Interest on trading securities | 78 | 58 | 30 | |||||||||||||||||
| Interest on other earning assets | 149 | 96 | 17 | |||||||||||||||||
| Total interest income | 4,100 | 2,683 | 2,158 | |||||||||||||||||
| Interest expense | ||||||||||||||||||||
| Interest on deposits | 1,266 | 184 | 81 | |||||||||||||||||
| Interest on trading liabilities | 12 | 12 | 6 | |||||||||||||||||
| Interest on short-term borrowings | 210 | 23 | 5 | |||||||||||||||||
| Interest on term borrowings | 72 | 72 | 72 | |||||||||||||||||
| Total interest expense | 1,560 | 291 | 164 | |||||||||||||||||
| Net interest income | 2,540 | 2,392 | 1,994 | |||||||||||||||||
| Provision (benefit) for credit losses | 260 | 95 | (310) | |||||||||||||||||
| Net interest income after provision for credit losses | 2,280 | 2,297 | 2,304 | |||||||||||||||||
| Noninterest income | ||||||||||||||||||||
| Deposit transactions and cash management | 179 | 171 | 175 | |||||||||||||||||
| Fixed income | 133 | 205 | 406 | |||||||||||||||||
| Brokerage, management fees and commissions | 90 | 92 | 88 | |||||||||||||||||
| Card and digital banking fees | 77 | 84 | 78 | |||||||||||||||||
| Other service charges and fees | 54 | 54 | 44 | |||||||||||||||||
| Trust services and investment management | 47 | 48 | 51 | |||||||||||||||||
| Mortgage banking and title income | 23 | 68 | 154 | |||||||||||||||||
| Gain on merger termination | 225 | — | — | |||||||||||||||||
| Securities gains (losses), net | (4) | 18 | 13 | |||||||||||||||||
| Other income | 103 | 75 | 67 | |||||||||||||||||
| Total noninterest income | 927 | 815 | 1,076 | |||||||||||||||||
| Noninterest expense | ||||||||||||||||||||
| Personnel expense | 1,100 | 1,101 | 1,210 | |||||||||||||||||
| Net occupancy expense | 123 | 128 | 137 | |||||||||||||||||
| Deposit insurance expense | 122 | 32 | 24 | |||||||||||||||||
| Computer software | 111 | 113 | 116 | |||||||||||||||||
| Operations services | 87 | 87 | 80 | |||||||||||||||||
| Advertising and public relations | 71 | 50 | 37 | |||||||||||||||||
| Contributions | 61 | 7 | 14 | |||||||||||||||||
| Legal and professional fees | 49 | 62 | 68 | |||||||||||||||||
| Contract employment and outsourcing | 49 | 54 | 67 | |||||||||||||||||
| Amortization of intangible assets | 47 | 51 | 56 | |||||||||||||||||
| Equipment expense | 42 | 45 | 47 | |||||||||||||||||
| Communications and delivery | 35 | 37 | 37 | |||||||||||||||||
| Impairment of long-lived assets | — | — | 34 | |||||||||||||||||
| Other expense | 182 | 186 | 169 | |||||||||||||||||
| Total noninterest expense | 2,079 | 1,953 | 2,096 | |||||||||||||||||
|
109 |
2023 FORM 10-K ANNUAL REPORT | ||||||
| ITEM 8. FINANCIAL STATEMENTS & SUPPLEMENTARY DATA | ||||||||
| CONSOLIDATED STATEMENTS OF INCOME | ||||||||
| Income before income taxes | 1,128 | 1,159 | 1,284 | |||||||||||||||||
| Income tax expense | 212 | 247 | 274 | |||||||||||||||||
| Net income | $ | 916 | $ | 912 | $ | 1,010 | ||||||||||||||
| Net income attributable to noncontrolling interest | 19 | 12 | 11 | |||||||||||||||||
| Net income attributable to controlling interest | $ | 897 | $ | 900 | $ | 999 | ||||||||||||||
| Preferred stock dividends | 32 | 32 | 37 | |||||||||||||||||
| Net income available to common shareholders | $ | 865 | $ | 868 | $ | 962 | ||||||||||||||
| Basic earnings per share | $ | 1.58 | $ | 1.62 | $ | 1.76 | ||||||||||||||
| Diluted earnings per share | $ | 1.54 | $ | 1.53 | $ | 1.74 | ||||||||||||||
| Weighted average common shares | 548,410 | 535,033 | 546,354 | |||||||||||||||||
| Diluted average common shares | 561,732 | 566,004 | 551,241 | |||||||||||||||||
|
110 |
2023 FORM 10-K ANNUAL REPORT | ||||||
| ITEM 8. FINANCIAL STATEMENTS & SUPPLEMENTARY DATA | ||||||||
| CONSOLIDATED STATEMENTS OF COMPREHENSIVE INCOME | ||||||||
| Year Ended December 31 | ||||||||||||||||||||
| (Dollars in millions) | 2023 | 2022 | 2021 | |||||||||||||||||
| Net income | $ | 916 | $ | 912 | $ | 1,010 | ||||||||||||||
| Other comprehensive income (loss), net of tax: | ||||||||||||||||||||
| Net unrealized gains (losses) on securities available for sale | 137 | (937) | (144) | |||||||||||||||||
| Net unrealized gains (losses) on cash flow hedges | 47 | (129) | (10) | |||||||||||||||||
| Net unrealized gains (losses) on pension and other postretirement plans | (4) | (14) | 6 | |||||||||||||||||
| Other comprehensive income (loss) | 180 | (1,080) | (148) | |||||||||||||||||
| Comprehensive income (loss) | 1,096 | (168) | 862 | |||||||||||||||||
| Comprehensive income attributable to noncontrolling interest | 19 | 12 | 11 | |||||||||||||||||
| Comprehensive income (loss) attributable to controlling interest | $ | 1,077 | $ | (180) | $ | 851 | ||||||||||||||
| Income tax expense (benefit) of items included in other comprehensive income: | ||||||||||||||||||||
| Net unrealized gains (losses) on securities available for sale | $ | 44 | $ | (302) | $ | (46) | ||||||||||||||
| Net unrealized gains (losses) on cash flow hedges | 15 | (42) | (3) | |||||||||||||||||
| Net unrealized gains (losses) on pension and other postretirement plans | (1) | (5) | 2 | |||||||||||||||||
|
111 |
2023 FORM 10-K ANNUAL REPORT | ||||||
| ITEM 8. FINANCIAL STATEMENTS & SUPPLEMENTARY DATA | ||||||||
| CONSOLIDATED STATEMENTS OF CHANGES IN EQUITY | ||||||||
| Preferred Stock | Common Stock | |||||||||||||||||||||||||||||||||||||||||||||||||||||||
| (Dollars in millions, except per share data; shares in thousands) | Shares | Amount | Shares | Amount | Capital Surplus |
Retained Earnings | Accumulated Other Comprehensive Income (Loss) (a) |
Noncontrolling Interest | Total | |||||||||||||||||||||||||||||||||||||||||||||||
| Balance, December 31, 2020 | 26,250 | $ | 470 | 555,031 | $ | 347 | $ | 5,074 | $ | 2,261 | $ | (140) | $ | 295 | $ | 8,307 | ||||||||||||||||||||||||||||||||||||||||
| Net income | — | — | — | — | — | 999 | — | 11 | 1,010 | |||||||||||||||||||||||||||||||||||||||||||||||
| Other comprehensive income (loss) | — | — | — | — | — | — | (148) | — | (148) | |||||||||||||||||||||||||||||||||||||||||||||||
| Cash dividends declared: | ||||||||||||||||||||||||||||||||||||||||||||||||||||||||
| Preferred stock | — | — | — | — | — | (32) | — | — | (32) | |||||||||||||||||||||||||||||||||||||||||||||||
Common stock ($0.60 per share) |
— | — | — | — | — | (332) | — | — | (332) | |||||||||||||||||||||||||||||||||||||||||||||||
Preferred stock issuance (1,500 shares issued at $100,000 per share net of offering costs) |
1,500 | 145 | — | — | — | — | — | — | 145 | |||||||||||||||||||||||||||||||||||||||||||||||
| Call of preferred stock | (1,000) | (95) | — | — | — | (5) | — | — | (100) | |||||||||||||||||||||||||||||||||||||||||||||||
| Common stock repurchased (b) | — | — | (25,063) | (16) | (400) | — | — | — | (416) | |||||||||||||||||||||||||||||||||||||||||||||||
| Common stock issued for: | ||||||||||||||||||||||||||||||||||||||||||||||||||||||||
| Stock options exercised and restricted stock awards | — | — | 3,609 | 2 | 26 | — | — | — | 28 | |||||||||||||||||||||||||||||||||||||||||||||||
| Stock-based compensation expense | — | — | — | — | 43 | — | — | — | 43 | |||||||||||||||||||||||||||||||||||||||||||||||
| Dividends declared - noncontrolling interest of subsidiary preferred stock | — | — | — | — | — | — | — | (11) | (11) | |||||||||||||||||||||||||||||||||||||||||||||||
| Balance, December 31, 2021 | 26,750 | 520 | 533,577 | 333 | 4,743 | 2,891 | (288) | 295 | 8,494 | |||||||||||||||||||||||||||||||||||||||||||||||
| Net income | — | — | — | — | — | 900 | — | 12 | 912 | |||||||||||||||||||||||||||||||||||||||||||||||
| Other comprehensive income (loss) | — | — | — | — | — | — | (1,080) | — | (1,080) | |||||||||||||||||||||||||||||||||||||||||||||||
| Cash dividends declared: | ||||||||||||||||||||||||||||||||||||||||||||||||||||||||
| Preferred stock | — | — | — | — | — | (32) | — | — | (32) | |||||||||||||||||||||||||||||||||||||||||||||||
Common stock ($0.60 per share) |
— | — | — | — | — | (329) | — | — | (329) | |||||||||||||||||||||||||||||||||||||||||||||||
Preferred stock issuance (4,936 shares issued at $100,000 per share) |
4,936 | 494 | — | — | — | — | — | — | 494 | |||||||||||||||||||||||||||||||||||||||||||||||
| Common stock repurchased | — | — | (577) | — | (12) | — | — | — | (12) | |||||||||||||||||||||||||||||||||||||||||||||||
| Common stock issued for: | ||||||||||||||||||||||||||||||||||||||||||||||||||||||||
| Stock options exercised and restricted stock awards | — | — | 4,101 | 3 | 34 | — | — | — | 37 | |||||||||||||||||||||||||||||||||||||||||||||||
| Stock-based compensation expense | — | — | — | — | 75 | — | — | — | 75 | |||||||||||||||||||||||||||||||||||||||||||||||
| Dividends declared - noncontrolling interest of subsidiary preferred stock | — | — | — | — | — | — | — | (12) | (12) | |||||||||||||||||||||||||||||||||||||||||||||||
| Balance, December 31, 2022 | 31,686 | 1,014 | 537,101 | 336 | 4,840 | 3,430 | (1,368) | 295 | 8,547 | |||||||||||||||||||||||||||||||||||||||||||||||
| Adjustment to reflect adoption of ASU 2022-02 | — | — | — | — | — | 4 | — | — | 4 | |||||||||||||||||||||||||||||||||||||||||||||||
| Net income | — | — | — | — | — | 897 | — | 19 | 916 | |||||||||||||||||||||||||||||||||||||||||||||||
| Other comprehensive income (loss) | — | — | — | — | — | — | 180 | — | 180 | |||||||||||||||||||||||||||||||||||||||||||||||
| Cash dividends declared: | ||||||||||||||||||||||||||||||||||||||||||||||||||||||||
| Preferred stock | — | — | — | — | — | (32) | — | — | (32) | |||||||||||||||||||||||||||||||||||||||||||||||
Common stock ($0.60 per share) |
— | — | — | — | — | (335) | — | — | (335) | |||||||||||||||||||||||||||||||||||||||||||||||
| Preferred stock conversion | (4,936) | (494) | — | — | — | — | — | — | (494) | |||||||||||||||||||||||||||||||||||||||||||||||
| Common stock repurchased | — | — | (807) | (1) | (9) | — | — | — | (10) | |||||||||||||||||||||||||||||||||||||||||||||||
| Common stock issued for: | ||||||||||||||||||||||||||||||||||||||||||||||||||||||||
| Stock options exercised and restricted stock awards | — | — | 2,802 | — | 5 | — | — | — | 5 | |||||||||||||||||||||||||||||||||||||||||||||||
| Series G preferred stock conversion | — | — | 19,743 | 12 | 481 | — | — | — | 493 | |||||||||||||||||||||||||||||||||||||||||||||||
| Stock-based compensation expense | — | — | — | 2 | 34 | — | — | — | 36 | |||||||||||||||||||||||||||||||||||||||||||||||
| Dividends declared - noncontrolling interest of subsidiary preferred stock | — | — | — | — | — | — | — | (19) | (19) | |||||||||||||||||||||||||||||||||||||||||||||||
| Balance, December 31, 2023 | 26,750 | $ | 520 | 558,839 | $ | 349 | $ | 5,351 | $ | 3,964 | $ | (1,188) | $ | 295 | $ | 9,291 | ||||||||||||||||||||||||||||||||||||||||
|
112 |
2023 FORM 10-K ANNUAL REPORT | ||||||
| ITEM 8. FINANCIAL STATEMENTS & SUPPLEMENTARY DATA | ||||||||
| CONSOLIDATED STATEMENTS OF CASH FLOWS | ||||||||
| Year Ended December 31 | ||||||||||||||||||||
| (Dollars in millions) | 2023 | 2022 | 2021 | |||||||||||||||||
| Operating Activities | ||||||||||||||||||||
| Net income | $ | 916 | $ | 912 | $ | 1,010 | ||||||||||||||
| Adjustments to reconcile net income to net cash provided by (used in) operating activities: | ||||||||||||||||||||
| Provision (benefit) for credit losses | 260 | 95 | (310) | |||||||||||||||||
| Deferred income tax expense (benefit) | 44 | 91 | — | |||||||||||||||||
| Depreciation and amortization of premises and equipment | 55 | 59 | 61 | |||||||||||||||||
| Amortization of intangible assets | 47 | 51 | 56 | |||||||||||||||||
| Net other amortization and accretion | — | (25) | (72) | |||||||||||||||||
| Net decrease in trading securities | 1,163 | 2,120 | 1,824 | |||||||||||||||||
| Net (increase) decrease in derivatives | (314) | 524 | 412 | |||||||||||||||||
| Stock-based compensation expense | 36 | 75 | 43 | |||||||||||||||||
| Securities (gains) losses, net | 4 | (18) | (13) | |||||||||||||||||
| Loss on debt extinguishment | — | — | 26 | |||||||||||||||||
| Net (gains) losses on sale/disposal of fixed assets | — | (1) | 29 | |||||||||||||||||
| Gain on divestiture | (9) | — | — | |||||||||||||||||
| (Gain) loss on BOLI | (7) | (9) | (8) | |||||||||||||||||
| Loans held for sale: | ||||||||||||||||||||
| Purchases and originations | (2,295) | (3,728) | (6,644) | |||||||||||||||||
| Gross proceeds from settlements and sales | 1,183 | 2,310 | 4,451 | |||||||||||||||||
| (Gain) loss due to fair value adjustments and other | (12) | 107 | (205) | |||||||||||||||||
| Other operating activities, net | 228 | (272) | 65 | |||||||||||||||||
| Total adjustments | 383 | 1,379 | (285) | |||||||||||||||||
| Net cash provided by operating activities | 1,299 | 2,291 | 725 | |||||||||||||||||
| Investing Activities | ||||||||||||||||||||
| Proceeds from sales of securities available for sale | — | — | 68 | |||||||||||||||||
| Proceeds from maturities of securities available for sale | 856 | 1,351 | 2,771 | |||||||||||||||||
| Purchases of securities available for sale | (261) | (2,767) | (3,736) | |||||||||||||||||
| Purchases of securities held to maturity | — | (712) | (720) | |||||||||||||||||
| Proceeds from prepayments of securities held to maturity | 53 | 55 | 17 | |||||||||||||||||
| Proceeds from sales of premises and equipment | 1 | 18 | 42 | |||||||||||||||||
| Purchases of premises and equipment | (37) | (28) | (53) | |||||||||||||||||
| Proceeds from BOLI | 14 | 22 | 22 | |||||||||||||||||
| Net (increase) decrease in loans and leases | (3,303) | (3,204) | 3,525 | |||||||||||||||||
| Net (increase) decrease in interest-bearing deposits with banks | 56 | 13,523 | (6,556) | |||||||||||||||||
| Cash received for divestitures | 11 | — | — | |||||||||||||||||
| Other investing activities, net | 5 | 75 | 19 | |||||||||||||||||
| Net cash provided by (used in) investing activities | (2,605) | 8,333 | (4,601) | |||||||||||||||||
| Financing Activities | ||||||||||||||||||||
| Common stock: | ||||||||||||||||||||
| Stock options exercised | 5 | 36 | 28 | |||||||||||||||||
| Cash dividends paid | (335) | (324) | (333) | |||||||||||||||||
| Repurchase of shares | (10) | (12) | (416) | |||||||||||||||||
| Preferred stock issuance | — | 494 | 145 | |||||||||||||||||
| Call of preferred stock | — | — | (100) | |||||||||||||||||
| Cash dividends paid - preferred stock - noncontrolling interest | (17) | (11) | (11) | |||||||||||||||||
| Cash dividends paid - preferred stock | (32) | (32) | (33) | |||||||||||||||||
| Net increase (decrease) in deposits | 2,289 | (11,406) | 4,919 | |||||||||||||||||
|
113 |
2023 FORM 10-K ANNUAL REPORT | ||||||
| ITEM 8. FINANCIAL STATEMENTS & SUPPLEMENTARY DATA | ||||||||
| CONSOLIDATED STATEMENTS OF CASH FLOWS | ||||||||
| Net increase (decrease) in short-term borrowings | 43 | 382 | (75) | |||||||||||||||||
| Increases (decreases) in term borrowings | (449) | 4 | (108) | |||||||||||||||||
| Net cash provided by (used in) financing activities | 1,494 | (10,869) | 4,016 | |||||||||||||||||
| Net increase (decrease) in cash and cash equivalents | 188 | (245) | 140 | |||||||||||||||||
| Cash and cash equivalents at beginning of period | 1,543 | 1,788 | 1,648 | |||||||||||||||||
| Cash and cash equivalents at end of period | $ | 1,731 | $ | 1,543 | $ | 1,788 | ||||||||||||||
| Supplemental Disclosures | ||||||||||||||||||||
| Total interest paid | $ | 1,428 | $ | 280 | $ | 170 | ||||||||||||||
| Total taxes paid | 123 | 20 | 258 | |||||||||||||||||
| Total taxes refunded | 19 | 7 | 30 | |||||||||||||||||
| Transfer from loans to OREO | 4 | 3 | 4 | |||||||||||||||||
| Transfer from loans HFS to trading securities | 1,212 | 1,893 | 2,232 | |||||||||||||||||
| Transfer from loans to loans HFS | 7 | — | 31 | |||||||||||||||||
| Preferred stock conversion to common stock | 493 | — | — | |||||||||||||||||
|
114 |
2023 FORM 10-K ANNUAL REPORT | ||||||
| ITEM 8. FINANCIAL STATEMENTS & SUPPLEMENTARY DATA | ||||||||
| NOTE 1—SIGNIFICANT ACCOUNTING POLICIES | ||||||||
|
115 |
2023 FORM 10-K ANNUAL REPORT | ||||||
| ITEM 8. FINANCIAL STATEMENTS & SUPPLEMENTARY DATA | ||||||||
| NOTE 1—SIGNIFICANT ACCOUNTING POLICIES | ||||||||
|
116 |
2023 FORM 10-K ANNUAL REPORT | ||||||
| ITEM 8. FINANCIAL STATEMENTS & SUPPLEMENTARY DATA | ||||||||
| NOTE 1—SIGNIFICANT ACCOUNTING POLICIES | ||||||||
|
117 |
2023 FORM 10-K ANNUAL REPORT | ||||||
| ITEM 8. FINANCIAL STATEMENTS & SUPPLEMENTARY DATA | ||||||||
| NOTE 1—SIGNIFICANT ACCOUNTING POLICIES | ||||||||
|
118 |
2023 FORM 10-K ANNUAL REPORT | ||||||
| ITEM 8. FINANCIAL STATEMENTS & SUPPLEMENTARY DATA | ||||||||
| NOTE 1—SIGNIFICANT ACCOUNTING POLICIES | ||||||||
|
119 |
2023 FORM 10-K ANNUAL REPORT | ||||||
| ITEM 8. FINANCIAL STATEMENTS & SUPPLEMENTARY DATA | ||||||||
| NOTE 1—SIGNIFICANT ACCOUNTING POLICIES | ||||||||
|
120 |
2023 FORM 10-K ANNUAL REPORT | ||||||
| ITEM 8. FINANCIAL STATEMENTS & SUPPLEMENTARY DATA | ||||||||
| NOTE 1—SIGNIFICANT ACCOUNTING POLICIES | ||||||||
|
121 |
2023 FORM 10-K ANNUAL REPORT | ||||||
| ITEM 8. FINANCIAL STATEMENTS & SUPPLEMENTARY DATA | ||||||||
| NOTE 1—SIGNIFICANT ACCOUNTING POLICIES | ||||||||
|
122 |
2023 FORM 10-K ANNUAL REPORT | ||||||
| ITEM 8. FINANCIAL STATEMENTS & SUPPLEMENTARY DATA | ||||||||
| NOTE 1—SIGNIFICANT ACCOUNTING POLICIES | ||||||||
|
123 |
2023 FORM 10-K ANNUAL REPORT | ||||||
| ITEM 8. FINANCIAL STATEMENTS & SUPPLEMENTARY DATA | ||||||||
| NOTE 1—SIGNIFICANT ACCOUNTING POLICIES | ||||||||
|
124 |
2023 FORM 10-K ANNUAL REPORT | ||||||
| ITEM 8. FINANCIAL STATEMENTS & SUPPLEMENTARY DATA | ||||||||
| NOTE 1—SIGNIFICANT ACCOUNTING POLICIES | ||||||||
|
125 |
2023 FORM 10-K ANNUAL REPORT | ||||||
| ITEM 8. FINANCIAL STATEMENTS & SUPPLEMENTARY DATA | ||||||||
| NOTE 1—SIGNIFICANT ACCOUNTING POLICIES | ||||||||
|
126 |
2023 FORM 10-K ANNUAL REPORT | ||||||
| ITEM 8. FINANCIAL STATEMENTS & SUPPLEMENTARY DATA | ||||||||
| NOTE 1—SIGNIFICANT ACCOUNTING POLICIES | ||||||||
|
127 |
2023 FORM 10-K ANNUAL REPORT | ||||||
| ITEM 8. FINANCIAL STATEMENTS & SUPPLEMENTARY DATA | ||||||||
| NOTE 2—INVESTMENT SECURITIES | ||||||||
| December 31, 2023 | ||||||||||||||||||||||||||
| (Dollars in millions) | Amortized Cost |
Gross Unrealized Gains |
Gross Unrealized Losses |
Fair Value |
||||||||||||||||||||||
| Securities available for sale: | ||||||||||||||||||||||||||
| Government agency issued MBS | $ | 5,061 | $ | 2 | $ | (579) | $ | 4,484 | ||||||||||||||||||
| Government agency issued CMO | 2,487 | — | (341) | 2,146 | ||||||||||||||||||||||
| Other U.S. government agencies | 1,321 | 2 | (151) | 1,172 | ||||||||||||||||||||||
| States and municipalities | 627 | 3 | (41) | 589 | ||||||||||||||||||||||
| Total securities available for sale (a) | $ | 9,496 | $ | 7 | $ | (1,112) | $ | 8,391 | ||||||||||||||||||
| Securities held to maturity: | ||||||||||||||||||||||||||
| Government agency issued MBS | $ | 852 | $ | — | $ | (96) | $ | 756 | ||||||||||||||||||
| Government agency issued CMO | 471 | — | (66) | 405 | ||||||||||||||||||||||
| Total securities held to maturity | $ | 1,323 | $ | — | $ | (162) | $ | 1,161 | ||||||||||||||||||
| December 31, 2022 | ||||||||||||||||||||||||||
| (Dollars in millions) | Amortized Cost |
Gross Unrealized Gains |
Gross Unrealized Losses |
Fair Value |
||||||||||||||||||||||
| Securities available for sale: | ||||||||||||||||||||||||||
| Government agency issued MBS | $ | 5,457 | $ | 1 | $ | (695) | $ | 4,763 | ||||||||||||||||||
| Government agency issued CMO | 2,682 | — | (369) | 2,313 | ||||||||||||||||||||||
| Other U.S. government agencies | 1,325 | — | (162) | 1,163 | ||||||||||||||||||||||
| States and municipalities | 658 | 1 | (62) | 597 | ||||||||||||||||||||||
| Total securities available for sale (a) | $ | 10,122 | $ | 2 | $ | (1,288) | $ | 8,836 | ||||||||||||||||||
| Securities held to maturity: | ||||||||||||||||||||||||||
| Government agency issued MBS | $ | 897 | $ | — | $ | (109) | $ | 788 | ||||||||||||||||||
| Government agency issued CMO | 474 | — | (53) | 421 | ||||||||||||||||||||||
| Total securities held to maturity | $ | 1,371 | $ | — | $ | (162) | $ | 1,209 | ||||||||||||||||||
|
128 |
2023 FORM 10-K ANNUAL REPORT | ||||||
| ITEM 8. FINANCIAL STATEMENTS & SUPPLEMENTARY DATA | ||||||||
| NOTE 2—INVESTMENT SECURITIES | ||||||||
| Held to Maturity | Available for Sale | |||||||||||||||||||||||||
| (Dollars in millions) | Amortized Cost |
Fair Value |
Amortized Cost |
Fair Value |
||||||||||||||||||||||
| Within 1 year | $ | — | $ | — | $ | 36 | $ | 36 | ||||||||||||||||||
| After 1 year through 5 years | — | — | 99 | 95 | ||||||||||||||||||||||
| After 5 years through 10 years | — | — | 397 | 364 | ||||||||||||||||||||||
| After 10 years | — | — | 1,416 | 1,266 | ||||||||||||||||||||||
| Subtotal | — | — | 1,948 | 1,761 | ||||||||||||||||||||||
| Government agency issued MBS and CMO (a) | 1,323 | 1,161 | 7,548 | 6,630 | ||||||||||||||||||||||
| Total | $ | 1,323 | $ | 1,161 | $ | 9,496 | $ | 8,391 | ||||||||||||||||||
| As of December 31, 2023 | ||||||||||||||||||||||||||||||||||||||
| Less than 12 months | 12 months or longer | Total | ||||||||||||||||||||||||||||||||||||
| (Dollars in millions) | Fair Value | Unrealized Losses | Fair Value | Unrealized Losses | Fair Value | Unrealized Losses | ||||||||||||||||||||||||||||||||
| Government agency issued MBS | $ | 140 | $ | (2) | $ | 4,231 | $ | (577) | $ | 4,371 | $ | (579) | ||||||||||||||||||||||||||
| Government agency issued CMO | 32 | — | 2,098 | (341) | 2,130 | (341) | ||||||||||||||||||||||||||||||||
| Other U.S. government agencies | 114 | (2) | 905 | (149) | 1,019 | (151) | ||||||||||||||||||||||||||||||||
| States and municipalities | 14 | — | 465 | (41) | 479 | (41) | ||||||||||||||||||||||||||||||||
| Total | $ | 300 | $ | (4) | $ | 7,699 | $ | (1,108) | $ | 7,999 | $ | (1,112) | ||||||||||||||||||||||||||
| As of December 31, 2022 | ||||||||||||||||||||||||||||||||||||||
| Less than 12 months | 12 months or longer | Total | ||||||||||||||||||||||||||||||||||||
| (Dollars in millions) | Fair Value | Unrealized Losses | Fair Value | Unrealized Losses | Fair Value | Unrealized Losses | ||||||||||||||||||||||||||||||||
| Government agency issued MBS | $ | 2,314 | $ | (249) | $ | 2,350 | $ | (446) | $ | 4,664 | $ | (695) | ||||||||||||||||||||||||||
| Government agency issued CMO | 1,104 | (123) | 1,209 | (246) | 2,313 | (369) | ||||||||||||||||||||||||||||||||
| Other U.S. government agencies | 643 | (67) | 424 | (95) | 1,067 | (162) | ||||||||||||||||||||||||||||||||
| States and municipalities | 493 | (48) | 54 | (14) | 547 | (62) | ||||||||||||||||||||||||||||||||
| Total | $ | 4,554 | $ | (487) | $ | 4,037 | $ | (801) | $ | 8,591 | $ | (1,288) | ||||||||||||||||||||||||||
|
129 |
2023 FORM 10-K ANNUAL REPORT | ||||||
| ITEM 8. FINANCIAL STATEMENTS & SUPPLEMENTARY DATA | ||||||||
| NOTE 2—INVESTMENT SECURITIES | ||||||||
|
130 |
2023 FORM 10-K ANNUAL REPORT | ||||||
| ITEM 8. FINANCIAL STATEMENTS & SUPPLEMENTARY DATA | ||||||||
| NOTE 3—LOANS & LEASES | ||||||||
| December 31, | ||||||||||||||
| (Dollars in millions) | 2023 | 2022 | ||||||||||||
| Commercial: | ||||||||||||||
| Commercial and industrial (a) (b) | $ | 30,614 | $ | 29,523 | ||||||||||
| Loans to mortgage companies | 2,019 | 2,258 | ||||||||||||
| Total commercial, financial, and industrial | 32,633 | 31,781 | ||||||||||||
| Commercial real estate | 14,216 | 13,228 | ||||||||||||
| Consumer: | ||||||||||||||
| HELOC | 2,219 | 2,028 | ||||||||||||
| Real estate installment loans | 11,431 | 10,225 | ||||||||||||
| Total consumer real estate | 13,650 | 12,253 | ||||||||||||
| Credit card and other (c) | 793 | 840 | ||||||||||||
| Loans and leases | $ | 61,292 | $ | 58,102 | ||||||||||
| Allowance for loan and lease losses | (773) | (685) | ||||||||||||
| Net loans and leases | $ | 60,519 | $ | 57,417 | ||||||||||
|
131 |
2023 FORM 10-K ANNUAL REPORT | ||||||
| ITEM 8. FINANCIAL STATEMENTS & SUPPLEMENTARY DATA | ||||||||
| NOTE 3—LOANS & LEASES | ||||||||
| December 31, 2023 | ||||||||||||||||||||||||||||||||||||||||||||||||||||||||||||||
| (Dollars in millions) | 2023 | 2022 | 2021 | 2020 | 2019 | Prior to 2019 | LMC (a) | Revolving Loans |
Revolving Loans Converted to Term Loans |
Total | ||||||||||||||||||||||||||||||||||||||||||||||||||||
| Credit Quality Indicator: | ||||||||||||||||||||||||||||||||||||||||||||||||||||||||||||||
| Pass (PD grades 1 through 12) (b) | $ | 4,009 | $ | 5,638 | $ | 3,507 | $ | 1,636 | $ | 1,666 | $ | 3,449 | $ | 2,014 | $ | 9,087 | $ | 327 | $ | 31,333 | ||||||||||||||||||||||||||||||||||||||||||
| Special Mention (PD grade 13) | 75 | 60 | 64 | 56 | 101 | 57 | — | 186 | — | 599 | ||||||||||||||||||||||||||||||||||||||||||||||||||||
| Substandard, Doubtful, or Loss (PD grades 14,15, and 16) | 41 | 135 | 94 | 51 | 39 | 100 | 5 | 187 | 49 | 701 | ||||||||||||||||||||||||||||||||||||||||||||||||||||
| Total C&I loans | $ | 4,125 | $ | 5,833 | $ | 3,665 | $ | 1,743 | $ | 1,806 | $ | 3,606 | $ | 2,019 | $ | 9,460 | $ | 376 | $ | 32,633 | ||||||||||||||||||||||||||||||||||||||||||
| December 31, 2022 | ||||||||||||||||||||||||||||||||||||||||||||||||||||||||||||||
| (Dollars in millions) | 2022 | 2021 | 2020 | 2019 | 2018 | Prior to 2018 | LMC (a) | Revolving Loans |
Revolving Loans Converted to Term Loans |
Total | ||||||||||||||||||||||||||||||||||||||||||||||||||||
| Credit Quality Indicator: | ||||||||||||||||||||||||||||||||||||||||||||||||||||||||||||||
| Pass (PD grades 1 through 12) (b) | $ | 7,456 | $ | 3,634 | $ | 1,803 | $ | 1,912 | $ | 1,112 | $ | 3,170 | $ | 2,258 | $ | 9,166 | $ | 371 | $ | 30,882 | ||||||||||||||||||||||||||||||||||||||||||
| Special Mention (PD grade 13) | 17 | 56 | 17 | 125 | 8 | 80 | — | 126 | — | 429 | ||||||||||||||||||||||||||||||||||||||||||||||||||||
| Substandard, Doubtful, or Loss (PD grades 14,15, and 16) | 36 | 48 | 41 | 34 | 25 | 55 | — | 134 | 97 | 470 | ||||||||||||||||||||||||||||||||||||||||||||||||||||
| Total C&I loans | $ | 7,509 | $ | 3,738 | $ | 1,861 | $ | 2,071 | $ | 1,145 | $ | 3,305 | $ | 2,258 | $ | 9,426 | $ | 468 | $ | 31,781 | ||||||||||||||||||||||||||||||||||||||||||
| December 31, 2023 | ||||||||||||||||||||||||||||||||||||||||||||||||||||||||
| (Dollars in millions) | 2023 | 2022 | 2021 | 2020 | 2019 | Prior to 2019 | Revolving Loans |
Revolving Loans Converted to Term Loans |
Total | |||||||||||||||||||||||||||||||||||||||||||||||
| Credit Quality Indicator: | ||||||||||||||||||||||||||||||||||||||||||||||||||||||||
| Pass (PD grades 1 through 12) | $ | 853 | $ | 3,473 | $ | 3,518 | $ | 1,162 | $ | 1,216 | $ | 2,853 | $ | 393 | $ | 18 | $ | 13,486 | ||||||||||||||||||||||||||||||||||||||
| Special Mention (PD grade 13) | 5 | 1 | 129 | 86 | 175 | 82 | — | — | 478 | |||||||||||||||||||||||||||||||||||||||||||||||
| Substandard, Doubtful, or Loss (PD grades 14,15, and 16) | — | 2 | 5 | 11 | 175 | 59 | — | — | 252 | |||||||||||||||||||||||||||||||||||||||||||||||
| Total CRE loans | $ | 858 | $ | 3,476 | $ | 3,652 | $ | 1,259 | $ | 1,566 | $ | 2,994 | $ | 393 | $ | 18 | $ | 14,216 | ||||||||||||||||||||||||||||||||||||||
|
132 |
2023 FORM 10-K ANNUAL REPORT | ||||||
| ITEM 8. FINANCIAL STATEMENTS & SUPPLEMENTARY DATA | ||||||||
| NOTE 3—LOANS & LEASES | ||||||||
| December 31, 2022 | ||||||||||||||||||||||||||||||||||||||||||||||||||||||||
| (Dollars in millions) | 2022 | 2021 | 2020 | 2019 | 2018 | Prior to 2018 | Revolving Loans |
Revolving Loans Converted to Term Loans |
Total | |||||||||||||||||||||||||||||||||||||||||||||||
| Credit Quality Indicator: | ||||||||||||||||||||||||||||||||||||||||||||||||||||||||
| Pass (PD grades 1 through 12) | $ | 2,637 | $ | 3,324 | $ | 1,488 | $ | 1,855 | $ | 808 | $ | 2,565 | $ | 274 | $ | 20 | $ | 12,971 | ||||||||||||||||||||||||||||||||||||||
| Special Mention (PD grade 13) | — | 3 | 3 | 37 | 68 | 5 | 1 | — | 117 | |||||||||||||||||||||||||||||||||||||||||||||||
| Substandard, Doubtful, or Loss (PD grades 14,15, and 16) | 1 | 4 | 12 | 50 | 31 | 31 | 11 | — | 140 | |||||||||||||||||||||||||||||||||||||||||||||||
| Total CRE loans | $ | 2,638 | $ | 3,331 | $ | 1,503 | $ | 1,942 | $ | 907 | $ | 2,601 | $ | 286 | $ | 20 | $ | 13,228 | ||||||||||||||||||||||||||||||||||||||
| December 31, 2023 | ||||||||||||||||||||||||||||||||||||||||||||||||||||||||
| (Dollars in millions) | 2023 | 2022 | 2021 | 2020 | 2019 | Prior to 2019 | Revolving Loans | Revolving Loans Converted to Term Loans | Total | |||||||||||||||||||||||||||||||||||||||||||||||
| FICO score 740 or greater | $ | 1,572 | $ | 2,099 | $ | 1,720 | $ | 730 | $ | 465 | $ | 1,332 | $ | 1,522 | $ | 50 | $ | 9,490 | ||||||||||||||||||||||||||||||||||||||
| FICO score 720-739 | 205 | 286 | 227 | 107 | 88 | 230 | 192 | 15 | 1,350 | |||||||||||||||||||||||||||||||||||||||||||||||
| FICO score 700-719 | 154 | 232 | 193 | 81 | 52 | 224 | 159 | 17 | 1,112 | |||||||||||||||||||||||||||||||||||||||||||||||
| FICO score 660-699 | 170 | 198 | 113 | 83 | 53 | 290 | 168 | 18 | 1,093 | |||||||||||||||||||||||||||||||||||||||||||||||
| FICO score 620-659 | 11 | 20 | 23 | 22 | 36 | 106 | 36 | 7 | 261 | |||||||||||||||||||||||||||||||||||||||||||||||
| FICO score less than 620 | 18 | 19 | 15 | 20 | 12 | 225 | 24 | 11 | 344 | |||||||||||||||||||||||||||||||||||||||||||||||
| Total | $ | 2,130 | $ | 2,854 | $ | 2,291 | $ | 1,043 | $ | 706 | $ | 2,407 | $ | 2,101 | $ | 118 | $ | 13,650 | ||||||||||||||||||||||||||||||||||||||
|
133 |
2023 FORM 10-K ANNUAL REPORT | ||||||
| ITEM 8. FINANCIAL STATEMENTS & SUPPLEMENTARY DATA | ||||||||
| NOTE 3—LOANS & LEASES | ||||||||
| December 31, 2022 | ||||||||||||||||||||||||||||||||||||||||||||||||||||||||
| (Dollars in millions) | 2022 | 2021 | 2020 | 2019 | 2018 | Prior to 2018 | Revolving Loans | Revolving Loans Converted to Term Loans | Total | |||||||||||||||||||||||||||||||||||||||||||||||
| FICO score 740 or greater | $ | 2,154 | $ | 1,847 | $ | 819 | $ | 523 | $ | 278 | $ | 1,294 | $ | 1,297 | $ | 63 | $ | 8,275 | ||||||||||||||||||||||||||||||||||||||
| FICO score 720-739 | 292 | 246 | 116 | 98 | 34 | 238 | 183 | 18 | 1,225 | |||||||||||||||||||||||||||||||||||||||||||||||
| FICO score 700-719 | 242 | 206 | 93 | 55 | 35 | 226 | 142 | 22 | 1,021 | |||||||||||||||||||||||||||||||||||||||||||||||
| FICO score 660-699 | 214 | 137 | 90 | 55 | 62 | 278 | 192 | 23 | 1,051 | |||||||||||||||||||||||||||||||||||||||||||||||
| FICO score 620-659 | 21 | 24 | 25 | 41 | 20 | 105 | 47 | 9 | 292 | |||||||||||||||||||||||||||||||||||||||||||||||
| FICO score less than 620 | 15 | 19 | 32 | 12 | 23 | 256 | 16 | 16 | 389 | |||||||||||||||||||||||||||||||||||||||||||||||
| Total | $ | 2,938 | $ | 2,479 | $ | 1,175 | $ | 784 | $ | 452 | $ | 2,397 | $ | 1,877 | $ | 151 | $ | 12,253 | ||||||||||||||||||||||||||||||||||||||
| December 31, 2023 | ||||||||||||||||||||||||||||||||||||||||||||||||||||||||
| (Dollars in millions) | 2023 | 2022 | 2021 | 2020 | 2019 | Prior to 2019 | Revolving Loans | Revolving Loans Converted to Term Loans | Total | |||||||||||||||||||||||||||||||||||||||||||||||
| FICO score 740 or greater | $ | 52 | $ | 26 | $ | 10 | $ | 5 | $ | 3 | $ | 27 | $ | 207 | $ | 5 | $ | 335 | ||||||||||||||||||||||||||||||||||||||
| FICO score 720-739 | 5 | 3 | 1 | 1 | 1 | 5 | 24 | 1 | 41 | |||||||||||||||||||||||||||||||||||||||||||||||
| FICO score 700-719 | 5 | 4 | 1 | 1 | 1 | 4 | 25 | 1 | 42 | |||||||||||||||||||||||||||||||||||||||||||||||
| FICO score 660-699 | 4 | 3 | 1 | 1 | 1 | 8 | 23 | — | 41 | |||||||||||||||||||||||||||||||||||||||||||||||
| FICO score 620-659 | 2 | 1 | 1 | — | — | 3 | 7 | — | 14 | |||||||||||||||||||||||||||||||||||||||||||||||
| FICO score less than 620 | 12 | 9 | 6 | 8 | 13 | 103 | 168 | 1 | 320 | |||||||||||||||||||||||||||||||||||||||||||||||
| Total | $ | 80 | $ | 46 | $ | 20 | $ | 16 | $ | 19 | $ | 150 | $ | 454 | $ | 8 | $ | 793 | ||||||||||||||||||||||||||||||||||||||
| December 31, 2022 | ||||||||||||||||||||||||||||||||||||||||||||||||||||||||
| (Dollars in millions) | 2022 | 2021 | 2020 | 2019 | 2018 | Prior to 2018 | Revolving Loans | Revolving Loans Converted to Term Loans | Total | |||||||||||||||||||||||||||||||||||||||||||||||
| FICO score 740 or greater | $ | 36 | $ | 14 | $ | 10 | $ | 10 | $ | 4 | $ | 25 | $ | 291 | $ | 6 | $ | 396 | ||||||||||||||||||||||||||||||||||||||
| FICO score 720-739 | 3 | 2 | 2 | 1 | — | 4 | 30 | 1 | 43 | |||||||||||||||||||||||||||||||||||||||||||||||
| FICO score 700-719 | 3 | 3 | 1 | 1 | — | 4 | 33 | 1 | 46 | |||||||||||||||||||||||||||||||||||||||||||||||
| FICO score 660-699 | 3 | 2 | 1 | 1 | 2 | 7 | 30 | 1 | 47 | |||||||||||||||||||||||||||||||||||||||||||||||
| FICO score 620-659 | 1 | 3 | 1 | — | — | 3 | 18 | — | 26 | |||||||||||||||||||||||||||||||||||||||||||||||
| FICO score less than 620 | 7 | 6 | 6 | 10 | 7 | 71 | 174 | 1 | 282 | |||||||||||||||||||||||||||||||||||||||||||||||
| Total | $ | 53 | $ | 30 | $ | 21 | $ | 23 | $ | 13 | $ | 114 | $ | 576 | $ | 10 | $ | 840 | ||||||||||||||||||||||||||||||||||||||
|
134 |
2023 FORM 10-K ANNUAL REPORT | ||||||
| ITEM 8. FINANCIAL STATEMENTS & SUPPLEMENTARY DATA | ||||||||
| NOTE 3—LOANS & LEASES | ||||||||
| December 31, 2023 | ||||||||||||||||||||||||||||||||||||||||||||||||||||||||
| Accruing | Non-Accruing | |||||||||||||||||||||||||||||||||||||||||||||||||||||||
| (Dollars in millions) | Current | 30-89 Days Past Due |
90+ Days Past Due |
Total Accruing |
Current | 30-89 Days Past Due |
90+ Days Past Due |
Total Non- Accruing |
Total Loans and Leases |
|||||||||||||||||||||||||||||||||||||||||||||||
| Commercial, financial, and industrial: | ||||||||||||||||||||||||||||||||||||||||||||||||||||||||
| C&I (a) | $ | 30,403 | $ | 31 | $ | 1 | $ | 30,435 | $ | 108 | $ | 18 | $ | 53 | $ | 179 | $ | 30,614 | ||||||||||||||||||||||||||||||||||||||
| Loans to mortgage companies | 2,013 | 1 | — | 2,014 | 5 | — | — | 5 | 2,019 | |||||||||||||||||||||||||||||||||||||||||||||||
| Total commercial, financial, and industrial | 32,416 | 32 | 1 | 32,449 | 113 | 18 | 53 | 184 | 32,633 | |||||||||||||||||||||||||||||||||||||||||||||||
| Commercial real estate: | ||||||||||||||||||||||||||||||||||||||||||||||||||||||||
| CRE (b) | 14,072 | 8 | — | 14,080 | 41 | — | 95 | 136 | 14,216 | |||||||||||||||||||||||||||||||||||||||||||||||
| Consumer real estate: | ||||||||||||||||||||||||||||||||||||||||||||||||||||||||
| HELOC (c) | 2,158 | 11 | 4 | 2,173 | 30 | 6 | 10 | 46 | 2,219 | |||||||||||||||||||||||||||||||||||||||||||||||
| Real estate installment loans (d) | 11,295 | 29 | 13 | 11,337 | 43 | 6 | 45 | 94 | 11,431 | |||||||||||||||||||||||||||||||||||||||||||||||
| Total consumer real estate | 13,453 | 40 | 17 | 13,510 | 73 | 12 | 55 | 140 | 13,650 | |||||||||||||||||||||||||||||||||||||||||||||||
| Credit card and other: | ||||||||||||||||||||||||||||||||||||||||||||||||||||||||
| Credit card | 271 | 3 | 3 | 277 | — | — | — | — | 277 | |||||||||||||||||||||||||||||||||||||||||||||||
| Other | 512 | 2 | — | 514 | 1 | — | 1 | 2 | 516 | |||||||||||||||||||||||||||||||||||||||||||||||
| Total credit card and other | 783 | 5 | 3 | 791 | 1 | — | 1 | 2 | 793 | |||||||||||||||||||||||||||||||||||||||||||||||
| Total loans and leases | $ | 60,724 | $ | 85 | $ | 21 | $ | 60,830 | $ | 228 | $ | 30 | $ | 204 | $ | 462 | $ | 61,292 | ||||||||||||||||||||||||||||||||||||||
|
135 |
2023 FORM 10-K ANNUAL REPORT | ||||||
| ITEM 8. FINANCIAL STATEMENTS & SUPPLEMENTARY DATA | ||||||||
| NOTE 3—LOANS & LEASES | ||||||||
| December 31, 2022 | ||||||||||||||||||||||||||||||||||||||||||||||||||||||||
| Accruing | Non-Accruing | |||||||||||||||||||||||||||||||||||||||||||||||||||||||
| (Dollars in millions) | Current | 30-89 Days Past Due |
90+ Days Past Due |
Total Accruing |
Current | 30-89 Days Past Due |
90+ Days Past Due |
Total Non- Accruing |
Total Loans and Leases |
|||||||||||||||||||||||||||||||||||||||||||||||
| Commercial, financial, and industrial: | ||||||||||||||||||||||||||||||||||||||||||||||||||||||||
| C&I (a) | $ | 29,309 | $ | 50 | $ | 11 | $ | 29,370 | $ | 64 | $ | 10 | $ | 79 | $ | 153 | $ | 29,523 | ||||||||||||||||||||||||||||||||||||||
| Loans to mortgage companies | 2,258 | — | — | 2,258 | — | — | — | — | 2,258 | |||||||||||||||||||||||||||||||||||||||||||||||
| Total commercial, financial, and industrial | 31,567 | 50 | 11 | 31,628 | 64 | 10 | 79 | 153 | 31,781 | |||||||||||||||||||||||||||||||||||||||||||||||
| Commercial real estate: | ||||||||||||||||||||||||||||||||||||||||||||||||||||||||
| CRE (b) | 13,208 | 11 | — | 13,219 | 7 | — | 2 | 9 | 13,228 | |||||||||||||||||||||||||||||||||||||||||||||||
| Consumer real estate: | ||||||||||||||||||||||||||||||||||||||||||||||||||||||||
| HELOC (c) | 1,967 | 12 | 5 | 1,984 | 32 | 4 | 8 | 44 | 2,028 | |||||||||||||||||||||||||||||||||||||||||||||||
| Real estate installment loans (d) | 10,079 | 25 | 13 | 10,117 | 56 | 5 | 47 | 108 | 10,225 | |||||||||||||||||||||||||||||||||||||||||||||||
| Total consumer real estate | 12,046 | 37 | 18 | 12,101 | 88 | 9 | 55 | 152 | 12,253 | |||||||||||||||||||||||||||||||||||||||||||||||
| Credit card and other: | ||||||||||||||||||||||||||||||||||||||||||||||||||||||||
| Credit card | 287 | 5 | 4 | 296 | — | — | — | — | 296 | |||||||||||||||||||||||||||||||||||||||||||||||
| Other | 540 | 2 | — | 542 | 1 | — | 1 | 2 | 544 | |||||||||||||||||||||||||||||||||||||||||||||||
| Total credit card and other | 827 | 7 | 4 | 838 | 1 | — | 1 | 2 | 840 | |||||||||||||||||||||||||||||||||||||||||||||||
| Total loans and leases | $ | 57,648 | $ | 105 | $ | 33 | $ | 57,786 | $ | 160 | $ | 19 | $ | 137 | $ | 316 | $ | 58,102 | ||||||||||||||||||||||||||||||||||||||
|
136 |
2023 FORM 10-K ANNUAL REPORT | ||||||
| ITEM 8. FINANCIAL STATEMENTS & SUPPLEMENTARY DATA | ||||||||
| NOTE 3—LOANS & LEASES | ||||||||
| December 31, 2023 | ||||||||||||||||||||
| Interest Rate Reduction | ||||||||||||||||||||
| (Dollars in millions) | Balance | % of Total Class | Financial Effect | |||||||||||||||||
| Consumer real estate | $ | 2 | — | % | Reduced weighted-average contractual interest rate from 8.60% to 5.00% |
|||||||||||||||
| Credit card and other (a) | — | — | Reduced weighted-average contractual interest rate from 11.20% to 0.00% |
|||||||||||||||||
| Total | $ | 2 | — | % | ||||||||||||||||
| December 31, 2023 | |||||||||||||||||||||||
| Term Extension | |||||||||||||||||||||||
| (Dollars in millions) | Balance | % of Total Class | Financial Effect | ||||||||||||||||||||
| C&I | $ | 90 | 0.3 | % | Added a weighted-average 1 year to the life of loans, which reduced monthly payment amounts for the borrowers |
||||||||||||||||||
| CRE | 40 | 0.3 | Added a weighted-average 0.8 year to the life of loans, which reduced monthly payment amounts for the borrowers |
||||||||||||||||||||
| Consumer real estate | 2 | — | Added a weighted-average 12 years to the life of loans, which reduced monthly payment amounts for the borrowers |
||||||||||||||||||||
| Total | $ | 132 | 0.2 | % | |||||||||||||||||||
| December 31, 2023 | |||||||||||||||||||||||
| Principal Forgiveness | |||||||||||||||||||||||
| (Dollars in millions) | Balance | % of Total Class | Financial Effect | ||||||||||||||||||||
| Consumer real estate | $ | 2 | — | % | $1.3 million of the principal of consumer loans was legally discharged in bankruptcy during the period and the borrowers have not re-affirmed the debt as of period end |
||||||||||||||||||
| Total | $ | 2 | — | % | |||||||||||||||||||
|
137 |
2023 FORM 10-K ANNUAL REPORT | ||||||
| ITEM 8. FINANCIAL STATEMENTS & SUPPLEMENTARY DATA | ||||||||
| NOTE 3—LOANS & LEASES | ||||||||
| December 31, 2023 | |||||||||||||||||||||||
| Payment Deferrals | |||||||||||||||||||||||
| (Dollars in millions) | Balance | % of Total Class | Financial Effect | ||||||||||||||||||||
| Consumer real estate | $ | 3 | — | % | Payment deferral for 11 months, with a balloon payment at the end of the term |
||||||||||||||||||
| Total | $ | 3 | — | % | |||||||||||||||||||
| December 31, 2023 | |||||||||||||||||||||||
| Combination - Term Extension and Interest Rate Reduction | |||||||||||||||||||||||
| (Dollars in millions) | Balance | % of Total Class | Financial Effect | ||||||||||||||||||||
| C&I (a) | $ | — | — | % | Added a weighted-average 1.2 years to the life of loans and reduced weighted-average contractual interest rate from 13.00% to 11.50% |
||||||||||||||||||
| Consumer real estate | 6 | — | Added a weighted-average 14.3 years to the life of loans and reduced weighted-average contractual interest rate from 5.00% to 4.70% |
||||||||||||||||||||
| Total | $ | 6 | — | % | |||||||||||||||||||
| December 31, 2023 | |||||||||||||||||||||||
| Combination - Term Extension, Interest Rate Reduction, and Interest Forgiveness | |||||||||||||||||||||||
| (Dollars in millions) | Balance | % of Total Class | Financial Effect | ||||||||||||||||||||
| C&I | $ | 2 | — | % | Added a weighted-average 3.7 years to the life of loans, reduced weighted-average contractual interest rate from 11.25% to 7.50% and provided less than $1 million in interest forgiveness |
||||||||||||||||||
| Total | $ | 2 | — | % | |||||||||||||||||||
| December 31, 2023 | |||||||||||||||||||||||
| Combination - Term Extension, Interest Rate Reduction, and Interest Deferrals | |||||||||||||||||||||||
| (Dollars in millions) | Balance | % of Total Class | Financial Effect | ||||||||||||||||||||
| CRE | $ | 15 | 0.1 | % | Added a weighted-average 1 year to the life of loans, reduced weighted-average contractual interest rate from 8.65% to 8.00% and provided less than $1 million in deferred interest |
||||||||||||||||||
| Total | $ | 15 | — | % | |||||||||||||||||||
| PERFORMANCE OF LOANS THAT HAVE BEEN MODIFIED IN THE LAST 12 MONTHS | ||||||||||||||||||||||||||
| December 31, 2023 | ||||||||||||||||||||||||||
| (Dollars in millions) | Current | 30-89 Days Past Due | 90+ Days Past Due | Non-Accruing | ||||||||||||||||||||||
| C&I | $ | 70 | $ | — | $ | — | $ | 22 | ||||||||||||||||||
| CRE | 8 | — | — | 47 | ||||||||||||||||||||||
| Consumer real estate | 4 | — | — | 11 | ||||||||||||||||||||||
| Credit card and other | — | — | — | — | ||||||||||||||||||||||
| Total | $ | 82 | $ | — | $ | — | $ | 80 | ||||||||||||||||||
|
138 |
2023 FORM 10-K ANNUAL REPORT | ||||||
| ITEM 8. FINANCIAL STATEMENTS & SUPPLEMENTARY DATA | ||||||||
| NOTE 3—LOANS & LEASES | ||||||||
| Year Ended December 31, 2022 | |||||||||||||||||||||||
| (Dollars in millions) | Number | Pre-Modification Outstanding Recorded Investment |
Post-Modification Outstanding Recorded Investment |
||||||||||||||||||||
| C&I | 6 | $ | 30 | $ | 24 | ||||||||||||||||||
| CRE | 1 | 1 | 1 | ||||||||||||||||||||
| HELOC | 98 | 7 | 7 | ||||||||||||||||||||
| Real estate installment loans | 181 | 41 | 41 | ||||||||||||||||||||
| Credit card and other | 81 | 12 | 12 | ||||||||||||||||||||
| Total TDRs | 367 | $ | 91 | $ | 85 | ||||||||||||||||||
| Year Ended December 31, 2022 | |||||||||||||||||
| (Dollars in millions) | Number | Recorded Investment |
|||||||||||||||
| C&I | 5 | $ | — | ||||||||||||||
| CRE | — | — | |||||||||||||||
| HELOC | 22 | 1 | |||||||||||||||
| Real estate installment loans | 54 | 15 | |||||||||||||||
| Credit card and other | 17 | — | |||||||||||||||
| Total TDRs | 98 | $ | 16 | ||||||||||||||
|
139 |
2023 FORM 10-K ANNUAL REPORT | ||||||
| ITEM 8. FINANCIAL STATEMENTS & SUPPLEMENTARY DATA | ||||||||
| NOTE 4—ALLOWANCE FOR CREDIT LOSSES | ||||||||
|
140 |
2023 FORM 10-K ANNUAL REPORT | ||||||
| ITEM 8. FINANCIAL STATEMENTS & SUPPLEMENTARY DATA | ||||||||
| NOTE 4—ALLOWANCE FOR CREDIT LOSSES | ||||||||
| (Dollars in millions) | Commercial, Financial, and Industrial (a) | Commercial Real Estate |
Consumer Real Estate |
Credit Card and Other |
Total | |||||||||||||||||||||||||||
| Allowance for loan and lease losses: | ||||||||||||||||||||||||||||||||
| Balance as of January 1, 2023 | $ | 308 | $ | 146 | $ | 200 | $ | 31 | $ | 685 | ||||||||||||||||||||||
| Adoption of ASU 2022-02 (b) | 1 | — | (7) | — | (6) | |||||||||||||||||||||||||||
| Charge-offs (c) | (156) | (17) | (4) | (22) | (199) | |||||||||||||||||||||||||||
| Recoveries | 14 | 2 | 9 | 4 | 29 | |||||||||||||||||||||||||||
| Provision for loan and lease losses | 172 | 41 | 35 | 16 | 264 | |||||||||||||||||||||||||||
| Balance as of December 31, 2023 | 339 | 172 | 233 | 29 | 773 | |||||||||||||||||||||||||||
| Reserve for remaining unfunded commitments: | ||||||||||||||||||||||||||||||||
| Balance as of January 1, 2023 | 55 | 22 | 10 | — | 87 | |||||||||||||||||||||||||||
| Provision for unfunded lending commitments | (6) | — | 2 | — | (4) | |||||||||||||||||||||||||||
| Balance as of December 31, 2023 | 49 | 22 | 12 | — | 83 | |||||||||||||||||||||||||||
| Allowance for credit losses as of December 31, 2023 | $ | 388 | $ | 194 | $ | 245 | $ | 29 | $ | 856 | ||||||||||||||||||||||
| Allowance for loan and lease losses: | ||||||||||||||||||||||||||||||||
| Balance as of January 1, 2022 | $ | 334 | $ | 154 | $ | 163 | $ | 19 | $ | 670 | ||||||||||||||||||||||
| Charge-offs | (62) | (1) | (5) | (25) | (93) | |||||||||||||||||||||||||||
| Recoveries | 9 | 1 | 19 | 5 | 34 | |||||||||||||||||||||||||||
| Provision for loan and lease losses | 27 | (8) | 23 | 32 | 74 | |||||||||||||||||||||||||||
| Balance as of December 31, 2022 | 308 | 146 | 200 | 31 | 685 | |||||||||||||||||||||||||||
| Reserve for remaining unfunded commitments: | ||||||||||||||||||||||||||||||||
| Balance as of January 1, 2022 | 46 | 12 | 8 | — | 66 | |||||||||||||||||||||||||||
| Provision for unfunded lending commitments | 9 | 10 | 2 | — | 21 | |||||||||||||||||||||||||||
| Balance as of December 31, 2022 | 55 | 22 | 10 | — | 87 | |||||||||||||||||||||||||||
| Allowance for credit losses as of December 31, 2022 | $ | 363 | $ | 168 | $ | 210 | $ | 31 | $ | 772 | ||||||||||||||||||||||
| Allowance for loan and lease losses | ||||||||||||||||||||||||||||||||
| Balance as of January 1, 2021 | $ | 453 | $ | 242 | $ | 242 | $ | 26 | $ | 963 | ||||||||||||||||||||||
| Charge-offs | (34) | (5) | (5) | (15) | (59) | |||||||||||||||||||||||||||
| Recoveries | 21 | 5 | 27 | 4 | 57 | |||||||||||||||||||||||||||
| Provision for loan and lease losses | (106) | (88) | (101) | 4 | (291) | |||||||||||||||||||||||||||
| Balance as of December 31, 2021 | 334 | 154 | 163 | 19 | 670 | |||||||||||||||||||||||||||
| Reserve for remaining unfunded commitments: | ||||||||||||||||||||||||||||||||
| Balance as of January 1, 2021 | 65 | 10 | 10 | — | 85 | |||||||||||||||||||||||||||
| Provision for unfunded lending commitments | (19) | 2 | (2) | — | (19) | |||||||||||||||||||||||||||
| Balance as of December 31, 2021 | 46 | 12 | 8 | — | 66 | |||||||||||||||||||||||||||
| Allowance for credit losses as of December 31, 2021 | $ | 380 | $ | 166 | $ | 171 | $ | 19 | $ | 736 | ||||||||||||||||||||||
|
141 |
2023 FORM 10-K ANNUAL REPORT | ||||||
| ITEM 8. FINANCIAL STATEMENTS & SUPPLEMENTARY DATA | ||||||||
| NOTE 4—ALLOWANCE FOR CREDIT LOSSES | ||||||||
| GROSS CHARGE-OFFS | ||||||||||||||||||||||||||||||||||||||||||||||||||
| (Dollars in millions) | 2023 | 2022 | 2021 | 2020 | 2019 | Prior to 2019 | Revolving Loans | Total | ||||||||||||||||||||||||||||||||||||||||||
| C&I | $ | 1 | $ | 17 | $ | 82 | $ | 5 | $ | 10 | $ | 34 | $ | 7 | $ | 156 | ||||||||||||||||||||||||||||||||||
| CRE | — | — | — | — | 2 | 15 | — | 17 | ||||||||||||||||||||||||||||||||||||||||||
| Consumer real estate | — | 1 | — | — | — | 3 | — | 4 | ||||||||||||||||||||||||||||||||||||||||||
| Credit card and other | 12 | 1 | — | — | — | 2 | 7 | 22 | ||||||||||||||||||||||||||||||||||||||||||
| Total | $ | 13 | $ | 19 | $ | 82 | $ | 5 | $ | 12 | $ | 54 | $ | 14 | $ | 199 | ||||||||||||||||||||||||||||||||||
|
142 |
2023 FORM 10-K ANNUAL REPORT | ||||||
| ITEM 8. FINANCIAL STATEMENTS & SUPPLEMENTARY DATA | ||||||||
| NOTE 5—PREMISES, EQUIPMENT, & LEASES | ||||||||
| (Dollars in millions) | December 31, 2023 | December 31, 2022 | ||||||||||||
| Land | $ | 163 | $ | 163 | ||||||||||
| Buildings | 554 | 544 | ||||||||||||
| Leasehold improvements | 84 | 82 | ||||||||||||
| Furniture, fixtures, and equipment | 295 | 277 | ||||||||||||
| Fixed assets held for sale (a) | — | 1 | ||||||||||||
| Total premises and equipment | 1,096 | 1,067 | ||||||||||||
| Less accumulated depreciation and amortization | (506) | (455) | ||||||||||||
| Premises and equipment, net | $ | 590 | $ | 612 | ||||||||||
| (Dollars in millions) | December 31, 2023 | December 31, 2022 | ||||||||||||
| Lease right-of-use assets: | Classification | |||||||||||||
| Operating lease right-of-use assets | Other assets | $ | 306 | $ | 331 | |||||||||
| Finance lease right-of-use assets | Other assets | 3 | 3 | |||||||||||
| Total lease right-of-use assets | $ | 309 | $ | 334 | ||||||||||
| Lease liabilities: | ||||||||||||||
| Operating lease liabilities | Other liabilities | $ | 342 | $ | 367 | |||||||||
| Finance lease liabilities | Other liabilities | 3 | 4 | |||||||||||
| Total lease liabilities | $ | 345 | $ | 371 | ||||||||||
| December 31, 2023 | December 31, 2022 | ||||||||||
| Weighted Average Remaining Lease Terms | |||||||||||
| Operating leases | 11.79 years | 12.22 years | |||||||||
| Finance leases | 9.15 years | 9.83 years | |||||||||
| Weighted Average Discount Rate | |||||||||||
| Operating leases | 2.84 | % | 2.69 | % | |||||||
| Finance leases | 2.39 | % | 2.62 | % | |||||||
|
143 |
2023 FORM 10-K ANNUAL REPORT | ||||||
| ITEM 8. FINANCIAL STATEMENTS & SUPPLEMENTARY DATA | ||||||||
| NOTE 5—PREMISES, EQUIPMENT, & LEASES | ||||||||
| (Dollars in millions) | 2023 | 2022 | 2021 | ||||||||||||||
| Lease cost | |||||||||||||||||
| Operating lease cost | $ | 45 | $ | 47 | $ | 48 | |||||||||||
| Sublease income | (2) | (2) | (1) | ||||||||||||||
| Total lease cost | $ | 43 | $ | 45 | $ | 47 | |||||||||||
| Other information | |||||||||||||||||
| (Gain) loss on right-of-use asset impairment - operating leases | $ | 1 | $ | 1 | $ | 3 | |||||||||||
| Cash paid for amounts included in the measurement of lease liabilities: | |||||||||||||||||
| Operating cash flows from operating leases | 46 | 50 | 53 | ||||||||||||||
| Right-of-use assets obtained in exchange for new lease obligations: | |||||||||||||||||
| Operating leases | 11 | 31 | 19 | ||||||||||||||
| (Dollars in millions) | December 31, 2023 | ||||
| 2024 | $ | 44 | |||
| 2025 | 43 | ||||
| 2026 | 42 | ||||
| 2027 | 41 | ||||
| 2028 | 35 | ||||
| 2029 and thereafter | 204 | ||||
| Total lease payments | 409 | ||||
| Less lease liability interest | (64) | ||||
| Total lease liability | $ | 345 | |||
| (Dollars in millions) | December 31, 2023 | December 31, 2022 | |||||||||
| Lease receivable | $ | 1,143 | $ | 984 | |||||||
| Unearned income | (244) | (198) | |||||||||
| Guaranteed residual | 147 | 121 | |||||||||
| Unguaranteed residual | 189 | 153 | |||||||||
| Total net investment | $ | 1,235 | $ | 1,060 | |||||||
|
144 |
2023 FORM 10-K ANNUAL REPORT | ||||||
| ITEM 8. FINANCIAL STATEMENTS & SUPPLEMENTARY DATA | ||||||||
| NOTE 5—PREMISES, EQUIPMENT, & LEASES | ||||||||
| (Dollars in millions) | December 31, 2023 | ||||
| 2024 | $ | 214 | |||
| 2025 | 193 | ||||
| 2026 | 168 | ||||
| 2027 | 132 | ||||
| 2028 | 98 | ||||
| 2029 and thereafter | 338 | ||||
| Total future minimum lease payments | $ | 1,143 | |||
|
145 |
2023 FORM 10-K ANNUAL REPORT | ||||||
| ITEM 8. FINANCIAL STATEMENTS & SUPPLEMENTARY DATA | ||||||||
| NOTE 6—GOODWILL & OTHER INTANGIBLE ASSETS | ||||||||
| (Dollars in millions) | Regional Banking |
Specialty Banking |
Total | |||||||||||||||||
| December 31, 2020 | $ | 880 | $ | 631 | $ | 1,511 | ||||||||||||||
| Additions | — | — | — | |||||||||||||||||
| December 31, 2021 | $ | 880 | $ | 631 | $ | 1,511 | ||||||||||||||
| Additions | — | — | — | |||||||||||||||||
| December 31, 2022 | $ | 880 | $ | 631 | $ | 1,511 | ||||||||||||||
| Additions | — | — | — | |||||||||||||||||
| Divestitures (a) | — | (1) | (1) | |||||||||||||||||
| December 31, 2023 | $ | 880 | $ | 630 | $ | 1,510 | ||||||||||||||
| December 31, 2023 | December 31, 2022 | |||||||||||||||||||||||||||||||||||||
| (Dollars in millions) | Gross Carrying Amount |
Accumulated Amortization |
Net Carrying Value |
Gross Carrying Amount |
Accumulated Amortization |
Net Carrying Value |
||||||||||||||||||||||||||||||||
| Core deposit intangibles | $ | 368 | $ | (208) | $ | 160 | $ | 371 | $ | (171) | $ | 200 | ||||||||||||||||||||||||||
| Client relationships | 32 | (16) | 16 | 32 | (13) | 19 | ||||||||||||||||||||||||||||||||
| Other (a) | 27 | (17) | 10 | 27 | (12) | 15 | ||||||||||||||||||||||||||||||||
| Total | $ | 427 | $ | (241) | $ | 186 | $ | 430 | $ | (196) | $ | 234 | ||||||||||||||||||||||||||
| (Dollars in millions) | ||||||||
| 2024 | $ | 44 | ||||||
| 2025 | 38 | |||||||
| 2026 | 33 | |||||||
| 2027 | 29 | |||||||
| 2028 | 17 | |||||||
|
146 |
2023 FORM 10-K ANNUAL REPORT | ||||||
| ITEM 8. FINANCIAL STATEMENTS & SUPPLEMENTARY DATA | ||||||||
| NOTE 7—MORTGAGE BANKING ACTIVITY | ||||||||
| (Dollars in millions) | 2023 | 2022 | 2021 | |||||||||||||||||
| Balance at beginning of period | $ | 44 | $ | 250 | $ | 409 | ||||||||||||||
| Originations and purchases | 692 | 1,275 | 2,836 | |||||||||||||||||
| Sales, net of gains | (674) | (1,481) | (3,025) | |||||||||||||||||
| Mortgage loans transferred from (to) held for investment | — | — | 30 | |||||||||||||||||
| Balance at end of period | $ | 62 | $ | 44 | $ | 250 | ||||||||||||||
| December 31, 2023 | |||||||||||||||||
| (Dollars in millions) | Gross Carrying Amount |
Accumulated Amortization |
Net Carrying Amount | ||||||||||||||
| Mortgage servicing rights | $ | 25 | $ | (7) | $ | 18 | |||||||||||
| December 31, 2022 | |||||||||||||||||
| (Dollars in millions) | Gross Carrying Amount |
Accumulated Amortization |
Net Carrying Amount | ||||||||||||||
| Mortgage servicing rights | $ | 21 | $ | (5) | $ | 16 | |||||||||||
|
147 |
2023 FORM 10-K ANNUAL REPORT | ||||||
| ITEM 8. FINANCIAL STATEMENTS & SUPPLEMENTARY DATA | ||||||||
| NOTE 8—DEPOSITS | ||||||||
| (Dollars in millions) | 2023 | 2022 | ||||||||||||
| Savings | $ | 25,082 | $ | 21,971 | ||||||||||
| Time deposits | 6,804 | 2,887 | ||||||||||||
| Other interest-bearing deposits | 16,690 | 15,165 | ||||||||||||
| Total interest-bearing deposits | 48,576 | 40,023 | ||||||||||||
| Noninterest-bearing deposits | 17,204 | 23,466 | ||||||||||||
| Total deposits | $ | 65,780 | $ | 63,489 | ||||||||||
| (Dollars in millions) | ||||||||
| 2024 | $ | 6,528 | ||||||
| 2025 | 138 | |||||||
| 2026 | 56 | |||||||
| 2027 | 52 | |||||||
| 2028 | 23 | |||||||
| 2029 and after | 7 | |||||||
| Total | $ | 6,804 | ||||||
|
148 |
2023 FORM 10-K ANNUAL REPORT | ||||||
| ITEM 8. FINANCIAL STATEMENTS & SUPPLEMENTARY DATA | ||||||||
| NOTE 9—SHORT-TERM BORROWINGS | ||||||||
| (Dollars in millions) | Trading Liabilities | Federal Funds Purchased | Securities Sold Under Agreements to Repurchase | Other Short-term Borrowings | ||||||||||||||||||||||
| 2023 | ||||||||||||||||||||||||||
| Average balance | $ | 301 | $ | 349 | $ | 1,426 | $ | 2,688 | ||||||||||||||||||
| Year-end balance | 509 | 302 | 1,921 | 326 | ||||||||||||||||||||||
| Maximum month-end outstanding | 509 | 622 | 1,957 | 7,476 | ||||||||||||||||||||||
| Average rate for the year | 4.16 | % | 5.12 | % | 3.66 | % | 5.19 | % | ||||||||||||||||||
| Average rate at year-end | 4.48 | % | 5.40 | % | 3.98 | % | 5.36 | % | ||||||||||||||||||
| 2022 | ||||||||||||||||||||||||||
| Average balance | $ | 480 | $ | 699 | $ | 881 | $ | 229 | ||||||||||||||||||
| Year-end balance | 335 | 400 | 1,013 | 1,093 | ||||||||||||||||||||||
| Maximum month-end outstanding | 700 | 1,023 | 1,211 | 1,093 | ||||||||||||||||||||||
| Average rate for the year | 2.56 | % | 1.56 | % | 0.77 | % | 2.26 | % | ||||||||||||||||||
| Average rate at year-end | 3.67 | % | 4.40 | % | 2.19 | % | 4.30 | % | ||||||||||||||||||
| 2021 | ||||||||||||||||||||||||||
| Average balance | $ | 540 | $ | 949 | $ | 1,235 | $ | 124 | ||||||||||||||||||
| Year-end balance | 426 | 775 | 1,247 | 102 | ||||||||||||||||||||||
| Maximum month-end outstanding | 685 | 1,037 | 1,615 | 146 | ||||||||||||||||||||||
| Average rate for the year | 1.11 | % | 0.12 | % | 0.30 | % | 0.09 | % | ||||||||||||||||||
| Average rate at year-end | 1.62 | % | 0.10 | % | 0.11 | % | 0.08 | % | ||||||||||||||||||
|
149 |
2023 FORM 10-K ANNUAL REPORT | ||||||
| ITEM 8. FINANCIAL STATEMENTS & SUPPLEMENTARY DATA | ||||||||
| NOTE 10—TERM BORROWINGS | ||||||||
| (Dollars in millions) | 2023 | 2022 | ||||||||||||
| First Horizon Bank: | ||||||||||||||
| Subordinated notes (a) | ||||||||||||||
Maturity date – May 1, 2030 - 5.75% |
$ | 448 | $ | 448 | ||||||||||
| Other collateralized borrowings - Maturity date – December 22, 2037 | ||||||||||||||
5.95% on December 31, 2023 and 5.07% on December 31, 2022 (b) |
88 | 87 | ||||||||||||
| Other collateralized borrowings - SBA loans (c) | 3 | 3 | ||||||||||||
| First Horizon Corporation: | ||||||||||||||
| Senior notes | ||||||||||||||
Maturity date – May 26, 2023 - 3.55% |
— | 450 | ||||||||||||
Maturity date – May 26, 2025 - 4.00% |
349 | 349 | ||||||||||||
| Junior subordinated debentures (d) | ||||||||||||||
Maturity date - June 28, 2035 - 7.33% on December 31, 2023 and 6.45% on December 31, 2022 |
3 | 3 | ||||||||||||
Maturity date - December 15, 2035 - 7.02% on December 31, 2023 and 6.14% on December 31, 2022 |
18 | 18 | ||||||||||||
Maturity date - March 15, 2036 - 7.05% on December 31, 2023 and 6.17% on December 31, 2022 |
9 | 9 | ||||||||||||
Maturity date - March 15, 2036 - 7.19% on December 31, 2023 and 6.31% on December 31, 2022 |
12 | 12 | ||||||||||||
Maturity date - June 30, 2036 - 6.91% on December 31, 2023 and 6.05% on December 31, 2022 |
28 | 27 | ||||||||||||
Maturity date - July 7, 2036 - 7.21% on December 31, 2023 and 5.63% on December 31, 2022 |
19 | 18 | ||||||||||||
Maturity date - June 15, 2037 - 7.30% on December 31, 2023 and 6.42% on December 31, 2022 |
52 | 52 | ||||||||||||
Maturity date - September 6, 2037 - 7.05% on December 31, 2023 and 6.16% on December 31, 2022 |
9 | 9 | ||||||||||||
Notes payable - New market tax credit investments; 7 to 35 year term, 0.93% to 4.95% |
65 | 66 | ||||||||||||
| FT Real Estate Securities Company, Inc.: | ||||||||||||||
| Cumulative preferred stock (e) | ||||||||||||||
Maturity date – March 31, 2031 – 9.50% |
47 | 46 | ||||||||||||
| Total | $ | 1,150 | $ | 1,597 | ||||||||||
|
150 |
2023 FORM 10-K ANNUAL REPORT | ||||||
| ITEM 8. FINANCIAL STATEMENTS & SUPPLEMENTARY DATA | ||||||||
| NOTE 10—TERM BORROWINGS | ||||||||
| (Dollars in millions) | ||||||||
| 2024 | $ | 6 | ||||||
| 2025 | 350 | |||||||
| 2026 | — | |||||||
| 2027 | — | |||||||
| 2028 and after | 812 | |||||||
|
151 |
2023 FORM 10-K ANNUAL REPORT | ||||||
| ITEM 8. FINANCIAL STATEMENTS & SUPPLEMENTARY DATA | ||||||||
| NOTE 11—PREFERRED STOCK | ||||||||
| December 31, | |||||||||||||||||||||||||||||||||||||||||||||||
| (Dollars in millions) | 2023 | 2022 | |||||||||||||||||||||||||||||||||||||||||||||
| Issuance Date | Earliest Redemption Date (a) | Annual Dividend Rate | Dividend Payments | Shares Outstanding | Liquidation Amount | Carrying Amount | Carrying Amount | ||||||||||||||||||||||||||||||||||||||||
| Series B | 7/2/2020 | 8/1/2025 | 6.625 | % | (b) | Semi-annually | 8,000 | $ | 80 | $ | 77 | $ | 77 | ||||||||||||||||||||||||||||||||||
| Series C | 7/2/2020 | 5/1/2026 | 6.600 | % | (c) | Quarterly | 5,750 | 58 | 59 | 59 | |||||||||||||||||||||||||||||||||||||
| Series D | 7/2/2020 | 5/1/2024 | 6.100 | % | (d) | Semi-annually | 10,000 | 100 | 94 | 94 | |||||||||||||||||||||||||||||||||||||
| Series E | 5/28/2020 | 10/10/2025 | 6.500 | % | Quarterly | 1,500 | 150 | 145 | 145 | ||||||||||||||||||||||||||||||||||||||
| Series F | 5/3/2021 | 7/10/2026 | 4.700 | % | Quarterly | 1,500 | 150 | 145 | 145 | ||||||||||||||||||||||||||||||||||||||
| Series G | 2/28/2022 | 2/28/2027 | N/A | N/A | — | — | — | 494 | |||||||||||||||||||||||||||||||||||||||
| 26,750 | $ | 538 | $ | 520 | $ | 1,014 | |||||||||||||||||||||||||||||||||||||||||
|
152 |
2023 FORM 10-K ANNUAL REPORT | ||||||
| ITEM 8. FINANCIAL STATEMENTS & SUPPLEMENTARY DATA | ||||||||
| NOTE 11—PREFERRED STOCK | ||||||||
|
153 |
2023 FORM 10-K ANNUAL REPORT | ||||||
| ITEM 8. FINANCIAL STATEMENTS & SUPPLEMENTARY DATA | ||||||||
| NOTE 12—REGULATORY CAPITAL & RESTRICTIONS | ||||||||
| (Dollars in millions) | First Horizon Corporation | First Horizon Bank | ||||||||||||||||||||||||
| Amount | Ratio | Amount | Ratio | |||||||||||||||||||||||
| December 31, 2023 | ||||||||||||||||||||||||||
| Actual: | ||||||||||||||||||||||||||
| Total Capital | $ | 9,922 | 13.96% | $ | 9,303 | 13.17% | ||||||||||||||||||||
| Tier 1 Capital | 8,825 | 12.42 | 8,350 | 11.82 | ||||||||||||||||||||||
| Common Equity Tier 1 | 8,104 | 11.40 | 8,055 | 11.40 | ||||||||||||||||||||||
| Leverage | 8,825 | 10.69 | 8,350 | 10.20 | ||||||||||||||||||||||
| Minimum Requirement for Capital Adequacy Purposes: | ||||||||||||||||||||||||||
| Total Capital | 5,686 | 8.00 | 5,651 | 8.00 | ||||||||||||||||||||||
| Tier 1 Capital | 4,264 | 6.00 | 4,238 | 6.00 | ||||||||||||||||||||||
| Common Equity Tier 1 | 3,198 | 4.50 | 3,179 | 4.50 | ||||||||||||||||||||||
| Leverage | 3,302 | 4.00 | 3,276 | 4.00 | ||||||||||||||||||||||
| Minimum Requirement to be Well Capitalized Under Prompt Corrective Action Provisions: | ||||||||||||||||||||||||||
| Total Capital | 7,064 | 10.00 | ||||||||||||||||||||||||
| Tier 1 Capital | 5,651 | 8.00 | ||||||||||||||||||||||||
| Common Equity Tier 1 | 4,591 | 6.50 | ||||||||||||||||||||||||
| Leverage | 4,095 | 5.00 | ||||||||||||||||||||||||
| December 31, 2022 | ||||||||||||||||||||||||||
| Actual: | ||||||||||||||||||||||||||
| Total Capital | $ | 9,222 | 13.33% | $ | 8,532 | 12.41% | ||||||||||||||||||||
| Tier 1 Capital | 8,247 | 11.92 | 7,700 | 11.20 | ||||||||||||||||||||||
| Common Equity Tier 1 | 7,032 | 10.17 | 7,405 | 10.77 | ||||||||||||||||||||||
| Leverage | 8,247 | 10.36 | 7,700 | 9.76 | ||||||||||||||||||||||
|
154 |
2023 FORM 10-K ANNUAL REPORT | ||||||
| ITEM 8. FINANCIAL STATEMENTS & SUPPLEMENTARY DATA | ||||||||
| NOTE 12—REGULATORY CAPITAL & RESTRICTIONS | ||||||||
| Minimum Requirement for Capital Adequacy Purposes: | ||||||||||||||||||||||||||
| Total Capital | 5,533 | 8.00 | 5,498 | 8.00 | ||||||||||||||||||||||
| Tier 1 Capital | 4,150 | 6.00 | 4,124 | 6.00 | ||||||||||||||||||||||
| Common Equity Tier 1 | 3,112 | 4.50 | 3,093 | 4.50 | ||||||||||||||||||||||
| Leverage | 3,183 | 4.00 | 3,157 | 4.00 | ||||||||||||||||||||||
| Minimum Requirement to be Well Capitalized Under Prompt Corrective Action Provisions: | ||||||||||||||||||||||||||
| Total Capital | 6,873 | 10.00 | ||||||||||||||||||||||||
| Tier 1 Capital | 5,498 | 8.00 | ||||||||||||||||||||||||
| Common Equity Tier 1 | 4,467 | 6.50 | ||||||||||||||||||||||||
| Leverage | 3,946 | 5.00 | ||||||||||||||||||||||||
|
155 |
2023 FORM 10-K ANNUAL REPORT | ||||||
| ITEM 8. FINANCIAL STATEMENTS & SUPPLEMENTARY DATA | ||||||||
| NOTE 13—COMPONENTS OF OTHER COMPREHENSIVE INCOME (LOSS) | ||||||||
| (Dollars in millions) | Securities AFS | Cash Flow Hedges |
Pension and Post-retirement Plans |
Total | ||||||||||||||||||||||
| Balance as of December 31, 2020 | $ | 108 | $ | 12 | $ | (260) | $ | (140) | ||||||||||||||||||
| Net unrealized gains (losses) | (144) | (3) | (2) | (149) | ||||||||||||||||||||||
| Amounts reclassified from AOCI | — | (7) | 8 | 1 | ||||||||||||||||||||||
| Other comprehensive income (loss) | (144) | (10) | 6 | (148) | ||||||||||||||||||||||
| Balance as of December 31, 2021 | $ | (36) | $ | 2 | $ | (254) | $ | (288) | ||||||||||||||||||
| Net unrealized gains (losses) | (937) | (144) | (22) | (1,103) | ||||||||||||||||||||||
| Amounts reclassified from AOCI | — | 15 | 8 | 23 | ||||||||||||||||||||||
| Other comprehensive income (loss) | (937) | (129) | (14) | (1,080) | ||||||||||||||||||||||
| Balance as of December 31, 2022 | $ | (973) | $ | (127) | $ | (268) | $ | (1,368) | ||||||||||||||||||
| Net unrealized gains (losses) | 137 | (5) | (11) | 121 | ||||||||||||||||||||||
| Amounts reclassified from AOCI | — | 52 | 7 | 59 | ||||||||||||||||||||||
| Other comprehensive income (loss) | 137 | 47 | (4) | 180 | ||||||||||||||||||||||
| Balance as of December 31, 2023 | $ | (836) | $ | (80) | $ | (272) | $ | (1,188) | ||||||||||||||||||
| (Dollars in millions) | ||||||||||||||||||||||||||
| Details about AOCI | 2023 | 2022 | 2021 | Affected line item in the statement where net income is presented | ||||||||||||||||||||||
| Cash flow hedges: | ||||||||||||||||||||||||||
| Realized (gains) losses on cash flow hedges | $ | 69 | $ | 20 | $ | (9) | Interest and fees on loans and leases | |||||||||||||||||||
| Tax expense (benefit) | (17) | (5) | 2 | Income tax expense | ||||||||||||||||||||||
| $ | 52 | $ | 15 | $ | (7) | |||||||||||||||||||||
| Pension and Postretirement Plans: | ||||||||||||||||||||||||||
| Amortization of prior service cost and net actuarial (gain) loss | $ | 9 | $ | 10 | $ | 10 | Other expense | |||||||||||||||||||
| Tax expense (benefit) | (2) | (2) | (2) | Income tax expense | ||||||||||||||||||||||
| 7 | 8 | 8 | ||||||||||||||||||||||||
| Total reclassification from AOCI | $ | 59 | $ | 23 | $ | 1 | ||||||||||||||||||||
|
156 |
2023 FORM 10-K ANNUAL REPORT | ||||||
| ITEM 8. FINANCIAL STATEMENTS & SUPPLEMENTARY DATA | ||||||||
| NOTE 14—INCOME TAXES | ||||||||
| (Dollars in millions) | 2023 | 2022 | 2021 | |||||||||||||||||
| Consolidated Statements of Income: | ||||||||||||||||||||
| Income tax expense | $ | 212 | $ | 247 | $ | 274 | ||||||||||||||
| Consolidated Statements of Changes in Equity: | ||||||||||||||||||||
| Income tax expense (benefit) related to: | ||||||||||||||||||||
| Net unrealized gains (losses) on pension and other postretirement plans | (1) | (5) | 2 | |||||||||||||||||
| Net unrealized gains (losses) on securities available for sale | 44 | (302) | (46) | |||||||||||||||||
| Net unrealized gains (losses) on cash flow hedges | 15 | (42) | (3) | |||||||||||||||||
| Total | $ | 270 | $ | (102) | $ | 227 | ||||||||||||||
| (Dollars in millions) | 2023 | 2022 | 2021 | |||||||||||||||||
| Current: | ||||||||||||||||||||
| Federal | $ | 140 | $ | 123 | $ | 235 | ||||||||||||||
| State | 28 | 33 | 39 | |||||||||||||||||
| Deferred: | ||||||||||||||||||||
| Federal | 37 | 87 | (1) | |||||||||||||||||
| State | 7 | 4 | 1 | |||||||||||||||||
| Total | $ | 212 | $ | 247 | $ | 274 | ||||||||||||||
|
157 |
2023 FORM 10-K ANNUAL REPORT | ||||||
| ITEM 8. FINANCIAL STATEMENTS & SUPPLEMENTARY DATA | ||||||||
| NOTE 14—INCOME TAXES | ||||||||
| (Dollars in millions) | 2023 | 2022 | 2021 | |||||||||||||||||
| Federal income tax rate | 21 | % | 21 | % | 21 | % | ||||||||||||||
| Tax computed at statutory rate | $ | 237 | $ | 243 | $ | 270 | ||||||||||||||
| Increase (decrease) resulting from: | ||||||||||||||||||||
| State income taxes, net of federal income tax benefit | 34 | 31 | 32 | |||||||||||||||||
| Bank-owned life insurance | (6) | (4) | (7) | |||||||||||||||||
| Tax-exempt interest | (12) | (10) | (10) | |||||||||||||||||
| FDIC premium | 11 | 7 | 5 | |||||||||||||||||
| Non-deductible expenses | 9 | 4 | 3 | |||||||||||||||||
| LIHTC credits and benefits, net of amortization | (15) | (16) | (14) | |||||||||||||||||
| Other tax credits | (5) | (4) | (4) | |||||||||||||||||
| Other changes in unrecognized tax benefits | (50) | (2) | 4 | |||||||||||||||||
| Termination of BOLI policies | 21 | — | — | |||||||||||||||||
| Other | (12) | (2) | (5) | |||||||||||||||||
| Total | $ | 212 | $ | 247 | $ | 274 | ||||||||||||||
| (Dollars in millions) | Expiration Dates | Net Deferred Tax Asset Balance |
||||||||||||
| Losses - federal | 2028 - 2035 | $ | 32 | |||||||||||
| Net operating losses - states | 2024 - 2033 | 2 | ||||||||||||
| Net operating losses - states | 2034 - 2041 | 1 | ||||||||||||
|
158 |
2023 FORM 10-K ANNUAL REPORT | ||||||
| ITEM 8. FINANCIAL STATEMENTS & SUPPLEMENTARY DATA | ||||||||
| NOTE 14—INCOME TAXES | ||||||||
| (Dollars in millions) | 2023 | 2022 | ||||||||||||
| Deferred tax assets: | ||||||||||||||
| Loan valuations and loss reserves | $ | 107 | $ | 108 | ||||||||||
| Employee benefits | 128 | 93 | ||||||||||||
| Accrued expenses | 21 | 22 | ||||||||||||
| Depreciation and amortization | 37 | 24 | ||||||||||||
| Lease liability | 85 | 91 | ||||||||||||
| Federal loss carryforwards | 32 | 34 | ||||||||||||
| State loss carryforwards | 3 | 2 | ||||||||||||
| Securities available for sale and financial instruments (a) | 296 | 355 | ||||||||||||
| Other | 28 | 32 | ||||||||||||
| Gross deferred tax assets | 737 | 761 | ||||||||||||
| Deferred tax liabilities: | ||||||||||||||
| Equity investments | $ | 31 | $ | 3 | ||||||||||
| Other intangible assets | 75 | 80 | ||||||||||||
| Prepaid expenses | 20 | 17 | ||||||||||||
| ROU lease asset | 76 | 82 | ||||||||||||
| Leasing | 316 | 265 | ||||||||||||
| Other | 4 | 1 | ||||||||||||
| Gross deferred tax liabilities | 522 | 448 | ||||||||||||
| Net deferred tax assets | $ | 215 | $ | 313 | ||||||||||
|
159 |
2023 FORM 10-K ANNUAL REPORT | ||||||
| ITEM 8. FINANCIAL STATEMENTS & SUPPLEMENTARY DATA | ||||||||
| NOTE 14—INCOME TAXES | ||||||||
| (Dollars in millions) | ||||||||
| Balance at December 31, 2021 | $ | 92 | ||||||
| Increases related to prior year tax positions | 3 | |||||||
| Increases related to current year tax positions | 1 | |||||||
| Decreases related to prior year tax positions | (7) | |||||||
| Balance at December 31, 2022 | $ | 89 | ||||||
| Increases related to prior year tax positions | 1 | |||||||
| Increases related to current year tax positions | 2 | |||||||
| Settlements | (76) | |||||||
| Lapse of statutes | (1) | |||||||
| Balance at December 31, 2023 | $ | 15 | ||||||
|
160 |
2023 FORM 10-K ANNUAL REPORT | ||||||
| ITEM 8. FINANCIAL STATEMENTS & SUPPLEMENTARY DATA | ||||||||
| NOTE 15—EARNINGS PER SHARE | ||||||||
| (Dollars in millions, except per share data; shares in thousands) | 2023 | 2022 | 2021 | |||||||||||||||||
| Net income | $ | 916 | $ | 912 | $ | 1,010 | ||||||||||||||
| Net income attributable to noncontrolling interest | 19 | 12 | 11 | |||||||||||||||||
| Net income attributable to controlling interest | 897 | 900 | 999 | |||||||||||||||||
| Preferred stock dividends | 32 | 32 | 37 | |||||||||||||||||
| Net income available to common shareholders | 865 | 868 | 962 | |||||||||||||||||
| Weighted average common shares outstanding—basic | 548,410 | 535,033 | 546,354 | |||||||||||||||||
| Effect of dilutive restricted stock, performance equity awards and options | 3,802 | 7,830 | 4,887 | |||||||||||||||||
| Effect of dilutive convertible preferred stock (a) | 9,520 | 23,141 | — | |||||||||||||||||
| Weighted average common shares outstanding—diluted | 561,732 | 566,004 | 551,241 | |||||||||||||||||
| Basic earnings per common share | $ | 1.58 | $ | 1.62 | $ | 1.76 | ||||||||||||||
| Diluted earnings per common share | $ | 1.54 | $ | 1.53 | $ | 1.74 | ||||||||||||||
(a) On February 28, 2022, FHN issued $494 million of Series G Convertible Preferred Stock, which was converted into common stock on June 26, 2023, following the termination of the TD Merger Agreement. Conversion occurred at the rate of 4,000 common shares per Series G preferred share resulting in 19,742,776 additional common shares outstanding. 2023 includes the impact of the Series G based on the final conversion rate and 2022 includes the impact based on the original maximum conversion rate. For more information on the convertible features, including the conversion rate, see Note 11 - Preferred Stock. | ||||||||||||||||||||
| (Shares in thousands) | 2023 | 2022 | 2021 | |||||||||||||||||
| Stock options excluded from the calculation of diluted EPS | — | 29 | 1,366 | |||||||||||||||||
| Weighted average exercise price of stock options excluded from the calculation of diluted EPS | $ | 24.36 | $ | 25.64 | $ | 20.44 | ||||||||||||||
| Other equity awards excluded from the calculation of diluted EPS | 2,242 | 144 | 1,531 | |||||||||||||||||
|
161 |
2023 FORM 10-K ANNUAL REPORT | ||||||
| ITEM 8. FINANCIAL STATEMENTS & SUPPLEMENTARY DATA | ||||||||
| NOTE 16—CONTINGENCIES & OTHER DISCLOSURES | ||||||||
|
162 |
2023 FORM 10-K ANNUAL REPORT | ||||||
| ITEM 8. FINANCIAL STATEMENTS & SUPPLEMENTARY DATA | ||||||||
| NOTE 16—CONTINGENCIES & OTHER DISCLOSURES | ||||||||
|
163 |
2023 FORM 10-K ANNUAL REPORT | ||||||
| ITEM 8. FINANCIAL STATEMENTS & SUPPLEMENTARY DATA | ||||||||
| NOTE 17—RETIREMENT PLANS & OTHER EMPLOYEE BENEFITS | ||||||||
|
164 |
2023 FORM 10-K ANNUAL REPORT | ||||||
| ITEM 8. FINANCIAL STATEMENTS & SUPPLEMENTARY DATA | ||||||||
| NOTE 17—RETIREMENT PLANS & OTHER EMPLOYEE BENEFITS | ||||||||
| Benefit Obligations | Net Periodic Benefit Cost | |||||||||||||||||||||||||||||||||||||
| 2023 | 2022 | 2021 | 2023 | 2022 | 2021 | |||||||||||||||||||||||||||||||||
| Discount rate | ||||||||||||||||||||||||||||||||||||||
| Qualified pension | 5.00% | 5.20% | 2.95% | 5.20% | 2.96% | 2.64% | ||||||||||||||||||||||||||||||||
| Nonqualified pension | 4.90% | 5.10% | 2.65% | 5.10% | 2.65% | 2.24% | ||||||||||||||||||||||||||||||||
| Other nonqualified pension | 4.75% | 4.94% | 1.99% | 4.94% | 1.99% | 1.41% | ||||||||||||||||||||||||||||||||
| Postretirement benefits | 4.84% - 5.06% |
5.04% - 5.25% |
2.43% - 3.07% |
4.88% - 5.25% |
2.42% - 5.08% |
1.93% - 2.81% |
||||||||||||||||||||||||||||||||
| Expected long-term rate of return | ||||||||||||||||||||||||||||||||||||||
| Qualified pension/ postretirement benefits |
N/A | N/A | N/A | 5.15% | 2.85% | 2.30% | ||||||||||||||||||||||||||||||||
| Postretirement benefit (retirees post January 1, 1993) | N/A | N/A | N/A | 5.50% | 5.95% | 5.80% | ||||||||||||||||||||||||||||||||
| Postretirement benefit (retirees prior to January 1, 1993) | N/A | N/A | N/A | N/A | 1.05% | 1.00% | ||||||||||||||||||||||||||||||||
| (Dollars in millions) | 2023 | 2022 | 2021 | |||||||||||||||||
| Projected benefit obligation | $ | 8 | $ | 10 | $ | 12 | ||||||||||||||
| Interest crediting rate | 12.04 | % | 10.77 | % | 9.07 | % | ||||||||||||||
| (Dollars in millions) | Pension Benefits | Other Benefits | ||||||||||||||||||||||||||||||||||||
| 2023 | 2022 | 2021 | 2023 | 2022 | 2021 | |||||||||||||||||||||||||||||||||
| Components of net periodic benefit cost | ||||||||||||||||||||||||||||||||||||||
| Interest cost | $ | 33 | $ | 20 | $ | 17 | $ | 2 | $ | 1 | $ | 1 | ||||||||||||||||||||||||||
| Expected return on plan assets | (32) | (24) | (20) | (1) | (2) | (1) | ||||||||||||||||||||||||||||||||
| Amortization of unrecognized: | ||||||||||||||||||||||||||||||||||||||
| Actuarial (gain) loss | 13 | 12 | 10 | (1) | — | — | ||||||||||||||||||||||||||||||||
| Net periodic benefit cost | $ | 14 | $ | 8 | $ | 7 | $ | — | $ | (1) | $ | — | ||||||||||||||||||||||||||
|
165 |
2023 FORM 10-K ANNUAL REPORT | ||||||
| ITEM 8. FINANCIAL STATEMENTS & SUPPLEMENTARY DATA | ||||||||
| NOTE 17—RETIREMENT PLANS & OTHER EMPLOYEE BENEFITS | ||||||||
| (Dollars in millions) | Pension Benefits | Other Benefits | ||||||||||||||||||||||||
| 2023 | 2022 | 2023 | 2022 | |||||||||||||||||||||||
| Change in benefit obligation | ||||||||||||||||||||||||||
| Benefit obligation, beginning of year | $ | 663 | $ | 845 | $ | 32 | $ | 41 | ||||||||||||||||||
| Interest cost | 33 | 20 | 2 | 1 | ||||||||||||||||||||||
| Actuarial (gain) loss (a) | 20 | (163) | — | (9) | ||||||||||||||||||||||
| Actual benefits paid | (41) | (39) | (3) | (1) | ||||||||||||||||||||||
| Benefit obligation, end of year | $ | 675 | $ | 663 | $ | 31 | $ | 32 | ||||||||||||||||||
| Change in plan assets | ||||||||||||||||||||||||||
| Fair value of plan assets, beginning of year | $ | 641 | $ | 849 | $ | 21 | $ | 26 | ||||||||||||||||||
| Actual return on plan assets | 35 | (172) | 2 | (4) | ||||||||||||||||||||||
| Employer contributions | 3 | 3 | 3 | 1 | ||||||||||||||||||||||
| Actual benefits paid – settlement payments | (2) | (2) | (3) | (2) | ||||||||||||||||||||||
| Actual benefits paid – other payments | (1) | (1) | — | — | ||||||||||||||||||||||
| Premium paid for annuity purchase (b) | (38) | (36) | — | — | ||||||||||||||||||||||
| Fair value of plan assets, end of year | $ | 638 | $ | 641 | $ | 23 | $ | 21 | ||||||||||||||||||
| Funded (unfunded) status of the plans | $ | (37) | $ | (22) | $ | (8) | $ | (11) | ||||||||||||||||||
| Amounts recognized in the Balance Sheets | ||||||||||||||||||||||||||
| Other assets | $ | — | $ | 4 | $ | 21 | $ | 19 | ||||||||||||||||||
| Other liabilities | (37) | (26) | (29) | (30) | ||||||||||||||||||||||
| Net asset (liability) at end of year | $ | (37) | $ | (22) | $ | (8) | $ | (11) | ||||||||||||||||||
| Pension Benefits | Other Benefits | |||||||||||||||||||||||||
| (Dollars in millions) | 2023 | 2022 | 2023 | 2022 | ||||||||||||||||||||||
| Projected benefit obligation | $ | 24 | $ | 26 | $ | 29 | $ | 30 | ||||||||||||||||||
|
166 |
2023 FORM 10-K ANNUAL REPORT | ||||||
| ITEM 8. FINANCIAL STATEMENTS & SUPPLEMENTARY DATA | ||||||||
| NOTE 17—RETIREMENT PLANS & OTHER EMPLOYEE BENEFITS | ||||||||
| (Dollars in millions) | Pension Benefits | Other Benefits | ||||||||||||||||||||||||
| 2023 | 2022 | 2023 | 2022 | |||||||||||||||||||||||
| Amounts recognized in accumulated other comprehensive income | ||||||||||||||||||||||||||
| Net actuarial (gain) loss | $ | 367 | $ | 363 | $ | (8) | $ | (8) | ||||||||||||||||||
| (Dollars in millions) | Pension Benefits | Other Benefits | ||||||||||||||||||||||||||||||||||||
| 2023 | 2022 | 2021 | 2023 | 2022 | 2021 | |||||||||||||||||||||||||||||||||
| Changes in plan assets and benefit obligation recognized in other comprehensive income | ||||||||||||||||||||||||||||||||||||||
| Net actuarial (gain) loss arising during measurement period | $ | 17 | $ | 32 | $ | 13 | $ | — | $ | (3) | $ | (7) | ||||||||||||||||||||||||||
| Items amortized during the measurement period: | ||||||||||||||||||||||||||||||||||||||
| Net actuarial gain (loss) | (13) | (11) | (10) | 1 | — | — | ||||||||||||||||||||||||||||||||
| Total recognized in other comprehensive income | $ | 4 | $ | 21 | $ | 3 | $ | 1 | $ | (3) | $ | (7) | ||||||||||||||||||||||||||
| (Dollars in millions) | Pension Benefits |
Other Benefits |
||||||||||||
| 2024 | $ | 44 | $ | 2 | ||||||||||
| 2025 | 46 | 2 | ||||||||||||
| 2026 | 47 | 2 | ||||||||||||
| 2027 | 48 | 2 | ||||||||||||
| 2028 | 48 | 2 | ||||||||||||
| 2029-2033 | 239 | 11 | ||||||||||||
|
167 |
2023 FORM 10-K ANNUAL REPORT | ||||||
| ITEM 8. FINANCIAL STATEMENTS & SUPPLEMENTARY DATA | ||||||||
| NOTE 17—RETIREMENT PLANS & OTHER EMPLOYEE BENEFITS | ||||||||
| (Dollars in millions) | December 31, 2023 | |||||||||||||||||||||||||
| Level 1 | Level 2 | Level 3 | Total | |||||||||||||||||||||||
| Cash equivalents and money market funds | $ | 6 | $ | — | $ | — | $ | 6 | ||||||||||||||||||
| Fixed income securities: | ||||||||||||||||||||||||||
| U.S. treasuries | — | 9 | — | 9 | ||||||||||||||||||||||
| Corporate, municipal and foreign bonds | — | 317 | — | 317 | ||||||||||||||||||||||
| Common and collective funds: | ||||||||||||||||||||||||||
| Fixed income | — | 306 | — | 306 | ||||||||||||||||||||||
| Total | $ | 6 | $ | 632 | $ | — | $ | 638 | ||||||||||||||||||
| (Dollars in millions) | December 31, 2022 | |||||||||||||||||||||||||
| Level 1 | Level 2 | Level 3 | Total | |||||||||||||||||||||||
| Cash equivalents and money market funds | $ | 20 | $ | — | $ | — | $ | 20 | ||||||||||||||||||
| Fixed income securities: | ||||||||||||||||||||||||||
| U.S. treasuries | — | 15 | — | 15 | ||||||||||||||||||||||
| Corporate, municipal and foreign bonds | — | 300 | — | 300 | ||||||||||||||||||||||
| Common and collective funds: | ||||||||||||||||||||||||||
| Fixed income | — | 306 | — | 306 | ||||||||||||||||||||||
| Total | $ | 20 | $ | 621 | $ | — | $ | 641 | ||||||||||||||||||
| (Dollars in millions) | December 31, 2023 | |||||||||||||||||||||||||
| Level 1 | Level 2 | Level 3 | Total | |||||||||||||||||||||||
| Mutual funds: | ||||||||||||||||||||||||||
| Equity mutual funds | $ | 7 | $ | — | $ | — | $ | 7 | ||||||||||||||||||
| Fixed income mutual funds | 16 | — | — | 16 | ||||||||||||||||||||||
| Total | $ | 23 | $ | — | $ | — | $ | 23 | ||||||||||||||||||
| (Dollars in millions) | December 31, 2022 | |||||||||||||||||||||||||
| Level 1 | Level 2 | Level 3 | Total | |||||||||||||||||||||||
| Mutual funds: | ||||||||||||||||||||||||||
| Equity mutual funds | $ | 6 | $ | — | $ | — | $ | 6 | ||||||||||||||||||
| Fixed income mutual funds | 15 | — | — | 15 | ||||||||||||||||||||||
| Total | $ | 21 | $ | — | $ | — | $ | 21 | ||||||||||||||||||
|
168 |
2023 FORM 10-K ANNUAL REPORT | ||||||
| ITEM 8. FINANCIAL STATEMENTS & SUPPLEMENTARY DATA | ||||||||
| NOTE 18—STOCK OPTIONS, RESTRICTED STOCK, & DIVIDEND REINVESTMENT PLANS | ||||||||
|
169 |
2023 FORM 10-K ANNUAL REPORT | ||||||
| ITEM 8. FINANCIAL STATEMENTS & SUPPLEMENTARY DATA | ||||||||
| NOTE 18—STOCK OPTIONS, RESTRICTED STOCK, & DIVIDEND REINVESTMENT PLANS | ||||||||
| Shares/ Units (a) |
Weighted average grant date fair value (per share) (b) |
|||||||||||||
| January 1, 2023 | 13,033,646 | $ | 17.09 | |||||||||||
| Shares/units granted | 4,558,402 | 16.08 | ||||||||||||
| Shares/units vested/distributed | (2,880,586) | 11.41 | ||||||||||||
| Shares/units canceled (c) | (3,393,758) | 22.43 | ||||||||||||
| December 31, 2023 | 11,317,704 | $ | 15.89 | |||||||||||
| Options Outstanding |
Weighted Average Exercise Price (per share) |
Weighted Average Remaining Contractual Term (years) |
Aggregate Intrinsic Value (millions) |
|||||||||||||||||||||||
| January 1, 2023 | 2,437,446 | $ | 15.72 | |||||||||||||||||||||||
| Options granted | — | — | ||||||||||||||||||||||||
| Options exercised | (393,560) | 13.49 | ||||||||||||||||||||||||
| Options expired/canceled | (144,918) | 14.05 | ||||||||||||||||||||||||
| December 31, 2023 | 1,898,968 | $ | 16.31 | 2.87 | $ | — | ||||||||||||||||||||
| Options exercisable | 1,617,760 | 16.44 | 2.62 | — | ||||||||||||||||||||||
| Options expected to vest | 281,208 | 15.53 | 4.33 | — | ||||||||||||||||||||||
|
170 |
2023 FORM 10-K ANNUAL REPORT | ||||||
| ITEM 8. FINANCIAL STATEMENTS & SUPPLEMENTARY DATA | ||||||||
| NOTE 18—STOCK OPTIONS, RESTRICTED STOCK, & DIVIDEND REINVESTMENT PLANS | ||||||||
| 2021 | ||||||||
| Expected dividend yield | 4.16% | |||||||
| Expected weighted-average lives of options granted | 6.29 years | |||||||
| Expected weighted-average volatility | 38.44% | |||||||
| Expected volatility range | 37.86% - 39.02% |
|||||||
| Risk-free interest rate | 0.62% | |||||||
|
171 |
2023 FORM 10-K ANNUAL REPORT | ||||||
| ITEM 8. FINANCIAL STATEMENTS & SUPPLEMENTARY DATA | ||||||||
| NOTE 19—BUSINESS SEGMENT INFORMATION | ||||||||
| 2023 | ||||||||||||||||||||||||||
| (Dollars in millions) | Regional Banking | Specialty Banking | Corporate | Consolidated | ||||||||||||||||||||||
| Net interest income (expense) | $ | 2,354 | $ | 518 | $ | (332) | $ | 2,540 | ||||||||||||||||||
| Provision for credit losses | 224 | 50 | (14) | 260 | ||||||||||||||||||||||
| Noninterest income (a) | 433 | 209 | 285 | 927 | ||||||||||||||||||||||
| Noninterest expense (b)(c)(e) | 1,301 | 364 | 414 | 2,079 | ||||||||||||||||||||||
| Income (loss) before income taxes | 1,262 | 313 | (447) | 1,128 | ||||||||||||||||||||||
| Income tax expense (benefit) (f) | 296 | 76 | (160) | 212 | ||||||||||||||||||||||
| Net income (loss) | $ | 966 | $ | 237 | $ | (287) | $ | 916 | ||||||||||||||||||
| Average assets | $ | 45,858 | $ | 20,161 | $ | 15,664 | $ | 81,683 | ||||||||||||||||||
| Depreciation and amortization | 60 | — | 42 | 102 | ||||||||||||||||||||||
| Expenditures for long-lived assets | 29 | 4 | 1 | 34 | ||||||||||||||||||||||
|
172 |
2023 FORM 10-K ANNUAL REPORT | ||||||
| ITEM 8. FINANCIAL STATEMENTS & SUPPLEMENTARY DATA | ||||||||
| NOTE 19—BUSINESS SEGMENT INFORMATION | ||||||||
| 2022 | ||||||||||||||||||||||||||
| (Dollars in millions) | Regional Banking | Specialty Banking | Corporate | Consolidated | ||||||||||||||||||||||
| Net interest income (expense) | $ | 1,954 | $ | 557 | $ | (119) | $ | 2,392 | ||||||||||||||||||
| Provision for credit losses | 94 | 14 | (13) | 95 | ||||||||||||||||||||||
| Noninterest income (a) | 443 | 312 | 60 | 815 | ||||||||||||||||||||||
| Noninterest expense (b)(e) | 1,226 | 446 | 281 | 1,953 | ||||||||||||||||||||||
| Income (loss) before income taxes | 1,077 | 409 | (327) | 1,159 | ||||||||||||||||||||||
| Income tax expense (benefit) | 253 | 99 | (105) | 247 | ||||||||||||||||||||||
| Net income (loss) | $ | 824 | $ | 310 | $ | (222) | $ | 912 | ||||||||||||||||||
| Average assets | $ | 42,297 | $ | 19,965 | $ | 21,955 | $ | 84,217 | ||||||||||||||||||
| Depreciation and amortization | 24 | 2 | 59 | 85 | ||||||||||||||||||||||
| Expenditures for long-lived assets | 18 | 12 | (6) | 24 | ||||||||||||||||||||||
| 2021 | ||||||||||||||||||||||||||
| (Dollars in millions) | Regional Banking | Specialty Banking | Corporate | Consolidated | ||||||||||||||||||||||
| Net interest income (expense) | $ | 1,764 | $ | 620 | $ | (390) | $ | 1,994 | ||||||||||||||||||
| Provision (benefit) for credit losses | (229) | (64) | (17) | (310) | ||||||||||||||||||||||
| Noninterest income (a) | 438 | 597 | 41 | 1,076 | ||||||||||||||||||||||
| Noninterest expense (b)(d)(e) | 1,136 | 573 | 387 | 2,096 | ||||||||||||||||||||||
| Income (loss) before income taxes | 1,295 | 708 | (719) | 1,284 | ||||||||||||||||||||||
| Income tax expense (benefit) | 303 | 172 | (201) | 274 | ||||||||||||||||||||||
| Net income (loss) | $ | 992 | $ | 536 | $ | (518) | $ | 1,010 | ||||||||||||||||||
| Average assets | $ | 41,527 | $ | 20,789 | $ | 25,293 | $ | 87,609 | ||||||||||||||||||
| Depreciation and amortization | (57) | 4 | 98 | 45 | ||||||||||||||||||||||
| Expenditures for long-lived assets | 27 | 3 | 7 | 37 | ||||||||||||||||||||||
|
173 |
2023 FORM 10-K ANNUAL REPORT | ||||||
| ITEM 8. FINANCIAL STATEMENTS & SUPPLEMENTARY DATA | ||||||||
| NOTE 19—BUSINESS SEGMENT INFORMATION | ||||||||
| December 31, 2023 | ||||||||||||||||||||||||||
| (Dollars in millions) | Regional Banking | Specialty Banking | Corporate | Consolidated | ||||||||||||||||||||||
| Noninterest income: | ||||||||||||||||||||||||||
| Deposit transactions and cash management | $ | 161 | $ | 10 | $ | 8 | $ | 179 | ||||||||||||||||||
| Fixed income (a) | — | 133 | — | 133 | ||||||||||||||||||||||
| Brokerage, management fees and commissions | 90 | — | — | 90 | ||||||||||||||||||||||
| Card and digital banking fees | 68 | 2 | 7 | 77 | ||||||||||||||||||||||
| Other service charges and fees | 30 | 24 | — | 54 | ||||||||||||||||||||||
| Trust services and investment management | 47 | — | — | 47 | ||||||||||||||||||||||
| Mortgage banking and title income | — | 23 | — | 23 | ||||||||||||||||||||||
| Gain on merger termination | — | — | 225 | 225 | ||||||||||||||||||||||
| Securities gains (losses), net (b) | — | — | (4) | (4) | ||||||||||||||||||||||
| Other income (c) | 37 | 17 | 49 | 103 | ||||||||||||||||||||||
| Total noninterest income | $ | 433 | $ | 209 | $ | 285 | $ | 927 | ||||||||||||||||||
| December 31, 2022 | ||||||||||||||||||||||||||
| (Dollars in millions) | Regional Banking | Specialty Banking | Corporate | Consolidated | ||||||||||||||||||||||
| Noninterest income: | ||||||||||||||||||||||||||
| Deposit transactions and cash management | $ | 153 | $ | 9 | $ | 9 | $ | 171 | ||||||||||||||||||
| Fixed income (a) | — | 205 | — | 205 | ||||||||||||||||||||||
| Brokerage, management fees and commissions | 92 | — | — | 92 | ||||||||||||||||||||||
| Card and digital banking fees | 75 | 2 | 7 | 84 | ||||||||||||||||||||||
| Other service charges and fees | 32 | 22 | — | 54 | ||||||||||||||||||||||
| Trust services and investment management | 48 | — | — | 48 | ||||||||||||||||||||||
| Mortgage banking and title income | — | 68 | — | 68 | ||||||||||||||||||||||
| Securities gains (losses), net (b) | — | — | 18 | 18 | ||||||||||||||||||||||
| Other income (c) | 43 | 6 | 26 | 75 | ||||||||||||||||||||||
| Total noninterest income | $ | 443 | $ | 312 | $ | 60 | $ | 815 | ||||||||||||||||||
| December 31, 2021 | ||||||||||||||||||||||||||
| (Dollars in millions) | Regional Banking | Specialty Banking | Corporate | Consolidated | ||||||||||||||||||||||
| Noninterest income: | ||||||||||||||||||||||||||
| Deposit transactions and cash management | $ | 157 | $ | 12 | $ | 6 | $ | 175 | ||||||||||||||||||
| Fixed income (a) | — | 406 | — | 406 | ||||||||||||||||||||||
| Brokerage, management fees and commissions | 88 | — | — | 88 | ||||||||||||||||||||||
| Card and digital banking fees | 67 | 3 | 8 | 78 | ||||||||||||||||||||||
| Other service charges and fees | 23 | 17 | 4 | 44 | ||||||||||||||||||||||
| Trust services and investment management | 51 | — | — | 51 | ||||||||||||||||||||||
| Mortgage banking and title income | — | 152 | 2 | 154 | ||||||||||||||||||||||
| Securities gains (losses), net (b) | — | — | 13 | 13 | ||||||||||||||||||||||
| Other income (c) | 52 | 7 | 8 | 67 | ||||||||||||||||||||||
| Total noninterest income | $ | 438 | $ | 597 | $ | 41 | $ | 1,076 | ||||||||||||||||||
|
174 |
2023 FORM 10-K ANNUAL REPORT | ||||||
| ITEM 8. FINANCIAL STATEMENTS & SUPPLEMENTARY DATA | ||||||||
| NOTE 20—VARIABLE INTEREST ENTITIES | ||||||||
| (Dollars in millions) | December 31, 2023 | December 31, 2022 | ||||||||||||
| Assets: | ||||||||||||||
| Other assets | $ | 177 | $ | 181 | ||||||||||
| Liabilities: | ||||||||||||||
| Other liabilities | $ | 150 | $ | 150 | ||||||||||
| (Dollars in millions) | 2023 | 2022 | 2021 | |||||||||||||||||
| Income tax expense (benefit): | ||||||||||||||||||||
| Amortization of qualifying LIHTC investments | $ | 54 | $ | 44 | $ | 26 | ||||||||||||||
| Low income housing tax credits | (55) | (48) | (32) | |||||||||||||||||
| Other tax benefits related to qualifying LIHTC investments | (13) | (12) | (7) | |||||||||||||||||
|
175 |
2023 FORM 10-K ANNUAL REPORT | ||||||
| ITEM 8. FINANCIAL STATEMENTS & SUPPLEMENTARY DATA | ||||||||
| NOTE 20—VARIABLE INTEREST ENTITIES | ||||||||
|
176 |
2023 FORM 10-K ANNUAL REPORT | ||||||
| ITEM 8. FINANCIAL STATEMENTS & SUPPLEMENTARY DATA | ||||||||
| NOTE 20—VARIABLE INTEREST ENTITIES | ||||||||
| (Dollars in millions) | Maximum Loss Exposure |
Liability Recognized |
Classification | |||||||||||||||||
| Type: | ||||||||||||||||||||
| Low income housing partnerships | $ | 587 | $ | 223 | (a) | |||||||||||||||
| Other tax credit investments (b) | 79 | 64 | Other assets | |||||||||||||||||
| Small issuer trust preferred holdings (c) | 173 | — | Loans and leases | |||||||||||||||||
| On-balance sheet trust preferred securitization | 26 | 88 | (d) | |||||||||||||||||
| Holdings of agency mortgage-backed securities (c) | 8,402 | — | (e) | |||||||||||||||||
| Commercial loan modifications to borrowers experiencing financial difficulty (f) | 129 | — | Loans and leases | |||||||||||||||||
| Proprietary trust preferred issuances (g) | — | 167 | Term borrowings | |||||||||||||||||
| (Dollars in millions) | Maximum Loss Exposure |
Liability Recognized |
Classification | |||||||||||||||||
| Type: | ||||||||||||||||||||
| Low income housing partnerships | $ | 463 | $ | 154 | (a) | |||||||||||||||
| Other tax credit investments (b) | 85 | 67 | Other assets | |||||||||||||||||
| Small issuer trust preferred holdings (c) | 171 | — | Loans and leases | |||||||||||||||||
| On-balance sheet trust preferred securitization | 27 | 87 | (d) | |||||||||||||||||
| Holdings of agency mortgage-backed securities (c) | 8,652 | — | (e) | |||||||||||||||||
| Commercial loan troubled debt restructurings (f) | 53 | — | Loans and leases | |||||||||||||||||
| Proprietary trust preferred issuances (g) | — | 167 | Term borrowings | |||||||||||||||||
|
177 |
2023 FORM 10-K ANNUAL REPORT | ||||||
| ITEM 8. FINANCIAL STATEMENTS & SUPPLEMENTARY DATA | ||||||||
| NOTE 21—DERIVATIVES | ||||||||
|
178 |
2023 FORM 10-K ANNUAL REPORT | ||||||
| ITEM 8. FINANCIAL STATEMENTS & SUPPLEMENTARY DATA | ||||||||
| NOTE 21—DERIVATIVES | ||||||||
| December 31, 2023 | ||||||||||||||||||||
| (Dollars in millions) | Notional | Assets | Liabilities | |||||||||||||||||
| Customer interest rate contracts | $ | 4,067 | $ | 22 | $ | 197 | ||||||||||||||
| Offsetting upstream interest rate contracts | 4,273 | 135 | 23 | |||||||||||||||||
| Forwards and futures purchased | 777 | 9 | — | |||||||||||||||||
| Forwards and futures sold | 912 | — | 9 | |||||||||||||||||
| December 31, 2022 | ||||||||||||||||||||
| (Dollars in millions) | Notional | Assets | Liabilities | |||||||||||||||||
| Customer interest rate contracts | $ | 3,076 | $ | 3 | $ | 270 | ||||||||||||||
| Offsetting upstream interest rate contracts | 3,076 | 91 | 6 | |||||||||||||||||
| Option contracts purchased | 40 | — | — | |||||||||||||||||
| Forwards and futures purchased | 1,127 | 5 | 2 | |||||||||||||||||
| Forwards and futures sold | 1,256 | 4 | 5 | |||||||||||||||||
| December 31, 2023 | ||||||||||||||||||||
| (Dollars in millions) | Notional | Assets | Liabilities | |||||||||||||||||
| Customer Interest Rate Contracts Hedging | ||||||||||||||||||||
| Hedging Instruments and Hedged Items: | ||||||||||||||||||||
| Customer interest rate contracts | $ | 8,375 | $ | 21 | $ | 392 | ||||||||||||||
| Offsetting upstream interest rate contracts | 8,375 | 389 | 22 | |||||||||||||||||
| December 31, 2022 | ||||||||||||||||||||
| (Dollars in millions) | Notional | Assets | Liabilities | |||||||||||||||||
| Customer Interest Rate Contracts Hedging | ||||||||||||||||||||
| Hedging Instruments and Hedged Items: | ||||||||||||||||||||
| Customer interest rate contracts | $ | 8,377 | $ | 3 | $ | 570 | ||||||||||||||
| Offsetting upstream interest rate contracts | 8,377 | 351 | 5 | |||||||||||||||||
|
179 |
2023 FORM 10-K ANNUAL REPORT | ||||||
| ITEM 8. FINANCIAL STATEMENTS & SUPPLEMENTARY DATA | ||||||||
| NOTE 21—DERIVATIVES | ||||||||
| Year Ended December 31, | ||||||||||||||||||||
| 2023 | 2022 | 2021 | ||||||||||||||||||
| (Dollars in millions) | Gains (Losses) | Gains (Losses) | Gains (Losses) | |||||||||||||||||
| Customer Interest Rate Contracts Hedging | ||||||||||||||||||||
| Hedging Instruments and Hedged Items: | ||||||||||||||||||||
| Customer interest rate contracts (a) | $ | 195 | $ | (744) | $ | (268) | ||||||||||||||
| Offsetting upstream interest rate contracts (a) | (195) | 744 | 268 | |||||||||||||||||
| December 31, 2023 | ||||||||||||||||||||
| (Dollars in millions) | Notional | Assets | Liabilities | |||||||||||||||||
| Cash Flow Hedges | ||||||||||||||||||||
| Hedging Instruments: | ||||||||||||||||||||
| Interest rate contracts | $ | 5,200 | $ | — | $ | 32 | ||||||||||||||
| Hedged Items: | ||||||||||||||||||||
| Variability in cash flows related to debt instruments (primarily loans) | N/A | $ | 5,200 | N/A | ||||||||||||||||
| December 31, 2022 | ||||||||||||||||||||
| (Dollars in millions) | Notional | Assets | Liabilities | |||||||||||||||||
| Cash Flow Hedges | ||||||||||||||||||||
| Hedging Instruments: | ||||||||||||||||||||
| Interest rate contracts | $ | 5,350 | $ | — | $ | 71 | ||||||||||||||
| Hedged Items: | ||||||||||||||||||||
| Variability in cash flows related to debt instruments (primarily loans) | N/A | $ | 5,350 | N/A | ||||||||||||||||
|
180 |
2023 FORM 10-K ANNUAL REPORT | ||||||
| ITEM 8. FINANCIAL STATEMENTS & SUPPLEMENTARY DATA | ||||||||
| NOTE 21—DERIVATIVES | ||||||||
| Year Ended December 31, | ||||||||||||||||||||
| 2023 | 2022 | 2021 | ||||||||||||||||||
| (Dollars in millions) | Gains (Losses) | Gains (Losses) | Gains (Losses) | |||||||||||||||||
| Cash Flow Hedges | ||||||||||||||||||||
| Hedging Instruments: | ||||||||||||||||||||
| Interest rate contracts (a) | $ | 45 | $ | 195 | $ | 29 | ||||||||||||||
| Gain (loss) recognized in other comprehensive income (loss) | 52 | 15 | (3) | |||||||||||||||||
| Gain (loss) reclassified from AOCI into interest income | 47 | (129) | (7) | |||||||||||||||||
| December 31, 2023 | ||||||||||||||||||||
| (Dollars in millions) | Notional | Assets | Liabilities | |||||||||||||||||
| Mortgage Banking Hedges | ||||||||||||||||||||
| Option contracts written | $ | 55 | $ | 1 | $ | — | ||||||||||||||
| Forward contracts written | 93 | — | 1 | |||||||||||||||||
| December 31, 2022 | ||||||||||||||||||||
| (Dollars in millions) | Notional | Assets | Liabilities | |||||||||||||||||
| Mortgage Banking Hedges | ||||||||||||||||||||
| Option contracts written | $ | 35 | $ | — | $ | — | ||||||||||||||
| Forward contracts written | 61 | — | — | |||||||||||||||||
| Year Ended December 31, | |||||||||||||||||||||||
| 2023 | 2022 | 2021 | |||||||||||||||||||||
| (Dollars in millions) | Gains (Losses) | Gains (Losses) | Gains (Losses) | ||||||||||||||||||||
| Mortgage Banking Hedges | |||||||||||||||||||||||
| Option contracts written | $ | — | $ | 3 | $ | 15 | |||||||||||||||||
| Forward contracts written | 1 | 32 | 11 | ||||||||||||||||||||
|
181 |
2023 FORM 10-K ANNUAL REPORT | ||||||
| ITEM 8. FINANCIAL STATEMENTS & SUPPLEMENTARY DATA | ||||||||
| NOTE 21—DERIVATIVES | ||||||||
|
182 |
2023 FORM 10-K ANNUAL REPORT | ||||||
| ITEM 8. FINANCIAL STATEMENTS & SUPPLEMENTARY DATA | ||||||||
| NOTE 21—DERIVATIVES | ||||||||
| Gross amounts not offset in the Balance Sheets | ||||||||||||||||||||||||||||||||||||||
| (Dollars in millions) | Gross amounts of recognized assets |
Gross amounts offset in the Balance Sheets |
Net amounts of assets presented in the Balance Sheets (a) |
Derivative liabilities available for offset |
Collateral received |
Net amount | ||||||||||||||||||||||||||||||||
| Derivative assets: | ||||||||||||||||||||||||||||||||||||||
| December 31, 2023 | ||||||||||||||||||||||||||||||||||||||
| Interest rate derivative contracts | $ | 567 | $ | — | $ | 567 | $ | (75) | $ | (486) | $ | 6 | ||||||||||||||||||||||||||
| Forward contracts | 9 | — | 9 | (4) | (3) | 2 | ||||||||||||||||||||||||||||||||
| $ | 576 | $ | — | $ | 576 | $ | (79) | $ | (489) | $ | 8 | |||||||||||||||||||||||||||
| December 31, 2022 | ||||||||||||||||||||||||||||||||||||||
| Interest rate derivative contracts | $ | 449 | $ | — | $ | 449 | $ | (58) | $ | (378) | $ | 13 | ||||||||||||||||||||||||||
| Forward contracts | 9 | — | 9 | (6) | (2) | 1 | ||||||||||||||||||||||||||||||||
| $ | 458 | $ | — | $ | 458 | $ | (64) | $ | (380) | $ | 14 | |||||||||||||||||||||||||||
|
183 |
2023 FORM 10-K ANNUAL REPORT | ||||||
| ITEM 8. FINANCIAL STATEMENTS & SUPPLEMENTARY DATA | ||||||||
| NOTE 21—DERIVATIVES | ||||||||
| Gross amounts not offset in the Balance Sheets | ||||||||||||||||||||||||||||||||||||||
| (Dollars in millions) | Gross amounts of recognized liabilities |
Gross amounts offset in the Balance Sheets |
Net amounts of liabilities presented in the Balance Sheets (a) |
Derivative assets available for offset |
Collateral pledged |
Net amount | ||||||||||||||||||||||||||||||||
| Derivative liabilities: | ||||||||||||||||||||||||||||||||||||||
| December 31, 2023 | ||||||||||||||||||||||||||||||||||||||
| Interest rate derivative contracts | $ | 666 | $ | — | $ | 666 | $ | (75) | $ | (164) | $ | 427 | ||||||||||||||||||||||||||
| Forward contracts | 9 | — | 9 | (4) | (5) | — | ||||||||||||||||||||||||||||||||
| $ | 675 | $ | — | $ | 675 | $ | (79) | $ | (169) | $ | 427 | |||||||||||||||||||||||||||
| December 31, 2022 | ||||||||||||||||||||||||||||||||||||||
| Interest rate derivative contracts | $ | 921 | $ | — | $ | 921 | $ | (58) | $ | (175) | $ | 688 | ||||||||||||||||||||||||||
| Forward contracts | 8 | — | 8 | (6) | (1) | 1 | ||||||||||||||||||||||||||||||||
| $ | 929 | $ | — | $ | 929 | $ | (64) | $ | (176) | $ | 689 | |||||||||||||||||||||||||||
|
184 |
2023 FORM 10-K ANNUAL REPORT | ||||||
| ITEM 8. FINANCIAL STATEMENTS & SUPPLEMENTARY DATA | ||||||||
| NOTE 22—MASTER NETTING & SIMILAR AGREEMENTS | ||||||||
| Gross amounts not offset in the Balance Sheets |
||||||||||||||||||||||||||||||||||||||
| (Dollars in millions) | Gross amounts of recognized assets |
Gross amounts offset in the Balance Sheets |
Net amounts of assets presented in the Balance Sheets |
Offsetting securities sold under agreements to repurchase |
Securities collateral (not recognized on FHN’s Balance Sheets) |
Net amount | ||||||||||||||||||||||||||||||||
| Securities purchased under agreements to resell: | ||||||||||||||||||||||||||||||||||||||
| 2023 | $ | 519 | $ | — | $ | 519 | $ | — | $ | (516) | $ | 3 | ||||||||||||||||||||||||||
| 2022 | 353 | — | 353 | (10) | (340) | 3 | ||||||||||||||||||||||||||||||||
| Gross amounts not offset in the Balance Sheets |
||||||||||||||||||||||||||||||||||||||
| (Dollars in millions) | Gross amounts of recognized liabilities |
Gross amounts offset in the Balance Sheets |
Net amounts of liabilities presented in the Balance Sheets |
Offsetting securities purchased under agreements to resell |
Securities/ government guaranteed loans collateral |
Net amount | ||||||||||||||||||||||||||||||||
| Securities sold under agreements to repurchase: | ||||||||||||||||||||||||||||||||||||||
| 2023 | $ | 1,921 | $ | — | $ | 1,921 | $ | — | $ | (1,921) | $ | — | ||||||||||||||||||||||||||
| 2022 | 1,013 | — | 1,013 | (10) | (1,003) | — | ||||||||||||||||||||||||||||||||
|
185 |
2023 FORM 10-K ANNUAL REPORT | ||||||
| ITEM 8. FINANCIAL STATEMENTS & SUPPLEMENTARY DATA | ||||||||
| NOTE 22—MASTER NETTING & SIMILAR AGREEMENTS | ||||||||
| December 31, 2023 | |||||||||||||||||
| (Dollars in millions) | Overnight and Continuous |
Up to 30 Days | Total | ||||||||||||||
| Securities sold under agreements to repurchase: | |||||||||||||||||
| Government agency issued MBS | $ | 1,717 | $ | — | $ | 1,717 | |||||||||||
| Government agency issued CMO | 161 | — | 161 | ||||||||||||||
| Other U.S. government agencies | 43 | — | 43 | ||||||||||||||
| Total securities sold under agreements to repurchase | $ | 1,921 | $ | — | $ | 1,921 | |||||||||||
| December 31, 2022 | |||||||||||||||||
| (Dollars in millions) | Overnight and Continuous |
Up to 30 Days | Total | ||||||||||||||
| Securities sold under agreements to repurchase: | |||||||||||||||||
| U.S. treasuries | $ | 10 | $ | — | $ | 10 | |||||||||||
| Government agency issued MBS | 851 | — | 851 | ||||||||||||||
| Government agency issued CMO | 122 | — | 122 | ||||||||||||||
| Other U.S. government agencies | 30 | — | 30 | ||||||||||||||
| Total securities sold under agreements to repurchase | $ | 1,013 | $ | — | $ | 1,013 | |||||||||||
|
186 |
2023 FORM 10-K ANNUAL REPORT | ||||||
| ITEM 8. FINANCIAL STATEMENTS & SUPPLEMENTARY DATA | ||||||||
| NOTE 23—FAIR VALUE OF ASSETS AND LIABILITIES | ||||||||
|
187 |
2023 FORM 10-K ANNUAL REPORT | ||||||
| ITEM 8. FINANCIAL STATEMENTS & SUPPLEMENTARY DATA | ||||||||
| NOTE 23—FAIR VALUE OF ASSETS AND LIABILITIES | ||||||||
| December 31, 2023 | ||||||||||||||||||||||||||
| (Dollars in millions) | Level 1 | Level 2 | Level 3 | Total | ||||||||||||||||||||||
| Trading securities: | ||||||||||||||||||||||||||
| U.S. treasuries | $ | — | $ | 3 | $ | — | $ | 3 | ||||||||||||||||||
| Government agency issued MBS | — | 114 | — | 114 | ||||||||||||||||||||||
| Government agency issued CMO | — | 336 | — | 336 | ||||||||||||||||||||||
| Other U.S. government agencies | — | 152 | — | 152 | ||||||||||||||||||||||
| States and municipalities | — | 17 | — | 17 | ||||||||||||||||||||||
| Corporate and other debt | — | 777 | — | 777 | ||||||||||||||||||||||
| Interest-only strips (elected fair value) | — | — | 13 | 13 | ||||||||||||||||||||||
| Total trading securities | — | 1,399 | 13 | 1,412 | ||||||||||||||||||||||
| Loans held for sale (elected fair value) | — | 42 | 26 | 68 | ||||||||||||||||||||||
| Securities available for sale: | ||||||||||||||||||||||||||
| Government agency issued MBS | — | 4,484 | — | 4,484 | ||||||||||||||||||||||
| Government agency issued CMO | — | 2,146 | — | 2,146 | ||||||||||||||||||||||
| Other U.S. government agencies | — | 1,172 | — | 1,172 | ||||||||||||||||||||||
| States and municipalities | — | 589 | — | 589 | ||||||||||||||||||||||
| Total securities available for sale | — | 8,391 | — | 8,391 | ||||||||||||||||||||||
| Other assets: | ||||||||||||||||||||||||||
| Deferred compensation mutual funds | 102 | — | — | 102 | ||||||||||||||||||||||
| Equity, mutual funds, and other | 34 | — | — | 34 | ||||||||||||||||||||||
| Derivatives, forwards and futures | 9 | — | — | 9 | ||||||||||||||||||||||
| Derivatives, interest rate contracts | — | 568 | — | 568 | ||||||||||||||||||||||
| Total other assets | 145 | 568 | — | 713 | ||||||||||||||||||||||
| Total assets | $ | 145 | $ | 10,400 | $ | 39 | $ | 10,584 | ||||||||||||||||||
| Trading liabilities: | ||||||||||||||||||||||||||
| U.S. treasuries | $ | — | $ | 426 | $ | — | $ | 426 | ||||||||||||||||||
| Government agency issued MBS | — | 1 | — | 1 | ||||||||||||||||||||||
| Corporate and other debt | — | 82 | — | 82 | ||||||||||||||||||||||
| Total trading liabilities | — | 509 | — | 509 | ||||||||||||||||||||||
| Other liabilities: | ||||||||||||||||||||||||||
| Derivatives, forwards and futures | 10 | — | — | 10 | ||||||||||||||||||||||
| Derivatives, interest rate contracts | — | 666 | — | 666 | ||||||||||||||||||||||
| Derivatives, other | — | — | 23 | 23 | ||||||||||||||||||||||
| Total other liabilities | 10 | 666 | 23 | 699 | ||||||||||||||||||||||
| Total liabilities | $ | 10 | $ | 1,175 | $ | 23 | $ | 1,208 | ||||||||||||||||||
|
188 |
2023 FORM 10-K ANNUAL REPORT | ||||||
| ITEM 8. FINANCIAL STATEMENTS & SUPPLEMENTARY DATA | ||||||||
| NOTE 23—FAIR VALUE OF ASSETS AND LIABILITIES | ||||||||
| December 31, 2022 | ||||||||||||||||||||||||||
| (Dollars in millions) | Level 1 | Level 2 | Level 3 | Total | ||||||||||||||||||||||
| Trading securities: | ||||||||||||||||||||||||||
| U.S. treasuries | $ | — | $ | 101 | $ | — | $ | 101 | ||||||||||||||||||
| Government agency issued MBS | — | 144 | — | 144 | ||||||||||||||||||||||
| Government agency issued CMO | — | 61 | — | 61 | ||||||||||||||||||||||
| Other U.S. government agencies | — | 115 | — | 115 | ||||||||||||||||||||||
| States and municipalities | — | 54 | — | 54 | ||||||||||||||||||||||
| Corporate and other debt | — | 875 | — | 875 | ||||||||||||||||||||||
| Interest-only strips (elected fair value) | — | — | 25 | 25 | ||||||||||||||||||||||
| Total trading securities | — | 1,350 | 25 | 1,375 | ||||||||||||||||||||||
| Loans held for sale (elected fair value) | — | 29 | 22 | 51 | ||||||||||||||||||||||
| Securities available for sale: | ||||||||||||||||||||||||||
| Government agency issued MBS | — | 4,763 | — | 4,763 | ||||||||||||||||||||||
| Government agency issued CMO | — | 2,313 | — | 2,313 | ||||||||||||||||||||||
| Other U.S. government agencies | — | 1,163 | — | 1,163 | ||||||||||||||||||||||
| States and municipalities | — | 597 | — | 597 | ||||||||||||||||||||||
| Total securities available for sale | — | 8,836 | — | 8,836 | ||||||||||||||||||||||
| Other assets: | ||||||||||||||||||||||||||
| Deferred compensation mutual funds | 112 | — | — | 112 | ||||||||||||||||||||||
| Equity, mutual funds, and other | 22 | — | — | 22 | ||||||||||||||||||||||
| Derivatives, forwards and futures | 9 | — | — | 9 | ||||||||||||||||||||||
| Derivatives, interest rate contracts | — | 449 | — | 449 | ||||||||||||||||||||||
| Derivatives, other | — | 2 | — | 2 | ||||||||||||||||||||||
| Total other assets | 143 | 451 | — | 594 | ||||||||||||||||||||||
| Total assets | $ | 143 | $ | 10,666 | $ | 47 | $ | 10,856 | ||||||||||||||||||
| Trading liabilities: | ||||||||||||||||||||||||||
| U.S. treasuries | $ | — | $ | 275 | $ | — | $ | 275 | ||||||||||||||||||
| Government agency issued MBS | — | 2 | — | 2 | ||||||||||||||||||||||
| Corporate and other debt | — | 58 | — | 58 | ||||||||||||||||||||||
| Total trading liabilities | — | 335 | — | 335 | ||||||||||||||||||||||
| Other liabilities: | ||||||||||||||||||||||||||
| Derivatives, forwards and futures | 8 | — | — | 8 | ||||||||||||||||||||||
| Derivatives, interest rate contracts | — | 922 | — | 922 | ||||||||||||||||||||||
| Derivatives, other | — | 1 | 27 | 28 | ||||||||||||||||||||||
| Total other liabilities | 8 | 923 | 27 | 958 | ||||||||||||||||||||||
| Total liabilities | $ | 8 | $ | 1,258 | $ | 27 | $ | 1,293 | ||||||||||||||||||
|
189 |
2023 FORM 10-K ANNUAL REPORT | ||||||
| ITEM 8. FINANCIAL STATEMENTS & SUPPLEMENTARY DATA | ||||||||
| NOTE 23—FAIR VALUE OF ASSETS AND LIABILITIES | ||||||||
| Year Ended December 31, 2023 | |||||||||||||||||||||||
| (Dollars in millions) | Interest-only strips | Loans held for sale | Net derivative liabilities |
||||||||||||||||||||
| Balance on January 1, 2023 | $ | 25 | $ | 22 | $ | (27) | |||||||||||||||||
| Total net gains (losses) included in net income | (12) | 4 | (15) | ||||||||||||||||||||
| Purchases | — | 3 | — | ||||||||||||||||||||
| Sales | (54) | (3) | — | ||||||||||||||||||||
| Settlements | — | (2) | 19 | ||||||||||||||||||||
| Net transfers into (out of) Level 3 | 54 | (b) | 2 | — | |||||||||||||||||||
| Balance on December 31, 2023 | $ | 13 | $ | 26 | $ | (23) | |||||||||||||||||
| Net unrealized gains (losses) included in net income | $ | (1) | (c) | $ | 4 | (a) | $ | (15) | (d) | ||||||||||||||
| Year Ended December 31, 2022 | |||||||||||||||||||||||
| (Dollars in millions) | Interest-only strips | Loans held for sale | Net derivative liabilities |
||||||||||||||||||||
| Balance on January 1, 2022 | $ | 38 | $ | 28 | $ | (23) | |||||||||||||||||
| Total net gains (losses) included in net income | (7) | — | (23) | ||||||||||||||||||||
| Purchases | — | 2 | — | ||||||||||||||||||||
| Sales | (76) | (12) | — | ||||||||||||||||||||
| Settlements | — | (2) | 19 | ||||||||||||||||||||
| Repayments | — | (1) | — | ||||||||||||||||||||
| Net transfers into (out of) Level 3 | 70 | (b) | 7 | — | |||||||||||||||||||
| Balance on December 31, 2022 | $ | 25 | $ | 22 | $ | (27) | |||||||||||||||||
| Net unrealized gains (losses) included in net income | $ | (2) | (c) | $ | — | (a) | $ | (23) | (d) | ||||||||||||||
| Year Ended December 31, 2021 | |||||||||||||||||||||||||||||
| (Dollars in millions) | Interest-only strips | Loans held for sale | Loans held for investment | Net derivative liabilities |
|||||||||||||||||||||||||
| Balance on January 1, 2021 | $ | 32 | $ | 12 | $ | 16 | $ | (14) | |||||||||||||||||||||
| Total net gains (losses) included in net income | 3 | 1 | — | (19) | |||||||||||||||||||||||||
| Purchases | — | 10 | — | — | |||||||||||||||||||||||||
| Sales | (68) | (18) | — | — | |||||||||||||||||||||||||
| Settlements | — | (3) | (2) | 10 | |||||||||||||||||||||||||
| Net transfers into (out of) Level 3 | 71 | (b) | 26 | (e) | (14) | (e) | — | ||||||||||||||||||||||
| Balance on December 31, 2021 | $ | 38 | $ | 28 | $ | — | $ | (23) | |||||||||||||||||||||
| Net unrealized gains (losses) included in net income | $ | (2) | (c) | $ | 1 | (a) | $ | — | $ | (19) | (d) | ||||||||||||||||||
|
190 |
2023 FORM 10-K ANNUAL REPORT | ||||||
| ITEM 8. FINANCIAL STATEMENTS & SUPPLEMENTARY DATA | ||||||||
| NOTE 23—FAIR VALUE OF ASSETS AND LIABILITIES | ||||||||
| Carrying value at December 31, 2023 | Year Ended December 31, 2023 | |||||||||||||||||||||||||||||||
| (Dollars in millions) | Level 1 | Level 2 | Level 3 | Total | Net gains (losses) | |||||||||||||||||||||||||||
| Loans held for sale—SBAs and USDA | $ | — | $ | 406 | $ | — | $ | 406 | $ | (3) | ||||||||||||||||||||||
| Loans and leases (a) | — | — | 245 | 245 | (42) | |||||||||||||||||||||||||||
| OREO (b) | — | — | 4 | 4 | — | |||||||||||||||||||||||||||
| Other assets (c) | — | — | 90 | 90 | (7) | |||||||||||||||||||||||||||
| $ | (52) | |||||||||||||||||||||||||||||||
| Carrying value at December 31, 2022 | Year Ended December 31, 2022 | |||||||||||||||||||||||||||||||
| (Dollars in millions) | Level 1 | Level 2 | Level 3 | Total | Net gains (losses) | |||||||||||||||||||||||||||
| Loans held for sale—SBAs and USDA | $ | — | $ | 506 | $ | — | $ | 506 | $ | (3) | ||||||||||||||||||||||
| Loans and leases (a) | — | — | 135 | 135 | (19) | |||||||||||||||||||||||||||
| OREO (b) | — | — | 3 | 3 | — | |||||||||||||||||||||||||||
| Other assets (c) | — | — | 91 | 91 | (10) | |||||||||||||||||||||||||||
| $ | (32) | |||||||||||||||||||||||||||||||
| Carrying value at December 31, 2021 | Year Ended December 31, 2021 | |||||||||||||||||||||||||||||||
| (Dollars in millions) | Level 1 | Level 2 | Level 3 | Total | Net gains (losses) | |||||||||||||||||||||||||||
| Loans held for sale—SBAs and USDA | $ | — | $ | 852 | $ | 1 | $ | 853 | $ | (2) | ||||||||||||||||||||||
| Loans held for sale—first mortgages | — | — | 1 | 1 | — | |||||||||||||||||||||||||||
| Loans and leases (a) | — | — | 84 | 84 | (13) | |||||||||||||||||||||||||||
| OREO (b) | — | — | 3 | 3 | (1) | |||||||||||||||||||||||||||
| Other assets (c) | — | — | 80 | 80 | (7) | |||||||||||||||||||||||||||
| $ | (23) | |||||||||||||||||||||||||||||||
|
191 |
2023 FORM 10-K ANNUAL REPORT | ||||||
| ITEM 8. FINANCIAL STATEMENTS & SUPPLEMENTARY DATA | ||||||||
| NOTE 23—FAIR VALUE OF ASSETS AND LIABILITIES | ||||||||
| (Dollars in millions) | Values Utilized | |||||||||||||||||||||||||||||||
| Level 3 Class | Fair Value at December 31, 2023 | Valuation Techniques | Unobservable Input | Range | Weighted Average (d) | |||||||||||||||||||||||||||
| Trading securities - SBA interest-only strips | $ | 13 | Discounted cash flow | Constant prepayment rate | 14% - 15% |
14% | ||||||||||||||||||||||||||
| Bond equivalent yield | 18% - 21% |
18% | ||||||||||||||||||||||||||||||
| Loans held for sale - residential real estate | $ | 26 | Discounted cash flow | Prepayment speeds - First mortgage | 2% - 7% |
3% | ||||||||||||||||||||||||||
| Foreclosure losses | 64% - 68% |
65% | ||||||||||||||||||||||||||||||
| Loss severity trends - First mortgage | 0% - 3% of UPB |
2% | ||||||||||||||||||||||||||||||
| Derivative liabilities, other | $ | 23 | Discounted cash flow | Visa covered litigation resolution amount | $5.7 billion - $6.7 billion |
$6.3 billion | ||||||||||||||||||||||||||
| Probability of resolution scenarios | 10% - 25% |
18% | ||||||||||||||||||||||||||||||
| Time until resolution | 6 - 36 months |
24 months | ||||||||||||||||||||||||||||||
| Loans and leases (a) | $ | 245 | Appraisals from comparable properties | Marketability adjustments for specific properties | 0% - 25% of appraisal |
NM | ||||||||||||||||||||||||||
| Other collateral valuations | Borrowing base certificates liquidation adjustment | 25% - 50% of gross value |
NM | |||||||||||||||||||||||||||||
| Financial Statements liquidation adjustment | 50% - 100% of reported value |
NM | ||||||||||||||||||||||||||||||
| Auction appraisals marketability adjustment | 0% - 10% of reported value |
NM | ||||||||||||||||||||||||||||||
| OREO (b) | $ | 4 | Appraisals from comparable properties | Adjustment for value changes since appraisal | 0% - 10% of appraisal |
NM | ||||||||||||||||||||||||||
| Other assets (c) | $ | 90 | Discounted cash flow | Adjustments to current sales yields for specific properties | 0% - 15% adjustment to yield |
NM | ||||||||||||||||||||||||||
| Appraisals from comparable properties | Marketability adjustments for specific properties | 0% - 25% of appraisal |
NM | |||||||||||||||||||||||||||||
|
192 |
2023 FORM 10-K ANNUAL REPORT | ||||||
| ITEM 8. FINANCIAL STATEMENTS & SUPPLEMENTARY DATA | ||||||||
| NOTE 23—FAIR VALUE OF ASSETS AND LIABILITIES | ||||||||
| (Dollars in millions) | Values Utilized | |||||||||||||||||||||||||||||||
| Level 3 Class | Fair Value at December 31, 2022 | Valuation Techniques | Unobservable Input | Range | Weighted Average (d) | |||||||||||||||||||||||||||
| Trading securities - SBA interest-only strips | $ | 25 | Discounted cash flow | Constant prepayment rate | 12% - 13% |
12% | ||||||||||||||||||||||||||
| Bond equivalent yield | 17% |
17% | ||||||||||||||||||||||||||||||
| Loans held for sale - residential real estate | $ | 22 | Discounted cash flow | Prepayment speeds - First mortgage | 2% - 8% |
3% | ||||||||||||||||||||||||||
| Foreclosure losses | 63% - 75% |
65% | ||||||||||||||||||||||||||||||
| Loss severity trends - First mortgage | 0% - 11% of UPB |
5% | ||||||||||||||||||||||||||||||
| Derivative liabilities, other | $ | 27 | Discounted cash flow | Visa covered litigation resolution amount | $5.6 billion - $6.0 billion |
$5.9 billion | ||||||||||||||||||||||||||
| Probability of resolution scenarios | 5% - 25% |
20% | ||||||||||||||||||||||||||||||
| Time until resolution | 12 - 42 months |
28 months | ||||||||||||||||||||||||||||||
| Loans and leases (a) | $ | 135 | Appraisals from comparable properties | Marketability adjustments for specific properties | 0% - 10% of appraisal |
NM | ||||||||||||||||||||||||||
| Other collateral valuations | Borrowing base certificates adjustment | 20% - 50% of gross value |
NM | |||||||||||||||||||||||||||||
| Financial Statements/Auction values adjustment | 0% - 25% of reported value |
NM | ||||||||||||||||||||||||||||||
| OREO (b) | $ | 3 | Appraisals from comparable properties | Adjustment for value changes since appraisal | 0% - 10% of appraisal |
NM | ||||||||||||||||||||||||||
| Other assets (c) | $ | 91 | Discounted cash flow | Adjustments to current sales yields for specific properties | 0% - 15% adjustment to yield |
NM | ||||||||||||||||||||||||||
| Appraisals from comparable properties | Marketability adjustments for specific properties | 0% - 25% of appraisal |
NM | |||||||||||||||||||||||||||||
|
193 |
2023 FORM 10-K ANNUAL REPORT | ||||||
| ITEM 8. FINANCIAL STATEMENTS & SUPPLEMENTARY DATA | ||||||||
| NOTE 23—FAIR VALUE OF ASSETS AND LIABILITIES | ||||||||
|
194 |
2023 FORM 10-K ANNUAL REPORT | ||||||
| ITEM 8. FINANCIAL STATEMENTS & SUPPLEMENTARY DATA | ||||||||
| NOTE 23—FAIR VALUE OF ASSETS AND LIABILITIES | ||||||||
| December 31, 2023 | ||||||||||||||||||||
| (Dollars in millions) | Fair value carrying amount |
Aggregate unpaid principal |
Fair value carrying amount less aggregate unpaid principal |
|||||||||||||||||
| Residential real estate loans held for sale reported at fair value: | ||||||||||||||||||||
| Total loans | $ | 68 | $ | 73 | $ | (5) | ||||||||||||||
| Nonaccrual loans | 2 | 5 | (3) | |||||||||||||||||
| Loans 90 days or more past due and still accruing | 1 | 1 | — | |||||||||||||||||
| December 31, 2022 | ||||||||||||||||||||
| (Dollars in millions) | Fair value carrying amount |
Aggregate unpaid principal |
Fair value carrying amount less aggregate unpaid principal |
|||||||||||||||||
| Residential real estate loans held for sale reported at fair value: | ||||||||||||||||||||
| Total loans | $ | 51 | $ | 58 | $ | (7) | ||||||||||||||
| Nonaccrual loans | 5 | 8 | (3) | |||||||||||||||||
| Loans 90 days or more past due and still accruing | 1 | 1 | — | |||||||||||||||||
| Year Ended December 31, | |||||||||||||||||
| (Dollars in millions) | 2023 | 2022 | 2021 | ||||||||||||||
| Changes in fair value included in net income: | |||||||||||||||||
| Mortgage banking and title noninterest income | |||||||||||||||||
| Loans held for sale | $ | 1 | $ | (9) | $ | (10) | |||||||||||
|
195 |
2023 FORM 10-K ANNUAL REPORT | ||||||
| ITEM 8. FINANCIAL STATEMENTS & SUPPLEMENTARY DATA | ||||||||
| NOTE 23—FAIR VALUE OF ASSETS AND LIABILITIES | ||||||||
|
196 |
2023 FORM 10-K ANNUAL REPORT | ||||||
| ITEM 8. FINANCIAL STATEMENTS & SUPPLEMENTARY DATA | ||||||||
| NOTE 23—FAIR VALUE OF ASSETS AND LIABILITIES | ||||||||
|
197 |
2023 FORM 10-K ANNUAL REPORT | ||||||
| ITEM 8. FINANCIAL STATEMENTS & SUPPLEMENTARY DATA | ||||||||
| NOTE 23—FAIR VALUE OF ASSETS AND LIABILITIES | ||||||||
|
198 |
2023 FORM 10-K ANNUAL REPORT | ||||||
| ITEM 8. FINANCIAL STATEMENTS & SUPPLEMENTARY DATA | ||||||||
| NOTE 23—FAIR VALUE OF ASSETS AND LIABILITIES | ||||||||
| December 31, 2023 | ||||||||||||||||||||||||||||||||
| Book Value |
Fair Value | |||||||||||||||||||||||||||||||
| (Dollars in millions) | Level 1 | Level 2 | Level 3 | Total | ||||||||||||||||||||||||||||
| Assets: | ||||||||||||||||||||||||||||||||
| Loans and leases, net of allowance for loan and lease losses | ||||||||||||||||||||||||||||||||
| Commercial: | ||||||||||||||||||||||||||||||||
| Commercial, financial and industrial | $ | 32,294 | $ | — | $ | — | $ | 31,678 | $ | 31,678 | ||||||||||||||||||||||
| Commercial real estate | 14,044 | — | — | 13,832 | 13,832 | |||||||||||||||||||||||||||
| Consumer: | ||||||||||||||||||||||||||||||||
| Consumer real estate | 13,417 | — | — | 12,616 | 12,616 | |||||||||||||||||||||||||||
| Credit card and other | 764 | — | — | 742 | 742 | |||||||||||||||||||||||||||
| Total loans and leases, net of allowance for loan and lease losses | 60,519 | — | — | 58,868 | 58,868 | |||||||||||||||||||||||||||
| Short-term financial assets: | ||||||||||||||||||||||||||||||||
| Interest-bearing deposits with banks | 1,328 | 1,328 | — | — | 1,328 | |||||||||||||||||||||||||||
| Federal funds sold | 200 | — | 200 | — | 200 | |||||||||||||||||||||||||||
| Securities purchased under agreements to resell | 519 | — | 519 | — | 519 | |||||||||||||||||||||||||||
| Total short-term financial assets | 2,047 | 1,328 | 719 | — | 2,047 | |||||||||||||||||||||||||||
| Trading securities (a) | 1,412 | — | 1,399 | 13 | 1,412 | |||||||||||||||||||||||||||
| Loans held for sale: | ||||||||||||||||||||||||||||||||
| Mortgage loans (elected fair value) (a) | 68 | — | 42 | 26 | 68 | |||||||||||||||||||||||||||
| USDA & SBA loans - LOCOM | 406 | — | 407 | — | 407 | |||||||||||||||||||||||||||
| Mortgage loans - LOCOM | 28 | — | — | 28 | 28 | |||||||||||||||||||||||||||
| Total loans held for sale | 502 | — | 449 | 54 | 503 | |||||||||||||||||||||||||||
| Securities available for sale (a) | 8,391 | — | 8,391 | — | 8,391 | |||||||||||||||||||||||||||
| Securities held to maturity | 1,323 | — | 1,161 | — | 1,161 | |||||||||||||||||||||||||||
| Derivative assets (a) | 577 | 9 | 568 | — | 577 | |||||||||||||||||||||||||||
| Other assets: | ||||||||||||||||||||||||||||||||
| Tax credit investments | 665 | — | — | 653 | 653 | |||||||||||||||||||||||||||
| Deferred compensation mutual funds | 102 | 102 | — | — | 102 | |||||||||||||||||||||||||||
| Equity, mutual funds, and other (b) | 261 | 34 | — | 227 | 261 | |||||||||||||||||||||||||||
| Total other assets | 1,028 | 136 | — | 880 | 1,016 | |||||||||||||||||||||||||||
| Total assets | $ | 75,799 | $ | 1,473 | $ | 12,687 | $ | 59,815 | $ | 73,975 | ||||||||||||||||||||||
| Liabilities: | ||||||||||||||||||||||||||||||||
| Defined maturity deposits | $ | 6,804 | $ | — | $ | 6,851 | $ | — | $ | 6,851 | ||||||||||||||||||||||
| Trading liabilities (a) | 509 | — | 509 | — | 509 | |||||||||||||||||||||||||||
| Short-term financial liabilities: | ||||||||||||||||||||||||||||||||
| Federal funds purchased | 302 | — | 302 | — | 302 | |||||||||||||||||||||||||||
| Securities sold under agreements to repurchase | 1,921 | — | 1,921 | — | 1,921 | |||||||||||||||||||||||||||
| Other short-term borrowings | 326 | — | 326 | — | 326 | |||||||||||||||||||||||||||
| Total short-term financial liabilities | 2,549 | — | 2,549 | — | 2,549 | |||||||||||||||||||||||||||
| Term borrowings: | ||||||||||||||||||||||||||||||||
| Real estate investment trust-preferred | 47 | — | — | 47 | 47 | |||||||||||||||||||||||||||
| Term borrowings—new market tax credit investment | 65 | — | — | 60 | 60 | |||||||||||||||||||||||||||
| Secured borrowings | 3 | — | — | 3 | 3 | |||||||||||||||||||||||||||
| Junior subordinated debentures | 150 | — | — | 150 | 150 | |||||||||||||||||||||||||||
| Other long-term borrowings | 885 | — | 824 | — | 824 | |||||||||||||||||||||||||||
| Total term borrowings | 1,150 | — | 824 | 260 | 1,084 | |||||||||||||||||||||||||||
| Derivative liabilities (a) | 699 | 10 | 666 | 23 | 699 | |||||||||||||||||||||||||||
| Total liabilities | $ | 11,711 | $ | 10 | $ | 11,399 | $ | 283 | $ | 11,692 | ||||||||||||||||||||||
|
199 |
2023 FORM 10-K ANNUAL REPORT | ||||||
| ITEM 8. FINANCIAL STATEMENTS & SUPPLEMENTARY DATA | ||||||||
| NOTE 23—FAIR VALUE OF ASSETS AND LIABILITIES | ||||||||
| December 31, 2022 | ||||||||||||||||||||||||||||||||
| Book Value |
Fair Value | |||||||||||||||||||||||||||||||
| (Dollars in millions) | Level 1 | Level 2 | Level 3 | Total | ||||||||||||||||||||||||||||
| Assets: | ||||||||||||||||||||||||||||||||
| Loans and leases, net of allowance for loan and lease losses | ||||||||||||||||||||||||||||||||
| Commercial: | ||||||||||||||||||||||||||||||||
| Commercial, financial and industrial | $ | 31,473 | $ | — | $ | — | $ | 31,329 | $ | 31,329 | ||||||||||||||||||||||
| Commercial real estate | 13,082 | — | — | 12,909 | 12,909 | |||||||||||||||||||||||||||
| Consumer: | ||||||||||||||||||||||||||||||||
| Consumer real estate | 12,053 | — | — | 11,934 | 11,934 | |||||||||||||||||||||||||||
| Credit card and other | 809 | — | — | 810 | 810 | |||||||||||||||||||||||||||
| Total loans and leases, net of allowance for loan and lease losses | 57,417 | — | — | 56,982 | 56,982 | |||||||||||||||||||||||||||
| Short-term financial assets: | ||||||||||||||||||||||||||||||||
| Interest-bearing deposits with banks | 1,384 | 1,384 | — | — | 1,384 | |||||||||||||||||||||||||||
| Federal funds sold | 129 | — | 129 | — | 129 | |||||||||||||||||||||||||||
| Securities purchased under agreements to resell | 353 | — | 353 | — | 353 | |||||||||||||||||||||||||||
| Total short-term financial assets | 1,866 | 1,384 | 482 | — | 1,866 | |||||||||||||||||||||||||||
| Trading securities (a) | 1,375 | — | 1,350 | 25 | 1,375 | |||||||||||||||||||||||||||
| Loans held for sale: | ||||||||||||||||||||||||||||||||
| Mortgage loans (elected fair value) (a) | 51 | — | 29 | 22 | 51 | |||||||||||||||||||||||||||
| USDA & SBA loans - LOCOM | 506 | — | 512 | — | 512 | |||||||||||||||||||||||||||
| Mortgage loans - LOCOM | 33 | — | — | 33 | 33 | |||||||||||||||||||||||||||
| Total loans held for sale | 590 | — | 541 | 55 | 596 | |||||||||||||||||||||||||||
| Securities available for sale (a) | 8,836 | — | 8,836 | — | 8,836 | |||||||||||||||||||||||||||
| Securities held to maturity | 1,371 | — | 1,209 | — | 1,209 | |||||||||||||||||||||||||||
| Derivative assets (a) | 460 | 9 | 451 | — | 460 | |||||||||||||||||||||||||||
| Other assets: | ||||||||||||||||||||||||||||||||
| Tax credit investments | 547 | — | — | 542 | 542 | |||||||||||||||||||||||||||
| Deferred compensation mutual funds | 112 | 112 | — | — | 112 | |||||||||||||||||||||||||||
| Equity, mutual funds, and other (b) | 275 | 22 | — | 253 | 275 | |||||||||||||||||||||||||||
| Total other assets | 934 | 134 | — | 795 | 929 | |||||||||||||||||||||||||||
| Total assets | $ | 72,849 | $ | 1,527 | $ | 12,869 | $ | 57,857 | $ | 72,253 | ||||||||||||||||||||||
| Liabilities: | ||||||||||||||||||||||||||||||||
| Defined maturity deposits | $ | 2,887 | $ | — | $ | 2,890 | $ | — | $ | 2,890 | ||||||||||||||||||||||
| Trading liabilities (a) | 335 | — | 335 | — | 335 | |||||||||||||||||||||||||||
| Short-term financial liabilities: | ||||||||||||||||||||||||||||||||
| Federal funds purchased | 400 | — | 400 | — | 400 | |||||||||||||||||||||||||||
| Securities sold under agreements to repurchase | 1,013 | — | 1,013 | — | 1,013 | |||||||||||||||||||||||||||
| Other short-term borrowings | 1,093 | — | 1,093 | — | 1,093 | |||||||||||||||||||||||||||
| Total short-term financial liabilities | 2,506 | — | 2,506 | — | 2,506 | |||||||||||||||||||||||||||
| Term borrowings: | ||||||||||||||||||||||||||||||||
| Real estate investment trust-preferred | 46 | — | — | 47 | 47 | |||||||||||||||||||||||||||
| Term borrowings—new market tax credit investment | 66 | — | — | 59 | 59 | |||||||||||||||||||||||||||
| Secured borrowings | 3 | — | — | 3 | 3 | |||||||||||||||||||||||||||
| Junior subordinated debentures | 148 | — | — | 150 | 150 | |||||||||||||||||||||||||||
| Other long-term borrowings | 1,334 | — | 1,301 | — | 1,301 | |||||||||||||||||||||||||||
| Total term borrowings | 1,597 | — | 1,301 | 259 | 1,560 | |||||||||||||||||||||||||||
| Derivative liabilities (a) | 958 | 8 | 923 | 27 | 958 | |||||||||||||||||||||||||||
| Total liabilities | $ | 8,283 | $ | 8 | $ | 7,955 | $ | 286 | $ | 8,249 | ||||||||||||||||||||||
|
200 |
2023 FORM 10-K ANNUAL REPORT | ||||||
| ITEM 8. FINANCIAL STATEMENTS & SUPPLEMENTARY DATA | ||||||||
| NOTE 23—FAIR VALUE OF ASSETS AND LIABILITIES | ||||||||
| Contractual Amount | Fair Value | |||||||||||||||||||||||||
| (Dollars in millions) | December 31, 2023 | December 31, 2022 | December 31, 2023 | December 31, 2022 | ||||||||||||||||||||||
| Unfunded Commitments: | ||||||||||||||||||||||||||
| Loan commitments | $ | 24,579 | $ | 25,953 | $ | 1 | $ | 1 | ||||||||||||||||||
| Standby and other commitments | 746 | 754 | 8 | 7 | ||||||||||||||||||||||
|
201 |
2023 FORM 10-K ANNUAL REPORT | ||||||
| ITEM 8. FINANCIAL STATEMENTS & SUPPLEMENTARY DATA | ||||||||
| NOTE 24—PARENT COMPANY FINANCIAL INFORMATION | ||||||||
| Balance Sheets | December 31, | |||||||||||||
| (Dollars in millions) | 2023 | 2022 | ||||||||||||
| Assets: | ||||||||||||||
| Cash | $ | 854 | $ | 1,335 | ||||||||||
| Notes receivable | 3 | 3 | ||||||||||||
| Investments in subsidiaries: | ||||||||||||||
| Bank | 8,658 | 7,861 | ||||||||||||
| Non-bank | 49 | 42 | ||||||||||||
| Other assets | 256 | 251 | ||||||||||||
| Total assets | $ | 9,820 | $ | 9,492 | ||||||||||
| Liabilities and equity: | ||||||||||||||
| Accrued employee benefits and other liabilities | $ | 324 | $ | 293 | ||||||||||
| Term borrowings | 500 | 948 | ||||||||||||
| Total liabilities | 824 | 1,241 | ||||||||||||
| Total equity | 8,996 | 8,251 | ||||||||||||
| Total liabilities and equity | $ | 9,820 | $ | 9,492 | ||||||||||
| Year Ended December 31, | ||||||||||||||||||||
| (Dollars in millions) | 2023 | 2022 | 2021 | |||||||||||||||||
| Dividend income: | ||||||||||||||||||||
| Bank | $ | 220 | $ | 435 | $ | 770 | ||||||||||||||
| Non-bank | — | 16 | — | |||||||||||||||||
| Total dividend income | 220 | 451 | 770 | |||||||||||||||||
| Other income (loss) | 226 | 22 | (26) | |||||||||||||||||
| Total income | 446 | 473 | 744 | |||||||||||||||||
| Interest expense - term borrowings | 21 | 31 | 31 | |||||||||||||||||
| Personnel and other expense | 114 | 128 | 89 | |||||||||||||||||
| Total expense | 135 | 159 | 120 | |||||||||||||||||
| Income before income taxes | 311 | 314 | 624 | |||||||||||||||||
| Income tax benefit | 24 | (31) | (35) | |||||||||||||||||
| Income before equity in undistributed net income of subsidiaries | 287 | 345 | 659 | |||||||||||||||||
| Equity in undistributed net income (loss) of subsidiaries: | ||||||||||||||||||||
| Bank | 613 | 561 | 332 | |||||||||||||||||
| Non-bank | (3) | (6) | 8 | |||||||||||||||||
| Net income attributable to the controlling interest | $ | 897 | $ | 900 | $ | 999 | ||||||||||||||
|
202 |
2023 FORM 10-K ANNUAL REPORT | ||||||
| ITEM 8. FINANCIAL STATEMENTS & SUPPLEMENTARY DATA | ||||||||
| NOTE 24—PARENT COMPANY FINANCIAL INFORMATION | ||||||||
| Year Ended December 31, | ||||||||||||||||||||
| (Dollars in millions) | 2023 | 2022 | 2021 | |||||||||||||||||
| Operating activities: | ||||||||||||||||||||
| Net income | $ | 897 | $ | 900 | $ | 999 | ||||||||||||||
| Less undistributed net income of subsidiaries | 610 | 555 | 340 | |||||||||||||||||
| Income before undistributed net income of subsidiaries | 287 | 345 | 659 | |||||||||||||||||
| Adjustments to reconcile income to net cash provided by operating activities: | ||||||||||||||||||||
| Deferred income tax expense | 8 | 7 | 8 | |||||||||||||||||
| Stock-based compensation expense | 36 | 76 | 43 | |||||||||||||||||
| Loss on extinguishment of debt | — | — | 26 | |||||||||||||||||
| Gain on sale of title services business | — | (22) | — | |||||||||||||||||
| Other operating activities, net | 1 | 2 | (11) | |||||||||||||||||
| Total adjustments | 45 | 63 | 66 | |||||||||||||||||
| Net cash provided by operating activities | 332 | 408 | 725 | |||||||||||||||||
| Investing activities: | ||||||||||||||||||||
| Proceeds from sales and prepayments of securities | 21 | 8 | 3 | |||||||||||||||||
| Purchases of securities | (1) | (1) | (10) | |||||||||||||||||
| (Investment in) return on subsidiary | (10) | 13 | 8 | |||||||||||||||||
| Proceeds from business divestitures, net | — | 22 | — | |||||||||||||||||
| Net cash provided by investing activities | 10 | 42 | 1 | |||||||||||||||||
| Financing activities: | ||||||||||||||||||||
| Proceeds from issuance of preferred stock | — | 494 | 145 | |||||||||||||||||
| Call of preferred stock | — | — | (100) | |||||||||||||||||
| Cash dividends paid - preferred stock | (32) | (32) | (33) | |||||||||||||||||
| Common stock: | ||||||||||||||||||||
| Stock options exercised | 5 | 36 | 28 | |||||||||||||||||
| Cash dividends paid | (335) | (324) | (333) | |||||||||||||||||
| Repurchase of shares | (10) | (13) | (416) | |||||||||||||||||
| Repayment of term borrowings | (450) | — | (120) | |||||||||||||||||
| Net cash provided by (used in) financing activities | (822) | 161 | (829) | |||||||||||||||||
| Net increase (decrease) in cash and cash equivalents | (480) | 611 | (103) | |||||||||||||||||
| Cash and cash equivalents at beginning of year | 1,335 | 724 | 827 | |||||||||||||||||
| Cash and cash equivalents at end of year | $ | 855 | $ | 1,335 | $ | 724 | ||||||||||||||
| Total interest paid | $ | 33 | $ | 35 | $ | 35 | ||||||||||||||
| Income taxes received from (paid to) subsidiaries | (46) | 42 | 28 | |||||||||||||||||
|
203 |
2023 FORM 10-K ANNUAL REPORT | ||||||
ITEM 9. ACCOUNTANTS, ITEM 9A. CONTROLS & PROCEDURES, ITEM 9B. OTHER INFO, AND ITEM 9C. FOREIGN INSPECTIONS | ||||||||
|
204 |
2023 FORM 10-K ANNUAL REPORT | ||||||
| ITEM 10. DIRECTORS & EXECUTIVE OFFICERS | ||||||||
| PART III | ||
|
205 |
2023 FORM 10-K ANNUAL REPORT | ||||||
| ITEM 10. DIRECTORS & EXECUTIVE OFFICERS | ||||||||
| Item 10 Topics | Responses or Incorporated Disclosures | ||||
| Directors and nominees for director of FHN, the Audit Committee of our Board of Directors, members of the Audit Committee, and Audit Committee financial experts | In our 2024 Proxy Statement: Independence & Categorical Standards, Committee Charters & Composition, Audit Committee, and Vote Item 1—Election of Directors (excluding the Audit Committee Report and the statements regarding the existence and location of the Audit Committee’s charter) |
||||
| Executive officers | In the Supplemental Part I Information following Item 4 of this report: Executive Officers of the Registrant, beginning on page 50
|
||||
| Compliance with Section 16(a) of the Securities Exchange Act of 1934 | not applicable | ||||
|
Harry V. Barton, Jr.
Age 69
CPA and Owner,
Barton Advisory Services, LLC,
an investment advisory firm
|
Velia Carboni
Age 53
Exec. Vice President and Chief Digital and Technology Officer,
VF Corporation, a provider of branded lifestyle apparel, footwear and accessories
|
John N. Casbon*
Age 75
Retired Executive Vice President,
First American Title Insurance Company,
a title insurance company
|
||||||||||||
|
John C. Compton
Age 62
Partner,
Clayton, Dubilier & Rice
a private equity firm
|
Wendy P. Davidson
Age 54
President and Chief Executive Officer
The Hain Celestial Group, Inc.,
an organic and natural products company
|
John W. Dietrich
Age 59
Executive Vice President and Chief Financial Officer, FedEx Corporation, a provider of transportation, e-commerce and business services
|
||||||||||||
|
William H. Fenstermaker*
Age 75
Chairman and CEO,
C.H. Fenstermaker and Associates, LLC, a surveying, mapping, engineering, and environmental consulting company
|
D. Bryan Jordan
Age 62
Chairman of the Board,
President and
Chief Executive Officer,
First Horizon Corporation,
a financial services company
|
J. Michael Kemp, Sr.
Age 53
Founder and Chief Executive Officer,
Kemp Management Solutions,
a program management and
consulting firm
|
||||||||||||
|
Rick E. Maples
Age 65
Retired Co-Head of Investment Banking,
Stifel, Nicolaus and Company, Incorporated,
a financial services company
|
Vicki R. Palmer
Age 70
President,
The Palmer Group, LLC
a general consulting firm
|
Colin V. Reed
Age 76
Executive Chairman,
Ryman Hospitality Properties, Inc.
a real estate investment trust
|
||||||||||||
|
Cecelia D. Stewart
Age 65
Retired President, U.S. Consumer & Commercial Banking,
Citigroup, Inc.
a financial services company
|
Rosa Sugrañes
Age 66
Founder and former
Chief Executive Officer,
Iberia Tiles,
a ceramic tile distributor
|
R. Eugene Taylor
Age 76
Retired Chairman of the Board and
Chief Executive Officer,
Capital Bank Financial Corp.,
a financial services company
|
||||||||||||
|
206 |
2023 FORM 10-K ANNUAL REPORT | ||||||
| ITEM 11. EXECUTIVE COMPENSATION | ||||||||
|
207 |
2023 FORM 10-K ANNUAL REPORT | ||||||
| ITEM 12. SECURITY OWNERSHIP & RELATED STOCKHOLDER MATTERS | ||||||||
|
208 |
2023 FORM 10-K ANNUAL REPORT | ||||||
ITEM 13. CERTAIN RELATIONSHIPS & RELATED TRANSACTIONS AND ITEM 14. PRINCIPAL ACCOUNTANT FEES & SERVICES | ||||||||
|
209 |
2023 FORM 10-K ANNUAL REPORT | ||||||
| ITEM 15. EXHIBITS & FINANCIAL STATEMENT SCHEDULES | ||||||||
| PART IV | ||
| Item 8 Page | Statement, Note, or Report Incorporated into Item 15 | ||||
| Report of Management on Internal Control over Financial Reporting | |||||
| Reports of Independent Registered Public Accounting Firm | |||||
Consolidated Balance Sheets as of December 31, 2023 and 2022 |
|||||
Consolidated Statements of Income for the years ended December 31, 2023, 2022, and 2021 |
|||||
Consolidated Statements of Comprehensive Income for the years ended December 31, 2023, 2022, and 2021 |
|||||
Consolidated Statements of Changes in Equity for the years ended December 31, 2023, 2022, and 2021 |
|||||
Consolidated Statements of Cash Flows for the years ended December 31, 2023, 2022, and 2021 |
|||||
| Notes to the Consolidated Financial Statements | |||||
|
210 |
2023 FORM 10-K ANNUAL REPORT | ||||||
| ITEM 15. EXHIBITS & FINANCIAL STATEMENT SCHEDULES | ||||||||
| Exh No | Description of Exhibit to this 10-K Report | Filed Here | Mngt Exh | Furn-ished | Incorporated by Reference to | ||||||||||||||||||
| Form | Exh No | Filing Date | |||||||||||||||||||||
| Corporate Exhibits | |||||||||||||||||||||||
| 3.1 | 8-K | 3.1 | 7/30/2021 | ||||||||||||||||||||
| 3.2 |
Articles of Amendment of the Restated Charter of FHN, related to the Series G Preferred Stock [all Series G stock was converted into common stock in 2023; none remains outstanding] |
8-K | 3.1 | 3/3/2022 | |||||||||||||||||||
| 3.3 | 8-K | 3.1 | 1/23/2024 | ||||||||||||||||||||
| 4.1 | 8-K | 4.1 | 7/2/2020 | ||||||||||||||||||||
| 4.2 | 8-K | 4.1 | 7/2/2020 | ||||||||||||||||||||
| 4.3 | 8-K | 4.2 | 7/2/2020 | ||||||||||||||||||||
| 4.4 | 8-K | 4.2 | 7/2/2020 | ||||||||||||||||||||
| 4.5 | 8-K | 4.3 | 7/2/2020 | ||||||||||||||||||||
| 4.6 | 8-K | 4.3 | 7/2/2020 | ||||||||||||||||||||
| 4.7 | 8-K | 4.1 | 5/28/2020 | ||||||||||||||||||||
| 4.8 | 8-K | 4.2 | 5/28/2020 | ||||||||||||||||||||
| 4.9 | 8-K | 4.1 | 5/28/2020 | ||||||||||||||||||||
| 4.10 | 8-K | 4.1 | 5/03/2021 | ||||||||||||||||||||
| 4.11 | 8-K | 4.2 | 5/03/2021 | ||||||||||||||||||||
| 4.12 | 8-K | 4.1 | 5/03/2021 | ||||||||||||||||||||
| 4.13 | 10-Q 2Q21 | 4.4 | 8/5/2021 | ||||||||||||||||||||
| 4.14 | FHN agrees to furnish to the Securities and Exchange Commission upon request a copy of each instrument defining the rights of the holders of the senior and subordinated long-term debt of FHN and its consolidated subsidiaries | ||||||||||||||||||||||
| Equity-Based Award Plans | |||||||||||||||||||||||
| 10.1 (a) | X | X | |||||||||||||||||||||
| 10.1 (b) | X | Proxy 2016 | App. A | 3/14/2016 | |||||||||||||||||||
| 10.1 (c) | X | 10-K 2020 | 10.1(b) | 2/25/2021 | |||||||||||||||||||
| 10.1 (d) | X | 10-K 2020 | 10.1(c) | 2/25/2021 | |||||||||||||||||||
|
211 |
2023 FORM 10-K ANNUAL REPORT | ||||||
| ITEM 15. EXHIBITS & FINANCIAL STATEMENT SCHEDULES | ||||||||
| Exh No | Description of Exhibit to this 10-K Report | Filed Here | Mngt Exh | Furn-ished | Incorporated by Reference to | ||||||||||||||||||
| Form | Exh No | Filing Date | |||||||||||||||||||||
| 10.1 (e) | X | 10-Q 2Q09 | 10.1(e) | 8/6/2009 | |||||||||||||||||||
| Performance-Based Equity Award Documents | |||||||||||||||||||||||
| 10.2 (a) | X | 10-Q 1Q21 | 10.1 | 5/6/2021 | |||||||||||||||||||
| 10.2 (b) | X | 10-Q 1Q22 | 10.1 | 5/6/2022 | |||||||||||||||||||
| 10.2 (c) | X | 10-K 2022 | 10.2(e) | 3/1/2023 | |||||||||||||||||||
| 10.2 (d) | X | 8-K | 10.3 | 8/4/2023 | |||||||||||||||||||
| 10.2 (e) | X | X | |||||||||||||||||||||
| 10.2 (f) | X | X | |||||||||||||||||||||
| Stock Option Award Documents | |||||||||||||||||||||||
| 10.3 (a) | X | 10-Q 1Q17 | 10.2 | 5/8/2017 | |||||||||||||||||||
| 10.3 (b) | X | 10-Q 1Q18 | 10.2 | 5/8/2018 | |||||||||||||||||||
| 10.3 (c) | X | 10-Q 1Q19 | 10.2 | 5/8/2019 | |||||||||||||||||||
| 10.3 (d) | X | 10-Q 1Q20 | 10.2 | 5/8/2020 | |||||||||||||||||||
| 10.3 (e) | X | 10-K 2020 | 10.3(l) | 2/25/2021 | |||||||||||||||||||
| Other Equity-Based Award Documents | |||||||||||||||||||||||
| 10.4 (a) | X | 10-Q 1Q21 | 10.2 | 5/6/2021 | |||||||||||||||||||
| 10.4 (b) | X | 10-Q 1Q21 | 10.3 | 5/6/2021 | |||||||||||||||||||
| 10.4 (c) | X | 10-Q 1Q22 | 10.2 | 5/6/2022 | |||||||||||||||||||
| 10.4 (d) | X | 10-K 2022 | 10.4(e) | 3/1/2023 | |||||||||||||||||||
| 10.4 (e) | X | X | |||||||||||||||||||||
| 10.4 (f) | X | X | |||||||||||||||||||||
| 10.4 (g) | X | 8-K | 10.4 | 8/4/2023 | |||||||||||||||||||
| 10.4 (h) | X | X | |||||||||||||||||||||
| 10.4 (i) | X | X | |||||||||||||||||||||
| Management Cash Incentive Plan Documents | |||||||||||||||||||||||
| 10.5 (a) | X | 8-K | 10.1 | 10/27/2021 | |||||||||||||||||||
| Other Exhibits relating to Employment, Retirement, Severance, or Separation | |||||||||||||||||||||||
| 10.6 (e) | X | 8-K | 10.1 | 1/29/2021 | |||||||||||||||||||
| 10.6 (f) | X | 10-Q 3Q07 | 10.7(e) | 11/7/2007 | |||||||||||||||||||
|
212 |
2023 FORM 10-K ANNUAL REPORT | ||||||
| ITEM 15. EXHIBITS & FINANCIAL STATEMENT SCHEDULES | ||||||||
| Exh No | Description of Exhibit to this 10-K Report | Filed Here | Mngt Exh | Furn-ished | Incorporated by Reference to | ||||||||||||||||||
| Form | Exh No | Filing Date | |||||||||||||||||||||
| 10.6 (g) | X | 10-K 2009 | 10.7(d2) | 2/26/2010 | |||||||||||||||||||
| 10.6 (h) | X | 10-Q 3Q11 | 10.2 | 11/8/2011 | |||||||||||||||||||
| 10.6 (i) | X | 8-K | 10.1 | 7/17/2012 | |||||||||||||||||||
| 10.6 (j) |
X | 8-K | 10.2 | 8/4/2023 | |||||||||||||||||||
| 10.6 (k) | X | 8-K | 10.1 | 7/2/2020 | |||||||||||||||||||
| Documents Related to Other Deferral Plans and Programs | |||||||||||||||||||||||
| 10.7 (a) | X | 10-Q 2Q17 | 10.4 | 8/8/2017 | |||||||||||||||||||
| 10.7 (b) | X | 10-Q 3Q07 | 10.1(a3) | 11/7/2007 | |||||||||||||||||||
| 10.7 (c) | X | 10-Q 3Q23 | 10.1 | 11/7/2023 | |||||||||||||||||||
| 10.7 (d) | X | 10-K 2018 | 10.7(d) | 2/28/2019 | |||||||||||||||||||
| 10.7 (e) |
Form of First Horizon National Corporation Deferred Compensation Plan as Amended and Restated [formerly known as First Tennessee National Corporation Nonqualified Deferred Compensation Plan] |
X | 10-Q 3Q07 | 10.1(c) | 11/7/2007 | ||||||||||||||||||
| 10.7 (f) |
Conformed copy of Amendment No. 1 to the First Horizon National Corporation Deferred Compensation Plan [removing "National" from the plan name] |
X | S-8 333- 273513 |
4.5 | 7/28/2023 | ||||||||||||||||||
| 10.7 (g) | X | 8-K | 10(z) | 1/3/2005 | |||||||||||||||||||
| Other Exhibits related to Management or Directors | |||||||||||||||||||||||
| 10.8 (a) | X | 10-Q 3Q06 | 10.8 | 11/8/2006 | |||||||||||||||||||
| 10.8 (b) | X | 10-K 2020 | 10.8(b) | 2/25/2021 | |||||||||||||||||||
| 10.8 (c) | X | 10-Q 2Q17 | 10.2 | 8/8/2017 | |||||||||||||||||||
| 10.8 (d) | X | 10-Q 2Q17 | 10.3 | 8/8/2017 | |||||||||||||||||||
| 10.8 (e) | X | 8-K | 10.4 | 4/28/2008 | |||||||||||||||||||
| 10.8 (f) | X | 8-K | 10.5 | 4/28/2008 | |||||||||||||||||||
| 10.8 (g) | X | X | |||||||||||||||||||||
| 10.8 (h) | X | X | |||||||||||||||||||||
| Other Exhibits | |||||||||||||||||||||||
| 14 | 10-K 2022 | 14 | 3/1/2023 | ||||||||||||||||||||
| 19.1 | 10-Q 2Q23 | 19.1 | 8/4/2023 | ||||||||||||||||||||
|
213 |
2023 FORM 10-K ANNUAL REPORT | ||||||
| ITEM 15. EXHIBITS & FINANCIAL STATEMENT SCHEDULES | ||||||||
| Exh No | Description of Exhibit to this 10-K Report | Filed Here | Mngt Exh | Furn-ished | Incorporated by Reference to | ||||||||||||||||||
| Form | Exh No | Filing Date | |||||||||||||||||||||
| 19.2 | 10-Q 2Q23 | 19.2 | 8/4/2023 | ||||||||||||||||||||
| 21 | X | ||||||||||||||||||||||
| 23 | X | ||||||||||||||||||||||
| 24 | X | ||||||||||||||||||||||
| 31(a) | X | ||||||||||||||||||||||
| 31(b) | X | ||||||||||||||||||||||
| 32(a) | X | X | |||||||||||||||||||||
| 32(b) | X | X | |||||||||||||||||||||
| 97 | X | ||||||||||||||||||||||
| XBRL Exhibits | |||||||||||||||||||||||
| 101 |
The following financial information from First Horizon Corporation’s Annual Report on Form 10-K for the year ended December 31, 2023, formatted in Inline XBRL:
(i) Consolidated Balance Sheets at December 31, 2023 and 2022;
(ii) Consolidated Statements of Income for the Years Ended December 31, 2023, 2022, and 2021;
(iii) Consolidated Statements of Comprehensive Income for the Years Ended December 31, 2023, 2022, and 2021;
(iv) Consolidated Statements of Changes in Equity for the Years Ended December 31, 2023, 2022, and 2021;
(v) Consolidated Statements of Cash Flows for the Years Ended December 31, 2023, 2022, and 2021; and
(vi) Notes to the Consolidated Financial Statements.
|
X | |||||||||||||||||||||
| 101. INS | XBRL Instance Document-the instance document does not appear in the Interactive Data File because its XBRL tags are embedded within the Inline XBRL document | X | |||||||||||||||||||||
| 101. SCH | Inline XBRL Taxonomy Extension Schema | X | |||||||||||||||||||||
| 101. CAL | Inline XBRL Taxonomy Extension Calculation Linkbase | X | |||||||||||||||||||||
| 101. DEF | Inline XBRL Taxonomy Extension Definition Linkbase | X | |||||||||||||||||||||
| 101. LAB | Inline XBRL Taxonomy Extension Label Linkbase | X | |||||||||||||||||||||
| 101. PRE | Inline XBRL Taxonomy Extension Presentation Linkbase | X | |||||||||||||||||||||
| 104 | Cover Page Interactive Data File, formatted in Inline XBRL (included in Exhibit 101) | X | |||||||||||||||||||||
|
214 |
2023 FORM 10-K ANNUAL REPORT | ||||||
| SIGNATURES | ||||||||
| FIRST HORIZON CORPORATION | ||||||||||||||
Date: February 22, 2024 |
By: | /s/ Hope Dmuchowski |
||||||||||||
| Name: | Hope Dmuchowski |
|||||||||||||
| Title: | Senior Executive Vice President and Chief Financial Officer | |||||||||||||
| (Duly Authorized Officer and Principal Financial Officer) | ||||||||||||||
| Signature* | Title | Date* | Signature* | Title | Date* | |||||||||||||||
|
D. Bryan Jordan
D. Bryan Jordan
|
President, Chief Executive Officer, Chairman of the Board, and a Director (principal executive officer) |
* |
Hope Dmuchowski
Hope Dmuchowski
|
Senior Executive Vice President and Chief Financial Officer
(principal financial officer)
|
* | |||||||||||||||
|
Jeff L. Fleming
Jeff L. Fleming
|
Executive Vice President and Chief Accounting Officer (principal accounting officer) |
* |
Harry V. Barton, Jr.
Harry V. Barton, Jr.
|
Director | * | |||||||||||||||
|
Velia Carboni
Velia Carboni
|
Director | * |
John N. Casbon
John N. Casbon
|
Director | * | |||||||||||||||
|
John C. Compton
John C. Compton
|
Director | * |
Wendy P. Davidson
Wendy P. Davidson
|
Director | * | |||||||||||||||
|
John W. Dietrich
John W. Dietrich
|
Director | * |
William H. Fenstermaker
William H. Fenstermaker
|
Director | * | |||||||||||||||
|
J. Michael Kemp, Sr.
J. Michael Kemp, Sr.
|
Director | * |
Rick E. Maples
Rick E. Maples
|
Director | * | |||||||||||||||
|
Vicki R. Palmer
Vicki R. Palmer
|
Director | * |
Colin V. Reed
Colin V. Reed
|
Director | * | |||||||||||||||
|
Cecelia D. Stewart
Cecelia D. Stewart
|
Director | * |
Rosa Sugrañes
Rosa Sugrañes
|
Director | * | |||||||||||||||
|
R. Eugene Taylor
R. Eugene Taylor
|
Director | * | ||||||||||||||||||
*By: /s/ Clyde A. Billings, Jr. |
February 22, 2024 |
|||||||||||||
Clyde A. Billings, Jr. |
||||||||||||||
As Attorney-in-Fact |
||||||||||||||
|
215 |
2023 FORM 10-K ANNUAL REPORT | ||||||
FIRST HORIZON CORPORATION | ||
2021 INCENTIVE PLAN | ||
| Section 1. Purposes | ||||||||||||||
| Section 2. Administration | ||||||||||||||
 |
1 |
2021 INCENTIVE PLAN | ||||||
| Section 3. Shares Available for Awards; Other Limitations | ||||||||||||||
|
2 |
2021 INCENTIVE PLAN | ||||||
|
3 |
2021 INCENTIVE PLAN | ||||||
| Section 4. Eligibility | ||||||||||||||
| Section 5. Stock Options and Stock Appreciation Rights | ||||||||||||||
|
4 |
2021 INCENTIVE PLAN | ||||||
|
5 |
2021 INCENTIVE PLAN | ||||||
| Section 6. Restricted Stock, Restricted Stock Units, & Restricted Cash Units | ||||||||||||||
|
6 |
2021 INCENTIVE PLAN | ||||||
|
7 |
2021 INCENTIVE PLAN | ||||||
| Section 7. Non-Employee Director Awards | ||||||||||||||
| Section 8. Performance Awards | ||||||||||||||
|
8 |
2021 INCENTIVE PLAN | ||||||
| Section 9. Minimum Vesting Periods | ||||||||||||||
|
9 |
2021 INCENTIVE PLAN | ||||||
| Section 10. Shares in Lieu of Cash Earned | ||||||||||||||
|
10 |
2021 INCENTIVE PLAN | ||||||
| Section 11. Annual Incentives | ||||||||||||||
| Section 12. Transferability of Awards | ||||||||||||||
|
11 |
2021 INCENTIVE PLAN | ||||||
| Section 13. Termination of Service, Forfeiture, and Clawback | ||||||||||||||
|
12 |
2021 INCENTIVE PLAN | ||||||
|
13 |
2021 INCENTIVE PLAN | ||||||
|
14 |
2021 INCENTIVE PLAN | ||||||
| Section 14. Effects of Change in Control | ||||||||||||||
|
15 |
2021 INCENTIVE PLAN | ||||||
|
16 |
2021 INCENTIVE PLAN | ||||||
| Section 15. Tax Matters | ||||||||||||||
|
17 |
2021 INCENTIVE PLAN | ||||||
| Section 16. Inception, Termination, Suspension, and Amendment | ||||||||||||||
|
18 |
2021 INCENTIVE PLAN | ||||||
| Section 17. Technical & Miscellaneous Matters | ||||||||||||||
|
19 |
2021 INCENTIVE PLAN | ||||||
|
20 |
2021 INCENTIVE PLAN | ||||||
| Section 18. Definitions | ||||||||||||||
|
21 |
2021 INCENTIVE PLAN | ||||||
|
22 |
2021 INCENTIVE PLAN | ||||||
|
23 |
2021 INCENTIVE PLAN | ||||||
|
24 |
2021 INCENTIVE PLAN | ||||||
|
25 |
2021 INCENTIVE PLAN | ||||||
|
26 |
2021 INCENTIVE PLAN | ||||||
|
27 |
2021 INCENTIVE PLAN | ||||||
|
28 |
2021 INCENTIVE PLAN | ||||||
|
29 |
2021 INCENTIVE PLAN | ||||||
|
30 |
2021 INCENTIVE PLAN | ||||||
GRANT NOTICE | ||
Performance Stock Units—ROTCE/TSR Rank | ||
| Grant Date: | __________ __, 2024 | Governing Plan: | 2021 Incentive Plan | ||||||||
| Target Number of PSUs Granted: | ROTCE Performance Period: | Three-year period 2024 thru 2026 | |||||||||
| Vesting Date: | May 12, 2027 |
TSR Start Date: | First trading day of 2024 | ||||||||
| TSR End Date: | Last trading day of 2026 | ||||||||||
 |
1 |
2024 GRANT NOTICE EXECUTIVE PSUs |
||||||
|
2 |
2024 GRANT NOTICE EXECUTIVE PSUs |
||||||
|
3 |
2024 GRANT NOTICE EXECUTIVE PSUs |
||||||
GRANT NOTICE | ||
Special Performance Stock Units—ROTCE/TSR Rank | ||
| Grant Date: | __________ __, 2024 | Governing Plan: | 2021 Incentive Plan | ||||||||
| Target Number of PSUs Granted: | ROTCE Performance Period: | Five-year period 2024 thru 2028 | |||||||||
| Vesting Date: | May 12, 2029 |
TSR Start Date: | First trading day of 2024 | ||||||||
| TSR End Date: | Last trading day of 2028 | ||||||||||
 |
1 |
2024 GRANT NOTICE EXECUTIVE SPSUs |
||||||
|
2 |
2024 GRANT NOTICE EXECUTIVE SPSUs |
||||||
|
3 |
2024 GRANT NOTICE EXECUTIVE SPSUs |
||||||
GRANT NOTICE | ||
Executive RSUs | ||
| Amount of Award: | ______ Restricted Stock Units | Grant Date: | _________ ___, 2024 | ||||||||
| Governing Plan: | 2021 Incentive Plan | Vesting Date: | March 2, 2027 | ||||||||
 |
1 |
2024 GRANT NOTICE EXECUTIVE RSUs |
||||||
|
2 |
2024 GRANT NOTICE EXECUTIVE RSUs |
||||||
GRANT NOTICE | ||
Executive Special RSUs | ||
| Amount of Award: | ______ Restricted Stock Units | Grant Date: | _________ ___, 2024 | ||||||||
| Governing Plan: | 2021 Incentive Plan | Vesting Date: | March 2, 2029 | ||||||||
 |
1 |
2024 GRANT NOTICE EXECUTIVE SRSUs |
||||||
|
2 |
2024 GRANT NOTICE EXECUTIVE SRSUs |
||||||
GRANT NOTICE | ||
Restricted Cash Units (Modified Retention Program, Cliff Vesting) | ||
| Amount of Award: | ______ RCUs ($1 per Unit) | Grant Date: | May 6, 2023 | ||||||||
| Governing Plan: | 2021 Incentive Plan | Vesting Date: | May 12, 2026 | ||||||||
| Base Price: | $______ / share (20-day average closing price May 4 thru June 1, 2023)(refer to “Performance Feature” on p.2) | ||||||||||
 |
1 |
2023 GRANT NOTICE RRCUs w/ Performance Feature (Cliff V.) |
||||||
|
2 |
2023 GRANT NOTICE RRCUs w/ Performance Feature (Cliff V.) |
||||||
| BOARD APPROVED POLICY | ||
| Base Retainer: | $80,000 cash annually | ||||
| $122,000 RSUs annually | |||||
| Additional retainers: | Annual cash amounts: | ||||
| Lead director | $50,000 | ||||
| Outside Chairman of the Board* | $125,000 | ||||
| Chair of Audit Committee | $32,000 | ||||
| Chair of Executive Committee & Risk Committee | $50,000 | ||||
| Chair of other committees | $20,000 | ||||
| Non-chair service on Audit | $10,000 | ||||
| Non-chair service on Executive Committee & Risk Committee | $10,000 | ||||
| EXHIBIT 10.8(g) | ||||||||
| Certain Executive Benefits | ||||||||
 |
2023 FORM 10-K ANNUAL REPORT | |||||||
| EXHIBIT 10.8(h) | ||||||||
| NEO Salaries 2024 | ||||||||
| Officer Name | Salary Rate | ||||||||||
D. Bryan Jordan |
1,200,000 | ||||||||||
| Hope Dmuchowski | 650,000 | ||||||||||
| Anthony J. Restel | 725,000 | ||||||||||
| David T. Popwell | 725,000 | ||||||||||
| Tammy S. LoCascio | 725,000 | ||||||||||
 |
1 |
2023 FORM 10-K ANNUAL REPORT | ||||||
| EXHIBIT 21 | ||||||||
| Subsidiaries | ||||||||
| Entity | Type of Ownership | Jurisdiction of Incorporation or Organization | ||||||
First Horizon Bank (1) (Bank subsidiaries are scheduled separately) |
Direct | Tennessee | ||||||
| CB Trustee, LLC | Direct | North Carolina | ||||||
| First Horizon Community Development Fund, LLC | Direct | Tennessee | ||||||
| First Horizon Ventures, Inc. | Direct | Tennessee | ||||||
| IBERIA Asset Management Inc. | Direct | Louisiana | ||||||
| IBERIA CDE, LLC | Direct | Louisiana | ||||||
| LIBERTY BANCORP DENNING, LLC | Direct | Florida | ||||||
| 840 Denning LLC | Indirect | Florida | ||||||
| Martin & Company, Inc. | Direct | Tennessee | ||||||
| Subsidiary of the Bank | Type of Ownership by the Bank | Jurisdiction of Incorporation or Organization | ||||||
| Acadiana Holdings, LLC | Direct | Louisiana | ||||||
| C1 Trustee, Inc. | Direct | North Carolina | ||||||
| Capital Financial Leasing, LLC | Direct | Delaware | ||||||
FHIS, Inc. FS |
Direct | Tennessee | ||||||
| FHN Advisory Services, LLC | Direct | Nevada | ||||||
| FHN Financial Capital Assets Corp. | Direct | Tennessee | ||||||
FHN Financial Securities Corp. FS |
Direct | Tennessee | ||||||
First Horizon Advisors, Inc. FS |
Direct | Tennessee | ||||||
| First Horizon Asset Securities, Inc. | Direct | Delaware | ||||||
| First Horizon CDE 1, LLC | Direct | Tennessee | ||||||
| First Horizon CDE 2, LLC | Direct | Tennessee | ||||||
| First Horizon CDE 3, LLC | Direct | Tennessee | ||||||
| First Horizon Community Development Enterprises, LLC | Direct | Tennessee | ||||||
 |
1 |
2023 FORM 10-K ANNUAL REPORT | ||||||
| EXHIBIT 21 | ||||||||
| Subsidiaries | ||||||||
| Subsidiary of the Bank | Type of Ownership by the Bank | Jurisdiction of Incorporation or Organization | ||||||
| First Horizon Community Investment Group, Inc. | Direct | Tennessee | ||||||
| CC Community Development Holdings, Inc. | Indirect | Tennessee | ||||||
| FHCIG Second Harvest Investment Fund, LLC | Indirect | Tennessee | ||||||
| FHCIG Our House Investment Fund, LLC | Indirect | Tennessee | ||||||
| FHCIG GoTextbooks Investment Fund, LLC | Indirect | Tennessee | ||||||
First Horizon Insurance Agency, Inc FS |
Direct | Georgia | ||||||
First Horizon Insurance Services, Inc FS |
Direct | Tennessee | ||||||
| First Tennessee New Markets Corporation | Direct | Tennessee | ||||||
| FT Building, LLC | Direct | Tennessee | ||||||
| FT Leasing, Inc. | Direct | Tennessee | ||||||
| FTB QOF I, Inc. | Direct | Tennessee | ||||||
| FTB QOF II, Inc. | Direct | Tennessee | ||||||
| FTB QOF III, Inc. | Direct | Tennessee | ||||||
| FTB QOF IV, Inc. | Direct | Tennessee | ||||||
| FTRE Holding, LLC | Direct | Delaware | ||||||
| First Horizon TE1, LLC | Indirect | Delaware | ||||||
| First Horizon Preferred Funding III, Inc. | Indirect | Delaware | ||||||
| First Horizon Preferred Funding IV, Inc. | Indirect | Maryland | ||||||
| FTB Securities Investment II, LLC | Indirect | Delaware | ||||||
| FT Real Estate Securities Company, Inc. | Indirect | Delaware | ||||||
| IB SPE Management, Inc. | Direct | Delaware | ||||||
| IBERIA Civic Impact Partners LLC | Direct | Louisiana | ||||||
| IBERIA Collage Impact Fund, LLC | Indirect | Louisiana | ||||||
| IBERIA NOCHI Impact Fund I, LLC | Indirect | Louisiana | ||||||
| IBERIA NOCHI Impact Fund II, LLC | Indirect | Louisiana | ||||||
| IBERIA Plush Mill Impact Fund, LLC | Indirect | Louisiana | ||||||
| IBERIA VCOM Impact Fund, LLC | Indirect | Louisiana | ||||||
| Iberia Corporate Asset Finance, LLC | Direct | Alabama | ||||||
| Iberia Financial Services, LLC | Direct | Louisiana | ||||||
| IBERIA INVESTMENT FUND I, LLC | Direct | Louisiana | ||||||
| IBERIA CommCare Impact Fund LLC | Indirect | Louisiana | ||||||
| JPO, Inc. | Direct | Tennessee | ||||||
| Mercantile Capital Corporation | Direct | Florida | ||||||
|
2 |
2023 FORM 10-K ANNUAL REPORT | ||||||
| EXHIBIT 21 | ||||||||
| Subsidiaries | ||||||||
| Name | Jurisdiction of Incorporation or Organization | ||||
| Capital Bank Statutory Trust III | Connecticut | ||||
| Civitas Statutory Trust I | Delaware | ||||
| FNB United Statutory Trust I | Connecticut | ||||
| FNB United Statutory Trust II | Delaware | ||||
| GreenBank Capital Trust I | Delaware | ||||
| Greene County Capital Trust II | Delaware | ||||
| Southern Community Capital Trust III | Delaware | ||||
| TIBFL Statutory Trust III | Delaware | ||||
|
3 |
2023 FORM 10-K ANNUAL REPORT | ||||||

| EXHIBIT 24 | ||||||||
| Power of Attorney | ||||||||
| SIGNATURE | TITLE | DATE | ||||||
/s/ D. Bryan Jordan |
Chairman of the Board, President, and Chief Executive
Officer and Director
(principal executive officer)
|
February 22, 2024 |
||||||
D. Bryan Jordan | ||||||||
/s/ Hope Dmuchowski |
Senior Executive Vice President and Chief Financial Officer
(principal financial officer)
|
February 22, 2024 |
||||||
| Hope Dmuchowski | ||||||||
/s/ Jeff L. Fleming |
Executive Vice President and Chief Accounting Officer
(principal accounting officer)
|
February 22, 2024 |
||||||
Jeff L. Fleming | ||||||||
/s/ Harry V. Barton, Jr. |
Director | February 22, 2024 |
||||||
Harry V. Barton, Jr. | ||||||||
/s/ Velia Carboni |
Director | February 22, 2024 |
||||||
Velia Carboni | ||||||||
/s/ John N. Casbon |
Director | February 22, 2024 |
||||||
John N. Casbon | ||||||||
/s/ John C. Compton |
Director | February 22, 2024 |
||||||
John C. Compton | ||||||||
/s/ Wendy P. Davidson |
Director | February 22, 2024 |
||||||
Wendy P. Davidson | ||||||||
/s/ John W. Dietrich |
Director | February 22, 2024 |
||||||
John W. Dietrich | ||||||||
 |
1 |
2023 FORM 10-K ANNUAL REPORT | ||||||
| EXHIBIT 24 | ||||||||
| Power of Attorney | ||||||||
| SIGNATURE | TITLE | DATE | ||||||
/s/ William H. Fenstermaker |
Director | February 22, 2024 |
||||||
William H. Fenstermaker | ||||||||
/s/ J. Michael Kemp, Sr. |
Director | February 22, 2024 |
||||||
J. Michael Kemp, Sr. | ||||||||
/s/ Rick E. Maples |
Director | February 22, 2024 |
||||||
Rick E. Maples | ||||||||
/s/ Vicki R. Palmer |
Director | February 22, 2024 |
||||||
Vicki R. Palmer | ||||||||
/s/ Colin V. Reed |
Director | February 22, 2024 |
||||||
Colin V. Reed | ||||||||
/s/ Cecelia D. Stewart |
Director | February 22, 2024 |
||||||
Cecelia D. Stewart | ||||||||
/s/ Rosa Sugrañes |
Director | February 22, 2024 |
||||||
Rosa Sugrañes | ||||||||
/s/ R. Eugene Taylor |
Director | February 22, 2024 |
||||||
R. Eugene Taylor | ||||||||
|
2 |
2023 FORM 10-K ANNUAL REPORT | ||||||
| BOARD APPROVED POLICY | ||