| Delaware | 41-0255900 | ||||
| (State or other jurisdiction of incorporation) | (I.R.S. Employer Identification Number) | ||||
| Title of each class |
Trading
symbol
|
Name of each exchange
on which registered
|
||||||
| Common Stock, $.01 par value per share | USB | New York Stock Exchange | ||||||
| Depositary Shares (each representing 1/100th interest in a share of Series A Non-Cumulative Perpetual Preferred Stock, par value $1.00) | USB PrA | New York Stock Exchange | ||||||
| Depositary Shares (each representing 1/1,000th interest in a share of Series B Non-Cumulative Perpetual Preferred Stock, par value $1.00) | USB PrH | New York Stock Exchange | ||||||
| Depositary Shares (each representing 1/1,000th interest in a share of Series K Non-Cumulative Perpetual Preferred Stock, par value $1.00) | USB PrP | New York Stock Exchange | ||||||
| Depositary Shares (each representing 1/1,000th interest in a share of Series L Non-Cumulative Perpetual Preferred Stock, par value $1.00) | USB PrQ | New York Stock Exchange | ||||||
| Depositary Shares (each representing 1/1,000th interest in a share of Series M Non-Cumulative Perpetual Preferred Stock, par value $1.00) | USB PrR | New York Stock Exchange | ||||||
| Depositary Shares (each representing 1/1,000th interest in a share of Series O Non-Cumulative Perpetual Preferred Stock, par value $1.00) | USB PrS | New York Stock Exchange | ||||||
| Floating Rate Notes, Series CC (Senior), due May 21, 2028 | USB/28 | New York Stock Exchange | ||||||
| 4.009% Fixed-to-Floating Rate Notes, Series CC (Senior), due May 21, 2032 | USB/32 | New York Stock Exchange | ||||||
| 99.1 | ||||||||
| 104 | Cover Page Interactive Data File (embedded within the Inline XBRL document) | |||||||
| U.S. BANCORP | ||
| By /s/ Lisa R. Stark | ||
| Lisa R. Stark | ||
|
Executive Vice President and
Controller
| ||

3Q24 Key Financial Data |
3Q24 Highlights |
|||||||||||||||||||
| PROFITABILITY METRICS | 3Q24 | 2Q24 | 3Q23 |
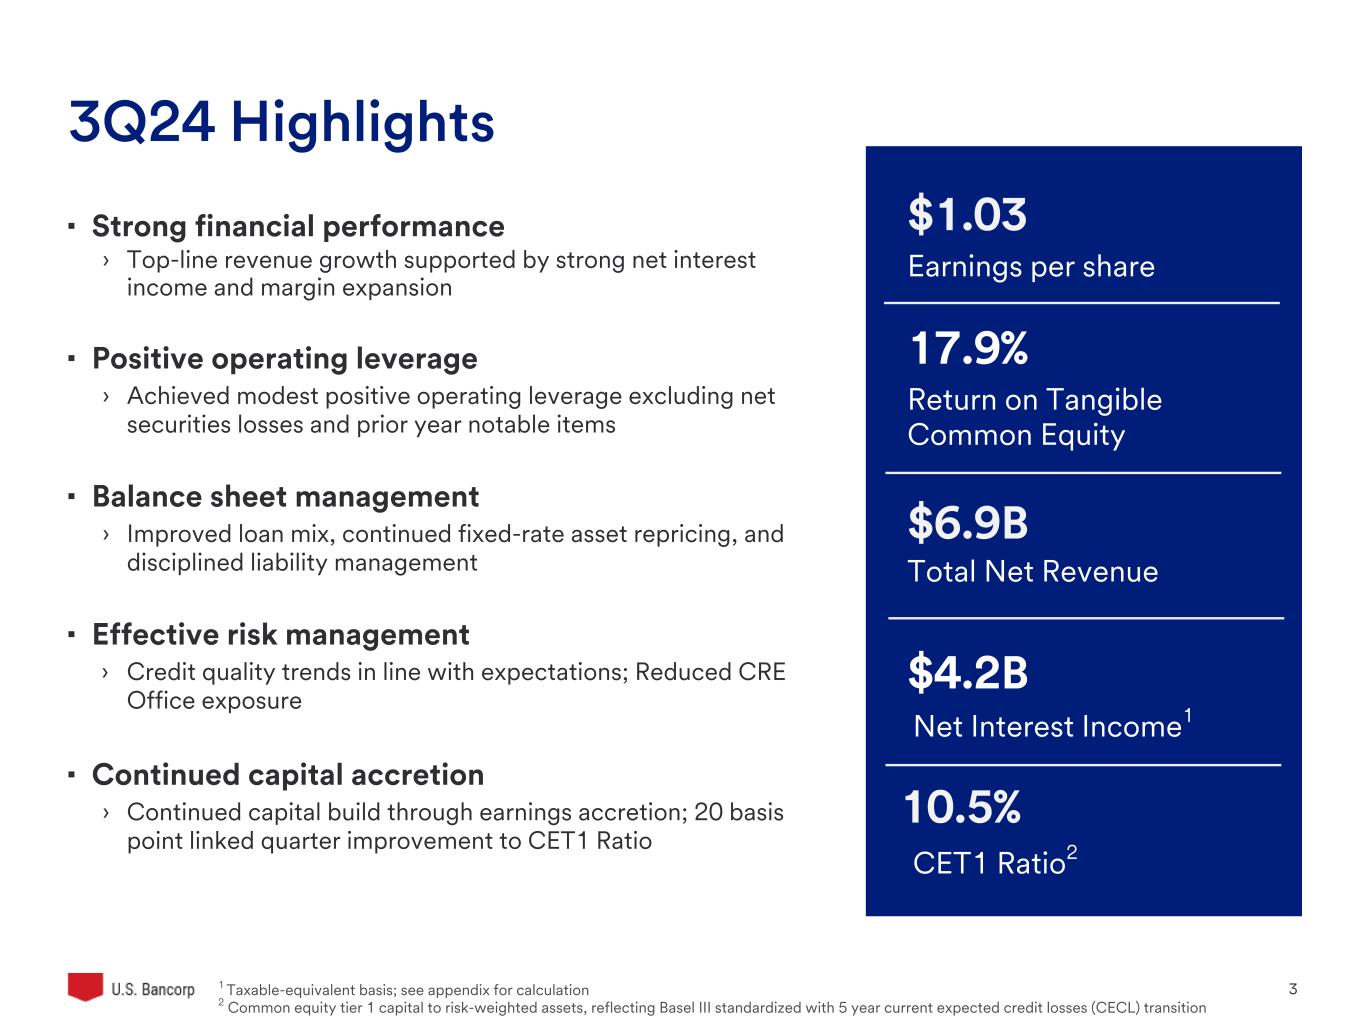
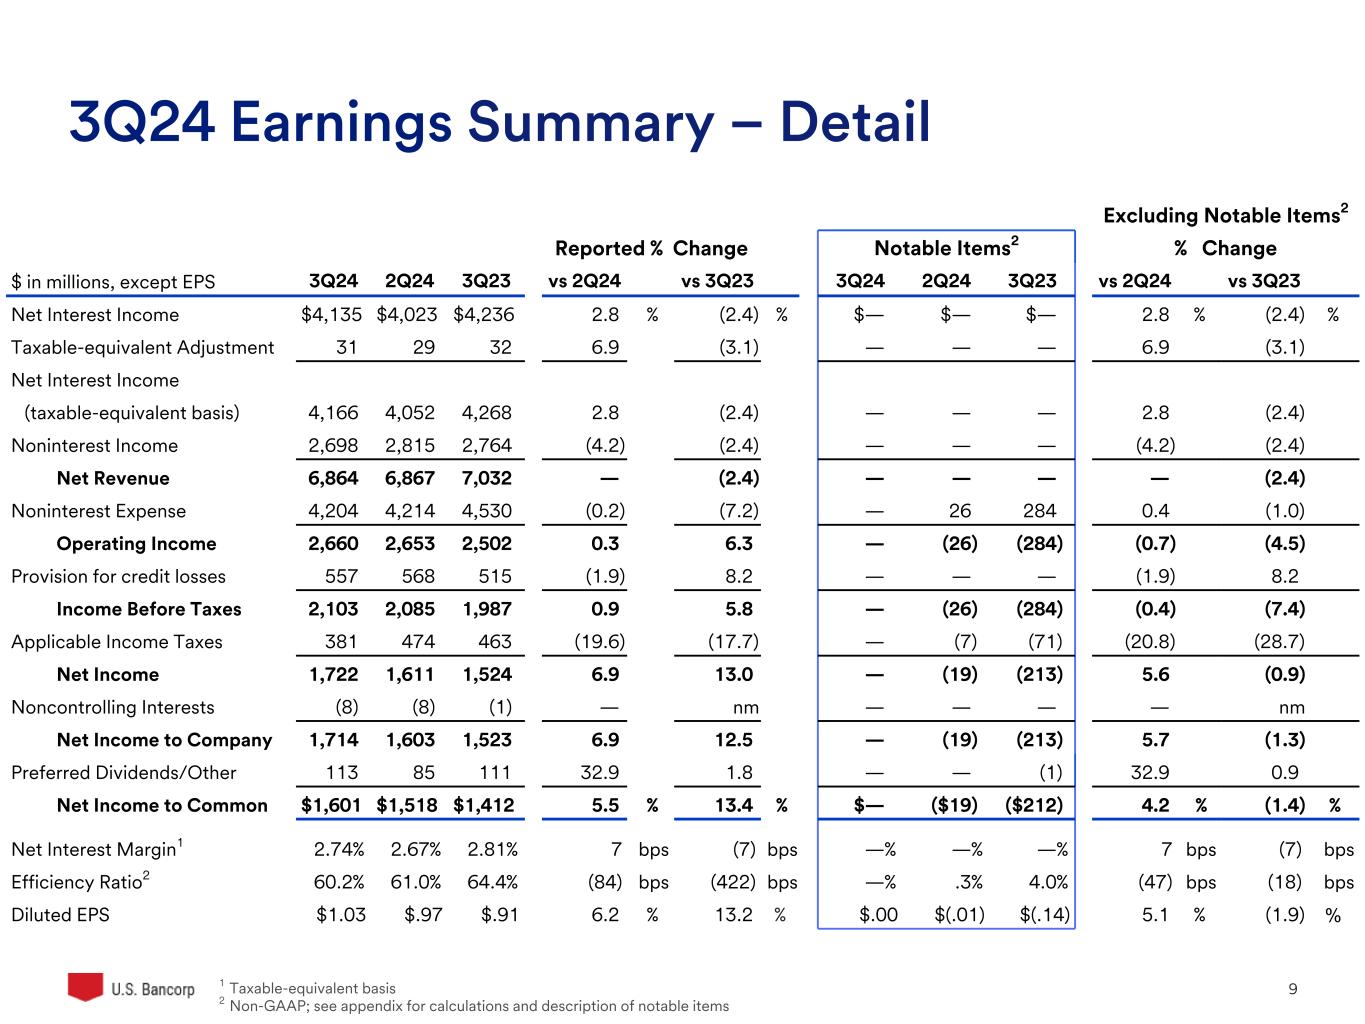
•Net income of $1,714 million and diluted earnings per common share of $1.03. Results included an $89 million after-tax net securities loss largely offset by lower income tax expense
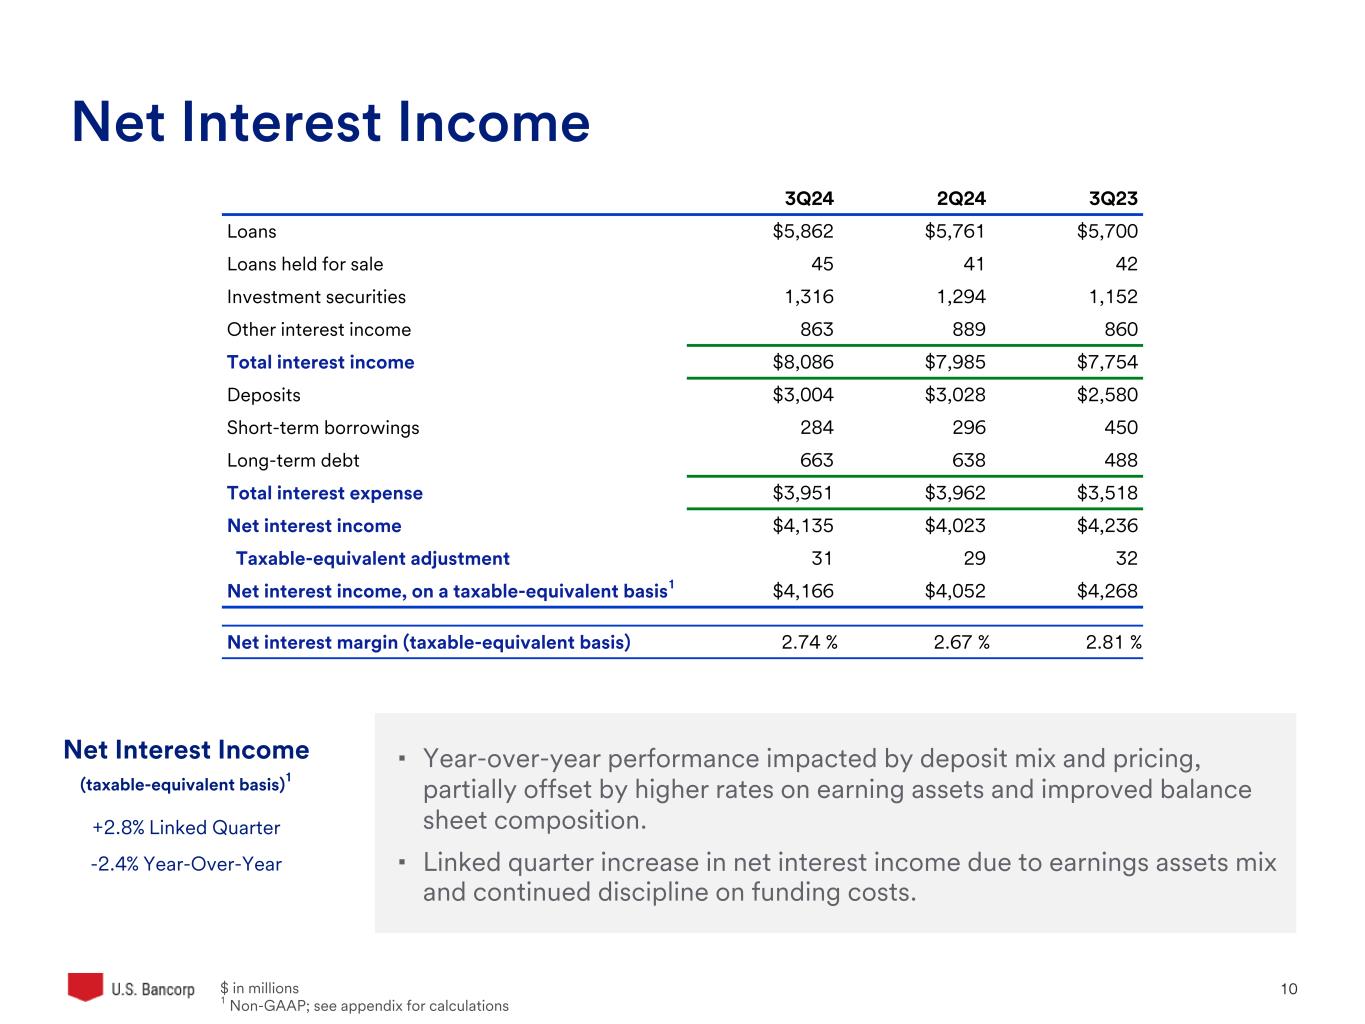
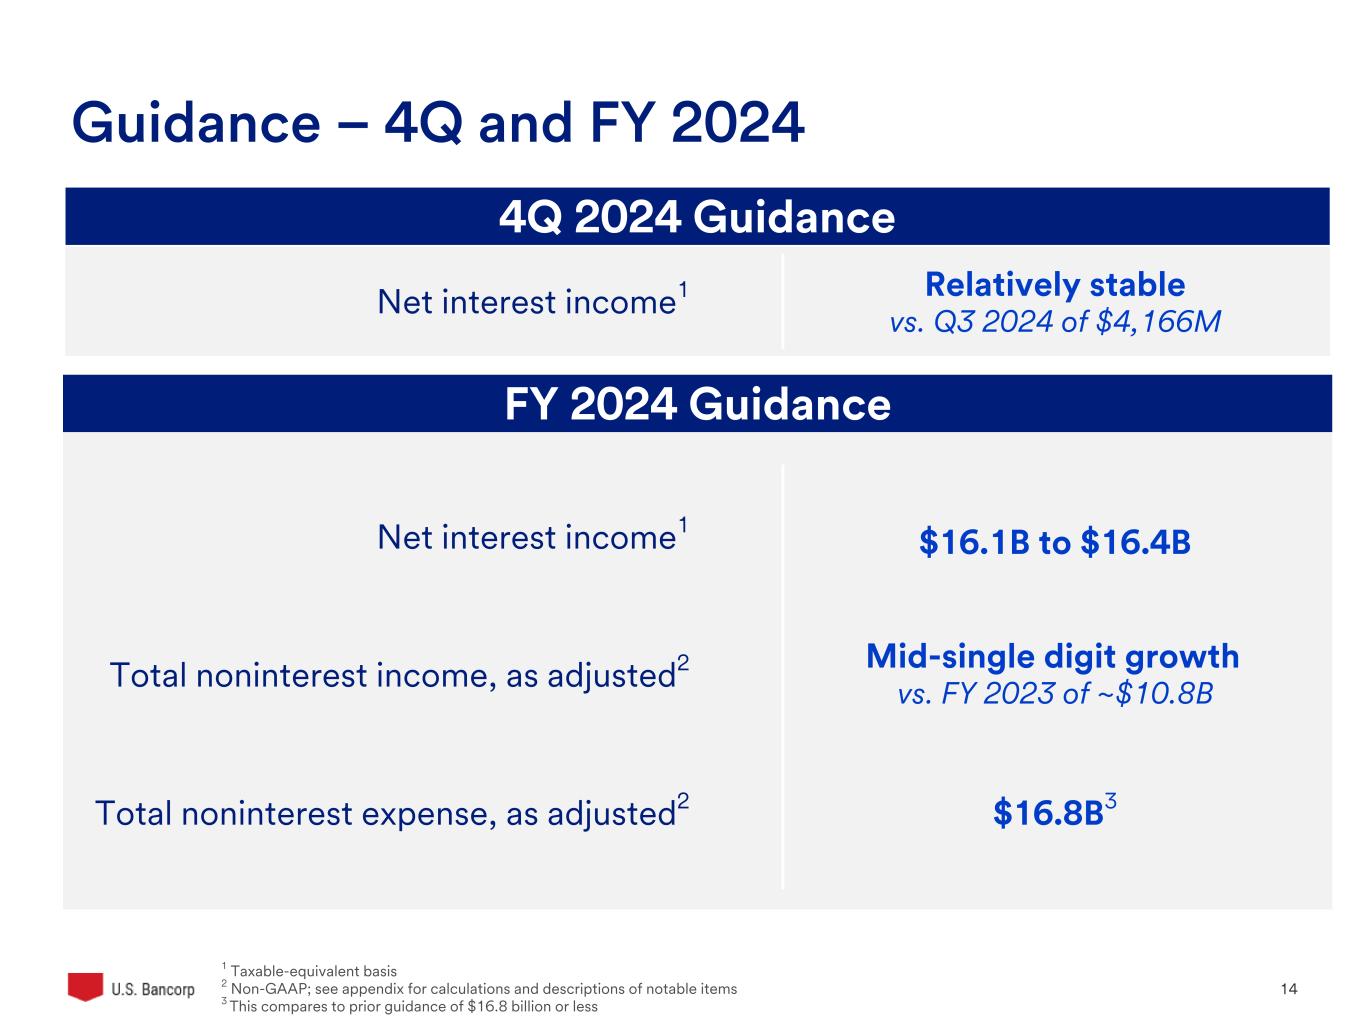
•Net interest income on a taxable-equivalent basis increased 2.8% on a linked quarter basis
•Net revenue of $6,864 million, including $4,166 million of net interest income on a taxable-equivalent basis
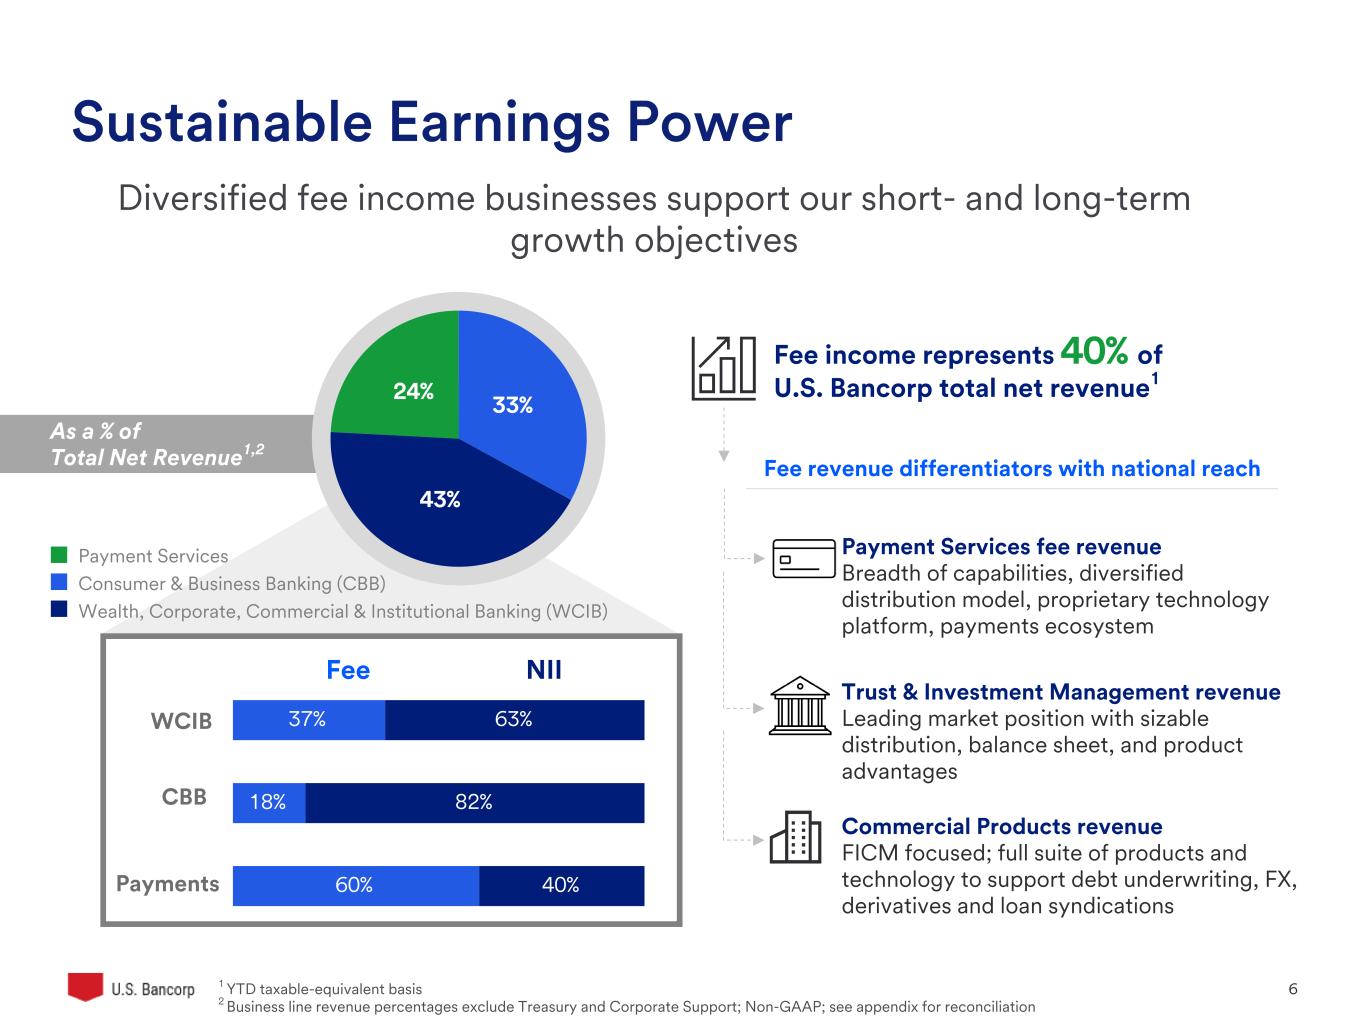
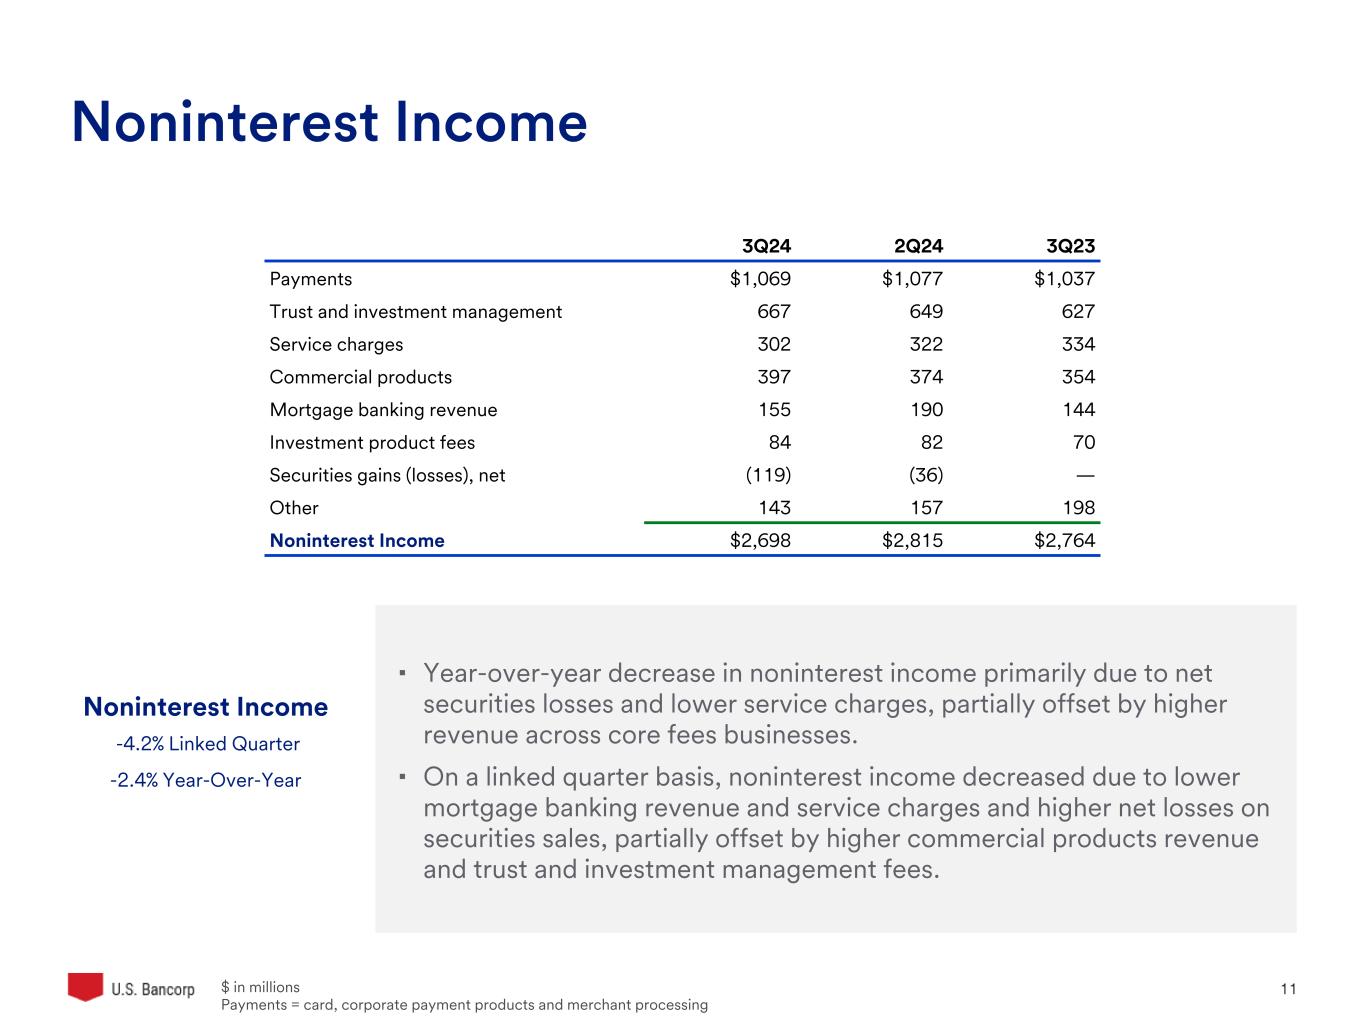
•Noninterest income of $2,817 million, which excludes net securities losses, driven by year-over-year increases in:
◦Commercial products revenue of 12.1%
◦Trust and investment management fees of 6.4%
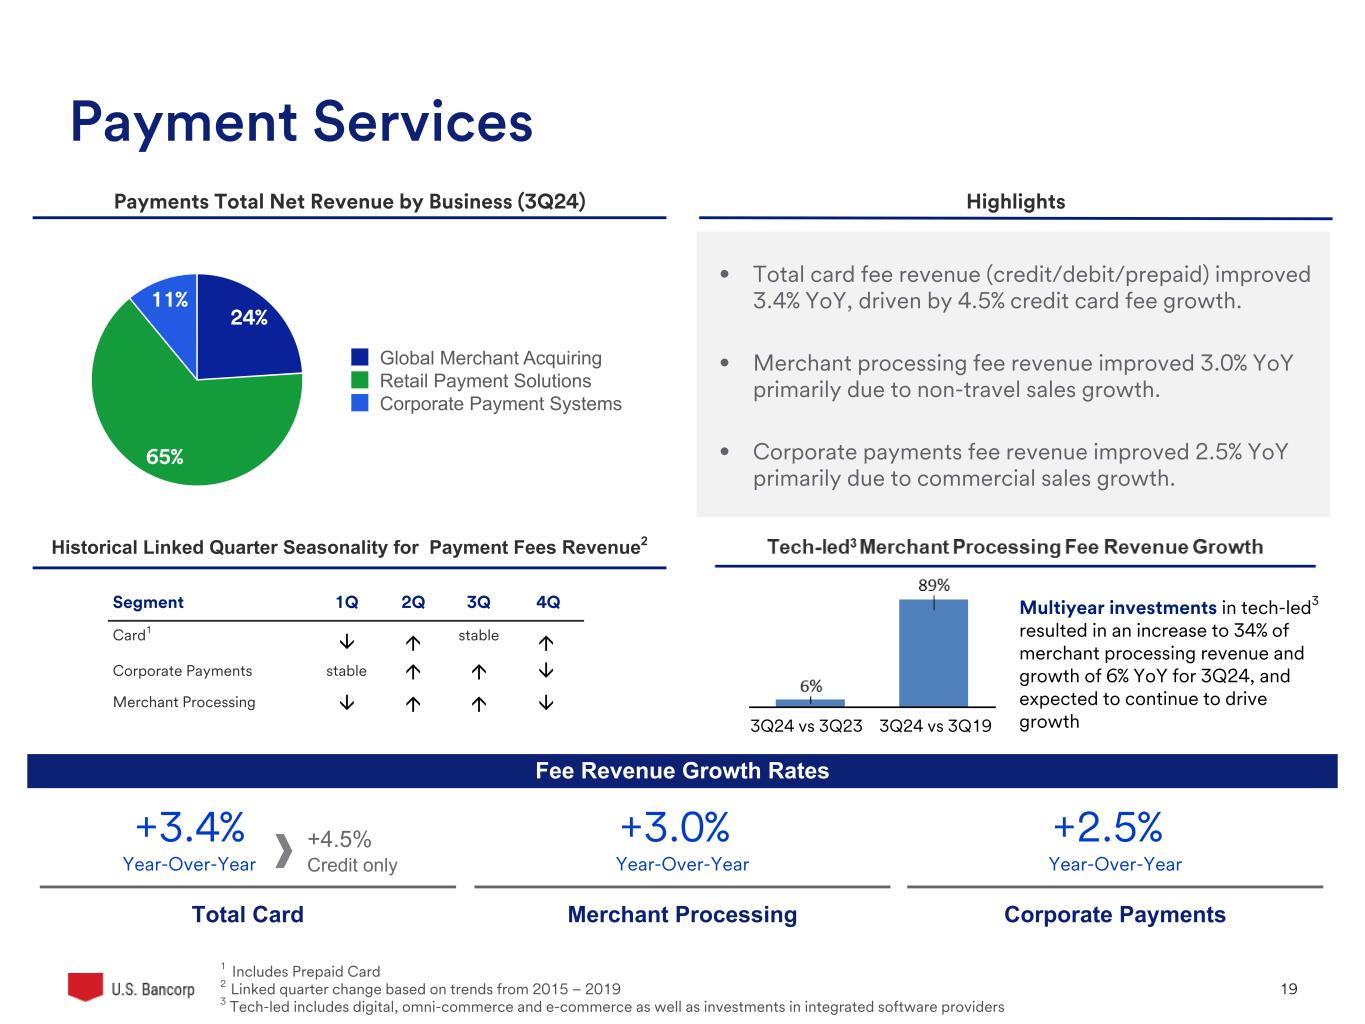
◦Payment services revenue of 3.1%
◦Mortgage banking revenue of 7.6%
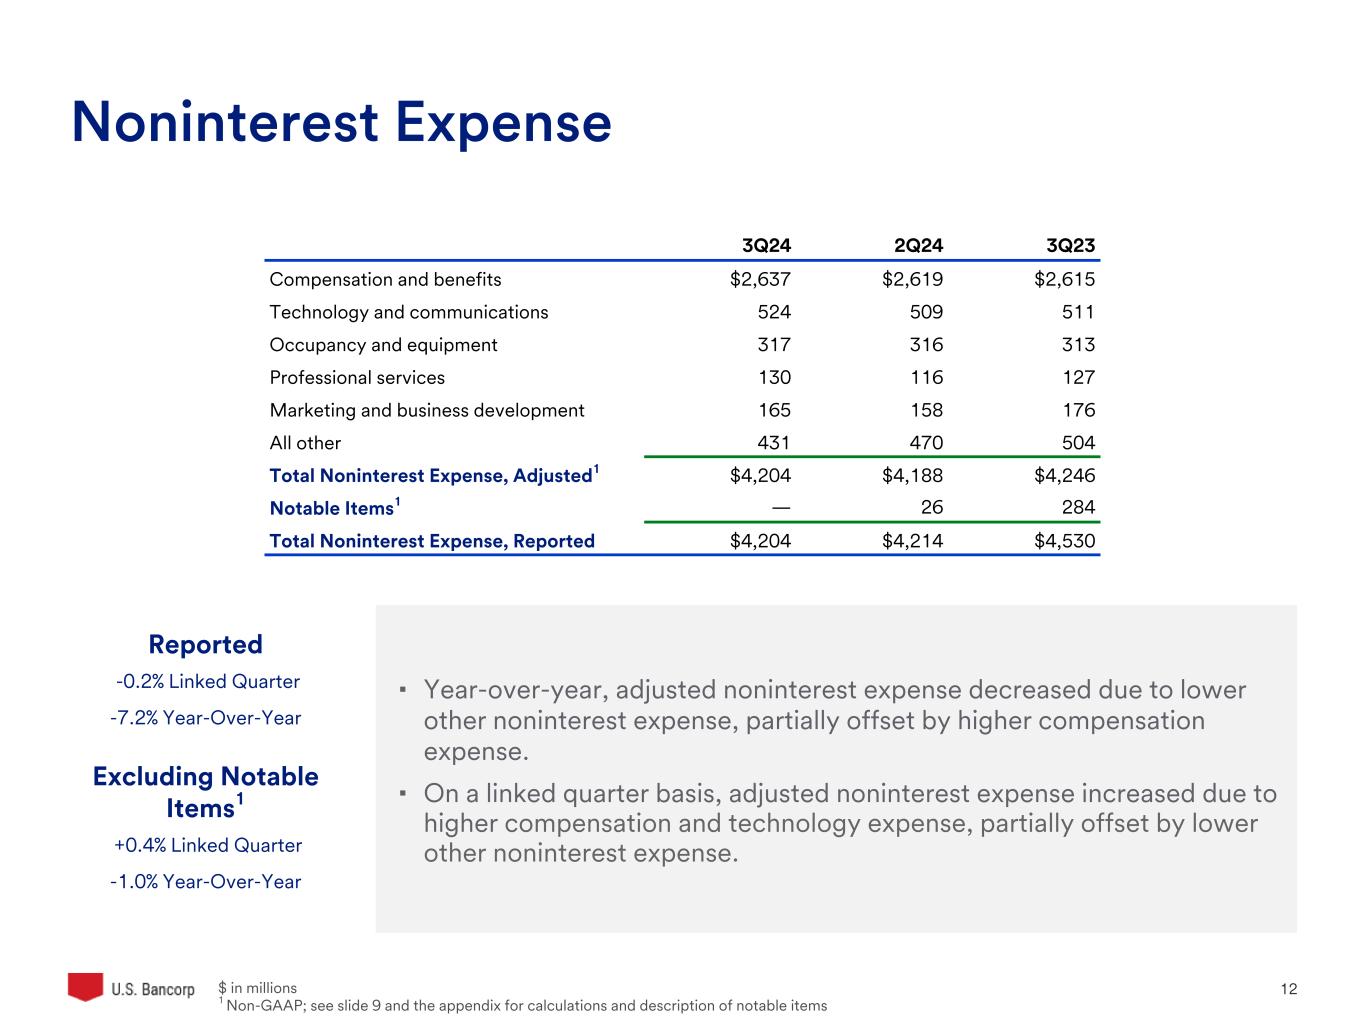
•Noninterest expense decreased 1.0% year-over-year and increased 0.4% on a linked quarter basis, as adjusted for notable items in the prior quarters
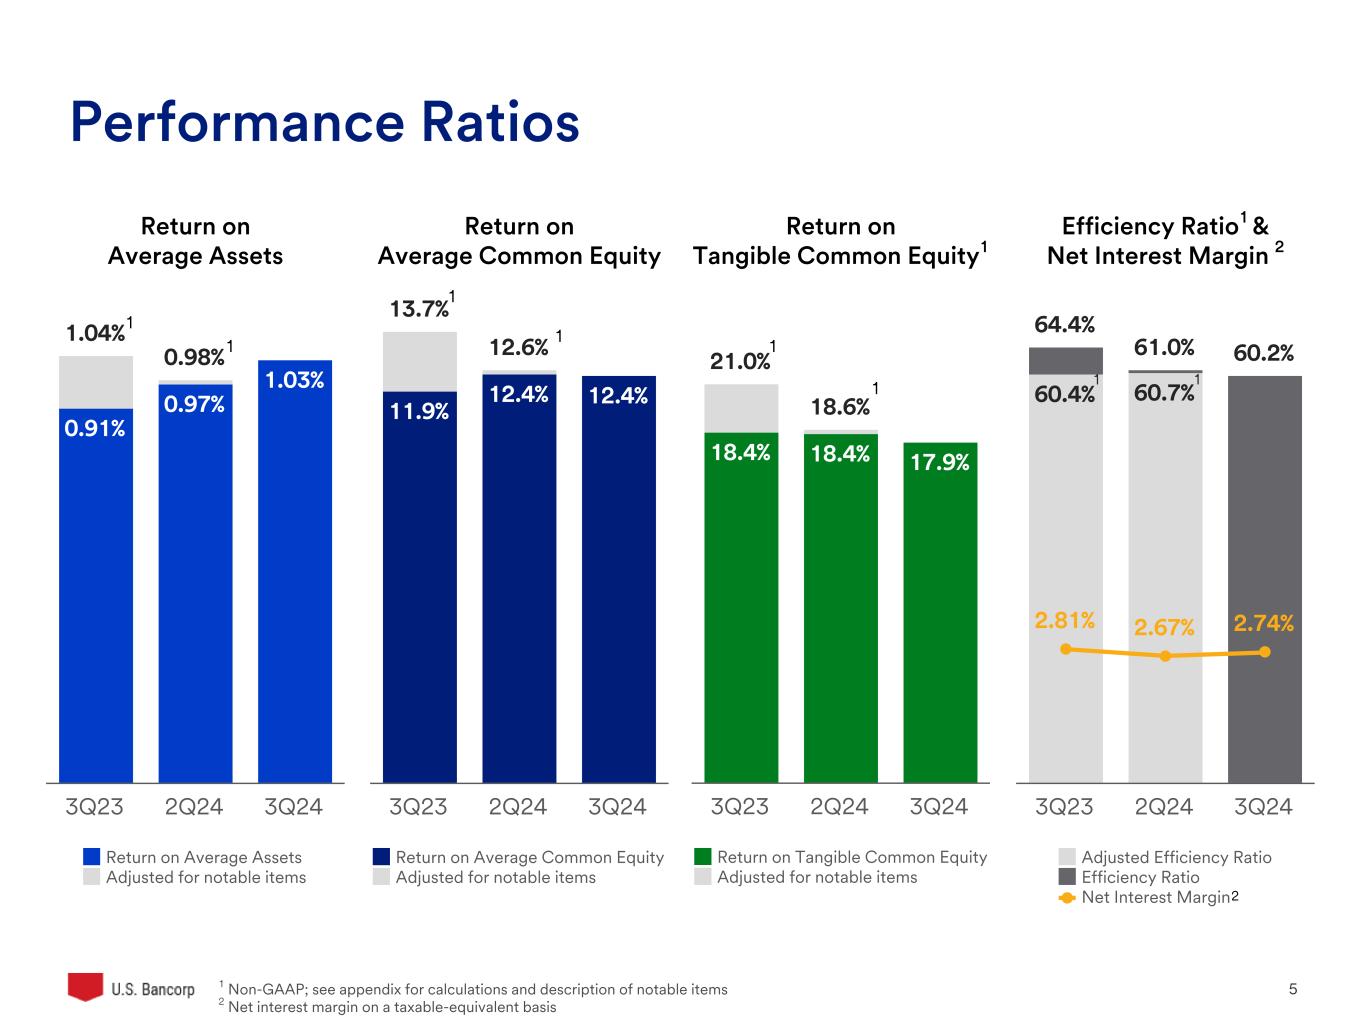
•Return on tangible common equity of 17.9%, return on average assets of 1.03%, and efficiency ratio of 60.2%
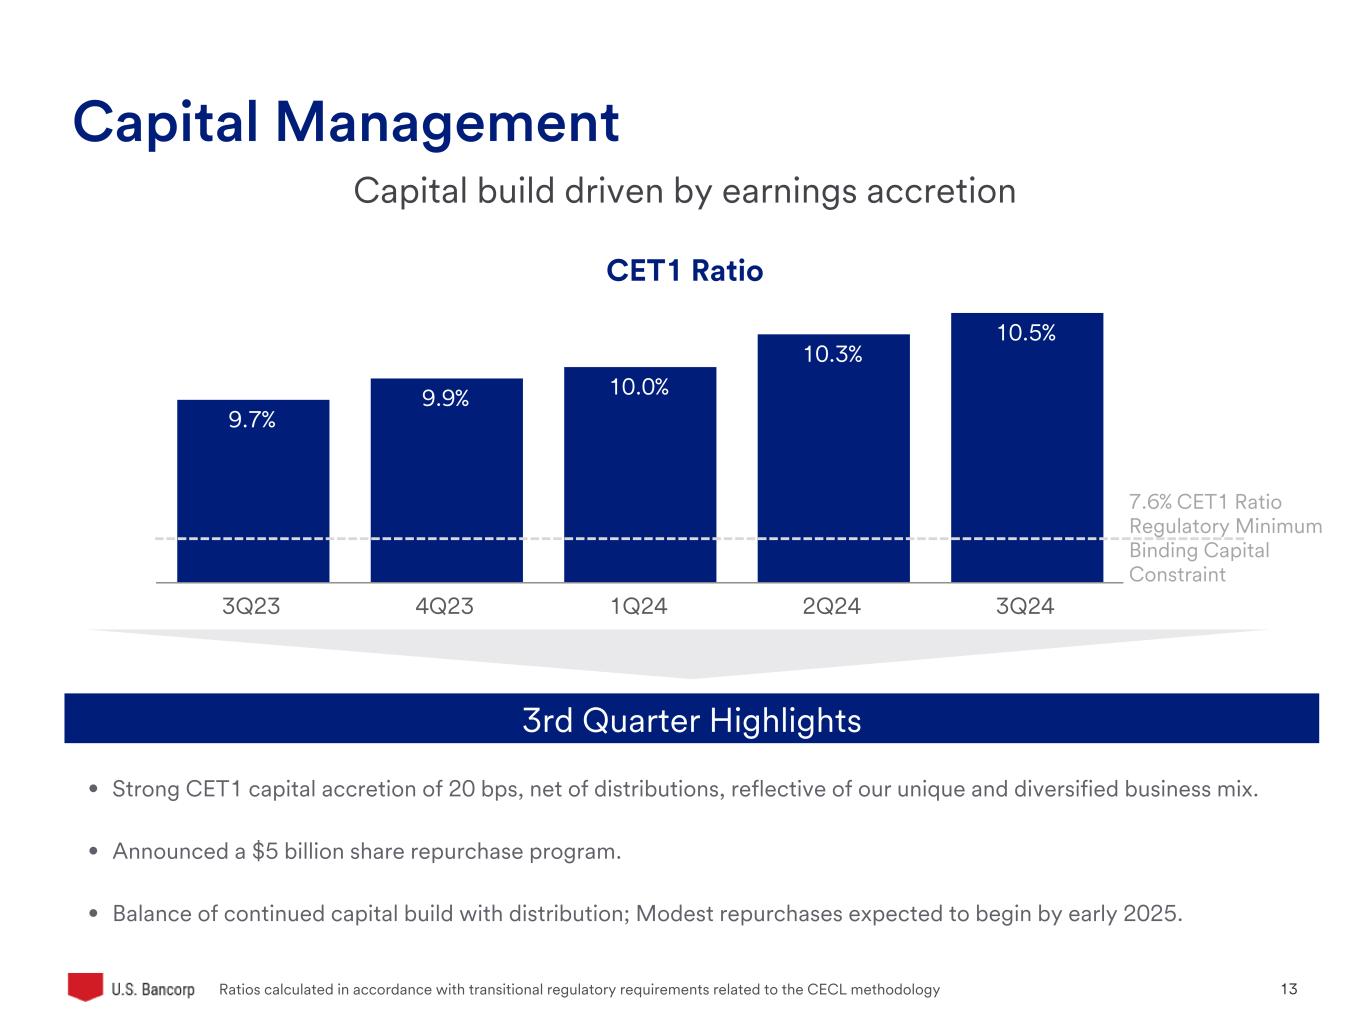
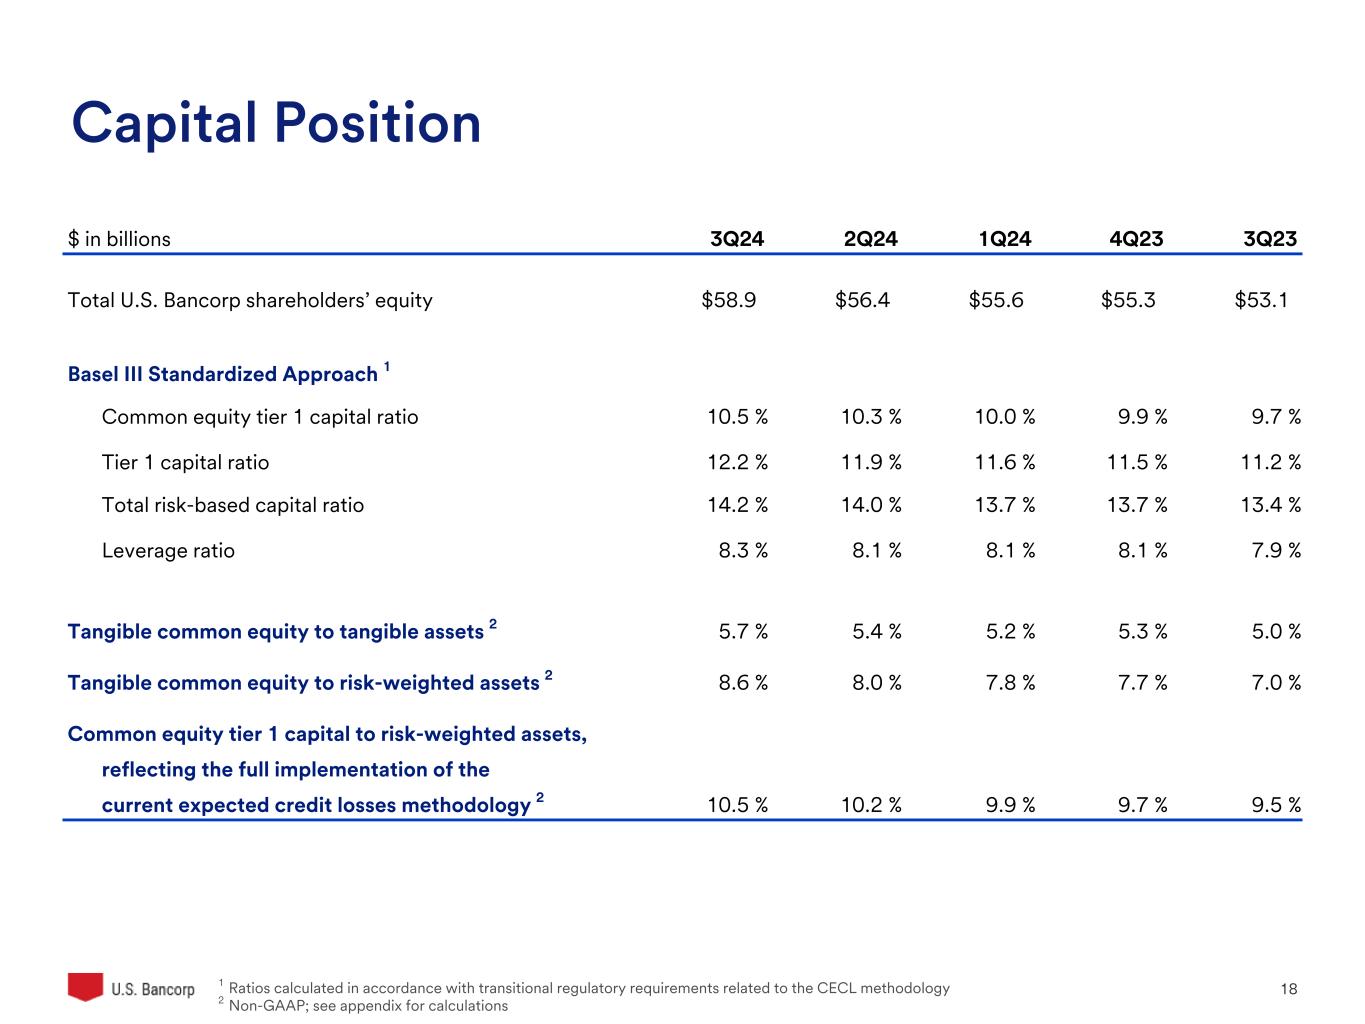
•CET1 capital ratio of 10.5% at September 30, 2024, compared with 10.3% at June 30, 2024
|
||||||||||||||||
| Return on average assets (%) | 1.03 | .97 | .91 | |||||||||||||||||
| Return on average common equity (%) | 12.4 | 12.4 | 11.9 | |||||||||||||||||
| Return on tangible common equity (%) (a) | 17.9 | 18.4 | 18.4 | |||||||||||||||||
| Net interest margin (%) | 2.74 | 2.67 | 2.81 | |||||||||||||||||
| Efficiency ratio (%) (a) | 60.2 | 61.0 | 64.4 | |||||||||||||||||
| Tangible efficiency ratio (%) (a) | 58.2 | 59.0 | 62.1 | |||||||||||||||||
| INCOME STATEMENT (b) | 3Q24 | 2Q24 | 3Q23 | |||||||||||||||||
| Net interest income (taxable-equivalent basis) | $4,166 | $4,052 | $4,268 | |||||||||||||||||
| Noninterest income | $2,698 | $2,815 | $2,764 | |||||||||||||||||
| Noninterest expense | $4,204 | $4,214 | $4,530 | |||||||||||||||||
| Net income attributable to U.S. Bancorp | $1,714 | $1,603 | $1,523 | |||||||||||||||||
| Diluted earnings per common share | $1.03 | $.97 | $.91 | |||||||||||||||||
| Dividends declared per common share | $.50 | $.49 | $.48 | |||||||||||||||||
| BALANCE SHEET (b) | 3Q24 | 2Q24 | 3Q23 | |||||||||||||||||
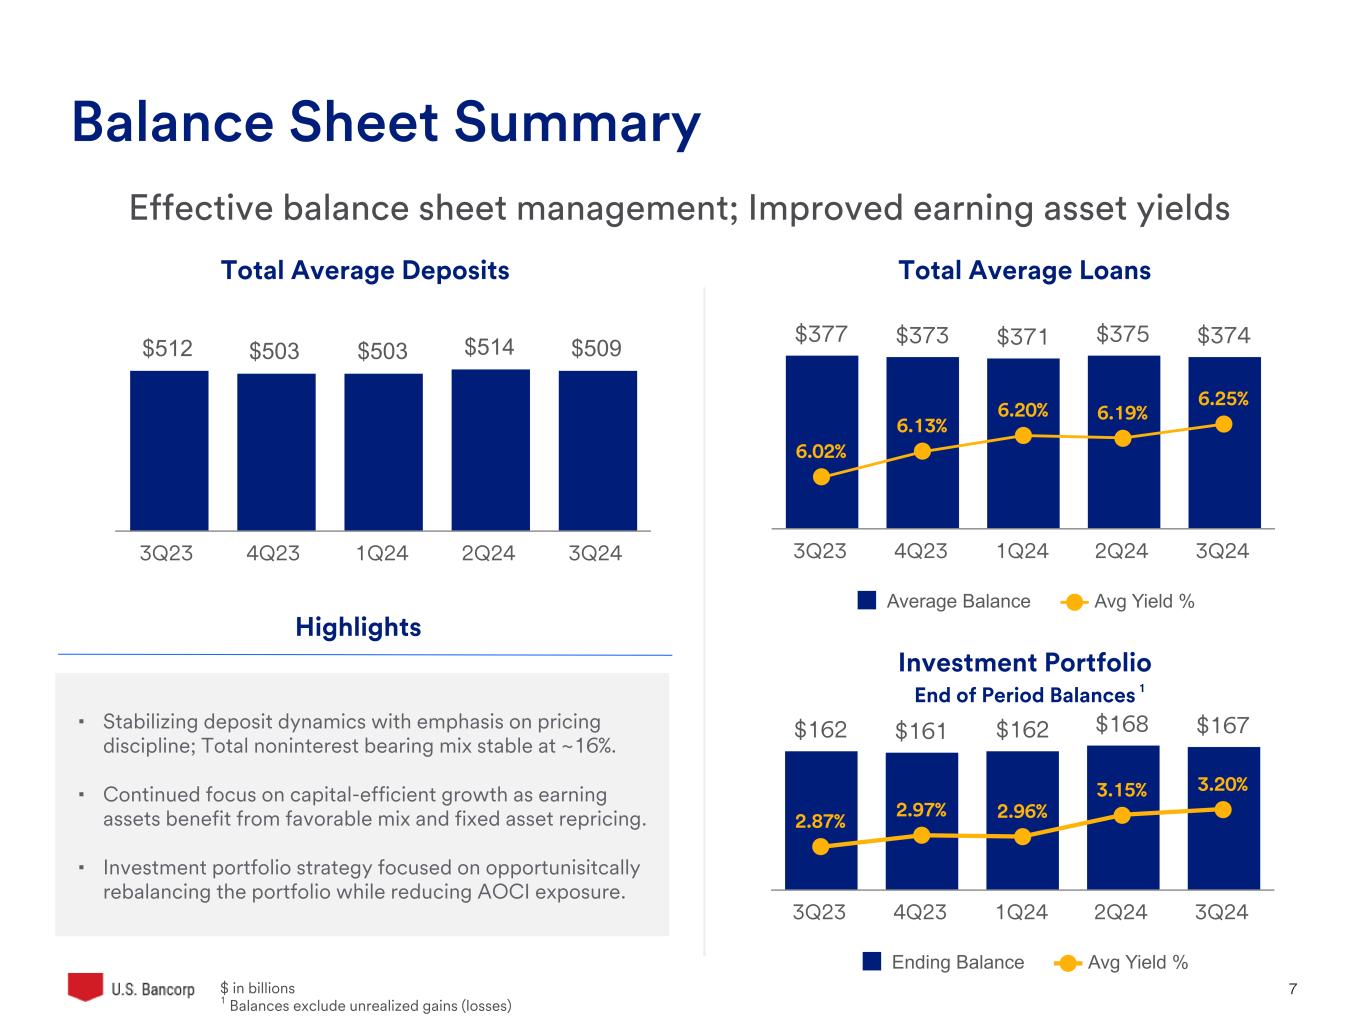
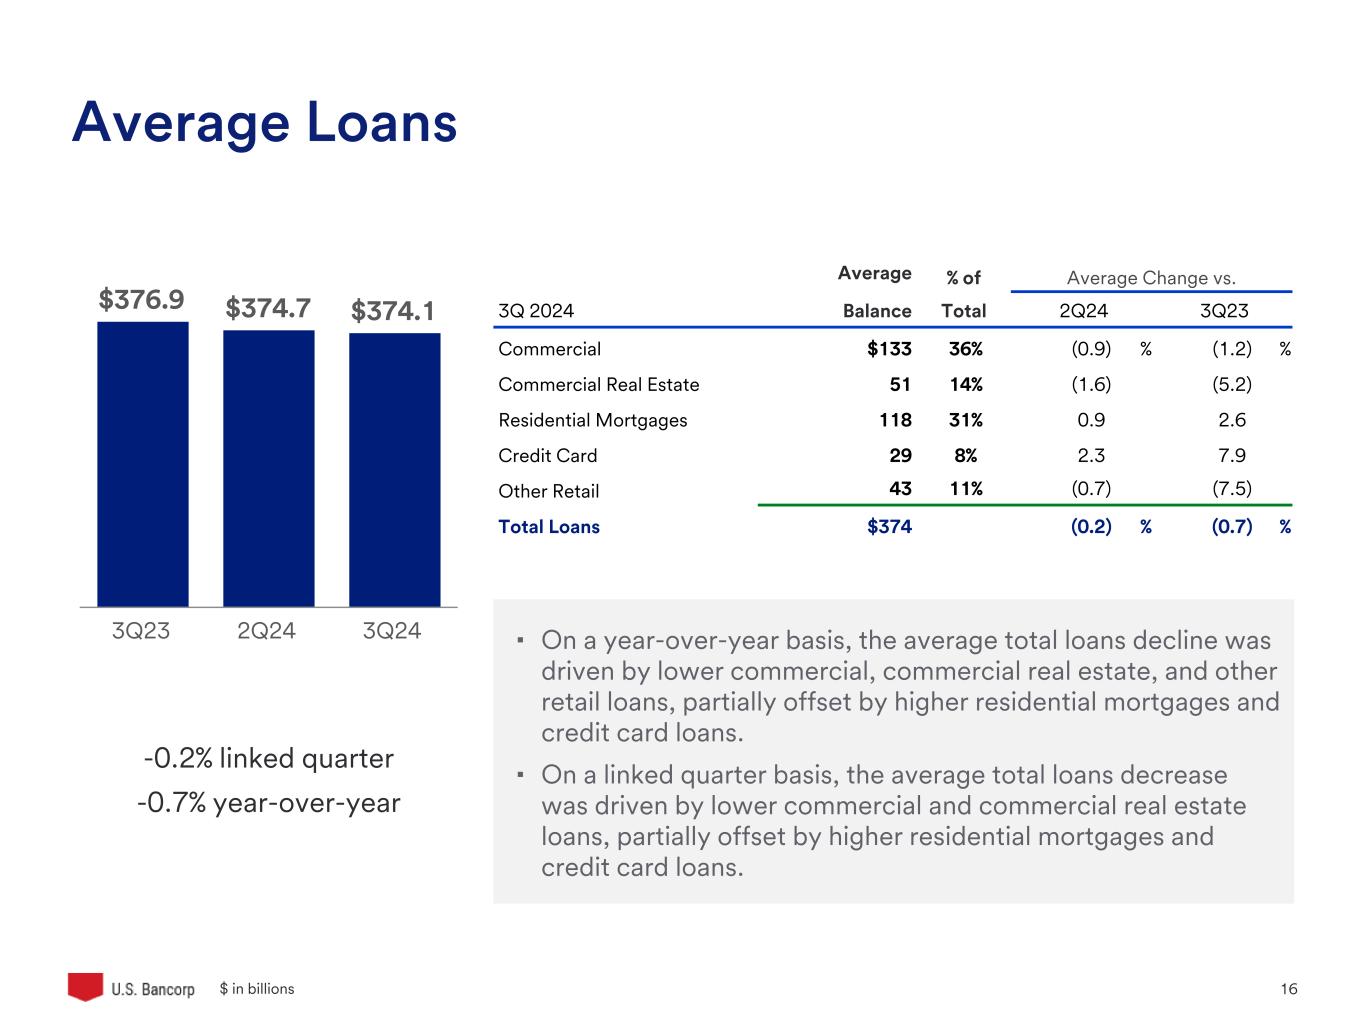
| Average total loans | $374,070 | $374,685 | $376,877 | |||||||||||||||||
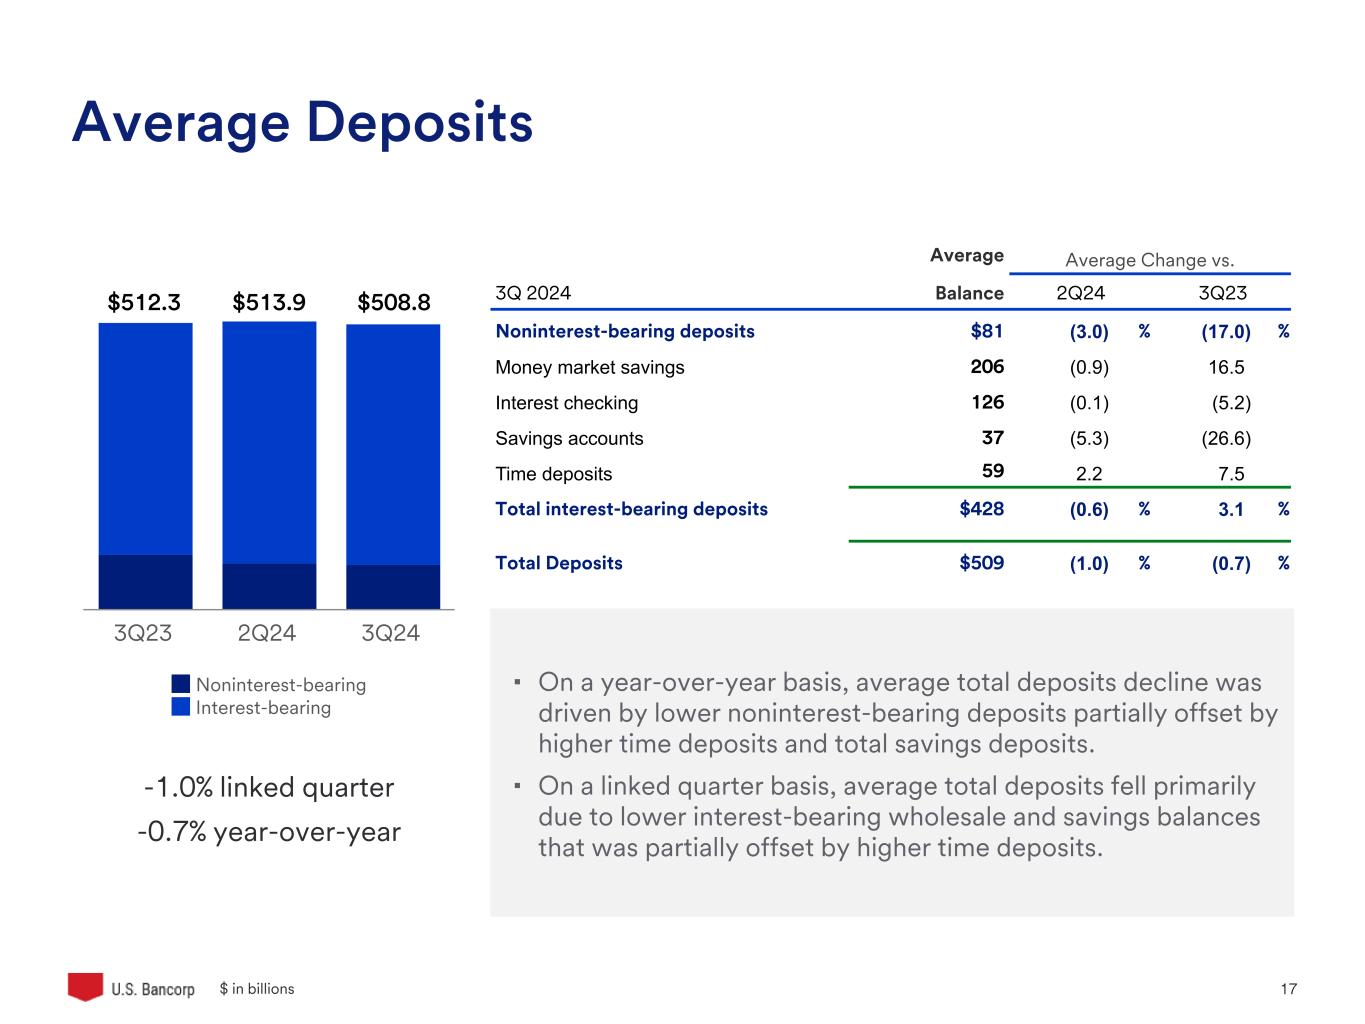
| Average total deposits | $508,757 | $513,909 | $512,291 | |||||||||||||||||
| Net charge-off ratio (%) | .60 | .58 | .44 | |||||||||||||||||
| Book value per common share (period end) | $33.34 | $31.80 | $29.74 | |||||||||||||||||
| Basel III standardized CET1 (%) (c) | 10.5 | 10.3 | 9.7 | |||||||||||||||||
|
(a) See Non-GAAP Financial Measures reconciliation on page 18
(b) Dollars in millions, except per share data
(c) CET1 = Common equity tier 1 capital ratio
|
||||||||||||||||||||
| CEO Commentary | ||
| Business and Other Highlights | ||
Investor contact: George Andersen, 612.303.3620 | Media contact: Jeff Shelman, 612.303.9933 | ||
 |
U.S. Bancorp Third Quarter 2024 Results |
||||
| INCOME STATEMENT HIGHLIGHTS | ||||||||||||||||||||||||||||||||||||||
| ($ in millions, except per share data) | ADJUSTED (a) (b) | |||||||||||||||||||||||||||||||||||||
| Percent Change | Percent Change | |||||||||||||||||||||||||||||||||||||
| 3Q 2024 | 2Q 2024 | 3Q 2023 | 3Q24 vs 2Q24 | 3Q24 vs 3Q23 | 3Q 2024 | 2Q 2024 | 3Q 2023 | 3Q24 vs 2Q24 | 3Q24 vs 3Q23 | |||||||||||||||||||||||||||||
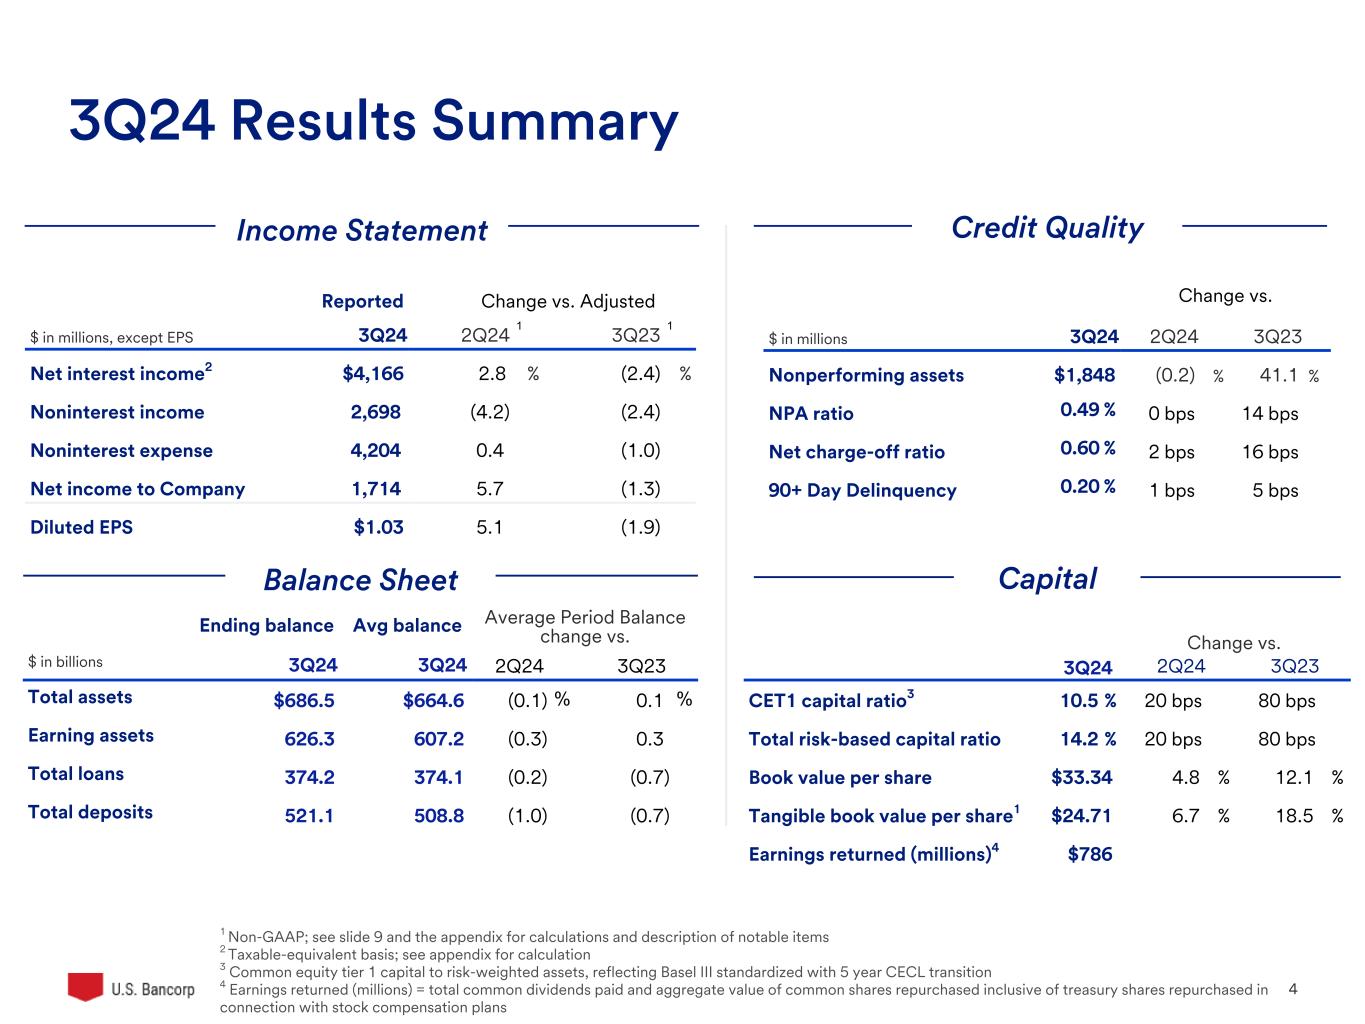
| Net interest income | $4,135 | $4,023 | $4,236 | 2.8 | (2.4) | $4,135 | $4,023 | $4,236 | 2.8 | (2.4) | ||||||||||||||||||||||||||||
| Taxable-equivalent adjustment | 31 | 29 | 32 | 6.9 | (3.1) | 31 | 29 | 32 | 6.9 | (3.1) | ||||||||||||||||||||||||||||
| Net interest income (taxable-equivalent basis) | 4,166 | 4,052 | 4,268 | 2.8 | (2.4) | 4,166 | 4,052 | 4,268 | 2.8 | (2.4) | ||||||||||||||||||||||||||||
| Noninterest income | 2,698 | 2,815 | 2,764 | (4.2) | (2.4) | 2,698 | 2,815 | 2,764 | (4.2) | (2.4) | ||||||||||||||||||||||||||||
| Total net revenue | 6,864 | 6,867 | 7,032 | — | (2.4) | 6,864 | 6,867 | 7,032 | — | (2.4) | ||||||||||||||||||||||||||||
| Noninterest expense | 4,204 | 4,214 | 4,530 | (.2) | (7.2) | 4,204 | 4,188 | 4,246 | .4 | (1.0) | ||||||||||||||||||||||||||||
| Income before provision and income taxes | 2,660 | 2,653 | 2,502 | .3 | 6.3 | 2,660 | 2,679 | 2,786 | (.7) | (4.5) | ||||||||||||||||||||||||||||
| Provision for credit losses | 557 | 568 | 515 | (1.9) | 8.2 | 557 | 568 | 515 | (1.9) | 8.2 | ||||||||||||||||||||||||||||
| Income before taxes | 2,103 | 2,085 | 1,987 | .9 | 5.8 | 2,103 | 2,111 | 2,271 | (.4) | (7.4) | ||||||||||||||||||||||||||||
| Income taxes and taxable-equivalent adjustment | 381 | 474 | 463 | (19.6) | (17.7) | 381 | 481 | 534 | (20.8) | (28.7) | ||||||||||||||||||||||||||||
| Net income | 1,722 | 1,611 | 1,524 | 6.9 | 13.0 | 1,722 | 1,630 | 1,737 | 5.6 | (.9) | ||||||||||||||||||||||||||||
| Net (income) loss attributable to noncontrolling interests | (8) | (8) | (1) | — | nm | (8) | (8) | (1) | — | nm | ||||||||||||||||||||||||||||
| Net income attributable to U.S. Bancorp | $1,714 | $1,603 | $1,523 | 6.9 | 12.5 | $1,714 | $1,622 | $1,736 | 5.7 | (1.3) | ||||||||||||||||||||||||||||
| Net income applicable to U.S. Bancorp common shareholders | $1,601 | $1,518 | $1,412 | 5.5 | 13.4 | $1,601 | $1,537 | $1,624 | 4.2 | (1.4) | ||||||||||||||||||||||||||||
| Diluted earnings per common share | $1.03 | $.97 | $.91 | 6.2 | 13.2 | $1.03 | $.98 | $1.05 | 5.1 | (1.9) | ||||||||||||||||||||||||||||
| INCOME STATEMENT HIGHLIGHTS | ||||||||||||||||||||||||||
| ($ in millions, except per share data) | ADJUSTED (c) (d) | |||||||||||||||||||||||||
| YTD 2024 |
YTD 2023 |
Percent Change |
YTD 2024 |
YTD 2023 |
Percent Change |
|||||||||||||||||||||
| Net interest income | $12,143 | $13,285 | (8.6) | $12,143 | $13,285 | (8.6) | ||||||||||||||||||||
| Taxable-equivalent adjustment | 90 | 100 | (10.0) | 90 | 100 | (10.0) | ||||||||||||||||||||
| Net interest income (taxable-equivalent basis) | 12,233 | 13,385 | (8.6) | 12,233 | 13,385 | (8.6) | ||||||||||||||||||||
| Noninterest income | 8,213 | 7,997 | 2.7 | 8,213 | 8,019 | 2.4 | ||||||||||||||||||||
| Total net revenue | 20,446 | 21,382 | (4.4) | 20,446 | 21,404 | (4.5) | ||||||||||||||||||||
| Noninterest expense | 12,877 | 13,654 | (5.7) | 12,586 | 12,816 | (1.8) | ||||||||||||||||||||
| Income before provision and income taxes | 7,569 | 7,728 | (2.1) | 7,860 | 8,588 | (8.5) | ||||||||||||||||||||
| Provision for credit losses | 1,678 | 1,763 | (4.8) | 1,678 | 1,520 | 10.4 | ||||||||||||||||||||
| Income before taxes | 5,891 | 5,965 | (1.2) | 6,182 | 7,068 | (12.5) | ||||||||||||||||||||
| Income taxes and taxable-equivalent adjustment | 1,232 | 1,368 | (9.9) | 1,305 | 1,643 | (20.6) | ||||||||||||||||||||
| Net income | 4,659 | 4,597 | 1.3 | 4,877 | 5,425 | (10.1) | ||||||||||||||||||||
| Net (income) loss attributable to noncontrolling interests | (23) | (15) | (53.3) | (23) | (15) | (53.3) | ||||||||||||||||||||
| Net income attributable to U.S. Bancorp | $4,636 | $4,582 | 1.2 | $4,854 | $5,410 | (10.3) | ||||||||||||||||||||
| Net income applicable to U.S. Bancorp common shareholders | $4,328 | $4,285 | 1.0 | $4,545 | $5,107 | (11.0) | ||||||||||||||||||||
| Diluted earnings per common share | $2.77 | $2.79 | (.7) | $2.91 | $3.32 | (12.3) | ||||||||||||||||||||
 |
U.S. Bancorp Third Quarter 2024 Results |
||||
 |
U.S. Bancorp Third Quarter 2024 Results |
||||
| NET INTEREST INCOME | ||||||||||||||||||||||||||||||||||||||||||||||||||
| (Taxable-equivalent basis; $ in millions) | Change | |||||||||||||||||||||||||||||||||||||||||||||||||
| 3Q 2024 | 2Q 2024 | 3Q 2023 | 3Q24 vs 2Q24 | 3Q24 vs 3Q23 | YTD 2024 |
YTD 2023 |
Change | |||||||||||||||||||||||||||||||||||||||||||
| Components of net interest income | ||||||||||||||||||||||||||||||||||||||||||||||||||
| Income on earning assets | $ | 8,117 | $ | 8,015 | $ | 7,788 | $ | 102 | $ | 329 | $ | 23,927 | $ | 22,349 | $ | 1,578 | ||||||||||||||||||||||||||||||||||
| Expense on interest-bearing liabilities | 3,951 | 3,963 | 3,520 | (12) | 431 | 11,694 | 8,964 | 2,730 | ||||||||||||||||||||||||||||||||||||||||||
| Net interest income | $ | 4,166 | $ | 4,052 | $ | 4,268 | $ | 114 | $ | (102) | $ | 12,233 | $ | 13,385 | $ | (1,152) | ||||||||||||||||||||||||||||||||||
| Average yields and rates paid | ||||||||||||||||||||||||||||||||||||||||||||||||||
| Earning assets yield | 5.33 | % | 5.29 | % | 5.12 | % | .04 | % | .21 | % | 5.29 | % | 4.90 | % | .39 | % | ||||||||||||||||||||||||||||||||||
| Rate paid on interest-bearing liabilities | 3.14 | 3.18 | 2.87 | (.04) | .27 | 3.15 | 2.52 | .63 | ||||||||||||||||||||||||||||||||||||||||||
| Gross interest margin | 2.19 | % | 2.11 | % | 2.25 | % | .08 | % | (.06) | % | 2.14 | % | 2.38 | % | (.24) | % | ||||||||||||||||||||||||||||||||||
| Net interest margin | 2.74 | % | 2.67 | % | 2.81 | % | .07 | % | (.07) | % | 2.70 | % | 2.94 | % | (.24) | % | ||||||||||||||||||||||||||||||||||
| Average balances | ||||||||||||||||||||||||||||||||||||||||||||||||||
| Investment securities (a) | $ | 166,899 | $ | 167,020 | $ | 163,236 | $ | (121) | $ | 3,663 | $ | 165,059 | $ | 163,051 | $ | 2,008 | ||||||||||||||||||||||||||||||||||
| Loans | 374,070 | 374,685 | 376,877 | (615) | (2,807) | 373,278 | 384,112 | (10,834) | ||||||||||||||||||||||||||||||||||||||||||
| Interest-bearing deposits with banks | 50,547 | 53,056 | 53,100 | (2,509) | (2,553) | 51,499 | 49,495 | 2,004 | ||||||||||||||||||||||||||||||||||||||||||
| Earning assets | 607,180 | 608,892 | 605,245 | (1,712) | 1,935 | 604,080 | 608,891 | (4,811) | ||||||||||||||||||||||||||||||||||||||||||
| Interest-bearing liabilities | 500,382 | 500,464 | 486,143 | (82) | 14,239 | 496,082 | 474,992 | 21,090 | ||||||||||||||||||||||||||||||||||||||||||
| (a) Excludes unrealized gain (loss) | ||||||||||||||||||||||||||||||||||||||||||||||||||
 |
U.S. Bancorp Third Quarter 2024 Results |
||||
| AVERAGE LOANS | ||||||||||||||||||||||||||
| ($ in millions) | Percent Change | |||||||||||||||||||||||||
| 3Q 2024 | 2Q 2024 | 3Q 2023 | 3Q24 vs 2Q24 | 3Q24 vs 3Q23 | YTD 2024 |
YTD 2023 |
Percent Change | |||||||||||||||||||
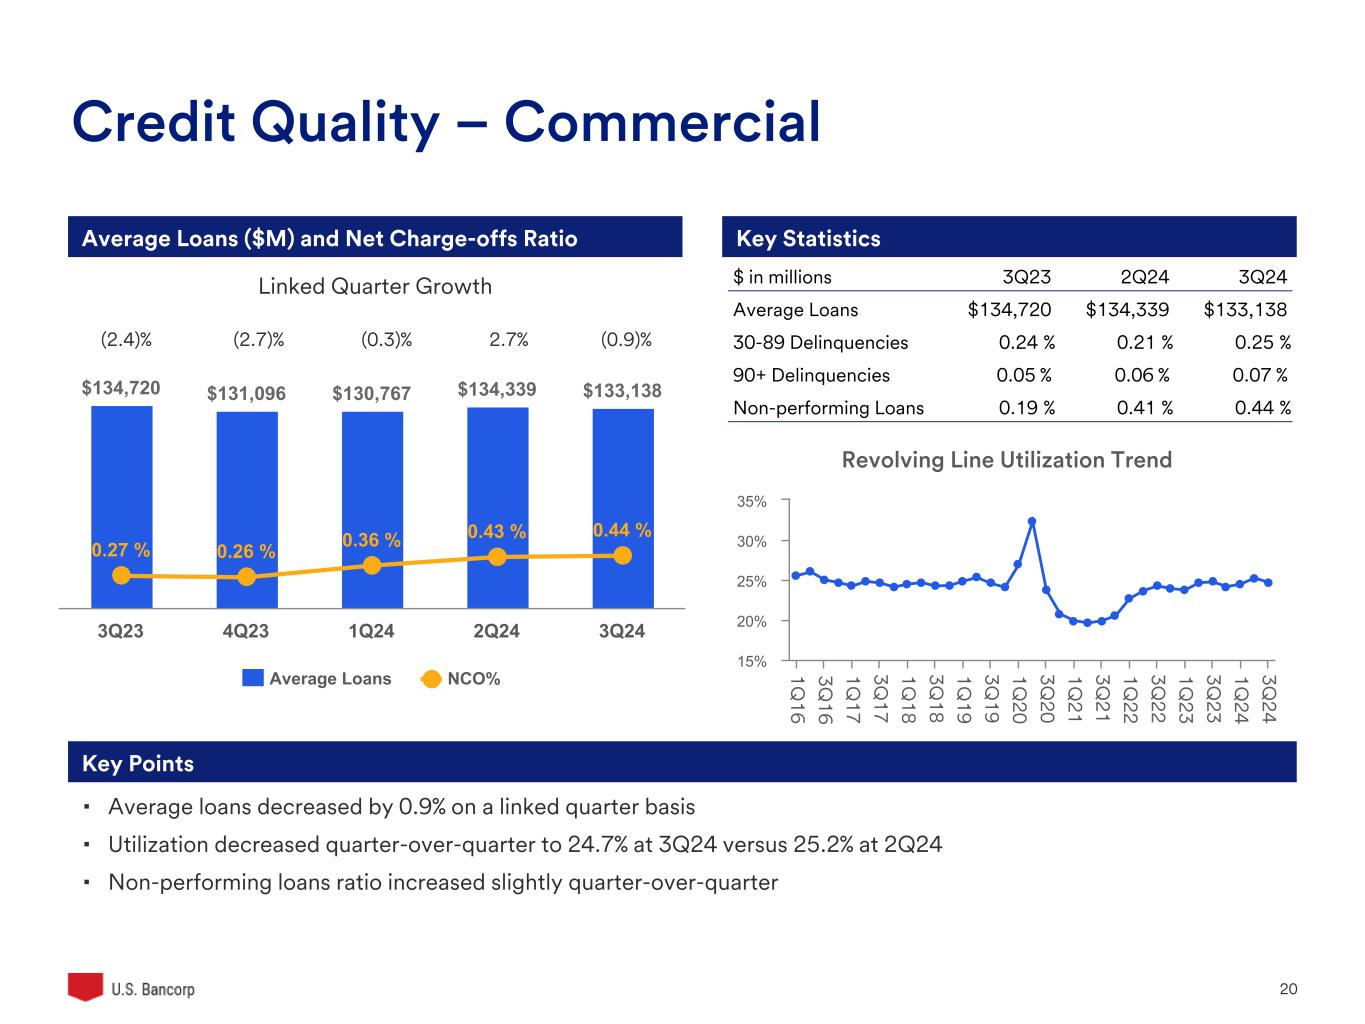
| Commercial | $128,979 | $130,162 | $130,415 | (.9) | (1.1) | $128,582 | $131,777 | (2.4) | ||||||||||||||||||
| Lease financing | 4,159 | 4,177 | 4,305 | (.4) | (3.4) | 4,167 | 4,382 | (4.9) | ||||||||||||||||||
| Total commercial | 133,138 | 134,339 | 134,720 | (.9) | (1.2) | 132,749 | 136,159 | (2.5) | ||||||||||||||||||
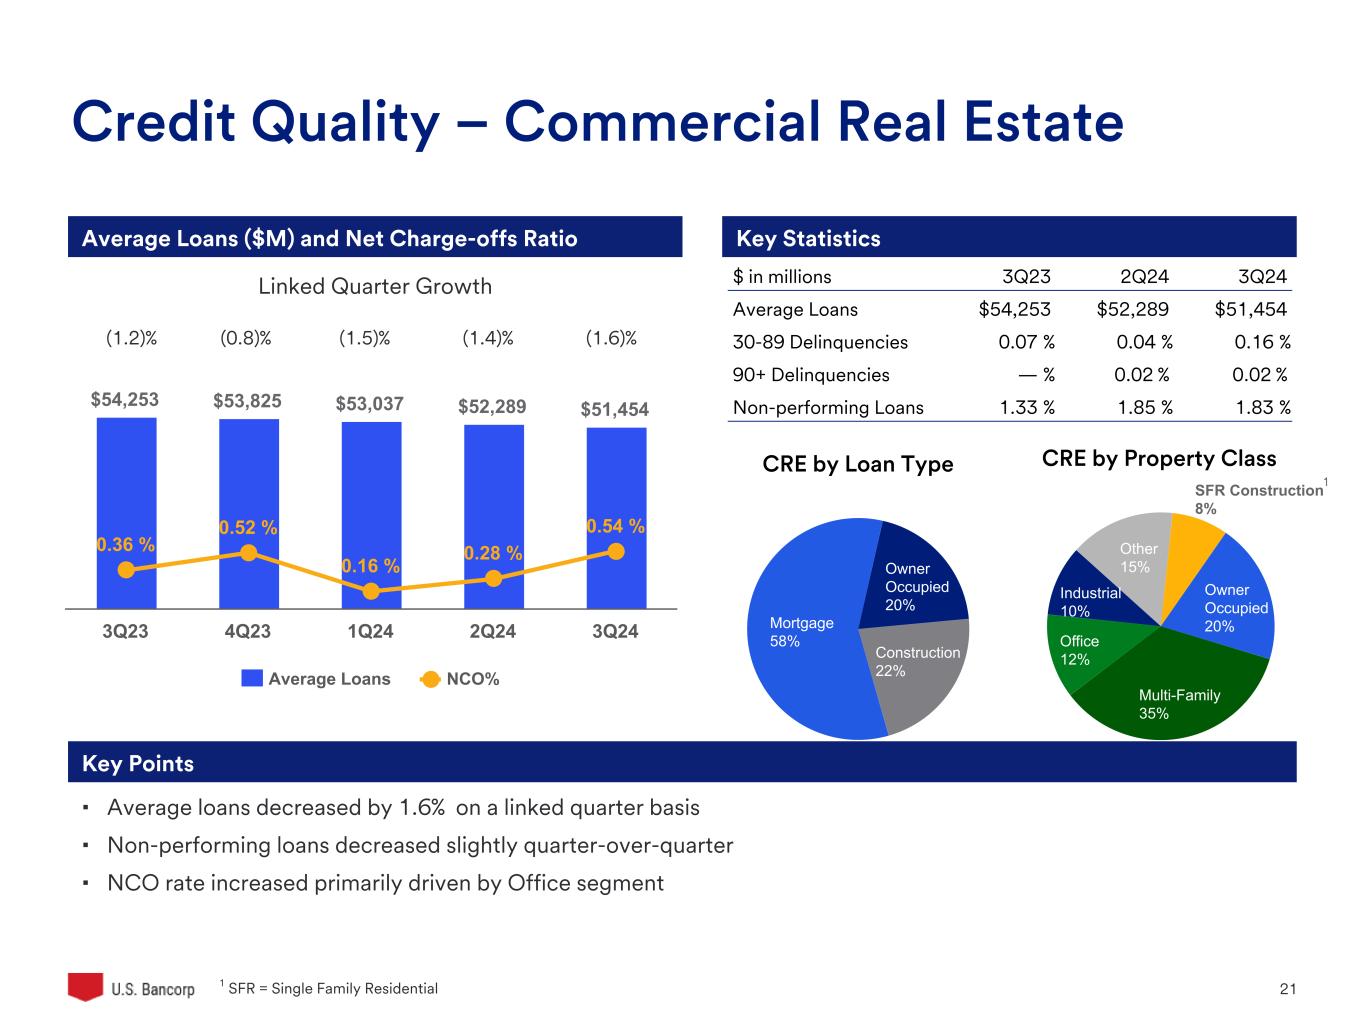
| Commercial mortgages | 40,343 | 40,871 | 42,665 | (1.3) | (5.4) | 40,918 | 43,165 | (5.2) | ||||||||||||||||||
| Construction and development | 11,111 | 11,418 | 11,588 | (2.7) | (4.1) | 11,339 | 11,758 | (3.6) | ||||||||||||||||||
| Total commercial real estate | 51,454 | 52,289 | 54,253 | (1.6) | (5.2) | 52,257 | 54,923 | (4.9) | ||||||||||||||||||
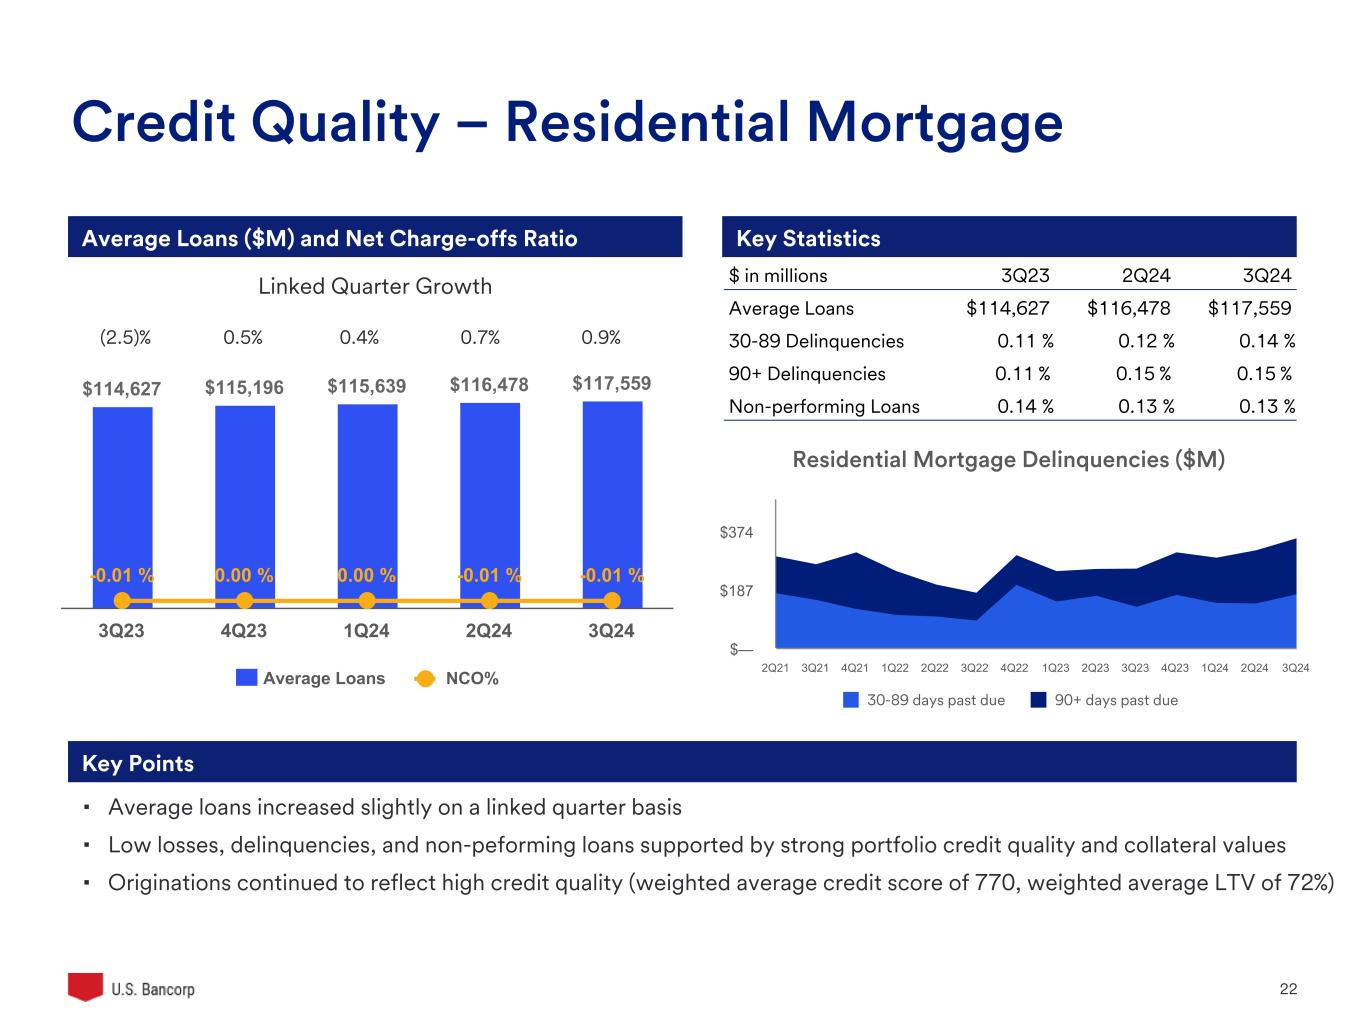
| Residential mortgages | 117,559 | 116,478 | 114,627 | .9 | 2.6 | 116,563 | 116,167 | .3 | ||||||||||||||||||
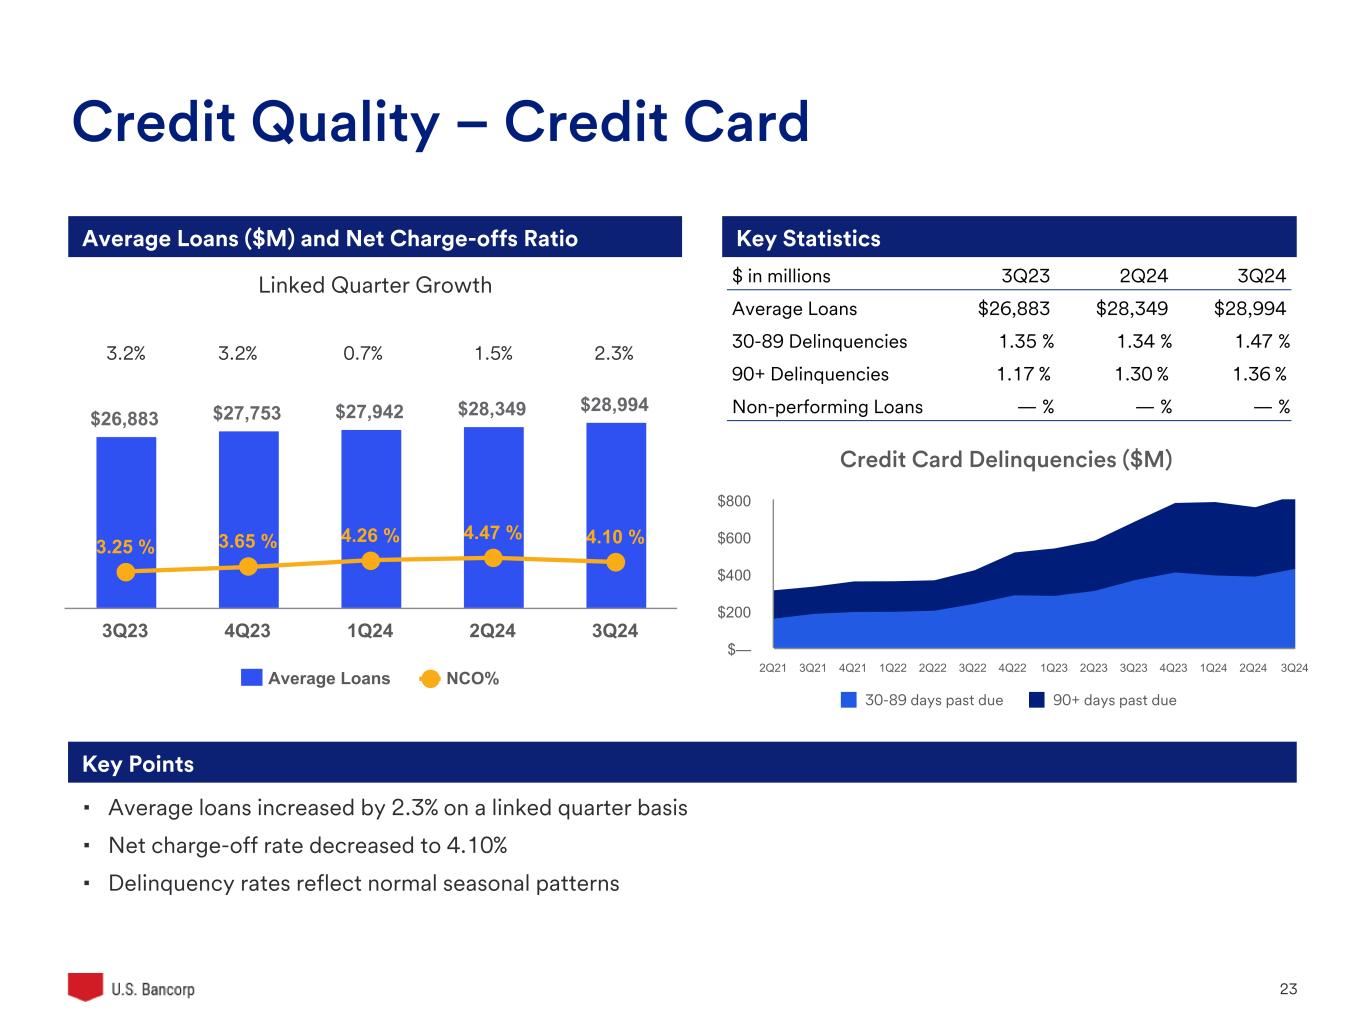
| Credit card | 28,994 | 28,349 | 26,883 | 2.3 | 7.9 | 28,430 | 26,171 | 8.6 | ||||||||||||||||||
| Retail leasing | 4,088 | 4,185 | 4,436 | (2.3) | (7.8) | 4,118 | 4,832 | (14.8) | ||||||||||||||||||
| Home equity and second mortgages | 13,239 | 13,053 | 12,809 | 1.4 | 3.4 | 13,092 | 12,779 | 2.4 | ||||||||||||||||||
| Other | 25,598 | 25,992 | 29,149 | (1.5) | (12.2) | 26,069 | 33,081 | (21.2) | ||||||||||||||||||
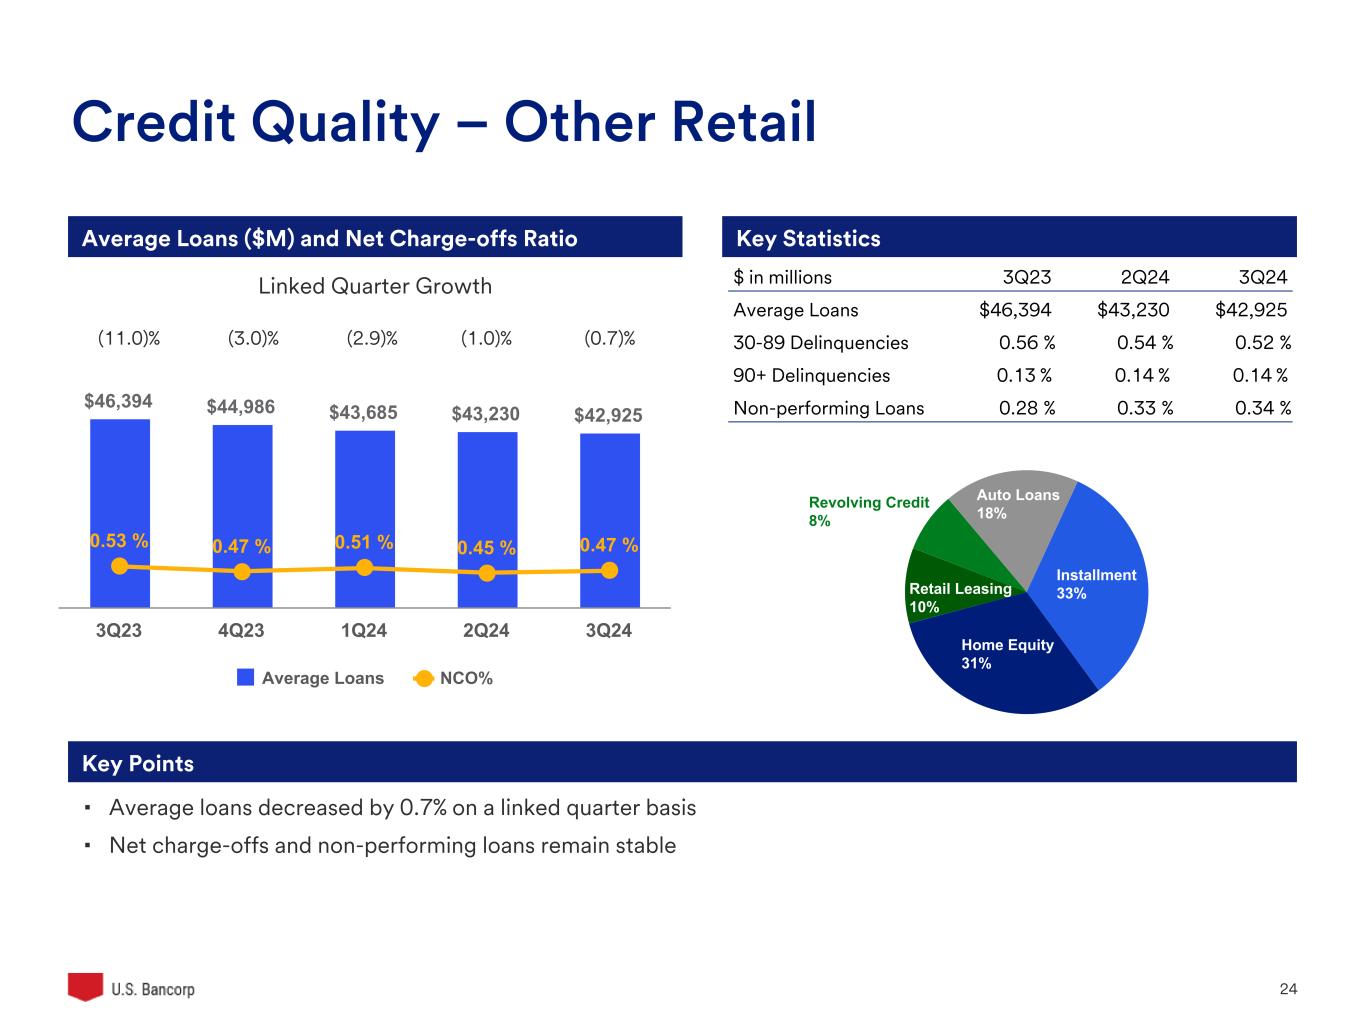
| Total other retail | 42,925 | 43,230 | 46,394 | (.7) | (7.5) | 43,279 | 50,692 | (14.6) | ||||||||||||||||||
| Total loans | $374,070 | $374,685 | $376,877 | (.2) | (.7) | $373,278 | $384,112 | (2.8) | ||||||||||||||||||
 |
U.S. Bancorp Third Quarter 2024 Results |
||||
| AVERAGE DEPOSITS | ||||||||||||||||||||||||||
| ($ in millions) | Percent Change | |||||||||||||||||||||||||
| 3Q 2024 | 2Q 2024 | 3Q 2023 | 3Q24 vs 2Q24 | 3Q24 vs 3Q23 | YTD 2024 |
YTD 2023 |
Percent Change | |||||||||||||||||||
| Noninterest-bearing deposits | $80,939 | $83,418 | $97,524 | (3.0) | (17.0) | $83,040 | $113,556 | (26.9) | ||||||||||||||||||
| Interest-bearing savings deposits | ||||||||||||||||||||||||||
| Interest checking | 125,631 | 125,709 | 132,560 | (.1) | (5.2) | 125,451 | 129,980 | (3.5) | ||||||||||||||||||
| Money market savings | 206,546 | 208,386 | 177,340 | (.9) | 16.5 | 203,821 | 159,178 | 28.0 | ||||||||||||||||||
| Savings accounts | 36,814 | 38,855 | 50,138 | (5.3) | (26.6) | 39,097 | 59,251 | (34.0) | ||||||||||||||||||
| Total savings deposits | 368,991 | 372,950 | 360,038 | (1.1) | 2.5 | 368,369 | 348,409 | 5.7 | ||||||||||||||||||
| Time deposits | 58,827 | 57,541 | 54,729 | 2.2 | 7.5 | 57,167 | 44,668 | 28.0 | ||||||||||||||||||
| Total interest-bearing deposits | 427,818 | 430,491 | 414,767 | (.6) | 3.1 | 425,536 | 393,077 | 8.3 | ||||||||||||||||||
| Total deposits | $508,757 | $513,909 | $512,291 | (1.0) | (.7) | $508,576 | $506,633 | .4 | ||||||||||||||||||
 |
U.S. Bancorp Third Quarter 2024 Results |
||||
| NONINTEREST INCOME | ||||||||||||||||||||||||||
| ($ in millions) | Percent Change | |||||||||||||||||||||||||
| 3Q 2024 | 2Q 2024 | 3Q 2023 | 3Q24 vs 2Q24 | 3Q24 vs 3Q23 | YTD 2024 |
YTD 2023 |
Percent Change | |||||||||||||||||||
| Card revenue | $426 | $428 | $412 | (.5) | 3.4 | $1,246 | $1,194 | 4.4 | ||||||||||||||||||
| Corporate payment products revenue | 203 | 195 | 198 | 4.1 | 2.5 | 582 | 577 | .9 | ||||||||||||||||||
| Merchant processing services | 440 | 454 | 427 | (3.1) | 3.0 | 1,295 | 1,250 | 3.6 | ||||||||||||||||||
| Trust and investment management fees | 667 | 649 | 627 | 2.8 | 6.4 | 1,957 | 1,838 | 6.5 | ||||||||||||||||||
| Service charges | 302 | 322 | 334 | (6.2) | (9.6) | 939 | 982 | (4.4) | ||||||||||||||||||
| Commercial products revenue | 397 | 374 | 354 | 6.1 | 12.1 | 1,159 | 1,046 | 10.8 | ||||||||||||||||||
| Mortgage banking revenue | 155 | 190 | 144 | (18.4) | 7.6 | 511 | 433 | 18.0 | ||||||||||||||||||
| Investment products fees | 84 | 82 | 70 | 2.4 | 20.0 | 243 | 206 | 18.0 | ||||||||||||||||||
| Securities gains (losses), net | (119) | (36) | — | nm | nm | (153) | (29) | nm | ||||||||||||||||||
| Other | 143 | 157 | 198 | (8.9) | (27.8) | 434 | 522 | (16.9) | ||||||||||||||||||
| Total before balance sheet optimization | 2,698 | 2,815 | 2,764 | (4.2) | (2.4) | 8,213 | 8,019 | 2.4 | ||||||||||||||||||
| Balance sheet optimization | — | — | — | — | — | — | (22) | nm | ||||||||||||||||||
| Total noninterest income | $2,698 | $2,815 | $2,764 | (4.2) | (2.4) | $8,213 | $7,997 | 2.7 | ||||||||||||||||||
 |
U.S. Bancorp Third Quarter 2024 Results |
||||
| NONINTEREST EXPENSE | ||||||||||||||||||||||||||
| ($ in millions) | Percent Change | |||||||||||||||||||||||||
| 3Q 2024 | 2Q 2024 | 3Q 2023 | 3Q24 vs 2Q24 | 3Q24 vs 3Q23 | YTD 2024 |
YTD 2023 |
Percent Change | |||||||||||||||||||
| Compensation and employee benefits | $2,637 | $2,619 | $2,615 | .7 | .8 | $7,947 | $7,907 | .5 | ||||||||||||||||||
| Net occupancy and equipment | 317 | 316 | 313 | .3 | 1.3 | 929 | 950 | (2.2) | ||||||||||||||||||
| Professional services | 130 | 116 | 127 | 12.1 | 2.4 | 356 | 402 | (11.4) | ||||||||||||||||||
| Marketing and business development | 165 | 158 | 176 | 4.4 | (6.3) | 459 | 420 | 9.3 | ||||||||||||||||||
| Technology and communications | 524 | 509 | 511 | 2.9 | 2.5 | 1,540 | 1,536 | .3 | ||||||||||||||||||
| Other intangibles | 142 | 142 | 161 | — | (11.8) | 430 | 480 | (10.4) | ||||||||||||||||||
| Other | 289 | 328 | 343 | (11.9) | (15.7) | 1,061 | 1,121 | (5.4) | ||||||||||||||||||
| Total before notable items | 4,204 | 4,188 | 4,246 | .4 | (1.0) | 12,722 | 12,816 | (.7) | ||||||||||||||||||
| Notable items | — | 26 | 284 | nm | nm | 155 | 838 | (81.5) | ||||||||||||||||||
| Total noninterest expense | $4,204 | $4,214 | $4,530 | (.2) | (7.2) | $12,877 | $13,654 | (5.7) | ||||||||||||||||||
 |
U.S. Bancorp Third Quarter 2024 Results |
||||
| ALLOWANCE FOR CREDIT LOSSES | ||||||||||||||||||||||||||||||||
| ($ in millions) | 3Q 2024 | % (a) | 2Q 2024 | % (a) | 1Q 2024 | % (a) | 4Q 2023 | % (a) | 3Q 2023 | % (a) | ||||||||||||||||||||||
| Balance, beginning of period | $7,934 | $7,904 | $7,839 | $7,790 | $7,695 | |||||||||||||||||||||||||||
| Net charge-offs | ||||||||||||||||||||||||||||||||
| Commercial | 139 | .43 | 135 | .42 | 109 | .35 | 78 | .24 | 86 | .26 | ||||||||||||||||||||||
| Lease financing | 8 | .77 | 8 | .77 | 7 | .68 | 7 | .66 | 6 | .55 | ||||||||||||||||||||||
| Total commercial | 147 | .44 | 143 | .43 | 116 | .36 | 85 | .26 | 92 | .27 | ||||||||||||||||||||||
| Commercial mortgages | 69 | .68 | 35 | .34 | 15 | .15 | 75 | .71 | 49 | .46 | ||||||||||||||||||||||
| Construction and development | 1 | .04 | 1 | .04 | 6 | .21 | (4) | (.14) | — | — | ||||||||||||||||||||||
| Total commercial real estate | 70 | .54 | 36 | .28 | 21 | .16 | 71 | .52 | 49 | .36 | ||||||||||||||||||||||
| Residential mortgages | (3) | (.01) | (4) | (.01) | — | — | (1) | — | (3) | (.01) | ||||||||||||||||||||||
| Credit card | 299 | 4.10 | 315 | 4.47 | 296 | 4.26 | 255 | 3.65 | 220 | 3.25 | ||||||||||||||||||||||
| Retail leasing | 5 | .49 | 3 | .29 | 5 | .49 | 2 | .19 | 2 | .18 | ||||||||||||||||||||||
| Home equity and second mortgages | (1) | (.03) | (1) | (.03) | — | — | (1) | (.03) | 1 | .03 | ||||||||||||||||||||||
| Other | 47 | .73 | 46 | .71 | 50 | .76 | 52 | .74 | 59 | .80 | ||||||||||||||||||||||
| Total other retail | 51 | .47 | 48 | .45 | 55 | .51 | 53 | .47 | 62 | .53 | ||||||||||||||||||||||
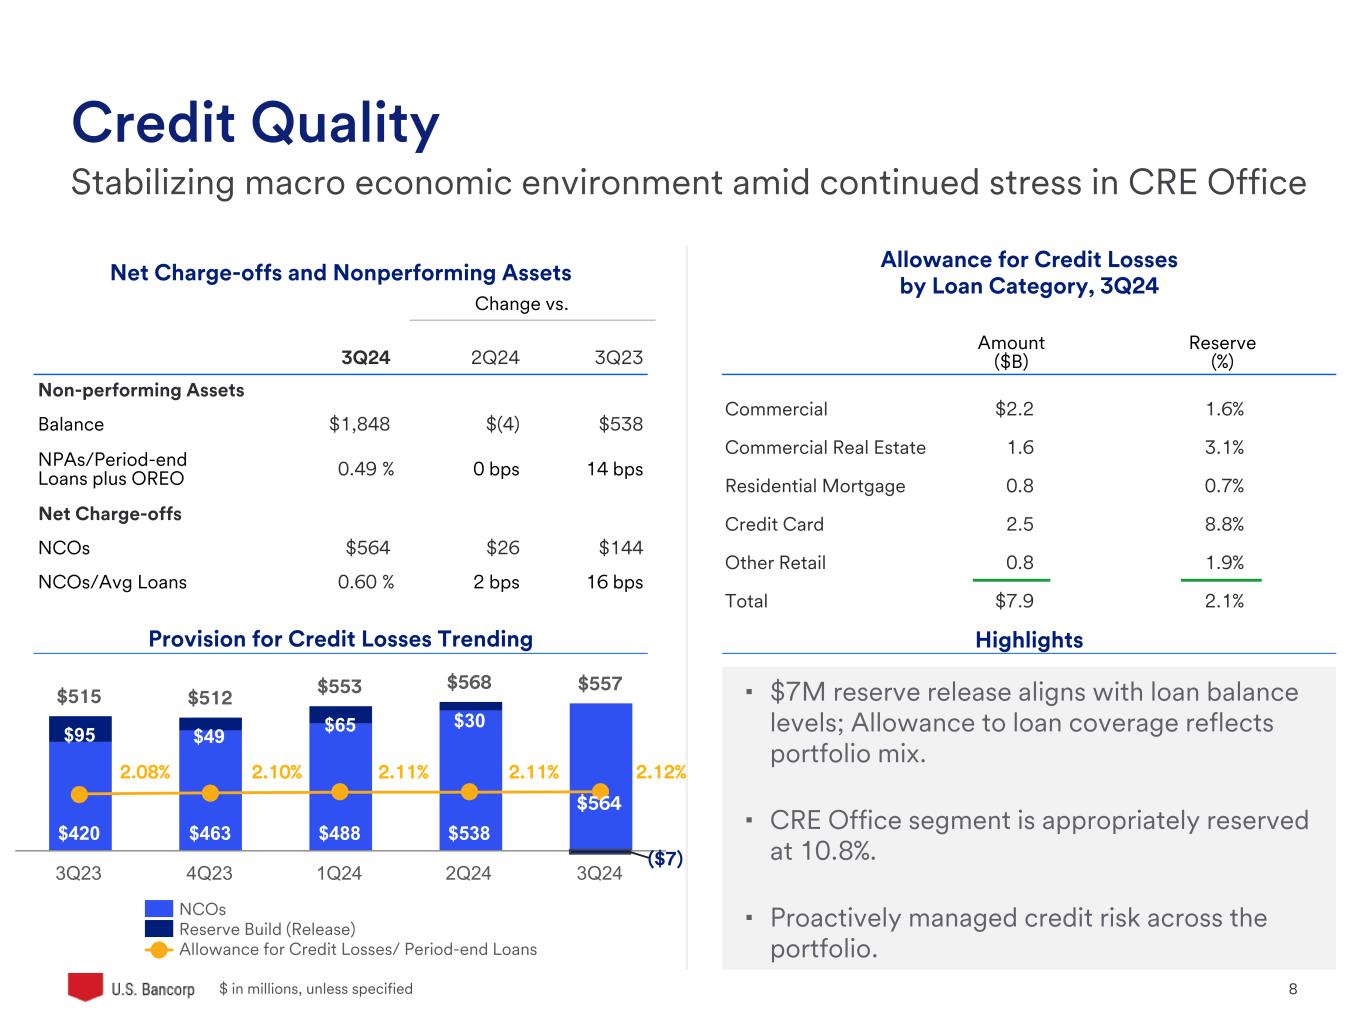
| Total net charge-offs | 564 | .60 | 538 | .58 | 488 | .53 | 463 | .49 | 420 | .44 | ||||||||||||||||||||||
| Provision for credit losses | 557 | 568 | 553 | 512 | 515 | |||||||||||||||||||||||||||
| Balance, end of period | $7,927 | $7,934 | $7,904 | $7,839 | $7,790 | |||||||||||||||||||||||||||
| Components | ||||||||||||||||||||||||||||||||
| Allowance for loan losses | $7,560 | $7,549 | $7,514 | $7,379 | $7,218 | |||||||||||||||||||||||||||
| Liability for unfunded credit commitments | 367 | 385 | 390 | 460 | 572 | |||||||||||||||||||||||||||
| Total allowance for credit losses | $7,927 | $7,934 | $7,904 | $7,839 | $7,790 | |||||||||||||||||||||||||||
| Gross charge-offs | $669 | $652 | $595 | $559 | $508 | |||||||||||||||||||||||||||
| Gross recoveries | $105 | $114 | $107 | $96 | $88 | |||||||||||||||||||||||||||
| Allowance for credit losses as a percentage of | ||||||||||||||||||||||||||||||||
| Period-end loans (%) | 2.12 | 2.11 | 2.11 | 2.10 | 2.08 | |||||||||||||||||||||||||||
| Nonperforming loans (%) | 438 | 438 | 454 | 541 | 615 | |||||||||||||||||||||||||||
| Nonperforming assets (%) | 429 | 428 | 443 | 525 | 595 | |||||||||||||||||||||||||||
(a) Annualized and calculated on average loan balances | ||||||||||||||||||||||||||||||||
 |
U.S. Bancorp Third Quarter 2024 Results |
||||
 |
U.S. Bancorp Third Quarter 2024 Results |
||||
| DELINQUENT LOAN RATIOS AS A PERCENT OF ENDING LOAN BALANCES | |||||||||||||||||
| (Percent) | Sep 30 2024 | Jun 30 2024 | Mar 31 2024 | Dec 31 2023 | Sep 30 2023 | ||||||||||||
| Delinquent loan ratios - 90 days or more past due | |||||||||||||||||
| Commercial | .07 | .06 | .08 | .09 | .05 | ||||||||||||
| Commercial real estate | .02 | .02 | — | .01 | — | ||||||||||||
| Residential mortgages | .15 | .15 | .12 | .12 | .11 | ||||||||||||
| Credit card | 1.36 | 1.30 | 1.42 | 1.31 | 1.17 | ||||||||||||
| Other retail | .14 | .14 | .15 | .15 | .13 | ||||||||||||
| Total loans | .20 | .19 | .19 | .19 | .15 | ||||||||||||
| Delinquent loan ratios - 90 days or more past due and nonperforming loans | |||||||||||||||||
| Commercial | .51 | .48 | .49 | .37 | .24 | ||||||||||||
| Commercial real estate | 1.85 | 1.87 | 1.71 | 1.46 | 1.33 | ||||||||||||
| Residential mortgages | .28 | .28 | .26 | .25 | .25 | ||||||||||||
| Credit card | 1.36 | 1.30 | 1.42 | 1.31 | 1.17 | ||||||||||||
| Other retail | .48 | .47 | .47 | .46 | .41 | ||||||||||||
| Total loans | .68 | .67 | .66 | .57 | .49 | ||||||||||||
| ASSET QUALITY (a) | |||||||||||||||||
| ($ in millions) | |||||||||||||||||
| Sep 30 2024 | Jun 30 2024 | Mar 31 2024 | Dec 31 2023 | Sep 30 2023 | |||||||||||||
| Nonperforming loans | |||||||||||||||||
| Commercial | $560 | $531 | $522 | $349 | $231 | ||||||||||||
| Lease financing | 25 | 25 | 27 | 27 | 25 | ||||||||||||
| Total commercial | 585 | 556 | 549 | 376 | 256 | ||||||||||||
| Commercial mortgages | 853 | 888 | 755 | 675 | 566 | ||||||||||||
| Construction and development | 72 | 71 | 145 | 102 | 155 | ||||||||||||
| Total commercial real estate | 925 | 959 | 900 | 777 | 721 | ||||||||||||
| Residential mortgages | 154 | 154 | 155 | 158 | 161 | ||||||||||||
| Credit card | — | — | — | — | — | ||||||||||||
| Other retail | 145 | 141 | 137 | 138 | 129 | ||||||||||||
| Total nonperforming loans | 1,809 | 1,810 | 1,741 | 1,449 | 1,267 | ||||||||||||
| Other real estate | 21 | 23 | 25 | 26 | 25 | ||||||||||||
| Other nonperforming assets | 18 | 19 | 20 | 19 | 18 | ||||||||||||
| Total nonperforming assets | $1,848 | $1,852 | $1,786 | $1,494 | $1,310 | ||||||||||||
| Accruing loans 90 days or more past due | $738 | $701 | $714 | $698 | $569 | ||||||||||||
| Nonperforming assets to loans plus ORE (%) | .49 | .49 | .48 | .40 | .35 | ||||||||||||
| (a) Throughout this document, nonperforming assets and related ratios do not include accruing loans 90 days or more past due | |||||||||||||||||
 |
U.S. Bancorp Third Quarter 2024 Results |
||||
| COMMON SHARES | |||||||||||||||||
| (Millions) | 3Q 2024 | 2Q 2024 | 1Q 2024 | 4Q 2023 | 3Q 2023 | ||||||||||||
| Beginning shares outstanding | 1,560 | 1,560 | 1,558 | 1,557 | 1,533 | ||||||||||||
| Shares issued for stock incentive plans, | |||||||||||||||||
| acquisitions and other corporate purposes | 1 | — | 3 | 1 | 24 | ||||||||||||
| Shares repurchased | — | — | (1) | — | — | ||||||||||||
| Ending shares outstanding | 1,561 | 1,560 | 1,560 | 1,558 | 1,557 | ||||||||||||
| CAPITAL POSITION | Preliminary Data | |||||||||||||||||||||||||||||||
| ($ in millions) | Sep 30 2024 | Jun 30 2024 | Mar 31 2024 | Dec 31 2023 | Sep 30 2023 | |||||||||||||||||||||||||||
| Total U.S. Bancorp shareholders' equity | $58,859 | $56,420 | $55,568 | $55,306 | $53,113 | |||||||||||||||||||||||||||
| Basel III Standardized Approach (a) | ||||||||||||||||||||||||||||||||
| Common equity tier 1 capital | $47,164 | $46,239 | $45,239 | $44,947 | $44,655 | |||||||||||||||||||||||||||
| Tier 1 capital | 54,416 | 53,491 | 52,491 | 52,199 | 51,906 | |||||||||||||||||||||||||||
| Total risk-based capital | 63,625 | 62,926 | 62,203 | 61,921 | 61,737 | |||||||||||||||||||||||||||
| Common equity tier 1 capital ratio | 10.5 | % | 10.3 | % | 10.0 | % | 9.9 | % | 9.7 | % | ||||||||||||||||||||||
| Tier 1 capital ratio | 12.2 | 11.9 | 11.6 | 11.5 | 11.2 | |||||||||||||||||||||||||||
| Total risk-based capital ratio | 14.2 | 14.0 | 13.7 | 13.7 | 13.4 | |||||||||||||||||||||||||||
| Leverage ratio | 8.3 | 8.1 | 8.1 | 8.1 | 7.9 | |||||||||||||||||||||||||||
| Tangible common equity to tangible assets (b) | 5.7 | 5.4 | 5.2 | 5.3 | 5.0 | |||||||||||||||||||||||||||
| Tangible common equity to risk-weighted assets (b) | 8.6 | 8.0 | 7.8 | 7.7 | 7.0 | |||||||||||||||||||||||||||
| Common equity tier 1 capital to risk-weighted assets, reflecting the full implementation of the current expected credit losses methodology (b) | 10.5 | 10.2 | 9.9 | 9.7 | 9.5 | |||||||||||||||||||||||||||
|
(a) Amounts and ratios calculated in accordance with transitional regulatory requirements related to the current expected credit losses methodology
(b) See Non-GAAP Financial Measures reconciliation on page 18
| ||||||||||||||||||||||||||||||||
 |
U.S. Bancorp Third Quarter 2024 Results |
||||
| Investor Conference Call | ||
| About U.S. Bancorp | ||
| Forward-looking Statements | ||
 |
U.S. Bancorp Third Quarter 2024 Results |
||||
 |
U.S. Bancorp Third Quarter 2024 Results |
||||
| Non-GAAP Financial Measures | ||

| CONSOLIDATED STATEMENT OF INCOME | ||||||||||||||
| (Dollars and Shares in Millions, Except Per Share Data) | Three Months Ended September 30, |
Nine Months Ended September 30, |
||||||||||||
| (Unaudited) | 2024 | 2023 | 2024 | 2023 | ||||||||||
| Interest Income | ||||||||||||||
| Loans | $5,862 | $5,700 | $17,335 | $16,582 | ||||||||||
| Loans held for sale | 45 | 42 | 123 | 111 | ||||||||||
| Investment securities | 1,316 | 1,152 | 3,785 | 3,303 | ||||||||||
| Other interest income | 863 | 860 | 2,592 | 2,248 | ||||||||||
| Total interest income | 8,086 | 7,754 | 23,835 | 22,244 | ||||||||||
| Interest Expense | ||||||||||||||
| Deposits | 3,004 | 2,580 | 8,916 | 6,024 | ||||||||||
| Short-term borrowings | 284 | 450 | 850 | 1,639 | ||||||||||
| Long-term debt | 663 | 488 | 1,926 | 1,296 | ||||||||||
| Total interest expense | 3,951 | 3,518 | 11,692 | 8,959 | ||||||||||
| Net interest income | 4,135 | 4,236 | 12,143 | 13,285 | ||||||||||
| Provision for credit losses | 557 | 515 | 1,678 | 1,763 | ||||||||||
| Net interest income after provision for credit losses | 3,578 | 3,721 | 10,465 | 11,522 | ||||||||||
| Noninterest Income | ||||||||||||||
| Card revenue | 426 | 412 | 1,246 | 1,194 | ||||||||||
| Corporate payment products revenue | 203 | 198 | 582 | 577 | ||||||||||
| Merchant processing services | 440 | 427 | 1,295 | 1,250 | ||||||||||
| Trust and investment management fees | 667 | 627 | 1,957 | 1,838 | ||||||||||
| Service charges | 302 | 334 | 939 | 982 | ||||||||||
| Commercial products revenue | 397 | 354 | 1,159 | 1,046 | ||||||||||
| Mortgage banking revenue | 155 | 144 | 511 | 403 | ||||||||||
| Investment products fees | 84 | 70 | 243 | 206 | ||||||||||
| Securities gains (losses), net | (119) | — | (153) | (29) | ||||||||||
| Other | 143 | 198 | 434 | 530 | ||||||||||
| Total noninterest income | 2,698 | 2,764 | 8,213 | 7,997 | ||||||||||
| Noninterest Expense | ||||||||||||||
| Compensation and employee benefits | 2,637 | 2,615 | 7,947 | 7,907 | ||||||||||
| Net occupancy and equipment | 317 | 313 | 929 | 950 | ||||||||||
| Professional services | 130 | 127 | 356 | 402 | ||||||||||
| Marketing and business development | 165 | 176 | 459 | 420 | ||||||||||
| Technology and communications | 524 | 511 | 1,540 | 1,536 | ||||||||||
| Other intangibles | 142 | 161 | 430 | 480 | ||||||||||
| Merger and integration charges | — | 284 | 155 | 838 | ||||||||||
| Other | 289 | 343 | 1,061 | 1,121 | ||||||||||
| Total noninterest expense | 4,204 | 4,530 | 12,877 | 13,654 | ||||||||||
| Income before income taxes | 2,072 | 1,955 | 5,801 | 5,865 | ||||||||||
| Applicable income taxes | 350 | 431 | 1,142 | 1,268 | ||||||||||
| Net income | 1,722 | 1,524 | 4,659 | 4,597 | ||||||||||
| Net (income) loss attributable to noncontrolling interests | (8) | (1) | (23) | (15) | ||||||||||
| Net income attributable to U.S. Bancorp | $1,714 | $1,523 | $4,636 | $4,582 | ||||||||||
| Net income applicable to U.S. Bancorp common shareholders | $1,601 | $1,412 | $4,328 | $4,285 | ||||||||||
| Earnings per common share | $1.03 | $.91 | $2.77 | $2.79 | ||||||||||
| Diluted earnings per common share | $1.03 | $.91 | $2.77 | $2.79 | ||||||||||
| Dividends declared per common share | $.50 | $.48 | $1.48 | $1.44 | ||||||||||
| Average common shares outstanding | 1,561 | 1,548 | 1,560 | 1,538 | ||||||||||
| Average diluted common shares outstanding | 1,561 | 1,549 | 1,561 | 1,538 | ||||||||||

| CONSOLIDATED ENDING BALANCE SHEET | |||||||||||
| (Dollars in Millions) | September 30, 2024 |
December 31, 2023 |
September 30, 2023 |
||||||||
| Assets | (Unaudited) | (Unaudited) | |||||||||
| Cash and due from banks | $73,562 | $61,192 | $64,354 | ||||||||
| Investment securities | |||||||||||
| Held-to-maturity | 80,025 | 84,045 | 85,342 | ||||||||
| Available-for-sale | 81,704 | 69,706 | 67,207 | ||||||||
| Loans held for sale | 3,211 | 2,201 | 2,336 | ||||||||
| Loans | |||||||||||
| Commercial | 133,638 | 131,881 | 133,319 | ||||||||
| Commercial real estate | 50,619 | 53,455 | 54,131 | ||||||||
| Residential mortgages | 118,034 | 115,530 | 115,055 | ||||||||
| Credit card | 29,037 | 28,560 | 27,080 | ||||||||
| Other retail | 42,836 | 44,409 | 45,649 | ||||||||
| Total loans | 374,164 | 373,835 | 375,234 | ||||||||
| Less allowance for loan losses | (7,560) | (7,379) | (7,218) | ||||||||
| Net loans | 366,604 | 366,456 | 368,016 | ||||||||
| Premises and equipment | 3,585 | 3,623 | 3,616 | ||||||||
| Goodwill | 12,573 | 12,489 | 12,472 | ||||||||
| Other intangible assets | 5,488 | 6,084 | 6,435 | ||||||||
| Other assets | 59,717 | 57,695 | 58,261 | ||||||||
| Total assets | $686,469 | $663,491 | $668,039 | ||||||||
| Liabilities and Shareholders' Equity | |||||||||||
| Deposits | |||||||||||
| Noninterest-bearing | $86,838 | $89,989 | $98,006 | ||||||||
| Interest-bearing | 434,293 | 422,323 | 420,352 | ||||||||
| Total deposits | 521,131 | 512,312 | 518,358 | ||||||||
| Short-term borrowings | 23,708 | 15,279 | 21,900 | ||||||||
| Long-term debt | 54,839 | 51,480 | 43,074 | ||||||||
| Other liabilities | 27,470 | 28,649 | 31,129 | ||||||||
| Total liabilities | 627,148 | 607,720 | 614,461 | ||||||||
| Shareholders' equity | |||||||||||
| Preferred stock | 6,808 | 6,808 | 6,808 | ||||||||
| Common stock | 21 | 21 | 21 | ||||||||
| Capital surplus | 8,729 | 8,673 | 8,684 | ||||||||
| Retained earnings | 76,057 | 74,026 | 74,023 | ||||||||
| Less treasury stock | (24,010) | (24,126) | (24,168) | ||||||||
| Accumulated other comprehensive income (loss) | (8,746) | (10,096) | (12,255) | ||||||||
| Total U.S. Bancorp shareholders' equity | 58,859 | 55,306 | 53,113 | ||||||||
| Noncontrolling interests | 462 | 465 | 465 | ||||||||
| Total equity | 59,321 | 55,771 | 53,578 | ||||||||
| Total liabilities and equity | $686,469 | $663,491 | $668,039 | ||||||||

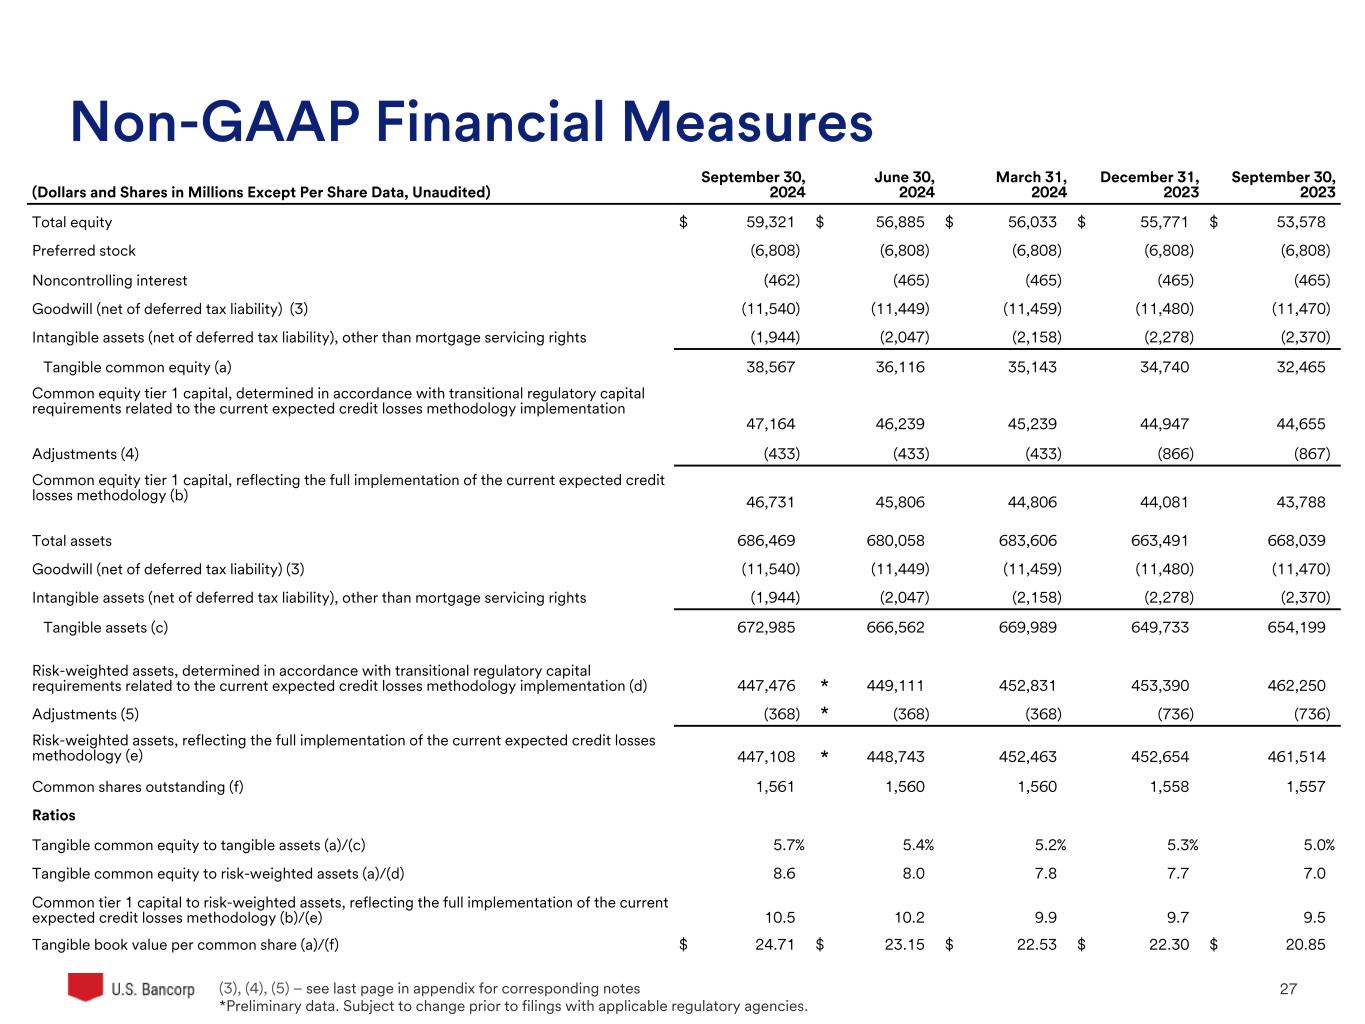
| NON-GAAP FINANCIAL MEASURES | ||||||||||||||||||||
| (Dollars in Millions, Unaudited) | September 30, 2024 |
June 30, 2024 |
March 31, 2024 |
December 31, 2023 |
September 30, 2023 |
|||||||||||||||
| Total equity | $59,321 | $56,885 | $56,033 | $55,771 | $53,578 | |||||||||||||||
| Preferred stock | (6,808) | (6,808) | (6,808) | (6,808) | (6,808) | |||||||||||||||
| Noncontrolling interests | (462) | (465) | (465) | (465) | (465) | |||||||||||||||
Goodwill (net of deferred tax liability) (1) |
(11,540) | (11,449) | (11,459) | (11,480) | (11,470) | |||||||||||||||
| Intangible assets (net of deferred tax liability), other than mortgage servicing rights | (1,944) | (2,047) | (2,158) | (2,278) | (2,370) | |||||||||||||||
Tangible common equity (a) |
38,567 | 36,116 | 35,143 | 34,740 | 32,465 | |||||||||||||||
|
Common equity tier 1 capital, determined in accordance with transitional regulatory
capital requirements related to the current expected credit losses methodology implementation
|
47,164 | 46,239 | 45,239 | 44,947 | 44,655 | |||||||||||||||
Adjustments (2) |
(433) | (433) | (433) | (866) | (867) | |||||||||||||||
| Common equity tier 1 capital, reflecting the full implementation | ||||||||||||||||||||
of the current expected credit losses methodology (b) |
46,731 | 45,806 | 44,806 | 44,081 | 43,788 | |||||||||||||||
| Total assets | 686,469 | 680,058 | 683,606 | 663,491 | 668,039 | |||||||||||||||
Goodwill (net of deferred tax liability) (1) |
(11,540) | (11,449) | (11,459) | (11,480) | (11,470) | |||||||||||||||
| Intangible assets (net of deferred tax liability), other than mortgage servicing rights | (1,944) | (2,047) | (2,158) | (2,278) | (2,370) | |||||||||||||||
Tangible assets (c) |
672,985 | 666,562 | 669,989 | 649,733 | 654,199 | |||||||||||||||
|
Risk-weighted assets, determined in accordance with transitional regulatory capital
requirements related to the current expected credit losses methodology
implementation (d)
|
447,476 | * | 449,111 | 452,831 | 453,390 | 462,250 | ||||||||||||||
Adjustments (3) |
(368) | * | (368) | (368) | (736) | (736) | ||||||||||||||
|
Risk-weighted assets, reflecting the full implementation of the current expected
credit losses methodology (e)
|
447,108 | * | 448,743 | 452,463 | 452,654 | 461,514 | ||||||||||||||
| Ratios * | ||||||||||||||||||||
Tangible common equity to tangible assets (a)/(c) |
5.7 | % | 5.4 | % | 5.2 | % | 5.3 | % | 5.0 | % | ||||||||||
Tangible common equity to risk-weighted assets (a)/(d) |
8.6 | 8.0 | 7.8 | 7.7 | 7.0 | |||||||||||||||
|
Common equity tier 1 capital to risk-weighted assets, reflecting the full
implementation of the current expected credit losses methodology (b)/(e)
|
10.5 | 10.2 | 9.9 | 9.7 | 9.5 | |||||||||||||||
| Three Months Ended | ||||||||||||||||||||
| September 30, 2024 |
June 30, 2024 |
March 31, 2024 |
December 31, 2023 |
September 30, 2023 |
||||||||||||||||
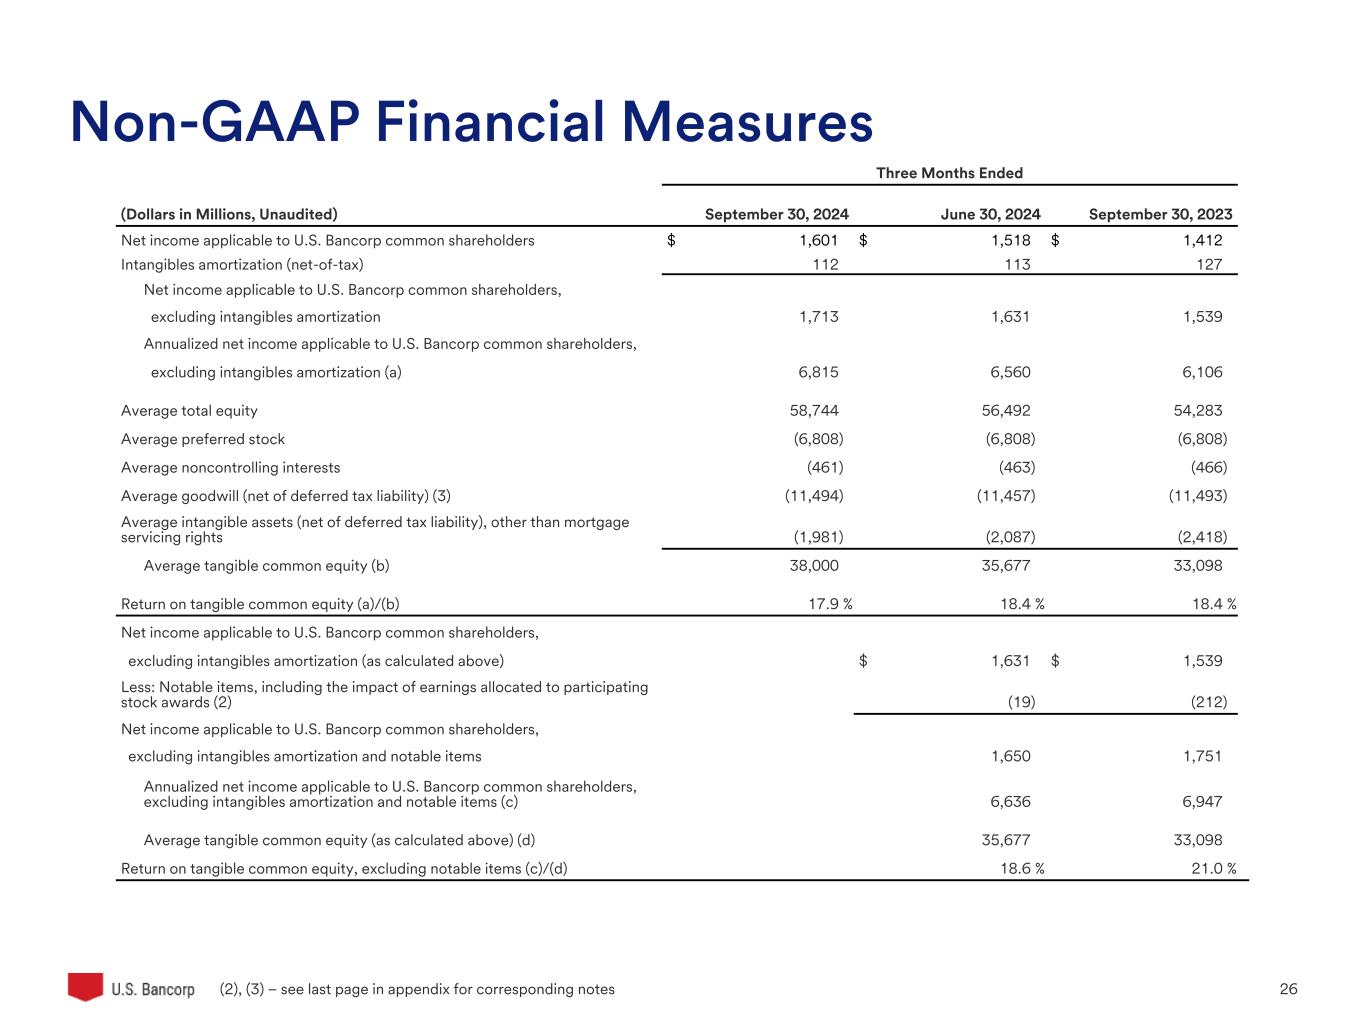
| Net income applicable to U.S. Bancorp common shareholders | $1,601 | $1,518 | $1,209 | $766 | $1,412 | |||||||||||||||
| Intangibles amortization (net-of-tax) | 112 | 113 | 115 | 123 | 127 | |||||||||||||||
|
Net income applicable to U.S. Bancorp common shareholders, excluding
intangibles amortization
|
1,713 | 1,631 | 1,324 | 889 | 1,539 | |||||||||||||||
|
Annualized net income applicable to U.S. Bancorp common shareholders,
excluding intangible amortization (f)
|
6,815 | 6,560 | 5,325 | 3,527 | 6,106 | |||||||||||||||
| Average total equity | 58,744 | 56,492 | 56,131 | 54,779 | 54,283 | |||||||||||||||
| Average preferred stock | (6,808) | (6,808) | (6,808) | (6,808) | (6,808) | |||||||||||||||
| Average noncontrolling interests | (461) | (463) | (464) | (465) | (466) | |||||||||||||||
Average goodwill (net of deferred tax liability) (1) |
(11,494) | (11,457) | (11,473) | (11,475) | (11,493) | |||||||||||||||
|
Average intangible assets (net of deferred tax liability), other than mortgage
servicing rights
|
(1,981) | (2,087) | (2,208) | (2,295) | (2,418) | |||||||||||||||
Average tangible common equity (g) |
38,000 | 35,677 | 35,178 | 33,736 | 33,098 | |||||||||||||||
Return on tangible common equity (f)/(g) |
17.9 | % | 18.4 | % | 15.1 | % | 10.5 | % | 18.4 | % | ||||||||||
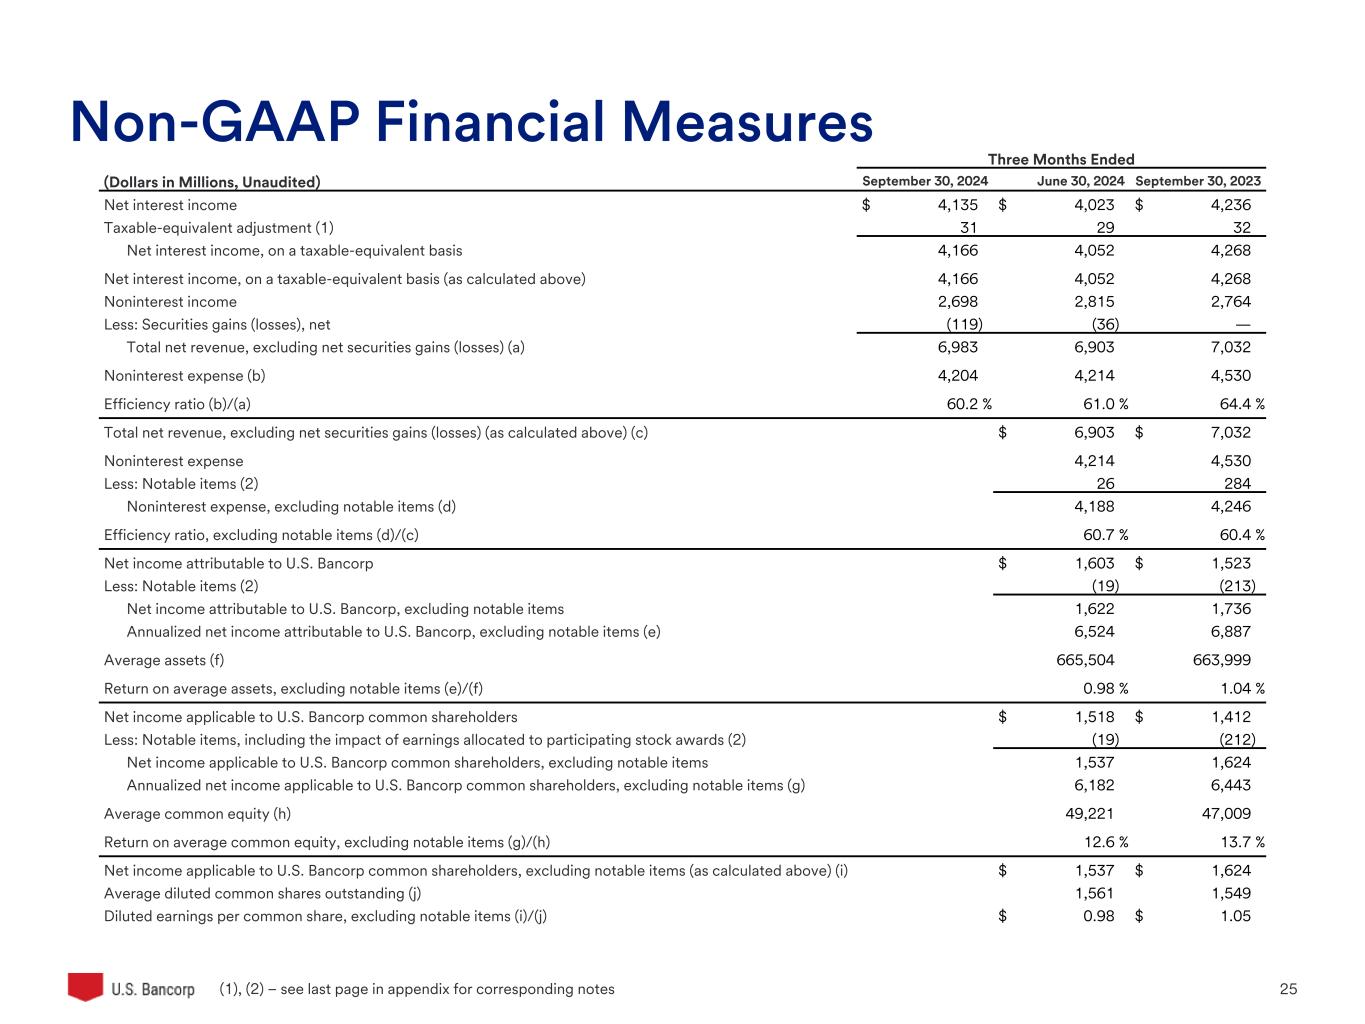
| Net interest income | $4,135 | $4,023 | $3,985 | $4,111 | $4,236 | |||||||||||||||
Taxable-equivalent adjustment (4) |
31 | 29 | 30 | 31 | 32 | |||||||||||||||
| Net interest income, on a taxable-equivalent basis | 4,166 | 4,052 | 4,015 | 4,142 | 4,268 | |||||||||||||||
| Net interest income, on a taxable-equivalent basis (as calculated above) | 4,166 | 4,052 | 4,015 | 4,142 | 4,268 | |||||||||||||||
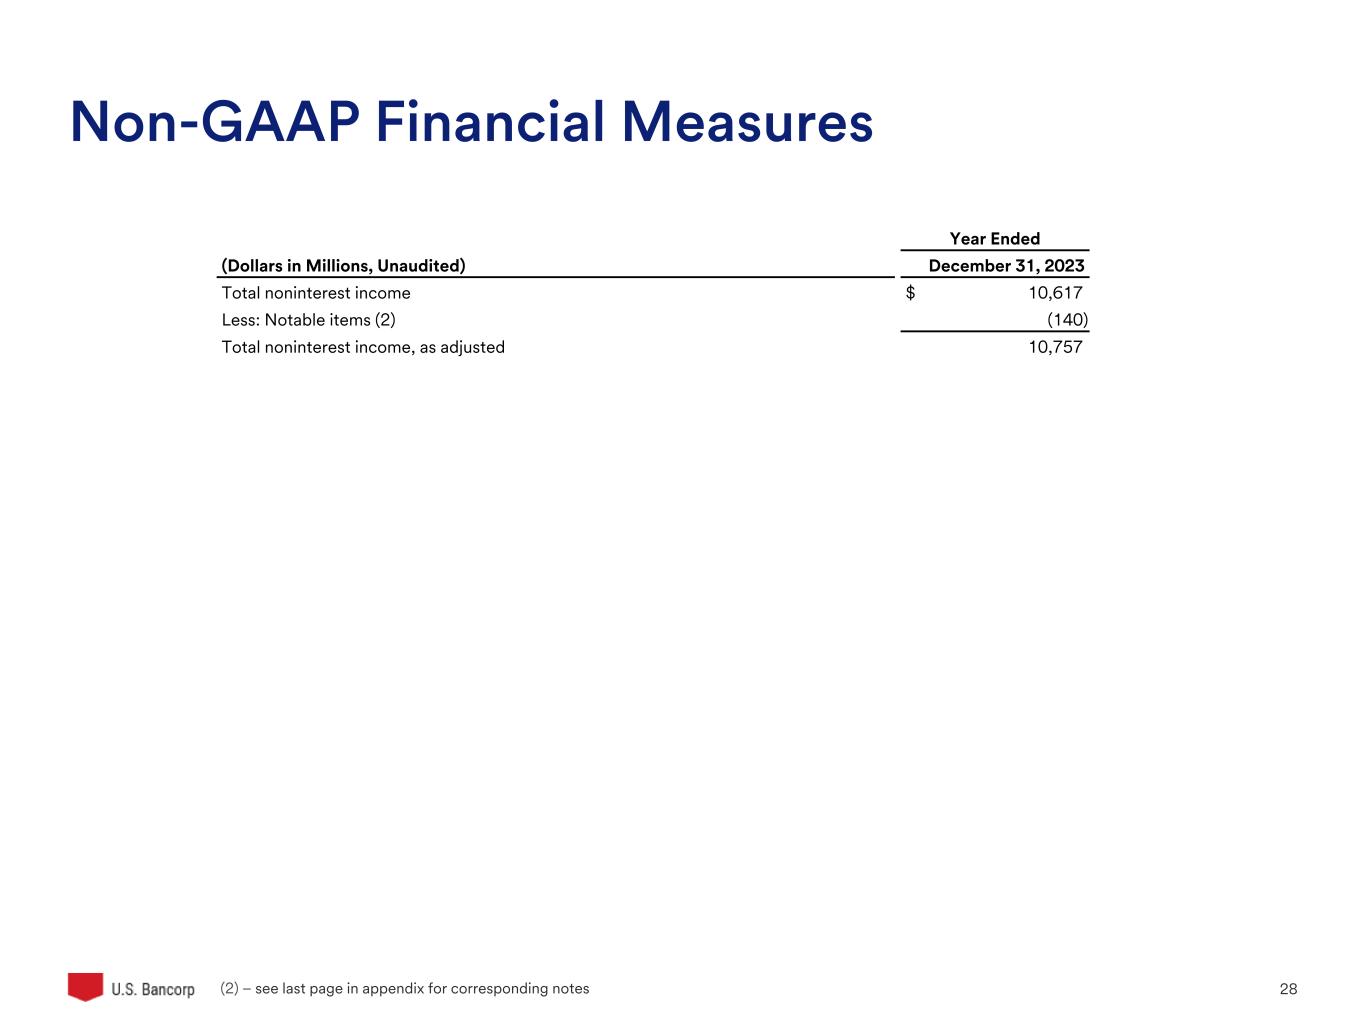
| Noninterest income | 2,698 | 2,815 | 2,700 | 2,620 | 2,764 | |||||||||||||||
| Less: Securities gains (losses), net | (119) | (36) | 2 | (116) | — | |||||||||||||||
Total net revenue, excluding net securities gains (losses) (h) |
6,983 | 6,903 | 6,713 | 6,878 | 7,032 | |||||||||||||||
Noninterest expense (i) |
4,204 | 4,214 | 4,459 | 5,219 | 4,530 | |||||||||||||||
| Less: Intangible amortization | 142 | 142 | 146 | 156 | 161 | |||||||||||||||
Noninterest expense, excluding intangible amortization (j) |
4,062 | 4,072 | 4,313 | 5,063 | 4,369 | |||||||||||||||
Efficiency ratio (i)/(h) |
60.2 | % | 61.0 | % | 66.4 | % | 75.9 | % | 64.4 | % | ||||||||||
Tangible efficiency ratio (j)/(h) |
58.2 | 59.0 | 64.2 | 73.6 | 62.1 | |||||||||||||||

| NON-GAAP FINANCIAL MEASURES | ||||||||||||||
| Three Months Ended | Nine Months Ended | |||||||||||||
| (Dollars and Shares in Millions, Except Per Share Data, Unaudited) | June 30, 2024 |
September 30, 2023 |
September 30, 2024 |
September 30, 2023 |
||||||||||
| Net income applicable to U.S. Bancorp common shareholders | $1,518 | $1,412 | $4,328 | $4,285 | ||||||||||
Less: Notable items, including the impact of earnings allocated to participating stock awards (1), (2) |
(19) | (212) | (217) | (822) | ||||||||||
Net income applicable to U.S. Bancorp common shareholders, excluding notable items (a) |
1,537 | 1,624 | 4,545 | 5,107 | ||||||||||
Average diluted common shares outstanding (b) |
1,561 | 1,549 | 1,561 | 1,538 | ||||||||||
Diluted earnings per common share, excluding notable items (a)/(b) |
$.98 | $1.05 | $2.91 | $3.32 | ||||||||||

|
Business Line Schedules
Third Quarter 2024
| ||
|
WEALTH, CORPORATE, COMMERCIAL AND
INSTITUTIONAL BANKING
CONSUMER AND BUSINESS BANKING
PAYMENT SERVICES
TREASURY AND CORPORATE SUPPORT
| ||

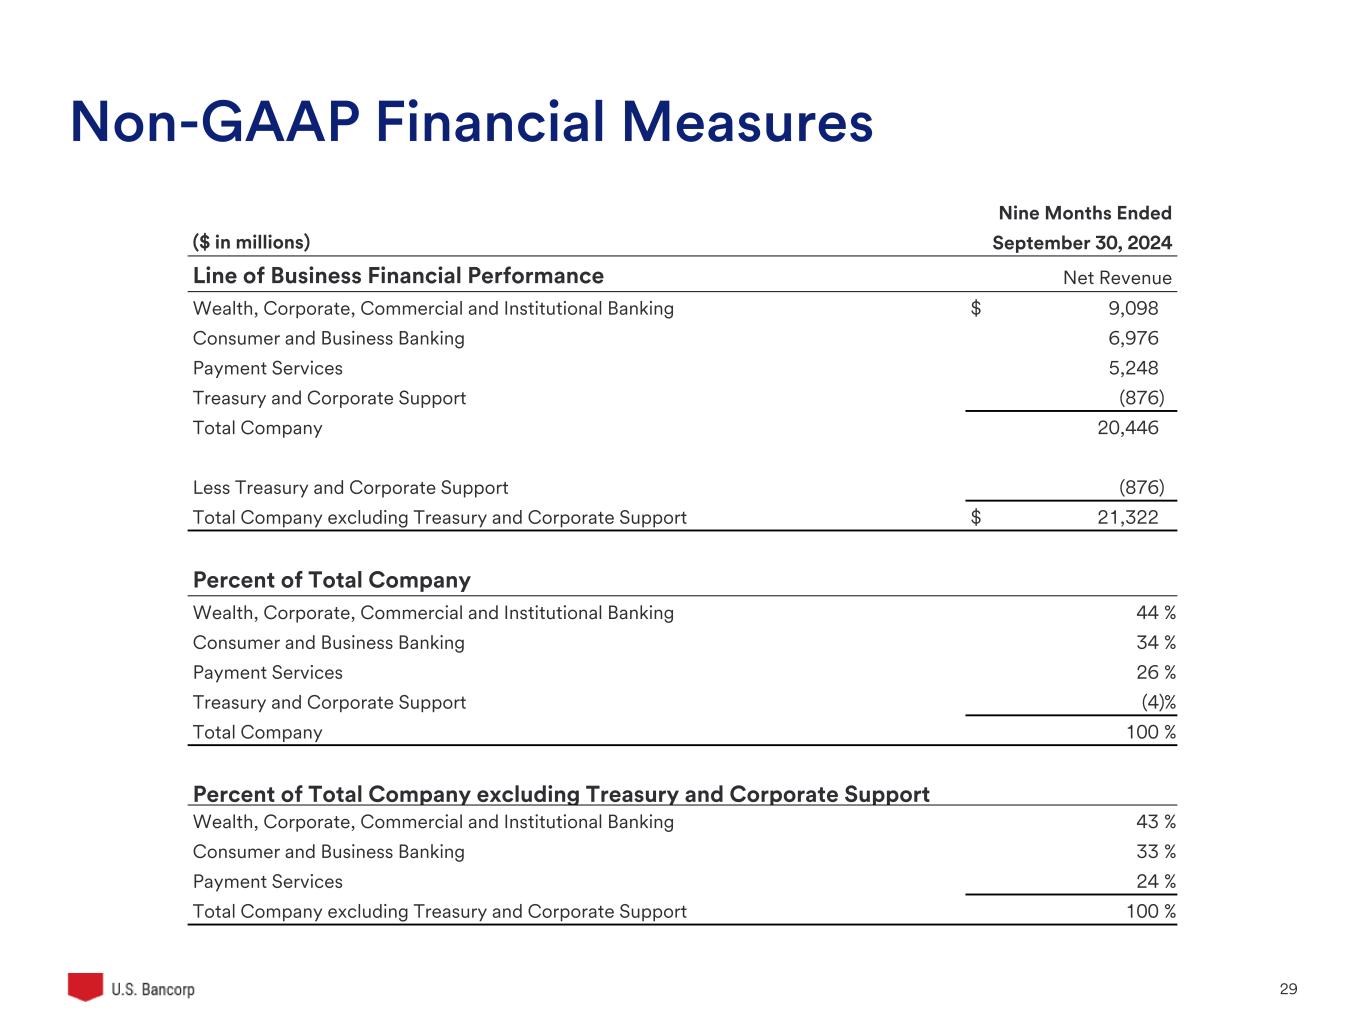
| LINE OF BUSINESS FINANCIAL PERFORMANCE | Preliminary data | |||||||||||||||||||||||||||||||
| ($ in millions) | Net Income Attributable to U.S. Bancorp |
Percent Change | Net Income Attributable to U.S. Bancorp | |||||||||||||||||||||||||||||
| Business Line | 3Q 2024 |
2Q 2024 |
3Q 2023 |
3Q24 vs 2Q24 | 3Q24 vs 3Q23 | YTD 2024 |
YTD 2023 |
Percent Change | ||||||||||||||||||||||||
| Wealth, Corporate, Commercial and Institutional Banking |
$1,187 | $1,177 | $1,183 | .8 | .3 | $3,470 | $3,495 | (.7) | ||||||||||||||||||||||||
| Consumer and Business Banking | 476 | 483 | 565 | (1.4) | (15.8) | 1,422 | 2,039 | (30.3) | ||||||||||||||||||||||||
| Payment Services | 277 | 283 | 223 | (2.1) | 24.2 | 792 | 867 | (8.7) | ||||||||||||||||||||||||
| Treasury and Corporate Support | (226) | (340) | (448) | 33.5 | 49.6 | (1,048) | (1,819) | 42.4 | ||||||||||||||||||||||||
| Consolidated Company | $1,714 | $1,603 | $1,523 | 6.9 | 12.5 | $4,636 | $4,582 | 1.2 | ||||||||||||||||||||||||
| Income Before Provision and Taxes |
Percent Change | Income Before Provision and Taxes |
||||||||||||||||||||||||||||||
| 3Q 2024 |
2Q 2024 |
3Q 2023 |
3Q24 vs 2Q24 | 3Q24 vs 3Q23 | YTD 2024 |
YTD 2023 |
Percent Change | |||||||||||||||||||||||||
| Wealth, Corporate, Commercial and Institutional Banking |
$1,677 | $1,670 | $1,713 | .4 | (2.1) | $4,963 | $4,931 | .6 | ||||||||||||||||||||||||
| Consumer and Business Banking | 653 | 674 | 761 | (3.1) | (14.2) | 1,999 | 2,749 | (27.3) | ||||||||||||||||||||||||
| Payment Services | 774 | 765 | 696 | 1.2 | 11.2 | 2,208 | 2,088 | 5.7 | ||||||||||||||||||||||||
| Treasury and Corporate Support | (444) | (456) | (668) | 2.6 | 33.5 | (1,601) | (2,040) | 21.5 | ||||||||||||||||||||||||
| Consolidated Company | $2,660 | $2,653 | $2,502 | .3 | 6.3 | $7,569 | $7,728 | (2.1) | ||||||||||||||||||||||||
 |
|||||
| WEALTH, CORPORATE, COMMERCIAL AND INSTITUTIONAL BANKING | Preliminary data | ||||||||||||||||||||||||||||
| ($ in millions) | Percent Change | ||||||||||||||||||||||||||||
| 3Q 2024 |
2Q 2024 |
3Q 2023 |
3Q24 vs 2Q24 | 3Q24 vs 3Q23 | YTD 2024 |
YTD 2023 |
Percent Change | ||||||||||||||||||||||
| Condensed Income Statement | |||||||||||||||||||||||||||||
| Net interest income (taxable-equivalent basis) | $1,896 | $1,910 | $2,023 | (.7) | (6.3) | $5,711 | $5,884 | (2.9) | |||||||||||||||||||||
| Noninterest income | 1,145 | 1,130 | 1,030 | 1.3 | 11.2 | 3,387 | 3,120 | 8.6 | |||||||||||||||||||||
| Securities gains (losses), net | — | — | — | — | — | — | — | — | |||||||||||||||||||||
| Total net revenue | 3,041 | 3,040 | 3,053 | — | (.4) | 9,098 | 9,004 | 1.0 | |||||||||||||||||||||
| Noninterest expense | 1,312 | 1,318 | 1,283 | (.5) | 2.3 | 3,979 | 3,898 | 2.1 | |||||||||||||||||||||
| Other intangibles | 52 | 52 | 57 | — | (8.8) | 156 | 175 | (10.9) | |||||||||||||||||||||
| Total noninterest expense | 1,364 | 1,370 | 1,340 | (.4) | 1.8 | 4,135 | 4,073 | 1.5 | |||||||||||||||||||||
| Income before provision and taxes | 1,677 | 1,670 | 1,713 | .4 | (2.1) | 4,963 | 4,931 | .6 | |||||||||||||||||||||
| Provision for credit losses | 94 | 100 | 136 | (6.0) | (30.9) | 335 | 271 | 23.6 | |||||||||||||||||||||
| Income before income taxes | 1,583 | 1,570 | 1,577 | .8 | .4 | 4,628 | 4,660 | (.7) | |||||||||||||||||||||
| Income taxes and taxable-equivalent adjustment |
396 | 393 | 394 | .8 | .5 | 1,158 | 1,165 | (.6) | |||||||||||||||||||||
| Net income | 1,187 | 1,177 | 1,183 | .8 | .3 | 3,470 | 3,495 | (.7) | |||||||||||||||||||||
| Net (income) loss attributable to noncontrolling interests |
— | — | — | — | — | — | — | — | |||||||||||||||||||||
| Net income attributable to U.S. Bancorp | $1,187 | $1,177 | $1,183 | .8 | .3 | $3,470 | $3,495 | (.7) | |||||||||||||||||||||
| Average Balance Sheet Data | |||||||||||||||||||||||||||||
| Loans | $171,833 | $173,784 | $175,700 | (1.1) | (2.2) | $172,249 | $177,161 | (2.8) | |||||||||||||||||||||
| Other earning assets | 10,740 | 9,590 | 6,458 | 12.0 | 66.3 | 9,693 | 6,386 | 51.8 | |||||||||||||||||||||
| Goodwill | 4,825 | 4,824 | 4,638 | — | 4.0 | 4,825 | 4,634 | 4.1 | |||||||||||||||||||||
| Other intangible assets | 955 | 1,007 | 921 | (5.2) | 3.7 | 1,007 | 972 | 3.6 | |||||||||||||||||||||
| Assets | 200,199 | 203,288 | 203,910 | (1.5) | (1.8) | 200,912 | 203,442 | (1.2) | |||||||||||||||||||||
| Noninterest-bearing deposits | 54,263 | 57,218 | 66,055 | (5.2) | (17.9) | 56,650 | 73,789 | (23.2) | |||||||||||||||||||||
| Interest-bearing deposits | 215,604 | 216,796 | 210,041 | (.5) | 2.6 | 213,572 | 201,805 | 5.8 | |||||||||||||||||||||
| Total deposits | 269,867 | 274,014 | 276,096 | (1.5) | (2.3) | 270,222 | 275,594 | (1.9) | |||||||||||||||||||||
| Total U.S. Bancorp shareholders' equity | 21,277 | 21,485 | 22,839 | (1.0) | (6.8) | 21,506 | 22,249 | (3.3) | |||||||||||||||||||||
 |
|||||
| CONSUMER AND BUSINESS BANKING | Preliminary data | ||||||||||||||||||||||||||||
| ($ in millions) | Percent Change | ||||||||||||||||||||||||||||
| 3Q 2024 |
2Q 2024 |
3Q 2023 |
3Q24 vs 2Q24 | 3Q24 vs 3Q23 | YTD 2024 |
YTD 2023 |
Percent Change | ||||||||||||||||||||||
| Condensed Income Statement | |||||||||||||||||||||||||||||
| Net interest income (taxable-equivalent basis) | $1,937 | $1,921 | $2,048 | .8 | (5.4) | $5,737 | $6,730 | (14.8) | |||||||||||||||||||||
| Noninterest income | 401 | 414 | 434 | (3.1) | (7.6) | 1,239 | 1,265 | (2.1) | |||||||||||||||||||||
| Securities gains (losses), net | — | — | — | — | — | — | — | — | |||||||||||||||||||||
| Total net revenue | 2,338 | 2,335 | 2,482 | .1 | (5.8) | 6,976 | 7,995 | (12.7) | |||||||||||||||||||||
| Noninterest expense | 1,618 | 1,594 | 1,646 | 1.5 | (1.7) | 4,776 | 5,026 | (5.0) | |||||||||||||||||||||
| Other intangibles | 67 | 67 | 75 | — | (10.7) | 201 | 220 | (8.6) | |||||||||||||||||||||
| Total noninterest expense | 1,685 | 1,661 | 1,721 | 1.4 | (2.1) | 4,977 | 5,246 | (5.1) | |||||||||||||||||||||
| Income before provision and taxes | 653 | 674 | 761 | (3.1) | (14.2) | 1,999 | 2,749 | (27.3) | |||||||||||||||||||||
| Provision for credit losses | 18 | 30 | 7 | (40.0) | nm | 102 | 30 | nm | |||||||||||||||||||||
| Income before income taxes | 635 | 644 | 754 | (1.4) | (15.8) | 1,897 | 2,719 | (30.2) | |||||||||||||||||||||
| Income taxes and taxable-equivalent adjustment |
159 | 161 | 189 | (1.2) | (15.9) | 475 | 680 | (30.1) | |||||||||||||||||||||
| Net income | 476 | 483 | 565 | (1.4) | (15.8) | 1,422 | 2,039 | (30.3) | |||||||||||||||||||||
| Net (income) loss attributable to noncontrolling interests |
— | — | — | — | — | — | — | — | |||||||||||||||||||||
| Net income attributable to U.S. Bancorp | $476 | $483 | $565 | (1.4) | (15.8) | $1,422 | $2,039 | (30.3) | |||||||||||||||||||||
| Average Balance Sheet Data | |||||||||||||||||||||||||||||
| Loans | $155,304 | $154,954 | $157,458 | .2 | (1.4) | $155,073 | $164,050 | (5.5) | |||||||||||||||||||||
| Other earning assets | 2,738 | 2,278 | 2,688 | 20.2 | 1.9 | 2,300 | 2,462 | (6.6) | |||||||||||||||||||||
| Goodwill | 4,326 | 4,326 | 4,515 | — | (4.2) | 4,326 | 4,514 | (4.2) | |||||||||||||||||||||
| Other intangible assets | 4,405 | 4,734 | 5,154 | (6.9) | (14.5) | 4,611 | 5,378 | (14.3) | |||||||||||||||||||||
| Assets | 168,937 | 168,729 | 174,883 | .1 | (3.4) | 168,954 | 181,735 | (7.0) | |||||||||||||||||||||
| Noninterest-bearing deposits | 20,781 | 20,974 | 25,561 | (.9) | (18.7) | 21,068 | 33,599 | (37.3) | |||||||||||||||||||||
| Interest-bearing deposits | 200,897 | 202,444 | 192,725 | (.8) | 4.2 | 200,719 | 182,267 | 10.1 | |||||||||||||||||||||
| Total deposits | 221,678 | 223,418 | 218,286 | (.8) | 1.6 | 221,787 | 215,866 | 2.7 | |||||||||||||||||||||
| Total U.S. Bancorp shareholders' equity | 14,247 | 14,560 | 15,770 | (2.1) | (9.7) | 14,552 | 16,246 | (10.4) | |||||||||||||||||||||
 |
|||||
| PAYMENT SERVICES | Preliminary data | ||||||||||||||||||||||||||||
| ($ in millions) | Percent Change | ||||||||||||||||||||||||||||
| 3Q 2024 |
2Q 2024 |
3Q 2023 |
3Q24 vs 2Q24 | 3Q24 vs 3Q23 | YTD 2024 |
YTD 2023 |
Percent Change | ||||||||||||||||||||||
| Condensed Income Statement | |||||||||||||||||||||||||||||
| Net interest income (taxable-equivalent basis) | $727 | $673 | $663 | 8.0 | 9.7 | $2,102 | $1,933 | 8.7 | |||||||||||||||||||||
| Noninterest income | 1,073 | 1,094 | 1,039 | (1.9) | 3.3 | 3,146 | 3,026 | 4.0 | |||||||||||||||||||||
| Securities gains (losses), net | — | — | — | — | — | — | — | — | |||||||||||||||||||||
| Total net revenue | 1,800 | 1,767 | 1,702 | 1.9 | 5.8 | 5,248 | 4,959 | 5.8 | |||||||||||||||||||||
| Noninterest expense | 1,003 | 979 | 977 | 2.5 | 2.7 | 2,967 | 2,786 | 6.5 | |||||||||||||||||||||
| Other intangibles | 23 | 23 | 29 | — | (20.7) | 73 | 85 | (14.1) | |||||||||||||||||||||
| Total noninterest expense | 1,026 | 1,002 | 1,006 | 2.4 | 2.0 | 3,040 | 2,871 | 5.9 | |||||||||||||||||||||
| Income before provision and taxes | 774 | 765 | 696 | 1.2 | 11.2 | 2,208 | 2,088 | 5.7 | |||||||||||||||||||||
| Provision for credit losses | 404 | 388 | 399 | 4.1 | 1.3 | 1,151 | 933 | 23.4 | |||||||||||||||||||||
| Income before income taxes | 370 | 377 | 297 | (1.9) | 24.6 | 1,057 | 1,155 | (8.5) | |||||||||||||||||||||
| Income taxes and taxable-equivalent adjustment |
93 | 94 | 74 | (1.1) | 25.7 | 265 | 288 | (8.0) | |||||||||||||||||||||
| Net income | 277 | 283 | 223 | (2.1) | 24.2 | 792 | 867 | (8.7) | |||||||||||||||||||||
| Net (income) loss attributable to noncontrolling interests |
— | — | — | — | — | — | — | — | |||||||||||||||||||||
| Net income attributable to U.S. Bancorp | $277 | $283 | $223 | (2.1) | 24.2 | $792 | $867 | (8.7) | |||||||||||||||||||||
| Average Balance Sheet Data | |||||||||||||||||||||||||||||
| Loans | $41,653 | $40,832 | $38,954 | 2.0 | 6.9 | $40,766 | $37,942 | 7.4 | |||||||||||||||||||||
| Other earning assets | 8 | 115 | 5 | (93.0) | 60.0 | 92 | 126 | (27.0) | |||||||||||||||||||||
| Goodwill | 3,370 | 3,327 | 3,333 | 1.3 | 1.1 | 3,343 | 3,326 | .5 | |||||||||||||||||||||
| Other intangible assets | 266 | 281 | 340 | (5.3) | (21.8) | 282 | 361 | (21.9) | |||||||||||||||||||||
| Assets | 47,199 | 46,099 | 44,774 | 2.4 | 5.4 | 46,707 | 43,926 | 6.3 | |||||||||||||||||||||
| Noninterest-bearing deposits | 2,653 | 2,706 | 2,796 | (2.0) | (5.1) | 2,716 | 3,052 | (11.0) | |||||||||||||||||||||
| Interest-bearing deposits | 95 | 97 | 101 | (2.1) | (5.9) | 96 | 104 | (7.7) | |||||||||||||||||||||
| Total deposits | 2,748 | 2,803 | 2,897 | (2.0) | (5.1) | 2,812 | 3,156 | (10.9) | |||||||||||||||||||||
| Total U.S. Bancorp shareholders' equity | 9,959 | 9,941 | 9,442 | .2 | 5.5 | 9,955 | 9,181 | 8.4 | |||||||||||||||||||||
 |
|||||
| TREASURY AND CORPORATE SUPPORT | Preliminary data | ||||||||||||||||||||||||||||
| ($ in millions) | Percent Change | ||||||||||||||||||||||||||||
| 3Q 2024 |
2Q 2024 |
3Q 2023 |
3Q24 vs 2Q24 | 3Q24 vs 3Q23 | YTD 2024 |
YTD 2023 |
Percent Change | ||||||||||||||||||||||
| Condensed Income Statement | |||||||||||||||||||||||||||||
| Net interest income (taxable-equivalent basis) | ($394) | ($452) | ($466) | 12.8 | 15.5 | ($1,317) | ($1,162) | (13.3) | |||||||||||||||||||||
| Noninterest income | 198 | 213 | 261 | (7.0) | (24.1) | 594 | 615 | (3.4) | |||||||||||||||||||||
| Securities gains (losses), net | (119) | (36) | — | nm | nm | (153) | (29) | nm | |||||||||||||||||||||
| Total net revenue | (315) | (275) | (205) | (14.5) | (53.7) | (876) | (576) | (52.1) | |||||||||||||||||||||
| Noninterest expense | 129 | 181 | 463 | (28.7) | (72.1) | 725 | 1,464 | (50.5) | |||||||||||||||||||||
| Other intangibles | — | — | — | — | — | — | — | — | |||||||||||||||||||||
| Total noninterest expense | 129 | 181 | 463 | (28.7) | (72.1) | 725 | 1,464 | (50.5) | |||||||||||||||||||||
| Income (loss) before provision and taxes | (444) | (456) | (668) | 2.6 | 33.5 | (1,601) | (2,040) | 21.5 | |||||||||||||||||||||
| Provision for credit losses | 41 | 50 | (27) | (18.0) | nm | 90 | 529 | (83.0) | |||||||||||||||||||||
| Income (loss) before income taxes | (485) | (506) | (641) | 4.2 | 24.3 | (1,691) | (2,569) | 34.2 | |||||||||||||||||||||
| Income taxes and taxable-equivalent adjustment |
(267) | (174) | (194) | (53.4) | (37.6) | (666) | (765) | 12.9 | |||||||||||||||||||||
| Net income | (218) | (332) | (447) | 34.3 | 51.2 | (1,025) | (1,804) | 43.2 | |||||||||||||||||||||
| Net (income) loss attributable to noncontrolling interests |
(8) | (8) | (1) | — | nm | (23) | (15) | (53.3) | |||||||||||||||||||||
| Net income (loss) attributable to U.S. Bancorp | ($226) | ($340) | ($448) | 33.5 | 49.6 | ($1,048) | ($1,819) | 42.4 | |||||||||||||||||||||
| Average Balance Sheet Data | |||||||||||||||||||||||||||||
| Loans | $5,280 | $5,115 | $4,765 | 3.2 | 10.8 | $5,190 | $4,959 | 4.7 | |||||||||||||||||||||
| Other earning assets | 219,624 | 222,224 | 219,217 | (1.2) | .2 | 218,717 | 215,805 | 1.3 | |||||||||||||||||||||
| Goodwill | — | — | — | — | — | — | — | — | |||||||||||||||||||||
| Other intangible assets | 9 | 9 | 10 | — | (10.0) | 9 | 19 | (52.6) | |||||||||||||||||||||
| Assets | 248,305 | 247,388 | 240,432 | .4 | 3.3 | 244,790 | 238,378 | 2.7 | |||||||||||||||||||||
| Noninterest-bearing deposits | 3,242 | 2,520 | 3,112 | 28.7 | 4.2 | 2,606 | 3,116 | (16.4) | |||||||||||||||||||||
| Interest-bearing deposits | 11,222 | 11,154 | 11,900 | .6 | (5.7) | 11,149 | 8,901 | 25.3 | |||||||||||||||||||||
| Total deposits | 14,464 | 13,674 | 15,012 | 5.8 | (3.7) | 13,755 | 12,017 | 14.5 | |||||||||||||||||||||
| Total U.S. Bancorp shareholders' equity | 12,800 | 10,043 | 5,766 | 27.5 | nm | 10,653 | 5,764 | 84.8 | |||||||||||||||||||||
 |
|||||
|
Supplemental Consolidated Schedules
Third Quarter 2024
| ||
 |
|||||
| QUARTERLY CONSOLIDATED STATEMENT OF INCOME | |||||||||||||||||
| (Dollars and Shares in Millions, Except Per Share Data) (Unaudited) |
September 30, 2024 |
June 30, 2024 |
March 31, 2024 |
December 31, 2023 |
September 30, 2023 |
||||||||||||
| Interest Income | |||||||||||||||||
| Loans | $5,862 | $5,761 | $5,712 | $5,742 | $5,700 | ||||||||||||
| Loans held for sale | 45 | 41 | 37 | 36 | 42 | ||||||||||||
| Investment securities | 1,316 | 1,294 | 1,175 | 1,182 | 1,152 | ||||||||||||
| Other interest income | 863 | 889 | 840 | 803 | 860 | ||||||||||||
| Total interest income | 8,086 | 7,985 | 7,764 | 7,763 | 7,754 | ||||||||||||
| Interest Expense | |||||||||||||||||
| Deposits | 3,004 | 3,028 | 2,884 | 2,751 | 2,580 | ||||||||||||
| Short-term borrowings | 284 | 296 | 270 | 332 | 450 | ||||||||||||
| Long-term debt | 663 | 638 | 625 | 569 | 488 | ||||||||||||
| Total interest expense | 3,951 | 3,962 | 3,779 | 3,652 | 3,518 | ||||||||||||
| Net interest income | 4,135 | 4,023 | 3,985 | 4,111 | 4,236 | ||||||||||||
| Provision for credit losses | 557 | 568 | 553 | 512 | 515 | ||||||||||||
| Net interest income after provision for credit losses | 3,578 | 3,455 | 3,432 | 3,599 | 3,721 | ||||||||||||
| Noninterest Income | |||||||||||||||||
| Card revenue | 426 | 428 | 392 | 436 | 412 | ||||||||||||
| Corporate payment products revenue | 203 | 195 | 184 | 182 | 198 | ||||||||||||
| Merchant processing services | 440 | 454 | 401 | 409 | 427 | ||||||||||||
| Trust and investment management fees | 667 | 649 | 641 | 621 | 627 | ||||||||||||
| Service charges | 302 | 322 | 315 | 324 | 334 | ||||||||||||
| Commercial products revenue | 397 | 374 | 388 | 326 | 354 | ||||||||||||
| Mortgage banking revenue | 155 | 190 | 166 | 137 | 144 | ||||||||||||
| Investment products fees | 84 | 82 | 77 | 73 | 70 | ||||||||||||
| Securities gains (losses), net | (119) | (36) | 2 | (116) | — | ||||||||||||
| Other | 143 | 157 | 134 | 228 | 198 | ||||||||||||
| Total noninterest income | 2,698 | 2,815 | 2,700 | 2,620 | 2,764 | ||||||||||||
| Noninterest Expense | |||||||||||||||||
| Compensation and employee benefits | 2,637 | 2,619 | 2,691 | 2,509 | 2,615 | ||||||||||||
| Net occupancy and equipment | 317 | 316 | 296 | 316 | 313 | ||||||||||||
| Professional services | 130 | 116 | 110 | 158 | 127 | ||||||||||||
| Marketing and business development | 165 | 158 | 136 | 306 | 176 | ||||||||||||
| Technology and communications | 524 | 509 | 507 | 513 | 511 | ||||||||||||
| Other intangibles | 142 | 142 | 146 | 156 | 161 | ||||||||||||
| Merger and integration charges | — | — | 155 | 171 | 284 | ||||||||||||
| Other | 289 | 354 | 418 | 1,090 | 343 | ||||||||||||
| Total noninterest expense | 4,204 | 4,214 | 4,459 | 5,219 | 4,530 | ||||||||||||
| Income before income taxes | 2,072 | 2,056 | 1,673 | 1,000 | 1,955 | ||||||||||||
| Applicable income taxes | 350 | 445 | 347 | 139 | 431 | ||||||||||||
| Net income | 1,722 | 1,611 | 1,326 | 861 | 1,524 | ||||||||||||
| Net (income) loss attributable to noncontrolling interests | (8) | (8) | (7) | (14) | (1) | ||||||||||||
| Net income attributable to U.S. Bancorp | $1,714 | $1,603 | $1,319 | $847 | $1,523 | ||||||||||||
| Net income applicable to U.S. Bancorp common shareholders | $1,601 | $1,518 | $1,209 | $766 | $1,412 | ||||||||||||
| Earnings per common share | $1.03 | $.97 | $.78 | $.49 | $.91 | ||||||||||||
| Diluted earnings per common share | $1.03 | $.97 | $.78 | $.49 | $.91 | ||||||||||||
| Dividends declared per common share | $.50 | $.49 | $.49 | $.49 | $.48 | ||||||||||||
| Average common shares outstanding | 1,561 | 1,560 | 1,559 | 1,557 | 1,548 | ||||||||||||
| Average diluted common shares outstanding | 1,561 | 1,561 | 1,559 | 1,558 | 1,549 | ||||||||||||
| Financial Ratios (%) | |||||||||||||||||
| Net interest margin (taxable-equivalent basis) | 2.74 | 2.67 | 2.70 | 2.78 | 2.81 | ||||||||||||
| Return on average assets | 1.03 | .97 | .81 | .52 | .91 | ||||||||||||
| Return on average common equity | 12.4 | 12.4 | 10.0 | 6.4 | 11.9 | ||||||||||||
| Efficiency ratio | 60.2 | 61.0 | 66.4 | 75.9 | 64.4 | ||||||||||||
 |
|||||
| CONSOLIDATED ENDING BALANCE SHEET | |||||||||||||||||
| (Dollars in Millions) | September 30, 2024 |
June 30, 2024 |
March 31, 2024 |
December 31, 2023 |
September 30, 2023 |
||||||||||||
| Assets | (Unaudited) | (Unaudited) | (Unaudited) | (Unaudited) | |||||||||||||
| Cash and due from banks | $73,562 | $65,832 | $76,985 | $61,192 | $64,354 | ||||||||||||
| Investment securities | |||||||||||||||||
| Held-to-maturity | 80,025 | 81,486 | 82,948 | 84,045 | 85,342 | ||||||||||||
| Available-for-sale | 81,704 | 79,799 | 72,426 | 69,706 | 67,207 | ||||||||||||
| Loans held for sale | 3,211 | 2,582 | 2,080 | 2,201 | 2,336 | ||||||||||||
| Loans | |||||||||||||||||
| Commercial | 133,638 | 135,248 | 134,726 | 131,881 | 133,319 | ||||||||||||
| Commercial real estate | 50,619 | 51,887 | 52,677 | 53,455 | 54,131 | ||||||||||||
| Residential mortgages | 118,034 | 117,147 | 116,079 | 115,530 | 115,055 | ||||||||||||
| Credit card | 29,037 | 28,715 | 27,844 | 28,560 | 27,080 | ||||||||||||
| Other retail | 42,836 | 43,136 | 43,262 | 44,409 | 45,649 | ||||||||||||
| Total loans | 374,164 | 376,133 | 374,588 | 373,835 | 375,234 | ||||||||||||
| Less allowance for loan losses | (7,560) | (7,549) | (7,514) | (7,379) | (7,218) | ||||||||||||
| Net loans | 366,604 | 368,584 | 367,074 | 366,456 | 368,016 | ||||||||||||
| Premises and equipment | 3,585 | 3,570 | 3,537 | 3,623 | 3,616 | ||||||||||||
| Goodwill | 12,573 | 12,476 | 12,479 | 12,489 | 12,472 | ||||||||||||
| Other intangible assets | 5,488 | 5,757 | 6,031 | 6,084 | 6,435 | ||||||||||||
| Other assets | 59,717 | 59,972 | 60,046 | 57,695 | 58,261 | ||||||||||||
| Total assets | $686,469 | $680,058 | $683,606 | $663,491 | $668,039 | ||||||||||||
| Liabilities and Shareholders' Equity | |||||||||||||||||
| Deposits | |||||||||||||||||
| Noninterest-bearing | $86,838 | $86,756 | $91,220 | $89,989 | $98,006 | ||||||||||||
| Interest-bearing | 434,293 | 437,029 | 436,843 | 422,323 | 420,352 | ||||||||||||
| Total deposits | 521,131 | 523,785 | 528,063 | 512,312 | 518,358 | ||||||||||||
| Short-term borrowings | 23,708 | 16,557 | 17,102 | 15,279 | 21,900 | ||||||||||||
| Long-term debt | 54,839 | 52,720 | 52,693 | 51,480 | 43,074 | ||||||||||||
| Other liabilities | 27,470 | 30,111 | 29,715 | 28,649 | 31,129 | ||||||||||||
| Total liabilities | 627,148 | 623,173 | 627,573 | 607,720 | 614,461 | ||||||||||||
| Shareholders' equity | |||||||||||||||||
| Preferred stock | 6,808 | 6,808 | 6,808 | 6,808 | 6,808 | ||||||||||||
| Common stock | 21 | 21 | 21 | 21 | 21 | ||||||||||||
| Capital surplus | 8,729 | 8,688 | 8,642 | 8,673 | 8,684 | ||||||||||||
| Retained earnings | 76,057 | 75,231 | 74,473 | 74,026 | 74,023 | ||||||||||||
| Less treasury stock | (24,010) | (24,020) | (24,023) | (24,126) | (24,168) | ||||||||||||
| Accumulated other comprehensive income (loss) | (8,746) | (10,308) | (10,353) | (10,096) | (12,255) | ||||||||||||
| Total U.S. Bancorp shareholders' equity | 58,859 | 56,420 | 55,568 | 55,306 | 53,113 | ||||||||||||
| Noncontrolling interests | 462 | 465 | 465 | 465 | 465 | ||||||||||||
| Total equity | 59,321 | 56,885 | 56,033 | 55,771 | 53,578 | ||||||||||||
| Total liabilities and equity | $686,469 | $680,058 | $683,606 | $663,491 | $668,039 | ||||||||||||
 |
|||||
| CONSOLIDATED QUARTERLY AVERAGE BALANCE SHEET | |||||||||||||||||
| (Dollars in Millions, Unaudited) | September 30, 2024 |
June 30, 2024 |
March 31, 2024 |
December 31, 2023 |
September 30, 2023 |
||||||||||||
| Assets | |||||||||||||||||
| Investment securities | $166,899 | $167,020 | $161,236 | $161,885 | $163,236 | ||||||||||||
| Loans held for sale | 2,757 | 2,382 | 2,002 | 2,154 | 2,661 | ||||||||||||
| Loans | |||||||||||||||||
| Commercial | |||||||||||||||||
| Commercial | 128,979 | 130,162 | 126,602 | 126,884 | 130,415 | ||||||||||||
| Lease financing | 4,159 | 4,177 | 4,165 | 4,212 | 4,305 | ||||||||||||
| Total commercial | 133,138 | 134,339 | 130,767 | 131,096 | 134,720 | ||||||||||||
| Commercial real estate | |||||||||||||||||
| Commercial mortgages | 40,343 | 40,871 | 41,545 | 42,089 | 42,665 | ||||||||||||
| Construction and development | 11,111 | 11,418 | 11,492 | 11,736 | 11,588 | ||||||||||||
| Total commercial real estate | 51,454 | 52,289 | 53,037 | 53,825 | 54,253 | ||||||||||||
| Residential mortgages | 117,559 | 116,478 | 115,639 | 115,196 | 114,627 | ||||||||||||
| Credit card | 28,994 | 28,349 | 27,942 | 27,753 | 26,883 | ||||||||||||
| Other retail | |||||||||||||||||
| Retail leasing | 4,088 | 4,185 | 4,082 | 4,167 | 4,436 | ||||||||||||
| Home equity and second mortgages | 13,239 | 13,053 | 12,983 | 12,977 | 12,809 | ||||||||||||
| Other | 25,598 | 25,992 | 26,620 | 27,842 | 29,149 | ||||||||||||
| Total other retail | 42,925 | 43,230 | 43,685 | 44,986 | 46,394 | ||||||||||||
| Total loans | 374,070 | 374,685 | 371,070 | 372,856 | 376,877 | ||||||||||||
| Interest-bearing deposits with banks | 50,547 | 53,056 | 50,903 | 47,532 | 53,100 | ||||||||||||
| Other earning assets | 12,907 | 11,749 | 10,924 | 9,817 | 9,371 | ||||||||||||
| Total earning assets | 607,180 | 608,892 | 596,135 | 594,244 | 605,245 | ||||||||||||
| Allowance for loan losses | (7,576) | (7,550) | (7,438) | (7,270) | (7,266) | ||||||||||||
| Unrealized gain (loss) on investment securities | (6,291) | (7,464) | (7,121) | (8,806) | (8,241) | ||||||||||||
| Other assets | 71,327 | 71,626 | 72,333 | 73,280 | 74,261 | ||||||||||||
| Total assets | $664,640 | $665,504 | $653,909 | $651,448 | $663,999 | ||||||||||||
| Liabilities and Shareholders' Equity | |||||||||||||||||
| Noninterest-bearing deposits | $80,939 | $83,418 | $84,787 | $90,590 | $97,524 | ||||||||||||
| Interest-bearing deposits | |||||||||||||||||
| Interest checking | 125,631 | 125,709 | 125,011 | 127,445 | 132,560 | ||||||||||||
| Money market savings | 206,546 | 208,386 | 196,502 | 187,322 | 177,340 | ||||||||||||
| Savings accounts | 36,814 | 38,855 | 41,645 | 44,728 | 50,138 | ||||||||||||
| Time deposits | 58,827 | 57,541 | 55,116 | 52,697 | 54,729 | ||||||||||||
| Total interest-bearing deposits | 427,818 | 430,491 | 418,274 | 412,192 | 414,767 | ||||||||||||
| Short-term borrowings | 17,723 | 17,098 | 16,364 | 18,645 | 27,550 | ||||||||||||
| Long-term debt | 54,841 | 52,875 | 52,713 | 48,863 | 43,826 | ||||||||||||
| Total interest-bearing liabilities | 500,382 | 500,464 | 487,351 | 479,700 | 486,143 | ||||||||||||
| Other liabilities | 24,575 | 25,130 | 25,640 | 26,379 | 26,049 | ||||||||||||
| Shareholders' equity | |||||||||||||||||
| Preferred equity | 6,808 | 6,808 | 6,808 | 6,808 | 6,808 | ||||||||||||
| Common equity | 51,475 | 49,221 | 48,859 | 47,506 | 47,009 | ||||||||||||
| Total U.S. Bancorp shareholders' equity | 58,283 | 56,029 | 55,667 | 54,314 | 53,817 | ||||||||||||
| Noncontrolling interests | 461 | 463 | 464 | 465 | 466 | ||||||||||||
| Total equity | 58,744 | 56,492 | 56,131 | 54,779 | 54,283 | ||||||||||||
| Total liabilities and equity | $664,640 | $665,504 | $653,909 | $651,448 | $663,999 | ||||||||||||
 |
|||||
| CONSOLIDATED DAILY AVERAGE BALANCE SHEET AND RELATED YIELDS AND RATES (a) | ||||||||||||||||||||||||||
| For the Three Months Ended September 30, | ||||||||||||||||||||||||||
| 2024 | 2023 | |||||||||||||||||||||||||
| (Dollars in Millions) (Unaudited) |
Average Balances |
Interest | Yields and Rates |
Average Balances |
Interest | Yields and Rates |
% Change Average Balances |
|||||||||||||||||||
| Assets | ||||||||||||||||||||||||||
| Investment securities (b) | $166,899 | $1,335 | 3.20 | % | $163,236 | $1,172 | 2.87 | % | 2.2 | % | ||||||||||||||||
| Loans held for sale | 2,757 | 45 | 6.44 | 2,661 | 42 | 6.28 | 3.6 | |||||||||||||||||||
| Loans (c) | ||||||||||||||||||||||||||
| Commercial | 133,138 | 2,217 | 6.63 | 134,720 | 2,254 | 6.64 | (1.2) | |||||||||||||||||||
| Commercial real estate | 51,454 | 841 | 6.50 | 54,253 | 854 | 6.25 | (5.2) | |||||||||||||||||||
| Residential mortgages | 117,559 | 1,160 | 3.95 | 114,627 | 1,078 | 3.76 | 2.6 | |||||||||||||||||||
| Credit card | 28,994 | 987 | 13.54 | 26,883 | 886 | 13.07 | 7.9 | |||||||||||||||||||
| Other retail | 42,925 | 669 | 6.20 | 46,394 | 642 | 5.49 | (7.5) | |||||||||||||||||||
| Total loans | 374,070 | 5,874 | 6.25 | 376,877 | 5,714 | 6.02 | (.7) | |||||||||||||||||||
| Interest-bearing deposits with banks | 50,547 | 694 | 5.46 | 53,100 | 742 | 5.55 | (4.8) | |||||||||||||||||||
| Other earning assets | 12,907 | 169 | 5.19 | 9,371 | 118 | 5.01 | 37.7 | |||||||||||||||||||
| Total earning assets | 607,180 | 8,117 | 5.33 | 605,245 | 7,788 | 5.12 | .3 | |||||||||||||||||||
| Allowance for loan losses | (7,576) | (7,266) | (4.3) | |||||||||||||||||||||||
| Unrealized gain (loss) on investment securities | (6,291) | (8,241) | 23.7 | |||||||||||||||||||||||
| Other assets | 71,327 | 74,261 | (4.0) | |||||||||||||||||||||||
| Total assets | $664,640 | $663,999 | .1 | |||||||||||||||||||||||
| Liabilities and Shareholders' Equity | ||||||||||||||||||||||||||
| Noninterest-bearing deposits | $80,939 | $97,524 | (17.0) | % | ||||||||||||||||||||||
| Interest-bearing deposits | ||||||||||||||||||||||||||
| Interest checking | 125,631 | 399 | 1.26 | 132,560 | 370 | 1.11 | (5.2) | |||||||||||||||||||
| Money market savings | 206,546 | 1,930 | 3.72 | 177,340 | 1,638 | 3.66 | 16.5 | |||||||||||||||||||
| Savings accounts | 36,814 | 28 | .30 | 50,138 | 25 | .19 | (26.6) | |||||||||||||||||||
| Time deposits | 58,827 | 647 | 4.37 | 54,729 | 547 | 3.97 | 7.5 | |||||||||||||||||||
| Total interest-bearing deposits | 427,818 | 3,004 | 2.79 | 414,767 | 2,580 | 2.47 | 3.1 | |||||||||||||||||||
| Short-term borrowings | 17,723 | 284 | 6.38 | 27,550 | 452 | 6.50 | (35.7) | |||||||||||||||||||
| Long-term debt | 54,841 | 663 | 4.81 | 43,826 | 488 | 4.42 | 25.1 | |||||||||||||||||||
| Total interest-bearing liabilities | 500,382 | 3,951 | 3.14 | 486,143 | 3,520 | 2.87 | 2.9 | |||||||||||||||||||
| Other liabilities | 24,575 | 26,049 | (5.7) | |||||||||||||||||||||||
| Shareholders' equity | ||||||||||||||||||||||||||
| Preferred equity | 6,808 | 6,808 | — | |||||||||||||||||||||||
| Common equity | 51,475 | 47,009 | 9.5 | |||||||||||||||||||||||
| Total U.S. Bancorp shareholders' equity | 58,283 | 53,817 | 8.3 | |||||||||||||||||||||||
| Noncontrolling interests | 461 | 466 | (1.1) | |||||||||||||||||||||||
| Total equity | 58,744 | 54,283 | 8.2 | |||||||||||||||||||||||
| Total liabilities and equity | $664,640 | $663,999 | .1 | |||||||||||||||||||||||
| Net interest income | $4,166 | $4,268 | ||||||||||||||||||||||||
| Gross interest margin | 2.19 | % | 2.25 | % | ||||||||||||||||||||||
| Gross interest margin without taxable-equivalent increments | 2.17 | 2.23 | ||||||||||||||||||||||||
| Percent of Earning Assets | ||||||||||||||||||||||||||
| Interest income | 5.33 | % | 5.12 | % | ||||||||||||||||||||||
| Interest expense | 2.59 | 2.31 | ||||||||||||||||||||||||
| Net interest margin | 2.74 | % | 2.81 | % | ||||||||||||||||||||||
| Net interest margin without taxable-equivalent increments | 2.72 | % | 2.79 | % | ||||||||||||||||||||||
|
(a)Interest and rates are presented on a fully taxable-equivalent basis based on a federal income tax rate of 21 percent.
(b)Yields on investment securities are computed based on amortized cost balances, excluding any premiums or discounts recorded related to the transfer of investment securities at fair value from available-for-sale to held-to-maturity. Yields include impacts of hedge accounting, including portfolio level basis adjustments.
(c)Interest income and rates on loans include loan fees. Nonaccrual loans are included in average loan balances.
| ||||||||||||||||||||||||||
 |
|||||
| CONSOLIDATED DAILY AVERAGE BALANCE SHEET AND RELATED YIELDS AND RATES (a) | ||||||||||||||||||||||||||
| For the Three Months Ended | ||||||||||||||||||||||||||
| September 30, 2024 | June 30, 2024 | |||||||||||||||||||||||||
| (Dollars in Millions) (Unaudited) |
Average Balances |
Interest | Yields and Rates |
Average Balances |
Interest | Yields and Rates |
% Change Average Balances |
|||||||||||||||||||
| Assets | ||||||||||||||||||||||||||
| Investment securities (b) | $166,899 | $1,335 | 3.20 | % | $167,020 | $1,314 | 3.15 | % | (.1) | % | ||||||||||||||||
| Loans held for sale | 2,757 | 45 | 6.44 | 2,382 | 41 | 6.98 | 15.7 | |||||||||||||||||||
| Loans (c) | ||||||||||||||||||||||||||
| Commercial | 133,138 | 2,217 | 6.63 | 134,339 | 2,209 | 6.61 | (.9) | |||||||||||||||||||
| Commercial real estate | 51,454 | 841 | 6.50 | 52,289 | 847 | 6.51 | (1.6) | |||||||||||||||||||
| Residential mortgages | 117,559 | 1,160 | 3.95 | 116,478 | 1,141 | 3.92 | .9 | |||||||||||||||||||
| Credit card | 28,994 | 987 | 13.54 | 28,349 | 925 | 13.13 | 2.3 | |||||||||||||||||||
| Other retail | 42,925 | 669 | 6.20 | 43,230 | 650 | 6.05 | (.7) | |||||||||||||||||||
| Total loans | 374,070 | 5,874 | 6.25 | 374,685 | 5,772 | 6.19 | (.2) | |||||||||||||||||||
| Interest-bearing deposits with banks | 50,547 | 694 | 5.46 | 53,056 | 736 | 5.58 | (4.7) | |||||||||||||||||||
| Other earning assets | 12,907 | 169 | 5.19 | 11,749 | 152 | 5.22 | 9.9 | |||||||||||||||||||
| Total earning assets | 607,180 | 8,117 | 5.33 | 608,892 | 8,015 | 5.29 | (.3) | |||||||||||||||||||
| Allowance for loan losses | (7,576) | (7,550) | (.3) | |||||||||||||||||||||||
| Unrealized gain (loss) on investment securities | (6,291) | (7,464) | 15.7 | |||||||||||||||||||||||
| Other assets | 71,327 | 71,626 | (.4) | |||||||||||||||||||||||
| Total assets | $664,640 | $665,504 | (.1) | |||||||||||||||||||||||
| Liabilities and Shareholders' Equity | ||||||||||||||||||||||||||
| Noninterest-bearing deposits | $80,939 | $83,418 | (3.0) | % | ||||||||||||||||||||||
| Interest-bearing deposits | ||||||||||||||||||||||||||
| Interest checking | 125,631 | 399 | 1.26 | 125,709 | 386 | 1.23 | (.1) | |||||||||||||||||||
| Money market savings | 206,546 | 1,930 | 3.72 | 208,386 | 1,993 | 3.85 | (.9) | |||||||||||||||||||
| Savings accounts | 36,814 | 28 | .30 | 38,855 | 26 | .27 | (5.3) | |||||||||||||||||||
| Time deposits | 58,827 | 647 | 4.37 | 57,541 | 623 | 4.35 | 2.2 | |||||||||||||||||||
| Total interest-bearing deposits | 427,818 | 3,004 | 2.79 | 430,491 | 3,028 | 2.83 | (.6) | |||||||||||||||||||
| Short-term borrowings | 17,723 | 284 | 6.38 | 17,098 | 297 | 6.98 | 3.7 | |||||||||||||||||||
| Long-term debt | 54,841 | 663 | 4.81 | 52,875 | 638 | 4.85 | 3.7 | |||||||||||||||||||
| Total interest-bearing liabilities | 500,382 | 3,951 | 3.14 | 500,464 | 3,963 | 3.18 | — | |||||||||||||||||||
| Other liabilities | 24,575 | 25,130 | (2.2) | |||||||||||||||||||||||
| Shareholders' equity | ||||||||||||||||||||||||||
| Preferred equity | 6,808 | 6,808 | — | |||||||||||||||||||||||
| Common equity | 51,475 | 49,221 | 4.6 | |||||||||||||||||||||||
| Total U.S. Bancorp shareholders' equity | 58,283 | 56,029 | 4.0 | |||||||||||||||||||||||
| Noncontrolling interests | 461 | 463 | (.4) | |||||||||||||||||||||||
| Total equity | 58,744 | 56,492 | 4.0 | |||||||||||||||||||||||
| Total liabilities and equity | $664,640 | $665,504 | (.1) | |||||||||||||||||||||||
| Net interest income | $4,166 | $4,052 | ||||||||||||||||||||||||
| Gross interest margin | 2.19 | % | 2.11 | % | ||||||||||||||||||||||
| Gross interest margin without taxable-equivalent increments | 2.17 | 2.09 | ||||||||||||||||||||||||
| Percent of Earning Assets | ||||||||||||||||||||||||||
| Interest income | 5.33 | % | 5.29 | % | ||||||||||||||||||||||
| Interest expense | 2.59 | 2.62 | ||||||||||||||||||||||||
| Net interest margin | 2.74 | % | 2.67 | % | ||||||||||||||||||||||
| Net interest margin without taxable-equivalent increments | 2.72 | % | 2.65 | % | ||||||||||||||||||||||
|
(a)Interest and rates are presented on a fully taxable-equivalent basis based on a federal income tax rate of 21 percent.
(b)Yields on investment securities are computed based on amortized cost balances, excluding any premiums or discounts recorded related to the transfer of investment securities at fair value from available-for-sale to held-to-maturity. Yields include impacts of hedge accounting, including portfolio level basis adjustments.
(c)Interest income and rates on loans include loan fees. Nonaccrual loans are included in average loan balances.
| ||||||||||||||||||||||||||
 |
|||||
| CONSOLIDATED DAILY AVERAGE BALANCE SHEET AND RELATED YIELDS AND RATES (a) | ||||||||||||||||||||||||||
| For the Nine Months Ended September 30, | ||||||||||||||||||||||||||
| 2024 | 2023 | |||||||||||||||||||||||||
| (Dollars in Millions) (Unaudited) |
Average Balances |
Interest | Yields and Rates |
Average Balances |
Interest | Yields and Rates |
% Change Average Balances |
|||||||||||||||||||
| Assets | ||||||||||||||||||||||||||
| Investment securities (b) | $165,059 | $3,843 | 3.10 | % | $163,051 | $3,364 | 2.75 | % | 1.2 | % | ||||||||||||||||
| Loans held for sale | 2,381 | 123 | 6.86 | 2,564 | 111 | 5.77 | (7.1) | |||||||||||||||||||
| Loans (c) | ||||||||||||||||||||||||||
| Commercial | 132,749 | 6,606 | 6.65 | 136,159 | 6,452 | 6.33 | (2.5) | |||||||||||||||||||
| Commercial real estate | 52,257 | 2,542 | 6.50 | 54,923 | 2,504 | 6.09 | (4.9) | |||||||||||||||||||
| Residential mortgages | 116,563 | 3,408 | 3.90 | 116,167 | 3,215 | 3.69 | .3 | |||||||||||||||||||
| Credit card | 28,430 | 2,852 | 13.40 | 26,171 | 2,508 | 12.81 | 8.6 | |||||||||||||||||||
| Other retail | 43,279 | 1,961 | 6.05 | 50,692 | 1,947 | 5.13 | (14.6) | |||||||||||||||||||
| Total loans | 373,278 | 17,369 | 6.21 | 384,112 | 16,626 | 5.78 | (2.8) | |||||||||||||||||||
| Interest-bearing deposits with banks | 51,499 | 2,134 | 5.53 | 49,495 | 1,904 | 5.14 | 4.0 | |||||||||||||||||||
| Other earning assets | 11,863 | 458 | 5.16 | 9,669 | 344 | 4.76 | 22.7 | |||||||||||||||||||
| Total earning assets | 604,080 | 23,927 | 5.29 | 608,891 | 22,349 | 4.90 | (.8) | |||||||||||||||||||
| Allowance for loan losses | (7,521) | (7,094) | (6.0) | |||||||||||||||||||||||
| Unrealized gain (loss) on investment securities | (6,956) | (7,708) | 9.8 | |||||||||||||||||||||||
| Other assets | 71,760 | 73,392 | (2.2) | |||||||||||||||||||||||
| Total assets | $661,363 | $667,481 | (.9) | |||||||||||||||||||||||
| Liabilities and Shareholders' Equity | ||||||||||||||||||||||||||
| Noninterest-bearing deposits | $83,040 | $113,556 | (26.9) | % | ||||||||||||||||||||||
| Interest-bearing deposits | ||||||||||||||||||||||||||
| Interest checking | 125,451 | 1,147 | 1.22 | 129,980 | 965 | .99 | (3.5) | |||||||||||||||||||
| Money market savings | 203,821 | 5,837 | 3.83 | 159,178 | 3,841 | 3.23 | 28.0 | |||||||||||||||||||
| Savings accounts | 39,097 | 80 | .27 | 59,251 | 61 | .14 | (34.0) | |||||||||||||||||||
| Time deposits | 57,167 | 1,852 | 4.33 | 44,668 | 1,157 | 3.46 | 28.0 | |||||||||||||||||||
| Total interest-bearing deposits | 425,536 | 8,916 | 2.80 | 393,077 | 6,024 | 2.05 | 8.3 | |||||||||||||||||||
| Short-term borrowings | 17,064 | 852 | 6.67 | 39,364 | 1,644 | 5.58 | (56.7) | |||||||||||||||||||
| Long-term debt | 53,482 | 1,926 | 4.81 | 42,551 | 1,296 | 4.07 | 25.7 | |||||||||||||||||||
| Total interest-bearing liabilities | 496,082 | 11,694 | 3.15 | 474,992 | 8,964 | 2.52 | 4.4 | |||||||||||||||||||
| Other liabilities | 25,112 | 25,028 | .3 | |||||||||||||||||||||||
| Shareholders' equity | ||||||||||||||||||||||||||
| Preferred equity | 6,808 | 6,808 | — | |||||||||||||||||||||||
| Common equity | 49,858 | 46,632 | 6.9 | |||||||||||||||||||||||
| Total U.S. Bancorp shareholders' equity | 56,666 | 53,440 | 6.0 | |||||||||||||||||||||||
| Noncontrolling interests | 463 | 465 | (.4) | |||||||||||||||||||||||
| Total equity | 57,129 | 53,905 | 6.0 | |||||||||||||||||||||||
| Total liabilities and equity | $661,363 | $667,481 | (.9) | |||||||||||||||||||||||
| Net interest income | $12,233 | $13,385 | ||||||||||||||||||||||||
| Gross interest margin | 2.14 | % | 2.38 | % | ||||||||||||||||||||||
| Gross interest margin without taxable-equivalent increments | 2.12 | 2.36 | ||||||||||||||||||||||||
| Percent of Earning Assets | ||||||||||||||||||||||||||
| Interest income | 5.29 | % | 4.90 | % | ||||||||||||||||||||||
| Interest expense | 2.59 | 1.96 | ||||||||||||||||||||||||
| Net interest margin | 2.70 | % | 2.94 | % | ||||||||||||||||||||||
| Net interest margin without taxable-equivalent increments | 2.68 | % | 2.92 | % | ||||||||||||||||||||||
|
(a)Interest and rates are presented on a fully taxable-equivalent basis based on a federal income tax rate of 21 percent.
(b)Yields on investment securities are computed based on amortized cost balances, excluding any premiums or discounts recorded related to the transfer of investment securities at fair value from available-for-sale to held-to-maturity. Yields include impacts of hedge accounting, including portfolio level basis adjustments.
(c)Interest income and rates on loans include loan fees. Nonaccrual loans are included in average loan balances.
| ||||||||||||||||||||||||||
 |
|||||
| LOAN PORTFOLIO | ||||||||||||||||||||||||||||||||
| September 30, 2024 | June 30, 2024 | March 31, 2024 | December 31, 2023 | September 30, 2023 | ||||||||||||||||||||||||||||
| (Dollars in Millions) (Unaudited) |
Amount | Percent of Total |
Amount | Percent of Total |
Amount | Percent of Total |
Amount | Percent of Total |
Amount | Percent of Total |
||||||||||||||||||||||
| Commercial | ||||||||||||||||||||||||||||||||
| Commercial | $129,434 | 34.6 | $131,043 | 34.9 | $130,530 | 34.8 | $127,676 | 34.2 | $129,040 | 34.4 | ||||||||||||||||||||||
| Lease financing | 4,204 | 1.1 | 4,205 | 1.1 | 4,196 | 1.2 | 4,205 | 1.1 | 4,279 | 1.1 | ||||||||||||||||||||||
| Total commercial | 133,638 | 35.7 | 135,248 | 36.0 | 134,726 | 36.0 | 131,881 | 35.3 | 133,319 | 35.5 | ||||||||||||||||||||||
| Commercial real estate | ||||||||||||||||||||||||||||||||
| Commercial mortgages | 39,602 | 10.6 | 40,844 | 10.9 | 41,157 | 11.0 | 41,934 | 11.2 | 42,473 | 11.3 | ||||||||||||||||||||||
| Construction and | ||||||||||||||||||||||||||||||||
| development | 11,017 | 2.9 | 11,043 | 2.9 | 11,520 | 3.1 | 11,521 | 3.1 | 11,658 | 3.1 | ||||||||||||||||||||||
| Total commercial | ||||||||||||||||||||||||||||||||
| real estate | 50,619 | 13.5 | 51,887 | 13.8 | 52,677 | 14.1 | 53,455 | 14.3 | 54,131 | 14.4 | ||||||||||||||||||||||
| Residential mortgages | ||||||||||||||||||||||||||||||||
| Residential mortgages | 111,790 | 29.9 | 110,680 | 29.4 | 109,396 | 29.2 | 108,605 | 29.0 | 107,875 | 28.8 | ||||||||||||||||||||||
| Home equity loans, first | ||||||||||||||||||||||||||||||||
| liens | 6,244 | 1.6 | 6,467 | 1.7 | 6,683 | 1.8 | 6,925 | 1.9 | 7,180 | 1.9 | ||||||||||||||||||||||
| Total residential | ||||||||||||||||||||||||||||||||
| mortgages | 118,034 | 31.5 | 117,147 | 31.1 | 116,079 | 31.0 | 115,530 | 30.9 | 115,055 | 30.7 | ||||||||||||||||||||||
| Credit card | 29,037 | 7.8 | 28,715 | 7.6 | 27,844 | 7.4 | 28,560 | 7.6 | 27,080 | 7.2 | ||||||||||||||||||||||
| Other retail | ||||||||||||||||||||||||||||||||
| Retail leasing | 4,038 | 1.1 | 4,178 | 1.1 | 4,137 | 1.1 | 4,135 | 1.1 | 4,271 | 1.2 | ||||||||||||||||||||||
| Home equity and second | ||||||||||||||||||||||||||||||||
| mortgages | 13,364 | 3.6 | 13,180 | 3.5 | 12,932 | 3.5 | 13,056 | 3.5 | 12,879 | 3.4 | ||||||||||||||||||||||
| Revolving credit | 3,644 | 1.0 | 3,597 | 1.0 | 3,473 | .9 | 3,668 | 1.0 | 3,766 | 1.0 | ||||||||||||||||||||||
| Installment | 14,482 | 3.9 | 14,169 | 3.8 | 13,921 | 3.7 | 13,889 | 3.7 | 14,145 | 3.8 | ||||||||||||||||||||||
| Automobile | 7,308 | 1.9 | 8,012 | 2.1 | 8,799 | 2.3 | 9,661 | 2.6 | 10,588 | 2.8 | ||||||||||||||||||||||
| Total other retail | 42,836 | 11.5 | 43,136 | 11.5 | 43,262 | 11.5 | 44,409 | 11.9 | 45,649 | 12.2 | ||||||||||||||||||||||
| Total loans | $374,164 | 100.0 | $376,133 | 100.0 | $374,588 | 100.0 | $373,835 | 100.0 | $375,234 | 100.0 | ||||||||||||||||||||||
 |
|||||
|
Supplemental Business Line Schedules
Third Quarter 2024
| ||
|
WEALTH, CORPORATE, COMMERCIAL AND
INSTITUTIONAL BANKING
CONSUMER AND BUSINESS BANKING
PAYMENT SERVICES
TREASURY AND CORPORATE SUPPORT
| ||

| WEALTH, CORPORATE, COMMERCIAL AND INSTITUTIONAL BANKING | Preliminary data | ||||||||||||||||
| Three Months Ended | |||||||||||||||||
| (Dollars in Millions) (Unaudited) |
September 30, 2024 |
June 30, 2024 |
March 31, 2024 |
December 31, 2023 |
September 30, 2023 |
||||||||||||
| INCOME STATEMENT | |||||||||||||||||
| Net Interest Income (taxable-equivalent basis) | $1,896 | $1,910 | $1,905 | $1,974 | $2,023 | ||||||||||||
| Noninterest Income | |||||||||||||||||
| Card revenue | — | — | — | — | — | ||||||||||||
| Corporate payment products revenue | — | — | — | — | — | ||||||||||||
| Merchant processing services | — | — | — | — | — | ||||||||||||
| Trust and investment management fees | 666 | 648 | 640 | 620 | 627 | ||||||||||||
| Service charges | 134 | 146 | 134 | 128 | 129 | ||||||||||||
| Commercial products revenue | 205 | 200 | 208 | 149 | 150 | ||||||||||||
| Mortgage banking revenue | — | — | — | — | — | ||||||||||||
| Investment products fees | 84 | 82 | 77 | 73 | 70 | ||||||||||||
| Securities gains (losses), net | — | — | — | — | — | ||||||||||||
| Other | 56 | 54 | 53 | 51 | 54 | ||||||||||||
| Total noninterest income | 1,145 | 1,130 | 1,112 | 1,021 | 1,030 | ||||||||||||
| Total net revenue | 3,041 | 3,040 | 3,017 | 2,995 | 3,053 | ||||||||||||
| Noninterest Expense | |||||||||||||||||
| Compensation and employee benefits | 547 | 564 | 566 | 534 | 543 | ||||||||||||
| Net occupancy and equipment | 39 | 39 | 39 | 37 | 37 | ||||||||||||
| Other intangibles | 52 | 52 | 52 | 55 | 57 | ||||||||||||
| Net shared services | 536 | 529 | 543 | 529 | 519 | ||||||||||||
| Other | 190 | 186 | 201 | 225 | 184 | ||||||||||||
| Total noninterest expense | 1,364 | 1,370 | 1,401 | 1,380 | 1,340 | ||||||||||||
| Income before provision and income taxes | 1,677 | 1,670 | 1,616 | 1,615 | 1,713 | ||||||||||||
| Provision for Credit Losses | 94 | 100 | 141 | 69 | 136 | ||||||||||||
| Income before income taxes | 1,583 | 1,570 | 1,475 | 1,546 | 1,577 | ||||||||||||
| Income taxes and taxable-equivalent adjustment | 396 | 393 | 369 | 387 | 394 | ||||||||||||
| Net income | 1,187 | 1,177 | 1,106 | 1,159 | 1,183 | ||||||||||||
| Net (income) loss attributable to noncontrolling interests | — | — | — | — | — | ||||||||||||
| Net income attributable to U.S. Bancorp | $1,187 | $1,177 | $1,106 | $1,159 | $1,183 | ||||||||||||
| FINANCIAL RATIOS | |||||||||||||||||
| Return on average assets | 2.36 | % | 2.33 | % | 2.23 | % | 2.29 | % | 2.30 | % | |||||||
| Net interest margin (taxable-equivalent basis) | 4.13 | 4.19 | 4.26 | 4.37 | 4.41 | ||||||||||||
| Efficiency ratio | 44.9 | 45.1 | 46.4 | 46.1 | 43.9 | ||||||||||||

| WEALTH, CORPORATE, COMMERCIAL AND INSTITUTIONAL BANKING | Preliminary data | ||||||||||||||||
| Three Months Ended | |||||||||||||||||
| (Dollars in Millions) (Unaudited) |
September 30, 2024 |
June 30, 2024 |
March 31, 2024 |
December 31, 2023 |
September 30, 2023 |
||||||||||||
| AVERAGE BALANCE SHEET | |||||||||||||||||
| Loans | |||||||||||||||||
| Commercial | $113,805 | $115,739 | $113,051 | $113,393 | $117,278 | ||||||||||||
| Commercial real estate | 36,925 | 37,445 | 37,976 | 38,329 | 38,448 | ||||||||||||
| Residential mortgages | 15,673 | 15,159 | 14,705 | 14,572 | 14,274 | ||||||||||||
| Credit card | — | — | — | — | — | ||||||||||||
| Other retail | 5,430 | 5,441 | 5,403 | 5,612 | 5,700 | ||||||||||||
| Total loans | 171,833 | 173,784 | 171,135 | 171,906 | 175,700 | ||||||||||||
| Other Earning Assets | 10,740 | 9,590 | 8,738 | 7,287 | 6,458 | ||||||||||||
| Total earning assets | 182,573 | 183,374 | 179,873 | 179,193 | 182,158 | ||||||||||||
| Non-earning Assets | |||||||||||||||||
| Goodwill | 4,825 | 4,824 | 4,825 | 4,825 | 4,638 | ||||||||||||
| Other intangible assets | 955 | 1,007 | 1,059 | 1,112 | 921 | ||||||||||||
| Other non-earning assets | 11,846 | 14,083 | 13,501 | 15,371 | 16,193 | ||||||||||||
| Total non-earning assets | 17,626 | 19,914 | 19,385 | 21,308 | 21,752 | ||||||||||||
| Total assets | 200,199 | 203,288 | 199,258 | 200,501 | 203,910 | ||||||||||||
| Deposits | |||||||||||||||||
| Noninterest-bearing deposits | 54,263 | 57,218 | 58,496 | 62,119 | 66,055 | ||||||||||||
| Interest checking | 53,278 | 52,027 | 50,864 | 51,288 | 52,956 | ||||||||||||
| Savings products | 150,302 | 152,530 | 145,376 | 143,192 | 143,577 | ||||||||||||
| Time deposits | 12,024 | 12,239 | 12,053 | 12,123 | 13,508 | ||||||||||||
| Total deposits | 269,867 | 274,014 | 266,789 | 268,722 | 276,096 | ||||||||||||
| Other Interest-bearing Liabilities | 15,885 | 15,761 | 15,161 | 13,842 | 12,846 | ||||||||||||
| Other Noninterest-bearing Liabilities | 8,526 | 10,748 | 10,060 | 11,969 | 12,877 | ||||||||||||
| Total liabilities | 294,278 | 300,523 | 292,010 | 294,533 | 301,819 | ||||||||||||
| Total U.S. Bancorp Shareholders' Equity | 21,277 | 21,485 | 21,760 | 22,710 | 22,839 | ||||||||||||
| Noncontrolling Interests | — | — | — | — | — | ||||||||||||
| Total Equity | 21,277 | 21,485 | 21,760 | 22,710 | 22,839 | ||||||||||||
| NET INTEREST SPREADS (%) | |||||||||||||||||
| Total earning assets | 1.18 | 1.16 | 1.16 | 1.17 | 1.16 | ||||||||||||
| Total assets | .65 | .57 | .60 | .57 | .60 | ||||||||||||
| Total deposits | 2.98 | 3.01 | 3.06 | 3.11 | 3.08 | ||||||||||||
| Total liabilities | 2.94 | 3.00 | 3.05 | 3.10 | 3.06 | ||||||||||||
| CREDIT QUALITY | |||||||||||||||||
| Net Charge-offs | |||||||||||||||||
| Commercial | $73 | $72 | $51 | $28 | $42 | ||||||||||||
| Commercial real estate | 67 | 35 | 13 | 71 | 49 | ||||||||||||
| Residential mortgages | — | — | — | — | — | ||||||||||||
| Credit card | — | — | — | — | — | ||||||||||||
| Other retail | — | — | 1 | — | 1 | ||||||||||||
| Total net charge-offs | $140 | $107 | $65 | $99 | $92 | ||||||||||||
| Net Charge-off Ratios | |||||||||||||||||
| Commercial | .26 | % | .25 | % | .18 | % | .10 | % | .14 | % | |||||||
| Commercial real estate | .72 | .38 | .14 | .73 | .51 | ||||||||||||
| Residential mortgages | — | — | — | — | — | ||||||||||||
| Credit card | — | — | — | — | — | ||||||||||||
| Other retail | — | — | .07 | — | .07 | ||||||||||||
| Total net charge-offs | .32 | % | .25 | % | .15 | % | .23 | % | .21 | % | |||||||
| September 30, 2024 |
June 30, 2024 |
March 31, 2024 |
December 31, 2023 |
September 30, 2023 |
|||||||||||||
| Nonperforming Assets | |||||||||||||||||
| Nonperforming loans | $1,359 | $1,353 | $1,292 | $937 | $830 | ||||||||||||
| Other nonperforming assets | — | 1 | 1 | 1 | 1 | ||||||||||||
| Total nonperforming assets | $1,359 | $1,354 | $1,293 | $938 | $831 | ||||||||||||

| WEALTH, CORPORATE, COMMERCIAL AND INSTITUTIONAL BANKING | Preliminary data | ||||||||||||||||
| Three Months Ended | |||||||||||||||||
| (Dollars in Millions) (Unaudited) |
September 30, 2024 |
June 30, 2024 |
March 31, 2024 |
December 31, 2023 |
September 30, 2023 |
||||||||||||
| OTHER INFORMATION | |||||||||||||||||
| Average Loan Balances | |||||||||||||||||
| Commercial real estate division | $45,864 | $47,138 | $47,821 | $48,479 | $48,751 | ||||||||||||
| Wealth management | 28,040 | 27,689 | 27,244 | 27,408 | 27,147 | ||||||||||||
| Institutional client group | 83,502 | 84,499 | 81,800 | 81,180 | 84,616 | ||||||||||||
| Global corporate trust & custody | 134 | 117 | 116 | 167 | 132 | ||||||||||||
| Other | 14,293 | 14,341 | 14,154 | 14,672 | 15,054 | ||||||||||||
| Total | $171,833 | $173,784 | $171,135 | $171,906 | $175,700 | ||||||||||||
| Average Deposit Balances | |||||||||||||||||
| Commercial real estate division | $16,100 | $15,209 | $15,519 | $16,585 | $16,799 | ||||||||||||
| Wealth management | 41,811 | 42,659 | 42,185 | 41,660 | 40,450 | ||||||||||||
| Institutional client group | 131,360 | 134,128 | 135,047 | 137,809 | 145,848 | ||||||||||||
| Global corporate trust & custody | 70,853 | 71,397 | 64,458 | 62,696 | 63,566 | ||||||||||||
| Other | 9,743 | 10,621 | 9,580 | 9,972 | 9,433 | ||||||||||||
| Total | $269,867 | $274,014 | $266,789 | $268,722 | $276,096 | ||||||||||||
| Noninterest Income | |||||||||||||||||
| Trust and investment management fees | |||||||||||||||||
| Wealth management | $169 | $166 | $165 | $158 | $157 | ||||||||||||
| U.S. Bancorp Asset Management | 61 | 60 | 61 | 57 | 59 | ||||||||||||
| Global corporate trust & custody | 276 | 265 | 262 | 258 | 259 | ||||||||||||
| Fund services | 149 | 147 | 142 | 138 | 141 | ||||||||||||
| Other | 11 | 10 | 10 | 9 | 11 | ||||||||||||
| Global capital markets | 247 | 238 | 242 | 188 | 191 | ||||||||||||
| Treasury management | 134 | 146 | 134 | 128 | 129 | ||||||||||||
| All other noninterest income | 98 | 98 | 96 | 85 | 83 | ||||||||||||
| Total | $1,145 | $1,130 | $1,112 | $1,021 | $1,030 | ||||||||||||
| Assets Under Management by Category * | |||||||||||||||||
| Equity | $79,653 | $73,940 | $70,924 | $66,344 | $67,371 | ||||||||||||
| Fixed income | 213,602 | 217,792 | 212,045 | 200,607 | 201,045 | ||||||||||||
| Money market | 160,592 | 154,977 | 155,774 | 154,250 | 148,593 | ||||||||||||
| Other | 35,188 | 33,622 | 33,421 | 33,134 | 31,212 | ||||||||||||
| Total | $489,035 | $480,331 | $472,164 | $454,335 | $448,221 | ||||||||||||
| * Amounts reported reflect end of month balances reported on a one month lag. | |||||||||||||||||

| CONSUMER AND BUSINESS BANKING | Preliminary data | ||||||||||||||||
| Three Months Ended | |||||||||||||||||
| (Dollars in Millions) (Unaudited) |
September 30, 2024 |
June 30, 2024 |
March 31, 2024 |
December 31, 2023 |
September 30, 2023 |
||||||||||||
| INCOME STATEMENT | |||||||||||||||||
| Net Interest Income (taxable-equivalent basis) | $1,937 | $1,921 | $1,879 | $1,959 | $2,048 | ||||||||||||
| Noninterest Income | |||||||||||||||||
| Card revenue | 2 | 3 | 3 | 3 | 4 | ||||||||||||
| Corporate payment products revenue | — | — | — | — | — | ||||||||||||
| Merchant processing services | — | — | — | — | — | ||||||||||||
| Trust and investment management fees | 1 | 1 | 1 | 1 | — | ||||||||||||
| Service charges | 166 | 174 | 179 | 194 | 203 | ||||||||||||
| Commercial products revenue | 6 | 6 | 6 | 5 | 5 | ||||||||||||
| Mortgage banking revenue | 155 | 160 | 166 | 137 | 144 | ||||||||||||
| Investment products fees | — | — | — | — | — | ||||||||||||
| Securities gains (losses), net | — | — | — | — | — | ||||||||||||
| Other | 71 | 70 | 69 | 70 | 78 | ||||||||||||
| Total noninterest income | 401 | 414 | 424 | 410 | 434 | ||||||||||||
| Total net revenue | 2,338 | 2,335 | 2,303 | 2,369 | 2,482 | ||||||||||||
| Noninterest Expense | |||||||||||||||||
| Compensation and employee benefits | 560 | 554 | 560 | 553 | 577 | ||||||||||||
| Net occupancy and equipment | 157 | 154 | 147 | 153 | 153 | ||||||||||||
| Other intangibles | 67 | 67 | 67 | 72 | 75 | ||||||||||||
| Net shared services | 720 | 720 | 705 | 747 | 739 | ||||||||||||
| Other | 181 | 166 | 152 | 178 | 177 | ||||||||||||
| Total noninterest expense | 1,685 | 1,661 | 1,631 | 1,703 | 1,721 | ||||||||||||
| Income before provision and income taxes | 653 | 674 | 672 | 666 | 761 | ||||||||||||
| Provision for Credit Losses | 18 | 30 | 54 | 48 | 7 | ||||||||||||
| Income before income taxes | 635 | 644 | 618 | 618 | 754 | ||||||||||||
| Income taxes and taxable-equivalent adjustment | 159 | 161 | 155 | 155 | 189 | ||||||||||||
| Net income | 476 | 483 | 463 | 463 | 565 | ||||||||||||
| Net (income) loss attributable to noncontrolling interests | — | — | — | — | — | ||||||||||||
| Net income attributable to U.S. Bancorp | $476 | $483 | $463 | $463 | $565 | ||||||||||||
| FINANCIAL RATIOS | |||||||||||||||||
| Return on average assets | 1.12 | % | 1.15 | % | 1.10 | % | 1.07 | % | 1.28 | % | |||||||
| Net interest margin (taxable-equivalent basis) | 4.88 | 4.91 | 4.82 | 4.91 | 5.07 | ||||||||||||
| Efficiency ratio | 72.1 | 71.1 | 70.8 | 71.9 | 69.3 | ||||||||||||

| CONSUMER AND BUSINESS BANKING | Preliminary data | ||||||||||||||||
| Three Months Ended | |||||||||||||||||
| (Dollars in Millions) (Unaudited) |
September 30, 2024 |
June 30, 2024 |
March 31, 2024 |
December 31, 2023 |
September 30, 2023 |
||||||||||||
| AVERAGE BALANCE SHEET | |||||||||||||||||
| Loans | |||||||||||||||||
| Commercial | $4,331 | $4,060 | $3,820 | $3,780 | $4,048 | ||||||||||||
| Commercial real estate | 11,745 | 11,940 | 12,083 | 12,353 | 12,608 | ||||||||||||
| Residential mortgages | 101,885 | 101,318 | 100,933 | 100,623 | 100,352 | ||||||||||||
| Credit card | — | — | — | — | — | ||||||||||||
| Other retail | 37,343 | 37,636 | 38,122 | 39,207 | 40,450 | ||||||||||||
| Total loans | 155,304 | 154,954 | 154,958 | 155,963 | 157,458 | ||||||||||||
| Other Earning Assets | 2,738 | 2,278 | 1,879 | 2,170 | 2,688 | ||||||||||||
| Total earning assets | 158,042 | 157,232 | 156,837 | 158,133 | 160,146 | ||||||||||||
| Non-earning Assets | |||||||||||||||||
| Goodwill | 4,326 | 4,326 | 4,326 | 4,327 | 4,515 | ||||||||||||
| Other intangible assets | 4,405 | 4,734 | 4,696 | 4,926 | 5,154 | ||||||||||||
| Other non-earning assets | 2,164 | 2,437 | 3,338 | 4,481 | 5,068 | ||||||||||||
| Total non-earning assets | 10,895 | 11,497 | 12,360 | 13,734 | 14,737 | ||||||||||||
| Total assets | 168,937 | 168,729 | 169,197 | 171,867 | 174,883 | ||||||||||||
| Deposits | |||||||||||||||||
| Noninterest-bearing deposits | 20,781 | 20,974 | 21,451 | 23,426 | 25,561 | ||||||||||||
| Interest checking | 70,751 | 72,235 | 72,902 | 74,783 | 78,221 | ||||||||||||
| Savings products | 90,906 | 92,511 | 90,576 | 87,566 | 82,626 | ||||||||||||
| Time deposits | 39,240 | 37,698 | 35,336 | 33,682 | 31,878 | ||||||||||||
| Total deposits | 221,678 | 223,418 | 220,265 | 219,457 | 218,286 | ||||||||||||
| Other Interest-bearing Liabilities | 1,176 | 965 | 1,116 | 1,226 | 1,234 | ||||||||||||
| Other Noninterest-bearing Liabilities | 2,007 | 2,143 | 2,117 | 2,288 | 2,420 | ||||||||||||
| Total liabilities | 224,861 | 226,526 | 223,498 | 222,971 | 221,940 | ||||||||||||
| Total U.S. Bancorp Shareholders' Equity | 14,247 | 14,560 | 14,851 | 15,374 | 15,770 | ||||||||||||
| Noncontrolling Interests | — | — | — | — | — | ||||||||||||
| Total Equity | 14,247 | 14,560 | 14,851 | 15,374 | 15,770 | ||||||||||||
| NET INTEREST SPREADS (%) | |||||||||||||||||
| Total earning assets | 1.32 | 1.34 | 1.34 | 1.33 | 1.33 | ||||||||||||
| Total assets | 1.00 | 1.00 | .96 | .93 | .90 | ||||||||||||
| Total deposits | 4.75 | 4.76 | 4.77 | 4.91 | 5.09 | ||||||||||||
| Total liabilities | 4.71 | 4.72 | 4.73 | 4.87 | 5.04 | ||||||||||||
| CREDIT QUALITY | |||||||||||||||||
| Net Charge-offs | |||||||||||||||||
| Commercial | $15 | $15 | $14 | $13 | $17 | ||||||||||||
| Commercial real estate | 3 | 1 | 1 | — | (1) | ||||||||||||
| Residential mortgages | (3) | (4) | — | (1) | (3) | ||||||||||||
| Credit card | — | — | — | — | — | ||||||||||||
| Other retail | 50 | 47 | 53 | 52 | 44 | ||||||||||||
| Total net charge-offs | $65 | $59 | $68 | $64 | $57 | ||||||||||||
| Net Charge-off Ratios | |||||||||||||||||
| Commercial | 1.38 | % | 1.49 | % | 1.47 | % | 1.36 | % | 1.67 | % | |||||||
| Commercial real estate | .10 | .03 | .03 | — | (.03) | ||||||||||||
| Residential mortgages | (.01) | (.02) | — | — | (.01) | ||||||||||||
| Credit card | — | — | — | — | — | ||||||||||||
| Other retail | .53 | .50 | .56 | .53 | .43 | ||||||||||||
| Total net charge-offs | .17 | % | .15 | % | .18 | % | .16 | % | .14 | % | |||||||
| September 30, 2024 |
June 30, 2024 |
March 31, 2024 |
December 31, 2023 |
September 30, 2023 |
|||||||||||||
| Nonperforming Assets | |||||||||||||||||
| Nonperforming loans | $398 | $401 | $389 | $397 | $373 | ||||||||||||
| Other nonperforming assets | 21 | 23 | 25 | 26 | 26 | ||||||||||||
| Total nonperforming assets | $419 | $424 | $414 | $423 | $399 | ||||||||||||

| CONSUMER AND BUSINESS BANKING | Preliminary data | ||||||||||||||||
| Three Months Ended | |||||||||||||||||
| (Dollars in Millions) (Unaudited) |
September 30, 2024 |
June 30, 2024 |
March 31, 2024 |
December 31, 2023 |
September 30, 2023 |
||||||||||||
| OTHER INFORMATION | |||||||||||||||||
| Other Retail Loan Information | |||||||||||||||||
| Average Balances | |||||||||||||||||
| Retail leasing | $4,087 | $4,185 | $4,082 | $4,167 | $4,436 | ||||||||||||
| Home equity and second mortgages | 10,812 | 10,602 | 10,527 | 10,481 | 10,302 | ||||||||||||
| Other | 22,444 | 22,849 | 23,513 | 24,559 | 25,712 | ||||||||||||
| Total other retail | $37,343 | $37,636 | $38,122 | $39,207 | $40,450 | ||||||||||||
| Home equity first lien* | $5,721 | $5,930 | $6,145 | $6,371 | $6,614 | ||||||||||||
| Home equity loans | 2,226 | 2,028 | 1,915 | 1,815 | 1,669 | ||||||||||||
| Home equity lines | 8,586 | 8,574 | 8,612 | 8,666 | 8,633 | ||||||||||||
| Total home equity | $16,533 | $16,532 | $16,672 | $16,852 | $16,916 | ||||||||||||
| Net Charge-off Ratios (%) | |||||||||||||||||
| Retail leasing | .49 | .29 | .49 | .19 | .18 | ||||||||||||
| Home equity and second mortgages | (.04) | (.04) | — | (.04) | .04 | ||||||||||||
| Other | .82 | .79 | .82 | .82 | .63 | ||||||||||||
| Total other retail | .53 | .50 | .56 | .53 | .43 | ||||||||||||
| Retail Credit Production | |||||||||||||||||
| Indirect loan/lease production volume | $1,798 | $1,929 | $1,569 | $1,072 | $1,090 | ||||||||||||
| Direct branch loan/line production volume | 1,417 | 1,754 | 1,382 | 1,336 | 1,575 | ||||||||||||
| Other production volume | 469 | 522 | 375 | 256 | 308 | ||||||||||||
| Total retail credit production volume | $3,684 | $4,205 | $3,326 | $2,664 | $2,973 | ||||||||||||
| Branch and ATM Data | |||||||||||||||||
| # of branches | 2,187 | 2,207 | 2,256 | 2,274 | 2,280 | ||||||||||||
| # of U.S. Bank ATMs | 4,515 | 4,534 | 4,522 | 4,524 | 4,520 | ||||||||||||
| * Home equity first lien balances are reported within residential mortgages as required by regulatory accounting principles. | |||||||||||||||||

| CONSUMER AND BUSINESS BANKING | Preliminary data | ||||||||||||||||
| Three Months Ended | |||||||||||||||||
| (Dollars in Millions) (Unaudited) |
September 30, 2024 |
June 30, 2024 |
March 31, 2024 |
December 31, 2023 |
September 30, 2023 |
||||||||||||
| Mortgage Banking Division Data | |||||||||||||||||
| Mortgage banking revenue | |||||||||||||||||
| Origination and sales (a) | $89 | $80 | $69 | $46 | $70 | ||||||||||||
| Loan servicing | 170 | 176 | 180 | 180 | 176 | ||||||||||||
| Mortgage servicing rights fair value changes | |||||||||||||||||
| net of economic hedges (b) | (10) | (6) | (2) | 4 | (3) | ||||||||||||
| Other changes in mortgage servicing rights fair value (c) | (94) | (90) | (81) | (93) | (99) | ||||||||||||
| Total mortgage banking revenue | $155 | $160 | $166 | $137 | $144 | ||||||||||||
| Mortgage production volume | $11,076 | $9,449 | $7,129 | $7,405 | $9,493 | ||||||||||||
| Mortgage application volume | $17,089 | $14,415 | $12,531 | $9,535 | $12,947 | ||||||||||||
| Mortgages serviced for others (d)(e) | $215,286 | $225,780 | $232,907 | $233,382 | $232,263 | ||||||||||||
| A summary of the Company's mortgage servicing rights and related characteristics by portfolio as of September 30, 2024, was as follows: | |||||||||||||||||
| (Dollars in Millions) | HFA (f) | Government | Conventional (g) | Total | |||||||||||||
| Servicing portfolio (h) | $51,526 | $25,506 | $137,961 | $214,993 | |||||||||||||
| Fair value | $791 | $490 | $1,906 | $3,187 | |||||||||||||
| Value (bps) (i) | 154 | 192 | 138 | 148 | |||||||||||||
| Weighted-average servicing fees (bps) | 36 | 45 | 25 | 30 | |||||||||||||
| Multiple (value/servicing fees) | 4.32 | 4.30 | 5.44 | 4.92 | |||||||||||||
| Weighted-average note rate | 4.84 | % | 4.34 | % | 3.81 | % | 4.12 | % | |||||||||
| Weighted-average age (in years) | 4.5 | 5.9 | 4.9 | 4.9 | |||||||||||||
| Weighted-average expected prepayment (constant prepayment rate) | 11.0 | % | 11.3 | % | 8.9 | % | 9.7 | % | |||||||||
| Weighted-average expected life (in years) | 7.0 | 6.4 | 7.0 | 6.9 | |||||||||||||
| Weighted-average option adjusted spread (j) | 5.9 | % | 6.2 | % | 4.8 | % | 5.3 | % | |||||||||
|
(a)Origination and sales revenue recorded based on estimated number of applications that will close.
(b)Represents the net impact of changes in the fair value of mortgage servicing rights related to assumption changes and the derivatives used to economically hedge the mortgage servicing rights fair value changes.
(c)Primarily the change in MSR value from passage of time and cash flows realized (decay), but also includes the impact of changes to expected cash flows not associated with changes in market interest rates, such as the impact of delinquencies.
(d)Amounts reported reflect end of period balances.
(e)Includes subserviced mortgages with no corresponding mortgage servicing rights asset.
(f)Represents Housing Finance Agency division.
(g)Represents loans primarily sold to government-sponsored enterprises.
(h)Represents principal balance of mortgages having corresponding mortgage servicing rights asset.
(i)Calculated as fair value divided by the servicing portfolio.
(j)Option adjusted spread is the incremental spread added to the risk-free rate to reflect optionality and other risk inherent in the mortgage servicing rights asset.
| |||||||||||||||||

| PAYMENT SERVICES | Preliminary data | ||||||||||||||||
| Three Months Ended | |||||||||||||||||
| (Dollars in Millions) (Unaudited) |
September 30, 2024 |
June 30, 2024 |
March 31, 2024 |
December 31, 2023 |
September 30, 2023 |
||||||||||||
| INCOME STATEMENT | |||||||||||||||||
| Net Interest Income (taxable-equivalent basis) | $727 | $673 | $702 | $676 | $663 | ||||||||||||
| Noninterest Income | |||||||||||||||||
| Card revenue | 424 | 425 | 389 | 433 | 408 | ||||||||||||
| Corporate payment products revenue | 203 | 195 | 184 | 182 | 198 | ||||||||||||
| Merchant processing services | 440 | 454 | 401 | 409 | 427 | ||||||||||||
| Trust and investment management fees | — | — | — | — | — | ||||||||||||
| Service charges | — | — | — | — | — | ||||||||||||
| Commercial products revenue | — | — | — | — | — | ||||||||||||
| Mortgage banking revenue | — | — | — | — | — | ||||||||||||
| Investment products fees | — | — | — | — | — | ||||||||||||
| Securities gains (losses), net | — | — | — | — | — | ||||||||||||
| Other | 6 | 20 | 5 | 5 | 6 | ||||||||||||
| Total noninterest income | 1,073 | 1,094 | 979 | 1,029 | 1,039 | ||||||||||||
| Total net revenue | 1,800 | 1,767 | 1,681 | 1,705 | 1,702 | ||||||||||||
| Noninterest Expense | |||||||||||||||||
| Compensation and employee benefits | 227 | 226 | 228 | 218 | 218 | ||||||||||||
| Net occupancy and equipment | 10 | 9 | 9 | 9 | 9 | ||||||||||||
| Other intangibles | 23 | 23 | 27 | 29 | 29 | ||||||||||||
| Net shared services | 547 | 530 | 522 | 530 | 522 | ||||||||||||
| Other | 219 | 214 | 226 | 245 | 228 | ||||||||||||
| Total noninterest expense | 1,026 | 1,002 | 1,012 | 1,031 | 1,006 | ||||||||||||
| Income before provision and income taxes | 774 | 765 | 669 | 674 | 696 | ||||||||||||
| Provision for Credit Losses | 404 | 388 | 359 | 461 | 399 | ||||||||||||
| Income before income taxes | 370 | 377 | 310 | 213 | 297 | ||||||||||||
| Income taxes and taxable-equivalent adjustment | 93 | 94 | 78 | 53 | 74 | ||||||||||||
| Net income | 277 | 283 | 232 | 160 | 223 | ||||||||||||
| Net (income) loss attributable to noncontrolling interests | — | — | — | — | — | ||||||||||||
| Net income attributable to U.S. Bancorp | $277 | $283 | $232 | $160 | $223 | ||||||||||||
| FINANCIAL RATIOS | |||||||||||||||||
| Return on average assets | 2.33 | % | 2.47 | % | 1.99 | % | 1.40 | % | 1.98 | % | |||||||
| Net interest margin (taxable-equivalent basis) | 6.94 | 6.61 | 7.07 | 6.70 | 6.75 | ||||||||||||
| Efficiency ratio | 57.0 | 56.7 | 60.2 | 60.5 | 59.1 | ||||||||||||

| PAYMENT SERVICES | Preliminary data | ||||||||||||||||
| Three Months Ended | |||||||||||||||||
| (Dollars in Millions) (Unaudited) |
September 30, 2024 |
June 30, 2024 |
March 31, 2024 |
December 31, 2023 |
September 30, 2023 |
||||||||||||
| AVERAGE BALANCE SHEET | |||||||||||||||||
| Loans | |||||||||||||||||
| Commercial | $12,511 | $12,334 | $11,705 | $12,121 | $11,899 | ||||||||||||
| Commercial real estate | — | — | — | — | — | ||||||||||||
| Residential mortgages | — | — | — | — | — | ||||||||||||
| Credit card | 28,994 | 28,349 | 27,942 | 27,753 | 26,883 | ||||||||||||
| Other retail | 148 | 149 | 156 | 165 | 172 | ||||||||||||
| Total loans | 41,653 | 40,832 | 39,803 | 40,039 | 38,954 | ||||||||||||
| Other Earning Assets | 8 | 115 | 153 | 10 | 5 | ||||||||||||
| Total earning assets | 41,661 | 40,947 | 39,956 | 40,049 | 38,959 | ||||||||||||
| Non-earning Assets | |||||||||||||||||
| Goodwill | 3,370 | 3,327 | 3,331 | 3,326 | 3,333 | ||||||||||||
| Other intangible assets | 266 | 281 | 300 | 319 | 340 | ||||||||||||
| Other non-earning assets | 1,902 | 1,544 | 3,229 | 1,679 | 2,142 | ||||||||||||
| Total non-earning assets | 5,538 | 5,152 | 6,860 | 5,324 | 5,815 | ||||||||||||
| Total assets | 47,199 | 46,099 | 46,816 | 45,373 | 44,774 | ||||||||||||
| Deposits | |||||||||||||||||
| Noninterest-bearing deposits | 2,653 | 2,706 | 2,791 | 2,772 | 2,796 | ||||||||||||
| Interest checking | — | — | — | — | — | ||||||||||||
| Savings products | 94 | 96 | 96 | 98 | 100 | ||||||||||||
| Time deposits | 1 | 1 | 1 | 1 | 1 | ||||||||||||
| Total deposits | 2,748 | 2,803 | 2,888 | 2,871 | 2,897 | ||||||||||||
| Other Interest-bearing Liabilities | 220 | 342 | 304 | 253 | 308 | ||||||||||||
| Other Noninterest-bearing Liabilities | 5,073 | 4,712 | 6,275 | 4,674 | 4,973 | ||||||||||||
| Total liabilities | 8,041 | 7,857 | 9,467 | 7,798 | 8,178 | ||||||||||||
| Total U.S. Bancorp Shareholders' Equity | 9,959 | 9,941 | 9,965 | 9,695 | 9,442 | ||||||||||||
| Noncontrolling Interests | — | — | — | — | — | ||||||||||||
| Total Equity | 9,959 | 9,941 | 9,965 | 9,695 | 9,442 | ||||||||||||
| NET INTEREST SPREADS (%) | |||||||||||||||||
| Total earning assets | 6.32 | 6.00 | 6.46 | 6.11 | 6.16 | ||||||||||||
| Total assets | 4.98 | 4.75 | 4.73 | 4.80 | 4.72 | ||||||||||||
| Total deposits | 5.94 | 6.03 | 5.99 | 5.94 | 5.89 | ||||||||||||
| Total liabilities | 5.19 | 5.17 | 5.31 | 5.39 | 5.29 | ||||||||||||
| CREDIT QUALITY | |||||||||||||||||
| Net Charge-offs | |||||||||||||||||
| Commercial | $59 | $57 | $51 | $44 | $37 | ||||||||||||
| Commercial real estate | — | — | — | — | — | ||||||||||||
| Residential mortgages | — | — | — | — | — | ||||||||||||
| Credit card | 299 | 315 | 296 | 255 | 220 | ||||||||||||
| Other retail | 1 | 1 | 1 | 1 | 1 | ||||||||||||
| Total net charge-offs | $359 | $373 | $348 | $300 | $258 | ||||||||||||
| Net Charge-off Ratios | |||||||||||||||||
| Commercial | 1.88 | % | 1.86 | % | 1.75 | % | 1.44 | % | 1.23 | % | |||||||
| Commercial real estate | — | — | — | — | — | ||||||||||||
| Residential mortgages | — | — | — | — | — | ||||||||||||
| Credit card | 4.10 | 4.47 | 4.26 | 3.65 | 3.25 | ||||||||||||
| Other retail | 2.69 | 2.70 | 2.58 | 2.40 | 2.31 | ||||||||||||
| Total net charge-offs | 3.43 | % | 3.67 | % | 3.52 | % | 2.97 | % | 2.63 | % | |||||||
| September 30, 2024 |
June 30, 2024 |
March 31, 2024 |
December 31, 2023 |
September 30, 2023 |
|||||||||||||
| Nonperforming Assets | |||||||||||||||||
| Nonperforming loans | $— | $— | $— | $— | $— | ||||||||||||
| Other nonperforming assets | — | — | — | — | — | ||||||||||||
| Total nonperforming assets | $— | $— | $— | $— | $— | ||||||||||||

| PAYMENT SERVICES | Preliminary data | ||||||||||||||||
| Three Months Ended | |||||||||||||||||
| (Dollars in Millions) (Unaudited) |
September 30, 2024 |
June 30, 2024 |
March 31, 2024 |
December 31, 2023 |
September 30, 2023 |
||||||||||||
| OTHER INFORMATION | |||||||||||||||||
| Total Noninterest Income | |||||||||||||||||
| Retail payment solutions | $426 | $442 | $390 | $436 | $410 | ||||||||||||
| Corporate payment systems | 207 | 198 | 187 | 184 | 201 | ||||||||||||
| Global merchant acquiring | 440 | 454 | 402 | 409 | 428 | ||||||||||||
| Total | $1,073 | $1,094 | $979 | $1,029 | $1,039 | ||||||||||||
| Payment Volumes | |||||||||||||||||
| Retail payment solutions (Issuing) | |||||||||||||||||
| Credit card | $36,912 | $36,504 | $33,683 | $35,604 | $34,526 | ||||||||||||
| Debit and prepaid card | 27,299 | 26,766 | 25,262 | 26,169 | 25,795 | ||||||||||||
| Total retail payment solutions | $64,211 | $63,270 | $58,945 | $61,773 | $60,321 | ||||||||||||
| Corporate payment systems (issuing) | $23,808 | $22,391 | $21,477 | $21,012 | $22,925 | ||||||||||||
| Merchant volume (acquiring) | $148,338 | $147,809 | $137,552 | $135,727 | $144,558 | ||||||||||||
| # of merchant transactions | 2,171,741,540 | 2,136,671,083 | 1,930,302,342 | 2,002,532,119 | 2,094,366,023 | ||||||||||||

| TREASURY AND CORPORATE SUPPORT | Preliminary data | ||||||||||||||||
| Three Months Ended | |||||||||||||||||
| (Dollars in Millions) (Unaudited) |
September 30, 2024 |
June 30, 2024 |
March 31, 2024 |
December 31, 2023 |
September 30, 2023 |
||||||||||||
| INCOME STATEMENT | |||||||||||||||||
| Net Interest Income (taxable-equivalent basis) | ($394) | ($452) | ($471) | ($467) | ($466) | ||||||||||||
| Noninterest Income | |||||||||||||||||
| Card revenue | — | — | — | — | — | ||||||||||||
| Corporate payment products revenue | — | — | — | — | — | ||||||||||||
| Merchant processing services | — | — | — | — | — | ||||||||||||
| Trust and investment management fees | — | — | — | — | — | ||||||||||||
| Service charges | 2 | 2 | 2 | 2 | 2 | ||||||||||||
| Commercial products revenue | 186 | 168 | 174 | 172 | 199 | ||||||||||||
| Mortgage banking revenue | — | 30 | — | — | — | ||||||||||||
| Investment products fees | — | — | — | — | — | ||||||||||||
| Securities gains (losses), net | (119) | (36) | 2 | (116) | — | ||||||||||||
| Other | 10 | 13 | 7 | 102 | 60 | ||||||||||||
| Total noninterest income | 79 | 177 | 185 | 160 | 261 | ||||||||||||
| Total net revenue | (315) | (275) | (286) | (307) | (205) | ||||||||||||
| Noninterest Expense | |||||||||||||||||
| Compensation and employee benefits | 1,303 | 1,275 | 1,337 | 1,204 | 1,277 | ||||||||||||
| Net occupancy and equipment | 111 | 114 | 101 | 117 | 114 | ||||||||||||
| Other intangibles | — | — | — | — | — | ||||||||||||
| Net shared services | (1,803) | (1,779) | (1,770) | (1,806) | (1,780) | ||||||||||||
| Other | 518 | 571 | 747 | 1,590 | 852 | ||||||||||||
| Total noninterest expense | 129 | 181 | 415 | 1,105 | 463 | ||||||||||||
| Income (loss) before provision and income taxes | (444) | (456) | (701) | (1,412) | (668) | ||||||||||||
| Provision for Credit Losses | 41 | 50 | (1) | (66) | (27) | ||||||||||||
| Income (loss) before income taxes | (485) | (506) | (700) | (1,346) | (641) | ||||||||||||
| Income taxes and taxable-equivalent adjustment | (267) | (174) | (225) | (425) | (194) | ||||||||||||
| Net income (loss) | (218) | (332) | (475) | (921) | (447) | ||||||||||||
| Net (income) loss attributable to noncontrolling interests | (8) | (8) | (7) | (14) | (1) | ||||||||||||
| Net income (loss) attributable to U.S. Bancorp | ($226) | ($340) | ($482) | ($935) | ($448) | ||||||||||||
| FINANCIAL RATIOS (%) | |||||||||||||||||
| Return on average assets | nm | nm | nm | nm | nm | ||||||||||||
| Net interest margin (taxable-equivalent basis) | nm | nm | nm | nm | nm | ||||||||||||
| Efficiency ratio | nm | nm | nm | nm | nm | ||||||||||||

| TREASURY AND CORPORATE SUPPORT | Preliminary data | ||||||||||||||||
| Three Months Ended | |||||||||||||||||
| (Dollars in Millions) (Unaudited) |
September 30, 2024 |
June 30, 2024 |
March 31, 2024 |
December 31, 2023 |
September 30, 2023 |
||||||||||||
| AVERAGE BALANCE SHEET | |||||||||||||||||
| Loans | |||||||||||||||||
| Commercial | $2,491 | $2,206 | $2,191 | $1,802 | $1,495 | ||||||||||||
| Commercial real estate | 2,784 | 2,904 | 2,978 | 3,143 | 3,197 | ||||||||||||
| Residential mortgages | 1 | 1 | 1 | 1 | 1 | ||||||||||||
| Credit card | — | — | — | — | — | ||||||||||||
| Other retail | 4 | 4 | 4 | 2 | 72 | ||||||||||||
| Total loans | 5,280 | 5,115 | 5,174 | 4,948 | 4,765 | ||||||||||||
| Other Earning Assets | 219,624 | 222,224 | 214,295 | 211,921 | 219,217 | ||||||||||||
| Total earning assets | 224,904 | 227,339 | 219,469 | 216,869 | 223,982 | ||||||||||||
| Non-earning Assets | |||||||||||||||||
| Goodwill | — | — | — | — | — | ||||||||||||
| Other intangible assets | 9 | 9 | 10 | 10 | 10 | ||||||||||||
| Other non-earning assets | 23,392 | 20,040 | 19,159 | 16,828 | 16,440 | ||||||||||||
| Total non-earning assets | 23,401 | 20,049 | 19,169 | 16,838 | 16,450 | ||||||||||||
| Total assets | 248,305 | 247,388 | 238,638 | 233,707 | 240,432 | ||||||||||||
| Deposits | |||||||||||||||||
| Noninterest-bearing deposits | 3,242 | 2,520 | 2,049 | 2,273 | 3,112 | ||||||||||||
| Interest checking | 1,602 | 1,447 | 1,245 | 1,374 | 1,383 | ||||||||||||
| Savings products | 2,058 | 2,104 | 2,099 | 1,194 | 1,175 | ||||||||||||
| Time deposits | 7,562 | 7,603 | 7,726 | 6,891 | 9,342 | ||||||||||||
| Total deposits | 14,464 | 13,674 | 13,119 | 11,732 | 15,012 | ||||||||||||
| Other Interest-bearing Liabilities | 55,283 | 52,905 | 52,496 | 52,187 | 56,988 | ||||||||||||
| Other Noninterest-bearing Liabilities | 8,969 | 7,527 | 7,188 | 7,448 | 5,779 | ||||||||||||
| Total liabilities | 78,716 | 74,106 | 72,803 | 71,367 | 77,779 | ||||||||||||
| Total U.S. Bancorp Shareholders' Equity | 12,800 | 10,043 | 9,091 | 6,535 | 5,766 | ||||||||||||
| Noncontrolling Interests | 461 | 463 | 464 | 465 | 466 | ||||||||||||
| Total Equity | 13,261 | 10,506 | 9,555 | 7,000 | 6,232 | ||||||||||||
| NET INTEREST SPREADS (%) | |||||||||||||||||
| Total earning assets | nm | nm | nm | nm | nm | ||||||||||||
| Total assets | nm | nm | nm | nm | nm | ||||||||||||
| Total deposits | nm | nm | nm | nm | nm | ||||||||||||
| Total liabilities | nm | nm | nm | nm | nm | ||||||||||||
| CREDIT QUALITY | |||||||||||||||||
| Net Charge-offs | |||||||||||||||||
| Commercial | $— | ($1) | $— | $— | ($4) | ||||||||||||
| Commercial real estate | — | — | 7 | — | 1 | ||||||||||||
| Residential mortgages | — | — | — | — | — | ||||||||||||
| Credit card | — | — | — | — | — | ||||||||||||
| Other retail | — | — | — | — | 16 | ||||||||||||
| Total net charge-offs | $— | ($1) | $7 | $— | $13 | ||||||||||||
| Net Charge-off Ratios (%) | |||||||||||||||||
| Commercial | nm | nm | nm | nm | nm | ||||||||||||
| Commercial real estate | nm | nm | nm | nm | nm | ||||||||||||
| Residential mortgages | nm | nm | nm | nm | nm | ||||||||||||
| Credit card | nm | nm | nm | nm | nm | ||||||||||||
| Other retail | nm | nm | nm | nm | nm | ||||||||||||
| Total net charge-offs | nm | nm | nm | nm | nm | ||||||||||||
| September 30, 2024 |
June 30, 2024 |
March 31, 2024 |
December 31, 2023 |
September 30, 2023 |
|||||||||||||
| Nonperforming Assets | |||||||||||||||||
| Nonperforming loans | $52 | $56 | $60 | $115 | $64 | ||||||||||||
| Other nonperforming assets | 18 | 18 | 19 | 18 | 16 | ||||||||||||
| Total nonperforming assets | $70 | $74 | $79 | $133 | $80 | ||||||||||||

