| New Jersey | 1-2256 | 13-5409005 | ||||||
| (State or other jurisdiction of incorporation) |
(Commission File Number) |
(IRS Employer Identification No.) |
||||||
| (Former name or former address, if changed since last report) | ||
| Name of Each Exchange | ||||||||
| Title of Each Class | Trading Symbol | on Which Registered | ||||||
| Common Stock, without par value | XOM | New York Stock Exchange | ||||||
| 0.142% Notes due 2024 | XOM24B | New York Stock Exchange | ||||||
| 0.524% Notes due 2028 | XOM28 | New York Stock Exchange | ||||||
| 0.835% Notes due 2032 | XOM32 | New York Stock Exchange | ||||||
| 1.408% Notes due 2039 | XOM39A | New York Stock Exchange | ||||||
| Item 2.02 | Results of Operations and Financial Condition | ||||
| Item 7.01 | Regulation FD Disclosure | ||||
| The following information is furnished pursuant to both Item 2.02 and Item 7.01. |
|||||
The Registrant hereby furnishes the information set forth in its News Release, dated January 31, 2023, announcing full-year 2022 results, a copy of which is included as Exhibit 99.1, and furnishes the information in the related 4Q22 Investor Relations Data Summary, a copy of which is included as Exhibit 99.2. Material available by hyperlink from the News Release is not deemed to be furnished herewith or included in this filing. |
|||||
| Exhibit No. | Description | ||||
Exxon Mobil Corporation News Release, dated January 31, 2023, announcing full-year 2022 results. |
|||||
4Q22 Investor Relations Data Summary. |
|||||
| 104 | Cover Page Interactive Data File (formatted as Inline XBRL). | ||||
| EXXON MOBIL CORPORATION | ||||||||
Date: January 31, 2023 |
By: | /s/ LEN M. FOX | ||||||
| Len M. Fox | ||||||||
| Vice President and Controller | ||||||||
| (Principal Accounting Officer) | ||||||||
 |
||||||||||||||
4Q 2022 Earnings Release |
||||||||||||||
| FOR IMMEDIATE RELEASE | January 31, 2023 |
|||||||||||||
| Results Summary | ||||||||||||||||||||||||||
| 4Q22 | 3Q22 |
Change
vs
3Q22
|
4Q21 |
Change
vs
4Q21
|
Dollars in millions (except per share data) | 2022 |
2021 |
Change
vs
2021
|
||||||||||||||||||
| 12,750 | 19,660 | -6,910 | 8,870 | +3,880 | Earnings (U.S. GAAP) | 55,740 | 23,040 | +32,700 | ||||||||||||||||||
| 14,035 | 18,682 | -4,647 | 8,795 | +5,240 | Earnings Excluding Identified Items (non-GAAP) | 59,101 | 23,013 | +36,088 | ||||||||||||||||||
| 3.09 | 4.68 | -1.59 | 2.08 | +1.01 | Earnings Per Common Share 4 |
13.26 | 5.39 | +7.87 | ||||||||||||||||||
| 3.40 | 4.45 | -1.05 | 2.05 | +1.35 | Earnings Excl. Identified Items Per Common Share 4 |
14.06 | 5.38 | +8.68 | ||||||||||||||||||
| 7,463 | 5,728 | +1,735 | 5,808 | +1,655 | Capital and Exploration Expenditures | 22,704 | 16,595 | +6,109 | ||||||||||||||||||
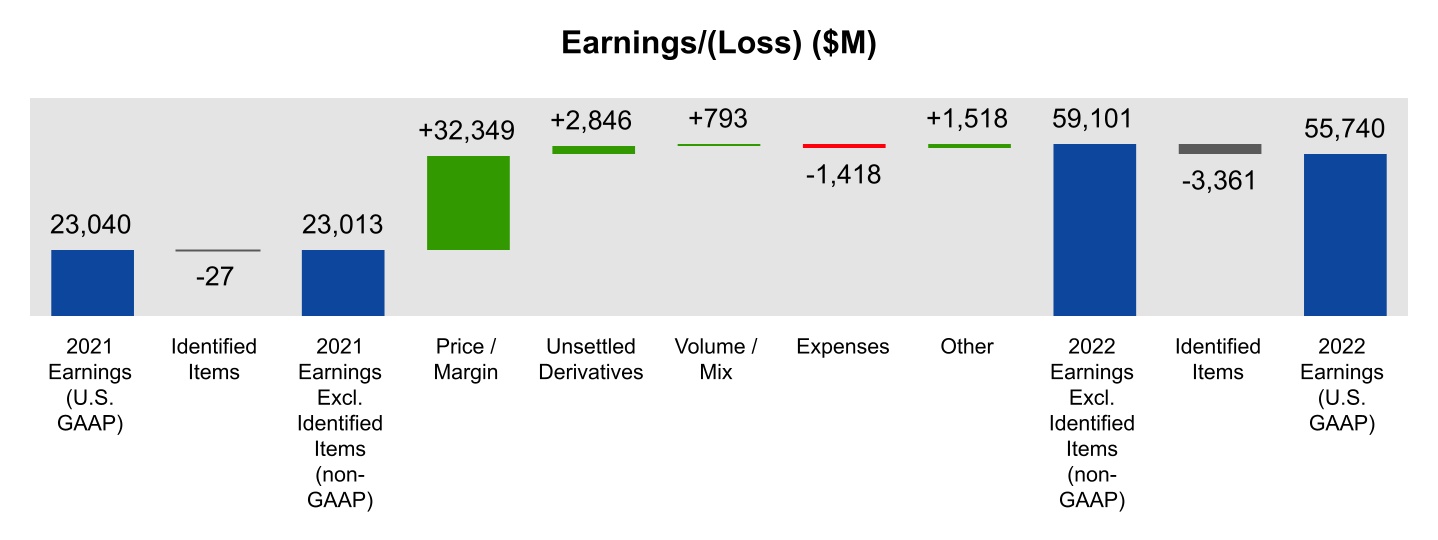
Full-year Factor Analysis |
||||||||||||||||||||||||||
|
. | |||||||||||||
EARNINGS AND VOLUME SUMMARY BY SEGMENT | ||||||||||||||
Upstream | |||||||||||||||||
| 4Q22 | 3Q22 | 4Q21 | Dollars in millions (unless otherwise noted) | 2022 |
2021 |
||||||||||||
| Earnings/(Loss) (U.S. GAAP) | |||||||||||||||||
| 2,493 | 3,110 | 1,768 | United States | 11,728 | 3,663 | ||||||||||||
| 5,708 | 9,309 | 4,317 | Non-U.S. | 24,751 | 12,112 | ||||||||||||
| 8,201 | 12,419 | 6,085 | Worldwide | 36,479 | 15,775 | ||||||||||||
| Earnings/(Loss) Excluding Identified Items (non-GAAP) | |||||||||||||||||
| 2,493 | 3,110 | 2,031 | United States | 11,429 | 3,926 | ||||||||||||
| 6,269 | 8,731 | 4,597 | Non-U.S. | 27,989 | 12,392 | ||||||||||||
| 8,762 | 11,841 | 6,628 | Worldwide | 39,418 | 16,318 | ||||||||||||
| 3,822 | 3,716 | 3,816 | Production (koebd) | 3,737 | 3,712 | ||||||||||||
Energy Products | |||||||||||||||||
| 4Q22 | 3Q22 | 4Q21 | Dollars in millions (unless otherwise noted) | 2022 |
2021 |
||||||||||||
| Earnings/(Loss) (U.S. GAAP) | |||||||||||||||||
| 2,188 | 3,008 | 699 | United States | 8,340 | 668 | ||||||||||||
| 1,882 | 2,811 | 203 | Non-U.S. | 6,626 | (1,014) | ||||||||||||
| 4,070 | 5,819 | 901 | Worldwide | 14,966 | (347) | ||||||||||||
| Earnings/(Loss) Excluding Identified Items (non-GAAP) | |||||||||||||||||
| 2,246 | 3,008 | 699 | United States | 8,398 | 668 | ||||||||||||
| 2,508 | 2,811 | 203 | Non-U.S. | 7,252 | (1,014) | ||||||||||||
| 4,754 | 5,819 | 901 | Worldwide | 15,650 | (347) | ||||||||||||
| 5,423 | 5,537 | 5,373 | Energy Products Sales (kbd) | 5,347 | 5,130 | ||||||||||||
Chemical Products | |||||||||||||||||
| 4Q22 | 3Q22 | 4Q21 | Dollars in millions (unless otherwise noted) | 2022 | 2021 | ||||||||||||
| Earnings/(Loss) (U.S. GAAP) | |||||||||||||||||
| 298 | 635 | 774 | United States | 2,328 | 3,697 | ||||||||||||
| (48) | 177 | 597 | Non-U.S. | 1,215 | 3,292 | ||||||||||||
| 250 | 812 | 1,371 | Worldwide | 3,543 | 6,989 | ||||||||||||
| Earnings/(Loss) Excluding Identified Items (non-GAAP) | |||||||||||||||||
| 298 | 635 | 774 | United States | 2,328 | 3,697 | ||||||||||||
| (48) | 177 | 597 | Non-U.S. | 1,215 | 3,292 | ||||||||||||
| 250 | 812 | 1,371 | Worldwide | 3,543 | 6,989 | ||||||||||||
| 4,658 | 4,680 | 4,833 | Chemical Products Sales (kt) | 19,167 | 19,142 | ||||||||||||
Specialty Products | |||||||||||||||||
| 4Q22 | 3Q22 | 4Q21 | Dollars in millions (unless otherwise noted) | 2022 | 2021 | ||||||||||||
| Earnings/(Loss) (U.S. GAAP) | |||||||||||||||||
| 406 | 306 | 763 | United States | 1,190 | 1,452 | ||||||||||||
| 354 | 456 | 353 | Non-U.S. | 1,225 | 1,807 | ||||||||||||
| 760 | 762 | 1,116 | Worldwide | 2,415 | 3,259 | ||||||||||||
| Earnings/(Loss) Excluding Identified Items (non-GAAP) | |||||||||||||||||
| 406 | 306 | 265 | United States | 1,190 | 954 | ||||||||||||
| 394 | 456 | 217 | Non-U.S. | 1,265 | 1,672 | ||||||||||||
| 800 | 762 | 482 | Worldwide | 2,455 | 2,625 | ||||||||||||
| 1,787 | 1,917 | 1,835 | Specialty Products Sales (kt) | 7,810 | 7,666 | ||||||||||||
Corporate and Financing | |||||||||||||||||
| 4Q22 | 3Q22 | 4Q21 | Dollars in millions (unless otherwise noted) | 2022 | 2021 | ||||||||||||
| (531) | (152) | (603) | Earnings/(Loss) (U.S. GAAP) | (1,663) | (2,636) | ||||||||||||
| (531) | (552) | (587) | Earnings/(Loss) Excluding Identified Items (non-GAAP) | (1,965) | (2,572) | ||||||||||||
|
. | |||||||||||||
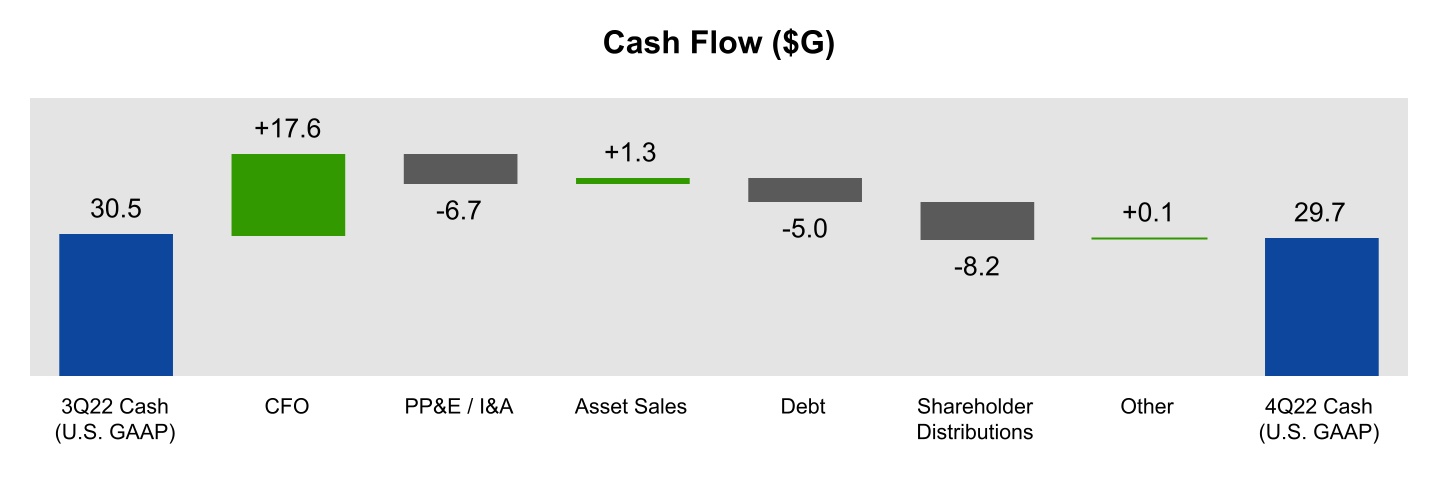
CASH FLOW FROM OPERATIONS AND ASSET SALES EXCLUDING WORKING CAPITAL | ||||||||||||||
| 4Q22 | 3Q22 | 4Q21 | Dollars in millions | 2022 |
2021 |
||||||||||||
| 13,055 | 20,198 | 9,079 | Net income/(loss) including noncontrolling interests | 57,577 | 23,598 | ||||||||||||
| 5,064 | 5,642 | 5,661 | Depreciation and depletion (includes impairments) | 24,040 | 20,607 | ||||||||||||
| (200) | 1,667 | 1,930 | Changes in operational working capital | (194) | 4,162 | ||||||||||||
| (298) | (3,082) | 454 | Other | (4,626) | (238) | ||||||||||||
| 17,621 | 24,425 | 17,124 | Cash Flow from Operating Activities (U.S. GAAP) | 76,797 | 48,129 | ||||||||||||
| 1,333 | 2,682 | 2,601 | Proceeds associated with asset sales | 5,247 | 3,176 | ||||||||||||
| 18,954 | 27,107 | 19,725 | Cash Flow from Operations and Asset Sales (non-GAAP) | 82,044 | 51,305 | ||||||||||||
| 200 | (1,667) | (1,930) | Changes in operational working capital | 194 | (4,162) | ||||||||||||
| 19,154 | 25,440 | 17,795 | Cash Flow from Operations and Asset Sales excluding Working Capital (non-GAAP) | 82,238 | 47,143 | ||||||||||||
FREE CASH FLOW |
|||||||||||||||||
4Q22 |
3Q22 |
4Q21 |
Dollars in millions | 2022 |
2021 |
||||||||||||
| 17,621 | 24,425 | 17,124 | Cash Flow from Operating Activities (U.S. GAAP) | 76,797 | 48,129 | ||||||||||||
| (5,783) | (4,876) | (4,089) | Additions to property, plant and equipment | (18,407) | (12,076) | ||||||||||||
| (2,175) | (272) | (1,762) | Additional investments and advances | (3,090) | (2,817) | ||||||||||||
| 1,270 | 88 | 1,140 | Other investing activities including collection of advances | 1,508 | 1,482 | ||||||||||||
| 1,333 | 2,682 | 2,601 | Proceeds from asset sales and returns of investments | 5,247 | 3,176 | ||||||||||||
| 12,266 | 22,047 | 15,014 | Free Cash Flow (non-GAAP) | 62,055 | 37,894 | ||||||||||||
| RETURN ON AVERAGE CAPITAL EMPLOYED | ||||||||
| Dollars in millions (unless otherwise noted) | 2022 | 2021 | ||||||
| Net income/(loss) attributable to ExxonMobil (U.S. GAAP) | 55,740 | 23,040 | ||||||
| Financing costs (after-tax) | ||||||||
| Gross third-party debt | (1,213) | (1,196) | ||||||
| ExxonMobil share of equity companies | (198) | (170) | ||||||
| All other financing costs – net | 276 | 11 | ||||||
| Total financing costs | (1,135) | (1,355) | ||||||
| Earnings/(loss) excluding financing costs (non-GAAP) | 56,875 | 24,395 | ||||||
| Total assets (U.S. GAAP) | 369,067 | 338,923 | ||||||
| Less liabilities and noncontrolling interests share of assets and liabilities | ||||||||
| Total current liabilities excluding notes and loans payable | (68,411) | (52,367) | ||||||
| Total long-term liabilities excluding long-term debt | (56,990) | (63,169) | ||||||
| Noncontrolling interests share of assets and liabilities | (9,205) | (8,746) | ||||||
| Add ExxonMobil share of debt-financed equity company net assets | 3,705 | 4,001 | ||||||
Total capital employed (non-GAAP) |
238,166 | 218,642 | ||||||
| Average capital employed (non-GAAP) | 228,404 | 222,890 | ||||||
Return on average capital employed – corporate total (non-GAAP) |
24.9% | 10.9% | ||||||
| CALCULATION OF STRUCTURAL COST SAVINGS | |||||||||||||||||
| OPERATING COSTS AND CASH OPERATING EXPENSES | |||||||||||||||||
| Dollars in billions | 2019 | 2022 | |||||||||||||||
| Components of operating costs | |||||||||||||||||
| From ExxonMobil’s Consolidated statement of income (U.S. GAAP) |
|||||||||||||||||
| Production and manufacturing expenses | 36.8 | 42.6 | |||||||||||||||
| Selling, general and administrative expenses | 11.4 | 10.1 | |||||||||||||||
| Depreciation and depletion (includes impairments) | 19.0 | 24.0 | |||||||||||||||
| Exploration expenses, including dry holes | 1.3 | 1.0 | |||||||||||||||
| Non-service pension and postretirement benefit expense | 1.2 | 0.5 | |||||||||||||||
| Subtotal | 69.7 | 78.2 | |||||||||||||||
| ExxonMobil’s share of equity company expenses | 9.1 | 13.0 | |||||||||||||||
| Total operating costs (non-GAAP) | 78.8 | 91.2 | |||||||||||||||
| Less: | |||||||||||||||||
| Depreciation and depletion (includes impairments) | 19.0 | 24.0 | |||||||||||||||
| Non-service pension and postretirement benefit expense | 1.2 | 0.5 | |||||||||||||||
| Other adjustments (includes equity company depreciation and depletion) |
3.6 | 3.5 | |||||||||||||||
| Total cash operating expenses (cash opex) (non-GAAP) | 55.0 | 63.2 | |||||||||||||||
| Energy and production taxes | 11.0 | 23.8 | |||||||||||||||
| Market | Activity / Other |
Structural Savings |
|||||||||||||||
| Total cash operating expenses (cash opex) excluding energy and production taxes (non-GAAP) | 44.0 | +3 | -1 | -7 | 39.4 | ||||||||||||
|
. | ATTACHMENT I-a |
||||||||||||
CONDENSED CONSOLIDATED STATEMENT OF INCOME | ||||||||||||||
| (Preliminary) | ||||||||||||||
Three Months Ended December 31, |
Twelve Months Ended December 31, | |||||||||||||
Dollars in millions |
2022 | 2021 | 2022 | 2021 | ||||||||||
| Revenues and other income | ||||||||||||||
| Sales and other operating revenue | 93,164 | 81,305 | 398,675 | 276,692 | ||||||||||
| Income from equity affiliates | 605 | 2,078 | 11,463 | 6,657 | ||||||||||
| Other income | 1,660 | 1,582 | 3,542 | 2,291 | ||||||||||
| Total revenues and other income | 95,429 | 84,965 | 413,680 | 285,640 | ||||||||||
| Costs and other deductions | ||||||||||||||
| Crude oil and product purchases | 50,761 | 45,489 | 228,959 | 155,164 | ||||||||||
| Production and manufacturing expenses | 10,365 | 10,783 | 42,609 | 36,035 | ||||||||||
| Selling, general and administrative expenses | 2,832 | 2,514 | 10,095 | 9,574 | ||||||||||
| Depreciation and depletion (includes impairments) | 5,064 | 5,661 | 24,040 | 20,607 | ||||||||||
| Exploration expenses, including dry holes | 348 | 524 | 1,025 | 1,054 | ||||||||||
| Non-service pension and postretirement benefit expense | 100 | 100 | 482 | 786 | ||||||||||
| Interest expense | 207 | 221 | 798 | 947 | ||||||||||
| Other taxes and duties | 6,910 | 7,944 | 27,919 | 30,239 | ||||||||||
| Total costs and other deductions | 76,587 | 73,236 | 335,927 | 254,406 | ||||||||||
| Income/(Loss) before income taxes | 18,842 | 11,729 | 77,753 | 31,234 | ||||||||||
| Income tax expense/(benefit) | 5,787 | 2,650 | 20,176 | 7,636 | ||||||||||
| Net income/(loss) including noncontrolling interests | 13,055 | 9,079 | 57,577 | 23,598 | ||||||||||
| Net income/(loss) attributable to noncontrolling interests | 305 | 209 | 1,837 | 558 | ||||||||||
| Net income/(loss) attributable to ExxonMobil | 12,750 | 8,870 | 55,740 | 23,040 | ||||||||||
| OTHER FINANCIAL DATA | ||||||||||||||
Three Months Ended December 31, |
Twelve Months Ended December 31, | |||||||||||||
| 2022 | 2021 | 2022 | 2021 | |||||||||||
Earnings per common share (U.S. dollars) |
3.09 | 2.08 | 13.26 | 5.39 | ||||||||||
Earnings per common share - assuming dilution (U.S. dollars) |
3.09 | 2.08 | 13.26 | 5.39 | ||||||||||
| Dividends on common stock | ||||||||||||||
| Total | 3,767 | 3,763 | 14,939 | 14,924 | ||||||||||
Per common share (U.S. dollars) |
0.91 | 0.88 | 3.55 | 3.49 | ||||||||||
| Millions of common shares outstanding | ||||||||||||||
| Average - assuming dilution | 4,138 | 4,275 | 4,205 | 4,275 | ||||||||||
| Income taxes | 5,787 | 2,650 | 20,176 | 7,636 | ||||||||||
| Total other taxes and duties | 7,754 | 8,659 | 31,455 | 32,955 | ||||||||||
| Total taxes | 13,541 | 11,309 | 51,631 | 40,591 | ||||||||||
| Sales-based taxes | 6,113 | 5,987 | 25,434 | 21,872 | ||||||||||
| Total taxes including sales-based taxes | 19,654 | 17,296 | 77,065 | 62,463 | ||||||||||
| ExxonMobil share of income taxes of equity companies | 1,512 | 918 | 7,594 | 2,756 | ||||||||||
|
. | ATTACHMENT I-b | ||||||||||||
| CONDENSED CONSOLIDATED BALANCE SHEET | ||||||||||||||
| (Preliminary) | ||||||||||||||
| Dollars in millions (unless otherwise noted) | December 31, 2022 | December 31, 2021 | ||||||
| ASSETS | ||||||||
| Current assets | ||||||||
| Cash and cash equivalents | 29,640 | 6,802 | ||||||
| Cash and cash equivalents – restricted | 25 | — | ||||||
| Notes and accounts receivable – net | 41,749 | 32,383 | ||||||
| Inventories | ||||||||
| Crude oil, products and merchandise | 20,434 | 14,519 | ||||||
| Materials and supplies | 4,001 | 4,261 | ||||||
| Other current assets | 1,782 | 1,189 | ||||||
| Total current assets | 97,631 | 59,154 | ||||||
| Investments, advances and long-term receivables | 49,793 | 45,195 | ||||||
Property, plant and equipment, at cost, less accumulated depreciation and depletion |
204,692 | 216,552 | ||||||
| Other assets, including intangibles – net | 16,951 | 18,022 | ||||||
| Total Assets | 369,067 | 338,923 | ||||||
| LIABILITIES | ||||||||
| Current liabilities | ||||||||
| Notes and loans payable | 634 | 4,276 | ||||||
| Accounts payable and accrued liabilities | 63,197 | 50,766 | ||||||
| Income taxes payable | 5,214 | 1,601 | ||||||
| Total current liabilities | 69,045 | 56,643 | ||||||
| Long-term debt | 40,559 | 43,428 | ||||||
| Postretirement benefits reserves | 10,045 | 18,430 | ||||||
| Deferred income tax liabilities | 22,874 | 20,165 | ||||||
| Long-term obligations to equity companies | 2,338 | 2,857 | ||||||
| Other long-term obligations | 21,733 | 21,717 | ||||||
| Total Liabilities | 166,594 | 163,240 | ||||||
| EQUITY | ||||||||
| Common stock without par value | ||||||||
(9,000 million shares authorized, 8,019 million shares issued) |
15,752 | 15,746 | ||||||
| Earnings reinvested | 432,860 | 392,059 | ||||||
| Accumulated other comprehensive income | (13,270) | (13,764) | ||||||
| Common stock held in treasury | ||||||||
(3,937 million shares at December 31, 2022, and 3,780 million shares at December 31, 2021) |
(240,293) | (225,464) | ||||||
| ExxonMobil share of equity | 195,049 | 168,577 | ||||||
| Noncontrolling interests | 7,424 | 7,106 | ||||||
| Total Equity | 202,473 | 175,683 | ||||||
| Total Liabilities and Equity | 369,067 | 338,923 | ||||||
|
. | ATTACHMENT I-c | ||||||||||||
| CONDENSED CONSOLIDATED STATEMENT OF CASH FLOWS | ||||||||||||||
| (Preliminary) | ||||||||||||||
| Twelve Months Ended December 31, | ||||||||
| Dollars in millions (unless otherwise noted) | 2022 | 2021 | ||||||
| CASH FLOWS FROM OPERATING ACTIVITIES | ||||||||
| Net income/(loss) including noncontrolling interests | 57,577 | 23,598 | ||||||
| Depreciation and depletion (includes impairments) | 24,040 | 20,607 | ||||||
| Changes in operational working capital, excluding cash and debt | (194) | 4,162 | ||||||
| All other items – net | (4,626) | (238) | ||||||
| Net cash provided by operating activities | 76,797 | 48,129 | ||||||
| CASH FLOWS FROM INVESTING ACTIVITIES | ||||||||
| Additions to property, plant and equipment | (18,407) | (12,076) | ||||||
| Proceeds from asset sales and returns of investments | 5,247 | 3,176 | ||||||
| Additional investments and advances | (3,090) | (2,817) | ||||||
| Other investing activities including collection of advances | 1,508 | 1,482 | ||||||
| Net cash used in investing activities | (14,742) | (10,235) | ||||||
| CASH FLOWS FROM FINANCING ACTIVITIES | ||||||||
| Additions to long-term debt | 637 | 46 | ||||||
| Reductions in long-term debt | (5) | (8) | ||||||
| Additions to short-term debt ¹ | 198 | 12,687 | ||||||
| Reductions in short-term debt ¹ | (8,075) | (29,396) | ||||||
| Additions/(Reductions) in commercial paper, and debt with three months or less maturity | 25 | (2,983) | ||||||
| Contingent consideration payments | (58) | (30) | ||||||
| Cash dividends to ExxonMobil shareholders | (14,939) | (14,924) | ||||||
| Cash dividends to noncontrolling interests | (267) | (224) | ||||||
| Changes in noncontrolling interests | (1,475) | (436) | ||||||
| Common stock acquired | (15,155) | (155) | ||||||
| Net cash provided by (used in) financing activities | (39,114) | (35,423) | ||||||
| Effects of exchange rate changes on cash | (78) | (33) | ||||||
| Increase/(Decrease) in cash and cash equivalents | 22,863 | 2,438 | ||||||
| Cash and cash equivalents at beginning of period | 6,802 | 4,364 | ||||||
| Cash and cash equivalents at end of period | 29,665 | 6,802 | ||||||
| ¹ Includes commercial paper with a maturity greater than three months | ||||||||
|
. | ATTACHMENT II-a | ||||||||||||
KEY FIGURES: IDENTIFIED ITEMS | ||||||||||||||
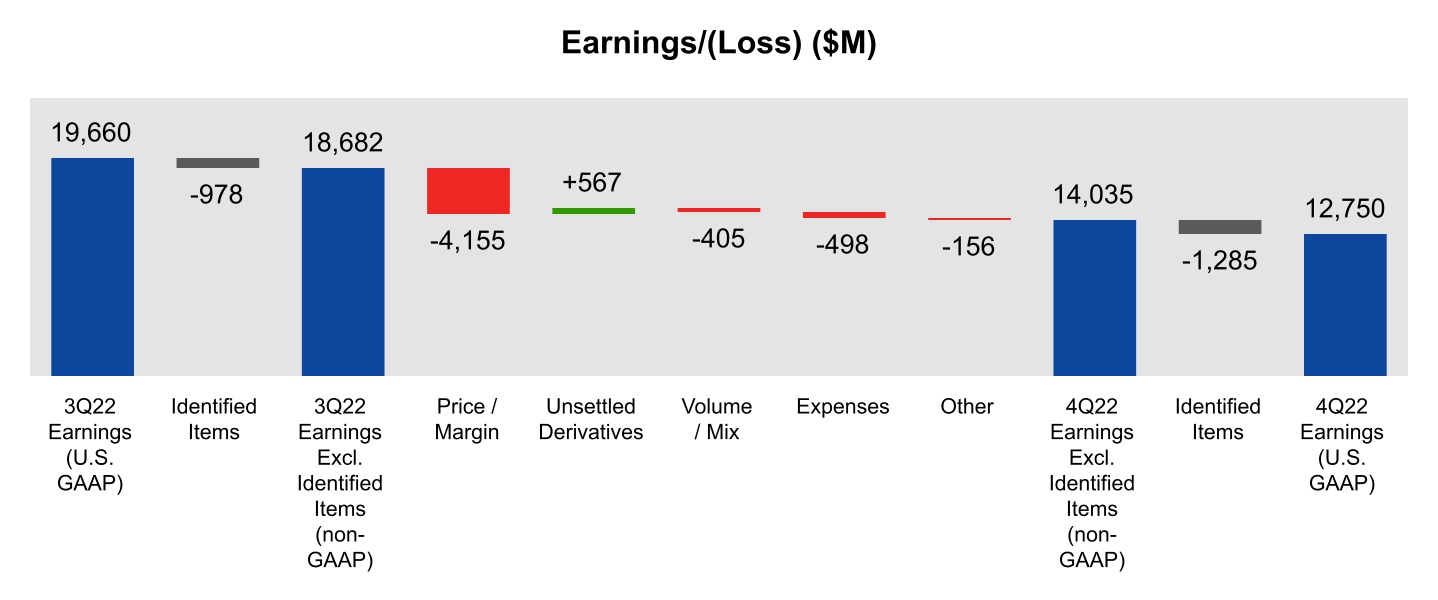
| 4Q22 | 3Q22 | 4Q21 | Dollars in Millions | 2022 | 2021 | ||||||||||||
| 12,750 | 19,660 | 8,870 | Earnings/(Loss) (U.S. GAAP) | 55,740 | 23,040 | ||||||||||||
| Identified Items | |||||||||||||||||
| (530) | (697) | (752) | Impairments | (4,202) | (752) | ||||||||||||
| — | 587 | 1,081 | Gain/(Loss) on sale of assets | 886 | 1,081 | ||||||||||||
| (1,825) | 324 | — | Tax-related items | (1,501) | — | ||||||||||||
| — | — | (4) | Severance | — | (52) | ||||||||||||
| 1,070 | 764 | (250) | Other | 1,456 | (250) | ||||||||||||
| (1,285) | 978 | 75 | Total Identified Items | (3,361) | 27 | ||||||||||||
| 14,035 | 18,682 | 8,795 | Earnings/(Loss) Excluding Identified Items (non-GAAP) | 59,101 | 23,013 | ||||||||||||
| 4Q22 | 3Q22 | 4Q21 | Dollars Per Common Share | 2022 | 2021 | ||||||||||||
| 3.09 | 4.68 | 2.08 | Earnings/(Loss) Per Common Share ¹ (U.S. GAAP) | 13.26 | 5.39 | ||||||||||||
| Identified Items Per Common Share ¹ | |||||||||||||||||
| (0.13) | (0.16) | (0.17) | Impairments | (1.00) | (0.17) | ||||||||||||
| — | 0.14 | 0.26 | Gain/(Loss) on sale of assets | 0.21 | 0.26 | ||||||||||||
| (0.44) | 0.08 | — | Tax-related items | (0.36) | — | ||||||||||||
| — | — | — | Severance | — | (0.02) | ||||||||||||
| 0.26 | 0.18 | (0.06) | Other | 0.35 | (0.06) | ||||||||||||
| (0.31) | 0.23 | 0.03 | Total Identified Items Per Common Share ¹ | (0.80) | 0.01 | ||||||||||||
| 3.40 | 4.45 | 2.05 | Earnings/(Loss) Excl. Identified Items Per Common Share ¹ (non-GAAP) | 14.06 | 5.38 | ||||||||||||
¹ Assuming dilution | |||||||||||||||||
|
. | ATTACHMENT II-b | ||||||||||||
KEY FIGURES: IDENTIFIED ITEMS BY SEGMENT | ||||||||||||||
| Fourth Quarter 2022 | Upstream | Energy Products | Chemical Products | Specialty Products | Corporate & Financing | Total | ||||||||||||||||||||||||||
| Dollars in millions | U.S. | Non-U.S. | U.S. | Non-U.S. | U.S. | Non-U.S. | U.S. | Non-U.S. | ||||||||||||||||||||||||
| Earnings/(Loss) (U.S. GAAP) | 2,493 | 5,708 | 2,188 | 1,882 | 298 | (48) | 406 | 354 | (531) | 12,750 | ||||||||||||||||||||||
| Identified Items | ||||||||||||||||||||||||||||||||
| Impairments | — | (216) | (58) | (216) | — | — | — | (40) | — | (530) | ||||||||||||||||||||||
| Tax-related items | — | (1,415) | — | (410) | — | — | — | — | — | (1,825) | ||||||||||||||||||||||
| Other | — | 1,070 | — | — | — | — | — | — | — | 1,070 | ||||||||||||||||||||||
| Total Identified Items | — | (561) | (58) | (626) | — | — | — | (40) | — | (1,285) | ||||||||||||||||||||||
| Earnings/(Loss) Excl. Identified Items (non-GAAP) | 2,493 | 6,269 | 2,246 | 2,508 | 298 | (48) | 406 | 394 | (531) | 14,035 | ||||||||||||||||||||||
Third Quarter 2022 |
Upstream | Energy Products | Chemical Products | Specialty Products | Corporate & Financing | Total | ||||||||||||||||||||||||||
| Dollars in millions | U.S. | Non-U.S. | U.S. | Non-U.S. | U.S. | Non-U.S. | U.S. | Non-U.S. | ||||||||||||||||||||||||
| Earnings/(Loss) (U.S. GAAP) | 3,110 | 9,309 | 3,008 | 2,811 | 635 | 177 | 306 | 456 | (152) | 19,660 | ||||||||||||||||||||||
| Identified Items | ||||||||||||||||||||||||||||||||
| Impairments | — | (697) | — | — | — | — | — | — | — | (697) | ||||||||||||||||||||||
| Gain/(Loss) on sale of assets | — | 587 | — | — | — | — | — | — | — | 587 | ||||||||||||||||||||||
| Tax-related items | — | — | — | — | — | — | — | — | 324 | 324 | ||||||||||||||||||||||
| Other | — | 688 | — | — | — | — | — | — | 76 | 764 | ||||||||||||||||||||||
| Total Identified Items | — | 578 | — | — | — | — | — | — | 400 | 978 | ||||||||||||||||||||||
| Earnings/(Loss) Excl. Identified Items (non-GAAP) | 3,110 | 8,731 | 3,008 | 2,811 | 635 | 177 | 306 | 456 | (552) | 18,682 | ||||||||||||||||||||||
| Fourth Quarter 2021 | Upstream | Energy Products | Chemical Products | Specialty Products | Corporate & Financing | Total | ||||||||||||||||||||||||||
| Dollars in millions | U.S. | Non-U.S. | U.S. | Non-U.S. | U.S. | Non-U.S. | U.S. | Non-U.S. | ||||||||||||||||||||||||
| Earnings/(Loss) (U.S. GAAP) | 1,768 | 4,317 | 699 | 203 | 774 | 597 | 763 | 353 | (603) | 8,870 | ||||||||||||||||||||||
| Identified Items | ||||||||||||||||||||||||||||||||
| Impairments | (263) | (489) | — | — | — | — | — | — | — | (752) | ||||||||||||||||||||||
| Gain/(Loss) on sale of assets | — | 459 | — | — | — | — | 498 | 136 | (12) | 1,081 | ||||||||||||||||||||||
| Severance | — | — | — | — | — | — | — | — | (4) | (4) | ||||||||||||||||||||||
| Other | — | (250) | — | — | — | — | — | — | — | (250) | ||||||||||||||||||||||
| Total Identified Items | (263) | (280) | — | — | — | — | 498 | 136 | (16) | 75 | ||||||||||||||||||||||
| Earnings/(Loss) Excl. Identified Items (non-GAAP) | 2,031 | 4,597 | 699 | 203 | 774 | 597 | 265 | 217 | (587) | 8,795 | ||||||||||||||||||||||
| 2022 | Upstream | Energy Products | Chemical Products | Specialty Products | Corporate & Financing | Total | ||||||||||||||||||||||||||
| Dollars in millions | U.S. | Non-U.S. | U.S. | Non-U.S. | U.S. | Non-U.S. | U.S. | Non-U.S. | ||||||||||||||||||||||||
| Earnings/(Loss) (U.S. GAAP) | 11,728 | 24,751 | 8,340 | 6,626 | 2,328 | 1,215 | 1,190 | 1,225 | (1,663) | 55,740 | ||||||||||||||||||||||
| Identified Items | ||||||||||||||||||||||||||||||||
| Impairments | — | (3,790) | (58) | (216) | — | — | — | (40) | (98) | (4,202) | ||||||||||||||||||||||
| Gain/(Loss) on sale of assets | 299 | 587 | — | — | — | — | — | — | — | 886 | ||||||||||||||||||||||
| Tax-related items | — | (1,415) | — | (410) | — | — | — | — | 324 | (1,501) | ||||||||||||||||||||||
| Other | — | 1,380 | — | — | — | — | — | — | 76 | 1,456 | ||||||||||||||||||||||
| Total Identified Items | 299 | (3,238) | (58) | (626) | — | — | — | (40) | 302 | (3,361) | ||||||||||||||||||||||
| Earnings/(Loss) Excl. Identified Items (non-GAAP) | 11,429 | 27,989 | 8,398 | 7,252 | 2,328 | 1,215 | 1,190 | 1,265 | (1,965) | 59,101 | ||||||||||||||||||||||
| 2021 | Upstream | Energy Products | Chemical Products | Specialty Products | Corporate & Financing | Total | ||||||||||||||||||||||||||
| Dollars in millions | U.S. | Non-U.S. | U.S. | Non-U.S. | U.S. | Non-U.S. | U.S. | Non-U.S. | ||||||||||||||||||||||||
| Earnings/(Loss) (U.S. GAAP) | 3,663 | 12,112 | 668 | (1,014) | 3,697 | 3,292 | 1,452 | 1,807 | (2,636) | 23,040 | ||||||||||||||||||||||
| Identified Items | ||||||||||||||||||||||||||||||||
| Impairments | (263) | (489) | — | — | — | — | — | — | — | (752) | ||||||||||||||||||||||
| Gain/(Loss) on sale of assets | — | 459 | — | — | — | — | 498 | 136 | (12) | 1,081 | ||||||||||||||||||||||
| Severance | — | — | — | — | — | — | — | — | (52) | (52) | ||||||||||||||||||||||
| Other | — | (250) | — | — | — | — | — | — | — | (250) | ||||||||||||||||||||||
| Total Identified Items | (263) | (280) | — | — | — | — | 498 | 136 | (64) | 27 | ||||||||||||||||||||||
| Earnings/(Loss) Excl. Identified Items (non-GAAP) | 3,926 | 12,392 | 668 | (1,014) | 3,697 | 3,292 | 954 | 1,672 | (2,572) | 23,013 | ||||||||||||||||||||||
|
. | ATTACHMENT III | ||||||||||||
KEY FIGURES: UPSTREAM VOLUMES | ||||||||||||||
| 4Q22 | 3Q22 | 4Q21 | Net production of crude oil, natural gas liquids, bitumen and synthetic oil, thousand barrels per day (kbd) | 2022 | 2021 | ||||||||||||
| 789 | 783 | 770 | United States | 776 | 721 | ||||||||||||
| 682 | 641 | 571 | Canada/Other Americas | 588 | 560 | ||||||||||||
| 4 | 4 | 17 | Europe | 4 | 22 | ||||||||||||
| 223 | 249 | 235 | Africa | 238 | 248 | ||||||||||||
| 725 | 666 | 752 | Asia | 705 | 695 | ||||||||||||
| 38 | 46 | 40 | Australia/Oceania | 43 | 43 | ||||||||||||
| 2,461 | 2,389 | 2,385 | Worldwide | 2,354 | 2,289 | ||||||||||||
| 4Q22 | 3Q22 | 4Q21 | Natural gas production available for sale, million cubic feet per day (mcfd) | 2022 | 2021 | ||||||||||||
| 2,383 | 2,351 | 2,713 | United States | 2,551 | 2,746 | ||||||||||||
| 74 | 158 | 189 | Canada/Other Americas | 148 | 195 | ||||||||||||
| 536 | 541 | 844 | Europe | 667 | 808 | ||||||||||||
| 89 | 70 | 48 | Africa | 71 | 43 | ||||||||||||
| 3,704 | 3,304 | 3,468 | Asia | 3,418 | 3,465 | ||||||||||||
| 1,381 | 1,539 | 1,322 | Australia/Oceania | 1,440 | 1,280 | ||||||||||||
| 8,167 | 7,963 | 8,584 | Worldwide | 8,295 | 8,537 | ||||||||||||
| 3,822 | 3,716 | 3,816 | Oil-equivalent production (koebd)¹ |
3,737 | 3,712 | ||||||||||||
1 Natural gas is converted to an oil-equivalent basis at six million cubic feet per one thousand barrels. |
|||||||||||||||||
|
. | ATTACHMENT IV | ||||||||||||
KEY FIGURES: MANUFACTURING THROUGHPUT AND SALES | ||||||||||||||
| 4Q22 | 3Q22 | 4Q21 | Refinery throughput, thousand barrels per day (kbd) | 2022 | 2021 | ||||||||||||
| 1,694 | 1,742 | 1,740 | United States | 1,702 | 1,623 | ||||||||||||
| 433 | 426 | 416 | Canada | 418 | 379 | ||||||||||||
| 1,157 | 1,253 | 1,246 | Europe | 1,192 | 1,210 | ||||||||||||
| 532 | 557 | 546 | Asia Pacific | 539 | 571 | ||||||||||||
| 167 | 187 | 170 | Other | 179 | 162 | ||||||||||||
| 3,983 | 4,165 | 4,118 | Worldwide | 4,030 | 3,945 | ||||||||||||
| 4Q22 | 3Q22 | 4Q21 | Energy Products sales, thousand barrels per day (kbd) | 2022 | 2021 | ||||||||||||
| 2,507 | 2,479 | 2,396 | United States | 2,426 | 2,267 | ||||||||||||
| 2,916 | 3,058 | 2,976 | Non-U.S. | 2,921 | 2,863 | ||||||||||||
| 5,423 | 5,537 | 5,373 | Worldwide | 5,347 | 5,130 | ||||||||||||
| 2,270 | 2,335 | 2,325 | Gasolines, naphthas | 2,232 | 2,158 | ||||||||||||
| 1,798 | 1,818 | 1,804 | Heating oils, kerosene, diesel | 1,774 | 1,749 | ||||||||||||
| 349 | 365 | 267 | Aviation fuels | 338 | 220 | ||||||||||||
| 210 | 252 | 265 | Heavy fuels | 235 | 269 | ||||||||||||
| 796 | 767 | 712 | Other energy products | 768 | 734 | ||||||||||||
| 5,423 | 5,537 | 5,373 | Worldwide | 5,347 | 5,130 | ||||||||||||
| 4Q22 | 3Q22 | 4Q21 | Chemical Products sales, thousand metric tons (kt) | 2022 | 2021 | ||||||||||||
| 1,583 | 1,658 | 1,807 | United States | 7,270 | 7,017 | ||||||||||||
| 3,076 | 3,023 | 3,026 | Non-U.S. | 11,897 | 12,126 | ||||||||||||
| 4,658 | 4,680 | 4,833 | Worldwide | 19,167 | 19,142 | ||||||||||||
| 4Q22 | 3Q22 | 4Q21 | Specialty Products sales, thousand metric tons (kt) | 2022 | 2021 | ||||||||||||
| 455 | 483 | 467 | United States | 2,049 | 1,943 | ||||||||||||
| 1,332 | 1,434 | 1,368 | Non-U.S. | 5,762 | 5,723 | ||||||||||||
| 1,787 | 1,917 | 1,835 | Worldwide | 7,810 | 7,666 | ||||||||||||
|
. | ATTACHMENT V | ||||||||||||
KEY FIGURES: CAPITAL AND EXPLORATION EXPENDITURES | ||||||||||||||
| 4Q22 | 3Q22 | 4Q21 | Dollars in millions | 2022 | 2021 | ||||||||||||
| Upstream | |||||||||||||||||
| 2,118 | 1,837 | 1,307 | United States | 6,968 | 4,018 | ||||||||||||
| 3,297 | 2,244 | 2,934 | Non-U.S. | 10,034 | 8,236 | ||||||||||||
| 5,415 | 4,081 | 4,241 | Total | 17,002 | 12,254 | ||||||||||||
| Energy Products | |||||||||||||||||
| 343 | 316 | 331 | United States | 1,351 | 982 | ||||||||||||
| 405 | 274 | 344 | Non-U.S. | 1,059 | 1,005 | ||||||||||||
| 748 | 590 | 675 | Total | 2,410 | 1,987 | ||||||||||||
| Chemical Products | |||||||||||||||||
| 332 | 310 | 300 | United States | 1,123 | 1,200 | ||||||||||||
| 824 | 644 | 380 | Non-U.S. | 1,842 | 825 | ||||||||||||
| 1,156 | 954 | 680 | Total | 2,965 | 2,025 | ||||||||||||
| Specialty Products | |||||||||||||||||
| 12 | 15 | 167 | United States | 46 | 185 | ||||||||||||
| 90 | 72 | 44 | Non-U.S. | 222 | 141 | ||||||||||||
| 102 | 87 | 211 | Total | 268 | 326 | ||||||||||||
| Other | |||||||||||||||||
| 42 | 16 | 1 | Other | 59 | 3 | ||||||||||||
| 7,463 | 5,728 | 5,808 | Worldwide | 22,704 | 16,595 | ||||||||||||
| CASH CAPITAL EXPENDITURES | |||||||||||||||||
| 4Q22 | 3Q22 | 4Q21 | Dollars in millions | 2022 | 2021 | ||||||||||||
| 5,783 | 4,876 | 4,089 | Additions to property, plant and equipment | 18,407 | 12,076 | ||||||||||||
| 905 | 184 | 622 | Net investments and advances | 1,582 | 1,335 | ||||||||||||
| 6,688 | 5,060 | 4,711 | Total Cash Capital Expenditures | 19,989 | 13,411 | ||||||||||||
|
. | ATTACHMENT VI | ||||||||||||
KEY FIGURES: QUARTER EARNINGS/(LOSS) | ||||||||||||||
| Results Summary | ||||||||||||||||||||||||||
| 4Q22 | 3Q22 |
Change
vs
3Q22
|
4Q21 |
Change
vs
4Q21
|
Dollars in millions (except per share data) | 2022 |
2021 |
Change
vs
2021
|
||||||||||||||||||
| 12,750 | 19,660 | -6,910 | 8,870 | +3,880 | Earnings/(Loss) (U.S. GAAP) | 55,740 | 23,040 | +32,700 | ||||||||||||||||||
| 14,035 | 18,682 | -4,647 | 8,795 | +5,240 | Earnings/(Loss) Excluding Identified Items (non-GAAP) | 59,101 | 23,013 | +36,088 | ||||||||||||||||||
| 3.09 | 4.68 | -1.59 | 2.08 | +1.01 | Earnings Per Common Share ¹ | 13.26 | 5.39 | +7.87 | ||||||||||||||||||
| 3.40 | 4.45 | -1.05 | 2.05 | +1.35 | Earnings/(Loss) Excl. Identified Items Per Common Share ¹ | 14.06 | 5.38 | +8.68 | ||||||||||||||||||
| 7,463 | 5,728 | +1,735 | 5,808 | +1,655 | Capital and Exploration Expenditures | 22,704 | 16,595 | +6,109 | ||||||||||||||||||
| ¹ Assuming dilution | ||||||||||||||||||||||||||
3Q22 to 4Q22 Factor Analysis | ||||||||||||||
|
. | ATTACHMENT VII | ||||||||||||
KEY FIGURES: EARNINGS/(LOSS) BY QUARTER | ||||||||||||||
| Dollars in millions | 2022 |
2021 |
2020 |
2019 |
2018 |
||||||||||||
| First Quarter | 5,480 | 2,730 | (610) | 2,350 | 4,650 | ||||||||||||
| Second Quarter | 17,850 | 4,690 | (1,080) | 3,130 | 3,950 | ||||||||||||
| Third Quarter | 19,660 | 6,750 | (680) | 3,170 | 6,240 | ||||||||||||
| Fourth Quarter | 12,750 | 8,870 | (20,070) | 5,690 | 6,000 | ||||||||||||
| Full Year | 55,740 | 23,040 | (22,440) | 14,340 | 20,840 | ||||||||||||
| Dollars per common share ¹ | 2022 |
2021 |
2020 |
2019 |
2018 |
||||||||||||
| First Quarter | 1.28 | 0.64 | (0.14) | 0.55 | 1.09 | ||||||||||||
| Second Quarter | 4.21 | 1.10 | (0.26) | 0.73 | 0.92 | ||||||||||||
| Third Quarter | 4.68 | 1.57 | (0.15) | 0.75 | 1.46 | ||||||||||||
| Fourth Quarter | 3.09 | 2.08 | (4.70) | 1.33 | 1.41 | ||||||||||||
| Full Year | 13.26 | 5.39 | (5.25) | 3.36 | 4.88 | ||||||||||||
1 Computed using the average number of shares outstanding during each period; assuming dilution |
|||||||||||||||||
 |
. | EXHIBIT 99.2 | |||||||||||||||
To assist investors in assessing 4Q22 results, the following disclosures have been made available in this 8-K filing: | |||||||||||||||||
–Identified items of $(0.31) per share assuming dilution, as noted on page 1 of the news release | |||||||||||||||||
–A reconciliation of cash flow from operations and asset sales excluding working capital on page 1 of this exhibit and on page 8 of the news release | |||||||||||||||||
4Q22 INVESTOR RELATIONS DATA SUMMARY (PAGE 1 of 4) | ||||||||||||||||||||
| Earnings/(Loss), $M (unless noted) | 4Q22 | 3Q22 | 2Q22 | 1Q22 | 4Q21 | |||||||||||||||
| Upstream | United States | 2,493 | 3,110 | 3,749 | 2,376 | 1,768 | ||||||||||||||
| Non-U.S. | 5,708 | 9,309 | 7,622 | 2,112 | 4,317 | |||||||||||||||
| Total | 8,201 | 12,419 | 11,371 | 4,488 | 6,085 | |||||||||||||||
| Energy Products | United States | 2,188 | 3,008 | 2,655 | 489 | 699 | ||||||||||||||
| Non-U.S. | 1,882 | 2,811 | 2,617 | (684) | 203 | |||||||||||||||
| Total | 4,070 | 5,819 | 5,273 | (196) | 901 | |||||||||||||||
| Chemical Products | United States | 298 | 635 | 625 | 770 | 774 | ||||||||||||||
| Non-U.S. | (48) | 177 | 450 | 636 | 597 | |||||||||||||||
| Total | 250 | 812 | 1,076 | 1,405 | 1,371 | |||||||||||||||
| Specialty Products | United States | 406 | 306 | 232 | 246 | 763 | ||||||||||||||
| Non-U.S. | 354 | 456 | 185 | 230 | 353 | |||||||||||||||
| Total | 760 | 762 | 417 | 476 | 1,116 | |||||||||||||||
| Corporate and Financing | (531) | (152) | (286) | (694) | (603) | |||||||||||||||
| Net income attributable to ExxonMobil (U.S. GAAP) | 12,750 | 19,660 | 17,850 | 5,480 | 8,870 | |||||||||||||||
| Earnings/(Loss) per common share (U.S. GAAP) | 3.09 | 4.68 | 4.21 | 1.28 | 2.08 | |||||||||||||||
| Earnings/(Loss) per common share - assuming dilution (U.S. GAAP) | 3.09 | 4.68 | 4.21 | 1.28 | 2.08 | |||||||||||||||
| Effective Income Tax Rate, % | 36 | % | 29 | % | 31 | % | 40 | % | 28 | % | ||||||||||
| Capital and Exploration Expenditures, $M | 4Q22 | 3Q22 | 2Q22 | 1Q22 | 4Q21 | |||||||||||||||
| Upstream | United States | 2,118 | 1,837 | 1,644 | 1,369 | 1,307 | ||||||||||||||
| Non-U.S. | 3,297 | 2,244 | 1,983 | 2,510 | 2,934 | |||||||||||||||
| Total | 5,415 | 4,081 | 3,627 | 3,879 | 4,241 | |||||||||||||||
| Energy Products | United States | 343 | 316 | 300 | 392 | 331 | ||||||||||||||
| Non-U.S. | 405 | 274 | 206 | 174 | 344 | |||||||||||||||
| Total | 748 | 590 | 506 | 566 | 675 | |||||||||||||||
| Chemical Products | United States | 332 | 310 | 250 | 231 | 300 | ||||||||||||||
| Non-U.S. | 824 | 644 | 169 | 205 | 380 | |||||||||||||||
| Total | 1,156 | 954 | 419 | 436 | 680 | |||||||||||||||
| Specialty Products | United States | 12 | 15 | 14 | 5 | 167 | ||||||||||||||
| Non-U.S. | 90 | 72 | 42 | 18 | 44 | |||||||||||||||
| Total | 102 | 87 | 56 | 23 | 211 | |||||||||||||||
| Other | 42 | 16 | 1 | — | 1 | |||||||||||||||
| Total Capital and Exploration Expenditures | 7,463 | 5,728 | 4,609 | 4,904 | 5,808 | |||||||||||||||
| Exploration expenses, including dry holes | 348 | 218 | 286 | 173 | 524 | |||||||||||||||
| Cash Capital Expenditures, $M | 4Q22 | 3Q22 | 2Q22 | 1Q22 | 4Q21 | |||||||||||||||
| Additions to property, plant and equipment | 5,783 | 4,876 | 3,837 | 3,911 | 4,089 | |||||||||||||||
| Net investments and advances | 905 | 184 | 166 | 327 | 622 | |||||||||||||||
| Total Cash Capital Expenditures | 6,688 | 5,060 | 4,003 | 4,238 | 4,711 | |||||||||||||||
| Total Cash and Cash Equivalents, $G | 29.7 | 30.5 | 18.9 | 11.1 | 6.8 | |||||||||||||||
| Total Debt, $G | 41.2 | 45.4 | 46.9 | 47.5 | 47.7 | |||||||||||||||
| Cash Flow from Operations and Asset Sales excluding working capital, $M | 4Q22 | 3Q22 | 2Q22 | 1Q22 | 4Q21 | |||||||||||||||
| Net cash provided by operating activities (GAAP) | 17,621 | 24,425 | 19,963 | 14,788 | 17,124 | |||||||||||||||
| Proceeds associated with asset sales | 1,333 | 2,682 | 939 | 293 | 2,601 | |||||||||||||||
| Cash flow from operations and asset sales (non-GAAP) | 18,954 | 27,107 | 20,902 | 15,081 | 19,725 | |||||||||||||||
| Changes in operational working capital | 200 | (1,667) | 2,747 | (1,086) | (1,930) | |||||||||||||||
|
Cash flow from operations and asset sales
excluding working capital (non-GAAP)
|
19,154 | 25,440 | 23,649 | 13,995 | 17,795 | |||||||||||||||
| Common Shares Outstanding, millions | 4Q22 | 3Q22 | 2Q22 | 1Q22 | 4Q21 | |||||||||||||||
| At quarter end | 4,082 | 4,118 | 4,168 | 4,213 | 4,239 | |||||||||||||||
| Average - assuming dilution | 4,138 | 4,185 | 4,233 | 4,266 | 4,275 | |||||||||||||||
|
. | ||||||||||||||||
4Q22 INVESTOR RELATIONS DATA SUMMARY (PAGE 2 of 4) | ||||||||||||||||||||
| Upstream Volumes | 4Q22 | 3Q22 | 2Q22 | 1Q22 | 4Q21 | |||||||||||||||
| Liquids production (kbd) ¹ | ||||||||||||||||||||
| United States | 789 | 783 | 777 | 753 | 770 | |||||||||||||||
| Canada/Other Americas | 682 | 641 | 556 | 474 | 571 | |||||||||||||||
| Europe | 4 | 4 | 4 | 4 | 17 | |||||||||||||||
| Africa | 223 | 249 | 224 | 257 | 235 | |||||||||||||||
| Asia | 725 | 666 | 691 | 738 | 752 | |||||||||||||||
| Australia/Oceania | 38 | 46 | 46 | 40 | 40 | |||||||||||||||
| Worldwide liquids production | 2,461 | 2,389 | 2,298 | 2,266 | 2,385 | |||||||||||||||
| ¹ Net production of crude oil, natural gas liquids, bitumen and synthetic oil, kbd | ||||||||||||||||||||
| Natural gas production available for sale (mcfd) | ||||||||||||||||||||
| United States | 2,383 | 2,351 | 2,699 | 2,777 | 2,713 | |||||||||||||||
| Canada/Other Americas | 74 | 158 | 180 | 182 | 189 | |||||||||||||||
| Europe | 536 | 541 | 825 | 770 | 844 | |||||||||||||||
| Africa | 89 | 70 | 67 | 58 | 48 | |||||||||||||||
| Asia | 3,704 | 3,304 | 3,320 | 3,340 | 3,468 | |||||||||||||||
| Australia/Oceania | 1,381 | 1,539 | 1,515 | 1,325 | 1,322 | |||||||||||||||
| Worldwide natural gas production available for sale | 8,167 | 7,963 | 8,606 | 8,452 | 8,584 | |||||||||||||||
Oil-equivalent production, koebd ² |
3,822 | 3,716 | 3,732 | 3,675 | 3,816 | |||||||||||||||
| ² Natural gas is converted to an oil-equivalent basis at six million cubic feet per one thousand barrels. | ||||||||||||||||||||
| Manufacturing Throughput and Sales | 4Q22 | 3Q22 | 2Q22 | 1Q22 | 4Q21 | |||||||||||||||
| Refinery throughput, kbd | ||||||||||||||||||||
| United States | 1,694 | 1,742 | 1,686 | 1,685 | 1,740 | |||||||||||||||
| Canada | 433 | 426 | 413 | 399 | 416 | |||||||||||||||
| Europe | 1,157 | 1,253 | 1,164 | 1,193 | 1,246 | |||||||||||||||
| Asia Pacific | 532 | 557 | 532 | 537 | 546 | |||||||||||||||
| Other | 167 | 187 | 193 | 169 | 170 | |||||||||||||||
| Worldwide refinery throughput | 3,983 | 4,165 | 3,988 | 3,983 | 4,118 | |||||||||||||||
| Energy Products sales, kbd | ||||||||||||||||||||
| United States | 2,507 | 2,479 | 2,452 | 2,262 | 2,396 | |||||||||||||||
| Non-U.S. | 2,916 | 3,058 | 2,858 | 2,849 | 2,976 | |||||||||||||||
| Worldwide Energy Products sales | 5,423 | 5,537 | 5,310 | 5,111 | 5,373 | |||||||||||||||
| Gasolines, naphthas | 2,270 | 2,335 | 2,208 | 2,114 | 2,325 | |||||||||||||||
| Heating oils, kerosene, diesel | 1,798 | 1,818 | 1,755 | 1,722 | 1,804 | |||||||||||||||
| Aviation fuels | 349 | 365 | 350 | 289 | 267 | |||||||||||||||
| Heavy fuels | 210 | 252 | 228 | 249 | 265 | |||||||||||||||
| Other energy products | 796 | 767 | 769 | 737 | 712 | |||||||||||||||
| Worldwide Energy Products sales | 5,423 | 5,537 | 5,310 | 5,111 | 5,373 | |||||||||||||||
| Chemical Products sales, kt | ||||||||||||||||||||
| United States | 1,583 | 1,658 | 1,998 | 2,032 | 1,807 | |||||||||||||||
| Non-U.S. | 3,076 | 3,023 | 2,812 | 2,986 | 3,026 | |||||||||||||||
| Worldwide Chemical Products sales | 4,658 | 4,680 | 4,811 | 5,018 | 4,833 | |||||||||||||||
| Specialty Products sales, kt | ||||||||||||||||||||
| United States | 455 | 483 | 590 | 522 | 467 | |||||||||||||||
| Non-U.S. | 1,332 | 1,434 | 1,511 | 1,484 | 1,368 | |||||||||||||||
| Worldwide Specialty Products sales | 1,787 | 1,917 | 2,100 | 2,006 | 1,835 | |||||||||||||||
|
. | ||||||||||||||||
4Q22 INVESTOR RELATIONS DATA SUMMARY (PAGE 3 of 4) |
|||||||||||
| Earnings Factor Analysis, $M | 4Q22 vs. 4Q21 |
4Q22 vs. 3Q22 |
2022 vs. 2021 |
||||||||
| Upstream | |||||||||||
| Prior Period | 6,085 | 12,419 | 15,775 | ||||||||
| Realization | 3,040 | (2,300) | 24,090 | ||||||||
| Volume / Mix | 210 | 30 | (110) | ||||||||
| Expenses | (230) | (210) | (790) | ||||||||
| Identified Items | (20) | (1,140) | (2,400) | ||||||||
| Other | (880) | (600) | (90) | ||||||||
| Current Period | 8,201 | 8,201 | 36,479 | ||||||||
| Energy Products | |||||||||||
| Prior Period | 901 | 5,819 | (347) | ||||||||
| Margin | 3,440 | (1,130) | 14,360 | ||||||||
| Volume / Mix | 10 | (260) | 1,060 | ||||||||
| Expenses | (160) | (80) | (420) | ||||||||
| Identified Items | (680) | (680) | (680) | ||||||||
| Other | 560 | 400 | 990 | ||||||||
| Current Period | 4,070 | 4,070 | 14,966 | ||||||||
| Chemical Products | |||||||||||
| Prior Period | 1,371 | 812 | 6,989 | ||||||||
| Margin | (990) | (360) | (3,030) | ||||||||
| Volume / Mix | (170) | (50) | (170) | ||||||||
| Expenses | — | (130) | (150) | ||||||||
| Other | 40 | (20) | (100) | ||||||||
| Current Period | 250 | 250 | 3,543 | ||||||||
| Specialty Products | |||||||||||
| Prior Period | 1,116 | 762 | 3,259 | ||||||||
| Margin | 310 | 200 | (220) | ||||||||
| Volume / Mix | (70) | (120) | 20 | ||||||||
| Expenses | (30) | (70) | (60) | ||||||||
| Identified Items | (670) | (40) | (670) | ||||||||
| Other | 100 | 30 | 90 | ||||||||
| Current Period | 760 | 760 | 2,415 | ||||||||
| Upstream Volume Factor Analysis, koebd | 4Q22 vs. 4Q21 |
4Q22 vs. 3Q22 |
2022 vs. 2021 |
||||||||
| Prior Period | 3,816 | 3,716 | 3,712 | ||||||||
| Entitlements - Net Interest | (94) | (6) | (44) | ||||||||
| Entitlements - Price / Spend / Other | 16 | 108 | (34) | ||||||||
| Government Mandates | 35 | (6) | 80 | ||||||||
| Divestments | (117) | (41) | (71) | ||||||||
| Growth / Other | 166 | 51 | 94 | ||||||||
| Current Period | 3,822 | 3,822 | 3,737 | ||||||||
|
. | ||||||||||||||||
4Q22 INVESTOR RELATIONS DATA SUMMARY (PAGE 4 of 4) | |||||||||||||||||
| Average Realization Data | 4Q22 | 3Q22 | 2Q22 | 1Q22 | 4Q21 | ||||||||||||
| United States | |||||||||||||||||
| ExxonMobil | |||||||||||||||||
| Crude ($/b) | 82.14 | 91.69 | 107.78 | 93.51 | 73.62 | ||||||||||||
| Natural Gas ($/kcf) | 6.62 | 8.38 | 6.49 | 4.80 | 4.96 | ||||||||||||
| Benchmarks | |||||||||||||||||
| WTI ($/b) | 82.85 | 91.76 | 108.66 | 94.49 | 77.34 | ||||||||||||
| ANS-WC ($/b) | 87.96 | 98.82 | 112.11 | 95.43 | 79.75 | ||||||||||||
| Henry Hub ($/mbtu) | 6.26 | 8.20 | 7.17 | 4.96 | 5.84 | ||||||||||||
| Non-U.S. | |||||||||||||||||
| ExxonMobil | |||||||||||||||||
| Crude ($/b) | 75.78 | 91.42 | 103.15 | 89.71 | 69.97 | ||||||||||||
| Natural Gas ($/kcf) | 21.11 | 22.92 | 19.68 | 16.42 | 14.32 | ||||||||||||
| European NG ($/kcf) | 35.52 | 37.24 | 27.90 | 24.10 | 18.95 | ||||||||||||
| Benchmarks | |||||||||||||||||
| Brent ($/b) | 88.71 | 100.85 | 113.78 | 101.41 | 79.73 | ||||||||||||
The above numbers reflect ExxonMobil’s current estimate of volumes and realizations given data available as of the end of the fourth quarter of 2022. Volumes and realizations may be adjusted when full statements on joint venture operations are received from outside operators. ExxonMobil management assumes no duty to update these estimates. | ||
| Sources and Uses of Funds, $M | 4Q22 | 2022 | |||||||||||||||
| Beginning Cash | 30,464 | 6,802 | |||||||||||||||
| Earnings | 12,750 | 55,740 | |||||||||||||||
| Depreciation | 5,064 | 24,040 | |||||||||||||||
| Working Capital / Other | (193) | (2,983) | |||||||||||||||
| Proceeds Associated with Asset Sales | 1,333 | 5,247 | |||||||||||||||
| PP&E Adds / Investments and Advances ¹ | (6,688) | (19,989) | |||||||||||||||
| Shareholder Distributions | (8,158) | (29,801) | |||||||||||||||
| Debt / Other Financing | (4,907) | (9,391) | |||||||||||||||
| Ending Cash | 29,665 | 29,665 | |||||||||||||||
|
¹ For the fourth-quarter PP&E Adds / Investments and Advances includes PP&E adds of ($5.8B) and net advances of ($0.9B)
For the full-year, PP&E Adds / Investments and Advances includes PP&E adds of ($18.4B) and net advances of ($1.6B)
|
|||||||||||||||||
| Throughout this press release, both Exhibit 99.1 as well as Exhibit 99.2, due to rounding, numbers presented may not add up precisely to the totals indicated. | ||