株探米国株
日本語 英語
エドガーで原本を確認する
0000029989false00000299892024-04-162024-04-160000029989omc:CommonStock0.15ParValueMember2024-04-162024-04-160000029989omc:A0.800SeniorNotesDue2027Member2024-04-162024-04-160000029989omc:A1.400SeniorNotesDue2031Member2024-04-162024-04-160000029989omc:A3.700SeniorNotesDue2032Member2024-04-162024-04-160000029989omc:A2.250SeniorNotesDue2033Member2024-04-162024-04-16

UNITED STATES
SECURITIES AND EXCHANGE COMMISSION
WASHINGTON, DC 20549
FORM 8-K
CURRENT REPORT
PURSUANT TO SECTION 13 OR 15(d) OF THE
SECURITIES EXCHANGE ACT OF 1934
Date of Report (Date of earliest event reported): April 16, 2024

OMNICOM GROUP INC.
(Exact Name of Registrant as Specified in its Charter)

New York
1-10551
13-1514814
(State or other jurisdiction
of incorporation)
(Commission
File Number)
(IRS Employer
Identification No.)

280 Park Avenue, New York, NY
10017
(Address of principal executive offices) (Zip Code)
Registrant’s telephone number, including area code: (212) 415-3600
Not Applicable
(Former name or former address, if changed since last report)
Check the appropriate box below if the Form 8-K filing is intended to simultaneously satisfy the filing obligation of the registrant under any of the following provisions (see General Instruction A.2. below):
☐    Written communications pursuant to Rule 425 under the Securities Act (17 CFR 230.425)
☐    Soliciting material pursuant to Rule 14a-12 under the Exchange Act (17 CFR 240.14a-12)
☐    Pre-commencement communications pursuant to Rule 14d-2(b) under the Exchange Act (17 CFR 240.14d-2(b))
☐    Pre-commencement communications pursuant to Rule 13e-4(c) under the Exchange Act (17 CFR 240.13e-4(c))
Securities registered pursuant to Section 12(b) of the Act:
Title of each class Trading Symbol Name of each exchange on which registered
Common Stock, par value $0.15 per share OMC New York Stock Exchange
0.800% Senior Notes due 2027 OMC/27 New York Stock Exchange
1.400% Senior Notes due 2031 OMC/31 New York Stock Exchange
3.700% Senior Notes due 2032 OMC/32 New York Stock Exchange
2.250% Senior Notes due 2033 OMC/33 New York Stock Exchange
Indicate by check mark whether the registrant is an emerging growth company as defined in Rule 405 of the Securities Act of 1933 (§230.405 of this chapter) or Rule 12b-2 of the Securities Exchange Act of 1934 (§240.12b-2 of this chapter).
Emerging growth company ☐
If an emerging growth company, indicate by check mark if the registrant has elected not to use the extended transition period for complying with any new or revised financial accounting standards provided pursuant to Section 13(a) of the Exchange Act. ☐


Item 2.02. Results of Operations and Financial Condition.
On April 16, 2024, Omnicom Group Inc. (“Omnicom” or the “Company”) published an earnings release reporting its financial results for the three months ended March 31, 2024. A copy of the earnings release is furnished as Exhibit 99.1 to this report and is incorporated by reference herein in its entirety.
Item 7.01. Regulation FD Disclosure.
On April 16, 2024, Omnicom hosted an earnings call and posted on its website a related investor presentation in connection with publishing its financial results for the three months ended March 31, 2024. A copy of the presentation is furnished as Exhibit 99.2 and is incorporated by reference herein in its entirety.
The information under Items 2.02 and 7.01 above (including Exhibits 99.1 and 99.2 hereto) is being furnished and shall not be deemed “filed” for purposes of Section 18 of the Securities Exchange Act of 1934, as amended, or otherwise subject to the liabilities of that section, nor shall it be deemed incorporated by reference in any filing under the Securities Act of 1933, as amended, except as expressly set forth by specific reference in such filing. Additionally, the submission of the information set forth in this Item 7.01 is not deemed an admission as to the materiality of any information that is required to be disclosed solely by Regulation FD.
Forward-Looking Statements.
Certain statements in the exhibits to this Current Report on Form 8-K contain forward-looking statements, including statements within the meaning of the Private Securities Litigation Reform Act of 1995. In addition, from time to time, the Company or its representatives have made, or may make, forward-looking statements, orally or in writing. These statements may discuss goals, intentions and expectations as to future plans, trends, events, results of operations or financial position, or otherwise, based on current beliefs of the Company’s management as well as assumptions made by, and information currently available to, the Company’s management. Forward-looking statements may be accompanied by words such as “aim,” “anticipate,” “believe,” “plan,” “could,” “should,” “would,” “estimate,” “expect,” “forecast,” “future,” “guidance,” “intend,” “may,” “will,” “possible,” “potential,” “predict,” “project” or similar words, phrases or expressions. These forward-looking statements are subject to various risks and uncertainties, many of which are outside the Company’s control. Therefore, you should not place undue reliance on such statements. Factors that could cause actual results to differ materially from those in the forward-looking statements include: adverse economic conditions, including those caused by geopolitical events, international hostilities, acts of terrorism, public health crises, high and sustained inflation in countries that comprise our major markets, high interest rates, and labor and supply chain issues affecting the distribution of our clients’ products; international, national, or local economic conditions that could adversely affect the Company or its clients; losses on media purchases and production costs incurred on behalf of clients; reductions in client spending, a slowdown in client payments, and a deterioration or disruption in the credit markets; the ability to attract new clients and retain existing clients in the manner anticipated; changes in client advertising, marketing, and corporate communications requirements; failure to manage potential conflicts of interest between or among clients; unanticipated changes related to competitive factors in the advertising, marketing, and corporate communications industries; unanticipated changes to, or the ability to hire and retain key personnel; currency exchange rate fluctuations; reliance on information technology systems and risks related to cybersecurity incidents; effective management of the risks, challenges and efficiencies presented by utilizing Artificial Intelligence (AI) technologies and related partnerships in our business; changes in legislation or governmental regulations affecting the Company or its clients; risks associated with assumptions the Company makes in connection with its acquisitions, critical accounting estimates and legal proceedings; the Company’s international operations, which are subject to the risks of currency repatriation restrictions, social or political conditions, and an evolving regulatory environment in high-growth markets and developing countries; and risks related to our environmental, social, and governance goals and initiatives, including impacts from regulators and other stakeholders, and the impact of factors outside of our control on such goals and initiatives. The foregoing list of factors is not exhaustive. You should carefully consider the foregoing factors and the other risks and uncertainties that may affect the Company’s business, including those described in Item 1A, “Risk Factors” and Item 7, “Management’s Discussion and Analysis of Financial Condition and Results of Operations” in our Annual Report on Form 10-K for the year ended December 31, 2023 and in other documents filed from time to time with the Securities and Exchange Commission. Except as required under applicable law, the Company does not assume any obligation to update these forward-looking statements.


Item 9.01. Financial Statements and Exhibits.
(d) Exhibits.

Exhibit Number Description
99.1
99.2
104 The cover page from this Current Report on Form 8-K, formatted in Inline XBRL


SIGNATURES
Pursuant to the requirements of the Securities Exchange Act of 1934, the registrant has duly caused this report to be signed on its behalf by the undersigned hereunto duly authorized.

Omnicom Group Inc.
 
By: /s/ Andrew L. Castellaneta
Name: Andrew L. Castellaneta
Title:
Senior Vice President,
Chief Accounting Officer
Date: April 16, 2024

EX-99.1 2 a2024q1earningsrelease.htm EX-99.1 Document

omnicomlogobluetransparenta.jpg

OMNICOM REPORTS FIRST QUARTER 2024 RESULTS

Revenue of $3.6 billion, with organic growth of 4.0%
Diluted earnings per share of $1.59; $1.67 Non-GAAP adjusted
Operating income of $478.9 million and 13.2% margin
EBITA of $500.4 million and 13.8% margin

NEW YORK, April 16, 2024 - Omnicom (NYSE: OMC) today announced results for the quarter ended March 31, 2024.

"Omnicom began the year with solid organic revenue growth of 4.0%, led by continued strength in our advertising & media and precision marketing disciplines, including Flywheel Digital," said John Wren, Chairman and Chief Executive Officer of Omnicom. "We are uniquely able to combine marketing and sales solutions with a seamless set of information signals to turn our award-winning creativity into measurable dynamic business outcomes for our clients. Our industry-leading tools and platforms, combined with the strength of our operating leadership, has led to our excellent new business performance and, when combined with the new opportunities we are pursuing, give us great confidence in the future."

First Quarter 2024 Results
Three Months Ended March 31,
$ in millions, except per share amounts 2024 2023
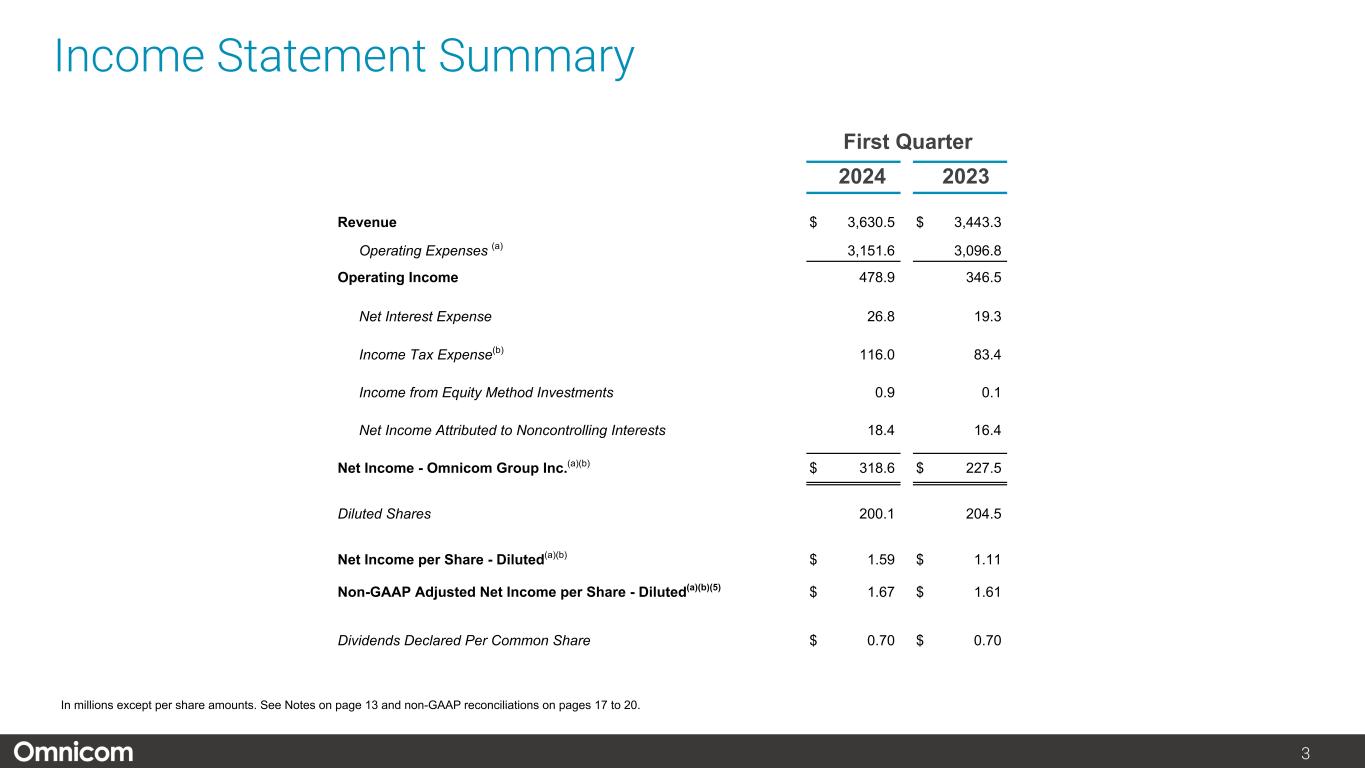
Revenue $ 3,630.5  $ 3,443.3 
Operating Income 478.9  346.5 
Operating Income Margin 13.2  % 10.1  %
Net Income1
318.6  227.5 
Net Income per Share - Diluted1
$ 1.59  $ 1.11 
Non-GAAP Measures2:
EBITA3
500.4  361.3 
EBITA Margin3
13.8  % 10.5  %
Adjusted EBITA4
480.5 
Adjusted EBITA Margin4
14.0  %
After-tax amortization per diluted share5
$ 0.08  $ 0.05 
Non-GAAP Adjusted Net Income per Share - Diluted3,4,5
$ 1.67  $ 1.61 
Notes: 1) Net Income and Net Income per Share for Omnicom Group Inc. 2) See non-GAAP reconciliations starting on page 8. 3) Beginning with the three months ended March 31, 2024, EBITA is defined as operating income before amortization of acquired intangible assets and internally developed strategic platform assets. As a result, we reclassified the prior year to be consistent with the revised definition, which reduced EBITA from previously reported amounts. 4) For the three months ended March 31, 2023, operating expenses include $119.2 million ($91.0 million after-tax, $0.45 per diluted share) related to real estate repositioning costs. 5) Beginning with the three months ended March 31, 2024, Adjusted Net Income per Share - Diluted excludes after-tax amortization of acquired intangible assets and internally developed strategic platform assets.


280 Park Avenue, New York, NY 10017. Tel (212) 415-3672


Revenue
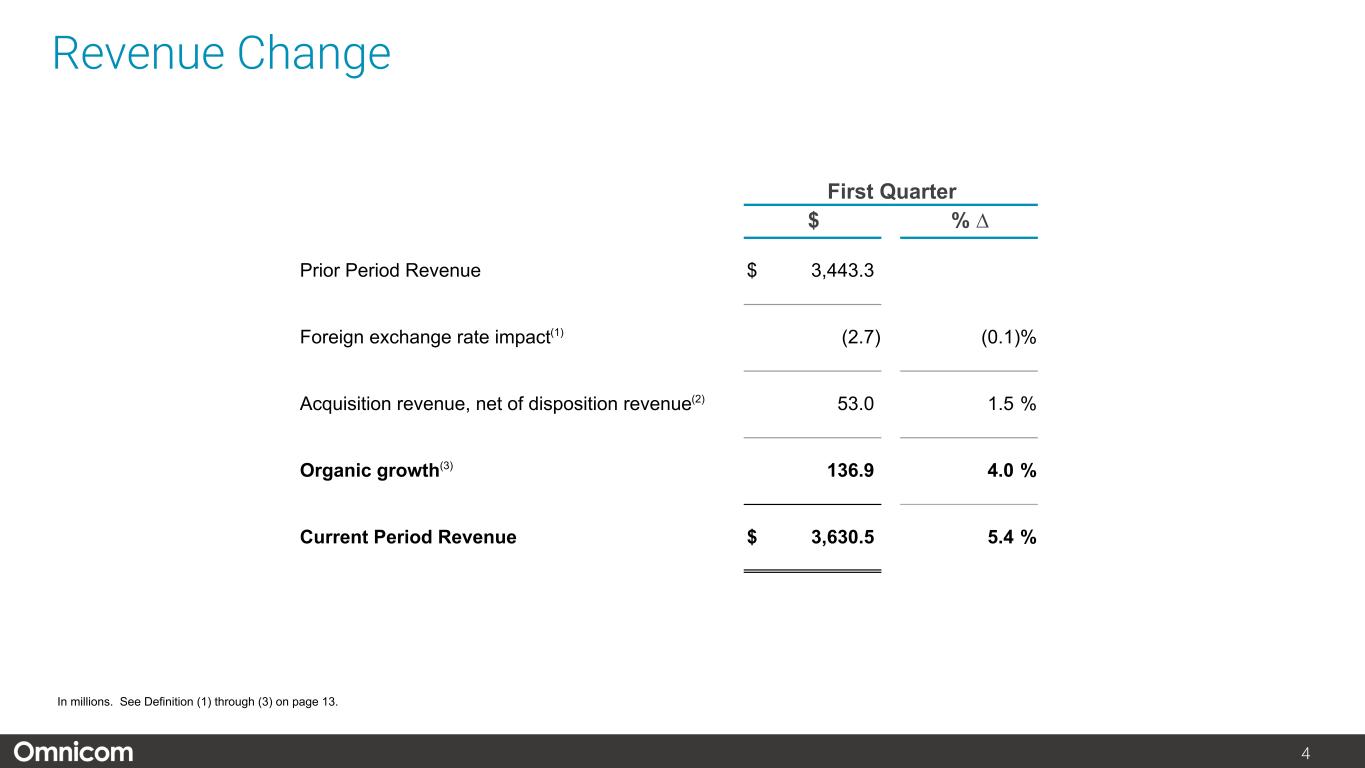
Reported revenue in the first quarter of 2024 increased $187.2 million, or 5.4%, to $3,630.5 million. Worldwide revenue growth in the first quarter of 2024 compared to the first quarter of 2023 was led by an increase in organic growth of $136.9 million, or 4.0%. Acquisition revenue, net of disposition revenue, increased revenue by $53.0 million, or 1.5%, primarily due to the Flywheel Digital acquisition in the Precision Marketing discipline. The impact of foreign currency translation reduced revenue by $2.7 million, or 0.1%.

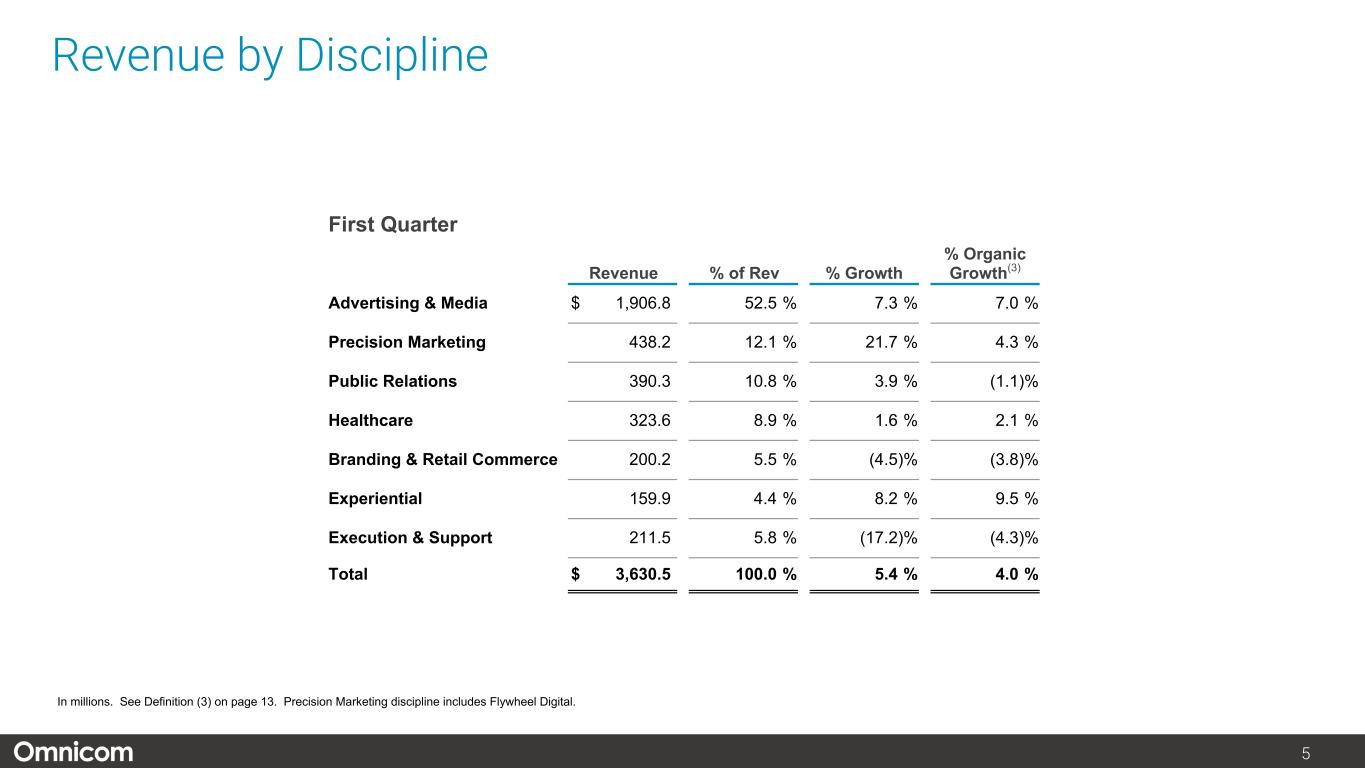
Organic growth by discipline in the first quarter of 2024 compared to the first quarter of 2023 was as follows: 7.0% for Advertising & Media, 4.3% for Precision Marketing, 9.5% for Experiential, and 2.1% for Healthcare, partially offset by declines of 4.3% for Execution & Support, 3.8% for Branding & Retail Commerce, and 1.1% for Public Relations.

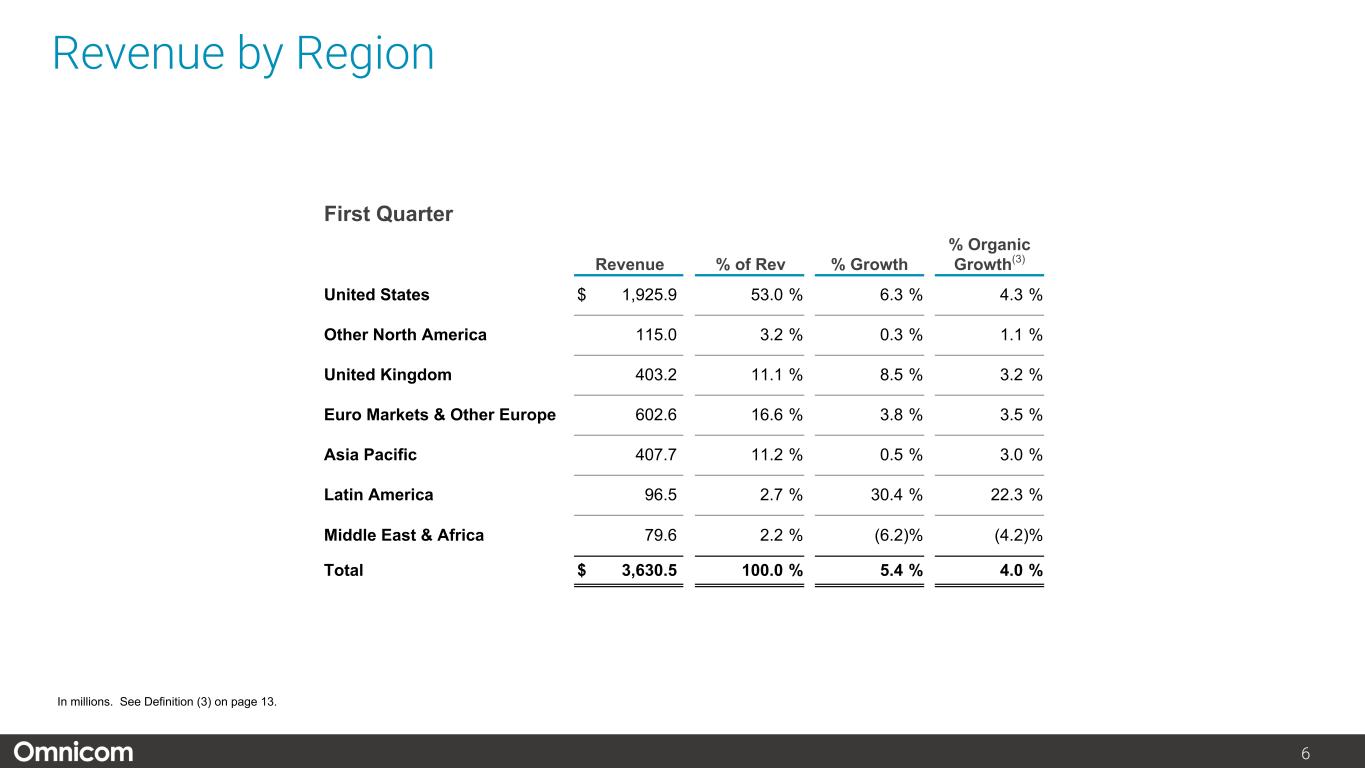
Organic growth by region in the first quarter of 2024 compared to the first quarter of 2023 was as follows: 4.3% for the United States, 3.5% for Euro Markets & Other Europe, 22.3% for Latin America, 3.0% for Asia Pacific, 3.2% for the United Kingdom, and 1.1% for Other North America, partially offset by a decline of 4.2% for the Middle East & Africa.

Expenses
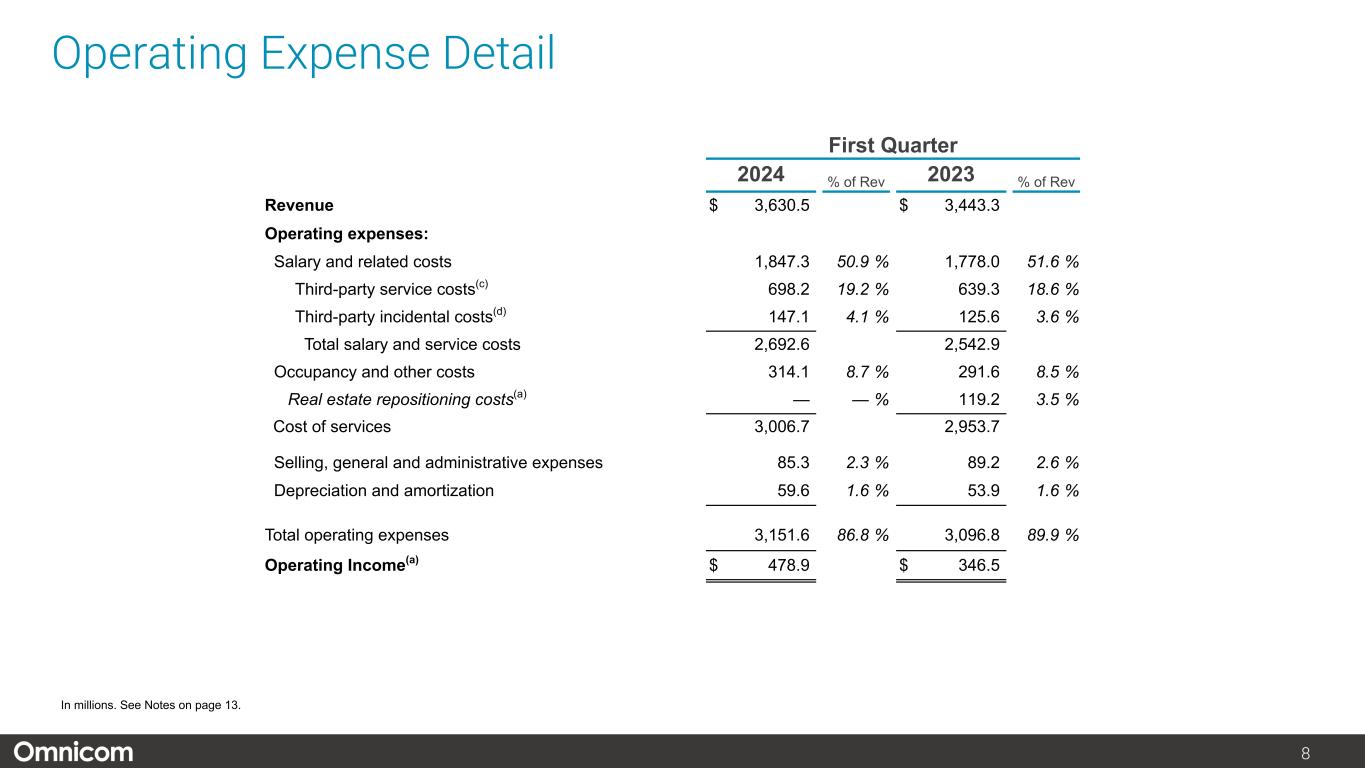
Operating expenses increased $54.8 million, or 1.8%, to $3,151.6 million in the first quarter of 2024 compared to the first quarter of 2023.

Salary and service costs increased $149.7 million, or 5.9%, to $2,692.6 million. These costs tend to fluctuate with changes in revenue and are comprised of salary and related costs, which include employee compensation and benefits costs, freelance labor, third-party service costs, and third-party incidental costs. Salary and related costs increased $69.3 million, or 3.9%, to $1,847.3 million, primarily due to an increase in headcount primarily as a result of our acquisition of Flywheel Digital. Third-party service costs include third-party supplier costs when we act as principal in providing services to our clients. Third-party incidental costs that are required to be included in revenue primarily consist of client-related travel and incidental out-of-pocket costs, which are billed back to the client directly at our cost. Third-party service costs increased $58.9 million, or 9.2%, to $698.2 million, and third-party incidental costs increased $21.5 million, or 17.1%, to $147.1 million, both primarily as a result of organic growth.

Occupancy and other costs, which are less directly linked to changes in revenue than salary and service costs, increased $22.5 million, or 7.7%, to $314.1 million. The increase is primarily related to our acquisition activity in the period. Increased occupancy costs were partially offset by lower rent expense.

SG&A expenses decreased $3.9 million, or 4.4%, to $85.3 million, primarily due to a decrease in administrative costs.

Operating Income
Operating income increased $132.4 million, or 38.2%, to $478.9 million in the first quarter of 2024 compared to the first quarter of 2023, and the related margin increased to 13.2% from 10.1%. In the three months ended March 31, 2023, the effect of real estate repositioning costs reduced operating income by $119.2 million and decreased operating margin by 3.4%.

Interest Expense, net
Interest expense was flat, offset by a decrease in interest income of $8.6 million due primarily to lower average cash and short-term investment balances.


Page 2


Income Taxes
Our effective tax rate for the three months ended March 31, 2024 increased period-over-period to 25.7% from 25.5%. The effective tax rate for 2024 includes the favorable impact from the resolution of certain tax positions of $7.5 million. The effective tax rate for the three months ended March 31, 2023 includes the favorable impact of approximately $10.0 million of previously unrecognized tax benefits, partially offset by approximately $6.0 million related to a lower tax benefit in certain jurisdictions for the real estate repositioning costs in the quarter, and an increase in the U.K. statutory tax rate.

Net Income – Omnicom Group Inc. and Diluted Net Income per Share
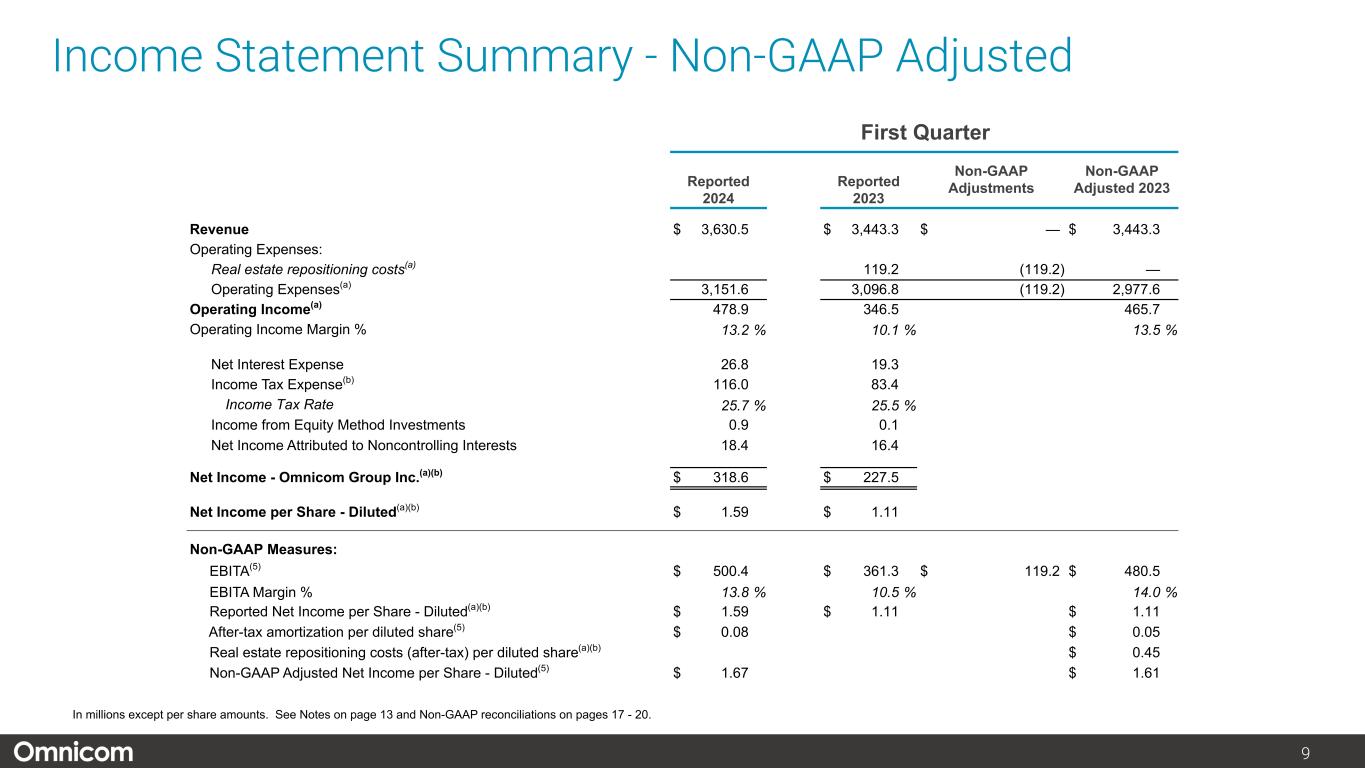
Net income - Omnicom Group Inc. for the first quarter of 2024 increased $91.1 million, or 40.0%, to $318.6 million compared to the first quarter of 2023. Diluted shares outstanding for the first quarter of 2024 decreased 2.2% to 200.1 million from 204.5 million as a result of net share repurchases. Diluted net income per share of $1.59 increased $0.48, or 43.2%, from $1.11. The first quarter 2023 included $119.2 million ($91.0 million after-tax, $0.45 per diluted share) related to real estate repositioning costs.

Beginning with the three months ended March 31, 2024, Non-GAAP Adjusted Net Income per Share - Diluted excludes the effect of after-tax amortization of acquired intangible assets and internally developed strategic platform assets. For the three months ended March 31, 2024, Non-GAAP Adjusted Net Income per Share - Diluted of $1.67 increased $0.06 or 3.7%, from Non-GAAP Adjusted Net Income per Share - Diluted of $1.61 in the first quarter of 2023. We present Non-GAAP Adjusted Net Income per Share - Diluted to allow for comparability with the prior year period.

EBITA
Adjusted EBITA increased $19.9 million, or 4.1%, to $500.4 million in the first quarter of 2024 compared to the first quarter of 2023, and the related margin decreased to 13.8% from 14.0%.

Risks and Uncertainties
Current global economic challenges, including geopolitical events, international hostilities, acts of terrorism, public health crises, high and sustained inflation in countries that comprise our major markets, high interest rates, and labor and supply chain issues could cause economic uncertainty and volatility. The impact of these issues on our business will vary by geographic market and discipline. We monitor economic conditions closely, as well as client revenue levels and other factors. In response to reductions in revenue, we can take actions to align our cost structure with changes in client demand and manage our working capital. However, there can be no assurance as to the effectiveness of our efforts to mitigate any impact of the current and future adverse economic conditions, reductions in client revenue, changes in client creditworthiness, and other developments.

Definitions - Components of Revenue Change
We use certain terms in describing the components of the change in revenue above.
Foreign exchange rate impact: calculated by translating the current period’s local currency revenue using the prior period average exchange rates to derive current period constant currency revenue. The foreign exchange rate impact is the difference between the current period revenue in U.S. Dollars and the current period constant currency revenue.
Acquisition revenue, net of disposition revenue: Acquisition revenue is calculated as if the acquisition occurred twelve months prior to the acquisition date by aggregating the comparable prior period revenue of acquisitions through the acquisition date. As a result, acquisition revenue excludes the positive or negative difference between our current period revenue subsequent to the acquisition date, and the comparable prior period revenue and the positive or negative growth after the acquisition date is attributed to organic growth.
Page 3


Disposition revenue is calculated as if the disposition occurred twelve months prior to the disposition date by aggregating the comparable prior period revenue of disposals through such date. The acquisition revenue and disposition revenue amounts are netted in the description above.
Organic growth: calculated by subtracting the foreign exchange rate impact component and the acquisition revenue, net of disposition revenue component from total revenue growth.

Conference Call
Omnicom will host a conference call to review its financial results on Tuesday, April 16, 2024, starting at 4:30 p.m. Eastern Time. A live webcast of the call, along with the related slide presentation, will be available at Omnicom’s investor relations website, investor.omnicomgroup.com, and a webcast replay will be made available after the call concludes.

Corporate Responsibility
At Omnicom, we are committed to promoting responsible practices and making positive contributions to society around the globe. Please explore our website (omnicomgroup.com/corporate-responsibility) for highlights of our progress across the areas on which we focus: Empower People, Protect Our Planet, Lead Responsibly.
About Omnicom
Omnicom (NYSE: OMC) is a leading provider of data-inspired, creative marketing and sales solutions. Omnicom’s iconic agency brands are home to the industry’s most innovative communications specialists who are focused on driving intelligent business outcomes for their clients. The company offers a wide range of services in advertising, strategic media planning and buying, precision marketing, retail and digital commerce, branding, experiential, public relations, healthcare marketing and other specialty marketing services to over 5,000 clients in more than 70 countries. For more information, visit www.omnicomgroup.com.    
Contact
Investors: Gregory Lundberg greg.lundberg@omnicomgroup.com
Media: Joanne Trout joanne.trout@omnicomgroup.com
Non-GAAP Financial Measures
We present financial measures determined in accordance with generally accepted accounting principles in the United States (“GAAP”) and adjustments to the GAAP presentation (“Non-GAAP”), which we believe are meaningful for understanding our performance. We believe these measures are useful in evaluating the impact of certain items on operating performance and allows for comparability between reporting periods. EBITA is defined as operating income before interest, taxes, and amortization of acquired intangible assets and internally developed strategic platform assets, and EBITA margin is defined as EBITA divided by revenue. We use EBITA and EBITA margin as additional operating performance measures, which exclude the non-cash amortization expense of acquired intangible assets and internally developed strategic platform assets. We also use Adjusted Operating Income, Adjusted Operating Income Margin, Adjusted EBITA, Adjusted EBITA Margin, Adjusted Income Tax Expense, Adjusted Net Income – Omnicom Group Inc. and Adjusted Net Income per diluted share – Omnicom Group Inc. as additional operating performance measures. Non-GAAP financial measures should not be considered in isolation from, or as a substitute for, financial information presented in accordance with GAAP. Non-GAAP financial measures as reported by us may not be comparable to similarly titled amounts reported by other companies.

Forward-Looking Statements Certain statements in this document contain forward-looking statements, including statements within the meaning of the Private Securities Litigation Reform Act of 1995. In addition, from time to time, the Company or its representatives have made, or may make, forward-looking statements, orally or in writing.
Page 4


These statements may discuss goals, intentions and expectations as to future plans, trends, events, results of operations or financial position, or otherwise, based on current beliefs of the Company’s management as well as assumptions made by, and information currently available to, the Company’s management. Forward-looking statements may be accompanied by words such as “aim,” “anticipate,” “believe,” “plan,” “could,” “should,” “would,” “estimate,” “expect,” “forecast,” “future,” “guidance,” “intend,” “may,” “will,” “possible,” “potential,” “predict,” “project” or similar words, phrases or expressions. These forward-looking statements are subject to various risks and uncertainties, many of which are outside the Company’s control. Therefore, you should not place undue reliance on such statements. Factors that could cause actual results to differ materially from those in the forward-looking statements include: adverse economic conditions, including those caused by geopolitical events, international hostilities, acts of terrorism, public health crises, high and sustained inflation in countries that comprise our major markets, high interest rates, and labor and supply chain issues affecting the distribution of our clients’ products; international, national, or local economic conditions that could adversely affect the Company or its clients; losses on media purchases and production costs incurred on behalf of clients; reductions in client spending, a slowdown in client payments, and a deterioration or disruption in the credit markets; the ability to attract new clients and retain existing clients in the manner anticipated; changes in client advertising, marketing, and corporate communications requirements; failure to manage potential conflicts of interest between or among clients; unanticipated changes related to competitive factors in the advertising, marketing, and corporate communications industries; unanticipated changes to, or the ability to hire and retain key personnel; currency exchange rate fluctuations; reliance on information technology systems and risks related to cybersecurity incidents; effective management of the risks, challenges and efficiencies presented by utilizing Artificial Intelligence (AI) technologies and related partnerships in our business; changes in legislation or governmental regulations affecting the Company or its clients; risks associated with assumptions the Company makes in connection with acquisitions, its critical accounting estimates and legal proceedings; the Company’s international operations, which are subject to the risks of currency repatriation restrictions, social or political conditions, and an evolving regulatory environment in high-growth markets and developing countries; and risks related to our environmental, social, and governance goals and initiatives, including impacts from regulators and other stakeholders, and the impact of factors outside of our control on such goals and initiatives. The foregoing list of factors is not exhaustive. You should carefully consider the foregoing factors and the other risks and uncertainties that may affect the Company’s business, including those described in Item 1A, “Risk Factors” and Item 7, “Management’s Discussion and Analysis of Financial Condition and Results of Operations” in our Annual Report on Form 10-K for the year ended December 31, 2023 and in other documents filed from time to time with the Securities and Exchange Commission. Except as required under applicable law, the Company does not assume any obligation to update these forward-looking statements.
Page 5


OMNICOM GROUP INC. AND SUBSIDIARIES
CONSOLIDATED STATEMENTS OF INCOME
(Unaudited)
(In millions, except per share amounts)

Three Months Ended 
March 31,
2024 2023
Revenue $ 3,630.5  $ 3,443.3 
Operating Expenses:
Salary and service costs 2,692.6  2,542.9 
Occupancy and other costs 314.1  291.6 
Real estate repositioning costs1
—  119.2 
Cost of services 3,006.7  2,953.7 
Selling, general and administrative expenses1
85.3  89.2 
Depreciation and amortization 59.6  53.9 
Total operating expenses1
3,151.6  3,096.8 
Operating Income 478.9  346.5 
Interest Expense 53.8  54.9 
Interest Income 27.0  35.6 
Income Before Income Taxes and Income From Equity Method Investments 452.1  327.2 
Income Tax Expense1
116.0  83.4 
Income From Equity Method Investments 0.9  0.1 
Net Income1
337.0  243.9 
Net Income Attributed To Noncontrolling Interests 18.4  16.4 
Net Income - Omnicom Group Inc.1
$ 318.6  $ 227.5 
Net Income Per Share - Omnicom Group Inc.:
Basic $ 1.61  $ 1.13 
Diluted1
$ 1.59  $ 1.11 
Dividends Declared Per Common Share $ 0.70  $ 0.70 
Operating income margin % 13.2  % 10.1  %
Non-GAAP Measures4:
EBITA2
$ 500.4  $ 361.3 
EBITA Margin2
13.8  % 10.5  %
EBITA - Adjusted1,2
$ 500.4  $ 480.5 
EBITA Margin %- Adjusted1,2
13.8  % 14.0  %
Non-GAAP Adjusted Net Income Per Share - Omnicom Group Inc. - Diluted1,2,3
$ 1.67  $ 1.61 


1)    For the three months ended March 31, 2023, operating expenses include $119.2 million ($91.0 million after-tax) related to real estate repositioning costs, which decreased diluted net income per share - Omnicom Group Inc. by $0.45.
2)     Beginning with the three months ended March 31, 2024, EBITA is defined as operating income before amortization of acquired intangible assets and internally developed strategic platform assets. As a result, we reclassified the prior year to be consistent with the revised definition, which reduced EBITA from previously reported amounts. We believe these measures are useful in evaluating the impact of these items on operating performance and allows for comparability between reporting periods.
3)     Beginning with the three months ended March 31, 2024, Adjusted Net Income per Share - Diluted excludes after-tax amortization of acquired intangible assets and internally developed strategic platform assets. We believe these measures are useful in evaluating the impact of these items on operating performance and allows for comparability between reporting periods.
4) See Non-GAAP reconciliation on page 8.


Page 6


OMNICOM GROUP INC. AND SUBSIDIARIES
DETAIL OF OPERATING EXPENSES
(Unaudited)
(In millions)


Three Months Ended 
March 31,
2024 2023
Revenue $ 3,630.5  $ 3,443.3 
Operating Expenses:
Salary and service costs:
Salary and related costs 1,847.3  1,778.0 
Third-party service costs1
698.2  639.3 
Third-party incidental costs2
147.1  125.6 
Total salary and service costs 2,692.6  2,542.9 
Occupancy and other costs 314.1  291.6 
Real estate repositioning costs3
—  119.2 
    Cost of services 3,006.7  2,953.7 
Selling, general and administrative expenses 85.3  89.2 
Depreciation and amortization 59.6  53.9 
Total operating expenses 3,151.6  3,096.8 
Operating Income $ 478.9  $ 346.5 

1)     Third-party service costs include third-party supplier costs when we act as principal in providing services to our clients.
2)     Third-party incidental costs primarily consist of client-related travel and incidental out-of-pocket costs which we bill back to the client directly at our cost and which we are required to include in revenue.
3)     For the three months ended March 31, 2023, operating expenses include $119.2 million ($91.0 million after-tax) related to real estate repositioning costs, which decreased diluted net income per share - Omnicom Group Inc. by $0.45.

Page 7


OMNICOM GROUP INC. AND SUBSIDIARIES
RECONCILIATION OF NON-GAAP FINANCIAL MEASURES
(Unaudited)
(In millions)
Three Months Ended 
March 31,
2024 2023
Net Income - Omnicom Group Inc. $ 318.6  $ 227.5 
Net Income Attributed To Noncontrolling Interests 18.4  16.4 
Net Income 337.0  243.9 
Income From Equity Method Investments 0.9  0.1 
Income Tax Expense 116.0  83.4 
Income Before Income Taxes and Income From Equity Method Investments 452.1  327.2 
Interest Expense 53.8  54.9 
Interest Income 27.0  35.6 
Operating Income 478.9  346.5 
Add back: amortization of acquired intangible assets and internally developed strategic platform assets1
21.5  14.8 
Earnings before interest, taxes and amortization of intangible assets (“EBITA”)1
$ 500.4  $ 361.3 
Amortization of other purchased and internally developed software 4.3  4.5 
Depreciation 33.8  34.6 
EBITDA $ 538.5  $ 400.4 
EBITA $ 500.4  $ 361.3 
Real estate repositioning costs2
—  119.2 
EBITA - Adjusted1,2,3
$ 500.4  $ 480.5 
Revenue $ 3,630.5  $ 3,443.3 
Non-GAAP Measures:
EBITA1
$ 500.4  $ 361.3 
EBITA Margin %1
13.8  % 10.5  %
EBITA - Adjusted1,2,3
$ 500.4  $ 480.5 
EBITA Margin % - Adjusted1
13.8  % 14.0  %

1)    Beginning with the three months ended March 31, 2024, EBITA is defined as operating income before amortization of acquired intangible assets and internally developed strategic platform assets. As a result, we reclassified the prior year to be consistent with the revised definition, which reduced EBITA from previously reported amounts.
2)     For the three months ended March 31, 2023, operating expenses include $119.2 million ($91.0 million after-tax) related to real estate repositioning costs, which decreased diluted net income per share - Omnicom Group Inc. by $0.45.
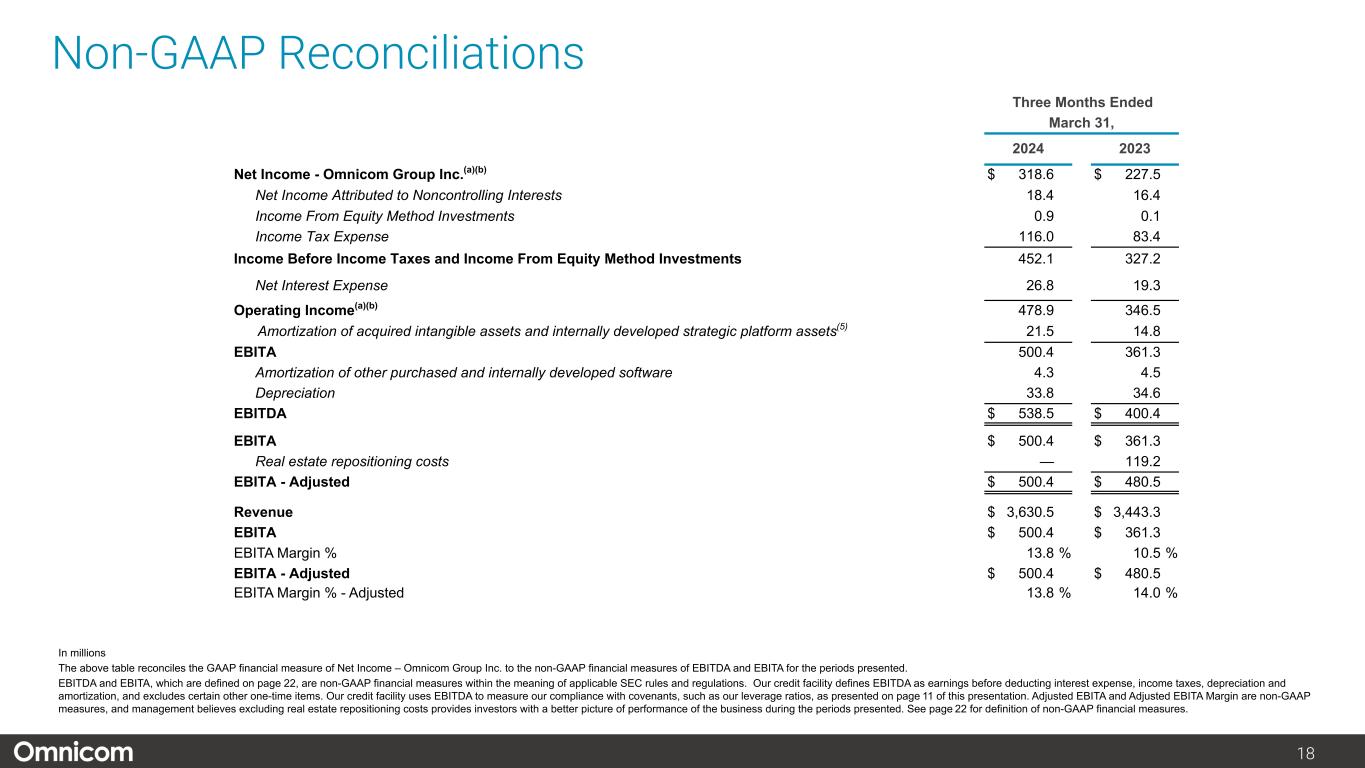
3)     The above table reconciles the U.S. GAAP financial measure of Net Income - Omnicom Group Inc. to EBITDA and EBITA. We use EBITA and EBITA margin as additional operating performance measures, which exclude the non-cash amortization expense of acquired intangible assets and internally developed strategic platform assets. The above table also presents Non-GAAP adjustments to EBITA to present EBITA - Adjusted for the periods presented. Accordingly, we believe EBITA, EBITA Margin, Adjusted EBITA, and Adjusted EBITA Margin are useful measures for investors to evaluate the comparability of the performance of our business year to year.


Page 8


OMNICOM GROUP INC. AND SUBSIDIARIES
RECONCILIATION OF NON-GAAP FINANCIAL MEASURES
(Unaudited)
(In millions)

Three Months Ended March 31,
Reported 2024 Non-GAAP Adj. Non-GAAP 2024 Adj. Reported 2023
Non-GAAP Adj. (1)
Non-GAAP 2023 Adj.
Revenue $ 3,630.5  $ —  $ 3,630.5  $ 3,443.3  $ —  $ 3,443.3 
Operating Expenses1
3,151.6  —  3,151.6  3,096.8  (119.2) 2,977.6 
Operating Income 478.9  —  478.9  346.5  119.2  465.7 
Operating Income Margin % 13.2  % 13.2  % 10.1  % 13.5  %
Add back: amortization of acquired intangible assets and internally developed strategic platform assets3
21.5  —  21.5  14.8  —  14.8 
EBITA2
$ 500.4  $ —  $ 500.4  $ 361.3  $ 119.2  $ 480.5 
EBITA Margin % 13.8  % 13.8  % 10.5  % 14.0  %

Three Months Ended March 31,
2024 2023
Net Income Net Income per Share- Diluted Net Income Net Income per Share- Diluted
Net Income - Omnicom Group Inc. - Reported $ 318.6  $ 1.59  $ 227.5  $ 1.11 
Real estate repositioning costs1
—  —  91.0  0.45 
Amortization of acquired intangible assets and internally developed strategic platform assets (after-tax)2
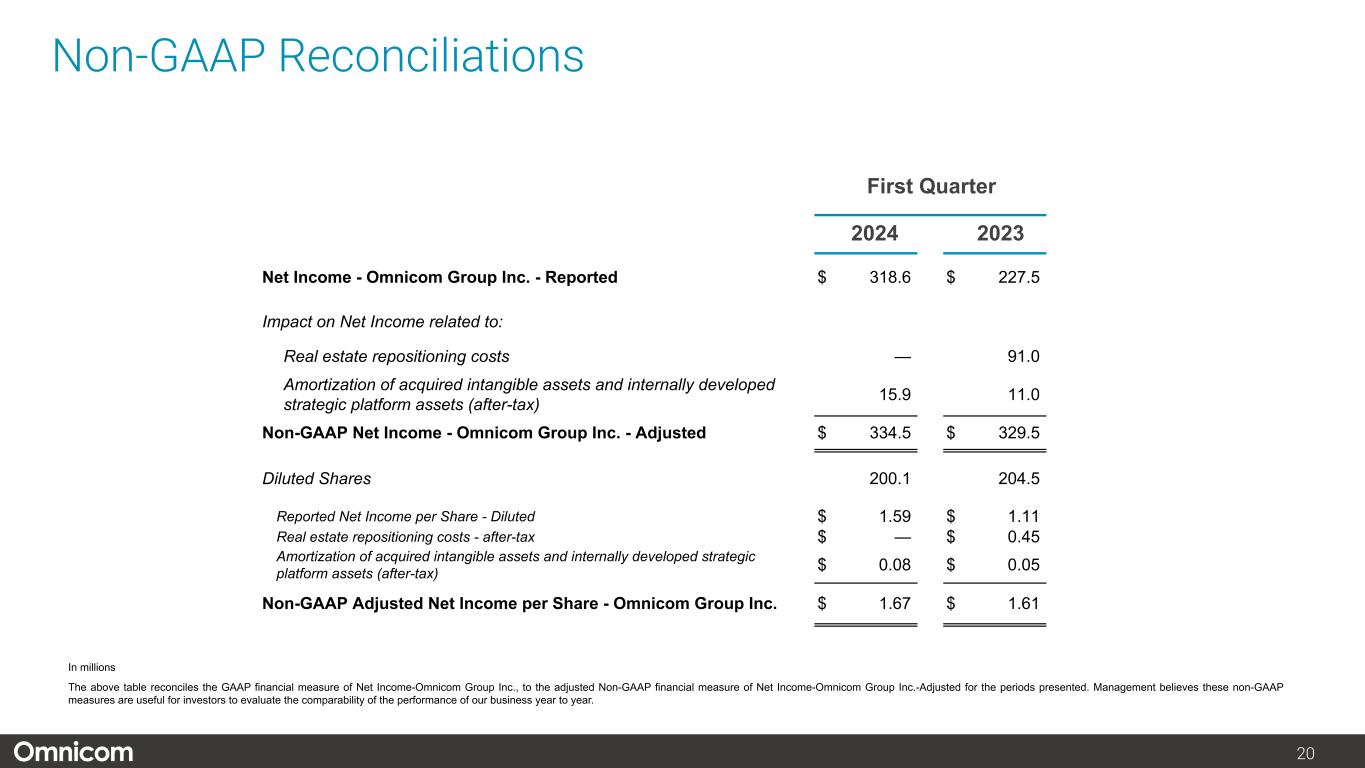
15.9  0.08  11.0  0.05 
Non-GAAP Net Income - Omnicom Group Inc. - Adjusted2,3
$ 334.5  $ 1.67  $ 329.5  $ 1.61 

1)     For the three months ended March 31, 2023, operating expenses include $119.2 million ($91.0 million after tax) related to real estate repositioning costs, which decreased diluted net income per share - Omnicom Group Inc. by $0.45.
2)    Beginning with the three months ended March 31, 2024, EBITA is defined as operating income before amortization of acquired intangible assets and internally developed strategic platform assets. As a result, we reclassified the prior year to be consistent with the revised definition, which reduced EBITA from previously reported amounts. Included in the above table are the after-tax effects of the amortization of acquired intangible assets and internally developed strategic platform assets.
3)     Diluted Shares for the three months ended March 31, 2024 and 2023 in millions were 200.1 and 204.5, respectively.

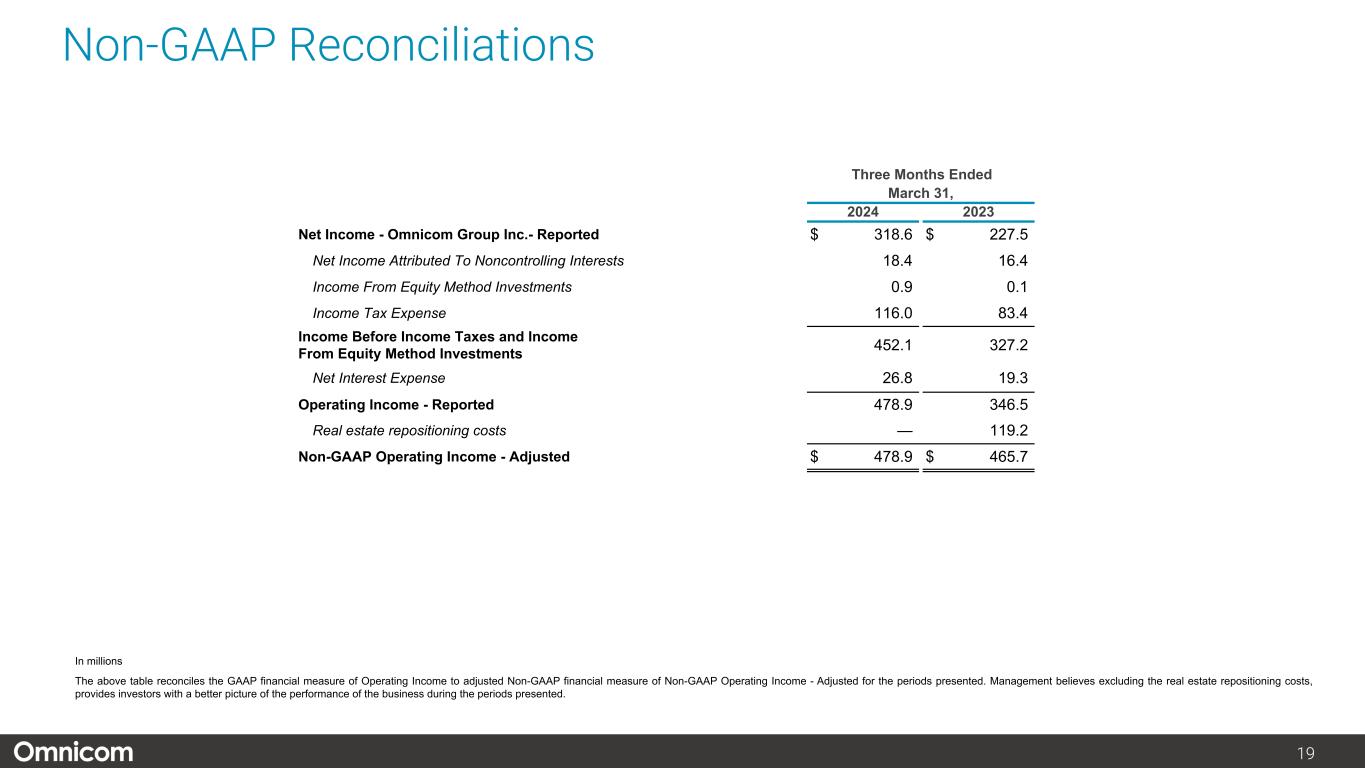
The above tables reconcile GAAP financial measures of Operating Income, Net Income - Omnicom Group Inc., and Net Income per Share - Diluted to adjusted Non-GAAP financial measures of Non-GAAP Operating Income - Adjusted, Non-GAAP Net Income-Omnicom Group Inc. - Adjusted and Non-GAAP Adjusted Net Income per Share - Diluted. Management believes these Non-GAAP measures are useful for investors to evaluate the comparability of the performance of our business year to year.
Page 9
EX-99.2 3 a2024q1investorpresentat.htm EX-99.2 a2024q1investorpresentat
2024 First Quarter April 16, 2024


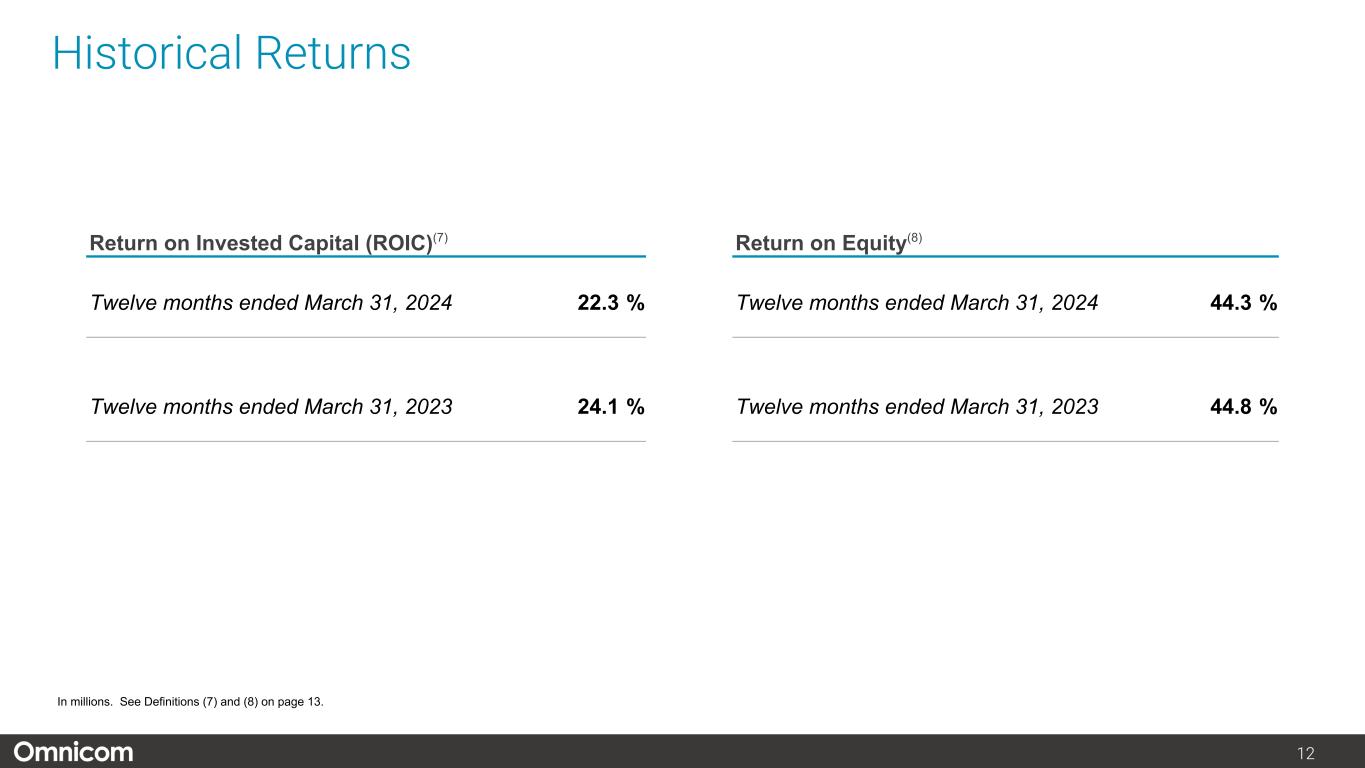
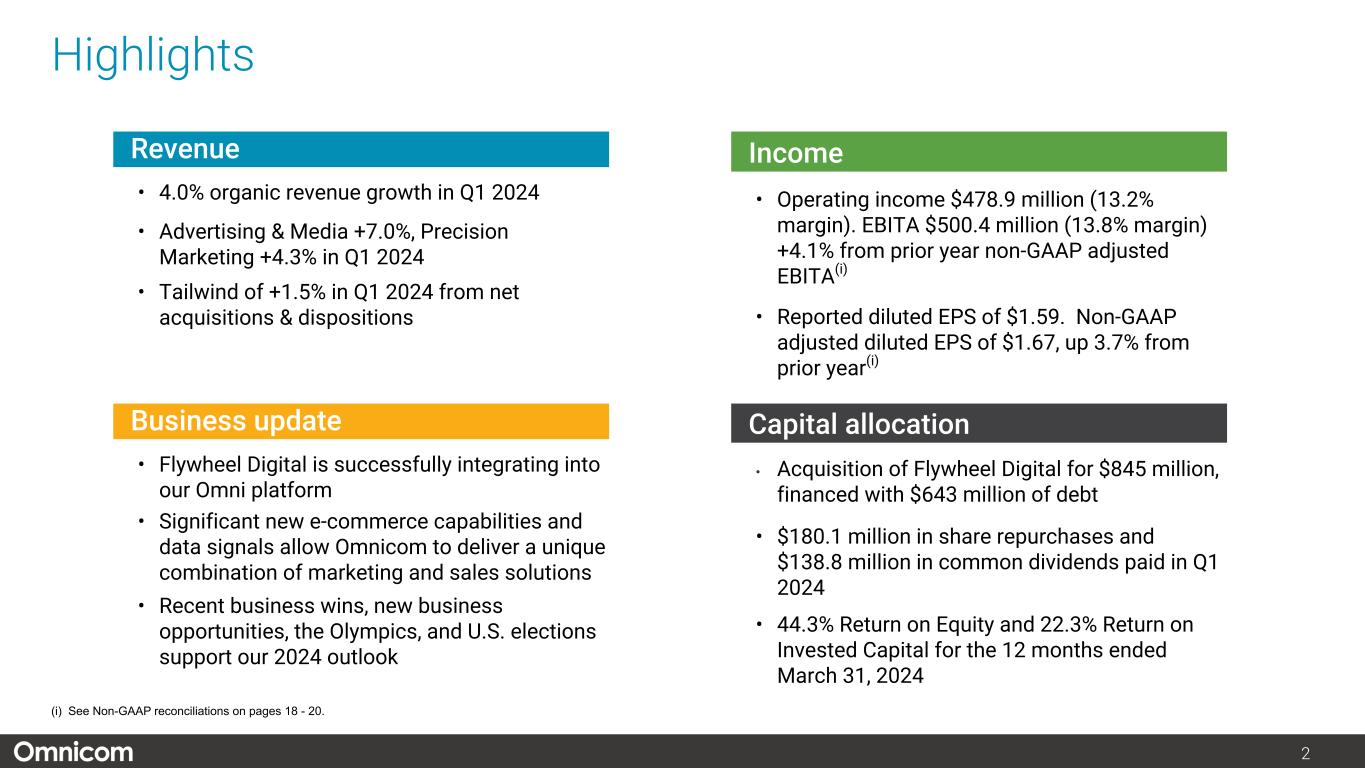
2 Highlights Revenue • 4.0% organic revenue growth in Q1 2024 • Advertising & Media +7.0%, Precision Marketing +4.3% in Q1 2024 • Tailwind of +1.5% in Q1 2024 from net acquisitions & dispositions Income • Operating income $478.9 million (13.2% margin). EBITA $500.4 million (13.8% margin) +4.1% from prior year non-GAAP adjusted EBITA(i) • Reported diluted EPS of $1.59. Non-GAAP adjusted diluted EPS of $1.67, up 3.7% from prior year(i) Business update • Flywheel Digital is successfully integrating into our Omni platform • Significant new e-commerce capabilities and data signals allow Omnicom to deliver a unique combination of marketing and sales solutions • Recent business wins, new business opportunities, the Olympics, and U.S. elections support our 2024 outlook Capital allocation • Acquisition of Flywheel Digital for $845 million, financed with $643 million of debt • $180.1 million in share repurchases and $138.8 million in common dividends paid in Q1 2024 • 44.3% Return on Equity and 22.3% Return on Invested Capital for the 12 months ended March 31, 2024 (i) See Non-GAAP reconciliations on pages 18 - 20.


3 First Quarter 2024 2023 Revenue $ 3,630.5 $ 3,443.3 Operating Expenses (a) 3,151.6 3,096.8 Operating Income 478.9 346.5 Net Interest Expense 26.8 19.3 Income Tax Expense(b) 116.0 83.4 Income from Equity Method Investments 0.9 0.1 Net Income Attributed to Noncontrolling Interests 18.4 16.4 Net Income - Omnicom Group Inc.(a)(b) $ 318.6 $ 227.5 Diluted Shares 200.1 204.5 Net Income per Share - Diluted(a)(b) $ 1.59 $ 1.11 Non-GAAP Adjusted Net Income per Share - Diluted(a)(b)(5) $ 1.67 $ 1.61 Dividends Declared Per Common Share $ 0.70 $ 0.70 Income Statement Summary In millions except per share amounts. See Notes on page 13 and non-GAAP reconciliations on pages 17 to 20.


4 Revenue Change First Quarter $ % ∆ Prior Period Revenue $ 3,443.3 Foreign exchange rate impact(1) (2.7) (0.1) % Acquisition revenue, net of disposition revenue(2) 53.0 1.5 % Organic growth(3) 136.9 4.0 % Current Period Revenue $ 3,630.5 5.4 % In millions. See Definition (1) through (3) on page 13.


5 Revenue by Discipline First Quarter Revenue % of Rev % Growth % Organic Growth(3) Advertising & Media $ 1,906.8 52.5 % 7.3 % 7.0 % Precision Marketing 438.2 12.1 % 21.7 % 4.3 % Public Relations 390.3 10.8 % 3.9 % (1.1) % Healthcare 323.6 8.9 % 1.6 % 2.1 % Branding & Retail Commerce 200.2 5.5 % (4.5) % (3.8) % Experiential 159.9 4.4 % 8.2 % 9.5 % Execution & Support 211.5 5.8 % (17.2) % (4.3) % Total $ 3,630.5 100.0 % 5.4 % 4.0 % In millions. See Definition (3) on page 13. Precision Marketing discipline includes Flywheel Digital.


6 First Quarter Revenue % of Rev % Growth % Organic Growth(3) United States $ 1,925.9 53.0 % 6.3 % 4.3 % Other North America 115.0 3.2 % 0.3 % 1.1 % United Kingdom 403.2 11.1 % 8.5 % 3.2 % Euro Markets & Other Europe 602.6 16.6 % 3.8 % 3.5 % Asia Pacific 407.7 11.2 % 0.5 % 3.0 % Latin America 96.5 2.7 % 30.4 % 22.3 % Middle East & Africa 79.6 2.2 % (6.2) % (4.2) % Total $ 3,630.5 100.0 % 5.4 % 4.0 % Revenue by Region In millions. See Definition (3) on page 13.


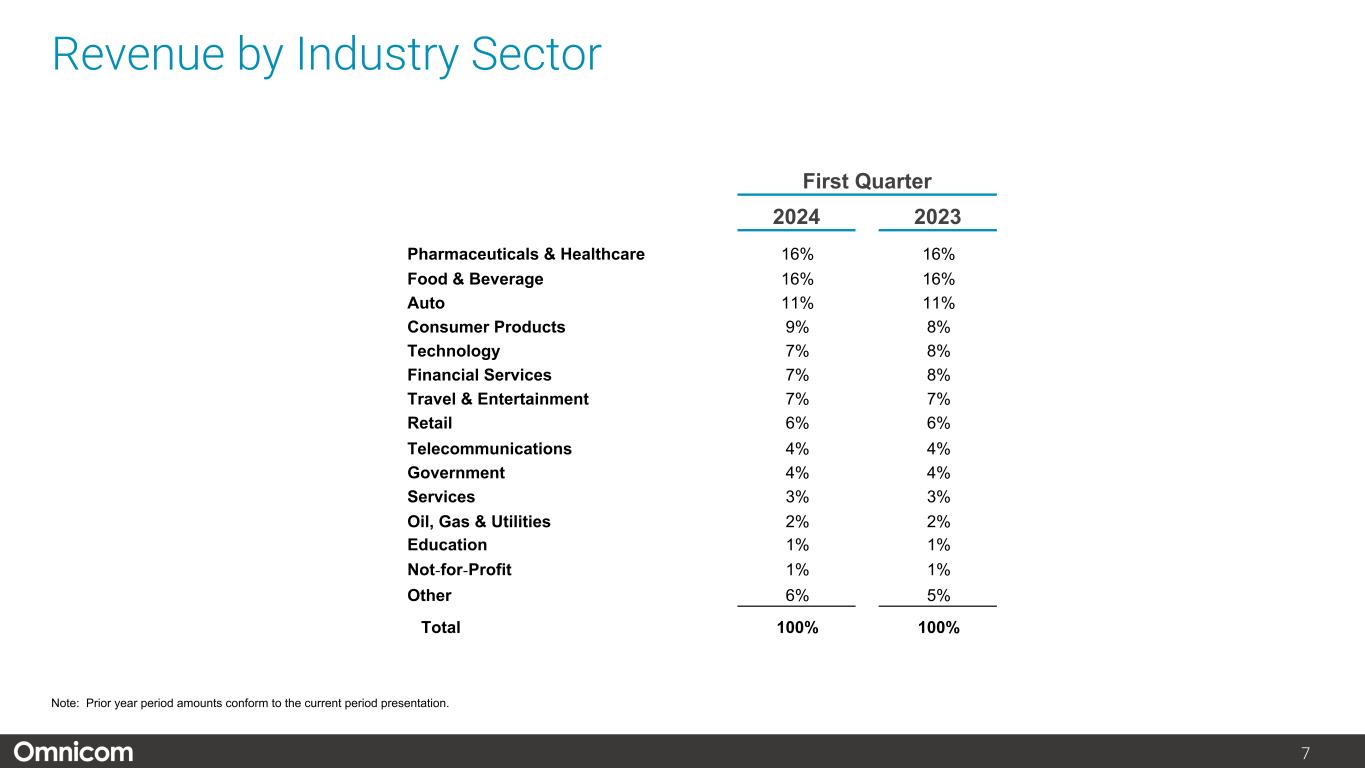
7 First Quarter 2024 2023 Pharmaceuticals & Healthcare 16% 16% Food & Beverage 16% 16% Auto 11% 11% Consumer Products 9% 8% Technology 7% 8% Financial Services 7% 8% Travel & Entertainment 7% 7% Retail 6% 6% Telecommunications 4% 4% Government 4% 4% Services 3% 3% Oil, Gas & Utilities 2% 2% Education 1% 1% Not-for-Profit 1% 1% Other 6% 5% Total 100% 100% Revenue by Industry Sector Note: Prior year period amounts conform to the current period presentation.


8 Operating Expense Detail First Quarter 2024 % of Rev 2023 % of Rev Revenue $ 3,630.5 $ 3,443.3 Operating expenses: Salary and related costs 1,847.3 50.9 % 1,778.0 51.6 % Third-party service costs(c) 698.2 19.2 % 639.3 18.6 % Third-party incidental costs(d) 147.1 4.1 % 125.6 3.6 % Total salary and service costs 2,692.6 2,542.9 Occupancy and other costs 314.1 8.7 % 291.6 8.5 % Real estate repositioning costs(a) — — % 119.2 3.5 % Cost of services 3,006.7 2,953.7 Selling, general and administrative expenses 85.3 2.3 % 89.2 2.6 % Depreciation and amortization 59.6 1.6 % 53.9 1.6 % Total operating expenses 3,151.6 86.8 % 3,096.8 89.9 % Operating Income(a) $ 478.9 $ 346.5 In millions. See Notes on page 13.


9 First Quarter Reported 2024 Reported 2023 Non-GAAP Adjustments Non-GAAP Adjusted 2023 Revenue $ 3,630.5 $ 3,443.3 $ — $ 3,443.3 Operating Expenses: Real estate repositioning costs(a) 119.2 (119.2) — Operating Expenses(a) 3,151.6 3,096.8 (119.2) 2,977.6 Operating Income(a) 478.9 346.5 465.7 Operating Income Margin % 13.2 % 10.1 % 13.5 % Net Interest Expense 26.8 19.3 — 19.3 Income Tax Expense(b) 116.0 83.4 28.2 111.6 Income Tax Rate 25.7 % 25.5 % 25.0 % Income from Equity Method Investments 0.9 0.1 — 0.1 Net Income Attributed to Noncontrolling Interests 18.4 16.4 — 16.4 Net Income - Omnicom Group Inc.(a)(b) $ 318.6 $ 227.5 $ 91.0 $ 318.5 Net Income per Share - Diluted(a)(b) $ 1.59 $ 1.11 $ 1.56 Non-GAAP Measures: EBITA(5) $ 500.4 $ 361.3 $ 119.2 $ 480.5 EBITA Margin % 13.8 % 10.5 % 14.0 % Reported Net Income per Share - Diluted(a)(b) $ 1.59 $ 1.11 $ 1.11 After-tax amortization per diluted share(5) $ 0.08 $ 0.05 Real estate repositioning costs (after-tax) per diluted share(a)(b) $ 0.45 Non-GAAP Adjusted Net Income per Share - Diluted(5) $ 1.67 $ 1.61 Income Statement Summary - Non-GAAP Adjusted In millions except per share amounts. See Notes on page 13 and Non-GAAP reconciliations on pages 17 - 20.


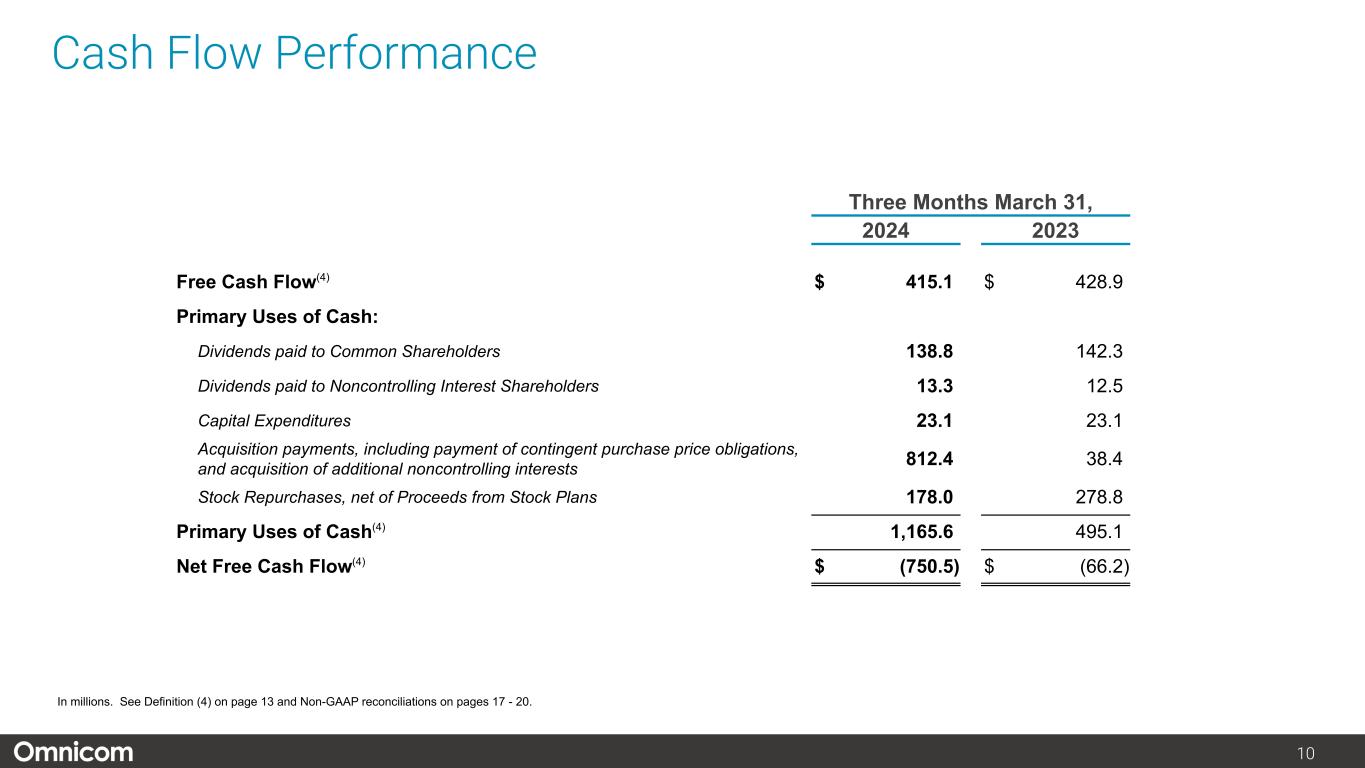
10 Cash Flow Performance Three Months March 31, 2024 2023 Free Cash Flow(4) $ 415.1 $ 428.9 Primary Uses of Cash: Dividends paid to Common Shareholders 138.8 142.3 Dividends paid to Noncontrolling Interest Shareholders 13.3 12.5 Capital Expenditures 23.1 23.1 Acquisition payments, including payment of contingent purchase price obligations, and acquisition of additional noncontrolling interests 812.4 38.4 Stock Repurchases, net of Proceeds from Stock Plans 178.0 278.8 Primary Uses of Cash(4) 1,165.6 495.1 Net Free Cash Flow(4) $ (750.5) $ (66.2) In millions. See Definition (4) on page 13 and Non-GAAP reconciliations on pages 17 - 20.


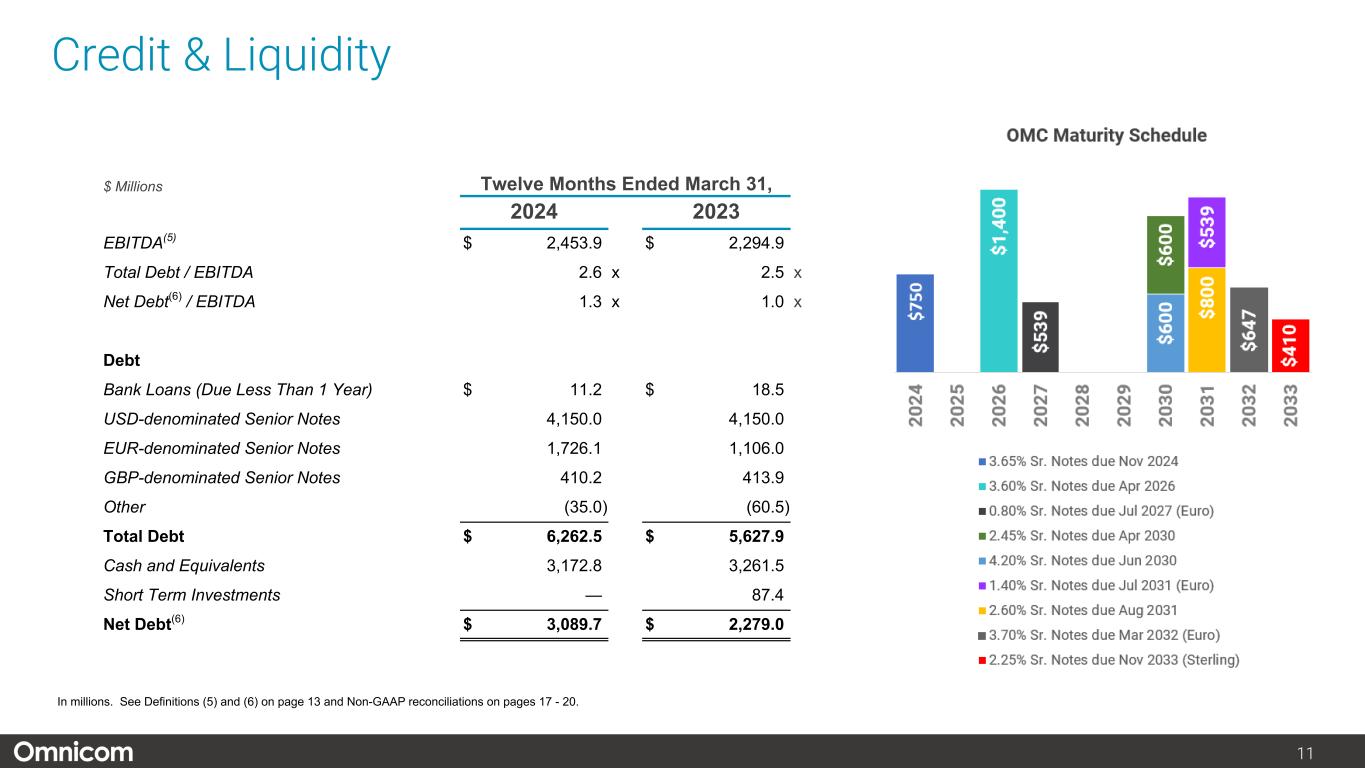
11 Credit & Liquidity $ Millions Twelve Months Ended March 31, 2024 2023 EBITDA(5) $ 2,453.9 $ 2,294.9 Total Debt / EBITDA 2.6 x 2.5 x Net Debt(6) / EBITDA 1.3 x 1.0 x Debt Bank Loans (Due Less Than 1 Year) $ 11.2 $ 18.5 USD-denominated Senior Notes 4,150.0 4,150.0 EUR-denominated Senior Notes 1,726.1 1,106.0 GBP-denominated Senior Notes 410.2 413.9 Other (35.0) (60.5) Total Debt $ 6,262.5 $ 5,627.9 Cash and Equivalents 3,172.8 3,261.5 Short Term Investments — 87.4 Net Debt(6) $ 3,089.7 $ 2,279.0 In millions. See Definitions (5) and (6) on page 13 and Non-GAAP reconciliations on pages 17 - 20.


12 Historical Returns Return on Invested Capital (ROIC)(7) Return on Equity(8) Twelve months ended March 31, 2024 22.3 % Twelve months ended March 31, 2024 44.3 % Twelve months ended March 31, 2023 24.1 % Twelve months ended March 31, 2023 44.8 % In millions. See Definitions (7) and (8) on page 13.


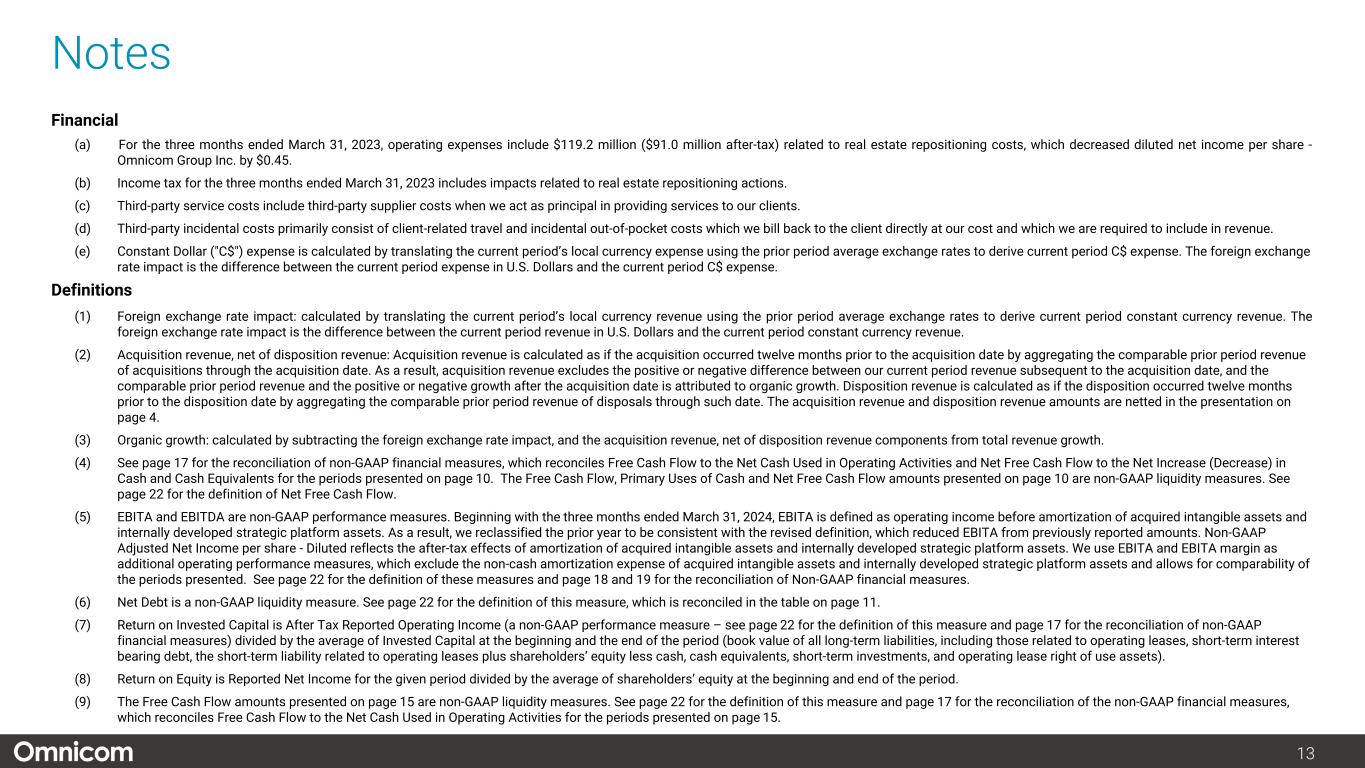
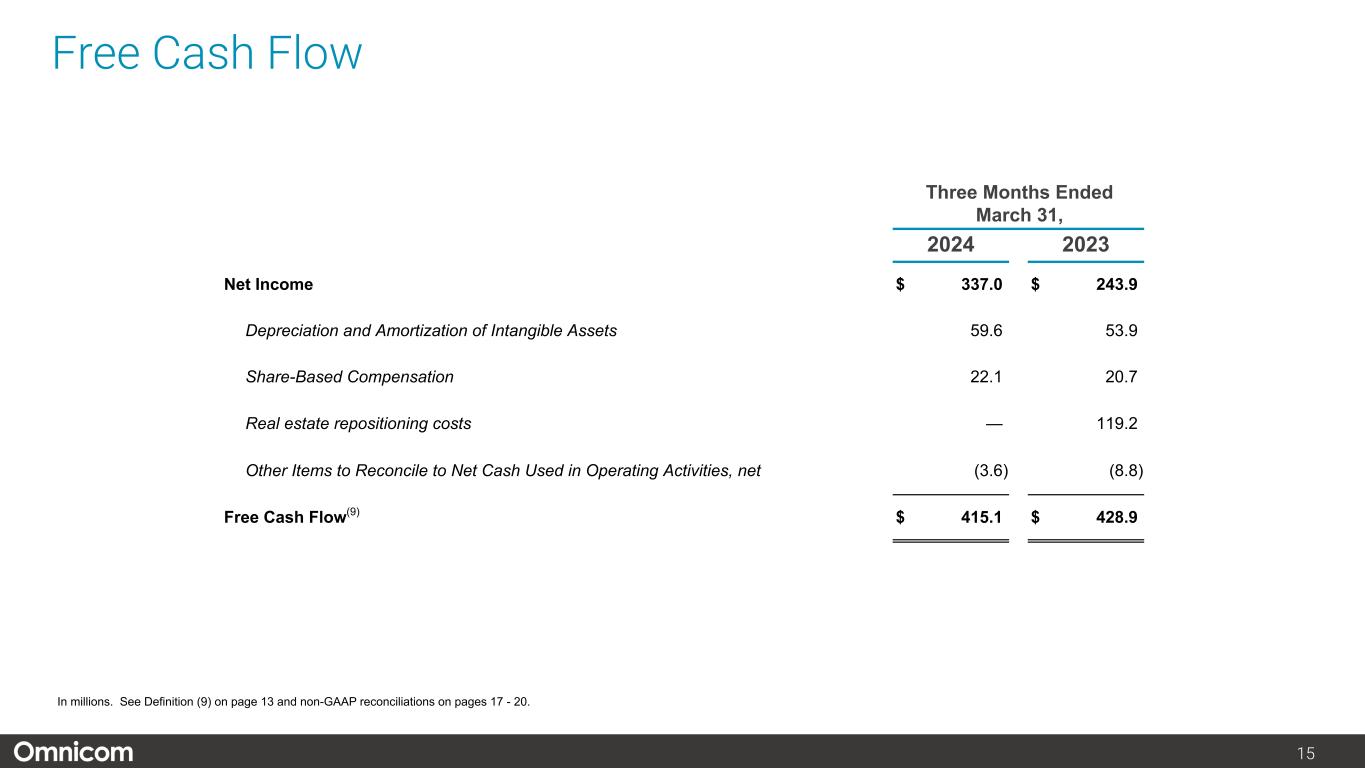
13 Notes (a) For the three months ended March 31, 2023, operating expenses include $119.2 million ($91.0 million after-tax) related to real estate repositioning costs, which decreased diluted net income per share - Omnicom Group Inc. by $0.45. (b) Income tax for the three months ended March 31, 2023 includes impacts related to real estate repositioning actions. (c) Third-party service costs include third-party supplier costs when we act as principal in providing services to our clients. (d) Third-party incidental costs primarily consist of client-related travel and incidental out-of-pocket costs which we bill back to the client directly at our cost and which we are required to include in revenue. (e) Constant Dollar ("C$") expense is calculated by translating the current period’s local currency expense using the prior period average exchange rates to derive current period C$ expense. The foreign exchange rate impact is the difference between the current period expense in U.S. Dollars and the current period C$ expense. Financial Definitions (1) Foreign exchange rate impact: calculated by translating the current period’s local currency revenue using the prior period average exchange rates to derive current period constant currency revenue. The foreign exchange rate impact is the difference between the current period revenue in U.S. Dollars and the current period constant currency revenue. (2) Acquisition revenue, net of disposition revenue: Acquisition revenue is calculated as if the acquisition occurred twelve months prior to the acquisition date by aggregating the comparable prior period revenue of acquisitions through the acquisition date. As a result, acquisition revenue excludes the positive or negative difference between our current period revenue subsequent to the acquisition date, and the comparable prior period revenue and the positive or negative growth after the acquisition date is attributed to organic growth. Disposition revenue is calculated as if the disposition occurred twelve months prior to the disposition date by aggregating the comparable prior period revenue of disposals through such date. The acquisition revenue and disposition revenue amounts are netted in the presentation on page 4. (3) Organic growth: calculated by subtracting the foreign exchange rate impact, and the acquisition revenue, net of disposition revenue components from total revenue growth. (4) See page 17 for the reconciliation of non-GAAP financial measures, which reconciles Free Cash Flow to the Net Cash Used in Operating Activities and Net Free Cash Flow to the Net Increase (Decrease) in Cash and Cash Equivalents for the periods presented on page 10. The Free Cash Flow, Primary Uses of Cash and Net Free Cash Flow amounts presented on page 10 are non-GAAP liquidity measures. See page 22 for the definition of Net Free Cash Flow. (5) EBITA and EBITDA are non-GAAP performance measures. Beginning with the three months ended March 31, 2024, EBITA is defined as operating income before amortization of acquired intangible assets and internally developed strategic platform assets. As a result, we reclassified the prior year to be consistent with the revised definition, which reduced EBITA from previously reported amounts. Non-GAAP Adjusted Net Income per share - Diluted reflects the after-tax effects of amortization of acquired intangible assets and internally developed strategic platform assets. We use EBITA and EBITA margin as additional operating performance measures, which exclude the non-cash amortization expense of acquired intangible assets and internally developed strategic platform assets and allows for comparability of the periods presented. See page 22 for the definition of these measures and page 18 and 19 for the reconciliation of Non-GAAP financial measures. (6) Net Debt is a non-GAAP liquidity measure. See page 22 for the definition of this measure, which is reconciled in the table on page 11. (7) Return on Invested Capital is After Tax Reported Operating Income (a non-GAAP performance measure – see page 22 for the definition of this measure and page 17 for the reconciliation of non-GAAP financial measures) divided by the average of Invested Capital at the beginning and the end of the period (book value of all long-term liabilities, including those related to operating leases, short-term interest bearing debt, the short-term liability related to operating leases plus shareholders’ equity less cash, cash equivalents, short-term investments, and operating lease right of use assets). (8) Return on Equity is Reported Net Income for the given period divided by the average of shareholders’ equity at the beginning and end of the period. (9) The Free Cash Flow amounts presented on page 15 are non-GAAP liquidity measures. See page 22 for the definition of this measure and page 17 for the reconciliation of the non-GAAP financial measures, which reconciles Free Cash Flow to the Net Cash Used in Operating Activities for the periods presented on page 15.


14 Appendix


15 Free Cash Flow Three Months Ended March 31, 2024 2023 Net Income $ 337.0 $ 243.9 Depreciation and Amortization of Intangible Assets 59.6 53.9 Share-Based Compensation 22.1 20.7 Real estate repositioning costs — 119.2 Other Items to Reconcile to Net Cash Used in Operating Activities, net (3.6) (8.8) Free Cash Flow(9) $ 415.1 $ 428.9 In millions. See Definition (9) on page 13 and non-GAAP reconciliations on pages 17 - 20.


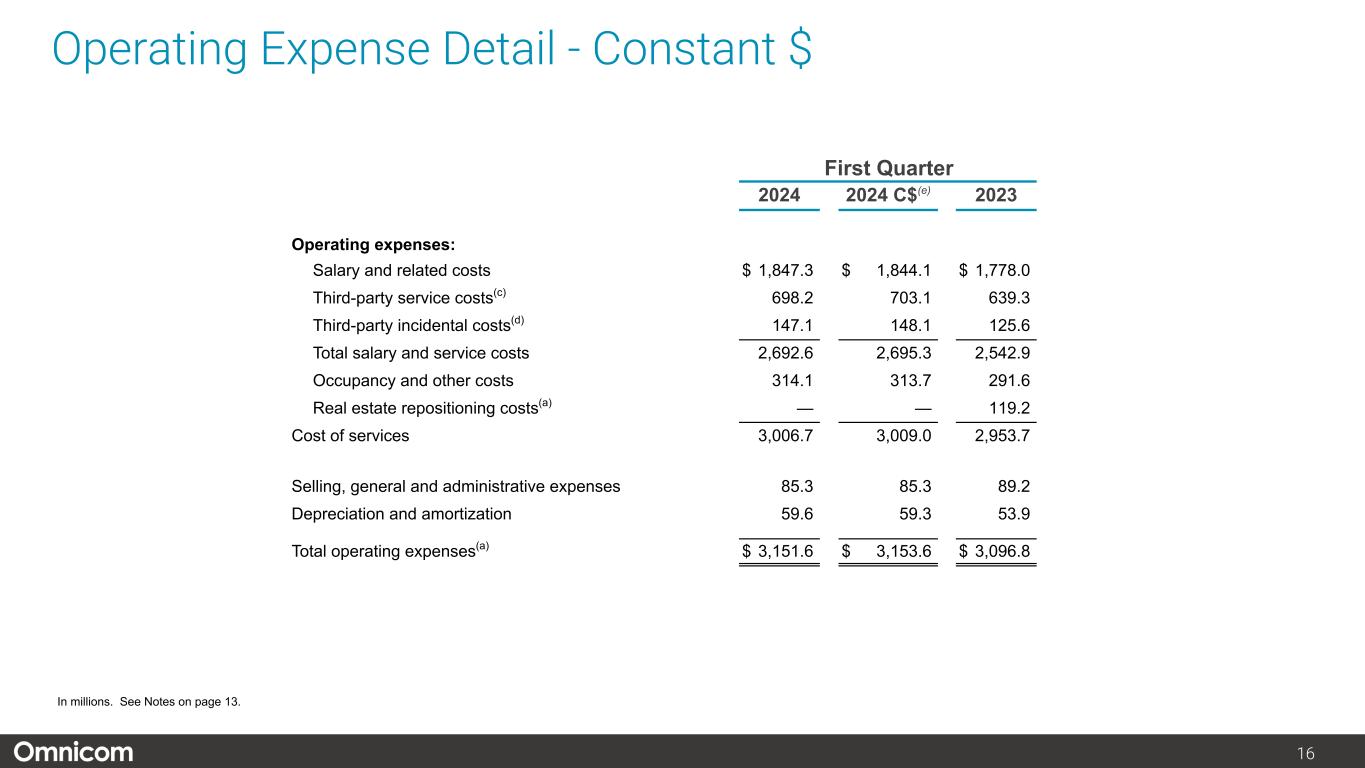
16 Operating Expense Detail - Constant $ First Quarter 2024 2024 C$(e) 2023 Operating expenses: Salary and related costs $ 1,847.3 $ 1,844.1 $ 1,778.0 Third-party service costs(c) 698.2 703.1 639.3 Third-party incidental costs(d) 147.1 148.1 125.6 Total salary and service costs 2,692.6 2,695.3 2,542.9 Occupancy and other costs 314.1 313.7 291.6 Real estate repositioning costs(a) — — 119.2 Cost of services 3,006.7 3,009.0 2,953.7 Selling, general and administrative expenses 85.3 85.3 89.2 Depreciation and amortization 59.6 59.3 53.9 Total operating expenses(a) $ 3,151.6 $ 3,153.6 $ 3,096.8 In millions. See Notes on page 13.


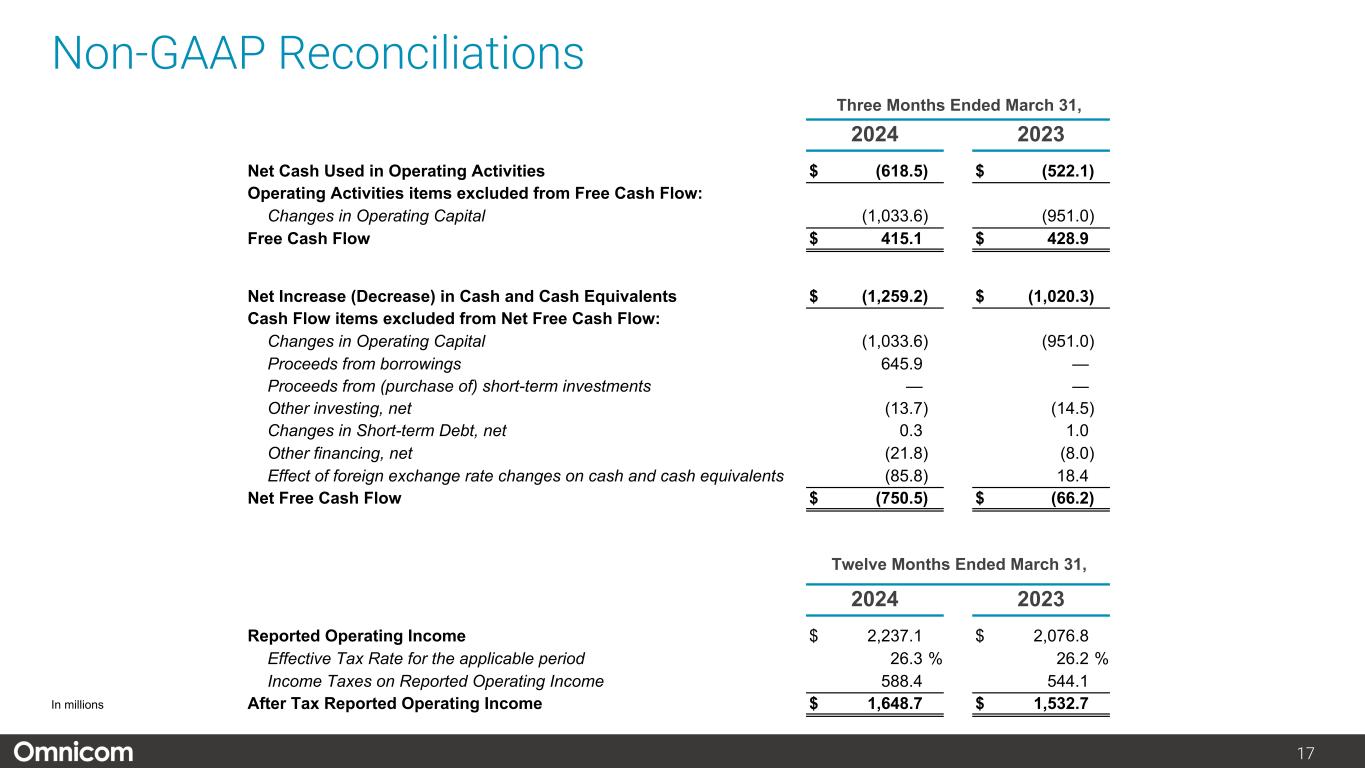
17 Non-GAAP Reconciliations Three Months Ended March 31, 2024 2023 Net Cash Used in Operating Activities $ (618.5) $ (522.1) Operating Activities items excluded from Free Cash Flow: Changes in Operating Capital (1,033.6) (951.0) Free Cash Flow $ 415.1 $ 428.9 Net Increase (Decrease) in Cash and Cash Equivalents $ (1,259.2) $ (1,020.3) Cash Flow items excluded from Net Free Cash Flow: Changes in Operating Capital (1,033.6) (951.0) Proceeds from borrowings 645.9 — Proceeds from (purchase of) short-term investments — — Other investing, net (13.7) (14.5) Changes in Short-term Debt, net 0.3 1.0 Other financing, net (21.8) (8.0) Effect of foreign exchange rate changes on cash and cash equivalents (85.8) 18.4 Net Free Cash Flow $ (750.5) $ (66.2) Twelve Months Ended March 31, 2024 2023 Reported Operating Income $ 2,237.1 $ 2,076.8 Effective Tax Rate for the applicable period 26.3 % 26.2 % Income Taxes on Reported Operating Income 588.4 544.1 After Tax Reported Operating Income $ 1,648.7 $ 1,532.7 In millions


18 Non-GAAP Reconciliations In millions The above table reconciles the GAAP financial measure of Net Income – Omnicom Group Inc. to the non-GAAP financial measures of EBITDA and EBITA for the periods presented. EBITDA and EBITA, which are defined on page 22, are non-GAAP financial measures within the meaning of applicable SEC rules and regulations. Our credit facility defines EBITDA as earnings before deducting interest expense, income taxes, depreciation and amortization, and excludes certain other one-time items. Our credit facility uses EBITDA to measure our compliance with covenants, such as our leverage ratios, as presented on page 11 of this presentation. Adjusted EBITA and Adjusted EBITA Margin are non-GAAP measures, and management believes excluding real estate repositioning costs provides investors with a better picture of performance of the business during the periods presented. See page 22 for definition of non-GAAP financial measures. Three Months Ended March 31, 2024 2023 Net Income - Omnicom Group Inc.(a)(b) $ 318.6 $ 227.5 Net Income Attributed to Noncontrolling Interests 18.4 16.4 Income From Equity Method Investments 0.9 0.1 Income Tax Expense 116.0 83.4 Income Before Income Taxes and Income From Equity Method Investments 452.1 327.2 Net Interest Expense 26.8 19.3 Operating Income(a)(b) 478.9 346.5 Amortization of acquired intangible assets and internally developed strategic platform assets(5) 21.5 14.8 EBITA 500.4 361.3 Amortization of other purchased and internally developed software 4.3 4.5 Depreciation 33.8 34.6 EBITDA $ 538.5 $ 400.4 EBITA $ 500.4 $ 361.3 Real estate repositioning costs — 119.2 EBITA - Adjusted $ 500.4 $ 480.5 Revenue $ 3,630.5 $ 3,443.3 EBITA $ 500.4 $ 361.3 EBITA Margin % 13.8 % 10.5 % EBITA - Adjusted $ 500.4 $ 480.5 EBITA Margin % - Adjusted 13.8 % 14.0 %


19 Non-GAAP Reconciliations In millions The above table reconciles the GAAP financial measure of Operating Income to adjusted Non-GAAP financial measure of Non-GAAP Operating Income - Adjusted for the periods presented. Management believes excluding the real estate repositioning costs, provides investors with a better picture of the performance of the business during the periods presented. Three Months Ended March 31, 2024 2023 Net Income - Omnicom Group Inc.- Reported $ 318.6 $ 227.5 Net Income Attributed To Noncontrolling Interests 18.4 16.4 Income From Equity Method Investments 0.9 0.1 Income Tax Expense 116.0 83.4 Income Before Income Taxes and Income From Equity Method Investments 452.1 327.2 Net Interest Expense 26.8 19.3 Operating Income - Reported 478.9 346.5 Real estate repositioning costs — 119.2 Non-GAAP Operating Income - Adjusted $ 478.9 $ 465.7


20 First Quarter 2024 2023 Net Income - Omnicom Group Inc. - Reported $ 318.6 $ 227.5 Impact on Net Income related to: Real estate repositioning costs — 91.0 Amortization of acquired intangible assets and internally developed strategic platform assets (after-tax) 15.9 11.0 Non-GAAP Net Income - Omnicom Group Inc. - Adjusted $ 334.5 $ 329.5 Diluted Shares 200.1 204.5 Reported Net Income per Share - Diluted $ 1.59 $ 1.11 Real estate repositioning costs - after-tax $ — $ 0.45 Amortization of acquired intangible assets and internally developed strategic platform assets (after-tax) $ 0.08 $ 0.05 Non-GAAP Adjusted Net Income per Share - Omnicom Group Inc. $ 1.67 $ 1.61 Non-GAAP Reconciliations In millions The above table reconciles the GAAP financial measure of Net Income-Omnicom Group Inc., to the adjusted Non-GAAP financial measure of Net Income-Omnicom Group Inc.-Adjusted for the periods presented. Management believes these non-GAAP measures are useful for investors to evaluate the comparability of the performance of our business year to year.

 
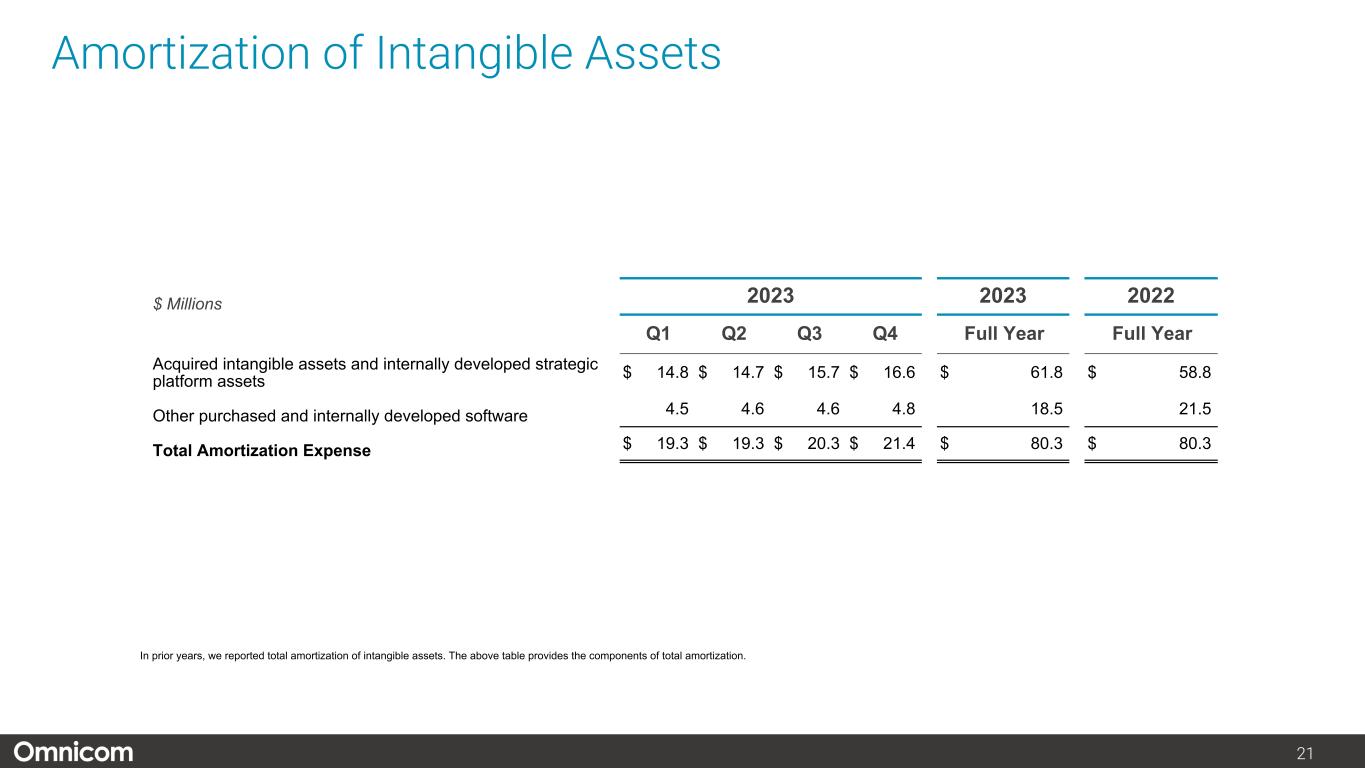
21 Amortization of Intangible Assets $ Millions 2023 2023 2022 Q1 Q2 Q3 Q4 Full Year Full Year Acquired intangible assets and internally developed strategic platform assets $ 14.8 $ 14.7 $ 15.7 $ 16.6 $ 61.8 $ 58.8 Other purchased and internally developed software 4.5 4.6 4.6 4.8 18.5 21.5 Total Amortization Expense $ 19.3 $ 19.3 $ 20.3 $ 21.4 $ 80.3 $ 80.3 In prior years, we reported total amortization of intangible assets. The above table provides the components of total amortization.


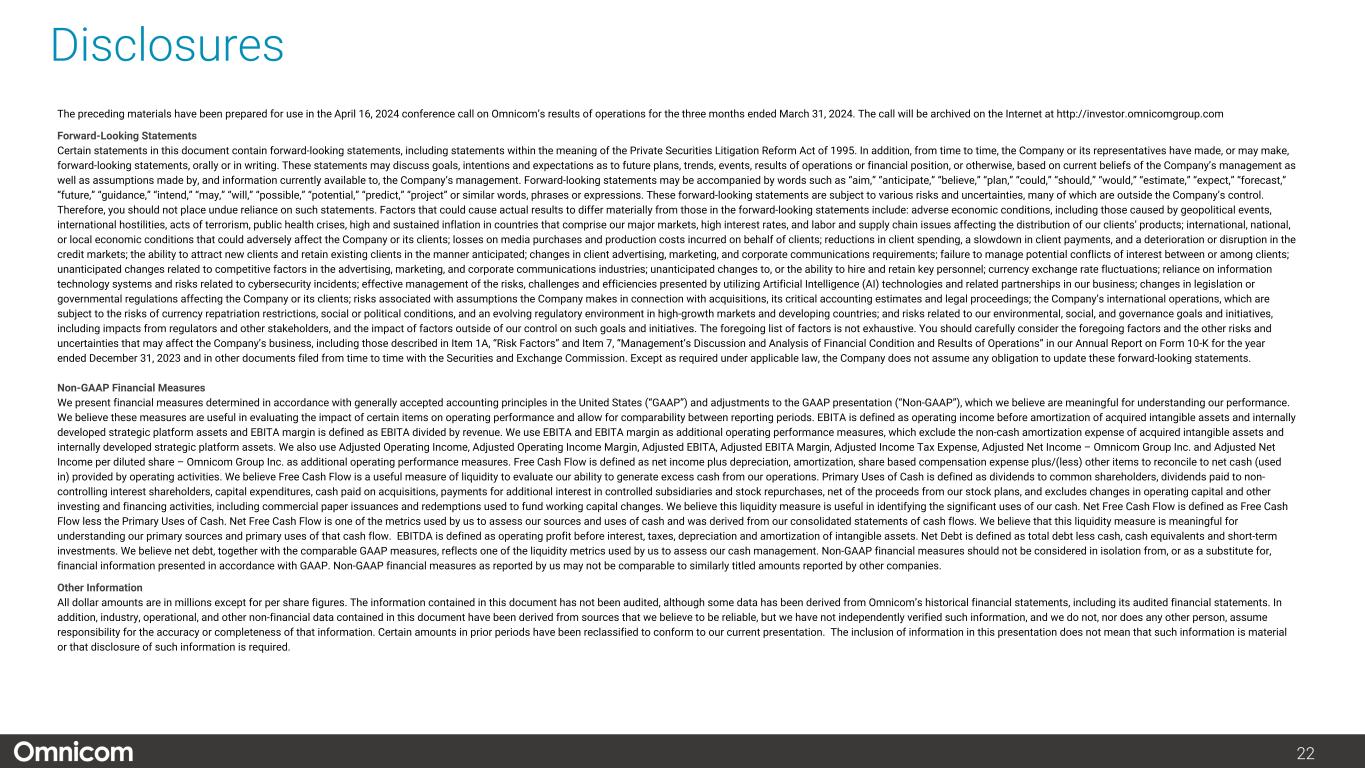
22 Disclosures The preceding materials have been prepared for use in the April 16, 2024 conference call on Omnicom’s results of operations for the three months ended March 31, 2024. The call will be archived on the Internet at http://investor.omnicomgroup.com Forward-Looking Statements Certain statements in this document contain forward-looking statements, including statements within the meaning of the Private Securities Litigation Reform Act of 1995. In addition, from time to time, the Company or its representatives have made, or may make, forward-looking statements, orally or in writing. These statements may discuss goals, intentions and expectations as to future plans, trends, events, results of operations or financial position, or otherwise, based on current beliefs of the Company’s management as well as assumptions made by, and information currently available to, the Company’s management. Forward-looking statements may be accompanied by words such as “aim,” “anticipate,” “believe,” “plan,” “could,” “should,” “would,” “estimate,” “expect,” “forecast,” “future,” “guidance,” “intend,” “may,” “will,” “possible,” “potential,” “predict,” “project” or similar words, phrases or expressions. These forward-looking statements are subject to various risks and uncertainties, many of which are outside the Company’s control. Therefore, you should not place undue reliance on such statements. Factors that could cause actual results to differ materially from those in the forward-looking statements include: adverse economic conditions, including those caused by geopolitical events, international hostilities, acts of terrorism, public health crises, high and sustained inflation in countries that comprise our major markets, high interest rates, and labor and supply chain issues affecting the distribution of our clients’ products; international, national, or local economic conditions that could adversely affect the Company or its clients; losses on media purchases and production costs incurred on behalf of clients; reductions in client spending, a slowdown in client payments, and a deterioration or disruption in the credit markets; the ability to attract new clients and retain existing clients in the manner anticipated; changes in client advertising, marketing, and corporate communications requirements; failure to manage potential conflicts of interest between or among clients; unanticipated changes related to competitive factors in the advertising, marketing, and corporate communications industries; unanticipated changes to, or the ability to hire and retain key personnel; currency exchange rate fluctuations; reliance on information technology systems and risks related to cybersecurity incidents; effective management of the risks, challenges and efficiencies presented by utilizing Artificial Intelligence (AI) technologies and related partnerships in our business; changes in legislation or governmental regulations affecting the Company or its clients; risks associated with assumptions the Company makes in connection with acquisitions, its critical accounting estimates and legal proceedings; the Company’s international operations, which are subject to the risks of currency repatriation restrictions, social or political conditions, and an evolving regulatory environment in high-growth markets and developing countries; and risks related to our environmental, social, and governance goals and initiatives, including impacts from regulators and other stakeholders, and the impact of factors outside of our control on such goals and initiatives. The foregoing list of factors is not exhaustive. You should carefully consider the foregoing factors and the other risks and uncertainties that may affect the Company’s business, including those described in Item 1A, “Risk Factors” and Item 7, “Management’s Discussion and Analysis of Financial Condition and Results of Operations” in our Annual Report on Form 10-K for the year ended December 31, 2023 and in other documents filed from time to time with the Securities and Exchange Commission. Except as required under applicable law, the Company does not assume any obligation to update these forward-looking statements. Non-GAAP Financial Measures We present financial measures determined in accordance with generally accepted accounting principles in the United States (“GAAP”) and adjustments to the GAAP presentation (“Non-GAAP”), which we believe are meaningful for understanding our performance. We believe these measures are useful in evaluating the impact of certain items on operating performance and allow for comparability between reporting periods. EBITA is defined as operating income before amortization of acquired intangible assets and internally developed strategic platform assets and EBITA margin is defined as EBITA divided by revenue. We use EBITA and EBITA margin as additional operating performance measures, which exclude the non-cash amortization expense of acquired intangible assets and internally developed strategic platform assets. We also use Adjusted Operating Income, Adjusted Operating Income Margin, Adjusted EBITA, Adjusted EBITA Margin, Adjusted Income Tax Expense, Adjusted Net Income – Omnicom Group Inc. and Adjusted Net Income per diluted share – Omnicom Group Inc. as additional operating performance measures. Free Cash Flow is defined as net income plus depreciation, amortization, share based compensation expense plus/(less) other items to reconcile to net cash (used in) provided by operating activities. We believe Free Cash Flow is a useful measure of liquidity to evaluate our ability to generate excess cash from our operations. Primary Uses of Cash is defined as dividends to common shareholders, dividends paid to non- controlling interest shareholders, capital expenditures, cash paid on acquisitions, payments for additional interest in controlled subsidiaries and stock repurchases, net of the proceeds from our stock plans, and excludes changes in operating capital and other investing and financing activities, including commercial paper issuances and redemptions used to fund working capital changes. We believe this liquidity measure is useful in identifying the significant uses of our cash. Net Free Cash Flow is defined as Free Cash Flow less the Primary Uses of Cash. Net Free Cash Flow is one of the metrics used by us to assess our sources and uses of cash and was derived from our consolidated statements of cash flows. We believe that this liquidity measure is meaningful for understanding our primary sources and primary uses of that cash flow. EBITDA is defined as operating profit before interest, taxes, depreciation and amortization of intangible assets. Net Debt is defined as total debt less cash, cash equivalents and short-term investments. We believe net debt, together with the comparable GAAP measures, reflects one of the liquidity metrics used by us to assess our cash management. Non-GAAP financial measures should not be considered in isolation from, or as a substitute for, financial information presented in accordance with GAAP. Non-GAAP financial measures as reported by us may not be comparable to similarly titled amounts reported by other companies. Other Information All dollar amounts are in millions except for per share figures. The information contained in this document has not been audited, although some data has been derived from Omnicom’s historical financial statements, including its audited financial statements. In addition, industry, operational, and other non-financial data contained in this document have been derived from sources that we believe to be reliable, but we have not independently verified such information, and we do not, nor does any other person, assume responsibility for the accuracy or completeness of that information. Certain amounts in prior periods have been reclassified to conform to our current presentation. The inclusion of information in this presentation does not mean that such information is material or that disclosure of such information is required.