00000296442023FYFALSEP3YP5YP5YP3YP1Yhttp://fasb.org/us-gaap/2023#OtherAssetsNoncurrenthttp://fasb.org/us-gaap/2023#OtherAssetsNoncurrenthttp://fasb.org/us-gaap/2023#OtherLiabilitiesCurrenthttp://fasb.org/us-gaap/2023#OtherLiabilitiesCurrenthttp://fasb.org/us-gaap/2023#OtherLiabilitiesNoncurrenthttp://fasb.org/us-gaap/2023#OtherLiabilitiesNoncurrenthttp://fasb.org/us-gaap/2023#OtherNonoperatingIncomeExpensehttp://fasb.org/us-gaap/2023#OtherNonoperatingIncomeExpensehttp://fasb.org/us-gaap/2023#OtherNonoperatingIncomeExpensehttp://fasb.org/us-gaap/2023#OtherNonoperatingIncomeExpensehttp://fasb.org/us-gaap/2023#OtherNonoperatingIncomeExpensehttp://fasb.org/us-gaap/2023#OtherNonoperatingIncomeExpensehttp://fasb.org/us-gaap/2023#OtherNonoperatingIncomeExpensehttp://fasb.org/us-gaap/2023#OtherNonoperatingIncomeExpensehttp://fasb.org/us-gaap/2023#OtherNonoperatingIncomeExpensehttp://fasb.org/us-gaap/2023#OtherNonoperatingIncomeExpensehttp://fasb.org/us-gaap/2023#OtherNonoperatingIncomeExpensehttp://fasb.org/us-gaap/2023#OtherNonoperatingIncomeExpensehttp://fasb.org/us-gaap/2023#OtherNonoperatingIncomeExpensehttp://fasb.org/us-gaap/2023#OtherNonoperatingIncomeExpensehttp://fasb.org/us-gaap/2023#OtherNonoperatingIncomeExpense00000296442022-08-012023-07-3100000296442023-01-31iso4217:USD00000296442023-09-08xbrli:shares00000296442021-08-012022-07-3100000296442020-08-012021-07-31iso4217:USDxbrli:shares00000296442023-07-3100000296442022-07-3100000296442021-07-3100000296442020-07-310000029644us-gaap:CommonStockMember2020-07-310000029644us-gaap:AdditionalPaidInCapitalMember2020-07-310000029644us-gaap:RetainedEarningsMember2020-07-310000029644us-gaap:NoncontrollingInterestMember2020-07-310000029644us-gaap:AccumulatedOtherComprehensiveIncomeMember2020-07-310000029644us-gaap:TreasuryStockCommonMember2020-07-310000029644us-gaap:RetainedEarningsMember2020-08-012021-07-310000029644us-gaap:AccumulatedOtherComprehensiveIncomeMember2020-08-012021-07-310000029644us-gaap:TreasuryStockCommonMember2020-08-012021-07-310000029644us-gaap:AdditionalPaidInCapitalMember2020-08-012021-07-310000029644us-gaap:NoncontrollingInterestMember2020-08-012021-07-310000029644us-gaap:CommonStockMember2021-07-310000029644us-gaap:AdditionalPaidInCapitalMember2021-07-310000029644us-gaap:RetainedEarningsMember2021-07-310000029644us-gaap:NoncontrollingInterestMember2021-07-310000029644us-gaap:AccumulatedOtherComprehensiveIncomeMember2021-07-310000029644us-gaap:TreasuryStockCommonMember2021-07-310000029644us-gaap:RetainedEarningsMember2021-08-012022-07-310000029644us-gaap:AccumulatedOtherComprehensiveIncomeMember2021-08-012022-07-310000029644us-gaap:TreasuryStockCommonMember2021-08-012022-07-310000029644us-gaap:AdditionalPaidInCapitalMember2021-08-012022-07-310000029644us-gaap:CommonStockMember2022-07-310000029644us-gaap:AdditionalPaidInCapitalMember2022-07-310000029644us-gaap:RetainedEarningsMember2022-07-310000029644us-gaap:NoncontrollingInterestMember2022-07-310000029644us-gaap:AccumulatedOtherComprehensiveIncomeMember2022-07-310000029644us-gaap:TreasuryStockCommonMember2022-07-310000029644us-gaap:RetainedEarningsMember2022-08-012023-07-310000029644us-gaap:AccumulatedOtherComprehensiveIncomeMember2022-08-012023-07-310000029644us-gaap:TreasuryStockCommonMember2022-08-012023-07-310000029644us-gaap:AdditionalPaidInCapitalMember2022-08-012023-07-310000029644us-gaap:CommonStockMember2023-07-310000029644us-gaap:AdditionalPaidInCapitalMember2023-07-310000029644us-gaap:RetainedEarningsMember2023-07-310000029644us-gaap:NoncontrollingInterestMember2023-07-310000029644us-gaap:AccumulatedOtherComprehensiveIncomeMember2023-07-310000029644us-gaap:TreasuryStockCommonMember2023-07-310000029644us-gaap:ShippingAndHandlingMember2022-08-012023-07-310000029644us-gaap:ShippingAndHandlingMember2021-08-012022-07-310000029644us-gaap:ShippingAndHandlingMember2020-08-012021-07-31xbrli:pure0000029644srt:MinimumMemberus-gaap:BuildingAndBuildingImprovementsMember2023-07-310000029644srt:MaximumMemberus-gaap:BuildingAndBuildingImprovementsMember2023-07-310000029644srt:MinimumMemberus-gaap:MachineryAndEquipmentMember2023-07-310000029644srt:MaximumMemberus-gaap:MachineryAndEquipmentMember2023-07-310000029644us-gaap:SoftwareDevelopmentMembersrt:MinimumMember2023-07-310000029644us-gaap:SoftwareDevelopmentMembersrt:MaximumMember2023-07-310000029644srt:MinimumMember2022-08-012023-07-310000029644srt:MaximumMember2022-08-012023-07-310000029644srt:MinimumMemberus-gaap:CustomerRelationshipsMember2023-07-310000029644srt:MinimumMemberdci:PatentsTrademarksAndTechnologyMember2023-07-310000029644srt:MinimumMemberus-gaap:NoncompeteAgreementsMember2023-07-310000029644srt:MaximumMemberus-gaap:NoncompeteAgreementsMember2023-07-310000029644us-gaap:CustomerRelationshipsMembersrt:MaximumMember2023-07-310000029644srt:MaximumMemberdci:PatentsTrademarksAndTechnologyMember2023-07-310000029644us-gaap:ForeignExchangeForwardMember2022-08-012023-07-310000029644dci:UnivercellsTechnologiesMember2023-06-292023-06-29iso4217:EUR0000029644dci:UnivercellsTechnologiesMember2023-06-290000029644dci:IsolereMember2023-02-012023-02-010000029644dci:IsolereMember2023-02-010000029644us-gaap:TechnologyBasedIntangibleAssetsMemberdci:IsolereAndUnivercellsMember2023-07-310000029644us-gaap:TrademarksAndTradeNamesMemberdci:IsolereAndUnivercellsMember2023-07-310000029644us-gaap:CustomerRelationshipsMemberdci:IsolereAndUnivercellsMember2023-07-310000029644dci:IsolereAndUnivercellsMemberus-gaap:NoncompeteAgreementsMember2023-07-310000029644dci:IsolereAndUnivercellsMember2023-07-310000029644dci:IsolereAndUnivercellsMember2022-08-012023-07-310000029644dci:PurilogicsLLCMember2022-06-132022-06-130000029644dci:PurilogicsLLCMember2022-06-130000029644dci:SolarisBiotechnologySrlMemberMember2021-11-222021-11-220000029644dci:PearsonArnoldIndustrialServicesMemberMember2021-11-012021-11-010000029644us-gaap:TechnologyBasedIntangibleAssetsMemberdci:PearsonArnoldIndustrialServicesMember2022-07-310000029644us-gaap:TrademarksAndTradeNamesMemberdci:PearsonArnoldIndustrialServicesMember2022-07-310000029644us-gaap:CustomerRelationshipsMemberdci:PearsonArnoldIndustrialServicesMember2022-07-310000029644dci:PearsonArnoldIndustrialServicesMemberus-gaap:NoncompeteAgreementsMember2022-07-310000029644dci:PearsonArnoldIndustrialServicesMemberus-gaap:OrderOrProductionBacklogMember2022-07-310000029644dci:PearsonArnoldIndustrialServicesMember2022-07-310000029644dci:PearsonArnoldIndustrialServicesMember2021-08-012022-07-310000029644srt:MinimumMemberdci:PurilogicsLLCMember2023-07-310000029644srt:MaximumMemberdci:PurilogicsLLCMember2023-07-310000029644dci:PurilogicsLLCMember2023-07-310000029644dci:PurilogicsLLCMember2022-07-310000029644us-gaap:SeriesOfIndividuallyImmaterialBusinessAcquisitionsMember2023-07-310000029644us-gaap:SeriesOfIndividuallyImmaterialBusinessAcquisitionsMember2022-07-310000029644us-gaap:SeriesOfIndividuallyImmaterialBusinessAcquisitionsMember2021-11-220000029644srt:MaximumMemberus-gaap:SeriesOfIndividuallyImmaterialBusinessAcquisitionsMember2021-11-220000029644us-gaap:SeriesOfIndividuallyImmaterialBusinessAcquisitionsMember2021-11-010000029644srt:MinimumMemberus-gaap:SeriesOfIndividuallyImmaterialBusinessAcquisitionsMember2021-11-010000029644dci:UnitedStatesAndCanadaMember2022-08-012023-07-310000029644dci:UnitedStatesAndCanadaMember2021-08-012022-07-310000029644dci:UnitedStatesAndCanadaMember2020-08-012021-07-310000029644us-gaap:EMEAMember2022-08-012023-07-310000029644us-gaap:EMEAMember2021-08-012022-07-310000029644us-gaap:EMEAMember2020-08-012021-07-310000029644srt:AsiaPacificMember2022-08-012023-07-310000029644srt:AsiaPacificMember2021-08-012022-07-310000029644srt:AsiaPacificMember2020-08-012021-07-310000029644srt:LatinAmericaMember2022-08-012023-07-310000029644srt:LatinAmericaMember2021-08-012022-07-310000029644srt:LatinAmericaMember2020-08-012021-07-310000029644us-gaap:LandMember2023-07-310000029644us-gaap:LandMember2022-07-310000029644us-gaap:BuildingMember2023-07-310000029644us-gaap:BuildingMember2022-07-310000029644us-gaap:MachineryAndEquipmentMember2023-07-310000029644us-gaap:MachineryAndEquipmentMember2022-07-310000029644us-gaap:SoftwareAndSoftwareDevelopmentCostsMember2023-07-310000029644us-gaap:SoftwareAndSoftwareDevelopmentCostsMember2022-07-310000029644us-gaap:ConstructionInProgressMember2023-07-310000029644us-gaap:ConstructionInProgressMember2022-07-310000029644dci:MobileSolutionsSegmentMember2021-07-310000029644dci:IndustrialProductsSegmentMember2021-07-310000029644dci:LifeSciencesSegmentMember2021-07-310000029644dci:MobileSolutionsSegmentMember2021-08-012022-07-310000029644dci:IndustrialProductsSegmentMember2021-08-012022-07-310000029644dci:LifeSciencesSegmentMember2021-08-012022-07-310000029644dci:MobileSolutionsSegmentMember2022-07-310000029644dci:IndustrialProductsSegmentMember2022-07-310000029644dci:LifeSciencesSegmentMember2022-07-310000029644dci:MobileSolutionsSegmentMember2022-08-012023-07-310000029644dci:IndustrialProductsSegmentMember2022-08-012023-07-310000029644dci:LifeSciencesSegmentMember2022-08-012023-07-310000029644dci:MobileSolutionsSegmentMember2023-07-310000029644dci:IndustrialProductsSegmentMember2023-07-310000029644dci:LifeSciencesSegmentMember2023-07-310000029644us-gaap:TechnologyBasedIntangibleAssetsMemberdci:UnivercellsTechnologiesMember2023-06-290000029644us-gaap:TrademarksAndTradeNamesMemberdci:UnivercellsTechnologiesMember2023-06-290000029644us-gaap:NoncompeteAgreementsMemberdci:UnivercellsTechnologiesMember2023-06-290000029644us-gaap:CustomerRelationshipsMemberdci:UnivercellsTechnologiesMember2023-06-290000029644us-gaap:TechnologyBasedIntangibleAssetsMemberdci:IsolereMember2023-02-010000029644dci:IsolereMemberus-gaap:TrademarksAndTradeNamesMember2023-02-010000029644dci:IsolereMemberus-gaap:NoncompeteAgreementsMember2023-02-010000029644dci:PurilogicsMember2022-07-310000029644us-gaap:TechnologyBasedIntangibleAssetsMemberdci:PurilogicsMember2022-07-310000029644us-gaap:TrademarksAndTradeNamesMemberdci:PurilogicsMember2022-07-310000029644dci:PurilogicsMemberus-gaap:NoncompeteAgreementsMember2022-07-310000029644us-gaap:TechnologyBasedIntangibleAssetsMemberus-gaap:SeriesOfIndividuallyImmaterialBusinessAcquisitionsMember2022-07-310000029644us-gaap:TrademarksAndTradeNamesMemberus-gaap:SeriesOfIndividuallyImmaterialBusinessAcquisitionsMember2022-07-310000029644us-gaap:CustomerRelationshipsMemberus-gaap:SeriesOfIndividuallyImmaterialBusinessAcquisitionsMember2022-07-310000029644us-gaap:OrderOrProductionBacklogMemberus-gaap:SeriesOfIndividuallyImmaterialBusinessAcquisitionsMember2022-07-310000029644us-gaap:CustomerRelationshipsMembersrt:WeightedAverageMember2023-07-310000029644us-gaap:PatentsMember2023-07-310000029644us-gaap:TrademarksMember2023-07-310000029644us-gaap:TechnologyBasedIntangibleAssetsMember2023-07-310000029644us-gaap:NoncompeteAgreementsMember2023-07-310000029644us-gaap:CustomerRelationshipsMembersrt:WeightedAverageMember2022-07-310000029644us-gaap:PatentsMember2022-07-310000029644us-gaap:TrademarksMember2022-07-310000029644us-gaap:TechnologyBasedIntangibleAssetsMember2022-07-310000029644us-gaap:NoncompeteAgreementsMember2022-07-310000029644srt:EuropeMemberus-gaap:CommercialPaperMember2023-07-310000029644srt:EuropeMemberus-gaap:CommercialPaperMember2022-07-310000029644us-gaap:LineOfCreditMembercountry:US2023-07-310000029644us-gaap:LineOfCreditMembercountry:US2022-07-310000029644us-gaap:LineOfCreditMembersrt:EuropeMember2023-07-310000029644us-gaap:LineOfCreditMembersrt:EuropeMember2022-07-310000029644us-gaap:LineOfCreditMemberdci:NonUSExcludingEuropeMember2023-07-310000029644us-gaap:LineOfCreditMemberdci:NonUSExcludingEuropeMember2022-07-310000029644us-gaap:LineOfCreditMember2023-07-310000029644us-gaap:LineOfCreditMember2022-07-310000029644srt:EuropeMemberdci:ShorttermDebtOutstandingBorrowingsMemberus-gaap:CommercialPaperMember2023-07-310000029644srt:EuropeMemberdci:ShorttermDebtOutstandingBorrowingsMemberus-gaap:CommercialPaperMember2022-07-310000029644us-gaap:LineOfCreditMemberdci:ShorttermDebtOutstandingBorrowingsMembercountry:US2023-07-310000029644us-gaap:LineOfCreditMemberdci:ShorttermDebtOutstandingBorrowingsMembercountry:US2022-07-310000029644us-gaap:LineOfCreditMembersrt:EuropeMemberdci:ShorttermDebtOutstandingBorrowingsMember2023-07-310000029644us-gaap:LineOfCreditMembersrt:EuropeMemberdci:ShorttermDebtOutstandingBorrowingsMember2022-07-310000029644us-gaap:LineOfCreditMemberdci:NonUSExcludingEuropeMemberdci:ShorttermDebtOutstandingBorrowingsMember2023-07-310000029644us-gaap:LineOfCreditMemberdci:NonUSExcludingEuropeMemberdci:ShorttermDebtOutstandingBorrowingsMember2022-07-310000029644us-gaap:LineOfCreditMemberdci:ShorttermDebtOutstandingBorrowingsMember2023-07-310000029644us-gaap:LineOfCreditMemberdci:ShorttermDebtOutstandingBorrowingsMember2022-07-310000029644dci:ShorttermDebtOtherNonborrowingReductionsMembersrt:EuropeMemberus-gaap:CommercialPaperMember2023-07-310000029644dci:ShorttermDebtOtherNonborrowingReductionsMembersrt:EuropeMemberus-gaap:CommercialPaperMember2022-07-310000029644us-gaap:LineOfCreditMemberdci:ShorttermDebtOtherNonborrowingReductionsMembercountry:US2023-07-310000029644us-gaap:LineOfCreditMemberdci:ShorttermDebtOtherNonborrowingReductionsMembercountry:US2022-07-310000029644us-gaap:LineOfCreditMemberdci:ShorttermDebtOtherNonborrowingReductionsMembersrt:EuropeMember2023-07-310000029644us-gaap:LineOfCreditMemberdci:ShorttermDebtOtherNonborrowingReductionsMembersrt:EuropeMember2022-07-310000029644us-gaap:LineOfCreditMemberdci:ShorttermDebtOtherNonborrowingReductionsMemberdci:NonUSExcludingEuropeMember2023-07-310000029644us-gaap:LineOfCreditMemberdci:ShorttermDebtOtherNonborrowingReductionsMemberdci:NonUSExcludingEuropeMember2022-07-310000029644us-gaap:LineOfCreditMemberdci:ShorttermDebtOtherNonborrowingReductionsMember2023-07-310000029644us-gaap:LineOfCreditMemberdci:ShorttermDebtOtherNonborrowingReductionsMember2022-07-310000029644us-gaap:UnsecuredDebtMemberdci:ThreePointSevenTwoPercentUnsecuredSeniorNotesDueMarchTwentySevenTwoThousandTwentyFourMember2023-07-310000029644us-gaap:UnsecuredDebtMemberdci:ThreePointSevenTwoPercentUnsecuredSeniorNotesDueMarchTwentySevenTwoThousandTwentyFourMember2022-07-310000029644us-gaap:UnsecuredDebtMemberdci:UnsecuredSeniorNotesSixMember2023-07-310000029644us-gaap:UnsecuredDebtMemberdci:UnsecuredSeniorNotesSixMember2022-07-310000029644us-gaap:UnsecuredDebtMemberdci:A2510YearNoteDue2031Member2023-07-310000029644us-gaap:UnsecuredDebtMemberdci:A2510YearNoteDue2031Member2022-07-310000029644us-gaap:UnsecuredDebtMemberdci:VariableRateCommittedRevolvingCreditFacilityDueMayTwentyFirstTwoThousandTwentySixMemberus-gaap:RevolvingCreditFacilityMember2023-07-310000029644us-gaap:UnsecuredDebtMemberdci:VariableRateCommittedRevolvingCreditFacilityDueMayTwentyFirstTwoThousandTwentySixMemberus-gaap:RevolvingCreditFacilityMember2022-07-310000029644us-gaap:UnsecuredDebtMemberdci:VariableRateCommittedUnsecuredTermLoanDueOctoberTwentyEightTwoThousandTwentyFourMember2023-07-310000029644us-gaap:UnsecuredDebtMemberdci:VariableRateCommittedUnsecuredTermLoanDueOctoberTwentyEightTwoThousandTwentyFourMember2022-07-310000029644us-gaap:UnsecuredDebtMemberdci:A2127YearNoteDue2028Member2023-07-310000029644us-gaap:UnsecuredDebtMemberdci:A2127YearNoteDue2028Member2022-07-310000029644us-gaap:UnsecuredDebtMemberdci:UnsecuredSeniorNotesFiveMember2023-07-310000029644us-gaap:UnsecuredDebtMemberdci:UnsecuredSeniorNotesFiveMember2022-07-310000029644us-gaap:UnsecuredDebtMemberdci:VariableRateGuaranteedSeniorNoteDueMayTwentyTwoThousandTwentyEightMember2023-07-31iso4217:JPY0000029644us-gaap:UnsecuredDebtMemberdci:VariableRateGuaranteedSeniorNoteDueMayTwentyTwoThousandTwentyEightMember2022-07-310000029644us-gaap:UnsecuredDebtMemberdci:VariableRateGuaranteedSeniorNoteDueJulyFifteenTwoThousandTwentySixMember2023-07-310000029644us-gaap:UnsecuredDebtMemberdci:VariableRateGuaranteedSeniorNoteDueJulyFifteenTwoThousandTwentySixMember2022-07-310000029644dci:VariableRateCommittedRevolvingCreditFacilityDueMayTwentyFirstTwoThousandTwentySixMemberus-gaap:RevolvingCreditFacilityMember2023-07-310000029644us-gaap:LineOfCreditMemberdci:MultiCurrencyRevolvingCreditFacilityMember2023-07-310000029644srt:MinimumMemberus-gaap:RevolvingCreditFacilityMember2022-08-012023-07-310000029644srt:MaximumMemberus-gaap:RevolvingCreditFacilityMember2022-08-012023-07-310000029644us-gaap:RevolvingCreditFacilityMember2023-07-310000029644srt:MinimumMemberdci:FederalTaxCreditsMember2022-08-012023-07-310000029644srt:MinimumMemberdci:ResearchAndDevelopmentCreditsMember2022-08-012023-07-310000029644dci:ResearchAndDevelopmentCreditsMembersrt:MaximumMember2022-08-012023-07-3100000296442023-07-282023-07-280000029644us-gaap:AccumulatedTranslationAdjustmentMember2022-07-310000029644us-gaap:AccumulatedDefinedBenefitPlansAdjustmentMember2022-07-310000029644us-gaap:AccumulatedGainLossNetCashFlowHedgeParentMember2022-07-310000029644us-gaap:AccumulatedTranslationAdjustmentMember2022-08-012023-07-310000029644us-gaap:AccumulatedDefinedBenefitPlansAdjustmentMember2022-08-012023-07-310000029644us-gaap:AccumulatedGainLossNetCashFlowHedgeParentMember2022-08-012023-07-310000029644us-gaap:AccumulatedTranslationAdjustmentMember2023-07-310000029644us-gaap:AccumulatedDefinedBenefitPlansAdjustmentMember2023-07-310000029644us-gaap:AccumulatedGainLossNetCashFlowHedgeParentMember2023-07-310000029644us-gaap:AccumulatedTranslationAdjustmentMember2021-07-310000029644us-gaap:AccumulatedDefinedBenefitPlansAdjustmentMember2021-07-310000029644us-gaap:AccumulatedGainLossNetCashFlowHedgeParentMember2021-07-310000029644us-gaap:AccumulatedTranslationAdjustmentMember2021-08-012022-07-310000029644us-gaap:AccumulatedDefinedBenefitPlansAdjustmentMember2021-08-012022-07-310000029644us-gaap:AccumulatedGainLossNetCashFlowHedgeParentMember2021-08-012022-07-310000029644us-gaap:AccumulatedDefinedBenefitPlansAdjustmentMemberus-gaap:ScenarioAdjustmentMember2022-08-012023-07-310000029644us-gaap:AccumulatedDefinedBenefitPlansAdjustmentMemberus-gaap:ScenarioAdjustmentMember2021-08-012022-07-310000029644us-gaap:ScenarioAdjustmentMemberdci:AccumulatedDefinedBenefitPlansAdjustmentForeignCurrencyTranslationAttributableToParentMember2022-08-012023-07-310000029644us-gaap:ScenarioAdjustmentMemberdci:AccumulatedDefinedBenefitPlansAdjustmentForeignCurrencyTranslationAttributableToParentMember2021-08-012022-07-310000029644us-gaap:ScenarioAdjustmentMemberdci:AccumulatedDefinedBenefitPlansAdjustmentNetPriorServiceCostAndActuarialLossesAttributableToParentMember2022-08-012023-07-310000029644us-gaap:ScenarioAdjustmentMemberdci:AccumulatedDefinedBenefitPlansAdjustmentNetPriorServiceCostAndActuarialLossesAttributableToParentMember2021-08-012022-07-310000029644dci:A2019MasterStockIncentivePlanMemberus-gaap:EmployeeStockOptionMember2022-08-012023-07-310000029644us-gaap:EmployeeStockOptionMember2022-08-012023-07-310000029644us-gaap:EmployeeStockOptionMember2021-08-012022-07-310000029644us-gaap:EmployeeStockOptionMember2020-08-012021-07-310000029644dci:DirectorGrantsMember2022-08-012023-07-310000029644dci:DirectorGrantsMember2021-08-012022-07-310000029644dci:DirectorGrantsMember2020-08-012021-07-310000029644dci:OfficerGrantsMember2022-08-012023-07-310000029644dci:OfficerGrantsMember2021-08-012022-07-310000029644dci:OfficerGrantsMember2020-08-012021-07-310000029644dci:NonOfficerGrantsMember2022-08-012023-07-310000029644dci:NonOfficerGrantsMember2021-08-012022-07-310000029644dci:NonOfficerGrantsMember2020-08-012021-07-310000029644us-gaap:EmployeeStockOptionMember2023-07-310000029644dci:RangeOneMember2022-08-012023-07-310000029644dci:RangeOneMember2023-07-310000029644dci:RangeTwoMember2022-08-012023-07-310000029644dci:RangeTwoMember2023-07-310000029644dci:RangeThreeMember2022-08-012023-07-310000029644dci:RangeThreeMember2023-07-310000029644dci:RangeFourMember2022-08-012023-07-310000029644dci:RangeFourMember2023-07-310000029644dci:RangeFiveMember2022-08-012023-07-310000029644dci:RangeFiveMember2023-07-310000029644dci:A2019MasterStockIncentivePlanMemberus-gaap:PerformanceSharesMember2022-08-012023-07-310000029644srt:MinimumMemberdci:A2019MasterStockIncentivePlanMemberus-gaap:PerformanceSharesMember2022-08-012023-07-310000029644srt:MaximumMemberdci:A2019MasterStockIncentivePlanMemberus-gaap:PerformanceSharesMember2022-08-012023-07-310000029644dci:A2019MasterStockIncentivePlanMemberus-gaap:PerformanceSharesMember2021-08-012022-07-310000029644dci:A2019MasterStockIncentivePlanMemberus-gaap:PerformanceSharesMember2020-08-012021-07-310000029644us-gaap:PerformanceSharesMember2022-08-012023-07-310000029644us-gaap:PerformanceSharesMember2021-08-012022-07-310000029644us-gaap:PerformanceSharesMember2020-08-012021-07-310000029644us-gaap:PerformanceSharesMember2022-07-310000029644us-gaap:PerformanceSharesMember2023-07-310000029644us-gaap:PensionPlansDefinedBenefitMember2022-07-310000029644us-gaap:PensionPlansDefinedBenefitMember2021-07-310000029644us-gaap:PensionPlansDefinedBenefitMember2022-08-012023-07-310000029644us-gaap:PensionPlansDefinedBenefitMember2021-08-012022-07-310000029644us-gaap:PensionPlansDefinedBenefitMember2023-07-310000029644us-gaap:PensionPlansDefinedBenefitMembercountry:US2023-07-310000029644us-gaap:PensionPlansDefinedBenefitMembercountry:US2022-07-310000029644us-gaap:PensionPlansDefinedBenefitMembercountry:US2022-08-012023-07-310000029644us-gaap:PensionPlansDefinedBenefitMembercountry:US2021-08-012022-07-310000029644us-gaap:PensionPlansDefinedBenefitMemberus-gaap:ForeignPlanMember2023-07-310000029644us-gaap:PensionPlansDefinedBenefitMemberus-gaap:ForeignPlanMember2022-07-310000029644us-gaap:PensionPlansDefinedBenefitMemberus-gaap:ForeignPlanMember2022-08-012023-07-310000029644us-gaap:PensionPlansDefinedBenefitMemberus-gaap:ForeignPlanMember2021-08-012022-07-310000029644us-gaap:PensionPlansDefinedBenefitMembercountry:US2020-08-012021-07-310000029644us-gaap:PensionPlansDefinedBenefitMemberus-gaap:ForeignPlanMember2020-08-012021-07-310000029644us-gaap:FixedIncomeSecuritiesMembersrt:MinimumMemberdci:IndependentInsuranceCompanyMemberus-gaap:FairValueInputsLevel3Memberus-gaap:PensionPlansDefinedBenefitMember2023-07-310000029644us-gaap:FixedIncomeSecuritiesMembersrt:MaximumMemberdci:IndependentInsuranceCompanyMemberus-gaap:FairValueInputsLevel3Memberus-gaap:PensionPlansDefinedBenefitMember2023-07-310000029644srt:MinimumMemberdci:IndependentInsuranceCompanyMemberus-gaap:FairValueInputsLevel3Memberus-gaap:PensionPlansDefinedBenefitMemberus-gaap:DefinedBenefitPlanEquitySecuritiesMember2023-07-310000029644srt:MaximumMemberdci:IndependentInsuranceCompanyMemberus-gaap:FairValueInputsLevel3Memberus-gaap:PensionPlansDefinedBenefitMemberus-gaap:DefinedBenefitPlanEquitySecuritiesMember2023-07-310000029644country:US2022-08-012023-07-310000029644us-gaap:FairValueInputsLevel1Memberus-gaap:PensionPlansDefinedBenefitMemberus-gaap:DefinedBenefitPlanCashAndCashEquivalentsMembercountry:US2023-07-310000029644us-gaap:FairValueInputsLevel2Memberus-gaap:PensionPlansDefinedBenefitMemberus-gaap:DefinedBenefitPlanCashAndCashEquivalentsMembercountry:US2023-07-310000029644us-gaap:FairValueInputsLevel3Memberus-gaap:PensionPlansDefinedBenefitMemberus-gaap:DefinedBenefitPlanCashAndCashEquivalentsMembercountry:US2023-07-310000029644us-gaap:PensionPlansDefinedBenefitMemberus-gaap:DefinedBenefitPlanCashAndCashEquivalentsMembercountry:US2023-07-310000029644us-gaap:FairValueInputsLevel1Memberus-gaap:PensionPlansDefinedBenefitMemberus-gaap:DefinedBenefitPlanEquitySecuritiesMembercountry:US2023-07-310000029644us-gaap:FairValueInputsLevel2Memberus-gaap:PensionPlansDefinedBenefitMemberus-gaap:DefinedBenefitPlanEquitySecuritiesMembercountry:US2023-07-310000029644us-gaap:FairValueInputsLevel3Memberus-gaap:PensionPlansDefinedBenefitMemberus-gaap:DefinedBenefitPlanEquitySecuritiesMembercountry:US2023-07-310000029644us-gaap:PensionPlansDefinedBenefitMemberus-gaap:DefinedBenefitPlanEquitySecuritiesMembercountry:US2023-07-310000029644us-gaap:FixedIncomeSecuritiesMemberus-gaap:FairValueInputsLevel1Memberus-gaap:PensionPlansDefinedBenefitMembercountry:US2023-07-310000029644us-gaap:FixedIncomeSecuritiesMemberus-gaap:FairValueInputsLevel2Memberus-gaap:PensionPlansDefinedBenefitMembercountry:US2023-07-310000029644us-gaap:FixedIncomeSecuritiesMemberus-gaap:FairValueInputsLevel3Memberus-gaap:PensionPlansDefinedBenefitMembercountry:US2023-07-310000029644us-gaap:FixedIncomeSecuritiesMemberus-gaap:PensionPlansDefinedBenefitMembercountry:US2023-07-310000029644us-gaap:FairValueInputsLevel1Memberus-gaap:PensionPlansDefinedBenefitMembercountry:USdci:DefinedBenefitPlanInsuranceContractsMember2023-07-310000029644us-gaap:FairValueInputsLevel2Memberus-gaap:PensionPlansDefinedBenefitMembercountry:USdci:DefinedBenefitPlanInsuranceContractsMember2023-07-310000029644us-gaap:FairValueInputsLevel3Memberus-gaap:PensionPlansDefinedBenefitMembercountry:USdci:DefinedBenefitPlanInsuranceContractsMember2023-07-310000029644us-gaap:PensionPlansDefinedBenefitMembercountry:USdci:DefinedBenefitPlanInsuranceContractsMember2023-07-310000029644us-gaap:FairValueInputsLevel1Memberus-gaap:PensionPlansDefinedBenefitMembercountry:US2023-07-310000029644us-gaap:FairValueInputsLevel2Memberus-gaap:PensionPlansDefinedBenefitMembercountry:US2023-07-310000029644us-gaap:FairValueInputsLevel3Memberus-gaap:PensionPlansDefinedBenefitMembercountry:US2023-07-310000029644us-gaap:FairValueMeasuredAtNetAssetValuePerShareMemberus-gaap:PensionPlansDefinedBenefitMembercountry:US2023-07-310000029644us-gaap:FairValueInputsLevel1Memberus-gaap:PensionPlansDefinedBenefitMemberus-gaap:DefinedBenefitPlanCashAndCashEquivalentsMembercountry:US2022-07-310000029644us-gaap:FairValueInputsLevel2Memberus-gaap:PensionPlansDefinedBenefitMemberus-gaap:DefinedBenefitPlanCashAndCashEquivalentsMembercountry:US2022-07-310000029644us-gaap:FairValueInputsLevel3Memberus-gaap:PensionPlansDefinedBenefitMemberus-gaap:DefinedBenefitPlanCashAndCashEquivalentsMembercountry:US2022-07-310000029644us-gaap:PensionPlansDefinedBenefitMemberus-gaap:DefinedBenefitPlanCashAndCashEquivalentsMembercountry:US2022-07-310000029644us-gaap:FairValueInputsLevel1Memberus-gaap:PensionPlansDefinedBenefitMemberus-gaap:DefinedBenefitPlanEquitySecuritiesMembercountry:US2022-07-310000029644us-gaap:FairValueInputsLevel2Memberus-gaap:PensionPlansDefinedBenefitMemberus-gaap:DefinedBenefitPlanEquitySecuritiesMembercountry:US2022-07-310000029644us-gaap:FairValueInputsLevel3Memberus-gaap:PensionPlansDefinedBenefitMemberus-gaap:DefinedBenefitPlanEquitySecuritiesMembercountry:US2022-07-310000029644us-gaap:PensionPlansDefinedBenefitMemberus-gaap:DefinedBenefitPlanEquitySecuritiesMembercountry:US2022-07-310000029644us-gaap:FixedIncomeSecuritiesMemberus-gaap:FairValueInputsLevel1Memberus-gaap:PensionPlansDefinedBenefitMembercountry:US2022-07-310000029644us-gaap:FixedIncomeSecuritiesMemberus-gaap:FairValueInputsLevel2Memberus-gaap:PensionPlansDefinedBenefitMembercountry:US2022-07-310000029644us-gaap:FixedIncomeSecuritiesMemberus-gaap:FairValueInputsLevel3Memberus-gaap:PensionPlansDefinedBenefitMembercountry:US2022-07-310000029644us-gaap:FixedIncomeSecuritiesMemberus-gaap:PensionPlansDefinedBenefitMembercountry:US2022-07-310000029644us-gaap:FairValueInputsLevel1Memberus-gaap:PensionPlansDefinedBenefitMembercountry:USdci:DefinedBenefitPlanInsuranceContractsMember2022-07-310000029644us-gaap:FairValueInputsLevel2Memberus-gaap:PensionPlansDefinedBenefitMembercountry:USdci:DefinedBenefitPlanInsuranceContractsMember2022-07-310000029644us-gaap:FairValueInputsLevel3Memberus-gaap:PensionPlansDefinedBenefitMembercountry:USdci:DefinedBenefitPlanInsuranceContractsMember2022-07-310000029644us-gaap:PensionPlansDefinedBenefitMembercountry:USdci:DefinedBenefitPlanInsuranceContractsMember2022-07-310000029644us-gaap:FairValueInputsLevel1Memberus-gaap:PensionPlansDefinedBenefitMembercountry:US2022-07-310000029644us-gaap:FairValueInputsLevel2Memberus-gaap:PensionPlansDefinedBenefitMembercountry:US2022-07-310000029644us-gaap:FairValueInputsLevel3Memberus-gaap:PensionPlansDefinedBenefitMembercountry:US2022-07-310000029644us-gaap:FairValueMeasuredAtNetAssetValuePerShareMemberus-gaap:PensionPlansDefinedBenefitMembercountry:US2022-07-310000029644us-gaap:FairValueMeasuredAtNetAssetValuePerShareMemberus-gaap:PensionPlansDefinedBenefitMemberus-gaap:DefinedBenefitPlanEquitySecuritiesMembercountry:US2023-07-310000029644us-gaap:FairValueMeasuredAtNetAssetValuePerShareMemberus-gaap:PensionPlansDefinedBenefitMemberus-gaap:DefinedBenefitPlanEquitySecuritiesMembercountry:US2022-07-310000029644srt:MinimumMemberus-gaap:PensionPlansDefinedBenefitMemberus-gaap:DefinedBenefitPlanEquitySecuritiesMembercountry:US2022-08-012023-07-310000029644srt:MaximumMemberus-gaap:PensionPlansDefinedBenefitMemberus-gaap:DefinedBenefitPlanEquitySecuritiesMembercountry:US2022-08-012023-07-310000029644us-gaap:FixedIncomeSecuritiesMemberus-gaap:FairValueMeasuredAtNetAssetValuePerShareMemberus-gaap:PensionPlansDefinedBenefitMembercountry:US2023-07-310000029644us-gaap:FixedIncomeSecuritiesMemberus-gaap:FairValueMeasuredAtNetAssetValuePerShareMemberus-gaap:PensionPlansDefinedBenefitMembercountry:US2022-07-310000029644us-gaap:FixedIncomeSecuritiesMembersrt:MinimumMemberus-gaap:PensionPlansDefinedBenefitMembercountry:US2022-08-012023-07-310000029644us-gaap:FixedIncomeSecuritiesMembersrt:MaximumMemberus-gaap:PensionPlansDefinedBenefitMembercountry:US2022-08-012023-07-310000029644us-gaap:DefinedBenefitPlanRealEstateMemberus-gaap:FairValueMeasuredAtNetAssetValuePerShareMemberus-gaap:PensionPlansDefinedBenefitMembercountry:US2023-07-310000029644us-gaap:DefinedBenefitPlanRealEstateMemberus-gaap:PensionPlansDefinedBenefitMembercountry:US2023-07-310000029644us-gaap:DefinedBenefitPlanRealEstateMemberus-gaap:FairValueMeasuredAtNetAssetValuePerShareMemberus-gaap:PensionPlansDefinedBenefitMembercountry:US2022-07-310000029644us-gaap:DefinedBenefitPlanRealEstateMemberus-gaap:PensionPlansDefinedBenefitMembercountry:US2022-07-310000029644us-gaap:ForeignPlanMember2022-08-012023-07-310000029644us-gaap:FairValueInputsLevel3Memberus-gaap:PensionPlansDefinedBenefitMember2022-07-310000029644us-gaap:FairValueInputsLevel3Memberus-gaap:PensionPlansDefinedBenefitMember2021-07-310000029644us-gaap:FairValueInputsLevel3Memberus-gaap:PensionPlansDefinedBenefitMember2020-07-310000029644us-gaap:FairValueInputsLevel3Memberus-gaap:PensionPlansDefinedBenefitMember2022-08-012023-07-310000029644us-gaap:FairValueInputsLevel3Memberus-gaap:PensionPlansDefinedBenefitMember2021-08-012022-07-310000029644us-gaap:FairValueInputsLevel3Memberus-gaap:PensionPlansDefinedBenefitMember2020-08-012021-07-310000029644us-gaap:FairValueInputsLevel3Memberus-gaap:PensionPlansDefinedBenefitMember2023-07-310000029644us-gaap:PensionPlansDefinedBenefitMemberus-gaap:DefinedBenefitPlanEquitySecuritiesMemberdci:SalariedPensionPlanMember2023-07-310000029644dci:HourlyPensionPlanMemberus-gaap:PensionPlansDefinedBenefitMemberus-gaap:DefinedBenefitPlanEquitySecuritiesMember2023-07-310000029644us-gaap:FixedIncomeSecuritiesMemberus-gaap:PensionPlansDefinedBenefitMemberdci:SalariedPensionPlanMember2023-07-310000029644us-gaap:FixedIncomeSecuritiesMemberdci:HourlyPensionPlanMemberus-gaap:PensionPlansDefinedBenefitMember2023-07-310000029644us-gaap:DefinedBenefitPlanRealEstateMemberus-gaap:PensionPlansDefinedBenefitMemberdci:SalariedPensionPlanMember2023-07-310000029644us-gaap:DefinedBenefitPlanRealEstateMemberdci:HourlyPensionPlanMemberus-gaap:PensionPlansDefinedBenefitMember2023-07-310000029644us-gaap:PensionPlansDefinedBenefitMemberdci:SalariedPensionPlanMemberus-gaap:DefinedBenefitPlanCashAndCashEquivalentsMember2023-07-310000029644dci:HourlyPensionPlanMemberus-gaap:PensionPlansDefinedBenefitMemberus-gaap:DefinedBenefitPlanCashAndCashEquivalentsMember2023-07-310000029644us-gaap:PensionPlansDefinedBenefitMemberdci:SalariedPensionPlanMember2023-07-310000029644dci:HourlyPensionPlanMemberus-gaap:PensionPlansDefinedBenefitMember2023-07-310000029644dci:RetirementSavingsAndEmployeeStockOwnershipPlanMembercountry:US2022-08-012023-07-310000029644dci:RetirementSavingsAndEmployeeStockOwnershipPlanMembercountry:US2021-08-012022-07-310000029644dci:RetirementSavingsAndEmployeeStockOwnershipPlanMembercountry:US2020-08-012021-07-310000029644us-gaap:FairValueInputsLevel2Memberus-gaap:ForeignExchangeForwardMemberus-gaap:DesignatedAsHedgingInstrumentMember2023-07-310000029644us-gaap:FairValueInputsLevel2Memberus-gaap:ForeignExchangeForwardMemberus-gaap:DesignatedAsHedgingInstrumentMember2022-07-310000029644us-gaap:NondesignatedMemberus-gaap:FairValueInputsLevel2Memberus-gaap:ForeignExchangeForwardMember2023-07-310000029644us-gaap:NondesignatedMemberus-gaap:FairValueInputsLevel2Memberus-gaap:ForeignExchangeForwardMember2022-07-310000029644us-gaap:NetInvestmentHedgingMemberus-gaap:FairValueInputsLevel2Memberus-gaap:DesignatedAsHedgingInstrumentMember2023-07-310000029644us-gaap:InterestRateSwapMemberus-gaap:CashFlowHedgingMemberus-gaap:DesignatedAsHedgingInstrumentMember2021-07-310000029644dci:InterestRateSwapIIMemberus-gaap:CashFlowHedgingMemberus-gaap:DesignatedAsHedgingInstrumentMember2021-07-310000029644us-gaap:CashFlowHedgingMemberus-gaap:DesignatedAsHedgingInstrumentMember2020-08-012021-07-310000029644us-gaap:CashFlowHedgingMemberus-gaap:DesignatedAsHedgingInstrumentMember2023-07-31dci:derivative0000029644us-gaap:CashFlowHedgingMemberus-gaap:DesignatedAsHedgingInstrumentMember2022-07-310000029644us-gaap:EstimateOfFairValueFairValueDisclosureMemberus-gaap:FairValueInputsLevel2Memberdci:LongTermDebtFixedInterestRateMember2023-07-310000029644us-gaap:FairValueInputsLevel2Memberus-gaap:CarryingReportedAmountFairValueDisclosureMemberdci:LongTermDebtFixedInterestRateMember2023-07-310000029644us-gaap:EstimateOfFairValueFairValueDisclosureMemberus-gaap:FairValueInputsLevel2Memberdci:LongTermDebtFixedInterestRateMember2022-07-310000029644us-gaap:FairValueInputsLevel2Memberus-gaap:CarryingReportedAmountFairValueDisclosureMemberdci:LongTermDebtFixedInterestRateMember2022-07-310000029644us-gaap:EstimateOfFairValueFairValueDisclosureMemberus-gaap:FairValueInputsLevel2Memberdci:LongTermDebtVariableInterestRateMember2023-07-310000029644us-gaap:FairValueInputsLevel2Memberus-gaap:CarryingReportedAmountFairValueDisclosureMemberdci:LongTermDebtVariableInterestRateMember2023-07-310000029644us-gaap:FairValueInputsLevel2Memberus-gaap:CarryingReportedAmountFairValueDisclosureMemberdci:LongTermDebtVariableInterestRateMember2022-07-310000029644us-gaap:EstimateOfFairValueFairValueDisclosureMemberus-gaap:FairValueInputsLevel2Memberdci:LongTermDebtVariableInterestRateMember2022-07-310000029644us-gaap:FairValueInputsLevel3Member2023-07-310000029644us-gaap:FairValueInputsLevel3Member2022-07-310000029644us-gaap:NetInvestmentHedgingMemberus-gaap:FairValueInputsLevel2Memberus-gaap:DesignatedAsHedgingInstrumentMember2022-07-310000029644us-gaap:FairValueInputsLevel2Memberus-gaap:DesignatedAsHedgingInstrumentMember2023-07-310000029644us-gaap:FairValueInputsLevel2Memberus-gaap:DesignatedAsHedgingInstrumentMember2022-07-310000029644us-gaap:NondesignatedMemberus-gaap:FairValueInputsLevel2Member2023-07-310000029644us-gaap:NondesignatedMemberus-gaap:FairValueInputsLevel2Member2022-07-310000029644us-gaap:FairValueInputsLevel2Member2023-07-310000029644us-gaap:FairValueInputsLevel2Member2022-07-310000029644dci:AdvancedFiltrationSystemsIncMember2023-07-310000029644dci:AdvancedFiltrationSystemsIncMember2022-07-310000029644dci:MultiCurrencyRevolvingCreditFacilityMember2023-07-310000029644dci:AdvancedFiltrationSystemsIncMember2022-08-012023-07-310000029644dci:AdvancedFiltrationSystemsIncMember2021-08-012022-07-3100000296442022-11-012022-11-01dci:segment0000029644us-gaap:OperatingSegmentsMemberdci:EngineProductsSegmentMember2022-08-012023-07-310000029644us-gaap:OperatingSegmentsMemberdci:IndustrialProductsSegmentMember2022-08-012023-07-310000029644us-gaap:OperatingSegmentsMemberdci:LifeSciencesSegmentMember2022-08-012023-07-310000029644dci:CorporateAndReconcilingItemsMember2022-08-012023-07-310000029644us-gaap:OperatingSegmentsMemberdci:EngineProductsSegmentMember2023-07-310000029644us-gaap:OperatingSegmentsMemberdci:IndustrialProductsSegmentMember2023-07-310000029644us-gaap:OperatingSegmentsMemberdci:LifeSciencesSegmentMember2023-07-310000029644dci:CorporateAndReconcilingItemsMember2023-07-310000029644us-gaap:OperatingSegmentsMemberdci:EngineProductsSegmentMember2021-08-012022-07-310000029644us-gaap:OperatingSegmentsMemberdci:IndustrialProductsSegmentMember2021-08-012022-07-310000029644us-gaap:OperatingSegmentsMemberdci:LifeSciencesSegmentMember2021-08-012022-07-310000029644dci:CorporateAndReconcilingItemsMember2021-08-012022-07-310000029644us-gaap:OperatingSegmentsMemberdci:EngineProductsSegmentMember2022-07-310000029644us-gaap:OperatingSegmentsMemberdci:IndustrialProductsSegmentMember2022-07-310000029644us-gaap:OperatingSegmentsMemberdci:LifeSciencesSegmentMember2022-07-310000029644dci:CorporateAndReconcilingItemsMember2022-07-310000029644us-gaap:OperatingSegmentsMemberdci:EngineProductsSegmentMember2020-08-012021-07-310000029644us-gaap:OperatingSegmentsMemberdci:IndustrialProductsSegmentMember2020-08-012021-07-310000029644us-gaap:OperatingSegmentsMemberdci:LifeSciencesSegmentMember2020-08-012021-07-310000029644dci:CorporateAndReconcilingItemsMember2020-08-012021-07-310000029644us-gaap:OperatingSegmentsMemberdci:EngineProductsSegmentMember2021-07-310000029644us-gaap:OperatingSegmentsMemberdci:IndustrialProductsSegmentMember2021-07-310000029644us-gaap:OperatingSegmentsMemberdci:LifeSciencesSegmentMember2021-07-310000029644dci:CorporateAndReconcilingItemsMember2021-07-310000029644us-gaap:OperatingSegmentsMemberdci:EngineProductsSegmentMemberdci:OffRoadProductsMember2022-08-012023-07-310000029644us-gaap:OperatingSegmentsMemberdci:EngineProductsSegmentMemberdci:OffRoadProductsMember2021-08-012022-07-310000029644us-gaap:OperatingSegmentsMemberdci:EngineProductsSegmentMemberdci:OffRoadProductsMember2020-08-012021-07-310000029644us-gaap:OperatingSegmentsMemberdci:EngineProductsSegmentMemberdci:OnRoadProductsMember2022-08-012023-07-310000029644us-gaap:OperatingSegmentsMemberdci:EngineProductsSegmentMemberdci:OnRoadProductsMember2021-08-012022-07-310000029644us-gaap:OperatingSegmentsMemberdci:EngineProductsSegmentMemberdci:OnRoadProductsMember2020-08-012021-07-310000029644us-gaap:OperatingSegmentsMemberdci:EngineProductsSegmentMemberdci:AftermarketProductsMember2022-08-012023-07-310000029644us-gaap:OperatingSegmentsMemberdci:EngineProductsSegmentMemberdci:AftermarketProductsMember2021-08-012022-07-310000029644us-gaap:OperatingSegmentsMemberdci:EngineProductsSegmentMemberdci:AftermarketProductsMember2020-08-012021-07-310000029644us-gaap:OperatingSegmentsMemberdci:IndustrialFiltrationSolutionsProductsMemberdci:IndustrialProductsSegmentMember2022-08-012023-07-310000029644us-gaap:OperatingSegmentsMemberdci:IndustrialFiltrationSolutionsProductsMemberdci:IndustrialProductsSegmentMember2021-08-012022-07-310000029644us-gaap:OperatingSegmentsMemberdci:IndustrialFiltrationSolutionsProductsMemberdci:IndustrialProductsSegmentMember2020-08-012021-07-310000029644us-gaap:OperatingSegmentsMemberdci:GasTurbineProductsMemberdci:IndustrialProductsSegmentMember2022-08-012023-07-310000029644us-gaap:OperatingSegmentsMemberdci:GasTurbineProductsMemberdci:IndustrialProductsSegmentMember2021-08-012022-07-310000029644us-gaap:OperatingSegmentsMemberdci:GasTurbineProductsMemberdci:IndustrialProductsSegmentMember2020-08-012021-07-310000029644dci:UnitedStatesAndCanadaMember2023-07-310000029644us-gaap:EMEAMember2023-07-310000029644srt:AsiaPacificMember2023-07-310000029644srt:LatinAmericaMember2023-07-310000029644dci:UnitedStatesAndCanadaMember2022-07-310000029644us-gaap:EMEAMember2022-07-310000029644srt:AsiaPacificMember2022-07-310000029644srt:LatinAmericaMember2022-07-310000029644dci:UnitedStatesAndCanadaMember2021-07-310000029644us-gaap:EMEAMember2021-07-310000029644srt:AsiaPacificMember2021-07-310000029644srt:LatinAmericaMember2021-07-310000029644dci:LowerMarginCustomerProgramsMember2022-08-012023-07-310000029644us-gaap:CostOfSalesMember2021-08-012022-07-310000029644us-gaap:OperatingExpenseMember2022-08-012023-07-310000029644us-gaap:EmployeeSeveranceMember2020-11-012021-01-310000029644us-gaap:CostOfSalesMember2020-08-012021-07-310000029644us-gaap:OperatingExpenseMember2020-08-012021-07-3100000296442023-05-012023-07-31
UNITED STATES
SECURITIES AND EXCHANGE COMMISSION
Washington, D.C. 20549
Form 10-K
|
|
|
|
|
|
| ☒ |
Annual Report Pursuant to Section 13 or 15(d) of the Securities Exchange Act of 1934 for the fiscal year ended July 31, 2023 or |
| ☐ |
Transition Report Pursuant to Section 13 or 15(d) of the Securities Exchange Act of 1934 for the transition period from __________ to __________ |
Commission File Number: 1-7891
DONALDSON COMPANY, INC.
(Exact name of registrant as specified in its charter)
|
|
|
|
|
|
| Delaware |
41-0222640 |
(State or other jurisdiction of
incorporation or organization) |
(I.R.S. Employer
Identification No.) |
|
|
|
|
|
|
1400 West 94th Street, Minneapolis, Minnesota 55431
(Address of principal executive offices) (Zip Code)
Registrant’s telephone number, including area code: (952) 887-3131
Securities registered pursuant to Section 12(b) of the Act:
|
|
|
|
|
|
|
|
|
| Title of each class |
Trading Symbol(s) |
Name of each exchange on which registered |
| Common Stock, $5.00 par value |
DCI |
New York Stock Exchange |
Securities registered pursuant to Section 12(g) of the Act: NONE
Indicate by check mark if the registrant is a well-known seasoned issuer, as defined in Rule 405 of the Securities Act. ☒ Yes ☐ No
Indicate by check mark if the registrant is not required to file reports pursuant to Section 13 or Section 15(d) of the Act. ☐ Yes ☒ No
Indicate by check mark whether the registrant (1) has filed all reports required to be filed by Section 13 or 15(d) of the Securities Exchange Act of 1934 during the preceding 12 months (or for such shorter period that the registrant was required to file such reports), and (2) has been subject to such filing requirements for the past 90 days. ☒ Yes ☐ No
Indicate by check mark whether the registrant has submitted electronically every Interactive Data File required to be submitted pursuant to Rule 405 of Regulation S-T during the preceding 12 months (or for such shorter period that the registrant was required to submit such files). ☒ Yes ☐ No
Indicate by check mark whether the registrant is a large accelerated filer, an accelerated filer, a non-accelerated filer, a smaller reporting company, or an emerging growth company. See the definitions of “large accelerated filer,” “accelerated filer,” “smaller reporting company,” and “emerging growth company” in Rule 12b-2 of the Exchange Act.
|
|
|
|
|
|
|
|
|
|
|
|
|
|
|
| |
Large accelerated filer |
☒ |
Accelerated filer |
☐ |
|
|
|
|
|
| |
Non-accelerated filer |
☐ |
Smaller reporting company |
☐ |
|
|
|
|
|
|
Emerging growth company |
☐ |
|
|
If an emerging growth company, indicate by check mark if the registrant has elected not to use the extended transition period for complying with any new or revised financial accounting standards provided pursuant to Section 13(a) of the Exchange Act. o
Indicate by check mark whether the registrant has filed a report on and attestation to its management’s assessment of the effectiveness of its internal control over financial reporting under Section 404(b) of the Sarbanes-Oxley Act (15 U.S.C. 7262(b)) by the registered public accounting firm that prepared or issued its audit report. ☒
If securities are registered pursuant to Section 12(b) of the Act, indicate by check mark whether the financial statements of the registrant included in the filing reflect the correction of an error to previously issued financial statements. o
Indicate by check mark whether any of those error corrections are restatements that required a recovery analysis of incentive-based compensation received by any of the registrant’s executive officers during the relevant recovery period pursuant to §240.10D-1(b). o
Indicate by check mark whether the registrant is a shell company (as defined in Rule 12b-2 of the Act). ☐ Yes ☒ No
As of January 31, 2023, the last business day of the registrant’s most recently completed second fiscal quarter, the aggregate market value of voting and non-voting common stock held by non-affiliates of the registrant was $7,523,208,549 (based on the closing price of $62.35 as reported on the New York Stock Exchange as of that date).
As of September 8, 2023, 121,242,187 shares of the registrant’s common stock, par value $5.00 per share, were outstanding.
Documents Incorporated by Reference
Portions of the registrant’s Proxy Statement for its 2023 annual meeting of stockholders (the “2023 Proxy Statement”) are incorporated by reference in Part III, as specifically set forth in Part III.
DONALDSON COMPANY, INC.
ANNUAL REPORT ON FORM 10-K
PART I
Item 1. Business
The Company
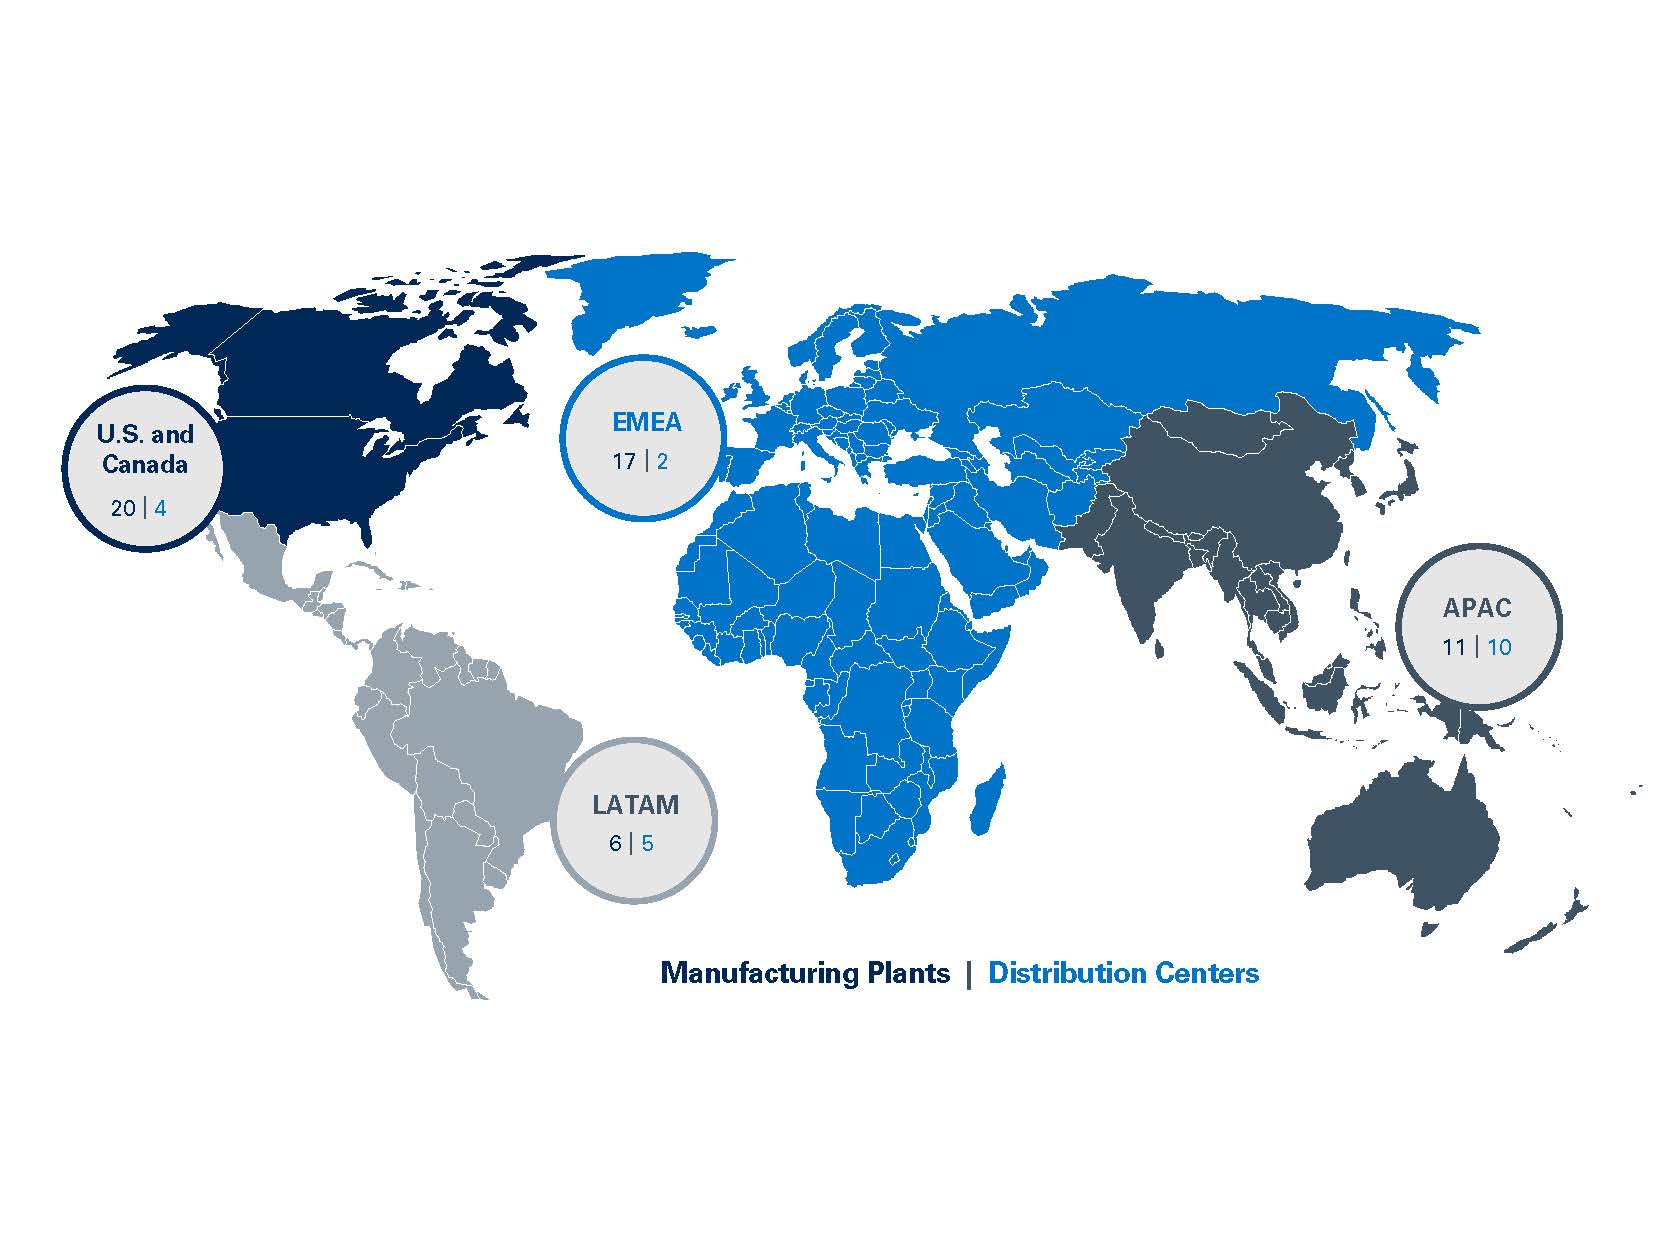
Founded in 1915, Donaldson Company, Inc. (the Company or Donaldson) is a global leader in technology-led filtration products and solutions, serving a broad range of industries and advanced markets. Donaldson’s diverse skilled employees at over 150 locations, 75 of which are manufacturing and/or distribution centers, on six continents partner with customers — from small business owners to the world’s largest original equipment manufacturer (OEM) brands — to solve complex filtration challenges. Customers choose Donaldson’s filtration solutions due to their stringent performance requirements and need for reliability.
Donaldson’s four regions and their contributing share of fiscal year 2023 revenue are as follows: the U.S. and Canada 42.7%; Europe, Middle East and Africa (EMEA) 29.4%; Asia Pacific (APAC) 17.7%; and Latin America (LATAM) 10.2%. Below are the Company’s manufacturing and distribution centers by region.
Strategic Priorities
The company has three primary strategic priorities to drive profitable growth. Below are each of the priorities and areas of focus related to each priority.
Extend Market Access - Grow Addressable Market by Extending Presence Across Adjacencies
•Significantly grow presence in bioprocessing via acquisitions with newly created stand-alone Life Sciences segment
•Strengthen position across alternative power solutions through increased focus and introduction of innovative and differentiated products
Expand Technologies and Solutions - Leverage Foundational Filtration Capabilities to Expand Best-in-class Technology and Service Offerings
•Expand Industrial Solutions connected service offerings while transitioning from a subscription model to a service model to gain additional aftermarket share
•Broaden battery vent offering to capture growing electronic vehicle (EV) opportunities
•Enhance digital experience through stronger data integration and navigation capabilities
Pursue Strategic Acquisitions - Accelerate Long-term Growth Through Strategic Acquisitions in High-margin Areas
•Strengthen presence in bioprocessing with disruptive technologies
•Penetrate underserved markets and expand service offerings
Reportable Segments
The Company’s reportable segments are Mobile Solutions, Industrial Solutions and Life Sciences.
The Mobile Solutions segment represents 63.4% of net sales, is organized based on a combination of customers and products and consists of the Off-Road, On-Road and Aftermarket business units. Within these business units, products consist of replacement filters for both air and liquid filtration applications and filtration housings for new equipment production and systems related to exhaust and emissions. Applications include air filtration systems, fuel, lube and hydraulic systems, emissions systems and sensors, indicators and monitoring systems. Mobile Solutions sells to original equipment manufacturers (OEMs) in the construction, mining, agriculture and transportation end markets and to independent distributors and OEM dealer networks.
The Industrial Solutions segment represents 29.6% of net sales, is organized based on product type and consists of the Industrial Air Filtration, Industrial Gasses, Industrial Hydraulics, Power Generation and Aerospace and Defense business units. Within our industrial portfolio, Donaldson provides the widest product offering in the market to industrial customers consisting of equipment, ancillary components, replacement parts, performance monitoring and service globally, that cost-effectively enhances productivity and manufacturing efficiency. Industrial Air Filtration, Industrial Gasses and Industrial Hydraulics products consist of dust, fume and mist collectors, compressed air and industrial gasses purification systems, hydraulic and lubricated rotating filtration applications as well as gas and liquid filtration for industrial processes. Power Generation products consist of air inlet systems and filtration sold to gas compression, power generation and natural gas liquification industries. Aerospace and Defense products consist of air, fuel, lubrication and hydraulic filtration for fixed-wing and rotorcraft aerospace applications and ground defense vehicle and naval platforms. Industrial Solutions businesses sell through multiple channels which include OEMs, distributors and direct-to-consumer in some markets.
The Life Sciences segment represents 7.0% of net sales and is organized by end market, including the Bioprocessing, Food and Beverage, Medical Device, Vehicle Electrification, Microelectronics and Disk Drive business units. Our products include gas and liquid filtration, bioprocessing equipment (including bioreactors, fermenters and filtration skids), bioprocessing consumables, (including membrane chromatography devices, reagents and filters) and specialized air and gas filtration systems for hard disk drive, semiconductor and electric vehicle applications. Life Sciences primarily sells to large OEMs and directly to various end users requiring cell growth, separation, purification, high purity filtration and device protection.
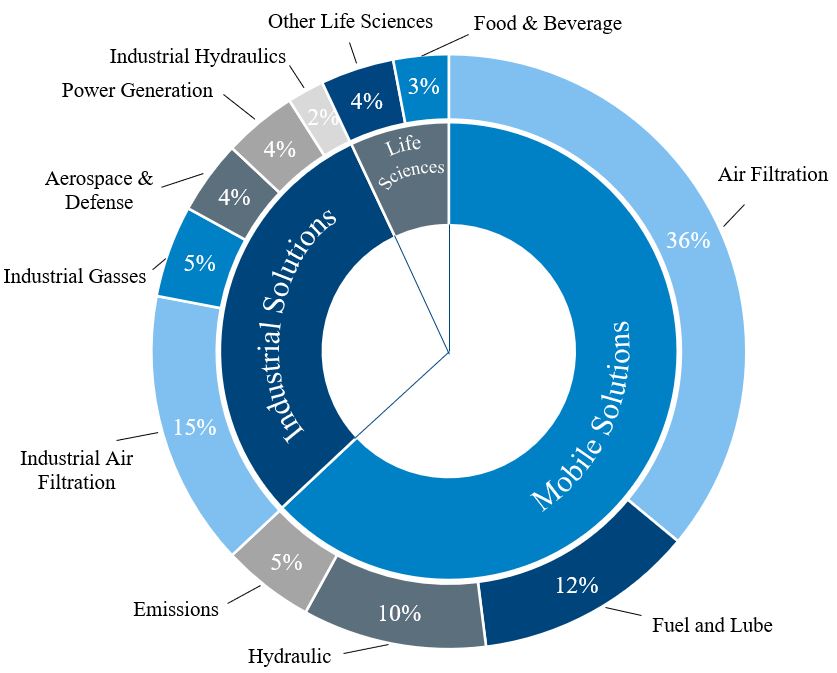
Diverse Product Groups
The Company sells a diverse group of products within each segment and the business units within the segments. Below are the diverse product groups across the Company’s three segments represented as a percentage of total fiscal 2023 net sales.
Mobile Solutions
Air Filtration
Air filtration systems are vital for safeguarding engine components against abrasive wear caused by dust particles. These systems play a pivotal role in supporting agricultural, construction and mining machinery, as well as commercial vehicles. Donaldson's air filtration solutions are globally renowned, featuring the standard in pleated cellulose filters. The company also offers advanced air filtration technologies, including PowerCore® and Ultra-Web®. PowerCore® filtration technology surpasses standard pleated cellulose filters in efficiency and compactness, making it the preferred choice for OEMs’ engines and equipment. Ultra-Web® media technology delivers robust filtration in the harshest environments, such as high-temperature and humid conditions frequently encountered by diesel, turbine, hybrid and other powered engines. Our Ultra-Web® HD media technology further enhances our fine fiber performance by ensuring consistent inter-fiber spacing at a microscopic level. This makes it ideal for extreme fine dust environments, commonly found in mining and high soot industries.
Fuel and Lube
Fuel and lube systems achieve optimal operations when contaminants are removed. The various components of the engine impacted include fuel injectors, valves, pumps, bearings and actuators. Fuel filters include primary and secondary particulate filters, coalescing fuel water separators, barrier fuel water separators and all-in-one filtration systems. The Company’s technology includes Synteq®™ XP filtration technology, which offers significantly higher fuel system protection and longer life under dynamic application conditions compared to commercially available alternatives. In addition, Donaldson’s Synteq® DRY and Synteq® XP coalescing technologies remove significantly more water in real-world conditions than current barrier or coalescing filters on the market. Fuel and lube filtration supports agricultural, construction and mining machinery and commercial vehicles.
Hydraulic
Hydraulic products provide filtration solutions typically for the same equipment that is filtered by fuel and lube systems. Applications include a suction strainer to protect the pump, high pressure filters, a charge pump or transmission filter, a return-line filter prior to the reservoir and a breather filter located on the reservoir.
The Duramax® filter, the Company’s primary mobile hydraulics filter, is renowned for its achievement of higher pressure in a spin-on configuration, allowing it to be designed on systems where other more costly, harder-to-service options were previously used. The Duramax® filter is combined with Synteq®™ XP media, a synthetic option for high performance. Hydraulics Systems supports agricultural, construction and mining machinery and transportation markets.
Emissions
Emissions products include sound-reducing mufflers used on machinery and vehicles, diesel-powered machinery and commercial vehicles. Emission control systems include diesel particulate filters, exhaust fluid mixers and catalytic reduction substrates to reduce emissions of particulate matter, nitrogen oxides and other greenhouse gases. Emissions products support agricultural, construction and mining machinery industries, as well as transportation markets.
Industrial Solutions
Industrial Air Filtration
Industrial air filtration equipment collects particles through an innovative bag house, or a cartridge style collector, which provides higher air-to-media capacity. Customers are supported through a global network of channel partners and service centers, which provide a quality customer experience during the design, installation, use, maintenance and repair of the equipment. Technology and features are continually added, such as the Internet-of-Things technology branded as iCue™, which is being integrated into product design to further improve product performance and better connect Donaldson with its end market customers, enabling additional service opportunities. Donaldson expanded its presence in the industrial service market with its acquisition in 2022 of Pearson Arnold Industrial Services (PAIS) headquartered in the U.S. PAIS provides equipment, parts and services for dust, mist and fume collection systems, industrial fans and compressed air systems.
Industrial dust, fume and mist collectors and filters are used within major industries including metals, mining, transportation, chemicals, food and beverage, pharmaceuticals and construction materials. For example, materials transformed in manufacturing, such as metal grinding, plasma cutting, mixing and welding, can create air contamination that can inhibit the production environment, which can be collected and filtered by Donaldson’s products.
Industrial Gasses
Industrial gasses provides solutions for challenging industrial gas purification objectives with premium filtration, drying and purification products. This includes delivering dust and particle collectors for air compressors at the inlet and output of air compressors and lube, fuel and air/oil separators used in a manufacturing environment.
Major product categories include dryers, compressed air, gasses and steam. Filtration involved in liquids, sterile and condensation management are part of the portfolio as well. Industrial gasses products are used within major industries including metals, mining, transportation, chemicals and construction materials.
Industrial Hydraulics
Industrial hydraulics helps to solve customers’ toughest contamination challenges with premium filtration products for hydraulics and lubrication. Hydraulic oil is adversely affected by contaminants such as wear metals, particulate, water and oxidation by-products. Contaminated fluid reduces performance and shortens lives of various system components including valves, pumps, bearings and actuators. Industrial hydraulic applications include steel mills, paper mills, refineries, oil and gas exploration, plastic molding, general manufacturing and power generation. Industrial hydraulics also supports the OEM fluid power and lubrication systems that support those industries.
Power Generation
Power generation provides leading OEMs air inlet equipment systems that deliver filtration and air handling performance. Power Generation filtration components are custom-engineered air intake systems for gas turbines and industrial compressors, for both new and retrofit applications. Aftermarket filters and parts are used in a variety of applications including cartridge filters, panel and compact filters, pulse systems, inlet hood components, filter retention hardware and accessories. Power Generation filtration components are in power plants, oil and gas delivery systems, other industrial applications and refining and processing machinery.
Aerospace and Defense
Aerospace and defense products are specifically designed to protect critical systems from contamination to ensure proper and efficient operation. The filtration portfolio includes engine intake, cabin air, avionics air, fuel, lubrication and hydraulics. Applications are found on fixed wing aircraft, helicopters, ground defense vehicles, weapons systems and naval vessels.
Life Sciences
Food and Beverage
Donaldson’s food and beverage business provides filtration solutions that enable process and product integrity for food and beverage manufacturing and support development of sustainable foods. Key products and applications include sterile liquid, air and steam filtration, compressed air dryers, bioreactors and fermenters and tangential and direct flow filtration.
Other Life Sciences
Bioprocessing Equipment and Consumables
Donaldson’s bioprocessing business provides equipment and consumables to support the development and production of biologic drugs and genetic medicines, including mAbs mRNA and cell and gene therapies, along with many other applications that use a bioprocessing workflow.
In fiscal year 2023, Donaldson acquired Isolere Bio, Inc. (Isolere), headquartered in Durham, North Carolina and Univercells Technologies (UTEC), headquartered in Nivelles, Belgium.
•Isolere is an early-stage biotechnology company that has developed novel and proprietary IsoTag™ reagents used for the purification and streamlined manufacturing of biopharmaceuticals. Aimed initially at the purification of viral vectors used for cell and gene therapies, IsoTag™ reagents are designed to substantially improve product quality and purity with faster timelines compared to competing solutions.
•UTEC is a global producer of innovative biomanufacturing solutions for cell and gene therapy research, development and commercial manufacturing. UTEC’s product offering includes the unique scale-X™ single-use structured fixed-bed bioreactor for the intensified production of viruses used in cell and gene therapy, viral vaccines and other therapeutics. In addition, UTEC’s automated NevoLine™ Upstream platform incorporates industry-standard filtration to provide integrated up-and mid-stream processing capabilities in a single unit, driving productivity improvements, a reduction in operational footprints and greater consistency of results.
During fiscal year 2022, the Company acquired Solaris Biotechnology S.r.l. (Solaris), headquartered in Porto Mantovano, Italy and Purlogics LLC (Purlogics) headquartered in Greenville, South Carolina.
•Solaris designs and manufactures bioprocessing equipment, including bioreactors, fermenters and tangential flow filtration systems for use in pharma, food and beverage and many other applications that require bioprocess technology.
•Purilogics is an early-stage biotechnology company that has developed novel and proprietary Purexa membrane chromatography products used for the purification and streamlined manufacturing of biopharmaceuticals. Aimed initially at the purification of pDNA, mRNA and mAbs, Purilogics’ platform is able to address a wide range of biologics. Purilogics’ Purexa membranes have significant competitive advantages over traditional resin and monolith technologies, enabling improved productivity, speed and production costs.
Vehicle Electrification and Medical Device
Vehicle electrification and medical device equipment provide a broad range of filters that protect devices and enclosures from pressure fluctuation, liquids and harmful contaminants. Key products include battery, powertrain and headlight vents for electric vehicles as well as venting solutions for hearing aids, ostomy bags and implantable devices.
Microelectronics
Microelectronics delivers product filtration solutions for gas phase molecular contamination at fabrication, tool and point-of-use locations. It offers protection and filtering for a broad spectrum of contaminants that can degrade tools, affect critical processes and impact production yield, which enables increased processing speeds and miniaturization of semiconductors. Key products/applications include lithography process air filtration, point-of-use chemical filtration, compressed air dryers and liquid filtration.
Disk Drive
Disk drive delivers products that have advanced materials and absorbent technologies to control moisture and contaminants in microenvironments. Disk drive filters work in the background to help protect critical components in cloud computing: streaming, storage, sharing, gaming and business-to-business interaction. Key products/applications include particle filters, chemical filters and relative humidity control.
Key Growth Drivers
The key growth drivers within each segment are as follows:
•Mobile Solutions
◦Providing solutions to customers to address their higher performance requirements ◦Utilization of technology to improve efficiencies and fuel economies in all end markets
◦Increased activity in construction, agriculture and mining markets driven by expansion in living standards
•Industrial Solutions
◦Complementing automation trends through expanded connectivity applications
◦Industrial equipment designed for optimized energy consumption and carbon footprint reduction
◦Growing operational efficiency needs to reduce costs associated with maintenance and downtime
•Life Sciences
◦Increasing need for cell and gene therapy as well as membrane applications for disease treatment and cures
◦Growing customer preference for sustainable food and materials
◦Continued cloud demand and growing automation trends
Competition
Principal methods of competition in the Mobile Solutions, Industrial Solutions and Life Sciences segments are technology, innovation, price, geographic coverage, service and product performance. The Company participates in a number of highly competitive filtration markets in all segments. Donaldson believes it is a market leader within many of its product lines, specifically within its Off-Road and On-Road product lines for OEMs and in the Aftermarket business for replacement filters. The Mobile Solutions segment’s principal competitors include several large global competitors and many regional competitors, especially in the Aftermarket business. The Industrial Solutions segment’s principal competitors vary from country to country and range from large global competitors to a significant number of smaller competitors who compete in a specific geographical region or in a limited number of product applications. The Life Sciences segment’s principal competitors include several large global competitors as well as niche players in the individual markets served by the segment.
Raw Materials
The principal raw materials the Company uses are steel, filter media and petrochemical-based products including plastic, rubber and adhesive products. Purchased raw materials represent approximately 70% of the Company’s cost of sales. On an ongoing basis, the Company enters into selective supply arrangements with certain of its suppliers that allow the Company to reduce volatility in its costs. The Company strives to recover or offset all material cost increases through selective price increases to its customers and the Company’s cost reduction initiatives, which include material substitution, process improvement and product redesigns.
Manufacturing and Backlog
Backlog is one of many indicators of business conditions in the Company’s markets. However, it is not always indicative of future results for a number of reasons, including the timing of the receipt of orders, as well as product mix. Backlog orders expected to be delivered within 90 days as of July 31, 2023 and 2022 were $576.4 million and $658.5 million, respectively.
Seasonality
Many of the Company’s end markets are generally stronger in the second half of the Company’s fiscal year. In addition, the first half of the fiscal year contains more holiday periods, which typically include more customer plant closures.
Diversification
The Company’s results of operations are affected by conditions in the global economic and geopolitical environment. Under most economic conditions, the Company’s market diversification between the regions and various end markets it serves and diversification through its OEM and replacement parts customers has helped to limit the impact of weakness in any one product line, market or geography on the consolidated operating results of the Company.
Intellectual Capital
Research and Development
Investment in research and development strengthens the Company’s material science capabilities and supports development of new and improved products and solutions. Research and development expenses include scientific research costs such as salaries, facility costs, testing, technical information technology and administrative expenditures. Research and development expenses are for the application of scientific advances to the development of new and improved products and their uses. Substantially all research and development is performed in-house. During the years ended July 31, 2023, 2022 and 2021, the Company spent $78.1 million, $69.1 million and $67.8 million, respectively, on research and development activities, which was 2.3%, 2.1% and 2.4% of net sales, respectively.
Intellectual Property
The Company owns a broad range of intellectual property rights relating to its products and services, which it considers in the aggregate to constitute a valuable asset. These include patents, trade secrets, trademarks, copyrights and other forms of intellectual property rights in the U.S. and a number of foreign countries. The Company protects its innovations arising from research and development through patent filings and owns a portfolio of over 2,800 issued patents, including utility and design patents. The Company also owns various trademarks related to its products and services including Donaldson® and the turbo D logo, Ultra-Web®, PowerCore®, Downflo®, Torit®, Synteq® XP, LifeTec®, iCue™ and Tetratex®, among others. No single intellectual property right is responsible for protecting the Company’s products.
Government Regulations
Donaldson is subject to a wide variety of local, state and federal governmental laws and regulations in the U.S., as well as the laws and regulations of other countries in which Donaldson conducts business, including securities laws, tax laws, data privacy, employment and pension-related laws, competition laws, U.S. and foreign export and trade laws, the Foreign Corrupt Practices Act ("FCPA") and similar worldwide anti-bribery laws, government procurement regulations and laws governing improper business practices. Donaldson strives to comply with applicable laws and regulations. We have robust internal controls, quality management systems, and management systems related to compliance that govern our internal actions and mitigate our risk of non-compliance. We also have safeguards established to identify non-compliance concerns through internal and external audits and risk assessments, as well as an ethics helpline reporting system. Failure to comply with these regulations, however, could lead to fines and other penalties.
We are subject to local, state, federal and international environmental, safety and health laws and regulations concerning, among other things, emissions to air; discharges to water; the generation, handling, storage, transportation, treatment and disposal of waste materials; and the use of raw materials and goods such as iron, steel aluminum, electricity, natural gas and hydrogen. The operation of manufacturing plants unavoidably entails environmental, safety and health risks, and we could incur material unanticipated costs or liabilities in the future if any of these risks were realized in ways or to an extent that we did not anticipate.
We believe that we operate in compliance, in all material respects, with applicable environmental laws and regulations. Compliance with environmental laws and regulations requires continuing management effort and expenditures. We have incurred, and will continue to incur, costs and capital expenditures to comply with these laws and regulations and to obtain and maintain the necessary permits and licenses. We believe that the cost of complying with environmental laws and regulations will not have a material effect on our results of operations, financial condition or cash flows but cannot assure that material compliance-related costs and expenses may not arise in the future. For example, future adoption of new or amended environmental laws, regulations or requirements or other circumstances could require us to incur costs and expenses that may have a material effect, but cannot be presently anticipated.
We believe that policies, practices and procedures have been properly designed to prevent unreasonable risk of material environmental damage arising from our operations. In fiscal 2023, the Company did not experience any material effect on its capital expenditures, results of operations or financial condition due to compliance with government rules regulating the discharge of materials into the environment or otherwise relating to the protection of the environment, nor does it expect such impact during fiscal 2024.
We are also required to comply with increasingly complex and changing laws and regulations enacted to protect business and personal data in the U.S. and other jurisdictions regarding privacy, data protection and data security, including those related to the collection, storage, use, transmission and protection of personal information and other consumer, customer, vendor or employee data. Such privacy and data protection laws and regulations, including with respect to the European Union’s General Data Protection Regulation ("GDPR"), the Brazilian General Data Protection Law, and the California Consumer Privacy Act of 2018 ("CCPA"), and the interpretation and enforcement of such laws and regulations, are continuously developing and evolving and there is significant uncertainty with respect to how compliance with these laws and regulations may evolve and the costs and complexity of future compliance.
For a discussion of the risks associated with these laws and regulations, see Part I, Item 1A, "Risk Factors."
Human Capital Resources
As of July 31, 2023, the Company had approximately 13,000 full time employees, of which 56% were in production related roles. When necessary, the Company’s production facilities augment their resources utilizing contingent labor. For over 100 years, the Company has been making a difference with customers, employees, investors, suppliers and communities through a collaborative and diverse workplace where every employee matters. The Company prides itself on providing innovative technologies and solutions backed by talented and dedicated employees guided by its core values.
Core Values
The Company’s purpose is to advance filtration for a cleaner world. The principles that guide this purpose are as follows:
•act with integrity - deliver on commitments and be accountable for actions;
•engage and empower people - have a richly diverse and inclusive culture and provide opportunities for people to grow, build successful careers and make meaningful contributions;
•deliver for customers - understand, anticipate and prioritize customers’ needs, delivering differentiated products and solutions that enable their success;
•cultivate innovation - pursue innovation in everything from continuous improvement in processes to breakthrough solutions that create value and competitive advantage;
•operate safely and sustainably - committed to safety in the workplace, being good stewards of natural resources and reducing environmental impacts; and
•enrich communities - share time, resources and talent to make a positive impact.
Culture
The Company is comprised of a diverse global team. With a broad base of capabilities, cultures and perspectives, employees reflect the communities they serve. The Company promotes a collaborative workplace. By working together, the Company’s employees can better understand and meet the customers’ needs. Every role is recognized and individuals’ contributions have a direct impact. The Company fosters learning and growth. To help employees continue to learn and succeed in their careers, while keeping pace with a rapidly changing global marketplace, the Company provides multiple learning opportunities and programs, including online courses and customized development plans.
Diversity, Equity and Inclusion
The Company values and welcomes employees’ unique views and contributions, knowing that together the global team can better understand and meet the needs of its customers and communities. The Company participates in outreach efforts for organizations focused on diversity and supporting educational opportunities to underserved students and communities.
Benefits
The Company is committed to the health, wealth and work-life balance of employees and offers competitive financial compensation packages that may include both base pay and bonus elements in addition to competitive benefits packages to help support individuals and their families. To support the health and well-being of employees in the U.S. and their dependents, the Company offers subsidized health insurance and also provides an employee assistance program. In other parts of the world, the Company offers social programs specific to the countries in which it operates. To help employees provide and prepare for the future, the Company provides several other financial and non-financial benefits.
Employment
The Company attracts a qualified workforce through an inclusive and accessible recruiting process that utilizes online recruiting platforms, campus outreach, internships, recruitment vendor partners, job fairs and other recruitment tools. The Company seeks to retain employees by offering competitive wages, benefits and training opportunities, as well as promoting a safe and healthy workplace. The Company is committed to treating all applicants and employees with the same high level of respect regardless of their gender, ethnicity, religion, national origin, age, marital status, political affiliation, sexual orientation, veteran status, gender identity, disability or other protected status. It is the Company’s policy to comply with all applicable state, local and international laws governing non-discrimination in employment in every location where it operates. This compliance includes terms and conditions of employment, which cover recruiting, hiring, placement, promotion, termination, layoff, recall, transfer, leaves of absence, compensation and training.
Health and Safety
The Company empowers its employees and provides the knowledge and tools needed to make safe decisions and mitigate risks. Every employee is responsible for identifying and managing exposure to health and safety hazards and harmful environmental impacts. A variety of training methods are available to fulfill these requirements, including online learning, training, coaching or mentoring and group discussions and activities.
Community Service
Generations of the Company’s employees and their families give their time, energy and aid to various philanthropic efforts, addressing the needs of our local communities and helping transform lives. Organizations are supported in partnership with the Donaldson Foundation and through numerous volunteer events.
Available Information
The Company makes its annual reports on Form 10-K, quarterly reports on Form 10-Q, current reports on Form 8-K, proxy statements and other information, including amendments to those reports, available free of charge through its website at ir.donaldson.com, as soon as reasonably practicable after it electronically files such material with, or furnishes such material to, the Securities and Exchange Commission (SEC). These filings are available on the SEC’s website at www.sec.gov. Also available on the Company’s website are corporate governance documents, including the Company’s Code of Business Conduct and Business Conduct Help Line, Corporate Governance Guidelines, Director Independence Standards, Audit Committee Charter, Human Resources Committee Charter and Corporate Governance Committee Charter. The information contained on the Company’s website is not incorporated by reference into this Annual Report and should not be considered as part of this report.
Executive Officers
Our executive officers of the Company as of August 31, 2023 were as follows:
|
|
|
|
|
|
|
|
|
|
|
|
|
|
|
|
|
|
|
|
|
| Name |
|
Age |
|
Positions and Offices Held |
|
First Calendar Year
Appointed as an
Executive Officer |
| Amy C. Becker |
|
58 |
|
Chief Legal Officer and Corporate Secretary |
|
2014 |
| Guillermo Briseño |
|
56 |
|
President, Industrial Solutions |
|
2022 |
| Tod E. Carpenter |
|
64 |
|
Chairman, President and Chief Executive Officer |
|
2008 |
| Andrew Dahlgren |
|
52 |
|
President, Life Sciences |
|
2022 |
| Sheila G. Kramer |
|
64 |
|
Chief Human Resources Officer |
|
2015 |
| Richard B. Lewis |
|
51 |
|
President, Mobile Solutions |
|
2017 |
| Scott J. Robinson |
|
56 |
|
Chief Financial Officer |
|
2015 |
| Thomas R. Scalf |
|
57 |
|
President, Enterprise Operations and Supply Chain |
|
2014 |
Ms. Becker was appointed to Chief Legal Officer and Corporate Secretary in November 2022. Ms. Becker joined the Company in 1998 and held positions as Senior Counsel and Assistant Corporate Secretary; Assistant General Counsel; and Vice President, General Counsel and Secretary. Prior to joining the Company, Ms. Becker was an attorney for Dorsey and Whitney, LLP from 1991 to 1995 and was a Project Manager and Corporate Counsel for Harmon, Ltd. from 1995 to 1998.
Mr. Briseño was appointed President, Industrial Solutions in November 2022. Mr. Briseño joined the Company in 2003 and has held various positions, including IAF District Manager; IFS Latin America Business Manager; Industrial Sales Director Latin America; Managing Director Latin America; and Vice President, Latin America.
Mr. Carpenter was appointed Chairman, President and Chief Executive Officer in November 2017. Mr. Carpenter joined the Company in 1996 and has held various positions, including Director of Operations, Gas Turbine Systems; General Manager, Gas Turbine Systems; General Manager, Industrial Filtration Systems; Vice President, Global Industrial Filtration Systems; Vice President, Europe and Middle East; and Senior Vice President, Engine Products. Mr. Carpenter was appointed Chief Operating Officer in April 2014 and President and Chief Executive Officer in April 2015.
Mr. Dahlgren was appointed President, Life Sciences in November 2022. Mr. Dahlgren joined the Company in 1994 and has held various positions, including Manager Business Development, Disk Drive; Director of Business Development, IVS, Semiconductor, Fuel Cell; General Manager, Engine Air; General Manager, GTS; Vice President, GTS and Special Applications; and Vice President, Asia Pacific.
Ms. Kramer was appointed Chief Human Resources Officer in November 2022. Ms. Kramer joined the Company in 2015 as Vice President, Human Resources. Prior to joining the Company, Ms. Kramer was Vice President, Human Resources for Taylor Corporation, a print and graphics media company, from 2013 until September 2015. Prior to that, Ms. Kramer spent 22 years at Lifetouch, Inc. in various human resources roles, including Corporate Vice President, Human Resources from 2009 to 2013.
Mr. Lewis was appointed President, Mobile Solutions in November 2022. Mr. Lewis joined the Company in 2002 and has held various positions, including Plant Manager; Director of Operations; General Manager, Liquid Filtration; General Manager, Operations; Vice President, Global Operations; and Senior Vice President, Global Operations.
Mr. Robinson was appointed Chief Financial Officer and joined the Company in 2015. Prior to joining the Company, Mr. Robinson was the Chief Financial Officer for Imation Corp., a global data storage and information security company, from 2014 to 2015. During his 11 years with Imation Corp., he also served as the Investor Relations Officer, Corporate Controller and Chief Accounting Officer.
Mr. Scalf was appointed President, Enterprise Operations and Supply Chain in November 2022. Mr. Scalf joined the Company in 1989 and has held various positions, including Plant Manager; Manager, Site Integration; Director of Operations; General Manager, Exhaust and Emissions; General Manager, Industrial Filtration Solutions Americas; Vice President, Global Industrial Air Filtration; and Senior Vice President, Engine Products.
Item 1A. Risk Factors
The Company’s (we, our or us) business is subject to various risks and uncertainties. The following discussion outlines what we believe to be the risk factors that could materially and adversely affect our business, reputation, financial condition and results of operations. These risk factors should be considered with the Company’s cautionary comments related to forward-looking statements when evaluating information provided in this Annual Report. Risks not currently known to the Company, or which the Company currently believes are immaterial, may also impair the Company’s business, reputation, financial condition and results of operations. The Company periodically reviews its strategies, processes and controls with respect to risk identification, assessment and mitigation with the audit committee of the Company’s board of directors.
Macroeconomic and Geopolitical Risks
Global Operations - we have a broad footprint and global operations may present challenges.
We have operations throughout the world. Our stability, growth and profitability are subject to a number of risks of doing business globally including the following:
•political and military events, including the rise of nationalism and support for protectionist policies;
•tariffs, trade barriers and other trade restrictions;
•legal and regulatory requirements, including import, export, defense regulations, anti-corruption laws and foreign exchange controls;
•potential difficulties in staffing and managing local operations;
•credit risk of local customers and distributors;
•deterioration in economic conditions, including the effect of inflation on our customers and suppliers;
•difficulties in protecting our intellectual property; and
•local economic, political and social conditions.
Due to the global reach of our operations, our business is subject to a complex system of commercial and trade laws, regulations and policies, including those related to data privacy, trade compliance, anti-corruption and anti-bribery. We experience exposure to and costs of complying with, these laws and regulations. Our global subsidiaries, joint venture partners and affiliates are governed by laws, rules and business practices that differ from those of the U.S. Our compliance programs may not adequately prevent or deter our employees, agents, distributors, suppliers and other third parties with whom we do business from violating laws, regulations or standards. We may incur defense costs, fines, penalties, damage to our reputation and business disruptions, which could result in an adverse effect on our results of operations, financial condition and cash flows.
Business Disruption - unexpected events, including natural disasters, may increase our cost of doing business or disrupt our operations.
There could be an occurrence of one or more unexpected events, including a terrorist attack, war or civil unrest, a weather event, a natural disaster, a climate-related event, a pandemic or other catastrophe in countries in which we operate or in which our suppliers are located. Such an event could result in physical damage to and complete or partial closure of one or more of our headquarters, manufacturing facilities or distribution centers, temporary or long-term disruption in the supply of component products from some local and international suppliers, disruption in the transport of our products to customers and disruption of information systems. Existing insurance coverage may not provide protection for all costs that may arise from any such event. Any disruption in our operations could have an adverse impact on our ability to meet our customer needs or may require us to incur additional expense in order to produce sufficient inventory. Certain unexpected events could adversely impact our business, results of operations, financial condition and cash flows.
Operational Risks
Supply Chain - unavailable raw materials, significant demand fluctuations and material cost inflation have and could continue to have an impact on our sales and cost of sales.
We obtain raw materials, including steel, filter media, petroleum-based products and other components from third-party suppliers. We often concentrate our sourcing of some materials from one supplier or a few suppliers. We rely, in part, on our suppliers to ensure they meet required quality and delivery standards. An unanticipated delay in delivery by our suppliers could result in the inability to deliver our products on time and to meet the expectations of our customers. We have experienced and could continue to experience, an increase in the costs of doing business, including increasing raw material prices and transportation costs, which have and could continue to have an adverse impact on our business, results of operations, financial condition and cash flows.
Personnel - our success has been and could in the future be affected, if we are not able to attract, engage, train and retain qualified personnel.
Our success depends in large part on our ability to identify, recruit, engage, train and retain highly skilled, qualified and diverse personnel globally and successfully execute management transitions at leadership levels of the Company. There is competition for talent with market-leading skills and capabilities in new technologies. Additionally, in some locations we have experienced labor shortages causing significant wage inflation and workplace availability. We may not be able to attract and retain qualified personnel and it may be difficult for us to compete effectively, which could adversely impact our business, results of operations, financial condition and cash flows.
Operations - complexity of manufacturing could cause inability to meet demand and result in the loss of customers.
Our ability to fulfill customer orders is dependent on our manufacturing and distribution operations. Although we forecast demand, additional plant capacity takes significant time to bring online and thus, unexpected or extreme changes in demand could result in longer lead times. We cannot guarantee we will be able to adjust manufacturing capacity, in the short-term, to meet higher customer demand. Efficient operations require streamlining processes to maintain or reduce lead times, which we may not be capable of achieving. Unacceptable levels of service for key customers may result if we are not able to fulfill orders on a timely basis or if product quality, warranty or safety issues result from compromised production. We may not be able to adjust our production schedules to reflect changes in customer demand on a timely basis. Due to the complexity of our manufacturing operations, we may be unable to timely respond to fluctuations in demand, which could adversely impact our business, results of operations, financial condition and cash flows.
Products - maintaining a competitive advantage requires consistent investment with uncertain returns.
We operate in highly competitive markets and have numerous competitors that are already be well-established in those markets. We expect our competitors to continue to improve the design and performance of their products and to introduce new products that could be competitive in both price and performance. We believe we have certain technological advantages over our competitors, but maintaining these advantages requires us to consistently invest in research and development, sales and marketing and customer service and support. There is no guarantee we will be successful in maintaining these advantages and we could encounter the commoditization of our key products. We make investments in new technologies that address increased performance and regulatory requirements around the globe. There is no guarantee we will be successful in completing development or achieving sales of these products or that the margins on such products will be acceptable. A competitor’s successful product innovation could reach the market before ours or gain broader market acceptance, which could adversely impact our business, results of operations, financial condition and cash flows.
Evolving Customer Needs - disruptive technologies may threaten our growth in certain industries.
Certain industry market trends guide decisions we make in operating the Company and our growth could be threatened by disruptive technologies. We may be adversely impacted by changes in technology that could reduce or eliminate the demand for our products. These risks include wider adoption of technologies providing alternatives to diesel engines such as electrification of equipment or other alternative power solutions. Such disruptive innovation could create new markets and displace existing companies and products, resulting in significantly negative consequences for the Company. If we do not properly address future customer needs, we may be slower to adapt to such disruption, which could adversely impact our business, results of operations, financial condition and cash flows.
Competition - we participate in highly competitive markets with pricing pressure.
The businesses and product lines in which we participate are very competitive and we risk losing business based on a wide range of factors, including price, technology, performance, reliability and availability, geographic coverage and customer service. Our customers continue to seek technological innovation, productivity gains, competitive prices, reliability and availability from us and their other suppliers. Additionally, we sell through a variety of channels (e.g., OEM, dealer, distributor and eCommerce) in a diverse set of highly competitive filtration markets. The variability complicates the supply chain, affects working capital needs, requires balance between relationships and drives a more targeted sales force. As a result of these and other factors, we may not be able to compete effectively, which could adversely impact our business, results of operations, financial condition and cash flows.
Customer Concentration and Retention - a number of our customers operate in similar cyclical industries. Changes in economic conditions in these industries could impact our sales.
No customer accounted for 10% or more of our net sales in fiscal 2023, 2022 or 2021. However, a number of our customers are concentrated in similar cyclical industries (e.g., construction, agriculture, mining, oil and gas, transportation, power generation and disk drive), resulting in additional risk based on their respective economic conditions. Our success is also dependent on retaining key customers, which requires us to successfully manage relationships and anticipate the needs of our customers in the channels in which we sell our products. Changes in economic conditions could materially and adversely impact our business, results of operations, financial condition and cash flows.
Productivity Improvements - if we do not successfully manage productivity improvements, we may not realize the expected benefits.
Our financial projections assume certain ongoing productivity improvements as a key component of our business strategy to, among other things, contain operating expenses, maintain competitiveness, increase operating efficiencies and align manufacturing capacity to demand. We may not be able to realize the expected benefits and cost savings if we do not successfully execute these plans while continuing to invest in business growth. Such cost savings may not otherwise be realized or other difficulties could be encountered, which could adversely impact our business, results of operations, financial condition and cash flows.
Environmental, Social and Governance (ESG) - achieving commitments could result in additional costs and our inability to achieve them could have an adverse impact on our reputation and performance.
We periodically communicate our strategies, commitments and targets related to ESG matters, including greenhouse gas (GHG) emissions and diversity, equity and inclusion through the issuance of our ESG report. Although we intend to meet these strategies, commitments and targets, we may be unable to achieve them due to impacts on resources, operational costs and technological advancements. In addition, standards and processes for measuring and reporting GHG emissions and other sustainability metrics may change over time, result in inconsistent data or result in significant revisions to our strategies, commitments and targets, or our ability to achieve them. Any scrutiny of our carbon emissions or other sustainability disclosures, our failure to achieve related strategies, commitments and targets or failure to meet sustainability requirements could negatively impact our reputation as well as the demand for our products and adversely affect our business, results of operations, financial condition and cash flow.
Acquisitions, Divestitures and Other Strategic Transactions - the execution of our acquisitions, divestitures and other strategic transactions may not provide the desired return on investment.
We have made and continue to pursue acquisitions and divestitures and may pursue joint ventures, strategic investments and other similar strategic transactions. Acquisitions, joint ventures and strategic investments could negatively impact our profitability and financial condition due to operating and integration inefficiencies, the incurrence of debt, contingent liabilities and amortization of expenses related to intangible assets. There are also a number of other risks involved in acquisitions including the potential loss of key customers or employees, difficulties in assimilating the acquired operations and the diversion of management’s time and attention away from other business matters. Further, during the pendency of a proposed transaction, we may be subject to risks related to a decline in the business and the risk the transaction may not close. Divestitures may involve significant challenges and risks, such as difficulty separating out portions of our business or the potential loss of revenue or negative impacts on margins. The divestitures may also result in ongoing financial or legal proceedings, such as retained liabilities, which could have an adverse impact on our business, results of operations, financial condition and cash flows.
Cybersecurity Risks
Cybersecurity Risks - vulnerability of our information technology systems and security.
We have many information technology systems that are important to the operation of our business, some of which are managed by third parties. These systems are used to process, transmit and store electronic information and to manage or support a variety of business processes and activities, which are critical to our operations. We could encounter difficulties in developing new systems, maintaining and upgrading our existing systems, managing access to these systems and preventing information security breaches. Additionally, we collect and store sensitive data, including intellectual property and proprietary business information, in data centers and on information technology networks.
Our data is subject to a variety of U.S. and international laws and regulations that pertain to the collection and handling of personal information. The laws require us to notify governmental authorities and affected individuals of data breaches involving certain personal information. These laws include the European GDPR and the CCPA. Regulatory litigation or actions that could impose significant penalties may be brought against us in the event of a breach of data or alleged non-compliance with such laws and regulations.
Information technology security threats are increasing in frequency and sophistication; to date, none of the threats faced by the Company have been material. We have invested in protection to prevent these threats; however, there can be no assurance our efforts will prevent all potential failures, cybersecurity attacks or breaches of our systems. These threats pose a risk to the security of our systems and networks and the confidentiality, availability and integrity of our data. Should such an attack succeed, it could lead to the compromise of confidential information, manipulation and destruction of data, defective products, production downtimes and operation disruptions. The occurrence of any of these events could adversely affect our reputation and could result in litigation, regulatory action, potential liability, increased costs and operational consequences of implementing further data protection matters. The Company maintains insurance coverage for various cybersecurity and business continuity risks, however, there can be no guarantee all costs or losses incurred will be fully insured. Vulnerabilities could lead to significant additional expenses and an adverse effect on our reputation, business, results of operations, financial condition and cash flows.
Legal and Regulatory Risks
Intellectual Property - demand for our products may be affected by new entrants that copy our products and/or infringe on our intellectual property.
The ability to protect and enforce intellectual property rights varies across jurisdictions. Where possible, we seek to preserve our intellectual property rights through patents. These patents have a limited life and, in some cases, have expired or will expire in the near future. Competitors and others may also initiate litigation to challenge the validity of our intellectual property rights or allege that we infringe their intellectual property rights. We may be required to pay substantial damages if it is determined our products infringe on their intellectual property rights. We may also be required to develop an alternative, non-infringing product that could be costly and time-consuming, or acquire a license on terms that are unfavorable to us.
Protecting or defending against such claims could significantly increase our costs and divert management’s time and attention away from other business matters, which could adversely impact our business, results of operations, financial condition and cash flows.
Legal and Regulatory - costs associated with lawsuits, investigations or complying with laws and regulations.
We are subject to many laws and regulations in the jurisdictions in which we operate. We routinely incur costs in order to comply with these laws and regulations. We may be adversely impacted by new or changing laws and regulations that affect both our operations and our ability to develop and sell products that meet our customers’ requirements. We are involved in various product liability, product warranty, intellectual property, environmental claims and other legal proceedings that arise in and outside of the ordinary course of our business. We are subject to increasingly stringent laws and regulations in the countries in which we operate, including those governing the environment (e.g., emissions to air; discharges to water; and the generation, handling, storage, transportation, treatment and disposal of waste materials; and the use of raw materials and goods such as iron, steel aluminum, electricity, natural gas and hydrogen) and data protection and privacy. It is not possible to predict the outcome of investigations and lawsuits and we could incur judgments, fines or penalties or enter into settlements of lawsuits and claims that could have an adverse effect on our reputation, business, results of operations, financial condition and cash flows in any particular period. In addition, we may not be able to maintain our insurance at a reasonable cost or in sufficient amounts to protect us against any losses.
Financial Risks
Currency - an unfavorable fluctuation in foreign currency exchange rates could impact our results of operations.
We have operations in many countries, with a substantial portion of our annual revenue earned in currencies other than the U.S. dollar. We face transactional and translational risks associated with the fluctuations in foreign currency exchange rates. Transactional risk arises from changes in the value of cash flows denominated in different currencies. This can be caused by supply chains that cross borders resulting in revenues and costs being in different currencies. Translational risk arises from the remeasurement of our financial statements. In addition, decreased value of local currency may make it difficult for some of our customers, distributors and end users to purchase our products. Each of our subsidiaries reports its results of operations and financial position in its relevant functional currency, which is then translated into U.S. dollars. This translated financial information is included in our Consolidated Financial Statements. Significant fluctuations of the U.S. dollar in comparison to the foreign currencies of our subsidiaries during discrete periods may have a negative impact on our business, results of operations, financial condition and cash flows.
Liquidity - changes in the capital and credit markets may negatively affect our ability to access financing to support strategic initiatives.
Disruption of the global financial and credit markets may have an effect on our long-term liquidity and financial condition. There can be no assurance the cost or availability of future borrowings will not be impacted by future capital market disruptions. Some of our existing borrowings contain covenants to maintain certain financial ratios that, under certain circumstances, could restrict our ability to incur additional indebtedness, make investments and other restricted payments, create liens and sell assets.
Item 1B. Unresolved Staff Comments
None.
Item 2. Properties
The Company’s corporate headquarters and corporate research facilities are located in Minneapolis, Minnesota. The Company also has administrative and engineering offices, as well as research facilities in the regions of EMEA, APAC and LATAM. The Company’s manufacturing and distribution activities are located throughout the world and the Company considers its properties to be suitable for their present purposes, well-maintained and in good operating condition.
Item 3. Legal Proceedings
The Company records provisions when it is probable a liability has been incurred and the amount of the loss can be reasonably estimated. Claims and litigation are reviewed quarterly and provisions are taken or adjusted to reflect the status of a particular matter. The Company believes the estimated liability in its Consolidated Financial Statements for claims or litigation is adequate and appropriate for the probable and estimable outcomes. Liabilities recorded were not material to the Company’s financial position, results of operations or liquidity. The Company believes it is remote that the settlement of any of the currently identified claims or litigation will be materially in excess of what is accrued.
Item 4. Mine Safety Disclosures
Not applicable.
PART II
Item 5. Market for Registrant’s Common Equity, Related Stockholder Matters and Issuer Purchases of Equity Securities
The Company’s common stock, par value $5.00 per share, is traded on the New York Stock Exchange under the symbol “DCI.” As of September 8, 2023, there were 1,168 registered stockholders of common stock.
To determine the appropriate level of dividend payouts, the Company considers recent and projected performance across key financial metrics, including earnings, cash flow from operations and total debt.
Information in connection with purchases made by, or on behalf of, the Company or any affiliated purchaser of the Company, of shares of the Company’s common stock during the three months ended July 31, 2023 was as follows:
|
|
|
|
|
|
|
|
|
|
|
|
|
|
|
|
|
|
|
|
|
|
|
|
|
|
|
| Period |
|
Total Number of
Shares Purchased
|
|
Average Price
Paid per Share |
|
Total Number of
Shares Purchased
as Part of Publicly
Announced Plans
or Programs |
|
Maximum Number
of Shares that May
Yet Be Purchased
Under the Plans or
Programs |
| May 1 - May 31, 2023 |
|
176,000 |
|
|
$ |
63.80 |
|
|
176,000 |
|
|
3,104,805 |
|
| June 1 - June 30, 2023 |
|
187,091 |
|
|
$ |
60.40 |
|
|
187,091 |
|
|
2,917,714 |
|
| July 1 - July 31, 2023 |
|
— |
|
|
$ |
— |
|
|
— |
|
|
2,917,714 |
|
| Total |
|
363,091 |
|
|
$ |
62.05 |
|
|
363,091 |
|
|
2,917,714 |
|
On May 31, 2019, the Board of Directors authorized the repurchase of up to 13.0 million shares of the Company’s common stock. This repurchase authorization is effective until terminated by the Board of Directors. The Company has remaining authorization to repurchase 2.9 million shares under this plan. There were no repurchases of common stock made outside of the Company’s current repurchase authorization during the three months ended July 31, 2023. While not considered repurchases of shares, the Company does at times withhold shares that would otherwise be issued under stock-based awards to cover the withholding of taxes due as a result of exercising stock options or payment of stock-based awards.
The table set forth in Part III, Item 12, “Security Ownership of Certain Beneficial Owners and Management and Related Stockholder Matters” of this Annual Report is also incorporated herein by reference.
The graph below compares the cumulative total stockholder return on the Company’s common stock for the last five fiscal years with the cumulative total return of the Standard & Poor’s (S&P) 500 Stock Index and the S&P Industrial Machinery Index. The graph and table assume the investment of $100 in each of the Company’s common stock and the specified indexes at the beginning of the applicable period and assume the reinvestment of all dividends.
COMPARISON OF FIVE YEAR CUMULATIVE TOTAL RETURN
Among Donaldson Company Inc., the S&P 500 Index
and the S&P Industrial Machinery Index
|
|
|
|
|
|
|
|
|
|
|
|
|
|
|
|
|
|
|
|
|
|
|
|
|
|
|
|
|
|
|
|
|
|
|
|
|
|
|
|
|
As of July 31, |
|
|
2018 |
|
2019 |
|
2020 |
|
2021 |
|
2022 |
|
2023 |
| Donaldson Company, Inc. |
|
$ |
100.00 |
|
|
$ |
106.43 |
|
|
$ |
104.74 |
|
|
$ |
145.55 |
|
|
$ |
121.51 |
|
|
$ |
142.53 |
|
| S&P 500 Stock Index |
|
$ |
100.00 |
|
|
$ |
107.99 |
|
|
$ |
120.90 |
|
|
$ |
164.96 |
|
|
$ |
157.31 |
|
|
$ |
177.78 |
|
| S&P Industrial Machinery Index |
|
$ |
100.00 |
|
|
$ |
107.28 |
|
|
$ |
112.27 |
|
|
$ |
162.08 |
|
|
$ |
139.66 |
|
|
$ |
174.48 |
|
Item 6. [Reserved]
Reserved.
Item 7. Management’s Discussion and Analysis of Financial Condition and Results of Operations
In the second quarter of fiscal 2023, the Company established a new segment reporting structure which resulted in three reportable segments: Mobile Solutions, Industrial Solutions and Life Sciences. We have reflected this change in all historical periods presented. See Note 19. Segment Reporting in the Notes to Consolidated Financial Statements, included in Item 8 of Part II in this Annual Report for further detail of this change.
The following Management’s Discussion and Analysis of Financial Condition and Results of Operations (MD&A) provides a comparison of the Company’s results of operations, liquidity and capital resources for the years ended July 31, 2023 and 2022, as well as revenue and segment specific comparisons for 2021. A discussion of the changes in the Company’s results of operations and liquidity and capital resources for the year ended July 31, 2022 from July 31, 2021 for non-segment specific comparisons can be found in Part II, “Item 7. Management’s Discussion and Analysis of Financial Condition and Results of Operations” of the Company’s Annual Report on Form 10-K for the year ended July 31, 2022 (the “2022 Annual Report”), which was filed with the SEC on September 23, 2022.
The MD&A should be read in conjunction with the Company’s Consolidated Financial Statements and Notes included in Item 8 of this Annual Report. This discussion contains forward-looking statements that involve risks and uncertainties. The Company’s actual results could differ materially from those anticipated in these forward-looking statements as a result of various factors, including those discussed elsewhere in this Annual Report, particularly Item 1A, “Risk Factors” and in the Safe Harbor Statement under the Private Securities Litigation Reform Act of 1995.
Throughout this MD&A, the Company refers to measures used by management to evaluate performance, including a number of financial measures that are not defined under generally accepted accounting principles (GAAP) in the U.S. Excluding foreign currency translation from net sales and net earnings (i.e. constant currency) are not measures of financial performance under GAAP; however, the Company believes they are useful in understanding its financial results and provide comparable measures for understanding the operating results of the Company between different fiscal periods. Reconciliations within this MD&A provide more details on the use and derivation of these measures.
Overview
Founded in 1915, Donaldson Company, Inc. is a global leader in technology-led filtration products and solutions, serving a broad range of industries and advanced markets. Donaldson’s diverse skilled employees at over 150 locations, 75 of which are manufacturing and/or distribution centers, on six continents partner with customers — from small business owners to the world’s largest original equipment manufacturer (OEM) brands — to solve complex filtration challenges. Customers choose Donaldson’s filtration solutions due to their stringent performance requirements and need for reliability.
The Company’s operating segments are Mobile Solutions, Industrial Solutions and Life Sciences. The Mobile Solutions segment is organized based on a combination of customers and products and consists of the Off-Road, On-Road and Aftermarket business units. Within these business units, products consist of replacement filters for both air and liquid filtration applications and filtration housings for new equipment production and systems related to exhaust and emissions. Applications include air filtration systems, fuel, lube and hydraulic systems, emissions systems and sensors, indicators and monitoring systems. Mobile Solutions sells to OEMs in the construction, mining, agriculture and transportation end markets and to independent distributors and OEM dealer networks.
The Industrial Solutions segment is organized based on product type and consists of the Industrial Air Filtration, Industrial Gasses, Industrial Hydraulics, Power Generation and Aerospace and Defense business units. Within our Industrial Solutions portfolio, Donaldson provides a wide product offering in the market to industrial customers consisting of equipment, ancillary components, replacement parts, performance monitoring and service globally, that cost-effectively enhance productivity and manufacturing efficiency. Industrial Air Filtration, Industrial Gasses and Industrial Hydraulics products consist of dust, fume and mist collectors, compressed air and industrial gasses purification systems, hydraulic and lubricated rotating equipment applications as well as gas and liquid filtration for industrial processes. Power Generation products consist of air inlet systems and filtration sold to gas compression, power generation and natural gas liquification industries. Aerospace and Defense products consist of air, fuel, lubrication and hydraulic filtration for fixed-wing and rotorcraft aerospace applications and ground defense vehicle and naval platforms. Industrial Solutions sells through multiple channels which include OEMs, distributors and direct-to-consumer in some markets.
The Life Sciences segment is organized by end market and consists of the Bioprocessing Equipment and Consumables, Food and Beverage, Vehicle Electrification and Medical Device, Microelectronics and Disk Drive business units. Within these business units, products consist of micro-environment gas and liquid filtration for food and beverage and industrial processes, bioprocessing equipment, including bioreactors and fermenters, bioprocessing consumables including chromatography devices, reagents and filters, polytetrafluoroethylene membrane-based products, as well as specialized air and gas filtration systems for applications including hard disk drives, semiconductor manufacturing, sensors, battery systems and powertrain components. Life Sciences primarily sells to large OEMs and directly to various end users requiring cell growth, separation, purification, high purity filtration and device protection.
The Company’s results of operations are affected by conditions in the global economic and geopolitical environment. Under most economic conditions, the Company’s market diversification between its diesel engine end markets, its global end markets, its diversification through technology and its OEM and replacement parts customers has helped to limit the impact of weakness in any one product line, market or geography on the consolidated operating results of the Company.
Operating Environment
Inflation
While inflation was not significant in the fourth quarter or the twelve months of fiscal 2023, as compared to the prior year, the Company continues to experience the effects of the prior year inflation related to raw materials and other expenses, including labor and energy. These inflationary pressures have had an adverse impact on the Company’s profit margins throughout the twelve months of fiscal 2023 when compared to the prior year, however they have been generally mitigated by pricing actions primarily implemented in the prior year.
Consolidated Results of Operations
Operating Results
Operating results were as follows (in millions, except per share amounts):
|
|
|
|
|
|
|
|
|
|
|
|
|
|
|
|
|
|
|
|
|
|
|
|
|
|
|
|
|
|
|
|
|
Year Ended July 31, |
|
|
|
|
|
|
2023 |
|
% of net sales |
|
2022 |
|
% of net sales |
|
|
|
|
| Net sales |
|
$ |
3,430.8 |
|
|
|
|
$ |
3,306.6 |
|
|
|
|
|
|
|
| Cost of sales |
|
2,270.2 |
|
|
66.2 |
% |
|
2,239.2 |
|
|
67.7 |
% |
|
|
|
|
| Gross profit |
|
1,160.6 |
|
|
33.8 |
|
|
1,067.4 |
|
|
32.3 |
|
|
|
|
|
| Selling, general and administrative |
|
602.3 |
|
|
17.6 |
|
|
554.8 |
|
|
16.8 |
|
|
|
|
|
| Research and development |
|
78.1 |
|
|
2.3 |
|
|
69.1 |
|
|
2.1 |
|
|
|
|
|
| Operating expenses |
|
680.4 |
|
|
19.8 |
|
|
623.9 |
|
|
18.9 |
|
|
|
|
|
| Operating income |
|
480.2 |
|
|
14.0 |
|
|
443.5 |
|
|
13.4 |
|
|
|
|
|
| Interest expense |
|
19.2 |
|
|
0.6 |
|
|
14.9 |
|
|
0.4 |
|
|
|
|
|
| Other income, net |
|
(7.7) |
|
|
(0.2) |
|
|
(9.8) |
|
|
(0.3) |
|
|
|
|
|
| Earnings before income taxes |
|
468.7 |
|
|
13.7 |
|
|
438.4 |
|
|
13.3 |
|
|
|
|
|
| Income taxes |
|
109.9 |
|
|
3.2 |
|
|
105.6 |
|
|
3.2 |
|
|
|
|
|
| Net earnings |
|
$ |
358.8 |
|
|
10.5 |
% |
|
$ |
332.8 |
|
|
10.1 |
% |
|
|
|
|
|
|
|
|
|
|
|
|
|
|
|
|
|
| Net earnings per share (EPS) – diluted |
|
$ |
2.90 |
|
|
|
|
$ |
2.66 |
|
|
|
|
|
|
|
Geographic Net Sales by Origination
Net sales, generally disaggregated by location where the customer’s order was received, were as follows (in millions):
|
|
|
|
|
|
|
|
|
|
|
|
|
|
|
|
|
|
|
|
|
|
|
|
|
|
|
|
|
|
|
|
|
Year Ended July 31, |
|
|
|
|
|
|
2023 |
|
% of net sales |
|
2022 |
|
% of net sales |
|
|
|
|
| U.S. and Canada |
|
$ |
1,464.7 |
|
|
42.7 |
% |
|
$ |
1,336.8 |
|
|
40.5 |
% |
|
|
|
|
| Europe, Middle East and Africa (EMEA) |
|
1,007.8 |
|
|
29.4 |
|
|
963.6 |
|
|
29.1 |
|
|
|
|
|
| Asia Pacific (APAC) |
|
608.8 |
|
|
17.7 |
|
|
669.0 |
|
|
20.2 |
|
|
|
|
|
| Latin America (LATAM) |
|
349.5 |
|
|
10.2 |
|
|
337.2 |
|
|
10.2 |
|
|
|
|
|
| Total Company |
|
$ |
3,430.8 |
|
|
100.0 |
% |
|
$ |
3,306.6 |
|
|
100.0 |
% |
|
|
|
|
Impact of Foreign Currency Translation on Net Sales
Net sales were impacted by fluctuations in foreign currency exchange rates. The impact was as follows (in millions):
|
|
|
|
|
|
|
|
|
|
|
|
|
|
|
|
|
Year Ended July 31, |
|
|
2023 |
|
2022 |
| Prior year net sales |
|
$ |
3,306.6 |
|
|
$ |
2,853.9 |
|
| Change in net sales excluding translation |
|
237.6 |
|
|
539.8 |
|
Impact of foreign currency translation(1) |
|
(113.4) |
|
|
(87.1) |
|
| Current year net sales |
|
$ |
3,430.8 |
|
|
$ |
3,306.6 |
|
(1)The impact of foreign currency translation was calculated by translating current fiscal year foreign currency net sales into U.S. dollars using the average foreign currency exchange rates for the prior fiscal year.
Net Sales
Net sales for the year ended July 31, 2023 increased $124.2 million, or 3.8% from fiscal 2022, reflecting higher sales in the Mobile Solutions segment of $48.3 million, or 2.3% and the Industrial Solutions segment of $113.7 million, or 12.6%, and decreased sales in the Life Sciences segment of $37.8 million, or 13.5%. Foreign currency translation decreased net sales by $113.4 million, reflecting decreases in the Mobile Solutions, Industrial Solutions and Life Sciences segments of $73.8 million, $26.8 million and $12.7 million, respectively. In fiscal 2023, the Company’s net sales increased primarily from higher pricing, partially offset by a negative impact from foreign currency translation.
Net sales for the year ended July 31, 2022 increased $452.7 million, or 15.9% from fiscal 2021, reflecting higher sales in the Mobile Solutions segment of $308.1 million, or 16.9%, the Industrial Solutions segment of $120.0 million, or 15.4% and the Life Sciences segment of $24.6 million, or 9.7%. Foreign currency translation decreased net sales by $87.1 million compared to the prior fiscal year, reflecting decreases in the Mobile Solutions, Industrial Solutions and Life Sciences segments of $52.1 million, $21.4 million and $13.6 million, respectively. In fiscal 2022, the Company’s net sales increased from strong, broad-based end-market demand and higher pricing.
Cost of Sales and Gross Margin
Cost of sales for the year ended July 31, 2023 was $2,270.2 million, compared with $2,239.2 million for the year ended July 31, 2022, an increase of $31.0 million, or 1.4%. Gross margin as a percentage of net sales for the year ended July 31, 2023 was 33.8% compared with 32.3% for the year ended July 31, 2022, an increase of 1.5 percentage points. The increase in gross margin as a percentage of net sales was primarily driven by pricing actions, partially offset by higher input costs as well as $2.9 million of costs associated with exiting of a lower-margin customer program and a lower-margin product.
Selling, General and Administrative Expenses
Selling, general and administrative expenses for the year ended July 31, 2023 were $602.3 million, or 17.6% of net sales, compared with $554.8 million, or 16.8% of net sales, for the year ended July 31, 2022, an increase of $47.5 million, or 8.6%. The increase in selling, general and administrative expenses as a percentage of net sales was primarily due to severance and other organizational redesign charges of $15.3 million, $3.6 million of costs mainly associated with the exiting of a lower-margin customer program and a lower-margin product and the impact of recent acquisitions. This was partially offset by expense leverage on higher sales.
Research and Development Expenses
Research and development expenses for the year ended July 31, 2023 were $78.1 million, or 2.3% of net sales, compared with $69.1 million, or 2.1% of net sales, for the year ended July 31, 2022, an increase of $9.0 million, or 13.0%. The increase in research and development expenses as a percentage of net sales was primarily due to higher headcount.
Non-Operating Items
Interest expense for the year ended July 31, 2023 was $19.2 million, compared with $14.9 million for the year ended July 31, 2022, an increase of $4.3 million, or 28.9%. The increase in interest expense reflected rising variable interest rates.
Other income, net for the year ended July 31, 2023 was $7.7 million, compared with $9.8 million for the year ended July 31, 2022, a decrease of $2.1 million, or 21.0%, driven by higher pension related expenses, partially offset by higher interest income.
Income Taxes
The effective tax rates were 23.4% and 24.1% for the years ended July 31, 2023 and 2022, respectively. The lower effective tax rate was primarily due to an increase in tax benefits on export income and an overall increase in discrete tax benefits.
Net Earnings
Net earnings for the year ended July 31, 2023 were $358.8 million, compared with $332.8 million for the year ended July 31, 2022, an increase of $26.0 million, or 7.8%. Diluted EPS were $2.90 for the year ended July 31, 2023, compared with $2.66 for the year ended July 31, 2022.
Net earnings were impacted by fluctuations in foreign currency exchange rates. The impact of these fluctuations on net earnings was as follows (in millions):
|
|
|
|
|
|
|
|
|
|
|
|
|
|
|
|
|
Year Ended July 31, |
|
|
2023 |
|
2022 |
| Prior year net earnings |
|
$ |
332.8 |
|
|
$ |
286.9 |
|
| Change in net earnings excluding translation |
|
40.4 |
|
|
56.8 |
|
Impact of foreign currency translation(1) |
|
(14.4) |
|
|
(10.9) |
|
| Current year net earnings |
|
$ |
358.8 |
|
|
$ |
332.8 |
|
(1)The impact of foreign currency translation was calculated by translating current fiscal year foreign currency net earnings into U.S. dollars using the average foreign currency exchange rates for the prior fiscal year.
Restructuring
During the first quarter of fiscal 2023, the Company announced a company-wide organizational redesign to further support the Company’s growth strategies and better serve its customers. In conjunction with the organizational redesign, the Company recorded $21.8 million of charges consisting of $15.3 million of severance charges and other organizational redesign costs and $6.5 million of costs mainly associated with the exiting of a lower-margin customer program and a lower-margin product. Charges of $2.9 million were included in cost of sales and $18.9 million were included in selling, general and administrative expenses in the accompanying Consolidated Statements of Earnings.
Segment Results of Operations
Net sales and earnings before income taxes were as follows (in millions):
|
|
|
|
|
|
|
|
|
|
|
|
|
|
|
|
|
|
|
|
|
|
|
|
|
|
|
|
|
|
|
|
|
|
|
|
|
|
|
|
|
|
|
|
|
|
|
Year Ended July 31, |
|
2023 VS 2022 |
|
2022 VS 2021 |
|
|
2023 |
|
2022 |
|
2021 |
|
$ Change |
|
% Change |
|
$ Change |
|
% Change |
| Net sales |
|
|
|
|
|
|
|
|
|
|
|
|
|
|
| Mobile Solutions |
|
$ |
2,174.8 |
|
|
$ |
2,126.5 |
|
|
$ |
1,818.4 |
|
|
$ |
48.3 |
|
|
2.3 |
% |
|
$ |
308.1 |
|
|
16.9 |
% |
| Industrial Solutions |
|
1,014.7 |
|
|
901.0 |
|
|
781.0 |
|
|
113.7 |
|
|
12.6 |
|
|
120.0 |
|
|
15.4 |
|
| Life Sciences |
|
241.3 |
|
|
279.1 |
|
|
254.5 |
|
|
(37.8) |
|
|
(13.5) |
|
|
24.6 |
|
|
9.7 |
|
| Total Company |
|
$ |
3,430.8 |
|
|
$ |
3,306.6 |
|
|
$ |
2,853.9 |
|
|
$ |
124.2 |
|
|
3.8 |
% |
|
$ |
452.7 |
|
|
15.9 |
% |
|
|
|
|
|
|
|
|
|
|
|
|
|
|
|
| Earnings (loss) before income taxes |
|
|
|
|
|
|
|
|
|
|
|
|
|
|
| Mobile Solutions |
|
$ |
330.4 |
|
|
$ |
293.8 |
|
|
$ |
276.1 |
|
|
$ |
36.6 |
|
|
12.5 |
% |
|
$ |
17.7 |
|
|
6.4 |
% |
| Industrial Solutions |
|
186.2 |
|
|
133.0 |
|
|
81.0 |
|
|
53.2 |
|
|
40.0 |
|
|
52.0 |
|
|
64.2 |
|
| Life Sciences |
|
9.9 |
|
|
64.9 |
|
|
65.2 |
|
|
(55.0) |
|
|
(84.7) |
|
|
(0.3) |
|
|
(0.5) |
|
Corporate and unallocated(1) |
|
(57.8) |
|
|
(53.3) |
|
|
(41.3) |
|
|
(4.5) |
|
|
(8.4) |
|
|
(12.0) |
|
|
29.1 |
|
| Total Company |
|
$ |
468.7 |
|
|
$ |
438.4 |
|
|
$ |
381.0 |
|
|
$ |
30.3 |
|
|
6.9 |
% |
|
$ |
57.4 |
|
|
15.1 |
% |
|
|
|
|
|
|
|
|
|
|
|
|
|
|
|
(1)Corporate and unallocated includes interest expense and certain corporate expenses determined to be non-allocable to the segments, such as restructuring charges and business development expenses.
Mobile Solutions Segment
Net sales and earnings before income taxes were as follows (in millions):
|
|
|
|
|
|
|
|
|
|
|
|
|
|
|
|
|
|
|
|
|
|
|
|
|
|
|
|
|
|
|
|
|
|
|
|
|
|
|
|
|
|
|
|
|
|
|
Year Ended July 31, |
|
2023 VS 2022 |
|
2022 VS 2021 |
|
|
2023 |
|
2022 |
|
2021 |
|
$ Change |
|
% Change |
|
$ Change |
|
% Change |
| Net sales |
|
|
|
|
|
|
|
|
|
|
|
|
|
|
| Off-Road |
|
$ |
428.7 |
|
|
$ |
390.5 |
|
|
$ |
316.3 |
|
|
$ |
38.2 |
|
|
9.8 |
% |
|
$ |
74.2 |
|
|
23.5 |
% |
| On-Road |
|
145.8 |
|
|
136.1 |
|
|
138.8 |
|
|
9.7 |
|
|
7.2 |
|
|
(2.7) |
|
|
(1.9) |
|
| Aftermarket |
|
1,600.3 |
|
|
1,599.9 |
|
|
1,363.3 |
|
|
0.4 |
|
|
— |
|
|
236.6 |
|
|
17.4 |
|
| Total Mobile Solutions segment |
|
$ |
2,174.8 |
|
|
$ |
2,126.5 |
|
|
$ |
1,818.4 |
|
|
$ |
48.3 |
|
|
2.3 |
% |
|
$ |
308.1 |
|
|
16.9 |
% |
|
|
|
|
|
|
|
|
|
|
|
|
|
|
|
| Mobile Solutions segment earnings before income taxes |
|
$ |
330.4 |
|
|
$ |
293.8 |
|
|
$ |
276.1 |
|
|
$ |
36.6 |
|
|
12.5 |
% |
|
$ |
17.7 |
|
|
6.4 |
% |
Fiscal 2023 compared with Fiscal 2022
Net sales for the Mobile Solutions segment for the year ended July 31, 2023 were $2,174.8 million, compared with $2,126.5 million for the year ended July 31, 2022, an increase of $48.3 million, or 2.3%. Excluding a $73.8 million decrease from foreign currency translation, net sales increased 5.7%.
Net sales of Off-Road increased $38.2 million, primarily due to pricing actions and high levels of global equipment production. Net sales of Aftermarket increased $0.4 million, primarily driven by pricing, offset by volume decline generally resulting from large OEM customer inventory reductions.
Earnings before income taxes for the Mobile Solutions segment for the year ended July 31, 2023 were $330.4 million, or 15.2% of net sales, an increase from 13.8% of net sales for the year ended July 31, 2022. The increase was driven by pricing actions, which were partially offset by higher input costs.
Fiscal 2022 compared with Fiscal 2021
Net sales for the Mobile Solutions segment for the year ended July 31, 2022 were $2,126.5 million, compared with $1,818.4 million for the year ended July 31, 2021, an increase of $308.1 million, or 16.9%. Excluding a $52.1 million decrease from foreign currency translation, net sales increased 19.8%.
Net sales of Off-Road increased $74.2 million primarily due to increased pricing, continued high equipment production levels in most regions, with the exception of mainland China, and strong sales for Emissions Systems in EMEA. Net sales of Aftermarket increased $236.6 million, which reflected broad growth across all regions driven by pricing and continued high end-market demand.
Earnings before income taxes for the Mobile Solutions segment for the year ended July 31, 2022 were $293.8 million, or 13.8% of net sales, a decrease from 15.2% of net sales for the year ended July 31, 2021. The decrease was driven by supply chain disruptions, which increased input costs, including raw material, freight, labor and energy costs, partially offset by pricing.
Industrial Solutions Segment
Net sales and earnings before income taxes were as follows (in millions):
|
|
|
|
|
|
|
|
|
|
|
|
|
|
|
|
|
|
|
|
|
|
|
|
|
|
|
|
|
|
|
|
|
|
|
|
|
|
|
|
|
|
|
|
|
|
|
Year Ended July 31, |
|
2023 VS 2022 |
|
2022 VS 2021 |
|
|
2023 |
|
2022 |
|
2021 |
|
$ Change |
|
% Change |
|
$ Change |
|
% Change |
| Net sales |
|
|
|
|
|
|
|
|
|
|
|
|
|
|
| Industrial Filtration Solutions (IFS) |
|
$ |
872.2 |
|
|
$ |
780.5 |
|
|
$ |
684.8 |
|
|
$ |
91.7 |
|
|
11.7 |
% |
|
$ |
95.7 |
|
|
14.0 |
% |
| Aerospace and Defense |
|
142.5 |
|
|
120.5 |
|
|
96.2 |
|
|
22.0 |
|
|
18.3 |
|
|
24.3 |
|
|
25.3 |
|
| Total Industrial Solutions segment |
|
$ |
1,014.7 |
|
|
$ |
901.0 |
|
|
$ |
781.0 |
|
|
$ |
113.7 |
|
|
12.6 |
% |
|
$ |
120.0 |
|
|
15.4 |
% |
|
|
|
|
|
|
|
|
|
|
|
|
|
|
|
| Industrial Solutions segment earnings before income taxes |
|
$ |
186.2 |
|
|
$ |
133.0 |
|
|
$ |
81.0 |
|
|
$ |
53.2 |
|
|
40.0 |
% |
|
$ |
52.0 |
|
|
64.2 |
% |
Fiscal 2023 compared with Fiscal 2022
Net sales for the Industrial Solutions segment for the year ended July 31, 2023 were $1,014.7 million, compared with $901.0 million for the year ended July 31, 2022, an increase of $113.7 million, or 12.6%. Excluding a $26.8 million decrease from foreign currency translation, net sales increased 15.6%.
Net sales of IFS increased $91.7 million, reflecting higher sales volume in industrial dust collection, a higher level of large power generation projects and pricing benefits. Net sales of Aerospace and Defense increased by $22.0 million due to strong demand in the fixed wing and rotorcraft end markets and timing of defense projects.
Earnings before income taxes for the Industrial Solutions segment for the year ended July 31, 2023 were $186.2 million, or 18.4% of net sales, an increase from 14.8% of net sales for the year ended July 31, 2022. The increase was primarily due to the impact from pricing actions, operational efficiencies and leveraging of operating expenses, partially offset by higher input costs.
Fiscal 2022 compared with Fiscal 2021
Net sales for the Industrial Solutions segment for the year ended July 31, 2022 were $901.0 million, compared with $781.0 million for the year ended July 31, 2021, an increase of $120.0 million, or 15.4%. Excluding a $21.4 million decrease from foreign currency translation, net sales increased 18.1%.
Net sales of IFS increased $95.7 million, primarily in the U.S., reflecting improved end-market conditions in Industrial Air Filtration for both first-fit and replacement parts of dust collection products. Net sales of Aerospace and Defense increased by $24.3 million resulting from stronger economic conditions as part of the COVID-19 recovery in the commercial aerospace industry and market share gains.
Earnings before income taxes for the Industrial Solutions segment for the year ended July 31, 2022 were $133.0 million, or 14.8% of net sales, an increase from 10.4% of net sales for the year ended July 31, 2021. The increase was driven by higher sales leveraging operating expenses and pricing, partially offset by supply chain disruptions which increased input costs, including raw material, freight, labor and energy costs.
Life Sciences Segment
Net sales and earnings before income taxes were as follows (in millions):
|
|
|
|
|
|
|
|
|
|
|
|
|
|
|
|
|
|
|
|
|
|
|
|
|
|
|
|
|
|
|
|
|
|
|
|
|
|
|
|
|
|
|
|
|
|
|
|
|
|
|
Year Ended July 31, |
|
|
|
|
|
2023 VS 2022 |
|
2022 VS 2021 |
|
|
2023 |
|
2022 |
|
2021 |
|
|
|
|
|
$ Change |
|
% Change |
|
$ Change |
|
% Change |
|
|
|
|
|
|
|
|
|
|
|
|
|
|
|
|
|
|
|
|
|
|
|
|
|
|
|
|
|
|
|
|
|
|
|
|
|
|
| Life Sciences segment net sales |
|
$ |
241.3 |
|
|
$ |
279.1 |
|
|
$ |
254.5 |
|
|
|
|
|
|
$ |
(37.8) |
|
|
(13.5) |
% |
|
$ |
24.6 |
|
|
9.7 |
% |
| Life Sciences segment earnings before income taxes |
|
$ |
9.9 |
|
|
$ |
64.9 |
|
|
$ |
65.2 |
|
|
|
|
|
|
$ |
(55.0) |
|
|
(84.7) |
% |
|
$ |
(0.3) |
|
|
(0.5) |
% |
|
|
|
|
|
|
|
|
|
|
|
|
|
|
|
|
|
|
|
Fiscal 2023 compared with Fiscal 2022
Net sales for the Life Sciences segment for the year ended July 31, 2023 were $241.3 million, compared with $279.1 million for the year ended July 31, 2022, a decrease of $37.8 million, or 13.5%. Excluding a $12.7 million decrease from foreign currency translation, net sales decreased 9.0%, primarily driven by weakness in market demand for products in the disk drive business, which more than offset growth in the food and beverage and bioprocessing businesses.
Earnings before income taxes for the Life Sciences segment for the year ended July 31, 2023 were $9.9 million, or 4.1% of net sales, a decrease from 23.3% of net sales for the year ended July 31, 2022. The decrease was driven by lower disk drive sales volumes causing a decline in profitability and the expected initial negative earnings impact from the Company’s recent acquisitions.
Fiscal 2022 compared with Fiscal 2021
Net sales for the Life Sciences segment for the year ended July 31, 2022 were $279.1 million, compared with $254.5 million for the year ended July 31, 2021, an increase of $24.6 million, or 9.7%. Excluding a $13.6 million decrease from foreign currency translation, net sales increased 15.0%. The increase was driven by strength in the EMEA food and beverage business.
Earnings before income taxes for the Life Sciences segment for the year ended July 31, 2022 were $64.9 million, or 23.3% of net sales, a decrease from 25.6% of net sales for the year ended July 31, 2021. The decrease was driven by supply chain disruptions which increased input costs, including raw material, freight, labor and energy costs, partially offset by pricing.
Liquidity, Capital Resources, Capital Requirements and Financial Condition
Liquidity
Liquidity is assessed in terms of the Company’s ability to generate cash to fund its operating, investing and financing activities. Significant factors affecting liquidity are cash flows generated from operating activities, capital expenditures, acquisitions, dividends, repurchases of outstanding shares, adequacy of available credit facilities and the ability to attract long-term capital with satisfactory terms. The Company generates substantial cash from the operation of its businesses as its primary source of liquidity, with sufficient liquidity available to fund growth through reinvestment in existing businesses and strategic acquisitions.
Cash Flow Summary
Cash flows were as follows (in millions):
|
|
|
|
|
|
|
|
|
|
|
|
|
|
|
|
|
|
|
|
|
|
|
|
|
July 31, |
|
|
|
|
|
|
2023 |
|
2022 |
|
$ Change |
|
|
| Net cash provided by (used in): |
|
|
|
|
|
|
|
|
| Operating activities |
|
$ |
544.5 |
|
|
$ |
252.8 |
|
|
$ |
291.7 |
|
|
|
| Investing activities |
|
(327.3) |
|
|
(154.0) |
|
|
(173.3) |
|
|
|
| Financing activities |
|
(222.2) |
|
|
(114.2) |
|
|
(108.0) |
|
|
|
| Effect of exchange rate changes on cash |
|
(1.2) |
|
|
(14.1) |
|
|
12.9 |
|
|
|
| Decrease in cash and cash equivalents |
|
$ |
(6.2) |
|
|
$ |
(29.5) |
|
|
$ |
23.3 |
|
|
|
Operating Activities
Cash provided by operating activities for the year ended July 31, 2023 was $544.5 million, compared with $252.8 million for the year ended July 31, 2022, an increase of $291.7 million. The increase in cash provided by operating activities was primarily driven by a reduction in inventory during the year compared to a significant increase in inventory during the prior year, as well as higher earnings.
Investing Activities
Cash used in investing activities for the year ended July 31, 2023 was $327.3 million, compared with $154.0 million for the year ended July 31, 2022, an increase of $173.3 million. In fiscal 2023, the Company acquired Isolere and UTEC for cash consideration of $209.2 million, net of cash acquired, and invested a higher level of capital in various projects, including capacity expansion and tooling for new programs.
Financing Activities
Cash used in financing activities generally relates to the use of cash for payment of dividends and repurchases of the Company’s common stock, net of borrowing activity and proceeds from the exercise of stock options. Cash used in financing activities for the year ended July 31, 2023 was $222.2 million, compared with $114.2 million for the year ended July 31, 2022, an increase of $108.0 million. The increase was primarily driven by net proceeds of $155.4 million from the issuance of debt in the prior year, compared to relatively flat net debt in the current year. This was partially offset by a decrease in the net use of cash associated with share repurchases and the exercise of stock options in the current year of $103.5 million, compared to $157.7 million in the prior year.
To determine the level of dividend and share repurchases, the Company considers recent and projected performance across key financial metrics, including earnings, cash flow from operations and total debt. Dividends paid for the years ended July 31, 2023 and 2022 were $114.4 million and $110.1 million, respectively. Share repurchases for the years ended July 31, 2023 and 2022 were $141.8 million and $170.6 million, respectively.
Capital Resources
Additional sources of liquidity are existing cash and available credit facilities. Cash and cash equivalents as of July 31, 2023 was $187.1 million, compared with $193.3 million as of July 31, 2022. A significant portion of the Company’s cash and cash equivalents is held by subsidiaries throughout the world as over half of the Company’s earnings occur outside the U.S. Additionally, the Company has capacity of $620.7 million available for further borrowing under existing credit facilities as of July 31, 2023.
Short-term borrowing capacity as of July 31, 2023 was as follows (in millions):
|
|
|
|
|
|
|
|
|
|
|
|
|
|
|
|
|
|
|
|
|
|
|
|
|
|
|
|
|
|
|
|
|
|
|
European Commercial Paper Program |
|
U.S. Credit Facilities |
|
European Operations Credit Facilities |
|
Rest of the World Credit Facilities |
|
Total |
| Available short-term credit facilities |
|
$ |
110.3 |
|
|
$ |
100.0 |
|
|
$ |
45.0 |
|
|
$ |
50.8 |
|
|
$ |
306.1 |
|
|
|
|
|
|
|
|
|
|
|
|
| Reductions to borrowing capacity: |
|
|
|
|
|
|
|
|
|
|
| Outstanding borrowings |
|
24.3 |
|
|
9.8 |
|
|
— |
|
|
— |
|
|
34.1 |
|
| Other non-borrowing reductions |
|
— |
|
|
— |
|
|
28.8 |
|
|
18.8 |
|
|
47.6 |
|
| Total reductions |
|
24.3 |
|
|
9.8 |
|
|
28.8 |
|
|
18.8 |
|
|
81.7 |
|
|
|
|
|
|
|
|
|
|
|
|
| Remaining borrowing capacity |
|
$ |
86.0 |
|
|
$ |
90.2 |
|
|
$ |
16.2 |
|
|
$ |
32.0 |
|
|
$ |
224.4 |
|
|
|
|
|
|
|
|
|
|
|
|
Weighted average interest rate as of July 31, 2023 |
|
4.09 |
% |
|
6.17 |
% |
|
N/A |
|
N/A |
|
4.69 |
% |
Other non-borrowing reductions include financial instruments such as bank guarantees and foreign exchange instruments.
Long-term borrowing capacity is maintained through a $500.0 million unsecured revolving credit facility. Borrowings against the credit facility are reported on the Consolidated Balance Sheets. Borrowing capacity as of July 31, 2023 was as follows (in millions):
|
|
|
|
|
|
|
|
|
|
|
|
|
|
|
|
| Revolving credit facility |
|
$ |
500.0 |
|
|
|
|
|
|
|
|
| Reductions to borrowing capacity: |
|
|
|
|
| Outstanding borrowings |
|
96.2 |
|
|
|
| Contingent liability for standby letters of credit |
|
7.5 |
|
|
|
| Total reductions |
|
103.7 |
|
|
|
| Remaining borrowing capacity |
|
$ |
396.3 |
|
|
|
|
|
|
|
|
Weighted average interest rate as of July 31, 2023 |
|
5.09 |
% |
|
|
|
|
|
|
|
|
|
|
|
|
Certain debt agreements contain financial covenants related to interest coverage and leverage ratios, as well as other non-financial covenants. As of July 31, 2023, the Company was in compliance with all such covenants.
Capital Requirements
The Company’s cash requirements within the next 12 months include short-term borrowings, accounts payable, accrued expenses, income taxes payable, dividends payable, purchase commitments and other current liabilities. Additionally, in fiscal 2024, the Company expects its cash paid for capital expenditures to be between $95 million and $115 million, primarily associated with capacity expansion, new products and technologies as well as infrastructure investments.
The Company’s cash requirements greater than 12 months from various contractual obligations and commitments primarily include:
•debt obligations and interest payments - see Note 7. Short-Term Borrowings and Long-Term Debt in the Notes to Consolidated Financial Statements, included in Item 8 of Part II in this Annual Report for further detail of the Company’s debt and the timing of expected future principal and interest payments; and
•operating leases - see Note 9. Leases in the Notes to Consolidated Financial Statements, included in Item 8 of Part II in this Annual Report for further detail of our lease obligations and the timing of expected future payments.
The Company believes the liquidity available from the combination of expected cash generated by operating activities, existing cash and available credit under existing credit facilities will be sufficient to meet its cash requirements for the next 12 months and beyond, including working capital needs, debt service obligations, capital expenditures, payment of dividends, share repurchase activity and potential acquisitions.
Financial Condition
The Company’s total capitalization components and debt-to-capitalization ratio were as follows (in millions):
|
|
|
|
|
|
|
|
|
|
|
|
|
|
|
|
|
|
|
|
|
|
|
|
|
|
|
|
|
July 31, |
|
|
2023 |
|
% |
|
2022 |
|
% |
| Short-term borrowings |
|
$ |
34.1 |
|
|
1.7 |
% |
|
$ |
3.7 |
|
|
0.2 |
% |
| Current maturities of long-term debt |
|
125.0 |
|
|
6.3 |
|
|
— |
|
|
— |
|
| Long-term debt |
|
496.6 |
|
|
25.1 |
|
|
644.3 |
|
|
36.2 |
|
| Total debt |
|
655.7 |
|
|
33.2 |
|
|
648.0 |
|
|
36.4 |
|
|
|
|
|
|
|
|
|
|
| Total stockholders’ equity |
|
1,320.7 |
|
|
66.8 |
|
|
1,133.2 |
|
|
63.6 |
|
| Total capitalization |
|
$ |
1,976.4 |
|
|
100.0 |
% |
|
$ |
1,781.2 |
|
|
100.0 |
% |
|
|
|
|
|
|
|
|
|
|
|
|
|
|
|
|
|
|
As of July 31, 2023, total debt, including short-term borrowings and long-term debt, represented 33.2% of total capitalization, defined as total debt plus total stockholders’ equity, compared with 36.4% as of July 31, 2022.
Long-term debt outstanding as of July 31, 2023 was $496.6 million compared with $644.3 million as of July 31, 2022, a decrease of $147.7 million. In fiscal 2022, the Company received proceeds of $150.0 million of unsecured senior notes for which it had entered into an agreement in fiscal 2021 and had additional borrowings on its revolving credit facilities.
Working Capital
In order to help measure and analyze the impact of working capital management, the Company calculates days sales outstanding as the average accounts receivable, net for the quarter, divided by net sales for the quarter multiplied by the number of days in the quarter. The Company calculates days inventory outstanding as the average inventories, net for the quarter, divided by cost of sales for the quarter multiplied by the number of days in the quarter and calculates inventory turns as the cost of sales for the quarter, annualized by the ratio of the number of days in the year to the number of days in the quarter, divided by the average inventories, net for the quarter. The Company calculates days payable outstanding as the average accounts payable for the quarter, divided by cost of sales for the quarter multiplied by the number of days in the quarter.
Accounts receivable, net as of July 31, 2023 was $599.7 million, compared with $616.6 million as of July 31, 2022, a decrease of $16.9 million. Days sales outstanding were 64 days as of July 31, 2023, an increase from 62 days as of July 31, 2022.
Inventories, net as of July 31, 2023 was $418.1 million, compared with $502.4 million as of July 31, 2022, a decrease of $84.3 million. Days inventory outstanding were 69 days as of July 31, 2023, a decrease from 78 days as of July 31, 2022. Inventory turns were 5.3 times and 4.7 times per year as of July 31, 2023 and 2022, respectively.
Accounts payable as of July 31, 2023 was $304.9 million, compared with $338.5 million as of July 31, 2022, a decrease of $33.6 million. Days payable outstanding were 49 days as of July 31, 2023, a decrease from 52 days as of July 31, 2022.
Off-Balance Sheet Arrangements
Joint Venture Guarantee
The Company has an unconsolidated joint venture, Advanced Filtration Systems Inc. (AFSI), established by the Company and Caterpillar Inc. (Caterpillar) in 1986. AFSI designs and manufactures high-efficiency fluid filters used in Caterpillar’s machinery worldwide. The Company and Caterpillar equally own the shares of AFSI and both companies guarantee certain debt and banking services, including credit and debit cards, merchant processing and treasury management services, of the joint venture. The Company accounts for AFSI as an equity method investment.
The outstanding debt relating to AFSI, which the Company guarantees half, was $59.6 million and $68.8 million as of July 31, 2023 and 2022, respectively. AFSI has $63.0 million in revolving credit facilities which expire in 2024 and $17.0 million in an additional multi-currency revolving credit facility which terminates upon notification of either party. The Company does not believe this guarantee will have a current or future effect on its financial condition, results of operations, liquidity or capital resources.
Critical Accounting Estimates
The Company’s Consolidated Financial Statements are prepared in conformity with GAAP. Our significant accounting policies are disclosed in Note 1 in the Notes to Consolidated Financial Statements included in Item 8 of this Annual Report. The preparation of these Consolidated Financial Statements requires the use of estimates and judgments that affect the reported amounts of assets and liabilities at the date of the Consolidated Financial Statements and the reported amounts of revenue and expenses during the periods presented. Management bases estimates on historical experience and various other assumptions that are believed to be reasonable under the circumstances, the results of which form the basis for making judgments about recorded amounts. The Company believes its use of estimates and underlying accounting assumptions adheres to GAAP and are reasonable and consistently applied. The Company’s Critical Accounting Estimates are those which require more significant assumptions and judgments used in the preparation of its Consolidated Financial Statements and are the most important to aid in fully understanding its financial results. The Company’s Critical Accounting Estimates are as follows:
Revenue Recognition - Variable Consideration
Revenue is measured as the amount of consideration the Company expects to receive in exchange for the fulfillment of performance obligations. The transaction price of a contract could be reduced by variable consideration including volume, purchase rebates and discounts, product refunds and returns. At the time of sale to a customer, the Company records an estimate of variable consideration as a reduction from gross sales. The Company primarily relies on historical experience and anticipated future performance to estimate the variable consideration. Revenue is recognized to the extent it is probable a significant reversal of revenue will not occur when the contingency is resolved.
For volume, purchase rebates and discounts, management estimates are based on the terms of the arrangements with customers, historical payment experience, field inventory levels, volume in quantity or mix of purchases of product during a specified time period and expectations for changes in relevant trends in the future. Actual results may differ from estimates if competitive factors create the need to enhance or reduce sales promotion and incentive accruals or if customer usage and field inventory levels vary from historical trends. Adjustments to sales promotions and incentive accruals are made as actual usage becomes known in order to properly estimate the amounts necessary to generate consumer demand based on market conditions as of the balance sheet date.
For product refunds and returns, estimates are based primarily on the expected number of products sold, the trend in the historical ratio of returns to sales and the historical length of time between the sale and resulting return. Actual refunds and returns could be higher or lower than amounts estimated due to such factors as performance of new products or significant manufacturing or design defects not discovered until after the product is delivered to customers.
Goodwill
Goodwill represents the excess of the purchase price over the fair value of net assets acquired in business combinations under the purchase method of accounting. Goodwill is assessed for impairment annually or if an event occurs or circumstances change that would indicate the carrying amount may be impaired. The Company performed its annual impairment assessment during the third quarter of fiscal 2023. The goodwill impairment assessment is conducted at a reporting unit level, which is one level below the operating segment level and utilizes either a qualitative or quantitative assessment. The Company determined the fair value for all its reporting units was substantially in excess of their respective carrying values and there were no indicators of impairment for any of the reporting units evaluated. In addition, as a result of the organizational redesign, the Company performed a qualitative impairment assessment based on the new segments in the second quarter of fiscal 2023 and concluded there was no impairment. An impairment loss would be recognized when the carrying amount of a reporting unit’s net assets exceeds the estimated fair value of the reporting unit.
The optional qualitative assessment evaluates general economic, industry and entity-specific factors that could impact the reporting units’ fair values. For reporting units evaluated using a qualitative assessment, if it is determined the fair value more likely than not exceeds the carrying value, no further assessment is necessary. For reporting units evaluated using a quantitative assessment, the fair values are determined using an income approach, a market approach or a weighting of the two. The income approach determines fair value based on discounted cash flow models derived from the reporting units’ long-term forecasts. The market approach determines fair value based on earnings multiples derived from prices investors paid for the stocks of comparable publicly traded companies. Estimates and assumptions are utilized in the valuations, including discounted projected cash flows, earnings before interest, taxes, depreciation and amortization margins, terminal value growth rates, revenue growth rates, discount rates and the determination of comparable, publicly traded companies. Changes in these estimates and assumptions could materially affect the determination of fair value and goodwill impairment.
Income Taxes
Management is required to estimate income taxes in each of the jurisdictions in which the Company operates. This process involves estimating current tax exposure and assessing future tax consequences attributable to temporary differences between the financial statement carrying amount of existing assets and liabilities and their respective tax basis. These deferred tax assets and liabilities are measured using the enacted tax rates expected to apply to taxable income in the fiscal years in which those temporary differences are anticipated to reverse based on future taxable income projections and the impact of tax planning strategies. The Company intends to indefinitely reinvest undistributed earnings for certain of its non-U.S. subsidiaries and thus has not provided for income taxes on these earnings.
Additionally, benefits of tax return positions are recognized in the Consolidated Financial Statements when the position is more likely than not to be sustained by the taxing authorities based solely on the technical merits of the position. If the recognition threshold is met, the tax benefit is measured and recognized as the largest amount of tax benefit that in the Company’s judgment is greater than 50% likely to be realized. The Company maintains a reserve for uncertain tax benefits that are currently unresolved and routinely monitors the potential impact of such situations. The liability for unrecognized tax benefits, accrued interest and penalties was $16.7 million and $16.3 million as of July 31, 2023 and 2022, respectively.
The Company believes it is remote that any adjustment necessary to the reserve for income taxes for the next 12 months will be material. However, it is possible the ultimate resolution of audits or disputes may result in a material change to the Company’s reserve for income taxes, although the quantification of such potential adjustments cannot be made at this time.
Defined Benefit Pension Plans
The Company incurs expenses for employee benefits provided through defined benefit pension plans. In accounting for these defined benefit pension plans, management must make a variety of estimates and assumptions including discount rates and expected return on plan assets. The Company considers current and historical data and uses a third-party specialist to assist management in determining these estimates.
Discount Rates
The Company’s objective in selecting a discount rate is to select the best estimate of the rate at which the benefit obligations could be effectively settled on the measurement date, taking into account the nature and duration of the benefit obligations of the plan. In making this best estimate, the Company looks at the rates of return on high-quality fixed-income investments currently available and expected to be available, during the period to maturity of the benefits. This process includes assessing the universe of bonds available on the measurement date with a quality rating of Aa or better. Similar appropriate benchmarks are used to determine the discount rate for the non-U.S. plans. The Company utilized a 5.58% and 4.62% weighted average discount rate for its U.S. plans for the years ended July 31, 2023 and 2022, respectively. The Company used a 4.80% and 3.26% weighted average discount rate for its non-U.S. plans for the years ended July 31, 2023 and 2022, respectively.
Expected Long-Term Rate of Return on Plan Assets
The Company considers historical returns and future expected returns for each asset class, as well as the target asset allocation to develop the assumption for each of its U.S. pension plans. The assumption for non-U.S. pension plans reflects the investment allocation and expected total portfolio returns specific to each plan and country.
The Company utilized a 5.66% and 5.41% asset-based weighted average expected return on plan assets for its U.S. plans for the years ended July 31, 2023 and 2022, respectively. The Company utilized a 4.39% and 3.40% asset-based weighted average expected return on plan assets for its non-U.S. plans for the years ended July 31, 2023 and 2022, respectively. The expected returns on plan assets are used to develop the following fiscal years’ expense for the plans.
Alternative Assumptions
If the Company were to use alternative assumptions for its pension plans as of July 31, 2023, a one percentage point change in the assumptions would impact fiscal 2023 net periodic benefit cost as follows (in millions):
|
|
|
|
|
|
|
|
|
|
|
|
|
|
|
|
|
|
|
|
|
|
|
|
|
+1% |
|
(1)% |
| Rate of return |
|
|
|
|
|
$ |
(4.5) |
|
|
$ |
4.5 |
|
| Discount rate |
|
|
|
|
|
$ |
(0.3) |
|
|
$ |
0.8 |
|
|
|
|
|
|
|
|
|
|
|
|
|
|
|
|
|
|
|
|
|
|
|
|
|
|
|
|
|
|
|
|
|
|
|
|
|
The Company’s net periodic benefit cost recognized in the Consolidated Statements of Earnings was $6.2 million, $2.8 million and $5.3 million for the years ended July 31, 2023, 2022 and 2021, respectively. While changes to the Company’s pension plan assumptions would not be expected to impact its net periodic benefit cost by a material amount, such changes could significantly impact the Company’s projected benefit obligation.
Business Combinations
The Company allocates the purchase price of acquired businesses to the estimated fair values of the assets acquired and liabilities assumed, as well as any contingent consideration, where applicable, as of the date of acquisition. The fair values of the long-lived assets acquired, primarily intangible assets, are determined using calculations which can be complex and require significant judgment. Estimates include many factors such as the nature of the acquired company’s business, its historical financial position and results, technology obsolescence, customer retention rates, discount rates, royalty rates and expected future performance. Independent valuation specialists are used to assist in determining certain fair value calculations.
The Company estimates the fair value of acquired customer relationships using the multi-period excess earnings method. This approach is typically applied when cash flows are not directly generated by the asset, but rather, by an operating group which includes the particular asset. Fair value is estimated as the present value of the benefits anticipated from ownership of the asset, in excess of the economic returns required on the investment in contributory assets which are necessary to realize those benefits. The intangible asset’s estimated earnings are determined as the residual earnings after quantifying estimated economic returns from contributory assets. Assumptions used in these calculations include same-customer revenue growth rates, estimated earnings and customer attrition rates.
The Company estimates the fair value of trade names and/or trademarks using the relief from royalty method, which calculates the cost savings associated with owning rather than licensing the assets. Assumed royalty rates are applied to projected revenue for the remaining useful lives of the assets to estimate the royalty savings. Royalty rates are selected based on the attributes of the asset, including reputation and recognition within the industry.
The Company estimates the fair value of technology utilizing the multi-period excess earnings method or the relief from royalty method, depending on the technology asset acquired. The multi-period excess earnings method is consistent with the approach used to value acquired customer relationships and the relief from royalty method is consistent with the approach used to value trade names and/or trademarks.
While the Company uses its best estimates and assumptions, especially at the acquisition date, including its estimates for intangible assets, pre-acquisition contingencies and any contingent consideration, where applicable, the fair value estimates are inherently uncertain and subject to refinement. As a result, during the measurement period, which may be up to one year from the acquisition date, the Company may record adjustments to the assets acquired and liabilities assumed, with the corresponding offset to goodwill. Any adjustments required after the measurement period are recorded in the Consolidated Statements of Earnings. The judgments required in determining the estimated fair values and expected useful lives assigned to each class of assets and liabilities acquired can significantly affect net income.
New Accounting Standard Not Yet Adopted
For the new accounting standard not yet adopted, refer to Note 1 Summary of Significant Accounting Policies in the Notes to Consolidated Financial Statements included in Item 8 of this Annual Report.
Safe Harbor Statement Under the Private Securities Litigation Reform Act of 1995
The Company, through its management, may make forward-looking statements reflecting the Company’s current views with respect to future events and expectations, such as forecasts, plans, trends and projections relating to the Company’s business and financial performance. These forward-looking statements, which may be included in reports filed under the Securities Exchange Act of 1934, as amended (the Exchange Act), in press releases and in other documents and materials as well as in written or oral statements made by or on behalf of the Company, are subject to certain risks and uncertainties, including those discussed in Part I, Item 1A, “Risk Factors” of this Annual Report, which could cause actual results to differ materially from historical results or those anticipated. The words or phrases such as “will likely result,” “are expected to,” “will continue,” “will allow,” “estimate,” “project,” “believe,” “expect,” “anticipate,” “forecast,” “plan” and similar expressions are intended to identify forward-looking statements within the meaning of Section 21E of the Exchange Act and Section 27A of the Securities Act of 1933, as amended, as enacted by the Private Securities Litigation Reform Act of 1995 (PSLRA). In particular, the Company desires to take advantage of the protections of the PSLRA in connection with the forward-looking statements made in this Annual Report. All statements other than statements of historical fact are forward-looking statements. These statements do not guarantee future performance.
These forward-looking statements speak only as of the date such statements are made and are subject to risks and uncertainties that could affect the Company’s performance and could cause the Company’s actual results for future periods to differ materially from any opinions or statements expressed. These factors include, but are not limited to, challenges in global operations; impacts of global economic, industrial and political conditions on product demand; impacts from unexpected events; effects of unavailable raw materials, significant demand fluctuations or material cost inflation; inability to attract and retain qualified personnel; inability to meet customer demand; inability to maintain competitive advantages; threats from disruptive technologies; effects of highly competitive markets with pricing pressure; exposure to customer concentration in certain cyclical industries; inability to manage productivity improvements; inability to achieve commitments related to ESG; results of execution of any acquisition, divestiture and other strategic transactions; vulnerabilities associated with information technology systems and security; inability to protect and enforce intellectual property rights; costs associated with governmental laws and regulations; impacts of foreign currency fluctuations; and effects of changes in capital and credit markets. These and other factors are described in Part I, Item 1A, “Risk Factors” of this Annual Report. The Company undertakes no obligation to publicly update or revise any forward-looking statements, whether as a result of new information, future events or otherwise, unless required by law.
Item 7A. Quantitative and Qualitative Disclosures About Market Risk
The Company’s market risk includes the potential loss arising from adverse changes in foreign currency exchange rates, interest rates and commodity prices. To manage these risks, the Company employs certain strategies to mitigate the effect of these fluctuations. The Company does not enter into any of these strategies for trading or speculative purposes.
The Company maintains significant assets and operations outside the U.S., resulting in exposure to foreign currency gains and losses. A portion of the Company’s foreign currency exposure is naturally hedged by incurring liabilities, including bank debt, denominated in the local currency in which the Company’s foreign subsidiaries are located.
During fiscal 2023, the U.S. dollar was generally stronger than in fiscal 2022 compared with many of the currencies of the foreign countries in which the Company operates. The overall stronger dollar had a negative impact on the Company’s international net sales and net earnings because the foreign denominated revenues translated into less U.S. dollars in many regions around the world. The estimated impact of foreign currency translation for the year ended July 31, 2023 resulted in an overall decrease in reported net sales of $113.4 million and a decrease in reported net earnings of $14.4 million.
Derivative Fair Value Measurements
The Company enters into derivative instrument agreements, including foreign currency forward contracts and net investment hedges, to manage risk in connection with changes in foreign currency. The Company only enters into derivative instrument agreements with counterparties who have highly rated credit. See Notes 12, 15 and 16 in the Notes to Consolidated Financial Statements in Item 8 of this Annual Report.
Foreign Currency Forward Contracts - Cash Flow Hedges and Derivatives Not Designated as Hedging Instruments
The Company buys materials from foreign suppliers. Those transactions can be denominated in those suppliers’ local currency. The Company also sells to customers in foreign countries. Those transactions can be denominated in those customers’ local currency. Both of these transaction types can create volatility in the Company’s financial statements. The Company uses foreign currency forward contracts to manage those exposures and fluctuations. These contracts generally mature in 12 months or less, which is consistent with the forecasts of the related purchases and sales. Certain contracts are designated as cash flow hedges, whereas the remaining contracts, most of which are related to certain intercompany transactions which offset balance sheet exposure, are not designated as hedging instruments. The total notional amounts of the foreign currency forward contracts designated as hedges as of July 31, 2023 and 2022 were $84.9 million and $158.0 million, respectively. The total notional amounts of the foreign currency forward contracts not designated as hedges as of July 31, 2023 and 2022 were $147.5 million and $151.6 million, respectively.
Net Investment Hedges
The Company uses fixed-to-fixed cross-currency swap agreements to hedge its exposure to adverse foreign currency exchange rate movements for its operations in Europe. The Company has elected the spot method for designating these contracts as net investment hedges.
The total notional amount of net investment hedges as of July 31, 2023 and 2022 was €80 million, or $88.8 million. The maturity dates range from 2027 to 2029.
Based on the net investment hedges outstanding as of July 31, 2023, a 10% appreciation of the U.S. dollar compared to the Euro, would result in a net gain of $7.7 million in the fair value of these contracts.
Interest Rates
The Company’s exposure to market risk for changes in interest rates primarily relates to debt obligations that are at variable rates, as well as the potential increase in the fair value of long-term debt resulting from a potential decrease in interest rates. As of July 31, 2023, the Company’s financial liabilities with exposure to changes in interest rates consisted mainly of €60.0 million and $30.0 million, or a total of $96.2 million, outstanding on the Company’s unsecured revolving credit facility, €80.0 million, or $88.2 million of a variable rate term loan and ¥2.0 billion, or $14.0 million, of variable rate senior notes. As of July 31, 2023, additional short-term borrowings outstanding consisted of $34.1 million. Assuming a hypothetical 0.5 percentage point increase in short-term interest rates, with all other variables remaining constant, interest expense would have increased approximately $1.2 million and interest income would have increased by approximately $0.9 million in fiscal 2023. Interest rate changes would also affect the fair market value of fixed-rate debt. As of July 31, 2023, the estimated fair values of fixed interest rate long-term debt were $378.9 million compared to the carrying values of $425.0 million. The fair values are estimated by discounting the projected cash flows using the interest rates at which similar amounts of debt could currently be borrowed.
In addition, the Company is exposed to market risk for changes in interest rates for the impact to its qualified defined benefit pension plans. The plans’ projected benefit obligation is inversely related to changes in interest rates. Consistent with published bond indices, in fiscal 2023, the Company increased its weighted average discount rate from 4.62% to 5.58% on its U.S. plans and increased its weighted average discount rate from 3.26% to 4.80% on its non-U.S. plans. To protect against declines in interest rates, the pension plans hold high-quality, long-duration bonds. The rates impact both the projected benefit obligation and the fair value of the plan assets and hence, the funded status of the plans. The plans were overfunded by $14.9 million as of July 31, 2023, since the fair value of the plan assets exceeded the projected benefit obligation.
Commodity Prices
The Company is exposed to market risk from fluctuating prices of purchased commodity raw materials, including steel, filter media and petrochemical-based products including plastics, rubber and adhesives. On an ongoing basis, the Company enters into selective supply arrangements that allow the Company to reduce volatility in its costs. The Company strives to recover or offset all material cost increases through price increases to its customers and the Company’s cost reduction initiatives, which include material substitution, process improvement and product redesigns. However, an increase in commodity prices could result in lower gross profit.
Bankers’ Acceptance Notes
Consistent with common business practice in APAC, the Company has subsidiaries which accept bankers’ acceptance notes from their customers in settlement of certain customer billed accounts receivable. Bankers’ acceptance notes represent a commitment by the issuing financial institution to pay a certain amount of money at a specified future maturity date to the legal owner of the bankers’ acceptance note as of the maturity date. The maturity dates of bankers’ acceptance notes vary, but it is the Company’s policy to only accept bankers’ acceptance notes with maturity dates no more than 180 days from the date of the Company’s receipt of such draft. As of July 31, 2023 and 2022, the Company owned $13.2 million and $12.6 million, respectively, of these bankers’ acceptance notes and includes them in accounts receivable on the Consolidated Balance Sheets.
Item 8. Financial Statements and Supplementary Data
Management’s Report on Internal Control over Financial Reporting
Management is responsible for establishing and maintaining adequate internal control over financial reporting, as such term is defined in Exchange Act Rule 13a-15(f). Management of the Company has assessed the effectiveness of the Company’s internal control over financial reporting as of July 31, 2023. In making its assessment of internal control over financial reporting, management used the criteria described in Internal Control - Integrated Framework - version 2013 issued by the Committee of Sponsoring Organizations of the Treadway Commission (COSO). Based on this evaluation, management concluded that the Company’s internal control over financial reporting was effective as of July 31, 2023 based on criteria in Internal Control - Integrated Framework issued by the COSO. The Company’s independent registered public accounting firm, PricewaterhouseCoopers LLP, has audited the effectiveness of the Company’s internal control over financial reporting as of July 31, 2023, as stated in its report, which appears herein.
|
|
|
|
|
|
|
|
|
| /s/ Tod E. Carpenter |
|
/s/ Scott J. Robinson |
|
|
|
| Tod E. Carpenter |
|
Scott J. Robinson |
| Chairman, President and Chief Executive Officer |
|
Chief Financial Officer |
| September 22, 2023 |
|
September 22, 2023 |
Report of Independent Registered Public Accounting Firm
To the Board of Directors and Stockholders of Donaldson Company, Inc.
Opinions on the Financial Statements and Internal Control over Financial Reporting
We have audited the accompanying consolidated balance sheets of Donaldson Company, Inc. and its subsidiaries (the “Company”) as of July 31, 2023 and 2022, and the related consolidated statements of earnings, of comprehensive income, of changes in stockholders’ equity and of cash flows for each of the three years in the period ended July 31, 2023, including the related notes (collectively referred to as the “consolidated financial statements”). We also have audited the Company's internal control over financial reporting as of July 31, 2023, based on criteria established in Internal Control - Integrated Framework (2013) issued by the Committee of Sponsoring Organizations of the Treadway Commission (COSO).
In our opinion, the consolidated financial statements referred to above present fairly, in all material respects, the financial position of the Company as of July 31, 2023 and 2022, and the results of its operations and its cash flows for each of the three years in the period ended July 31, 2023 in conformity with accounting principles generally accepted in the United States of America. Also in our opinion, the Company maintained, in all material respects, effective internal control over financial reporting as of July 31, 2023, based on criteria established in Internal Control - Integrated Framework (2013) issued by the COSO.
Basis for Opinions
The Company’s management is responsible for these consolidated financial statements, for maintaining effective internal control over financial reporting, and for its assessment of the effectiveness of internal control over financial reporting, included in the accompanying Management’s Report on Internal Control over Financial Reporting. Our responsibility is to express opinions on the Company’s consolidated financial statements and on the Company’s internal control over financial reporting based on our audits. We are a public accounting firm registered with the Public Company Accounting Oversight Board (United States) (PCAOB) and are required to be independent with respect to the Company in accordance with the U.S. federal securities laws and the applicable rules and regulations of the Securities and Exchange Commission and the PCAOB.
We conducted our audits in accordance with the standards of the PCAOB. Those standards require that we plan and perform the audits to obtain reasonable assurance about whether the consolidated financial statements are free of material misstatement, whether due to error or fraud, and whether effective internal control over financial reporting was maintained in all material respects.
Our audits of the consolidated financial statements included performing procedures to assess the risks of material misstatement of the consolidated financial statements, whether due to error or fraud, and performing procedures that respond to those risks. Such procedures included examining, on a test basis, evidence regarding the amounts and disclosures in the consolidated financial statements. Our audits also included evaluating the accounting principles used and significant estimates made by management, as well as evaluating the overall presentation of the consolidated financial statements. Our audit of internal control over financial reporting included obtaining an understanding of internal control over financial reporting, assessing the risk that a material weakness exists, and testing and evaluating the design and operating effectiveness of internal control based on the assessed risk. Our audits also included performing such other procedures as we considered necessary in the circumstances. We believe that our audits provide a reasonable basis for our opinions.
Definition and Limitations of Internal Control over Financial Reporting
A company’s internal control over financial reporting is a process designed to provide reasonable assurance regarding the reliability of financial reporting and the preparation of financial statements for external purposes in accordance with generally accepted accounting principles. A company’s internal control over financial reporting includes those policies and procedures that (i) pertain to the maintenance of records that, in reasonable detail, accurately and fairly reflect the transactions and dispositions of the assets of the company; (ii) provide reasonable assurance that transactions are recorded as necessary to permit preparation of financial statements in accordance with generally accepted accounting principles, and that receipts and expenditures of the company are being made only in accordance with authorizations of management and directors of the company; and (iii) provide reasonable assurance regarding prevention or timely detection of unauthorized acquisition, use, or disposition of the company’s assets that could have a material effect on the financial statements.
Because of its inherent limitations, internal control over financial reporting may not prevent or detect misstatements. Also, projections of any evaluation of effectiveness to future periods are subject to the risk that controls may become inadequate because of changes in conditions, or that the degree of compliance with the policies or procedures may deteriorate.
Critical Audit Matters
The critical audit matter communicated below is a matter arising from the current period audit of the consolidated financial statements that was communicated or required to be communicated to the audit committee and that (i) relates to accounts or disclosures that are material to the consolidated financial statements and (ii) involved our especially challenging, subjective, or complex judgments. The communication of critical audit matters does not alter in any way our opinion on the consolidated financial statements, taken as a whole, and we are not, by communicating the critical audit matter below, providing a separate opinion on the critical audit matter or on the accounts or disclosures to which it relates.
Revenue Recognition - Product Sales
As described in Notes 1 and 3 to the consolidated financial statements, net sales were $3,430.8 million for the year ended July 31, 2023, of which a majority pertains to product sales. Revenue is measured as the amount of consideration the Company expects to receive in exchange for the fulfillment of performance obligations. For most customer contracts, the Company recognizes revenue at a point in time when control of the goods is transferred to the customer. For product sales, control is typically deemed to have transferred in accordance with the shipping terms, either at the time of shipment from the plants or distribution centers or the time of delivery to the customers. The transaction price of a contract could be reduced by variable consideration including volume, purchase rebates and discounts, product refunds and returns. At the time of sale to a customer, the Company records an estimate of variable consideration as a reduction from gross sales. Revenue is recognized to the extent it is probable a significant reversal of revenue will not occur when the contingency is resolved.
The principal consideration for our determination that performing procedures relating to revenue recognition for product sales is a critical audit matter is a high degree of auditor effort in performing procedures related to the Company’s revenue recognition.
Addressing the matter involved performing procedures and evaluating audit evidence in connection with forming our overall opinion on the consolidated financial statements. These procedures included testing the effectiveness of controls relating to the revenue recognition process. These procedures also included, among others (i) evaluating certain revenue transactions by either (a) testing the issuance and settlement of invoices and credit memos, tracing transactions not settled to a detailed listing of accounts receivable, and testing the completeness and accuracy of data provided by management or (b) testing, on a sample basis, the revenue recognized by obtaining and inspecting source documents, including executed contracts, invoices, shipment or delivery documents, and cash receipts, as applicable; (ii) testing, on a sample basis, the recognition of variable consideration for rebates issued during the year by obtaining and inspecting source documents, including support for the nature of the rebate, amount, and agreement with the customer; and (iii) confirming, on a sample basis, outstanding customer invoice balances as of year-end and, and for confirmations not returned, obtaining and inspecting source documents, including executed contracts, invoices, shipment or delivery documents, and subsequent cash receipts, as applicable.
/s/ PricewaterhouseCoopers LLP
Minneapolis, Minnesota
September 22, 2023
We have served as the Company’s auditor since 2002.
DONALDSON COMPANY, INC. AND SUBSIDIARIES
CONSOLIDATED STATEMENTS OF EARNINGS
(In millions, except per share amounts)
|
|
|
|
|
|
|
|
|
|
|
|
|
|
|
|
|
|
|
|
|
|
|
Year Ended July 31, |
|
|
2023 |
|
2022 |
|
2021 |
| Net sales |
|
$ |
3,430.8 |
|
|
$ |
3,306.6 |
|
|
$ |
2,853.9 |
|
| Cost of sales |
|
2,270.2 |
|
|
2,239.2 |
|
|
1,882.2 |
|
| Gross profit |
|
1,160.6 |
|
|
1,067.4 |
|
|
971.7 |
|
| Selling, general and administrative |
|
602.3 |
|
|
554.8 |
|
|
519.2 |
|
| Research and development |
|
78.1 |
|
|
69.1 |
|
|
67.8 |
|
| Operating expenses |
|
680.4 |
|
|
623.9 |
|
|
587.0 |
|
| Operating income |
|
480.2 |
|
|
443.5 |
|
|
384.7 |
|
| Interest expense |
|
19.2 |
|
|
14.9 |
|
|
13.0 |
|
| Other income, net |
|
(7.7) |
|
|
(9.8) |
|
|
(9.3) |
|
| Earnings before income taxes |
|
468.7 |
|
|
438.4 |
|
|
381.0 |
|
| Income taxes |
|
109.9 |
|
|
105.6 |
|
|
94.1 |
|
| Net earnings |
|
$ |
358.8 |
|
|
$ |
332.8 |
|
|
$ |
286.9 |
|
|
|
|
|
|
|
|
| Weighted average shares – basic |
|
121.8 |
|
|
123.7 |
|
|
126.4 |
|
| Weighted average shares – diluted |
|
123.6 |
|
|
125.2 |
|
|
128.2 |
|
|
|
|
|
|
|
|
| Net earnings per share – basic |
|
$ |
2.95 |
|
|
$ |
2.69 |
|
|
$ |
2.27 |
|
| Net earnings per share – diluted |
|
$ |
2.90 |
|
|
$ |
2.66 |
|
|
$ |
2.24 |
|
See Notes to Consolidated Financial Statements.
DONALDSON COMPANY, INC. AND SUBSIDIARIES
CONSOLIDATED STATEMENTS OF COMPREHENSIVE INCOME
(In millions)
|
|
|
|
|
|
|
|
|
|
|
|
|
|
|
|
|
|
|
|
|
|
|
Year Ended July 31, |
|
|
2023 |
|
2022 |
|
2021 |
| Net earnings |
|
$ |
358.8 |
|
|
$ |
332.8 |
|
|
$ |
286.9 |
|
| Other comprehensive income: |
|
|
|
|
|
|
| Foreign currency translation income (loss) |
|
34.0 |
|
|
(99.6) |
|
|
30.0 |
|
Pension liability adjustment, net of deferred taxes of $(0.3), $(2.1) and $(11.5), respectively |
|
0.3 |
|
|
7.2 |
|
|
35.3 |
|
| Derivatives: |
|
|
|
|
|
|
(Loss) gain on hedging derivatives, net of deferred taxes of $0.5, $(2.0) and $(0.2), respectively |
|
(1.4) |
|
|
7.2 |
|
|
0.8 |
|
Reclassification of gain (loss) on hedging derivatives to net earnings, net of taxes of $(0.1), $0.5 and $(0.1), respectively |
|
0.2 |
|
|
(2.2) |
|
|
(0.3) |
|
| Total derivatives |
|
(1.2) |
|
|
5.0 |
|
|
0.5 |
|
| Net other comprehensive income (loss) |
|
33.1 |
|
|
(87.4) |
|
|
65.8 |
|
| Comprehensive income |
|
$ |
391.9 |
|
|
$ |
245.4 |
|
|
$ |
352.7 |
|
See Notes to Consolidated Financial Statements.
DONALDSON COMPANY, INC. AND SUBSIDIARIES
CONSOLIDATED BALANCE SHEETS
(In millions, except share and per share amounts)
|
|
|
|
|
|
|
|
|
|
|
|
|
As of July 31, |
|
2023 |
|
2022 |
| Assets |
|
|
|
| Current assets: |
|
|
|
| Cash and cash equivalents |
$ |
187.1 |
|
|
$ |
193.3 |
|
Accounts receivable, less allowances of $8.3 and $7.6, respectively |
599.7 |
|
|
616.6 |
|
| Inventories, net |
418.1 |
|
|
502.4 |
|
| Prepaid expenses and other current assets |
81.1 |
|
|
94.2 |
|
| Total current assets |
1,286.0 |
|
|
1,406.5 |
|
| Property, plant and equipment, net |
652.9 |
|
|
594.4 |
|
|
|
|
|
| Goodwill |
481.1 |
|
|
345.8 |
|
| Intangible assets, net |
188.1 |
|
|
99.8 |
|
|
|
|
|
| Other long-term assets |
162.4 |
|
|
153.8 |
|
| Total assets |
$ |
2,770.5 |
|
|
$ |
2,600.3 |
|
|
|
|
|
| Liabilities and Stockholders’ Equity |
|
|
|
| Current liabilities: |
|
|
|
| Short-term borrowings |
$ |
34.1 |
|
|
$ |
3.7 |
|
| Current maturities of long-term debt |
125.0 |
|
|
— |
|
| Accounts payable |
304.9 |
|
|
338.5 |
|
| Accrued employee compensation and related taxes |
119.4 |
|
|
113.8 |
|
| Deferred revenue |
25.3 |
|
|
22.3 |
|
| Income taxes payable |
32.3 |
|
|
31.8 |
|
| Dividend payable |
30.4 |
|
|
28.3 |
|
| Other current liabilities |
85.0 |
|
|
91.2 |
|
| Total current liabilities |
756.4 |
|
|
629.6 |
|
| Long-term debt |
496.6 |
|
|
644.3 |
|
| Non-current income taxes payable |
56.5 |
|
|
69.4 |
|
| Deferred income taxes |
32.3 |
|
|
32.7 |
|
| Other long-term liabilities |
108.0 |
|
|
91.1 |
|
| Total liabilities |
1,449.8 |
|
|
1,467.1 |
|
|
|
|
|
Commitments and contingencies (Note 18) |
|
|
|
|
|
|
|
|
|
|
|
| Stockholders’ equity: |
|
|
|
Preferred stock, $1.00 par value, 1,000,000 shares authorized, none issued |
— |
|
|
— |
|
Common stock, $5.00 par value, 240,000,000 shares authorized, 151,643,194 shares issued |
758.2 |
|
|
758.2 |
|
Additional paid-in capital |
24.8 |
|
|
17.0 |
|
| Retained earnings |
2,087.8 |
|
|
1,845.7 |
|
|
|
|
|
|
|
|
|
| Accumulated other comprehensive loss |
(172.5) |
|
|
(205.6) |
|
Treasury stock, 30,528,696 and 29,089,612 shares, respectively, at cost |
(1,377.6) |
|
|
(1,282.1) |
|
| Total stockholders’ equity |
1,320.7 |
|
|
1,133.2 |
|
| Total liabilities and stockholders’ equity |
$ |
2,770.5 |
|
|
$ |
2,600.3 |
|
See Notes to Consolidated Financial Statements.
DONALDSON COMPANY, INC. AND SUBSIDIARIES
CONSOLIDATED STATEMENTS OF CASH FLOWS
(In millions)
|
|
|
|
|
|
|
|
|
|
|
|
|
|
|
|
|
|
|
|
|
| |
|
Year Ended July 31, |
| |
|
2023 |
|
2022 |
|
2021 |
| Operating Activities |
|
|
|
|
|
|
| Net earnings |
|
$ |
358.8 |
|
|
$ |
332.8 |
|
|
$ |
286.9 |
|
| Adjustments to reconcile net earnings to net cash provided by operating activities: |
|
|
|
|
|
|
| Depreciation and amortization |
|
92.3 |
|
|
93.8 |
|
|
95.3 |
|
| Equity in earnings of affiliates, net of distributions |
|
(1.0) |
|
|
0.3 |
|
|
(2.1) |
|
| Deferred income taxes |
|
(15.3) |
|
|
(1.4) |
|
|
(5.9) |
|
| Stock-based compensation expense |
|
20.4 |
|
|
20.4 |
|
|
14.2 |
|
| Other, net |
|
7.3 |
|
|
10.6 |
|
|
19.6 |
|
| Changes in operating assets and liabilities, excluding effect of acquired businesses: |
|
|
|
|
|
|
| Accounts receivable, net |
|
30.1 |
|
|
(100.8) |
|
|
(92.7) |
|
| Inventories, net |
|
99.8 |
|
|
(147.8) |
|
|
(56.3) |
|
| Prepaid expenses and other current assets |
|
16.8 |
|
|
(10.5) |
|
|
(5.3) |
|
| Accounts payable |
|
(39.0) |
|
|
51.1 |
|
|
106.6 |
|
| Income taxes payable |
|
(11.5) |
|
|
4.9 |
|
|
(3.6) |
|
| Deferred revenue |
|
2.1 |
|
|
8.3 |
|
|
(1.2) |
|
| Accrued employee compensation and related taxes and other current liabilities |
|
(16.3) |
|
|
(8.9) |
|
|
46.4 |
|
| Net cash provided by operating activities |
|
544.5 |
|
|
252.8 |
|
|
401.9 |
|
|
|
|
|
|
|
|
| Investing Activities |
|
|
|
|
|
|
| Purchases of property, plant and equipment |
|
(118.5) |
|
|
(85.5) |
|
|
(59.0) |
|
| Proceeds from sale of property, plant and equipment |
|
0.4 |
|
|
0.4 |
|
|
0.7 |
|
|
|
|
|
|
|
|
|
|
|
|
|
|
|
| Acquisitions, net of cash acquired |
|
(209.2) |
|
|
(68.9) |
|
|
— |
|
| Net cash used in investing activities |
|
(327.3) |
|
|
(154.0) |
|
|
(58.3) |
|
|
|
|
|
|
|
|
| Financing Activities |
|
|
|
|
|
|
| Proceeds from long-term debt |
|
189.2 |
|
|
289.3 |
|
|
7.9 |
|
| Repayments of long-term debt |
|
(219.6) |
|
|
(90.0) |
|
|
(170.4) |
|
| Change in short-term borrowings |
|
30.4 |
|
|
(43.9) |
|
|
45.2 |
|
| Purchase of non-controlling interests |
|
— |
|
|
— |
|
|
(14.4) |
|
| Purchase right exercised in finance lease |
|
— |
|
|
— |
|
|
(13.8) |
|
| Purchase of treasury stock |
|
(141.8) |
|
|
(170.6) |
|
|
(142.2) |
|
| Dividends paid |
|
(114.4) |
|
|
(110.1) |
|
|
(107.2) |
|
| Tax withholding for stock compensation transactions |
|
(4.3) |
|
|
(1.8) |
|
|
(4.2) |
|
| Exercise of stock options |
|
38.3 |
|
|
12.9 |
|
|
35.8 |
|
| Net cash used in financing activities |
|
(222.2) |
|
|
(114.2) |
|
|
(363.3) |
|
| Effect of exchange rate changes on cash |
|
(1.2) |
|
|
(14.1) |
|
|
5.9 |
|
Decrease in cash and cash equivalents |
|
(6.2) |
|
|
(29.5) |
|
|
(13.8) |
|
| Cash and cash equivalents, beginning of year |
|
193.3 |
|
|
222.8 |
|
|
236.6 |
|
| Cash and cash equivalents, end of year |
|
$ |
187.1 |
|
|
$ |
193.3 |
|
|
$ |
222.8 |
|
|
|
|
|
|
|
|
| Supplemental Cash Flow Information |
|
|
|
|
|
|
|
|
|
|
|
|
|
| Income taxes paid |
|
$ |
140.9 |
|
|
$ |
102.4 |
|
|
$ |
105.9 |
|
| Interest paid |
|
$ |
20.9 |
|
|
$ |
12.2 |
|
|
$ |
10.9 |
|
| Supplemental Disclosure of Non-Cash Operating and Investing Transactions |
|
|
|
|
|
|
| Accrued property, plant and equipment additions |
|
$ |
18.5 |
|
|
$ |
16.3 |
|
|
$ |
7.0 |
|
| Leased assets obtained in exchange for new operating lease liabilities |
|
$ |
32.3 |
|
|
$ |
17.0 |
|
|
$ |
12.4 |
|
| Transfer of operating lease asset and operating lease liability |
|
$ |
— |
|
|
$ |
— |
|
|
$ |
(9.2) |
|
|
|
|
|
|
|
|
See Notes to Consolidated Financial Statements.
DONALDSON COMPANY, INC. AND SUBSIDIARIES
CONSOLIDATED STATEMENTS OF CHANGES IN STOCKHOLDERS’ EQUITY
(In millions, except per share amounts)
|
|
|
|
|
|
|
|
|
|
|
|
|
|
|
|
|
|
|
|
|
|
|
|
|
|
|
|
|
|
|
|
|
|
|
|
|
|
|
|
|
|
|
|
|
Common
Stock |
|
Additional
Paid-in
Capital |
|
Retained
Earnings |
|
Non-
Controlling
Interest |
|
|
|
Accumulated
Other
Comprehensive
Loss |
|
Treasury
Stock |
|
Total |
| Balance July 31, 2020 |
$ |
758.2 |
|
|
$ |
— |
|
|
$ |
1,445.9 |
|
|
$ |
5.8 |
|
|
|
|
$ |
(184.0) |
|
|
$ |
(1,033.0) |
|
|
$ |
992.9 |
|
| Comprehensive income |
|
|
|
|
|
|
|
|
|
|
|
|
|
|
|
| Net earnings |
|
|
|
|
286.9 |
|
|
|
|
|
|
|
|
|
|
286.9 |
|
| Foreign currency translation |
|
|
|
|
|
|
|
|
|
|
30.0 |
|
|
|
|
30.0 |
|
| Pension liability adjustment, net of deferred taxes |
|
|
|
|
|
|
|
|
|
|
35.3 |
|
|
|
|
35.3 |
|
| Gains on hedging derivatives, net of deferred taxes |
|
|
|
|
|
|
|
|
|
|
0.8 |
|
|
|
|
0.8 |
|
| Reclassification of gains on hedging derivatives to net earnings |
|
|
|
|
|
|
|
|
|
|
(0.3) |
|
|
|
|
(0.3) |
|
| Comprehensive income |
|
|
|
|
|
|
|
|
|
|
|
|
|
|
352.7 |
|
| Treasury stock acquired |
|
|
|
|
|
|
|
|
|
|
|
|
(142.2) |
|
|
(142.2) |
|
| Stock options exercised |
|
|
(5.9) |
|
|
— |
|
|
|
|
|
|
|
|
41.5 |
|
|
35.6 |
|
| Stock compensation expense |
|
|
14.3 |
|
|
|
|
|
|
|
|
|
(0.1) |
|
|
14.2 |
|
| Deferred stock and other activity |
|
|
(7.4) |
|
|
(0.9) |
|
|
0.1 |
|
|
|
|
|
|
3.9 |
|
|
(4.3) |
|
| Purchase of non-controlling interests |
|
|
2.2 |
|
|
|
|
(5.9) |
|
|
|
|
|
|
|
|
(3.7) |
|
Dividends declared ($0.86 per share) |
|
|
|
|
(108.1) |
|
|
|
|
|
|
|
|
|
|
(108.1) |
|
| Balance July 31, 2021 |
758.2 |
|
|
3.2 |
|
|
1,623.8 |
|
|
— |
|
|
|
|
(118.2) |
|
|
(1,129.9) |
|
|
1,137.1 |
|
| Comprehensive income |
|
|
|
|
|
|
|
|
|
|
|
|
|
|
|
| Net earnings |
|
|
|
|
332.8 |
|
|
|
|
|
|
|
|
|
|
332.8 |
|
| Foreign currency translation |
|
|
|
|
|
|
|
|
|
|
(99.6) |
|
|
|
|
(99.6) |
|
| Pension liability adjustment, net of deferred taxes |
|
|
|
|
|
|
|
|
|
|
7.2 |
|
|
|
|
7.2 |
|
| Gains on hedging derivatives, net of deferred taxes |
|
|
|
|
|
|
|
|
|
|
7.2 |
|
|
|
|
7.2 |
|
| Reclassification of gains on hedging derivatives to net earnings |
|
|
|
|
|
|
|
|
|
|
(2.2) |
|
|
|
|
(2.2) |
|
| Comprehensive income |
|
|
|
|
|
|
|
|
|
|
|
|
|
|
245.4 |
|
| Treasury stock acquired |
|
|
|
|
|
|
|
|
|
|
|
|
(170.6) |
|
|
(170.6) |
|
| Stock options exercised |
|
|
(2.5) |
|
|
— |
|
|
|
|
|
|
|
|
15.8 |
|
|
13.3 |
|
| Stock compensation expense |
|
|
20.5 |
|
— |
|
|
|
|
|
|
|
|
(0.1) |
|
|
20.4 |
|
| Deferred stock and other activity |
|
|
(4.2) |
|
|
(0.2) |
|
|
|
|
|
|
|
|
2.7 |
|
|
(1.7) |
|
|
|
|
|
|
|
|
|
|
|
|
|
|
|
|
|
Dividends declared ($0.90 per share) |
|
|
|
|
(110.7) |
|
|
|
|
|
|
|
|
|
|
(110.7) |
|
| Balance July 31, 2022 |
758.2 |
|
|
17.0 |
|
|
1,845.7 |
|
|
— |
|
|
|
|
(205.6) |
|
|
(1,282.1) |
|
|
1,133.2 |
|
| Comprehensive income |
|
|
|
|
|
|
|
|
|
|
|
|
|
|
|
| Net earnings |
|
|
|
|
358.8 |
|
|
|
|
|
|
|
|
|
|
358.8 |
|
| Foreign currency translation |
|
|
|
|
|
|
|
|
|
|
34.0 |
|
|
|
|
34.0 |
|
| Pension liability adjustment, net of deferred taxes |
|
|
|
|
|
|
|
|
|
|
0.3 |
|
|
|
|
0.3 |
|
| Losses on hedging derivatives, net of deferred taxes |
|
|
|
|
|
|
|
|
|
|
(1.4) |
|
|
|
|
(1.4) |
|
| Reclassification of losses on hedging derivatives to net earnings |
|
|
|
|
|
|
|
|
|
|
0.2 |
|
|
|
|
0.2 |
|
| Comprehensive income |
|
|
|
|
|
|
|
|
|
|
|
|
|
|
391.9 |
|
| Treasury stock acquired |
|
|
|
|
|
|
|
|
|
|
|
|
(141.8) |
|
|
(141.8) |
|
| Stock options exercised |
|
|
(5.2) |
|
|
— |
|
|
|
|
|
|
|
|
42.1 |
|
|
36.9 |
|
| Stock compensation expense |
|
|
20.2 |
|
|
— |
|
|
|
|
|
|
|
|
0.2 |
|
|
20.4 |
|
| Deferred stock and other activity |
|
|
(7.2) |
|
|
(0.3) |
|
|
|
|
|
|
|
|
4.0 |
|
|
(3.5) |
|
Dividends declared ($0.96 per share) |
|
|
|
|
(116.4) |
|
|
|
|
|
|
|
|
|
|
(116.4) |
|
| Balance July 31, 2023 |
$ |
758.2 |
|
|
$ |
24.8 |
|
|
$ |
2,087.8 |
|
|
$ |
— |
|
|
|
|
$ |
(172.5) |
|
|
$ |
(1,377.6) |
|
|
$ |
1,320.7 |
|
See Notes to Consolidated Financial Statements.
DONALDSON COMPANY, INC. AND SUBSIDIARIES
NOTES TO CONSOLIDATED FINANCIAL STATEMENTS
Note 1. Summary of Significant Accounting Policies
Description of Business
Donaldson Company, Inc. (the Company) is a global leader in technology-led filtration products and solutions. The Company’s core strengths include leading filtration technology, diverse business and a global presence. Products are manufactured and sold around the world to original equipment manufacturers (OEMs), distributors, dealers and directly to end users.
Principles of Consolidation
The Consolidated Financial Statements include the accounts of the Company and all its majority-owned subsidiaries. All intercompany accounts and transactions have been eliminated. The Company’s joint ventures are not majority-owned and are accounted for under the equity method.
Certain reclassifications to previously reported financial information on the Consolidated Balance Sheet, Consolidated Statements of Cash Flows and Consolidated Statements of Changes in Stockholders’ Equity have been made to conform to the current period presentation.
Use of Estimates
The preparation of the Company’s financial statements in conformity with generally accepted accounting principles (GAAP) in the United States (U.S.) requires management to make estimates and assumptions that affect the amount of assets and liabilities and the disclosures regarding contingent assets and liabilities at period end and the reported amounts of revenue and expenses during the reporting period. Actual results could differ from those estimates.
Operating Environment
Inflation
While inflation was not significant in the fourth quarter or the twelve months of fiscal 2023, as compared to the prior year, the Company continues to experience the effects of the prior year inflation related to raw materials and other expenses, including labor and energy. These inflationary pressures have had an adverse impact on the Company’s profit margins throughout the twelve months of fiscal 2023 when compared to the prior year, however they have been generally mitigated by pricing actions primarily implemented in the prior year.
Foreign Currency Translation
For most foreign operations, local currencies are considered the functional currency. Assets and liabilities of non-U.S. dollar functional currency entities are translated to U.S. dollars at fiscal year end exchange rates and the resulting gains and losses arising from the translation of net assets located outside the U.S. are recorded as a cumulative translation adjustment, a component of accumulated other comprehensive loss on the Consolidated Balance Sheets. Elements of the Consolidated Statements of Earnings are translated at average exchange rates in effect during the fiscal year. Foreign currency transaction losses are included in other income, net in the Consolidated Statements of Earnings and were $6.4 million, $6.3 million and $2.9 million in the years ended July 31, 2023, 2022 and 2021, respectively.
Cash Equivalents
The Company considers all highly liquid temporary investments with an original maturity of three months or less to be cash equivalents. Cash equivalents are carried at cost which approximates market value.
Revenue Recognition
Revenue is measured as the amount of consideration the Company expects to receive in exchange for the fulfillment of performance obligations. The transaction price of a contract could be reduced by variable consideration including volume, purchase rebates and discounts, product refunds and returns. At the time of sale to a customer, the Company records an estimate of variable consideration as a reduction from gross sales. The Company primarily relies on historical experience and anticipated future performance to estimate the variable consideration. Revenue is recognized to the extent it is probable a significant reversal of revenue will not occur when the contingency is resolved. The Company accounts for amounts billed to customers for reimbursement of shipping and handling costs by recording these amounts as revenue and accruing costs when the related revenue is recognized.
For most customer contracts, the Company recognizes revenue at a point in time when control of the goods or services is transferred to the customer. For product sales, control is typically deemed to have transferred in accordance with the shipping terms, either at the time of shipment from the plants or distribution centers or the time of delivery to the customers. Revenue is recognized for services upon completion of those services. Payment terms vary by customer and the geographic location of the customer. The Company’s contracts with customers do not include significant financing components or non-cash consideration.
The Company has some contracts with customers where the performance obligations are satisfied over time. Certain customer contracts provide the Company with an enforceable right to payment of the transaction price for performance completed to date and the Company uses either an input or an output method of production to measure the progress towards the completion of the performance obligation in these arrangements, depending on the nature of the contract. The timing of revenue recognized from these products is slightly accelerated compared to revenue recognized at the time of shipment or delivery.
The Company generally does not incur significant incremental costs related to obtaining or fulfilling a contract prior to the start of a project. The Company may incur certain fulfillment costs such as initial design or mobilization costs which are capitalized if they relate directly to the contract, if they are expected to generate resources that will be used to satisfy the Company’s performance obligation under the contract and if they are expected to be recovered through revenues generated under the contract. Such costs, which are amortized over the life of the respective project, were not material for any period presented.
The Company does not pay upfront sales commissions on contracts when the related contract period is greater than one year and thus has not capitalized any amounts as of July 31, 2023 and 2022, see Note 3.
Shipping and Handling
Shipping and handling costs on products sold of $91.2 million, $96.4 million and $79.2 million are classified as a component of operating expenses in the Consolidated Statements of Earnings for the years ended July 31, 2023, 2022 and 2021, respectively.
Accounts Receivable, Net and Allowance for Doubtful Accounts
Accounts receivable, net are recorded at the invoiced amount and do not bear interest. The allowance for doubtful accounts is the Company’s best estimate of the amount of credit losses in its existing accounts receivable. The Company determines the allowance based on utilization of a combination of aging schedules with reserve rates applied to both current and aged receivables using historical write-off experience, regional economic data and evaluation of specific customer accounts for risk of loss and changes in current or projected conditions to calculate the allowances related to accounts receivable, net. The Company reviews its allowance for doubtful accounts monthly. Account balances are reviewed on a pooled basis by reporting unit and geographic region and are reserved when the Company determines it is probable the receivable will not be recovered. The Company reduces the receivable and corresponding allowance when it confirms an account is uncollectible.
Inventories
Inventories are stated at the lower of cost and net realizable value. U.S. inventories are valued using the last-in, first-out (LIFO) method while the non-U.S. inventories are valued using the first-in, first-out (FIFO) method. Inventories valued at LIFO were approximately 29.7% and 31.6% of total inventories as of July 31, 2023 and 2022, respectively. For inventories valued under the LIFO method, the FIFO cost exceeded the LIFO carrying values by $56.1 million and $59.7 million as of July 31, 2023 and 2022, respectively. Results of operations for all periods presented were not materially affected by the liquidation of LIFO inventory.
Property, Plant and Equipment
Property, plant and equipment are stated at cost. Additions, improvements or major renewals are capitalized while expenditures that do not enhance or extend the asset’s useful life are expensed as incurred. Depreciation is computed using the straight-line method. Depreciation expense was $80.9 million, $85.1 million and $87.1 million in the years ended July 31, 2023, 2022 and 2021, respectively. The estimated useful lives of property, plant and equipment are 10 to 40 years for buildings, including building improvements and three to 10 years for machinery and equipment, see Note 5.
Internal-Use Software and Cloud Computing Arrangements
The Company capitalizes direct costs of materials and services used in the development and purchase of internal-use software. Amounts capitalized are amortized on a straight-line basis over a period of five to seven years and are reported as a component of property, plant and equipment.
The Company capitalizes certain costs incurred during the application development stage of implementation of internal-use software in cloud computing arrangements. Amounts capitalized are amortized on a straight-line basis over a period of five to 10 years and are reported as a component of other long-term assets.
Goodwill and Intangible Assets
Goodwill represents the excess of the purchase price over the fair value of net assets acquired in business combinations under the purchase method of accounting. Goodwill is assessed for impairment annually or if an event occurs or circumstances change that would indicate the carrying amount may be impaired. The Company performed its annual impairment assessment during the third quarter of fiscal 2023. The goodwill impairment assessment is conducted at a reporting unit level, which is one level below the operating segment level and utilizes either a qualitative or quantitative assessment. The Company determined the fair value for all its reporting units was substantially in excess of their respective carrying values and there were no indicators of impairment for any of the reporting units evaluated. In addition, as a result of the organizational redesign, the Company performed a qualitative impairment assessment based on the new segments in the second quarter of fiscal 2023 and concluded there was no impairment. An impairment loss would be recognized when the carrying amount of a reporting unit’s net assets exceeds the estimated fair value of the reporting unit, see Note 6.
Intangible assets, comprised of customer relationships, patents, trademarks, technology and non-compete agreements, are amortized on a straight-line basis over their estimated useful lives of less than one year to 20 years.
Business Combinations
The Company allocates the purchase price of acquired businesses to the estimated fair values of the assets acquired and liabilities assumed, as well as any contingent consideration, where applicable, as of the date of acquisition. The fair values of the long-lived assets acquired, primarily intangible assets, are determined using calculations which can be complex and require significant judgment. Estimates include many factors such as the nature of the acquired company’s business, its historical financial position and results, technology obsolescence, customer retention rates, discount rates, royalty rates and expected future performance. Independent valuation specialists are used to assist in determining certain fair value calculations.
During the measurement period, which may be up to one year from the acquisition date, the Company may record adjustments to the assets acquired and liabilities assumed, with the corresponding offset to goodwill. Any adjustments required after the measurement period are recorded in the Consolidated Statements of Earnings.
Recoverability of Long-Lived Assets
The Company reviews its long-lived assets, including identifiable intangibles, for impairment when events or changes in circumstances indicate the carrying amount of an asset may not be recoverable. If impairment indicators are present and the estimated future undiscounted cash flows are less than the carrying value of the assets, the carrying value is reduced to the fair market value. There were no indicators of impairment or impairment charges recorded for the years ended July 31, 2023, 2022 and 2021.
Income Taxes
The provision for income taxes is computed based on the pretax income reported for financial statement purposes. Deferred tax assets and liabilities are recognized for the expected future tax consequences attributed to temporary differences between the financial statement carrying amounts of existing assets and liabilities and their respective tax basis. Deferred tax assets and liabilities are measured using the enacted tax rates expected to apply to taxable income in the years in which those temporary differences are anticipated to reverse. Valuation allowances are recorded to reduce deferred tax assets when it is more likely than not a tax benefit will not be realized.
The Company maintains a reserve for uncertain tax benefits. Benefits of tax return positions are recognized in the financial statements when the position is more likely than not to be sustained by the taxing authorities based solely on the technical merits of the position. If the recognition threshold is met, the tax benefit is measured and recognized as the largest amount of tax benefit that is greater than 50% likely to be realized, in the Company’s judgment, see Note 8.
Leases
The Company determines whether an arrangement that provides control over the use of an asset to the Company is a lease. The Company recognizes a lease liability and corresponding right-of-use asset on the Consolidated Balance Sheets based on the present value of future lease payments and recognizes lease expense on a straight-line basis over the lease term. Operating lease assets and liabilities are recognized at the commencement date based on the present value of lease payments over the lease term (or at fair values in the case of those leases assumed in an acquisition). Leases with an initial term of 12 months or less are not recorded on the Consolidated Balance Sheets and are expensed on a straight-line basis over the lease term. Variable lease expense is immaterial and primarily includes leases with payments indexed to inflation when the index changes after lease commencement.
The Company has elected to separate payments for lease components from non-lease components for all asset classes. Lease agreements may include extension, termination or purchase options, all of which are considered in calculating the lease liability and right-of-use asset when it is reasonably certain the Company will exercise an option. The Company’s incremental borrowing rate on the commencement date is used to calculate the present value of future payments for most leases since the rate implicit in the lease is generally not readily determinable. These rates are assessed on a quarterly basis for measurement of new lease obligations, see Note 9.
Stock-Based Compensation
Stock-based compensation expense is recognized using the fair value method for all awards, see Note 13.
Treasury Stock
Repurchased common stock is stated at cost, determined on an average cost basis and is presented as a reduction of stockholders’ equity on the Consolidated Balance Sheets.
Research and Development Expenses
Research and development expenses include scientific research costs such as salaries, facility costs, testing, technical information technology and administrative expenditures. Research and development expenses are for the application of scientific advances to the development of new and improved products and their uses. Substantially all research and development is performed in-house. Expenses are charged against earnings in the year incurred.
Foreign Currency Forward Contracts - Cash Flow Hedges and Derivatives Not Designated as Hedging Instruments
The Company buys materials from foreign suppliers. Those transactions can be denominated in those suppliers’ local currency. The Company also sells to customers in foreign countries. Those transactions can be denominated in those customers’ local currency. Both of these transaction types can create volatility in the Company’s financial statements. The Company uses foreign currency forward contracts to manage those exposures and fluctuations. These contracts generally mature in 12 months or less, which is consistent with the forecasts of the related purchases and sales. Certain contracts are designated as cash flow hedges, whereas the remaining contracts, most of which are related to certain intercompany transactions which offset balance sheet exposure, are not designated as hedging instruments, see Notes 12, 15 and 16.
Net Investment Hedges
The Company uses fixed-to-fixed cross-currency swap agreements to hedge its exposure to adverse foreign currency exchange rate movements for its operations in Europe. The Company has elected the spot method for designating these contracts as net investment hedges. The maturity dates range from 2027 to 2029, see Notes 12, 15 and 16.
Interest Rate Swaps - Cash Flow Hedges
The Company uses swap agreements to hedge exposure related to interest expense and to manage its exposure to interest rate movements. The Company enters into interest rate swap agreements designated as cash flow hedges to hedge future fixed-rate debt issuances, which effectively fix a portion of interest payments. The Company entered into and terminated agreements within fiscal 2021, see Notes 12, 15 and 16.
Product Warranties
The Company provides for estimated warranty expense at the time of sale and accrues for specific items at the time their existence is known and the amounts are determinable. The Company estimates warranty expense on certain products at the time of sale using quantitative measures based on historical warranty claim experience and evaluation of specific customer warranty issues, see Note 18.
New Significant Accounting Standards Recently Adopted
There were no new significant accounting standards adopted in fiscal 2023 or 2022 that had a material impact on the Company’s financial statements.
New Significant Accounting Standards Not Yet Adopted
The Company considers the applicability and impact of the FASB’s ASUs issued but not yet adopted. The Company assessed ASUs not listed above and determined they were either not applicable or were not expected to have a material impact on the Company’s financial reporting.
In October 2021, the FASB issued ASU 2021-08, Business Combinations (Topic 805), Accounting for Contract Assets and Contract Liabilities from Contracts with Customers. This ASU clarifies that an acquirer of a business should recognize and measure contract assets and contract liabilities in a business combination in accordance with ASU 2014-09, Revenue from Contracts with Customers (Topic 606) as if the entity had originated the contracts. The guidance is effective for fiscal years beginning after December 15, 2022, with early application permitted. This ASU is applicable to the Company’s fiscal year beginning in the first quarter of fiscal 2024. This guidance is applicable to all business combinations occurring after the effective date.
In June 2022, the FASB issued ASU 2022-03, which amends Fair Value Measurement (Topic 820), Fair Value Measurement of Equity Securities Subject to Contractual Sale Restrictions (ASU 2022-03). This guidance clarifies guidance for fair value measurement of an equity security subject to a contractual sale restriction and establishes new disclosure requirements for such equity securities. The guidance is effective for fiscal years beginning after December 15, 2023, with early application permitted. The Company is currently evaluating the impact the adoption will have on its financial statements.
Note 2. Acquisitions
Univercells Technologies (UTEC)
On June 29, 2023, the Company acquired UTEC, headquartered in Nivelles, Belgium, for cash consideration of €134.2 million, or $146.9 million, net of cash acquired. UTEC is a global producer of innovative biomanufacturing solutions for cell and gene therapy research, development and commercial manufacturing. UTEC is reported within the Company’s Life Sciences segment. The Company assigned the fair values to the net assets acquired resulting in $97.0 million for goodwill and $51.6 million for intangible assets, as well as a deferred tax liability of $12.9 million and a deferred tax asset of $7.0 million, none of which are expected to be deductible for tax purposes. Net working capital was $(0.9) million. The purchase price allocation for this acquisition is preliminary pending the outcome of the final valuations of the net assets acquired. Net sales of UTEC were immaterial to the Consolidated Statements of Earnings for the year ended July 31, 2023. Management expects to finalize the purchase accounting by the fourth quarter of fiscal 2024.
Isolere Bio, Inc. (Isolere)
On February 17, 2023, the Company acquired Isolere, headquartered in Durham, North Carolina, for cash consideration of $62.3 million, net of cash acquired. Isolere develops reagents and accompanying filtration processes used for the purification and streamlined manufacturing of biopharmaceuticals. Isolere is reported within the Company’s Life Sciences segment. The Company assigned the fair values to the net assets acquired resulting in $28.1 million for goodwill and $44.5 million for intangible assets, as well as a deferred tax liability of $10.9 million, none of which are expected to be deductible for tax purposes. Net working capital was $(0.4) million. The purchase price allocation for this acquisition is preliminary pending the outcome of the final valuations of the contingent liabilities acquired. Net sales of Isolere were immaterial to the Consolidated Statements of Earnings for the year ended July 31, 2023. Management expects to finalize the purchase accounting by the first quarter of fiscal 2024.
Purchase Price Summary
The components of the UTEC and Isolere acquisitions, net of cash acquired, as of the acquisition date were as follows (in millions):
|
|
|
|
|
|
|
2023 |
| Intangible assets: |
|
| Technology |
$ |
84.0 |
|
| Trademarks and tradenames |
8.2 |
|
|
|
| Customer relationships |
1.2 |
|
| Non-competition agreements |
2.7 |
|
|
|
| Intangible assets acquired |
96.1 |
|
| Tangible assets, net |
9.6 |
|
| Assets acquired, net |
105.7 |
|
| Goodwill |
125.1 |
|
| Aggregate purchase price |
230.8 |
|
| Add deferred tax asset |
7.0 |
|
| Less deferred tax liability |
(23.8) |
|
|
|
| Less cash acquired |
(4.8) |
|
| Acquisitions, net of cash acquired |
$ |
209.2 |
|
Purilogics, LLC (Purilogics)
On June 13, 2022, the Company acquired Purilogics, headquartered in Greenville, South Carolina, for cash consideration of approximately $19.9 million, net of cash acquired. The transaction included a maximum payout of $29.0 million in contingent consideration related to developing manufacturing capabilities, creating future technologies and attaining certain business performance results. Purilogics is a biotechnology company that leverages a novel technology platform for the development of membrane chromatography products. Purilogics offers a broad portfolio of purification tools for a wide range of biologics. Purilogics’ proprietary formulations and processes create membranes that have significant competitive advantages, enabling faster and more cost-effective production of increasingly complex biologic drugs. Purilogics is reported within the Company’s Life Sciences segment. Purchase accounting was finalized in the second quarter of fiscal 2023. Net sales of Purilogics were immaterial to the Consolidated Statements of Earnings for the year ended July 31, 2022.
Solaris Biotechnology S.r.l. (Solaris)
On November 22, 2021, the Company acquired Solaris, headquartered in Porto Mantovano, Italy, with U.S. operations based in Berkeley, California, for cash consideration of approximately €41 million, or $45.7 million, net of cash acquired. Solaris designs and manufactures bioprocessing equipment, including bioreactors, fermenters and tangential flow filtration systems for use in food and beverage, biotechnology and other life sciences markets. Solaris is reported within the Company’s Life Sciences segment. Purchase accounting was finalized in the fourth quarter of fiscal 2022. Net sales of Solaris were immaterial to the Consolidated Statements of Earnings for the year ended July 31, 2022.
Pearson Arnold Industrial Services (PAIS)
On November 1, 2021, the Company acquired PAIS, headquartered in the U.S., for cash consideration of approximately $3.3 million, net of cash acquired. PAIS provides equipment, parts and services for dust, mist and fume collection systems, industrial fans and compressed air systems. PAIS is reported within the Company’s Industrial Filtration Solutions (IFS) business in the Industrial Solutions segment. Goodwill and intangible assets acquired are deductible for tax purposes. Purchase accounting was finalized in the fourth quarter of fiscal 2022. Net sales of PAIS were immaterial to the Consolidated Statements of Earnings for the year ended July 31, 2022.
Purchase Price Summary
The components of acquisitions, net of cash acquired in fiscal 2022, as of each acquisition date (in millions):
|
|
|
|
|
|
| Intangible assets: |
|
| Technology |
$ |
45.9 |
|
| Trademarks and tradenames |
4.0 |
|
| Customer relationships |
3.0 |
|
| Non-competition agreements |
0.6 |
|
| Backlog |
0.2 |
|
| Intangible assets acquired |
53.7 |
|
| Tangible liabilities, net |
(2.7) |
|
| Assets acquired, net |
51.0 |
|
| Goodwill |
42.8 |
|
| Aggregate purchase price |
93.8 |
|
| Less contingent consideration |
(24.6) |
|
| Less cash acquired |
(0.3) |
|
| Acquisitions, net of cash acquired |
$ |
68.9 |
|
Pro forma Financial Information
Pro forma financial information for these acquisitions has not been presented because the acquisitions were not material to the Company’s Consolidated Statements of Earnings. See Note 6 for goodwill and intangible assets acquired.
Contingent Compensation and Consideration
Purilogics
The Company’s acquisition purchase agreement with Purilogics includes deferred payment provisions representing potential milestone payments for its former owners. The provisions are made up of two general types of arrangements, contingent compensation and contingent consideration. The contingent compensation arrangement is contingent on the former owner’s future employment with the Company and the related amounts are recognized over the required employment period. The contingent consideration is not contingent on employment and is recorded as purchase consideration in both other current and other long-term liabilities on the Consolidated Balance Sheets at the time of the initial acquisition based on the fair value of the estimated liability. The amounts are paid over a three to five year period, contingent on the achievement of certain revenue and manufacturing milestones.
The total contingent compensation arrangement liability was $1.1 million and $0.1 million as of July 31, 2023 and 2022, respectively, which was included in other long-term liabilities on the Consolidated Balance Sheets. The maximum payout of the contingent compensation arrangement upon completion of the future performance periods was $3.0 million, inclusive of the $1.1 million and $0.1 million accrued as of July 31, 2023 and 2022, respectively.
The Company primarily determines the contingent consideration liability based on the forecasted probability of achieving certain milestones. The contingent consideration liability is measured at fair value each reporting period and changes in estimates of fair value are recognized in earnings. The total contingent consideration liability was $23.2 million and $23.0 million as of July 31, 2023 and 2022, respectively and was included in other current and other long-term liabilities on the Consolidated Balance Sheets. The maximum payout of the contingent consideration was $29.0 million, inclusive of the $23.2 million and $23.0 million accrued as of July 31, 2023 and 2022, respectively. For additional discussion regarding the fair value of the Company’s contingent consideration liability, see Note 16.
Other Acquisitions
For other acquisitions, the total contingent compensation arrangement liability was $0.9 million and $0.3 million as of July 31, 2023 and 2022, respectively, which was included in other long-term liabilities on the Consolidated Balance Sheets. The maximum payout of the contingent compensation arrangement upon completion of the future performance periods was $3.1 million, which terminates five years from acquisition date of November 22, 2021. This is inclusive of the $0.9 million and $0.3 million accrued as of July 31, 2023 and 2022, respectively.
The total contingent consideration liability was $1.7 million as of July 31, 2023 and 2022, respectively, of which, $0.0 million and $0.3 million, respectively, was included in other current liabilities and $1.7 million and $1.4 million, respectively, was included in other long-term liabilities on the Consolidated Balance Sheets. The maximum payout of the contingent consideration was $1.7 million, which terminates three years from acquisition date of November 1, 2021 and was fully accrued as of July 31, 2023 and 2022, respectively.
Note 3. Revenue
The Company recognizes revenue on a wide range of filtration solutions sold to customers in many industries around the globe. Most of the Company’s performance obligations within customer sales contracts are for manufactured filtration systems and replacement parts. The Company also performs limited services and installation. Customer contracts may include multiple performance obligations and the transaction price is allocated to each distinct performance obligation based on its relative standalone selling price.
Revenue Disaggregation
Net sales, generally disaggregated by location where the customer’s order was placed, were as follows (in millions):
|
|
|
|
|
|
|
|
|
|
|
|
|
|
|
|
|
|
|
Year Ended July 31, |
|
2023 |
|
2022 |
|
2021 |
| U.S. and Canada |
$ |
1,464.7 |
|
|
$ |
1,336.8 |
|
|
$ |
1,084.2 |
|
| Europe, Middle East and Africa (EMEA) |
1,007.8 |
|
|
963.6 |
|
|
865.7 |
|
| Asia Pacific (APAC) |
608.8 |
|
|
669.0 |
|
|
649.2 |
|
| Latin America (LATAM) |
349.5 |
|
|
337.2 |
|
|
254.8 |
|
| Total net sales |
$ |
3,430.8 |
|
|
$ |
3,306.6 |
|
|
$ |
2,853.9 |
|
See Note 19 for net sales disaggregated by segment and business unit.
Contract Assets and Liabilities
The satisfaction of performance obligations and the resulting recognition of revenue typically correspond with billing of the customer. In limited circumstances, the customer may be billed at a time later than when revenue is recognized, resulting in contract assets, which are reported in other current assets on the Consolidated Balance Sheets. Contract assets were $13.3 million and $17.7 million as of July 31, 2023 and 2022, respectively. In other limited circumstances, the customer may make a payment at a time earlier than when revenue is recognized and prior to the satisfaction of performance obligations, resulting in contract liabilities, which are reported in deferred revenue on the Consolidated Balance Sheets. Contract liabilities were $25.3 million and $22.3 million as of July 31, 2023 and 2022, respectively.
The Company will recognize revenue in future periods related to remaining performance obligations for certain open contracts. Generally, these contracts have terms of one year or less. The amount of revenue related to unsatisfied performance obligations in which the original duration of the contract is greater than one year is not significant. None of the Company’s contracts contained a significant financing component.
Note 4. Inventories, Net
The components of inventories, net were as follows (in millions):
|
|
|
|
|
|
|
|
|
|
|
|
|
|
|
|
|
July 31, |
|
|
2023 |
|
2022 |
| Raw materials |
|
$ |
155.1 |
|
|
$ |
197.6 |
|
| Work in process |
|
50.9 |
|
|
56.1 |
|
| Finished products |
|
212.1 |
|
|
248.7 |
|
| Total inventories, net |
|
$ |
418.1 |
|
|
$ |
502.4 |
|
Note 5. Property, Plant and Equipment, Net
The components of property, plant and equipment, net were as follows (in millions):
|
|
|
|
|
|
|
|
|
|
|
|
|
|
|
|
|
July 31, |
|
|
2023 |
|
2022 |
| Land |
|
$ |
29.3 |
|
|
$ |
25.6 |
|
| Buildings |
|
430.8 |
|
|
396.2 |
|
| Machinery and equipment |
|
989.0 |
|
|
940.1 |
|
| Computer software |
|
142.0 |
|
|
141.0 |
|
| Construction in progress |
|
107.7 |
|
|
72.1 |
|
| Less accumulated depreciation |
|
(1,045.9) |
|
|
(980.6) |
|
| Total property, plant and equipment, net |
|
$ |
652.9 |
|
|
$ |
594.4 |
|
Note 6. Goodwill and Intangible Assets
Goodwill
The Company allocates goodwill to reporting units within its Mobile Solutions, Industrial Solutions and Life Sciences segments. There were no dispositions or impairment charges recorded during the years ended July 31, 2023, 2022 and 2021. Goodwill is assessed for impairment annually during the third quarter of the fiscal year, or more frequently if events or changes in circumstances indicate the asset may be impaired. The Company performed its annual impairment assessment during the third quarter of fiscal 2023 and did not record any impairment as a result of this assessment. In addition, as a result of the organizational redesign, the Company performed a qualitative impairment assessment based on the new segments in the second quarter of fiscal 2023 and concluded there was no impairment.
Goodwill by reportable segment was as follows (in millions):
|
|
|
|
|
|
|
|
|
|
|
|
|
|
|
|
|
|
|
|
|
|
|
|
|
Mobile
Solutions
Segment |
|
Industrial
Solutions
Segment |
|
Life Sciences Segment |
|
Total
Goodwill |
Balance as of July 31, 2021 (1) |
$ |
25.6 |
|
|
$ |
296.9 |
|
|
$ |
— |
|
|
$ |
322.5 |
|
| Goodwill acquired |
— |
|
|
2.1 |
|
|
40.7 |
|
|
42.8 |
|
| Foreign exchange translation |
(0.3) |
|
|
(16.9) |
|
|
(2.3) |
|
|
(19.5) |
|
Balance as of July 31, 2022 (1) |
$ |
25.3 |
|
|
$ |
282.1 |
|
|
$ |
38.4 |
|
|
$ |
345.8 |
|
| Goodwill acquired |
— |
|
|
— |
|
|
125.1 |
|
|
125.1 |
|
| Foreign exchange translation |
0.2 |
|
|
7.0 |
|
|
3.0 |
|
|
10.2 |
|
| Balance as of July 31, 2023 |
$ |
25.5 |
|
|
$ |
289.1 |
|
|
$ |
166.5 |
|
|
$ |
481.1 |
|
(1)All prior segment information has been recast to reflect the Company’s new segment structure and current period presentation (see Note 19).
Intangible Assets
Intangible assets preliminarily recognized from the UTEC acquisition were $51.6 million, of which $42.3 million was technology with an 18 year useful life, $6.7 million was trademarks with a 10 year useful life, $1.4 million was non-competition agreements with a 2 year useful life and $1.2 million was customer relationships with a 20 year useful life.
Intangible assets recognized from the Isolere acquisition were $44.5 million, of which $41.7 million was technology with a 20 year useful life, trademarks and tradenames were $1.5 million with a 10 year useful life and non-competition agreements were $1.3 million with a three year useful life.
Intangible assets recognized from the Purilogics acquisition in fiscal 2022 were $29.9 million, of which $28.6 million was technology with a 20 year useful life, trademarks and tradenames were $0.7 million with a 10 year useful life and non-competition agreements were $0.6 million with a five year useful life.
Intangible assets recognized from other acquisitions in fiscal 2022 were $23.8 million, of which technology was $17.3 million with a 15 year useful life, trademarks and tradenames were $3.3 million with a 10 year useful life, customer relationships were $3.0 million with a 20 year useful life and backlog was $0.2 million with a six month useful life.
There was a foreign currency translation gain of $3.2 million in fiscal 2023 and translation loss of $6.3 million in fiscal 2022.
Intangible asset classes were as follows (in millions):
|
|
|
|
|
|
|
|
|
|
|
|
|
|
|
|
|
|
|
|
|
|
|
|
|
Year Ended July 31, 2023 |
|
Weighted Amortizable Life (in Years) |
|
Gross Carrying Amount |
|
Accumulated Amortization |
|
Net |
| Customer relationships |
10.8 |
|
$ |
107.8 |
|
|
$ |
(65.6) |
|
|
$ |
42.2 |
|
| Patents |
18.9 |
|
33.4 |
|
|
(6.3) |
|
|
27.1 |
|
| Trademarks |
9.0 |
|
15.9 |
|
|
(3.9) |
|
|
12.0 |
|
| Technology |
17.2 |
|
116.3 |
|
|
(12.9) |
|
|
103.4 |
|
| Non-compete agreements |
3.1 |
|
4.0 |
|
(0.6) |
|
|
3.4 |
|
| Total intangible assets |
|
|
$ |
277.4 |
|
|
$ |
(89.3) |
|
|
$ |
188.1 |
|
|
|
|
|
|
|
|
|
|
|
|
|
|
|
|
|
|
|
|
|
|
|
|
|
|
Year Ended July 31, 2022 |
|
Weighted Amortizable Life (in Years) |
|
Gross Carrying Amount |
|
Accumulated Amortization |
|
Net |
| Customer relationships |
11.4 |
|
$ |
104.0 |
|
|
$ |
(60.2) |
|
|
$ |
43.8 |
|
| Patents |
19.9 |
|
33.4 |
|
|
(4.7) |
|
|
28.7 |
|
| Trademarks |
7.9 |
|
7.3 |
|
|
(2.6) |
|
|
4.7 |
|
| Technology |
12.0 |
|
30.6 |
|
|
(9.1) |
|
|
21.5 |
|
| Non-compete agreements |
6.4 |
|
1.2 |
|
|
(0.1) |
|
|
1.1 |
|
| Total intangible assets |
|
|
$ |
176.5 |
|
|
$ |
(76.7) |
|
|
$ |
99.8 |
|
Intangible asset amortization expense was $11.4 million, $9.2 million and $8.2 million for the fiscal 2023, 2022 and 2021, respectively and is included in operating expenses in the Consolidated Statements of Earnings. Amortization expense relating to existing intangible assets as of July 31, 2023 was as follows (in millions):
|
|
|
|
|
|
|
|
|
|
|
|
| 2024 |
|
$ |
15.2 |
|
| 2025 |
|
15.0 |
|
| 2026 |
|
13.9 |
|
| 2027 |
|
13.4 |
|
| 2028 |
|
13.0 |
|
| Thereafter |
|
117.6 |
|
| Total amortization expense |
|
$ |
188.1 |
|
Note 7. Short-Term Borrowings and Long-Term Debt
Short-Term Borrowings
Short-term borrowings were as follows (in millions):
|
|
|
|
|
|
|
|
|
|
|
|
|
|
|
|
|
|
|
|
|
|
|
|
|
|
|
|
|
|
|
|
|
|
|
|
|
|
|
|
|
|
|
|
|
|
|
|
|
|
|
|
|
|
|
|
|
|
|
|
|
|
|
|
|
European Commercial Paper Program |
|
U.S. Credit Facilities |
|
European Operations Credit Facilities |
|
Rest of the World Credit Facilities |
|
Total |
|
|
Year Ended July 31, |
|
|
2023 |
|
2022 |
|
2023 |
|
2022 |
|
2023 |
|
2022 |
|
2023 |
|
2022 |
|
2023 |
|
2022 |
| Available credit facilities |
|
$ |
110.3 |
|
|
$ |
102.1 |
|
|
$ |
100.0 |
|
|
$ |
100.0 |
|
|
$ |
45.0 |
|
|
$ |
42.4 |
|
|
$ |
50.8 |
|
|
$ |
52.8 |
|
|
$ |
306.1 |
|
|
$ |
297.3 |
|
| Reductions to borrowing capacity: |
|
|
|
|
|
|
|
|
|
|
|
|
|
|
|
|
|
|
|
|
| Outstanding borrowings |
|
24.3 |
|
|
— |
|
|
9.8 |
|
|
— |
|
|
— |
|
|
— |
|
|
— |
|
|
3.7 |
|
|
34.1 |
|
|
3.7 |
|
| Other non-borrowing reductions |
|
— |
|
|
— |
|
|
— |
|
|
— |
|
|
28.8 |
|
|
27.0 |
|
|
18.8 |
|
|
19.1 |
|
|
47.6 |
|
|
46.1 |
|
| Total reductions |
|
24.3 |
|
|
— |
|
|
9.8 |
|
|
— |
|
|
28.8 |
|
|
27.0 |
|
|
18.8 |
|
|
22.8 |
|
|
81.7 |
|
|
49.8 |
|
| Remaining borrowing capacity |
|
$ |
86.0 |
|
|
$ |
102.1 |
|
|
$ |
90.2 |
|
|
$ |
100.0 |
|
|
$ |
16.2 |
|
|
$ |
15.4 |
|
|
$ |
32.0 |
|
|
$ |
30.0 |
|
|
$ |
224.4 |
|
|
$ |
247.5 |
|
|
|
|
|
|
|
|
|
|
|
|
|
|
|
|
|
|
|
|
|
|
|
|
|
|
|
|
|
|
|
|
|
|
|
|
|
|
|
|
|
|
|
|
|
|
|
|
|
|
|
|
|
|
|
|
|
|
|
|
|
|
|
|
Weighted average interest rate as of July 31, 2023 and 2022 |
|
4.09 |
% |
|
N/A |
|
6.17 |
% |
|
N/A |
|
N/A |
|
N/A |
|
N/A |
|
0.37 |
% |
|
4.69 |
% |
|
0.37 |
% |
Other non-borrowing reductions include financial instruments such as bank guarantees and foreign currency exchange instruments. Commitment fees for the years ended July 31, 2023 and 2022 were not material.
Long-Term Debt
Long-term debt was as follows:
|
|
|
|
|
|
|
|
|
|
|
|
|
|
|
|
|
|
|
|
|
|
|
|
|
|
|
|
|
|
|
|
|
|
|
|
|
|
|
|
|
|
|
|
|
|
|
|
|
|
|
|
|
Interest Rate |
|
Outstanding Balance
(in millions) |
| Financial Instrument |
|
Fixed or Variable |
|
Amount |
|
Maturity Date |
|
July 31, 2023 |
|
July 31, 2022 |
|
July 31, 2023 |
|
July 31, 2022 |
| Unsecured senior notes |
|
Fixed |
|
$125.0 million |
|
March 27, 2024 |
|
3.72 |
% |
|
3.72 |
% |
|
$ |
125.0 |
|
|
$ |
125.0 |
|
| Unsecured senior notes |
|
Fixed |
|
$125.0 million |
|
June 17, 2030 |
|
3.18 |
% |
|
3.18 |
% |
|
125.0 |
|
|
125.0 |
|
Unsecured senior notes |
|
Fixed |
|
$100.0 million |
|
August 5, 2031 |
|
2.50 |
% |
|
2.50 |
% |
|
100.0 |
|
|
100.0 |
|
| Unsecured revolving credit facility |
|
Variable |
|
$500.0 million |
|
May 21, 2026 |
|
5.09 |
% |
|
2.88 |
% |
|
96.2 |
|
|
125.0 |
|
| Unsecured term loan |
|
Variable |
|
€80.0 million |
|
October 28, 2024 |
|
4.41 |
% |
|
0.91 |
% |
|
88.2 |
|
|
81.7 |
|
Unsecured senior notes |
|
Fixed |
|
$50.0 million |
|
November 5, 2028 |
|
2.12 |
% |
|
2.12 |
% |
|
50.0 |
|
|
50.0 |
|
| Unsecured senior notes |
|
Fixed |
|
$25.0 million |
|
April 16, 2025 |
|
2.93 |
% |
|
2.93 |
% |
|
25.0 |
|
|
25.0 |
|
| Unsecured term loan |
|
Variable |
|
¥1.0 |
billion |
|
July 31, 2028 |
|
0.57 |
% |
|
0.41 |
% |
|
7.0 |
|
|
7.5 |
|
| Unsecured term loan |
|
Variable |
|
¥1.0 |
billion |
|
July 15, 2026 |
|
0.49 |
% |
|
0.49 |
% |
|
7.0 |
|
|
7.5 |
|
| Debt issuance costs, net |
|
|
|
|
|
|
|
|
|
|
|
(1.8) |
|
|
(2.4) |
|
| Subtotal |
|
|
|
|
|
|
|
|
|
|
|
621.6 |
|
|
644.3 |
|
| Less current maturities |
|
|
|
|
|
|
|
|
|
|
|
(125.0) |
|
|
— |
|
| Total long-term debt |
|
|
|
|
|
|
|
|
|
$ |
496.6 |
|
|
$ |
644.3 |
|
The Company’s $500.0 million revolving credit facility is with a group of lenders and allows for borrowings in multiple currencies. The interest rate is calculated using the appropriate benchmark rate plus the applicable rate. The borrowing availability can be reduced or the agreement terminated early at the option of the Company. The Company can request to increase the revolving credit facility by up to $250.0 million, subject to terms of the credit facility agreement, including written notification and lender acceptance, through an accordion feature. Borrowings are automatically rolled over until the credit facility maturity date, unless the agreement is terminated early or the Company is found to be in default. The total facility includes a commitment fee of 0.08% to 0.25%, depending on the Company’s leverage ratio.
Certain debt agreements contain financial covenants related to interest coverage and leverage ratios, as well as other non-financial covenants. As of July 31, 2023, the Company was in compliance with all such covenants.
The Company has long-term borrowing capacity of $396.3 million available for further borrowing under the existing credit facility as of July 31, 2023. The remaining borrowing capacity has been reduced for standby letters of credit as discussed in Note 17.
Future maturities of the Company’s long-term debt as of July 31, 2023 were as follows (in millions):
|
|
|
|
|
|
|
|
|
|
|
|
| 2024 |
|
$ |
125.0 |
|
| 2025 |
|
113.2 |
|
| 2026 |
|
103.2 |
|
| 2027 |
|
— |
|
| 2028 |
|
7.0 |
|
| Thereafter |
|
275.0 |
|
| Total future maturities payments |
|
623.4 |
|
| Less debt issuance costs, net |
|
(1.8) |
|
| Total future maturities payments, net of debt issuance costs |
|
$ |
621.6 |
|
Note 8. Income Taxes
The components of earnings before income taxes were as follows (in millions):
|
|
|
|
|
|
|
|
|
|
|
|
|
|
|
|
|
|
|
|
|
|
|
Year Ended July 31, |
|
|
2023 |
|
2022 |
|
2021 |
|
|
|
|
|
|
|
| U.S. |
|
$ |
178.0 |
|
|
$ |
132.8 |
|
|
$ |
114.1 |
|
| Foreign |
|
290.7 |
|
|
305.6 |
|
|
266.9 |
|
| Total |
|
$ |
468.7 |
|
|
$ |
438.4 |
|
|
$ |
381.0 |
|
The components of the provision for income taxes were as follows (in millions):
|
|
|
|
|
|
|
|
|
|
|
|
|
|
|
|
|
|
|
|
|
|
|
Year Ended July 31, |
|
|
2023 |
|
2022 |
|
2021 |
|
|
|
|
|
|
|
| Current |
|
|
|
|
|
|
| Federal |
|
$ |
38.1 |
|
|
$ |
17.4 |
|
|
$ |
13.2 |
|
| State |
|
7.3 |
|
|
4.9 |
|
|
3.9 |
|
| Foreign |
|
79.8 |
|
|
84.7 |
|
|
82.9 |
|
| Total current |
|
125.2 |
|
|
107.0 |
|
|
100.0 |
|
|
|
|
|
|
|
|
| Deferred |
|
|
|
|
|
|
| Federal |
|
(13.3) |
|
|
2.8 |
|
|
(1.9) |
|
| State |
|
(1.8) |
|
|
(0.3) |
|
|
(0.2) |
|
| Foreign |
|
(0.2) |
|
|
(3.9) |
|
|
(3.8) |
|
| Total deferred |
|
(15.3) |
|
|
(1.4) |
|
|
(5.9) |
|
|
|
|
|
|
|
|
| Total provision for income taxes |
|
$ |
109.9 |
|
|
$ |
105.6 |
|
|
$ |
94.1 |
|
The reconciliation of the U.S. statutory federal income tax rate with the effective income tax rate was as follows:
|
|
|
|
|
|
|
|
|
|
|
|
|
|
|
|
|
|
|
|
|
|
|
Year Ended July 31, |
|
|
2023 |
|
2022 |
|
2021 |
| U.S. statutory federal income tax rate |
|
21.0 |
% |
|
21.0 |
% |
|
21.0 |
% |
| State income taxes |
|
0.9 |
|
|
0.9 |
|
|
0.8 |
|
| Foreign operations |
|
3.8 |
|
|
3.6 |
|
|
4.4 |
|
| Global Intangible Low Tax Income |
|
0.2 |
|
|
0.3 |
|
|
0.6 |
|
| Foreign Derived Intangible Income |
|
(1.6) |
|
|
(0.6) |
|
|
(0.7) |
|
| Research and development credit |
|
(0.7) |
|
|
(0.6) |
|
|
(0.7) |
|
| Change in unrecognized tax benefits |
|
— |
|
|
(0.8) |
|
|
0.2 |
|
| Tax benefits on stock-based compensation |
|
(0.7) |
|
|
(0.5) |
|
|
(1.0) |
|
|
|
|
|
|
|
|
| Other |
|
0.5 |
|
|
0.8 |
|
|
0.1 |
|
| Effective income tax rate |
|
23.4 |
% |
|
24.1 |
% |
|
24.7 |
% |
The tax effects of temporary differences that give rise to deferred tax assets and liabilities were as follows (in millions):
|
|
|
|
|
|
|
|
|
|
|
|
|
|
|
|
|
July 31, |
|
|
2023 |
|
2022 |
| Deferred tax assets |
|
|
|
|
| Accrued expenses |
|
$ |
12.2 |
|
|
$ |
11.6 |
|
| Compensation and retirement plans |
|
24.7 |
|
|
26.4 |
|
| Capitalization of R&D costs |
|
17.6 |
|
|
— |
|
| Net operating loss (NOL) and tax credit carryforwards |
|
15.1 |
|
|
6.4 |
|
| Operating lease assets |
|
15.0 |
|
|
11.6 |
|
| Other |
|
6.2 |
|
|
6.4 |
|
| Gross deferred tax assets |
|
90.8 |
|
|
62.4 |
|
| Valuation allowance |
|
(6.4) |
|
|
(3.4) |
|
| Deferred tax assets, net of valuation allowance |
|
84.4 |
|
|
59.0 |
|
| Deferred tax liabilities |
|
|
|
|
| Depreciation and amortization |
|
(79.5) |
|
|
(57.0) |
|
| Operating lease liabilities |
|
(15.1) |
|
|
(11.6) |
|
| Other |
|
(4.2) |
|
|
(2.4) |
|
| Deferred tax liabilities |
|
(98.8) |
|
|
(71.0) |
|
| Net deferred tax liability |
|
$ |
(14.4) |
|
|
$ |
(12.0) |
|
The activity in the NOL and tax credit valuation allowances was as follows (in millions):
|
|
|
|
|
|
|
|
|
|
|
|
|
|
|
|
|
|
|
|
|
|
|
Year Ended July 31, |
|
|
2023 |
|
2022 |
|
2021 |
| Balance as of beginning of year |
|
$ |
(3.4) |
|
|
$ |
(4.6) |
|
|
$ |
(8.1) |
|
| Additions charged to costs and expenses |
|
(3.0) |
|
|
(0.9) |
|
|
(0.8) |
|
|
|
|
|
|
|
|
| Deductions from reserves |
|
— |
|
|
2.1 |
|
|
4.3 |
|
| Balance as of end of year |
|
$ |
(6.4) |
|
|
$ |
(3.4) |
|
|
$ |
(4.6) |
|
As of July 31, 2023, the Company had deferred tax assets related to U.S. federal foreign tax credits of $3.9 million, related to state research and development credits of $3.6 million and related to foreign operating loss carryovers of $7.1 million. The U.S. federal tax credits will expire after 10 years, the state portion after one to 20 years and the foreign portion has an indefinite carryover period. As of July 31, 2023, the Company had provided $6.4 million for a valuation allowance against certain of these deferred tax assets based on management’s determination it is more likely than not the tax benefits related to these assets will not be realized.
As of July 31, 2023, the total undistributed earnings of the Company’s non-U.S. subsidiaries were $1.3 billion, of which $943.6 million were not considered indefinitely reinvested. The Company is subject to foreign withholding taxes on a small portion of these earnings distributable in the future in the form of dividends. Thus, the Company provides for foreign withholding taxes payable upon future dividend distributions of the earnings not considered indefinitely reinvested annually. For the year ended July 31, 2023, the Company recognized a tax charge of $3.6 million related to these foreign withholding taxes. The remaining $355.1 million of earnings are considered indefinitely reinvested and it is not practicable to estimate, within any reasonable range, the additional taxes that may be payable on the potential distribution of the portion of the undistributed earnings considered indefinitely reinvested.
The transition tax related to the U.S. Tax Cuts and Jobs Act of 2017 on undistributed earnings was accrued in fiscal 2018 and it is payable over an eight year period. The portion not due within 12 months classified in non-current income taxes payable on the Consolidated Balance Sheets as of July 31, 2023 was $39.8 million.
The reconciliation of the beginning and ending amount of gross unrecognized tax benefits was as follows (in millions):
|
|
|
|
|
|
|
|
|
|
|
|
|
|
|
|
|
|
|
|
|
|
|
Year Ended July 31, |
|
|
2023 |
|
2022 |
|
2021 |
| Balance as of beginning of year |
|
$ |
15.2 |
|
|
$ |
18.7 |
|
|
$ |
16.9 |
|
| Additions for tax positions of the current year |
|
2.5 |
|
|
2.7 |
|
|
4.7 |
|
| Additions for tax positions of prior years |
|
— |
|
|
— |
|
|
2.7 |
|
| Reductions for tax positions of prior years |
|
0.1 |
|
|
(1.1) |
|
|
(1.0) |
|
|
|
|
|
|
|
|
| Reductions due to lapse of applicable statute of limitations |
|
(2.8) |
|
|
(5.1) |
|
|
(4.6) |
|
| Balance as of end of year |
|
$ |
15.0 |
|
|
$ |
15.2 |
|
|
$ |
18.7 |
|
The Company recognizes accrued interest and penalties related to unrecognized tax benefits in income taxes in the Consolidated Statements of Earnings. As of July 31, 2023 and 2022, accrued interest and penalties on a gross basis were $1.7 million and $1.1 million, respectively. During the year ended July 31, 2023, the Company recognized interest expense, net of tax benefit, of $0.7 million. If the Company were to prevail on all unrecognized tax benefits recorded, substantially all the unrecognized tax benefits would benefit the effective tax rate. With an average statute of limitations of five years, up to $4.0 million of the unrecognized tax benefits could potentially expire in the next 12 months, unless extended by an audit.
The Company files income tax returns in the U.S. federal jurisdiction and various state and foreign jurisdictions. The U.S. Internal Revenue Service has completed examinations of the Company’s U.S. federal income tax returns through fiscal 2019. With few exceptions, the Company is no longer subject to state and foreign income tax examinations by tax authorities for years before fiscal 2018.
The Company believes it is remote that any adjustment necessary to the reserve for income taxes for the next 12 months will be material. However, it is possible the ultimate resolution of audits or disputes may result in a material change to the Company’s reserve for income taxes, although the quantification of such potential adjustments cannot be made at this time.
Note 9. Leases
The Company enters into operating leases primarily for office, production and warehouse facilities, production and non-production equipment, automobiles and computer equipment. As of July 31, 2023 and 2022, the Company had no financing lease obligations.
The Company’s operating lease costs were as follows (in millions):
|
|
|
|
|
|
|
|
|
|
|
|
|
|
|
|
|
|
|
Year Ended July 31, |
|
|
|
|
2023 |
|
2022 |
|
|
| Operating lease cost |
|
$ |
24.5 |
|
|
$ |
21.4 |
|
|
|
| Short-term lease cost |
|
3.2 |
|
|
3.1 |
|
|
|
|
|
|
|
|
|
|
| Total lease costs |
|
$ |
27.7 |
|
|
$ |
24.5 |
|
|
|
Supplemental balance sheet information for the Company was as follows (in millions):
|
|
|
|
|
|
|
|
|
|
|
|
|
|
|
|
|
|
|
|
|
|
|
|
|
July 31, |
|
|
Balance Sheet Location |
|
2023 |
|
2022 |
| Right-of-use lease assets |
|
Other long-term assets |
|
$ |
59.4 |
|
|
$ |
44.7 |
|
| Current lease liabilities |
|
Other current liabilities |
|
$ |
17.8 |
|
|
$ |
16.3 |
|
| Long-term lease liabilities |
|
Other long-term liabilities |
|
$ |
42.4 |
|
|
$ |
28.5 |
|
Additional information related to operating leases was as follows:
|
|
|
|
|
|
|
|
|
|
|
|
|
|
|
|
|
July 31, |
|
|
2023 |
|
2022 |
| Weighted average remaining lease term (years) |
|
4.2 |
|
3.4 |
| Weighted average discount rate |
|
3.89 |
% |
|
3.17 |
% |
Remaining payments for operating leases having initial terms of more than one year as of July 31, 2023 were as follows (in millions):
|
|
|
|
|
|
|
|
|
|
|
|
| 2024 |
|
$ |
19.6 |
|
| 2025 |
|
15.2 |
|
| 2026 |
|
11.3 |
|
| 2027 |
|
8.1 |
|
| 2028 |
|
5.7 |
|
| Thereafter |
|
5.3 |
|
| Total future lease payments |
|
65.2 |
|
| Less imputed interest |
|
5.0 |
|
| Present value of future lease payments |
|
$ |
60.2 |
|
Note 10. Earnings Per Share
Basic net earnings per share (EPS) is computed by dividing net earnings by the weighted average number of outstanding common shares. Diluted net EPS is computed by dividing net earnings by the weighted average number of outstanding common shares and common share equivalents relating to stock options and other stock incentive plans.
Basic and diluted net EPS calculations were as follows (in millions, except per share amounts):
|
|
|
|
|
|
|
|
|
|
|
|
|
|
|
|
|
|
|
|
|
|
|
Year Ended July 31, |
|
|
2023 |
|
2022 |
|
2021 |
| Net earnings |
|
$ |
358.8 |
|
|
$ |
332.8 |
|
|
$ |
286.9 |
|
|
|
|
|
|
|
|
| Weighted average common shares outstanding |
|
|
|
|
|
|
| Weighted average common shares – basic |
|
121.8 |
|
|
123.7 |
|
|
126.4 |
|
| Dilutive impact of stock-based awards |
|
1.8 |
|
|
1.5 |
|
|
1.8 |
|
| Weighted average common shares – diluted |
|
123.6 |
|
|
125.2 |
|
|
128.2 |
|
|
|
|
|
|
|
|
| Net EPS – basic |
|
$ |
2.95 |
|
|
$ |
2.69 |
|
|
$ |
2.27 |
|
| Net EPS – diluted |
|
$ |
2.90 |
|
|
$ |
2.66 |
|
|
$ |
2.24 |
|
| Stock options excluded from net EPS calculation |
|
0.0 |
|
1.6 |
|
0.8 |
Note 11. Stockholders’ Equity
Share Repurchases
The Company’s Board of Directors has authorized the repurchase of up to 13.0 million shares of common stock under the Company’s stock repurchase plan. This repurchase authorization is effective until terminated by the Board of Directors. During the year ended July 31, 2023, the Company repurchased 2.5 million shares for $141.8 million. During the year ended July 31, 2022, the Company repurchased 2.9 million shares for $170.6 million. As of July 31, 2023, the Company had remaining authorization to repurchase 2.9 million shares under this plan.
Treasury stock share activity was as follows:
|
|
|
|
|
|
|
|
|
|
|
|
|
|
|
|
|
Year Ended July 31, |
|
|
2023 |
|
2022 |
| Balance as of beginning of year |
|
29,089,612 |
|
|
26,620,560 |
|
| Stock repurchases |
|
2,485,000 |
|
|
2,900,000 |
|
| Net issuance upon exercise of stock options |
|
(941,837) |
|
|
(360,448) |
|
| Issuance under compensation plans |
|
(84,942) |
|
|
(52,678) |
|
| Other activity |
|
(19,137) |
|
|
(17,822) |
|
| Balance as of end of year |
|
30,528,696 |
|
|
29,089,612 |
|
Dividends Paid and Declared
Dividends paid were 94.0 cents and 89.0 cents per common share for the years ended July 31, 2023 and 2022, respectively. On July 28, 2023, the Company’s Board of Directors declared a cash dividend in the amount of 25.0 cents per common share, payable August 30, 2023, to stockholders of record as of August 15, 2023.
Note 12. Accumulated Other Comprehensive Loss
Changes in accumulated other comprehensive loss for the years ended July 31, 2023 and 2022 were as follows (in millions):
|
|
|
|
|
|
|
|
|
|
|
|
|
|
|
|
|
|
|
|
|
|
|
|
|
|
|
|
|
|
Foreign
Currency
Translation
Adjustment |
|
Pension
Benefits |
|
Derivative
Financial
Instruments |
|
Total |
|
| Balance as of July 31, 2022, net of tax |
|
$ |
(143.6) |
|
|
$ |
(67.5) |
|
|
$ |
5.5 |
|
|
$ |
(205.6) |
|
|
| Other comprehensive income (loss) before reclassifications and tax |
|
34.0 |
|
|
(6.9) |
|
(1) |
(1.9) |
|
|
25.2 |
|
|
| Tax benefit |
|
— |
|
|
2.2 |
|
|
0.5 |
|
|
2.7 |
|
|
| Other comprehensive income (loss) before reclassifications, net of tax |
|
34.0 |
|
|
(4.7) |
|
|
(1.4) |
|
|
27.9 |
|
|
|
|
|
|
|
|
|
|
|
|
| Reclassifications, before tax |
|
— |
|
|
7.5 |
|
(2) |
0.3 |
|
|
7.8 |
|
|
| Tax expense |
|
— |
|
|
(2.5) |
|
|
(0.1) |
|
|
(2.6) |
|
|
| Reclassifications, net of tax |
|
— |
|
|
5.0 |
|
|
0.2 |
|
(3) |
5.2 |
|
|
| Other comprehensive income (loss), net of tax |
|
34.0 |
|
|
0.3 |
|
|
(1.2) |
|
|
33.1 |
|
|
| Balance as of July 31, 2023, net of tax |
|
$ |
(109.6) |
|
|
$ |
(67.2) |
|
|
$ |
4.3 |
|
|
$ |
(172.5) |
|
|
|
|
|
|
|
|
|
|
|
|
| Balance as of July 31, 2021, net of tax |
|
$ |
(44.0) |
|
|
$ |
(74.7) |
|
|
$ |
0.5 |
|
|
$ |
(118.2) |
|
|
| Other comprehensive (loss) income before reclassifications and tax |
|
(99.6) |
|
|
(6.2) |
|
(1) |
9.2 |
|
|
(96.6) |
|
|
| Tax benefit (expense) |
|
— |
|
|
1.4 |
|
|
(2.0) |
|
|
(0.6) |
|
|
| Other comprehensive (loss) income before reclassifications, net of tax |
|
(99.6) |
|
|
(4.8) |
|
|
7.2 |
|
|
(97.2) |
|
|
|
|
|
|
|
|
|
|
|
|
| Reclassifications, before tax |
|
— |
|
|
15.5 |
|
(2) |
(2.7) |
|
|
12.8 |
|
|
| Tax (expense) benefit |
|
— |
|
|
(3.5) |
|
|
0.5 |
|
|
(3.0) |
|
|
| Reclassifications, net of tax |
|
— |
|
|
12.0 |
|
|
(2.2) |
|
(3) |
9.8 |
|
|
| Other comprehensive (loss) income, net of tax |
|
(99.6) |
|
|
7.2 |
|
|
5.0 |
|
|
(87.4) |
|
|
| Balance as of July 31, 2022, net of tax |
|
$ |
(143.6) |
|
|
$ |
(67.5) |
|
|
$ |
5.5 |
|
|
$ |
(205.6) |
|
|
(1)In fiscal 2023 and 2022, pension settlement accounting was triggered. In addition, pension curtailment accounting was triggered in fiscal 2023. Remeasurements of the Company’s pension obligations resulted in an increase of $6.9 million and $6.2 million in fiscal 2023 and 2022, respectively, to accumulated other comprehensive loss on the Consolidated Balance Sheets, see Note 14.
(2)Amounts include reclassifications of $6.6 million and $3.0 million, a foreign currency translation gain of $1.4 million and loss of $4.9 million and net amortization of prior service costs and actuarial losses of $2.3 million and $7.6 million in fiscal 2023 and 2022, respectively. Amounts are included in other income, net in the Consolidated Statements of Earnings, see Note 14.
(3)Relates to designated foreign currency forward contracts that were reclassified from accumulated other comprehensive loss on the Consolidated Balance Sheets to net sales, cost of sales and operating expenses in the Consolidated Statements of Earnings, see Note 15.
Note 13. Stock-Based Compensation
The Company recognizes compensation expense for all stock-based awards based on the grant date fair value of the award. Stock-based awards consist primarily of non-qualified stock options, performance-based awards, restricted stock awards and restricted stock units. Grants related to restricted stock awards and restricted stock units are immaterial. The Company issues treasury shares for stock options and performance-based awards.
Stock Options
The exercise price of options granted is equal to the market price of the Company’s common stock at the date of the grant. Options are generally exercisable for up to 10 years from the date of grant and vest in equal increments over three years.
Pretax stock-based compensation expense associated with options was $12.4 million, $11.6 million and $10.8 million for the years ended July 31, 2023, 2022 and 2021, respectively.
Fair value is calculated using the Black-Scholes option pricing model. The weighted average fair value for options granted during the years ended July 31, 2023, 2022 and 2021 was $15.67, $14.24 and $10.23 per share, respectively.
The fair value of these awards was determined using the following inputs:
|
|
|
|
|
|
|
|
|
|
|
|
|
|
|
|
|
|
|
|
|
|
|
Year Ended July 31, |
|
|
2023 |
|
2022 |
|
2021 |
| Risk-free interest rate |
|
3.8% - 4.2% |
|
1.2% - 1.8% |
|
0.5% - 1.3% |
| Expected volatility |
|
26.8% - 27.5% |
|
26.0% - 27.0% |
|
25.4% - 26.6% |
| Expected dividend yield |
|
1.6 |
% |
|
1.6 |
% |
|
1.6 |
% |
|
|
|
|
|
|
|
| Expected life: |
|
|
|
|
|
|
| Director grants |
|
8 years |
|
8 years |
|
8 years |
| Officer grants |
|
7 years |
|
7 years |
|
8 years |
| Non-officer grants |
|
7 years |
|
7 years |
|
7 years |
Option activity was as follows:
|
|
|
|
|
|
|
|
|
|
|
|
|
|
|
| |
|
Options |
|
Weighted
Average Exercise
Price |
| Balance outstanding as of July 31, 2020 |
|
6,533,979 |
|
|
$ |
42.44 |
|
| Granted |
|
1,004,631 |
|
|
46.61 |
|
| Exercised |
|
(1,030,938) |
|
|
36.00 |
|
| Expired/forfeited |
|
(62,929) |
|
|
49.95 |
|
| Balance outstanding as of July 31, 2021 |
|
6,444,743 |
|
|
44.05 |
|
| Granted |
|
898,726 |
|
|
59.18 |
|
| Exercised |
|
(365,267) |
|
|
37.02 |
|
| Expired/forfeited |
|
(51,041) |
|
|
53.15 |
|
| Balance outstanding as of July 31, 2022 |
|
6,927,161 |
|
|
46.32 |
|
| Granted |
|
920,816 |
|
|
51.35 |
|
| Exercised |
|
(1,006,602) |
|
|
40.48 |
|
| Expired/forfeited |
|
(63,968) |
|
|
53.47 |
|
| Balance outstanding as of July 31, 2023 |
|
6,777,407 |
|
|
$ |
47.80 |
|
The total intrinsic value of options exercised during the years ended July 31, 2023, 2022 and 2021 was $20.2 million, $7.8 million and $22.6 million, respectively.
The number of shares authorized as of July 31, 2023 for outstanding options and future grants was 8,585,779. Forfeited options are recorded as an offset to operating expenses in the Consolidated Statements of Earnings in the period in which they occur.
Outstanding and exercisable stock options as of July 31, 2023 were as follows:
|
|
|
|
|
|
|
|
|
|
|
|
|
|
|
|
|
|
|
|
|
|
|
|
|
|
|
|
|
|
|
|
|
|
|
|
|
|
|
| Range of Exercise Prices |
|
Number
Outstanding |
|
Weighted
Average
Remaining
Contractual
Life (Years) |
|
Weighted
Average
Exercise
Price |
|
Number
Exercisable |
|
Weighted
Average
Remaining
Contractual
Life (Years) |
|
Weighted
Average
Exercise
Price |
$28.00 to $37.99 |
|
672,703 |
|
|
2.3 |
|
$ |
29.24 |
|
|
672,703 |
|
|
2.3 |
|
$ |
29.24 |
|
$38.00 to $43.99 |
|
1,393,425 |
|
|
2.3 |
|
41.29 |
|
|
1,393,425 |
|
|
2.3 |
|
41.29 |
|
$44.00 to $49.99 |
|
1,452,757 |
|
|
5.9 |
|
45.96 |
|
|
1,162,081 |
|
|
5.5 |
|
45.93 |
|
$50.00 to $55.99 |
|
1,656,918 |
|
|
7.8 |
|
51.34 |
|
|
769,671 |
|
|
6.2 |
|
51.75 |
|
$56.00 and above |
|
1,601,604 |
|
|
6.9 |
|
59.27 |
|
|
995,816 |
|
|
6.0 |
|
59.17 |
|
|
|
6,777,407 |
|
|
5.5 |
|
$ |
47.80 |
|
|
4,993,696 |
|
|
4.4 |
|
$ |
45.93 |
|
As of July 31, 2023, the aggregate intrinsic value of stock options outstanding and exercisable was $101.9 million and $84.4 million, respectively.
For the year ended July 31, 2023, activity for non-vested stock options that contain vesting provisions was as follows:
|
|
|
|
|
|
|
|
|
|
|
|
|
|
|
|
|
Options |
|
Weighted
Average Grant
Date Fair
Value |
| Balance outstanding as of beginning of year |
|
1,809,473 |
|
|
$ |
12.31 |
|
| Granted |
|
920,816 |
|
|
15.67 |
|
| Vested |
|
(895,862) |
|
|
11.78 |
|
| Forfeited |
|
(50,716) |
|
|
13.61 |
|
| Balance outstanding as of end of year |
|
1,783,711 |
|
|
$ |
14.27 |
|
As of July 31, 2023, there was $8.1 million of total unrecognized compensation expense related to non-vested stock options, which is expected to be recognized over the remaining vesting period during fiscal 2024, 2025 and 2026.
Performance-Based Awards
Performance-based awards are payable in common stock and are based on a formula that measures Company performance over a three year period. These awards are settled after three years with payouts ranging from 0% to 200% of the target award depending on achievement. Pretax performance-based awards expense was $6.3 million, $7.2 million and $1.9 million for the years ended July 31, 2023, 2022 and 2021, respectively.
The weighted average grant date fair value related to the Company’s performance-based awards was as follows:
|
|
|
|
|
|
|
|
|
|
|
|
|
|
|
|
|
|
|
|
|
|
|
Year Ended July 31, |
|
|
2023 |
|
2022 |
|
2021 |
| Weighted average grant date fair value |
|
$ |
50.89 |
|
|
$ |
59.40 |
|
|
$ |
46.06 |
|
Performance-based awards for non-vested activity were as follows:
|
|
|
|
|
|
|
|
|
|
|
|
|
|
|
|
|
Performance Shares |
|
Weighted
Average Grant
Date Fair
Value |
Balance outstanding as of July 31, 2022 |
|
188,206 |
|
|
$ |
52.20 |
|
| Granted |
|
113,100 |
|
|
50.89 |
|
| Vested |
|
(98,853) |
|
|
46.06 |
|
| Forfeited |
|
(7,692) |
|
|
54.76 |
|
Balance outstanding as of July 31, 2023 |
|
194,761 |
|
|
$ |
54.46 |
|
As of July 31, 2023, there was $5.7 million of total unrecognized compensation expense related to non-vested performance-based awards, which is expected to be recognized over the remaining vesting period during fiscal 2024, 2025 and 2026. Forfeited performance-based awards are recorded as an offset to operating expenses in the Consolidated Statements of Earnings in the period in which they occur.
Note 14. Employee Benefit Plans
Defined Benefit Pension Plans
The Company has defined benefit pension plans for certain hourly and salaried employees. They consist of plans in the U.S., Belgium, Germany, Mexico and the United Kingdom. These plans generally provide pension benefits based on years of service and compensation level. Components of net periodic pension costs other than the service cost component are included in other income, net in the Consolidated Statements of Earnings.
Net periodic pension costs for the Company’s pension plans were as follows (in millions):
|
|
|
|
|
|
|
|
|
|
|
|
|
|
|
|
|
|
|
|
|
|
|
Year Ended July 31, |
|
|
2023 |
|
2022 |
|
2021 |
| Net periodic pension costs |
|
|
|
|
|
|
| Service cost |
|
$ |
6.7 |
|
|
$ |
6.9 |
|
|
$ |
7.5 |
|
| Interest cost |
|
17.0 |
|
|
10.6 |
|
|
10.2 |
|
| Expected return on assets |
|
(25.3) |
|
|
(24.8) |
|
|
(23.7) |
|
| Prior service cost amortization |
|
— |
|
|
0.2 |
|
|
0.3 |
|
| Actuarial loss amortization |
|
2.1 |
|
|
6.9 |
|
|
8.2 |
|
| Settlement charge |
|
5.5 |
|
|
3.0 |
|
|
2.0 |
|
| Curtailment charge |
|
0.2 |
|
|
— |
|
|
0.8 |
|
| Net periodic pension costs |
|
6.2 |
|
|
2.8 |
|
|
5.3 |
|
| Other changes recognized in other comprehensive income (loss): |
|
|
|
|
|
|
| Prior service cost |
|
(0.4) |
|
|
— |
|
|
— |
|
| Net actuarial (loss) gain |
|
(5.9) |
|
|
(1.3) |
|
|
35.9 |
|
|
|
|
|
|
|
|
| Amortization of prior service cost |
|
0.2 |
|
|
0.3 |
|
|
1.2 |
|
| Amortization of net actuarial loss |
|
7.7 |
|
|
9.9 |
|
|
10.2 |
|
| Total recognized in other comprehensive income |
|
1.6 |
|
|
8.9 |
|
|
47.3 |
|
| Total recognized in net periodic pension costs and other comprehensive (loss) income |
|
$ |
(4.6) |
|
|
$ |
6.1 |
|
|
$ |
42.0 |
|
The changes in projected benefit obligations, fair value of plan assets and funded status of the Company’s pension plans for the years ended July 31, 2023 and 2022 were as follows (in millions):
|
|
|
|
|
|
|
|
|
|
|
|
|
|
|
|
|
Year Ended July 31, |
|
|
2023 |
|
2022 |
| Change in projected benefit obligation |
|
|
|
|
| Projected benefit obligation, beginning of year |
|
$ |
442.6 |
|
|
$ |
579.9 |
|
| Service cost |
|
6.7 |
|
|
6.9 |
|
| Interest cost |
|
17.0 |
|
|
10.6 |
|
| Plan amendments |
|
0.2 |
|
|
— |
|
| Participant contributions |
|
0.7 |
|
|
0.7 |
|
| Actuarial gain |
|
(42.0) |
|
|
(100.3) |
|
| Foreign currency exchange rates |
|
9.2 |
|
|
(25.4) |
|
| Settlements paid |
|
(17.0) |
|
|
(12.9) |
|
Acquisition |
|
1.2 |
|
|
— |
|
|
|
|
|
|
| Benefits paid |
|
(17.5) |
|
|
(16.9) |
|
| Projected benefit obligation, end of year |
|
401.1 |
|
|
442.6 |
|
| Change in fair value of plan assets |
|
|
|
|
| Fair value of plan assets, beginning of year |
|
459.8 |
|
|
591.3 |
|
| Actual return on plan assets |
|
(22.1) |
|
|
(80.7) |
|
| Company contributions |
|
2.6 |
|
|
2.3 |
|
| Participant contributions |
|
0.7 |
|
|
0.7 |
|
| Foreign currency exchange rates |
|
8.3 |
|
|
(24.0) |
|
| Settlements paid |
|
(17.0) |
|
|
(12.9) |
|
Acquisition |
|
1.2 |
|
|
— |
|
|
|
|
|
|
| Benefits paid |
|
(17.5) |
|
|
(16.9) |
|
| Fair value of plan assets, end of year |
|
416.0 |
|
|
459.8 |
|
|
|
|
|
|
| Funded status of plans, end of year |
|
$ |
14.9 |
|
|
$ |
17.2 |
|
|
|
|
|
|
| Amounts recognized on the Consolidated Balance Sheets |
|
|
|
|
| Other long-term assets |
|
$ |
34.7 |
|
|
$ |
38.3 |
|
| Other current liabilities |
|
(1.7) |
|
|
(1.8) |
|
| Other long-term liabilities |
|
(18.1) |
|
|
(19.3) |
|
| Net recognized asset |
|
$ |
14.9 |
|
|
$ |
17.2 |
|
The net overfunded status of $14.9 million and $17.2 million as of July 31, 2023 and 2022, respectively, is recognized on the Consolidated Balance Sheets. The pension-related accumulated other comprehensive loss as of July 31, 2023 and 2022, prior to the consideration of income taxes, was $109.0 million and $110.2 million, respectively, and consisted primarily of unrecognized actuarial losses. The accumulated benefit obligation for all defined benefit pension plans was $384.4 million and $424.1 million as of July 31, 2023 and 2022, respectively. The decrease in the accumulated benefit obligation during fiscal 2023 is due to actuarial gains. Pension settlement accounting was triggered in fiscal 2023 and 2022 as a result of the amount of lump sum distributions in the defined benefit pension plans exceeding the service and interest cost threshold.
The projected benefit obligation and fair value of plan assets for pension plans with projected benefit obligations in excess of plan assets were $73.5 million and $53.7 million, respectively, as of July 31, 2023 and $70.3 million and $49.2 million, respectively, as of July 31, 2022.
The projected benefit obligation, accumulated benefit obligation and fair value of plan assets for pension plans with accumulated benefit obligations in excess of plan assets were $15.0 million, $15.0 million and $5.0 million, respectively, as of July 31, 2023 and $12.8 million, $12.8 million and $3.1 million, respectively, as of July 31, 2022.
Assumptions
The significant assumptions used in determining the actuarial present value of the projected benefit obligation were as follows:
|
|
|
|
|
|
|
|
|
|
|
|
|
|
|
|
|
Year Ended July 31, |
|
|
2023 |
|
2022 |
| U.S. plans |
|
|
|
|
| Discount rate |
|
5.58 |
% |
|
4.62 |
% |
| Expected rate of return on plan assets |
|
5.66 |
% |
|
5.41 |
% |
| Rate of compensation increase |
|
N/A |
|
N/A |
|
|
|
|
|
| Non-U.S. plans |
|
|
|
|
| Discount rate |
|
4.80 |
% |
|
3.26 |
% |
| Expected rate of return on plan assets |
|
4.39 |
% |
|
3.40 |
% |
| Rate of compensation increase |
|
3.12 |
% |
|
2.99 |
% |
|
|
|
|
|
|
|
|
|
|
|
|
|
|
|
|
|
|
|
|
|
|
|
|
|
The weighted average discount rates, expected returns on plan assets and rates of increase in future compensation levels used to determine the net periodic pension costs were as follows:
|
|
|
|
|
|
|
|
|
|
|
|
|
|
|
|
|
|
|
|
|
|
|
Year Ended July 31, |
|
|
2023 |
|
2022 |
|
2021 |
| U.S. plans |
|
|
|
|
|
|
| Discount rate |
|
4.62 |
% |
|
2.55 |
% |
|
2.37 |
% |
| Expected rate of return on plan assets |
|
5.66 |
% |
|
5.41 |
% |
|
5.33 |
% |
| Rate of compensation increase |
|
N/A |
|
N/A |
|
N/A |
| Non-U.S. plans |
|
|
|
|
|
|
| Discount rate |
|
3.26 |
% |
|
1.60 |
% |
|
1.52 |
% |
| Expected rate of return on plan assets |
|
4.39 |
% |
|
3.40 |
% |
|
3.13 |
% |
| Rate of compensation increase |
|
3.12 |
% |
|
2.99 |
% |
|
2.86 |
% |
Discount Rates
The Company’s objective in selecting a discount rate is to select the best estimate of the rate at which the benefit obligations could be effectively settled on the measurement date, taking into account the nature and duration of the benefit obligations of the plan. In making this best estimate, the Company looks at the rates of return on high-quality fixed-income investments currently available and expected to be available, during the period to maturity of the benefits. This process includes assessing the universe of bonds available on the measurement date with a quality rating of Aa or better. Similar appropriate benchmarks are used to determine the discount rate for the non-U.S. plans.
Expected Long-Term Rate of Return on Plan Assets
The Company considers historical returns and future expected returns for each asset class, as well as the target asset allocation to develop the assumption for each of its U.S. pension plans. The assumption for non-U.S. pension plans reflects the investment allocation and expected total portfolio returns specific to each plan and country.
Mortality Rates
The Company’s actuary uses the Pri-2012 mortality table issued by the Society of Actuaries during the pre-retirement period and the Mercer Industry Longevity Experience Study (MILES) table for post-retirement mortality, both reflecting the Scale MMP-2021 mortality improvement projection scale for its U.S. pension plans. These assumptions were used for determining the benefit obligations as of July 31, 2023 and for developing the annual expense for its U.S. pension plans for the fiscal year ending July 31, 2024. The Company follows the local actuaries’ recommendations for non-U.S. pension plans.
Service and Interest Costs
The Company uses a full yield curve approach to estimate service and interest costs by applying specific spot rates along the yield curve used to determine the benefit obligation of relevant projected cash outflows. This method provides a precise measurement of service and interest costs by aligning the timing of the plans’ liability cash flows to the corresponding spot rate on the yield curve.
Investments
Global Equity Securities
Global equity securities consist primarily of publicly traded U.S. and non-U.S. equities, mutual funds, collective investment trusts, diversified growth investment funds and private equity. Publicly traded equities and index funds are valued at the closing price reported in the active market in which the individual securities are traded. Private equity consists of interests in partnerships that invest in U.S. and non-U.S. equity and debt securities. This may include a diversified mix of partnership interests including buyouts, restructured or distressed debt, growth equity, mezzanine or subordinated debt, real estate, special situation partnerships and venture capital investments. Interests in these funds are valued at net asset value (NAV).
Fixed Income Securities
Fixed income securities consist primarily of investment and non-investment grade debt securities, debt securities issued by the U.S. Treasury, multi-asset credit investment funds and exchange-traded funds. Government, corporate and other bonds and notes, interest rate and inflation swaps, physical inflation-linked and nominal gilts, synthetic gilts, money market instruments and cash are valued at the closing price reported if they are traded on an active market or if they are traded at yields currently available on comparable securities of issuers with similar credit ratings. Fixed income securities also include smaller allocations to alternative investments, private equity and alternative fixed income investments. Alternative investments consist primarily of private placement funds, private equity investments and alternative fixed income-like investments. Private equity consists of interests in partnerships that invest in U.S. and non-U.S. equity and debt securities. This may include a diversified mix of partnership interests including buyouts, restructured or distressed debt, growth equity, mezzanine or subordinated debt, real estate, special situation partnerships and venture capital investments. Alternative fixed income securities consist primarily of private partnership interests in hedge funds. Interests in these funds are valued at NAV, which is determined by the administrator or custodian of the fund based on the fair value of the underlying assets owned by the fund less its liabilities.
Insurance Contracts
Insurance contracts are individual contracts whereby an insurance company offers a guaranteed minimum interest return. The Company does not have any influence on the investment decisions made by the insurer. European insurers, in general, are strictly regulated by an external control mechanism and have to invest for their guaranteed interest products within certain boundaries. Typically, they have a strategic asset allocation with 80% to 90% fixed income products and 10% to 20% equity-type products, including real estate.
Real Assets Funds
Real assets funds consist of interests in partnerships that invest in private real estate and commodities investments. Interests in partnerships are valued using NAV.
Fair Value of Plan Assets
Fair value measurements of plan assets are reported in one of three levels based on the lowest level of significant input used. For Level 1, inputs to the fair value measurement are quoted prices in active markets for identical assets or liabilities. For Level 2, inputs to the fair value measurement include quoted prices in active markets for similar assets or liabilities, quoted prices for identical or similar assets or liabilities in markets that are not active and inputs other than quoted prices that are observable for the asset or liability, either directly or indirectly. For Level 3, inputs to the fair value measurement are unobservable inputs or are based on valuation techniques.
The estimated fair value of pension plan assets and their respective levels in the fair value hierarchy by asset category were as follows (in millions):
|
|
|
|
|
|
|
|
|
|
|
|
|
|
|
|
|
|
|
|
|
|
|
|
|
|
|
|
|
|
|
Level 1 |
|
Level 2 |
|
Level 3 |
|
|
|
Total |
| Balances as of July 31, 2023 |
|
|
|
|
|
|
|
|
|
|
| Cash and cash equivalents |
|
$ |
3.6 |
|
|
$ |
0.7 |
|
|
$ |
— |
|
|
|
|
$ |
4.3 |
|
| Global equity securities |
|
61.2 |
|
|
55.7 |
|
|
— |
|
|
|
|
116.9 |
|
| Fixed income securities |
|
90.1 |
|
|
117.2 |
|
|
— |
|
|
|
|
207.3 |
|
|
|
|
|
|
|
|
|
|
|
|
| Insurance contracts |
|
— |
|
|
— |
|
|
41.3 |
|
|
|
|
41.3 |
|
|
|
|
|
|
|
|
|
|
|
|
|
|
|
|
|
|
|
|
|
|
|
| Total investments in the fair value hierarchy |
|
$ |
154.9 |
|
|
$ |
173.6 |
|
|
$ |
41.3 |
|
|
|
|
369.8 |
|
| Investments using NAV as practical expedient |
|
|
|
|
|
|
|
|
|
46.2 |
|
| Total assets |
|
|
|
|
|
|
|
|
|
$ |
416.0 |
|
|
|
|
|
|
|
|
|
|
|
|
| Balances as of July 31, 2022 |
|
|
|
|
|
|
|
|
|
|
| Cash and cash equivalents |
|
$ |
6.6 |
|
|
$ |
0.8 |
|
|
$ |
— |
|
|
|
|
$ |
7.4 |
|
| Global equity securities |
|
136.5 |
|
|
— |
|
|
— |
|
|
|
|
136.5 |
|
| Fixed income securities |
|
114.1 |
|
|
115.7 |
|
|
— |
|
|
|
|
229.8 |
|
|
|
|
|
|
|
|
|
|
|
|
| Insurance contracts |
|
— |
|
|
— |
|
|
35.4 |
|
|
|
|
35.4 |
|
| Total investments in the fair value hierarchy |
|
$ |
257.2 |
|
|
$ |
116.5 |
|
|
$ |
35.4 |
|
|
|
|
409.1 |
|
| Investments using NAV as practical expedient |
|
|
|
|
|
|
|
|
|
50.7 |
|
| Total assets |
|
|
|
|
|
|
|
|
|
$ |
459.8 |
|
|
|
|
|
|
|
|
|
|
|
|
Certain investments, valued at NAV, had the following unfunded commitments and/or redemption restrictions (in millions):
|
|
|
|
|
|
|
|
|
|
|
|
|
|
|
|
|
|
|
|
|
|
|
|
|
|
|
|
|
|
|
|
|
|
|
|
|
|
|
|
|
July 31, 2023 |
|
July 31, 2022 |
|
|
|
|
|
|
NAV |
|
Unfunded Commitments |
|
NAV |
|
Unfunded Commitments |
|
Redemption Frequency
(If Currently Eligible) |
|
Redemption Notice (Days) |
|
|
|
|
|
|
|
|
|
|
|
|
|
| Global equity securities |
|
$ |
33.6 |
|
|
$ |
1.8 |
|
|
$ |
37.0 |
|
|
$ |
1.8 |
|
|
Daily |
|
0 - 5 |
| Fixed income securities |
|
9.5 |
|
|
— |
|
|
10.8 |
|
|
— |
|
|
Daily, Weekly and Quarterly |
|
0 - 60 |
|
|
|
|
|
|
|
|
|
|
|
|
|
| Real asset funds |
|
3.1 |
|
|
4.2 |
|
|
2.9 |
|
|
4.2 |
|
|
Not eligible |
|
N/A |
| Total U.S. assets |
|
$ |
46.2 |
|
|
$ |
6.0 |
|
|
$ |
50.7 |
|
|
$ |
6.0 |
|
|
|
|
|
The changes in the fair values of the pension plans’ Level 3 assets were as follows (in millions):
|
|
|
|
|
|
|
|
|
|
|
|
|
|
|
|
|
|
|
|
|
|
|
Year Ended July 31, |
|
|
2023 |
|
2022 |
|
2021 |
| Balance as of beginning of year |
|
$ |
35.4 |
|
|
$ |
37.7 |
|
|
$ |
35.4 |
|
| Unrealized gains |
|
2.7 |
|
|
3.5 |
|
|
3.6 |
|
| Foreign currency exchange |
|
3.0 |
|
|
(5.6) |
|
|
0.1 |
|
| Purchases and sales, net |
|
0.2 |
|
|
(0.2) |
|
|
(1.4) |
|
| Balance as of end of year |
|
$ |
41.3 |
|
|
$ |
35.4 |
|
|
$ |
37.7 |
|
|
|
|
|
|
|
|
|
|
|
|
|
|
|
|
|
|
|
|
|
|
|
|
|
|
|
|
|
|
|
|
|
|
|
|
|
|
|
|
|
|
|
|
|
|
|
|
|
|
|
|
|
|
|
|
|
|
|
|
|
|
|
|
|
|
|
|
|
|
|
Investment Policies and Strategies
For U.S. pension plans, the Company uses a total return on investment approach to achieve a long-term return on plan assets, with what the Company believes to be a prudent level of risk for the purpose of meeting its retirement income commitments to employees. The U.S. pension plans’ investments are diversified to assist in managing risk. During the year ended July 31, 2023, the Company’s asset allocation was as follows:
|
|
|
|
|
|
|
|
|
|
|
|
|
|
|
|
|
Salaried Pension Plan |
|
Hourly Pension Plan |
| Global equity securities |
|
33 |
% |
|
32 |
% |
| Fixed income securities |
|
65 |
|
|
67 |
|
| Real asset funds |
|
1 |
|
|
— |
|
| Cash and cash equivalents |
|
1 |
|
|
1 |
|
| Total |
|
100 |
% |
|
100 |
% |
The target allocation guidelines are determined in conjunction with the Company’s investment consultant and through the use of modeling the risk/return trade-offs among asset classes utilizing assumptions about expected annual return, expected volatility/standard deviation of returns and expected correlations with other asset classes.
For non-U.S. plans, the general investment objectives are to maintain a suitably diversified portfolio of secure assets with appropriate liquidity that will generate income and capital growth to meet, together with any new contributions from members and the Company, the cost of current and future benefits. Investment policy and performance is measured and monitored on an ongoing basis.
Estimated Contributions and Future Payments
The Company’s general funding policy is to make at least the minimum required contributions as required by applicable regulations, plus any additional amounts it determines to be appropriate. The Company made contributions of $2.6 million to its pension plans during the year ended July 31, 2023. Future required pension plan contributions may change significantly depending on the actual rate of return on plan assets, discount rates and regulatory requirements.
Estimated future benefit required payments for the Company’s pension plans as of July 31, 2023 were as follows (in millions):
|
|
|
|
|
|
|
|
|
|
|
|
| 2024 |
|
$ |
33.0 |
|
| 2025 |
|
$ |
28.7 |
|
| 2026 |
|
$ |
30.9 |
|
| 2027 |
|
$ |
28.8 |
|
| 2028 |
|
$ |
28.9 |
|
| 2029-2033 |
|
$ |
161.5 |
|
Retirement Savings
The Company provides a contributory employee savings plan to U.S. employees that permits participants to make contributions by salary reduction pursuant to section 401(k) of the Internal Revenue Code. For eligible employees, employee contributions of up to 50% of compensation are matched at a rate equaling 100% of the first 3% contributed and 50% of the next 2% contributed. In addition, the Company contributes 3% of compensation annually for eligible employees. Total contribution expense for this plan was $28.6 million, $27.2 million and $25.2 million for the years ended July 31, 2023, 2022 and 2021, respectively.
Deferred Compensation and Other Benefit Plans
The Company provides various deferred compensation and other benefit plans to certain executives. The deferred compensation plan allows eligible employees to defer the receipt of all or a portion of their cash bonus and other stock-related compensation and up to 75% of their salary to future periods. Other benefit plans are provided to supplement the benefits for a select group of highly compensated individuals that are reduced because of compensation limitations set by the Internal Revenue Code. The Company has recorded a liability of $1.9 million and $2.6 million as of July 31, 2023 and 2022, respectively, related primarily to its deferred compensation plans.
Note 15. Derivative Instruments and Hedging
Derivative Fair Value Measurements
The Company enters into derivative instrument agreements, including foreign currency forward contracts and net investment hedges, to manage risk in connection with changes in foreign currency. The Company only enters into derivative instrument agreements with counterparties who have highly rated credit. There is risk the counterparties to derivative contracts will fail to meet their contractual obligations. In order to mitigate counterparty credit risk, the Company only enters into contracts with carefully selected financial institutions based upon their credit ratings and certain other financial factors.
Contract provisions may require the posting of collateral or settlement of the contracts for various reasons, including if the Company’s credit ratings are downgraded below its investment grade credit rating by any of the major credit agencies or for cross default contractual provisions if there is a failure under other financing arrangements related to payment terms or covenants. As of July 31, 2023 and 2022, no collateral was posted.
The Company does not enter into derivative instrument agreements for trading or speculative purposes. For discussion on the fair value of the Company’s derivatives, see Note 16.
Foreign Currency Forward Contracts - Cash Flow Hedges and Derivatives Not Designated as Hedging Instruments
The Company buys materials from foreign suppliers. Those transactions can be denominated in those suppliers’ local currency. The Company also sells to customers in foreign countries. Those transactions can be denominated in those customers’ local currency. Both of these transaction types can create volatility in the Company’s financial statements. The Company uses foreign currency forward contracts to manage those exposures and fluctuations. These contracts generally mature in 12 months or less, which is consistent with the forecasts of the related purchases and sales. Certain contracts are designated as cash flow hedges, whereas the remaining contracts, most of which are related to certain intercompany transactions which offset balance sheet exposure, are not designated as hedging instruments. The total notional amounts of the foreign currency forward contracts designated as hedges as of July 31, 2023 and 2022 were $84.9 million and $158.0 million, respectively. The total notional amounts of the foreign currency forward contracts not designated as hedges as of July 31, 2023 and 2022 were $147.5 million and $151.6 million, respectively.
Changes in the fair value of the Company’s designated hedges are reported in accumulated other comprehensive loss on the Consolidated Balance Sheets until the related transaction occurs, see Note 12. Designated hedges are recognized as a component of net sales, cost of sales, operating expenses and other income, net in the Consolidated Statements of Earnings upon occurrence of the related hedged transaction.
Hedges which are not designated are recognized in other income, net in the Consolidated Statements of Earnings along with the related hedged transactions. Changes in the fair value of hedges which are not designated, are recognized in other income, net in the Consolidated Statements of Earnings.
Amounts related to foreign currency forward contracts designated as hedges are expected to be reclassified into earnings during the next 12 months based upon the timing of inventory purchases and sales.
Net Investment Hedges
The Company uses fixed-to-fixed cross-currency swap agreements to hedge its exposure to adverse foreign currency exchange rate movements for its operations in Europe. The Company has elected the spot method for designating these contracts as net investment hedges.
The total notional amount of net investment hedges as of July 31, 2023 and 2022 was €80 million, or $88.8 million. The maturity dates range from 2027 to 2029.
Gains and losses resulting from a change in fair value of the net investment hedge are offset by gains and losses on the underlying foreign currency exposure and are included in accumulated other comprehensive loss on the Consolidated Balance Sheets. Amounts related to excluded components associated with the net investment hedge are expected to be reclassified into earnings in interest expense in the Consolidated Statements of Earnings through their maturity.
Interest Rate Swaps - Cash Flow Hedges
The Company uses swap agreements to hedge exposure related to interest expense and to manage its exposure to interest rate movements. In fiscal 2021, the Company entered into interest rate swap agreements designated as cash flow hedges with aggregate notional amounts of $40.0 million and $25.0 million, respectively, hedging future fixed-rate debt issuances, which effectively fixed a portion of interest payments based on the 10 year treasury rates. Both instruments terminated in fiscal 2021, generating a realized gain of $2.6 million and were subsequently recorded in accumulated other comprehensive loss on the Consolidated Balance Sheets. The gain is amortized in interest expense in the Consolidated Statements of Earnings over the life of the related debt. As of July 31, 2023 and 2022, there were no outstanding interest rate swap arrangements.
Cash Flows
Cash flows from derivative transactions are recorded in operating activities in the Consolidated Statements of Cash Flows.
Note 16. Fair Value Measurements
Fair value measurements of financial instruments are reported in one of three levels based on the lowest level of significant input used. For Level 1, inputs to the fair value measurement are quoted prices in active markets for identical assets or liabilities. For Level 2, inputs to the fair value measurement include quoted prices in active markets for similar assets or liabilities, quoted prices for identical or similar assets or liabilities in markets that are not active and inputs other than quoted prices that are observable for the asset or liability, either directly or indirectly. For Level 3, inputs to the fair value measurement are unobservable inputs or are based on valuation techniques.
Short-Term Financial Instruments
As of July 31, 2023 and 2022, the carrying values of cash and cash equivalents, accounts receivable, short-term borrowings and accounts payable approximate fair value because of the short-term nature of these instruments and are classified as Level 1 in the fair value hierarchy.
Long-Term Debt
As of July 31, 2023, the estimated fair values of fixed interest rate long-term debt were $378.9 million compared to the carrying values of $425.0 million. As of July 31, 2022, the estimated fair values of fixed interest rate long-term debt were $396.9 million compared to the carrying values of $425.0 million. The fair values are estimated by discounting the projected cash flows using the interest rates at which similar amounts of debt could currently be borrowed. The carrying values of total variable interest rate long-term debt were $198.4 million and $221.7 million as of July 31, 2023 and 2022, respectively and approximate their fair values. Long-term debt is classified as Level 2 in the fair value hierarchy.
Equity Method Investments
The Company holds equity method investments in its joint ventures, which are included in other long-term assets on the Consolidated Balance Sheets. The aggregate carrying amount of these investments was $24.4 million and $22.4 million as of July 31, 2023 and 2022, respectively. These equity method investments are measured at fair value on a non-recurring basis. The fair value of the Company’s equity method investments has not been adjusted as there have been no triggering events or changes in circumstance that would have had an adverse impact on the value of these investments. In the event these investments are required to be measured, they would fall within Level 3 of the fair value hierarchy due to the use of significant unobservable inputs to determine fair value, as the investments are in privately-held entities.
Derivative Fair Value Measurements
The fair values of the Company’s foreign currency forward contracts, net investment hedges and interest rate swaps reflect the amounts that would be received to sell the assets or paid to transfer the liabilities in an orderly transaction between market participants at the measurement date (exit price). The fair values are based on inputs other than quoted prices that are observable for the asset or liability and are determined by standard calculations and models that use readily observable market parameters. These inputs include foreign currency exchange rates and interest rates. Industry standard data providers are the primary source for forward and spot rate information for both interest rates and foreign currency exchange rates. The fair values of the Company’s foreign currency forward contracts, net investment hedges and interest rate swaps are classified as Level 2 in the fair value hierarchy. For discussion of the Company’s derivatives and hedging, see Note 15.
Fair Value of Derivative Contracts
The fair value of the Company’s derivative contracts, recorded on the Consolidated Balance Sheets, was as follows (in millions):
|
|
|
|
|
|
|
|
|
|
|
|
|
|
|
|
|
|
|
|
|
|
|
|
|
|
|
|
|
|
|
|
|
|
|
|
|
|
|
|
|
|
|
|
|
|
|
|
|
|
|
|
Assets |
|
Liabilities |
|
|
|
|
|
|
July 31, |
|
July 31, |
| Instruments |
|
Balance Sheet Location |
|
|
|
|
|
2023 |
|
2022 |
|
2023 |
|
2022 |
| Designated as hedging instruments |
|
|
|
|
|
|
|
|
|
|
|
|
|
|
Foreign currency forward contracts |
|
Other current assets, other long-term assets |
|
|
|
|
|
$ |
0.6 |
|
|
$ |
0.3 |
|
|
$ |
0.1 |
|
|
$ |
2.7 |
|
| Net investment hedges |
|
Other current assets, other long-term assets and other long-term liabilities |
|
|
|
|
|
3.6 |
|
|
8.2 |
|
|
— |
|
|
— |
|
|
|
|
|
|
|
|
|
|
|
|
|
|
|
|
| Total designated |
|
|
|
|
|
|
|
4.2 |
|
|
8.5 |
|
|
0.1 |
|
|
2.7 |
|
|
|
|
|
|
|
|
|
|
|
|
|
|
|
|
| Not designated as hedging instruments |
|
|
|
|
|
|
|
|
|
|
|
|
|
|
Foreign currency forward contracts |
|
Other current liabilities |
|
|
|
|
|
0.7 |
|
|
1.7 |
|
|
1.4 |
|
|
2.5 |
|
| Total not designated |
|
|
|
|
|
|
|
0.7 |
|
|
1.7 |
|
|
1.4 |
|
|
2.5 |
|
| Total |
|
|
|
|
|
|
|
$ |
4.9 |
|
|
$ |
10.2 |
|
|
$ |
1.5 |
|
|
$ |
5.2 |
|
|
|
|
|
|
|
|
|
|
|
|
|
|
|
|
Fair Value of Contingent Consideration
The fair value of the contingent consideration liability is determined using a probability-weighted discounted cash flow method. This fair value measurement is based on unobservable inputs in the market and thus, represents a Level 3 measurement within the fair value hierarchy. This analysis reflects the contractual terms of the purchase agreement (e.g., potential payment amounts, length of measurement periods, manner of calculating any amounts due) and utilizes assumptions with regard to future cash flows, probabilities of achieving such future cash flows and a discount rate. Depending on the contractual terms of the purchase agreement, the probability of achieving future cash flows or earnings generally represent the only significant unobservable inputs. The contingent consideration liability is measured at fair value each reporting period and changes in estimates of fair value are recognized in earnings.
A reconciliation of the fair value of the Company’s contingent consideration liability that use unobservable inputs was as follows (in millions):
|
|
|
|
|
|
|
|
|
|
|
|
|
|
|
|
|
|
|
|
|
|
|
|
|
|
|
|
|
|
| Balance as of July 31, 2022 |
|
$ |
24.7 |
|
|
|
|
|
| Issuances |
|
— |
|
|
|
|
|
|
|
|
|
|
|
|
| Adjustments to fair value |
|
0.3 |
|
|
|
|
|
| Balance as of July 31, 2023 |
|
$ |
25.0 |
|
|
|
|
|
|
|
|
|
|
|
|
| Maximum potential payout |
|
$ |
30.7 |
|
|
|
|
|
|
|
|
|
|
|
|
|
|
|
|
|
|
|
|
|
|
|
|
|
|
|
|
|
|
|
|
|
|
|
| Balance as of July 31, 2021 |
|
$ |
— |
|
|
|
|
|
| Issuances |
|
24.6 |
|
|
|
|
|
|
|
|
|
|
|
|
| Adjustments to fair value |
|
0.1 |
|
|
|
|
|
| Balance as of July 31, 2022 |
|
$ |
24.7 |
|
|
|
|
|
|
|
|
|
|
|
|
| Maximum potential payout |
|
$ |
30.7 |
|
|
|
|
|
There was no contingent consideration as of and for the year ended July 31, 2021, see Note 2.
Note 17. Guarantees
Letters of Credit
The Company has letters of credit which guarantee payment to third parties in the event the Company is in breach of contract terms as detailed in each letter of credit. The outstanding debt contingent liability for standby letters of credit was as follows (in millions):
|
|
|
|
|
|
|
|
|
|
|
|
|
|
|
|
|
Year Ended July 31, |
|
|
2023 |
|
2022 |
| Contingent liability for standby letters of credit issued under the Company’s revolving credit facility |
|
$ |
7.5 |
|
|
$ |
7.5 |
|
| Amounts drawn for letters of credit under the Company’s revolving credit facility |
|
$ |
— |
|
|
$ |
— |
|
|
|
|
|
|
Advanced Filtration Systems Inc. (AFSI)
The Company has an unconsolidated joint venture, AFSI, established by the Company and Caterpillar Inc. (Caterpillar) in 1986. AFSI designs and manufactures high-efficiency fluid filters used in Caterpillar’s machinery worldwide. The Company and Caterpillar equally own the shares of AFSI and both companies guarantee certain debt and banking services, including credit and debit cards, merchant processing and treasury management services, of the joint venture. The Company accounts for AFSI as an equity method investment.
The outstanding debt relating to AFSI, of which the Company guarantees half, was $59.6 million and $68.8 million as of July 31, 2023 and 2022, respectively. AFSI has $63.0 million in a revolving credit facility which expires in 2024 and $17.0 million in an additional multi-currency revolving credit facility which terminates upon notification of either party.
Earnings from AFSI, which are recorded in other income, net in the Consolidated Statements of Earnings were $8.5 million and $8.1 million as of July 31, 2023 and 2022, respectively.
Note 18. Commitments and Contingencies
The Company records provisions when it is probable a liability has been incurred and the amount of the loss can be reasonably estimated. Claims and litigation are reviewed quarterly and provisions are taken or adjusted to reflect the status of a particular matter. The Company believes the estimated liability in its Consolidated Financial Statements for claims or litigation is adequate and appropriate for the probable and estimable outcomes. Liabilities recorded were not material to the Company’s financial position, results of operations or liquidity. The Company believes it is remote that the settlement of any of the currently identified claims or litigation will be materially in excess of what is accrued.
Warranty Reserves
The Company estimates warranty expense on certain products at the time of sale using quantitative measures based on historical warranty claim experience and evaluation of specific customer warranty issues. There were no individually or collectively material specific warranty matters accrued for, or significant settlements made, during the years ended July 31, 2023 and 2022. The Company’s accrued warranty reserves were $5.5 million and $4.9 million as of July 31, 2023 and 2022, respectively.
Note 19. Segment Reporting
During the first quarter of fiscal 2023, the Company announced a company-wide organizational redesign to further support the Company’s growth strategies and better serve its customers. Effective November 1, 2022, as a result of the organizational redesign, the Company established a new segment reporting structure which resulted in three reportable segments: Mobile Solutions, Industrial Solutions and Life Sciences. The organizational structure also includes Corporate and Unallocated which includes interest expense and certain corporate expenses determined to be non-allocable to the segments, such as restructuring charges and business development expenses. The Company determines its operating segments consistent with the manner in which it manages its operations and evaluates performance for internal review and decision-making. All prior segment information has been recast to reflect the Company’s new segment structure and current period presentation. In fiscal 2023, Corporate and Unallocated also included a charge of $21.8 million related to the organizational redesign as well as costs associated with the exiting of a lower-margin customer program and product.
The Mobile Solutions segment is organized based on a combination of customers and products and consists of the Off-Road, On-Road and Aftermarket business units. Within these business units, products consist of replacement filters for both air and liquid filtration applications and filtration housings for new equipment production and systems related to exhaust and emissions. Applications include air filtration systems, fuel, lube and hydraulic systems, emissions systems and sensors, indicators and monitoring systems. Mobile Solutions sells to original equipment manufacturers (OEMs) in the construction, mining, agriculture and transportation end markets and to independent distributors and OEM dealer networks.
The Industrial Solutions segment is organized based on product type and consists of the Industrial Air Filtration, Industrial Gasses, Industrial Hydraulics, Power Generation and Aerospace and Defense business units. Within our industrial portfolio, Donaldson provides the widest product offering in the market to industrial customers consisting of equipment, ancillary components, replacement parts, performance monitoring and service globally, that cost-effectively enhances productivity and manufacturing efficiency. Industrial Air Filtration, Industrial Gasses and Industrial Hydraulics products consist of dust, fume and mist collectors, compressed air and industrial gasses purification systems, hydraulic and lubricated rotating filtration applications as well as gas and liquid filtration for industrial processes. Power Generation products consist of air inlet systems and filtration sold to gas compression, power generation and natural gas liquification industries. Aerospace and Defense products consist of air, fuel, lubrication and hydraulic filtration for fixed-wing and rotorcraft aerospace applications and ground defense vehicle and naval platforms. Industrial Solutions businesses sell through multiple channels which include OEMs, distributors and direct-to-consumer in some markets.
The Life Sciences segment is organized by end market, including the Bioprocessing, Food and Beverage, Medical Device, Vehicle Electrification, Microelectronics and Disk Drive business units. Our products include gas and liquid filtration, bioprocessing equipment (including bioreactors, fermenters and filtration skids), bioprocessing consumables, (including membrane chromatography devices, reagents and filters) and specialized air and gas filtration systems for hard disk drive, semiconductor and electric vehicle applications. Life Sciences primarily sells to large OEMs and directly to various end users requiring cell growth, separation, purification, high purity filtration and device protection.
The Company has manufacturing facilities that serve multiple reportable segments. As such, capital expenditure information by reportable segment has not been provided because the Company does not produce or utilize such information internally. In addition, although depreciation and amortization expense is a component of each reportable segment’s operating results, it is not discretely identifiable.
The Company is an integrated enterprise, characterized by substantial intersegment cooperation, cost allocations and sharing of assets. Therefore, the Company does not represent these segments, if operated independently, would report earnings before income taxes and other financial information as stated below.
Segment details were as follows (in millions):
|
|
|
|
|
|
|
|
|
|
|
|
|
|
|
|
|
|
|
|
|
|
|
|
|
|
|
|
|
|
|
|
|
|
|
Mobile Solutions Segment |
|
Industrial Solutions Segment |
|
Life Sciences Segment |
|
Corporate and
Unallocated |
|
Total
Company |
| Year ended July 31, 2023 |
|
|
|
|
|
|
|
|
|
|
| Net sales |
|
$ |
2,174.8 |
|
|
$ |
1,014.7 |
|
|
$ |
241.3 |
|
|
$ |
— |
|
|
$ |
3,430.8 |
|
|
|
|
|
|
|
|
|
|
|
|
| Equity earnings in unconsolidated affiliates |
|
$ |
3.6 |
|
|
$ |
— |
|
|
$ |
— |
|
|
$ |
— |
|
|
$ |
3.6 |
|
| Earnings (loss) before income taxes |
|
$ |
330.4 |
|
|
$ |
186.2 |
|
|
$ |
9.9 |
|
|
$ |
(57.8) |
|
|
$ |
468.7 |
|
| Assets |
|
$ |
1,243.8 |
|
|
$ |
788.1 |
|
|
$ |
513.8 |
|
|
$ |
224.8 |
|
|
$ |
2,770.5 |
|
| Equity investments in unconsolidated affiliates |
|
$ |
24.2 |
|
|
$ |
0.2 |
|
|
$ |
— |
|
|
$ |
— |
|
|
$ |
24.4 |
|
|
|
|
|
|
|
|
|
|
|
|
|
|
|
|
|
|
|
|
|
|
|
| Year ended July 31, 2022 |
|
|
|
|
|
|
|
|
|
|
| Net sales |
|
$ |
2,126.5 |
|
|
$ |
901.0 |
|
|
$ |
279.1 |
|
|
$ |
— |
|
|
$ |
3,306.6 |
|
|
|
|
|
|
|
|
|
|
|
|
| Equity earnings in unconsolidated affiliates |
|
$ |
1.7 |
|
|
$ |
— |
|
|
$ |
— |
|
|
$ |
— |
|
|
$ |
1.7 |
|
| Earnings (loss) before income taxes |
|
$ |
293.8 |
|
|
$ |
133.0 |
|
|
$ |
64.9 |
|
|
$ |
(53.3) |
|
|
$ |
438.4 |
|
| Assets |
|
$ |
1,319.4 |
|
|
$ |
816.0 |
|
|
$ |
267.8 |
|
|
$ |
197.1 |
|
|
$ |
2,600.3 |
|
| Equity investments in unconsolidated affiliates |
|
$ |
22.3 |
|
|
$ |
0.1 |
|
|
$ |
— |
|
|
$ |
— |
|
|
$ |
22.4 |
|
|
|
|
|
|
|
|
|
|
|
|
|
|
|
|
|
|
|
|
|
|
|
| Year ended July 31, 2021 |
|
|
|
|
|
|
|
|
|
|
| Net sales |
|
$ |
1,818.4 |
|
|
$ |
781.0 |
|
|
$ |
254.5 |
|
|
$ |
— |
|
|
$ |
2,853.9 |
|
|
|
|
|
|
|
|
|
|
|
|
| Equity earnings in unconsolidated affiliates |
|
$ |
4.2 |
|
|
$ |
— |
|
|
$ |
— |
|
|
$ |
— |
|
|
$ |
4.2 |
|
| Earnings (loss) before income taxes |
|
$ |
276.1 |
|
|
$ |
81.0 |
|
|
$ |
65.2 |
|
|
$ |
(41.3) |
|
|
$ |
381.0 |
|
| Assets |
|
$ |
1,216.0 |
|
|
$ |
812.0 |
|
|
$ |
139.8 |
|
|
$ |
232.4 |
|
|
$ |
2,400.2 |
|
| Equity investments in unconsolidated affiliates |
|
$ |
24.0 |
|
|
$ |
0.2 |
|
|
$ |
— |
|
|
$ |
— |
|
|
$ |
24.2 |
|
|
|
|
|
|
|
|
|
|
|
|
Net sales by business unit were as follows (in millions):
|
|
|
|
|
|
|
|
|
|
|
|
|
|
|
|
|
|
|
|
|
|
|
Year Ended July 31, |
|
|
2023 |
|
2022 |
|
2021 |
| Mobile Solutions segment |
|
|
|
|
|
|
| Off-Road |
|
$ |
428.7 |
|
|
$ |
390.5 |
|
|
$ |
316.3 |
|
| On-Road |
|
145.8 |
|
|
136.1 |
|
|
138.8 |
|
| Aftermarket |
|
1,600.3 |
|
|
1,599.9 |
|
|
1,363.3 |
|
| Total Mobile Solutions segment |
|
2,174.8 |
|
|
2,126.5 |
|
|
1,818.4 |
|
|
|
|
|
|
|
|
| Industrial Solutions segment |
|
|
|
|
|
|
Industrial Filtration Solutions |
|
872.2 |
|
|
780.5 |
|
|
684.8 |
|
| Aerospace and Defense |
|
142.5 |
|
|
120.5 |
|
|
96.2 |
|
| Total Industrial Solutions segment |
|
1,014.7 |
|
|
901.0 |
|
|
781.0 |
|
|
|
|
|
|
|
|
| Life Sciences segment |
|
|
|
|
|
|
| Total Life Sciences segment |
|
241.3 |
|
|
279.1 |
|
|
254.5 |
|
|
|
|
|
|
|
|
| Total Company |
|
$ |
3,430.8 |
|
|
$ |
3,306.6 |
|
|
$ |
2,853.9 |
|
Net sales, generally disaggregated by location where the customer’s order was received and property, plant and equipment, net by geographic region were as follows (in millions):
|
|
|
|
|
|
|
|
|
|
|
|
|
|
|
|
|
Net Sales |
|
Property, Plant and Equipment, Net |
| Year ended July 31, 2023 |
|
|
|
|
| U.S. and Canada |
|
$ |
1,464.7 |
|
|
$ |
219.7 |
|
| EMEA |
|
1,007.8 |
|
|
202.4 |
|
| APAC |
|
608.8 |
|
|
76.5 |
|
| LATAM |
|
349.5 |
|
|
154.3 |
|
| Total |
|
$ |
3,430.8 |
|
|
$ |
652.9 |
|
|
|
|
|
|
|
|
|
|
|
| Year ended July 31, 2022 |
|
|
|
|
| U.S. and Canada |
|
$ |
1,336.8 |
|
|
$ |
218.1 |
|
| EMEA |
|
963.6 |
|
|
184.3 |
|
| APAC |
|
669.0 |
|
|
59.5 |
|
| LATAM |
|
337.2 |
|
|
132.5 |
|
| Total |
|
$ |
3,306.6 |
|
|
$ |
594.4 |
|
|
|
|
|
|
|
|
|
|
|
| Year ended July 31, 2021 |
|
|
|
|
| U.S. and Canada |
|
$ |
1,084.2 |
|
|
$ |
214.0 |
|
| EMEA |
|
865.7 |
|
|
220.4 |
|
| APAC |
|
649.2 |
|
|
60.4 |
|
| LATAM |
|
254.8 |
|
|
123.0 |
|
| Total |
|
$ |
2,853.9 |
|
|
$ |
617.8 |
|
Concentrations
There were no customers that accounted for over 10% of net sales for the years ended July 31, 2023, 2022 or 2021. There were no customers that accounted for over 10% of gross accounts receivable as of July 31, 2023 or 2022.
Note 20. Restructuring
During the first quarter of fiscal 2023, the Company announced a company-wide organizational redesign to further support the Company’s growth strategies and better serve its customers. In conjunction with the organizational redesign, the Company recorded $21.8 million of charges consisting of $15.3 million of severance charges and other organizational redesign costs and $6.5 million of costs mainly associated with the exiting of a lower-margin customer program and a lower-margin product. Charges of $2.9 million were included in cost of sales and $18.9 million were included in selling, general and administrative expenses in the accompanying Consolidated Statements of Earnings.
In the second quarter of fiscal 2021, the Company initiated activities to further improve its operating and manufacturing cost structure, primarily in EMEA. These activities resulted in restructuring expenses, primarily related to severance, of $14.8 million. Charges of $5.8 million were included in cost of sales and $9.0 million were included in operating expenses in the Consolidated Statements of Earnings for the year ended July 31, 2021. This initiative is now substantially completed.
Item 9. Changes in and Disagreements With Accountants on Accounting and Financial Disclosure
None.
Item 9A. Controls and Procedures
Evaluation of Disclosure Controls and Procedures
Management of the Company, with the participation of its Chief Executive Officer and the Chief Financial Officer, evaluated the effectiveness of the Company’s disclosure controls and procedures as of the end of the period. Based on their evaluation, as of the end of the period covered, the Company’s Chief Executive Officer and Chief Financial Officer concluded the Company’s disclosure controls and procedures (as defined in Rules 13a-15(e) and 15d-15(e) under the Exchange Act) were effective. The Company’s disclosure controls and procedures are designed so information required to be disclosed by the issuer in the reports it files or submits under the Exchange Act is recorded, processed, summarized and reported within the time periods specified in the Securities and Exchange Commission’s (SEC) rules and forms and such information is accumulated and communicated to management of the Company, with the participation of its Chief Executive Officer and Chief Financial Officer, as appropriate to allow timely decisions regarding required disclosure.
Changes in Internal Control over Financial Reporting
No change in the Company’s internal control over financial reporting (as defined by Rules 13a-15(f) under the Exchange Act) occurred during the fiscal quarter ended July 31, 2023, that has materially affected, or is reasonably likely to materially affect, the Company’s internal control over financial reporting.
Management’s Report on Internal Control over Financial Reporting
See Management’s Report on Internal Control over Financial Reporting under Item 8 of this Annual Report.
Report of Independent Registered Public Accounting Firm
See Report of Independent Registered Public Accounting Firm under Item 8 of this Annual Report.
Item 9B. Other Information
During the three months ended July 31, 2023, no director or officer of the Company adopted, modified or terminated a “Rule 10b5-1 trading arrangement” or “non-Rule 10b5-1 trading arrangement,” as each term is defined in Item 408(a) of Regulation S-K.
Item 9C. Disclosure Regarding Foreign Jurisdictions that Prevent Inspections
None.
PART III
Item 10. Directors, Executive Officers and Corporate Governance
The information under the captions “Item 1: Election of Directors,” “Director Selection Process,” “Audit Committee,” “Audit Committee Expertise” and “Complaint-Handling Procedures” of the 2023 Proxy Statement is incorporated herein by reference. Information on the Executive Officers of the Company is found under the caption “Executive Officers” in Part I of this Annual Report.
The Company has adopted a code of business conduct and ethics in compliance with applicable rules of the SEC that applies to its Principal Executive Officer, its Principal Financial Officer and its Principal Accounting Officer or Controller or persons performing similar functions. A copy of the code of business conduct and ethics is posted on the Company’s website at ir.donaldson.com. The code of business conduct and ethics is available in print, free of charge, to any stockholder who requests it. The Company will disclose any amendments to or waivers of the code of business conduct and ethics for the Company’s Principal Executive Officer, Principal Financial Officer and Principal Accounting Officer on the Company’s website.
Item 11. Executive Compensation
The information under the captions “Executive Compensation” and “Director Compensation” of the 2023 Proxy Statement is incorporated herein by reference.
Item 12. Security Ownership of Certain Beneficial Owners and Management and Related Stockholder Matters
The information under the captions “Security Ownership” and “Equity Compensation Plan Information” of the 2023 Proxy Statement is incorporated herein by reference.
Item 13. Certain Relationships and Related Transactions and Director Independence
The information under the captions “Policy and Procedures Regarding Transactions with Related Persons” and “Board Oversight and Director Independence” of the 2023 Proxy Statement is incorporated herein by reference.
Item 14. Principal Accountant Fees and Services
The information under the captions “Independent Registered Public Accounting Firm Fees” and “Audit Committee Pre-Approval Policies and Procedures” of the 2023 Proxy Statement is incorporated herein by reference.
PART IV
Item 15. Exhibits and Financial Statement Schedules
Documents filed with this report:
|
|
|
|
|
|
| (1) |
Financial Statements |
|
Report of Independent Registered Public Accounting Firm (PCAOB ID 238) |
|
Consolidated Statements of Earnings — years ended July 31, 2023, 2022 and 2021 |
|
Consolidated Statements of Comprehensive Income — years ended July 31, 2023, 2022 and 2021 |
|
Consolidated Balance Sheets — July 31, 2023 and 2022 |
|
Consolidated Statements of Cash Flows — years ended July 31, 2023, 2022 and 2021 |
|
Consolidated Statements of Changes in Stockholders’ Equity — years ended July 31, 2023, 2022 and 2021 |
|
Notes to Consolidated Financial Statements |
| (2) |
Financial Statement Schedules |
|
|
|
All other schedules (Schedules I, II, III, IV and V) for which provision is made in the applicable accounting regulations of the SEC are not required under the related instruction, or are inapplicable and therefore have been omitted or the required information is shown in the consolidated financial statements or the accompanying notes to the consolidated financial statements. |
| (3) |
Exhibits |
|
|
|
|
|
|
|
|
|
|
|
|
|
|
|
|
|
|
|
|
|
|
|
|
|
|
|
|
|
|
|
|
|
|
|
|
| 101 |
The following financial information from the Donaldson Company, Inc. Annual Report on Form 10-K for the fiscal year ended July 31, 2023, formatted in Inline eXtensible Business Reporting Language (iXBRL): (i) the Consolidated Statements of Earnings, (ii) the Consolidated Statements of Comprehensive Income, (iii) the Consolidated Balance Sheets, (iv) the Consolidated Statements of Cash Flows, (v) the Consolidated Statements of Changes in Stockholders’ Equity and (vi) the Notes to Consolidated Financial Statements |
| 104 |
The cover page from the Donaldson Company, Inc. Annual Report on Form 10-K for the fiscal year ended July 31, 2023, formatted in iXBRL (included as Exhibit 101) |
__________________
|
|
|
|
|
|
|
|
|
| * |
|
Exhibit has previously been filed with the SEC and is incorporated herein by reference as an exhibit. |
| ** |
|
Pursuant to the provisions of Regulation S-K Item 601(b)(4)(iii)(A), copies of instruments defining the rights of holders of certain long-term debts of the Registrant and its subsidiaries are not filed and in lieu thereof the Registrant agrees to furnish a copy thereof to the SEC upon request. |
| *** |
|
Denotes compensatory plan or management contract. |
Item 16. Form 10-K Summary
None.
SIGNATURES
Pursuant to the requirements of Section 13 or 15(d) of the Securities Exchange Act of 1934, the registrant has duly caused this report to be signed on its behalf by the undersigned, thereunto duly authorized.
|
|
|
|
|
|
|
|
|
|
|
|
|
|
|
| |
|
DONALDSON COMPANY, INC. |
| |
|
|
|
| Date: |
September 22, 2023 |
|
By: |
/s/ Tod E. Carpenter |
| |
|
|
|
Tod E. Carpenter
Chief Executive Officer |
Pursuant to the requirements of the Securities Exchange Act of 1934, this report has been signed below by the following persons on behalf of the registrant and in the capacities indicated on September 22, 2023.
|
|
|
|
|
|
|
|
|
|
|
|
| /s/ Tod E. Carpenter |
|
Chairman, President and Chief Executive Officer |
| Tod E. Carpenter |
|
(Principal Executive Officer) |
|
|
|
| /s/ Scott J. Robinson |
|
Chief Financial Officer |
| Scott J. Robinson |
|
(Principal Financial Officer) |
|
|
|
| /s/ Andrew J. Cebulla |
|
Vice President and Corporate Controller |
| Andrew J. Cebulla |
|
(Principal Accounting Officer) |
|
|
|
| * |
|
Director |
| Pilar Cruz |
|
|
|
|
|
| * |
|
Director |
| Christopher M. Hilger |
|
|
|
|
|
| * |
|
Director |
| Douglas A. Milroy |
|
|
|
|
|
| * |
|
Director |
| Willard D. Oberton |
|
|
|
|
|
| * |
|
Director |
| Richard M. Olson |
|
|
|
|
|
| * |
|
Director |
| James J. Owens |
|
|
|
|
|
| * |
|
Director |
| Ajita G. Rajendra |
|
|
|
|
|
| * |
|
Director |
| Trudy A. Rautio |
|
|
|
|
|
| * |
|
Director |
| Jacinth C. Smiley |
|
|
|
|
|
| *By: /s/ Amy C. Becker |
|
|
| Amy C. Becker |
|
|
| As attorney-in-fact |
|
|
EX-21
2
exhibit21dci20230731.htm
EX-21
Document
Exhibit 21
Wholly Owned Subsidiaries, Joint Ventures and Partnerships
Wholly Owned Subsidiaries
|
|
|
|
|
|
| Name of Company |
Where Organized |
| BOFA International Ltd. |
Poole, United Kingdom |
| Donaldson Australasia Pty. Ltd. |
Wyong, Australia |
| Donaldson Belgie, b.v.b.a. |
Leuven, Belgium |
| Donaldson Canada, Inc. |
Toronto, Ontario, Canada |
| Donaldson Chile, Ltd. |
Santiago, Chile |
| Donaldson China Holding Co., Ltd. |
Shanghai, China Mainland |
| Donaldson China Trading Co., Ltd. |
Wuxi, China Mainland |
| Donaldson Colombia S.A.S. |
Bogotá, Colombia |
| Donaldson Czech Republic s.r.o. |
Klasterec nad Ohri, Czech Republic |
| Donaldson do Brasil Equipamentos Industriais Ltda |
Atibaia, São Paulo, Brazil |
| Donaldson Education Investment Company RF (Pty) Ltd. |
Modderfontein, South Africa |
| Donaldson Europe b.v. |
Leuven, Belgium |
| Donaldson Far East Ltd. |
Hong Kong, S.A.R. |
| Donaldson Filter Components Ltd. |
Hull, United Kingdom |
| Donaldson Filtration (Asia Pacific) Pte. Ltd. |
Changi, Singapore |
| Donaldson Filtration Deutschland GmbH |
Haan, Germany |
| Donaldson Filtration (GB) Ltd. |
Leicester, United Kingdom |
| Donaldson Filtration Magyarorszag Kft. |
Budapest, Hungary |
| Donaldson Filtration Malaysia Sdn. Bhd. |
Selangor Darul Ehsan, Malaysia |
| Donaldson Filtration Norway a.s. |
Moss, Norway |
| Donaldson Filtration Österreich, GmbH |
Vienna, Austria |
| Donaldson Filtration Slovensko s.r.o. |
Bratislava, Slovakia |
| Donaldson Filtration Sub Saharan Africa (Pty) Ltd. |
Modderfontein, South Africa |
| Donaldson Filtration Systems (Pty) Ltd. |
Cape Town, South Africa |
| Donaldson Filtration (Thailand) Ltd. |
Nonthaburi, Thailand |
| Donaldson Filtre Sistemleri Ticaret Ltd. Sirketi |
Istanbul, Turkey |
| Donaldson France S.A.S. |
Paris, France |
| Donaldson Ibèrica Soluciones en Filtracion s.l. |
Barcelona, Spain |
| Donaldson India Filter Systems Pvt. Ltd. |
New Delhi, India |
| Donaldson Industrial CR s.r.o. |
Kadan, Czech Republic |
| Donaldson Italia s.r.l. |
Ostiglia, Italy |
| Donaldson Korea Co., Ltd. |
Seoul, South Korea |
| Donaldson Middle East Filtration System LLC |
Abu Dhabi, United Arab Emirates |
| Donaldson Nederland B.V. |
Almere, Netherlands |
| Donaldson Peru s.a.c. |
Lima, Peru |
| Donaldson Polska Sp. z.o.o. |
Warsaw, Poland |
| Donaldson S.A. de C.V. |
Aguascalientes, Mexico |
| Donaldson S.A.S. |
Domjean, France |
| Donaldson Scandinavia a.p.s. |
Hørsholm, Denmark |
| Donaldson Schweiz GmbH |
Zurich, Switzerland |
| Donaldson Taiwan Inc. |
Taipei, Taiwan |
| Donaldson (Thailand) Ltd. |
Rayong, Thailand |
|
|
|
|
|
|
| Name of Company |
Where Organized |
| Donaldson UK Holding Ltd. |
Hull, United Kingdom |
| Donaldson (Wuxi) Filters Co. Ltd. |
Wuxi, China Mainland |
| Filtros Partmo S.A.S. |
Bogotá, Colombia |
| Isolere Bio, Inc. |
Durham, North Carolina, USA |
| Le Bozec Filtration Systems, S.A.S. |
Paris, France |
| Nippon Donaldson Ltd. |
Tachikawa, Tokyo, Japan |
Pearson Arnold Industrial Services |
New Hope, Minnesota, USA |
| P.T. Donaldson Filtration Indonesia |
Jakarta, Indonesia |
Purilogics, LLC |
Greenville, South Carolina, USA |
| Shoo 788AA Ltd. |
Poole, United Kingdom |
| Ultrafilter S.A.S. |
Vigny, France |
Joint Ventures and Partnerships
|
|
|
|
|
|
| Name of Company |
Where Organized |
| Advanced Filtration Systems Inc. |
Champaign, Illinois, USA |
| AFSI Europe s.r.o. |
Most, Czech Republic |
| P.T. Panata Jaya Mandiri |
Jakarta, Indonesia |
EX-23
3
exhibit23dci20230731.htm
EX-23
Document
Exhibit 23
Consent of Independent Registered Public Accounting Firm
We hereby consent to the incorporation by reference in the Registration Statements on Form S-8 (Nos. 333-235394, 333-238901, 333-170729, 333-97771, 33-27086 and 33-44624) of Donaldson Company, Inc. of our report dated September 22, 2023 relating to the financial statements and the effectiveness of internal control over financial reporting, which appears in this Form 10-K.
/s/ PricewaterhouseCoopers LLP
Minneapolis, Minnesota
September 22, 2023
EX-24
4
exhibit24dci20230731.htm
EX-24
Document
Exhibit 24
POWER OF ATTORNEY
The undersigned does hereby constitute and appoint Amy C. Becker and Andrew J. Cebulla the undersigned’s attorneys-in-fact and agents, individually and separately, for the purpose of signing in the undersigned’s name and on the undersigned’s behalf as a Director of Donaldson Company, Inc., a report on Form 10-K for the Annual Report for Fiscal Year 2023, pursuant to Section 13 or 15(d) of the Securities Exchange Act of 1934, of Donaldson Company, Inc., and any and all amendments thereto, and to deliver on the undersigned’s behalf said report so signed for filing with the Securities and Exchange Commission.
Dated: September 22, 2023
|
|
|
|
|
|
| |
/s/ Tod E. Carpenter |
| |
Signature |
| |
|
| |
Tod E. Carpenter |
| |
Print Name |
POWER OF ATTORNEY
The undersigned does hereby constitute and appoint Tod E. Carpenter, Amy C. Becker, and Andrew J. Cebulla the undersigned’s attorneys-in-fact and agents, individually and separately, for the purpose of signing in the undersigned’s name and on the undersigned’s behalf as a Director of Donaldson Company, Inc., a report on Form 10-K for the Annual Report for Fiscal Year 2023, pursuant to Section 13 or 15(d) of the Securities Exchange Act of 1934, of Donaldson Company, Inc., and any and all amendments thereto, and to deliver on the undersigned’s behalf said report so signed for filing with the Securities and Exchange Commission.
Dated: September 22, 2023
|
|
|
|
|
|
| |
/s/ Pilar Cruz |
| |
Signature |
| |
|
| |
Pilar Cruz |
| |
Print Name |
POWER OF ATTORNEY
The undersigned does hereby constitute and appoint Tod E. Carpenter, Amy C. Becker, and Andrew J. Cebulla the undersigned’s attorneys-in-fact and agents, individually and separately, for the purpose of signing in the undersigned’s name and on the undersigned’s behalf as a Director of Donaldson Company, Inc., a report on Form 10-K for the Annual Report for Fiscal Year 2023, pursuant to Section 13 or 15(d) of the Securities Exchange Act of 1934, of Donaldson Company, Inc., and any and all amendments thereto, and to deliver on the undersigned’s behalf said report so signed for filing with the Securities and Exchange Commission.
Dated: September 22, 2023
|
|
|
|
|
|
| |
/s/ Christopher M. Hilger |
| |
Signature |
| |
|
| |
Christopher M. Hilger |
| |
Print Name |
POWER OF ATTORNEY
The undersigned does hereby constitute and appoint Tod E. Carpenter, Amy C. Becker, and Andrew J. Cebulla the undersigned’s attorneys-in-fact and agents, individually and separately, for the purpose of signing in the undersigned’s name and on the undersigned’s behalf as a Director of Donaldson Company, Inc., a report on Form 10-K for the Annual Report for Fiscal Year 2023, pursuant to Section 13 or 15(d) of the Securities Exchange Act of 1934, of Donaldson Company, Inc., and any and all amendments thereto, and to deliver on the undersigned’s behalf said report so signed for filing with the Securities and Exchange Commission.
Dated: September 22, 2023
|
|
|
|
|
|
| |
/s/ Douglas A. Milroy |
| |
Signature |
| |
|
| |
Douglas A. Milroy |
| |
Print Name |
POWER OF ATTORNEY
The undersigned does hereby constitute and appoint Tod E. Carpenter, Amy C. Becker, and Andrew J. Cebulla the undersigned’s attorneys-in-fact and agents, individually and separately, for the purpose of signing in the undersigned’s name and on the undersigned’s behalf as a Director of Donaldson Company, Inc., a report on Form 10-K for the Annual Report for Fiscal Year 2023, pursuant to Section 13 or 15(d) of the Securities Exchange Act of 1934, of Donaldson Company, Inc., and any and all amendments thereto, and to deliver on the undersigned’s behalf said report so signed for filing with the Securities and Exchange Commission.
Dated: September 22, 2023
|
|
|
|
|
|
| |
/s/ Willard D. Oberton |
| |
Signature |
| |
|
| |
Willard D. Oberton |
| |
Print Name |
POWER OF ATTORNEY
The undersigned does hereby constitute and appoint Tod E. Carpenter, Amy C. Becker, and Andrew J. Cebulla the undersigned’s attorneys-in-fact and agents, individually and separately, for the purpose of signing in the undersigned’s name and on the undersigned’s behalf as a Director of Donaldson Company, Inc., a report on Form 10-K for the Annual Report for Fiscal Year 2023, pursuant to Section 13 or 15(d) of the Securities Exchange Act of 1934, of Donaldson Company, Inc., and any and all amendments thereto, and to deliver on the undersigned’s behalf said report so signed for filing with the Securities and Exchange Commission.
Dated: September 22, 2023
|
|
|
|
|
|
| |
/s/ Richard M. Olson |
| |
Signature |
| |
|
| |
Richard M. Olson |
| |
Print Name |
POWER OF ATTORNEY
The undersigned does hereby constitute and appoint Tod E. Carpenter, Amy C. Becker, and Andrew J. Cebulla the undersigned’s attorneys-in-fact and agents, individually and separately, for the purpose of signing in the undersigned’s name and on the undersigned’s behalf as a Director of Donaldson Company, Inc., a report on Form 10-K for the Annual Report for Fiscal Year 2023, pursuant to Section 13 or 15(d) of the Securities Exchange Act of 1934, of Donaldson Company, Inc., and any and all amendments thereto, and to deliver on the undersigned’s behalf said report so signed for filing with the Securities and Exchange Commission.
Dated: September 22, 2023
|
|
|
|
|
|
| |
/s/ James J. Owens |
| |
Signature |
| |
|
| |
James J. Owens |
| |
Print Name |
POWER OF ATTORNEY
The undersigned does hereby constitute and appoint Tod E. Carpenter, Amy C. Becker, and Andrew J. Cebulla the undersigned’s attorneys-in-fact and agents, individually and separately, for the purpose of signing in the undersigned’s name and on the undersigned’s behalf as a Director of Donaldson Company, Inc., a report on Form 10-K for the Annual Report for Fiscal Year 2023, pursuant to Section 13 or 15(d) of the Securities Exchange Act of 1934, of Donaldson Company, Inc., and any and all amendments thereto, and to deliver on the undersigned’s behalf said report so signed for filing with the Securities and Exchange Commission.
Dated: September 22, 2023
|
|
|
|
|
|
| |
/s/ Ajita G. Rajendra |
| |
Signature |
| |
|
| |
Ajita G. Rajendra |
| |
Print Name |
POWER OF ATTORNEY
The undersigned does hereby constitute and appoint Tod E. Carpenter, Amy C. Becker, and Andrew J. Cebulla the undersigned’s attorneys-in-fact and agents, individually and separately, for the purpose of signing in the undersigned’s name and on the undersigned’s behalf as a Director of Donaldson Company, Inc., a report on Form 10-K for the Annual Report for Fiscal Year 2023, pursuant to Section 13 or 15(d) of the Securities Exchange Act of 1934, of Donaldson Company, Inc., and any and all amendments thereto, and to deliver on the undersigned’s behalf said report so signed for filing with the Securities and Exchange Commission.
Dated: September 22, 2023
|
|
|
|
|
|
| |
/s/ Trudy A. Rautio |
| |
Signature |
| |
|
| |
Trudy A. Rautio |
| |
Print Name |
POWER OF ATTORNEY
The undersigned does hereby constitute and appoint Tod E. Carpenter, Amy C. Becker, and Andrew J. Cebulla the undersigned’s attorneys-in-fact and agents, individually and separately, for the purpose of signing in the undersigned’s name and on the undersigned’s behalf as a Director of Donaldson Company, Inc., a report on Form 10-K for the Annual Report for Fiscal Year 2023, pursuant to Section 13 or 15(d) of the Securities Exchange Act of 1934, of Donaldson Company, Inc., and any and all amendments thereto, and to deliver on the undersigned’s behalf said report so signed for filing with the Securities and Exchange Commission.
Dated: September 22, 2023
|
|
|
|
|
|
| |
/s/ Jacinth C. Smiley |
| |
Signature |
| |
|
| |
Jacinth C. Smiley |
| |
Print Name |
EX-31.A
5
exhibit31-adci20230731.htm
EX-31.A
Document
Exhibit 31-A
Certification of Chief Executive Officer
Pursuant to Section 302 of the Sarbanes-Oxley Act of 2002
I, Tod E. Carpenter, certify that:
1.I have reviewed this Annual Report on Form 10-K of Donaldson Company, Inc.;
2.Based on my knowledge, this report does not contain any untrue statement of a material fact or omit to state a material fact necessary to make the statements made, in light of the circumstances under which such statements were made, not misleading with respect to the period covered by this report;
3.Based on my knowledge, the financial statements, and other financial information included in this report, fairly present in all material respects the financial condition, results of operations and cash flows of the registrant as of, and for, the periods presented in this report;
4.The registrant’s other certifying officer and I are responsible for establishing and maintaining disclosure controls and procedures (as defined in Exchange Act Rules 13a-15(e) and 15d-15(e)) and internal control over financial reporting (as defined in Exchange Act Rules 13a-15(f) and 15d-15(f)) for the registrant and have:
a)designed such disclosure controls and procedures, or caused such disclosure controls and procedures to be designed under our supervision, to ensure that material information relating to the registrant, including its consolidated subsidiaries, is made known to us by others within those entities, particularly during the period in which this report is being prepared;
b)designed such internal control over financial reporting, or caused such internal control over financial reporting to be designed under our supervision, to provide reasonable assurance regarding the reliability of financial reporting and the preparation of financial statements for external purposes in accordance with generally accepted accounting principles;
c)evaluated the effectiveness of the registrant’s disclosure controls and procedures and presented in this report our conclusions about the effectiveness of the disclosure controls and procedures, as of the end of the period covered by this report based on such evaluation; and
d)disclosed in this report any change in the registrant’s internal control over financial reporting that occurred during the registrant’s most recent fiscal quarter (the registrant’s fourth fiscal quarter in the case of an annual report) that has materially affected, or is reasonably likely to materially affect, the registrant’s internal control over financial reporting; and
5.The registrant’s other certifying officer and I have disclosed, based on our most recent evaluation of internal control over financial reporting, to the registrant’s auditors and the audit committee of the registrant’s board of directors (or persons performing the equivalent functions):
a)all significant deficiencies and material weaknesses in the design or operation of internal control over financial reporting which are reasonably likely to adversely affect the registrant’s ability to record, process, summarize and report financial information; and
b)any fraud, whether or not material, that involves management or other employees who have a significant role in the registrant’s internal control over financial reporting.
|
|
|
|
|
|
|
|
|
|
|
|
|
|
|
| |
|
|
|
| Date: |
September 22, 2023 |
|
By: |
/s/ Tod E. Carpenter |
| |
|
|
|
Tod E. Carpenter
Chairman, President and Chief Executive Officer
|
EX-31.B
6
exhibit31-bdci20230731.htm
EX-31.B
Document
Exhibit 31-B
Certification of Chief Financial Officer
Pursuant to Section 302 of the Sarbanes-Oxley Act of 2002
I, Scott J. Robinson, certify that:
1.I have reviewed this Annual Report on Form 10-K of Donaldson Company, Inc.;
2.Based on my knowledge, this report does not contain any untrue statement of a material fact or omit to state a material fact necessary to make the statements made, in light of the circumstances under which such statements were made, not misleading with respect to the period covered by this report;
3.Based on my knowledge, the financial statements, and other financial information included in this report, fairly present in all material respects the financial condition, results of operations and cash flows of the registrant as of, and for, the periods presented in this report;
4.The registrant’s other certifying officer and I are responsible for establishing and maintaining disclosure controls and procedures (as defined in Exchange Act Rules 13a-15(e) and 15d-15(e)) and internal control over financial reporting (as defined in Exchange Act Rules 13a-15(f) and 15d-15(f)) for the registrant and have:
a)designed such disclosure controls and procedures, or caused such disclosure controls and procedures to be designed under our supervision, to ensure that material information relating to the registrant, including its consolidated subsidiaries, is made known to us by others within those entities, particularly during the period in which this report is being prepared;
b)designed such internal control over financial reporting, or caused such internal control over financial reporting to be designed under our supervision, to provide reasonable assurance regarding the reliability of financial reporting and the preparation of financial statements for external purposes in accordance with generally accepted accounting principles;
c)evaluated the effectiveness of the registrant’s disclosure controls and procedures and presented in this report our conclusions about the effectiveness of the disclosure controls and procedures, as of the end of the period covered by this report based on such evaluation; and
d)disclosed in this report any change in the registrant’s internal control over financial reporting that occurred during the registrant’s most recent fiscal quarter (the registrant’s fourth fiscal quarter in the case of an annual report) that has materially affected, or is reasonably likely to materially affect, the registrant’s internal control over financial reporting; and
5.The registrant’s other certifying officer and I have disclosed, based on our most recent evaluation of internal control over financial reporting, to the registrant’s auditors and the audit committee of the registrant’s board of directors (or persons performing the equivalent functions):
a)all significant deficiencies and material weaknesses in the design or operation of internal control over financial reporting which are reasonably likely to adversely affect the registrant’s ability to record, process, summarize and report financial information; and
b)any fraud, whether or not material, that involves management or other employees who have a significant role in the registrant’s internal control over financial reporting.
|
|
|
|
|
|
|
|
|
|
|
|
|
|
|
| |
|
|
|
| Date: |
September 22, 2023 |
|
By: |
/s/ Scott J. Robinson |
| |
|
|
|
Scott J. Robinson
Chief Financial Officer |
EX-32
7
exhibit32dci20230731.htm
EX-32
Document
Exhibit 32
Pursuant to 18 U.S.C. Section 1350, as created by Section 906 of the Sarbanes–Oxley Act of 2002, the following certifications are being made to accompany the Annual Report on Form 10-K for the fiscal year ended July 31, 2023 for Donaldson Company, Inc.:
CERTIFICATION OF CHIEF EXECUTIVE OFFICER
I, Tod E. Carpenter, Chief Executive Officer of Donaldson Company, Inc., certify that:
1.The Annual Report on Form 10-K of Donaldson Company, Inc. for the fiscal year ended July 31, 2023, (the “Report”), fully complies with the requirements of Section 13(a) or 15(d) of the Securities Exchange Act of 1934; and
2.The information contained in the Report fairly presents, in all material respects, the financial condition and results of operations of Donaldson Company, Inc.
|
|
|
|
|
|
|
|
|
|
|
|
|
|
|
| |
|
|
|
| Date: |
September 22, 2023 |
|
By: |
/s/ Tod E. Carpenter |
| |
|
|
|
Tod E. Carpenter
Chairman, President and Chief Executive Officer
|
CERTIFICATION OF CHIEF FINANCIAL OFFICER
I, Scott J. Robinson, Chief Financial Officer of Donaldson Company, Inc., certify that:
1.The Annual Report on Form 10-K of Donaldson Company, Inc. for the fiscal year ended July 31, 2023, (the “Report”), fully complies with the requirements of Section 13(a) or 15(d) of the Securities Exchange Act of 1934; and
2.The information contained in the Report fairly presents, in all material respects, the financial condition and results of operations of Donaldson Company, Inc.
|
|
|
|
|
|
|
|
|
|
|
|
|
|
|
| |
|
|
|
| Date: |
September 22, 2023 |
|
By: |
/s/ Scott J. Robinson |
| |
|
|
|
Scott J. Robinson
Chief Financial Officer |