Document
FIRST QUARTER 2025 NET INCOME OF $172 MILLION, $1.25 PER SHARE
Favorable Deposit Trends and Expense Discipline Contributed to Profitability Growth
Conservative Capital Management, Proven Approach to Credit and Strong Liquidity Position
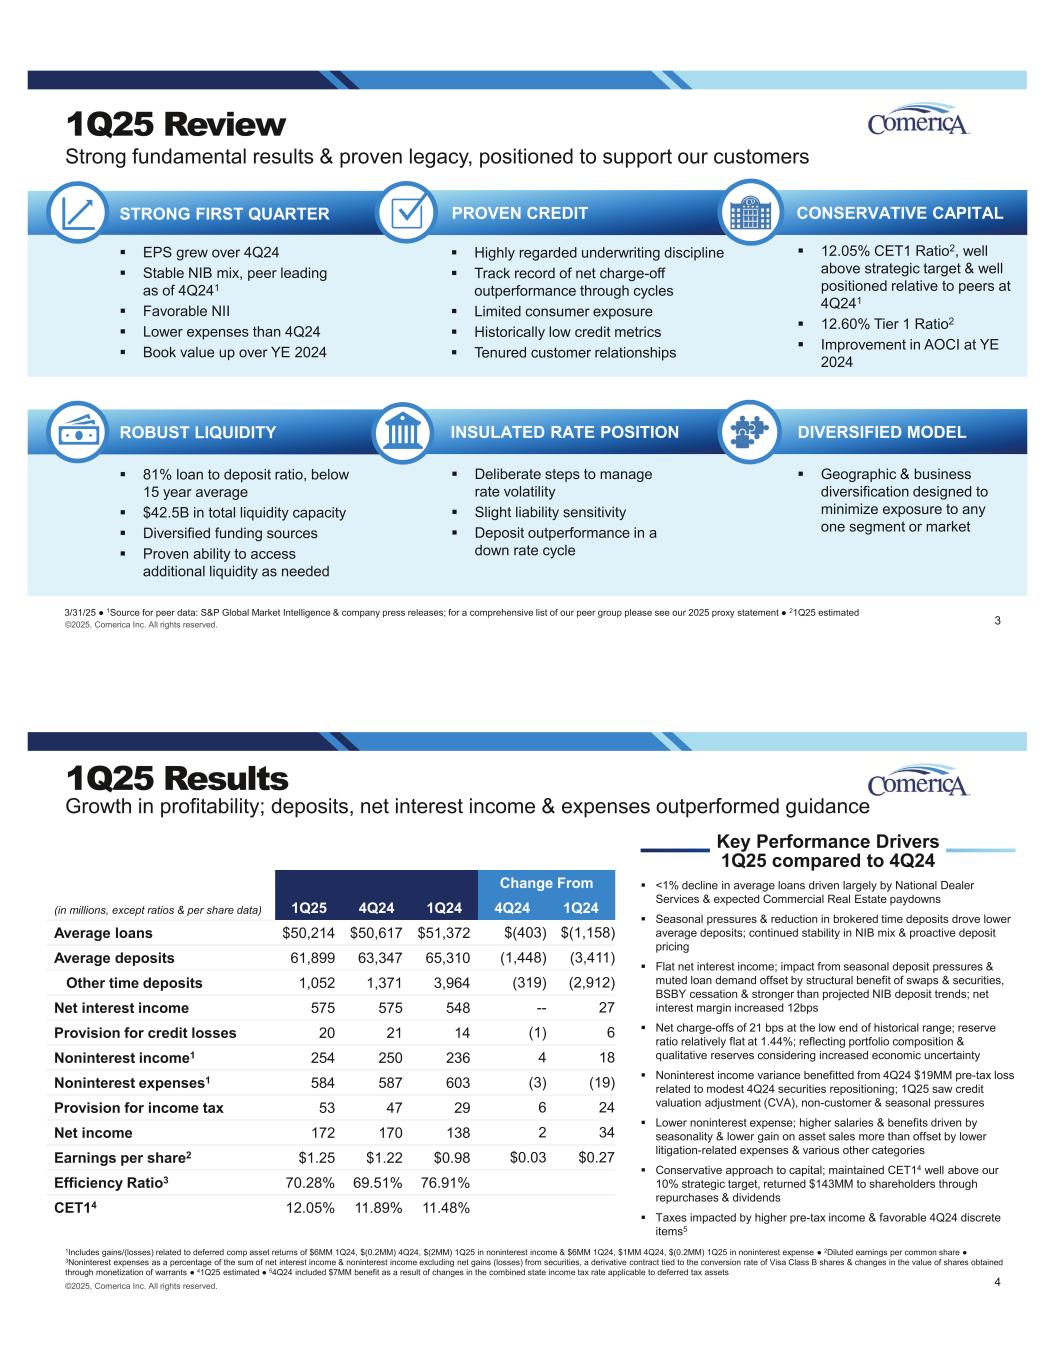
“Today we reported first quarter earnings per share of $1.25,” said Curtis C. Farmer, Comerica Chairman and Chief Executive Officer. “Stronger than expected noninterest-bearing balances and proactive deposit pricing strategies offset the impact of muted loan demand, contributing to net interest income outperforming our outlook for the quarter. We saw lower expenses than in fourth quarter 2024, in part due to slower business activity, and we continued to prioritize efficiency. The increase in noninterest income reflected the fourth quarter 2024 loss related to our securities repositioning. Credit quality remained a competitive strength as migration was manageable, and net charge-offs remained low. The downward shift in the rate curve drove improvements in quarter-end unrealized losses, common shareholders’ equity and tangible common equity, and our prudent approach to capital resulted in an estimated CET1 capital ratio of 12.05%, well above our 10% target. With a proven legacy of conservative capital, credit and liquidity management, we feel we are well-positioned to provide consistency and support to our customers as they navigate this dynamic environment.”
|
|
|
|
|
|
|
|
|
|
|
|
|
|
|
|
|
|
|
|
|
|
|
|
|
(dollar amounts in millions, except per share data) |
1st Qtr '25 |
|
4th Qtr '24 |
|
1st Qtr '24 |
|
|
|
|
|
|
FINANCIAL RESULTS |
|
|
|
|
|
|
|
|
|
|
|
Net interest income |
$ |
575 |
|
|
$ |
575 |
|
|
$ |
548 |
|
|
|
|
|
|
|
Provision for credit losses |
20 |
|
|
21 |
|
|
14 |
|
|
|
|
|
|
|
Noninterest income |
254 |
|
|
250 |
|
|
236 |
|
|
|
|
|
|
|
Noninterest expenses |
584 |
|
|
587 |
|
|
603 |
|
|
|
|
|
|
|
Pre-tax income |
225 |
|
|
217 |
|
|
167 |
|
|
|
|
|
|
|
Provision for income taxes |
53 |
|
|
47 |
|
|
29 |
|
|
|
|
|
|
|
Net income |
$ |
172 |
|
|
$ |
170 |
|
|
$ |
138 |
|
|
|
|
|
|
|
Diluted earnings per common share |
$ |
1.25 |
|
|
$ |
1.22 |
|
|
$ |
0.98 |
|
|
|
|
|
|
|
|
|
|
|
|
|
|
|
|
|
|
|
|
|
|
|
|
|
|
|
|
|
|
|
Average loans |
50,214 |
|
|
50,617 |
|
|
51,372 |
|
|
|
|
|
|
|
Average deposits |
61,899 |
|
|
63,347 |
|
|
65,310 |
|
|
|
|
|
|
|
Return on average assets (ROA) |
0.90 |
% |
|
0.85 |
% |
|
0.66 |
% |
|
|
|
|
|
|
Return on average common shareholders' equity (ROE) |
10.60 |
|
|
10.27 |
|
|
9.33 |
|
|
|
|
|
|
|
Net interest margin |
3.18 |
|
|
3.06 |
|
|
2.80 |
|
|
|
|
|
|
|
Efficiency ratio (a) |
70.28 |
|
|
69.51 |
|
|
76.91 |
|
|
|
|
|
|
|
Common equity Tier 1 capital ratio (b) |
12.05 |
|
|
11.89 |
|
|
11.48 |
|
|
|
|
|
|
|
Tier 1 capital ratio (b) |
12.60 |
|
|
12.43 |
|
|
12.01 |
|
|
|
|
|
|
|
|
|
|
|
|
|
|
|
|
|
|
|
|
|
|
|
|
|
|
|
|
|
|
|
|
|
|
|
|
|
|
|
|
|
|
|
|
|
|
|
|
|
|
|
|
|
|
|
|
|
|
|
|
|
|
|
|
|
|
|
|
|
|
|
|
|
|
|
|
|
|
|
|
|
|
|
|
|
|
|
|
|
|
|
|
|
|
|
|
|
|
|
|
|
|
|
|
|
|
|
|
|
|
|
|
|
|
|
|
|
|
|
|
|
|
|
|
|
|
|
|
|
|
|
|
|
|
|
|
|
|
|
|
|
|
|
|
|
|
|
|
|
|
|
|
|
|
|
|
|
|
|
|
|
|
|
|
|
|
|
|
|
|
|
|
|
|
|
|
|
|
|
|
|
|
|
|
|
|
|
|
|
|
|
|
|
|
|
|
|
|
|
|
|
|
|
|
|
|
|
|
|
|
|
|
|
|
|
|
|
|
|
|
|
|
|
|
|
|
|
|
|
|
|
|
|
|
|
|
|
|
|
|
|
|
|
|
|
|
|
|
|
|
|
|
|
|
|
|
|
|
|
|
|
|
|
|
|
|
|
|
|
|
|
|
|
|
|
|
|
|
|
|
|
|
|
|
|
|
|
|
|
|
|
|
|
|
|
|
|
|
|
|
|
|
|
|
|
|
|
|
|
|
|
|
|
|
|
|
|
|
|
|
|
|
|
|
|
|
|
|
|
|
|
|
|
|
|
|
|
|
|
|
|
|
|
|
|
|
|
|
|
|
|
|
|
|
|
|
|
|
|
|
|
|
|
|
|
|
|
|
|
|
|
|
|
|
|
|
|
|
|
|
|
|
|
(a)Noninterest expenses as a percentage of the sum of net interest income and noninterest income excluding net gains (losses) from securities, a derivative contract tied to the conversion rate of Visa Class B shares and changes in the value of shares obtained through monetization of warrants.
(b)March 31, 2025 ratios are estimated. See Reconciliations of Non-GAAP Financial Measures and Regulatory Ratios for additional information.
First Quarter 2025 Compared to Fourth Quarter 2024 Overview
Balance sheet items discussed in terms of average balances unless otherwise noted.
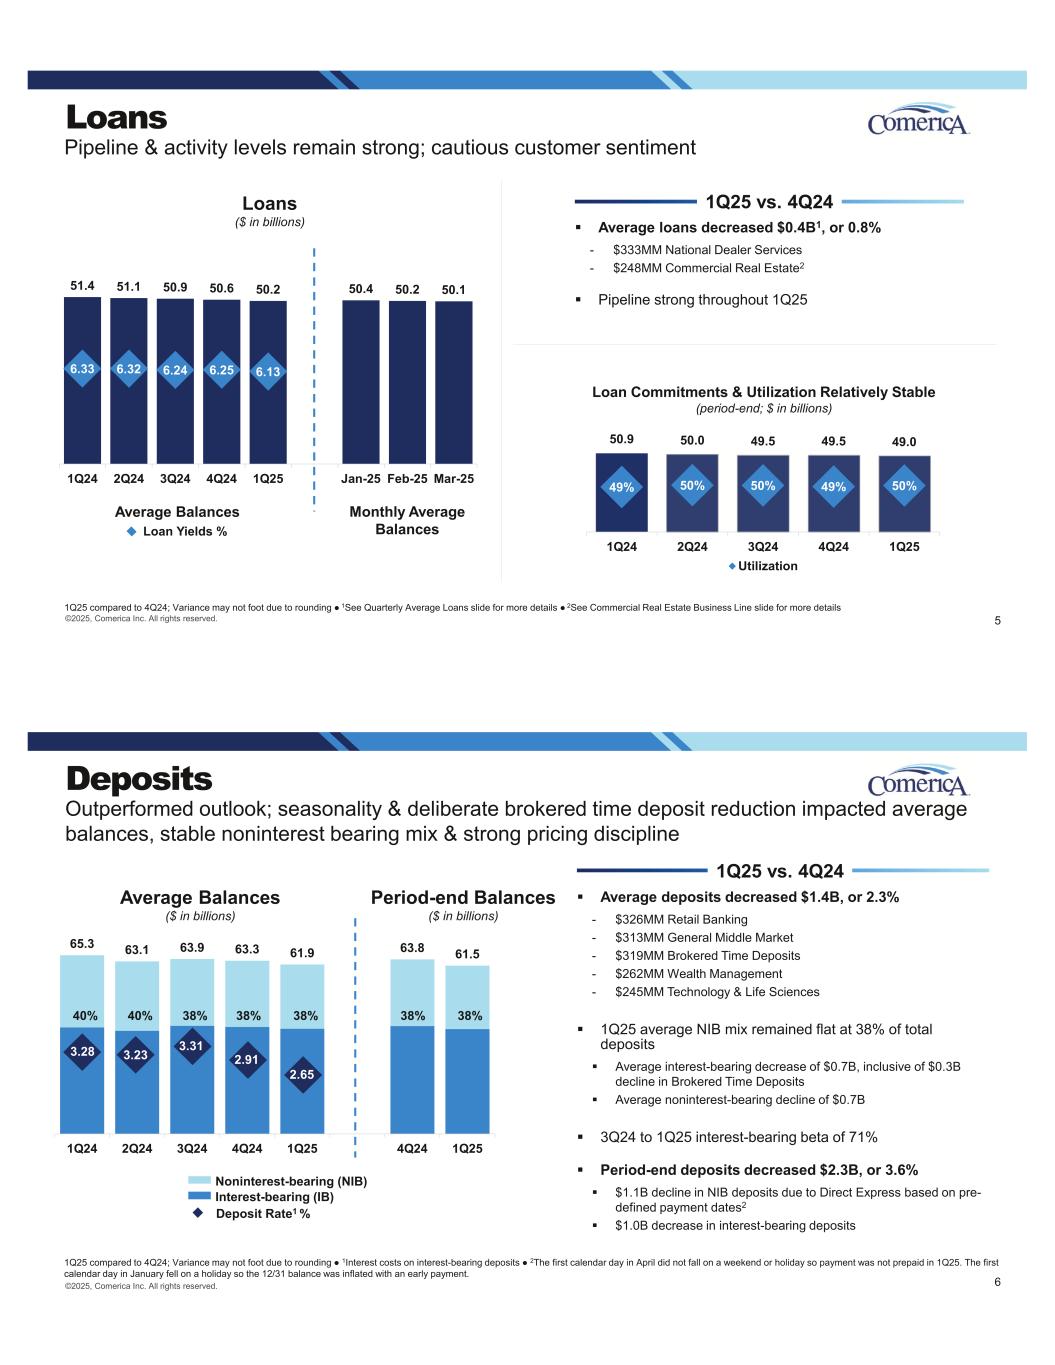
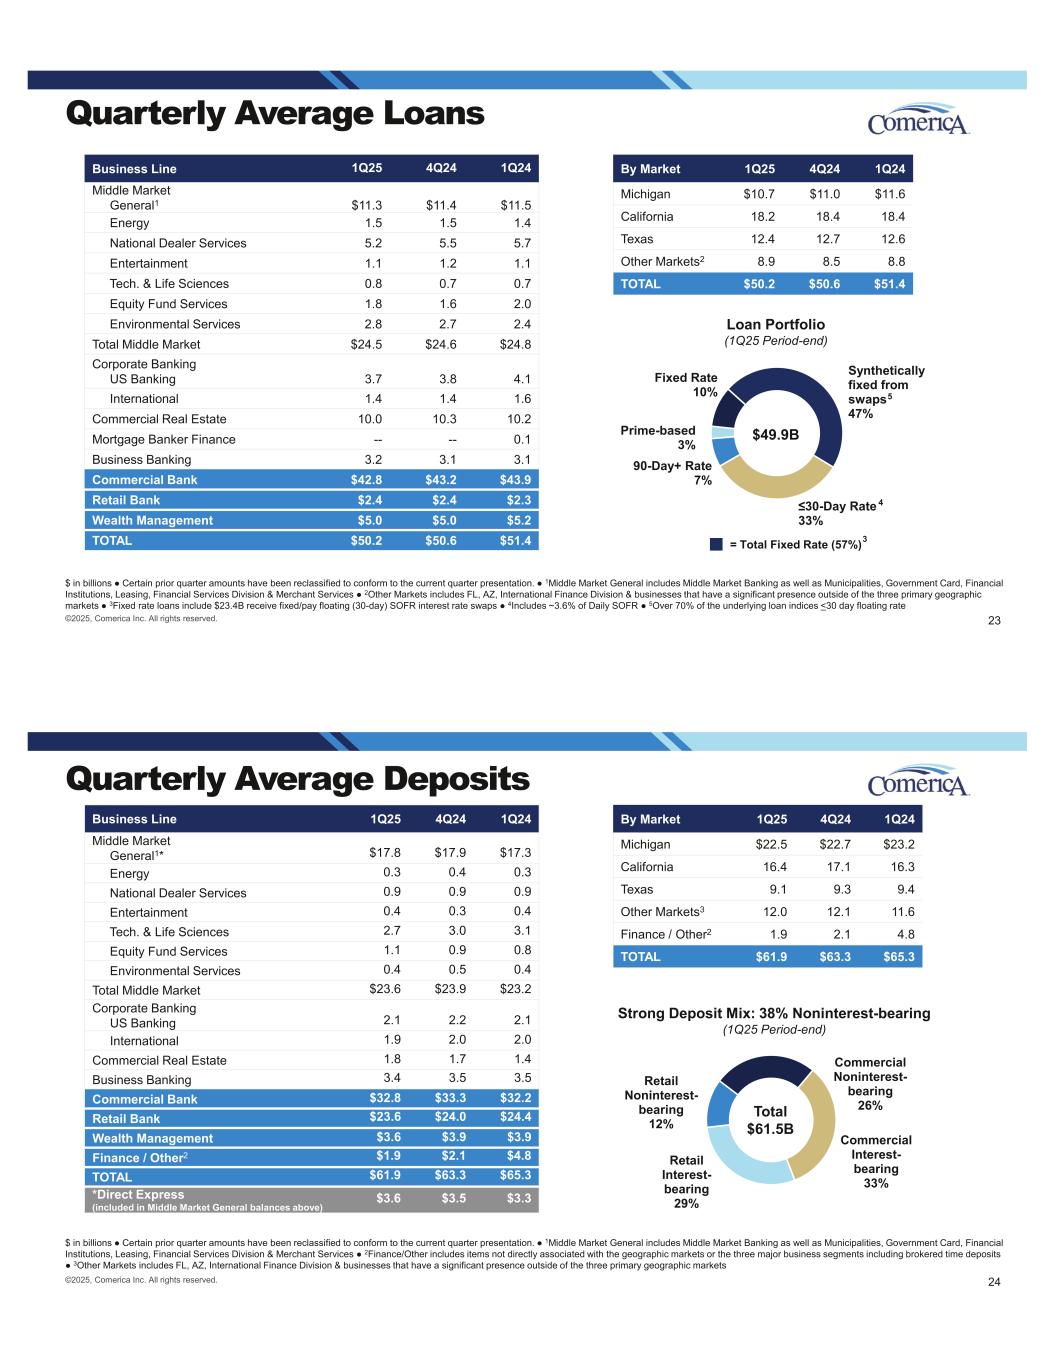
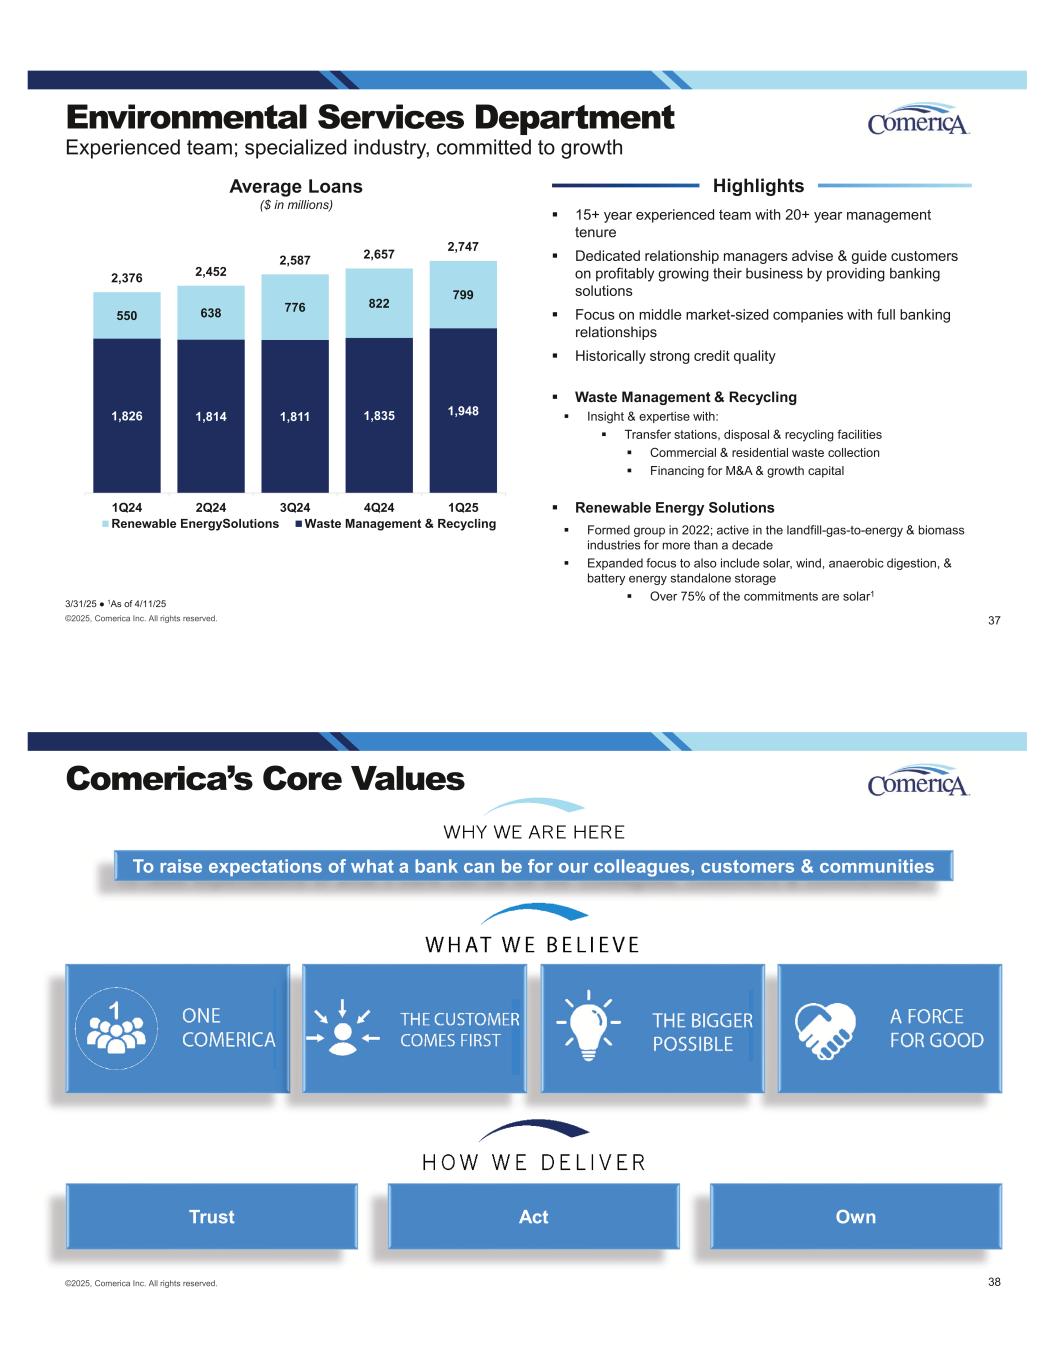
Loans decreased $403 million to $50.2 billion.
•Decreases of $333 million in National Dealer Services and $248 million in Commercial Real Estate.
◦Period-end loans decreased $627 million to $49.9 billion, with decreases of $438 million in Equity Fund Services and $185 million in National Dealer Services.
•Average yield on loans (including swaps) decreased 12 basis points to 6.13%, reflecting the impact of the lower rate environment and a decline in nonaccrual interest, partially offset by the positive impact from Bloomberg Short-Term Bank Yield Index (BSBY) cessation.
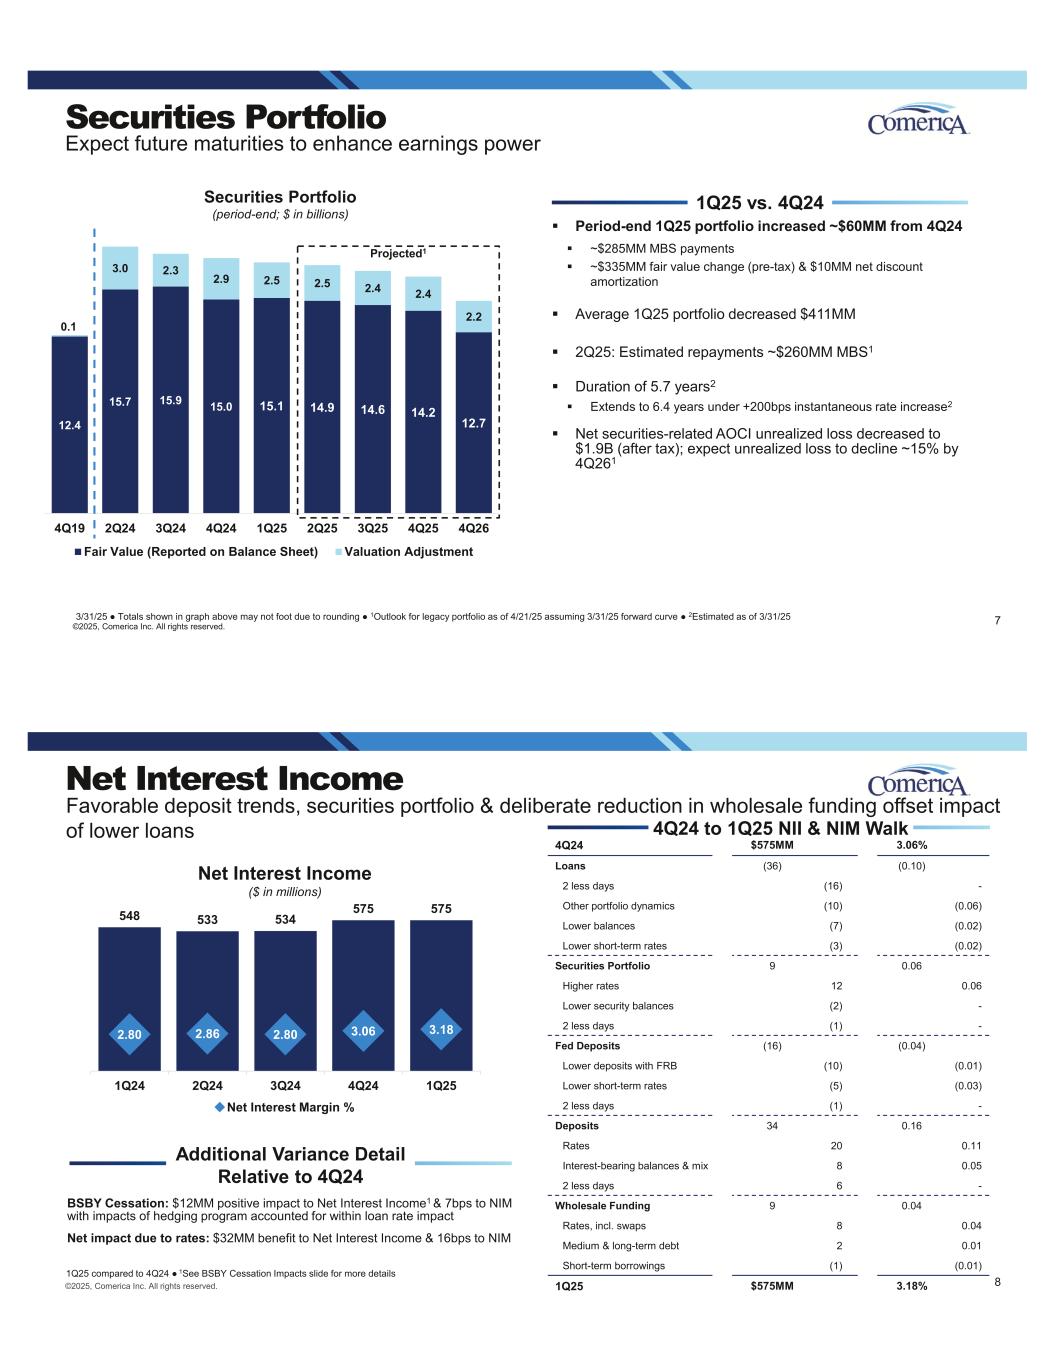
Securities decreased $411 million to $15.0 billion, reflecting paydowns and an increase in average unrealized losses.
•Period-end unrealized losses on securities decreased $334 million to $2.5 billion.
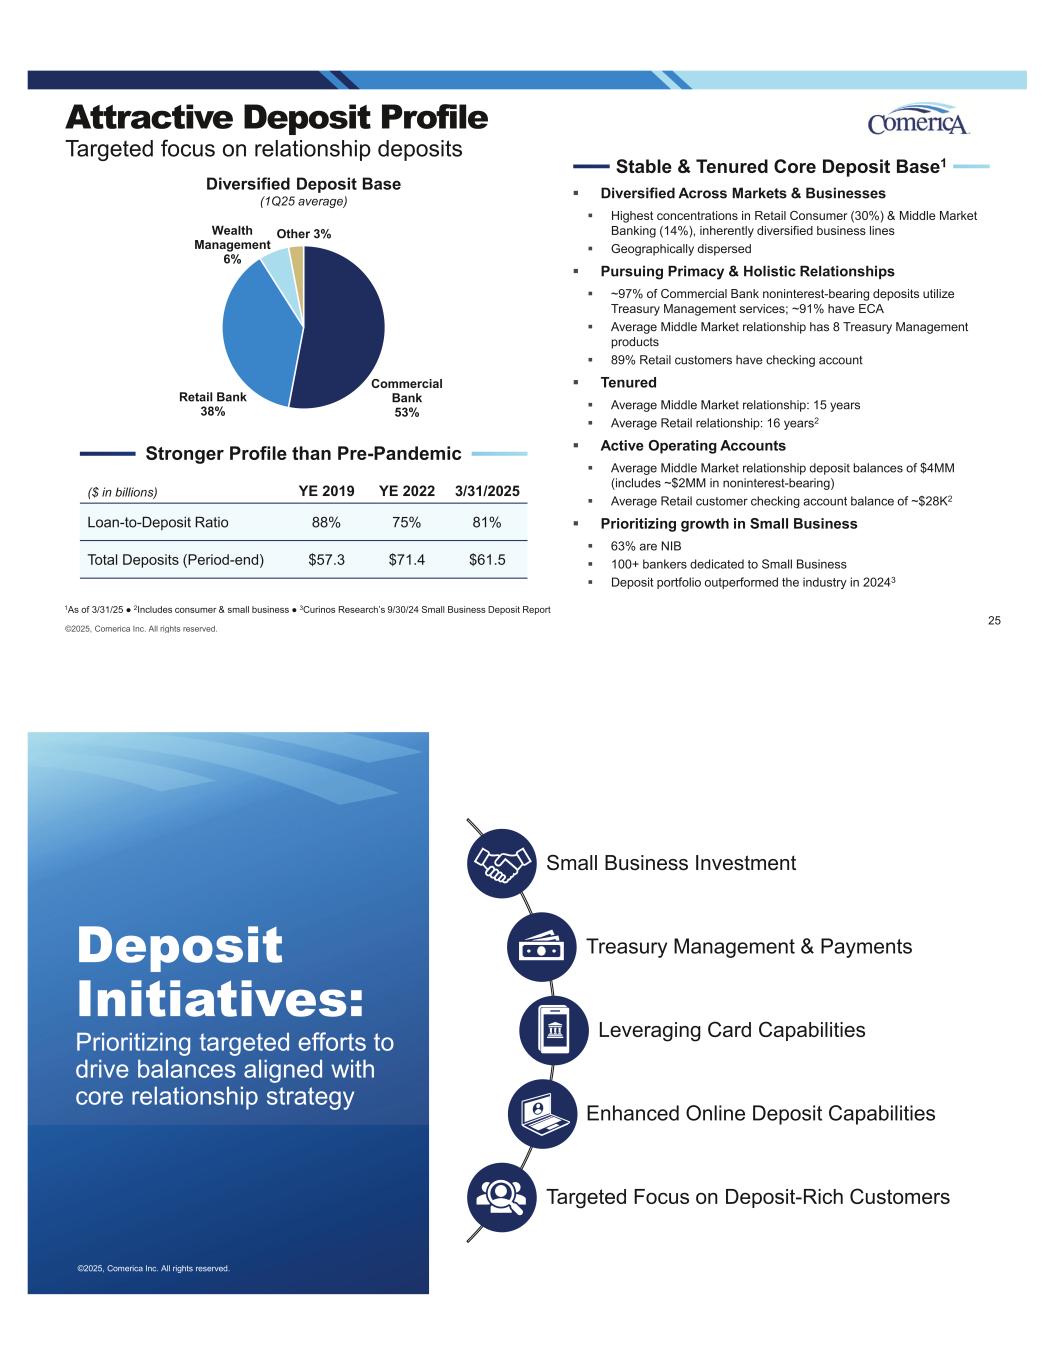
Deposits decreased $1.4 billion to $61.9 billion, with noninterest-bearing and interest-bearing deposits decreasing $742 million and $706 million, respectively.
•Noninterest-bearing deposits comprised 38% of total deposits, flat from the prior quarter.
•Decreases of $326 million in Retail Banking, $313 million in general Middle Market, $262 million in Wealth Management, $245 million in Technology and Life Sciences, $144 million in Corporate Banking and $128 million in Business Banking, partially offset by increases of $117 million in Equity Fund Services, $104 million in Entertainment and smaller increases in other business lines. Additionally, brokered time deposits decreased $319 million.
◦Period-end deposits decreased $2.3 billion, which included a $1.3 billion decrease in noninterest-bearing deposits, $1.1 billion of which was related to timing of disbursements within the Direct Express government card program, as well as a $1.0 billion decline in interest-bearing deposits.
•The average cost of interest-bearing deposits decreased 26 basis points to 265 basis points, reflecting the impact of disciplined pricing as well as the decrease in brokered time deposits.
Net interest income was stable at $575 million, while net interest margin increased 12 basis points to 3.18%.
•Driven by the net impact of lower rates and a decline in interest-bearing deposits, partially offset by decreases in deposits held at the Federal Reserve Bank, nonaccrual interest and loan volume.
•Additionally, net interest income was impacted by two fewer days in the quarter.
Provision for credit losses decreased $1 million to $20 million.
•The allowance for credit losses decreased $6 million to $719 million, reflecting the impact of changes in portfolio composition and relatively stable macroeconomic variables, as well as a rise in economic uncertainty.
•As a percentage of total loans, the allowance for credit losses was 1.44%, unchanged from the prior quarter.
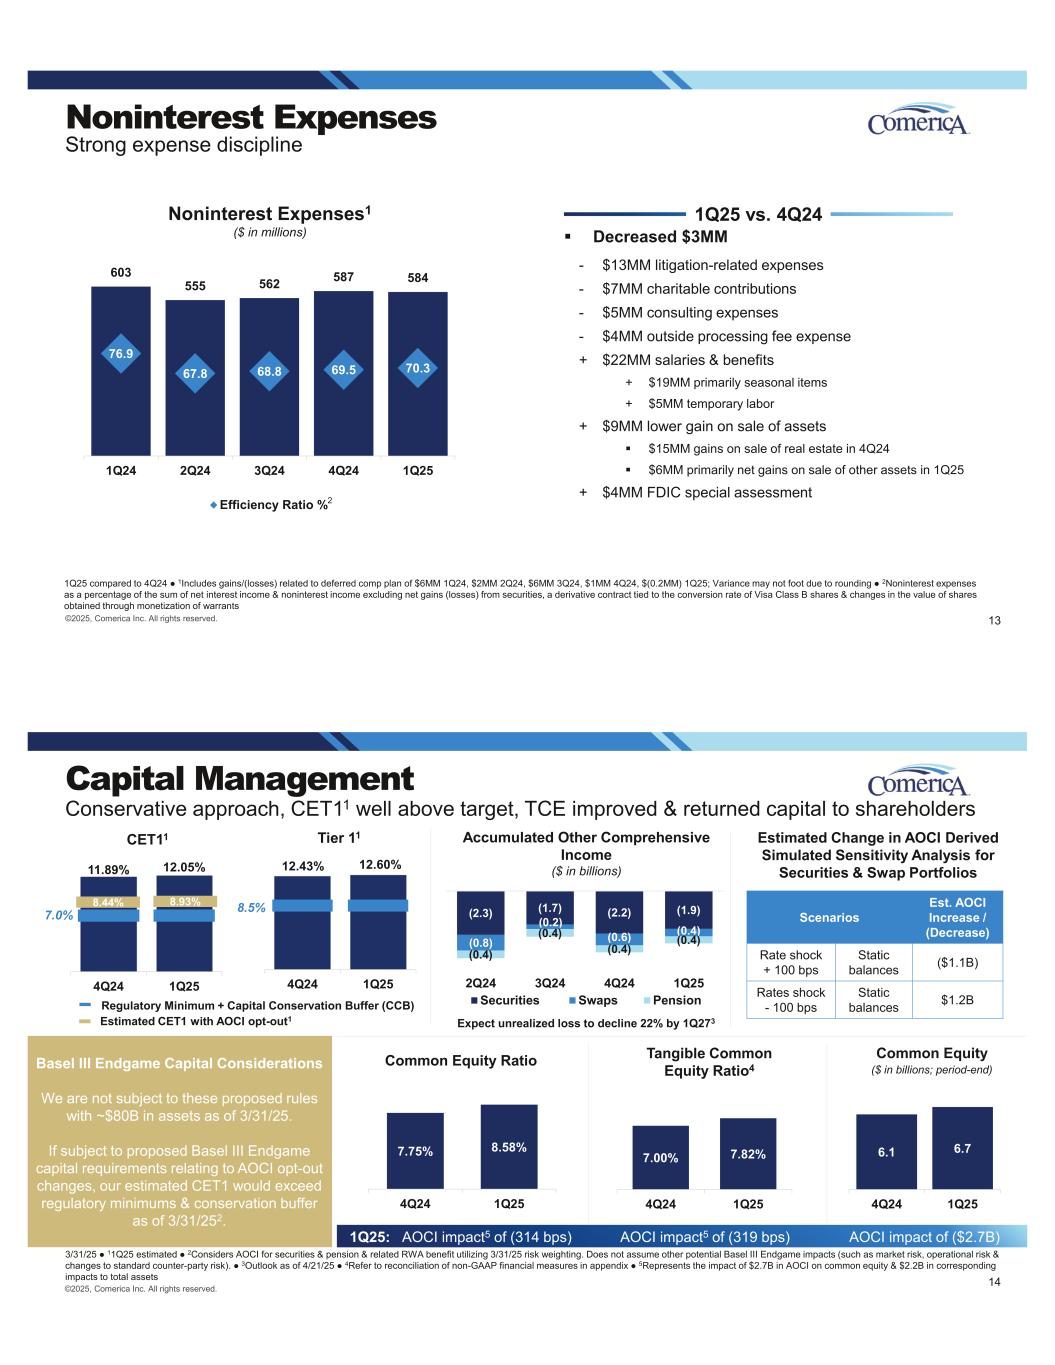
Noninterest income increased $4 million to $254 million.
•Excluding the impact of a $19 million loss related to repositioning the securities portfolio in fourth quarter 2024, noninterest income decreased $15 million, which included decreases of $5 million in capital markets income, $3 million in card fees and smaller declines in other categories.
Noninterest expenses decreased $3 million to $584 million.
•Decreases of $13 million in litigation-related expenses, $7 million in charitable contributions, $5 million in consulting expenses, $4 million in outside processing fee expense and $3 million in advertising expense, partially offset by increases of $22 million in salaries and benefits expense and $4 million in FDIC insurance expense, as well as a $9 million reduction in gains on the sale of real estate and other assets.
◦Salaries and benefits expense was impacted by a $19 million increase due to primarily seasonal items, as well as a $5 million increase in temporary labor.
◦First quarter 2025 other noninterest expenses included $6 million in gains primarily related to the sale of other assets, while fourth quarter 2024 other noninterest expenses included $15 million in gains on the sale of real estate.
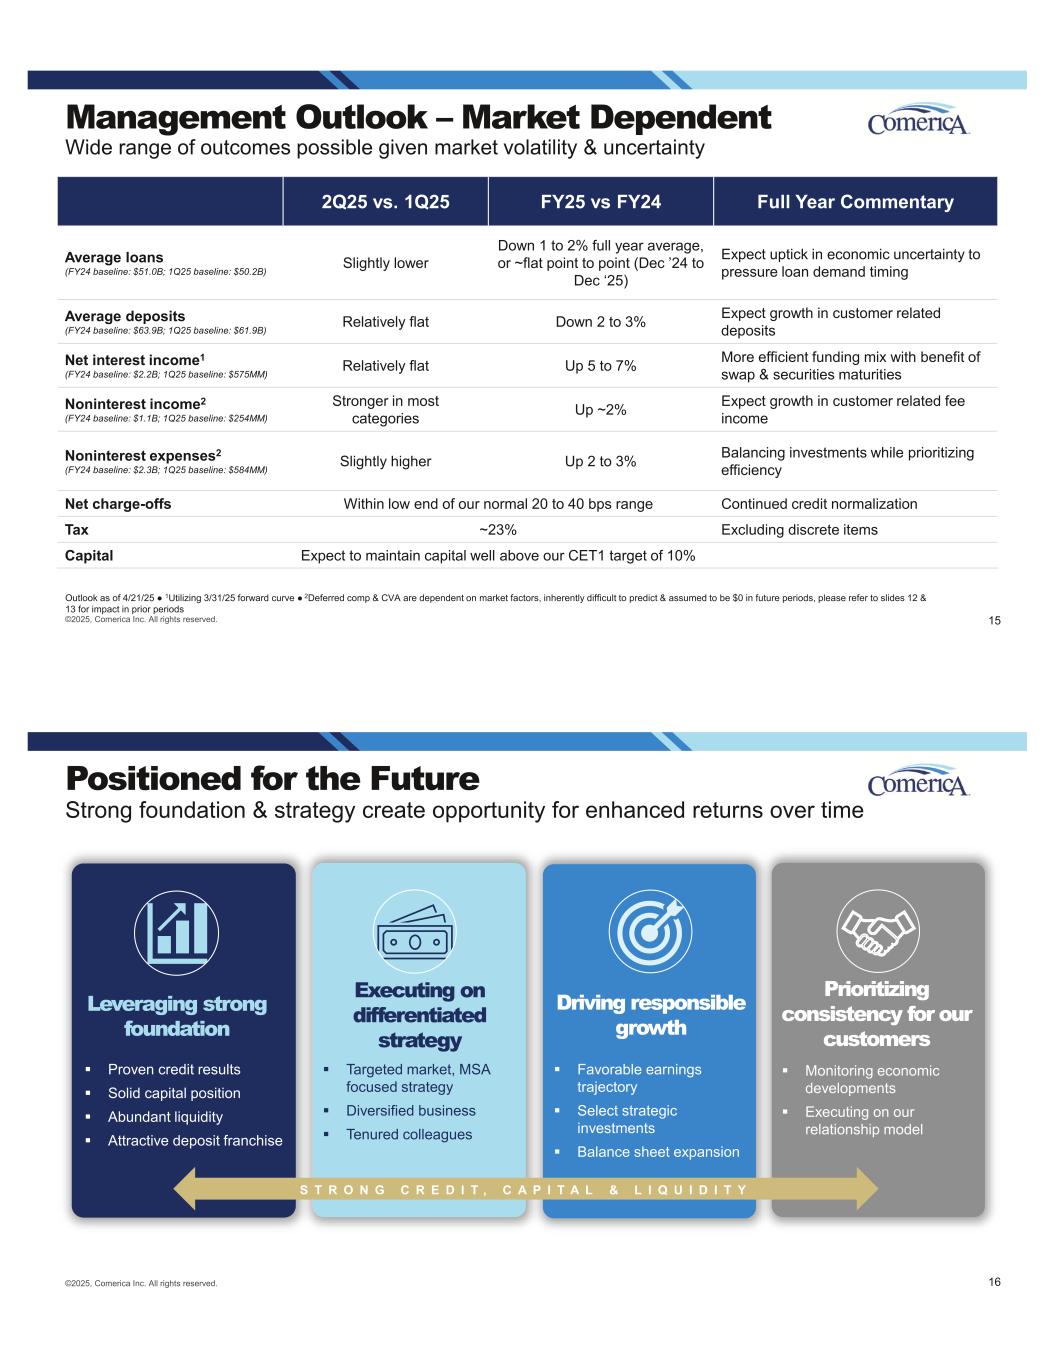
Estimated common equity Tier 1 capital ratio* of 12.05% and an estimated Tier 1 capital ratio* of 12.60%.
•Returned a total of $143 million to common shareholders through share repurchases and dividends.
◦Declared dividends of $93 million on common stock and $6 million on preferred stock.
◦Repurchased $50 million of common stock (approximately 747,000 shares) under the share repurchase program.
◦Second quarter share repurchases subject to market conditions and economic developments.
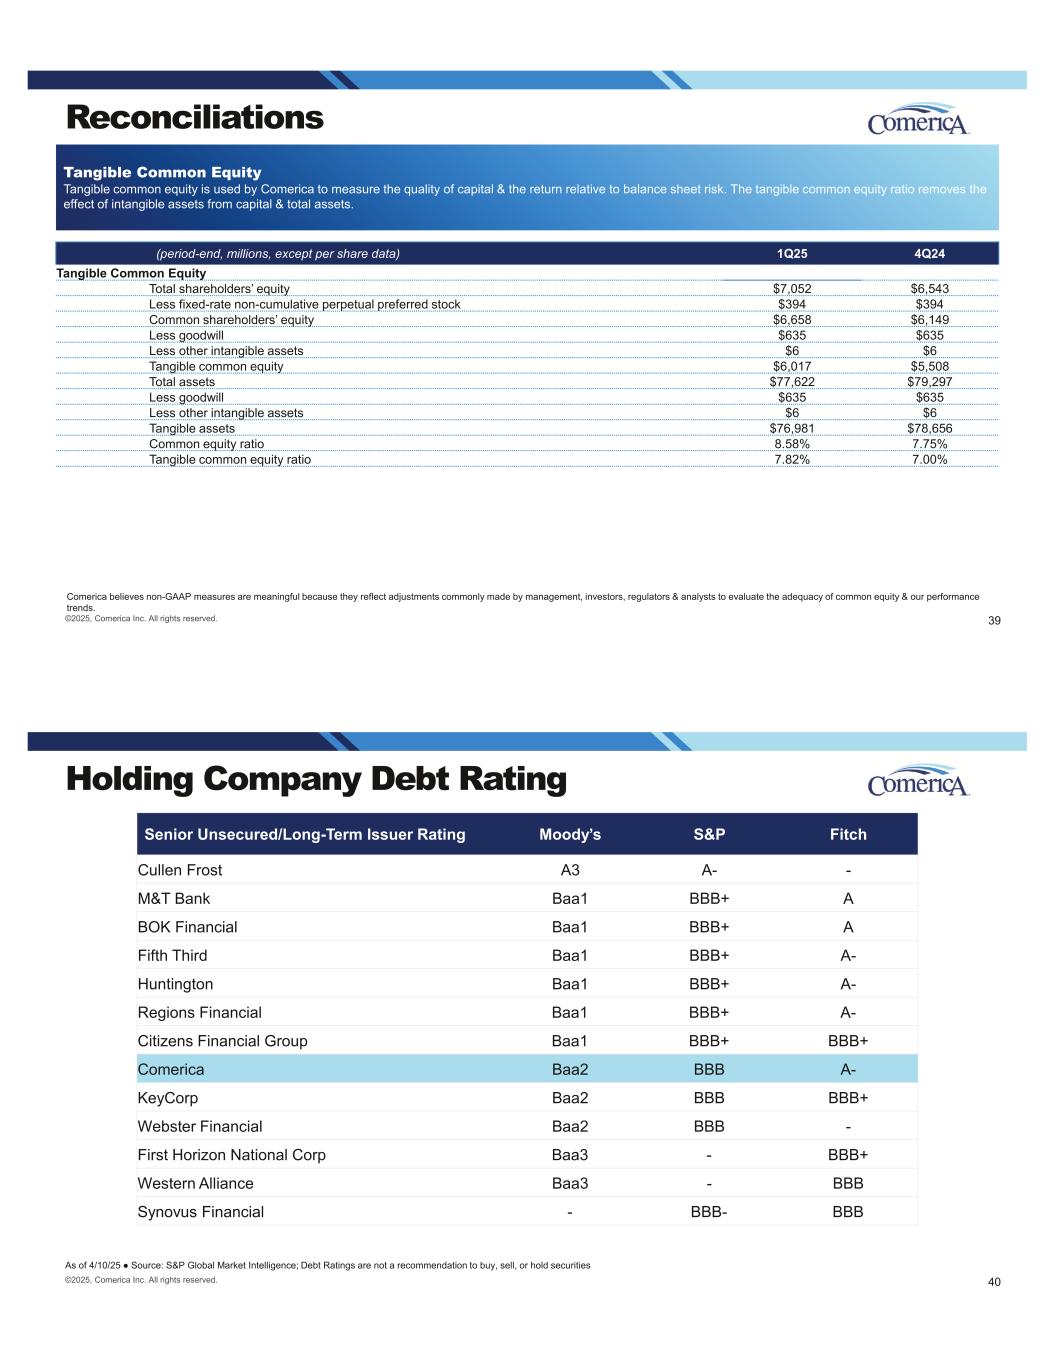
•Common equity ratio of 8.58% and tangible common equity ratio* of 7.82%.
*See Reconciliations of Non-GAAP Financial Measures and Regulatory Ratios for additional information.
Net Interest Income
Balance sheet items presented and discussed in terms of average balances.
|
|
|
|
|
|
|
|
|
|
|
|
|
|
|
|
|
|
|
|
|
|
| (dollar amounts in millions) |
1st Qtr '25 |
|
4th Qtr '24 |
|
1st Qtr '24 |
|
|
|
|
|
|
|
|
|
|
|
|
|
|
| Net interest income |
$ |
575 |
|
|
$ |
575 |
|
|
$ |
548 |
|
|
|
|
|
| Net interest margin |
3.18 |
% |
|
3.06 |
% |
|
2.80 |
% |
|
|
|
|
| Selected balances: |
|
|
|
|
|
|
|
|
|
| Total earning assets |
$ |
70,378 |
|
|
$ |
72,072 |
|
|
$ |
75,807 |
|
|
|
|
|
| Total loans |
50,214 |
|
|
50,617 |
|
|
51,372 |
|
|
|
|
|
| Total investment securities |
14,983 |
|
|
15,394 |
|
|
16,328 |
|
|
|
|
|
| Federal Reserve Bank deposits |
4,664 |
|
|
5,558 |
|
|
7,526 |
|
|
|
|
|
|
|
|
|
|
|
|
|
|
|
| Total deposits |
61,899 |
|
|
63,347 |
|
|
65,310 |
|
|
|
|
|
| Total noninterest-bearing deposits |
23,480 |
|
|
24,222 |
|
|
26,408 |
|
|
|
|
|
| Short-term borrowings |
188 |
|
|
42 |
|
|
2,581 |
|
|
|
|
|
| Medium- and long-term debt |
6,488 |
|
|
6,698 |
|
|
6,903 |
|
|
|
|
|
First quarter 2025 net interest income remained stable from the prior quarter, and net interest margin increased 12 basis points, compared to fourth quarter 2024. Amounts shown in parentheses below represent the impacts to net interest income and net interest margin, respectively, with impacts of hedging program and BSBY cessation included with rate.
•Interest income on loans decreased $36 million and reduced net interest margin by 10 basis points, driven by two fewer days in the quarter (-$16 million), other portfolio dynamics (primarily lower nonaccrual interest) (-$10 million, -6 basis points), lower loan balances (-$7 million, -2 basis points) and the net impact of lower rates (-$3 million, -2 basis points).
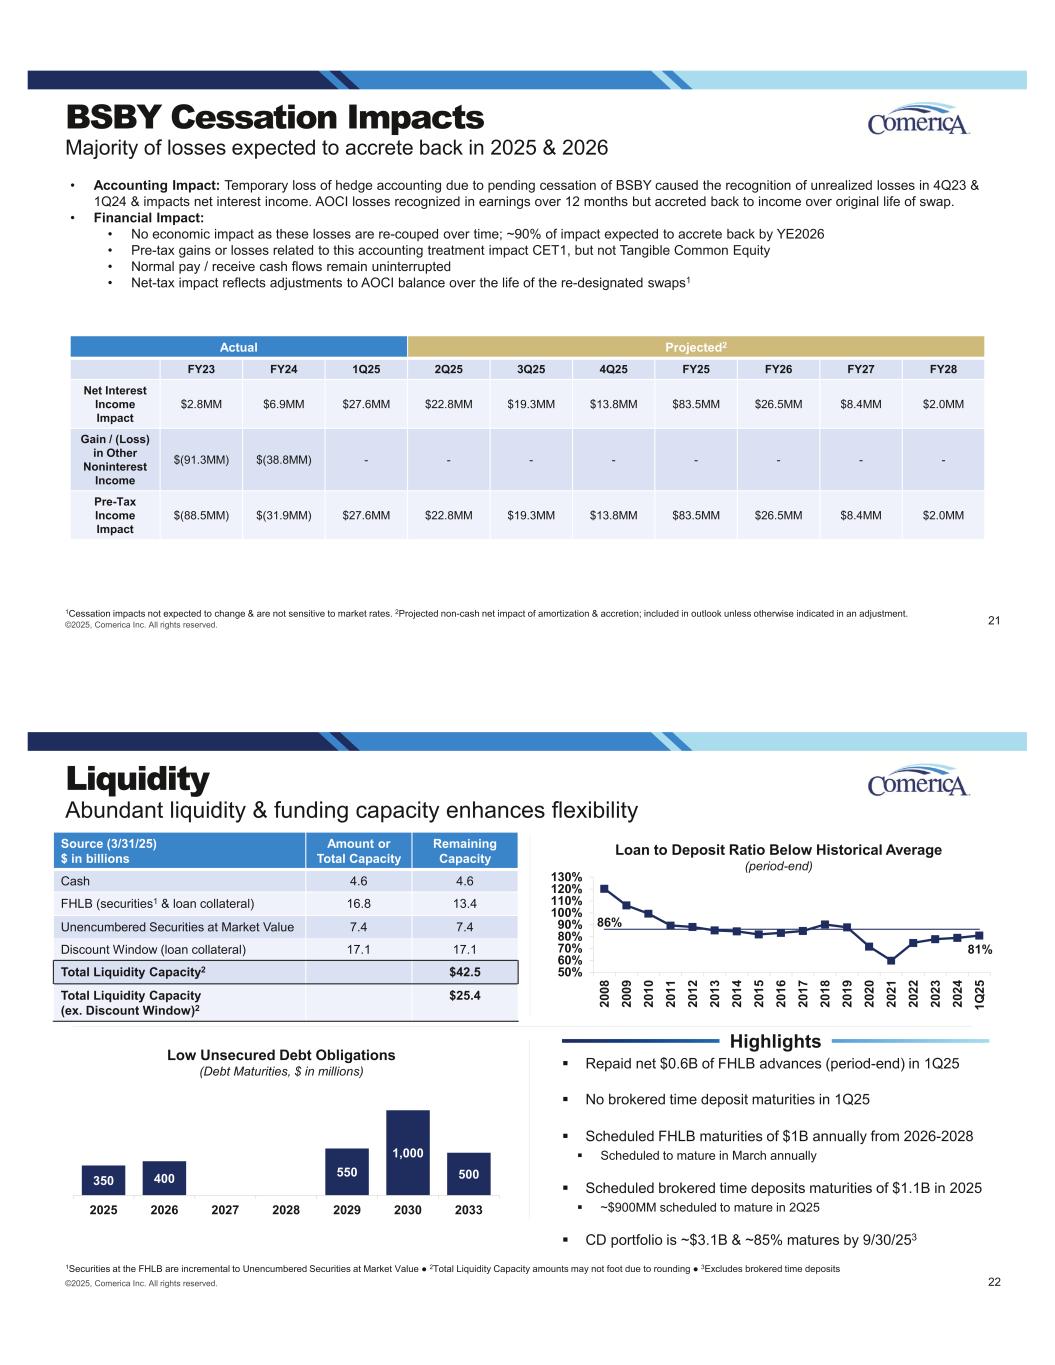
◦BSBY cessation positively impacted net interest income and net interest margin by $28 million and 16 basis points for first quarter 2025 (a $0.16 impact to earnings per share, net of tax), compared to a positive impact of $16 million and 9 basis points for fourth quarter 2024 (a $0.09 impact to earnings per share, net of tax).
•Interest income on investment securities increased $9 million and improved net interest margin by 6 basis points due to improvements to portfolio mix driving higher rates (+$12 million, +6 basis points), partially offset by a decline in securities balances (-$2 million) and two fewer days in the quarter (-$1 million).
•Interest income on short-term investments decreased $16 million and reduced net interest margin by 4 basis points, primarily reflecting a decrease of $894 million in deposits with the Federal Reserve Bank (-$10 million, -1 basis point), lower short-term rates (-$5 million, -3 basis points) and two fewer days in the quarter (-$1 million).
•Interest expense on deposits decreased $34 million and improved net interest margin by 16 basis points, reflecting lower pay rates on deposits (+$20 million, +11 basis points), lower average interest-bearing deposit balances (+$8 million, +5 basis points, which included decreased brokered time deposits) and two fewer days in the quarter (+$6 million).
•Interest expense on debt decreased $9 million and improved net interest margin by 4 basis points, driven by lower rates (+$8 million, +4 basis points) and a decline of $210 million in medium- and long-term debt (+$2 million, +1 basis point), partially offset by an increase of $146 million in short-term borrowings (-$1 million, -1 basis point).
The net impact of lower rates to first quarter 2025 net interest income was an increase of $32 million compared to fourth quarter 2024, and the net impact of lower rates to first quarter 2025 net interest margin was an increase of 16 basis points compared to fourth quarter 2024.
Credit Quality
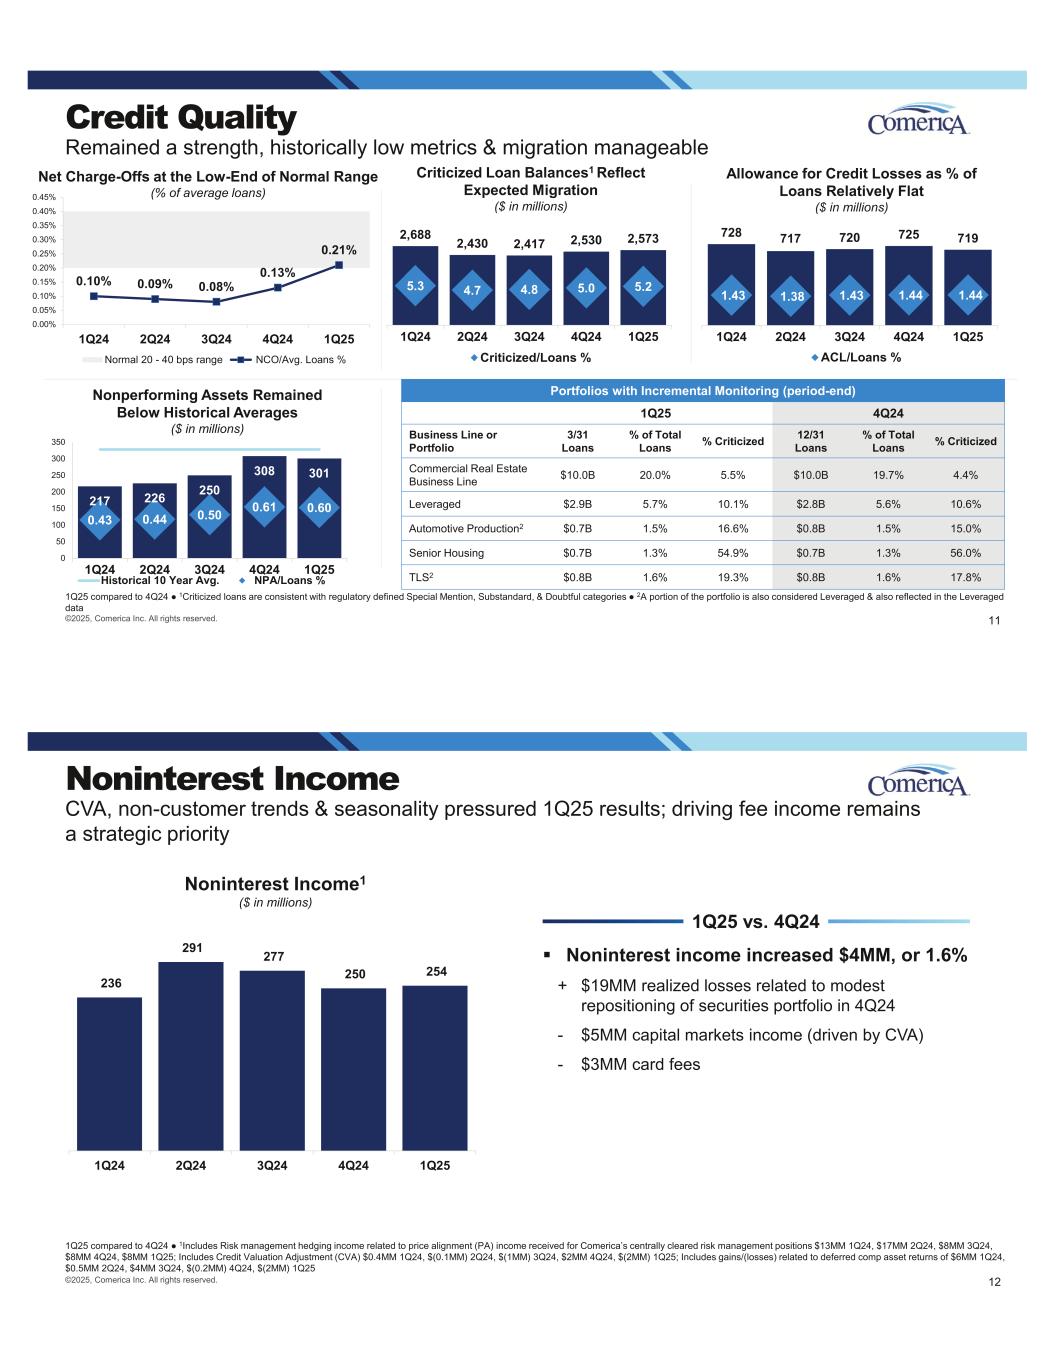
“Our track record for conservative underwriting continued to deliver results as our net charge-offs of 21 basis points were at the low end of our normal range," said Farmer. "Inflationary pressures and elevated rates continued to impact customer profitability, yet our portfolio remained resilient, and migration was manageable. The allowance for credit losses declined slightly with lower loan balances, stable credit metrics and a relatively benign economic forecast at quarter-end. Given elevated uncertainty, we increased our qualitative reserves, and our coverage ratio remained flat at 1.44% of total loans. We will continue to monitor the environment and feel confident in our highly regarded approach to credit.”
|
|
|
|
|
|
|
|
|
|
|
|
|
|
|
|
|
|
| (dollar amounts in millions) |
1st Qtr '25 |
|
4th Qtr '24 |
|
1st Qtr '24 |
| Charge-offs |
$ |
32 |
|
|
$ |
23 |
|
|
$ |
21 |
|
| Recoveries |
6 |
|
|
7 |
|
|
7 |
|
Net charge-offs |
26 |
|
|
16 |
|
|
14 |
|
Net charge-offs/Average total loans |
0.21 |
% |
|
0.13 |
% |
|
0.10 |
% |
| Provision for credit losses |
$ |
20 |
|
|
$ |
21 |
|
|
$ |
14 |
|
|
|
|
|
|
|
| Nonperforming loans and nonperforming assets (NPAs) |
301 |
|
|
308 |
|
|
217 |
|
|
|
|
|
|
|
| NPAs/Total loans and foreclosed property |
0.60 |
% |
|
0.61 |
% |
|
0.43 |
% |
| Loans past due 90 days or more and still accruing |
$ |
12 |
|
|
$ |
44 |
|
|
$ |
32 |
|
| Allowance for loan losses |
683 |
|
|
690 |
|
|
691 |
|
| Allowance for credit losses on lending-related commitments (a) |
36 |
|
|
35 |
|
|
37 |
|
| Total allowance for credit losses |
719 |
|
|
725 |
|
|
728 |
|
|
|
|
|
|
|
|
|
|
|
|
|
| Allowance for credit losses/Period-end total loans |
1.44 |
% |
|
1.44 |
% |
|
1.43 |
% |
|
|
|
|
|
|
| Allowance for credit losses/Nonperforming loans |
2.4x |
|
2.4x |
|
3.4x |
(a) Included in accrued expenses and other liabilities on the Consolidated Balance Sheets.
•The allowance for credit losses totaled $719 million at March 31, 2025 and remained stable at 1.44% of total loans, reflecting the impact of changes in portfolio composition and relatively stable macroeconomic variables, as well as a rise in economic uncertainty.
•Criticized loans increased $43 million to $2.6 billion, or 5.2% of total loans. Criticized loans are generally consistent with the Special Mention, Substandard and Doubtful categories defined by regulatory authorities.
•Nonperforming assets decreased $7 million to $301 million, or 0.60% of total loans and foreclosed property, compared to 0.61% in fourth quarter 2024.
•Net charge-offs totaled $26 million, compared to net charge-offs of $16 million in fourth quarter 2024.
Strategic Lines of Business
Comerica's operations are strategically aligned into three major business segments: the Commercial Bank, the Retail Bank and Wealth Management. In addition to the three major business segments, the Finance and Other categories include items not directly associated with the business segments. For a summary of business segment quarterly results, see the Business Segment Financial Results tables included later in this press release. From time to time, Comerica may make reclassifications among the segments to reflect management's current view of the segments, and methodologies may be modified as the management accounting system is enhanced and changes occur in the organizational structure and/or product lines. The financial results provided are based on the internal business unit structures of Comerica and methodologies in effect at March 31, 2025. A discussion of business segment results will be included in Comerica’s Form 10-Q for the quarter ended March 31, 2025.
Conference Call and Webcast
Comerica will host a conference call and live webcast to review first quarter 2025 financial results at 7 a.m. CT Monday, April 21, 2025. Interested parties may access the conference call by calling (877) 484-6065 or (201) 689-8846. The call and supplemental financial information, as well as a replay of the Webcast, can also be accessed via Comerica's "Investor Relations" page at www.comerica.com. Comerica’s presentation may include forward-looking statements, such as descriptions of plans and objectives for future or past operations, products or services; forecasts of revenue, earnings or other measures of economic performance and profitability; and estimates of credit trends and stability.
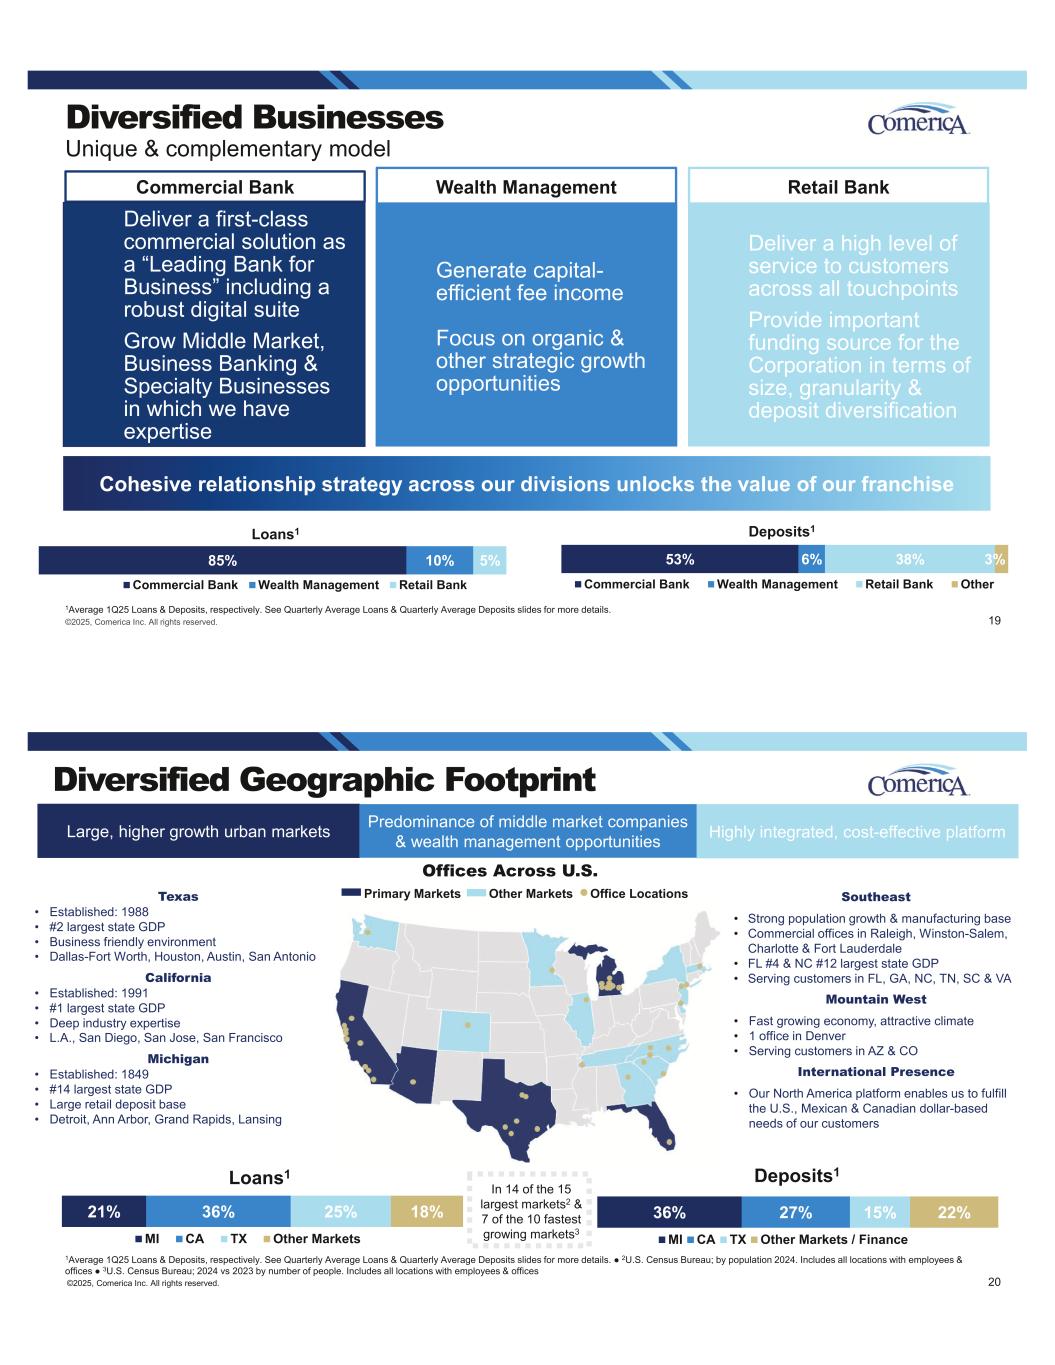
Comerica Incorporated is a financial services company headquartered in Dallas, Texas, and strategically aligned by three business segments: the Commercial Bank, the Retail Bank and Wealth Management. Comerica is one of the 25 largest U.S. commercial bank financial holding companies and focuses on building relationships and helping people and businesses be successful. Comerica provides 380 banking centers across the country with locations in Arizona, California, Florida, Michigan and Texas. Founded 175 years ago in Detroit, Michigan, Comerica continues to expand into new regions, including its Southeast Market, based in North Carolina, and Mountain West Market in Colorado. Comerica has offices in 17 states and services 14 of the 15 largest U.S. metropolitan areas, as well as Canada and Mexico.
This press release contains (and Comerica’s related upcoming conference call and live webcast will discuss) both financial measures based on accounting principles generally accepted in the United States (GAAP) and non-GAAP based financial measures, which are used where management believes them to be helpful in understanding Comerica's results of operations or financial position. Where non-GAAP financial measures are used, the comparable GAAP financial measure, as well as a reconciliation to the comparable GAAP financial measure, can be found in this press release or in the investor relations portions of Comerica’s website, www.comerica.com. These disclosures should not be viewed as a substitute for operating results determined in accordance with GAAP, nor are they necessarily comparable to non-GAAP performance measures that may be presented by other companies.
Forward-looking Statements
Any statements in this press release that are not historical facts are forward-looking statements as defined in the Private Securities Litigation Reform Act of 1995. Words such as achieve, anticipate, aspire, assume, believe, can, confident, continue, could, designed, enhances, estimate, expect, feel, forecast, forward, future, goal, grow, guidance, guide, initiative, intend, look forward, maintain, may, might, mission, model, objective, opportunity, outcome, on track, outlook, plan, position, potential, project, propose, remain, risk, seek, should, signs, strategy, strive, target, trajectory, trend, until, well-positioned, will, would or similar expressions, as they relate to Comerica or its management, or to economic, market or other environmental conditions, are intended to identify forward-looking statements. These forward-looking statements are predicated on the beliefs and assumptions of Comerica's management based on information known to Comerica's management as of the date of this press release and do not purport to speak as of any other date. Forward-looking statements may include descriptions of plans and objectives of Comerica's management for future or past operations, products or services, and forecasts of Comerica's revenue, earnings or other measures of economic performance, including statements of profitability, business segments and subsidiaries as well as estimates of credit trends and global stability. Such statements reflect the view of Comerica's management as of this date with respect to future events and are subject to risks and uncertainties. Should one or more of these risks materialize or should underlying beliefs or assumptions prove incorrect, Comerica's actual results could differ materially from those discussed. Factors that could cause or contribute to such differences include credit risks (changes in customer behavior; unfavorable developments concerning credit quality; and declines or other changes in the businesses or industries of Comerica's customers); market risks (changes in monetary and fiscal policies and fluctuations in interest rates and their impact on deposit pricing); liquidity risks (Comerica's ability to maintain adequate sources of funding and liquidity; reductions in Comerica's credit rating; and the interdependence of financial service companies and their soundness); technology risks (cybersecurity risks and heightened legislative and regulatory focus on cybersecurity and data privacy); operational risks (operational, systems or infrastructure failures; reliance on other companies to provide certain key components of business infrastructure; the impact of legal and regulatory proceedings or determinations; losses due to fraud; and controls and procedures failures); compliance risks (changes in regulation or oversight, or changes in Comerica’s status with respect to existing regulations or oversight; the effects of stringent capital requirements; and the impacts of future legislative, administrative or judicial changes to tax regulations); strategic risks (damage to Comerica's reputation; Comerica's ability to utilize technology to efficiently and effectively develop, market and deliver new products and services; competitive product and pricing pressures among financial institutions within Comerica's markets; the implementation of Comerica's strategies and business initiatives; management's ability to maintain and expand customer relationships; management's ability to retain key officers and employees; and any future strategic acquisitions or divestitures); and other general risks (changes in general economic, political or industry conditions; negative effects from inflation; the effectiveness of methods of reducing risk exposures; the effects of catastrophic events; physical or transition risks related to climate change; changes in accounting standards; the critical nature of Comerica's accounting policies, processes and management estimates; the volatility of Comerica’s stock price; and that an investment in Comerica’s equity securities is not insured or guaranteed by the FDIC). Comerica cautions that the foregoing list of factors is not all-inclusive. For discussion of factors that may cause actual results to differ from expectations, please refer to Comerica’s filings with the Securities and Exchange Commission. In particular, please refer to “Item 1A. Risk Factors” beginning on page 16 of Comerica's Annual Report on Form 10-K for the year ended December 31, 2024. Forward-looking statements speak only as of the date they are made. Comerica does not undertake to update forward-looking statements to reflect facts, circumstances, assumptions or events that occur after the date the forward-looking statements are made. For any forward-looking statements made in this press release or in any documents, Comerica claims the protection of the safe harbor for forward-looking statements contained in the Private Securities Litigation Reform Act of 1995.
|
|
|
|
|
|
| Media Contacts: |
Investor Contacts: |
| Nicole Hogan |
Kelly Gage |
| (214) 462-6657 |
(833) 571-0486 |
|
|
| Louis H. Mora |
Lindsey Baird |
| (214) 462-6669 |
(833) 571-0486 |
|
|
|
|
|
|
|
|
|
|
|
|
|
|
|
| CONSOLIDATED FINANCIAL HIGHLIGHTS (unaudited) |
|
|
|
| Comerica Incorporated and Subsidiaries |
|
|
|
|
|
|
|
Three Months Ended |
|
|
|
March 31, |
December 31, |
March 31, |
|
|
| (in millions, except per share data) |
2025 |
2024 |
2024 |
|
|
|
| PER COMMON SHARE AND COMMON STOCK DATA |
|
|
|
|
|
|
| Diluted earnings per common share |
$ |
1.25 |
|
$ |
1.22 |
|
$ |
0.98 |
|
|
|
|
|
|
|
|
|
|
|
| Cash dividends declared |
0.71 |
|
0.71 |
|
0.71 |
|
|
|
|
| Average diluted shares (in thousands) |
132,700 |
|
133,361 |
|
133,369 |
|
|
|
|
| PERFORMANCE RATIOS |
|
|
|
|
|
|
| Return on average common shareholders' equity |
10.60 |
% |
10.27 |
% |
9.33 |
% |
|
|
|
| Return on average assets |
0.90 |
|
0.85 |
|
0.66 |
|
|
|
|
| Efficiency ratio (a) |
70.28 |
|
69.51 |
|
76.91 |
|
|
|
|
| CAPITAL |
|
|
|
|
|
|
| Common equity tier 1 capital (b), (c) |
$ |
8,712 |
|
$ |
8,667 |
|
$ |
8,469 |
|
|
|
|
| Tier 1 capital (b), (c) |
9,106 |
|
9,061 |
|
8,863 |
|
|
|
|
| Risk-weighted assets (b) |
72,283 |
|
72,903 |
|
73,794 |
|
|
|
|
| Common equity tier 1 capital ratio (b), (c) |
12.05 |
% |
11.89 |
% |
11.48 |
% |
|
|
|
| Tier 1 capital ratio (b), (c) |
12.60 |
|
12.43 |
|
12.01 |
|
|
|
|
| Total capital ratio (b) |
14.39 |
|
14.21 |
|
13.98 |
|
|
|
|
| Leverage ratio (b) |
11.36 |
|
11.08 |
|
10.23 |
|
|
|
|
| Common shareholders' equity per share of common stock |
$ |
50.73 |
|
$ |
46.79 |
|
$ |
42.69 |
|
|
|
|
| Tangible common equity per share of common stock (c) |
45.85 |
|
41.91 |
|
37.84 |
|
|
|
|
| Common equity ratio |
8.58 |
% |
7.75 |
% |
7.12 |
% |
|
|
|
| Tangible common equity ratio (c) |
7.82 |
|
7.00 |
|
6.36 |
|
|
|
|
| AVERAGE BALANCES |
|
|
|
|
|
|
| Commercial loans |
$ |
26,112 |
|
$ |
26,198 |
|
$ |
26,451 |
|
|
|
|
| Real estate construction loans |
3,479 |
|
3,765 |
|
5,174 |
|
|
|
|
| Commercial mortgage loans |
14,731 |
|
14,728 |
|
13,642 |
|
|
|
|
| Lease financing |
727 |
|
752 |
|
810 |
|
|
|
|
| International loans |
1,004 |
|
988 |
|
1,141 |
|
|
|
|
| Residential mortgage loans |
1,920 |
|
1,921 |
|
1,882 |
|
|
|
|
| Consumer loans |
2,241 |
|
2,265 |
|
2,272 |
|
|
|
|
| Total loans |
50,214 |
|
50,617 |
|
51,372 |
|
|
|
|
| Earning assets |
70,378 |
|
72,072 |
|
75,807 |
|
|
|
|
| Total assets |
77,558 |
|
79,234 |
|
83,617 |
|
|
|
|
| Noninterest-bearing deposits |
23,480 |
|
24,222 |
|
26,408 |
|
|
|
|
| Interest-bearing deposits |
38,419 |
|
39,125 |
|
38,902 |
|
|
|
|
| Total deposits |
61,899 |
|
63,347 |
|
65,310 |
|
|
|
|
| Common shareholders' equity |
6,367 |
|
6,345 |
|
5,683 |
|
|
|
|
| Total shareholders' equity |
6,761 |
|
6,739 |
|
6,077 |
|
|
|
|
| NET INTEREST INCOME |
|
|
|
|
|
|
| Net interest income |
$ |
575 |
|
$ |
575 |
|
$ |
548 |
|
|
|
|
| Net interest margin |
3.18 |
% |
3.06 |
% |
2.80 |
% |
|
|
|
| CREDIT QUALITY |
|
|
|
|
|
|
| Nonperforming assets |
$ |
301 |
|
$ |
308 |
|
$ |
217 |
|
|
|
|
| Loans past due 90 days or more and still accruing |
12 |
|
44 |
|
32 |
|
|
|
|
| Net charge-offs |
26 |
|
16 |
|
14 |
|
|
|
|
| Allowance for loan losses |
683 |
|
690 |
|
691 |
|
|
|
|
| Allowance for credit losses on lending-related commitments |
36 |
|
35 |
|
37 |
|
|
|
|
| Total allowance for credit losses |
719 |
|
725 |
|
728 |
|
|
|
|
| Allowance for credit losses as a percentage of total loans |
1.44 |
% |
1.44 |
% |
1.43 |
% |
|
|
|
| Net loan charge-offs as a percentage of average total loans |
0.21 |
|
0.13 |
|
0.10 |
|
|
|
|
Nonperforming assets as a percentage of total loans and foreclosed property |
0.60 |
|
0.61 |
|
0.43 |
|
|
|
|
| Allowance for credit losses as a multiple of total nonperforming loans |
2.4x |
2.4x |
3.4x |
|
|
|
| OTHER KEY INFORMATION |
|
|
|
|
|
|
| Number of banking centers |
380 |
|
381 |
|
408 |
|
|
|
|
| Number of employees - full time equivalent |
7,860 |
|
7,766 |
|
7,619 |
|
|
|
|
(a) Noninterest expenses as a percentage of the sum of net interest income and noninterest income excluding net gains (losses) from securities, a derivative contract tied to the conversion rate of Visa Class B shares and changes in the value of shares obtained through monetization of warrants.
(b) March 31, 2025 ratios are estimated.
(c) See Reconciliations of Non-GAAP Financial Measures and Regulatory Ratios.
|
|
|
|
|
|
|
|
|
|
|
|
|
| CONSOLIDATED BALANCE SHEETS |
| Comerica Incorporated and Subsidiaries |
|
|
|
|
|
|
|
|
|
|
March 31, |
December 31, |
March 31, |
|
| (in millions, except share data) |
2025 |
2024 |
2024 |
|
|
(unaudited) |
|
(unaudited) |
|
| ASSETS |
|
|
|
|
| Cash and due from banks |
$ |
1,083 |
|
$ |
850 |
|
$ |
689 |
|
|
|
|
|
|
|
| Interest-bearing deposits with banks |
4,709 |
|
5,954 |
|
4,446 |
|
|
| Other short-term investments |
379 |
|
375 |
|
366 |
|
|
| Investment securities available-for-sale |
15,102 |
|
15,045 |
|
16,246 |
|
|
|
|
|
|
|
| Commercial loans |
25,801 |
|
26,492 |
|
26,019 |
|
|
| Real estate construction loans |
3,393 |
|
3,680 |
|
4,558 |
|
|
| Commercial mortgage loans |
14,788 |
|
14,493 |
|
14,266 |
|
|
| Lease financing |
734 |
|
722 |
|
793 |
|
|
| International loans |
1,036 |
|
952 |
|
1,070 |
|
|
| Residential mortgage loans |
1,916 |
|
1,929 |
|
1,889 |
|
|
| Consumer loans |
2,244 |
|
2,271 |
|
2,227 |
|
|
| Total loans |
49,912 |
|
50,539 |
|
50,822 |
|
|
| Allowance for loan losses |
(683) |
|
(690) |
|
(691) |
|
|
| Net loans |
49,229 |
|
49,849 |
|
50,131 |
|
|
| Premises and equipment |
447 |
|
473 |
|
462 |
|
|
| Accrued income and other assets |
6,673 |
|
6,751 |
|
7,104 |
|
|
| Total assets |
$ |
77,622 |
|
$ |
79,297 |
|
$ |
79,444 |
|
|
| LIABILITIES AND SHAREHOLDERS' EQUITY |
|
|
|
|
| Noninterest-bearing deposits |
$ |
23,156 |
|
$ |
24,425 |
|
$ |
25,833 |
|
|
| Money market and interest-bearing checking deposits |
32,029 |
|
32,714 |
|
28,550 |
|
|
| Savings deposits |
2,147 |
|
2,138 |
|
2,342 |
|
|
| Customer certificates of deposit |
3,095 |
|
3,450 |
|
3,941 |
|
|
| Other time deposits |
1,052 |
|
1,052 |
|
2,894 |
|
|
| Foreign office time deposits |
26 |
|
32 |
|
18 |
|
|
| Total interest-bearing deposits |
38,349 |
|
39,386 |
|
37,745 |
|
|
| Total deposits |
61,505 |
|
63,811 |
|
63,578 |
|
|
| Short-term borrowings |
1,225 |
|
— |
|
— |
|
|
| Accrued expenses and other liabilities |
2,107 |
|
2,270 |
|
2,695 |
|
|
| Medium- and long-term debt |
5,733 |
|
6,673 |
|
7,121 |
|
|
| Total liabilities |
70,570 |
|
72,754 |
|
73,394 |
|
|
| Fixed-rate reset non-cumulative perpetual preferred stock, series A, no par value, $100,000 liquidation preference per share: |
|
|
|
|
| Authorized - 4,000 shares |
|
|
|
|
| Issued - 4,000 shares |
394 |
|
394 |
|
394 |
|
|
| Common stock - $5 par value: |
|
|
|
|
| Authorized - 325,000,000 shares |
|
|
|
|
| Issued - 228,164,824 shares |
1,141 |
|
1,141 |
|
1,141 |
|
|
| Capital surplus |
2,198 |
|
2,218 |
|
2,202 |
|
|
| Accumulated other comprehensive loss |
(2,695) |
|
(3,161) |
|
(3,457) |
|
|
| Retained earnings |
12,093 |
|
12,017 |
|
11,765 |
|
|
Less cost of common stock in treasury - 96,945,906 shares at 3/31/25, 96,755,368 shares at 12/31/24, 95,683,776 shares at 3/31/24 |
(6,079) |
|
(6,066) |
|
(5,995) |
|
|
| Total shareholders' equity |
7,052 |
|
6,543 |
|
6,050 |
|
|
| Total liabilities and shareholders' equity |
$ |
77,622 |
|
$ |
79,297 |
|
$ |
79,444 |
|
|
|
|
|
|
|
|
|
|
|
|
|
|
|
|
|
|
|
|
|
|
|
|
|
|
|
|
|
|
|
|
|
|
|
|
|
|
| CONSOLIDATED QUARTERLY STATEMENTS OF COMPREHENSIVE INCOME (unaudited) |
| Comerica Incorporated and Subsidiaries |
|
|
|
|
|
|
|
|
|
|
|
|
|
|
|
|
|
|
|
|
|
|
|
First |
Fourth |
Third |
Second |
First |
|
First Quarter 2025 Compared to: |
|
Quarter |
Quarter |
Quarter |
Quarter |
Quarter |
|
Fourth Quarter 2024 |
|
First Quarter 2024 |
| (in millions, except per share data) |
2025 |
2024 |
2024 |
2024 |
2024 |
|
Amount |
Percent |
|
Amount |
Percent |
| INTEREST INCOME |
|
|
|
|
|
|
|
|
|
|
|
| Interest and fees on loans |
$ |
759 |
|
$ |
795 |
|
$ |
798 |
|
$ |
803 |
|
$ |
808 |
|
|
$ |
(36) |
|
(4) |
% |
|
$ |
(49) |
|
(6) |
% |
| Interest on investment securities |
109 |
|
100 |
|
99 |
|
101 |
|
102 |
|
|
9 |
|
8 |
|
|
7 |
|
6 |
|
| Interest on short-term investments |
56 |
|
72 |
|
85 |
|
67 |
|
109 |
|
|
(16) |
|
(23) |
|
|
(53) |
|
(49) |
|
| Total interest income |
924 |
|
967 |
|
982 |
|
971 |
|
1,019 |
|
|
(43) |
|
(5) |
|
|
(95) |
|
(9) |
|
| INTEREST EXPENSE |
|
|
|
|
|
|
|
|
|
|
|
| Interest on deposits |
252 |
|
286 |
|
330 |
|
305 |
|
317 |
|
|
(34) |
|
(12) |
|
|
(65) |
|
(21) |
|
| Interest on short-term borrowings |
2 |
|
1 |
|
1 |
|
9 |
|
37 |
|
|
1 |
|
n/m |
|
(35) |
|
(94) |
|
| Interest on medium- and long-term debt |
95 |
|
105 |
|
117 |
|
124 |
|
117 |
|
|
(10) |
|
(10) |
|
|
(22) |
|
(19) |
|
| Total interest expense |
349 |
|
392 |
|
448 |
|
438 |
|
471 |
|
|
(43) |
|
(11) |
|
|
(122) |
|
(26) |
|
| Net interest income |
575 |
|
575 |
|
534 |
|
533 |
|
548 |
|
|
— |
|
— |
|
|
27 |
|
5 |
|
| Provision for credit losses |
20 |
|
21 |
|
14 |
|
— |
|
14 |
|
|
(1) |
|
(7) |
|
|
6 |
|
39 |
|
|
Net interest income after provision
for credit losses
|
555 |
|
554 |
|
520 |
|
533 |
|
534 |
|
|
1 |
|
— |
|
|
21 |
|
4 |
|
| NONINTEREST INCOME |
|
|
|
|
|
|
|
|
|
|
|
| Card fees |
59 |
|
62 |
|
64 |
|
64 |
|
66 |
|
|
(3) |
|
(4) |
|
|
(7) |
|
(10) |
|
| Fiduciary income |
52 |
|
54 |
|
57 |
|
58 |
|
51 |
|
|
(2) |
|
(2) |
|
|
1 |
|
2 |
|
| Service charges on deposit accounts |
46 |
|
47 |
|
46 |
|
46 |
|
45 |
|
|
(1) |
|
(2) |
|
|
1 |
|
1 |
|
| Capital markets income |
31 |
|
36 |
|
39 |
|
37 |
|
30 |
|
|
(5) |
|
(16) |
|
|
1 |
|
4 |
|
| Commercial lending fees |
16 |
|
18 |
|
17 |
|
17 |
|
16 |
|
|
(2) |
|
(10) |
|
|
— |
|
— |
|
| Brokerage fees |
14 |
|
14 |
|
13 |
|
14 |
|
10 |
|
|
— |
|
— |
|
|
4 |
|
37 |
|
Letter of credit fees |
11 |
|
10 |
|
10 |
|
10 |
|
10 |
|
|
1 |
|
(1) |
|
|
1 |
|
10 |
|
Bank-owned life insurance |
9 |
|
11 |
|
12 |
|
11 |
|
10 |
|
|
(2) |
|
(17) |
|
|
(1) |
|
(6) |
|
| Risk management hedging income (loss) |
7 |
|
9 |
|
7 |
|
17 |
|
(25) |
|
|
(2) |
|
(29) |
|
|
32 |
|
n/m |
| Net losses on debt securities |
— |
|
(19) |
|
— |
|
— |
|
— |
|
|
19 |
|
n/m |
|
— |
|
— |
|
| Other noninterest income |
9 |
|
8 |
|
12 |
|
17 |
|
23 |
|
|
1 |
|
25 |
|
|
(14) |
|
(58) |
|
| Total noninterest income |
254 |
|
250 |
|
277 |
|
291 |
|
236 |
|
|
4 |
|
2 |
|
|
18 |
|
8 |
|
| NONINTEREST EXPENSES |
|
|
|
|
|
|
|
|
|
|
|
| Salaries and benefits expense |
368 |
|
346 |
|
335 |
|
323 |
|
348 |
|
|
22 |
|
6 |
|
|
20 |
|
6 |
|
| Outside processing fee expense |
64 |
|
68 |
|
69 |
|
68 |
|
68 |
|
|
(4) |
|
(5) |
|
|
(4) |
|
(6) |
|
Software expense |
48 |
|
46 |
|
46 |
|
45 |
|
44 |
|
|
2 |
|
3 |
|
|
4 |
|
9 |
|
Occupancy expense |
46 |
|
47 |
|
46 |
|
44 |
|
44 |
|
|
(1) |
|
(2) |
|
|
2 |
|
4 |
|
FDIC insurance expense |
14 |
|
10 |
|
11 |
|
19 |
|
36 |
|
|
4 |
|
31 |
|
|
(22) |
|
(62) |
|
Equipment expense |
13 |
|
14 |
|
13 |
|
13 |
|
12 |
|
|
(1) |
|
(10) |
|
|
1 |
|
9 |
|
| Advertising expense |
8 |
|
11 |
|
10 |
|
12 |
|
8 |
|
|
(3) |
|
(25) |
|
|
— |
|
— |
|
| Other noninterest expenses |
23 |
|
45 |
|
32 |
|
31 |
|
43 |
|
|
(22) |
|
(47) |
|
|
(20) |
|
(46) |
|
| Total noninterest expenses |
584 |
|
587 |
|
562 |
|
555 |
|
603 |
|
|
(3) |
|
(1) |
|
|
(19) |
|
(3) |
|
| Income before income taxes |
225 |
|
217 |
|
235 |
|
269 |
|
167 |
|
|
8 |
|
4 |
|
|
58 |
|
36 |
|
| Provision for income taxes |
53 |
|
47 |
|
51 |
|
63 |
|
29 |
|
|
6 |
|
13 |
|
|
24 |
|
87 |
|
| NET INCOME |
172 |
|
170 |
|
184 |
|
206 |
|
138 |
|
|
2 |
|
2 |
|
|
34 |
|
25 |
|
| Less: |
|
|
|
|
|
|
|
|
|
|
|
| Income allocated to participating securities |
1 |
|
1 |
|
1 |
|
1 |
|
1 |
|
|
— |
|
— |
|
|
— |
|
— |
|
| Preferred stock dividends |
6 |
|
6 |
|
6 |
|
5 |
|
6 |
|
|
— |
|
— |
|
|
— |
|
— |
|
| Net income attributable to common shares |
$ |
165 |
|
$ |
163 |
|
$ |
177 |
|
$ |
200 |
|
$ |
131 |
|
|
$ |
2 |
|
2 |
% |
|
$ |
34 |
|
26 |
% |
| Earnings per common share: |
|
|
|
|
|
|
|
|
|
|
|
| Basic |
$ |
1.26 |
|
$ |
1.23 |
|
$ |
1.34 |
|
$ |
1.50 |
|
$ |
0.99 |
|
|
$ |
0.03 |
|
2 |
% |
|
$ |
0.27 |
|
27 |
% |
| Diluted |
1.25 |
|
1.22 |
|
1.33 |
|
1.49 |
|
0.98 |
|
|
0.03 |
|
2 |
|
|
0.27 |
|
28 |
|
| Comprehensive income (loss) |
638 |
|
(636) |
|
1,292 |
|
200 |
|
(271) |
|
|
1,274 |
|
n/m |
|
909 |
|
n/m |
| Cash dividends declared on common stock |
93 |
|
93 |
|
94 |
|
95 |
|
94 |
|
|
— |
|
— |
|
|
(1) |
|
(1) |
|
| Cash dividends declared per common share |
0.71 |
|
0.71 |
|
0.71 |
|
0.71 |
|
0.71 |
|
|
— |
|
— |
|
|
— |
|
— |
|
n/m - not meaningful
|
|
|
|
|
|
|
|
|
|
|
|
|
|
|
|
|
|
|
|
|
| ANALYSIS OF THE ALLOWANCE FOR CREDIT LOSSES (unaudited) |
| Comerica Incorporated and Subsidiaries |
|
|
|
|
|
|
|
|
|
|
|
|
|
|
2025 |
|
2024 |
| (in millions) |
1st Qtr |
|
4th Qtr |
3rd Qtr |
2nd Qtr |
1st Qtr |
| Balance at beginning of period: |
|
|
|
|
|
|
| Allowance for loan losses |
$ |
690 |
|
|
$ |
686 |
|
$ |
686 |
|
$ |
691 |
|
$ |
688 |
|
| Allowance for credit losses on lending-related commitments |
35 |
|
|
34 |
|
31 |
|
37 |
|
40 |
|
| Allowance for credit losses |
725 |
|
|
720 |
|
717 |
|
728 |
|
728 |
|
|
|
|
|
|
|
|
| Loan charge-offs: |
|
|
|
|
|
|
| Commercial |
17 |
|
|
22 |
|
11 |
|
19 |
|
20 |
|
| Real estate construction |
7 |
|
|
— |
|
— |
|
— |
|
— |
|
| Commercial mortgage |
7 |
|
|
— |
|
10 |
|
6 |
|
— |
|
| Lease financing |
— |
|
|
— |
|
1 |
|
3 |
|
— |
|
| International |
— |
|
|
— |
|
1 |
|
— |
|
— |
|
|
|
|
|
|
|
|
| Consumer |
1 |
|
|
1 |
|
— |
|
— |
|
1 |
|
| Total loan charge-offs |
32 |
|
|
23 |
|
23 |
|
28 |
|
21 |
|
| Recoveries on loans previously charged-off: |
|
|
|
|
|
|
| Commercial |
5 |
|
|
5 |
|
6 |
|
15 |
|
6 |
|
|
|
|
|
|
|
|
| Commercial mortgage |
1 |
|
|
1 |
|
1 |
|
1 |
|
— |
|
|
|
|
|
|
|
|
| International |
— |
|
|
1 |
|
5 |
|
— |
|
— |
|
|
|
|
|
|
|
|
| Consumer |
— |
|
|
— |
|
— |
|
1 |
|
1 |
|
| Total recoveries |
6 |
|
|
7 |
|
12 |
|
17 |
|
7 |
|
| Net loan charge-offs |
26 |
|
|
16 |
|
11 |
|
11 |
|
14 |
|
| Provision for credit losses: |
|
|
|
|
|
|
| Provision for loan losses |
19 |
|
|
20 |
|
11 |
|
6 |
|
17 |
|
| Provision for credit losses on lending-related commitments |
1 |
|
|
1 |
|
3 |
|
(6) |
|
(3) |
|
| Provision for credit losses |
20 |
|
|
21 |
|
14 |
|
— |
|
14 |
|
|
|
|
|
|
|
|
| Balance at end of period: |
|
|
|
|
|
|
| Allowance for loan losses |
683 |
|
|
690 |
|
686 |
|
686 |
|
691 |
|
| Allowance for credit losses on lending-related commitments |
36 |
|
|
35 |
|
34 |
|
31 |
|
37 |
|
| Allowance for credit losses |
$ |
719 |
|
|
$ |
725 |
|
$ |
720 |
|
$ |
717 |
|
$ |
728 |
|
|
|
|
|
|
|
|
|
|
|
|
|
|
|
| Allowance for credit losses as a percentage of total loans |
1.44 |
% |
|
1.44 |
% |
1.43 |
% |
1.38 |
% |
1.43 |
% |
|
|
|
|
|
|
|
| Net loan charge-offs as a percentage of average total loans |
0.21 |
|
|
0.13 |
|
0.08 |
|
0.09 |
|
0.10 |
|
|
|
|
|
|
|
|
|
|
|
|
|
|
|
|
|
|
|
|
|
|
|
|
|
|
|
|
|
|
|
|
|
|
|
|
| NONPERFORMING ASSETS (unaudited) |
| Comerica Incorporated and Subsidiaries |
|
|
|
|
|
|
|
|
|
|
|
|
|
|
2025 |
|
2024 |
| (in millions) |
1st Qtr |
|
4th Qtr |
3rd Qtr |
2nd Qtr |
1st Qtr |
| SUMMARY OF NONPERFORMING ASSETS AND PAST DUE LOANS |
|
|
|
|
|
|
| Nonperforming loans: |
|
|
|
|
|
|
| Business loans: |
|
|
|
|
|
|
| Commercial |
$ |
108 |
|
|
$ |
125 |
|
$ |
97 |
|
$ |
94 |
|
$ |
88 |
|
| Real estate construction |
20 |
|
|
— |
|
— |
|
— |
|
— |
|
| Commercial mortgage |
110 |
|
|
118 |
|
88 |
|
69 |
|
67 |
|
| Lease financing |
1 |
|
|
1 |
|
1 |
|
1 |
|
— |
|
| International |
— |
|
|
— |
|
3 |
|
13 |
|
16 |
|
| Total nonperforming business loans |
239 |
|
|
244 |
|
189 |
|
177 |
|
171 |
|
| Retail loans: |
|
|
|
|
|
|
| Residential mortgage |
35 |
|
|
37 |
|
36 |
|
23 |
|
23 |
|
| Consumer: |
|
|
|
|
|
|
| Home equity |
27 |
|
|
27 |
|
25 |
|
26 |
|
23 |
|
|
|
|
|
|
|
|
| Total nonperforming retail loans |
62 |
|
|
64 |
|
61 |
|
49 |
|
46 |
|
| Total nonperforming loans and nonperforming assets |
301 |
|
|
308 |
|
250 |
|
226 |
|
217 |
|
|
|
|
|
|
|
|
|
|
|
|
|
|
|
|
|
|
|
|
|
|
| Nonperforming loans as a percentage of total loans |
0.60 |
% |
|
0.61 |
% |
0.50 |
% |
0.44 |
% |
0.43 |
% |
Nonperforming assets as a percentage of total loans and foreclosed property |
0.60 |
|
|
0.61 |
|
0.50 |
|
0.44 |
|
0.43 |
|
| Allowance for credit losses as a multiple of total nonperforming loans |
2.4x |
|
2.4x |
2.9x |
3.2x |
3.4x |
| Loans past due 90 days or more and still accruing |
$ |
12 |
|
|
$ |
44 |
|
$ |
21 |
|
$ |
11 |
|
$ |
32 |
|
| ANALYSIS OF NONACCRUAL LOANS |
|
|
|
|
|
|
| Nonaccrual loans at beginning of period |
$ |
308 |
|
|
$ |
250 |
|
$ |
226 |
|
$ |
217 |
|
$ |
178 |
|
| Loans transferred to nonaccrual (a) |
43 |
|
|
97 |
|
55 |
|
45 |
|
83 |
|
| Nonaccrual loan gross charge-offs |
(32) |
|
|
(23) |
|
(23) |
|
(28) |
|
(21) |
|
| Loans transferred to accrual status (a) |
— |
|
|
(5) |
|
— |
|
— |
|
(2) |
|
| Nonaccrual loans sold |
(1) |
|
|
(1) |
|
(14) |
|
(2) |
|
(12) |
|
| Payments/other (b) |
(17) |
|
|
(10) |
|
6 |
|
(6) |
|
(9) |
|
| Nonaccrual loans at end of period |
$ |
301 |
|
|
$ |
308 |
|
$ |
250 |
|
$ |
226 |
|
$ |
217 |
|
(a)Based on an analysis of nonaccrual loans with book balances greater than $2 million.
(b)Includes net changes related to nonaccrual loans with balances less than or equal to $2 million, payments on nonaccrual loans with book balances greater than $2 million and transfers of nonaccrual loans to foreclosed property.
|
|
|
|
|
|
|
|
|
|
|
|
|
|
|
|
|
|
|
|
|
|
|
|
|
|
|
|
|
|
|
|
|
|
|
|
| ANALYSIS OF NET INTEREST INCOME (unaudited) |
| Comerica Incorporated and Subsidiaries |
|
|
|
|
|
|
|
|
|
|
|
|
Three Months Ended |
|
March 31, 2025 |
|
December 31, 2024 |
|
March 31, 2024 |
|
Average |
|
Average |
|
Average |
|
Average |
|
Average |
|
Average |
| (dollar amounts in millions) |
Balance |
Interest |
Rate |
|
Balance |
Interest |
Rate |
|
Balance |
Interest |
Rate |
| Commercial loans (a) |
$ |
26,112 |
|
$ |
368 |
|
5.72 |
% |
|
$ |
26,198 |
|
$ |
372 |
|
5.65 |
% |
|
$ |
26,451 |
|
$ |
348 |
|
5.30 |
% |
| Real estate construction loans |
3,479 |
|
64 |
|
7.47 |
|
|
3,765 |
|
75 |
|
7.89 |
|
|
5,174 |
|
108 |
|
8.37 |
|
| Commercial mortgage loans |
14,731 |
|
240 |
|
6.60 |
|
|
14,728 |
|
257 |
|
6.95 |
|
|
13,642 |
|
253 |
|
7.46 |
|
| Lease financing |
727 |
|
10 |
|
5.69 |
|
|
752 |
|
11 |
|
5.90 |
|
|
810 |
|
12 |
|
6.11 |
|
| International loans |
1,004 |
|
16 |
|
6.67 |
|
|
988 |
|
18 |
|
7.26 |
|
|
1,141 |
|
22 |
|
7.80 |
|
| Residential mortgage loans |
1,920 |
|
20 |
|
4.09 |
|
|
1,921 |
|
17 |
|
3.62 |
|
|
1,882 |
|
18 |
|
3.74 |
|
| Consumer loans |
2,241 |
|
41 |
|
7.37 |
|
|
2,265 |
|
45 |
|
7.80 |
|
|
2,272 |
|
47 |
|
8.32 |
|
| Total loans |
50,214 |
|
759 |
|
6.13 |
|
|
50,617 |
|
795 |
|
6.25 |
|
|
51,372 |
|
808 |
|
6.33 |
|
| Mortgage-backed securities (b) |
13,702 |
|
95 |
|
2.33 |
|
|
14,075 |
|
96 |
|
2.30 |
|
|
14,782 |
|
101 |
|
2.28 |
|
| U.S. Treasury securities (c) |
1,281 |
|
14 |
|
4.21 |
|
|
1,319 |
|
4 |
|
1.32 |
|
|
1,546 |
|
1 |
|
0.28 |
|
| Total investment securities |
14,983 |
|
109 |
|
2.46 |
|
|
15,394 |
|
100 |
|
2.22 |
|
|
16,328 |
|
102 |
|
2.12 |
|
| Interest-bearing deposits with banks (d) |
4,806 |
|
53 |
|
4.36 |
|
|
5,695 |
|
68 |
|
4.71 |
|
|
7,726 |
|
105 |
|
5.47 |
|
| Other short-term investments |
375 |
|
3 |
|
3.37 |
|
|
366 |
|
4 |
|
3.73 |
|
|
381 |
|
4 |
|
4.01 |
|
| Total earning assets |
70,378 |
|
924 |
|
5.11 |
|
|
72,072 |
|
967 |
|
5.15 |
|
|
75,807 |
|
1,019 |
|
5.20 |
|
| Cash and due from banks |
733 |
|
|
|
|
630 |
|
|
|
|
938 |
|
|
|
| Allowance for loan losses |
(690) |
|
|
|
|
(687) |
|
|
|
|
(688) |
|
|
|
| Accrued income and other assets |
7,137 |
|
|
|
|
7,219 |
|
|
|
|
7,560 |
|
|
|
| Total assets |
$ |
77,558 |
|
|
|
|
$ |
79,234 |
|
|
|
|
$ |
83,617 |
|
|
|
| Money market and interest-bearing checking deposits (e) |
$ |
31,912 |
|
213 |
|
2.70 |
|
|
$ |
32,045 |
|
238 |
|
2.95 |
|
|
$ |
28,700 |
|
228 |
|
3.18 |
|
| Savings deposits |
2,140 |
|
1 |
|
0.16 |
|
|
2,142 |
|
1 |
|
0.16 |
|
|
2,352 |
|
1 |
|
0.23 |
|
| Customer certificates of deposit |
3,282 |
|
24 |
|
2.93 |
|
|
3,542 |
|
28 |
|
3.21 |
|
|
3,868 |
|
36 |
|
3.76 |
|
| Other time deposits |
1,052 |
|
14 |
|
5.35 |
|
|
1,371 |
|
19 |
|
5.35 |
|
|
3,964 |
|
52 |
|
5.28 |
|
| Foreign office time deposits |
33 |
|
— |
|
3.78 |
|
|
25 |
|
— |
|
4.14 |
|
|
18 |
|
— |
|
4.35 |
|
| Total interest-bearing deposits |
38,419 |
|
252 |
|
2.65 |
|
|
39,125 |
|
286 |
|
2.91 |
|
|
38,902 |
|
317 |
|
3.28 |
|
| Federal funds purchased |
184 |
|
2 |
|
4.41 |
|
|
5 |
|
— |
|
4.68 |
|
|
26 |
|
— |
|
5.39 |
|
| Other short-term borrowings |
4 |
|
— |
|
4.61 |
|
|
37 |
|
1 |
|
4.77 |
|
|
2,555 |
|
37 |
|
5.65 |
|
|
|
|
|
|
|
|
|
|
|
|
|
| Medium- and long-term debt |
6,488 |
|
95 |
|
5.83 |
|
|
6,698 |
|
105 |
|
6.28 |
|
|
6,903 |
|
117 |
|
6.77 |
|
| Total interest-bearing sources |
45,095 |
|
349 |
|
3.12 |
|
|
45,865 |
|
392 |
|
3.40 |
|
|
48,386 |
|
471 |
|
3.90 |
|
| Noninterest-bearing deposits |
23,480 |
|
|
|
|
24,222 |
|
|
|
|
26,408 |
|
|
|
| Accrued expenses and other liabilities |
2,222 |
|
|
|
|
2,408 |
|
|
|
|
2,746 |
|
|
|
| Shareholders' equity |
6,761 |
|
|
|
|
6,739 |
|
|
|
|
6,077 |
|
|
|
| Total liabilities and shareholders' equity |
$ |
77,558 |
|
|
|
|
$ |
79,234 |
|
|
|
|
$ |
83,617 |
|
|
|
| Net interest income/rate spread |
|
$ |
575 |
|
1.99 |
|
|
|
$ |
575 |
|
1.75 |
|
|
|
$ |
548 |
|
1.30 |
|
| Impact of net noninterest-bearing sources of funds |
|
|
1.19 |
|
|
|
|
1.31 |
|
|
|
|
1.50 |
|
| Net interest margin (as a percentage of average earning assets) |
|
|
3.18 |
% |
|
|
|
3.06 |
% |
|
|
|
2.80 |
% |
(a)Interest income on commercial loans included net expense from cash flow swaps of $78 million, $115 million and $170 million for the three months ended March 31, 2025, December 31, 2024 and March 31, 2024, respectively.
(b)Average balances included $2.7 billion, $2.7 billion and $2.9 billion of unrealized losses for the three months ended March 31, 2025, December 31, 2024 and March 31, 2024, respectively; yields calculated gross of these unrealized losses.
(c)Average balances included $1 million of unrealized gains, $22 million of unrealized losses and $71 million of unrealized losses for the three months ended March 31, 2025, December 31, 2024 and March 31, 2024, respectively; yields calculated gross of these unrealized gains and losses.
(d)Average balances excluded $2 million, excluded $10 million and included $2 million of collateral posted and netted against derivative liability positions for the three months ended March 31, 2025, December 31, 2024 and March 31, 2024, respectively; yields calculated gross of derivative netting amounts.
(e)Average balances excluded $70 million, $76 million and $130 million of collateral received and netted against derivative asset positions for the three months ended March 31, 2025, December 31, 2024 and March 31, 2024, respectively; rates calculated gross of derivative netting amounts.
|
|
|
|
|
|
|
|
|
|
|
|
|
|
|
|
|
|
|
|
|
|
|
|
|
|
|
|
| CONSOLIDATED STATEMENTS OF CHANGES IN SHAREHOLDERS' EQUITY (unaudited) |
|
| Comerica Incorporated and Subsidiaries |
|
|
|
|
|
|
|
|
|
|
|
Accumulated Other Comprehensive Loss |
|
|
|
|
|
Nonredeemable Preferred Stock |
Common Stock |
|
|
|
Total Shareholders' Equity |
|
|
Shares Outstanding |
Amount |
Capital Surplus |
Retained Earnings |
Treasury Stock |
|
| (in millions, except per share data) |
|
|
|
|
|
|
|
|
|
|
|
|
|
|
|
|
|
|
|
|
|
|
|
|
|
|
|
|
|
|
|
|
|
|
|
|
|
|
|
|
|
|
|
|
|
|
|
|
|
|
|
|
|
|
|
|
|
|
|
|
|
|
|
|
|
|
|
|
|
|
|
|
|
|
|
|
|
|
|
|
|
|
|
|
|
|
|
|
|
|
|
|
|
|
|
|
|
|
|
|
|
|
|
|
|
|
|
|
|
|
|
|
|
|
|
|
|
|
|
|
|
|
|
|
|
|
|
|
|
|
|
|
|
|
|
|
|
|
|
|
|
|
|
|
|
|
|
|
|
|
|
|
|
|
|
|
|
|
|
|
|
|
|
|
|
|
|
|
|
|
|
|
|
|
|
|
|
|
|
|
|
|
|
|
|
|
|
|
|
|
|
|
|
|
|
|
|
|
|
|
|
|
|
|
|
|
|
|
|
|
|
|
|
|
|
|
|
|
|
|
|
|
|
|
|
|
|
|
|
|
|
|
|
|
|
|
|
|
|
|
|
|
|
|
|
|
|
|
|
|
|
|
|
|
|
|
|
|
|
|
|
| BALANCE AT DECEMBER 31, 2023 |
$ |
394 |
|
131.9 |
|
$ |
1,141 |
|
$ |
2,224 |
|
$ |
(3,048) |
|
$ |
11,727 |
|
$ |
(6,032) |
|
$ |
6,406 |
|
| Cumulative effect of change in accounting principle (a) |
— |
|
— |
|
— |
|
— |
|
— |
|
(4) |
|
— |
|
(4) |
|
| Net income |
— |
|
— |
|
— |
|
— |
|
— |
|
138 |
|
— |
|
138 |
|
| Other comprehensive loss, net of tax |
— |
|
— |
|
— |
|
— |
|
(409) |
|
— |
|
— |
|
(409) |
|
| Cash dividends declared on common stock ($0.71 per share) |
— |
|
— |
|
— |
|
— |
|
— |
|
(94) |
|
— |
|
(94) |
|
| Cash dividends declared on preferred stock |
— |
|
— |
|
— |
|
— |
|
— |
|
(6) |
|
— |
|
(6) |
|
|
|
|
|
|
|
|
|
|
|
|
|
|
|
|
|
|
|
|
|
|
|
|
|
|
|
|
|
|
|
| Net issuance of common stock under employee stock plans |
— |
|
0.6 |
|
— |
|
(49) |
|
— |
|
4 |
|
37 |
|
(8) |
|
|
|
|
|
|
|
|
|
|
|
| Share-based compensation |
— |
|
— |
|
— |
|
27 |
|
— |
|
— |
|
— |
|
27 |
|
|
|
|
|
|
|
|
|
|
|
| BALANCE AT MARCH 31, 2024 |
$ |
394 |
|
132.5 |
|
$ |
1,141 |
|
$ |
2,202 |
|
$ |
(3,457) |
|
$ |
11,765 |
|
$ |
(5,995) |
|
$ |
6,050 |
|
| BALANCE AT DECEMBER 31, 2024 |
$ |
394 |
|
131.4 |
|
$ |
1,141 |
|
$ |
2,218 |
|
$ |
(3,161) |
|
$ |
12,017 |
|
$ |
(6,066) |
|
$ |
6,543 |
|
|
|
|
|
|
|
|
|
|
|
| Net income |
— |
|
— |
|
— |
|
— |
|
— |
|
172 |
|
— |
|
172 |
|
| Other comprehensive income, net of tax |
— |
|
— |
|
— |
|
— |
|
466 |
|
— |
|
— |
|
466 |
|
| Cash dividends declared on common stock ($0.71 per share) |
— |
|
— |
|
— |
|
— |
|
— |
|
(93) |
|
— |
|
(93) |
|
| Cash dividends declared on preferred stock |
— |
|
— |
|
— |
|
— |
|
— |
|
(6) |
|
— |
|
(6) |
|
| Purchase of common stock |
— |
|
(0.7) |
|
— |
|
(1) |
|
— |
|
— |
|
(49) |
|
(50) |
|
|
|
|
|
|
|
|
|
|
|
|
|
|
|
|
|
|
|
|
|
| Net issuance of common stock under employee stock plans |
— |
|
0.5 |
|
— |
|
(46) |
|
— |
|
3 |
|
36 |
|
(7) |
|
|
|
|
|
|
|
|
|
|
|
| Share-based compensation |
— |
|
— |
|
— |
|
27 |
|
— |
|
— |
|
— |
|
27 |
|
|
|
|
|
|
|
|
|
|
|
| BALANCE AT MARCH 31, 2025 |
$ |
394 |
|
131.2 |
|
$ |
1,141 |
|
$ |
2,198 |
|
$ |
(2,695) |
|
$ |
12,093 |
|
$ |
(6,079) |
|
$ |
7,052 |
|
|
(a)Effective January 1, 2024, the Corporation adopted ASU 2023-02, which expanded the permitted use of the proportional amortization method to certain tax credit investments.
|
|
|
|
|
|
|
|
|
|
|
|
|
|
|
|
|
|
|
|
|
|
|
|
|
|
|
|
|
|
|
|
|
|
|
|
| BUSINESS SEGMENT FINANCIAL RESULTS (unaudited) |
| Comerica Incorporated and Subsidiaries |
|
|
|
|
|
|
|
|
|
|
|
|
|
|
|
|
|
|
|
|
|
|
| (dollar amounts in millions) |
Commercial Bank |
|
Retail Bank |
|
Wealth Management |
|
Finance |
|
Other |
|
Total |
| Three Months Ended March 31, 2025 |
|
|
|
|
|
| Earnings summary: |
|
|
|
|
|
|
|
|
|
|
|
| Net interest income (expense) |
$ |
472 |
|
|
$ |
254 |
|
|
$ |
48 |
|
|
$ |
(240) |
|
|
$ |
41 |
|
|
$ |
575 |
|
| Provision for credit losses |
31 |
|
|
(5) |
|
|
(6) |
|
|
— |
|
|
— |
|
|
20 |
|
| Noninterest income |
135 |
|
|
26 |
|
|
71 |
|
|
23 |
|
|
(1) |
|
|
254 |
|
| Noninterest expenses |
267 |
|
|
180 |
|
|
97 |
|
|
1 |
|
|
39 |
|
|
584 |
|
| Provision (benefit) for income taxes |
71 |
|
|
26 |
|
|
7 |
|
|
(52) |
|
|
1 |
|
|
53 |
|
| Net income (loss) |
$ |
238 |
|
|
$ |
79 |
|
|
$ |
21 |
|
|
$ |
(166) |
|
|
$ |
— |
|
|
$ |
172 |
|
| Net charge-offs |
$ |
26 |
|
|
$ |
— |
|
|
$ |
— |
|
|
$ |
— |
|
|
$ |
— |
|
|
$ |
26 |
|
| Selected average balances: |
|
|
|
|
|
|
|
|
|
|
|
| Assets |
$ |
44,960 |
|
|
$ |
3,053 |
|
|
$ |
5,170 |
|
|
$ |
17,433 |
|
|
$ |
6,942 |
|
|
$ |
77,558 |
|
| Loans |
42,850 |
|
|
2,380 |
|
|
4,984 |
|
|
— |
|
|
— |
|
|
50,214 |
|
| Deposits |
32,750 |
|
|
23,638 |
|
|
3,620 |
|
|
1,633 |
|
|
258 |
|
|
61,899 |
|
|
|
|
|
|
|
|
|
|
|
|
|
|
Commercial Bank |
|
Retail Bank |
|
Wealth Management |
|
Finance |
|
Other |
|
Total |
| Three Months Ended December 31, 2024 |
|
|
|
|
|
| Earnings summary: |
|
|
|
|
|
|
|
|
|
|
|
| Net interest income (expense) |
$ |
463 |
|
|
$ |
204 |
|
|
$ |
47 |
|
|
$ |
(181) |
|
|
$ |
42 |
|
|
$ |
575 |
|
| Provision for credit losses |
25 |
|
|
(2) |
|
|
(4) |
|
|
— |
|
|
2 |
|
|
21 |
|
| Noninterest income |
150 |
|
|
27 |
|
|
71 |
|
|
2 |
|
|
— |
|
|
250 |
|
| Noninterest expenses |
272 |
|
|
174 |
|
|
98 |
|
|
1 |
|
|
42 |
|
|
587 |
|
| Provision (benefit) for income taxes |
70 |
|
|
14 |
|
|
5 |
|
|
(44) |
|
|
2 |
|
|
47 |
|
| Net income (loss) |
$ |
246 |
|
|
$ |
45 |
|
|
$ |
19 |
|
|
$ |
(136) |
|
|
$ |
(4) |
|
|
$ |
170 |
|
| Net charge-offs (recoveries) |
$ |
15 |
|
|
$ |
1 |
|
|
$ |
— |
|
|
$ |
— |
|
|
$ |
— |
|
|
$ |
16 |
|
| Selected average balances: |
|
|
|
|
|
|
|
|
|
|
|
| Assets |
$ |
45,445 |
|
|
$ |
3,055 |
|
|
$ |
5,201 |
|
|
$ |
17,825 |
|
|
$ |
7,708 |
|
|
$ |
79,234 |
|
| Loans |
43,258 |
|
|
2,374 |
|
|
4,982 |
|
|
— |
|
|
3 |
|
|
50,617 |
|
| Deposits |
33,313 |
|
|
23,964 |
|
|
3,882 |
|
|
1,946 |
|
|
242 |
|
|
63,347 |
|
|
|
|
|
|
|
|
|
|
|
|
|
|
Commercial Bank |
|
Retail Bank |
|
Wealth Management |
|
Finance |
|
Other |
|
Total |
| Three Months Ended March 31, 2024 |
|
|
|
|
|
| Earnings summary: |
|
|
|
|
|
|
|
|
|
|
|
| Net interest income (expense) |
$ |
477 |
|
|
$ |
200 |
|
|
$ |
47 |
|
|
$ |
(217) |
|
|
$ |
41 |
|
|
$ |
548 |
|
| Provision for credit losses |
16 |
|
|
(1) |
|
|
1 |
|
|
— |
|
|
(2) |
|
|
14 |
|
| Noninterest income |
148 |
|
|
28 |
|
|
65 |
|
|
(11) |
|
|
6 |
|
|
236 |
|
| Noninterest expenses |
275 |
|
|
182 |
|
|
96 |
|
|
2 |
|
|
48 |
|
|
603 |
|
| Provision (benefit) for income taxes |
56 |
|
|
8 |
|
|
2 |
|
|
(41) |
|
|
4 |
|
|
29 |
|
| Net income (loss) |
$ |
278 |
|
|
$ |
39 |
|
|
$ |
13 |
|
|
$ |
(189) |
|
|
$ |
(3) |
|
|
$ |
138 |
|
| Net charge-offs |
$ |
14 |
|
|
$ |
— |
|
|
$ |
— |
|
|
$ |
— |
|
|
$ |
— |
|
|
$ |
14 |
|
| Selected average balances: |
|
|
|
|
|
|
|
|
|
|
|
| Assets |
$ |
46,485 |
|
|
$ |
3,026 |
|
|
$ |
5,443 |
|
|
$ |
19,057 |
|
|
$ |
9,606 |
|
|
$ |
83,617 |
|
| Loans |
43,911 |
|
|
2,297 |
|
|
5,152 |
|
|
— |
|
|
12 |
|
|
51,372 |
|
| Deposits |
32,212 |
|
|
24,384 |
|
|
3,900 |
|
|
4,539 |
|
|
275 |
|
|
65,310 |
|
|
|
|
|
|
|
|
|
|
|
|
|
|
|
|
|
|
|
| RECONCILIATIONS OF NON-GAAP FINANCIAL MEASURES AND REGULATORY RATIOS (unaudited) |
| Comerica Incorporated and Subsidiaries |
|
|
|
|
|
|
|
|
|
|
Comerica believes non-GAAP measures are meaningful because they reflect adjustments commonly made by management, investors, regulators and analysts to evaluate the adequacy of common equity and performance trends. Common equity tier 1 capital ratio removes preferred stock from the Tier 1 capital ratio as defined by and calculated in conformity with bank regulations. Tangible common equity is used by Comerica to measure the quality of capital and the return relative to balance sheet risk. The tangible common equity ratio removes the effect of intangible assets from capital and total assets. Tangible common equity per share of common stock removes the effect of intangible assets from common shareholders' equity per share of common stock.
|
|
|
|
|
|
|
|
|
|
|
|
|
March 31, |
December 31, |
March 31, |
| (in millions, except share data) |
2025 |
2024 |
2024 |
| Common Equity Tier 1 Capital (a): |
|
|
|
| Tier 1 capital |
$ |
9,106 |
|
$ |
9,061 |
|
$ |
8,863 |
|
| Less: |
|
|
|
| Fixed-rate reset non-cumulative perpetual preferred stock |
394 |
|
394 |
|
394 |
|
| Common equity tier 1 capital |
$ |
8,712 |
|
$ |
8,667 |
|
$ |
8,469 |
|
| Risk-weighted assets |
$ |
72,283 |
|
$ |
72,903 |
|
$ |
73,794 |
|
| Tier 1 capital ratio |
12.60 |
% |
12.43 |
% |
12.01 |
% |
| Common equity tier 1 capital ratio |
12.05 |
|
11.89 |
|
11.48 |
|
| Tangible Common Equity: |
|
|
|
| Total shareholders' equity |
$ |
7,052 |
|
$ |
6,543 |
|
$ |
6,050 |
|
| Less: |
|
|
|
| Fixed-rate reset non-cumulative perpetual preferred stock |
394 |
|
394 |
|
394 |
|
| Common shareholders' equity |
$ |
6,658 |
|
$ |
6,149 |
|
$ |
5,656 |
|
| Less: |
|
|
|
| Goodwill |
635 |
|
635 |
|
635 |
|
| Other intangible assets |
6 |
|
6 |
|
8 |
|
| Tangible common equity |
$ |
6,017 |
|
$ |
5,508 |
|
$ |
5,013 |
|
| Total assets |
$ |
77,622 |
|
$ |
79,297 |
|
$ |
79,444 |
|
| Less: |
|
|
|
| Goodwill |
635 |
|
635 |
|
635 |
|
| Other intangible assets |
6 |
|
6 |
|
8 |
|
| Tangible assets |
$ |
76,981 |
|
$ |
78,656 |
|
$ |
78,801 |
|
| Common equity ratio |
8.58 |
% |
7.75 |
% |
7.12 |
% |
| Tangible common equity ratio |
7.82 |
|
7.00 |
|
6.36 |
|
| Tangible Common Equity per Share of Common Stock: |
|
|
|
| Common shareholders' equity |
$ |
6,658 |
|
$ |
6,149 |
|
$ |
5,656 |
|
| Tangible common equity |
6,017 |
|
5,508 |
|
5,013 |
|
| Shares of common stock outstanding (in millions) |
131 |
|
131 |
|
133 |
|
| Common shareholders' equity per share of common stock |
$ |
50.73 |
|
$ |
46.79 |
|
$ |
42.69 |
|
| Tangible common equity per share of common stock |
45.85 |
|
41.91 |
|
37.84 |
|
|
|
|
|
|
|
|
|
|
|
|
|
|
|
|
|
|
|
|
|
|
|
|
|
(a)March 31, 2025 ratios are estimated.
Total uninsured deposits as calculated per regulatory guidance and reported on schedule RC-O of Comerica Bank’s Call Report include affiliate deposits, which by definition have a different risk profile than other uninsured deposits. The amounts presented below remove affiliate deposits from the total uninsured deposits number. Comerica believes that the presentation of uninsured deposits adjusted for the impact of affiliate deposits provides enhanced clarity of uninsured deposits at risk.
|
|
|
|
|
|
|
|
|
|
|
|
|
March 31, |
December 31, |
March 31, |
| (dollar amounts in millions) |
2025 |
2024 |
2024 |
| Uninsured Deposits: |
|
|
|
| Total uninsured deposits, as calculated per regulatory guidelines |
$ |
32,291 |
|
$ |
33,387 |
|
$ |
30,481 |
|
| Less: |
|
|
|
| Affiliate deposits |
(3,844) |
|
(3,876) |
|
(3,966) |
|
| Total uninsured deposits, excluding affiliate deposits |
$ |
28,447 |
|
$ |
29,511 |
|
$ |
26,515 |
|
|
|
|
|

