☐ |
Written communications pursuant to Rule 425 under the Securities Act (17 CFR 230.425) |
||||
☐ |
Soliciting material pursuant to Rule 14a-12 under the Exchange Act (17 CFR 240.14a-12) |
||||
☐ |
Pre-commencement communications pursuant to Rule 14d-2(b) under the Exchange Act (17 CFR 240.14d-2(b)) |
||||
☐ |
Pre-commencement communications pursuant to Rule 13e-4(c) under the Exchange Act (17 CFR 240.13e-4(c)) |
||||
| Title of each class | Trading Symbol(s) | Name of each exchange on which registered | |||||||||||||||
| Common Stock, $1 par value per share | CUZ | New York Stock Exchange | ("NYSE") | ||||||||||||||
| By: | /s/ Gregg D. Adzema | ||||
| TABLE OF CONTENTS | ||||||||
| Forward-Looking Statements | |||||
Key Performance Metrics |
|||||
Portfolio Statistics |
|||||
Same Property Performance |
|||||
Office Leasing Activity |
|||||
Top 20 Office Tenants |
|||||
Debt Schedule |
|||||
| Cousins Properties | 1 |
Q3 2023 Supplemental Information | ||||||
| FORWARD-LOOKING STATEMENTS | ||||||||
| Cousins Properties | 2 |
Q3 2023 Supplemental Information | ||||||
| EARNINGS RELEASE | ||||||||
| Cousins Properties | 3 |
Q3 2023 Supplemental Information | ||||||
| EARNINGS RELEASE | ||||||||
| Cousins Properties | 4 |
Q3 2023 Supplemental Information | ||||||
| COMPANY INFORMATION | ||||||||
| M. Colin Connolly | Gregg D. Adzema | Kennedy Hicks | Richard G. Hickson IV | ||||||||
| President & Chief Executive Officer | Executive Vice President & Chief Financial Officer | Executive Vice President, Chief Investment Officer & Managing Director | Executive Vice President, Operations | ||||||||
| John S. McColl | Pamela F. Roper | Jeffrey D. Symes | |||||||||
| Executive Vice President, Development | Executive Vice President, General Counsel & Corporate Secretary | Senior Vice President & Chief Accounting Officer |
|||||||||
| Robert M. Chapman | Charles T. Cannada | M. Colin Connolly | ||||||
| Non-executive Chairman of Cousins Properties, Chief Executive Officer of Centerpoint Properties Trust | Private Investor | President and Chief Executive Officer of Cousins Properties | ||||||
| Scott W. Fordham | Lillian C. Giornelli | R. Kent Griffin Jr. | ||||||
| Former Chief Executive Officer and Director of TIER REIT, Inc. |
Chairman, Chief Executive Officer and Trustee of The Cousins Foundation Inc. |
Managing Director of Phicas Investors | ||||||
| Donna W. Hyland | Dionne Nelson | R. Dary Stone | ||||||
| President and Chief Executive Officer of Children's Healthcare of Atlanta |
President and Chief Executive Officer of Laurel Street Residential |
President and Chief Executive Officer of R.D. Stone Interests | ||||||
| Barclays | BofA Securities | BMO Capital | Evercore ISI | Green Street | |||||||||||||||||||
| Anthony Powell 212.526.8768 | Camille Bonnel 646.855.5042 |
John Kim 212.885.4115 |
Steve Sakwa 212.446.9462 |
Dylan Burzinski 949.640.8780 |
|||||||||||||||||||
| Jefferies | J.P. Morgan | KeyBanc | Mizuho Securities | RW Baird | |||||||||||||||||||
| Peter Abramowitz 212.336.7241 |
Anthony Paolone 212.622.6682 |
Upal Rana 917.368.2316 |
Vikram Malhotra 212.282.3827 |
Nicholas Thillman 414.298.5053 |
|||||||||||||||||||
| Truist Securities | Wells Fargo | Wolfe Research | |||||||||||||||||||||
| Michael Lewis 212.319.5659 |
Blaine Heck 443.263.6529 |
Andrew Rosivach 646.582.9250 |
|||||||||||||||||||||
| Cousins Properties | 5 |
Q3 2023 Supplemental Information | ||||||
| CONSOLIDATED BALANCE SHEETS | ||||||||
| September 30, 2023 | December 31, 2022 | ||||||||||
| Assets: | |||||||||||
| Real estate assets: | |||||||||||
| Operating properties, net of accumulated depreciation of $1,258,003 and $1,079,662 in 2023 and 2022, respectively | $ | 6,730,434 | $ | 6,738,354 | |||||||
| Projects under development | 126,630 | 111,400 | |||||||||
| Land | 154,729 | 158,430 | |||||||||
| 7,011,793 | 7,008,184 | ||||||||||
| Cash and cash equivalents | 6,926 | 5,145 | |||||||||
| Accounts receivable | 12,867 | 8,653 | |||||||||
| Deferred rents receivable | 203,561 | 184,043 | |||||||||
| Investment in unconsolidated joint ventures | 141,250 | 112,839 | |||||||||
| Intangible assets, net | 116,092 | 136,240 | |||||||||
| Other assets, net | 92,820 | 81,912 | |||||||||
| Total assets | $ | 7,585,309 | $ | 7,537,016 | |||||||
| Liabilities: | |||||||||||
| Notes payable | $ | 2,418,403 | $ | 2,334,606 | |||||||
| Accounts payable and accrued expenses | 266,632 | 271,103 | |||||||||
| Deferred income | 174,178 | 128,636 | |||||||||
| Intangible liabilities, net | 44,295 | 52,280 | |||||||||
| Other liabilities | 104,495 | 103,442 | |||||||||
| Total liabilities | 3,008,003 | 2,890,067 | |||||||||
| Commitments and contingencies | |||||||||||
| Equity: | |||||||||||
| Stockholders' investment: | |||||||||||
| Common stock, $1 par value per share, 300,000,000 shares authorized, 154,335,798 and 154,019,214 issued, and 151,773,774 and 151,457,190 outstanding in 2023 and 2022, respectively | 154,336 | 154,019 | |||||||||
| Additional paid-in capital | 5,637,406 | 5,630,327 | |||||||||
| Treasury stock at cost, 2,562,024 shares in 2023 and 2022 | (147,157) | (147,157) | |||||||||
| Distributions in excess of cumulative net income | (1,095,597) | (1,013,292) | |||||||||
| Accumulated other comprehensive income | 5,723 | 1,767 | |||||||||
| Total stockholders' investment | 4,554,711 | 4,625,664 | |||||||||
| Nonredeemable noncontrolling interests | 22,595 | 21,285 | |||||||||
| Total equity | 4,577,306 | 4,646,949 | |||||||||
| Total liabilities and equity | $ | 7,585,309 | $ | 7,537,016 | |||||||
| Cousins Properties | 6 |
Q3 2023 Supplemental Information | ||||||
| CONSOLIDATED STATEMENTS OF OPERATIONS | ||||||||
| Three Months Ended | Nine Months Ended | |||||||||||||||||||||||||
| September 30, | September 30, | |||||||||||||||||||||||||
| 2023 | 2022 | 2023 | 2022 | |||||||||||||||||||||||
| Revenues: | ||||||||||||||||||||||||||
| Rental property revenues | $ | 198,429 | $ | 193,455 | $ | 602,459 | $ | 559,856 | ||||||||||||||||||
| Fee income | 318 | 1,677 | 1,044 | 5,370 | ||||||||||||||||||||||
| Other | 101 | 38 | 2,393 | 2,522 | ||||||||||||||||||||||
| 198,848 | 195,170 | 605,896 | 567,748 | |||||||||||||||||||||||
| Expenses: | ||||||||||||||||||||||||||
| Rental property operating expenses | 64,838 | 66,632 | 203,150 | 193,725 | ||||||||||||||||||||||
| Reimbursed expenses | 149 | 418 | 515 | 1,455 | ||||||||||||||||||||||
| General and administrative expenses | 8,336 | 6,498 | 24,795 | 21,557 | ||||||||||||||||||||||
| Interest expense | 27,008 | 18,380 | 78,010 | 50,454 | ||||||||||||||||||||||
| Depreciation and amortization | 79,492 | 79,116 | 235,531 | 219,721 | ||||||||||||||||||||||
| Other | 623 | 231 | 1,484 | 877 | ||||||||||||||||||||||
| 180,446 | 171,275 | 543,485 | 487,789 | |||||||||||||||||||||||
| Income from unconsolidated joint ventures | 582 | 634 | 2,008 | 7,038 | ||||||||||||||||||||||
| Gain on sales of investments in unconsolidated joint ventures | — | 56,260 | — | 56,260 | ||||||||||||||||||||||
| Gain (loss) on investment property transactions | 507 | (20) | 505 | (61) | ||||||||||||||||||||||
| Loss on extinguishment of debt | — | — | — | (100) | ||||||||||||||||||||||
| Net income | 19,491 | 80,769 | 64,924 | 143,096 | ||||||||||||||||||||||
| Net income attributable to noncontrolling interests | (130) | (130) | (746) | (421) | ||||||||||||||||||||||
| Net income available to common stockholders | $ | 19,361 | $ | 80,639 | $ | 64,178 | $ | 142,675 | ||||||||||||||||||
| Net income per common share — basic and diluted | $ | 0.13 | $ | 0.53 | $ | 0.42 | $ | 0.95 | ||||||||||||||||||
| Weighted average shares — basic | 151,774 | 151,435 | 151,692 | 149,670 | ||||||||||||||||||||||
| Weighted average shares — diluted | 152,048 | 151,695 | 152,018 | 149,946 | ||||||||||||||||||||||
| Cousins Properties | 7 |
Q3 2023 Supplemental Information | ||||||
| KEY PERFORMANCE METRICS (1) | ||||||||
| 2021 | 2022 1st | 2022 2nd | 2022 3rd | 2022 4th | 2022 | 2023 1st | 2023 2nd | 2023 3rd | YTD 2023 | |||||||||||||||||||||||
| Property Statistics | ||||||||||||||||||||||||||||||||
| Consolidated Operating Properties | 32 | 33 | 33 | 33 | 34 | 34 | 34 | 34 | 34 | 34 | ||||||||||||||||||||||
| Consolidated Rentable Square Feet (in thousands) | 17,758 | 18,136 | 18,136 | 18,136 | 18,424 | 18,424 | 18,444 | 18,444 | 18,434 | 18,434 | ||||||||||||||||||||||
| Unconsolidated Operating Properties | 3 | 3 | 3 | 2 | 2 | 2 | 2 | 2 | 2 | 2 | ||||||||||||||||||||||
| Unconsolidated Rentable Square Feet (in thousands) | 1,179 | 1,179 | 1,179 | 711 | 711 | 711 | 711 | 711 | 711 | 711 | ||||||||||||||||||||||
| Total Operating Properties | 35 | 36 | 36 | 35 | 36 | 36 | 36 | 36 | 36 | 36 | ||||||||||||||||||||||
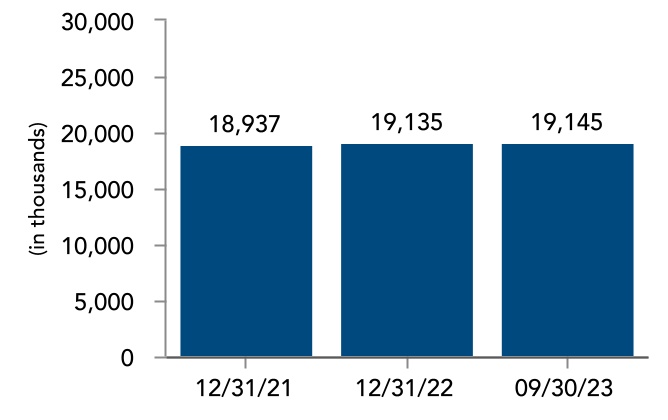
| Total Rentable Square Feet (in thousands) | 18,937 | 19,315 | 19,315 | 18,847 | 19,135 | 19,135 | 19,155 | 19,155 | 19,145 | 19,145 | ||||||||||||||||||||||
| Office Percent Leased (period end) | 91.5 | % | 90.5 | % | 90.1 | % | 90.1 | % | 91.0 | % | 91.0 | % | 90.8 | % | 90.8 | % | 91.1 | % | 91.1 | % | ||||||||||||
| Office Weighted Average Occupancy | 90.4 | % | 87.4 | % | 87.5 | % | 87.3 | % | 87.1 | % | 87.3 | % | 87.2 | % | 87.7 | % | 88.0 | % | 87.6 | % | ||||||||||||
| Office Leasing Activity (2) | ||||||||||||||||||||||||||||||||
| Net Leased during the Period (SF, in thousands) | 2,096 | 324 | 588 | 431 | 632 | 1,976 | 258 | 435 | 548 | 1,241 | ||||||||||||||||||||||
| Net Rent (per SF) | $35.24 | $35.45 | $32.34 | $35.49 | $34.04 | $34.08 | $34.45 | $38.65 | $33.94 | $35.70 | ||||||||||||||||||||||
| Net Free Rent (per SF) | (1.45) | (2.36) | (0.99) | (1.97) | (2.69) | (1.97) | (2.07) | (2.04) | (2.27) | (2.15) | ||||||||||||||||||||||
| Leasing Commissions (per SF) | (2.77) | (3.01) | (2.65) | (2.86) | (2.60) | (2.74) | (2.83) | (2.53) | (2.60) | (2.62) | ||||||||||||||||||||||
| Tenant Improvements (per SF) | (5.47) | (6.34) | (5.33) | (5.69) | (6.61) | (5.98) | (6.29) | (5.88) | (5.30) | (5.71) | ||||||||||||||||||||||
| Leasing Costs (per SF) | (9.69) | (11.71) | (8.97) | (10.52) | (11.90) | (10.69) | (11.19) | (10.45) | (10.17) | (10.48) | ||||||||||||||||||||||
| Net Effective Rent (per SF) | $25.55 | $23.74 | $23.37 | $24.97 | $22.14 | $23.39 | $23.26 | $28.20 | $23.77 | $25.22 | ||||||||||||||||||||||
| Change in Second Generation Net Rent | 24.7 | % | 27.4 | % | 27.2 | % | 20.4 | % | 18.6 | % | 23.2 | % | 20.1 | % | 19.6 | % | 28.7 | % | 24.8 | % | ||||||||||||
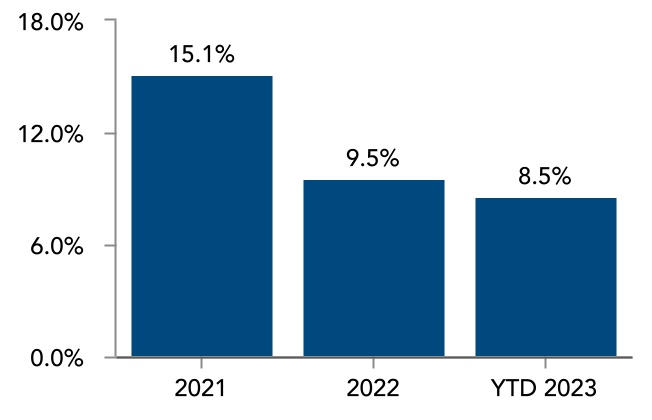
| Change in Cash-Basis Second Generation Net Rent | 15.1 | % | 15.4 | % | 11.6 | % | 4.8 | % | 7.3 | % | 9.5 | % | 6.1 | % | 7.9 | % | 9.8 | % | 8.5 | % | ||||||||||||
| Same Property Information (3) | ||||||||||||||||||||||||||||||||
| Percent Leased (period end) | 90.5 | % | 90.0 | % | 89.7 | % | 89.2 | % | 90.1 | % | 90.1 | % | 90.6 | % | 90.5 | % | 90.8 | % | 90.8 | % | ||||||||||||
| Weighted Average Occupancy | 90.0 | % | 87.0 | % | 86.9 | % | 86.6 | % | 86.2 | % | 86.6 | % | 87.0 | % | 87.3 | % | 87.3 | % | 87.3 | % | ||||||||||||
| Change in NOI (over prior year period) | (0.5) | % | (2.0) | % | (2.2) | % | 1.8 | % | 2.3 | % | 0.0 | % | 5.3 | % | 6.3 | % | 4.1 | % | 5.3 | % | ||||||||||||
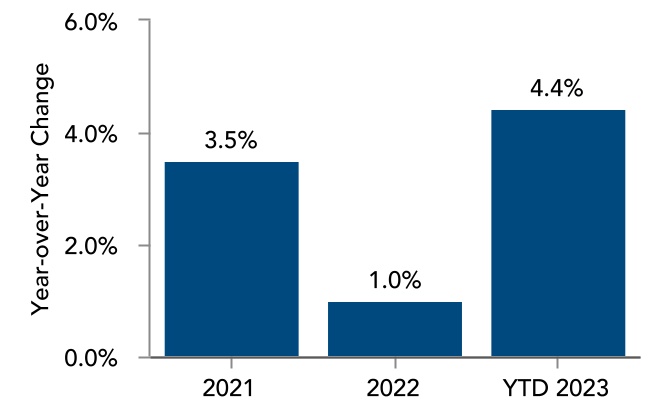
| Change in Cash-Basis NOI (over prior year period) | 3.5 | % | 0.1 | % | (0.2) | % | 1.5 | % | 2.5 | % | 1.0 | % | 4.9 | % | 3.7 | % | 4.6 | % | 4.4 | % | ||||||||||||
| Development Pipeline (4) | ||||||||||||||||||||||||||||||||
| Estimated Project Costs (in thousands) | $759,000 | $566,000 | $566,000 | $568,900 | $428,500 | $428,500 | $428,500 | $428,500 | $428,500 | $428,500 | ||||||||||||||||||||||
| Estimated Project Costs/Total Undepreciated Assets | 8.9 | % | 6.6 | % | 6.5 | % | 6.5 | % | 4.8 | % | 4.8 | % | 4.8 | % | 4.7 | % | 4.7 | % | 4.7 | % | ||||||||||||
| Continued on next page | ||||||||||||||||||||||||||||||||
| Cousins Properties | 8 |
Q3 2023 Supplemental Information | ||||||
| KEY PERFORMANCE METRICS (1) | ||||||||
| 2021 | 2022 1st | 2022 2nd | 2022 3rd | 2022 4th | 2022 | 2023 1st | 2023 2nd | 2023 3rd | YTD 2023 | |||||||||||||||||||||||
| Market Capitalization | ||||||||||||||||||||||||||||||||
| Common Stock Price Per Share | $40.28 | $40.29 | $29.23 | $23.35 | $25.29 | $25.29 | $21.38 | $22.80 | $20.37 | $20.37 | ||||||||||||||||||||||
| Common Stock/Units Outstanding (in thousands) | 148,713 | 148,788 | 151,465 | 151,459 | 151,482 | 151,482 | 151,718 | 151,774 | 151,774 | 151,774 | ||||||||||||||||||||||
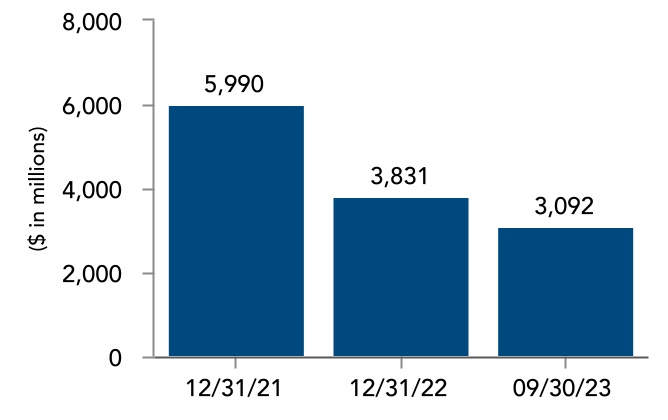
| Equity Market Capitalization (in thousands) | $5,990,160 | $5,994,669 | $4,427,322 | $3,536,568 | $3,830,980 | $3,830,980 | $3,243,731 | $3,460,447 | $3,091,636 | $3,091,636 | ||||||||||||||||||||||
| Debt (in thousands) | 2,350,314 | 2,462,197 | 2,425,339 | 2,372,931 | 2,424,004 | 2,424,004 | 2,544,956 | 2,548,073 | 2,559,871 | 2,559,871 | ||||||||||||||||||||||
| Total Market Capitalization (in thousands) | $8,340,474 | $8,456,866 | $6,852,661 | $5,909,499 | $6,254,984 | $6,254,984 | $5,788,687 | $6,008,520 | $5,651,507 | $5,651,507 | ||||||||||||||||||||||
| Credit Ratios | ||||||||||||||||||||||||||||||||
| Net Debt/Total Market Capitalization | 28.0 | % | 28.9 | % | 35.1 | % | 39.9 | % | 38.6 | % | 38.6 | % | 43.7 | % | 42.1 | % | 45.0 | % | 45.0 | % | ||||||||||||
| Net Debt/Total Undepreciated Assets | 27.5 | % | 28.4 | % | 27.7 | % | 26.7 | % | 27.2 | % | 27.2 | % | 28.1 | % | 27.8 | % | 27.8 | % | 27.8 | % | ||||||||||||
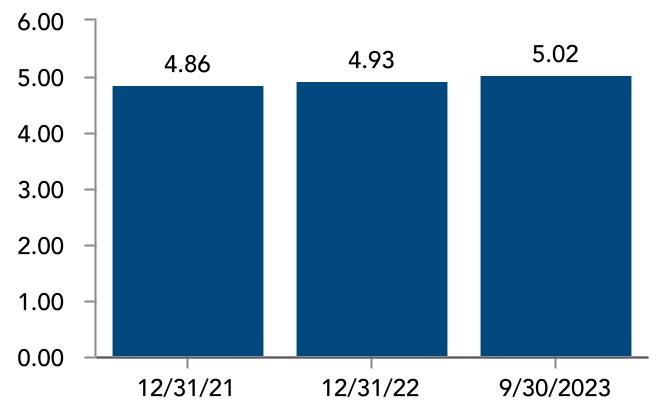
Net Debt/Annualized EBITDAre |
4.86 | 5.28 | 4.93 | 4.75 | 4.93 | 4.93 | 5.13 | 4.89 | 5.02 | 5.02 | ||||||||||||||||||||||
Fixed Charges Coverage (EBITDAre) |
5.45 | 5.56 | 5.56 | 5.13 | 4.72 | 5.21 | 4.48 | 4.53 | 4.28 | 4.43 | ||||||||||||||||||||||
| Dividend Information | ||||||||||||||||||||||||||||||||
| Common Dividend per Share | $1.24 | $0.32 | $0.32 | $0.32 | $0.32 | $1.28 | $0.32 | $0.32 | $0.32 | $0.96 | ||||||||||||||||||||||
| Funds From Operations (FFO) Payout Ratio | 45.3 | % | 48.7 | % | 46.3 | % | 46.4 | % | 48.4 | % | 47.4 | % | 49.5 | % | 47.3 | % | 49.2 | % | 48.6 | % | ||||||||||||
| Funds Available for Distribution (FAD) Payout Ratio | 63.1 | % | 65.7 | % | 69.0 | % | 72.2 | % | 76.6 | % | 70.6 | % | 65.3 | % | 71.8 | % | 70.1 | % | 69.0 | % | ||||||||||||
| Operations Ratio | ||||||||||||||||||||||||||||||||
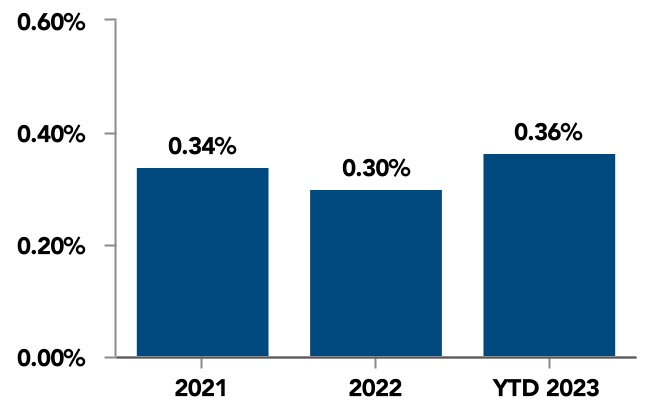
| Annualized General and Administrative Expenses/ Total Undepreciated Assets | 0.34 | % | 0.38 | % | 0.32 | % | 0.29 | % | 0.30 | % | 0.30 | % | 0.37 | % | 0.35 | % | 0.36 | % | 0.36 | % | ||||||||||||
| Additional Information | ||||||||||||||||||||||||||||||||
| In-Place Gross Rent (per SF) (5) | $42.85 | $43.90 | $44.39 | $44.85 | $44.87 | $44.87 | $46.02 | $46.43 | $46.64 | $46.64 | ||||||||||||||||||||||
| Straight-Line Rental Revenue (in thousands) | $25,503 | $5,501 | $6,378 | $8,966 | $8,108 | $28,953 | $8,431 | $3,703 | $7,508 | $19,642 | ||||||||||||||||||||||
|
Above and Below Market Rents Amortization, Net
(in thousands)
|
$8,392 | $1,771 | $1,669 | $1,538 | $1,466 | $6,444 | $1,559 | $2,525 | $1,371 | $5,455 | ||||||||||||||||||||||
|
Second Generation Capital Expenditures
(in thousands)
|
$81,642 | $21,280 | $24,324 | $26,636 | $27,261 | $99,501 | $15,467 | $29,317 | $20,224 | $65,008 | ||||||||||||||||||||||
| (1) | For Non-GAAP Financial Measures, see the calculations and reconciliations on pages 31-38. | ||||
| (2) | See Office Leasing Activity on page 19 for additional detail and explanations. | ||||
| (3) | Same Property Information is derived from the pool of same office properties that existed in the period as originally reported. See Same Property Performance on page 18 and Non-GAAP Financial Measures - Calculations and Reconciliations on page 31 for additional information. |
||||
| (4) | The Company's share of estimated project costs. See Development Pipeline on page 25 for additional detail. | ||||
| (5) | In-place gross rent equals the annualized cash rent including the tenant's share of estimated operating expenses, if applicable, as of the end of the period divided by occupied square feet. | ||||
| Cousins Properties | 9 |
Q3 2023 Supplemental Information | ||||||
| KEY PERFORMANCE METRICS | ||||||||
| Cousins Properties | 10 |
Q3 2023 Supplemental Information | ||||||
| FUNDS FROM OPERATIONS - SUMMARY | ||||||||
| (amounts in thousands, except per share amounts) | ||||||||||||||||||||||||||||||||
| 2021 | 2022 1st | 2022 2nd | 2022 3rd | 2022 4th | 2022 | 2023 1st | 2023 2nd | 2023 3rd | YTD 2023 | |||||||||||||||||||||||
| Net Income | $ | 278,996 | $ | 28,163 | $ | 34,164 | $ | 80,769 | $ | 24,349 | $ | 167,445 | $ | 22,356 | $ | 23,077 | $ | 19,491 | $ | 64,924 | ||||||||||||
| Fee and Other Income | (21,115) | (5,133) | (2,955) | (1,957) | (1,198) | (11,243) | (2,788) | (6,936) | (690) | (10,414) | ||||||||||||||||||||||
| General and Administrative Expenses | 29,321 | 8,063 | 6,996 | 6,498 | 6,762 | 28,319 | 8,438 | 8,021 | 8,336 | 24,795 | ||||||||||||||||||||||
| Interest Expense | 67,027 | 15,525 | 16,549 | 18,380 | 22,083 | 72,537 | 25,030 | 25,972 | 27,008 | 78,010 | ||||||||||||||||||||||
| Depreciation and Amortization | 288,092 | 70,744 | 69,861 | 79,116 | 75,866 | 295,587 | 75,770 | 80,269 | 79,492 | 235,531 | ||||||||||||||||||||||
| Reimbursed and Other Expenses | 4,607 | 581 | 1,102 | 649 | 1,826 | 4,158 | 592 | 635 | 772 | 1,999 | ||||||||||||||||||||||
| Income from Unconsolidated Joint Ventures | (6,801) | (1,124) | (5,280) | (634) | (662) | (7,700) | (673) | (753) | (582) | (2,008) | ||||||||||||||||||||||
| NOI from Unconsolidated Joint Ventures | 19,223 | 2,719 | 2,542 | 2,819 | 1,444 | 9,524 | 1,409 | 1,559 | 1,564 | 4,532 | ||||||||||||||||||||||
| Transaction Loss (Gain) | (165,630) | 69 | 72 | (56,240) | (328) | (56,427) | 2 | — | (507) | (505) | ||||||||||||||||||||||
| NOI (1) | $ | 493,720 | $ | 119,607 | $ | 123,051 | $ | 129,400 | $ | 130,142 | $ | 502,200 | $ | 130,136 | $ | 131,844 | $ | 134,884 | $ | 396,864 | ||||||||||||
| Fee and Other Income (1) | 21,362 | 5,168 | 3,046 | 2,013 | 1,232 | 11,459 | 2,825 | 6,974 | 725 | 10,524 | ||||||||||||||||||||||
| General and Administrative Expenses | (29,321) | (8,063) | (6,996) | (6,498) | (6,762) | (28,319) | (8,438) | (8,021) | (8,336) | (24,795) | ||||||||||||||||||||||
| Interest Expense (1) | (69,937) | (16,142) | (17,238) | (19,390) | (22,370) | (75,140) | (25,310) | (26,334) | (27,516) | (79,160) | ||||||||||||||||||||||
| Reimbursed and Other Expenses (1) | (4,652) | (594) | (1,216) | (667) | (1,580) | (4,057) | (605) | (642) | (795) | (2,042) | ||||||||||||||||||||||
| Gain (Loss) on Sales of Undepreciated Investment Properties | (64) | — | 4,500 | (22) | — | 4,478 | — | — | 507 | 507 | ||||||||||||||||||||||
| Depreciation and Amortization of Non-Real Estate Assets | (623) | (155) | (158) | (138) | (107) | (558) | (108) | (111) | (113) | (332) | ||||||||||||||||||||||
| Partners' Share of FFO in Consolidated Joint Ventures | (1,284) | (396) | (258) | (288) | (362) | (1,304) | (406) | (759) | (384) | (1,549) | ||||||||||||||||||||||
| FFO (1) | $ | 409,201 | $ | 99,425 | $ | 104,731 | $ | 104,410 | $ | 100,193 | $ | 408,759 | $ | 98,094 | $ | 102,951 | $ | 98,972 | $ | 300,017 | ||||||||||||
| Weighted Average Shares - Diluted | 148,891 | 149,002 | 149,142 | 151,695 | 151,835 | 150,419 | 151,880 | 152,126 | 152,048 | 152,018 | ||||||||||||||||||||||
| FFO per Share (1) | $ | 2.75 | $ | 0.67 | $ | 0.70 | $ | 0.69 | $ | 0.66 | $ | 2.72 | $ | 0.65 | $ | 0.68 | $ | 0.65 | $ | 1.97 | ||||||||||||
| Cousins Properties | 11 |
Q3 2023 Supplemental Information | ||||||
| FUNDS FROM OPERATIONS - DETAIL (1) | ||||||||
| (amounts in thousands, except per share amounts) | ||||||||||||||||||||||||||||||||
| 2021 | 2022 1st | 2022 2nd | 2022 3rd | 2022 4th | 2022 | 2023 1st | 2023 2nd | 2023 3rd | YTD 2023 | |||||||||||||||||||||||
| NOI | ||||||||||||||||||||||||||||||||
| Consolidated Properties | ||||||||||||||||||||||||||||||||
| The Domain (2) | $ | 60,987 | $ | 15,443 | $ | 15,510 | $ | 18,478 | $ | 19,273 | $ | 68,704 | $ | 18,144 | $ | 18,466 | $ | 18,303 | $ | 54,913 | ||||||||||||
| Terminus (2) | 27,148 | 7,439 | 7,673 | 9,228 | 8,568 | 32,908 | 8,097 | 8,442 | 8,596 | 25,135 | ||||||||||||||||||||||
| Corporate Center (2) | 29,106 | 7,050 | 7,090 | 7,144 | 7,310 | 28,594 | 7,467 | 7,600 | 7,548 | 22,615 | ||||||||||||||||||||||
| Spring & 8th (2) | 29,413 | 7,424 | 7,282 | 7,352 | 7,361 | 29,419 | 7,361 | 7,372 | 7,270 | 22,003 | ||||||||||||||||||||||
| Hayden Ferry (2) | 24,528 | 6,133 | 5,990 | 6,094 | 6,087 | 24,304 | 5,934 | 4,323 | 6,106 | 16,363 | ||||||||||||||||||||||
| Buckhead Plaza (2) | 12,577 | 3,646 | 4,013 | 4,563 | 4,758 | 16,980 | 4,766 | 5,312 | 5,436 | 15,514 | ||||||||||||||||||||||
| Northpark (2) | 26,562 | 6,098 | 6,317 | 5,278 | 5,006 | 22,699 | 5,136 | 4,901 | 5,141 | 15,178 | ||||||||||||||||||||||
| 725 Ponce | 7,669 | 4,527 | 4,686 | 4,596 | 4,734 | 18,543 | 4,777 | 4,753 | 4,828 | 14,358 | ||||||||||||||||||||||
| Fifth Third Center | 18,592 | 4,229 | 4,340 | 4,675 | 4,431 | 17,675 | 4,732 | 4,726 | 4,840 | 14,298 | ||||||||||||||||||||||
| One Eleven Congress | 18,193 | 4,342 | 4,531 | 4,547 | 3,978 | 17,398 | 4,246 | 4,542 | 4,850 | 13,638 | ||||||||||||||||||||||
| 300 Colorado (3) | 1,130 | 3,275 | 3,050 | 2,762 | 4,033 | 13,120 | 3,772 | 4,608 | 5,166 | 13,546 | ||||||||||||||||||||||
| Avalon (2) | 14,381 | 3,637 | 3,969 | 4,156 | 4,165 | 15,927 | 4,243 | 4,145 | 4,326 | 12,714 | ||||||||||||||||||||||
| 3344 Peachtree | 14,927 | 3,966 | 3,931 | 3,848 | 3,946 | 15,691 | 3,992 | 4,107 | 4,112 | 12,211 | ||||||||||||||||||||||
| San Jacinto Center | 15,652 | 4,252 | 4,316 | 4,113 | 3,322 | 16,003 | 3,940 | 4,093 | 3,748 | 11,781 | ||||||||||||||||||||||
| The Terrace (2) | 16,713 | 3,133 | 3,583 | 3,225 | 3,472 | 13,413 | 3,698 | 3,903 | 4,036 | 11,637 | ||||||||||||||||||||||
| Colorado Tower | 13,060 | 3,155 | 2,746 | 3,226 | 3,325 | 12,452 | 3,282 | 3,740 | 4,152 | 11,174 | ||||||||||||||||||||||
| BriarLake Plaza (2) | 18,142 | 3,879 | 3,740 | 3,547 | 3,580 | 14,746 | 3,545 | 3,588 | 3,648 | 10,781 | ||||||||||||||||||||||
| 100 Mill | — | — | 1,405 | 2,550 | 3,343 | 7,298 | 3,603 | 3,575 | 3,352 | 10,530 | ||||||||||||||||||||||
| Promenade Tower | 14,933 | 2,968 | 2,901 | 2,867 | 3,434 | 12,170 | 3,377 | 3,483 | 3,568 | 10,428 | ||||||||||||||||||||||
| The RailYard | 12,496 | 3,153 | 3,258 | 3,255 | 3,234 | 12,900 | 3,332 | 3,308 | 3,296 | 9,936 | ||||||||||||||||||||||
| 550 South | 10,593 | 2,652 | 2,665 | 2,654 | 2,723 | 10,694 | 2,698 | 2,730 | 2,811 | 8,239 | ||||||||||||||||||||||
| Heights Union (2) | 1,303 | 1,641 | 1,461 | 2,033 | 3,177 | 8,312 | 2,338 | 2,525 | 2,669 | 7,532 | ||||||||||||||||||||||
| Legacy Union One | 9,466 | 2,357 | 2,342 | 2,355 | 2,367 | 9,421 | 2,364 | 2,366 | 2,348 | 7,078 | ||||||||||||||||||||||
| Domain Point (2) | 5,055 | 1,761 | 1,741 | 1,837 | 1,746 | 7,085 | 2,025 | 2,260 | 2,186 | 6,471 | ||||||||||||||||||||||
| 111 West Rio | 5,630 | 1,419 | 1,416 | 1,424 | 1,410 | 5,669 | 1,417 | 1,395 | 1,408 | 4,220 | ||||||||||||||||||||||
| 3350 Peachtree | 6,083 | 992 | 1,771 | 1,339 | 1,418 | 5,520 | 1,477 | 1,447 | 855 | 3,779 | ||||||||||||||||||||||
| Meridian Mark Plaza | 4,110 | 1,042 | 1,408 | 1,268 | 1,243 | 4,961 | 1,286 | 1,215 | 1,237 | 3,738 | ||||||||||||||||||||||
| 3348 Peachtree | 5,427 | 1,257 | 1,348 | 984 | 1,183 | 4,772 | 1,050 | 1,160 | 1,119 | 3,329 | ||||||||||||||||||||||
| Research Park V | 4,044 | 1,059 | 1,087 | 1,162 | 1,160 | 4,468 | 1,166 | 918 | 934 | 3,018 | ||||||||||||||||||||||
| Tempe Gateway | 6,086 | 1,423 | 1,057 | 1,077 | 716 | 4,273 | 819 | 957 | 1,084 | 2,860 | ||||||||||||||||||||||
| 5950 Sherry Lane | 4,549 | 951 | 849 | 841 | 828 | 3,469 | 861 | 852 | 886 | 2,599 | ||||||||||||||||||||||
| Promenade Central (4) | 9,026 | — | — | — | 224 | 224 | 716 | 775 | 1,084 | 2,575 | ||||||||||||||||||||||
| Harborview Plaza | 3,211 | 844 | 882 | 842 | 861 | 3,429 | 849 | 841 | 848 | 2,538 | ||||||||||||||||||||||
| The Pointe | 4,685 | 1,156 | 1,211 | 1,234 | 1,251 | 4,852 | 1,056 | 695 | 381 | 2,132 | ||||||||||||||||||||||
| Other (5) | 19,020 | 585 | 940 | 2,027 | 1,031 | 4,583 | 1,161 | 1,162 | 1,148 | 3,471 | ||||||||||||||||||||||
| Subtotal - Consolidated | 474,497 | 116,888 | 120,509 | 126,581 | 128,698 | 492,676 | 128,727 | 130,285 | 133,320 | 392,332 | ||||||||||||||||||||||
| Continued on next page | ||||||||||||||||||||||||||||||||
| Cousins Properties | 12 |
Q3 2023 Supplemental Information | ||||||
| FUNDS FROM OPERATIONS - DETAIL (1) | ||||||||
| (amounts in thousands, except per share amounts) | ||||||||||||||||||||||||||||||||
| 2021 | 2022 1st | 2022 2nd | 2022 3rd | 2022 4th | 2022 | 2023 1st | 2023 2nd | 2023 3rd | YTD 2023 | |||||||||||||||||||||||
| Unconsolidated Properties (6) | ||||||||||||||||||||||||||||||||
| Medical Offices at Emory Hospital | 4,332 | 1,112 | 1,152 | 1,126 | 1,141 | 4,531 | 1,054 | 1,203 | 1,161 | 3,418 | ||||||||||||||||||||||
| 120 West Trinity (2) | 827 | 301 | 305 | 350 | 346 | 1,302 | 326 | 338 | 389 | 1,053 | ||||||||||||||||||||||
| 300 Colorado (3) | 2,931 | — | — | — | — | — | — | — | — | — | ||||||||||||||||||||||
| Other (7) | 11,133 | 1,306 | 1,085 | 1,343 | (43) | 3,691 | 29 | 18 | 14 | 61 | ||||||||||||||||||||||
| Subtotal - Unconsolidated | 19,223 | 2,719 | 2,542 | 2,819 | 1,444 | 9,524 | 1,409 | 1,559 | 1,564 | 4,532 | ||||||||||||||||||||||
| Total Net Operating Income (1) | 493,720 | 119,607 | 123,051 | 129,400 | 130,142 | 502,200 | 130,136 | 131,844 | 134,884 | 396,864 | ||||||||||||||||||||||
| Fee and Other Income | ||||||||||||||||||||||||||||||||
| Development Fees | 12,081 | 817 | 1,404 | 957 | — | 3,178 | — | — | — | — | ||||||||||||||||||||||
| Management Fees (8) | 3,374 | 571 | 901 | 720 | 749 | 2,941 | 374 | 352 | 318 | 1,044 | ||||||||||||||||||||||
| Termination Fees | 5,105 | 1,462 | 449 | 242 | 311 | 2,464 | 136 | 6,570 | 271 | 6,977 | ||||||||||||||||||||||
| Termination Fees - Unconsolidated (6) | 81 | — | — | — | — | — | — | — | — | — | ||||||||||||||||||||||
| Leasing & Other Fees | 104 | — | — | — | — | — | — | — | — | — | ||||||||||||||||||||||
| Interest and Other Income | 450 | 2,283 | 201 | 38 | 138 | 2,660 | 2,278 | 14 | 101 | 2,393 | ||||||||||||||||||||||
| Interest and Other Income - Unconsolidated (6) | 167 | 35 | 91 | 56 | 34 | 216 | 37 | 38 | 35 | 110 | ||||||||||||||||||||||
| Total Fee and Other Income | 21,362 | 5,168 | 3,046 | 2,013 | 1,232 | 11,459 | 2,825 | 6,974 | 725 | 10,524 | ||||||||||||||||||||||
| General and Administrative Expenses | (29,321) | (8,063) | (6,996) | (6,498) | (6,762) | (28,319) | (8,438) | (8,021) | (8,336) | (24,795) | ||||||||||||||||||||||
| Interest Expense | ||||||||||||||||||||||||||||||||
| Consolidated Interest Expense | ||||||||||||||||||||||||||||||||
| Term Loan, Unsecured ($400M) | — | — | — | — | (4,936) | (4,936) | (5,856) | (6,158) | (6,306) | (18,320) | ||||||||||||||||||||||
| Term Loan, Unsecured ($350M) | (4,332) | (1,430) | (1,918) | (3,279) | (4,982) | (11,609) | (4,902) | (4,944) | (5,009) | (14,855) | ||||||||||||||||||||||
| Terminus (2) | (5,779) | (1,406) | (1,309) | (1,293) | (1,636) | (5,644) | (3,513) | (3,514) | (3,514) | (10,541) | ||||||||||||||||||||||
| Credit Facility, Unsecured | (5,602) | (1,795) | (2,585) | (3,533) | (1,846) | (9,759) | (3,054) | (3,583) | (3,589) | (10,226) | ||||||||||||||||||||||
| Senior Notes, Unsecured ($275M) | (10,975) | (2,744) | (2,744) | (2,743) | (2,744) | (10,975) | (2,744) | (2,744) | (2,743) | (8,231) | ||||||||||||||||||||||
| Senior Notes, Unsecured ($250M) | (9,958) | (2,490) | (2,489) | (2,490) | (2,489) | (9,958) | (2,490) | (2,489) | (2,490) | (7,469) | ||||||||||||||||||||||
| Senior Notes, Unsecured ($250M) | (9,764) | (2,441) | (2,441) | (2,441) | (2,441) | (9,764) | (2,441) | (2,441) | (2,441) | (7,323) | ||||||||||||||||||||||
| Senior Notes, Unsecured ($125M) | (4,789) | (1,197) | (1,198) | (1,197) | (1,197) | (4,789) | (1,197) | (1,197) | (1,198) | (3,592) | ||||||||||||||||||||||
| Fifth Third Center | (4,625) | (1,138) | (1,131) | (1,123) | (1,116) | (4,508) | (1,108) | (1,101) | (1,094) | (3,303) | ||||||||||||||||||||||
| Senior Notes, Unsecured ($100M) | (4,145) | (1,036) | (1,037) | (1,036) | (1,036) | (4,145) | (1,036) | (1,036) | (1,037) | (3,109) | ||||||||||||||||||||||
| Colorado Tower | (4,006) | (988) | (982) | (976) | (971) | (3,917) | (965) | (960) | (953) | (2,878) | ||||||||||||||||||||||
| Domain 10 | (3,095) | (792) | (788) | (783) | (778) | (3,141) | (774) | (770) | (765) | (2,309) | ||||||||||||||||||||||
| Other (9) | (6,213) | (1,519) | (1,518) | (1,512) | (243) | (4,792) | (41) | (40) | (41) | (122) | ||||||||||||||||||||||
| Capitalized (10) | 6,257 | 3,451 | 3,591 | 4,026 | 4,332 | 15,400 | 5,091 | 5,005 | 4,172 | 14,268 | ||||||||||||||||||||||
| Subtotal - Consolidated Interest Expense | (67,026) | (15,525) | (16,549) | (18,380) | (22,083) | (72,537) | (25,030) | (25,972) | (27,008) | (78,010) | ||||||||||||||||||||||
| Continued on next page | ||||||||||||||||||||||||||||||||
| Cousins Properties | 13 |
Q3 2023 Supplemental Information | ||||||
| FUNDS FROM OPERATIONS - DETAIL (1) | ||||||||
| (amounts in thousands, except per share amounts) | ||||||||||||||||||||||||||||||||
| 2021 | 2022 1st | 2022 2nd | 2022 3rd | 2022 4th | 2022 | 2023 1st | 2023 2nd | 2023 3rd | YTD 2023 | |||||||||||||||||||||||
| Unconsolidated Interest Expense (6) | ||||||||||||||||||||||||||||||||
| Medical Offices at Emory Hospital | (1,170) | (288) | (286) | (284) | (289) | (1,147) | (280) | (362) | (508) | (1,150) | ||||||||||||||||||||||
| Other (9) | (1,741) | (329) | (403) | (726) | 2 | (1,456) | — | — | — | — | ||||||||||||||||||||||
| Subtotal - Unconsolidated Interest Expense | (2,911) | (617) | (689) | (1,010) | (287) | (2,603) | (280) | (362) | (508) | (1,150) | ||||||||||||||||||||||
| Total Interest Expense | (69,937) | (16,142) | (17,238) | (19,390) | (22,370) | (75,140) | (25,310) | (26,334) | (27,516) | (79,160) | ||||||||||||||||||||||
| Reimbursed and Other Expenses | ||||||||||||||||||||||||||||||||
| Reimbursed Expenses (8) | (2,476) | (360) | (677) | (418) | (569) | (2,024) | (207) | (159) | (149) | (515) | ||||||||||||||||||||||
| Property Taxes and Other Land Holding Costs (6) | (941) | (230) | (262) | (247) | (326) | (1,065) | (323) | (276) | (318) | (917) | ||||||||||||||||||||||
| Severance | (406) | — | (170) | — | — | (170) | (72) | (90) | (63) | (225) | ||||||||||||||||||||||
| Gain (Loss) on Extinguishment of Debt | — | — | (100) | — | 269 | 169 | — | — | — | — | ||||||||||||||||||||||
| Predevelopment & Other Costs (6) | (829) | (4) | (7) | (2) | (954) | (967) | (3) | (117) | (265) | (385) | ||||||||||||||||||||||
| Total Reimbursed and Other Expenses | (4,652) | (594) | (1,216) | (667) | (1,580) | (4,057) | (605) | (642) | (795) | (2,042) | ||||||||||||||||||||||
| Gain (Loss) on Sales of Undepreciated Investment Properties | ||||||||||||||||||||||||||||||||
| Consolidated | (64) | — | — | — | — | — | — | — | 507 | 507 | ||||||||||||||||||||||
| Unconsolidated (6) | — | — | 4,500 | (22) | — | 4,478 | — | — | — | — | ||||||||||||||||||||||
| Total Gain (Loss) on Sales of Undepreciated Investment Properties | (64) | — | 4,500 | (22) | — | 4,478 | — | — | 507 | 507 | ||||||||||||||||||||||
| Depreciation and Amortization of Non-Real Estate Assets | (623) | (155) | (158) | (138) | (107) | (558) | (108) | (111) | (113) | (332) | ||||||||||||||||||||||
| Partners' Share of FFO in Consolidated Joint Ventures | (1,284) | (396) | (258) | (288) | (362) | (1,304) | (406) | (759) | (384) | (1,549) | ||||||||||||||||||||||
| FFO | $ | 409,201 | $ | 99,425 | $ | 104,731 | $ | 104,410 | $ | 100,193 | $ | 408,759 | $ | 98,094 | $ | 102,951 | $ | 98,972 | $ | 300,017 | ||||||||||||
| Weighted Average Shares - Diluted | 148,891 | 149,002 | 149,142 | 151,695 | 151,835 | 150,419 | 151,880 | 152,126 | 152,048 | 152,018 | ||||||||||||||||||||||
| FFO per Share | $ | 2.75 | $ | 0.67 | $ | 0.70 | $ | 0.69 | $ | 0.66 | $ | 2.72 | $ | 0.65 | $ | 0.68 | $ | 0.65 | $ | 1.97 | ||||||||||||
| Note: | Amounts may differ slightly from other schedules contained herein due to rounding. | ||||||||||||||||||||||||||||||||||||||||||||||||||||
| (1) See Non-GAAP Financial Measures - Calculations and Reconciliations beginning on page 31. | |||||||||||||||||||||||||||||||||||||||||||||||||||||
| (2) Contains multiple buildings that are grouped together for reporting purposes. | |||||||||||||||||||||||||||||||||||||||||||||||||||||
| (3) In December 2021, we purchased the remaining 50% interest from our partners; as a result, we began consolidating 300 Colorado. | |||||||||||||||||||||||||||||||||||||||||||||||||||||
| (4) A redevelopment of Promenade Central reached substantial completion in the fourth quarter of 2022. | |||||||||||||||||||||||||||||||||||||||||||||||||||||
(5) Primarily represents properties sold prior to September 30, 2023, see page 24. Also includes College Street Garage and properties in the final stages of development and not yet stabilized. | |||||||||||||||||||||||||||||||||||||||||||||||||||||
| (6) Unconsolidated amounts include amounts recorded in unconsolidated joint ventures for the respective category multiplied by the Company's ownership interest. The Company does not control the operations of the unconsolidated joint ventures but believes including these amounts in the categories indicated is meaningful to investors and analysts. | |||||||||||||||||||||||||||||||||||||||||||||||||||||
(7) Primarily represents unconsolidated investments sold prior to September 30, 2023, see page 24. Also includes NOI from unconsolidated investments not yet stabilized. | |||||||||||||||||||||||||||||||||||||||||||||||||||||
| (8) Reimbursed Expenses include costs incurred by the Company for management services provided to our unconsolidated joint ventures. The reimbursement of these costs by the unconsolidated joint ventures is included in Management Fees. | |||||||||||||||||||||||||||||||||||||||||||||||||||||
(9) Represents interest on consolidated loans repaid and our share of interests on loans of unconsolidated investments sold prior to September 30, 2023. | |||||||||||||||||||||||||||||||||||||||||||||||||||||
| (10) Amounts of consolidated interest expense related to consolidated debt that are capitalized to consolidated development and redevelopment projects as well as to equity in unconsolidated development projects. | |||||||||||||||||||||||||||||||||||||||||||||||||||||
| Cousins Properties | 14 |
Q3 2023 Supplemental Information | ||||||
| PORTFOLIO STATISTICS | ||||||||
| Office Properties (1) | Rentable Square Feet | Financial Statement Presentation | Company's Ownership Interest | End of Period Leased | Weighted Average Occupancy (2) | % of Total NOI / 3Q23 |
Property Level Debt ($ in thousands) (3) | |||||||||||||||||||||||||||||||||||||||||||||||||
| 3Q23 | 2Q23 | 3Q23 | 2Q23 | |||||||||||||||||||||||||||||||||||||||||||||||||||||
| Terminus (4) | 1,226,000 | Consolidated | 100% | 86.0% | 84.4% | 84.2% | 82.6% | 6.4% | $ | 220,676 | ||||||||||||||||||||||||||||||||||||||||||||||
| Spring & 8th (4) | 765,000 | Consolidated | 100% | 100.0% | 100.0% | 100.0% | 100.0% | 5.4% | — | |||||||||||||||||||||||||||||||||||||||||||||||
| Buckhead Plaza (4) | 678,000 | Consolidated | 100% | 92.4% | 90.8% | 89.5% | 87.4% | 4.0% | — | |||||||||||||||||||||||||||||||||||||||||||||||
| Northpark (4) | 1,539,000 | Consolidated | 100% | 75.1% | 73.8% | 73.1% | 71.9% | 3.8% | — | |||||||||||||||||||||||||||||||||||||||||||||||
| 725 Ponce | 372,000 | Consolidated | 100% | 100.0% | 100.0% | 98.4% | 98.4% | 3.6% | — | |||||||||||||||||||||||||||||||||||||||||||||||
| Avalon (4) | 480,000 | Consolidated | 100% | 100.0% | 100.0% | 100.0% | 98.0% | 3.2% | — | |||||||||||||||||||||||||||||||||||||||||||||||
| 3344 Peachtree | 484,000 | Consolidated | 100% | 96.9% | 96.9% | 96.9% | 96.9% | 3.1% | — | |||||||||||||||||||||||||||||||||||||||||||||||
| Promenade Tower | 777,000 | Consolidated | 100% | 88.1% | 88.3% | 73.0% | 74.3% | 2.6% | — | |||||||||||||||||||||||||||||||||||||||||||||||
| Meridian Mark Plaza | 160,000 | Consolidated | 100% | 100.0% | 100.0% | 100.0% | 100.0% | 0.9% | — | |||||||||||||||||||||||||||||||||||||||||||||||
| Medical Offices at Emory Hospital | 358,000 | Unconsolidated | 50% | 99.5% | 99.5% | 99.5% | 99.5% | 0.9% | 41,148 | |||||||||||||||||||||||||||||||||||||||||||||||
| 3348 Peachtree | 258,000 | Consolidated | 100% | 82.3% | 75.6% | 75.6% | 75.8% | 0.8% | — | |||||||||||||||||||||||||||||||||||||||||||||||
| Promenade Central (5) (6) | 367,000 | Consolidated | 100% | 72.6% | 71.6% | 45.7% | 31.5% | 0.8% | — | |||||||||||||||||||||||||||||||||||||||||||||||
| 3350 Peachtree | 413,000 | Consolidated | 100% | 59.8% | 59.8% | 54.3% | 54.3% | 0.6% | — | |||||||||||||||||||||||||||||||||||||||||||||||
| 120 West Trinity Office | 43,000 | Unconsolidated | 20% | 100.0% | 100.0% | 100.0% | 100.0% | 0.1% | — | |||||||||||||||||||||||||||||||||||||||||||||||
| ATLANTA (6) | 7,920,000 | 87.4% | 86.5% | 84.2% | 83.5% | 36.2% | 261,824 | |||||||||||||||||||||||||||||||||||||||||||||||||
| The Domain (4) | 1,899,000 | Consolidated | 100% | 100.0% | 100.0% | 99.8% | 99.7% | 13.6% | 72,716 | |||||||||||||||||||||||||||||||||||||||||||||||
| 300 Colorado | 378,000 | Consolidated | 100% | 100.0% | 100.0% | 100.0% | 92.2% | 3.8% | — | |||||||||||||||||||||||||||||||||||||||||||||||
| One Eleven Congress | 519,000 | Consolidated | 100% | 81.5% | 80.8% | 80.8% | 82.7% | 3.6% | — | |||||||||||||||||||||||||||||||||||||||||||||||
| Colorado Tower | 373,000 | Consolidated | 100% | 98.8% | 98.8% | 96.8% | 90.8% | 3.1% | 107,261 | |||||||||||||||||||||||||||||||||||||||||||||||
| The Terrace (4) | 619,000 | Consolidated | 100% | 80.5% | 80.0% | 78.1% | 79.1% | 3.0% | — | |||||||||||||||||||||||||||||||||||||||||||||||
| San Jacinto Center | 399,000 | Consolidated | 100% | 95.9% | 93.9% | 76.0% | 80.7% | 2.8% | — | |||||||||||||||||||||||||||||||||||||||||||||||
| Domain Point (4) | 240,000 | Consolidated | 96.5% | 100.0% | 100.0% | 100.0% | 100.0% | 1.6% | — | |||||||||||||||||||||||||||||||||||||||||||||||
| Research Park V | 173,000 | Consolidated | 100% | 93.0% | 97.1% | 80.7% | 82.1% | 0.8% | — | |||||||||||||||||||||||||||||||||||||||||||||||
| AUSTIN | 4,600,000 | 94.6% | 94.4% | 91.7% | 91.4% | 32.3% | 179,977 | |||||||||||||||||||||||||||||||||||||||||||||||||
| Hayden Ferry (4) (7) | 792,000 | Consolidated | 100% | 92.8% | 91.0% | 91.0% | 90.4% | 4.5% | — | |||||||||||||||||||||||||||||||||||||||||||||||
| 100 Mill (5) | 288,000 | Consolidated | 90% | 92.3% | 92.3% | 81.3% | 88.6% | 2.5% | — | |||||||||||||||||||||||||||||||||||||||||||||||
| 111 West Rio | 225,000 | Consolidated | 100% | 100.0% | 100.0% | 100.0% | 100.0% | 1.0% | — | |||||||||||||||||||||||||||||||||||||||||||||||
| Tempe Gateway | 264,000 | Consolidated | 100% | 62.4% | 62.4% | 60.1% | 56.9% | 0.9% | — | |||||||||||||||||||||||||||||||||||||||||||||||
| PHOENIX | 1,569,000 | 88.6% | 87.6% | 85.4% | 85.7% | 8.9% | — | |||||||||||||||||||||||||||||||||||||||||||||||||
| Corporate Center (4) | 1,227,000 | Consolidated | 100% | 94.0% | 96.9% | 95.5% | 96.3% | 5.6% | — | |||||||||||||||||||||||||||||||||||||||||||||||
| Heights Union (4) (5) | 294,000 | Consolidated | 100% | 100.0% | 100.0% | 100.0% | 98.0% | 2.0% | — | |||||||||||||||||||||||||||||||||||||||||||||||
| Harborview Plaza | 206,000 | Consolidated | 100% | 85.2% | 85.7% | 80.3% | 80.8% | 0.6% | — | |||||||||||||||||||||||||||||||||||||||||||||||
| The Pointe | 253,000 | Consolidated | 100% | 91.9% | 86.3% | 87.0% | 82.5% | 0.3% | — | |||||||||||||||||||||||||||||||||||||||||||||||
| TAMPA | 1,980,000 | 93.7% | 94.8% | 93.5% | 93.2% | 8.5% | — | |||||||||||||||||||||||||||||||||||||||||||||||||
| Fifth Third Center | 692,000 | Consolidated | 100% | 90.8% | 90.8% | 90.8% | 90.8% | 3.6% | 127,267 | |||||||||||||||||||||||||||||||||||||||||||||||
| Railyard | 329,000 | Consolidated | 100% | 99.4% | 99.4% | 99.4% | 99.4% | 2.4% | — | |||||||||||||||||||||||||||||||||||||||||||||||
| 550 South | 394,000 | Consolidated | 100% | 95.9% | 97.9% | 97.2% | 97.9% | 2.1% | — | |||||||||||||||||||||||||||||||||||||||||||||||
| CHARLOTTE | 1,415,000 | 94.2% | 94.8% | 94.6% | 94.8% | 8.1% | 127,267 | |||||||||||||||||||||||||||||||||||||||||||||||||
| Continued on next page | ||||||||||||||||||||||||||||||||||||||||||||||||||||||||
| Cousins Properties | 15 |
Q3 2023 Supplemental Information | ||||||
| PORTFOLIO STATISTICS | ||||||||
| Office Properties (1) | Rentable Square Feet | Financial Statement Presentation | Company's Ownership Interest | End of Period Leased | Weighted Average Occupancy (2) | % of Total NOI / 3Q23 |
Property Level Debt ($ in thousands) (3) | |||||||||||||||||||||||||||||||||||||||||||||||||
| 3Q23 | 2Q23 | 3Q23 | 2Q23 | |||||||||||||||||||||||||||||||||||||||||||||||||||||
| Legacy Union One | 319,000 | Consolidated | 100% | 100.0% | 100.0% | 100.0% | 100.0% | 1.7% | — | |||||||||||||||||||||||||||||||||||||||||||||||
| 5950 Sherry Lane | 197,000 | Consolidated | 100% | 77.5% | 80.3% | 77.1% | 79.9% | 0.7% | — | |||||||||||||||||||||||||||||||||||||||||||||||
| DALLAS | 516,000 | 91.4% | 92.5% | 91.2% | 92.3% | 2.4% | — | |||||||||||||||||||||||||||||||||||||||||||||||||
| BriarLake Plaza (4) | 835,000 | Consolidated | 100% | 97.8% | 97.6% | 79.5% | 79.8% | 2.7% | — | |||||||||||||||||||||||||||||||||||||||||||||||
| HOUSTON | 835,000 | 97.8% | 97.6% | 79.5% | 79.8% | 2.7% | — | |||||||||||||||||||||||||||||||||||||||||||||||||
| TOTAL OFFICE (6) | 18,835,000 | 91.1% | 90.8% | 88.0% | 87.7% | 99.1% | $ | 569,068 | ||||||||||||||||||||||||||||||||||||||||||||||||
| Other Properties (1) | ||||||||||||||||||||||||||||||||||||||||||||||||||||||||
| College Street Garage - Charlotte (5) | N/A | Consolidated | 100% | N/A | N/A | N/A | N/A | 0.7% | — | |||||||||||||||||||||||||||||||||||||||||||||||
| 120 West Trinity Apartment - Atlanta (330 units) (5) | 310,000 | Unconsolidated | 20% | 96.5% | 98.2% | 95.6% | 95.1% | 0.2% | — | |||||||||||||||||||||||||||||||||||||||||||||||
| TOTAL OTHER | 310,000 | 96.5% | 98.2% | 95.6% | 95.1% | 0.9% | $ | — | ||||||||||||||||||||||||||||||||||||||||||||||||
| TOTAL (6) | 19,145,000 | 91.1% | 90.8% | 88.0% | 87.7% | 100.0% | $ | 569,068 | ||||||||||||||||||||||||||||||||||||||||||||||||
| (1) | Represents the Company's operating properties, excluding properties on the development pipeline and properties sold prior to September 30, 2023. |
||||
| (2) | The weighted average economic occupancy of the property over the period for which the property was available for occupancy. | ||||
| (3) | The Company's share of property-specific mortgage debt, net of unamortized loan costs, as of September 30, 2023. |
||||
| (4) | Contains two or more buildings that are grouped together for reporting purposes. | ||||
| (5) | Not included in Same Property as of September 30, 2023. |
||||
| (6) | A full building redevelopment was completed at Promenade Central in the fourth quarter of 2022. This building will be excluded from the Atlanta, Total Office, and Total Portfolio calculations until stabilized. | ||||
| (7) | Hayden Ferry 1 in this group of buildings has been excluded from Same Property as of September 30, 2023 due to the lack of comparability driven by the financial impact of the SVB Financial lease rejection and commencement of a redevelopment of this building in the fourth quarter of 2023. See our Quarterly Report for the period ended September 30, 2023, on Form 10-Q. The SVB lease continued through September 30, 2023 and, as such, Hayden Ferry 1 is included in our end of period leased and weighted average occupancy for the quarters ended September 30, 2023 and June 30, 2023. |
||||
| Cousins Properties | 16 |
Q3 2023 Supplemental Information | ||||||
| PORTFOLIO STATISTICS | ||||||||
| Cousins Properties | 17 |
Q3 2023 Supplemental Information | ||||||
| SAME PROPERTY PERFORMANCE (1) | ||||||||
| ($ in thousands) | |||||||||||||||||||||||
| Three Months Ended September 30, | |||||||||||||||||||||||
| 2023 | 2022 | $ Change | % Change | ||||||||||||||||||||
| Rental Property Revenues (2) | $ | 186,272 | $ | 185,324 | $ | 948 | 0.5 | % | |||||||||||||||
| Rental Property Operating Expenses (2) | 61,712 | 65,627 | (3,915) | (6.0) | % | ||||||||||||||||||
| Same Property Net Operating Income | $ | 124,560 | $ | 119,697 | $ | 4,863 | 4.1 | % | |||||||||||||||
| Cash-Basis Rental Property Revenues (3) | $ | 176,139 | $ | 175,011 | $ | 1,128 | 0.6 | % | |||||||||||||||
| Cash-Basis Rental Property Operating Expenses (4) | 61,482 | 65,400 | (3,918) | (6.0) | % | ||||||||||||||||||
| Cash-Basis Same Property Net Operating Income | $ | 114,657 | $ | 109,611 | $ | 5,046 | 4.6 | % | |||||||||||||||
| End of Period Leased | 90.8 | % | 89.8 | % | |||||||||||||||||||
| Weighted Average Occupancy | 87.3 | % | 87.1 | % | |||||||||||||||||||
| Nine Months Ended September 30, | |||||||||||||||||||||||
| 2023 | 2022 | $ Change | % Change | ||||||||||||||||||||
| Rental Property Revenues (2) | $ | 563,653 | $ | 540,351 | $ | 23,302 | 4.3 | % | |||||||||||||||
| Rental Property Operating Expenses (2) | 194,731 | 189,871 | 4,860 | 2.6 | % | ||||||||||||||||||
| Same Property Net Operating Income | $ | 368,922 | $ | 350,480 | $ | 18,442 | 5.3 | % | |||||||||||||||
| Cash-Basis Rental Property Revenues (3) | $ | 534,251 | $ | 514,948 | $ | 19,303 | 3.7 | % | |||||||||||||||
| Cash-Basis Rental Property Operating Expenses (4) | 194,043 | 189,160 | 4,883 | 2.6 | % | ||||||||||||||||||
| Cash-Basis Same Property Net Operating Income | $ | 340,208 | $ | 325,788 | $ | 14,420 | 4.4 | % | |||||||||||||||
| Weighted Average Occupancy | 87.3 | % | 87.2 | % | |||||||||||||||||||
| (1) | Same Properties include those office properties that were stabilized and owned by the Company for the entirety of all comparable reporting periods presented. See Portfolio Statistics on pages 15 and 16 for footnotes indicating which properties are not included in Same Property. See Non-GAAP Financial Measures - Calculations and Reconciliations beginning on page 31. |
||||||||||
| (2) | Rental Property Revenues and Expenses include results for the Company and its share of unconsolidated joint ventures and exclude termination fee income. Net operating income for unconsolidated joint ventures is calculated as Rental Property Revenues less termination fee income and Rental Property Expenses at the joint ventures, multiplied by the Company's ownership interest. The Company does not control the operations of the unconsolidated joint ventures but believes that including these amounts with consolidated net operating income is meaningful to investors and analysts. | ||||||||||
| (3) | Cash-Basis Rental Property Revenues include that of the Company and its share of unconsolidated joint ventures. It represents Rental Property Revenues, excluding termination fee income, straight-line rents, and other deferred income amortization, amortization of lease inducements, and amortization of acquired above and below market rents. | ||||||||||
| (4) | Cash-Basis Rental Property Operating Expenses include that of the Company and its share of unconsolidated joint ventures. It represents Rental Property Operating Expenses, excluding straight-line ground rent expense and amortization of above and below market ground rent expense. | ||||||||||
| Cousins Properties | 18 |
Q3 2023 Supplemental Information | ||||||
| OFFICE LEASING ACTIVITY | ||||||||
| Three Months Ended September 30, 2023 | Nine Months Ended September 30, 2023 | ||||||||||||||||||||||||||||||||||||||||||||||
| New | Renewal | Expansion | Total | New | Renewal | Expansion | Total | ||||||||||||||||||||||||||||||||||||||||
| Gross leased square feet (1) | 649,668 | 1,491,127 | |||||||||||||||||||||||||||||||||||||||||||||
| Less exclusions (2) | (101,769) | (249,898) | |||||||||||||||||||||||||||||||||||||||||||||
| Net leased square feet | 131,830 | 358,473 | 57,596 | 547,899 | 511,767 | 549,997 | 179,465 | 1,241,229 | |||||||||||||||||||||||||||||||||||||||
| Number of transactions | 14 | 12 | 6 | 32 | 47 | 40 | 14 | 101 | |||||||||||||||||||||||||||||||||||||||
| Lease term in years (3) | 9.2 | 8.8 | 5.6 | 8.6 | 8.9 | 7.4 | 4.9 | 7.7 | |||||||||||||||||||||||||||||||||||||||
| Net effective rent calculation (per square foot per year) (3) | |||||||||||||||||||||||||||||||||||||||||||||||
| Net annualized rent (4) | $ | 35.90 | $ | 33.44 | $ | 32.61 | $ | 33.94 | $ | 38.06 | $ | 33.42 | $ | 35.97 | $ | 35.70 | |||||||||||||||||||||||||||||||
| Net free rent | (1.92) | (2.53) | (1.48) | (2.27) | (2.43) | (2.35) | (0.73) | (2.15) | |||||||||||||||||||||||||||||||||||||||
| Leasing commissions | (3.03) | (2.50) | (2.30) | (2.60) | (3.00) | (2.56) | (1.76) | (2.62) | |||||||||||||||||||||||||||||||||||||||
| Tenant improvements | (7.69) | (4.09) | (7.29) | (5.30) | (8.30) | (4.14) | (3.12) | (5.71) | |||||||||||||||||||||||||||||||||||||||
| Total leasing costs | (12.64) | (9.12) | (11.07) | (10.17) | (13.73) | (9.05) | (5.61) | (10.48) | |||||||||||||||||||||||||||||||||||||||
| Net effective rent | $ | 23.26 | $ | 24.32 | $ | 21.54 | $ | 23.77 | $ | 24.33 | $ | 24.37 | $ | 30.36 | $ | 25.22 | |||||||||||||||||||||||||||||||
| Second generation leased square footage (5) | 474,948 | 887,074 | |||||||||||||||||||||||||||||||||||||||||||||
| Increase in straight-line basis second generation net rent per square foot (6) | 28.7 | % | 24.8 | % | |||||||||||||||||||||||||||||||||||||||||||
| Increase in cash-basis second generation net rent per square foot (7) | 9.8 | % | 8.5 | % | |||||||||||||||||||||||||||||||||||||||||||
| (1) | Comprised of total square feet leased, unadjusted for ownership share and excluding apartment leasing. | ||||
| (2) | Adjusted for leases approximately one year or less, along with leases for retail, amenity, storage, percentage rent, and intercompany space. | ||||
| (3) | Weighted average of net leased square feet. | ||||
| (4) | Straight-line net rent per square foot (operating expense reimbursements deducted from gross leases) over the lease term prior to any deductions for leasing costs. | ||||
| (5) | Excludes leases executed for spaces that were vacant upon acquisition, new leases in development properties, and leases for spaces that have been vacant for one year or more. |
||||
| (6) | Increase in second generation straight-line basis net annualized rent on a weighted average basis. | ||||
| (7) | Increase in second generation net cash rent at the end of the term paid by the prior tenant compared to net cash rent at the beginning of the term (after any free rent period) paid by the current tenant on a weighted average basis. For early renewals, the increase in net cash rent at the end of the term of the original lease is compared to net cash rent at the beginning of the extended term of the lease. Net cash rent is net of any recovery of operating expenses but prior to any deductions for leasing costs. | ||||
| Cousins Properties | 19 |
Q3 2023 Supplemental Information | ||||||
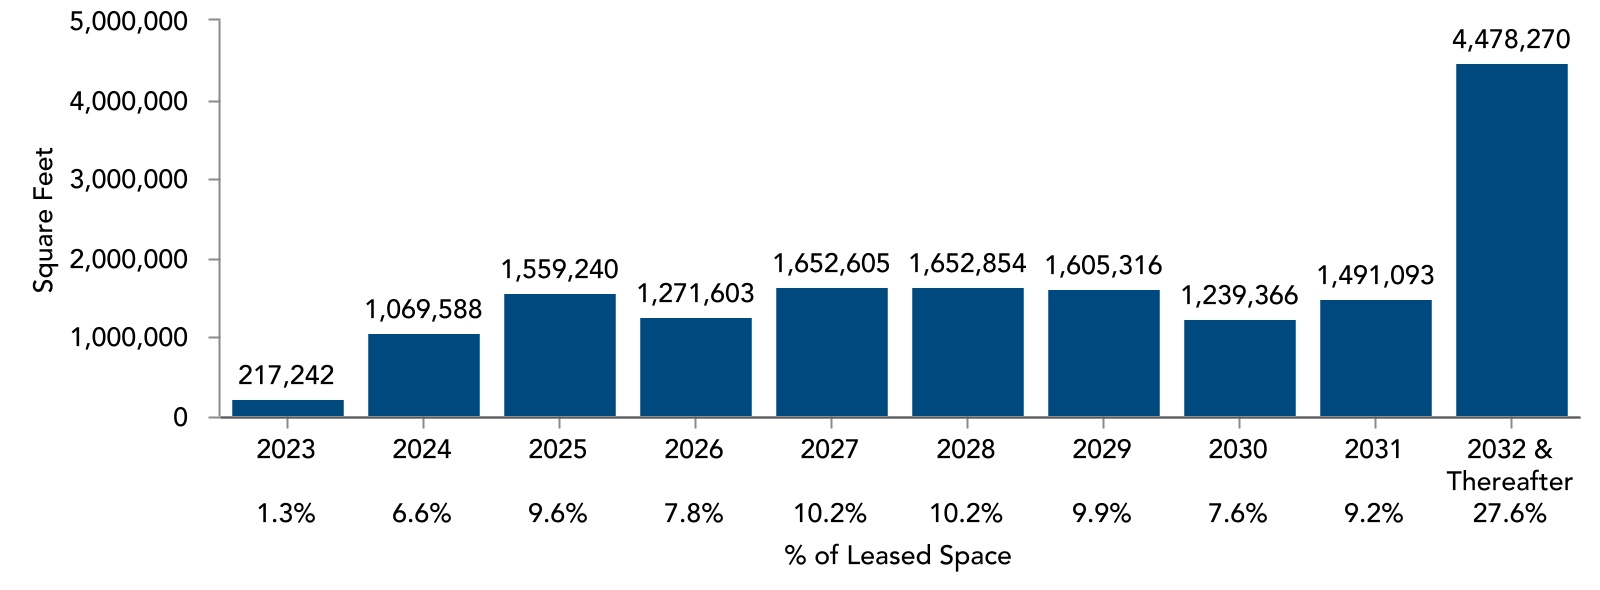
| OFFICE LEASE EXPIRATIONS | ||||||||
| Year of Expiration | Square Feet Expiring |
% of Leased Space |
Annual Contractual Rent ($ in thousands) (2) |
% of Annual Contractual Rent |
Annual Contractual Rent/Sq. Ft. |
|||||||||||||||||||||||||||
| 2023 | 217,242 | 1.3 | % | $ | 9,122 | 1.1 | % | $ | 41.99 | |||||||||||||||||||||||
| 2024 | 1,069,588 | 6.6 | % | 47,480 | 5.6 | % | 44.39 | |||||||||||||||||||||||||
| 2025 | 1,559,240 | 9.6 | % | 71,022 | 8.4 | % | 45.55 | |||||||||||||||||||||||||
| 2026 | 1,271,603 | 7.8 | % | 59,710 | 7.1 | % | 46.96 | |||||||||||||||||||||||||
| 2027 | 1,652,605 | 10.2 | % | 77,128 | 9.1 | % | 46.67 | |||||||||||||||||||||||||
| 2028 | 1,652,854 | 10.2 | % | 84,691 | 10.0 | % | 51.24 | |||||||||||||||||||||||||
| 2029 | 1,605,316 | 9.9 | % | 84,750 | 10.0 | % | 52.79 | |||||||||||||||||||||||||
| 2030 | 1,239,366 | 7.6 | % | 63,620 | 7.5 | % | 51.33 | |||||||||||||||||||||||||
| 2031 | 1,491,093 | 9.2 | % | 91,139 | 10.8 | % | 61.12 | |||||||||||||||||||||||||
| 2032 & Thereafter | 4,478,270 | 27.6 | % | 257,622 | 30.4 | % | 57.53 | |||||||||||||||||||||||||
| Total | 16,237,177 | 100.0 | % | $ | 846,284 | 100.0 | % | $ | 52.12 | |||||||||||||||||||||||
(1) Company's share of leases expiring after September 30, 2023. Expiring square footage for which new leases have been executed is reflected based on the expiration date of the new lease. | |||||||||||
| (2) Annual Contractual Rent is the estimated rent in the year of expiration. It includes the minimum base rent and an estimate of the tenant's share of operating expenses, if applicable, as defined in the respective leases. | |||||||||||
| Cousins Properties | 20 |
Q3 2023 Supplemental Information | ||||||
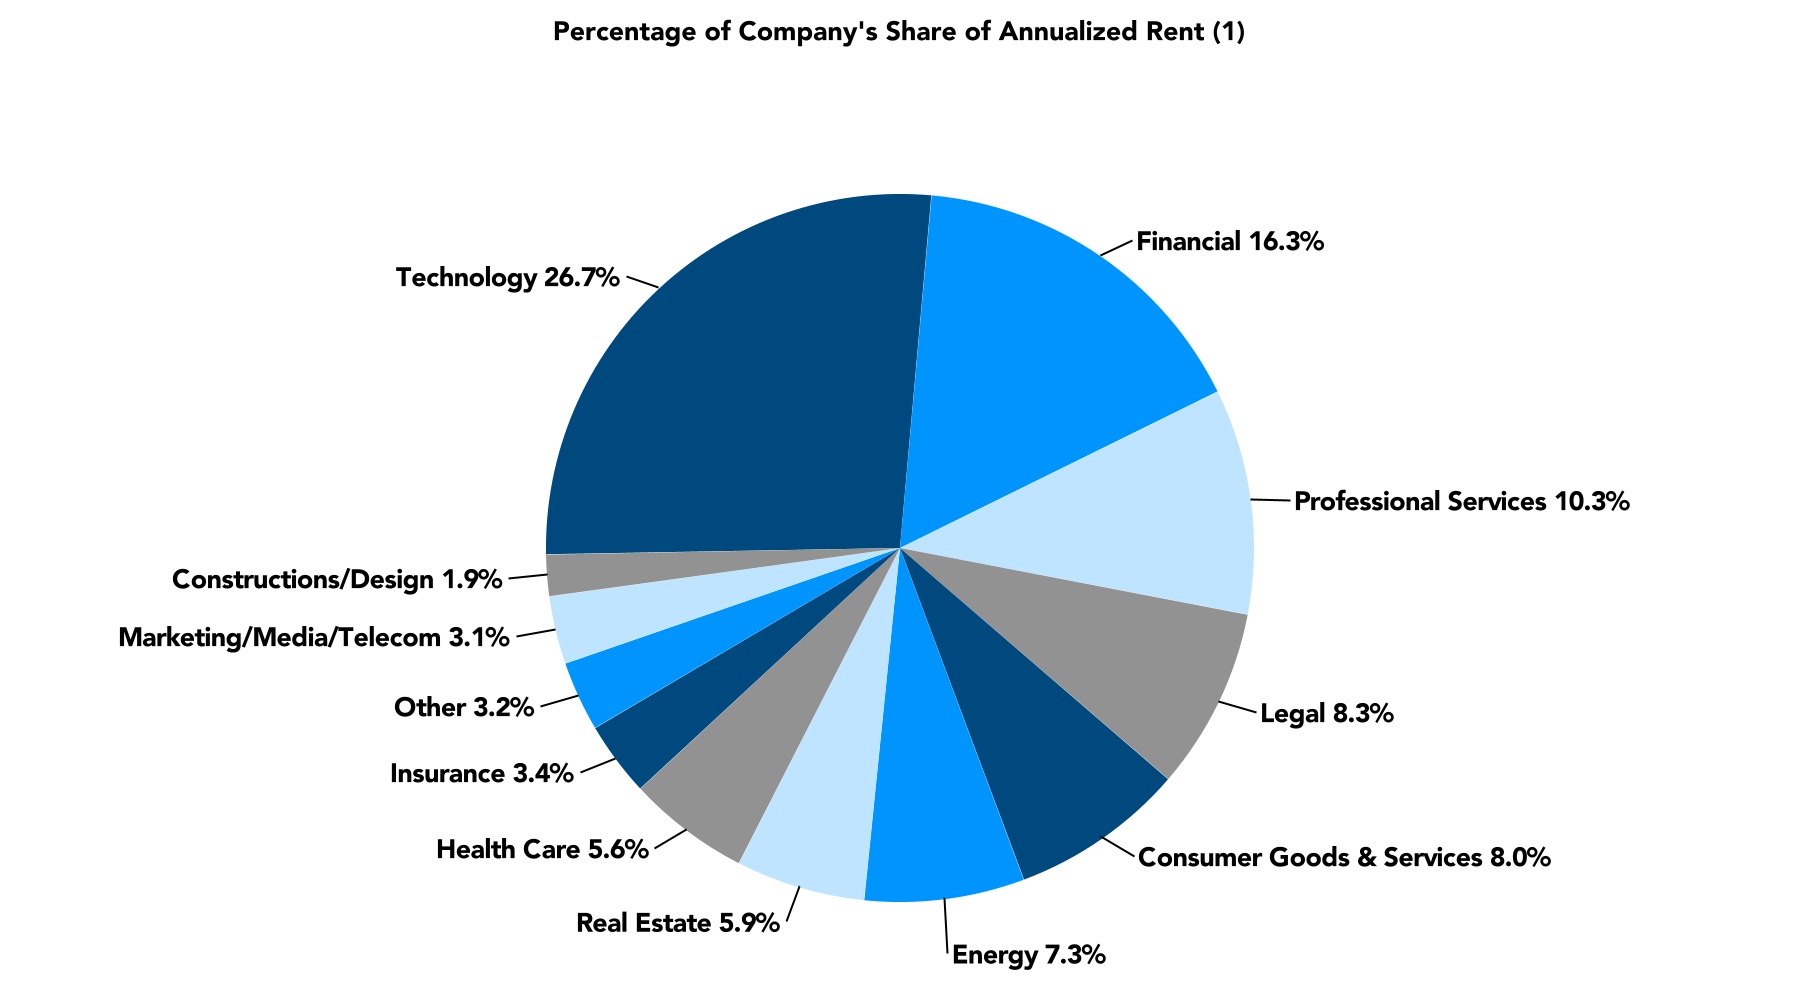
| TOP 20 OFFICE TENANTS | ||||||||
| Tenant (1) | Number of Properties Occupied | Number of Markets Occupied | Company's Share of Square Footage | Company's Share of Annualized Rent ($ in thousands) (2) |
Percentage of Company's Share of Annualized Rent | Weighted Average Remaining Lease Term (Years) | |||||||||||||||||||||||||||||||||||
| 1 | Amazon | 5 | 3 | 1,107,805 | $ | 59,663 | 8.0% | 5.5 | |||||||||||||||||||||||||||||||||
| 2 | NCR Corporation | 2 | 2 | 815,634 | 40,406 | 5.4% | 9.7 | ||||||||||||||||||||||||||||||||||
| 3 | Pioneer Natural Resources | 2 | 1 | 359,660 | 25,868 | 3.5% | 7.9 | ||||||||||||||||||||||||||||||||||
| 4 | Meta Platforms | 1 | 1 | 319,863 | 19,481 | 2.6% | 7.8 | ||||||||||||||||||||||||||||||||||
| 5 | Expedia | 1 | 1 | 315,882 | 17,926 | 2.4% | 7.5 | ||||||||||||||||||||||||||||||||||
| 6 | Bank of America | 2 | 2 | 347,139 | 12,648 | 1.7% | 2.2 | ||||||||||||||||||||||||||||||||||
| 7 | Apache | 1 | 1 | 210,012 | 9,658 | 1.3% | 13.2 | ||||||||||||||||||||||||||||||||||
| 8 | Wells Fargo | 5 | 3 | 198,507 | 9,129 | 1.2% | 2.5 | ||||||||||||||||||||||||||||||||||
| 9 | SVB Financial Group (3) | 1 | 1 | 204,751 | 8,687 | 1.2% | — | ||||||||||||||||||||||||||||||||||
| 10 | Ovintiv USA | 1 | 1 | 318,582 | 8,313 | 1.1% | 3.8 | ||||||||||||||||||||||||||||||||||
| 11 | WeWork (3) | 4 | 2 | 169,050 | 8,001 | 1.1% | 10.0 | ||||||||||||||||||||||||||||||||||
| 12 | ADP | 1 | 1 | 225,000 | 7,668 | 1.0% | 4.5 | ||||||||||||||||||||||||||||||||||
| 13 | Westrock Shared Services | 1 | 1 | 205,185 | 7,309 | 1.0% | 6.6 | ||||||||||||||||||||||||||||||||||
| 14 | Regus Equity Business Centers | 5 | 4 | 145,119 | 7,305 | 1.0% | 5.2 | ||||||||||||||||||||||||||||||||||
| 15 | BlackRock | 1 | 1 | 131,656 | 6,937 | 1.0% | 12.7 | ||||||||||||||||||||||||||||||||||
| 16 | McGuireWoods | 2 | 2 | 187,119 | 6,891 | 1.0% | 3.3 | ||||||||||||||||||||||||||||||||||
| 17 | Workrise Technologies | 1 | 1 | 93,210 | 6,712 | 0.9% | 4.8 | ||||||||||||||||||||||||||||||||||
| 18 | Amgen | 1 | 1 | 163,169 | 6,477 | 0.9% | 5.1 | ||||||||||||||||||||||||||||||||||
| 19 | McKinsey & Company Inc. | 2 | 2 | 130,513 | 6,357 | 0.9% | 9.1 | ||||||||||||||||||||||||||||||||||
| 20 | Samsung Engineering America | 1 | 1 | 133,860 | 6,349 | 0.9% | 3.2 | ||||||||||||||||||||||||||||||||||
| Total | 5,781,716 | $ | 281,785 | 38.1% | 6.4 | ||||||||||||||||||||||||||||||||||||
| (1) | In some cases, the actual tenant may be an affiliate of the entity shown. | ||||||||||||||||||||||||||||||||||||||||
| (2) | Annualized Rent represents the annualized cash rent including the tenant's share of estimated operating expenses, if applicable, paid by the tenant as of September 30, 2023. If the tenant is in a free rent period as of September 30, 2023, Annualized Rent represents the annualized contractual rent the tenant will pay in the first month it is required to pay full cash rent. |
||||||||||||||||||||||||||||||||||||||||
| (3) | Additional information regarding leases with these tenants can be found in note 11 to the consolidated financial statements included in our Quarterly Report for the period ended September 30, 2023, on Form 10-Q filed on October 26, 2023. |
||||||||||||||||||||||||||||||||||||||||
| Note: | This schedule includes leases that have commenced. Leases that have been signed but have not commenced are excluded. | ||||||||||||||||||||||||||||||||||||||||
| Cousins Properties | 21 |
Q3 2023 Supplemental Information | ||||||
| TENANT INDUSTRY DIVERSIFICATION | ||||||||
| Cousins Properties | 22 |
Q3 2023 Supplemental Information | ||||||
| INVESTMENT ACTIVITY | ||||||||
| Property | Type | Market | Company's Ownership Interest | Timing | Square Feet | Gross Purchase Price ($ in thousands) (1) |
||||||||||||||||||||||||||||||||
| 2022 | ||||||||||||||||||||||||||||||||||||||
| Avalon (2) | Office | Atlanta | 100% | 2Q | 480,000 | $ | 43,400 | |||||||||||||||||||||||||||||||
| 2021 | ||||||||||||||||||||||||||||||||||||||
| 725 Ponce | Office | Atlanta | 100% | 3Q | 372,000 | 300,200 | ||||||||||||||||||||||||||||||||
| Heights Union | Office | Tampa | 100% | 4Q | 294,000 | 144,800 | ||||||||||||||||||||||||||||||||
| 2020 | ||||||||||||||||||||||||||||||||||||||
| The RailYard | Office | Charlotte | 100% | 4Q | 329,000 | 201,300 | ||||||||||||||||||||||||||||||||
| 2019 | ||||||||||||||||||||||||||||||||||||||
| Promenade Central | Office | Atlanta | 100% | 1Q | 370,000 | 82,000 | ||||||||||||||||||||||||||||||||
| TIER REIT, Inc. | Office | Various | Various | 2Q | 5,799,000 | (3) | ||||||||||||||||||||||||||||||||
| Terminus (4) | Office | Atlanta | 100% | 4Q | 1,226,000 | 246,000 | ||||||||||||||||||||||||||||||||
| 8,870,000 | $ | 1,017,700 | ||||||||||||||||||||||||||||||||||||
| Project | Type | Market | Company's Ownership Interest | Timing (5) | Square Feet | Total Project Cost ($ in thousands) (1) | ||||||||||||||||||||||||||||||||
| 2022 | ||||||||||||||||||||||||||||||||||||||
| 300 Colorado | Office | Austin | 100% | 1Q | 369,000 | $ | 193,000 | |||||||||||||||||||||||||||||||
| 100 Mill | Office | Phoenix | 90% | 4Q | 288,000 | 156,000 | ||||||||||||||||||||||||||||||||
| 2021 | ||||||||||||||||||||||||||||||||||||||
| 10000 Avalon | Office | Atlanta | 90% | 1Q | 251,000 | 96,000 | ||||||||||||||||||||||||||||||||
| 120 West Trinity | Mixed | Atlanta | 20% | 2Q | 353,000 | 89,000 | ||||||||||||||||||||||||||||||||
| Domain 10 | Office | Austin | 100% | 3Q | 300,000 | 111,000 | ||||||||||||||||||||||||||||||||
| 2020 | ||||||||||||||||||||||||||||||||||||||
| Domain 12 | Office | Austin | 100% | 4Q | 320,000 | 117,000 | ||||||||||||||||||||||||||||||||
| 2019 | ||||||||||||||||||||||||||||||||||||||
| Dimensional Place | Office | Charlotte | 50% | 1Q | 281,000 | 96,000 | ||||||||||||||||||||||||||||||||
| 2018 | ||||||||||||||||||||||||||||||||||||||
| Spring & 8th | Office | Atlanta | 100% | 1Q/4Q | 765,000 | 336,000 | ||||||||||||||||||||||||||||||||
| 2,927,000 | $ | 1,194,000 | ||||||||||||||||||||||||||||||||||||
| Cousins Properties | 23 |
Q3 2023 Supplemental Information | ||||||
| INVESTMENT ACTIVITY | ||||||||
| Property | Type | Market | Company's Ownership Interest | Timing | Square Feet | Gross Sales Price ($ in thousands) |
|||||||||||||||||||||||||||||||||||
| 2022 | |||||||||||||||||||||||||||||||||||||||||
| Carolina Square | Mixed | Charlotte | 50% | 3Q | 468,000 | $ | 105,000 | (1) | |||||||||||||||||||||||||||||||||
| 2021 | |||||||||||||||||||||||||||||||||||||||||
| Burnett Plaza | Office | Fort Worth | 100% | 2Q | 1,023,000 | 137,500 | |||||||||||||||||||||||||||||||||||
| One South at the Plaza | Office | Charlotte | 100% | 3Q | 891,000 | 271,500 | |||||||||||||||||||||||||||||||||||
| Dimensional Place | Office | Charlotte | 50% | 3Q | 281,000 | 60,800 | (1) | ||||||||||||||||||||||||||||||||||
| 816 Congress | Office | Austin | 100% | 4Q | 435,000 | 174,000 | |||||||||||||||||||||||||||||||||||
| 2020 | |||||||||||||||||||||||||||||||||||||||||
| Hearst Tower | Office | Charlotte | 100% | 1Q | 966,000 | 455,500 | |||||||||||||||||||||||||||||||||||
| Gateway Village | Office | Charlotte | 50% | 1Q | 1,061,000 | 52,200 | (1) | ||||||||||||||||||||||||||||||||||
| Woodcrest | Office | Cherry Hill | 100% | 1Q | 386,000 | 25,300 | |||||||||||||||||||||||||||||||||||
| 5,511,000 | $ | 1,281,800 | |||||||||||||||||||||||||||||||||||||||
| Cousins Properties | 24 |
Q3 2023 Supplemental Information | ||||||
| DEVELOPMENT PIPELINE (1) | ||||||||
| Project | Type | Market | Company's Ownership Interest | Construction Start Date | Square Feet/Units | Estimated Project Cost (1) (2) ($ in thousands) |
Company's Share of Estimated Project Cost (2) ($ in thousands) |
Project Cost Incurred to Date (2) ($ in thousands) |
Company's Share of Project Cost Incurred to Date (2) ($ in thousands) |
Percent Leased | Initial Occupancy (3) | Estimated Stabilization (4) | ||||||||||||||||||||||||||||||||||||||||||||||||||||||||||||||
| Neuhoff (5) | Mixed | Nashville | 50 | % | 3Q21 | $ | 563,000 | $ | 281,500 | $ | 439,476 | $ | 219,738 | |||||||||||||||||||||||||||||||||||||||||||||||||||||||||||||
| Office and Retail | 448,000 | 11 | % | 4Q23 | 4Q25 | |||||||||||||||||||||||||||||||||||||||||||||||||||||||||||||||||||||
| Apartments | 542 | — | % | 2Q24 | 2Q26 | |||||||||||||||||||||||||||||||||||||||||||||||||||||||||||||||||||||
| Domain 9 | Office | Austin | 100 | % | 2Q21 | 338,000 | 147,000 | 147,000 | 118,797 | 118,797 | 98 | % | 1Q24 | 3Q25 | ||||||||||||||||||||||||||||||||||||||||||||||||||||||||||||
| Total | $ | 710,000 | $ | 428,500 | $ | 558,273 | $ | 338,535 | ||||||||||||||||||||||||||||||||||||||||||||||||||||||||||||||||||
| (1) | This schedule shows projects currently under active development through the substantial completion of construction as well as properties in an initial lease up period prior to stabilization. Amounts included in the estimated project cost column are the estimated costs of the project, as of project commencement, through stabilization. Significant estimation is required to derive these costs, and the final costs may differ from these estimates. | ||||
| (2) | Estimated and incurred project costs are construction costs plus financing costs on project-specific debt. Neuhoff has a project-specific construction loan (see footnote 5). The above schedule excludes any financing cost assumptions for projects without project-specific debt and any other incremental capitalized costs required by GAAP. | ||||
| (3) | Initial occupancy represents the quarter within which the Company first recognized, or estimates it will begin recognizing, revenue under GAAP. The Company capitalizes interest, real estate taxes, and certain operating expenses on the unoccupied portion of office and retail properties, which have ongoing construction of tenant improvements, until the earlier of (1) the date on which the project achieves 90% economic occupancy or (2) one year from cessation of major construction activity. For residential project construction, the Company continues to capitalize interest, real estate taxes, and certain operating expenses until cessation of major construction activity. | ||||
| (4) | This has been updated from prior schedules to reflect the estimated quarter of economic stabilization for each project. Previously, this column reflected when we ceased capitalization in accordance with GAAP. | ||||
| (5) | The Neuhoff estimated project cost will be funded with a combination of $250.6 million of equity contributed by the joint venture partners and a $312.7 million construction loan. The estimated project cost includes approximately $66 million of site and associated infrastructure work related to a future phase. | ||||
| Cousins Properties | 25 |
Q3 2023 Supplemental Information | ||||||
| LAND INVENTORY | ||||||||
| Market | Company's Ownership Interest | Financial Statement Presentation | Total Developable Land (Acres) | Cost Basis of Land ($ in thousands) | ||||||||||||||||||||||||||||
| 3354/3356 Peachtree | Atlanta | 95% | Consolidated | 3.2 | ||||||||||||||||||||||||||||
| 715 Ponce | Atlanta | 50% | Unconsolidated | 1.0 | ||||||||||||||||||||||||||||
| 887 West Peachtree (1) | Atlanta | 100% | Consolidated | 1.6 | ||||||||||||||||||||||||||||
| Domain Point 3 | Austin | 90% | Consolidated | 1.7 | ||||||||||||||||||||||||||||
| Domain Central | Austin | 100% | Consolidated | 5.6 | ||||||||||||||||||||||||||||
| South End Station | Charlotte | 100% | Consolidated | 3.4 | ||||||||||||||||||||||||||||
| 303 Tremont | Charlotte | 100% | Consolidated | 2.4 | ||||||||||||||||||||||||||||
| Legacy Union 2 & 3 | Dallas | 95% | Consolidated | 4.0 | ||||||||||||||||||||||||||||
| Corporate Center 5 & 6 (2) | Tampa | 100% | Consolidated | 14.1 | ||||||||||||||||||||||||||||
| Total | 37.0 | $ | 162,813 | |||||||||||||||||||||||||||||
| 159351 | ||||||||||||||||||||||||||||||||
| Company's Share | 36.0 | $ | 156,008 | |||||||||||||||||||||||||||||
| (1) | Includes a ground lease with future obligation to purchase. | ||||
| (2) | Corporate Center 5 is controlled through a long-term ground lease. | ||||
| Cousins Properties | 26 |
Q3 2023 Supplemental Information | ||||||
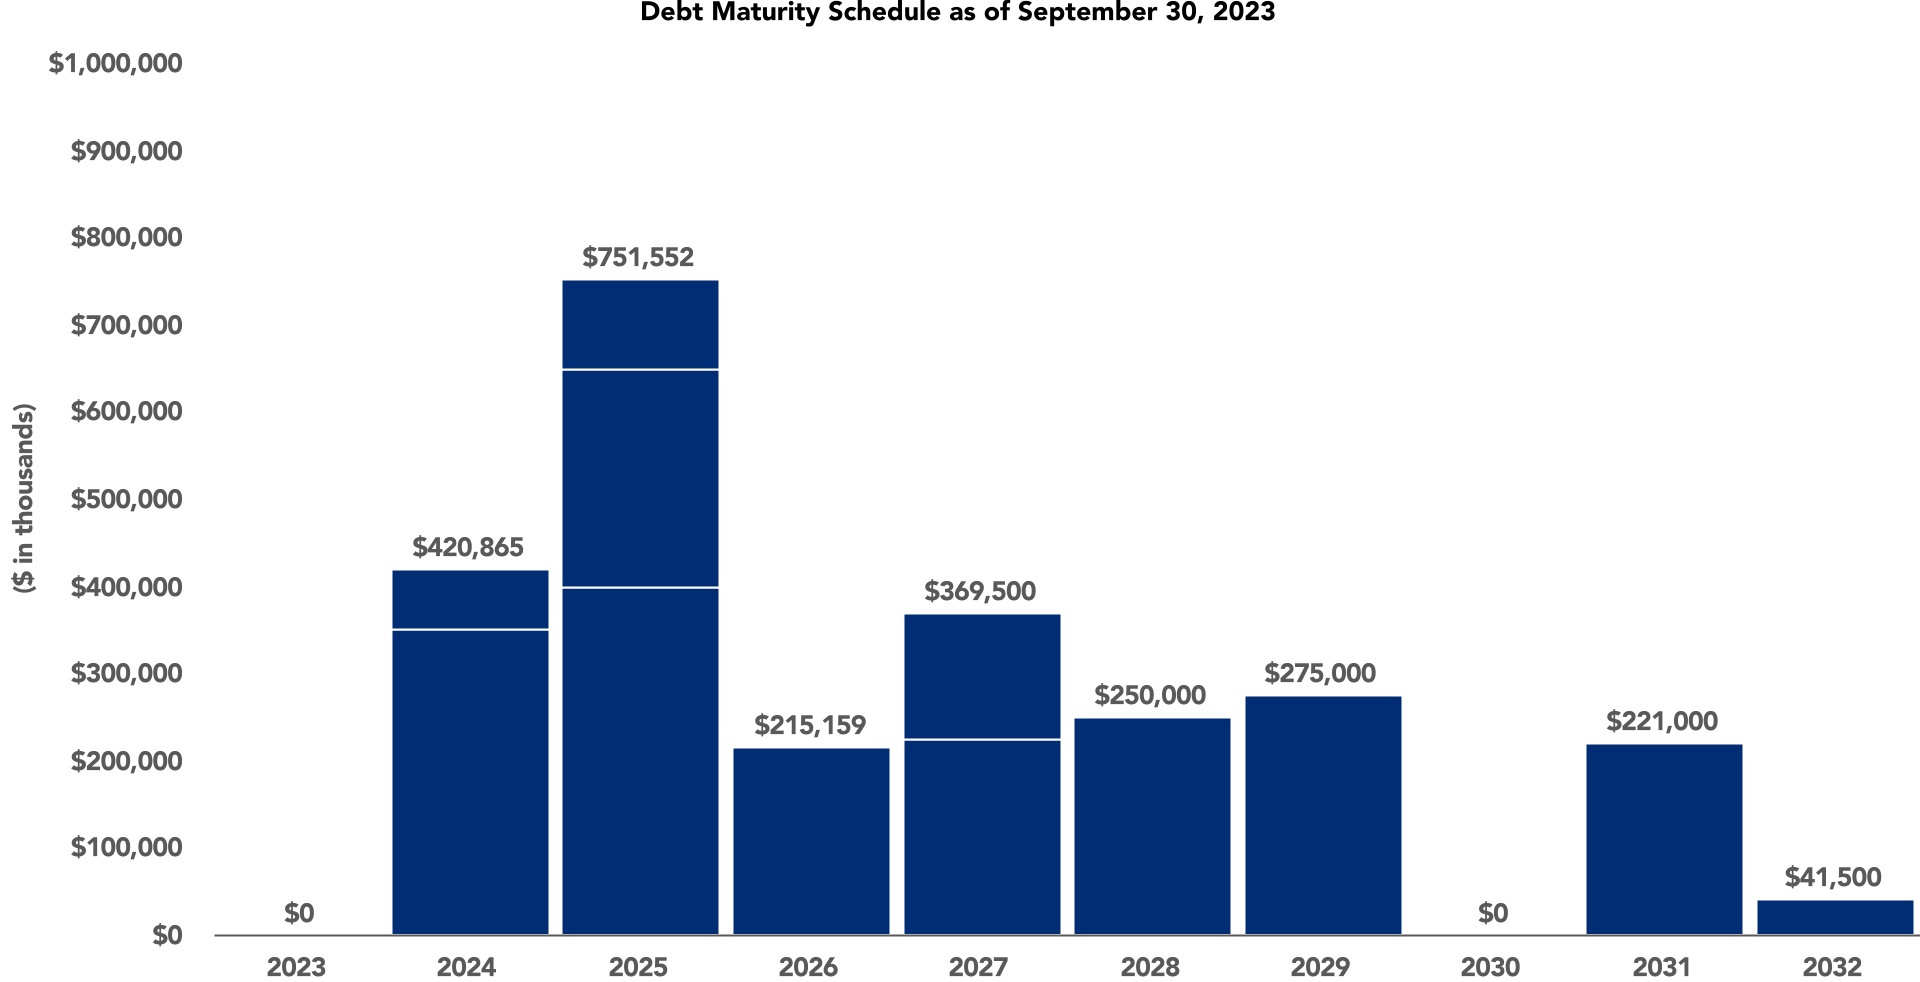
| DEBT SCHEDULE (1) | ||||||||
| Company's Share of Debt Maturities and Principal Payments | ||||||||||||||||||||||||||||||||||||||||||||||||||||||||||||||||||||||||||
| ($ in thousands) | ||||||||||||||||||||||||||||||||||||||||||||||||||||||||||||||||||||||||||
| Description (Interest Rate Base, if not fixed) | Company's Ownership Interest | Rate at End of Quarter | Maturity Date | 2023 | 2024 | 2025 | 2026 | 2027 | Thereafter | Total Principal | Deferred Loan Costs | Total | ||||||||||||||||||||||||||||||||||||||||||||||||||||||||||||||
| Consolidated Debt - Floating Rate | ||||||||||||||||||||||||||||||||||||||||||||||||||||||||||||||||||||||||||
| Term Loan, Unsecured (Adjusted SOFR + 1.05% to 1.65%) (2) | 100% | 6.46% | 3/3/25 | $ | — | $ | — | $ | 200,000 | $ | — | $ | — | $ | — | $ | 200,000 | $ | (741) | $ | 199,259 | |||||||||||||||||||||||||||||||||||||||||||||||||||||
| Credit Facility, Unsecured (Adjusted SOFR + 0.90% to 1.40%) (3) | 100% | 6.31% | 4/30/27 | — | — | — | — | 144,500 | — | 144,500 | — | 144,500 | ||||||||||||||||||||||||||||||||||||||||||||||||||||||||||||||
| Total Consolidated Floating Rate Debt | — | — | 200,000 | — | 144,500 | — | 344,500 | (741) | 343,759 | |||||||||||||||||||||||||||||||||||||||||||||||||||||||||||||||||
| Consolidated Debt - Fixed Rate | ||||||||||||||||||||||||||||||||||||||||||||||||||||||||||||||||||||||||||
| Term Loan, Unsecured (4) | 100% | 5.38% | 8/30/24 | — | 350,000 | — | — | — | — | 350,000 | (562) | 349,438 | ||||||||||||||||||||||||||||||||||||||||||||||||||||||||||||||
| Senior Note, Unsecured | 100% | 3.95% | 7/6/29 | — | — | — | — | — | 275,000 | 275,000 | (645) | 274,355 | ||||||||||||||||||||||||||||||||||||||||||||||||||||||||||||||
| Senior Note, Unsecured | 100% | 3.91% | 7/6/25 | — | — | 250,000 | — | — | — | 250,000 | (320) | 249,680 | ||||||||||||||||||||||||||||||||||||||||||||||||||||||||||||||
| Senior Note, Unsecured | 100% | 3.86% | 7/6/28 | — | — | — | — | — | 250,000 | 250,000 | (537) | 249,463 | ||||||||||||||||||||||||||||||||||||||||||||||||||||||||||||||
| Terminus (5) | 100% | 6.34% | 1/15/31 | — | — | — | — | — | 221,000 | 221,000 | (324) | 220,676 | ||||||||||||||||||||||||||||||||||||||||||||||||||||||||||||||
| Term Loan, Unsecured (2) | 100% | 5.45% | 3/3/25 | — | — | 200,000 | — | — | — | 200,000 | (780) | 199,220 | ||||||||||||||||||||||||||||||||||||||||||||||||||||||||||||||
| Fifth Third Center | 100% | 3.37% | 10/1/26 | 916 | 3,746 | 3,874 | 118,928 | — | — | 127,464 | (197) | 127,267 | ||||||||||||||||||||||||||||||||||||||||||||||||||||||||||||||
| Senior Note, Unsecured | 100% | 3.78% | 7/6/27 | — | — | — | — | 125,000 | — | 125,000 | (238) | 124,762 | ||||||||||||||||||||||||||||||||||||||||||||||||||||||||||||||
| Colorado Tower | 100% | 3.45% | 9/1/26 | 681 | 2,783 | 2,880 | 101,199 | — | — | 107,543 | (282) | 107,261 | ||||||||||||||||||||||||||||||||||||||||||||||||||||||||||||||
| Senior Note, Unsecured | 100% | 4.09% | 7/6/27 | — | — | — | — | 100,000 | — | 100,000 | (194) | 99,806 | ||||||||||||||||||||||||||||||||||||||||||||||||||||||||||||||
| Domain 10 | 100% | 3.75% | 11/1/24 | 498 | 72,558 | — | — | — | — | 73,056 | (340) | 72,716 | ||||||||||||||||||||||||||||||||||||||||||||||||||||||||||||||
| Total Consolidated Fixed Rate Debt | 2,095 | 429,087 | 456,754 | 220,127 | 225,000 | 746,000 | 2,079,063 | (4,419) | 2,074,644 | |||||||||||||||||||||||||||||||||||||||||||||||||||||||||||||||||
| Total Consolidated Debt | 2,095 | 429,087 | 656,754 | 220,127 | 369,500 | 746,000 | 2,423,563 | (5,160) | 2,418,403 | |||||||||||||||||||||||||||||||||||||||||||||||||||||||||||||||||
| Unconsolidated Debt - Floating Rate | ||||||||||||||||||||||||||||||||||||||||||||||||||||||||||||||||||||||||||
| Neuhoff (SOFR + 3.45%) (6) | 50% | 8.78% | 9/30/25 | — | — | 101,552 | — | — | — | 101,552 | (1,232) | 100,320 | ||||||||||||||||||||||||||||||||||||||||||||||||||||||||||||||
| Total Unconsolidated Floating Rate Debt | — | — | 101,552 | — | — | — | 101,552 | (1,232) | 100,320 | |||||||||||||||||||||||||||||||||||||||||||||||||||||||||||||||||
| . | ||||||||||||||||||||||||||||||||||||||||||||||||||||||||||||||||||||||||||
| Unconsolidated Debt - Fixed Rate | ||||||||||||||||||||||||||||||||||||||||||||||||||||||||||||||||||||||||||
| Medical Offices at Emory Hospital | 50% | 4.80% | 6/1/32 | — | — | — | — | — | 41,500 | 41,500 | (352) | 41,148 | ||||||||||||||||||||||||||||||||||||||||||||||||||||||||||||||
| Total Unconsolidated Fixed Rate Debt | — | — | — | — | — | 41,500 | 41,500 | (352) | 41,148 | |||||||||||||||||||||||||||||||||||||||||||||||||||||||||||||||||
| Total Unconsolidated Debt | — | — | 101,552 | — | — | 41,500 | 143,052 | (1,584) | 141,468 | |||||||||||||||||||||||||||||||||||||||||||||||||||||||||||||||||
| Total Debt | $ | 2,095 | $ | 429,087 | $ | 758,306 | $ | 220,127 | $ | 369,500 | $ | 787,500 | $ | 2,566,615 | $ | (6,744) | $ | 2,559,871 | ||||||||||||||||||||||||||||||||||||||||||||||||||||||||
| Total Maturities (7) | $ | — | $ | 420,865 | $ | 751,552 | $ | 215,159 | $ | 369,500 | $ | 787,500 | $ | 2,544,576 | ||||||||||||||||||||||||||||||||||||||||||||||||||||||||||||
| % of Maturities | — | % | 17 | % | 30 | % | 8 | % | 15 | % | 30 | % | 100 | % | ||||||||||||||||||||||||||||||||||||||||||||||||||||||||||||
| Cousins Properties | 27 |
Q3 2023 Supplemental Information | ||||||
| DEBT SCHEDULE (1) | ||||||||
| Cousins Properties | 28 |
Q3 2023 Supplemental Information | ||||||
| DEBT SCHEDULE (1) | ||||||||
| Total Principal ($ in thousands) |
Total Debt (%) | Weighted Average Interest Rate | Weighted Average Maturity (Years) (8) | |||||||||||||||||||||||
| Floating Rate Debt | $ | 446,052 | 17 | % | 6.94 | % | 2.3 | |||||||||||||||||||
| Fixed Rate Debt | 2,120,563 | 83 | % | 4.51 | % | 3.5 | ||||||||||||||||||||
| Total Debt | $ | 2,566,615 | 100 | % | 4.93 | % | 3.3 | |||||||||||||||||||
| (1) | All amounts are presented at Company share. | ||||
| (2) | As of September 30, 2023, the spread over Adjusted SOFR (SOFR + 0.10%) under the Term Loan was 1.05%. The loan matures on March 3, 2025 with four consecutive options to extend the maturity date for an additional six months each. In the second quarter of 2023, the Company entered into a floating-to-fixed interest rate swap with respect to $200 million of the $400 million Term Loan through the maturity date effectively fixing the underlying SOFR rate at 4.298%. |
||||
| (3) | As of September 30, 2023, the Company had $144.5 million drawn under the Credit Facility and had the ability to borrow the remaining $855.5 million. The spread over Adjusted SOFR (SOFR + 0.10%) under the Credit Facility at September 30, 2023 was 0.90%. |
||||
| (4) | In the third quarter of 2022, the Company entered into a floating-to-fixed interest rate swap through the maturity date effectively fixing the underlying SOFR rate at 4.234%. The spread over Adjusted SOFR (SOFR + 0.10%) at September 30, 2023 was 1.05%. The Company has four consecutive options to extend the maturity date for an additional six months each. |
||||
| (5) | Represents $123.0 million and $98.0 million non-cross collateralized mortgages secured by the Terminus 100 and Terminus 200 buildings, respectively. | ||||
| (6) | The Company's share of the total borrowing capacity of the construction loan is $156.4 million. The joint venture has a one option to extend the maturity date for an additional 12 months. | ||||
| (7) | Maturities include principal payments due at the maturity date. Maturities do not include scheduled principal payments due prior to the maturity date. | ||||
| (8) | If the Company exercises all available extension options noted above, the weighted average years to maturity increases to 3.9 years. | ||||
| Cousins Properties | 29 |
Q3 2023 Supplemental Information | ||||||
| JOINT VENTURE INFORMATION (1) | ||
| Joint Venture | Property | Cash Flows to Cousins (2) | Options | |||||||||||||||||
| Consolidated: | ||||||||||||||||||||
| HICO 100 Mill LLC | 100 Mill | 90% of cash flows until return of contributed capital to Partners; portions of cash amounts received in excess of contributed capital are paid to our partner as a promote. | Cousins can trigger a sale process, subject to a right of first offer that can be exercised by Partner. | |||||||||||||||||
| TR Domain Point LLC | Domain Point | Preferred return on preferred equity contribution, then 96.5% of remaining cash flows. | Partner has put option under various circumstances. | |||||||||||||||||
| Unconsolidated: | ||||||||||||||||||||
| AMCO 120 WT Holdings LLC | 120 West Trinity | 20% of cash flows. | Cousins or Partner can trigger a buyout upon which Cousins would receive the office component, and Partner would receive the multifamily component, with a net settlement at a then agreed upon value. | |||||||||||||||||
| Crawford Long-CPI, LLC | Medical Offices at Emory Hospital | 50% of cash flows. | Cousins can put its interest to Partner, or Partner can call Cousins' interest, at a value determined by appraisal. | |||||||||||||||||
| Neuhoff Holdings LLC | Neuhoff | 50% of cash flows until return of contributed capital to Partners; portions of cash amounts received in excess of contributed capital to equity partners are paid to development partner as a promote. | Cousins or its equity partner can trigger a sale process, subject to a right of first offer that can be exercised by the non-triggering party. | |||||||||||||||||
| (1) | This schedule only contains information related to joint ventures that hold an ownership interest in operating assets or projects under active development. | ||||
| (2) | Each respective joint venture agreement may contain additional terms that affect the distribution of operating cash flows and capital transaction proceeds that are not yet effective, including the distribution of promoted interest. | ||||
| Cousins Properties | 30 |
Q3 2023 Supplemental Information | ||||||
| NON-GAAP FINANCIAL MEASURES - CALCULATIONS AND RECONCILIATIONS | ||||||||
| ($ in thousands, except per share amounts) | ||||||||||||||||||||||||||||||||
| 2021 | 2022 1st | 2022 2nd | 2022 3rd | 2022 4th | 2022 | 2023 1st | 2023 2nd | 2023 3rd | YTD 2023 | |||||||||||||||||||||||
FFO and EBITDAre |
||||||||||||||||||||||||||||||||
| Net income available to common stockholders | $ | 278,586 | $ | 27,984 | $ | 34,052 | $ | 80,639 | $ | 24,118 | $ | 166,793 | $ | 22,196 | $ | 22,621 | $ | 19,361 | $ | 64,178 | ||||||||||||
| Depreciation and amortization of real estate assets: | ||||||||||||||||||||||||||||||||
| Consolidated properties | 287,469 | 70,589 | 69,703 | 78,978 | 75,759 | 295,029 | 75,662 | 80,158 | 79,379 | 235,199 | ||||||||||||||||||||||
| Share of unconsolidated joint ventures | 9,674 | 1,124 | 1,111 | 1,189 | 503 | 3,927 | 479 | 476 | 485 | 1,440 | ||||||||||||||||||||||
| Partners' share of real estate depreciation | (929) | (223) | (153) | (182) | (236) | (794) | (249) | (307) | (257) | (813) | ||||||||||||||||||||||
| Loss (gain) on depreciated property transactions: | ||||||||||||||||||||||||||||||||
| Consolidated properties | (152,611) | 69 | (28) | 20 | (52) | 9 | 2 | — | — | 2 | ||||||||||||||||||||||
| Share of unconsolidated joint ventures | 39 | (124) | 40 | — | 3 | (81) | — | — | — | — | ||||||||||||||||||||||
| Sale of investments in unconsolidated joint ventures | (13,083) | — | — | (56,260) | (7) | (56,267) | — | — | — | — | ||||||||||||||||||||||
| Non-controlling interest related to unitholders | 56 | 6 | 6 | 26 | 105 | 143 | 4 | 3 | 4 | 11 | ||||||||||||||||||||||
| FFO (1) | 409,201 | 99,425 | 104,731 | 104,410 | 100,193 | 408,759 | 98,094 | 102,951 | 98,972 | 300,017 | ||||||||||||||||||||||
| Interest Expense | 69,938 | 16,142 | 17,238 | 19,390 | 22,369 | 75,139 | 25,310 | 26,334 | 27,516 | 79,160 | ||||||||||||||||||||||
| Non-Real Estate Depreciation and Amortization | 623 | 155 | 158 | 138 | 107 | 558 | 108 | 111 | 113 | 332 | ||||||||||||||||||||||
EBITDAre (1) |
479,762 | 115,722 | 122,127 | 123,938 | 122,669 | 484,456 | 123,512 | 129,396 | 126,601 | 379,509 | ||||||||||||||||||||||
| FFO and Net Operating Income from Unconsolidated Joint Ventures | ||||||||||||||||||||||||||||||||
| Income from Unconsolidated Joint Ventures | 6,801 | 1,124 | 5,280 | 634 | 662 | 7,700 | 673 | 753 | 582 | 2,008 | ||||||||||||||||||||||
| Depreciation and Amortization of Real Estate | 9,674 | 1,124 | 1,111 | 1,189 | 503 | 3,927 | 479 | 476 | 485 | 1,440 | ||||||||||||||||||||||
| Loss (gain) on sale of depreciated investment properties, net | 39 | (124) | 40 | — | 3 | (81) | — | — | — | — | ||||||||||||||||||||||
| FFO - Unconsolidated Joint Ventures | 16,514 | 2,124 | 6,431 | 1,823 | 1,168 | 11,546 | 1,152 | 1,229 | 1,067 | 3,448 | ||||||||||||||||||||||
| Loss (gain) on sale of undepreciated property | — | — | (4,500) | 22 | — | (4,478) | — | — | — | — | ||||||||||||||||||||||
| Interest Expense | 2,911 | 617 | 689 | 1,010 | 287 | 2,603 | 280 | 362 | 508 | 1,150 | ||||||||||||||||||||||
| Other Expense | 46 | 11 | 16 | 19 | 24 | 70 | 14 | 6 | 24 | 44 | ||||||||||||||||||||||
| Termination Fee Income | (81) | — | — | — | — | — | — | — | — | — | ||||||||||||||||||||||
| Other Income | (167) | (33) | (94) | (55) | (35) | (217) | (37) | (38) | (35) | (110) | ||||||||||||||||||||||
| Net Operating Income - Unconsolidated Joint Ventures | 19,223 | 2,719 | 2,542 | 2,819 | 1,444 | 9,524 | 1,409 | 1,559 | 1,564 | 4,532 | ||||||||||||||||||||||
| Market Capitalization | ||||||||||||||||||||||||||||||||
| Common Stock Price Per Share at Period End | $ | 40.28 | $ | 40.29 | $ | 29.23 | $ | 23.35 | $ | 25.29 | $ | 25.29 | $ | 21.38 | $ | 22.80 | $ | 20.37 | $ | 20.37 | ||||||||||||
| Number of Common Stock/Units Outstanding at Period End |
148,713 | 148,788 | 151,465 | 151,459 | 151,482 | 151,482 | 151,718 | 151,774 | 151,774 | 151,774 | ||||||||||||||||||||||
| Equity Market Capitalization | 5,990,160 | 5,994,669 | 4,427,322 | 3,536,568 | 3,830,980 | 3,830,980 | 3,243,731 | 3,460,447 | 3,091,636 | 3,091,636 | ||||||||||||||||||||||
| Consolidated Debt | 2,237,509 | 2,349,484 | 2,305,637 | 2,295,989 | 2,334,606 | 2,334,606 | 2,448,942 | 2,423,761 | 2,418,403 | 2,418,403 | ||||||||||||||||||||||
| Share of Unconsolidated Debt | 112,805 | 112,713 | 119,702 | 76,942 | 89,398 | 89,398 | 96,014 | 124,312 | 141,468 | 141,468 | ||||||||||||||||||||||
| Debt (1) | 2,350,314 | 2,462,197 | 2,425,339 | 2,372,931 | 2,424,004 | 2,424,004 | 2,544,956 | 2,548,073 | 2,559,871 | 2,559,871 | ||||||||||||||||||||||
| Total Market Capitalization | 8,340,474 | 8,456,866 | 6,852,661 | 5,909,499 | 6,254,984 | 6,254,984 | 5,788,687 | 6,008,520 | 5,651,507 | 5,651,507 | ||||||||||||||||||||||
| Continued on next page | ||||||||||||||||||||||||||||||||
| Cousins Properties | 31 |
Q3 2023 Supplemental Information | ||||||
| NON-GAAP FINANCIAL MEASURES - CALCULATIONS AND RECONCILIATIONS | ||||||||
| ($ in thousands, except per share amounts) | ||||||||||||||||||||||||||||||||
| 2021 | 2022 1st | 2022 2nd | 2022 3rd | 2022 4th | 2022 | 2023 1st | 2023 2nd | 2023 3rd | YTD 2023 | |||||||||||||||||||||||
| Credit Ratios | ||||||||||||||||||||||||||||||||
| Debt (1) | 2,350,314 | 2,462,197 | 2,425,339 | 2,372,931 | 2,424,004 | 2,424,004 | 2,544,956 | 2,548,073 | 2,559,871 | 2,559,871 | ||||||||||||||||||||||
| Less: Cash and Cash Equivalents | (8,937) | (7,000) | (4,057) | (5,507) | (5,145) | (5,145) | (3,585) | (8,031) | (6,926) | (6,926) | ||||||||||||||||||||||
| Less: Share of Unconsolidated Cash and Cash Equivalents (1) | (4,285) | (9,217) | (13,110) | (10,894) | (1,721) | (1,721) | (8,905) | (7,789) | (8,269) | (8,269) | ||||||||||||||||||||||
| Net Debt (1) | 2,337,092 | 2,445,980 | 2,408,172 | 2,356,530 | 2,417,138 | 2,417,138 | 2,532,466 | 2,532,253 | 2,544,676 | 2,544,676 | ||||||||||||||||||||||
| Total Market Capitalization | 8,340,474 | 8,456,866 | 6,852,661 | 5,909,499 | 6,254,984 | 6,254,984 | 5,788,687 | 6,008,520 | 5,651,507 | 5,651,507 | ||||||||||||||||||||||
| Net Debt / Total Market Capitalization | 28.0 | % | 28.9% | 35.1 | % | 39.9 | % | 38.6 | % | 38.6 | % | 43.7 | % | 42.1 | % | 45.0 | % | 45.0 | % | |||||||||||||
| Total Assets - Consolidated | 7,312,034 | 7,360,095 | 7,380,124 | 7,496,072 | 7,537,016 | 7,537,016 | 7,582,970 | 7,595,785 | 7,585,309 | 7,585,309 | ||||||||||||||||||||||
| Accumulated Depreciation - Consolidated | 1,065,047 | 1,110,315 | 1,158,044 | 1,218,996 | 1,261,752 | 1,261,752 | 1,314,000 | 1,381,054 | 1,443,382 | 1,443,382 | ||||||||||||||||||||||
| Undepreciated Assets - Unconsolidated (1) | 204,423 | 221,851 | 257,685 | 204,033 | 209,636 | 209,636 | 240,386 | 257,697 | 272,556 | 272,556 | ||||||||||||||||||||||
| Less: Investment in Unconsolidated Joint Ventures | (77,811) | (93,307) | (103,215) | (106,389) | (112,839) | (112,839) | (136,721) | (138,992) | (141,250) | (141,250) | ||||||||||||||||||||||
| Total Undepreciated Assets (1) | 8,503,693 | 8,598,954 | 8,692,638 | 8,812,712 | 8,895,565 | 8,895,565 | 9,000,635 | 9,095,544 | 9,159,997 | 9,159,997 | ||||||||||||||||||||||
| Net Debt (1) | 2,337,092 | 2,445,980 | 2,408,172 | 2,356,530 | 2,417,138 | 2,417,138 | 2,532,466 | 2,532,253 | 2,544,676 | 2,544,676 | ||||||||||||||||||||||
| Net Debt / Total Undepreciated Assets (1) | 27.5 | % | 28.4% | 27.7 | % | 26.7 | % | 27.2 | % | 27.2 | % | 28.1 | % | 27.8 | % | 27.8 | % | 27.8 | % | |||||||||||||
| Coverage Ratios (1) | ||||||||||||||||||||||||||||||||
| Interest Expense | 69,938 | 16,142 | 17,238 | 19,390 | 22,369 | 75,139 | 25,310 | 26,334 | 27,516 | 79,160 | ||||||||||||||||||||||
| Scheduled Principal Payments | 18,131 | 4,675 | 4,719 | 4,764 | 3,616 | 17,774 | 2,272 | 2,214 | 2,077 | 6,563 | ||||||||||||||||||||||
| Fixed Charges | 88,069 | 20,817 | 21,957 | 24,154 | 25,985 | 92,913 | 27,582 | 28,548 | 29,593 | 85,723 | ||||||||||||||||||||||
EBITDAre |
479,762 | 115,722 | 122,127 | 123,938 | 122,669 | 484,456 | 123,512 | 129,396 | 126,601 | 379,509 | ||||||||||||||||||||||
Fixed Charges Coverage Ratio (EBITDAre) (1) |
5.45 | 5.56 | 5.56 | 5.13 | 4.72 | 5.21 | 4.48 | 4.53 | 4.28 | 4.43 | ||||||||||||||||||||||
| Net Debt | 2,337,092 | 2,445,980 | 2,408,172 | 2,356,530 | 2,417,138 | 2,417,138 | 2,532,466 | 2,532,253 | 2,544,676 | 2,544,676 | ||||||||||||||||||||||
Annualized EBITDAre (2) |
480,476 | 462,888 | 488,508 | 495,752 | 490,676 | 490,676 | 494,048 | 517,584 | 506,404 | 506,404 | ||||||||||||||||||||||
Net Debt / Annualized EBITDAre |
4.86 | 5.28 | 4.93 | 4.75 | 4.93 | 4.93 | 5.13 | 4.89 | 5.02 | 5.02 | ||||||||||||||||||||||
| Dividend Information | ||||||||||||||||||||||||||||||||
| Common Dividends | 185,176 | 48,447 | 48,523 | 48,398 | 48,525 | 193,893 | 48,598 | 48,650 | 48,650 | 145,898 | ||||||||||||||||||||||
| FFO | 409,201 | 99,425 | 104,731 | 104,410 | 100,193 | 408,759 | 98,094 | 102,951 | 98,972 | 300,017 | ||||||||||||||||||||||
| FFO Payout Ratio | 45.3 | % | 48.7% | 46.3 | % | 46.4 | % | 48.4 | % | 47.4 | % | 49.5 | % | 47.3 | % | 49.2 | % | 48.6 | % | |||||||||||||
| Continued on next page | ||||||||||||||||||||||||||||||||
| Cousins Properties | 32 |
Q3 2023 Supplemental Information | ||||||
| NON-GAAP FINANCIAL MEASURES - CALCULATIONS AND RECONCILIATIONS | ||||||||
| ($ in thousands, except per share amounts) | ||||||||||||||||||||||||||||||||
| 2021 | 2022 1st | 2022 2nd | 2022 3rd | 2022 4th | 2022 | 2023 1st | 2023 2nd | 2023 3rd | YTD 2023 | |||||||||||||||||||||||
| Net income available to common stockholders | $ | 278,586 | $ | 27,984 | $ | 34,052 | $ | 80,639 | $ | 24,118 | $ | 166,793 | $ | 22,196 | $ | 22,621 | $ | 19,361 | $ | 64,178 | ||||||||||||
| Depreciation and amortization of real estate assets | 296,214 | 71,490 | 70,661 | 79,985 | 76,026 | 298,162 | 75,892 | 80,327 | 79,607 | 235,826 | ||||||||||||||||||||||
| Loss (gain) on depreciated property transactions | (165,655) | (55) | 12 | (56,240) | (56) | (56,339) | 2 | — | — | 2 | ||||||||||||||||||||||
| Non-controlling interest related to unitholders | 56 | 6 | 6 | 26 | 105 | 143 | 4 | 3 | 4 | 11 | ||||||||||||||||||||||
| FFO (1) | 409,201 | 99,425 | 104,731 | 104,410 | 100,193 | 408,759 | 98,094 | 102,951 | 98,972 | 300,017 | ||||||||||||||||||||||
| Amortization of Deferred Financing Costs | 3,063 | 973 | 923 | 818 | 683 | 3,397 | 1,030 | 1,044 | 1,050 | 3,124 | ||||||||||||||||||||||
| Non-Cash Stock-Based Compensation | 7,005 | 2,748 | 2,448 | 2,299 | 2,564 | 10,059 | 3,512 | 2,770 | 2,817 | 9,099 | ||||||||||||||||||||||
| Non-Real Estate Depreciation and Amortization | 623 | 155 | 158 | 138 | 107 | 558 | 108 | 111 | 113 | 332 | ||||||||||||||||||||||
| Lease Inducement Amortization | 3,434 | 351 | 375 | 440 | 463 | 1,629 | 492 | 1,991 | 607 | 3,090 | ||||||||||||||||||||||
| Straight-Line Rent Ground Leases | 449 | 124 | 121 | 121 | 125 | 491 | 126 | 125 | 125 | 376 | ||||||||||||||||||||||
| Above and Below Market Ground Rent | 159 | 92 | 82 | 82 | 83 | 339 | 82 | 82 | 82 | 246 | ||||||||||||||||||||||
| Debt Premium Amortization | (3,664) | (916) | (998) | (998) | (1,001) | (3,913) | — | — | — | — | ||||||||||||||||||||||
| Deferred Income - Tenant Improvements | (9,430) | (633) | (611) | (3,139) | (3,022) | (7,405) | (3,609) | (5,772) | (4,779) | (14,160) | ||||||||||||||||||||||
| Above and Below Market Rents, Net | (10,762) | (1,771) | (1,669) | (1,538) | (1,466) | (6,444) | (1,559) | (2,525) | (1,371) | (5,455) | ||||||||||||||||||||||
| Second Generation Capital Expenditures (CAPEX) | (81,642) | (21,280) | (24,324) | (26,636) | (27,261) | (99,501) | (15,467) | (29,317) | (20,224) | (65,008) | ||||||||||||||||||||||
| Straight-Line Rental Revenue | (24,821) | (5,501) | (6,378) | (8,966) | (8,108) | (28,953) | (8,431) | (3,703) | (7,508) | (19,642) | ||||||||||||||||||||||
| Loss (Gain) on Sales of Undepreciated Investment Properties | 64 | — | (4,500) | 22 | — | (4,478) | — | — | (507) | (507) | ||||||||||||||||||||||
| FAD (1) | 293,679 | 73,767 | 70,358 | 67,053 | 63,360 | 274,538 | 74,378 | 67,757 | 69,377 | 211,512 | ||||||||||||||||||||||
| Weighted Average Shares - Diluted | 148,891 | 149,002 | 149,142 | 151,695 | 151,835 | 150,419 | 151,880 | 152,126 | 152,048 | 152,018 | ||||||||||||||||||||||
| FAD per share | $ | 1.97 | $ | 0.50 | $ | 0.47 | $ | 0.44 | $ | 0.42 | $ | 1.83 | $ | 0.49 | $ | 0.45 | $ | 0.46 | $ | 1.40 | ||||||||||||
| Common Dividends | 185,176 | 48,447 | 48,523 | 48,398 | 48,525 | 193,893 | 48,598 | 48,650 | 48,650 | 145,898 | ||||||||||||||||||||||
| Common Dividends per share | $ | 1.24 | $ | 0.32 | $ | 0.32 | $ | 0.32 | $ | 0.32 | $ | 1.28 | $ | 0.32 | $ | 0.32 | $ | 0.32 | $ | 0.96 | ||||||||||||
| FAD Payout Ratio | 63.1 | % | 65.7% | 69.0 | % | 72.2 | % | 76.6 | % | 70.6 | % | 65.3 | % | 71.8 | % | 70.1 | % | 69.0 | % | |||||||||||||
| Operations Ratio | ||||||||||||||||||||||||||||||||
| Total Undepreciated Assets (1) | 8,503,693 | 8,598,954 | 8,692,638 | 8,812,712 | 8,895,565 | 8,895,565 | 9,000,635 | 9,095,544 | 9,159,997 | 9,159,997 | ||||||||||||||||||||||
| General and Administrative Expenses | 29,321 | 8,063 | 6,996 | 6,498 | 6,762 | 28,319 | 8,438 | 8,021 | 8,336 | 24,795 | ||||||||||||||||||||||
| Annualized General and Administrative Expenses (2) / Total Undepreciated Assets | 0.34 | % | 0.38% | 0.32 | % | 0.29 | % | 0.30 | % | 0.30 | % | 0.37 | % | 0.35 | % | 0.36 | % | 0.36 | % | |||||||||||||
| 2nd Generation CAPEX | ||||||||||||||||||||||||||||||||
| Second Generation Leasing Related Costs | 58,908 | 13,898 | 20,524 | 19,136 | 14,771 | 68,329 | 11,182 | 22,640 | 10,810 | 44,632 | ||||||||||||||||||||||
| Second Generation Building Improvements | 22,734 | 7,382 | 3,800 | 7,500 | 12,490 | 31,172 | 4,285 | 6,677 | 9,414 | 20,376 | ||||||||||||||||||||||
| 81,642 | 21,280 | 24,324 | 26,636 | 27,261 | 99,501 | 15,467 | 29,317 | 20,224 | 65,008 | |||||||||||||||||||||||
| (1) Includes the Company's share of unconsolidated joint ventures. These amounts are derived from the amounts in the categories indicated that are recorded at the joint venture multiplied by the Company's ownership interest. The Company does not control the operations of the unconsolidated joint ventures but believes that including these amounts in the categories indicated is meaningful to investors and analysts. | ||||||||||||||||||||||||||||||||
| (2) Amounts represent most recent quarter annualized. | ||||||||||||||||||||||||||||||||
| Note: Amounts may differ slightly from other schedules contained herein due to rounding. | ||||||||||||||||||||||||||||||||
| Cousins Properties | 33 |
Q3 2023 Supplemental Information | ||||||
| NON-GAAP FINANCIAL MEASURES - CALCULATIONS AND RECONCILIATIONS | ||||||||
| ($ in thousands, except per share amounts) | |||||||||||||||||||||||||||||||||||
Three Months Ended September 30, |
|||||||||||||||||||||||||||||||||||
2023 |
2022 |
||||||||||||||||||||||||||||||||||
| Dollars | Weighted Average Common Shares | Per Share Amount | Dollars | Weighted Average Common Shares | Per Share Amount | ||||||||||||||||||||||||||||||
| Net Income Available to Common Stockholders | $ | 19,361 | 151,774 | $ | 0.13 | $ | 80,639 | 151,435 | $ | 0.53 | |||||||||||||||||||||||||
| Noncontrolling interest related to unitholders | 4 | 25 | — | 26 | 25 | — | |||||||||||||||||||||||||||||
| Conversion of unvested restricted stock units | — | 249 | — | — | 235 | — | |||||||||||||||||||||||||||||
| Net Income — Diluted | 19,365 | 152,048 | 0.13 | 80,665 | 151,695 | 0.53 | |||||||||||||||||||||||||||||
| Depreciation and amortization of real estate assets: | |||||||||||||||||||||||||||||||||||
| Consolidated properties | 79,379 | — | 0.52 | 78,978 | — | 0.52 | |||||||||||||||||||||||||||||
| Share of unconsolidated joint ventures | 485 | — | — | 1,189 | — | 0.01 | |||||||||||||||||||||||||||||
| Partners' share of real estate depreciation | (257) | — | — | (182) | — | — | |||||||||||||||||||||||||||||
| Loss (gain) on depreciated property transactions: | |||||||||||||||||||||||||||||||||||
| Consolidated properties | — | — | — | 20 | — | — | |||||||||||||||||||||||||||||
| Investments in unconsolidated joint ventures | — | — | — | (56,260) | — | (0.37) | |||||||||||||||||||||||||||||
| Funds From Operations | $ | 98,972 | 152,048 | $ | 0.65 | $ | 104,410 | 151,695 | $ | 0.69 | |||||||||||||||||||||||||
| Cousins Properties | 34 |
Q3 2023 Supplemental Information | ||||||
| NON-GAAP FINANCIAL MEASURES - CALCULATIONS AND RECONCILIATIONS | ||||||||
| ($ in thousands, except per share amounts) | |||||||||||||||||||||||||||||||||||
| Nine Months Ended September 30, | |||||||||||||||||||||||||||||||||||
2023 |
2022 |
||||||||||||||||||||||||||||||||||
| Dollars | Weighted Average Common Shares | Per Share Amount | Dollars | Weighted Average Common Shares | Per Share Amount | ||||||||||||||||||||||||||||||
| Net Income Available to Common Stockholders | $ | 64,178 | 151,692 | $ | 0.42 | $ | 142,675 | 149,670 | $ | 0.95 | |||||||||||||||||||||||||
| Noncontrolling interest related to unitholders | 11 | 25 | — | 38 | 25 | — | |||||||||||||||||||||||||||||
| Conversion of unvested restricted stock units | — | 301 | — | — | 251 | — | |||||||||||||||||||||||||||||
| Net Income — Diluted | 64,189 | 152,018 | 0.42 | 142,713 | 149,946 | 0.95 | |||||||||||||||||||||||||||||
| Depreciation and amortization of real estate assets: | |||||||||||||||||||||||||||||||||||
| Consolidated properties | 235,199 | — | 1.55 | 219,270 | — | 1.46 | |||||||||||||||||||||||||||||
| Share of unconsolidated joint ventures | 1,440 | — | — | 3,424 | — | 0.02 | |||||||||||||||||||||||||||||
| Partners' share of real estate depreciation | (813) | — | — | (558) | — | — | |||||||||||||||||||||||||||||
| Loss (gain) on depreciated property transactions: | |||||||||||||||||||||||||||||||||||
| Consolidated properties | 2 | — | — | 61 | — | — | |||||||||||||||||||||||||||||
| Share of unconsolidated joint ventures | — | — | — | (84) | — | — | |||||||||||||||||||||||||||||
| Investments in unconsolidated joint ventures | — | — | (56,260) | — | (0.37) | ||||||||||||||||||||||||||||||
| Funds From Operations | $ | 300,017 | 152,018 | $ | 1.97 | $ | 308,566 | 149,946 | $ | 2.06 | |||||||||||||||||||||||||
| Cousins Properties | 35 |
Q3 2023 Supplemental Information | ||||||
| NON-GAAP FINANCIAL MEASURES - CALCULATIONS AND RECONCILIATIONS | ||||||||
| ($ in thousands) | ($ in thousands) | ||||||||||||||||||||||
| Three Months Ended | Nine Months Ended | ||||||||||||||||||||||
| Net Operating Income | September 30, 2023 |
September 30, 2022 | September 30, 2023 | September 30, 2022 | |||||||||||||||||||
| Net income | $ | 19,491 | $ | 80,769 | $ | 64,924 | $ | 143,096 | |||||||||||||||
| Net operating income from unconsolidated joint ventures | 1,564 | 2,819 | 4,532 | 8,080 | |||||||||||||||||||
| Fee income | (318) | (1,677) | (1,044) | (5,370) | |||||||||||||||||||
| Termination fee income | (271) | (242) | (6,977) | (2,153) | |||||||||||||||||||
| Other income | (101) | (38) | (2,393) | (2,522) | |||||||||||||||||||
| Reimbursed expenses | 149 | 418 | 515 | 1,455 | |||||||||||||||||||
| General and administrative expenses | 8,336 | 6,498 | 24,795 | 21,557 | |||||||||||||||||||
| Interest expense | 27,008 | 18,380 | 78,010 | 50,454 | |||||||||||||||||||
| Depreciation and amortization | 79,492 | 79,116 | 235,531 | 219,721 | |||||||||||||||||||
| Other expenses | 623 | 231 | 1,484 | 877 | |||||||||||||||||||
| Income from unconsolidated joint ventures | (582) | (634) | (2,008) | (7,038) | |||||||||||||||||||
| Gain on sale of investment in unconsolidated joint ventures | — | (56,260) | — | (56,260) | |||||||||||||||||||
| Loss (gain) on investment property transactions | (507) | 20 | (505) | 61 | |||||||||||||||||||
| Loss on extinguishment of debt | — | — | — | 100 | |||||||||||||||||||
| Net Operating Income | 134,884 | 129,400 | 396,864 | 372,058 | |||||||||||||||||||
| Less: | |||||||||||||||||||||||
| Partners' share of NOI from consolidated joint ventures | (412) | (347) | (1,310) | (1,107) | |||||||||||||||||||
| Cousins' share of NOI | $ | 134,472 | $ | 129,053 | $ | 395,554 | $ | 370,951 | |||||||||||||||
| Net Operating Income | $ | 134,884 | $ | 129,400 | $ | 396,864 | $ | 372,058 | |||||||||||||||
| Non-cash income | (13,421) | (13,531) | (38,089) | (30,367) | |||||||||||||||||||
| Non-cash expense | 233 | 229 | 696 | 721 | |||||||||||||||||||
| Cash-Basis Net Operating Income | $ | 121,696 | $ | 116,098 | $ | 359,471 | $ | 342,412 | |||||||||||||||
| Net Operating Income | |||||||||||||||||||||||
| Same Property | $ | 124,560 | $ | 119,697 | $ | 368,922 | $ | 350,480 | |||||||||||||||
| Non-Same Property | 10,324 | 9,703 | 27,942 | 21,578 | |||||||||||||||||||
| $ | 134,884 | $ | 129,400 | $ | 396,864 | $ | 372,058 | ||||||||||||||||
| Cash-Basis Net Operating Income | |||||||||||||||||||||||
| Same Property | $ | 114,657 | $ | 109,611 | $ | 340,208 | $ | 325,788 | |||||||||||||||
| Non-Same Property | 7,039 | 6,487 | 19,263 | 16,624 | |||||||||||||||||||
| $ | 121,696 | $ | 116,098 | $ | 359,471 | $ | 342,412 | ||||||||||||||||
| Cousins Properties | 36 |
Q3 2023 Supplemental Information | ||||||
| NON-GAAP FINANCIAL MEASURES - CALCULATIONS AND RECONCILIATIONS | ||||||||
| Full Year 2023 Guidance | |||||||||||||||||||||||||||||
| ($ in thousands, except per share amounts) | |||||||||||||||||||||||||||||
| Low | High | ||||||||||||||||||||||||||||
| Dollars | Per Share Amount (1) | Dollars | Per Share Amount (1) | ||||||||||||||||||||||||||
| Net Income Available to Common Stockholders and Net Income | $ | 81,434 | $ | 0.54 | $ | 87,516 | $ | 0.58 | |||||||||||||||||||||
| Add: Noncontrolling interest related to unitholders | 15 | — | 15 | — | |||||||||||||||||||||||||
| Net Income | 81,449 | 0.54 | 87,531 | 0.58 | |||||||||||||||||||||||||
| Add: Depreciation and amortization of real estate assets | 313,894 | 2.06 | 313,894 | 2.06 | |||||||||||||||||||||||||
| Funds From Operations | $ | 395,343 | $ | 2.60 | $ | 401,425 | $ | 2.64 | |||||||||||||||||||||
| (1) Calculated based on projected weighted average shares outstanding of 152.1 million. | |||||||||||||||||||||||||||||
| Cousins Properties | 37 |
Q3 2023 Supplemental Information | ||||||
| NON-GAAP FINANCIAL MEASURES - DEFINITIONS | ||||||||
| Cousins Properties | 38 |
Q3 2023 Supplemental Information | ||||||