0000022444FALSE2024FY11http://fasb.org/us-gaap/2023#OtherAssetsNoncurrenthttp://fasb.org/us-gaap/2023#OtherAssetsNoncurrenthttp://fasb.org/us-gaap/2023#PropertyPlantAndEquipmentNethttp://fasb.org/us-gaap/2023#PropertyPlantAndEquipmentNethttp://fasb.org/us-gaap/2023#OtherAccountsPayableAndAccruedLiabilitieshttp://fasb.org/us-gaap/2023#OtherAccountsPayableAndAccruedLiabilitieshttp://fasb.org/us-gaap/2023#OtherLiabilitiesNoncurrenthttp://fasb.org/us-gaap/2023#OtherLiabilitiesNoncurrenthttp://fasb.org/us-gaap/2023#LongTermDebtCurrenthttp://fasb.org/us-gaap/2023#LongTermDebtCurrenthttp://fasb.org/us-gaap/2023#LongTermDebtAndCapitalLeaseObligationshttp://fasb.org/us-gaap/2023#LongTermDebtAndCapitalLeaseObligationshttp://fasb.org/us-gaap/2023#OtherComprehensiveIncomeLossNetOfTaxhttp://fasb.org/us-gaap/2023#CostOfGoodsAndServicesSoldhttp://fasb.org/us-gaap/2023#OtherComprehensiveIncomeLossNetOfTaxhttp://fasb.org/us-gaap/2023#CostOfGoodsAndServicesSoldhttp://fasb.org/us-gaap/2023#OtherComprehensiveIncomeLossNetOfTaxhttp://fasb.org/us-gaap/2023#CostOfGoodsAndServicesSoldhttp://fasb.org/us-gaap/2023#SellingGeneralAndAdministrativeExpensehttp://fasb.org/us-gaap/2023#SellingGeneralAndAdministrativeExpensehttp://fasb.org/us-gaap/2023#SellingGeneralAndAdministrativeExpensehttp://fasb.org/us-gaap/2023#SellingGeneralAndAdministrativeExpensehttp://fasb.org/us-gaap/2023#SellingGeneralAndAdministrativeExpensehttp://fasb.org/us-gaap/2023#SellingGeneralAndAdministrativeExpensehttp://fasb.org/us-gaap/2023#SellingGeneralAndAdministrativeExpensehttp://fasb.org/us-gaap/2023#OtherLiabilitiesNoncurrenthttp://fasb.org/us-gaap/2023#Liabilitieshttp://fasb.org/us-gaap/2023#OtherLiabilitiesNoncurrenthttp://fasb.org/us-gaap/2023#Liabilitiesiso4217:USDxbrli:sharesiso4217:USDxbrli:sharescmc:segmentscmc:millxbrli:purecmc:facilityiso4217:PLNcmc:numberOfTaxCreditTransactionsutr:tutr:MWhutr:MMBTUcmc:Interval00000224442023-09-012024-08-3100000224442024-02-2900000224442024-10-1400000224442022-09-012023-08-3100000224442021-09-012022-08-3100000224442024-08-3100000224442023-08-3100000224442022-08-3100000224442021-08-310000022444us-gaap:CommonStockMember2021-08-310000022444us-gaap:AdditionalPaidInCapitalMember2021-08-310000022444us-gaap:AccumulatedOtherComprehensiveIncomeMember2021-08-310000022444us-gaap:RetainedEarningsMember2021-08-310000022444us-gaap:TreasuryStockCommonMember2021-08-310000022444us-gaap:NoncontrollingInterestMember2021-08-310000022444us-gaap:RetainedEarningsMember2021-09-012022-08-310000022444us-gaap:AccumulatedOtherComprehensiveIncomeMember2021-09-012022-08-310000022444us-gaap:TreasuryStockCommonMember2021-09-012022-08-310000022444us-gaap:AdditionalPaidInCapitalMember2021-09-012022-08-310000022444us-gaap:CommonStockMember2022-08-310000022444us-gaap:AdditionalPaidInCapitalMember2022-08-310000022444us-gaap:AccumulatedOtherComprehensiveIncomeMember2022-08-310000022444us-gaap:RetainedEarningsMember2022-08-310000022444us-gaap:TreasuryStockCommonMember2022-08-310000022444us-gaap:NoncontrollingInterestMember2022-08-310000022444us-gaap:RetainedEarningsMember2022-09-012023-08-310000022444us-gaap:AccumulatedOtherComprehensiveIncomeMember2022-09-012023-08-310000022444us-gaap:TreasuryStockCommonMember2022-09-012023-08-310000022444us-gaap:AdditionalPaidInCapitalMember2022-09-012023-08-310000022444us-gaap:NoncontrollingInterestMember2022-09-012023-08-310000022444us-gaap:CommonStockMember2023-08-310000022444us-gaap:AdditionalPaidInCapitalMember2023-08-310000022444us-gaap:AccumulatedOtherComprehensiveIncomeMember2023-08-310000022444us-gaap:RetainedEarningsMember2023-08-310000022444us-gaap:TreasuryStockCommonMember2023-08-310000022444us-gaap:NoncontrollingInterestMember2023-08-310000022444us-gaap:RetainedEarningsMember2023-09-012024-08-310000022444us-gaap:AccumulatedOtherComprehensiveIncomeMember2023-09-012024-08-310000022444us-gaap:TreasuryStockCommonMember2023-09-012024-08-310000022444us-gaap:AdditionalPaidInCapitalMember2023-09-012024-08-310000022444us-gaap:NoncontrollingInterestMember2023-09-012024-08-310000022444us-gaap:CommonStockMember2024-08-310000022444us-gaap:AdditionalPaidInCapitalMember2024-08-310000022444us-gaap:AccumulatedOtherComprehensiveIncomeMember2024-08-310000022444us-gaap:RetainedEarningsMember2024-08-310000022444us-gaap:TreasuryStockCommonMember2024-08-310000022444us-gaap:NoncontrollingInterestMember2024-08-310000022444cmc:SecuredAccountsReceivableMember2024-08-310000022444cmc:SecuredAccountsReceivableMember2023-08-310000022444srt:MinimumMemberus-gaap:BuildingMember2024-08-310000022444srt:MaximumMemberus-gaap:BuildingMember2024-08-310000022444srt:MinimumMemberus-gaap:LandImprovementsMember2024-08-310000022444srt:MaximumMemberus-gaap:LandImprovementsMember2024-08-310000022444srt:MinimumMemberus-gaap:LeaseholdImprovementsMember2024-08-310000022444srt:MaximumMemberus-gaap:LeaseholdImprovementsMember2024-08-310000022444srt:MinimumMemberus-gaap:MachineryAndEquipmentMember2024-08-310000022444srt:MaximumMemberus-gaap:MachineryAndEquipmentMember2024-08-310000022444srt:MinimumMemberus-gaap:SoftwareDevelopmentMember2024-08-310000022444srt:MaximumMemberus-gaap:SoftwareDevelopmentMember2024-08-3100000224442023-06-012023-08-310000022444cmc:PolandCompensationSchemeActMember2023-09-012024-08-310000022444cmc:PolandCompensationSchemeActMember2022-09-012023-08-310000022444cmc:PolandCompensationSchemeActMember2021-09-012022-08-310000022444cmc:EnergyAidProgram2022Member2023-09-012024-08-310000022444cmc:EnergyAidProgram2022Member2022-09-012023-08-310000022444cmc:WestVirginiaEconomicDevelopmentAuthorityMember2023-09-012024-08-310000022444cmc:WestVirginiaEconomicDevelopmentAuthorityMember2022-09-012023-08-310000022444cmc:RoaneMetalsGroupLLCMember2023-03-032023-03-030000022444cmc:EDSCOFastenersLLCMember2023-07-122023-07-120000022444cmc:TensarMember2022-04-250000022444cmc:TensarMember2022-04-252022-04-250000022444cmc:TensarMember2022-04-252022-08-310000022444cmc:TensarMember2021-09-012022-08-310000022444cmc:RanchoCucamongaFacilityAndRebarFabricationFacilityMember2021-12-282021-12-280000022444cmc:RanchoCucamongaFacilityAndRebarFabricationFacilityMember2022-09-012023-08-310000022444cmc:RanchoCucamongaFacilityAndRebarFabricationFacilityMember2021-09-012022-08-310000022444us-gaap:AccumulatedTranslationAdjustmentMember2021-08-310000022444us-gaap:AccumulatedNetGainLossFromDesignatedOrQualifyingCashFlowHedgesMember2021-08-310000022444us-gaap:AccumulatedDefinedBenefitPlansAdjustmentMember2021-08-310000022444us-gaap:AccumulatedTranslationAdjustmentMember2021-09-012022-08-310000022444us-gaap:AccumulatedNetGainLossFromDesignatedOrQualifyingCashFlowHedgesMember2021-09-012022-08-310000022444us-gaap:AccumulatedDefinedBenefitPlansAdjustmentMember2021-09-012022-08-310000022444us-gaap:AccumulatedTranslationAdjustmentMember2022-08-310000022444us-gaap:AccumulatedNetGainLossFromDesignatedOrQualifyingCashFlowHedgesMember2022-08-310000022444us-gaap:AccumulatedDefinedBenefitPlansAdjustmentMember2022-08-310000022444us-gaap:AccumulatedTranslationAdjustmentMember2022-09-012023-08-310000022444us-gaap:AccumulatedNetGainLossFromDesignatedOrQualifyingCashFlowHedgesMember2022-09-012023-08-310000022444us-gaap:AccumulatedDefinedBenefitPlansAdjustmentMember2022-09-012023-08-310000022444us-gaap:AccumulatedTranslationAdjustmentMember2023-08-310000022444us-gaap:AccumulatedNetGainLossFromDesignatedOrQualifyingCashFlowHedgesMember2023-08-310000022444us-gaap:AccumulatedDefinedBenefitPlansAdjustmentMember2023-08-310000022444us-gaap:AccumulatedTranslationAdjustmentMember2023-09-012024-08-310000022444us-gaap:AccumulatedNetGainLossFromDesignatedOrQualifyingCashFlowHedgesMember2023-09-012024-08-310000022444us-gaap:AccumulatedDefinedBenefitPlansAdjustmentMember2023-09-012024-08-310000022444us-gaap:AccumulatedTranslationAdjustmentMember2024-08-310000022444us-gaap:AccumulatedNetGainLossFromDesignatedOrQualifyingCashFlowHedgesMember2024-08-310000022444us-gaap:AccumulatedDefinedBenefitPlansAdjustmentMember2024-08-310000022444cmc:FabricatedProductandInstallationServicesMemberus-gaap:TransferredOverTimeMembercmc:NorthAmericaSegmentMember2023-09-012024-08-310000022444cmc:FabricatedProductwithoutInstallationServicesMemberus-gaap:TransferredOverTimeMembercmc:NorthAmericaSegmentMember2023-09-012024-08-310000022444cmc:FabricatedProductwithoutInstallationServicesMemberus-gaap:TransferredOverTimeMembercmc:NorthAmericaSegmentMember2022-09-012023-08-310000022444cmc:FabricatedProductwithoutInstallationServicesMemberus-gaap:TransferredOverTimeMembercmc:NorthAmericaSegmentMember2021-09-012022-08-3100000224442024-09-012024-08-3100000224442025-09-012024-08-310000022444cmc:NorthAmericaSegmentMember2022-08-310000022444cmc:EuropeSegmentMember2022-08-310000022444cmc:NorthAmericaSteelGroupMember2022-08-310000022444cmc:EuropeSteelGroupMember2022-08-310000022444cmc:EmergingBusinessGroupMember2022-08-310000022444cmc:NorthAmericaSegmentMember2022-09-012023-08-310000022444cmc:EuropeSegmentMember2022-09-012023-08-310000022444cmc:NorthAmericaSteelGroupMember2022-09-012023-08-310000022444cmc:EuropeSteelGroupMember2022-09-012023-08-310000022444cmc:EmergingBusinessGroupMember2022-09-012023-08-310000022444cmc:NorthAmericaSegmentMember2023-08-310000022444cmc:EuropeSegmentMember2023-08-310000022444cmc:NorthAmericaSteelGroupMember2023-08-310000022444cmc:EuropeSteelGroupMember2023-08-310000022444cmc:EmergingBusinessGroupMember2023-08-310000022444cmc:NorthAmericaSegmentMember2023-09-012024-08-310000022444cmc:EuropeSegmentMember2023-09-012024-08-310000022444cmc:NorthAmericaSteelGroupMember2023-09-012024-08-310000022444cmc:EuropeSteelGroupMember2023-09-012024-08-310000022444cmc:EmergingBusinessGroupMember2023-09-012024-08-310000022444cmc:NorthAmericaSegmentMember2024-08-310000022444cmc:EuropeSegmentMember2024-08-310000022444cmc:NorthAmericaSteelGroupMember2024-08-310000022444cmc:EuropeSteelGroupMember2024-08-310000022444cmc:EmergingBusinessGroupMember2024-08-310000022444cmc:NorthAmericaSegmentMember2021-09-012022-08-310000022444cmc:EuropeSegmentMember2021-09-012022-08-310000022444cmc:NorthAmericaSteelGroupMember2021-09-012022-08-310000022444cmc:EuropeSteelGroupMember2021-09-012022-08-310000022444cmc:EmergingBusinessGroupMember2021-09-012022-08-310000022444cmc:SixQualitativeReportingUnitsMember2024-08-310000022444cmc:FirstQuantitativeReportingUnitMember2024-08-310000022444cmc:SecondQuantitativeReportingUnitMember2024-08-310000022444us-gaap:TradeNamesMembercmc:TensarMember2023-09-012024-08-310000022444us-gaap:TradeNamesMembercmc:TensarMember2022-09-012023-08-310000022444us-gaap:InProcessResearchAndDevelopmentMembercmc:TensarMember2023-09-012024-08-310000022444us-gaap:InProcessResearchAndDevelopmentMembercmc:TensarMember2022-09-012023-08-310000022444cmc:NonCompeteAgreementsMembercmc:TensarMember2023-09-012024-08-310000022444cmc:NonCompeteAgreementsMembercmc:TensarMember2022-09-012023-08-310000022444cmc:TensarMember2023-09-012024-08-310000022444cmc:TensarMember2022-09-012023-08-310000022444us-gaap:DevelopedTechnologyRightsMembercmc:TensarMember2024-08-310000022444us-gaap:DevelopedTechnologyRightsMembercmc:TensarMember2023-08-310000022444us-gaap:CustomerListsMember2024-08-310000022444us-gaap:CustomerListsMember2023-08-310000022444us-gaap:PatentsMember2024-08-310000022444us-gaap:PatentsMember2023-08-310000022444us-gaap:LeaseAgreementsMember2024-08-310000022444us-gaap:LeaseAgreementsMember2023-08-310000022444us-gaap:TradeNamesMember2024-08-310000022444us-gaap:TradeNamesMember2023-08-310000022444us-gaap:NoncompeteAgreementsMember2024-08-310000022444us-gaap:NoncompeteAgreementsMember2023-08-310000022444us-gaap:OtherIntangibleAssetsMember2024-08-310000022444us-gaap:OtherIntangibleAssetsMember2023-08-310000022444cmc:FinanceLeasesMember2024-08-310000022444srt:MinimumMember2024-08-310000022444srt:MaximumMember2024-08-310000022444cmc:A300MillionNotesAt4125DueJanuary2030Member2024-08-310000022444cmc:A300MillionNotesAt4125DueJanuary2030Member2023-08-310000022444cmc:A300MillionNotesAt3875DueFebruary2031Member2024-08-310000022444cmc:A300MillionNotesAt3875DueFebruary2031Member2023-08-310000022444cmc:A300MillionNotesAt4375DueMarch2032Member2024-08-310000022444cmc:A300MillionNotesAt4375DueMarch2032Member2023-08-310000022444cmc:Series2022BondsDue2047Member2024-08-310000022444cmc:Series2022BondsDue2047Member2023-08-310000022444us-gaap:ShortTermDebtMember2024-08-310000022444us-gaap:ShortTermDebtMember2023-08-310000022444cmc:OtherDebtMember2024-08-310000022444cmc:OtherDebtMember2023-08-310000022444cmc:FinanceLeasesMember2023-08-310000022444cmc:A300MillionNotesAt4125DueJanuary2030Member2022-01-310000022444cmc:A300MillionNotesAt4375DueMarch2032Member2022-01-3100000224442022-01-310000022444cmc:A300MillionNotesAt3875DueFebruary2031Member2021-02-280000022444cmc:A350millionnotesat5.75dueApril2026Member2021-02-280000022444cmc:Series2022BondsDue2047Member2022-02-280000022444cmc:Series2022BondsDue2047Member2022-02-012022-02-280000022444us-gaap:RevolvingCreditFacilityMembercmc:CreditAgreementMaturingMarch2026Member2024-08-310000022444us-gaap:RevolvingCreditFacilityMember2024-08-310000022444cmc:DelayedDrawSeniorSecuredTermLoanFacilityMember2024-08-310000022444us-gaap:RevolvingCreditFacilityMember2023-08-310000022444us-gaap:LetterOfCreditMember2024-08-310000022444us-gaap:RevolvingCreditFacilityMember2023-09-012024-08-310000022444cmc:CmcpMember2023-08-310000022444cmc:CmcpMember2024-08-310000022444us-gaap:StandbyLettersOfCreditMembercmc:CmcpMember2024-08-310000022444us-gaap:StandbyLettersOfCreditMembercmc:CmcpMember2023-08-310000022444cmc:PolandProgramMember2023-08-310000022444cmc:PolandProgramMember2024-08-3100000224442016-01-012017-12-310000022444cmc:MicroMillMembercmc:Fund156Member2023-09-012024-08-310000022444cmc:MicroMillMembercmc:Fund156Member2024-08-310000022444cmc:MicroMillMembercmc:Fund156Membercmc:QualifiedEquityInvestmentLoansMembercmc:CMCSteelOklahomaLLCMember2024-08-310000022444cmc:SpoolerProjectMembercmc:Fund249Member2023-09-012024-08-310000022444cmc:SpoolerProjectMembercmc:Fund249Member2024-08-310000022444cmc:SpoolerProjectMembercmc:Fund249Membercmc:QualifiedEquityInvestmentLoansMembercmc:CMCSteelOklahomaLLCMember2024-08-310000022444cmc:PostShopProjectMembercmc:Fund219andFund222Member2023-09-012024-08-310000022444cmc:PostShopProjectMembercmc:Fund219andFund222Member2024-08-310000022444cmc:PostShopProjectMembercmc:Fund219andFund222Membercmc:QualifiedEquityInvestmentLoansMembercmc:CMCSteelOklahomaLLCMember2024-08-310000022444cmc:Fund156andFund249Member2023-09-012024-08-310000022444cmc:Fund219Member2023-09-012024-08-310000022444cmc:Fund249Member2024-08-310000022444cmc:Fund219Member2024-08-310000022444cmc:Fund222Member2023-09-012024-08-310000022444cmc:Fund222Member2023-08-310000022444us-gaap:CommodityContractMember2024-08-310000022444us-gaap:CommodityContractMember2023-08-310000022444us-gaap:ForeignExchangeContractMember2024-08-310000022444us-gaap:ForeignExchangeContractMember2023-08-310000022444cmc:AluminumMemberus-gaap:LongMember2023-09-012024-08-310000022444cmc:CopperMemberus-gaap:LongMember2023-09-012024-08-310000022444cmc:CopperMemberus-gaap:ShortMember2023-09-012024-08-310000022444us-gaap:ElectricityMemberus-gaap:LongMember2023-09-012024-08-310000022444srt:NaturalGasReservesMemberus-gaap:LongMember2023-09-012024-08-310000022444us-gaap:CommodityMemberus-gaap:PrepaidExpensesAndOtherCurrentAssetsMember2024-08-310000022444us-gaap:CommodityMemberus-gaap:PrepaidExpensesAndOtherCurrentAssetsMember2023-08-310000022444us-gaap:CommodityMemberus-gaap:OtherNoncurrentAssetsMember2024-08-310000022444us-gaap:CommodityMemberus-gaap:OtherNoncurrentAssetsMember2023-08-310000022444us-gaap:ForeignExchangeMemberus-gaap:PrepaidExpensesAndOtherCurrentAssetsMember2024-08-310000022444us-gaap:ForeignExchangeMemberus-gaap:PrepaidExpensesAndOtherCurrentAssetsMember2023-08-310000022444us-gaap:CommodityMemberus-gaap:AccountsPayableAndAccruedLiabilitiesMember2024-08-310000022444us-gaap:CommodityMemberus-gaap:AccountsPayableAndAccruedLiabilitiesMember2023-08-310000022444us-gaap:CommodityMemberus-gaap:OtherNoncurrentLiabilitiesMember2024-08-310000022444us-gaap:CommodityMemberus-gaap:OtherNoncurrentLiabilitiesMember2023-08-310000022444us-gaap:ForeignExchangeMemberus-gaap:AccountsPayableAndAccruedLiabilitiesMember2024-08-310000022444us-gaap:ForeignExchangeMemberus-gaap:AccountsPayableAndAccruedLiabilitiesMember2023-08-310000022444us-gaap:CommodityContractMemberus-gaap:CostOfSalesMember2023-09-012024-08-310000022444us-gaap:CommodityContractMemberus-gaap:CostOfSalesMember2022-09-012023-08-310000022444us-gaap:CommodityContractMemberus-gaap:CostOfSalesMember2021-09-012022-08-310000022444us-gaap:ForeignExchangeContractMemberus-gaap:SellingGeneralAndAdministrativeExpensesMember2023-09-012024-08-310000022444us-gaap:ForeignExchangeContractMemberus-gaap:SellingGeneralAndAdministrativeExpensesMember2022-09-012023-08-310000022444us-gaap:ForeignExchangeContractMemberus-gaap:SellingGeneralAndAdministrativeExpensesMember2021-09-012022-08-310000022444us-gaap:CommodityContractMember2023-09-012024-08-310000022444us-gaap:CommodityContractMember2022-09-012023-08-310000022444us-gaap:CommodityContractMember2021-09-012022-08-310000022444us-gaap:ForeignExchangeContractMember2023-09-012024-08-310000022444us-gaap:ForeignExchangeContractMember2022-09-012023-08-310000022444us-gaap:ForeignExchangeContractMember2021-09-012022-08-310000022444us-gaap:FairValueMeasurementsRecurringMember2024-08-310000022444us-gaap:FairValueMeasurementsRecurringMemberus-gaap:FairValueInputsLevel1Member2024-08-310000022444us-gaap:FairValueMeasurementsRecurringMemberus-gaap:FairValueInputsLevel2Member2024-08-310000022444us-gaap:FairValueMeasurementsRecurringMemberus-gaap:FairValueInputsLevel3Member2024-08-310000022444us-gaap:CommodityContractMemberus-gaap:FairValueMeasurementsRecurringMember2024-08-310000022444us-gaap:FairValueInputsLevel1Memberus-gaap:CommodityContractMemberus-gaap:FairValueMeasurementsRecurringMember2024-08-310000022444us-gaap:FairValueInputsLevel2Memberus-gaap:CommodityContractMemberus-gaap:FairValueMeasurementsRecurringMember2024-08-310000022444us-gaap:FairValueInputsLevel3Memberus-gaap:CommodityContractMemberus-gaap:FairValueMeasurementsRecurringMember2024-08-310000022444us-gaap:ForeignExchangeContractMemberus-gaap:FairValueMeasurementsRecurringMember2024-08-310000022444us-gaap:FairValueInputsLevel1Memberus-gaap:ForeignExchangeContractMemberus-gaap:FairValueMeasurementsRecurringMember2024-08-310000022444us-gaap:FairValueInputsLevel2Memberus-gaap:ForeignExchangeContractMemberus-gaap:FairValueMeasurementsRecurringMember2024-08-310000022444us-gaap:FairValueInputsLevel3Memberus-gaap:ForeignExchangeContractMemberus-gaap:FairValueMeasurementsRecurringMember2024-08-310000022444us-gaap:FairValueMeasurementsRecurringMember2023-08-310000022444us-gaap:FairValueMeasurementsRecurringMemberus-gaap:FairValueInputsLevel1Member2023-08-310000022444us-gaap:FairValueMeasurementsRecurringMemberus-gaap:FairValueInputsLevel2Member2023-08-310000022444us-gaap:FairValueMeasurementsRecurringMemberus-gaap:FairValueInputsLevel3Member2023-08-310000022444us-gaap:CommodityContractMemberus-gaap:FairValueMeasurementsRecurringMember2023-08-310000022444us-gaap:FairValueInputsLevel1Memberus-gaap:CommodityContractMemberus-gaap:FairValueMeasurementsRecurringMember2023-08-310000022444us-gaap:FairValueInputsLevel2Memberus-gaap:CommodityContractMemberus-gaap:FairValueMeasurementsRecurringMember2023-08-310000022444us-gaap:FairValueInputsLevel3Memberus-gaap:CommodityContractMemberus-gaap:FairValueMeasurementsRecurringMember2023-08-310000022444us-gaap:ForeignExchangeContractMemberus-gaap:FairValueMeasurementsRecurringMember2023-08-310000022444us-gaap:FairValueInputsLevel1Memberus-gaap:ForeignExchangeContractMemberus-gaap:FairValueMeasurementsRecurringMember2023-08-310000022444us-gaap:FairValueInputsLevel2Memberus-gaap:ForeignExchangeContractMemberus-gaap:FairValueMeasurementsRecurringMember2023-08-310000022444us-gaap:FairValueInputsLevel3Memberus-gaap:ForeignExchangeContractMemberus-gaap:FairValueMeasurementsRecurringMember2023-08-310000022444us-gaap:FairValueInputsLevel3Memberus-gaap:ValuationTechniqueDiscountedCashFlowMembersrt:MinimumMemberus-gaap:CommodityContractMember2024-08-310000022444us-gaap:FairValueInputsLevel3Memberus-gaap:ValuationTechniqueDiscountedCashFlowMembersrt:MaximumMemberus-gaap:CommodityContractMember2024-08-310000022444us-gaap:FairValueInputsLevel3Memberus-gaap:ValuationTechniqueDiscountedCashFlowMembersrt:WeightedAverageMemberus-gaap:CommodityContractMember2024-08-310000022444us-gaap:FairValueInputsLevel3Memberus-gaap:ValuationTechniqueDiscountedCashFlowMembersrt:MinimumMemberus-gaap:CommodityContractMember2023-08-310000022444us-gaap:FairValueInputsLevel3Memberus-gaap:ValuationTechniqueDiscountedCashFlowMembersrt:MaximumMemberus-gaap:CommodityContractMember2023-08-310000022444us-gaap:FairValueInputsLevel3Memberus-gaap:ValuationTechniqueDiscountedCashFlowMembersrt:WeightedAverageMemberus-gaap:CommodityContractMember2023-08-310000022444us-gaap:CommodityContractMemberus-gaap:FairValueInputsLevel3Member2021-08-310000022444us-gaap:CommodityContractMemberus-gaap:FairValueInputsLevel3Member2021-09-012022-08-310000022444us-gaap:CommodityContractMemberus-gaap:FairValueInputsLevel3Member2022-08-310000022444us-gaap:CommodityContractMemberus-gaap:FairValueInputsLevel3Member2022-09-012023-08-310000022444us-gaap:CommodityContractMemberus-gaap:FairValueInputsLevel3Member2023-08-310000022444us-gaap:CommodityContractMemberus-gaap:FairValueInputsLevel3Member2023-09-012024-08-310000022444us-gaap:CommodityContractMemberus-gaap:FairValueInputsLevel3Member2024-08-3100000224442024-06-012024-08-310000022444us-gaap:FairValueInputsLevel2Member2024-08-310000022444us-gaap:FairValueInputsLevel2Member2023-08-310000022444us-gaap:StateAndLocalJurisdictionMember2024-08-310000022444us-gaap:ForeignCountryMember2024-08-310000022444country:USus-gaap:RestrictedStockUnitsRSUMember2023-09-012024-08-310000022444srt:MinimumMemberus-gaap:PerformanceSharesMember2023-09-012024-08-310000022444srt:MaximumMemberus-gaap:PerformanceSharesMember2023-09-012024-08-310000022444cmc:EBITDAMemberus-gaap:PerformanceSharesMember2022-09-012023-08-310000022444cmc:RelativeTotalShareholderReturnMemberus-gaap:PerformanceSharesMember2022-09-012023-08-310000022444us-gaap:RestrictedStockUnitsRSUMember2021-09-012022-08-310000022444us-gaap:PerformanceSharesMember2021-09-012022-08-310000022444us-gaap:RestrictedStockUnitsRSUMember2022-09-012023-08-310000022444us-gaap:PerformanceSharesMember2022-09-012023-08-310000022444us-gaap:RestrictedStockUnitsRSUMember2023-09-012024-08-310000022444us-gaap:PerformanceSharesMember2023-09-012024-08-310000022444cmc:RestrictedStockAwardsAndPsusexcludingthecashcomponentMember2021-08-310000022444cmc:RestrictedStockAwardsAndPsusexcludingthecashcomponentMember2021-09-012022-08-310000022444cmc:RestrictedStockAwardsAndPsusexcludingthecashcomponentMember2022-08-310000022444cmc:RestrictedStockAwardsAndPsusexcludingthecashcomponentMember2022-09-012023-08-310000022444cmc:RestrictedStockAwardsAndPsusexcludingthecashcomponentMember2023-08-310000022444cmc:RestrictedStockAwardsAndPsusexcludingthecashcomponentMember2023-09-012024-08-310000022444cmc:RestrictedStockAwardsAndPsusexcludingthecashcomponentMember2024-08-310000022444us-gaap:PhantomShareUnitsPSUsMember2023-09-012024-08-310000022444us-gaap:PhantomShareUnitsPSUsMember2022-09-012023-08-310000022444us-gaap:PhantomShareUnitsPSUsMember2024-08-310000022444us-gaap:EmployeeStockMember2023-09-012024-08-310000022444us-gaap:EmployeeStockMember2021-09-012022-08-310000022444us-gaap:EmployeeStockMember2022-09-012023-08-310000022444us-gaap:EmployeeStockMember2024-08-310000022444us-gaap:EmployeeStockMember2023-08-310000022444us-gaap:EmployeeStockMember2022-08-310000022444us-gaap:CostOfSalesMember2023-09-012024-08-310000022444us-gaap:CostOfSalesMember2022-09-012023-08-310000022444us-gaap:CostOfSalesMember2021-09-012022-08-310000022444us-gaap:SupplementalEmployeeRetirementPlanDefinedBenefitMember2024-08-310000022444us-gaap:SupplementalEmployeeRetirementPlanDefinedBenefitMember2023-08-310000022444us-gaap:OtherNoncurrentLiabilitiesMemberus-gaap:SupplementalEmployeeRetirementPlanDefinedBenefitMember2024-08-310000022444us-gaap:OtherNoncurrentLiabilitiesMemberus-gaap:SupplementalEmployeeRetirementPlanDefinedBenefitMember2023-08-310000022444us-gaap:SupplementalEmployeeRetirementPlanDefinedBenefitMember2023-09-012024-08-310000022444us-gaap:SupplementalEmployeeRetirementPlanDefinedBenefitMember2022-09-012023-08-310000022444us-gaap:SupplementalEmployeeRetirementPlanDefinedBenefitMember2021-09-012022-08-3100000224442022-10-012022-10-310000022444cmc:UKPensionPlanMember2023-08-310000022444cmc:UKPensionPlanMember2022-08-310000022444cmc:USPensionPlanMember2022-08-310000022444cmc:UKPensionPlanMember2023-09-012024-08-310000022444cmc:UKPensionPlanMember2022-09-012023-08-310000022444cmc:USPensionPlanMember2022-09-012023-08-310000022444cmc:USPensionPlanMember2023-09-012024-08-310000022444cmc:UKPensionPlanMember2024-08-310000022444cmc:USPensionPlanMember2023-08-310000022444cmc:UKPensionPlanMember2021-09-012022-08-310000022444us-gaap:FixedIncomeSecuritiesMembersrt:MinimumMembercmc:UKPensionPlanMember2024-08-310000022444us-gaap:FixedIncomeSecuritiesMembersrt:MaximumMembercmc:UKPensionPlanMember2024-08-310000022444us-gaap:FixedIncomeSecuritiesMembercmc:UKPensionPlanMember2024-08-310000022444us-gaap:FixedIncomeSecuritiesMembercmc:UKPensionPlanMember2023-08-310000022444us-gaap:DefinedBenefitPlanCashMembersrt:MinimumMembercmc:UKPensionPlanMember2024-08-310000022444us-gaap:DefinedBenefitPlanCashMembersrt:MaximumMembercmc:UKPensionPlanMember2024-08-310000022444us-gaap:DefinedBenefitPlanCashMembercmc:UKPensionPlanMember2024-08-310000022444us-gaap:DefinedBenefitPlanCashMembercmc:UKPensionPlanMember2023-08-310000022444us-gaap:FixedIncomeSecuritiesMemberus-gaap:FairValueInputsLevel1Membercmc:UKPensionPlanMember2024-08-310000022444us-gaap:FixedIncomeSecuritiesMemberus-gaap:FairValueInputsLevel2Membercmc:UKPensionPlanMember2024-08-310000022444us-gaap:FixedIncomeSecuritiesMemberus-gaap:FairValueInputsLevel3Membercmc:UKPensionPlanMember2024-08-310000022444us-gaap:DefinedBenefitPlanCashMemberus-gaap:FairValueInputsLevel1Membercmc:UKPensionPlanMember2024-08-310000022444us-gaap:DefinedBenefitPlanCashMemberus-gaap:FairValueInputsLevel2Membercmc:UKPensionPlanMember2024-08-310000022444us-gaap:DefinedBenefitPlanCashMemberus-gaap:FairValueInputsLevel3Membercmc:UKPensionPlanMember2024-08-310000022444us-gaap:FixedIncomeSecuritiesMemberus-gaap:FairValueInputsLevel1Membercmc:UKPensionPlanMember2023-08-310000022444us-gaap:FixedIncomeSecuritiesMemberus-gaap:FairValueInputsLevel2Membercmc:UKPensionPlanMember2023-08-310000022444us-gaap:FixedIncomeSecuritiesMemberus-gaap:FairValueInputsLevel3Membercmc:UKPensionPlanMember2023-08-310000022444us-gaap:DefinedBenefitPlanCashMemberus-gaap:FairValueInputsLevel1Membercmc:UKPensionPlanMember2023-08-310000022444us-gaap:DefinedBenefitPlanCashMemberus-gaap:FairValueInputsLevel2Membercmc:UKPensionPlanMember2023-08-310000022444us-gaap:DefinedBenefitPlanCashMemberus-gaap:FairValueInputsLevel3Membercmc:UKPensionPlanMember2023-08-310000022444us-gaap:FairValueInputsLevel3Membercmc:UKPensionPlanMember2022-08-310000022444us-gaap:FairValueInputsLevel3Membercmc:UKPensionPlanMember2022-09-012023-08-310000022444us-gaap:FairValueInputsLevel3Membercmc:UKPensionPlanMember2023-08-310000022444us-gaap:FairValueInputsLevel3Membercmc:UKPensionPlanMember2023-09-012024-08-310000022444us-gaap:FairValueInputsLevel3Membercmc:UKPensionPlanMember2024-08-3100000224442021-10-3100000224442024-01-310000022444cmc:CerclaSitesMember2024-08-310000022444cmc:CerclaSitesMember2023-08-310000022444us-gaap:OperatingSegmentsMembercmc:NorthAmericaSteelGroupMember2023-09-012024-08-310000022444us-gaap:OperatingSegmentsMembercmc:NorthAmericaSteelGroupMember2022-09-012023-08-310000022444us-gaap:OperatingSegmentsMembercmc:NorthAmericaSteelGroupMember2021-09-012022-08-310000022444us-gaap:OperatingSegmentsMembercmc:EuropeSteelGroupMember2023-09-012024-08-310000022444us-gaap:OperatingSegmentsMembercmc:EuropeSteelGroupMember2022-09-012023-08-310000022444us-gaap:OperatingSegmentsMembercmc:EuropeSteelGroupMember2021-09-012022-08-310000022444us-gaap:OperatingSegmentsMembercmc:EmergingBusinessGroupMember2023-09-012024-08-310000022444us-gaap:OperatingSegmentsMembercmc:EmergingBusinessGroupMember2022-09-012023-08-310000022444us-gaap:OperatingSegmentsMembercmc:EmergingBusinessGroupMember2021-09-012022-08-310000022444us-gaap:OperatingSegmentsMember2023-09-012024-08-310000022444us-gaap:OperatingSegmentsMember2022-09-012023-08-310000022444us-gaap:OperatingSegmentsMember2021-09-012022-08-310000022444us-gaap:OperatingSegmentsMemberus-gaap:CorporateAndOtherMember2023-09-012024-08-310000022444us-gaap:OperatingSegmentsMemberus-gaap:CorporateAndOtherMember2022-09-012023-08-310000022444us-gaap:OperatingSegmentsMemberus-gaap:CorporateAndOtherMember2021-09-012022-08-310000022444us-gaap:OperatingSegmentsMembercmc:NorthAmericaSteelGroupMember2024-08-310000022444us-gaap:OperatingSegmentsMembercmc:NorthAmericaSteelGroupMember2023-08-310000022444us-gaap:OperatingSegmentsMembercmc:NorthAmericaSteelGroupMember2022-08-310000022444us-gaap:OperatingSegmentsMembercmc:EuropeSteelGroupMember2024-08-310000022444us-gaap:OperatingSegmentsMembercmc:EuropeSteelGroupMember2023-08-310000022444us-gaap:OperatingSegmentsMembercmc:EuropeSteelGroupMember2022-08-310000022444us-gaap:OperatingSegmentsMembercmc:EmergingBusinessGroupMember2024-08-310000022444us-gaap:OperatingSegmentsMembercmc:EmergingBusinessGroupMember2023-08-310000022444us-gaap:OperatingSegmentsMembercmc:EmergingBusinessGroupMember2022-08-310000022444us-gaap:OperatingSegmentsMember2024-08-310000022444us-gaap:OperatingSegmentsMember2023-08-310000022444us-gaap:OperatingSegmentsMember2022-08-310000022444us-gaap:OperatingSegmentsMemberus-gaap:CorporateAndOtherMember2024-08-310000022444us-gaap:OperatingSegmentsMemberus-gaap:CorporateAndOtherMember2023-08-310000022444us-gaap:OperatingSegmentsMemberus-gaap:CorporateAndOtherMember2022-08-310000022444cmc:RawMaterialProductsMemberus-gaap:OperatingSegmentsMembercmc:NorthAmericaSteelGroupMember2023-09-012024-08-310000022444cmc:RawMaterialProductsMemberus-gaap:OperatingSegmentsMembercmc:EuropeSteelGroupMember2023-09-012024-08-310000022444cmc:RawMaterialProductsMemberus-gaap:OperatingSegmentsMembercmc:EmergingBusinessGroupMember2023-09-012024-08-310000022444cmc:RawMaterialProductsMemberus-gaap:OperatingSegmentsMemberus-gaap:CorporateAndOtherMember2023-09-012024-08-310000022444cmc:RawMaterialProductsMember2023-09-012024-08-310000022444cmc:SteelProductsMemberus-gaap:OperatingSegmentsMembercmc:NorthAmericaSteelGroupMember2023-09-012024-08-310000022444cmc:SteelProductsMemberus-gaap:OperatingSegmentsMembercmc:EuropeSteelGroupMember2023-09-012024-08-310000022444cmc:SteelProductsMemberus-gaap:OperatingSegmentsMembercmc:EmergingBusinessGroupMember2023-09-012024-08-310000022444cmc:SteelProductsMemberus-gaap:OperatingSegmentsMemberus-gaap:CorporateAndOtherMember2023-09-012024-08-310000022444cmc:SteelProductsMember2023-09-012024-08-310000022444cmc:DownstreamProductsMemberus-gaap:OperatingSegmentsMembercmc:NorthAmericaSteelGroupMember2023-09-012024-08-310000022444cmc:DownstreamProductsMemberus-gaap:OperatingSegmentsMembercmc:EuropeSteelGroupMember2023-09-012024-08-310000022444cmc:DownstreamProductsMemberus-gaap:OperatingSegmentsMembercmc:EmergingBusinessGroupMember2023-09-012024-08-310000022444cmc:DownstreamProductsMemberus-gaap:OperatingSegmentsMemberus-gaap:CorporateAndOtherMember2023-09-012024-08-310000022444cmc:DownstreamProductsMember2023-09-012024-08-310000022444cmc:ConstructionProductsMemberus-gaap:OperatingSegmentsMembercmc:NorthAmericaSteelGroupMember2023-09-012024-08-310000022444cmc:ConstructionProductsMemberus-gaap:OperatingSegmentsMembercmc:EuropeSteelGroupMember2023-09-012024-08-310000022444cmc:ConstructionProductsMemberus-gaap:OperatingSegmentsMembercmc:EmergingBusinessGroupMember2023-09-012024-08-310000022444cmc:ConstructionProductsMemberus-gaap:OperatingSegmentsMemberus-gaap:CorporateAndOtherMember2023-09-012024-08-310000022444cmc:ConstructionProductsMember2023-09-012024-08-310000022444cmc:GroundStabilizationProductsMemberus-gaap:OperatingSegmentsMembercmc:NorthAmericaSteelGroupMember2023-09-012024-08-310000022444cmc:GroundStabilizationProductsMemberus-gaap:OperatingSegmentsMembercmc:EuropeSteelGroupMember2023-09-012024-08-310000022444cmc:GroundStabilizationProductsMemberus-gaap:OperatingSegmentsMembercmc:EmergingBusinessGroupMember2023-09-012024-08-310000022444cmc:GroundStabilizationProductsMemberus-gaap:OperatingSegmentsMemberus-gaap:CorporateAndOtherMember2023-09-012024-08-310000022444cmc:GroundStabilizationProductsMember2023-09-012024-08-310000022444cmc:OtherProductMemberus-gaap:OperatingSegmentsMembercmc:NorthAmericaSteelGroupMember2023-09-012024-08-310000022444cmc:OtherProductMemberus-gaap:OperatingSegmentsMembercmc:EuropeSteelGroupMember2023-09-012024-08-310000022444cmc:OtherProductMemberus-gaap:OperatingSegmentsMembercmc:EmergingBusinessGroupMember2023-09-012024-08-310000022444cmc:OtherProductMemberus-gaap:OperatingSegmentsMemberus-gaap:CorporateAndOtherMember2023-09-012024-08-310000022444cmc:OtherProductMember2023-09-012024-08-310000022444us-gaap:MaterialReconcilingItemsMembercmc:NorthAmericaSteelGroupMember2023-09-012024-08-310000022444us-gaap:MaterialReconcilingItemsMembercmc:EuropeSteelGroupMember2023-09-012024-08-310000022444us-gaap:MaterialReconcilingItemsMembercmc:EmergingBusinessGroupMember2023-09-012024-08-310000022444us-gaap:MaterialReconcilingItemsMemberus-gaap:CorporateAndOtherMember2023-09-012024-08-310000022444us-gaap:MaterialReconcilingItemsMember2023-09-012024-08-310000022444us-gaap:CorporateAndOtherMember2023-09-012024-08-310000022444cmc:RawMaterialProductsMemberus-gaap:OperatingSegmentsMembercmc:NorthAmericaSteelGroupMember2022-09-012023-08-310000022444cmc:RawMaterialProductsMemberus-gaap:OperatingSegmentsMembercmc:EuropeSteelGroupMember2022-09-012023-08-310000022444cmc:RawMaterialProductsMemberus-gaap:OperatingSegmentsMembercmc:EmergingBusinessGroupMember2022-09-012023-08-310000022444cmc:RawMaterialProductsMemberus-gaap:OperatingSegmentsMemberus-gaap:CorporateAndOtherMember2022-09-012023-08-310000022444cmc:RawMaterialProductsMember2022-09-012023-08-310000022444cmc:SteelProductsMemberus-gaap:OperatingSegmentsMembercmc:NorthAmericaSteelGroupMember2022-09-012023-08-310000022444cmc:SteelProductsMemberus-gaap:OperatingSegmentsMembercmc:EuropeSteelGroupMember2022-09-012023-08-310000022444cmc:SteelProductsMemberus-gaap:OperatingSegmentsMembercmc:EmergingBusinessGroupMember2022-09-012023-08-310000022444cmc:SteelProductsMemberus-gaap:OperatingSegmentsMemberus-gaap:CorporateAndOtherMember2022-09-012023-08-310000022444cmc:SteelProductsMember2022-09-012023-08-310000022444cmc:DownstreamProductsMemberus-gaap:OperatingSegmentsMembercmc:NorthAmericaSteelGroupMember2022-09-012023-08-310000022444cmc:DownstreamProductsMemberus-gaap:OperatingSegmentsMembercmc:EuropeSteelGroupMember2022-09-012023-08-310000022444cmc:DownstreamProductsMemberus-gaap:OperatingSegmentsMembercmc:EmergingBusinessGroupMember2022-09-012023-08-310000022444cmc:DownstreamProductsMemberus-gaap:OperatingSegmentsMemberus-gaap:CorporateAndOtherMember2022-09-012023-08-310000022444cmc:DownstreamProductsMember2022-09-012023-08-310000022444cmc:ConstructionProductsMemberus-gaap:OperatingSegmentsMembercmc:NorthAmericaSteelGroupMember2022-09-012023-08-310000022444cmc:ConstructionProductsMemberus-gaap:OperatingSegmentsMembercmc:EuropeSteelGroupMember2022-09-012023-08-310000022444cmc:ConstructionProductsMemberus-gaap:OperatingSegmentsMembercmc:EmergingBusinessGroupMember2022-09-012023-08-310000022444cmc:ConstructionProductsMemberus-gaap:OperatingSegmentsMemberus-gaap:CorporateAndOtherMember2022-09-012023-08-310000022444cmc:ConstructionProductsMember2022-09-012023-08-310000022444cmc:GroundStabilizationProductsMemberus-gaap:OperatingSegmentsMembercmc:NorthAmericaSteelGroupMember2022-09-012023-08-310000022444cmc:GroundStabilizationProductsMemberus-gaap:OperatingSegmentsMembercmc:EuropeSteelGroupMember2022-09-012023-08-310000022444cmc:GroundStabilizationProductsMemberus-gaap:OperatingSegmentsMembercmc:EmergingBusinessGroupMember2022-09-012023-08-310000022444cmc:GroundStabilizationProductsMemberus-gaap:OperatingSegmentsMemberus-gaap:CorporateAndOtherMember2022-09-012023-08-310000022444cmc:GroundStabilizationProductsMember2022-09-012023-08-310000022444cmc:OtherProductMemberus-gaap:OperatingSegmentsMembercmc:NorthAmericaSteelGroupMember2022-09-012023-08-310000022444cmc:OtherProductMemberus-gaap:OperatingSegmentsMembercmc:EuropeSteelGroupMember2022-09-012023-08-310000022444cmc:OtherProductMemberus-gaap:OperatingSegmentsMembercmc:EmergingBusinessGroupMember2022-09-012023-08-310000022444cmc:OtherProductMemberus-gaap:OperatingSegmentsMemberus-gaap:CorporateAndOtherMember2022-09-012023-08-310000022444cmc:OtherProductMember2022-09-012023-08-310000022444us-gaap:MaterialReconcilingItemsMembercmc:NorthAmericaSteelGroupMember2022-09-012023-08-310000022444us-gaap:MaterialReconcilingItemsMembercmc:EuropeSteelGroupMember2022-09-012023-08-310000022444us-gaap:MaterialReconcilingItemsMembercmc:EmergingBusinessGroupMember2022-09-012023-08-310000022444us-gaap:MaterialReconcilingItemsMemberus-gaap:CorporateAndOtherMember2022-09-012023-08-310000022444us-gaap:MaterialReconcilingItemsMember2022-09-012023-08-310000022444us-gaap:CorporateAndOtherMember2022-09-012023-08-310000022444cmc:RawMaterialProductsMemberus-gaap:OperatingSegmentsMembercmc:NorthAmericaSteelGroupMember2021-09-012022-08-310000022444cmc:RawMaterialProductsMemberus-gaap:OperatingSegmentsMembercmc:EuropeSteelGroupMember2021-09-012022-08-310000022444cmc:RawMaterialProductsMemberus-gaap:OperatingSegmentsMembercmc:EmergingBusinessGroupMember2021-09-012022-08-310000022444cmc:RawMaterialProductsMemberus-gaap:OperatingSegmentsMemberus-gaap:CorporateAndOtherMember2021-09-012022-08-310000022444cmc:RawMaterialProductsMember2021-09-012022-08-310000022444cmc:SteelProductsMemberus-gaap:OperatingSegmentsMembercmc:NorthAmericaSteelGroupMember2021-09-012022-08-310000022444cmc:SteelProductsMemberus-gaap:OperatingSegmentsMembercmc:EuropeSteelGroupMember2021-09-012022-08-310000022444cmc:SteelProductsMemberus-gaap:OperatingSegmentsMembercmc:EmergingBusinessGroupMember2021-09-012022-08-310000022444cmc:SteelProductsMemberus-gaap:OperatingSegmentsMemberus-gaap:CorporateAndOtherMember2021-09-012022-08-310000022444cmc:SteelProductsMember2021-09-012022-08-310000022444cmc:DownstreamProductsMemberus-gaap:OperatingSegmentsMembercmc:NorthAmericaSteelGroupMember2021-09-012022-08-310000022444cmc:DownstreamProductsMemberus-gaap:OperatingSegmentsMembercmc:EuropeSteelGroupMember2021-09-012022-08-310000022444cmc:DownstreamProductsMemberus-gaap:OperatingSegmentsMembercmc:EmergingBusinessGroupMember2021-09-012022-08-310000022444cmc:DownstreamProductsMemberus-gaap:OperatingSegmentsMemberus-gaap:CorporateAndOtherMember2021-09-012022-08-310000022444cmc:DownstreamProductsMember2021-09-012022-08-310000022444cmc:ConstructionProductsMemberus-gaap:OperatingSegmentsMembercmc:NorthAmericaSteelGroupMember2021-09-012022-08-310000022444cmc:ConstructionProductsMemberus-gaap:OperatingSegmentsMembercmc:EuropeSteelGroupMember2021-09-012022-08-310000022444cmc:ConstructionProductsMemberus-gaap:OperatingSegmentsMembercmc:EmergingBusinessGroupMember2021-09-012022-08-310000022444cmc:ConstructionProductsMemberus-gaap:OperatingSegmentsMemberus-gaap:CorporateAndOtherMember2021-09-012022-08-310000022444cmc:ConstructionProductsMember2021-09-012022-08-310000022444cmc:GroundStabilizationProductsMemberus-gaap:OperatingSegmentsMembercmc:NorthAmericaSteelGroupMember2021-09-012022-08-310000022444cmc:GroundStabilizationProductsMemberus-gaap:OperatingSegmentsMembercmc:EuropeSteelGroupMember2021-09-012022-08-310000022444cmc:GroundStabilizationProductsMemberus-gaap:OperatingSegmentsMembercmc:EmergingBusinessGroupMember2021-09-012022-08-310000022444cmc:GroundStabilizationProductsMemberus-gaap:OperatingSegmentsMemberus-gaap:CorporateAndOtherMember2021-09-012022-08-310000022444cmc:GroundStabilizationProductsMember2021-09-012022-08-310000022444cmc:OtherProductMemberus-gaap:OperatingSegmentsMembercmc:NorthAmericaSteelGroupMember2021-09-012022-08-310000022444cmc:OtherProductMemberus-gaap:OperatingSegmentsMembercmc:EuropeSteelGroupMember2021-09-012022-08-310000022444cmc:OtherProductMemberus-gaap:OperatingSegmentsMembercmc:EmergingBusinessGroupMember2021-09-012022-08-310000022444cmc:OtherProductMemberus-gaap:OperatingSegmentsMemberus-gaap:CorporateAndOtherMember2021-09-012022-08-310000022444cmc:OtherProductMember2021-09-012022-08-310000022444us-gaap:MaterialReconcilingItemsMembercmc:NorthAmericaSteelGroupMember2021-09-012022-08-310000022444us-gaap:MaterialReconcilingItemsMembercmc:EuropeSteelGroupMember2021-09-012022-08-310000022444us-gaap:MaterialReconcilingItemsMembercmc:EmergingBusinessGroupMember2021-09-012022-08-310000022444us-gaap:MaterialReconcilingItemsMemberus-gaap:CorporateAndOtherMember2021-09-012022-08-310000022444us-gaap:MaterialReconcilingItemsMember2021-09-012022-08-310000022444us-gaap:CorporateAndOtherMember2021-09-012022-08-310000022444country:US2023-09-012024-08-310000022444country:US2022-09-012023-08-310000022444country:US2021-09-012022-08-310000022444country:PL2023-09-012024-08-310000022444country:PL2022-09-012023-08-310000022444country:PL2021-09-012022-08-310000022444country:CN2023-09-012024-08-310000022444country:CN2022-09-012023-08-310000022444country:CN2021-09-012022-08-310000022444cmc:OtherGeographicalAreasMember2023-09-012024-08-310000022444cmc:OtherGeographicalAreasMember2022-09-012023-08-310000022444cmc:OtherGeographicalAreasMember2021-09-012022-08-310000022444country:US2024-08-310000022444country:US2023-08-310000022444country:US2022-08-310000022444country:PL2024-08-310000022444country:PL2023-08-310000022444country:PL2022-08-310000022444cmc:OtherGeographicalAreasMember2024-08-310000022444cmc:OtherGeographicalAreasMember2023-08-310000022444cmc:OtherGeographicalAreasMember2022-08-310000022444us-gaap:AllowanceForCreditLossMember2023-08-310000022444us-gaap:AllowanceForCreditLossMember2023-09-012024-08-310000022444us-gaap:AllowanceForCreditLossMember2024-08-310000022444us-gaap:ValuationAllowanceOfDeferredTaxAssetsMember2023-08-310000022444us-gaap:ValuationAllowanceOfDeferredTaxAssetsMember2023-09-012024-08-310000022444us-gaap:ValuationAllowanceOfDeferredTaxAssetsMember2024-08-310000022444us-gaap:AllowanceForCreditLossMember2022-08-310000022444us-gaap:AllowanceForCreditLossMember2022-09-012023-08-310000022444us-gaap:ValuationAllowanceOfDeferredTaxAssetsMember2022-08-310000022444us-gaap:ValuationAllowanceOfDeferredTaxAssetsMember2022-09-012023-08-310000022444us-gaap:AllowanceForCreditLossMember2021-08-310000022444us-gaap:AllowanceForCreditLossMember2021-09-012022-08-310000022444us-gaap:ValuationAllowanceOfDeferredTaxAssetsMember2021-08-310000022444us-gaap:ValuationAllowanceOfDeferredTaxAssetsMember2021-09-012022-08-31
UNITED STATES SECURITIES AND EXCHANGE COMMISSION
Washington, D.C. 20549
Form 10-K
|
|
|
|
|
|
|
|
|
| ☑ |
|
ANNUAL REPORT PURSUANT TO SECTION 13 OR 15(d) OF THE SECURITIES EXCHANGE ACT OF 1934 |
|
|
For the fiscal year ended August 31, 2024 |
|
|
|
|
|
|
|
|
|
| ☐ |
|
TRANSITION REPORT PURSUANT TO SECTION 13 OR 15(d) OF THE SECURITIES EXCHANGE ACT OF 1934 |
|
|
For the transition period from to |
Commission file number 1-4304
Commercial Metals Company
(Exact name of registrant as specified in its charter)

|
|
|
|
|
|
|
|
|
| Delaware |
|
75-0725338 |
| (State or other jurisdiction of incorporation or organization) |
|
(I.R.S. Employer Identification No.) |
6565 N. MacArthur Blvd., Irving, Texas 75039
(Address of Principal Executive Office) (Zip Code)
(214) 689-4300
(Registrant's Telephone Number, Including Area Code)
Securities registered pursuant to Section 12(b) of the Act:
|
|
|
|
|
|
|
|
|
|
|
|
|
|
|
| Title of Each Class |
|
Trading Symbol(s) |
|
Name of Each Exchange on Which Registered |
| Common Stock, $0.01 par value |
|
CMC |
|
New York Stock Exchange |
Securities registered pursuant to Section 12(g) of the Act: None
Indicate by check mark if the registrant is a well-known seasoned issuer, as defined in Rule 405 of the Securities Act. Yes þ No o
Indicate by check mark if the registrant is not required to file reports pursuant to Section 13 or Section 15(d) of the Act. Yes o No þ
Indicate by check mark whether the registrant (1) has filed all reports required to be filed by Section 13 or 15(d) of the Securities Exchange Act of 1934 during the preceding 12 months (or for such shorter period that the registrant was required to file such reports), and (2) has been subject to such filing requirements for the past 90 days. Yes þ No o
Indicate by check mark whether the registrant has submitted electronically every Interactive Data File required to be submitted pursuant to Rule 405 of Regulation S-T (§ 232.405 of this chapter) during the preceding 12 months (or for such shorter period that the registrant was required to submit such files). Yes þ No o
Indicate by check mark whether the registrant is a large accelerated filer, an accelerated filer, a non-accelerated filer, a smaller reporting company, or an emerging growth company. See the definitions of "large accelerated filer," "accelerated filer," "smaller reporting company," and "emerging growth company" in Rule 12b-2 of the Exchange Act.
|
|
|
|
|
|
|
|
|
|
|
|
| Large accelerated filer |
☑ |
Accelerated filer |
☐ |
| Non-accelerated filer |
☐ |
Smaller reporting company |
☐ |
|
|
Emerging growth company |
☐ |
If an emerging growth company, indicate by check mark if the registrant has elected not to use the extended transition period for complying with any new or revised financial accounting standards provided pursuant to Section 13(a) of the Exchange Act. ☐
Indicate by check mark whether the registrant has filed a report on and attestation to its management's assessment of the effectiveness of its internal control over financial reporting under Section 404(b) of the Sarbanes-Oxley Act (15 U.S.C 7262(b)) by the registered public accounting firm that prepared or issued its audit report. ☑
If securities are registered pursuant to Section 12(b) of the Act, indicate by check mark whether the financial statements of the registrant included in the filing reflect the correction of an error to previously issued financial statements. ☐
Indicate by check mark whether any of those error corrections are restatements that required a recovery analysis of incentive-based compensation received by any of the registrant’s executive officers during the relevant recovery period pursuant to §240.10D-1(b). ☐
Indicate by check mark whether the registrant is a shell company (as defined in Rule 12b-2 of the Act). Yes ☐ No ☑
The aggregate market value of the Company's common stock on February 29, 2024 held by non-affiliates of the registrant based on the closing price per share on February 29, 2024 on the New York Stock Exchange was approximately $6.2 billion.
As of October 14, 2024, 113,909,587 shares of the registrant's common stock, par value $0.01 per share, were outstanding.
DOCUMENTS INCORPORATED BY REFERENCE:
Portions of the definitive proxy statement for the 2025 annual meeting of stockholders are incorporated by reference into Part III.
COMMERCIAL METALS COMPANY AND SUBSIDIARIES
TABLE OF CONTENTS
|
|
|
|
|
|
|
|
| |
|
|
|
|
|
|
|
|
|
|
|
|
|
|
|
| |
|
|
|
| |
|
|
|
Item 6: Intentionally Omitted |
|
|
|
|
|
|
|
|
|
|
|
|
|
|
|
| |
|
|
|
| |
|
|
|
|
|
|
|
|
|
|
|
| |
|
|
|
| |
|
|
|
|
|
PART I
ITEM 1. BUSINESS
DISCLOSURE REGARDING FORWARD-LOOKING STATEMENTS
This annual report on Form 10-K (hereinafter referred to as the "Annual Report") contains forward-looking statements within the meaning of Section 27A of the Securities Act of 1933, as amended (the "Securities Act"), Section 21E of the Securities Exchange Act of 1934, as amended (the "Exchange Act") and the Private Securities Litigation Reform Act of 1995. Actual results, performance or achievements could differ materially from those projected in the forward-looking statements as a result of a number of risks, uncertainties and other factors. For a discussion of important factors that could cause our results, performance or achievements to differ materially from any future results, performance or achievements expressed or implied by our forward-looking statements, please refer to Part I, Item 1A, Risk Factors and Part II, Item 7, Management's Discussion and Analysis of Financial Condition and Results of Operations in this Annual Report.
References in this Annual Report to "CMC," "the Company," "we," "our" and "us" refer to Commercial Metals Company and its subsidiaries unless otherwise indicated.
Certain trademarks or service marks of CMC appearing in this Annual Report are the property of CMC and are protected under applicable intellectual property laws. Solely for convenience, our trademarks and tradenames referred to in this Annual Report may appear without the ® or ™ symbols, but such references are not intended to indicate in any way that we will not assert, to the fullest extent under applicable law, our rights to these trademarks and tradenames.
OVERVIEW
Founded in 1915 as a single scrap yard in Dallas, Texas, CMC is an innovative solutions provider helping build a stronger, safer and more sustainable world. Through an extensive manufacturing network principally located in the United States ("U.S.") and Central Europe, we offer products and technologies to meet the critical reinforcement needs of the global construction sector. CMC’s solutions support construction across a wide variety of applications, including infrastructure, non-residential, residential, industrial and energy generation and transmission. Our operations are conducted through three operating and reportable segments: North America Steel Group, Europe Steel Group and Emerging Businesses Group.
At CMC, we believe "it’s what’s inside that counts." This reflects the nature of our products, which are found in critical infrastructure worldwide, and also applies to our culture and employees. We operate under the guiding principles of placing the customer at the core of all we do, staying committed to our employees, giving back to our communities and creating value for our investors, all while continuing our commitment to sustainability. From our inception, our business model has been strategically built on sustainable principles, including recycling metals, manufacturing products from approximately 98% recycled material using energy-efficient technology and employing closed-loop water recycling processes.
Our focus on safety and talent development allows us to run a great company and achieve operational and commercial excellence across our business. We provide differentiating value for our customers through our industry-leading customer service with a low cost, high-quality production process. Further, we have achieved market leadership through our commitment to transformation, advancement and long-term growth by investing in our business and in our people. As our customers' needs and preferences have evolved, our products have expanded to include diverse and innovative solutions and future growth platforms. Through a combination of both value-accretive organic growth that captures available internal synergies, and capability-enhancing inorganic growth that broadens our portfolio, we aim to provide our customers with a comprehensive solution.
We maintain our corporate office at 6565 North MacArthur Boulevard, Suite 800, Irving, Texas 75039. Our telephone number is (214) 689-4300, and our website is http://www.cmc.com. Our fiscal year ends August 31st, and any reference in this Annual Report to a year refers to the fiscal year ended August 31st of that year, unless otherwise noted. Any reference in this Annual Report to a ton refers to the U.S. short ton, a unit of weight equal to 2,000 pounds.
Our Annual Report, Quarterly Reports on Form 10-Q, Current Reports on Form 8-K and all amendments to these reports are made available free of charge through the Investors section of our website as soon as reasonably practicable after such material is electronically filed with, or furnished to, the U.S. Securities and Exchange Commission (the "SEC"). The information contained on our website or available by hyperlink from our website is not incorporated into this Annual Report or other documents we file with, or furnish to, the SEC.
Segments
During the first quarter of 2024, we changed our reportable segments to reflect a change in the manner in which our business is managed. Based on changes to our organizational structure, the evolution of our solutions offerings outside of traditional steel products, the growing importance of non-steel solutions to our financial results and future outlook and how our chief operating decision maker, our President and Chief Executive Officer, reviews operating results and makes decisions about resource allocation, the Company now has three reportable segments that represent the primary businesses reported in our consolidated financial statements: North America Steel Group, Europe Steel Group and Emerging Businesses Group. As a result of this change in reportable segments, certain prior year amounts have been recast to conform to the current year presentation. Throughout this Annual Report, unless otherwise indicated, amounts and activity affected by the change in reportable segments have been reclassified.
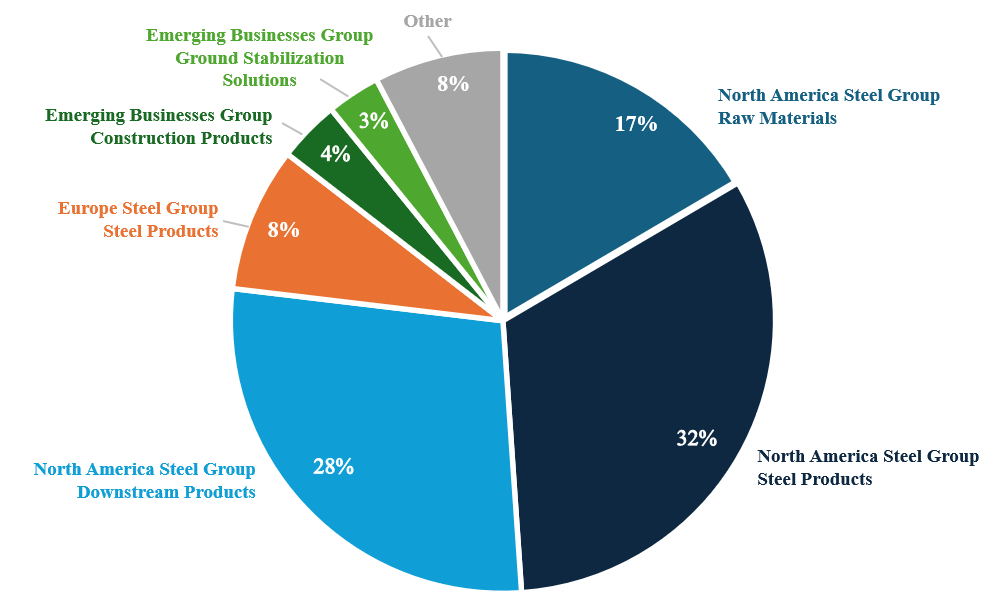
The following chart summarizes net sales to external customers by major product category within each reportable segment during 2024. For a historical breakout of our net sales to external customers by major product category within each reportable segment, see Note 19, Segment Information, in Part II, Item 8 of this Annual Report.
NORTH AMERICA STEEL GROUP SEGMENT
Our North America Steel Group segment provides a diverse offering of products and solutions to support the construction sector. Composed of a vertically integrated network of recycling facilities, steel mills and fabrication operations, our strategy in North America is to optimize our vertically integrated value chain to maximize profitability while providing industry-leading customer service. To execute our strategy, we seek to (i) obtain inputs at the lowest possible cost, including materials procured from our recycling facilities, which are operated to provide low-cost scrap to our steel mills, (ii) operate modern, efficient electric arc furnace ("EAF") steel mills and (iii) enhance operational efficiency by utilizing our fabrication operations to optimize our steel mill volumes and obtain the highest possible selling prices to maximize metal margin. We strive to maximize cash flow generation through increased productivity, high-capacity utilization and optimal product mix. To remain competitive, we regularly make substantial capital expenditures. We have invested approximately 77%, 88% and 91% of total capital expenditures in our North America Steel Group segment during 2024, 2023 and 2022, respectively. For logistics, we utilize a fleet of trucks we own or lease as well as private haulers, railcars, export containers and barges.
Our 43 scrap metal recycling facilities, primarily located in the southeast and central U.S., process ferrous and nonferrous scrap metals. These facilities purchase processed and unprocessed ferrous and nonferrous scrap metals from a variety of sources including manufacturing and industrial plants, metal fabrication plants, electric utilities, machine shops, factories, refineries, shipyards, demolition businesses, automobile salvage firms, wrecking companies and retail individuals. Our recycling facilities utilize specialized equipment to efficiently process large volumes of ferrous material, including seven large machines capable of shredding obsolete automobiles or other sources of scrap metal. Certain facilities also have nonferrous downstream separation equipment, including equipment at three of our facilities that reclaim metal from insulated copper wire, to allow us to capture more metal content. With the exception of precious metals, our scrap metal processing facilities recycle and process almost all types of metal.
We sell ferrous and nonferrous scrap metals (collectively referred to as "raw materials") to steel mills and foundries, aluminum sheet and ingot manufacturers, brass and bronze ingot makers, copper refineries and mills, secondary lead smelters, specialty steel mills, high temperature alloy manufacturers and other consumers. Raw materials margin per ton is defined as the difference between the selling prices for processed and recycled ferrous and nonferrous scrap metals and the price paid to purchase obsolete and industrial scrap.
Our steel mill operations consist of six EAF mini mills, three EAF micro mills and one rerolling mill. Our steel mills manufacture finished long steel products including rebar, merchant bar, light structural and other special sections and wire rod, as well as semi-finished billets for rerolling and forging applications (collectively referred to as "steel products" in the context of the North America Steel Group segment). Each EAF mini mill consists of:
•a melt shop with an EAF;
•continuous casting equipment that shapes molten metal into billets;
•a reheating furnace that prepares billets for rolling;
•a rolling line that forms products from heated billets;
•a mechanical cooling bed that receives hot products from the rolling line;
•finishing facilities that shear, straighten, bundle and prepare products for shipping; and
•supporting facilities such as maintenance, warehouse and office areas.
Our EAF micro mills utilize similar equipment and processes as described above; however, these facilities utilize unique continuous process technology where metal flows uninterrupted from melting to casting to rolling into finished steel products. Our rerolling mill does not utilize a melt shop; the rerolling process begins by reheating billets to roll into finished steel products. CMC has three facilities capable of producing spooled rebar. The estimated annual capacity for our steel mills, included in Part I, Item 2, Properties, of this Annual Report assumes a typical product mix and is not necessarily indicative of the expected production volumes or shipments in any fiscal year. Descriptions of mill capacity, particularly rolling capacity, are highly dependent on the specific product mix manufactured. Our mills roll many different types and sizes of products depending on market conditions, including pricing and demand.
Ferrous scrap is the primary raw material used by our steel mills and is subject to significant price fluctuations. We believe the supply of ferrous scrap available to us is adequate to meet our future needs. Our mills consume large amounts of electricity and natural gas. We have not had any significant curtailments, and we believe that energy supplies are adequate. The supply and demand of regional and national energy, and the extent of applicable regulatory oversight of rates charged by providers, affect the prices we pay for electricity and natural gas. Our mills ship to a broad range of customers and end markets across the U.S. The primary end markets are construction and fabricating industries, metals service centers, original equipment manufacturers and agricultural, energy and petrochemical industries. Due to the nature of our steel products, we do not have a long lead time between order receipt and delivery. We generally fill orders for steel products from inventory or with products near completion. As a result, we do not believe our steel products backlog is a significant factor in the evaluation of our North America Steel Group operations.
Our fabrication operations include 54 facilities engaged in various aspects of steel fabrication; 50 of these facilities engage in general fabrication of reinforcing steel, including shearing, bending and welding, and four of these facilities fabricate steel fence posts. Fabricated rebar is used to reinforce concrete primarily in the construction of commercial and non-commercial buildings, hospitals, convention centers, industrial plants, power plants, highways, bridges, arenas, stadiums and dams, and is generally sold in response to a competitive bid solicitation. Many of the resulting projects are fixed price over the life of the project. We also provide installation services of fabricated rebar in certain markets. We obtain steel for our fabrication operations primarily from our own steel mills, and the demand created by our fabrication operations optimizes the production from our steel mills. Our steel fence posts have many applications, including residential and commercial landscaping and agricultural and livestock containment. Additionally, we have three facilities that supply post-tension cable for use in a variety of projects, such as slab-on-grade foundations, bridges, buildings, parking structures and rock-and-soil anchors. The fabrication and post-tension cable offerings are collectively referred to as "downstream products" in the context of the North America Steel Group segment. Downstream products backlog, defined as the total value of unfulfilled orders, was $1.6 billion at August 31, 2024.
EUROPE STEEL GROUP SEGMENT
Our Europe Steel Group segment is composed of a vertically integrated network of recycling facilities, an EAF mini mill and fabrication operations located in Poland. Our strategy in Europe is to optimize profitability of the products manufactured by our mini mill, and we execute this strategy in the same way in our Europe Steel Group segment as we do in our North America Steel Group segment.
Our 12 scrap metal recycling facilities, located throughout Poland, process ferrous scrap metals for use as a raw material for our mini mill. These facilities provide material almost exclusively to our mini mill and operate in order to lower the cost of scrap used by our mini mill. The equipment utilized at these facilities is similar to our North America Steel Group recycling operations and includes one large capacity scrap metal shredder similar to the largest shredder we operate in North America. Nonferrous scrap metal is not material to this segment’s operations.
Our mini mill is a significant manufacturer of rebar, merchant bar, wire rod and semi-finished billets in Central Europe and includes three rolling lines. The first rolling line is designed to allow efficient and flexible production of a range of medium section merchant bar products. The second rolling line is dedicated primarily to rebar production. The third rolling line is designed to produce high grade wire rod. The products produced by the mini mill are collectively referred to as "steel products" in the context of our Europe Steel Group segment. Our mini mill sells steel products primarily to fabricators, manufacturers, distributors and construction companies, mostly to customers located within Poland. However, the mini mill also exports steel products to the Czech Republic, France, Germany, Italy and Slovakia, among other countries. Ferrous scrap metal, the principal raw material used by our mini mill, electricity, natural gas and other necessary raw materials for the steel manufacturing process are generally readily available, although they can be subject to significant price fluctuations. Our mini mill generally fills orders for steel products from inventory or with products near completion. As a result, we do not believe that our steel products backlog is a significant factor in evaluating the operations of our Europe Steel Group segment.
Our fabrication operations consist of five steel fabrication facilities located in Poland which produce downstream products including fabricated rebar, wire mesh, welded steel mesh, wire rod, cold rolled rebar, cold rolled wire rod, assembled rebar cages and other fabricated rebar by-products (collectively referred to as "downstream products" in the context of our Europe Steel Group segment). These facilities obtain rebar and wire rod primarily from the mini mill. Three of the facilities are similar to the facilities operated by our North America Steel Group segment and sell fabricated rebar primarily to contractors for incorporation into construction projects. The other two fabrication facilities in Poland produce welded steel mesh, cold rolled wire rod and cold rolled rebar. We are among the largest manufacturers of wire mesh in Poland, and our wire mesh customers include metals service centers and construction contractors. In addition to sales of downstream products in the Polish market, we also export our downstream products to neighboring countries such as the Czech Republic and Germany. The downstream products backlog is not a significant factor in evaluating the operations of our Europe Steel Group segment.
EMERGING BUSINESSES GROUP SEGMENT
Our Emerging Businesses Group segment provides construction-related solutions and value-added products with strong underlying growth fundamentals to serve domestic and international markets that are adjacent to those served by our vertically integrated operations in the North America Steel Group segment and the Europe Steel Group segment. The Emerging Businesses Group segment's portfolio consists of the following:
•CMC Construction Services operations sell and rent construction-related products and equipment to concrete installers and other businesses in the construction industry (collectively referred to as "construction products").
•Tensar operations sell geogrids and Geopier foundation systems (collectively referred to as "ground stabilization solutions"). Geogrids are polymer-based products used for ground stabilization, soil reinforcement and asphalt optimization in construction applications, including roadways, public infrastructure and industrial facilities. Geopier foundation systems are rammed aggregate pier and other foundation solutions that increase the load-bearing characteristics of ground structures and working surfaces and can be applied in soil types and construction situations in which traditional support methods are impractical or would make a project infeasible.
•CMC Impact Metals operations manufacture heat-treated, high-strength steel products, such as high-strength bar for the truck trailer industry, special bar quality steel for the energy market and armor plate for military vehicles.
•Our group of performance reinforcing steel offerings include innovative products such as Galvabar (galvanized rebar with a zinc alloy coating that provides corrosion protection and post-fabrication formability), ChromX (designed for high-strength capabilities, corrosion resistance and a service life of more than 100 years), and CryoSteel (a cryogenic reinforcing steel that exceeds minimum performance requirements for strength and ductility at extremely low temperatures). Additionally, CMC Anchoring Systems' operations supply custom engineered anchor cages, bolts and fasteners that are fabricated principally from rebar and are used primarily to secure high voltage electrical transmission poles to concrete foundations.
•Through our licensing agreement with InQuik Inc., CMC Bridge Systems is the authorized provider of InQuik Bridges in the U.S. CMC Bridge Systems offers a prefabricated and modular method used to build reinforced concrete bridge components off-site, which are then installed on-site with poured concrete for a cast-in-place structure.
SEASONALITY
Our facilities primarily serve customers in the construction industry. Due to the increase in construction activities during the spring and summer months, our net sales are generally higher in our third and fourth quarters than in our first and second quarters.
COMPETITION
Our North America Steel Group recycling operations compete with scrap metal processors and primary nonferrous scrap metal producers. The nonferrous recycling industry is highly fragmented in the U.S.; however, we believe our recycling operations are among the largest engaged in the recycling of nonferrous scrap metals in the U.S. We are also a major regional processor of ferrous scrap metal. For both nonferrous and ferrous scrap metals, we compete primarily on the quality and price of our products. Our Europe Steel Group recycling facilities operate to provide raw materials almost exclusively to our mini mill in Poland.
We produce a significant percentage of the total U.S. output of rebar and merchant bar through our EAF steel mills. Domestic and international competitors include local, regional, national and international manufacturers and suppliers of steel. We compete primarily on the services we provide to our customers and on the quality and price of our products. In the U.S., we believe we are the largest manufacturer and fabricator of rebar, the largest manufacturer of steel fence posts and among the largest manufacturers of merchant bar. In Poland, we believe we are the largest producer of rebar and merchant bars for the products we produce and the second largest producer of wire rod.
Furthermore, the global steel industry is cyclical and highly competitive, consisting of domestic and international producers for all major product lines across our North America Steel Group and Europe Steel Group segments. Global steelmaking capacity greatly exceeds demand for steel products in many regions around the world, and this overcapacity results in competition from steel imports into the regions we operate. Our global strategy and differentiating customer service allow us to navigate the risks arising from overproduction. Additionally, trade enforcement laws, such as the tariffs and quotas enforced by Section 232 of the U.S. Trade Expansion Act of 1962 ("Section 232"), have supported domestic production and reduced unfairly priced steel imports. However, these restrictions may be temporary and import competition continues to be a significant threat facing the steel industry.
Competitive Advantage
CMC's diverse product offerings support a wide variety of applications and position us as a global solutions provider to the construction industry, capable of addressing multiple stages of the early phases of construction. We believe our vertically integrated manufacturing platform provides an advantageous cost structure and maximizes the results of our steel-related operations. Our recycling and fabrication operations are designed to support our steel mills. Our recycling operations provide scrap metal to our steel mills, which in turn use the scrap metal to produce and supply steel required by our fabrication operations. As our recycling facilities are generally located near our steel mills, we can ensure a secure supply of low-cost raw materials, and our fabrication facilities provide a significant and consistent source of demand as well as forward visibility into end customer demand. This is a strategic advantage when imports increase as our steel mills can continue to supply our fabricators. Contract pricing that is utilized for these operations helps to stabilize short-term volatility. The construction-related solutions and value-added products within our Emerging Businesses Group segment complement our existing concrete reinforcement product lines and broaden our commercial portfolio, allowing us to address multiple stages of the early phases of commercial and infrastructure construction and provide a comprehensive solution for our customers.
Our operational footprint also provides a competitive advantage in North America and Europe. Our steel mills and fabrication operations in North America and Europe are well-positioned geographically with steel mill locations in some of the highest demand locations for rebar and merchant bar consumption. In North America, we operate a network of operations that stretch from the East Coast to the West Coast and can reach every major metro area in the U.S. Demand for our products in the U.S. is highest in the Sun Belt region where most of our steel mills are located, which positions us to capitalize on growth in this region as well as benefit from a longer construction season.
Our mini mill in Poland also provides strategic benefits as it is well positioned to serve neighboring European economies.
See Part I, Item 1A, Risk Factors, of this Annual Report for more information on competitive factors described above.
SUSTAINABILITY
Sustainability is embedded in our business model and remains central to our strategy. For over 50 years, we have manufactured steel using recycled scrap metal and EAF technology, which is more efficient and environmentally friendly than traditional blast furnace technology, using less energy than the industry average and producing significantly less carbon dioxide per ton of steel we melt. We play a key role in returning our primary input, ferrous scrap, into the economy in the form of rebar, merchant bar, wire rod and fence post for use in a wide variety of applications. In 2024, recycled content made up approximately 98% of the raw materials used in our manufactured finished steel. Our Tensar geogrid technology is also inherently sustainable, as its use in construction projects can, for example, extend road service life, conserve water resources, control soil erosion and reduce consumption of aggregate.
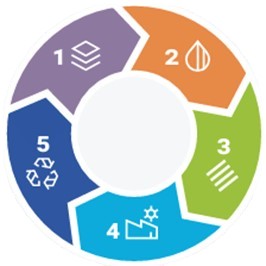
Increasingly, our customers are prioritizing sustainable business practices in and through their supply chains. We help our customers meet their own sustainability needs by offering products such as our RebarZero, MerchantZero, WireZero and PostZero product lines, among others in our portfolio of "net-zero" emissions products. Annually, our vertically integrated manufacturing process keeps millions of tons of scrap metal out of landfills. Our process includes five primary steps:
|
|
|
|
1. Locally source, purchase and process scrap metal as feedstock, which allows us to lower emissions and put more waste to beneficial use.
2. Melt the recycled scrap metal into new steel in our mills using our modern, efficient EAFs, which consume less energy and reduce greenhouse gas ("GHG") emissions compared to traditional blast furnace technology.
3. Roll the new steel into finished long steel products, including rebar, merchant bar, light structural shapes and other special sections, wire rod and semi-finished billets for rerolling.
4. Fabricate the finished products into custom shapes and lengths for end use by our customers.
5. Reclaim end-of-life steel material as feedstock for new steel products, thereby starting our cycle of steel production once again.
|
|
|
|
|
|
|
|
|
We continue to invest in new technologies and processes to reduce our impact on the environment, including our newly commissioned micro mill located in Mesa, Arizona, which employs the latest technology in EAF power supply systems and is able to directly connect the EAF and the ladle furnace to renewable energy sources such as solar and wind.
Information relating to our environmental, social and governance ("ESG") commitments and the goals we have established to increase our use of renewable energy and reduce our energy consumption, GHG emissions and water withdrawal is available on the ESG section of our website, www.esg.cmc.com.
ENVIRONMENTAL MATTERS
A significant factor in our business is our compliance with environmental laws and regulations. Compliance with and changes to various environmental requirements and environmental risks applicable to our industry may adversely affect our business, results of operations and financial condition.
Under the Comprehensive Environmental Response, Compensation and Liability Act ("CERCLA" or "Superfund") and analogous state statutes, we may occasionally be required to cleanup or take remedial action with regard to (or pay for cleanup or remedial action with regard to) sites we operate or formerly operated. If we are found to have arranged for treatment or disposal of hazardous substances at a site, we could be named as a potentially responsible party ("PRP") and responsible for both the costs of cleanup as well as for associated natural resource damages at such site. The U.S. Environmental Protection Agency ("EPA"), or equivalent state agency, has named us as a PRP at several federal Superfund sites or similar state sites. In some cases, these agencies allege that we are a PRP because we sold scrap metals to, or otherwise disposed of materials at, the site. With respect to the sale of scrap metals, we contend that an arm's length sale of valuable scrap metal for use as a raw material in a manufacturing process that we do not control should not constitute "an arrangement for disposal or treatment of hazardous substances" as defined under federal law. Subject to the satisfaction of certain conditions, the Superfund Recycling Equity Act provides legitimate sellers of scrap metal for recycling with some relief from Superfund liability under federal law.
Despite Congress' clarification of the intent of the federal law, some state laws and environmental agencies still seek to impose liability on the basis of such arm's length sale constituting "an arrangement for disposal or treatment of hazardous substances." We believe efforts to impose such liability are contrary to public policy objectives and legislation encouraging recycling and promoting the use of recycled materials, and we continue to support clarification of state laws and regulations consistent with Congress' action.
New federal, state and local laws and regulations, as well as foreign laws, with respect to our foreign operations, and the varying interpretations of such laws by regulatory agencies and the judiciary impact how much money we spend on environmental compliance. In addition, uncertainty regarding adequate control levels, testing and sampling procedures, new pollution control technology and cost benefit analysis based on market conditions impact our future expenditures that are necessary to comply with environmental laws and rules. We cannot predict the total amount of capital expenditures or increases in operating costs or other expenses that may be required as a result of environmental compliance. We also do not know if we can pass such costs on to our customers through product price increases. During 2024, we incurred environmental costs, including disposal, permits, license fees, tests, studies, remediation, consultant fees and environmental personnel expense of approximately $54.9 million. In addition, we spent approximately $5.0 million on capital expenditures for environmental projects in 2024. We believe that our facilities are in material compliance with currently applicable environmental laws and regulations. We anticipate capital expenditures for new environmental projects during 2025 to be approximately $6.3 million. For more information on our compliance with environmental laws and regulations, see Part I, Item 1A, Risk Factors — Risks Related to the Regulatory Environment, in this Annual Report.
EMPLOYEES AND WORKFORCE CULTURE
Our employees are our most important asset and are fundamental to our success. We recognize that our employees bring diverse backgrounds and unique skill sets, and we have fostered a culture that challenges conventional thinking, promotes teamwork, requires accountability and rewards success. At the heart of our culture are our core values of Integrity, Safety, Collaboration and Excellence. These core values are reinforced daily through our actions and in meetings with employees and serve as a compass for our behaviors and decisions.
The following table presents the approximate headcount of employees within each reportable segment and Corporate and Other as of August 31, 2024:
|
|
|
|
|
|
|
|
|
| Segment |
|
Number of Employees |
| North America Steel Group |
|
8,400 |
|
| Europe Steel Group |
|
2,847 |
|
| Emerging Businesses Group |
|
1,458 |
|
| Corporate and Other |
|
473 |
|
| Total |
|
13,178 |
|
Approximately 14%, 29% and 10% of the employees in our North America Steel Group, Europe Steel Group and Emerging Businesses Group segments, respectively, belong to unions. We believe that we have good relations with the union representatives that represent our employees, and we are focused on providing safe and productive workplace environments for our employees.
Ethics and Compliance
At CMC, we believe "it’s what’s inside that counts." It is fundamental to our success that both our leaders and employees observe the highest ethical standards of business conduct in their interactions with our customers, suppliers, communities, investors and each other. We empower our employees to make the right decisions and have established the CMC Code of Conduct and Business Ethics (the "Code") to help our employees understand company policies and guide their actions. Employees are required to complete training to reinforce their continued understanding of and compliance with the Code. Additionally, to foster and maintain our culture of ethical conduct and integrity, we provide confidential channels for employees to report known and suspected violations of applicable laws, the Code, our policies or our internal controls, and receive a response to such reports.
Employee Health and Safety
The safety of every employee is, and has always been, one of our top values. We strive to provide a safe working environment where facilities achieve zero work-related injuries or illnesses. In pursuit of our goal of zero incidents, we embrace a total safety culture that encourages our employees to recognize potentially unsafe situations and use our Proactive Safety Program to report concerns and work together to remove potential hazards from the work environment before incidents occur.
Additionally, our Global Health and Safety Policy sets the standard for our facilities based on best practices that often exceed regulatory requirements and all of our employees are provided with the training necessary to safely and effectively perform their responsibilities.
Our Safety Management System includes our policies, incident management process, data dashboards and safety action plans based on observed behaviors related to health and safety. We periodically issue employee Safety Perception Surveys at various locations and across business groups to identify any discrepancies between management and employee perspectives on the safety of our working conditions. Additionally, we participate in industry association meetings to share expertise and best practices. These surveys and meetings facilitate important discussions that ultimately help further develop our health and safety management systems.
With safety as one of our top values, in 2024, we improved our already exceptional safety record to achieve the lowest total recordable incident rate ("TRIR") in our Company's history.
____________________________
(1) TRIR is defined as OSHA recordable incidents x 200,000/hours worked.
(2) This line represents the 2022 average for Steel Product Manufacturing (North American Industry Classification System ("NAICS") code 3311), based on the latest available information provided by the U.S. Bureau of Labor Statistics.
In addition to TRIR, we also measure our near miss frequency rate, which we believe is critical to incident avoidance and supports our superior safety rating in the industry.
Diversity, Equity and Inclusion
We believe having a diverse workforce strengthens our business; because of this, we aim to build a welcoming and inclusive work environment. CMC is committed to providing equal employment opportunities to all employees and applicants for employment without regard to race, ethnicity, color, religion, sex, age, physical or mental ability, national origin, citizenship, military or veteran status, sexual orientation, gender identity and/or expression. Our talent acquisition strategies include partnerships with organizations that reach veterans and women, and we release job postings in multiple languages to access a wide, diverse range of candidates. We offer an Essentials of Management training to educate employees who manage people or lead teams about diversity issues, and we also reflect our values of diversity and inclusion in our employee handbook and the Code.
Talent Development and Retention
We invest in training and resources to support our employees in reaching their full potential and to build internal capabilities, and are committed to providing a safe, welcoming and stimulating work environment. Our culture of continuous improvement creates internal advancement and growth opportunities for our employees. We recognize that retaining and hiring employees with the right talent, commitment and drive are critical steps to allow us to achieve our goals and reach our full growth potential. CMC provides both online and in-person training options to our employees as well as tuition assistance to support the cost of furthering relevant education for our employees. In addition to our internally developed technical, safety and leadership training available to all employees, many new employees in commercial and operational positions complete rotational programs during onboarding to gain technical experience across the business. We also conduct periodic surveys and other initiatives with employees, which provide invaluable information about how employees perceive our onboarding, employee training, development and culture and allow us to further enhance the training and resources we offer.
INFORMATION ABOUT OUR EXECUTIVE OFFICERS
Our Board of Directors (the "Board") annually elects executive officers. Our executive officers continue to serve for terms set by our Board in its discretion. The table below sets forth the name, current position and offices, age and calendar year in which they became an executive officer, for each of our executive officers as of October 17, 2024.
|
|
|
|
|
|
|
|
|
|
|
|
|
|
|
|
|
|
|
|
|
|
|
|
|
|
|
EXECUTIVE |
| NAME |
|
CURRENT POSITION & OFFICES |
|
AGE |
|
OFFICER SINCE |
| Peter R. Matt |
|
President and Chief Executive Officer |
|
61 |
|
2023 |
| Paul J. Lawrence |
|
Senior Vice President and Chief Financial Officer |
|
54 |
|
2016 |
| Stephen W. Simpson |
|
Senior Vice President, North America Steel Group |
|
57 |
|
2023 |
| Kekin M. Ghelani |
|
Senior Vice President, Chief Strategy Officer |
|
50 |
|
2024 |
| Jody K. Absher |
|
Senior Vice President, Chief Legal Officer and Corporate Secretary |
|
47 |
|
2020 |
| Jennifer J. Durbin |
|
Senior Vice President, Chief Human Resources and Communications Officer |
|
43 |
|
2020 |
Peter R. Matt has served as the President and Chief Executive Officer of CMC since September 1, 2023 and previously served as President of CMC from April 2023 to August 2023. Prior to joining CMC, Mr. Matt served as Executive Vice President and Chief Financial Officer of Constellium N.V. (“Constellium”), a global aluminum fabrication company, from 2016 to 2023. Prior to joining Constellium, Mr. Matt served as a Managing Partner for Tumpline Capital, LLC from 2015 to 2016. From 1985 to 2015, he held various leadership positions with Credit Suisse.
Paul J. Lawrence has served as Senior Vice President and Chief Financial Officer of CMC since November 2021. Prior thereto, Mr. Lawrence served as CMC’s Vice President and Chief Financial Officer from September 2019 to November 2021, Vice President of Finance from June 2018 to September 2019, Treasurer, Vice President of Financial Planning and Analysis from January 2017 to June 2018, Vice President of Finance and Treasurer from September 2016 to January 2017, and Vice President of Finance from February 2016 to September 2016. Prior to joining CMC, Mr. Lawrence served as North American Information Technology Leader of Gerdau Long Steel North America, a U.S. steel producer, from 2014 to 2016, and from 2010 to 2014, he served as Gerdau Template Deployment Leader at Gerdau Long Steel North America. From 2003 to 2010, Mr. Lawrence held a variety of financial roles at Gerdau Ameristeel Corporation, including Assistant Vice President and Corporate Controller, and Deputy Corporate Controller. From 1998 to 2002, Mr. Lawrence held several financial positions with Co-Steel Inc., which was acquired by Gerdau SA.
Stephen W. Simpson has served as Senior Vice President, North America Steel Group since October 2023. Prior thereto, Mr. Simpson served as CMC’s Divisional Vice President, Central Division from April 2022 to October 2023, Vice President, East Commercial from January 2021 to April 2022, Director of Commercial Operations from October 2019 to January 2021, and Director of Special Projects from April 2019 to October 2019. Prior to joining CMC, Mr. Simpson served as Vice President, Sales and Marketing of Charter Steel, Inc. from June 2014 to January 2019 and Sales and Marketing Manager at Charter Wire LLC from November 2012 to May 2014. From 1993 to 2012, Mr. Simpson held various leadership positions at Gerdau Ameristeel Corporation.
Kekin M. Ghelani has served as Senior Vice President, Chief Strategy Officer since October 2024. Prior to joining CMC, Mr. Ghelani served as the Chief Strategy and Growth Officer of Summit Materials, Inc. from May 2022 to August 2024. From 2019 to 2022, Mr. Ghelani served as Vice President of Strategy, Growth and Ventures of the Water & Protection business unit of DuPont Nemours, Inc. From 2013 to 2019, Mr. Ghelani held roles of increasing responsibility at Celanese Corporation. Prior thereto, he held various senior positions at McKesson Corporation and Honeywell International.
Jody K. Absher has served as Senior Vice President, Chief Legal Officer and Corporate Secretary since October 2023. Prior thereto, Ms. Absher served as CMC’s Vice President, Chief Legal Officer and Secretary from August 2022 to October 2023, Vice President, General Counsel and Corporate Secretary from May 2020 to August 2022, Interim General Counsel from February 2020 to May 2020, Lead Counsel and Assistant Corporate Secretary from November 2014 to February 2020, Senior Counsel and Assistant Corporate Secretary from October 2013 to November 2014, and Legal Counsel from May 2011 to October 2013. Prior to joining CMC, Ms. Absher was an attorney at Haynes and Boone, LLP, a global law firm, from August 2007 to May 2011.
Jennifer J. Durbin has served as Senior Vice President and Chief Human Resources and Communications Officer since October 2023. Prior thereto, Ms. Durbin served as CMC’s Vice President and Chief Human Resources Officer from August 2022 to October 2023, Vice President of Human Resources and Safety from November 2021 to August 2022, Vice President of Human Resources from January 2020 to November 2021, Lead Counsel from November 2014 to January 2020, Senior Counsel from January 2013 to November 2014, and Legal Counsel from May 2010 to January 2013.
Prior to joining CMC, Ms. Durbin was an attorney at Sidley Austin LLP, a global law firm, from August 2006 to May 2010.
ITEM 1A. RISK FACTORS
There are inherent risks and uncertainties associated with our business that could adversely affect our business, results of operations and financial condition. Set forth below are descriptions of those risks and uncertainties that we currently believe to be material, but the risks and uncertainties described below are not the only risks and uncertainties that could adversely affect our business, results of operations and financial condition. If any of these risks actually occur, our business, results of operations and financial condition could be materially adversely affected.
RISKS RELATED TO OUR BUSINESS
Scrap and other inputs for our business are subject to significant price fluctuations and limited availability, which may adversely affect our business, results of operations and financial condition.
At any given time, we may be unable to obtain an adequate supply of critical raw materials at prices and on other terms acceptable to us. We depend on ferrous scrap, the primary raw material used by our steel mills, and other inputs such as graphite electrodes and alloys for our steel mill operations. The price of scrap and other inputs has historically been subject to significant fluctuation, and we may not be able to adjust our product prices to recover the costs of rapid increases in raw material prices, especially over the short-term and in our fixed price contracts. The profitability of our operations would be adversely affected if we are unable to pass increased raw material and input costs on to our customers.
The purchase prices for automobile bodies and various other grades of obsolete and industrial scrap, as well as the selling prices for processed and recycled scrap metals we utilize in our own manufacturing process or resell to others, are highly volatile. A prolonged period of low scrap prices or a fall in scrap prices could impair our ability to obtain, process, sell and consume recycled material, which could have a material adverse effect on our business, results of operations and financial condition. Our ability to respond to changing recycled metal selling prices may be limited by competitive or other factors during periods of low scrap prices, when the supply of scrap may decline considerably, as scrap generators hold onto their scrap in the hope of getting higher prices later. Conversely, increased foreign demand for scrap due to economic expansion in countries such as China, India, Brazil and Turkey, as well as the growth of EAF steel production due to efforts by countries and producers to reduce carbon emissions in the industry, can result in an outflow of available domestic scrap as well as higher scrap prices that cannot always be passed on to domestic scrap consumers or consumers of our steel products, further reducing the available domestic scrap flows and margins, all of which could adversely affect our sales and profitability.
The availability of raw materials may also be negatively affected by new laws and regulations, countries limiting scrap exports, allocations by suppliers, interruptions in production, accidents or natural disasters, changes in exchange rates, global price fluctuations and the availability and cost of transportation. If we are unable to obtain adequate and timely deliveries of our required raw materials, we may be unable to timely manufacture significant quantities of our products.
We are vulnerable to the economic conditions in the regions in which our operations are concentrated.
Economic downturns in the U.S., United Kingdom (the "U.K."), Central Europe and China, or decisions by governments that have an impact on the level and pace of overall economic activity in one of these regions, could adversely affect demand for our products and, consequently, our sales and profitability. As a result, our financial results are substantially dependent upon the overall economic conditions in these areas.
We rely on the availability of large amounts of electricity and natural gas. Disruptions in delivery or substantial increases in energy costs, including crude oil prices, could adversely affect our business, results of operations and financial condition.
Our EAF mills melt steel scrap and use natural gas to heat steel billets for rolling into finished steel products. As large consumers of electricity and natural gas, often the largest in the geographic area where our mills are located, we must have dependable delivery of electricity and natural gas in order to operate. Accordingly, we are at risk in the event of an energy disruption. Prolonged black-outs or brown-outs or disruptions caused by natural disasters such as hurricanes would substantially disrupt our production. While we have not suffered prolonged production delays due to our inability to access electricity or natural gas, several of our competitors have experienced such occurrences. Prolonged substantial increases in energy costs would have an adverse effect on the costs of operating our mills and would negatively impact our profitability unless we were able to fully pass through the additional expense to our customers. Further, our finished steel products are typically delivered by truck.
Rapid increases in the price of fuel attributable to increases in crude oil prices would increase our costs and adversely affect many of our customers' financial results, which in turn could result in reduced margins and declining demand for our products.
We may encounter labor disputes and shortages for skilled labor and/or qualified employees in operational positions, which could adversely impact our operations.
Our employees contribute to developing and meeting our business goals and objectives, and we depend on a qualified labor force for the manufacture of our products. The impact of labor shortages and increased competition for available workers may increase our costs or impede our ability to optimally staff our facilities and could have an adverse impact on our results of operations, financial condition and cash flows. In addition, an ongoing labor shortage may result in increased expenses related to hiring and retention of qualified employees. As our experienced employees retire and we lose their institutional knowledge, we may encounter challenges and may have difficulty replacing them with employees of comparable skill and efficiency. Additionally, as of August 31, 2024, 14%, 29% and 10% of the employees in our North America Steel Group, Europe Steel Group and Emerging Businesses Group segments, respectively, belong to unions. While we believe that we have good relations with the union representatives, there can be no assurance that any future labor negotiations will prove successful, which may result in a significant increase in the cost of labor, or may break down and result in the disruption of our business or operations.
The loss of, or inability to hire, key employees may adversely affect our ability to successfully manage our operations and meet our strategic objectives.
Our future success depends, in large part, on the continued service of our officers and other key employees and our ability to continue to attract and retain additional highly qualified personnel. These employees are integral to our success based on their expertise and knowledge of our business and products. We compete for such personnel with other companies, including public and private company competitors who may periodically offer more favorable terms of employment. The loss or interruption of the services of a number of our key employees could reduce our ability to effectively manage our operations should we be unable to find appropriate replacement personnel in a timely manner.
Our business, financial condition and results of operations may be adversely impacted by the effects of inflation.
Inflation has the potential to adversely affect our business, financial condition and results of operations by increasing our overall cost structure, particularly if we are unable to achieve commensurate increases in the prices we charge our customers. Other inflationary pressures could affect wages, energy prices, the cost and availability of components and raw materials and other inputs and our ability to meet customer demand. Inflation may further exacerbate other risk factors, including supply chain disruptions, risks related to international operations and the recruitment and retention of qualified employees.
We may have difficulty competing with companies that have a lower cost structure or access to greater financial resources.
We compete with regional, national and foreign manufacturers and traders. Consolidation among participants in the steel manufacturing and recycling industries has resulted in fewer competitors, and several of our competitors are significantly larger than us and have greater financial resources and more diverse businesses than us. Some of our foreign competitors may be able to pursue business opportunities without regard to certain laws and regulations with which we must comply, such as environmental regulations. These companies may have a lower cost structure and more operating flexibility, and consequently they may be able to offer lower prices and more services than we can. There is no assurance that we will be able to compete successfully with these companies. Any of these factors could have a material adverse effect on our business, results of operations and financial condition.
Operating and startup risks, as well as market risks associated with the commissioning of our micro mills, could prevent us from realizing anticipated benefits and could result in a loss of all or a substantial part of our investments.
Although we have successfully commissioned and operated similar facilities, there are technological, operational, market and start-up risks associated with the continued ramp up of our third micro mill and the construction and commissioning of our fourth micro mill. Construction of our micro mills is subject to changing market conditions, delays, inflation and cost overruns, work stoppages, labor shortages, weather interferences, supply chain delays, changes in transportation costs and availability, changes required by governmental authorities, and delays in acquiring or the inability to acquire required permits or licenses, any of which could have an adverse impact on our operational and financial results. Further, although we believe these facilities should each be capable of consistently producing high-quality products in sufficient quantities and at costs that will compare favorably with other similar steel manufacturing facilities, there can be no assurance that these expectations will be achieved.
If we encounter cost overruns, system or process difficulties or quality control restrictions during commissioning of our fourth micro mill or after startup with either or both facilities, our capital costs could increase materially, the expected benefits from the development of the applicable facilities could be diminished or lost and we could lose all or a substantial portion of our investments. In addition, reductions in the availability of certain modes of transportation, such as rail or trucking, during construction of our micro mills could result in significant delays, and reduced transportation availability following startup at our facilities could limit our ability to deliver our steel products and therefore adversely affect our operational and financial results. We could also encounter commodity market risk if, during a sustained period, the cost to manufacture is greater than projected or the market prices for steel products decline.
Our mills require continual capital investments that we may not be able to sustain.
We must make regular, substantial capital investments in our steel mills to maintain the mills, lower production costs and remain competitive. We cannot be certain that we will have sufficient internally generated cash or acceptable external financing to make necessary substantial capital expenditures in the future. The availability of external financing depends on many factors outside of our control, including capital market conditions and the overall performance of the economy. If funding is insufficient, we may be unable to develop or enhance our mills, take advantage of business opportunities and respond to competitive pressures.
Unexpected equipment failures may lead to production curtailments or shutdowns, which may adversely affect our business, results of operations and financial condition.
Interruptions in our production capabilities would adversely affect our production costs, products available for sale and earnings for the affected period. Our manufacturing processes are dependent upon critical pieces of steelmaking equipment, such as our furnaces, continuous casters and rolling equipment, as well as electrical equipment, such as transformers. This equipment may, on occasion, be out of service as a result of unanticipated failures. While we maintain backups for certain critical pieces of equipment to use during the time it may take to repair or replace inoperable equipment, we have experienced, and may in the future experience, material plant shutdowns or periods of reduced production as a result of such equipment failures. In addition to equipment failures, our facilities are also subject to the risk of catastrophic loss due to unanticipated events such as fires, explosions or violent weather conditions.
Information technology interruptions and breaches in data security could adversely impact our business, results of operations and financial condition.
We rely on computers, information and communications technology and related systems and networks in order to operate our business, including to store sensitive data such as intellectual property, our own proprietary business information and that of our customers, suppliers and business partners and personally identifiable information of our employees. Increased global information technology security requirements, vulnerabilities, threats and a rise in sophisticated and targeted cyber attacks, which may be heightened in times of hostilities or war, computer viruses, phishing attacks, social engineering schemes, malicious code, ransomware attacks, acts of terrorism and physical or electronic security breaches, including breaches by computer hackers, cyber-terrorists and/or unauthorized access to or disclosure of our and/or our employees’ or customers’ data pose a risk to the security of our systems, networks and the confidentiality, availability and integrity of our data. Our systems and networks are also subject to damage or interruption from power outages, natural disasters, telecommunications failures, intentional or inadvertent user misuse, employee error, operator negligence and other similar events. Any of these or other events could result in system interruption, the disclosure, modification or destruction of proprietary and other key information, corruption of data, legal claims or proceedings, government enforcement actions, civil or criminal penalties, increased cybersecurity protection and remediation costs, production delays or disruptions to operations including processing transactions and reporting financial results and could adversely impact our reputation and our operating results. We have taken steps to address these concerns and have implemented internal control and security measures to protect our systems and networks from security breaches; however, measures that the Company takes to avoid, detect, mitigate or recover from material incidents, may be insufficient or circumvented, or may become ineffective and there can be no assurance that a system or network failure, or security breach, will not impact our business, results of operations and financial condition. As cybersecurity threats continue to evolve and become more sophisticated, we may be required to incur significant costs and invest additional resources to protect against and, if required, remediate the damage caused by such disruptions or system failures in the future.
Increasing attention to ESG matters, including any targets or other ESG, environmental justice or regulatory initiatives, could result in additional costs or risks or adverse impacts on our business.
Our business faces increasing scrutiny related to ESG issues, including environmental stewardship, supply chain management, climate change, diversity and inclusion, workplace conduct, human rights, philanthropy and support for local communities. Investors, stakeholders and other interested parties are also increasingly focused on issues related to environmental justice and ESG in general. Implementation of our environmental and sustainability initiatives, including the goals set forth in our annual sustainability report, requires certain financial expenditures and employee resources, and the implementation of certain ESG practices or disclosures. In addition, we are, or in the future may become, subject to domestic and international disclosure frameworks, regulations and requirements related to climate change and sustainability. Compliance with such disclosure frameworks, regulations and requirements, if and when they are implemented, could require significant effort, and if we fail to meet the applicable regulatory standards or expectations with respect to these issues, including the expectations we establish for our business, we could be subject to penalties, fines, lawsuits or regulatory action, our reputation and brand could be damaged, and our business, financial condition and results of operations could be adversely impacted. Furthermore, negative publicity with respect to our business and operations could result in the cancellation or delay of projects, the revocation of permits or termination of contracts, each of which may adversely affect our business strategy, increase our costs, or adversely affect our reputation and performance.
We are subject to litigation, potential liability claims and contract disputes, and may become subject to additional litigation, claims and disputes in the future, any of which could adversely affect our business, results of operations and financial condition.
We are involved in various litigation matters, including regulatory proceedings, administrative proceedings, governmental investigations, environmental matters and construction contract disputes. The nature of our operations also exposes us to possible litigation claims in the future. Furthermore, the manufacture and sale of our products as well as the use of our products in a wide variety of commercial and industrial applications expose us to potential product liability and related claims. In the event that a product of ours fails to perform as expected, regardless of fault, or is used in an unexpected manner, and such failure or use results in, or is alleged to result in, bodily injury and/or property damage or other losses, we may be subject to product liability and product quality claims.
Because of the uncertain nature of litigation and insurance coverage decisions, we cannot predict the outcome of these matters. These matters could have a material adverse effect on our reputation, business, results of operations and financial condition. Litigation is very costly, and the costs associated with prosecuting and defending litigation matters could have a material adverse effect on our business, results of operations and financial condition. Although we are unable to precisely estimate the ultimate dollar amount of exposure to loss in connection with litigation matters, we make accruals as warranted. However, the amounts that we accrue could vary significantly from the amounts we actually pay, due to inherent uncertainties, including the inherent uncertainties of the estimation process, the uncertainties involved in litigation and other factors. See Part I, Item 3, Legal Proceedings of this Annual Report for a description of certain pending legal proceedings.
Potential limitations on our ability to access credit, or the ability of our customers and suppliers to access credit, may adversely affect our business, results of operations and financial condition.
If our access to credit is limited or impaired, our business, results of operations and financial condition could be adversely impacted. Our senior unsecured notes are rated by Standard & Poor's Corporation, Moody's Investors Service and Fitch Group, Inc. In determining our credit ratings, the rating agencies consider a number of both quantitative and qualitative factors. These factors include earnings (loss), fixed charges such as interest, cash flows, total debt outstanding, off-balance sheet obligations and other commitments, total capitalization and various ratios calculated from these factors. The rating agencies also consider predictability of cash flows, business strategy and diversity, industry conditions and contingencies. Any downgrades in our credit ratings may make raising capital more difficult, increase the cost and affect the terms of future borrowings, affect the terms under which we purchase goods and services and limit our ability to take advantage of potential business opportunities. We could also be adversely affected if our banks refused to honor their contractual commitments or cease lending.
We are also exposed to risks associated with the creditworthiness of our customers and suppliers. In certain markets, we have experienced a consolidation among those entities to whom we sell. This consolidation has resulted in an increased credit risk spread among fewer customers, often without a corresponding strengthening of their financial status. If the availability of credit to fund or support the continuation and expansion of our customers' business operations is curtailed or if the cost of that credit is increased, the resulting inability of our customers or of their customers to either access credit or absorb the increased cost of that credit could adversely affect our business by reducing our sales or by increasing our exposure to losses from uncollectible customer accounts.
The consequences of such adverse effects could include the interruption of production at the facilities of our customers, the reduction, delay or cancellation of customer orders, delays or interruptions of the supply of raw materials we purchase and bankruptcy of customers, suppliers or other creditors. Any of these events may adversely affect our business, results of operations and financial condition.
Geopolitical conditions, including political turmoil and volatility, regional conflicts, terrorism and war have caused disruptions in the global economy, energy supplies and raw materials, which may continue to negatively impact our business and operations.
We operate globally and sell our products in countries throughout the world. Since early 2022, Russia and Ukraine have been engaged in active armed conflict. We continue to monitor the adverse impact that the outbreak of war in Ukraine and the subsequent institution of sanctions against Russia by the U.S. and several European and Asian countries may continue to have on the global economy in general, on our business and operations and on the businesses and operations of our suppliers and customers. The ongoing conflict in Ukraine has led to market disruptions, including significant volatility in commodity prices and credit markets, as well as reductions in demand and supply chain interruptions, and contributed to global inflation. Further, if the conflict intensifies or expands beyond Ukraine, it could continue to have an adverse, indirect impact on our operations in Poland. The Russian invasion of Ukraine did not have a direct material adverse impact on our business, financial condition or results of operations during 2024, 2023 or 2022. However, we will continue to monitor this fluid situation and develop contingency plans as necessary to address any disruptions to our business operations. To the extent this and other geopolitical conflicts may continue to adversely affect the global economy as discussed above, they may also have the effect of heightening many of the other risks described in this “Risk Factors” section, such as those relating to data security, supply chain, volatility in prices of scrap, energy and other inputs, and market conditions, any of which could negatively affect our business, results of operations and financial condition.
The potential impact of our customers' non-compliance with existing commercial contracts and commitments, due to insolvency or for any other reason, may adversely affect our business, results of operations and financial condition.
From time to time in the past, some of our customers have sought to renegotiate or cancel their existing purchase commitments with us. In addition, some of our customers have breached previously agreed upon contracts to buy our products by refusing delivery of the products.
Where appropriate, we have and expect to in the future pursue litigation to recover our damages resulting from customer contract defaults and bankruptcy filings. We use credit assessments in the U.S. and credit insurance in Poland to mitigate the risk of customer insolvency. However, a large number of our customers defaulting on existing contractual obligations to purchase our products could have a material adverse effect on our business, results of operations and financial condition.
The agreements governing our notes and our other debt contain financial covenants and impose restrictions on our business.
The indentures governing our 4.125% Senior Notes due 2030, our 3.875% Senior Notes due 2031 and our 4.375% Senior Notes due 2032 contain restrictions on our ability to create liens, sell assets, enter into sale and leaseback transactions and consummate transactions causing a change of control such as a merger or consolidation. In addition to these restrictions, our Credit Agreement, as defined in Note 8, Credit Arrangements, in Part II, Item 8 of this Annual Report, contains covenants that restrict our ability to, among other things, enter into transactions with affiliates and guarantee the debt of some of our subsidiaries. Our Credit Agreement, as defined in Note 8, Credit Arrangements, in Part II, Item 8 of this Annual Report also requires that we meet certain financial tests and maintain certain financial ratios, including maximum debt to capitalization and interest coverage ratios. The loan agreement related to the Series 2022 Bonds, as defined in Note 8, Credit Arrangements, in Part II, Item 8 of this Annual Report, also restricts our ability to, among other things, enter into certain sale and leaseback transactions, incur certain liens and take certain actions that would adversely affect the tax-exempt status of the Series 2022 Bonds.
Other agreements that we may enter into in the future may contain covenants imposing significant restrictions on our business that are similar to, or in addition to, the covenants under our existing agreements. These restrictions may affect our ability to operate our business and may limit our ability to take advantage of potential business opportunities as they arise.
Our ability to comply with these covenants may be affected by events beyond our control, including prevailing economic, financial and industry conditions. The breach of any of these covenants could result in a default under the indentures governing our notes or under our other debt agreements. An event of default under our debt agreements would permit our lenders to declare all amounts borrowed from them to be due and payable, together with accrued and unpaid interest. If we were unable to repay debt to our secured lenders or if we incur additional secured debt in the future, these lenders could proceed against the collateral securing such debt.
In addition, acceleration of our other indebtedness may cause us to be unable to make interest payments on our notes.
We may not be able to successfully identify, consummate or integrate acquisitions, and acquisitions may adversely affect our financial leverage.
Part of our business strategy includes pursuing synergistic acquisitions. We have expanded, and plan to continue to expand, our business by making strategic acquisitions and regularly seeking suitable acquisition targets to enhance our growth. We may fund such acquisitions using cash on hand, drawing under our credit facility or accessing the capital markets. To the extent we finance such acquisitions with additional debt, the incurrence of such debt may result in a significant increase in our interest expense and financial leverage, which could be further exacerbated by volatility in the debt capital markets. Further, an increase in our leverage could lead to deterioration in our credit ratings.
The pursuit of acquisitions may pose certain risks to us. We may not be able to identify acquisition candidates that fit our criteria for growth and profitability. Even if we are able to identify such candidates, we may not be able to acquire them on terms or financing satisfactory to us. We will incur expenses and dedicate attention and resources associated with the review of acquisition opportunities, whether or not we consummate such acquisitions.
Additionally, even if we are able to acquire suitable targets on agreeable terms, we may not be able to successfully integrate their operations with ours. Achieving the anticipated benefits of any acquisition will depend in significant part upon whether we integrate such acquired businesses in an efficient and effective manner. We may not be able to achieve the anticipated operating and cost synergies or long-term strategic benefits of our acquisitions within the anticipated timing or at all. For example, elimination of duplicative costs may not be fully achieved or may take longer than anticipated. The benefits from any acquisition may be offset by the costs incurred in integrating the businesses and operations. We may also assume liabilities in connection with acquisitions to which we would not otherwise be exposed. An inability to realize any or all of the anticipated synergies or other benefits of an acquisition as well as any delays that may be encountered in the integration process, which may delay the timing of such synergies or other benefits, could have an adverse effect on our business, results of operations and financial condition.
Goodwill or other indefinite-lived intangible asset impairment charges in the future could have a material adverse effect on our business, results of operations and financial condition.
Goodwill and other indefinite-lived intangible assets are tested for impairment annually as of the first day of our fourth quarter and between annual tests whenever events or circumstances indicate that the carrying value of a reporting unit, including goodwill, or an indefinite-lived intangible asset exceeds its fair value.
To evaluate goodwill and other indefinite-lived intangible assets for impairment, we may use qualitative assessments to determine whether it is more likely than not that the fair value of a reporting unit, including goodwill, or an indefinite-lived intangible asset is less than its carrying amount. The qualitative assessments require assumptions to be made regarding multiple factors, including the current operating environment, historical and future financial performance and industry and market conditions. If an initial qualitative assessment identifies that it is more likely than not that the carrying value of a reporting unit exceeds its estimated fair value, additional quantitative testing is performed. Alternatively, the Company may elect to bypass the qualitative assessment and instead perform a quantitative impairment test to calculate the fair value of the reporting unit in comparison to its associated carrying value.
The quantitative impairment tests require us to make an estimate of the fair value of our reporting units and indefinite-lived intangible assets. An impairment could be recorded as a result of changes in assumptions, estimates or circumstances, some of which are beyond our control. Factors which could result in an impairment include, but are not limited to: (i) reduced demand for our products; (ii) our cost of capital; (iii) higher material prices; (iv) slower growth rates in our industry; and (v) changes in the market based discount rates. Since a number of factors may influence determinations of fair value of goodwill and indefinite-lived intangible assets, we are unable to predict whether impairments will occur in the future, and there can be no assurance that continued conditions will not result in future impairments. The future occurrence of a potential indicator of impairment could include matters such as (i) a decrease in expected net earnings; (ii) adverse equity market conditions; (iii) a decline in current market multiples; (iv) a decline in our common stock price; (v) a significant adverse change in legal factors or the general business climate; (vi) an adverse action or assessment by a regulator; (vii) a significant downturn in residential or non-residential construction markets; and (viii) excess steelmaking capacity due to new mill startup in the U.S. or levels of imported steel. Any such impairment would result in us recognizing a non-cash charge in our consolidated statements of earnings, which could adversely affect our business, results of operations and financial condition.
Impairment of long-lived assets in the future could have a material adverse effect on our business, results of operations and financial condition.
We have a significant amount of property, plant and equipment, finite-lived intangible assets and right-of-use ("ROU") assets that may be subject to impairment testing. Long-lived assets are subject to an impairment assessment when certain triggering events or circumstances indicate that their carrying value may be impaired. If the net carrying value of the asset or group of assets exceeds our estimate of future undiscounted cash flows of the operations related to the asset, the excess of the net carrying value over estimated fair value is charged to impairment loss in the consolidated statements of earnings. The primary factors that affect estimates of future cash flows for these long-lived asset groups are (i) management's raw material price outlook; (ii) market demand; (iii) working capital changes; (iv) capital expenditures; and (v) selling, general and administrative ("SG&A") expenses. There can be no assurance that continued market conditions, demand for our products, facility utilization levels or other factors will not result in future impairment charges.
Competition from other materials may have a material adverse effect on our business, results of operations and financial condition.
In many applications, steel competes with other materials, such as aluminum and plastics (particularly in the automobile industry), cement, composites, glass and wood. Increased use of, or additional substitutes for, steel products could adversely affect future market prices and demand for steel products.
Our operations present significant risk of injury or death.
The industrial activities conducted at our facilities present significant risk of serious injury or death to our employees, customers or other visitors to our operations. Notwithstanding our safety precautions, including our material compliance with federal, state and local employee health and safety regulations, we may be unable to avoid material liabilities for injuries or deaths. We maintain workers' compensation insurance to address the risk of incurring material liabilities for injuries or deaths, but there can be no assurance that the insurance coverage will be adequate or will continue to be available on the terms acceptable to us, or at all, which could result in material liabilities to us for any injuries or deaths.
Our business, financial condition, results of operations, cash flows, liquidity and stock price may be adversely affected by global public health epidemics.
Pandemics, epidemics, widespread illness or other health issues that interfere with the ability of our employees, suppliers, customers, financing sources or others to conduct business, or negatively affect consumer confidence or the global economy, could adversely affect our business, financial condition, results of operations, cash flows, liquidity and stock price.
Additionally, such global public health epidemics could negatively impact our operations, supply chain, transportation networks and customers, which may compress our margins, including as a result of preventative and precautionary measures that we, other businesses and governments are taking. Any economic downturn resulting from the widespread public health impacts of any future public health epidemic could adversely affect demand for our products and contribute to volatile supply and demand conditions affecting prices and volumes in the markets for our products and raw materials.
Fluctuations in the value of the U.S. dollar relative to other currencies may adversely affect our business, results of operations and financial condition.
Fluctuations in the value of the U.S. dollar, including, in particular, the increased strength of the U.S. dollar as compared to Turkey's lira, China's renminbi or the euro, may adversely affect our business, results of operations and financial condition. A strong U.S. dollar makes imported metal products less expensive, resulting in more imports of steel products into the U.S. by our foreign competitors, while a weak U.S. dollar may have the opposite impact on imports. With the exception of exports of nonferrous scrap metal by certain recycling facilities in our North America Steel Group segment, we have not recently been a significant exporter of metal products from the U.S. Economic difficulties in some large steel-producing regions of the world, resulting in lower local demand for steel products, have historically encouraged greater steel exports to the U.S. at depressed prices which can be exacerbated by a strong U.S. dollar. As a result, our products that are made in the U.S. may become relatively more expensive as compared to imported steel, which has had, and in the future could have, a negative impact on our business, results of operations and financial condition.
Operating internationally carries risks and uncertainties which could adversely affect our business, results of operations and financial condition.
We have significant recycling and fabrication facilities and a mini mill in Poland as well as Tensar facilities in China and the U.K. Our Europe Steel Group segment, which comprises the majority of our international operations, generated approximately 11% of 2024 consolidated net sales. Our stability, growth and profitability are subject to a number of risks inherent in doing business internationally in addition to the currency exchange risk and operating risks discussed above, including:
•political, military, terrorist or major pandemic events;
•differences in demand, production and energy costs;
•local labor and social issues;
•legal and regulatory requirements or limitations imposed by foreign governments (particularly those with significant steel consumption or steel-related production including Turkey, China, Brazil, Russia and India), including quotas, tariffs or other protectionist trade barriers, adverse tax law changes, nationalization or currency restrictions, and efforts to reduce carbon dioxide emissions;
•disruptions or delays in shipments caused by customs compliance or government agencies; and
•potential difficulties in staffing and managing local operations.
These factors may adversely affect our business, results of operations and financial condition.
Hedging transactions may expose us to losses or limit our potential gains.
Our product lines and global operations expose us to risks associated with fluctuations in foreign currency exchange rates, commodity prices and interest rates. As part of our risk management program, we sometimes use financial instruments, including metals commodity futures, natural gas, electricity and other energy forward contracts, freight forward contracts, foreign currency exchange forward contracts and interest rate swap contracts. While intended to reduce the effects of fluctuations in these prices and rates, these transactions may limit our potential gains or expose us to losses. If our counterparties to such transactions or the sponsors of the exchanges through which these transactions are offered, such as the London Metal Exchange, fail to honor their obligations due to financial distress, we would be exposed to potential losses or the inability to recover anticipated gains from these transactions.
We enter into the foreign currency exchange forward contracts as economic hedges of trade commitments or anticipated commitments denominated in currencies other than the functional currency to mitigate the effects of changes in currency rates. These foreign exchange commitments are dependent on timely performance by our counterparties. Their failure to perform could result in us having to close these hedges without the anticipated underlying transaction and could result in losses if foreign currency exchange rates have changed.
There can be no assurance that we will repurchase shares of our common stock at all or in any particular amounts.
The stock markets in general have experienced substantial price and trading fluctuations, which have resulted in volatility in the market prices of securities that often are unrelated or disproportionate to changes in operating performance. These broad market fluctuations may adversely affect the trading price of our common stock. Price volatility over a given period may also cause the average price at which we repurchase our own common stock to exceed the stock's price at a given point in time. In addition, significant changes in the trading price of our common stock and our ability to access capital on terms favorable to us could impact our ability to repurchase shares of our common stock. The timing and amount of any repurchases will be determined by the Company's management based on its evaluation of market conditions, capital allocation alternatives and other factors beyond our control. Our share repurchase program may be modified, suspended, extended or terminated by the Company at any time and without notice. See Note 15, Capital Stock, in Part II, Item 8 of this Annual Report for additional information on our share repurchase program.
RISKS RELATED TO OUR INDUSTRY
Our industry and the industries we serve are vulnerable to global economic conditions.
Metals industries and commodity products have historically been vulnerable to significant declines in consumption, global overcapacity and depressed product pricing during prolonged periods of economic downturn. Our business supports cyclical industries such as commercial, government and residential construction, energy, metals service center, petrochemical and original equipment manufacturing. We may experience significant fluctuations in demand for our products from these industries based on global or regional economic conditions, geo-political conflicts, energy prices, consumer demand and decisions by governments to fund infrastructure projects such as highways, schools, energy plants and airports. Commercial and infrastructure construction activities related to the residential housing market, such as shopping centers, schools and roads, could be adversely impacted by a prolonged slump in new housing construction. Our business, results of operations and financial condition are adversely affected when the industries we serve suffer a prolonged downturn or anemic growth. Because we do not have unlimited backlogs, our business, results of operations and financial condition are promptly affected by short-term economic fluctuations.
We are unable to predict the duration of current economic conditions that are contributing to current demand for our products. Future economic downturns or a prolonged period of slow growth or economic stagnation could materially adversely affect our business, results of operations and financial condition.
Excess capacity and over-production by foreign producers in the steel industry as well as the startup of new steelmaking capacity in the U.S. could result in lower domestic steel prices, which would adversely affect our sales, margins and profitability.
Global steelmaking capacity exceeds demand for steel products in many regions around the world. Rather than reducing employment by rationalizing capacity with consumption, steel manufacturers in these countries (often with local government assistance or subsidies in various forms) have traditionally exported steel at prices significantly below their home market prices, which prices may not reflect their costs of production or capital. For example, steel production in China, the world's largest producer and consumer of steel, has continued to exceed Chinese demand. This excess capacity in China has resulted in a further increase in imports of artificially low-priced steel and steel products to the U.S. and world steel markets. A continuation of this trend or a significant decrease in China's rate of economic expansion could result in increasing steel imports from China. Excessive imports of steel into the U.S. have exerted, and may continue to exert, downward pressure on U.S. steel prices, which negatively affects our ability to increase our sales, margins and profitability. The excess capacity may create downward pressure on our steel prices and lead to reduced sales volumes as imports absorb market share that would otherwise be filled by domestic supply, all of which would adversely affect our sales, margins and profitability and could subject us to possible renegotiation of contracts or increases in bad debt. Excess capacity has also led to greater protectionism as is evident in raw material and finished product border tariffs put in place by China, Brazil and other countries.
We believe the downward pressure on, and periodically depressed levels of, U.S. steel prices in some recent years have been further exacerbated by imports of steel involving dumping and subsidy abuses by foreign steel producers. While some tariffs and quotas are periodically put into effect for certain steel products imported from a number of countries that have been found to have been unfairly pricing steel imports to the U.S., there is no assurance that tariffs and quotas will always be levied, even if otherwise justified, and even when imposed many of these are short-lived or ineffective.
On March 8, 2018, the President signed a proclamation imposing a 25% tariff or quota limits on all imported steel products for an indefinite period of time under Section 232. The tariff or quota limits are imposed on all steel imports with the exception of steel imports originating from Australia, Canada and Mexico, though pursuant to a U.S. Presidential Proclamation issued July 10, 2024, this exclusion no longer covers steel imports from Mexico that are melted and poured in a country other than Mexico, Canada or the U.S. During 2022, the current administration converted the tariff on steel imports from the European Union, U.K. and Japan to a tariff rate quota. When the Section 232 or other import tariffs, quotas or duties expire or if others are further relaxed or repealed, or if relatively higher U.S. steel prices make it attractive for foreign steelmakers to export their steel products to the U.S., despite the presence of import tariffs, quotas or duties, the resurgence of substantial imports of foreign steel could create downward pressure on U.S. steel prices.
The adverse effects of excess capacity and over-production by foreign producers could be exacerbated by the startup of new steelmaking capacity in the U.S. Any of these adverse effects could have a material adverse effect on our business, results of operations and financial condition.
Rapid and significant changes in the price of metals could adversely impact our business, results of operations and financial condition.
Prices for most metals in which we deal have experienced increased volatility over the last several years, and such increased price volatility impacts us in several ways. While our downstream products may benefit from metal margin expansion as rapidly decreasing input costs for previously contracted fixed price work declines, our steel products would likely experience reduced metal margin and may be forced to liquidate high-cost inventory at reduced metal margins or losses until prices stabilize. Sudden increases in input costs could have the opposite effect in each case. Overall, we believe that rapid substantial price changes are not to our industry's benefit. Our customer and supplier base would be impacted due to uncertainty as to future prices. A reluctance to purchase inventory in the face of extreme price decreases or to sell quickly during a period of rapid price increases would likely reduce our volume of business. Marginal industry participants or speculators may attempt to participate to an unhealthy extent during a period of rapid price escalation with a substantial risk of contract default if prices suddenly reverse. Risks of default in contract performance by customers or suppliers as well as an increased risk of bad debts and customer credit exposure could increase during periods of rapid and substantial price changes.
Physical impacts of climate change could have a material adverse effect on our costs and results of operations.
The physical impacts of climate change may result in, among other things, increasing temperatures and an increase in extreme weather events such as droughts, wildfires, thunderstorms, snow or ice storms, earthquakes, floods, hurricanes and rising sea levels. Extreme weather conditions and natural disasters may increase our costs, limit the availability of materials, cause damage to our facilities or result in a prolonged disruption to our operations, and any damage resulting from extreme weather may not be fully insured.
Many of our facilities are located near coastal areas or waterways where rising sea levels or flooding could disrupt our operations or adversely impact our facilities. Additionally, two of our micro mills are located in an arid desert climate, where drought may restrict available water supplies and increase the risk of wildfires. Furthermore, major changes in weather patterns, periods of extended inclement weather or associated flooding may inhibit construction activity utilizing our products, result in project cancellations, delay or hinder shipments of our products to customers or reduce scrap metal inflows to our recycling facilities or disrupt the availability of electricity to our facilities. Any such events could have a material adverse effect on our costs or results of operations.
RISKS RELATED TO THE REGULATORY ENVIRONMENT
Compliance with and changes in environmental laws and regulations and remediation requirements could result in substantially increased capital obligations and operating costs; violations of environmental laws and regulations could result in costs that have a material adverse effect on our business, results of operations and financial condition.
Existing environmental laws or regulations, as currently interpreted or reinterpreted in the future, and future laws and regulations, may have a material adverse effect on our business, results of operations and financial condition. Compliance with environmental laws and regulations is a significant factor in our business. We are subject to local, state, federal and international environmental laws and regulations concerning, among other matters, waste disposal, air emissions, waste and storm water effluent and disposal and employee health. Federal and state regulatory agencies can impose administrative, civil and criminal penalties and may seek injunctive relief impacting continuing operations for non-compliance with environmental requirements.
New facilities that we may build, especially steel mills, are required to obtain several environmental permits before significant construction or commencement of operations. Delays in obtaining permits or unanticipated conditions in such permits could delay the project or increase construction costs or operating expenses. Our manufacturing and recycling operations produce significant amounts of by-products, some of which are handled as industrial waste or hazardous waste. For example, our EAF mills generate electric arc furnace dust ("EAF dust"), which the EPA and other regulatory authorities classify as hazardous waste. EAF dust and other industrial waste and hazardous waste require special handling, recycling or disposal.
In addition, the primary feed materials for the shredders operated by our recycling facilities are automobile hulks and obsolete household appliances. Approximately 20% of the weight of an automobile hull consists of material known as shredder fluff. After the segregation of ferrous scrap metal and saleable nonferrous metals, shredder fluff remains. We, along with others in the recycling industry, interpret federal regulations to require shredder fluff to meet certain criteria and pass a toxic leaching test to avoid classification as a hazardous waste. We also endeavor to remove hazardous contaminants from the feed material prior to shredding. As a result, we believe the shredder fluff we generate is not normally considered or properly classified as hazardous waste.
If the laws, regulations or testing methods change with regard to EAF dust or shredder fluff or other by-products, we may incur additional significant costs.
Changes to National Ambient Air Quality Standards ("NAAQS") or other requirements on our air emissions could make it more difficult to obtain new permits or to modify existing permits and could require changes to our operations or emissions control equipment. Such difficulties and changes could result in operational delays and capital and ongoing compliance expenditures. These regulations can also increase our costs of energy, primarily electricity, which we use extensively in the steelmaking process. Moreover, in July 2021, the EPA issued a public statement regarding Clean Air Act violations at metal recycling facilities that operate auto and scrap metal shredders, noting that noncompliant shredders can have an impact on overburdened communities, and in August 2023, the EPA released federal enforcement priorities, which affirmed the EPA’s continued focus on reducing air toxins. The EPA uses alerts such as this to signal its intention to focus enforcement activity on a particular industry sector.
Legal requirements are changing frequently and are subject to interpretation. New laws, regulations and changing interpretations by regulatory authorities, together with uncertainty regarding adequate pollution control levels, testing and sampling procedures, new pollution control technology and cost/benefit analysis based on market conditions along with changing interpretations, stricter enforcement and expanding scope of regulation to emerging contaminants are all factors that may increase our future expenditures to comply with environmental requirements. Accordingly, we are unable to predict the ultimate cost of future compliance with these requirements or their effect on our operations. We cannot predict whether such costs would be able to be passed on to customers through product price increases. Competitors in various regions or countries where environmental regulation is less restrictive, subject to different interpretation or generally not enforced, may enjoy a competitive advantage.
We may also be required to conduct additional cleanup (and pay for associated natural resource damages) at sites where we have already participated in remediation efforts or take remediation action with regard to sites formerly used in connection with our operations in response to new information or new regulatory requirements. We may be required to pay for a portion or all of the costs of cleanup or remediation at sites we never owned or on which we never operated if we are found to have arranged for treatment or disposal of hazardous substances on the sites. In cases of joint and several liability, we may be obligated to pay a disproportionate share of cleanup costs if other responsible parties are financially insolvent.
Increased regulation associated with climate change could impose significant additional costs on both our steelmaking and metals recycling operations.
Energy used by our steelmaking operations is a significant input and the largest contributor to our GHG emissions and there is growing belief that consumption of energy derived from fossil fuels is a major contributor to climate change. The U.S. government and various governmental agencies have introduced or are contemplating regulatory changes in response to the potential impact of climate change, including legislation regarding carbon emission pricing, GHG emissions and renewable energy targets. International treaties or agreements may also result in increasing regulation of GHG emissions, including the introduction of carbon emissions trading mechanisms. Therefore, any such regulation regarding climate change and GHG emissions could impose significant costs on our steelmaking and metals recycling operations and on the operations of our customers and suppliers, including increased energy, capital equipment, environmental monitoring and reporting and other costs in order to comply with current or future laws or regulations and limitations imposed on our operations. The potential costs of "allowances," "offsets" or "credits" that may be part of potential cap-and-trade programs or similar future regulatory measures are still uncertain. Any adopted future climate change and GHG regulations could negatively impact our ability (and that of our customers and suppliers) to compete with companies situated in areas not subject to such limitations. From a medium and long-term perspective, as a result of these regulatory initiatives, we may see an increase in costs relating to our assets that emit significant amounts of GHGs. Additionally, although we are focused on water conservation and reuse in our operations, steel manufacturing is a water intensive industry. There may be an increase in costs to respond to future water laws and regulations, and operations in areas with limited water availability may be impacted if droughts become more frequent or severe.
Regulatory initiatives in these areas will be either voluntary or mandatory and may impact our operations directly or through our suppliers or customers. Until the timing, scope and extent of any future regulation becomes known, we cannot predict the effect on our business, results of operations or financial condition, but such effect could be materially adverse to our business, results of operations and financial condition.
We are subject to governmental regulatory and compliance risks that expose us to potential litigation and disputes regarding violations, which could adversely affect our business, results of operations and financial condition.
As noted above, existing laws or regulations, as currently interpreted or reinterpreted in the future, and future laws and regulations, may have a material adverse effect on our business, results of operations and financial condition. See the risk factor "Compliance with and changes in environmental laws and regulations and remediation requirements could result in substantially increased capital obligations and operating costs; violations of environmental laws and regulations could result in costs that have a material adverse effect on our business, results of operations and financial condition" of this Annual Report for a description of such risks relating to environmental laws and regulations. In addition to such environmental laws and regulations, complex foreign and U.S. laws and regulations that apply to our international operations, including without limitation the Foreign Corrupt Practices Act and similar laws in other countries, which generally prohibit companies and those acting on their behalf from making improper payments to foreign government officials for the purpose of obtaining or retaining business, regulations related to import-export controls, the Office of Foreign Assets Control sanctions program and antiboycott provisions, may increase our cost of doing business in international jurisdictions and expose us and our employees to elevated risk. While we believe that we have adopted appropriate risk management and compliance programs, the nature of our operations means that legal and compliance risks will continue to exist. A negative outcome in an unusual or significant legal proceeding or compliance investigation could adversely affect our business, results of operations and financial condition.
We are involved, and may in the future become involved, in various environmental matters that may result in fines, penalties or judgments being assessed against us or liability imposed upon us which we cannot presently estimate or reasonably foresee, and which may have a material impact on our business, results of operations and financial condition.
Under CERCLA or similar state statutes, we may have obligations to conduct investigation and remediation activities associated with alleged releases of hazardous substances or other materials or to reimburse the EPA (or state agencies as applicable) for such activities and to pay for natural resource damages associated with alleged releases. We have been named a PRP at several federal and state Superfund sites because the EPA or an equivalent state agency contends that we and other potentially responsible scrap metal suppliers are liable for the cleanup of those sites as a result of having sold scrap metal to unrelated manufacturers for recycling as a raw material in the manufacture of new products. We are involved in litigation or administrative proceedings with regard to several of these sites in which we are contesting, or at the appropriate time may contest, our liability. In addition, we have received information requests with regard to other sites which may be under consideration by the EPA as potential CERCLA sites.
We are presently participating in PRP organizations at several sites, which are paying for certain remediation expenses. Although we are unable to precisely estimate the ultimate dollar amount of exposure to loss in connection with various environmental matters or the effect on our consolidated financial position, we make accruals as warranted. In addition, although we do not believe that a reasonably possible range of loss in excess of amounts accrued for pending lawsuits, claims or proceedings would be material to our financial statements, additional developments may occur, and due to inherent uncertainties, including evolving remediation technology, changing regulations, possible third-party contributions, the inherent uncertainties of the estimation process, the uncertainties involved in litigation and other factors, the amounts we ultimately are required to pay could vary significantly from the amounts we accrue, and this could have a material adverse effect on our business, results of operations and financial condition.
Changes in tax legislation and regulations in the jurisdictions in which we operate may adversely affect our financial condition or results of operations.
We are subject to taxation at the federal, state and local levels in the U.S., Poland, the U.K. and other countries and jurisdictions in which we operate, including income taxes, sales taxes, value-added taxes and similar taxes and assessments. New tax legislative initiatives may be proposed from time to time which may impact our effective tax rate and which could adversely affect our tax positions or tax liabilities. Our future effective tax rate could be adversely affected by, among other things, changes in the composition of earnings in jurisdictions with differing tax rates, changes in statutory rates and other legislative changes, changes in interpretations of existing tax laws, or changes in determinations regarding the jurisdictions in which we are subject to tax. From time to time, U.S. federal, state and local and foreign governments make substantive changes to tax rules and their application, which could result in materially higher taxes than would be incurred under existing tax law and which could adversely affect our financial condition or results of operations.
ITEM 1B.
None.
ITEM 1C. CYBERSECURITY
Risk Management and Strategy
UNRESOLVED STAFF COMMENTS CMC has established a comprehensive cybersecurity risk management program to identify, assess and manage material risks from cybersecurity threats to our computer systems, outsourced services, communications systems, industrial processing equipment, hardware and software, and to safeguard our data and our customers’ data. Our risk management program includes a documented cybersecurity incident response plan and a data breach response plan (the “response plans”) that outline how to respond to and contain incidents and data breaches. Additionally, we maintain a cybersecurity incident disclosure and evaluation plan (the "disclosure plan") which would be used to assess the impact of a cybersecurity incident and promptly issue required SEC disclosures if needed. The response plans and disclosure plan are adapted depending on the type of incident or data breach and are tested at least once per year. We use the National Institute of Standards and Technology Cybersecurity Framework to guide our risk management program and utilize third parties to regularly review our response plans.
CMC recognizes the critical importance of a well-developed cybersecurity risk management program within an ever-changing threat landscape and has designed ongoing cybersecurity management protocols that are embedded into our global business processes and activities. These protocols include, but are not limited to, penetration testing, vulnerability scanning, attack simulations and appropriate internal controls, along with independent third-party audits conducted to evaluate compliance with security standards and best practices. The protocols are designed by our Chief Information Security Officer (“CISO”) and implemented by an experienced team including our information security and various technology departments. We engage expert consultants and third-party service providers to review our cybersecurity controls and readiness, alert us to potential improvements and provide incremental industry knowledge and expertise. Additionally, employees are required to complete cybersecurity training at the start of their employment and annually thereafter and are regularly exposed to phishing awareness campaigns that simulate real-world threats.
Our cybersecurity risk management program also addresses cybersecurity risks associated with our use of third-party service providers and our vendors. We proactively manage these risks by reviewing current and prospective third-party service providers’ compliance with our established relevant privacy and data security standards. We also require our key vendors to complete security questionnaires and we conduct audits and vulnerability scans related to them. Depending on the nature of the services provided and the sensitivity of the relevant data involved, our service provider and vendor management processes may involve different levels of assessment and impose additional obligations related to cybersecurity on the service provider or vendor.
While previous cybersecurity incidents and threats have not materially adversely affected our business strategy, results of operations or financial condition to date, any actual or perceived breach of our security could damage our reputation or subject us to third-party lawsuits, regulatory investigations and fines or other actions or liabilities, any of which could materially adversely affect our business strategy, results of operations, or financial condition. See Item 1A, Risk Factors, “Information technology interruptions and breaches in data security could adversely impact our business, results of operations and financial condition” for more information.
Governance
Both management and our Board understand that cybersecurity is crucial for securing our data and operations and defending the interests of our stakeholders. Our Board considers cybersecurity risk management as part of its general oversight function and receives an annual update on cybersecurity matters. The audit committee of our Board oversees management’s process for identifying and mitigating cybersecurity threats and implementing the cybersecurity risk management processes described above. On a quarterly basis, our Vice President and Chief Information Officer (“CIO”) and CISO update the audit committee regarding cybersecurity management initiatives, the status of ongoing cybersecurity threats CMC faces and other developments regarding our cybersecurity management protocols.
Our CISO has many years of experience in creating and implementing cybersecurity risk management programs and using cybersecurity management technologies and infrastructure solutions. Our CISO works under the supervision of our CIO, who has extensive experience in information technology and cybersecurity functions. Both the CISO and the CIO have daily responsibility for cybersecurity risk management and establishing risk management practices, and are involved in the execution of the response plans described above when a possible cybersecurity incident occurs. We engage a third-party service provider on a bi-annual basis to evaluate our cybersecurity risk management program and perform health checks on key applications. We also complete annual penetration testing to test our defenses against potential threats or risks.
The response plans referenced above define a cross-functional cyber incident response team (the “CIRT”) that includes members of senior management, including the CISO and CIO, among other skilled employees. The CIRT plays an important role in the detection, mitigation, and remediation of cybersecurity incidents and in informing relevant members of management and the audit committee on cybersecurity threats and events. Select members of the CIRT actively participate in regular technical readiness exercises. Moreover, our executive officers participate in annual crisis tabletop exercises and attack simulations to prepare for a swift, effective, and thorough response to a potential cybersecurity incident.
ITEM 2. PROPERTIES
The following table describes our principal properties as of August 31, 2024. These properties are either owned by us and not subject to any significant encumbrances or are leased by us. Refer to Part I, Item 1, Business included in this Annual Report for a discussion of the nature of our operations.
|
|
|
|
|
|
|
|
|
|
|
|
|
|
|
|
|
|
|
|
|
|
|
|
|
|
|
|
|
|
|
|
|
| Segment and Operation |
|
Location |
|
Site Acreage Owned |
|
Site Acreage Leased |
|
Approximate Building Square Footage |
|
Capacity (Millions of Tons)(9) |
| North America Steel Group |
|
|
|
|
|
|
|
|
|
|
| Recycling facilities |
|
(1) |
|
773 |
|
90 |
|
1,670,000 |
|
|
5.1 |
| Steel mills |
|
|
|
|
|
|
|
|
|
6.1 |
| Mini mill |
|
Birmingham, Alabama |
|
71 |
|
1 |
|
|
580,000 |
|
|
|
| Mini mill |
|
Cayce, South Carolina |
|
142 |
|
— |
|
|
760,000 |
|
|
|
| Mini mill |
|
Jacksonville, Florida |
|
619 |
|
— |
|
|
460,000 |
|
|
|
| Mini mill |
|
Knoxville, Tennessee |
|
76 |
|
— |
|
|
460,000 |
|
|
|
| Mini mill |
|
Sayreville, New Jersey |
|
116 |
|
— |
|
|
380,000 |
|
|
|
| Mini mill |
|
Seguin, Texas |
|
661 |
|
— |
|
|
870,000 |
|
|
|
| Micro mill |
|
Durant, Oklahoma |
|
402 |
|
4 |
|
|
290,000 |
|
|
|
| Two micro mills |
|
Mesa, Arizona |
|
273 |
|
— |
|
|
820,000 |
|
|
|
| Rerolling mill |
|
Magnolia, Arkansas |
|
123 |
|
— |
|
|
280,000 |
|
|
|
|
|
|
|
|
|
|
|
|
|
|
| Fabrication facilities |
|
(2) |
|
751 |
|
40 |
|
|
2,990,000 |
|
|
2.2 |
|
|
|
|
|
|
|
|
|
|
|
| Post-tension cable facilities |
|
(3) |
|
3 |
|
|
8 |
|
|
120,000 |
|
|
|
|
|
|
|
|
|
|
|
|
|
|
| Europe Steel Group |
|
|
|
|
|
|
|
|
|
|
| Recycling facilities |
|
12 locations in Poland(4) |
|
104 |
|
4 |
|
|
160,000 |
|
|
0.7 |
| Steel mini mill |
|
Zawiercie, Poland |
|
524 |
|
— |
|
|
2,950,000 |
|
|
1.7 |
| Fabrication facilities |
|
Five locations in Poland(4) |
|
24 |
|
— |
|
|
260,000 |
|
|
0.5 |
|
|
|
|
|
|
|
|
|
|
|
| Emerging Businesses Group |
|
|
|
|
|
|
|
|
|
|
| CMC Anchoring Systems facilities |
|
(5) |
|
— |
|
|
26 |
|
|
170,000 |
|
|
|
| CMC Impact Metals facilities |
|
(6) |
|
112 |
|
— |
|
|
300,000 |
|
|
|
| CMC Construction Services facilities |
|
(7) |
|
35 |
|
51 |
|
450,000 |
|
|
|
| Tensar facilities |
|
(8) |
|
34 |
|
20 |
|
710,000 |
|
|
|
__________________________________
(1) Consists of 43 scrap metal recycling facilities, with 17 locations in Texas, seven locations in South Carolina, four locations in Florida, three locations in Tennessee, two locations in each of Alabama, Georgia, Missouri and North Carolina and one location in each of California, Kansas, Louisiana and Oklahoma. The recycling facilities associated with the North America Steel Group segment are not individually material.
(2) Consists of 54 fabrication facilities, with 11 locations in Texas, five locations in Florida, three locations in each of California and Illinois, two locations in each of Arizona, Colorado, Georgia, Hawaii, Missouri, Nevada, New Jersey, North Carolina, Oklahoma, South Carolina, Tennessee, Utah and Virginia and one location in each of Alabama, Kentucky, Louisiana, New Mexico, Ohio and Washington. The fabrication facilities associated with the North America Steel Group segment are not individually material.
(3) Consists of three post-tension cable facilities, with two locations in Georgia and one location in California. The post-tension cable facilities are not individually material.
(4) The recycling facilities and fabrication facilities associated with the Europe Steel Group segment are not individually material.
(5) Consists of four CMC Anchoring Systems facilities, with one location in each of North Carolina, Tennessee, Texas and Utah. The CMC Anchoring Systems facilities are not individually material.
(6) Consists of two CMC Impact Metals facilities, with one location in Alabama and one location in Pennsylvania. The CMC Impact Metals facilities are not individually material.
(7) Consists of 24 CMC Construction Services facilities, with 18 locations in Texas, five locations in Louisiana and one location in Oklahoma. The CMC Construction Services facilities are not individually material.
(8) Consists of four Tensar facilities, with one location in each of Georgia, Oklahoma, China and the U.K. The Tensar facilities are not individually material.
(9) Refer to Part 1, Item 1, Business, of this Annual Report for information about the calculation of capacity for our steel mills.
The extent to which we utilize our capacity varies by property and is highly dependent on the specific product mix manufactured. Our product mix is determined in response to market conditions, including pricing and demand. We believe our properties are appropriately utilized and suitable to meet the requirements of our present and foreseeable future operations, and our facilities are capable of producing increased volumes.
In addition to the owned facilities described above, we own 208 acres of land in Berkeley County, West Virginia, the site of the Company's fourth micro mill, which is currently under construction. We expect an operational start-up in late calendar 2025.
In addition to the leased facilities described above, we lease the 105,916 square foot office space occupied by our corporate headquarters in Irving, Texas. Generally, our leases expire on various dates over the next ten years, with the exception of the leased facilities in our Europe Steel Group segment, which have longer lease terms. Several of the leases have renewal options. We have generally been able to renew leases prior to their expiration. We estimate our minimum annual rental obligation for our real estate operating leases in effect at August 31, 2024, to be paid during 2025, to be approximately $13.2 million.
ITEM 3. LEGAL PROCEEDINGS
The Company is involved in legal and regulatory proceedings, lawsuits, claims and investigations (including those related to environmental laws and regulations) associated with the normal conduct of its businesses and operations. It is not possible to predict the outcome of the pending actions, and, as with any litigation, it is possible that these actions could be decided unfavorably to the Company.
Legal Proceedings
On October 30, 2020, plaintiff Pacific Steel Group ("PSG") filed a suit in the United States District Court for the Northern District of California (the "Northern District Court") alleging that CMC, CMC Steel Fabricators, Inc. and CMC Steel US, LLC violated federal and California state antitrust laws and California common law by entering into an exclusivity agreement for certain steel mill equipment manufactured by one of the Company’s equipment suppliers. PSG seeks, among other things, a jury trial on its claims in addition to injunctive relief, compensatory damages, fees and costs. Fact and expert discovery are complete. Both the motion for summary judgment filed by CMC, CMC Steel Fabricators, Inc. and CMC Steel US, LLC and the cross-motion for summary judgment filed by PSG were denied by the Northern District Court on June 10, 2024. A jury trial is scheduled for late October 2024. The Company believes that it has substantial defenses and intends to vigorously defend against PSG's claims. The Company has not recorded any liability for this matter as it does not believe a loss is probable, and it cannot estimate any reasonably possible loss or range of possible loss. It is possible that an unfavorable resolution to this matter could have an adverse effect on the Company’s results of operations, financial position or cash flows.
On March 13, 2022, PSG filed a second suit in the San Diego County Superior Court of California alleging that CMC Steel Fabricators, Inc., CMC Steel US, LLC, and CMC Rebar West (which later merged into CMC Steel Fabricators, Inc.) violated California state antitrust and unfair competition laws by bidding below their costs for rebar furnish-and-install projects in California to hamper PSG's ability to win jobs. These same allegations were initially brought in PSG's lawsuit pending in the Northern District Court but were dismissed without prejudice by the Northern District Court for lack of jurisdiction. This second lawsuit was later removed to the United States District Court for the Southern District of California (the "Southern District Court"). There, PSG seeks, among other things, a jury trial on its claims in addition to injunctive relief, compensatory damages, fees and costs. Fact discovery is substantially complete and expert discovery is underway. As of the date of this Annual Report, no motions for summary judgment have been filed nor has a trial been scheduled. The Company believes that it has substantial defenses and intends to vigorously defend against PSG's claims. The Company has not recorded any liability for this matter as it does not believe a loss is probable, and it cannot estimate any reasonably possible loss or range of possible loss. It is possible that an unfavorable resolution to this matter could have an adverse effect on the Company’s results of operations, financial position or cash flows.
Environmental Matters
We are the subject of civil actions regarding compliance with environmental law, or have received notices from the EPA or state agencies with similar responsibility, that we and numerous other parties are considered a PRP and may be obligated under CERCLA, or similar state statutes, to pay for the cost of remedial investigation, feasibility studies and ultimately remediation to correct alleged releases of hazardous substances at ten locations.
The actions and notices refer to the following locations, none of which involve real estate we ever owned or upon which we ever conducted operations: the Sapp Battery site in Cottondale, Florida, the Interstate Lead Company site in Leeds, Alabama, the Peak Oil site in Tampa, Florida, the R&H Oil site in San Antonio, Texas, the SoGreen/Parramore site in Tifton, Georgia, the Jensen Drive site in Houston, Texas, the Chemetco site in Hartford, Illinois, the Ward Transformer site in Raleigh, North Carolina, the Bailey Metal Processors, Inc. site in Brady, Texas and the Poly-Cycle Industries, Inc. site in Tecula, Texas. We may contest our designation as a PRP with regard to certain sites, while at other sites we are participating with other named PRPs in agreements or negotiations that have resulted or that we expect will result in agreements to remediate the sites. During 2010, we acquired a 70% interest in the real property at Jensen Drive as part of the remediation of that site. We have periodically received information requests from government environmental agencies with regard to other sites that are apparently under consideration for designation as listed sites under CERCLA or similar state statutes. Often, we do not receive any further communication with regard to these sites, and as of the date of this Annual Report, we do not know if any of these inquiries will ultimately result in a demand for payment from us.
We believe that adequate provisions have been made in the financial statements for the potential impact of any loss in connection with the above-described environmental matters and other miscellaneous litigation and legal proceedings not referenced above. We believe that there are substantial defenses to these actions and, where appropriate, these actions are being vigorously contested. Management believes that the outcome of the above-described environmental matters and other miscellaneous litigation and proceedings not referenced above now pending will not have a material adverse effect on our business, results of operations or financial condition.
ITEM 4. MINE SAFETY DISCLOSURES ITEM 5.
Not applicable.
PART II
MARKET FOR REGISTRANT'S COMMON EQUITY, RELATED STOCKHOLDER MATTERS AND ISSUER PURCHASES OF EQUITY SECURITIES
MARKET, STOCKHOLDERS AND DIVIDENDS
Our common stock is traded on the New York Stock Exchange under the symbol CMC. The number of stockholders of record of CMC common stock at October 14, 2024 was 1,905.
In March 2024, our Board authorized an increase of $0.02 to our quarterly cash dividend, resulting in a $0.18 cash dividend per share of CMC common stock paid during the third and fourth quarters of 2024, compared to a quarterly cash dividend of $0.16 per share of CMC common stock paid during the first and second quarters of 2024 and during the year ended August 31, 2023. On October 15, 2024, the Board declared CMC's 240th consecutive quarterly cash dividend. The dividend was declared at the rate of $0.18 per share of CMC common stock and is payable on November 14, 2024 to stockholders of record as of the close of business on October 31, 2024. While the Board currently intends to continue regular quarterly cash dividend payments, the Board's determination with respect to any future dividends will depend upon our profitability and financial condition, contractual restrictions, restrictions imposed by applicable law and other factors that the Board deems relevant at the time of such determination. Based on its evaluation of these factors, the Board may determine not to declare a dividend, or to declare dividends at rates that are less than currently anticipated.
PURCHASES OF EQUITY SECURITIES BY THE ISSUER AND AFFILIATED PURCHASERS
The following table provides information about purchases of equity securities registered by the Company pursuant to Section 12 of the Exchange Act, as amended, made by the Company during the quarter ended August 31, 2024.
|
|
|
|
|
|
|
|
|
|
|
|
|
|
|
|
|
|
|
|
|
|
|
|
|
|
|
Issuer Purchases of Equity Securities(1) |
| Period |
|
Total Number of Shares Purchased |
|
Average Price Paid Per Share |
|
Total Number of Shares Purchased as Part of Publicly Announced Plans or Programs |
|
Approximate Dollar Value of Shares that May Yet Be Purchased Under the Plans or Programs as of the End of Period |
| June 1, 2024 - June 30, 2024 |
|
202,806 |
|
|
$ |
53.02 |
|
|
202,806 |
|
|
$ |
447,804,879 |
|
| July 1, 2024 - July 31, 2024 |
|
391,949 |
|
|
56.15 |
|
|
391,949 |
|
|
425,797,663 |
|
| August 1, 2024 - August 31, 2024 |
|
406,341 |
|
|
54.16 |
|
|
406,341 |
|
|
403,780,629 |
|
|
|
1,001,096 |
|
|
|
|
1,001,096 |
|
|
|
__________________________________
(1) On October 13, 2021, the Company announced that the Board authorized a share repurchase program under which the Company may repurchase up to $350.0 million of the Company's outstanding common stock. On January 10, 2024, the Company announced that the Board authorized an increase of $500.0 million to the existing share repurchase program. The share repurchase program does not require the Company to purchase any dollar amount or number of shares of CMC common stock and may be modified, suspended, extended or terminated by the Company at any time without prior notice. See Note 15, Capital Stock, in Part II, Item 8 of this Annual Report for more information on the share repurchase program.
ITEM 7. MANAGEMENT'S DISCUSSION AND ANALYSIS OF FINANCIAL CONDITION AND RESULTS OF OPERATIONS
This Management's Discussion and Analysis of Financial Condition and Results of Operations should be read in conjunction with our consolidated financial statements and the accompanying notes contained in this Annual Report.
OVERVIEW
CMC is an innovative solutions provider helping build a stronger, safer and more sustainable world. Through an extensive manufacturing network principally located in the U.S. and Central Europe, the Company offers products and technologies to meet the critical reinforcement needs of the global construction sector. CMC’s solutions support construction across a wide variety of applications, including infrastructure, non-residential, residential, industrial and energy generation and transmission. Our operations are conducted through three reportable segments: North America Steel Group, Europe Steel Group and the Emerging Businesses Group. See Part I, Item 1, Business, of this Annual Report for further information regarding our business and reportable segments.
Key Performance Indicators
When evaluating our results for the period, we compare net sales, in the aggregate and for each of our reportable segments, in the current period to net sales in the corresponding period of the prior year. Specifically, for the North America Steel Group segment and the Europe Steel Group segment we focus on changes in average selling price per ton and tons shipped compared to the prior year period for each of our vertically integrated product categories as these are the two variables that typically have the greatest impact on our net sales for these reportable segments. Of the products evaluated based on changes in average selling price per ton and tons shipped within the North America Steel Group and Europe Steel Group segments, raw materials include ferrous and nonferrous scrap, steel products include rebar, merchant bar and other steel products, such as billets and wire rod, and downstream products include fabricated rebar, steel fence posts and wire mesh. The evaluations of average selling price per ton and tons shipped for downstream products exclude post-tension cable, which is not measured on a per ton basis.
Adjusted EBITDA is used by management to compare and evaluate the period-over-period underlying business operational performance of our reportable segments. Adjusted EBITDA is the sum of the Company's earnings before interest expense, income taxes, depreciation and amortization and impairment expense. Although there are many factors that can impact a segment’s adjusted EBITDA and, therefore, our overall earnings, changes in metal margins of our steel products and downstream products period-over-period in the North America Steel Group and Europe Steel Group segments are a consistent area of focus for our Company and industry. Metal margin is a metric used by management to monitor the results of our vertically integrated organization. For our steel products, metal margin is the difference between the average selling price per ton of rebar, merchant bar and other steel products and the cost of ferrous scrap per ton utilized by our steel mills to produce these products. An increase or decrease in input costs can impact profitability of these products when there is no corresponding change in selling prices. The metal margin for the North America Steel Group and Europe Steel Group segments' downstream products is the difference between the average selling price per ton of our downstream products and the scrap input costs to produce these products. The majority of the North America Steel Group and Europe Steel Group segments' downstream products selling prices per ton are fixed at the beginning of a project and these projects last one to two years on average. Because the selling price generally remains fixed over the life of a project, changes in input costs over the life of the project can significantly impact profitability.
BUSINESS CONDITIONS AND DEVELOPMENTS
Change in Reportable Segments
During the first quarter of 2024, we changed our reportable segments to reflect a change in the manner in which our business is managed. Based on changes to our organizational structure, the evolution of our solutions offerings outside of traditional steel products, the growing importance of non-steel solutions to our financial results and future outlook and how our chief operating decision maker, our President and Chief Executive Officer, reviews operating results and makes decisions about resource allocation, we now have three reportable segments that represent the primary businesses reported in our consolidated financial statements: North America Steel Group, Europe Steel Group and Emerging Businesses Group. See the section titled "Results of Operations Summary" below and Part I, Item 1, Business for further information regarding our business and reportable segments. As a result of this change in reportable segments, certain prior year amounts have been recast to conform to the current year presentation. Throughout this Form 10-K, unless otherwise indicated, amounts and activity affected by the change in reportable segments have been reclassified.
2023 Acquisitions
On September 15, 2022, we completed the acquisition of Advanced Steel Recovery, LLC ("ASR"), a supplier of recycled ferrous scrap metals located in Southern California. ASR's primary operations include processing and brokering capabilities that source material for sale into both the domestic and export markets.
On November 14, 2022, we completed the acquisition of a Galveston, Texas area metals recycling facility and related assets (collectively, "Kodiak") from Kodiak Resources, Inc. and Kodiak Properties, L.L.C.
On March 3, 2023, we completed the acquisition of all of the assets of Roane Metals Group, LLC ("Roane"), a supplier of recycled metals with two facilities located in eastern Tennessee.
On March 17, 2023, we completed the acquisition of Tendon Systems, LLC ("Tendon"), a leading provider of post-tensioning, barrier cable and concrete restoration solutions to the southeastern U.S.
On May 1, 2023, we completed the acquisition of all of the assets of BOSTD America, LLC ("BOSTD"), a geogrid manufacturing facility located in Blackwell, Oklahoma. Prior to the acquisition, BOSTD produced several product lines for our Tensar operations under a contract manufacturing arrangement.
On July 12, 2023, we completed the acquisition of EDSCO Fasteners, LLC ("EDSCO"), a leading provider of anchoring solutions for the electrical transmission market, with four manufacturing facilities located in North Carolina, Tennessee, Texas and Utah. Following the acquisition, EDSCO was rebranded as CMC Anchoring Systems.
Operating results for ASR, Kodiak, Roane and Tendon are presented within the North America Steel Group segment. Operating results for BOSTD and CMC Anchoring Systems are presented within the Emerging Businesses Group segment. The acquired operations of ASR, Kodiak, Roane, Tendon, BOSTD and CMC Anchoring Systems are collectively referred to as the "2023 Acquisitions."
Tensar Acquisition
On April 25, 2022 (the "Tensar Acquisition Date"), we completed the acquisition of TAC Acquisition Corp. ("Tensar") for approximately $550 million, net of cash acquired. Through its patented foundation systems, Tensar produces ground stabilization and soil reinforcement solutions that complement our existing concrete reinforcement product lines and broaden our ability to address multiple early phases of commercial and infrastructure construction, including subgrade, foundation and structures. End customers for these products include commercial, industrial and residential site developers, mining and oil and gas companies, transportation authorities, coastal and waterway authorities and waste management companies. The acquired operations are presented within our Emerging Businesses Group segment. See Note 2, Changes in Business, in Part II, Item 8 of this Annual Report for more information about the Tensar acquisition.
Capital Expenditures
During the fourth quarter of 2023, our third micro mill was placed into service. The new facility, located in Mesa, Arizona, replaced the rebar capacity at our Rancho Cucamonga, California mill, which was sold during 2022, and allows us to meet underlying West Coast and Pacific Northwest demand for steel products. For further details on the sale of the Rancho Cucamonga, California mill, refer to Note 2, Changes in Business, in Part II, Item 8 of this Annual Report. Designed to produce both rebar and merchant bar, this micro mill is the first in the world to produce merchant bar quality products through a continuous production process. Initial commercial production of rebar commenced during commissioning, prior to the startup of merchant bar production, which commenced during the second quarter of 2024. The merchant bar products produced at this facility consist of a wide variety of shapes and sizes of long steel, and, combined with rebar production, the capacity of this micro mill is approximately 40% greater than that of the other micro mills we have constructed. The micro mill was designed with the latest technology in electric arc furnace ("EAF") power supply systems, which can allow us to directly connect the EAF and the ladle furnace to renewable energy sources such as solar and wind. Additionally, this micro mill is the Company’s first micro mill to utilize Q-ONE technology on an EAF, which provides energy efficiencies and precise electrical control during production, creating a stable and consistent output.
In December 2022, we announced that our planned fourth micro mill would be located in Berkeley County, West Virginia. This new micro mill will be geographically situated to serve the Northeast, Mid-Atlantic and Mid-Western U.S. markets and will be supported by our existing network of downstream fabrication plants. Site improvements and foundation work for the micro mill are complete, large portions of supporting infrastructure have been installed and equipment installation is underway. We expect an operational start-up in late calendar 2025.
Chief Executive Officer Transition
Effective September 1, 2023, our Board appointed Peter R. Matt, our then President, as President and Chief Executive Officer, immediately following the retirement of Barbara R. Smith, our then Chief Executive Officer and Chairman of the Board. The Chief Executive Officer transition from Ms. Smith to Mr. Matt followed our formal succession planning process. Mr. Matt has served as our President since April 9, 2023 and continues to serve as a member of the Board, which he joined in June 2020. Ms. Smith was appointed Executive Chairman of the Board, effective September 1, 2023, and retired from such position and from the Board effective August 31, 2024.
Russian Invasion of Ukraine
The Russian invasion of Ukraine did not have a direct material adverse impact on our business, financial condition or results of operations during 2024, 2023 or 2022. Our Europe Steel Group segment has not experienced an interruption in energy supply and was able to identify alternate sources for a limited number of materials previously procured through Russia. However, the Russian invasion of Ukraine has led to economic slowdowns in Europe, including significant volatility in commodity prices and credit markets, reductions in demand, supply chain interruptions and higher global inflation. We will continue to monitor disruptions in supply of energy and materials and the indirect effects on our operations of inflationary pressures, reductions in demand, foreign exchange rate fluctuations, commodity pricing, potential cybersecurity risks and sanctions resulting from the invasion.
See Part I, Item 1A, Risk Factors, in this Annual Report for further discussion related to the above business conditions and developments.
RESULTS OF OPERATIONS SUMMARY
|
|
|
|
|
|
|
|
|
|
|
|
|
|
|
|
|
|
|
|
|
| |
|
Year Ended August 31, |
| (in thousands, except per share data) |
|
2024 |
|
2023 |
|
2022 |
| Net sales |
|
$ |
7,925,972 |
|
|
$ |
8,799,533 |
|
|
$ |
8,913,481 |
|
| Net earnings |
|
485,491 |
|
|
859,760 |
|
|
1,217,262 |
|
| Diluted earnings per share |
|
4.14 |
|
|
7.25 |
|
|
9.95 |
|
2024 Compared to 2023
Net sales during 2024 decreased $873.6 million, or 10%, compared to 2023. See discussions below, labeled North America Steel Group, Europe Steel Group and Emerging Businesses Group within the Segment Operating Data section, for further information on our net sales results.
During 2024, we achieved net earnings of $485.5 million, a decrease of $374.3 million, or 44%, compared to 2023. The year-over-year change in net earnings was primarily due to compression in steel products metal margins in both our North America Steel Group and Europe Steel Group segments during 2024 driven by declining steel products average selling prices per ton, while the cost of ferrous scrap utilized per ton decreased at a lesser rate. Net earnings includes $69.4 million of government assistance recognized in the Europe Steel Group segment during 2024, compared to $13.8 million of government assistance recognized in 2023.
Selling, General and Administrative Expenses
SG&A expenses increased $21.5 million in 2024 compared to 2023. Contributing to the year-over-year increase was $10.3 million of incremental SG&A expenses attributable to the 2023 Acquisitions incurred during 2024 compared to a partial year of expenses recorded during 2023 following their respective acquisition dates. The remaining increase in SG&A expenses in 2024 compared to 2023 was primarily due to $10.2 million of increased professional services expenses, $5.9 million of increased benefit restoration plan ("BRP") expenses and $6.1 million of increased information technology expenses. These increases were partially offset by $11.2 million of decreased labor-related expenses in 2024 compared to 2023. Additionally, the results for 2023 included a $4.2 million pension plan settlement charge, with no such settlement charge in 2024. See Note 2, Changes in Business, in Part II, Item 8 of this Annual Report for more information about the 2023 Acquisitions and Note 14, Employees' Retirement Plans, in Part II, Item 8 of this Annual Report for more information on the pension plan termination activity.
Interest Expense
Interest expense increased $7.8 million in 2024 compared to 2023. Although lower average balances of long-term debt outstanding resulted in a $9.2 million decrease in interest expense during 2024 compared to 2023, this decrease was offset by $16.1 million of reduced capitalized interest during 2024 compared to 2023. The decrease in capitalized interest was attributable to the timing of micro mill construction activities, as construction of our third micro mill was nearing completion during 2023 and placed into service at the end of 2023, whereas construction of our fourth micro mill was in the beginning stages during most of 2024.
Income Taxes
Our effective income tax rate for 2024 was 23.6%, which was relatively consistent with our effective income tax rate of 23.4% for 2023. See Note 12, Income Tax, in Part II, Item 8 of this Annual Report for further discussion of our effective tax rate.
2023 Compared to 2022
Net sales during 2023 remained relatively flat compared to 2022. See discussions below, labeled North America Steel Group, Europe Steel Group and Emerging Businesses Group within the Segment Operating Data section, for further information on our net sales results.
During 2023, we achieved net earnings of $859.8 million, a decrease of $357.5 million, or 29%, compared to 2022. Included in net earnings during 2022 was a $273.3 million gain on the sale of the Rancho Cucamonga facilities. The remaining year-over-year change in net earnings was primarily due to compression in steel products metal margins in our Europe Steel Group segment during 2023, contrasted by significant expansion in downstream products metal margins over scrap in our North America Steel Group segment during 2023 compared to 2022. See Note 2, Changes in Business, in Part II, Item 8 of this Annual Report for more information on the sale of the Rancho Cucamonga facilities.
Selling, General and Administrative Expenses
SG&A expenses increased $98.6 million in 2023 compared to 2022. Contributing to the year-over-year increase was $60.5 million of incremental SG&A expenses from Tensar operations' commercial and engineering support incurred during 2023, compared to the expenses recorded in the period following the Tensar Acquisition Date to August 31, 2022, as well as $12.8 million of SG&A expenses from the 2023 Acquisitions, with no such expenses in 2022. The remaining increase in SG&A expenses in 2023 compared to 2022 was primarily due to an $11.1 million increase in professional services expenses, a $10.7 million increase in expenses for our BRP and a $4.2 million pension plan settlement charge, with no such settlement charge in the corresponding period. These fluctuations were partially offset by a $16.6 million decrease in labor-related expenses during 2023 compared to 2022. See Note 2, Changes in Business, in Part II, Item 8 of this Annual Report for more information about the Tensar acquisition and the 2023 Acquisitions and Note 14, Employees' Retirement Plans, in Part II, Item 8 of this Annual Report for more information on the pension plan termination activity.
Interest Expense
Interest expense decreased $10.6 million in 2023 compared to 2022, which can be attributed primarily to an increase in capitalized interest of $9.6 million in 2023 compared to 2022 due to construction of our third micro mill, as well as lower average interest rates on the long-term debt outstanding during 2023 compared to 2022.
Income Taxes
Our effective income tax rate for 2023 was 23.4% compared to 19.7% for 2022. The year-over-year increase was primarily due to a tax benefit recorded during 2022 from a capital loss on a restructuring transaction that did not recur in 2023, as well as a reduction in research and development tax credits in 2023 compared to 2022. See Note 12, Income Tax, in Part II, Item 8 of this Annual Report for further discussion of our effective tax rate.
SEGMENT OPERATING DATA
All amounts are computed and presented in a manner that is consistent with the basis in which we internally disaggregate financial information for the purpose of making operating decisions. See Note 19, Segment Information, in Part II, Item 8 of this Annual Report for further information on how we evaluate financial performance of our segments. The operational data by product category presented in the North America Steel Group and Europe Steel Group tables below is calculated using averages during each period presented.
2024 Compared to 2023
North America Steel Group
|
|
|
|
|
|
|
|
|
|
|
|
|
|
|
|
|
Year Ended August 31, |
| (in thousands, except per ton amounts) |
|
2024 |
|
2023 |
| Net sales to external customers |
|
$ |
6,309,730 |
|
|
$ |
6,704,305 |
|
| Adjusted EBITDA |
|
946,350 |
|
|
1,328,431 |
|
|
|
|
|
|
| External tons shipped |
|
|
|
|
| Raw materials |
|
1,452 |
|
|
1,390 |
|
| Rebar |
|
2,024 |
|
|
1,967 |
|
| Merchant bar and other |
|
945 |
|
|
942 |
|
| Steel products |
|
2,969 |
|
|
2,909 |
|
| Downstream products |
|
1,394 |
|
|
1,466 |
|
|
|
|
|
|
| Average selling price per ton |
|
|
|
|
| Raw materials |
|
$ |
874 |
|
|
$ |
840 |
|
| Steel products |
|
882 |
|
|
977 |
|
| Downstream products |
|
1,346 |
|
|
1,425 |
|
|
|
|
|
|
|
|
|
|
|
| Cost of ferrous scrap utilized per ton |
|
$ |
348 |
|
|
$ |
349 |
|
| Steel products metal margin per ton |
|
534 |
|
|
628 |
|
Net sales to external customers in our North America Steel Group segment decreased $394.6 million, or 6%, in 2024 compared to 2023. Raw materials average selling price per ton increased slightly due to increases in the sales prices of both ferrous and nonferrous scrap metals, and raw materials tons shipped increased, in part, due to a full year of sales from the recycling operations acquired during 2023. See Note 2, Changes in Business, in Part II, Item 8 of this Annual Report for more information about the acquired recycling operations. However, this increase in net sales to external customers from sales of raw materials was offset by decreases in net sales to external customers of steel products and downstream products, primarily due to reductions in steel products and downstream products average selling prices per ton of 10% and 6%, respectively, in 2024 compared to 2023. For both steel products and downstream products, the reductions in selling prices were due to increased competitive pricing in our key markets. Furthermore, the downstream products average selling price per ton during 2023 reflected contracts that were awarded during periods of heightened steel commodity pricing, which has since declined.
During 2024, we achieved adjusted EBITDA of $946.4 million, a decrease of 29% compared to adjusted EBITDA of $1.3 billion in 2023. The decrease in adjusted EBITDA in 2024 compared to 2023 was caused by metal margin compression for both steel products and downstream products. The cost of ferrous scrap utilized per ton, the largest single driver of cost of goods sold for both steel products and downstream products, remained stable year-over-year. However, average selling prices decreased for both steel products and downstream products, as explained above.
Europe Steel Group
|
|
|
|
|
|
|
|
|
|
|
|
|
|
|
|
|
Year Ended August 31, |
| (in thousands, except per ton amounts) |
|
2024 |
|
2023 |
| Net sales to external customers |
|
$ |
848,566 |
|
|
$ |
1,328,791 |
|
| Adjusted EBITDA |
|
22,517 |
|
|
48,473 |
|
|
|
|
|
|
| External tons shipped |
|
|
|
|
| Rebar |
|
364 |
|
|
684 |
|
| Merchant bar and other |
|
870 |
|
|
1,043 |
|
| Steel products |
|
1,234 |
|
|
1,727 |
|
|
|
|
|
|
| Average selling price per ton |
|
|
|
|
| Steel products |
|
$ |
663 |
|
|
$ |
749 |
|
|
|
|
|
|
| Cost of ferrous scrap utilized per ton |
|
$ |
383 |
|
|
$ |
395 |
|
| Steel products metal margin per ton |
|
280 |
|
|
354 |
|
Net sales to external customers in our Europe Steel Group segment decreased $480.2 million, or 36%, in 2024 compared to 2023. This decrease was primarily due to a 29% year-over-year reduction in steel products shipment volumes and a reduction in steel products average selling price per ton of 11% in 2024 as compared to 2023. The slowdown in demand was driven by the sustained indirect impacts of macroeconomic factors affecting the business climate in European end markets, which resulted in lower construction and industrial activity. Additionally, increased imports from neighboring countries contributed to the reduced steel products average selling price per ton in 2024 as compared to 2023. During 2024, overall, the U.S. dollar weakened compared to the Polish zloty. The effect of foreign currency translation was an increase in net sales to external customers of approximately $64.0 million for 2024, determined by using actual results for 2024 measured at the average currency rate during 2023.
Adjusted EBITDA decreased $26.0 million, or 54%, in 2024 compared to 2023, primarily driven by a contraction in steel products metal margin per ton of $74 per ton, or 21%, in 2024 compared to 2023, due to the decline in steel products average selling prices described above, which outpaced the decrease in the cost of ferrous scrap utilized per ton. Adjusted EBITDA was also negatively impacted by lower shipment volumes during 2024 compared to 2023, as described above. Offsetting the impact of the decrease in steel products metal margin per ton and lower shipment volumes, results during 2024 benefited from government assistance programs established to offset the rising costs of electricity and natural gas and the indirect costs of rising carbon emission rights included in energy costs. The government assistance recognized under the programs during 2024 was $69.4 million, compared to $13.8 million of government assistance recognized in 2023. The effect of foreign currency translation was an increase in adjusted EBITDA of approximately $3.8 million during 2024.
Emerging Businesses Group
|
|
|
|
|
|
|
|
|
|
|
|
|
|
|
| |
|
Year Ended August 31, |
| (in thousands) |
|
2024 |
|
2023 |
| Net sales to external customers |
|
$ |
717,397 |
|
|
$ |
721,746 |
|
| Adjusted EBITDA |
|
129,530 |
|
|
138,985 |
|
Net sales to external customers in our Emerging Businesses Group segment remained relatively flat in 2024 compared to 2023. The acquired CMC Anchoring Systems operations provided $38.5 million of incremental net sales to external customers during 2024 compared to the net sales to external customers in 2023 following the acquisition date. See Note 2, Changes in Business, in Part II, Item 8 of this Annual Report for more information on the acquisition of CMC Anchoring Systems. CMC Construction Services' operations experienced a decline in net sales to external customers of $42.6 million, or 13%, in 2024 compared to 2023, due to reduced selling prices across many product lines.
Adjusted EBITDA decreased $9.5 million, or 7%, in 2024 compared to 2023. The year-over-year decrease in adjusted EBITDA was primarily a result of the decline in net sales to external customers for CMC Construction Services caused by reduced selling prices as described above, which impacted fixed cost leverage, and more than offset the positive contribution from the acquired CMC Anchoring Systems operations.
Corporate and Other
|
|
|
|
|
|
|
|
|
|
|
|
|
|
|
| |
|
Year Ended August 31, |
| (in thousands) |
|
2024 |
|
2023 |
| Adjusted EBITDA loss |
|
$ |
(127,758) |
|
|
$ |
(131,185) |
|
Corporate and Other adjusted EBITDA loss decreased by $3.4 million in 2024 compared to 2023. Contributing to the decrease in adjusted EBITDA loss during 2024 compared to 2023 was $13.5 million of increased interest income on short-term investments and $7.7 million of decreased labor-related expenses. Additionally, in 2023 we recognized a $4.2 million pension plan settlement charge, with no such settlement charge in 2024. In contrast to these reductions to adjusted EBITDA loss, we incurred $12.4 million of increased professional services expenses and recognized $6.7 million of other revenue from our New Markets Tax Credit (“NMTC”) transactions in 2024, compared to $17.7 million of other revenue from NMTC transactions in 2023. See Note 9, New Markets Tax Credit Transactions, in Part II, Item 8 of this Annual Report, for more information on the NMTC transactions and Note 14, Employees' Retirement Plans, in Part II, Item 8 of this Annual Report, for more information on the pension plan termination activity.
2023 Compared to 2022
North America Steel Group
|
|
|
|
|
|
|
|
|
|
|
|
|
|
|
|
|
Year Ended August 31, |
| (in thousands, except per ton amounts) |
|
2023 |
|
2022 |
| Net sales to external customers |
|
$ |
6,704,305 |
|
|
$ |
6,798,405 |
|
| Adjusted EBITDA |
|
1,328,431 |
|
|
1,482,667 |
|
|
|
|
|
|
| External tons shipped |
|
|
|
|
| Raw materials |
|
1,390 |
|
|
1,375 |
|
| Rebar |
|
1,967 |
|
|
1,805 |
|
| Merchant bar and other |
|
942 |
|
|
1,024 |
|
| Steel products |
|
2,909 |
|
|
2,829 |
|
| Downstream products |
|
1,466 |
|
|
1,559 |
|
|
|
|
|
|
| Average selling price per ton |
|
|
|
|
| Raw materials |
|
$ |
840 |
|
|
$ |
1,073 |
|
| Steel products |
|
977 |
|
|
1,059 |
|
| Downstream products |
|
1,425 |
|
|
1,218 |
|
|
|
|
|
|
|
|
|
|
|
| Cost of ferrous scrap utilized per ton |
|
$ |
349 |
|
|
$ |
431 |
|
| Steel products metal margin per ton |
|
628 |
|
|
628 |
|
Net sales to external customers in our North America Steel Group segment remained relatively flat in 2023 compared to 2022. While downstream products average selling prices experienced a significant increase of $207 per ton, or 17%, year-over-year, this fluctuation was offset by decreases in steel products average selling prices and raw materials average selling prices due to a falling scrap price environment. The increases in average selling prices for downstream products, many of which are fixed at the beginning of the project, reflected the increased input costs from rising scrap and energy prices during 2022 when we entered into the contracts. Additionally, the 2023 Acquisitions that are reported in the North America Steel Group segment contributed $152.1 million to net sales to external customers in 2023.
During 2023, we achieved adjusted EBITDA of $1.3 billion compared to $1.5 billion in 2022. Included in adjusted EBITDA during 2022 was a $273.3 million gain on the sale of the Rancho Cucamonga facilities. The remaining year-over-year change was an increase in adjusted EBITDA due to significant expansion in downstream products margin over scrap per ton, driven by a combination of the high downstream products average selling prices mentioned above and sharp decreases in the cost of ferrous scrap utilized per ton. Additionally, the 2023 Acquisitions that are reported in the North America Steel Group segment contributed $13.2 million to adjusted EBITDA in 2023. See Note 2, Changes in Business, in Part II, Item 8 of this Annual Report for more information about the sale of the Rancho Cucamonga facilities.
Europe Steel Group
|
|
|
|
|
|
|
|
|
|
|
|
|
|
|
|
|
Year Ended August 31, |
| (in thousands, except per ton amounts) |
|
2023 |
|
2022 |
| Net sales to external customers |
|
$ |
1,328,791 |
|
|
$ |
1,592,292 |
|
| Adjusted EBITDA |
|
48,473 |
|
|
344,659 |
|
|
|
|
|
|
| External tons shipped |
|
|
|
|
| Rebar |
|
684 |
|
|
622 |
|
| Merchant bar and other |
|
1,043 |
|
|
1,097 |
|
| Steel products |
|
1,727 |
|
|
1,719 |
|
|
|
|
|
|
| Average selling price per ton |
|
|
|
|
| Steel products |
|
$ |
749 |
|
|
$ |
896 |
|
|
|
|
|
|
| Cost of ferrous scrap utilized per ton |
|
$ |
395 |
|
|
$ |
463 |
|
| Steel products metal margin per ton |
|
354 |
|
|
433 |
|
Net sales to external customers in our Europe Steel Group segment decreased $263.5 million, or 17%, in 2023 compared to 2022. This decrease was primarily due to a $147 per ton, or 16%, year-over-year decrease in steel products average selling price per ton, while volumes remained relatively flat year-over-year, as well as unfavorable impacts of foreign currency translation described below. The decrease in steel products average selling price per ton was driven by the indirect impacts of macroeconomic factors affecting the overall business climate in Europe, such as inflation and rising interest rates, which resulted in consumer uncertainties and delayed construction starts across our European end markets near the end of 2023. During 2023, overall, the U.S. dollar strengthened compared to the Polish zloty. The effect of foreign currency translation was a decrease in net sales to external customers of approximately $75.7 million during 2024, determined by using actual results for 2023 measured at the average currency rate during 2022.
Adjusted EBITDA decreased $296.2 million, or 86%, in 2023 compared to 2022, primarily driven by a contraction in steel products metal margin per ton, increased energy costs used in production and unfavorable impacts of foreign currency translation. Steel products metal margin per ton decreased $79 per ton, or 18%, in 2023 compared to 2022, due to the decline in steel products average selling prices per ton described above, which outpaced the decrease in cost of ferrous scrap utilized per ton. In addition to the change in steel products metal margin per ton, our Europe Steel Group segment continued to face an environment of heightened energy costs. The cost of energy increased $51 per ton during 2023 compared to 2022, net of the benefit from our electricity commodity derivative. The electricity commodidty derivative resulted in an $11.8 million realized gain in 2023, recorded as a reduction to cost of goods sold, compared to a $21.7 million realized gain in 2022. See Note 10, Derivatives, in Part II, Item 8 of this Annual Report for further information on the electricity commodity derivative. The effect of foreign currency translation was a decrease in adjusted EBITDA of approximately $18.2 million during 2024.
Emerging Businesses Group
|
|
|
|
|
|
|
|
|
|
|
|
|
|
|
| |
|
Year Ended August 31, |
| (in thousands) |
|
2023 |
|
2022 |
| Net sales to external customers |
|
$ |
721,746 |
|
|
$ |
525,516 |
|
| Adjusted EBITDA |
|
138,985 |
|
|
72,583 |
|
Net sales to external customers in our Emerging Businesses Group segment increased $196.2 million in 2023 compared to 2022. The acquired Tensar operations provided $159.3 million of incremental net sales to external customers during 2023 compared to the net sales to external customers in 2022 following the Tensar Acquisition Date, and CMC Anchoring Systems' operations contributed $7.6 million of net sales to external customers following their acquisition during 2023. See Note 2, Changes in Business, in Part II, Item 8, of this Annual Report for more information on the acquisitions of Tensar and CMC Anchoring Systems. The remaining increase in net sales to external customers included a $17.0 million increase from CMC Impact Metals in 2023 compared to 2022, due to favorable market conditions that led to both increased shipments and selling prices.
Adjusted EBITDA increased $66.4 million in 2023 compared to 2022. The acquired Tensar operations provided $44.9 million of incremental adjusted EBITDA during 2023 compared to the adjusted EBITDA in 2022 following the Tensar Acquisition Date. Additionally, CMC Anchoring Systems' operations contributed to the year-over-year changes by providing $1.1 million of adjusted EBITDA during 2023, with no such activity in the corresponding period. The remaining growth in adjusted EBITDA in 2023 compared to 2022 was experienced across all product offerings in the Emerging Businesses Group segment, including CMC Impact Metals, which provided an adjusted EBITDA increase of $7.5 million, or 47%, during 2023 compared to 2022.
Corporate and Other
|
|
|
|
|
|
|
|
|
|
|
|
|
|
|
| |
|
Year Ended August 31, |
| (in thousands) |
|
2023 |
|
2022 |
| Adjusted EBITDA loss |
|
$ |
(131,185) |
|
|
$ |
(154,103) |
|
Corporate and Other adjusted EBITDA loss decreased by $22.9 million in 2023 compared to 2022. Contributing to the year-over-year decrease in adjusted EBITDA loss was $18.9 million of increased interest income on short-term investments, compared to 2022, $17.7 million in other revenue from our NMTC transactions, with no such activity in 2022, and $16.1 million in debt extinguishment costs incurred during 2022, compared to immaterial activity in 2023. In contrast to these reductions to adjusted EBITDA loss, during 2023 compared to 2022 we incurred $12.1 million of increased labor-related expenses, $10.6 million of increased professional services expenses and $3.0 million of increased information technology expenses. Additionally, in 2023 we recognized a $4.2 million pension plan settlement charge, with no such settlement charge in 2022. See Note 9, New Markets Tax Credit Transactions, in Part II, Item 8 of this Annual Report, for more information on the NMTC transactions and Note 14, Employees' Retirement Plans, in Part II, Item 8 of this Annual Report, for more information on the pension plan termination activity.
LIQUIDITY AND CAPITAL RESOURCES
Sources of Liquidity and Capital Resources
Our cash flows from operating activities are our principal sources of liquidity and result primarily from sales of products offered by the vertically integrated operations in the North America Steel Group segment and the Europe Steel Group segment, products offered by our Emerging Businesses Group segment and related materials and services, as described in Part I, Item 1, Business, of this Annual Report. Historically, our U.S. operations have generated the majority of our cash. At August 31, 2024, cash and cash equivalents of $30.9 million were held by our non-U.S. subsidiaries. We use futures or forward contracts to mitigate the risks from fluctuations in metal commodity prices, foreign currency exchange rates, interest rates and natural gas, electricity and other energy commodity prices. See Note 10, Derivatives, in Part II, Item 8 of this Annual Report for further information.
We have a diverse and generally stable customer base, and regularly maintain a substantial amount of accounts receivable. We actively monitor our accounts receivable and, based on market conditions and customers' financial condition, record allowances when we believe accounts are uncollectible. We use credit insurance internationally to mitigate the risk of customer insolvency. We estimate that the amount of credit-insured or financially assured receivables was approximately 13% of total receivables at August 31, 2024.
The table below reflects our sources, facilities and availability of liquidity as of August 31, 2024. See Note 8, Credit Arrangements, in Part II, Item 8 of this Annual Report for additional information.
|
|
|
|
|
|
|
|
|
|
|
|
|
|
|
| (in thousands) |
|
Total Facility |
|
Availability |
| Cash and cash equivalents |
|
$ |
857,922 |
|
|
$ |
857,922 |
|
| Notes due from 2030 to 2032 |
|
900,000 |
|
|
(1) |
| Revolver |
|
600,000 |
|
|
599,053 |
|
| Series 2022 Bonds, due 2047 |
|
145,060 |
|
|
— |
|
| Poland credit facilities |
|
154,795 |
|
|
152,439 |
|
| Poland accounts receivable facility |
|
74,301 |
|
|
74,301 |
|
|
|
|
|
|
__________________________________
(1) We believe we have access to additional financing and refinancing, if needed, although we can make no assurances as to the form or terms of such financing.
We continually review our capital resources to determine whether we can meet our short and long-term goals. For at least the next twelve months, we anticipate our current cash balances, cash flows from operations and available sources of liquidity will be sufficient to maintain operations, make necessary capital expenditures, invest in the development of our fourth micro mill, pay dividends and opportunistically repurchase shares. Additionally, we expect our long-term liquidity position will be sufficient to meet our long-term liquidity needs with cash flows from operations and financing arrangements. However, in the event of changes in business conditions or other developments, including a sustained market deterioration, unanticipated regulatory developments, significant acquisitions, competitive pressures, or to the extent our liquidity needs prove to be greater than expected or cash generated from operations is less than anticipated, we may need additional liquidity. To the extent we elect to finance our long-term liquidity needs, we believe that the potential financing capital available to us in the future will be sufficient.
We aim to execute a capital allocation strategy that prioritizes both value-accretive growth and competitive cash returns to stockholders. We estimate that our 2025 capital spending will range from $630 million to $680 million. We regularly assess our capital spending based on current and expected results and the amount is subject to change.
In January 2024, our Board authorized an increase of $500.0 million to the existing share repurchase program. During 2024, 2023 and 2022, we repurchased $182.9 million, $101.4 million and $161.9 million, respectively, of shares of CMC common stock. We had remaining authorization to repurchase $403.8 million of shares of CMC common stock at August 31, 2024. See Note 15, Capital Stock, in Part II, Item 8, of this Annual Report for more information on the share repurchase program.
In March 2024, our Board authorized an increase of $0.02 to our quarterly cash dividend, resulting in a $0.18 per share cash dividend paid during the third and fourth quarters of 2024, compared to a $0.16 per share quarterly cash dividend paid during the first and second quarters of 2024 and during 2023. On October 15, 2024, our Board declared CMC's 240th quarterly cash dividend. The dividend was declared at the rate of $0.18 per share of CMC common stock and is payable on November 14, 2024 to stockholders of record as of the close of business on October 31, 2024. During 2024, 2023 and 2022 we paid $78.9 million, $74.9 million and $67.7 million, respectively, of cash dividends to our stockholders.
Our credit arrangements require compliance with certain non-financial and financial covenants, including an interest coverage ratio and a debt to capitalization ratio. At August 31, 2024, we believe we were in compliance with all covenants contained in our credit arrangements.
As of August 31, 2024 and 2023, we had no off-balance sheet arrangements that may have a current or future material effect on our financial condition, revenues or expenses, results of operations, liquidity, capital expenditures or capital resources.
2024 Compared to 2023
Operating Activities
Net cash flows from operating activities were $899.7 million and $1.3 billion in 2024 and 2023, respectively. Contributing to the year-over-year change was a $374.3 million decrease in net earnings and a $55.7 million decrease in cash from operating assets and liabilities. In general, the fluctuations in cash flows from accounts receivable and inventory were largely driven by continued decreases in the pricing and scrap cost environment during 2024 compared to 2023 as described in the Segment Operating Data section above. Partially offsetting the decreases in cash flows from accounts receivable and inventory was a reduction in cash flows used by accounts payable, accrued expenses and other payables in 2024 compared to 2023. While both periods were affected by declining inventory values and reductions in accrued labor-related expenses, the fluctuations in accounts payable, accrued expenses and other payables were greater in 2023 compared to 2024. Additional changes include a $67.2 million decrease in deferred income taxes and other long-term taxes, partially offset by $61.5 million of additional depreciation and amortization expense. The additional depreciation and amortization expense in 2024 compared to 2023 was largely attributable to placing our third micro mill into service during the fourth quarter of 2023. Lastly, we recorded $6.7 million of non-cash other revenue from the settlement of NMTC transactions during 2024, compared to $17.7 million in 2023. See Note 12, Income Tax, in Part II, Item 8 of this Annual Report for more information on the change in deferred income taxes and Note 9, New Markets Tax Credit Transactions, in Part II, Item 8 of this Annual Report for more information on the NMTC transactions.
Investing Activities
Net cash flows used by investing activities were $323.0 million and $835.2 million in 2024 and 2023, respectively. During 2023, cash flows used by investing activities included $234.7 million of cash used for acquisitions, with no such acquisitions during 2024. Additionally, capital expenditures decreased year-over-year by $282.4 million. The decrease in capital expenditures was largely driven by the timing of micro mill construction, which resulted in greater cash outflows as we neared the completion of our third micro mill during 2023, compared to the expenditures in the early days of construction of our fourth micro mill during 2024. See Note 2, Changes in Business, in Part II, Item 8 of this Annual Report, for more information about our acquisitions completed in 2023.
Financing Activities
Net cash flows used by financing activities were $313.8 million and $599.5 million in 2024 and 2023, respectively. The decrease in net cash flows used by financing activities during 2024 compared to 2023 included a $353.4 million decrease in repayments of long-term debt and a $10.9 million decrease in net repayments under our Polish accounts receivable facility, offset, in part, by an $81.5 million increase in treasury stock acquired under the share repurchase program. See Note 8, Credit Arrangements, in Part II, Item 8 of this Annual Report for more information regarding our credit arrangements and accounts receivable facility and Note 15, Capital Stock, in Part II, Item 8 of this Annual Report for more information on the share repurchase program.
2023 Compared to 2022
Our discussion and analysis of cash flows due to and from operating, investing and financing activities during 2023 as compared to 2022 can be found in Part II, Item 7, Management’s Discussion and Analysis of Financial Condition and Results of Operations, in our Annual Report on Form 10-K for the year ended August 31, 2023, which was filed with the SEC on October 12, 2023. The change in reportable segments during the first quarter of 2024 did not alter the discussion previously provided.
Contractual Obligations and Commitments
Our material cash commitments from known contractual and other obligations primarily consist of obligations for long-term debt and related interest, leases for properties and equipment and purchase obligations as part of normal operations. See Note 8, Credit Arrangements, in Part II, Item 8 of this Annual Report for more information regarding scheduled maturities of our long-term debt. See Note 7, Leases, in Part II, Item 8 of this Annual Report for additional information on leases. Interest payable on our long-term debt was $43.4 million due in the twelve months following August 31, 2024 and $343.4 million due thereafter. Additionally, we have a U.S. federal repatriation tax obligation resulting from the repatriation tax provisions of the Tax Cuts and Jobs Act ("TCJA"), of which $5.5 million was due in the twelve months following August 31, 2024 and $6.9 million is due thereafter.
As of August 31, 2024, our undiscounted purchase obligations were approximately $720 million due in the next twelve months and $340 million due thereafter under purchase orders and "take or pay" arrangements. These purchase obligations include all enforceable, legally binding agreements to purchase goods or services that specify all significant terms, regardless of the duration of the agreement, and exclude agreements with variable terms for which we are unable to estimate the minimum amounts. The "take or pay" arrangements are multi-year commitments with minimum annual purchase requirements and are entered into primarily for purchases of commodities used in operations such as electrodes and natural gas.
Of the purchase obligations due within the twelve months following August 31, 2024, approximately 23% were for consumable production inputs, such as alloys, 21% were for the construction of our fourth micro mill, 19% were for commodities and 14% were for capital expenditures in connection with normal business operations. Of the purchase obligations due thereafter, 69% were for commodities and 9% were for the construction of our fourth micro mill. The remainder of the purchase obligations are for goods and services in the normal course of business.
We provide certain eligible employees benefits pursuant to our nonqualified BRP equal to amounts that would have been available under our tax qualified plans under the Employee Retirement Income Security Act of 1974, as amended ("ERISA"), but for limitations of ERISA, tax laws and regulations. We did not include estimated payments related to the BRP in the above description of contractual obligations and commitments. Refer to Note 14, Employees' Retirement Plans, in Part II, Item 8 of this Annual Report for more information on the BRP.
Other Commercial Commitments
We maintain stand-by letters of credit to provide support for certain transactions that governmental agencies, our insurance providers and suppliers require. At August 31, 2024, we had committed $44.8 million under these arrangements, of which $0.9 million reduced availability under the Revolver (as defined in Note 8, Credit Arrangements, in Part II, Item 8 of this Annual Report).
CONTINGENCIES
In the ordinary course of conducting our business, we become involved in litigation, administrative proceedings and governmental investigations, including environmental matters. We may incur settlements, fines, penalties or judgments because of some of these matters. Liabilities and costs associated with litigation-related loss contingencies require estimates and judgments based on our knowledge of the facts and circumstances surrounding each matter and the advice of our legal counsel. We record liabilities for litigation-related losses when a loss is probable and we can reasonably estimate the amount of the loss. We evaluate the measurement of recorded liabilities each reporting period based on the current facts and circumstances specific to each matter. The ultimate losses incurred upon final resolution of litigation-related loss contingencies may differ materially from the estimated liability recorded at a particular balance sheet date. Changes in estimates are recorded in earnings in the period in which such changes occur. See Note 17, Commitments and Contingencies, in Part II, Item 8 of this Annual Report for more information on pending litigation and other matters.
Environmental and Other Matters
The information set forth in Note 17, Commitments and Contingencies, in Part II, Item 8 of this Annual Report is hereby incorporated by reference.
General
We are subject to federal, state and local pollution control laws and regulations in all locations where we have operating facilities. We anticipate that compliance with these laws and regulations will involve continuing capital expenditures and operating costs.
Metals recycling was our original business, and it has been one of our core businesses for over a century. In the present era of conservation of natural resources and ecological concerns, we are committed to sound ecological and business conduct. Certain governmental regulations regarding environmental concerns, however well-intentioned, may expose us and our industry to potentially significant risks. We believe that recycled materials are commodities that are diverted by recyclers, such as us, from the solid waste streams because of their inherent value and thus should be treated like products rather than wastes. They are identified, purchased, sorted, processed and sold by us in accordance with carefully established industry specifications.
We incurred environmental expenses of approximately $54.9 million, $49.3 million and $44.2 million for 2024, 2023 and 2022, respectively. The expenses included the cost of disposal, environmental personnel at various divisions, permit and license fees, accruals and payments for studies, tests, assessments, remediation, consultant fees, baghouse dust removal and various other expenses. In addition, during 2024, we spent approximately $5.0 million in capital expenditures related to costs directly associated with environmental compliance. Our accrued environmental liabilities were $3.4 million and $4.5 million as of August 31, 2024 and 2023, respectively, of which $1.9 million and $2.0 million were classified as other noncurrent liabilities within the Company's consolidated balance sheets as of August 31, 2024 and 2023, respectively.
Solid and Hazardous Waste
We generate wastes, including hazardous wastes, that are subject to the Federal Resource Conservation and Recovery Act and comparable state and local statutes where we operate. These statutes, regulations and laws may limit our disposal options with respect to certain wastes.
We currently own or lease, and in the past we have owned or leased, properties for use in our operations. Although we have used operating and disposal practices that were industry standard at the time, wastes may have been disposed of or released on or under the properties or on or under locations where such wastes have been taken for disposal in a manner that is now understood to pose a contamination threat. We are currently involved in the investigation and remediation of several such properties, and we have been named as a PRP by governmental entities at a number of contaminated sites.
State and federal laws applicable to wastes and contaminated properties have gradually become more strict over time. There is no guarantee that the EPA or individual states will not adopt more stringent requirements for the handling of, or make changes to the exemptions upon which we rely, for the wastes that we generate. Similarly, some materials which are not currently classified as waste may be deemed solid or hazardous waste in the future. Under new laws, we could be required to remediate properties impacted by previously disposed wastes. Any such change could result in an increase in our costs to manage and dispose of waste which could have a material adverse effect on our business, results of our operations and financial condition.
Superfund
The EPA, or an equivalent state agency, has notified us that we are considered a PRP at several sites, none of which involve real estate we ever owned or upon which we have ever conducted operations. We may be obligated under CERCLA, or similar state statutes, to conduct remedial investigation, feasibility studies, remediation and/or removal of alleged releases of hazardous substances or to reimburse the EPA or third parties for such activities and pay costs for associated damages to natural resources. We are involved in litigation or administrative proceedings with regard to several of these sites in which we are contesting, or at the appropriate time may contest, our liability. In addition, we have received information requests with regard to other sites which may be under consideration by the EPA as potential CERCLA sites. Because of various factors, including the ambiguity of the regulations, the difficulty of identifying the responsible parties for any particular site, the complexity of determining the relative liability among them, the uncertainty as to the most desirable remediation techniques and the amount of damages and cleanup costs, and the extended time periods over which such costs may be incurred, we cannot reasonably estimate our ultimate costs of compliance with CERCLA. Based on currently available information, which is in many cases preliminary and incomplete, we had immaterial amounts accrued as of both August 31, 2024 and 2023, in connection with CERCLA sites. We have accrued for these liabilities based upon our best estimates. The amounts paid and the expenses incurred on these sites for 2024, 2023 and 2022 were not material. Historically, the amounts that we have ultimately paid for such remediation activities have not been material.
We believe that adequate provisions have been made in the consolidated financial statements for the potential impact of these contingencies, and that the outcomes of the suits and proceedings described above, and other miscellaneous litigation and proceedings now pending, will not have a material adverse effect on our business, results of operations or financial condition.
Clean Water Regulation
The Clean Water Act ("CWA") imposes restrictions and strict controls regarding the discharge of wastes into waters of the U.S., a term broadly defined, or into publicly owned treatment works. These controls have become more stringent over time, and it is probable that additional restrictions will be imposed in the future. Permits must generally be obtained to discharge pollutants into federal waters or into publicly owned treatment works and comparable permits may be required at the state level. The CWA and many state statutes provide for civil, criminal and administrative penalties for unauthorized discharges of pollutants. In addition, the EPA's regulations and comparable state statutes may require us to obtain permits to discharge storm water runoff. In the event of an unauthorized discharge or non-compliance with permit requirements, we may be liable for penalties, costs and injunctive relief.
Clean Air Act
Our operations are subject to regulations at the federal, state and local level for the control of emissions from sources of air pollution. New and modified sources of air pollutants are often required to obtain permits prior to commencing construction, modification or operations. Major sources of air pollutants are subject to more stringent requirements, including the potential need for additional permits and to increase scrutiny in the context of enforcement. The EPA has been implementing its stationary emission control program through expanded enforcement of the New Source Review Program. Under this program, new or modified sources may be required to construct emission sources using what is referred to as the Best Available Control Technology, or in any areas that are not meeting NAAQS, using methods that satisfy requirements for the Lowest Achievable Emission Rate. Additionally, the EPA has implemented, and is continuing to implement, new, more stringent standards for NAAQS, including fine particulate matter. Compliance with new standards could require additional expenditures.
Climate Change
The potential impacts of climate change on our business and results of operations and potential future climate change regulations in the jurisdictions in which we operate are highly uncertain. See the risk factors entitled "Increased regulation associated with climate change could impose significant additional costs on both our steelmaking and metals recycling operations" and "Physical impacts of climate change could have a material adverse effect on our costs and results of operations" in Part I, Item 1A, Risk Factors, of this Annual Report.
CRITICAL ACCOUNTING POLICIES AND ESTIMATES
The preceding discussion and analysis of our financial condition and results of operations is based upon our consolidated financial statements, which have been prepared in accordance with accounting principles generally accepted in the United States. The preparation of the consolidated financial statements requires us to make estimates and assumptions that affect the reported amounts of assets, liabilities, revenue and expenses and related disclosure of contingent liabilities. We evaluate the appropriateness of these estimates and assumptions, including those related to revenue recognition, income taxes, inventory cost, acquisitions, goodwill and other intangible assets, long-lived assets, derivative financial instruments and contingencies, on an ongoing basis. Estimates and assumptions are based on historical experience and on various other assumptions that we believe to be reasonable under the circumstances, the results of which form the basis for making judgments about the carrying value of assets and liabilities that are not readily apparent from other sources. Accordingly, actual results in future periods could differ materially from these estimates. Judgments and estimates related to critical accounting policies used in the preparation of the consolidated financial statements include the following:
Revenue Recognition
Revenue from contracts where the Company provides fabricated rebar and installation services is recognized over time using an input method based on costs incurred compared to total estimated costs. Revenue from contracts where the Company does not provide installation services is recognized over time using an output method based on tons shipped compared to total estimated tons. Significant judgment is required to evaluate total estimated costs used in the input method and total estimated tons in the output method. If total estimated costs on any contract are greater than the net contract revenues, the Company recognizes the entire estimated loss in the period the loss becomes known. The cumulative effect of revisions to estimates related to net contract revenues, costs to complete or total planned quantity is recorded in the period in which such revisions are identified. The Company does not exercise significant judgment in determining the transaction price. See Note 4, Revenue Recognition, in Part II, Item 8 of this Annual Report for further details.
Income Taxes
We periodically assess the likelihood of realizing our deferred tax assets and maintain a valuation allowance to reduce certain deferred tax assets to amounts that we believe are more likely than not to be realized. We base our judgment of the recoverability of our deferred tax assets primarily on historical earnings, our estimate of current and expected future earnings, prudent and feasible tax planning strategies and current and future ownership changes. At August 31, 2024 and 2023, we had valuation allowances of $256.8 million and $280.5 million, respectively, against our deferred tax assets. Of these amounts, $10.0 million and $13.3 million at August 31, 2024 and 2023, respectively, relate to net operating loss and credit carryforwards in certain state jurisdictions that are subject to estimation. The remaining valuation allowance primarily relates to net operating loss carryforwards in certain foreign jurisdictions, which the Company does not expect to realize.
Inventory Cost
We state inventories at the lower of cost or net realizable value, which is defined as estimated selling prices in the ordinary course of business, less reasonably predictable costs of completion, disposal and transportation. Adjustments to inventory may be due to changes in price levels, assumptions about market conditions, obsolescence, damage, physical deterioration and other causes. Any adjustments required to reduce the carrying value of inventory to net realizable value are recorded as a charge to cost of goods sold within the consolidated statements of earnings. In fiscal 2024, we recorded $5.1 million of inventory write-downs within our Europe Steel Group segment resulting from changes in future demand and market conditions impacting the vertically integrated operations in Poland. A hypothetical 10% decrease to the estimated selling prices used in the calculation of net realizable value of inventory within these operations in Poland would have resulted in a $3.9 million increase to the inventory write-downs recorded as of August 31, 2024.
Acquisitions
The Company accounts for business combinations under the acquisition method of accounting, which requires assets acquired and liabilities assumed to be recorded at their estimated fair value at the date of acquisition. The fair value is estimated by the Company using valuation techniques and Level 3 inputs, including expected future cash flows and discount rates. The excess of purchase price over the fair value amounts assigned to the assets acquired and liabilities assumed, if any, is recorded as goodwill. Determining the fair value of assets acquired and liabilities assumed involves the use of significant estimates and assumptions. See Note 2, Changes in Business, in Part II, Item 8 of this Annual Report for more information about the Company's acquisitions.
Goodwill and Other Intangible Assets
Goodwill and indefinite-lived intangible assets are tested for impairment annually as of the first day of the Company’s fourth quarter (the "annual impairment test date"), and between annual tests whenever events or circumstances indicate that the carrying value of a reporting unit, including goodwill, or of an indefinite-lived intangible asset exceeds its fair value. Goodwill is tested at the reporting unit level, which represents an operating segment or one level below an operating segment. When evaluating goodwill and other indefinite-lived intangible assets for impairment, the Company may first assess qualitative factors in determining whether it is more likely than not that the respective fair value is less than its carrying amount. The qualitative evaluation is an assessment of multiple factors, including the current operating environment, historical and future financial performance and industry and market considerations. The Company may elect to bypass this qualitative assessment for some or all of its reporting units or other indefinite-lived intangible assets and perform a quantitative test, based on management's judgment. If the Company chooses to bypass the qualitative assessment, it performs a quantitative test by comparing the fair value of the reporting units or indefinite-lived intangible assets to their respective carrying amounts and records an impairment charge if the carrying amount exceeds the fair value; however, the loss recognized, if any, will not exceed the total amount of the intangible asset or the goodwill allocated to a reporting unit.
When assessing the recoverability of goodwill using a quantitative approach we use an income and a market approach to calculate the fair value of the reporting unit. To calculate the fair value of a reporting unit using the income approach, management uses a discounted cash flow model, which includes a number of significant assumptions and estimates regarding future cash flows such as discount rates, volumes, prices, capital expenditures and the impact of current market conditions. The market approach estimates fair value based on market multiples of earnings derived from comparable publicly traded companies with similar operating and investment characteristics as the reporting unit. The estimates used during a quantitative approach to test goodwill could be materially impacted by adverse changes in market conditions.
For 2024 and 2023, the annual goodwill impairment analyses did not result in impairment charges. As of the 2024 annual impairment test date, the Company had goodwill of $383.9 million related to three reporting units within the North America Steel Group segment, one reporting unit within the Europe Steel Group segment and four reporting units within the Emerging Businesses Group segment. Six reporting units, which, as of the 2024 annual impairment test date, comprised $5.0 million of goodwill within the North America Steel Group segment, $4.1 million of goodwill within the Europe Steel Group segment and $262.4 million of goodwill within the Emerging Businesses Group segment, were assessed for impairment using a qualitative approach. Management determined it was more likely than not that the fair values of the reporting units which were assessed using a qualitative approach exceeded their respective carrying values.
The remaining two reporting units, both within the North America Steel Group segment, were tested for impairment using a quantitative approach. The fair values of these two reporting units consisting of $71.7 million and $40.7 million of goodwill as of the 2024 annual impairment test date exceeded their carrying values by greater than 30%. The Company believes the fair values of the reporting units tested using a quantitative approach are substantially in excess of their carrying values. An increase or decrease of 2% to the discount rate or terminal growth rate used in the quantitative impairment tests for these reporting units would not result in impairment charges.
The difference in the value of goodwill between the 2024 annual impairment test date and August 31, 2024 was due to the foreign currency translation adjustments.
As of the 2024 annual impairment test date, the Company had $57.3 million of other indefinite-lived intangible assets within the Emerging Businesses Group segment, of which $54.1 million were tested for impairment using a quantitative approach. To perform the quantitative impairment tests, the Company used an income approach to calculate the fair value of each intangible asset using a relief from royalty method. Significant inputs to measure the fair value of the indefinite-lived intangible assets included projected revenue growth rates, royalty rates and discount rates. The fair values of the indefinite-lived intangible assets exceeded their carrying values in excess of 30%. The difference in the value of indefinite-lived intangible assets between the 2024 annual impairment test date and August 31, 2024 was due to foreign currency translation adjustments. Based on the Company’s annual impairment testing of the indefinite-lived intangible assets, we concluded it was more likely than not that their fair values exceeded the respective carrying values.
Based on the results of impairment tests performed in 2024, management does not believe that it is reasonably likely that our reporting units or indefinite-lived intangible assets will fail their respective impairment tests in the near term. See Note 6, Goodwill and Other Intangible Assets, in Part II, Item 8 of this Annual Report for additional information.
Long-Lived Assets
We evaluate the carrying value of property, plant and equipment and finite-lived intangible assets whenever a change in circumstances indicates that the net carrying value may not be recoverable from the entity-specific undiscounted future cash flows expected to result from our use of and eventual disposition of a long-lived asset or asset group. Events or circumstances that could trigger an impairment review of a long-lived asset or asset group include, but are not limited to: (i) a significant decrease in the market price of the asset, (ii) a significant adverse change in the extent or manner that the asset is used or in its physical condition, (iii) a significant adverse change in legal factors or in the business climate that could affect the value of the asset, (iv) an accumulation of costs significantly in excess of original expectation for the acquisition or construction of the asset, (v) a current period operating or cash flow loss combined with a history of operating or cash flow losses or a forecast of continuing losses associated with the use of the asset and (vi) a more-likely-than-not expectation that the asset will be sold or disposed of significantly before the end of its previously estimated useful life. If an impairment exists, the net carrying values are reduced to fair values. We estimate the fair values of these long-lived assets by performing a discounted future cash flow analysis for the remaining useful life of the asset, or the remaining useful life of the primary asset in the case of an asset group. An individual asset within an asset group is not impaired below its estimated fair value.
Our operations are capital intensive. The estimates of undiscounted future cash flows used during an impairment review of a long-lived asset or asset group require judgments and assumptions of future cash flows that are expected to arise as a direct result of the use and eventual disposition of the asset or asset group. If these assets were for sale, our estimates of their values could be significantly different because of market conditions, specific transaction terms and a buyer's perspective on future cash flows. During 2024, there were no events or circumstances that triggered an impairment review.
Derivative Financial Instruments
Our global operations and product lines expose us to risks from fluctuations in metal commodity prices, foreign currency exchange rates, interest rates and natural gas, electricity and other energy prices. To limit the impact of these exposures, we enter into derivative instruments. We do not enter into derivative financial instruments for speculative purposes. We evaluate the fair value of our derivative financial instruments using an established fair value hierarchy as stated in Note 1, Nature of Operations and Summary of Significant Accounting Policies, in Part II, Item 8 of this Annual Report.
The Company has three Level 3 commodity derivatives which are bilateral agreements with a counterparty. The fair value estimates of the Level 3 commodity derivatives are based on an internally developed discounted cash flow model primarily utilizing unobservable inputs for which there is little or no market data. The company determined the Level 3 fair value inputs as provided for under ASC 820 utilizing information obtained from relevant published indexes and external sources along with management’s own assumptions. Fluctuations in the information used to forecast future energy rates may cause volatility in the fair value estimate and in the unrealized gains and losses in other comprehensive income. See Note 11, Fair Value, in Part II, Item 8 of this Annual Report for more information on the Level 3 commodity derivatives.
Contingencies
In the ordinary course of conducting our business, we become involved in litigation, administrative proceedings and governmental investigations, including environmental matters. We may incur settlements, fines, penalties or judgments in connection with some of these matters. While we are unable to estimate the ultimate dollar amount of exposure or loss in connection with these matters, we make accruals when a loss is probable and the amount can be reasonably estimated. The amounts we accrue could vary substantially from amounts we pay due to several factors including the following: evolving remediation technology, changing regulations, possible third-party contributions, the inherent uncertainties of the estimation process and the uncertainties involved in litigation. We believe that we have adequately provided for these contingencies as needed in our consolidated financial statements. See Note 17, Commitments and Contingencies, in Part II, Item 8 of this Annual Report for more information on pending litigation and other matters.
Other Accounting Policies and New Accounting Pronouncements
See Note 1, Nature of Operations and Summary of Significant Accounting Policies, in Part II, Item 8 of this Annual Report.
FORWARD-LOOKING STATEMENTS
This Annual Report contains "forward-looking statements" within the meaning of the federal securities laws. The statements in this report that are not historical statements are forward-looking statements and address activities, events or developments that may occur in the future, including (without limitation) such matters as activities related to general economic conditions, key macro-economic drivers that impact our business, the effects of ongoing trade actions, the effects of continued pressure on the liquidity of our customers, potential synergies and growth provided by acquisitions and strategic investments, demand for our products, shipment volumes, metal margins, the ability to operate our steel mills at full capacity, future availability and cost of supplies of raw materials and energy for our operations, growth rates in certain reportable segments, product margins within our Emerging Businesses Group, share repurchases, legal proceedings, construction activity, international trade, the impact of geopolitical conditions, capital expenditures, tax credits, our liquidity and our ability to satisfy future liquidity requirements, estimated contractual obligations, the expected capabilities and benefits of new facilities, the timeline for execution of our growth plan and our expectations or beliefs concerning future events. These forward-looking statements can generally be identified by phrases such as we or our management "expects," "anticipates," "believes," "estimates," "future," "intends," "may," "plans to," "ought," "could," "will," "should," "likely," "appears," "projects," "forecasts," "outlook" or other similar words or phrases, as well as by discussions of strategy, plans or intentions.
Our forward-looking statements are based on management's expectations and beliefs as of the time this Annual Report is filed with the SEC or, with respect to any document incorporated by reference, as of the time such document was prepared. Although we believe that our expectations are reasonable, we can give no assurance that these expectations will prove to have been correct, and actual results may vary materially. Except as required by law, we undertake no obligation to update, amend or clarify any forward-looking statements to reflect changed assumptions, the occurrence of anticipated or unanticipated events, new information or circumstances or any other changes. Important factors that could cause actual results to differ materially from our expectations include those described in Part I, Item 1A, Risk Factors and Part II, Item 7, Management's Discussion and Analysis of Financial Condition and Results of Operations of this Annual Report as well as the following:
•changes in economic conditions which affect demand for our products or construction activity generally, and the impact of such changes on the highly cyclical steel industry;
•rapid and significant changes in the price of metals, potentially impairing our inventory values due to declines in commodity prices or reducing the profitability of downstream contracts within our vertically integrated steel operations due to rising commodity pricing;
•excess capacity in our industry, particularly in China, and product availability from competing steel mills and other steel suppliers including import quantities and pricing;
•the impact of geopolitical conditions, including political turmoil and volatility, regional conflicts, terrorism and war on the global economy, inflation, energy supplies and raw materials;
•increased attention to environmental, social and governance ("ESG") matters, including any targets or other ESG, environmental justice or regulatory initiatives;
•operating and startup risks, as well as market risks associated with the commissioning of new projects could prevent us from realizing anticipated benefits and could result in a loss of all or a substantial part of our investments;
•impacts from global public health crises on the economy, demand for our products, global supply chain and on our operations;
•compliance with and changes in existing and future laws, regulations and other legal requirements and judicial decisions that govern our business, including increased environmental regulations associated with climate change and greenhouse gas emissions;
•involvement in various environmental matters that may result in fines, penalties or judgments;
•evolving remediation technology, changing regulations, possible third-party contributions, the inherent uncertainties of the estimation process and other factors that may impact amounts accrued for environmental liabilities;
•potential limitations in our or our customers' abilities to access credit and non-compliance with their contractual obligations, including payment obligations;
•activity in repurchasing shares of our common stock under our share repurchase program;
•financial and non-financial covenants and restrictions on the operation of our business contained in agreements governing our debt;
•our ability to successfully identify, consummate and integrate acquisitions and realize any or all of the anticipated synergies or other benefits of acquisitions;
•the effects that acquisitions may have on our financial leverage;
•risks associated with acquisitions generally, such as the inability to obtain, or delays in obtaining, required approvals under applicable antitrust legislation and other regulatory and third-party consents and approvals;
•lower than expected future levels of revenues and higher than expected future costs;
•failure or inability to implement growth strategies in a timely manner;
•the impact of goodwill or other indefinite-lived intangible asset impairment charges;
•the impact of long-lived asset impairment charges;
•currency fluctuations;
•global factors, such as trade measures, military conflicts and political uncertainties, including changes to current trade regulations, such as Section 232 trade tariffs and quotas, tax legislation and other regulations which might adversely impact our business;
•availability and pricing of electricity, electrodes and natural gas for mill operations;
•our ability to hire and retain key executives and other employees;
•competition from other materials or from competitors that have a lower cost structure or access to greater financial resources;
•information technology interruptions and breaches in security;
•our ability to make necessary capital expenditures;
•availability and pricing of raw materials and other items over which we exert little influence, including scrap metal, energy and insurance;
•unexpected equipment failures;
•losses or limited potential gains due to hedging transactions;
•litigation claims and settlements, court decisions, regulatory rulings and legal compliance risks;
•risk of injury or death to employees, customers or other visitors to our operations; and
•civil unrest, protests and riots.
Refer to the "Risk Factors" disclosed in our periodic and current reports filed with the SEC for information regarding additional risks which would cause actual results to be significantly different from those expressed or implied by these forward-looking statements. Forward-looking statements involve known and unknown risks, uncertainties, assumptions and other important factors that could cause actual results, performance or our achievements, or industry results, to differ materially from historical results, any future results, or performance or achievements expressed or implied by such forward-looking statements. Accordingly, readers of this Annual Report are cautioned not to place undue reliance on any forward-looking statements.
ITEM 7A. QUANTITATIVE AND QUALITATIVE DISCLOSURES ABOUT MARKET RISK
Approach to Mitigating Market Risk
See Note 10, Derivatives, in Part II, Item 8 of this Annual Report for disclosure regarding our approach to mitigating market risk and for summarized market risk information by year. Also, see Note 1, Nature of Operations and Summary of Significant Accounting Policies, in Part II, Item 8 of this Annual Report for additional information. We utilized foreign currency exchange forward contracts and commodity futures contracts during 2024 in accordance with our risk management program. None of the instruments were entered into for speculative purposes.
Foreign Currency Exchange Forward Contracts
Our global operations expose us to risks from fluctuations in foreign currency exchange rates. The Polish zloty ("PLN") to the United States dollar ("USD") exchange rate is considered to be a material foreign currency exchange rate risk exposure. We enter into currency exchange forward contracts as economic hedges of trade commitments denominated in currencies other than our reporting currency or the functional currency of our subsidiaries, including commitments denominated in PLN, USD, the euro ("EUR") and the Great British Pound ("GBP").
The fair value of our foreign currency exchange forward contract commitments as of August 31, 2024 were as follows:
|
|
|
|
|
|
|
|
|
|
|
|
|
|
|
|
|
|
|
|
|
|
|
|
|
|
|
|
|
|
|
|
|
|
|
|
|
|
|
| Functional Currency |
|
Foreign Currency |
|
|
|
|
|
|
| Type |
|
Amount
(in thousands) |
|
Type |
|
Amount
(in thousands) |
|
Range of
Hedge Rates (1)
|
|
Total Contract Fair Value
(in thousands) |
| PLN |
|
439,794 |
|
|
EUR |
|
101,362 |
|
|
4.27 |
— |
4.74 |
|
$ |
(207) |
|
| PLN |
|
6,858 |
|
|
USD |
|
1,723 |
|
|
3.85 |
— |
4.08 |
|
(42) |
|
| USD |
|
392 |
|
|
EUR |
|
352 |
|
|
1.10 |
— |
1.12 |
|
(3) |
|
| USD |
|
2,575 |
|
|
GBP |
|
2,000 |
|
|
1.00 |
— |
1.00 |
|
(50) |
|
| USD |
|
109,010 |
|
|
PLN |
|
421,239 |
|
|
0.25 |
— |
0.26 |
|
(1,164) |
|
| |
|
|
|
|
|
|
|
|
|
|
|
$ |
(1,466) |
|
__________________________________
(1) Most foreign currency exchange forward contracts mature within one year. The range of hedge rates represents functional to foreign currency conversion rates.
Commodity Futures Contracts
Our product lines expose us to risks from fluctuations in metal commodity prices and natural gas, electricity and other energy commodity prices. We base pricing in some of our sales and purchase contracts on metal commodity futures exchange quotes, which we determine at the beginning of the contract. Due to the volatility of the metal commodity indexes, we enter into metal commodity futures contracts for copper and aluminum. These futures contracts mitigate the risk of unanticipated declines in gross margin due to the price volatility of the underlying commodities. We also enter into energy derivatives to mitigate the risk of unanticipated declines in gross margin due to the price volatility of electricity and natural gas.
The fair value of our commodity futures contract commitments and energy derivatives as of August 31, 2024 were as follows:
|
|
|
|
|
|
|
|
|
|
|
|
|
|
|
|
|
|
|
|
|
|
|
|
|
|
|
|
|
|
|
|
|
|
|
|
|
|
|
|
|
|
|
|
|
|
|
|
| Commodity |
|
Exchange |
|
Long/
Short |
|
Total Contract Volumes |
|
Range or
Amount of Hedge
Rates per unit |
|
Total Contract
Fair Value(1)
(in thousands)
|
| Aluminum |
|
London Metal Exchange |
|
Long |
|
1,225 |
|
MT |
|
|
$ |
2,477.00 |
|
— |
|
|
$ |
2,500.00 |
|
|
$ |
(37) |
|
|
|
|
|
|
|
|
|
|
|
|
|
|
|
|
|
| Copper |
|
New York Mercantile Exchange |
|
Long |
|
624 |
|
MT |
|
|
$ |
399.35 |
|
— |
|
|
$ |
469.00 |
|
|
10 |
|
| Copper |
|
New York Mercantile Exchange |
|
Short |
|
9,321 |
|
MT |
|
|
$ |
398.05 |
|
— |
|
|
$ |
509.10 |
|
|
2,223 |
|
| Electricity |
|
N/A(2) |
|
Long |
|
3,112,000 |
|
MW(h) |
|
PLN |
244.08 |
|
— |
|
PLN |
744.64 |
|
|
38,029 |
|
| Natural Gas |
|
New York Mercantile Exchange |
|
Long |
|
5,190,700 |
|
MMBtu |
|
|
$ |
3.17 |
|
— |
|
|
$ |
5.75 |
|
|
(3,603) |
|
| |
|
|
|
|
|
|
|
|
|
|
|
|
|
|
$ |
36,622 |
|
__________________________________
MT = Metric ton
MW(h) = Megawatt hour
MMBtu = Metric Million British thermal unit
(1) All commodity futures contract commitments mature within one year, except for the electricity and natural gas contract commitments, which have maturity dates extending to December 31, 2034 and August 31, 2027, respectively.
(2) There is no exchange for the electricity derivatives as they are bilateral agreements with a counterparty.
ITEM 8. FINANCIAL STATEMENTS AND SUPPLEMENTARY DATA
REPORT OF INDEPENDENT REGISTERED PUBLIC ACCOUNTING FIRM
To the stockholders and the Board of Directors of Commercial Metals Company
Opinion on Internal Control over Financial Reporting
We have audited the internal control over financial reporting of Commercial Metals Company and subsidiaries (the “Company”) as of August 31, 2024, based on criteria established in Internal Control — Integrated Framework (2013) issued by the Committee of Sponsoring Organizations of the Treadway Commission (COSO). In our opinion, the Company maintained, in all material respects, effective internal control over financial reporting as of August 31, 2024, based on criteria established in Internal Control — Integrated Framework (2013) issued by COSO.
We have also audited, in accordance with the standards of the Public Company Accounting Oversight Board (United States) (PCAOB), the consolidated financial statements as of and for the year ended August 31, 2024, of the Company and our report dated October 17, 2024, expressed an unqualified opinion on those financial statements.
Basis for Opinion
The Company’s management is responsible for maintaining effective internal control over financial reporting and for its assessment of the effectiveness of internal control over financial reporting, included in the accompanying Management’s Report on Internal Control Over Financial Reporting. Our responsibility is to express an opinion on the Company’s internal control over financial reporting based on our audit. We are a public accounting firm registered with the PCAOB and are required to be independent with respect to the Company in accordance with the U.S. federal securities laws and the applicable rules and regulations of the Securities and Exchange Commission and the PCAOB.
We conducted our audit in accordance with the standards of the PCAOB. Those standards require that we plan and perform the audit to obtain reasonable assurance about whether effective internal control over financial reporting was maintained in all material respects. Our audit included obtaining an understanding of internal control over financial reporting, assessing the risk that a material weakness exists, testing and evaluating the design and operating effectiveness of internal control based on the assessed risk, and performing such other procedures as we considered necessary in the circumstances. We believe that our audit provides a reasonable basis for our opinion.
Definition and Limitations of Internal Control over Financial Reporting
A company’s internal control over financial reporting is a process designed to provide reasonable assurance regarding the reliability of financial reporting and the preparation of financial statements for external purposes in accordance with generally accepted accounting principles. A company’s internal control over financial reporting includes those policies and procedures that (1) pertain to the maintenance of records that, in reasonable detail, accurately and fairly reflect the transactions and dispositions of the assets of the company; (2) provide reasonable assurance that transactions are recorded as necessary to permit preparation of financial statements in accordance with generally accepted accounting principles, and that receipts and expenditures of the company are being made only in accordance with authorizations of management and directors of the company; and (3) provide reasonable assurance regarding prevention or timely detection of unauthorized acquisition, use, or disposition of the company’s assets that could have a material effect on the financial statements.
Because of its inherent limitations, internal control over financial reporting may not prevent or detect misstatements. Also, projections of any evaluation of effectiveness to future periods are subject to the risk that controls may become inadequate because of changes in conditions, or that the degree of compliance with the policies or procedures may deteriorate.
/s/ Deloitte & Touche LLP
Dallas, Texas
October 17, 2024
REPORT OF INDEPENDENT REGISTERED PUBLIC ACCOUNTING FIRM
To the stockholders and the Board of Directors of Commercial Metals Company
Opinion on the Financial Statements
We have audited the accompanying consolidated balance sheets of Commercial Metals Company and subsidiaries (the "Company") as of August 31, 2024 and 2023, the related consolidated statements of earnings, comprehensive income, stockholders' equity, and cash flows, for each of the three years in the period ended August 31, 2024, and the related notes and the schedule listed in the Index at Item 15 (collectively referred to as the "financial statements"). In our opinion, the financial statements present fairly, in all material respects, the financial position of the Company as of August 31, 2024 and 2023, and the results of its operations and its cash flows for each of the three years in the period ended August 31, 2024, in conformity with accounting principles generally accepted in the United States of America.
We have also audited, in accordance with the standards of the Public Company Accounting Oversight Board (United States) (PCAOB), the Company's internal control over financial reporting as of August 31, 2024, based on criteria established in Internal Control — Integrated Framework (2013) issued by the Committee of Sponsoring Organizations of the Treadway Commission and our report dated October 17, 2024, expressed an unqualified opinion on the Company's internal control over financial reporting.
Basis for Opinion
These financial statements are the responsibility of the Company's management. Our responsibility is to express an opinion on the Company's financial statements based on our audits. We are a public accounting firm registered with the PCAOB and are required to be independent with respect to the Company in accordance with the U.S. federal securities laws and the applicable rules and regulations of the Securities and Exchange Commission and the PCAOB.
We conducted our audits in accordance with the standards of the PCAOB. Those standards require that we plan and perform the audit to obtain reasonable assurance about whether the financial statements are free of material misstatement, whether due to error or fraud. Our audits included performing procedures to assess the risks of material misstatement of the financial statements, whether due to error or fraud, and performing procedures that respond to those risks. Such procedures included examining, on a test basis, evidence regarding the amounts and disclosures in the financial statements. Our audits also included evaluating the accounting principles used and significant estimates made by management, as well as evaluating the overall presentation of the financial statements. We believe that our audits provide a reasonable basis for our opinion.
Critical Audit Matter
The critical audit matter communicated below is a matter arising from the current-period audit of the financial statements that was communicated or required to be communicated to the audit committee and that (1) relates to accounts or disclosures that are material to the financial statements and (2) involved our especially challenging, subjective, or complex judgments. The communication of critical audit matters does not alter in any way our opinion on the financial statements, taken as a whole, and we are not, by communicating the critical audit matter below, providing a separate opinion on the critical audit matter or on the accounts or disclosures to which it relates.
Goodwill — Annual impairment test for one Reporting Unit within the North America Steel Group segment – Refer to Notes 1 and 6 to the Financial Statements
Critical Audit Matter Description
Goodwill is tested for impairment at the reporting unit level annually as of the first day of the Company’s fourth quarter and whenever events or circumstances indicate that the carrying value exceeds its fair value. As of the 2024 annual impairment test date, the Company had goodwill of $383.9 million, of which $71.7 million related to one reporting unit within the North America Steel Group segment. The Company’s goodwill impairment assessment involves comparing the fair value of each reporting unit to its carrying value. The Company estimates the fair value of its reporting units using a weighting of fair values derived from the income and market approaches. The determination of fair value using the income approach is based on the present value of estimated future cash flows, which requires management to make significant estimates and assumptions of revenue growth rates and operating margins, and selection of the discount rate. The determination of the fair value using the market approach requires management to make significant assumptions related to market multiples of earnings derived from comparable publicly traded companies with similar operating and investment characteristics as the reporting unit.
Based on the results of the Company’s annual impairment testing, no impairment was recognized as the fair value of the Company’s reporting units exceeded their carrying value.
We identified the Company’s goodwill impairment assessment as of the first day of the Company’s fourth quarter for the $71.7 million of goodwill related to one reporting unit within the North America Steel Group segment as a critical audit matter because of the significant estimates and assumptions used by management to estimate the fair value of the reporting unit. This required a high degree of auditor judgment and an increased extent of effort, including the need to involve our fair value specialists, when performing audit procedures to evaluate the reasonableness of management’s estimates and assumptions of future cash flows based on estimates of revenue growth rates and operating margins and selection of the discount rate for the income approach, and multiples of earnings for the market approach.
How the Critical Audit Matter Was Addressed in the Audit
Our audit procedures related to the annual goodwill impairment assessment for one reporting unit within the North America Steel Group segment included the following, among others:
•We tested the effectiveness of controls over the goodwill impairment assessment, including management’s controls over forecasts of future cash flows based on estimates of revenue growth rates and operating margins and the selection of the discount rate for the income approach, and determination of multiples of earnings for the market approach.
•We evaluated the reasonableness of management’s forecasts of future cash flows based on revenue growth rates and operating margins by comparing the forecasts to (1) historical revenues and operating margins and (2) forecasted information included in industry reports.
•With the assistance of our fair value specialists:
◦We evaluated the reasonableness of the valuation methodologies.
◦We evaluated the reasonableness of the discount rate used in the income approach by developing an independent range of estimated discount rates and comparing that range to the discount rate used in the Company’s valuation.
◦We evaluated the multiples of earnings used in the market approach, including testing the underlying source information and mathematical accuracy of the calculations.
/s/ Deloitte & Touche LLP
Dallas, Texas
October 17, 2024
We have served as the Company's auditor since 1959.
|
|
|
|
|
|
|
|
|
|
|
|
|
|
|
|
|
|
|
|
|
|
COMMERCIAL METALS COMPANY AND SUBSIDIARIES
CONSOLIDATED STATEMENTS OF EARNINGS
|
| |
|
Year Ended August 31, |
| (in thousands, except share and per share data) |
|
2024 |
|
2023 |
|
2022 |
| Net sales |
|
$ |
7,925,972 |
|
|
$ |
8,799,533 |
|
|
$ |
8,913,481 |
|
| Costs and operating expenses (income): |
|
|
|
|
|
|
| Cost of goods sold |
|
6,567,287 |
|
|
6,987,618 |
|
|
7,057,085 |
|
| Selling, general and administrative expenses |
|
665,081 |
|
|
643,535 |
|
|
544,984 |
|
| Interest expense |
|
47,893 |
|
|
40,127 |
|
|
50,709 |
|
| Asset impairments |
|
6,708 |
|
|
3,780 |
|
|
4,926 |
|
| Loss (gain) on sale of assets |
|
3,321 |
|
|
2,327 |
|
|
(275,422) |
|
| Loss on debt extinguishment |
|
11 |
|
|
179 |
|
|
16,052 |
|
| Net costs and operating expenses |
|
7,290,301 |
|
|
7,677,566 |
|
|
7,398,334 |
|
| Earnings before income taxes |
|
635,671 |
|
|
1,121,967 |
|
|
1,515,147 |
|
| Income taxes |
|
150,180 |
|
|
262,207 |
|
|
297,885 |
|
| Net earnings |
|
$ |
485,491 |
|
|
$ |
859,760 |
|
|
$ |
1,217,262 |
|
|
|
|
|
|
|
|
|
|
|
|
|
|
|
|
|
|
|
|
|
|
|
|
|
|
|
|
|
|
|
|
|
|
|
|
|
|
|
|
|
|
|
|
|
|
|
|
|
|
| Earnings per share: |
|
|
|
|
|
|
| Basic |
|
$ |
4.19 |
|
|
$ |
7.34 |
|
|
$ |
10.09 |
|
| Diluted |
|
4.14 |
|
|
7.25 |
|
|
9.95 |
|
|
|
|
|
|
|
|
| Average basic shares outstanding |
|
115,844,977 |
|
|
117,077,703 |
|
|
120,648,090 |
|
| Average diluted shares outstanding |
|
117,152,552 |
|
|
118,606,271 |
|
|
122,372,386 |
|
See notes to consolidated financial statements.
|
|
|
|
|
|
|
|
|
|
|
|
|
|
|
|
|
|
|
|
|
|
COMMERCIAL METALS COMPANY AND SUBSIDIARIES
CONSOLIDATED STATEMENTS OF COMPREHENSIVE INCOME
|
|
|
Year Ended August 31, |
| (in thousands) |
|
2024 |
|
2023 |
|
2022 |
| Net earnings |
|
$ |
485,491 |
|
|
$ |
859,760 |
|
|
$ |
1,217,262 |
|
| Other comprehensive income (loss), net of income taxes: |
|
|
|
|
|
|
|
|
|
|
|
|
|
|
|
|
|
|
|
|
|
|
|
|
|
|
|
| Foreign currency translation adjustments |
|
49,191 |
|
|
119,852 |
|
|
(140,217) |
|
| Derivatives: |
|
|
|
|
|
|
Net unrealized holding gain (loss) |
|
(129,678) |
|
|
6,395 |
|
|
138,634 |
|
Reclassification for realized gain |
|
(1,965) |
|
|
(9,380) |
|
|
(22,173) |
|
| Net other comprehensive income (loss) on derivatives |
|
(131,643) |
|
|
(2,985) |
|
|
116,461 |
|
| Defined benefit pension plans: |
|
|
|
|
|
|
Net gain (loss) |
|
708 |
|
|
(7,985) |
|
|
(5,898) |
|
| Reclassification for settlement losses and other |
|
(430) |
|
|
1,791 |
|
|
23 |
|
| Net other comprehensive income (loss) on defined benefit pension plans |
|
278 |
|
|
(6,194) |
|
|
(5,875) |
|
Total other comprehensive income (loss), net of income taxes |
|
(82,174) |
|
|
110,673 |
|
|
(29,631) |
|
Comprehensive income |
|
$ |
403,317 |
|
|
$ |
970,433 |
|
|
$ |
1,187,631 |
|
See notes to consolidated financial statements.
|
|
|
|
|
|
|
|
|
|
|
|
|
|
|
|
COMMERCIAL METALS COMPANY AND SUBSIDIARIES
CONSOLIDATED BALANCE SHEETS
|
|
|
August 31, |
| (in thousands, except share and per share data) |
|
2024 |
|
2023 |
| Assets |
|
|
|
|
| Current assets: |
|
|
|
|
| Cash and cash equivalents |
|
$ |
857,922 |
|
|
$ |
592,332 |
|
Accounts receivable (less allowance for doubtful accounts of $3,494 and $4,135) |
|
1,158,946 |
|
|
1,240,217 |
|
| Inventories |
|
971,755 |
|
|
1,035,582 |
|
| Prepaid and other current assets |
|
285,489 |
|
|
276,024 |
|
| Assets held for sale |
|
18,656 |
|
|
— |
|
| Total current assets |
|
3,292,768 |
|
|
3,144,155 |
|
| Property, plant and equipment: |
|
|
|
|
| Land |
|
165,674 |
|
|
160,067 |
|
| Buildings and improvements |
|
1,166,788 |
|
|
1,071,102 |
|
| Equipment |
|
3,317,537 |
|
|
3,089,007 |
|
| Construction in process |
|
261,321 |
|
|
213,651 |
|
|
|
4,911,320 |
|
|
4,533,827 |
|
| Less accumulated depreciation and amortization |
|
(2,334,184) |
|
|
(2,124,467) |
|
| Property, plant and equipment, net |
|
2,577,136 |
|
|
2,409,360 |
|
| Intangible assets, net |
|
234,869 |
|
|
259,161 |
|
| Goodwill |
|
385,630 |
|
|
385,821 |
|
| Other noncurrent assets |
|
327,436 |
|
|
440,597 |
|
| Total assets |
|
$ |
6,817,839 |
|
|
$ |
6,639,094 |
|
| Liabilities and stockholders' equity |
|
|
|
|
| Current liabilities: |
|
|
|
|
| Accounts payable |
|
$ |
350,550 |
|
|
$ |
364,390 |
|
| Accrued expenses and other payables |
|
445,514 |
|
|
438,811 |
|
|
|
|
|
|
| Current maturities of long-term debt and short-term borrowings |
|
38,786 |
|
|
40,513 |
|
|
|
|
|
|
| Total current liabilities |
|
834,850 |
|
|
843,714 |
|
| Deferred income taxes |
|
276,908 |
|
|
306,801 |
|
| Other noncurrent liabilities |
|
255,222 |
|
|
253,181 |
|
| Long-term debt |
|
1,150,835 |
|
|
1,114,284 |
|
| Total liabilities |
|
2,517,815 |
|
|
2,517,980 |
|
| Commitments and contingencies (Note 17) |
|
|
|
|
| Stockholders' equity: |
|
|
|
|
|
|
|
|
|
Common stock, par value $0.01 per share; authorized 200,000,000 shares; issued 129,060,664 shares; outstanding 114,104,057 and 116,515,427 shares |
|
1,290 |
|
|
1,290 |
|
| Additional paid-in capital |
|
407,232 |
|
|
394,672 |
|
| Accumulated other comprehensive loss |
|
(85,952) |
|
|
(3,778) |
|
| Retained earnings |
|
4,503,885 |
|
|
4,097,262 |
|
Less treasury stock, 14,956,607 and 12,545,237 shares at cost |
|
(526,679) |
|
|
(368,573) |
|
| Stockholders' equity |
|
4,299,776 |
|
|
4,120,873 |
|
| Stockholders' equity attributable to non-controlling interests |
|
248 |
|
|
241 |
|
| Total stockholders' equity |
|
4,300,024 |
|
|
4,121,114 |
|
| Total liabilities and stockholders' equity |
|
$ |
6,817,839 |
|
|
$ |
6,639,094 |
|
See notes to consolidated financial statements.
|
|
|
|
|
|
|
|
|
|
|
|
|
|
|
|
|
|
|
|
|
COMMERCIAL METALS COMPANY AND SUBSIDIARIES
CONSOLIDATED STATEMENTS OF CASH FLOWS |
| |
|
Year Ended August 31, |
| (in thousands) |
|
2024 |
|
2023 |
|
2022 |
| Cash flows from (used by) operating activities: |
|
|
|
|
|
|
| Net earnings |
|
$ |
485,491 |
|
|
$ |
859,760 |
|
|
$ |
1,217,262 |
|
Adjustments to reconcile net earnings to net cash flows from operating activities: |
|
|
|
|
|
|
| Depreciation and amortization |
|
280,367 |
|
|
218,830 |
|
|
175,024 |
|
| Stock-based compensation |
|
45,066 |
|
|
60,529 |
|
|
46,978 |
|
| Deferred income taxes and other long-term taxes |
|
(15,319) |
|
|
51,919 |
|
|
86,175 |
|
| Write-down of inventory |
|
5,098 |
|
|
11,286 |
|
|
464 |
|
| Asset impairments |
|
6,708 |
|
|
3,780 |
|
|
4,926 |
|
Net loss (gain) on sales of assets |
|
3,321 |
|
|
2,327 |
|
|
(275,422) |
|
| Loss on debt extinguishment |
|
11 |
|
|
179 |
|
|
16,052 |
|
| Other |
|
2,745 |
|
|
4,471 |
|
|
2,089 |
|
|
|
|
|
|
|
|
| Settlement of New Markets Tax Credit transactions |
|
(6,748) |
|
|
(17,659) |
|
|
— |
|
|
|
|
|
|
|
|
|
|
|
|
|
|
|
|
|
|
|
|
|
|
|
|
|
|
|
|
|
| Changes in operating assets and liabilities, net of acquisitions: |
|
|
|
|
|
|
| Accounts receivable |
|
75,703 |
|
|
175,102 |
|
|
(257,607) |
|
|
|
|
|
|
|
|
| Inventories |
|
61,777 |
|
|
177,024 |
|
|
(255,175) |
|
| Accounts payable, accrued expenses and other payables |
|
(23,557) |
|
|
(174,120) |
|
|
3,899 |
|
| Other operating assets and liabilities |
|
(20,955) |
|
|
(29,325) |
|
|
(64,356) |
|
|
|
|
|
|
|
|
Net cash flows from operating activities |
|
899,708 |
|
|
1,344,103 |
|
|
700,309 |
|
|
|
|
|
|
|
|
| Cash flows from (used by) investing activities: |
|
|
|
|
|
|
| Capital expenditures |
|
(324,271) |
|
|
(606,665) |
|
|
(449,988) |
|
| Acquisitions, net of cash acquired |
|
— |
|
|
(234,717) |
|
|
(552,449) |
|
| Proceeds from government grants related to property, plant and equipment |
|
— |
|
|
5,000 |
|
|
— |
|
| Proceeds from insurance |
|
— |
|
|
2,456 |
|
|
3,081 |
|
| Proceeds from the sale of property, plant and equipment and other |
|
756 |
|
|
1,006 |
|
|
315,148 |
|
| Other |
|
513 |
|
|
(2,307) |
|
|
(507) |
|
|
|
|
|
|
|
|
|
|
|
|
|
|
|
|
|
|
|
|
|
|
Net cash flows used by investing activities |
|
(323,002) |
|
|
(835,227) |
|
|
(684,715) |
|
|
|
|
|
|
|
|
| Cash flows from (used by) financing activities: |
|
|
|
|
|
|
| Proceeds from issuance of long-term debt, net |
|
— |
|
|
— |
|
|
743,391 |
|
| Repayments of long-term debt |
|
(36,346) |
|
|
(389,756) |
|
|
(328,594) |
|
| Debt issuance and extinguishment |
|
— |
|
|
(1,897) |
|
|
(16,706) |
|
|
|
|
|
|
|
|
| Proceeds from accounts receivable facilities |
|
175,322 |
|
|
330,061 |
|
|
440,236 |
|
| Repayments under accounts receivable facilities |
|
(183,347) |
|
|
(349,015) |
|
|
(433,936) |
|
| Treasury stock acquired |
|
(182,932) |
|
|
(101,406) |
|
|
(161,880) |
|
| Tax withholdings related to share settlements, net of purchase plans |
|
(7,595) |
|
|
(12,539) |
|
|
(9,457) |
|
| Dividends |
|
(78,868) |
|
|
(74,936) |
|
|
(67,749) |
|
| Contribution from non-controlling interest |
|
7 |
|
|
9 |
|
|
— |
|
|
|
|
|
|
|
|
Net cash flows from (used by) financing activities |
|
(313,759) |
|
|
(599,479) |
|
|
165,305 |
|
| Effect of exchange rate changes on cash |
|
891 |
|
|
7,077 |
|
|
(2,785) |
|
Increase (decrease) in cash and cash equivalents |
|
263,838 |
|
|
(83,526) |
|
|
178,114 |
|
| Cash, restricted cash and cash equivalents at beginning of period |
|
595,717 |
|
|
679,243 |
|
|
501,129 |
|
| Cash, restricted cash and cash equivalents at end of period |
|
$ |
859,555 |
|
|
$ |
595,717 |
|
|
$ |
679,243 |
|
See notes to consolidated financial statements.
|
|
|
|
|
|
|
|
|
|
|
|
|
|
|
|
|
|
|
|
|
| |
|
Year Ended August 31, |
| (in thousands) |
|
2024 |
|
2023 |
|
2022 |
| Supplemental information: |
|
|
|
|
|
|
| Cash paid for income taxes |
|
$ |
158,455 |
|
|
$ |
199,883 |
|
|
$ |
229,316 |
|
| Cash paid for interest |
|
49,463 |
|
|
64,431 |
|
|
47,329 |
|
|
|
|
|
|
|
|
| Noncash activities: |
|
|
|
|
|
|
| Liabilities related to additions of property, plant and equipment |
|
$ |
35,203 |
|
|
$ |
31,379 |
|
|
$ |
55,648 |
|
|
|
|
|
|
|
|
|
|
|
|
|
|
|
| Cash and cash equivalents |
|
$ |
857,922 |
|
|
$ |
592,332 |
|
|
$ |
672,596 |
|
| Restricted cash |
|
1,633 |
|
|
3,385 |
|
|
6,647 |
|
| Total cash, restricted cash and cash equivalents |
|
$ |
859,555 |
|
|
$ |
595,717 |
|
|
$ |
679,243 |
|
|
|
|
|
|
|
|
|
|
|
|
|
|
|
|
|
|
|
|
|
|
|
|
|
|
|
|
|
|
|
COMMERCIAL METALS COMPANY AND SUBSIDIARIES
CONSOLIDATED STATEMENTS OF STOCKHOLDERS' EQUITY |
| |
Common Stock |
|
|
|
Treasury Stock |
|
|
| (in thousands, except share and per share data) |
Number of
Shares |
Amount |
Additional Paid-In
Capital |
Accumulated Other Comprehensive Income (Loss) |
Retained
Earnings |
Number of
Shares |
Amount |
Non-Controlling
Interests |
Total |
| Balance, September 1, 2021 |
129,060,664 |
|
$ |
1,290 |
|
$ |
368,064 |
|
$ |
(84,820) |
|
$ |
2,162,925 |
|
(8,474,075) |
|
$ |
(152,582) |
|
$ |
232 |
|
$ |
2,295,109 |
|
| Net earnings |
|
|
|
|
1,217,262 |
|
|
|
|
1,217,262 |
|
| Other comprehensive loss |
|
|
|
(29,631) |
|
|
|
|
|
(29,631) |
|
Dividends ($0.56 per share) |
|
|
|
|
(67,749) |
|
|
|
|
(67,749) |
|
| Treasury stock acquired |
|
|
|
|
|
(4,496,628) |
|
(161,880) |
|
|
(161,880) |
|
| Issuance of stock under incentive and purchase plans, net of shares withheld for taxes |
|
|
(28,072) |
|
|
|
1,406,092 |
|
18,615 |
|
|
(9,457) |
|
| Stock-based compensation |
|
|
33,684 |
|
|
|
|
|
|
33,684 |
|
|
|
|
|
|
|
|
|
|
|
|
|
|
|
|
|
|
|
|
|
| Reclassification of share-based liability awards |
|
|
9,091 |
|
|
|
|
|
|
9,091 |
|
| Balance, August 31, 2022 |
129,060,664 |
|
$ |
1,290 |
|
$ |
382,767 |
|
$ |
(114,451) |
|
$ |
3,312,438 |
|
(11,564,611) |
|
$ |
(295,847) |
|
$ |
232 |
|
$ |
3,286,429 |
|
| Net earnings |
|
|
|
|
859,760 |
|
|
|
|
859,760 |
|
| Other comprehensive income |
|
|
|
110,673 |
|
|
|
|
|
110,673 |
|
Dividends ($0.64 per share) |
|
|
|
|
(74,936) |
|
|
|
|
(74,936) |
|
| Treasury stock acquired |
|
|
|
|
|
(2,309,452) |
|
(101,406) |
|
|
(101,406) |
|
| Issuance of stock under incentive and purchase plans, net of shares withheld for taxes |
|
|
(41,219) |
|
|
|
1,328,826 |
|
28,680 |
|
|
(12,539) |
|
| Stock-based compensation |
|
|
43,434 |
|
|
|
|
|
|
43,434 |
|
| Contribution of non-controlling interest |
|
|
|
|
|
|
|
9 |
|
9 |
|
| Reclassification of share-based liability awards |
|
|
9,690 |
|
|
|
|
|
|
9,690 |
|
| Balance at August 31, 2023 |
129,060,664 |
|
$ |
1,290 |
|
$ |
394,672 |
|
$ |
(3,778) |
|
$ |
4,097,262 |
|
(12,545,237) |
|
$ |
(368,573) |
|
$ |
241 |
|
$ |
4,121,114 |
|
| Net earnings |
|
|
|
|
485,491 |
|
|
|
|
485,491 |
|
| Other comprehensive loss |
|
|
|
(82,174) |
|
|
|
|
|
(82,174) |
|
Dividends ($0.68 per share) |
|
|
|
|
(78,868) |
|
|
|
|
(78,868) |
|
| Treasury stock acquired and excise tax |
|
|
|
|
|
(3,499,225) |
|
(184,249) |
|
|
(184,249) |
|
| Issuance of stock under incentive and purchase plans, net of shares withheld for taxes and other |
|
|
(33,882) |
|
|
|
1,087,855 |
|
26,143 |
|
|
(7,739) |
|
| Stock-based compensation |
|
|
35,241 |
|
|
|
|
|
|
35,241 |
|
| Contribution of non-controlling interest |
|
|
|
|
|
|
|
7 |
|
7 |
|
| Reclassification of share-based liability awards |
|
|
11,201 |
|
|
|
|
|
|
11,201 |
|
| Balance at August 31, 2024 |
129,060,664 |
|
$ |
1,290 |
|
$ |
407,232 |
|
$ |
(85,952) |
|
$ |
4,503,885 |
|
(14,956,607) |
|
$ |
(526,679) |
|
$ |
248 |
|
$ |
4,300,024 |
|
See notes to consolidated financial statements.
COMMERCIAL METALS COMPANY AND SUBSIDIARIES
NOTES TO CONSOLIDATED FINANCIAL STATEMENTS
NOTE 1. NATURE OF OPERATIONS AND SUMMARY OF SIGNIFICANT ACCOUNTING POLICIES
Nature of Operations
CMC is an innovative solutions provider helping build a stronger, safer and more sustainable world. Through an extensive manufacturing network principally located in the United States ("U.S.") and Central Europe, CMC offers products and technologies to meet the critical reinforcement needs of the global construction sector. CMC’s solutions support construction across a wide variety of applications, including infrastructure, non-residential, residential, industrial and energy generation and transmission.
During the first quarter of 2024, CMC changed its reportable segments to reflect a change in the manner in which the business is managed. Based on changes to CMC’s organizational structure, the evolution of CMC’s solutions offerings outside of traditional steel products, the growing importance of non-steel solutions to CMC’s financial results and future outlook and how CMC's chief operating decision maker ("CODM"), the President and Chief Executive Officer, reviews operating results and makes decisions about resource allocation, CMC now has three reportable segments: North America Steel Group, Europe Steel Group and Emerging Businesses Group.
North America Steel Group
The North America Steel Group segment is composed of a vertically integrated network of recycling facilities, steel mills and fabrication operations located in the U.S. The recycling facilities process ferrous and nonferrous scrap metals (collectively referred to as "raw materials") for use by manufacturers of metal products. The steel mill operations consist of six electric arc furnace ("EAF") mini mills, three EAF micro mills and one rerolling mill. The steel mills manufacture finished long steel products including reinforcing bar ("rebar"), merchant bar, light structural and other special sections and wire rod, as well as semi-finished billets for rerolling and forging applications (collectively referred to as "steel products" in the context of the North America Steel Group segment). The fabrication operations primarily fabricate rebar and steel fence posts and offer post-tension cable products (collectively referred to as "downstream products" in the context of the North America Steel Group segment). The general strategy in the North America Steel Group segment is to optimize the Company's vertically integrated value chain to maximize profitability by obtaining the lowest possible input costs and highest possible selling prices. The Company operates the recycling facilities to provide low-cost scrap to the steel mills and the fabrication operations to optimize the steel mill volumes. The North America Steel Group segment's products are sold primarily to steel mills and foundries, as well as construction, fabrication and other manufacturing industries.
Europe Steel Group
The Europe Steel Group segment is composed of a vertically integrated network of recycling facilities, an EAF mini mill and fabrication operations located in Poland. The scrap metal recycling facilities process ferrous scrap metals for use almost exclusively by the mini mill. The steel products manufactured by the mini mill include rebar, merchant bar and wire rod as well as semi-finished billets. The products manufactured by this segment's fabrication operations include fabricated rebar, wire mesh, welded steel mesh, wire rod, cold rolled rebar, cold rolled wire rod, assembled rebar cages and other fabricated rebar by-products (collectively referred to as "downstream products" in the context of the Europe Steel Group segment). The strategy in the Europe Steel Group segment is to optimize profitability of the products manufactured by the mini mill and is executed in the same manner as in the North America Steel Group segment. The Europe Steel Group segment's products are sold primarily to fabricators, manufacturers, distributors and construction companies.
Emerging Businesses Group
The Emerging Businesses Group segment's portfolio consists of CMC Construction Services products (collectively referred to as "construction products"), Tensar products and solutions (collectively referred to as "ground stabilization solutions") and CMC Impact Metals, and performance reinforcing steel products (collectively referred to as "downstream products" in the context of the Emerging Businesses Group segment).
•CMC Construction Services operations sell and rent products and equipment used to execute construction projects. Primary customers include concrete installers and other businesses in the construction industry.
•Tensar operations sell geogrids and Geopier foundation systems. Geogrids are polymer-based products used for ground stabilization, soil reinforcement and asphalt optimization in construction applications, including roadways, public infrastructure and industrial facilities. Geopier foundation systems are rammed aggregate pier and other foundation solutions that increase the load-bearing characteristics of ground structures and working surfaces and can be applied in soil types and construction situations in which traditional support methods are impractical or would make a project infeasible.
•CMC Impact Metals operations manufacture heat-treated, high-strength steel products, such as high-strength bar for the truck trailer industry, special bar quality steel for the energy market and armor plate for military vehicles.
•CMC's group of performance reinforcing steel offerings include innovative products such as Galvabar (galvanized rebar with a zinc alloy coating that provides corrosion protection and post-fabrication formability), ChromX (designed for high-strength capabilities, corrosion resistance and a service life of more than 100 years) and CryoSteel (a cryogenic reinforcing steel that exceeds minimum performance requirements for strength and ductility at extremely low temperatures). Additionally, CMC Anchoring Systems' operations supply custom engineered anchor cages, bolts and fasteners that are fabricated principally from rebar and are used primarily to secure high voltage electrical transmission poles to concrete foundations.
•Through the Company's licensing agreement with InQuik Inc., CMC Bridge Systems is the authorized provider of InQuik Bridges in the U.S. CMC Bridge Systems offers a prefabricated and modular method used to build reinforced concrete bridge components off-site, which are then installed on-site with poured concrete for a cast-in-place structure.
The strategy in the Emerging Businesses Group segment is to provide construction-related solutions and value-added products with strong underlying growth fundamentals to serve domestic and international markets that are adjacent to those served by the vertically integrated operations in the North America Steel Group segment and the Europe Steel Group segment. To execute this strategy, the Company (i) develops proprietary products and solutions that deliver high value to customers by reducing costs and construction time, (ii) provides concrete-related construction products, equipment, and services and (iii) produces reinforcing steel products with increased strength, durability and corrosion resistance to support sustainable concrete construction.
As a result of the change in reportable segments, certain prior year amounts have been recast to conform to the current year presentation. Throughout this Form 10-K, unless otherwise indicated, amounts and activity affected by the change in reportable segments have been reclassified. The change in reportable segments had no impact on the Company’s consolidated balance sheets and the consolidated statements of earnings, comprehensive income, cash flows and stockholders’ equity previously reported.
Summary of Significant Accounting Policies
Consolidation
The consolidated financial statements include the accounts of the Company and its wholly-owned and majority owned subsidiaries and certain variable interest entities ("VIEs") for which the Company is the primary beneficiary. Intercompany account balances and transactions have been eliminated.
Use of Estimates
The preparation of the Company's consolidated financial statements in accordance with accounting principles generally accepted in the United States requires management to make estimates and assumptions that affect the reported amounts of assets and liabilities and disclosure of contingent assets and liabilities at the date of the consolidated financial statements and reported amounts of net sales and expenses during the reporting period. Significant items subject to such estimates and assumptions include revenue recognition, income taxes, carrying value of inventory, acquisitions, goodwill and other intangible assets, long-lived assets, derivative financial instruments and contingencies. Actual results could differ significantly from these estimates and assumptions.
Cash and Cash Equivalents
Cash and cash equivalents include cash on deposit and short-term, highly-liquid investments with original maturities of three months or less at the date of purchase.
Revenue Recognition and Allowance for Doubtful Accounts
Revenue is recognized when control of the promised goods or services is transferred to the customer in an amount that reflects the consideration received or expected to be received in exchange for those goods or services. The Company's performance obligations arise from (i) sales of raw materials, steel products, downstream products, construction products and ground stabilization solutions and (ii) installation services performed by its fabrication operations. The shipment of products to customers is considered a fulfillment activity and amounts billed to customers for shipping and freight are included in net sales, and the related costs are included in cost of goods sold. Net sales are presented net of taxes remitted to taxing authorities.
The majority of the Company's revenue is recognized at a point in time concurrent with the transfer of control, which usually occurs, depending on shipping terms, upon shipment or customer receipt. Certain revenue from the Company's downstream products in the North America Steel Group segment is not recognized at a point in time. Revenue resulting from certain sales of fabricated rebar in the North America Steel Group segment is recognized over time, as discussed below. Remaining revenue resulting from sales of downstream products in the North America Steel Group segment is recognized equal to billing under an available practical expedient.
Each of the North America Steel Group segment's fabricated rebar contracts represent a single performance obligation. For contracts where the Company provides fabricated rebar and installation services, revenue is recognized over time using an input measure of progress based on contract costs incurred to date compared to total estimated contract costs ("input measure"). This input measure provides a reasonable depiction of the Company’s progress towards satisfaction of the performance obligation as there is a direct relationship between costs incurred by the Company and the transfer of the fabricated rebar and installation services. Revenue from fabricated rebar contracts where the Company does not provide installation services is recognized over time using an output measure of progress based on tons shipped compared to total estimated tons ("output measure"). This output measure provides a reasonable depiction of the transfer of contract value to the customer, as there is a direct relationship between the units shipped by the Company and the transfer of the fabricated rebar. If total estimated costs on any contract are greater than the net contract revenues, the Company recognizes the entire estimated loss in the period the loss becomes known. The cumulative effect of revisions to estimates related to net contract revenues, costs to complete or total planned quantity is recorded in the period in which such revisions are identified.
The timing of revenue recognition may differ from the timing of invoicing to customers. The Company records an asset when revenue is recognized prior to invoicing and a liability when revenue is recognized subsequent to invoicing. Payment terms and conditions vary by contract type, although the Company generally requires customers to pay 30 days after the Company satisfies the performance obligations. In instances where the timing of revenue recognition differs from the timing of invoicing, the Company has determined the contracts do not include a significant financing component.
The Company maintains an allowance for doubtful accounts for the accounts receivable we estimate will not be collected based on market conditions, customers' financial condition and other factors. Historically, these allowances have not been material. The Company reviews and sets credit limits for each customer. The Europe Steel Group segment uses credit insurance to ensure payment in accordance with the terms of sale. Generally, collateral is not required. Approximately 13% and 14% of total receivables at August 31, 2024 and 2023, respectively, were financially assured.
Inventories
Inventories are stated at the lower of cost or net realizable value. Cost is determined by the weighted average cost method. Adjustments to inventory may be due to changes in price levels, assumptions about market conditions, obsolescence, damage, physical deterioration and other causes. Adjustments required to reduce the carrying value of inventory to net realizable value are recorded as a charge to cost of goods sold within the consolidated statements of earnings.
Elements of cost in finished goods inventory in addition to the cost of material include depreciation, utilities, consumable production inputs, maintenance, production, wages and transportation costs. Additionally, the costs of departments that support production, including materials management and quality control, are allocated to inventory.
Property, Plant and Equipment
Property, plant and equipment are recorded at cost. Maintenance is expensed as incurred. Leasehold improvements are amortized over the shorter of their estimated useful lives or the lease term. Depreciation and amortization are recorded on a straight-line basis over the following estimated useful lives:
|
|
|
|
|
|
|
|
|
|
|
|
|
|
|
| Buildings |
7 |
to |
40 |
years |
| Land improvements |
3 |
to |
25 |
years |
| Leasehold improvements |
3 |
to |
15 |
years |
| Equipment |
3 |
to |
25 |
years |
| Internal-use software |
3 |
to |
15 |
years |
The Company evaluates impairment of its property, plant and equipment to be held and used whenever events or changes in circumstances indicate that the carrying value of an asset or asset group may not be recoverable. For each asset or asset group held for use with indicators of impairment, the Company compares the undiscounted net cash flows to be generated from the use and eventual disposition of the asset or asset group with its net carrying value. If the net carrying value of the asset or asset group exceeds the estimated undiscounted net future cash flows, the excess of the net carrying value over its estimated fair value is charged to impairment loss. Property, plant and equipment held for sale are reported at the lower of their carrying amount or their estimated sales price, less estimated costs to sell.
During 2023, historical and current period operating losses were determined to be triggering events for three long-lived asset
groups associated with downstream fabricated rebar operations. The Company reviewed the undiscounted future cash flows for
the long-lived asset groups for recoverability, which indicated that the net carrying values of certain right-of-use ("ROU")
assets included in one long-lived asset group were not recoverable. Therefore, such ROU assets were evaluated for impairment
by comparing the estimated fair values of the ROU assets to their net carrying values, which resulted in a non-cash impairment
of $3.5 million during the fourth quarter of 2023, included in asset impairments in the consolidated statement of earnings. During 2024, there were no events or circumstances that triggered an impairment review for property, plant and equipment. Further discussion regarding non-recurring fair value remeasurements is included in Note 11, Fair Value.
Software Development Costs
The Company capitalizes certain direct internal and external costs for the development of internal-use software based upon the stage of development as well as the nature of the costs incurred. Capitalization of qualifying internal-use software costs begins when the preliminary project stage is completed, management with the relevant authority, implicitly or explicitly, authorizes and commits to funding the project and it is probable that the project will be completed and the software will perform as intended. Costs incurred in the application and infrastructure development phases, including significant enhancements and upgrades, are capitalized. Capitalization ends once a project is substantially complete and the software is ready for its intended purpose. Costs incurred in the preliminary project stage and post implementation phases, including costs associated with the post-configuration training and repairs and maintenance of the developed technologies, are expensed as incurred.
Costs associated with a cloud computing arrangement (“CCA”), such as software as a service or other hosting arrangement, are capitalized consistent with costs capitalized for internal-use software. If the CCA includes a software license, the software license element of the arrangement is accounted for in the same manner as the acquisition of other software licenses. If the CCA does not include a software license, the service element of the arrangement is accounted for as a service contract. The Company defers certain implementation costs for its CCAs that are service contracts, which are included in prepaids and other current assets and other noncurrent assets in the Company's consolidated balance sheets. The Company amortizes capitalized or deferred implementation costs in a CCA over the life of the service contract.
Leases
The Company's leases are primarily for real property and equipment. The Company determines if an arrangement is a lease at inception of a contract if the terms state the Company has the right to direct the use of, and obtain substantially all the economic benefits from, a specific asset identified in the contract. The ROU assets represent the Company's right to use the underlying assets for the lease term, and the lease liabilities represent the obligation to make lease payments arising from the leases. The Company's ROU assets and lease liabilities are recognized at commencement date based on the present value of lease payments to be made over the lease term. Certain of the Company's lease agreements contain options to extend the lease. The Company evaluates these options on a lease-by-lease basis, and if the Company determines it is reasonably certain to be exercised, the lease term includes the extension. The Company uses its incremental borrowing rate at lease commencement to determine the present value of lease payments, and lease expense is recognized on a straight-line basis over the lease term. The incremental borrowing rate is the rate of interest the Company could borrow on a collateralized basis over a similar term with similar payments. The Company does not include leases with an initial term of twelve months or less in the ROU asset or lease liability balances.
Certain of the Company's lease agreements include payments for certain variable costs not determinable upon lease commencement, including mileage, utilities, fuel and inflation adjustments. These variable lease payments are recognized in cost of goods sold and selling, general and administrative ("SG&A") expenses, but are not included in the ROU asset or lease liability balances. The Company's lease agreements do not contain any material residual value guarantees, restrictions or covenants.
Government Assistance
Government assistance, including non-monetary grants, herein collectively referred to as grants, are not recognized until there is reasonable assurance that the Company will comply with the conditions of the grant and the Company will receive the grant. Generally, government grants fall into two categories: grants related to assets and grants related to income.
Grants related to assets are government grants for the purchase, construction or other acquisition of long-lived assets. The Company accounts for grants related to assets by deducting the grant in arriving at the carrying amount of the asset on the consolidated balance sheets. Non-monetary grants are recognized at fair value. The Company recognizes the grant in profit or loss over the life of the depreciable asset as a reduction to depreciation expense. Grants related to non-depreciable assets may require the fulfillment of certain obligations and, in such cases, would be recognized in profit or loss over the periods that bear the cost of meeting the obligations. As an example, a grant of land that is conditional upon constructing a building on the site is recognized as a reduction to depreciation expense over the life of the building.
Grants related to income are any grants that are not considered grants related to assets, such as grants to compensate for certain expenses. Grants related to income are recognized in profit or loss on a systematic basis upon meeting the recognition criteria specified in the grants and during the periods when the expenses the grants intend to compensate for are incurred.
During 2024, 2023 and 2022, the Company was awarded $29.2 million, $9.5 million and $15.5 million, respectively, in government grants related to income as part of the compensation scheme for energy-intensive sectors and sub-sectors established by the Energy Regulatory Office in Poland (the "Poland Compensation Scheme Act" or "PCSA"). The purpose of the PCSA in each year was to provide aid to energy-intensive companies to offset indirect costs of rising carbon emission rights included in energy costs. The amount of government assistance awarded by the PCSA in each year was dependent upon the Company meeting certain electricity consumption thresholds and the number of other applicants. The government assistance received and recognized under the PCSA in each year is not subject to recapture. The PCSA grants were recognized in the Europe Steel Group segment and were recorded as reductions to cost of goods sold in the Company's consolidated statements of earnings.
During 2024 and 2023, the Company was awarded $40.2 million and $4.3 million, respectively, in government grants related to income as part of the annual Polish state aid programs established for rising electricity and natural gas prices (the "Energy Aid Programs"). The Energy Aid Programs were established by the Polish Ministry of Development and Technology to mitigate the effects of sudden increases in electricity and natural gas prices in Poland for companies who met required energy intensity and sectorial conditions and met certain financial metrics. The government assistance received and recognized under the Energy Aid Programs in each year is not subject to recapture. The grants from the Energy Aid Programs were recognized in the Europe Steel Group segment and recorded as reductions to cost of goods sold in the Company's consolidated statements of earnings.
During 2023, the Company entered into an agreement with the West Virginia Economic Development Authority (the "WVEDA") to permanently finance a portion of the costs to construct the Company's fourth micro mill, which is under development in Berkeley County, West Virginia.
Under this agreement, the Company can receive up to $75.0 million in the aggregate of disbursements in the form of a forgivable loan for eligible costs incurred from June 21, 2023 through June 20, 2027 (the "Completion Date"). Eligible costs include the acquisition of land and buildings, the acquisition and installation of machinery and equipment and necessary construction costs. The Company anticipates receiving disbursements over this period upon achieving certain capital investment and employment thresholds. Amounts received under the agreement are subject to recapture in the event that the Company fails to achieve certain minimum investment and employment thresholds prior to the Completion Date. The Company has determined that amounts received under the agreement are grants related to assets. During 2023, the Company received $5.0 million in benefits from the WVEDA as a result of meeting certain investment thresholds; amounts received were recognized in the North America Steel Group segment and the cumulative benefits reduced construction in process in the Company's consolidated balance sheets.
Goodwill and Other Intangible Assets
Goodwill and other indefinite-lived intangible assets are tested for impairment annually as of the first day of the Company's fourth quarter, and between annual tests whenever events or circumstances indicate that the carrying value of a reporting unit, including goodwill, or an indefinite-lived intangible asset exceeds its fair value. To evaluate goodwill and other indefinite-lived intangible assets for impairment, the Company may use qualitative assessments to determine whether it is more likely than not that the fair value of a reporting unit, including goodwill, or an indefinite-lived intangible asset is less than its carrying amount. The qualitative assessments consider multiple factors, including the current operating environment, historical and future financial performance and industry and market conditions. If an initial qualitative assessment identifies that it is more likely than not that the carrying value of a reporting unit exceeds its estimated fair value, additional quantitative testing is performed. The Company may elect to bypass the qualitative assessment and instead perform a quantitative impairment test to calculate the fair value of the reporting unit in comparison to its associated carrying value.
The Company's reporting units represent an operating segment or one level below an operating segment. When performing a quantitative impairment test, the Company estimates the fair value of its reporting units using a weighting of fair values derived from the income and market approaches. Under the income approach, the Company determines the fair value of a reporting unit based on the present value of estimated future cash flows. Cash flow projections are based on management's estimates of revenue growth rates and operating margins, taking into account industry and market conditions. The discount rate is based on a weighted average cost of capital adjusted for the relevant risk associated with the characteristics of the reporting unit. The market approach estimates fair value based on market multiples of earnings derived from comparable publicly traded companies with similar operating and investment characteristics as the reporting unit. If the carrying amount of a reporting unit exceeds its fair value, an impairment loss is indicated in the amount that the carrying value exceeds the fair value of the reporting unit, not to exceed the goodwill value for the reporting unit.
When estimating the fair value of indefinite-lived intangible assets using a quantitative approach, the Company uses an income approach to calculate the fair value of the indefinite-lived intangible assets using a relief from royalty method. Significant inputs to measure the fair value of the indefinite-lived intangible assets include projected revenue growth rates, royalty rates and discount rates.
Intangible assets with finite lives are amortized on a straight-line basis over their estimated useful lives and are tested for impairment whenever events or changes in circumstances indicate that the carrying value may not be recoverable. Impairment charges are recorded on finite-lived intangible assets when indicators of impairment are present and the undiscounted cash flows estimated to be generated by those assets are less than the assets' carrying amounts.
Contingencies
The Company accrues for claims and litigation, including environmental investigation and remediation costs, when they are both probable and the amount can be reasonably estimated. In the event that estimates or assumptions prove to differ from actual results, adjustments are made in subsequent periods to reflect more current information. The Company expenses legal fees as incurred.
Environmental costs are based upon estimates regarding the sites for which the Company will be responsible, the scope and cost of work to be performed at each site, the portion of costs that will be shared with other parties and the timing of remediation. Where timing and amounts cannot be reasonably determined, a range is estimated and the lower end of the range is recorded.
Stock-Based Compensation
The Company recognizes stock-based equity and liability awards at fair value. The fair value of each stock-based equity award is estimated at the grant date using either the Black-Scholes or Monte Carlo pricing model. Total compensation cost of the stock-based equity awards is amortized over the requisite service period using the accelerated method of amortization for grants with graded vesting or the straight-line method for grants with cliff vesting. Stock-based liability awards are measured at fair value at the end of each reporting period and will fluctuate based on the price of CMC common stock and performance relative to the targets.
Income Taxes
CMC and its U.S. subsidiaries file a consolidated federal income tax return. Deferred income taxes are provided for temporary differences between financial statement and income tax bases of assets and liabilities. The principal differences are described in Note 12, Income Tax. Benefits from income tax credits are reflected currently in earnings. The Company records income tax positions based on a more likely than not threshold that the tax positions will be sustained on examination by the taxing authorities having full knowledge of all relevant information. The Company classifies interest and any statutory penalties recognized on a tax position as income tax expense.
Foreign Currencies
The functional currency of the Company's foreign operations is the local currency of each respective country. Translation adjustments are reported as a component of accumulated other comprehensive income or loss. Transactions denominated in currencies other than the functional currency yielded losses of $7.7 million and $12.1 million in 2024 and 2023, respectively, and a gain of $9.6 million in 2022.
Derivative Financial Instruments
The Company recognizes derivatives as either assets or liabilities in the consolidated balance sheets and measures those instruments at fair value. Derivatives that are not designated as hedges are adjusted to fair value through net earnings. Changes in the fair value of derivatives that are designated as hedges are recognized depending on the nature of the hedge. In the case of fair value hedges, changes are recognized as an offset against the change in fair value of the hedged balance sheet item. When the derivative is designated as a cash flow hedge and is highly effective, changes are recognized in other comprehensive income.
When a derivative instrument is sold, terminated, exercised or expires, the gain or loss is recorded in the consolidated statement of earnings for fair value hedges, and the cumulative unrealized gain or loss, which had been recognized in the statement of comprehensive income, is reclassified to the consolidated statement of earnings for cash flow hedges. Additionally, when hedged items are sold or extinguished, or the anticipated transaction being hedged is no longer expected to occur, the Company recognizes the gain or loss on the designated hedged financial instrument.
Fair Value
The Company has established a fair value hierarchy which prioritizes the inputs to the valuation techniques used to measure fair value into three levels. These levels are determined based on the lowest level input that is significant to the fair value measurement. Level 1 represents unadjusted quoted prices in active markets for identical assets and liabilities. Level 2 represents quoted prices for similar assets and liabilities in active markets (other than those included in Level 1) which are observable, either directly or indirectly. Level 3 represents valuations derived from valuation techniques in which one or more significant inputs or significant value drivers are unobservable.
Recently Issued and Adopted Accounting Pronouncements
In October 2021, the Financial Accounting Standards Board ("FASB") issued Accounting Standards Update ("ASU") 2021-08, Business Combinations (Topic 805): Accounting for Contract Assets and Contract Liabilities from Contracts with Customers. ASU 2021-08 requires that an acquirer recognize and measure contract assets and liabilities acquired in a business combination in accordance with ASU 2014-09, Revenue from Contracts with Customers (Topic 606). The Company adopted this standard on a prospective basis for the annual period beginning September 1, 2023. The adoption did not have an impact on our consolidated financial statements at the time of adoption.
In November 2023, the FASB issued ASU 2023-07, Segment Reporting (Topic 280): Improvements to Reportable Segment Disclosures ("ASU 2023-07"). ASU 2023-07 requires, among other updates, enhanced disclosures about significant segment expenses that are regularly provided to the CODM, as well as the aggregate amount of other segment items included in the reported measure of segment profit or loss. ASU 2023-07 is effective for fiscal years beginning after December 15, 2023, and interim periods within fiscal years beginning after December 15, 2024, and requires retrospective adoption. Early adoption is permitted. The Company is evaluating the impact of this guidance on its consolidated financial statements and disclosures.
In December 2023, the FASB issued ASU 2023-09, Income Taxes (Topic 740): Improvements to Income Tax Disclosures ("ASU 2023-09"). ASU 2023-09 requires enhanced annual disclosures regarding the rate reconciliation and income taxes paid information. ASU 2023-09 is effective for fiscal years beginning after December 15, 2024 and may be adopted on a prospective or retrospective basis. Early adoption is permitted. The Company is evaluating the impact of this guidance on its consolidated financial statements and disclosures.
NOTE 2. CHANGES IN BUSINESS
2023 Acquisitions
On September 15, 2022, the Company completed the acquisition of Advanced Steel Recovery, LLC ("ASR"), a supplier of recycled ferrous scrap metals located in Southern California. ASR's primary operations include processing and brokering capabilities that source material for sale into both the domestic and export markets.
On November 14, 2022, the Company completed the acquisition of a Galveston, Texas area metals recycling facility and related assets (collectively, "Kodiak") from Kodiak Resources, Inc. and Kodiak Properties, L.L.C.
On March 3, 2023, the Company completed the acquisition of all of the assets of Roane Metals Group, LLC ("Roane"), a supplier of recycled metals with two facilities located in eastern Tennessee.
On March 17, 2023, the Company completed the acquisition of Tendon Systems, LLC ("Tendon"), a leading provider of post-tensioning, barrier cable and concrete restoration solutions to the southeastern U.S.
On May 1, 2023, the Company completed the acquisition of all of the assets of BOSTD America, LLC ("BOSTD"), a geogrid manufacturing facility located in Blackwell, Oklahoma. Prior to the acquisition, BOSTD produced several product lines for the Company's Tensar operations under a contract manufacturing arrangement.
On July 12, 2023, the Company completed the acquisition of EDSCO Fasteners, LLC ("EDSCO"), a leading provider of anchoring solutions for the electrical transmission market, with four manufacturing facilities located in North Carolina, Tennessee, Texas and Utah. Following the acquisition, EDSCO was rebranded as CMC Anchoring Systems.
The acquisitions of ASR, Kodiak, Roane, Tendon, BOSTD and EDSCO (collectively, the "2023 Acquisitions") were not material individually, or in the aggregate, to the Company's financial position or results of operations, and therefore, pro forma operating results and other disclosures are not presented.
Operating results for the acquired operations of ASR, Kodiak, Roane and Tendon are presented within the Company's North America Steel Group segment. Operating results for BOSTD and CMC Anchoring Systems are presented within the Company's Emerging Businesses Group segment.
Tensar Acquisition
On April 25, 2022 (the "Tensar Acquisition Date"), the Company completed the acquisition of TAC Acquisition Corp. ("Tensar"). The total cash purchase price, net of $19.6 million cash acquired, was approximately $550 million, and was funded through domestic cash on-hand. Tensar's net sales of $102.1 million and earnings before income taxes of $3.2 million were included in the Company's consolidated statement of earnings in 2022.
Pro Forma Supplemental Information
Supplemental information on an unaudited pro forma basis is presented below as if the acquisition of Tensar occurred on September 1, 2020. The pro forma financial information is presented for comparative purposes only, based on certain factually supported estimates and assumptions, which the Company believes to be reasonable, but not necessarily indicative of future results of operations or the results that would have been reported if the acquisition had been completed on September 1, 2020. These results were not used as part of management's analysis of the financial results and performance of the Company. The pro forma adjustments do not reflect anticipated synergies, but rather include the nonrecurring impact to cost of sales from revalued inventory and the recurring income statement effects of fair value adjustments, such as increased amortization expense. Further adjustments were made to remove the impact of Tensar's prior management fees, acquisition and integration expenses and interest on debt not assumed in the acquisition. The resulting tax effects of the business combination are also reflected below.
|
|
|
|
|
|
|
|
|
|
| (in thousands) |
|
Year Ended August 31, 2022 |
|
| Pro forma net sales |
|
$ |
9,064,322 |
|
|
| Pro forma net earnings |
|
1,238,174 |
|
|
The 2022 pro forma results include, but are not limited to, adjustments to remove the impact of $8.7 million of acquisition and integration expenses incurred during 2022 and $8.7 million of increased cost of goods sold in 2022 as a result of the revaluation of inventory. The 2022 pro forma results also reflect increased amortization expense from acquired intangible assets of $8.1 million.
Facility Disposition
On September 29, 2021, the Company entered into a definitive agreement to sell the assets associated with its Rancho Cucamonga mini mill and an adjacent rebar fabrication facility ("the Rancho Cucamonga facilities"). On December 28, 2021, the sale of the Rancho Cucamonga facilities was completed for gross proceeds of $313.0 million, of which $22.0 million was used to purchase like-kind assets in 2022 per the terms of the sale agreement. The Company recognized a gain on the sale of the Rancho Cucamonga facilities of $273.3 million in 2022.
NOTE 3. ACCUMULATED OTHER COMPREHENSIVE INCOME (LOSS)
Accumulated other comprehensive income (loss) ("AOCI") was comprised of the following:
|
|
|
|
|
|
|
|
|
|
|
|
|
|
|
|
|
|
|
|
|
|
|
|
|
|
|
| (in thousands) |
|
Foreign Currency Translation |
|
Derivatives |
|
Defined Benefit Pension Plans |
|
Total AOCI |
| Balance, September 1, 2021 |
|
$ |
(105,680) |
|
|
$ |
21,781 |
|
|
$ |
(921) |
|
|
$ |
(84,820) |
|
Other comprehensive income (loss) before reclassifications(1) |
|
(140,217) |
|
|
138,634 |
|
|
(5,875) |
|
|
(7,458) |
|
Reclassification for gain(2) |
|
— |
|
|
(22,173) |
|
|
— |
|
|
(22,173) |
|
| Net other comprehensive income (loss) |
|
(140,217) |
|
|
116,461 |
|
|
(5,875) |
|
|
(29,631) |
|
| Balance at August 31, 2022 |
|
(245,897) |
|
|
138,242 |
|
|
(6,796) |
|
|
(114,451) |
|
Other comprehensive income (loss) before reclassifications(1) |
|
119,852 |
|
|
6,395 |
|
|
(7,985) |
|
|
118,262 |
|
Reclassification for (gain) loss(2) |
|
— |
|
|
(9,380) |
|
|
1,791 |
|
|
(7,589) |
|
Net other comprehensive income (loss) |
|
119,852 |
|
|
(2,985) |
|
|
(6,194) |
|
|
110,673 |
|
| Balance at August 31, 2023 |
|
(126,045) |
|
|
135,257 |
|
|
(12,990) |
|
|
(3,778) |
|
Other comprehensive income (loss) before reclassifications(1) |
|
49,191 |
|
|
(129,678) |
|
|
708 |
|
|
(79,779) |
|
Reclassification for gain and other(2)(3) |
|
— |
|
|
(1,965) |
|
|
(430) |
|
|
(2,395) |
|
Net other comprehensive income (loss) |
|
49,191 |
|
|
(131,643) |
|
|
278 |
|
|
(82,174) |
|
| Balance at August 31, 2024 |
|
$ |
(76,854) |
|
|
$ |
3,614 |
|
|
$ |
(12,712) |
|
|
$ |
(85,952) |
|
__________________________________
(1) Other comprehensive income (loss) ("OCI") before reclassifications from derivatives is presented net of income tax benefit (expense) of $30.6 million, $(1.1) million and $(33.0) million for 2024, 2023 and 2022, respectively. OCI before reclassifications from defined benefit pension plans is presented net of an immaterial income tax impact for 2024 and net of income tax benefit of $3.9 million and $2.6 million for 2023 and 2022, respectively.
(2) Reclassifications for gains from derivatives included in net earnings are primarily recorded in cost of goods sold in the consolidated statements of earnings and are presented net of an immaterial income tax impact for 2024 and net of income tax expense of $2.2 million and $5.3 million for 2023 and 2022, respectively.
(3) Reclassification from defined benefit pension plans include settlement losses and other items such as amortization of unrecognized gains or losses that are recorded in SG&A expenses in the consolidated statements of earnings and are presented net of immaterial income tax impacts for all periods presented.
NOTE 4. REVENUE RECOGNITION
Revenue from Contracts with Customers
The majority of the Company's revenue is recognized at a point in time concurrent with the transfer of control, which usually occurs, depending on shipping terms, upon shipment or customer receipt. See Note 19, Segment Information, for further information about disaggregated revenue by our major product lines.
Certain revenue from the Company's downstream products in the North America Steel Group segment is not recognized at a point in time. Revenue resulting from certain sales of fabricated rebar in the North America Steel Group segment is recognized over time, as discussed below. Revenue resulting from sales of other downstream products in the North America Steel Group segment is recognized equal to billing under an available practical expedient.
Each of the North America Steel Group segment's fabricated rebar contracts represent a single performance obligation. Revenue from certain fabricated rebar contracts for which the Company provides fabricated product and installation services is recognized over time using an input measure, and these contracts represented 8% of net sales in the North America Steel Group segment in 2024, 2023 and 2022. Revenue from fabricated rebar contracts for which the Company does not provide installation services is recognized over time using an output measure, and these contracts represented 10%, 12% and 9% of net sales in the North America Steel Group segment in 2024, 2023 and 2022, respectively.
The following table provides information about assets and liabilities from contracts with customers:
|
|
|
|
|
|
|
|
|
|
|
|
|
|
|
| (in thousands) |
|
August 31, 2024 |
|
August 31, 2023 |
| Contract assets (included in accounts receivable) |
|
$ |
57,007 |
|
|
$ |
67,641 |
|
| Contract liabilities (included in accrued expenses and other payables) |
|
35,356 |
|
|
28,377 |
The entire contract liability as of August 31, 2023 was recognized in 2024.
Remaining Performance Obligations
As of August 31, 2024, revenue totaling $983.5 million has been allocated to remaining performance obligations in the North America Steel Group segment related to contracts for which revenue is recognized using an input or output measure. Of this amount, the Company estimates that approximately 79% of the remaining performance obligations will be recognized during 2025 and the remainder will be recognized during 2026. The duration of all other contracts in the North America Steel Group, Europe Steel Group and Emerging Businesses Group segments are typically less than one year.
NOTE 5. INVENTORIES
The majority of the Company's inventories are in the form of semi-finished and finished steel products. Under the Company’s vertically integrated business models in the North America Steel Group segment and the Europe Steel Group segment, steel products are sold to external customers in various stages, from semi-finished billets through fabricated steel, leading these categories to be combined as finished goods.
The components of inventories were as follows:
|
|
|
|
|
|
|
|
|
|
|
|
|
|
|
| (in thousands) |
|
August 31, 2024 |
|
August 31, 2023 |
| Raw materials |
|
$ |
232,982 |
|
|
$ |
261,619 |
|
| Work in process |
|
5,390 |
|
|
6,844 |
|
| Finished goods |
|
733,383 |
|
|
767,119 |
|
| Total |
|
$ |
971,755 |
|
|
$ |
1,035,582 |
|
Inventory write-down expense was $5.1 million and $11.3 million for 2024 and 2023, respectively, and primarily impacted the Europe Steel Group segment. The inventory write-downs were recorded in cost of goods sold in the consolidated statements of earnings. Inventory write-downs were immaterial for 2022.
NOTE 6. GOODWILL AND OTHER INTANGIBLE ASSETS
Goodwill by reportable segment is detailed in the following table:
|
|
|
|
|
|
|
|
|
|
|
|
|
|
|
|
|
|
|
|
|
|
|
|
|
|
|
|
|
|
|
|
|
|
|
|
|
|
|
| (in thousands) |
|
North America |
|
Europe |
|
North America Steel Group |
|
Europe Steel Group |
|
Emerging Businesses Group |
|
Consolidated |
| Goodwill, gross: |
|
|
|
|
|
|
|
|
|
|
|
|
| Balance, September 1, 2022 |
|
$ |
216,059 |
|
|
$ |
43,115 |
|
|
$ |
— |
|
|
$ |
— |
|
|
$ |
— |
|
|
$ |
259,174 |
|
| Acquisitions |
|
135,382 |
|
|
— |
|
|
— |
|
|
— |
|
|
— |
|
|
135,382 |
|
| Foreign currency translation |
|
— |
|
|
1,446 |
|
|
— |
|
|
— |
|
|
— |
|
|
1,446 |
|
|
|
|
|
|
|
|
|
|
|
|
|
|
| Balance at August 31, 2023 |
|
351,441 |
|
|
44,561 |
|
|
— |
|
|
— |
|
|
— |
|
|
396,002 |
|
| Segment reassignment |
|
(351,441) |
|
|
(44,561) |
|
|
126,915 |
|
|
4,075 |
|
|
265,012 |
|
|
— |
|
Acquisition adjustments(1) |
|
— |
|
|
— |
|
|
— |
|
|
— |
|
|
(1,808) |
|
|
(1,808) |
|
| Foreign currency translation |
|
— |
|
|
— |
|
|
— |
|
|
262 |
|
|
1,364 |
|
|
1,626 |
|
|
|
|
|
|
|
|
|
|
|
|
|
|
| Balance at August 31, 2024 |
|
— |
|
|
— |
|
|
126,915 |
|
|
4,337 |
|
|
264,568 |
|
|
395,820 |
|
|
|
|
|
|
|
|
|
|
|
|
|
|
| Accumulated impairment: |
|
|
|
|
|
|
|
|
|
|
|
|
| Balance, September 1, 2022 |
|
(10,036) |
|
|
(129) |
|
|
— |
|
|
— |
|
|
— |
|
|
(10,165) |
|
| Foreign currency translation |
|
— |
|
|
(16) |
|
|
— |
|
|
— |
|
|
— |
|
|
(16) |
|
|
|
|
|
|
|
|
|
|
|
|
|
|
| Balance at August 31, 2023 |
|
(10,036) |
|
|
(145) |
|
|
— |
|
|
— |
|
|
— |
|
|
(10,181) |
|
| Segment reassignment |
|
10,036 |
|
|
145 |
|
|
(9,542) |
|
|
(146) |
|
|
(493) |
|
|
— |
|
| Foreign currency translation |
|
— |
|
|
— |
|
|
— |
|
|
(9) |
|
|
— |
|
|
(9) |
|
|
|
|
|
|
|
|
|
|
|
|
|
|
| Balance at August 31, 2024 |
|
— |
|
|
— |
|
|
(9,542) |
|
|
(155) |
|
|
(493) |
|
|
(10,190) |
|
|
|
|
|
|
|
|
|
|
|
|
|
|
| Goodwill, net: |
|
|
|
|
|
|
|
|
|
|
|
|
| Balance, September 1, 2022 |
|
206,023 |
|
|
42,986 |
|
|
— |
|
|
— |
|
|
— |
|
|
249,009 |
|
| Acquisitions |
|
135,382 |
|
|
— |
|
|
— |
|
|
— |
|
|
— |
|
|
135,382 |
|
| Foreign currency translation |
|
— |
|
|
1,430 |
|
|
— |
|
|
— |
|
|
— |
|
|
1,430 |
|
| Balance at August 31, 2023 |
|
341,405 |
|
|
44,416 |
|
|
— |
|
|
— |
|
|
— |
|
|
385,821 |
|
| Segment reassignment |
|
(341,405) |
|
|
(44,416) |
|
|
117,373 |
|
|
3,929 |
|
|
264,519 |
|
|
— |
|
Acquisition adjustments(1) |
|
— |
|
|
— |
|
|
— |
|
|
— |
|
|
(1,808) |
|
|
(1,808) |
|
| Foreign currency translation |
|
— |
|
|
— |
|
|
— |
|
|
253 |
|
|
1,364 |
|
|
1,617 |
|
| Balance at August 31, 2024 |
|
$ |
— |
|
|
$ |
— |
|
|
$ |
117,373 |
|
|
$ |
4,182 |
|
|
$ |
264,075 |
|
|
$ |
385,630 |
|
__________________________________
(1) Measurement period adjustments related to the 2023 Acquisitions which impacted the amount of goodwill originally reported.
The Company evaluated impairment indicators for the previous reporting units immediately prior to the change in reportable segments described in Note 1, Nature of Operations and Summary of Significant Accounting Policies, and concluded there were no indicators of impairment. Immediately after the change in reportable segments, the Company performed qualitative assessments for five reporting units consisting of $285.0 million of goodwill and quantitative tests for three reporting units consisting of $100.8 million of goodwill. The results of the qualitative assessments and quantitative tests indicated it was more likely than not that the fair value of all reporting units exceeded their carrying values.
During 2024, 2023 and 2022, the annual goodwill impairment analyses, which are performed as of the first day of the Company's fourth quarter (the "annual impairment test date"), did not result in any impairment charges. For the year ended August 31, 2024, the Company performed qualitative assessments for six reporting units consisting of $271.5 million of goodwill as of the 2024 annual impairment test date and quantitative tests for two reporting units consisting of $71.7 million and $40.7 million of goodwill as of the 2024 annual impairment test date. The results of the qualitative assessments and quantitative tests indicated it was more likely than not that the fair value of all reporting units exceeded their carrying values. The difference in the value of goodwill between the 2024 annual impairment test date and August 31, 2024 was due to the foreign currency translation adjustments.
Other indefinite-lived intangible assets consisted of the following:
|
|
|
|
|
|
|
|
|
|
|
|
|
|
|
| (in thousands) |
|
August 31, 2024 |
|
August 31, 2023 |
| Trade names |
|
$ |
54,531 |
|
|
$ |
54,056 |
|
| In-process research and development |
|
2,400 |
|
|
2,400 |
|
| Non-compete agreements |
|
750 |
|
|
750 |
|
| Total |
|
$ |
57,681 |
|
|
$ |
57,206 |
|
During 2024, 2023 and 2022, the Company did not record any indefinite-lived intangible asset impairment charges. As of the 2024 annual impairment test date, the Company had $57.3 million of indefinite-lived intangible assets, of which $54.1 million were tested for impairment using a quantitative approach. Based on the quantitative tests performed, the Company concluded it was more likely than not that the estimated fair values of the indefinite-lived intangible assets were greater than their respective carrying values. The changes in the balance of intangible assets with indefinite lives from August 31, 2023 to August 31, 2024 and from the 2024 annual impairment test date to August 31, 2024 were due to foreign currency translation adjustments.
Other intangible assets subject to amortization are detailed in the following table:
|
|
|
|
|
|
|
|
|
|
|
|
|
|
|
|
|
|
|
|
|
|
|
|
|
|
|
|
|
|
|
|
|
|
|
|
|
|
|
|
|
| |
|
|
|
August 31, 2024 |
|
August 31, 2023 |
| (in thousands) |
|
|
|
Gross
Carrying Amount |
|
Accumulated Amortization |
|
Net |
|
Gross
Carrying Amount |
|
Accumulated Amortization |
|
Net |
| Developed technologies |
|
|
|
$ |
152,659 |
|
|
$ |
43,540 |
|
|
$ |
109,119 |
|
|
$ |
150,445 |
|
|
$ |
25,228 |
|
|
$ |
125,217 |
|
| Customer relationships |
|
|
|
75,000 |
|
|
16,118 |
|
|
58,882 |
|
|
74,582 |
|
|
7,606 |
|
|
66,976 |
|
| Patents |
|
|
|
7,970 |
|
|
6,595 |
|
|
1,375 |
|
|
7,203 |
|
|
5,570 |
|
|
1,633 |
|
| Perpetual lease rights |
|
|
|
6,404 |
|
|
1,049 |
|
|
5,355 |
|
|
5,984 |
|
|
910 |
|
|
5,074 |
|
| Trade names |
|
|
|
3,413 |
|
|
1,474 |
|
|
1,939 |
|
|
3,287 |
|
|
1,129 |
|
|
2,158 |
|
| Non-compete agreements |
|
|
|
2,300 |
|
|
1,859 |
|
|
441 |
|
|
2,300 |
|
|
1,502 |
|
|
798 |
|
| Other |
|
|
|
224 |
|
|
147 |
|
|
77 |
|
|
224 |
|
|
125 |
|
|
99 |
|
| Total |
|
|
|
$ |
247,970 |
|
|
$ |
70,782 |
|
|
$ |
177,188 |
|
|
$ |
244,025 |
|
|
$ |
42,070 |
|
|
$ |
201,955 |
|
The foreign currency translation adjustments related to the intangible assets subject to amortization were immaterial for all periods presented above.
Amortization expense for intangible assets was $28.3 million, $25.9 million and $10.0 million in 2024, 2023 and 2022, respectively, of which $18.2 million, $18.7 million and $6.4 million, respectively, was recorded in cost of goods sold and the remainder was recorded in SG&A expenses in the consolidated statements of earnings. Estimated amortization expense for the next five years is as follows:
|
|
|
|
|
|
|
|
|
| Year Ended August 31, |
|
(in thousands) |
| 2025 |
|
$ |
26,821 |
|
| 2026 |
|
25,596 |
|
| 2027 |
|
25,499 |
|
| 2028 |
|
23,772 |
|
| 2029 |
|
19,178 |
|
NOTE 7. LEASES
The following table presents the components of the total leased assets and lease liabilities and their classification in the Company's consolidated balance sheets:
|
|
|
|
|
|
|
|
|
|
|
|
|
|
|
|
|
|
|
|
|
| (in thousands) |
|
Classification in Consolidated Balance Sheets |
|
August 31, 2024 |
|
August 31, 2023 |
| Assets: |
|
|
|
|
|
|
| Operating assets |
|
Other noncurrent assets |
|
$ |
178,006 |
|
|
$ |
160,767 |
|
| Finance assets |
|
Property, plant and equipment, net |
|
160,361 |
|
|
104,537 |
|
| Total leased assets |
|
|
|
$ |
338,367 |
|
|
$ |
265,304 |
|
|
|
|
|
|
|
|
| Liabilities: |
|
|
|
|
|
|
| Operating lease liabilities: |
|
|
|
|
|
|
| Current |
|
Accrued expenses and other payables |
|
$ |
36,675 |
|
|
$ |
34,445 |
|
| Long-term |
|
Other noncurrent liabilities |
|
140,109 |
|
|
129,800 |
|
| Total operating lease liabilities |
|
|
|
176,784 |
|
|
164,245 |
|
| Finance lease liabilities: |
|
|
|
|
|
|
| Current |
|
Current maturities of long-term debt and short-term borrowings |
|
36,985 |
|
|
28,037 |
|
| Long-term |
|
Long-term debt |
|
104,286 |
|
|
67,433 |
|
| Total finance lease liabilities |
|
|
|
141,271 |
|
|
95,470 |
|
| Total lease liabilities |
|
|
|
$ |
318,055 |
|
|
$ |
259,715 |
|
The components of lease cost were as follows:
|
|
|
|
|
|
|
|
|
|
|
|
|
|
|
|
|
|
|
|
|
|
|
Year Ended August 31, |
| (in thousands) |
|
2024 |
|
2023 |
|
2022 |
| Operating lease expense |
|
$ |
46,515 |
|
|
$ |
40,093 |
|
|
$ |
35,111 |
|
| Finance lease expense: |
|
|
|
|
|
|
| Amortization of assets |
|
23,825 |
|
|
16,574 |
|
|
13,302 |
|
| Interest on lease liabilities |
|
5,712 |
|
|
3,642 |
|
|
2,105 |
|
| Total finance lease expense |
|
29,537 |
|
|
20,216 |
|
|
15,407 |
|
| Variable and short-term lease expense |
|
19,481 |
|
|
20,810 |
|
|
20,856 |
|
| Total lease expense |
|
$ |
95,533 |
|
|
$ |
81,119 |
|
|
$ |
71,374 |
|
The weighted average remaining lease terms and discount rates for operating and finance leases are presented in the following table:
|
|
|
|
|
|
|
|
|
|
|
|
|
|
|
|
|
August 31, 2024 |
|
August 31, 2023 |
| Weighted average remaining lease term (years): |
|
|
|
|
| Operating leases |
|
6.2 |
|
5.6 |
| Finance leases |
|
4.1 |
|
4.1 |
|
|
|
|
|
| Weighted average discount rate: |
|
|
|
|
| Operating leases |
|
4.934 |
% |
|
4.730 |
% |
| Finance leases |
|
5.134 |
% |
|
4.926 |
% |
Cash flow and other information related to leases is included in the following table:
|
|
|
|
|
|
|
|
|
|
|
|
|
|
|
|
|
|
|
|
|
|
|
Year Ended August 31, |
| (in thousands) |
|
2024 |
|
2023 |
|
2022 |
| Cash paid for amounts included in the measurement of lease liabilities: |
|
|
|
|
|
|
| Operating cash outflows from operating leases |
|
$ |
47,508 |
|
|
$ |
40,645 |
|
|
$ |
35,697 |
|
| Operating cash outflows from finance leases |
|
5,712 |
|
|
3,642 |
|
|
2,093 |
|
| Financing cash outflows from finance leases |
|
34,508 |
|
|
22,837 |
|
|
17,821 |
|
|
|
|
|
|
|
|
| ROU assets obtained in exchange for lease obligations: |
|
|
|
|
|
|
| Operating leases |
|
$ |
57,746 |
|
|
$ |
55,588 |
|
|
$ |
59,035 |
|
| Finance leases |
|
79,841 |
|
|
59,499 |
|
|
24,333 |
|
Future maturities of lease liabilities at August 31, 2024 are presented in the following table:
|
|
|
|
|
|
|
|
|
|
|
|
|
|
|
| (in thousands) |
|
Operating Leases |
|
Finance Leases |
| 2025 |
|
$ |
44,856 |
|
|
$ |
43,376 |
|
| 2026 |
|
40,369 |
|
|
36,953 |
|
| 2027 |
|
33,391 |
|
|
33,836 |
|
| 2028 |
|
24,992 |
|
|
27,198 |
|
| 2029 |
|
16,542 |
|
|
12,771 |
|
| Thereafter |
|
49,492 |
|
|
3,264 |
|
| Total lease payments |
|
209,642 |
|
|
157,398 |
|
| Less imputed interest |
|
(32,858) |
|
|
(16,127) |
|
| Present value of lease liabilities |
|
$ |
176,784 |
|
|
$ |
141,271 |
|
As of August 31, 2024, the Company has additional leases that have not yet commenced, primarily for vehicles, with aggregate fixed payments over their terms of approximately $18.1 million to commence in 2025. These leases have noncancellable terms of 5 to 12 years.
NOTE 8. CREDIT ARRANGEMENTS
Long-term debt was as follows:
|
|
|
|
|
|
|
|
|
|
|
|
|
|
|
|
|
|
|
|
|
|
|
Weighted Average Interest Rate as of August 31, 2024 |
|
Year Ended August 31, |
| (in thousands) |
|
|
2024 |
|
2023 |
| 2030 Notes |
|
4.125% |
|
$ |
300,000 |
|
|
$ |
300,000 |
|
| 2031 Notes |
|
3.875% |
|
300,000 |
|
|
300,000 |
|
| 2032 Notes |
|
4.375% |
|
300,000 |
|
|
300,000 |
|
| Series 2022 Bonds, due 2047 |
|
4.000% |
|
145,060 |
|
|
145,060 |
|
|
|
|
|
|
|
|
|
|
|
|
|
|
|
|
|
|
|
|
|
|
| Short-term borrowings |
|
(1) |
|
— |
|
|
8,419 |
|
| Other |
|
5.100% |
|
11,910 |
|
|
16,042 |
|
| Finance leases |
|
5.134% |
|
141,271 |
|
|
95,470 |
|
| Total debt |
|
|
|
1,198,241 |
|
|
1,164,991 |
|
| Less unamortized debt issuance costs |
|
|
|
(13,073) |
|
|
(14,840) |
|
| Plus unamortized bond premium |
|
|
|
4,453 |
|
|
4,646 |
|
| Total amounts outstanding |
|
|
|
1,189,621 |
|
|
1,154,797 |
|
| Less current maturities of long-term debt and short-term borrowings |
|
|
|
(38,786) |
|
|
(40,513) |
|
| Long-term debt |
|
|
|
$ |
1,150,835 |
|
|
$ |
1,114,284 |
|
__________________________________
(1) The weighted average interest rate of short-term borrowings was 6.790% and 7.800% as of August 31, 2024 and 2023, respectively.
Senior Notes
In January 2022, the Company issued $300.0 million of 4.125% Senior Notes due January 2030 (the "2030 Notes") and $300.0 million of 4.375% Senior Notes due March 2032 (the "2032 Notes"). Aggregate issuance costs associated with the 2030 Notes and 2032 Notes were approximately $9.4 million. Interest on the 2030 Notes is payable semiannually on January 15 and July 15. Interest on the 2032 Notes is payable semiannually on March 15 and September 15.
In February 2021, the Company issued $300.0 million of 3.875% Senior Notes due February 2031 (the "2031 Notes") and accepted for purchase all of the previously outstanding $350.0 million of 5.750% Senior Notes due April 2026 (the "2026 Notes") through a cash tender offer. Interest on the 2031 Notes is payable semiannually on February 15 and August 15.
Series 2022 Bonds
In February 2022, the Company announced the issuance of $145.1 million in original aggregate principal amount of tax-exempt bonds (the "Series 2022 Bonds") by the Industrial Development Authority of the County of Maricopa (the "MCIDA"). The Series 2022 Bonds were priced to yield 3.5% and provided gross proceeds of $150.0 million. The proceeds were loaned to the Company pursuant to a loan agreement between the Company and the MCIDA and were used to fund a portion of the acquisition, construction and equipping of the Company’s third micro mill.
Issuance costs associated with the Series 2022 Bonds were $3.1 million. The Series 2022 Bonds accrue interest at 4.0%, payable semiannually on April 15 and October 15, and have a maturity date in October 2047.
Credit Facilities
The Company has a $600.0 million revolving credit facility (the "Revolver"), pursuant to the Sixth Amended and Restated Credit Agreement (as amended, the "Credit Agreement"). The Credit Agreement has a maturity date in October 2027. The maximum availability under the Revolver can be increased to $850.0 million with bank approval. The Credit Agreement also provided for a delayed draw senior secured term loan facility with a maximum principal amount of $200.0 million, which expired undrawn in October 2023, in accordance with its terms. The Company had no amounts drawn under the Revolver at August 31, 2024 or 2023. The Company's obligations under the Credit Agreement are secured by its U.S.-domiciled inventory. The Credit Agreement's capacity includes a $50.0 million sub-limit for the issuance of stand-by letters of credit. The availability under the Revolver was reduced by outstanding stand-by letters of credit of $0.9 million at August 31, 2024 and 2023.
Under the Credit Agreement, the Company is required to comply with certain covenants, including covenants to maintain: (i) an interest coverage ratio (consolidated EBITDA to consolidated interest expense, as each is defined in the Credit Agreement) of not less than 2.50 to 1.00 and (ii) a debt to capitalization ratio (consolidated funded debt to total capitalization, as each is defined in the Credit Agreement) that does not exceed 0.60 to 1.00. Loans under the Credit Agreement bear interest based on the Eurocurrency rate, a base rate, or the Secured Overnight Financing Rate ("SOFR"). At August 31, 2024, the Company was in compliance with all financial covenants contained in its credit arrangements. At August 31, 2024, the Company's interest coverage ratio was 20.37 to 1.00 and the Company's debt to capitalization ratio was 0.22 to 1.00.
The Company also has credit facilities in Poland, through its subsidiary, CMC Poland Sp. z.o.o. ("CMCP"), available to support working capital, short-term cash needs, letters of credit, financial assurance and other trade finance-related matters. At August 31, 2024 and 2023, CMCP's credit facilities totaled PLN 600.0 million, or $154.8 million and $145.4 million, respectively. The facilities have an expiration date in April 2026. There were no amounts outstanding under these facilities at August 31, 2024 or 2023. The available balance of these credit facilities was reduced by outstanding stand-by letters of credit, guarantees and/or other financial assurance instruments, which totaled $2.4 million and $16.3 million at August 31, 2024 and 2023, respectively.
The scheduled maturities of the Company's long-term debt, excluding obligations related to finance leases, are included in the table below. See Note 7, Leases, for scheduled maturities of finance leases.
|
|
|
|
|
|
|
|
|
| Year Ended August 31, |
|
(in thousands) |
| 2025 |
|
$ |
1,802 |
|
| 2026 |
|
1,789 |
|
| 2027 |
|
1,782 |
|
| 2028 |
|
1,795 |
|
| 2029 |
|
1,806 |
|
| Thereafter |
|
1,047,996 |
|
| Total long-term debt, excluding finance leases |
|
1,056,970 |
|
| Less unamortized debt issuance costs |
|
(13,073) |
|
| Plus unamortized bond premium |
|
4,453 |
|
| Total long-term debt outstanding, excluding finance leases |
|
$ |
1,048,350 |
|
The Company capitalized $5.4 million, $21.5 million and $11.9 million of interest in the cost of property, plant and equipment during 2024, 2023 and 2022, respectively.
Accounts Receivable Facility
The Company's subsidiary in Poland, CMCP, transfers trade accounts receivable to financial institutions without recourse (the "Poland Facility"). The Poland Facility has a facility limit of PLN 288.0 million, or $74.3 million and $69.8 million as of August 31, 2024 and 2023, respectively. Advances taken under the Poland Facility incur interest based on the Warsaw Interbank Offered Rate ("WIBOR") plus a margin. The transfers of receivables under the Poland Facility do not qualify to be accounted for as sales. Therefore, any advances outstanding under this program are recorded as debt on the Company's consolidated balance sheets. The Company had no advance payments outstanding under the Poland Facility at August 31, 2024 compared to PLN 34.7 million, or $8.4 million, at August 31, 2023.
NOTE 9. NEW MARKETS TAX CREDIT TRANSACTIONS
During 2016 and 2017, the Company entered into three New Markets Tax Credit ("NMTC") transactions with U.S. Bancorp Community Development Corporation, a Minnesota corporation ("USBCDC"). The NMTC transactions relate to the construction and equipping of the micro mill in Durant, Oklahoma, as well as a rebar spooler and automated T-post shop located on the same site.
The transactions qualified through the New Markets Tax Credit program provided for in the Community Renewal Tax Relief Act of 2000 (the "NMTC Program"), as the micro mill, spooler and T-post shop are located in an eligible zone designated by the Internal Revenue Service ("IRS") and are considered eligible business activities for the NMTC Program. Under the NMTC Program, an investor that makes a capital investment, which, in turn, together with leverage loan sources, is used to make a Qualifying Equity Investment ("QEI") in an entity that (i) qualifies as a Community Development Entity ("CDE"), (ii) has applied for and been granted an allocation of a portion of the total federal funds available to fund the credits (an "NMTC Allocation") and (iii) uses a minimum specified portion of the QEI to make a Qualified Low Income Community Investment up to the maximum amount of the CDE’s NMTC Allocation will be entitled to claim, over a period of seven years, federal nonrefundable tax credits in an amount equal to 39% of the QEI amount. NMTCs are subject to 100% recapture for a period of seven years as provided in the Internal Revenue Code.
In general, the three NMTC transactions were structured similarly. USBCDC made a capital contribution to an investment fund and Commonwealth Acquisition Holdings, Inc., a wholly-owned subsidiary of the Company (“Commonwealth”), made a loan to the investment fund. The investment fund used the proceeds from the capital contribution and the loan to make a QEI into a CDE, which, in turn, makes loans of the QEIs to the operating subsidiaries of the Company with terms similar to the loans by Commonwealth.
The following table summarizes the key terms and conditions for each of the three NMTC transactions ($ in millions):
|
|
|
|
|
|
|
|
|
|
|
|
|
|
|
|
|
|
|
|
|
|
|
|
|
|
|
|
|
|
|
|
|
|
|
|
|
|
|
|
|
| Project |
|
USBCDC Capital Contribution |
|
Commonwealth Loan |
|
Commonwealth Loan Rate / Maturity |
|
Investment Fund(s) |
|
QEI to CDE |
|
CDE Loan |
|
|
Micro mill(1) |
|
$17.7 |
|
$35.3 |
|
1.08% / December 24, 2045 |
|
USBCDC Investment Fund 156, LLC |
|
$51.5 |
|
$50.7 |
|
|
Spooler(1) |
|
6.7 |
|
14.0 |
|
1.39% / July 26, 2042 |
|
Twain Investment Fund 249, LLC |
|
20.0 |
|
19.4 |
|
|
| T-post shop |
|
5.0 |
|
10.4 |
|
1.16% / March 23, 2047 |
|
Twain Investment Fund 219, LLC
Twain Investment Fund 222, LLC |
|
15.0 |
|
14.7 |
|
|
__________________________________
(1) The Exercise Period (as defined below) on USBCDC Investment Fund 156, LLC and Twain Investment Fund 249, LLC ended in 2023 and 2024, respectively.
By its capital contributions to the investment funds (exclusive of Twain Investment Fund 222) (collectively, the "Funds"), USBCDC is entitled to substantially all the benefits derived from the NMTCs. These transactions include a put/call provision whereby the Company may be obligated or entitled to repurchase USBCDC’s interest in the Funds at the end of a seven-year period, in the case of USBCDC Investment Fund 156, LLC and Twain Investment Fund 249, LLC or an eight-year period, in the case of Twain Investment Fund 219, LLC (each of such periods, an "Exercise Period").
In December 2022, the Exercise Period on the first NMTC transaction, USBCDC Investment Fund 156, ended, and the corresponding $17.7 million USBCDC capital contribution was recognized in net sales in the consolidated statement of earnings. As of August 31, 2023, the remaining $6.7 million and $2.8 million of USBCDC’s contributions, which represented deferred revenue to the Company, were included in accrued expenses and other payables and other noncurrent liabilities, respectively, in the consolidated balance sheet. In July 2024, the Exercise Period on Twain Investment Fund 249 ended, and the corresponding $6.7 million USBCDC capital contribution was recognized in net sales in the consolidated statement of earnings. The Exercise Period on Twain Investment Fund 219 will end during March 2025, and therefore, the corresponding $2.8 million USBCDC capital contribution was reclassified to accrued expenses and other payables in the Company's consolidated balance sheet as of August 31, 2024.
Additionally, the $2.2 million of capital contributions to Twain Investment Fund 222 resulted in a $2.1 million QEI, which was classified as current maturities of long-term debt and short-term borrowings in the consolidated balance sheet as of August 31, 2023. The Company repaid the outstanding QEI at maturity in March 2024.
The Company believes USBCDC will exercise the put option following the end of the remaining Exercise Period for Twain Investment Fund 219. The value attributed to the put/call is immaterial. The Company is required to follow various regulations and contractual provisions that apply to the NMTC transactions. Non-compliance with applicable requirements could result in unrealized projected tax benefits and, therefore, could require the Company to indemnify USBCDC for any loss or recapture of NMTCs related to the financing until the Company's obligation to deliver tax benefits is relieved. The Company does not anticipate any credit recaptures will be required in connection with these transactions. The Company has determined that the Funds are VIEs, of which the Company is the primary beneficiary and has consolidated them in accordance with ASC Topic 810, Consolidation.
Direct costs incurred in structuring the transactions were deferred and are recognized as expense over each Exercise Period. Incremental costs to maintain the structures during the compliance periods are recognized as incurred.
NOTE 10. DERIVATIVES
The Company's global operations and product lines expose it to risks from fluctuations in metal commodity prices, foreign currency exchange rates, interest rates and natural gas, electricity and other energy prices. One objective of the Company's risk management program is to mitigate these risks using derivative instruments. The Company enters into (i) metal commodity futures and forward contracts to mitigate the risk of unanticipated changes in net earnings due to price volatility in these commodities, (ii) foreign currency forward contracts that match the expected settlements for purchases and sales denominated in foreign currencies and (iii) natural gas and electricity commodity derivatives to mitigate the risk related to price volatility of these commodities.
The Company designates only those contracts which closely match the terms of the underlying transaction as hedges for accounting purposes. Certain foreign currency and commodity contracts were not designated as hedges for accounting purposes, although management believes they are essential economic hedges.
The Company considers the total notional value of its futures and forward contracts as the best measure of the volume of derivative transactions. At August 31, 2024 and 2023, the notional values of the Company's commodity contract commitments were $480.1 million and $456.4 million, respectively. At August 31, 2024 and 2023, the notional values of the Company's foreign currency contract commitments were $225.1 million and $221.4 million, respectively.
The following table provides information regarding the Company's commodity contract commitments as of August 31, 2024:
|
|
|
|
|
|
|
|
|
|
|
|
|
|
|
|
|
|
|
|
|
| Commodity |
|
Position |
|
Total |
| Aluminum |
|
Long |
|
1,225 |
|
|
MT |
|
|
|
|
|
|
|
| Copper |
|
Long |
|
624 |
|
|
MT |
| Copper |
|
Short |
|
9,321 |
|
|
MT |
| Electricity |
|
Long |
|
3,112,000 |
|
|
MW(h) |
| Natural Gas |
|
Long |
|
5,190,700 |
|
|
MMBtu |
__________________________________
MT = Metric ton
MW(h) = Megawatt hour
MMBtu = Metric Million British thermal unit
The following table summarizes the location and amounts of the fair value of the Company's derivative instruments reported in the consolidated balance sheets:
|
|
|
|
|
|
|
|
|
|
|
|
|
|
|
|
|
|
|
|
|
| (in thousands) |
|
Primary Location |
|
August 31, 2024 |
|
August 31, 2023 |
| Derivative assets: |
|
|
|
|
|
|
| Commodity |
|
Prepaid and other current assets |
|
$ |
9,823 |
|
|
$ |
11,427 |
|
| Commodity |
|
Other noncurrent assets |
|
30,402 |
|
|
184,261 |
|
| Foreign exchange |
|
Prepaid and other current assets |
|
419 |
|
|
1,898 |
|
| Derivative liabilities: |
|
|
|
|
|
|
| Commodity |
|
Accrued expenses and other payables |
|
$ |
3,445 |
|
|
$ |
2,983 |
|
| Commodity |
|
Other noncurrent liabilities |
|
157 |
|
|
1,085 |
|
| Foreign exchange |
|
Accrued expenses and other payables |
|
1,885 |
|
|
2,566 |
|
The decrease in fair value of the Company's commodity derivatives reported within other noncurrent assets is primarily due to the decrease in the value of a significant input used to measure the fair value of the Company's Level 3 commodity derivatives at August 31, 2024 as compared to August 31, 2023. See Note 11, Fair Value, for further discussion of the measurement of the fair value of the Company's Level 3 commodity derivatives.
The following table summarizes activities related to the Company's derivatives not designated as hedging instruments recognized in the consolidated statements of earnings. All other activity related to the Company's derivatives not designated as hedging instruments was immaterial for the periods presented.
|
|
|
|
|
|
|
|
|
|
|
|
|
|
|
|
|
|
|
|
|
|
|
|
|
|
|
|
|
|
|
Year Ended August 31, |
| Gain (Loss) on Derivatives Not Designated as Hedging Instruments (in thousands) |
|
Primary Location |
|
2024 |
|
2023 |
|
2022 |
| Commodity |
|
Cost of goods sold |
|
$ |
(10,195) |
|
|
$ |
(3,028) |
|
|
$ |
15,862 |
|
| Foreign exchange |
|
SG&A expenses |
|
6,974 |
|
|
12,265 |
|
|
(6,547) |
|
The following table summarizes activities related to the Company's derivatives designated as cash flow hedging instruments recognized in the consolidated statements of comprehensive income and consolidated statements of earnings. Amounts presented do not include the effects of foreign currency translation adjustments.
|
|
|
|
|
|
|
|
|
|
|
|
|
|
|
|
|
|
|
|
|
| Effective Portion of Derivatives Designated as Cash Flow Hedging Instruments Gain (Loss) Recognized in OCI, Net of Income Taxes (in thousands) |
|
Year Ended August 31, |
|
2024 |
|
2023 |
|
2022 |
| Commodity |
|
$ |
(129,709) |
|
|
$ |
6,367 |
|
|
$ |
138,534 |
|
| Foreign exchange |
|
31 |
|
|
28 |
|
|
100 |
|
|
|
|
|
|
|
|
|
|
|
|
|
|
|
|
|
|
|
|
|
|
|
|
|
|
|
|
| Gain on Derivatives Designated as Cash Flow Hedging Instruments Reclassified from AOCI into Net Earnings (in thousands) |
|
|
|
Year Ended August 31, |
|
Primary Location |
|
2024 |
|
2023 |
|
2022 |
| Commodity |
|
Cost of goods sold |
|
$ |
2,031 |
|
|
$ |
11,325 |
|
|
$ |
27,267 |
|
| Foreign exchange |
|
SG&A expenses |
|
250 |
|
|
244 |
|
|
244 |
|
The Company's natural gas commodity derivatives accounted for as cash flow hedging instruments have maturities extending to August 2027. The Company's electricity commodity derivatives accounted for as cash flow hedging instruments have maturities extending to December 2034. Included in the AOCI balance as of August 31, 2024 was an estimated net gain of $4.8 million from cash flow hedging instruments that is expected to be reclassified into net earnings within the twelve months following August 31, 2024. Cash flows associated with the cash flow hedging instruments are recorded as a component of cash flows from operating activities in the consolidated statements of cash flows. See Note 11, Fair Value, for the fair value of the Company's derivative instruments recorded in the consolidated balance sheets.
NOTE 11. FAIR VALUE
The Company has established a fair value hierarchy which prioritizes the inputs to the valuation techniques used to measure fair value into three levels. These levels are determined based on the lowest level input that is significant to the fair value measurement. See Note 1, Nature of Operations and Summary of Significant Accounting Policies, for definitions of the three levels within the hierarchy.
The Company presents the fair value of its derivative contracts on a net-by-counterparty basis when a legal right to offset exists under an enforceable netting agreement. The following tables summarize information regarding the Company's financial assets and financial liabilities that were measured at fair value on a recurring basis:
|
|
|
|
|
|
|
|
|
|
|
|
|
|
|
|
|
|
|
|
|
|
|
|
|
|
|
| |
|
|
|
Fair Value Measurements at Reporting Date Using |
| (in thousands) |
|
Total |
|
Quoted Prices in
Active Markets for
Identical Assets
(Level 1) |
|
Significant Other
Observable Inputs
(Level 2) |
|
Significant
Unobservable Inputs
(Level 3) |
As of August 31, 2024: |
|
|
|
|
|
|
|
|
| Assets: |
|
|
|
|
|
|
|
|
Investment deposit accounts(1) |
|
$ |
718,110 |
|
|
$ |
718,110 |
|
|
$ |
— |
|
|
$ |
— |
|
Commodity derivative assets(2) |
|
40,225 |
|
|
2,196 |
|
|
— |
|
|
38,029 |
|
Foreign exchange derivative assets(2) |
|
419 |
|
|
— |
|
|
419 |
|
|
— |
|
| Liabilities: |
|
|
|
|
|
|
|
|
Commodity derivative liabilities(2) |
|
3,602 |
|
|
3,602 |
|
|
— |
|
|
— |
|
Foreign exchange derivative liabilities(2) |
|
1,885 |
|
|
— |
|
|
1,885 |
|
|
— |
|
|
|
|
|
|
|
|
|
|
As of August 31, 2023: |
|
|
|
|
|
|
|
|
| Assets: |
|
|
|
|
|
|
|
|
Investment deposit accounts(1) |
|
$ |
508,227 |
|
|
$ |
508,227 |
|
|
$ |
— |
|
|
$ |
— |
|
Commodity derivative assets(2) |
|
195,689 |
|
|
1,264 |
|
|
— |
|
|
194,425 |
|
Foreign exchange derivative assets(2) |
|
1,898 |
|
|
— |
|
|
1,898 |
|
|
— |
|
| Liabilities: |
|
|
|
|
|
|
|
|
Commodity derivative liabilities(2) |
|
4,068 |
|
|
4,068 |
|
|
— |
|
|
— |
|
Foreign exchange derivative liabilities(2) |
|
2,566 |
|
|
— |
|
|
2,566 |
|
|
— |
|
__________________________________
(1) Investment deposit accounts are short-term in nature, and the value is determined by principal plus interest. The investment portfolio mix can change each period based on the Company's assessment of investment options.
(2) Derivative assets and liabilities classified as Level 1 are commodity futures contracts valued based on quoted market prices in the London Metal Exchange or the New York Mercantile Exchange. Amounts in Level 2 are based on broker quotes in the over-the-counter market. Derivatives classified as Level 3 are described below. Further discussion regarding the Company's use of derivative instruments is included in Note 10, Derivatives.
As of August 31, 2022, the Company had one Level 3 commodity derivative. The Company entered into its second and third Level 3 commodity derivatives in September 2022 and January 2023, respectively, with the same counterparty as the first Level 3 commodity derivative. Both the second and third Level 3 commodity derivatives will begin to settle in January 2025.
The fair value estimate of the Level 3 commodity derivatives are based on internally developed discounted cash flow models primarily utilizing unobservable inputs in which there is little or no market data. The Company forecasts future energy rates using a range of historical prices (the "floating rate"), which is the only significant unobservable input used in the Company's discounted cash flow models. Significantly higher or lower floating rates could have resulted in a material difference in the fair value measurement. The following table summarizes the range of floating rates used to measure the fair value of the Level 3 commodity derivatives at August 31, 2024 and 2023, which are applied uniformly across each of our Level 3 commodity derivatives:
|
|
|
|
|
|
|
|
|
|
|
|
|
|
|
|
|
|
|
|
|
|
|
Floating Rate (PLN) |
|
|
Low |
|
High |
|
Average |
| August 31, 2024 |
|
324 |
|
|
510 |
|
|
405 |
|
| August 31, 2023 |
|
480 |
|
|
855 |
|
|
630 |
|
Below is a reconciliation of the beginning and ending balances of the Level 3 commodity derivatives recognized in the consolidated statements of comprehensive income. Amounts presented are before income taxes. The fluctuation in energy rates over time may cause volatility in the fair value estimate and is the primary reason for the unrealized gains and losses in OCI in 2024, 2023 and 2022.
|
|
|
|
|
|
|
|
|
| (in thousands) |
|
Level 3 Commodity Derivatives |
| Balance, September 1, 2021 |
|
$ |
26,413 |
|
Unrealized holding gain before reclassification(1) |
|
138,760 |
|
Reclassification for gain included in net earnings(2) |
|
(21,673) |
|
| Balance at August 31, 2022 |
|
143,500 |
|
|
|
|
|
|
|
Unrealized holding gain before reclassification(1) |
|
62,706 |
|
Reclassification for gain included in net earnings(2) |
|
(11,781) |
|
| Balance at August 31, 2023 |
|
194,425 |
|
|
|
|
Unrealized holding loss before reclassification(1) |
|
(148,533) |
|
Reclassification for gain included in net earnings(2) |
|
(7,863) |
|
| Balance at August 31, 2024 |
|
$ |
38,029 |
|
__________________________________
(1) Unrealized holding gain (loss), net of foreign currency translation, less amounts reclassified are included in net unrealized holding gain (loss) on derivatives in the consolidated statements of comprehensive income.
(2) Gains included in net earnings are recorded in cost of goods sold in the consolidated statements of earnings.
During the fourth quarter of 2024, the Company committed to a plan to sell a rebar fabrication facility within the North America Steel Group segment and determined that the disposal group met the criteria to be classified as held for sale. Accordingly, the Company classified $17.5 million of assets and $4.1 million of liabilities as held for sale within the Company's consolidated balance sheet as of August 31, 2024. The liabilities held for sale are recorded within accrued expenses and other payables. Upon concluding that the disposal group met the held for sale criteria, the Company recorded an impairment charge of $6.6 million to record the disposal group at the lower of its carrying value or fair value less costs to sell. The Company determined the fair value of the disposal group using a Level 2 input, based on a quoted price in an inactive market. There were no other material non-recurring fair value remeasurements in 2024 or 2023.
The carrying values of the Company's short-term items, including documentary letters of credit and notes payable, approximate fair value.
The carrying value and fair value of the Company's long-term debt, including current maturities, excluding other borrowings and finance leases, was $1.0 billion and $962.8 million, respectively, at August 31, 2024, and $1.0 billion and $900.9 million, respectively, at August 31, 2023. The Company estimates these fair values based on Level 2 of the fair value hierarchy using indicated market values. The Company's other borrowings contain variable interest rates, and as a result, their carrying values approximate fair values.
NOTE 12. INCOME TAX
The components of earnings before income taxes were as follows:
|
|
|
|
|
|
|
|
|
|
|
|
|
|
|
|
|
|
|
|
|
| |
|
Year Ended August 31, |
| (in thousands) |
|
2024 |
|
2023 |
|
2022 |
| United States |
|
$ |
631,592 |
|
|
$ |
1,095,099 |
|
|
$ |
1,197,769 |
|
| Foreign |
|
4,079 |
|
|
26,868 |
|
|
317,378 |
|
| Total |
|
$ |
635,671 |
|
|
$ |
1,121,967 |
|
|
$ |
1,515,147 |
|
The income taxes (benefit) included in the consolidated statements of earnings were as follows:
|
|
|
|
|
|
|
|
|
|
|
|
|
|
|
|
|
|
|
|
|
| |
|
Year Ended August 31, |
| (in thousands) |
|
2024 |
|
2023 |
|
2022 |
| Current: |
|
|
|
|
|
|
| United States |
|
$ |
143,462 |
|
|
$ |
168,399 |
|
|
$ |
122,334 |
|
| Foreign |
|
163 |
|
|
6,089 |
|
|
63,912 |
|
| State and local |
|
18,035 |
|
|
32,916 |
|
|
20,228 |
|
| Current taxes |
|
161,660 |
|
|
207,404 |
|
|
206,474 |
|
| Deferred: |
|
|
|
|
|
|
| United States |
|
(8,075) |
|
|
46,008 |
|
|
81,162 |
|
| Foreign |
|
(7,684) |
|
|
(847) |
|
|
(3,388) |
|
| State and local |
|
4,279 |
|
|
9,642 |
|
|
13,637 |
|
| Deferred taxes |
|
(11,480) |
|
|
54,803 |
|
|
91,411 |
|
| Total income taxes |
|
$ |
150,180 |
|
|
$ |
262,207 |
|
|
$ |
297,885 |
|
|
|
|
|
|
|
|
|
|
|
|
|
|
|
A reconciliation of the federal statutory rate to the Company's effective income tax rate, including material items impacting the effective income tax rate, is as follows:
|
|
|
|
|
|
|
|
|
|
|
|
|
|
|
|
|
|
|
|
|
| |
|
Year Ended August 31, |
| (in thousands) |
|
2024 |
|
2023 |
|
2022 |
| Income tax expense at statutory rate |
|
$ |
133,491 |
|
$ |
235,613 |
|
$ |
318,181 |
State and local taxes(1) |
|
17,629 |
|
33,621 |
|
26,753 |
Research and development credit(1) |
|
(1,151) |
|
(7,986) |
|
(13,102) |
|
|
|
|
|
|
|
|
|
|
|
|
|
|
|
|
|
|
|
|
|
Capital loss(2) |
|
— |
|
— |
|
(34,736) |
|
|
|
|
|
|
|
| Other |
|
211 |
|
959 |
|
789 |
| Income tax expense |
|
$ |
150,180 |
|
$ |
262,207 |
|
$ |
297,885 |
| Effective income tax rate |
|
23.6 |
% |
|
23.4 |
% |
|
19.7 |
% |
__________________________________
(1) 2024, 2023 and 2022 include impacts of uncertain tax positions.
(2) Resulted from a tax restructuring transaction.
The Company plans to repatriate the current and future earnings from the Europe Steel Group segment and certain immaterial foreign jurisdictions in the Emerging Business Group segment and has recorded an immaterial amount of tax expense related to such earnings. The Company considers the undistributed earnings of the Europe Steel Group segment prior to August 31, 2019 and all other undistributed earnings of the Emerging Business Group segment to be indefinitely reinvested and has not recorded deferred tax liabilities on such earnings.
The income tax effects of significant temporary differences giving rise to deferred tax assets and liabilities were as follows:
|
|
|
|
|
|
|
|
|
|
|
|
|
|
|
| |
|
August 31, |
| (in thousands) |
|
2024 |
|
2023 |
| Deferred tax assets: |
|
|
|
|
| Net operating losses and credits |
|
$ |
278,855 |
|
|
$ |
298,624 |
|
| Capitalized research and development |
|
57,597 |
|
|
45,669 |
|
| ROU operating lease liabilities |
|
41,838 |
|
|
39,984 |
|
| Deferred compensation and employee benefits |
|
32,377 |
|
|
33,491 |
|
| Reserves and other accrued expenses |
|
13,839 |
|
|
16,510 |
|
| Other |
|
19,122 |
|
|
21,750 |
|
| Total deferred tax assets |
|
443,628 |
|
|
456,028 |
|
| Valuation allowance for deferred tax assets |
|
(256,826) |
|
|
(280,463) |
|
| Deferred tax assets, net |
|
186,802 |
|
|
175,565 |
|
| Deferred tax liabilities: |
|
|
|
|
| Property, plant and equipment |
|
(353,439) |
|
|
(351,900) |
|
| Intangible assets |
|
(37,233) |
|
|
(44,168) |
|
| ROU operating lease assets |
|
(41,463) |
|
|
(38,801) |
|
| Derivatives |
|
(6,850) |
|
|
(35,992) |
|
| Other |
|
(13,093) |
|
|
(11,453) |
|
| Total deferred tax liabilities |
|
(452,078) |
|
|
(482,314) |
|
| Net deferred tax liabilities |
|
$ |
(265,276) |
|
|
$ |
(306,749) |
|
Net operating losses giving rise to deferred tax assets consist of $299.4 million of state net operating losses and $923.3 million of foreign net operating losses that expire in varying amounts beginning in 2025 (with certain amounts having indefinite carryforward periods). These assets will be reduced as income tax expense is recognized in future periods.
The Company maintains a valuation allowance to reduce certain deferred tax assets to amounts that are more likely than not to be realized. The Company's valuation allowances primarily relate to net operating loss and credit carryforwards in certain state and foreign jurisdictions for which utilization is uncertain.
A reconciliation of the beginning and ending amounts of unrecognized income tax benefits is as follows:
|
|
|
|
|
|
|
|
|
|
|
|
|
|
|
|
|
|
|
|
|
| (in thousands) |
|
2024 |
|
2023 |
|
2022 |
| Balance at September 1, |
|
$ |
44,165 |
|
|
$ |
29,747 |
|
|
$ |
5,531 |
|
|
|
|
|
|
|
|
| Change for tax positions of current year |
|
— |
|
|
14,792 |
|
|
17,461 |
|
| Change for tax positions of prior years |
|
1,556 |
|
|
(374) |
|
|
6,755 |
|
|
|
|
|
|
|
|
Balance at August 31, (1) |
|
$ |
45,721 |
|
|
$ |
44,165 |
|
|
$ |
29,747 |
|
__________________________________
(1) The full balance of unrecognized income tax benefits in each year, if recognized, would have impacted the Company’s effective income tax rate at the end of each respective year.
At August 31, 2024 and 2023, the Company had accrued interest and penalties related to uncertain tax positions of $4.1 million and $1.4 million, respectively.
During 2025, the Company anticipates the statute of limitations relating to positions of the Company in prior year income tax returns may lapse. As a result, it is reasonably possible that the amount of unrecognized tax benefits may decrease by $9.5 million.
The Company files income tax returns in the U.S. and multiple foreign jurisdictions with varying statutes of limitations. In the normal course of business, the Company and its subsidiaries are subject to examination by various taxing authorities. The following is a summary of all fiscal years that are open to examination.
U.S. Federal — 2021 and forward
U.S. States — 2020 and forward
Foreign — 2019 and forward
NOTE 13. STOCK-BASED COMPENSATION PLANS
The Company's stock-based compensation plans provide for the issuance of incentive and nonqualified stock options, restricted stock awards and performance-based awards. The Compensation Committee of the Board (the "Compensation Committee") approves all awards that are granted under the Company's stock-based compensation plans. Stock-based compensation expense for 2024, 2023 and 2022 of $45.1 million, $60.5 million and $47.0 million, respectively, was primarily included in SG&A expenses on the Company's consolidated statements of earnings. Total tax benefits recognized in the consolidated statements of earnings related to stock-based compensation expense were $10.6 million, $14.2 million and $9.3 million for the years ended August 31, 2024, 2023 and 2022, respectively. As of August 31, 2024, total unrecognized compensation cost related to unvested stock-based compensation arrangements was $21.3 million, which is expected to be recognized over a weighted average period of 1.8 years.
Restricted Stock Units
Restricted stock units issued under the Company's stock-based compensation plans may not be sold, transferred, pledged or assigned until service-based restrictions lapse. The restricted stock units generally vest and are converted to shares of the Company's common stock in three equal installments on each of the first three anniversaries of the date of grant. Generally, upon termination of employment, restricted stock units that have not vested are forfeited. Other than awards granted to certain executives, which continue to vest following qualifying retirement, a pro-rata portion of the unvested restricted stock awarded will vest and become payable upon death, disability or qualifying retirement.
The estimated fair value of the restricted stock units is based on the closing price of the Company's common stock on the date of grant, discounted for the expected dividend yield through the vesting period. Compensation cost related to the restricted stock units is recognized ratably over the service period and is included in equity on the Company's consolidated balance sheets.
Performance Stock Units
Performance stock units issued under the Company's stock-based compensation plans may not be sold, transferred, pledged or assigned until service-based restrictions lapse and any performance objectives have been attained as established by the Compensation Committee. Performance stock units have a three-year performance period that includes the fiscal year in which the awards were granted and the succeeding two fiscal years (the "performance period"). Recipients of these awards generally must be actively employed by and providing services to the Company on the last day of the performance period in order to receive an award payout. Generally, upon termination of employment, performance stock units that have not vested are forfeited. Other than awards granted to certain executives, which continue to vest following qualifying retirement, a pro-rata portion of the performance stock units will vest and become payable at the end of the performance period upon death, disability or qualifying retirement.
Compensation cost for performance stock units is accrued based on the probable outcome of specified performance conditions, net of estimated forfeitures. The Company accrues compensation cost if it is probable that the performance conditions will be met. The Company reassesses the probability of meeting the specified performance conditions at the end of each reporting period and adjusts compensation cost, as necessary, based on the probability of achieving the performance conditions. If the performance conditions are not met at the end of the performance period, the Company reverses the related compensation cost.
Performance stock units awarded will be settled in shares of the Company's common stock. Award payouts range from a threshold of 50% to a maximum of 200% for each portion of the target awards. The fair value of these performance stock units is remeasured each reporting period and is recognized ratably over the performance period. Performance targets established by the Compensation Committee for performance stock units were weighted 75% based on the Company's cumulative EBITDA targets and positive return on invested capital during the performance period, as approved by the Board in the respective year's business plan, and 25% based on a three-year relative total stockholder return metric. The performance stock units associated with the Company's cumulative EBITDA targets and positive return on invested capital were classified as liability awards on the date of grant and are included in accrued expenses and other payables on the Company's consolidated balance sheets until the start of the third year within the performance period.
Upon entering the third year within the performance period when the final EBITDA target is set, the liability awards are reclassified as equity awards. The performance stock units associated with the total stockholder return metric were included in equity on the Company's consolidated balance sheets on the date of grant and were valued at fair value using the Monte Carlo pricing model.
The following table summarizes the total liability awards and equity awards granted:
|
|
|
|
|
|
|
|
|
|
|
|
|
|
|
|
|
|
|
|
|
Restricted Stock
Awards/Units |
|
Performance
Awards |
| 2022 grants |
|
|
|
652,951 |
|
|
328,734 |
|
| 2023 grants |
|
|
|
633,898 |
|
|
335,746 |
|
| 2024 grants |
|
|
|
524,943 |
|
|
244,931 |
|
As of August 31, 2024, the Company had 3,145,024 shares of common stock available for future grants.
Information for restricted stock units and performance stock units accounted for as equity awards is as follows:
|
|
|
|
|
|
|
|
|
|
|
|
|
|
|
|
|
Number |
|
Weighted Average
Fair Value |
| Outstanding as of August 31, 2021 |
|
2,190,795 |
|
|
$ |
20.67 |
|
Granted(1) |
|
1,466,628 |
|
|
28.16 |
|
| Vested |
|
(1,617,943) |
|
|
18.84 |
|
| Forfeited |
|
(45,850) |
|
|
23.57 |
|
| Outstanding as of August 31, 2022 |
|
1,993,630 |
|
|
27.59 |
|
Granted(1) |
|
1,438,695 |
|
|
36.88 |
|
| Vested |
|
(1,621,002) |
|
|
25.32 |
|
| Forfeited |
|
(33,732) |
|
|
36.65 |
|
| Outstanding as of August 31, 2023 |
|
1,777,591 |
|
|
37.01 |
|
Granted(1) |
|
1,084,719 |
|
|
47.73 |
|
| Vested |
|
(1,256,412) |
|
|
38.03 |
|
| Forfeited |
|
(57,312) |
|
|
41.95 |
|
| Outstanding as of August 31, 2024 |
|
1,548,586 |
|
|
$ |
43.52 |
|
_______________________________
(1) Includes grants related to (i) all restricted stock units accounted for as equity awards, (ii) performance stock units accounted for as equity awards on the date of grant and (iii) performance stock units that were reclassified from liability awards to equity awards in the applicable year, such year being the third year of the respective performance period for such performance stock units.
The total fair value of shares vested during 2024, 2023 and 2022 was $47.8 million, $41.0 million and $30.5 million, respectively.
The Company granted 188,453 and 269,052 equivalent shares of restricted stock units and performance stock units accounted for as liability awards during 2024 and 2023, respectively. As of August 31, 2024, the Company had 455,667 equivalent shares of awards outstanding and expects 432,884 equivalent shares to vest.
Stock Purchase Plan
Almost all U.S. resident employees may participate in the Company's employee stock purchase plan. Each eligible employee may purchase up to 500 shares annually. The Board established a 15% purchase discount based on market prices on specified dates for 2024, 2023 and 2022. Yearly activity of the stock purchase plan was as follows:
|
|
|
|
|
|
|
|
|
|
|
|
|
|
|
|
|
|
|
|
|
|
|
Year Ended August 31, |
|
|
2024 |
|
2023 |
|
2022 |
| Shares subscribed |
|
259,500 |
|
|
272,980 |
|
|
279,370 |
|
| Price per share |
|
$ |
42.16 |
|
|
$ |
41.31 |
|
|
$ |
29.90 |
|
| Shares purchased |
|
238,850 |
|
|
248,080 |
|
|
313,790 |
|
| Price per share |
|
$ |
41.31 |
|
|
$ |
29.90 |
|
|
$ |
17.14 |
|
| Shares available for future issuance |
|
1,437,154 |
|
|
|
|
|
NOTE 14. EMPLOYEES' RETIREMENT PLANS
Substantially all employees in the U.S. are covered by a defined contribution 401(k) retirement plan. The tax qualified defined contribution plan is maintained, and contributions are made, in accordance with the Employee Retirement Income Security Act of 1974, as amended ("ERISA"). The Company also provides certain eligible executives benefits pursuant to its Benefit Restoration Plan ("BRP") equal to amounts that would have been available under the tax qualified ERISA plan, but were subject to the limitations of ERISA, tax laws and regulations. Company expenses for these plans, a portion of which are discretionary, totaled $46.9 million, $40.4 million and $34.0 million for 2024, 2023 and 2022, respectively, of which $27.7 million, $26.1 million and $26.8 million was recorded in cost of goods sold, respectively, and the remainder was recorded in SG&A expenses in the Company's consolidated statements of earnings.
The deferred compensation liability under the BRP was $48.8 million and $48.2 million at August 31, 2024 and 2023, respectively, of which $44.3 million and $41.1 million, respectively, was included in other noncurrent liabilities, and the remainder was included in accrued expenses and other payables on the Company's consolidated balance sheets. Though under no obligation to fund the BRP, the Company has segregated assets in a trust with a value of $67.0 million and $60.1 million at August 31, 2024 and 2023, respectively, and such assets were included in other noncurrent assets on the Company's consolidated balance sheets. The net holding gain on these segregated assets was $8.5 million in 2024, compared to a net holding gain of $5.0 million and a net holding loss of $7.1 million in 2023 and 2022, respectively, and was included in net sales in the Company's consolidated statements of earnings.
U.K. Pension Plan
In 2022, the Company acquired a partially funded defined benefit pension plan in the United Kingdom (the "U.K.") (the "U.K. Pension Plan"). The U.K. Pension Plan provides retirement benefit payments for participating retired employees and their spouses, and was closed to new participants prior to the acquisition. The Company’s funding policy for the U.K. Pension Plan is to contribute annually the amount necessary to provide for benefits based on accrued service and meet at least the minimum contributions required by applicable regulations.
U.S. Pension Plan
In 2019, the Company acquired a partially funded defined benefit pension plan in the U.S. (the "U.S. Pension Plan"), which was closed to new participants prior to the acquisition. In October 2022, the Company terminated its U.S. Pension Plan. As part of the termination, the Company made a contribution of $4.1 million. Plan assets were liquidated to purchase annuity contracts with an insurance company for all participants. The Company recognized a $4.2 million settlement charge as a result of the termination, including an immaterial non-cash charge for unrecognized losses within AOCI as of the termination date. The $4.2 million settlement charge was recognized within SG&A expenses in the consolidated statement of earnings during 2023. All other components of net periodic benefit cost recorded in the consolidated statements of earnings and changes in plan assets and benefits obligations recognized in OCI were immaterial in 2023 and 2022. No benefit obligation or plan assets related to the U.S. Pension Plan remain.
The following tables include a reconciliation of the beginning and ending balances of the pension benefit obligation and the fair value of plan assets resulting from the U.K. Pension Plan and the U.S. Pension Plan and the related amounts recognized in the Company’s consolidated balance sheets as of August 31, 2024 and 2023:
|
|
|
|
|
|
|
|
|
|
|
|
|
|
|
|
|
|
|
|
|
|
|
|
|
|
|
|
U.K. Pension Plan |
|
U.S. Pension Plan |
|
|
| (in thousands) |
|
2024 |
|
|
2023 |
|
2023 |
|
|
|
|
| Benefit obligation at beginning of year |
|
$ |
50,900 |
|
|
|
$ |
52,042 |
|
|
$ |
26,568 |
|
|
|
|
|
|
|
|
|
|
|
|
|
|
|
|
|
| Interest cost |
|
2,615 |
|
|
|
2,261 |
|
|
— |
|
|
|
|
|
|
|
|
|
|
|
|
|
|
|
|
|
|
|
|
|
|
|
|
|
|
|
|
|
| Actuarial loss (gain) |
|
794 |
|
|
|
(5,354) |
|
|
(47) |
|
|
|
|
|
| Benefits paid |
|
(2,958) |
|
|
|
(2,529) |
|
|
(466) |
|
|
|
|
|
| Foreign currency translation |
|
1,841 |
|
|
|
4,480 |
|
|
— |
|
|
|
|
|
| Settlement |
|
— |
|
|
|
— |
|
|
(26,055) |
|
|
|
|
|
| Benefit obligation at end of year |
|
$ |
53,192 |
|
|
|
$ |
50,900 |
|
|
$ |
— |
|
|
|
|
|
|
|
|
|
|
|
|
|
|
|
|
|
| Fair value of plan assets at beginning of year |
|
$ |
49,522 |
|
|
|
$ |
60,454 |
|
|
$ |
24,440 |
|
|
|
|
|
| Actuarial gain |
|
— |
|
|
|
— |
|
|
(47) |
|
|
|
|
|
| Actual return (loss) on plan assets |
|
2,733 |
|
|
|
(13,533) |
|
|
(1,966) |
|
|
|
|
|
|
|
|
|
|
|
|
|
|
|
|
|
| Employer contributions |
|
339 |
|
|
|
297 |
|
|
4,094 |
|
|
|
|
|
|
|
|
|
|
|
|
|
|
|
|
|
| Benefits paid |
|
(2,958) |
|
|
|
(2,529) |
|
|
(466) |
|
|
|
|
|
| Foreign currency translation |
|
1,779 |
|
|
|
4,833 |
|
|
— |
|
|
|
|
|
| Settlement |
|
— |
|
|
|
— |
|
|
(26,055) |
|
|
|
|
|
| Fair value of plan assets at end of year |
|
$ |
51,415 |
|
|
|
$ |
49,522 |
|
|
$ |
— |
|
|
|
|
|
| Funded status at end of year liability recognized in the consolidated balance sheets as of August 31, |
|
$ |
(1,777) |
|
|
|
$ |
(1,378) |
|
|
$ |
— |
|
|
|
|
|
|
|
|
|
|
|
|
|
|
|
|
|
| Amounts recognized in AOCI as of August 31, |
|
|
|
|
|
|
|
|
|
|
|
Net actuarial loss |
|
$ |
15,981 |
|
|
|
$ |
16,477 |
|
|
$ |
— |
|
|
|
|
|
|
|
|
|
|
|
|
|
|
|
|
|
Weighted average assumptions used to determine benefit obligations are detailed below:
|
|
|
|
|
|
|
|
|
|
|
|
|
|
|
|
|
U.K. Pension Plan |
|
|
2024 |
|
2023 |
| Effective discount rate for benefit obligations |
|
5.0 |
% |
|
5.3 |
% |
|
|
|
|
|
The pension accumulated benefit obligation represents the actuarial present value of benefits based on employee service and compensation as of the measurement date and does not include an assumption about future compensation levels.
Net periodic benefit costs (gains) are recorded in SG&A expenses within the consolidated statements of earnings. Components of net periodic benefit costs (gains) and other supplemental information are detailed below:
|
|
|
|
|
|
|
|
|
|
|
|
|
|
|
|
|
|
|
|
|
|
|
|
|
|
|
U.K. Pension Plan |
|
|
|
|
|
|
Year Ended August 31, |
|
|
|
|
| (in thousands) |
|
2024 |
|
2023 |
|
2022 |
|
|
|
|
|
|
|
|
|
|
|
|
|
|
|
|
|
|
|
|
|
|
|
|
|
|
| Interest cost |
|
$ |
2,615 |
|
|
$ |
2,261 |
|
|
$ |
635 |
|
|
|
|
|
| Expected return on plan assets |
|
(2,065) |
|
|
(2,589) |
|
|
(1,067) |
|
|
|
|
|
| Amortization of unrecognized net actuarial loss |
|
622 |
|
|
— |
|
|
— |
|
|
|
|
|
|
|
|
|
|
|
|
|
|
|
|
|
|
|
|
|
|
|
|
|
|
|
| Total net periodic benefit costs (gains) |
|
$ |
1,172 |
|
|
$ |
(328) |
|
|
$ |
(432) |
|
|
|
|
|
|
|
|
|
|
|
|
|
|
|
|
| Other changes in plan assets and benefit obligations recognized in OCI |
|
|
|
|
|
|
|
|
|
|
| Net actuarial (gain) loss arising during measurement period |
|
$ |
(496) |
|
|
$ |
10,811 |
|
|
$ |
5,666 |
|
|
|
|
|
|
|
|
|
|
|
|
|
|
|
|
|
|
|
|
|
|
|
|
|
|
|
|
|
|
|
|
|
|
|
|
|
|
|
|
|
|
|
|
|
|
|
|
|
|
|
|
|
|
|
|
|
|
|
|
|
|
|
|
|
|
|
|
|
|
|
|
|
|
|
|
|
|
|
|
|
|
|
|
|
|
|
|
|
|
|
|
|
|
|
|
|
|
|
|
|
|
|
|
|
|
|
|
|
|
|
|
|
|
|
|
|
|
|
|
|
|
|
|
|
|
|
|
|
|
|
|
|
|
|
|
|
|
|
|
|
|
|
|
|
|
|
|
|
|
|
|
|
|
|
|
|
|
|
|
|
|
|
|
|
|
|
|
|
|
|
|
|
|
|
|
|
|
|
|
|
Weighted average assumptions used to determine net periodic benefit costs (gains) are detailed below:
|
|
|
|
|
|
|
|
|
|
|
|
|
|
|
|
|
|
|
|
|
|
|
|
|
|
|
U.K. Pension Plan |
|
|
|
|
2024 |
|
2023 |
|
2022 |
|
|
|
|
| Effective rate for interest on benefit obligations |
|
5.3 |
% |
|
4.3 |
% |
|
2.9 |
% |
|
|
|
|
|
|
|
|
|
|
|
|
|
|
|
| Expected long-term rate of return |
|
5.0 |
% |
|
4.6 |
% |
|
4.0 |
% |
|
|
|
|
|
|
|
|
|
|
|
|
|
|
|
|
|
|
|
|
|
|
|
|
|
|
|
|
|
|
|
|
|
|
|
|
|
|
|
|
|
|
|
|
|
|
|
|
|
|
|
|
|
|
|
|
|
|
|
The Company determines the discount rates used to measure liabilities as of the August 31 measurement date, which is also the date used for the related annual measurement assumptions. The discount rates reflect the current rate at which the associated liabilities could be effectively settled at the end of the year. For the U.K. Pension Plan, the Company sets its discount rate by reference to a corporate bond yield curve derived from AA rated U.K. corporate bonds. The single equivalent discount rate is derived as equivalent to applying the full yield curve approach to each future year's projected benefit cash flow.
The expected return assumptions are based on the strategic asset allocation of each plan and long-term capital market return expectations. For the U.K. Pension Plan, the interest cost calculation is determined by applying the single equivalent discount rate to the discounted value of the year-by-year projected benefit payments. The single equivalent discount rate does not affect the measurement of the total benefit obligations.
The Company plans to make immaterial contributions to the U.K. Pension Plan in 2025. Future contributions will depend on market conditions, interest rates and other factors.
Plan Assets
Plan assets consist primarily of public equity, corporate and government bonds. The principal investment objectives are to achieve, over the long term, a return on the plan assets which is consistent with the assumptions made by the plan actuaries in determining the funding of the plans, to ensure that sufficient liquid assets are available to meet benefit payments as they fall due and to consider the interest of the Company in relation to the size and volatility of the Company's contribution requirements. Each asset class has broadly diversified characteristics. Asset and benefit obligation forecasting studies are conducted periodically, generally every two to three years, or when significant changes have occurred in market conditions, benefits, participant demographics or funded status.
The U.K. Pension Plan's weighted average target allocation ranges and actual allocations as a percentage of plan assets, including the notional exposure of future contracts by asset categories, are detailed below:
|
|
|
|
|
|
|
|
|
|
|
|
|
|
|
|
|
|
|
|
|
|
|
|
|
|
|
|
|
Pension Assets |
|
|
Target Percent |
|
2024 |
|
2023 |
| Fixed income securities |
|
95.0% |
to |
100% |
|
99.6% |
|
88.2% |
|
|
|
|
|
|
|
|
|
| Cash and other |
|
— |
to |
5.0 |
|
0.4 |
|
11.8 |
| Total |
|
|
|
|
|
100% |
|
100% |
Investment Valuation
Investments are stated at fair value. Fair value is the price that would be received to sell an asset or paid to transfer a liability at the measurement date. Fixed income securities are valued at the yields currently available on comparable securities of issues with similar credit ratings. Purchases and sales of securities are recorded as of the trade date. Realized gains and losses on sales of securities are determined based on average cost. Interest income is recognized on the accrual basis. Dividend income is recognized on the ex-dividend date. Non-interest bearing cash is valued at cost, which approximates fair value.
Fair Value Measurements
The following table sets forth the fair value of the plan assets by asset class for the U.K. Pension Plan as of August 31, 2024 and 2023. Level 1 assets consist of cash and cash equivalents. Level 2 assets include funds invested in bonds and fixed income securities. Level 3 assets are measured at fair value using significant unobservable inputs and consist primarily of Secured Finance and Multistrategy Funds that invest in debt, loan and structured financial instruments in both public and private secured finance markets.
|
|
|
|
|
|
|
|
|
|
|
|
|
|
|
|
|
|
|
|
|
|
|
|
|
|
|
|
|
|
|
|
|
|
|
|
|
Fair Value at Measurement Date Using |
|
|
|
|
|
|
| (in thousands) |
|
Total |
|
Quoted Prices in
Active Markets for
Identical Assets
(Level 1) |
|
Significant Other
Observable Inputs
(Level 2) |
|
Significant
Unobservable Inputs
(Level 3) |
|
|
|
|
|
|
As of August 31, 2024: |
|
|
|
|
|
|
|
|
|
|
|
|
|
|
| Fixed income securities |
|
$ |
51,194 |
|
|
$ |
— |
|
|
$ |
51,194 |
|
|
$ |
— |
|
|
|
|
|
|
|
|
|
|
|
|
|
|
|
|
|
|
|
|
|
|
| Cash and other |
|
221 |
|
|
— |
|
|
221 |
|
|
— |
|
|
|
|
|
|
|
| Fair value of U.K. Pension Plan assets |
|
$ |
51,415 |
|
|
|
|
|
|
|
|
|
|
|
|
|
|
|
|
|
|
|
|
|
|
|
|
|
|
|
|
As of August 31, 2023: |
|
|
|
|
|
|
|
|
|
|
|
|
|
|
| Fixed income securities |
|
$ |
43,654 |
|
|
$ |
— |
|
|
$ |
40,497 |
|
|
$ |
3,157 |
|
|
|
|
|
|
|
| Cash and other |
|
5,868 |
|
|
376 |
|
|
5,356 |
|
|
136 |
|
|
|
|
|
|
|
| Fair value of U.K. Pension Plan assets |
|
$ |
49,522 |
|
|
|
|
|
|
|
|
|
|
|
|
|
The following table provides a reconciliation of the beginning and ending balances of U.K. Pension Plan Level 3 assets recognized in the consolidated balance sheets:
|
|
|
|
|
|
|
|
|
| (in thousands) |
|
Level 3 Plan Assets |
| Balance at August 31, 2022 |
|
$ |
8,885 |
|
| Sales |
|
(4,997) |
|
| Actual return on plan assets: |
|
|
| Assets held as of the reporting date |
|
134 |
|
| Assets sold during the year |
|
256 |
|
| Transfers out of Level 3 |
|
(1,541) |
|
| Foreign currency translation |
|
556 |
|
| Balance at August 31, 2023 |
|
$ |
3,293 |
|
| Sales |
|
(3,139) |
|
| Actual return on plan assets sold during the year |
|
(139) |
|
|
|
|
|
|
|
|
|
|
| Foreign currency translation |
|
(15) |
|
| Balance at August 31, 2024 |
|
$ |
— |
|
Future Pension Benefit Payments
The following table provides the estimated aggregate pension benefit payments that are payable from the U.K. Pension Plan to participants in future years:
|
|
|
|
|
|
|
|
|
| (in thousands) |
|
U.K. Pension Plan |
| 2025 |
|
$ |
3,150 |
|
| 2026 |
|
3,225 |
|
| 2027 |
|
3,300 |
|
| 2028 |
|
3,379 |
|
| 2029 |
|
3,458 |
|
| 2030 through 2034 |
|
18,548 |
|
NOTE 15. CAPITAL STOCK
Treasury Stock
In October 2021, the Board approved a share repurchase program under which CMC was authorized to repurchase up to $350.0 million of shares of common stock. In January 2024, the Board authorized an increase of $500.0 million to the existing share repurchase program. The share repurchase program does not require the Company to purchase any dollar amount or number of shares of CMC common stock and may be modified, suspended, extended or terminated by the Company at any time without prior notice. During 2024, 2023 and 2022, the Company repurchased 3,499,225, 2,309,452 and 4,496,628 shares of CMC common stock, respectively, at an average purchase price of $52.28, $43.91 and $36.00 per share, respectively. CMC had remaining authorization to purchase $403.8 million of common stock at August 31, 2024.
Preferred Stock
The Company has 2,000,000 shares of preferred stock, par value of $1.00 per share, authorized. The Company may issue preferred stock in series, and the shares of each series may have such rights and preferences as are fixed by the Board when authorizing the issuance of that particular series. There are no shares of preferred stock outstanding.
NOTE 16. EARNINGS PER SHARE
Basic earnings per share ("EPS") is computed based on the weighted average shares of common stock outstanding during the period. Restricted stock is included in the number of shares of common stock issued and outstanding, but omitted from the basic EPS calculation until the shares vest. Diluted EPS is computed based on the weighted average shares of common stock plus the effect of dilutive securities outstanding during the period using the treasury stock method. The effect of dilutive securities includes the impact of outstanding stock-based incentive awards and shares purchased by employees through participation in the Company's employee stock purchase plan.
The calculations of basic and diluted EPS were as follows:
|
|
|
|
|
|
|
|
|
|
|
|
|
|
|
|
|
|
|
|
|
|
|
Year Ended August 31, |
| (in thousands, except share and per share data) |
|
2024 |
|
2023 |
|
2022 |
| Net earnings |
|
$ |
485,491 |
|
|
$ |
859,760 |
|
|
$ |
1,217,262 |
|
|
|
|
|
|
|
|
| Average basic shares outstanding |
|
115,844,977 |
|
|
117,077,703 |
|
|
120,648,090 |
|
| Effect of dilutive securities |
|
1,307,575 |
|
|
1,528,568 |
|
|
1,724,296 |
|
| Average diluted shares outstanding |
|
117,152,552 |
|
|
118,606,271 |
|
|
122,372,386 |
|
|
|
|
|
|
|
|
| Earnings per share: |
|
|
|
|
|
|
| Basic |
|
$ |
4.19 |
|
|
$ |
7.34 |
|
|
$ |
10.09 |
|
| Diluted |
|
4.14 |
|
|
7.25 |
|
|
9.95 |
|
|
|
|
|
|
|
|
|
|
|
|
|
|
|
Anti-dilutive shares not included in the table above were immaterial for all periods presented.
NOTE 17. COMMITMENTS AND CONTINGENCIES
In the ordinary course of conducting its business, the Company becomes involved in litigation, administrative proceedings and governmental investigations, including environmental matters.
Legal Proceedings
On October 30, 2020, plaintiff Pacific Steel Group ("PSG") filed a suit in the United States District Court for the Northern District of California (the "Northern District Court") alleging that CMC, CMC Steel Fabricators, Inc. and CMC Steel US, LLC violated federal and California state antitrust laws and California common law by entering into an exclusivity agreement for certain steel mill equipment manufactured by one of the Company’s equipment suppliers. PSG seeks, among other things, a jury trial on its claims in addition to injunctive relief, compensatory damages, fees and costs. Fact and expert discovery are complete. Both the motion for summary judgment filed by CMC, CMC Steel Fabricators, Inc. and CMC Steel US, LLC and the cross-motion for summary judgment filed by PSG were denied by the Northern District Court on June 10, 2024. A jury trial is scheduled for late October 2024.
The Company believes that it has substantial defenses and intends to vigorously defend against PSG's claims. The Company has not recorded any liability for this matter as it does not believe a loss is probable, and it cannot estimate any reasonably possible loss or range of possible loss. It is possible that an unfavorable resolution to this matter could have an adverse effect on the Company’s results of operations, financial position or cash flows.
On March 13, 2022, PSG filed a second suit in the San Diego County Superior Court of California alleging that CMC Steel Fabricators, Inc., CMC Steel US, LLC, and CMC Rebar West (which later merged into CMC Steel Fabricators, Inc.) violated California state antitrust and unfair competition laws by bidding below their costs for rebar furnish-and-install projects in California to hamper PSG's ability to win jobs. These same allegations were initially brought in PSG's lawsuit pending in the Northern District Court, but were dismissed without prejudice by the Northern District Court for lack of jurisdiction. This second lawsuit was later removed to the United States District Court for the Southern District of California (the "Southern District Court"). There, PSG seeks, among other things, a jury trial on its claims in addition to injunctive relief, compensatory damages, fees and costs. Fact discovery is substantially complete and expert discovery is underway. As of the date of this Annual Report, no summary judgment motions have been filed nor has a trial been scheduled. The Company believes that it has substantial defenses and intends to vigorously defend against PSG's claims. The Company has not recorded any liability for this matter as it does not believe a loss is probable, and it cannot estimate any reasonably possible loss or range of possible loss. It is possible that an unfavorable resolution to this matter could have an adverse effect on the Company’s results of operations, financial position or cash flows.
Other Matters
At August 31, 2024 and 2023, the amounts accrued for cleanup and remediation costs at certain sites in response to notices, actions and agreements under the Comprehensive Environmental Response, Compensation and Liability Act of 1980 (“CERCLA”) and analogous state and local statutes were immaterial. Total accrued environmental liabilities, including CERCLA sites, were $3.4 million and $4.5 million as of August 31, 2024 and 2023, respectively, of which $1.9 million and $2.0 million was classified as other noncurrent liabilities at August 31, 2024 and 2023, respectively. These amounts have not been discounted to their present values. Due to evolving remediation technology, changing regulations, possible third-party contributions, the inherent uncertainties of the estimation process and other factors, amounts accrued could vary significantly from amounts paid.
NOTE 18. ACCRUED EXPENSES AND OTHER PAYABLES
Significant accrued expenses and other payables were as follows:
|
|
|
|
|
|
|
|
|
|
|
|
|
|
|
| |
|
Year Ended August 31, |
| (in thousands) |
|
2024 |
|
2023 |
| Salaries and incentive compensation |
|
$ |
118,462 |
|
|
$ |
133,242 |
|
| Worker's compensation and general liability insurance |
|
64,539 |
|
|
41,512 |
|
| Taxes other than income taxes |
|
40,193 |
|
|
39,433 |
|
| Utilities |
|
17,595 |
|
|
20,695 |
|
NOTE 19. SEGMENT INFORMATION
The Company's operating segments engage in business activities from which they may earn revenues and incur expenses and for which discrete financial information is available. Operating results for the operating segments are regularly reviewed by the Company's Chief Operating Decision Maker ("CODM"), the President and Chief Executive Officer, to manage the business, make decisions about resources to be allocated to the segments and to assess performance.
The Company structures its business into the following three reportable segments: North America Steel Group, Europe Steel Group and Emerging Businesses Group. See Note 1, Nature of Operations and Summary of Significant Accounting Policies, for more information about the reportable segments, including the types of products and services from which each reportable segment derives its net sales. Corporate and Other contains earnings or losses on assets and liabilities related to the Company's BRP assets and short-term investments, expenses of the Company's corporate headquarters, interest expense related to long-term debt, other revenue resulting from the Company's NMTC transactions and intercompany eliminations. Certain corporate administrative expenses are allocated to the segments based upon the nature of the expense.
The CODM uses adjusted EBITDA to evaluate segment performance and allocate resources. Adjusted EBITDA is the sum of the Company's earnings before interest expense, income taxes, depreciation and amortization expense and impairment expense.
The following table summarizes certain financial information by reportable segment and Corporate and Other. Interest expense includes intercompany interest expense in the segments, which is eliminated within Corporate and Other.
|
|
|
|
|
|
|
|
|
|
|
|
|
|
|
|
|
|
|
|
|
|
|
Year Ended August 31, |
| (in thousands) |
|
2024 |
|
2023 |
|
2022 |
| Net sales to external customers: |
|
|
|
|
|
|
| North America Steel Group |
|
$ |
6,309,730 |
|
|
$ |
6,704,305 |
|
|
$ |
6,798,405 |
|
| Europe Steel Group |
|
848,566 |
|
|
1,328,791 |
|
|
1,592,292 |
|
| Emerging Businesses Group |
|
717,397 |
|
|
721,746 |
|
|
525,516 |
|
| Reportable segments total |
|
$ |
7,875,693 |
|
|
$ |
8,754,842 |
|
|
$ |
8,916,213 |
|
| Corporate and Other |
|
50,279 |
|
|
44,691 |
|
|
(2,732) |
|
| Total |
|
$ |
7,925,972 |
|
|
$ |
8,799,533 |
|
|
$ |
8,913,481 |
|
|
|
|
|
|
|
|
| Adjusted EBITDA: |
|
|
|
|
|
|
| North America Steel Group |
|
$ |
946,350 |
|
|
$ |
1,328,431 |
|
|
$ |
1,482,667 |
|
| Europe Steel Group |
|
22,517 |
|
|
48,473 |
|
|
344,659 |
|
| Emerging Businesses Group |
|
129,530 |
|
|
138,985 |
|
|
72,583 |
|
| Reportable segments total |
|
$ |
1,098,397 |
|
|
$ |
1,515,889 |
|
|
$ |
1,899,909 |
|
|
|
|
|
|
|
|
| Interest expense: |
|
|
|
|
|
|
| North America Steel Group |
|
$ |
184,019 |
|
|
$ |
117,502 |
|
|
$ |
27,310 |
|
| Europe Steel Group |
|
(5,074) |
|
|
(1,165) |
|
|
2,749 |
|
| Emerging Businesses Group |
|
2,480 |
|
|
2,291 |
|
|
558 |
|
| Reportable segments total |
|
$ |
181,425 |
|
|
$ |
118,628 |
|
|
$ |
30,617 |
|
| Corporate and Other |
|
(133,532) |
|
|
(78,501) |
|
|
20,092 |
|
| Total |
|
$ |
47,893 |
|
|
$ |
40,127 |
|
|
$ |
50,709 |
|
|
|
|
|
|
|
|
| Depreciation and amortization: |
|
|
|
|
|
|
| North America Steel Group |
|
$ |
192,697 |
|
|
$ |
136,391 |
|
|
$ |
120,026 |
|
| Europe Steel Group |
|
34,077 |
|
|
32,607 |
|
|
28,755 |
|
| Emerging Businesses Group |
|
43,945 |
|
|
40,725 |
|
|
17,791 |
|
| Reportable segments total |
|
$ |
270,719 |
|
|
$ |
209,723 |
|
|
$ |
166,572 |
|
| Corporate and Other |
|
9,648 |
|
|
9,107 |
|
|
8,452 |
|
| Total |
|
$ |
280,367 |
|
|
$ |
218,830 |
|
|
$ |
175,024 |
|
|
|
|
|
|
|
|
| Asset impairments: |
|
|
|
|
|
|
| North America Steel Group |
|
$ |
6,558 |
|
|
$ |
3,733 |
|
|
$ |
4,915 |
|
| Europe Steel Group |
|
150 |
|
|
47 |
|
|
11 |
|
| Emerging Businesses Group |
|
— |
|
|
— |
|
|
— |
|
| Reportable segments total |
|
$ |
6,708 |
|
|
$ |
3,780 |
|
|
$ |
4,926 |
|
| Corporate and Other |
|
— |
|
|
— |
|
|
— |
|
| Total |
|
$ |
6,708 |
|
|
$ |
3,780 |
|
|
$ |
4,926 |
|
|
|
|
|
|
|
|
| Capital expenditures: |
|
|
|
|
|
|
| North America Steel Group |
|
$ |
250,599 |
|
|
$ |
535,927 |
|
|
$ |
411,101 |
|
| Europe Steel Group |
|
44,726 |
|
|
37,600 |
|
|
25,722 |
|
| Emerging Businesses Group |
|
20,479 |
|
|
19,986 |
|
|
6,116 |
|
| Reportable segments total |
|
$ |
315,804 |
|
|
$ |
593,513 |
|
|
$ |
442,939 |
|
| Corporate and Other |
|
8,467 |
|
|
13,152 |
|
|
7,049 |
|
| Total |
|
$ |
324,271 |
|
|
$ |
606,665 |
|
|
$ |
449,988 |
|
|
|
|
|
|
|
|
| Assets: |
|
|
|
|
|
|
| North America Steel Group |
|
$ |
4,219,603 |
|
|
$ |
4,166,521 |
|
|
$ |
3,739,567 |
|
| Europe Steel Group |
|
677,697 |
|
|
927,468 |
|
|
883,813 |
|
| Emerging Businesses Group |
|
861,025 |
|
|
874,330 |
|
|
812,107 |
|
| Reportable segments total |
|
$ |
5,758,325 |
|
|
$ |
5,968,319 |
|
|
$ |
5,435,487 |
|
| Corporate and Other |
|
1,059,514 |
|
|
670,775 |
|
|
801,540 |
|
| Total |
|
$ |
6,817,839 |
|
|
$ |
6,639,094 |
|
|
$ |
6,237,027 |
|
The following table presents a reconciliation of earnings to adjusted EBITDA for the reportable segments:
|
|
|
|
|
|
|
|
|
|
|
|
|
|
|
|
|
|
|
|
|
| |
|
Year Ended August 31, |
| (in thousands) |
|
2024 |
|
2023 |
|
2022 |
| Net earnings |
|
$ |
485,491 |
|
|
$ |
859,760 |
|
|
$ |
1,217,262 |
|
| Interest expense |
|
47,893 |
|
|
40,127 |
|
|
50,709 |
|
| Income taxes |
|
150,180 |
|
|
262,207 |
|
|
297,885 |
|
| Depreciation and amortization |
|
280,367 |
|
|
218,830 |
|
|
175,024 |
|
| Asset impairments |
|
6,708 |
|
|
3,780 |
|
|
4,926 |
|
| Corporate and Other expenses |
|
127,758 |
|
|
131,185 |
|
|
154,103 |
|
| Adjusted EBITDA reportable segments |
|
$ |
1,098,397 |
|
|
$ |
1,515,889 |
|
|
$ |
1,899,909 |
|
The following tables display net sales to external customers by reportable segment and Corporate and Other, disaggregated by major product:
|
|
|
|
|
|
|
|
|
|
|
|
|
|
|
|
|
|
|
|
|
|
|
|
|
|
|
|
|
|
|
|
|
|
|
Year Ended August 31, 2024 |
| (in thousands) |
|
North America Steel Group |
|
Europe Steel Group |
|
Emerging Businesses Group |
|
Corporate and Other |
|
Total |
| Major product: |
|
|
|
|
|
|
|
|
|
|
| Raw materials |
|
$ |
1,311,995 |
|
|
$ |
17,943 |
|
|
$ |
— |
|
|
$ |
— |
|
|
$ |
1,329,938 |
|
| Steel products |
|
2,564,472 |
|
|
672,886 |
|
|
— |
|
|
— |
|
|
3,237,358 |
|
| Downstream products |
|
2,217,621 |
|
|
121,431 |
|
|
157,644 |
|
— |
|
|
2,496,696 |
|
| Construction products |
|
— |
|
|
— |
|
|
290,304 |
|
— |
|
|
290,304 |
|
| Ground stabilization solutions |
|
— |
|
|
— |
|
|
250,941 |
|
— |
|
|
250,941 |
|
| Other |
|
215,642 |
|
|
36,306 |
|
|
18,508 |
|
50,279 |
|
|
320,735 |
|
| Net sales to external customers |
|
6,309,730 |
|
|
848,566 |
|
|
717,397 |
|
|
50,279 |
|
|
7,925,972 |
|
| Intersegment net sales, eliminated in consolidation |
|
73,376 |
|
|
3,044 |
|
|
33,357 |
|
|
(109,777) |
|
|
— |
|
| Net sales |
|
$ |
6,383,106 |
|
|
$ |
851,610 |
|
|
$ |
750,754 |
|
|
$ |
(59,498) |
|
|
$ |
7,925,972 |
|
|
|
|
|
|
|
|
|
|
|
|
|
|
|
|
|
|
|
|
|
|
|
|
|
|
|
|
|
|
|
|
|
|
|
|
Year Ended August 31, 2023 |
| (in thousands) |
|
North America Steel Group |
|
Europe Steel Group |
|
Emerging Businesses Group |
|
Corporate and Other |
|
Total |
| Major product: |
|
|
|
|
|
|
|
|
|
|
| Raw materials |
|
$ |
1,324,373 |
|
|
$ |
21,010 |
|
|
$ |
— |
|
|
$ |
— |
|
|
$ |
1,345,383 |
|
| Steel products |
|
2,776,572 |
|
|
1,069,130 |
|
|
— |
|
|
— |
|
|
3,845,702 |
|
| Downstream products |
|
2,417,045 |
|
|
194,414 |
|
|
118,321 |
|
|
— |
|
|
2,729,780 |
|
| Construction products |
|
— |
|
|
— |
|
|
332,940 |
|
|
— |
|
|
332,940 |
|
| Ground stabilization solutions |
|
— |
|
|
— |
|
|
256,148 |
|
|
— |
|
|
256,148 |
|
| Other |
|
186,315 |
|
|
44,237 |
|
|
14,337 |
|
|
44,691 |
|
|
289,580 |
|
| Net sales to external customers |
|
6,704,305 |
|
|
1,328,791 |
|
|
721,746 |
|
|
44,691 |
|
|
8,799,533 |
|
| Intersegment net sales, eliminated in consolidation |
|
93,522 |
|
|
2,353 |
|
|
22,802 |
|
|
(118,677) |
|
|
— |
|
| Net sales |
|
$ |
6,797,827 |
|
|
$ |
1,331,144 |
|
|
$ |
744,548 |
|
|
$ |
(73,986) |
|
|
$ |
8,799,533 |
|
|
|
|
|
|
|
|
|
|
|
|
|
|
|
|
|
|
|
|
|
|
|
|
|
|
|
|
|
|
|
|
|
|
|
|
Year Ended August 31, 2022 |
| (in thousands) |
|
North America Steel Group |
|
Europe Steel Group |
|
Emerging Businesses Group |
|
Corporate and Other |
|
Total |
| Major product: |
|
|
|
|
|
|
|
|
|
|
| Raw materials |
|
$ |
1,517,962 |
|
|
$ |
25,778 |
|
|
$ |
— |
|
|
$ |
— |
|
|
$ |
1,543,740 |
|
| Steel products |
|
2,942,741 |
|
|
1,236,854 |
|
|
— |
|
|
— |
|
|
4,179,595 |
|
| Downstream products |
|
2,161,004 |
|
|
285,836 |
|
|
93,403 |
|
|
— |
|
|
2,540,243 |
|
| Construction products |
|
— |
|
|
— |
|
|
322,486 |
|
|
— |
|
|
322,486 |
|
| Ground stabilization solutions |
|
— |
|
|
— |
|
|
100,072 |
|
|
— |
|
|
100,072 |
|
| Other |
|
176,698 |
|
|
43,824 |
|
|
9,555 |
|
|
(2,732) |
|
|
227,345 |
|
| Net sales to external customers |
|
6,798,405 |
|
|
1,592,292 |
|
|
525,516 |
|
|
(2,732) |
|
|
8,913,481 |
|
| Intersegment net sales, eliminated in consolidation |
|
110,495 |
|
|
2,031 |
|
|
6,873 |
|
|
(119,399) |
|
|
— |
|
| Net sales |
|
$ |
6,908,900 |
|
|
$ |
1,594,323 |
|
|
$ |
532,389 |
|
|
$ |
(122,131) |
|
|
$ |
8,913,481 |
|
The following table presents net sales by geographic area:
|
|
|
|
|
|
|
|
|
|
|
|
|
|
|
|
|
|
|
|
|
| |
|
Year Ended August 31, |
| (in thousands) |
|
2024 |
|
2023 |
|
2022 |
| Geographic area: |
|
|
|
|
|
|
| United States |
|
$ |
6,465,388 |
|
|
$ |
6,894,990 |
|
|
$ |
6,793,023 |
|
| Poland |
|
583,320 |
|
|
941,806 |
|
|
1,078,986 |
|
| China |
|
215,039 |
|
|
217,779 |
|
|
246,679 |
|
| Other |
|
662,225 |
|
|
744,958 |
|
|
794,793 |
|
| Net sales |
|
$ |
7,925,972 |
|
|
$ |
8,799,533 |
|
|
$ |
8,913,481 |
|
The following table presents long-lived assets, net of accumulated depreciation and amortization, by geographic area:
|
|
|
|
|
|
|
|
|
|
|
|
|
|
|
|
|
|
|
|
|
| |
|
August 31, |
| (in thousands) |
|
2024 |
|
2023 |
|
2022 |
| Geographic area: |
|
|
|
|
|
|
| United States |
|
$ |
2,499,949 |
|
|
$ |
2,343,606 |
|
|
$ |
1,858,269 |
|
| Poland |
|
236,326 |
|
|
209,966 |
|
|
180,350 |
|
| Other |
|
43,026 |
|
|
39,704 |
|
|
35,199 |
|
| Total long-lived assets, net |
|
$ |
2,779,301 |
|
|
$ |
2,593,276 |
|
|
$ |
2,073,818 |
|
ITEM 9. CHANGES IN AND DISAGREEMENTS WITH ACCOUNTANTS ON ACCOUNTING AND FINANCIAL DISCLOSURE
Not applicable.
ITEM 9A. CONTROLS AND PROCEDURES
Evaluation of Disclosure Controls and Procedures. Under the supervision and with the participation of our management, including the Chief Executive Officer and the Chief Financial Officer, we have evaluated the effectiveness of our disclosure controls and procedures as required by Rules 13a-15(b) and 15d-15(b) under the Exchange Act as of the end of the period covered by this report. There are inherent limitations to the effectiveness of any system of disclosure controls and procedures. Accordingly, even effective disclosure controls and procedures can only provide reasonable assurance of achieving their control objectives. Based on that evaluation, the Chief Executive Officer and the Chief Financial Officer have concluded that these disclosure controls and procedures were effective at the reasonable assurance level as of August 31, 2024.
Management's Report on Internal Control Over Financial Reporting. Management is responsible for establishing and maintaining adequate internal control over financial reporting as defined in Rule 13a-15(f) under the Exchange Act.
Internal control over financial reporting is a process designed to provide reasonable assurance regarding the reliability of our financial reporting and the preparation of financial statements for external purposes in accordance with accounting principles generally accepted in the United States of America.
Because of its inherent limitations, internal control over financial reporting may not prevent or detect misstatements. Also, projections of any evaluation of the effectiveness of internal control over financial reporting to future periods are subject to the risk that controls may become inadequate because of changes in conditions or that the degree of compliance with the policies or procedures may deteriorate over time.
Management, including our Chief Executive Officer and our Chief Financial Officer, conducted an evaluation of the effectiveness of our internal control over financial reporting as of August 31, 2024 based on the guidelines established in Internal Control-Integrated Framework (2013) issued by the Committee of Sponsoring Organizations of the Treadway Commission ("COSO"). Based on the results of our evaluation, our management concluded that our internal control over financial reporting was effective as of August 31, 2024.
CMC's internal control over financial reporting as of August 31, 2024 has been audited by Deloitte & Touche LLP, an independent registered public accounting firm, as stated in its report included in Part II, Item 8 of this Annual Report.
Changes in Internal Control Over Financial Reporting. During the fourth quarter of 2024, we executed a portion of a phased implementation of a new information system for our scrap metal recycling facilities, which will replace our existing information system for this line of business. The implementation was completed during the first quarter of 2025. There were changes in our internal control over financial reporting as this information system became operational at each scrap metal recycling facility. We took the necessary steps to monitor and maintain appropriate internal control over financial reporting during this period of change. Additionally, we provided training related to this application to individuals using the information system to carry out their job responsibilities. This information system change was not undertaken in response to any deficiencies in our internal control over financial reporting.
There were no other changes in our internal control over financial reporting (as defined in Rules 13a-15(f) and 15d-15(f) of the Exchange Act) that occurred during the quarter ended August 31, 2024 that materially affected, or are reasonably likely to materially affect, our internal control over financial reporting.
ITEM 9B. OTHER INFORMATION
During the three months ended August 31, 2024, none of the Company’s directors or executive officers adopted or terminated a “Rule 10b5-1 trading arrangement” or “non-Rule 10b5-1 trading arrangement,” as each term is defined in Item 408(a) of Regulation S-K.
ITEM 9C. DISCLOSURE REGARDING FOREIGN JURISDICTIONS THAT PREVENT INSPECTIONS
Not applicable.
PART III
We will file a definitive proxy statement for our 2025 annual meeting of stockholders (such proxy statement, the “2025 Proxy Statement”) with the SEC, pursuant to Regulation 14A of the Exchange Act, not later than 120 days after the end of the fiscal year covered by this Annual Report. Accordingly, certain information required by Part III has been omitted under General Instruction G(3) to Form 10-K. Only those sections of the 2025 Proxy Statement that specifically address the items set forth herein are incorporated by reference.
ITEM 10. DIRECTORS, EXECUTIVE OFFICERS AND CORPORATE GOVERNANCE
The information required in response to this Item 10 with regard to directors is incorporated herein by reference to the 2025 Proxy Statement. Information regarding the Company's executive officers is set forth under the caption "Information About Our Executive Officers" in Part I, Item 1, Business of this Annual Report and incorporated herein by reference.
ITEM 11. EXECUTIVE COMPENSATION
The information required in response to this Item 11 is incorporated herein by reference to the 2025 Proxy Statement, except for the information required by Item 402(v) of Regulation S-K, which is specifically not incorporated herein by reference.
ITEM 12. SECURITY OWNERSHIP OF CERTAIN BENEFICIAL OWNERS AND MANAGEMENT AND RELATED STOCKHOLDER MATTERS
The information required in response to this Item 12 is incorporated herein by reference to the 2025 Proxy Statement.
ITEM 13. CERTAIN RELATIONSHIPS AND RELATED TRANSACTIONS AND DIRECTOR INDEPENDENCE
The information required in response to this Item 13 is incorporated herein by reference to the 2025 Proxy Statement.
ITEM 14. PRINCIPAL ACCOUNTANT FEES AND SERVICES
The information required in response to this Item 14 about our principal accountant, Deloitte & Touche LLP (PCAOB ID No. 34), is incorporated herein by reference to the 2025 Proxy Statement.
PART IV
ITEM 15. EXHIBITS AND FINANCIAL STATEMENT SCHEDULE
(a) The following documents are filed as a part of this Annual Report:
1. All financial statements are included in Item 8 above.
2. Financial statement schedule: The following financial statement schedule is attached to this Annual Report.
Schedule II — Valuation and Qualifying Accounts
All other financial statement schedules have been omitted because they are not applicable, they are not required or the required information is shown in the financial statements or notes thereto.
3. Exhibits:
Pursuant to Item 601(b)(4)(iii) of Regulation S-K, certain long-term debt instruments are omitted because the total amount of securities authorized thereunder does not exceed 10% of the total assets of CMC and its subsidiaries on a consolidated basis. The Company agrees to furnish copies of such instruments to the SEC upon its request.
|
|
|
|
|
|
|
|
|
| EXHIBIT |
|
|
| NO. |
|
DESCRIPTION |
2(a)† |
|
|
|
|
|
| 3(i)(a) |
|
|
|
|
|
| 3(i)(b) |
|
|
|
|
|
| 3(i)(c) |
|
|
|
|
|
| 3(i)(d) |
|
|
|
|
|
| 3(i)(e) |
|
|
|
|
|
| 3(i)(f) |
|
|
|
|
|
| 3(ii) |
|
|
|
|
|
| 4(i)(a) |
|
|
|
|
|
| 4(i)(b) |
|
|
|
|
|
|
|
|
|
|
|
|
|
|
| 4(i)(c) |
|
|
|
|
|
| 4(i)(d) |
|
|
|
|
|
| 4(i)(e) |
|
|
|
|
|
| 4(i)(f) |
|
|
|
|
|
| 4(i)(g) |
|
|
|
|
|
| 4(ii)(a) |
|
|
|
|
|
| 10(i)(a) |
|
|
|
|
|
| 10(i)(b) |
|
|
|
|
|
| 10(i)(c) |
|
|
|
|
|
| 10(ii)(a)* |
|
|
|
|
|
| 10(ii)(b)* |
|
|
|
|
|
| 10(ii)(c)* |
|
|
|
|
|
| 10(ii)(d)* |
|
|
|
|
|
| 10(ii)(e)* |
|
|
|
|
|
| 10(ii)(f)* |
|
|
|
|
|
| 10(ii)(g)* |
|
|
|
|
|
| 10(ii)(h)* |
|
|
|
|
|
|
|
|
|
|
|
|
|
|
| 10(ii)(i)* |
|
|
|
|
|
| 10(ii)(j)* |
|
|
|
|
|
| 10(ii)(k)* |
|
|
|
|
|
| 10(ii)(l)* |
|
|
|
|
|
| 10(ii)(m)* |
|
|
|
|
|
| 10(ii)(n)* |
|
|
|
|
|
| 10(ii)(o)* |
|
|
|
|
|
| 10(ii)(p)* |
|
|
|
|
|
| 10(ii)(q)* |
|
|
|
|
|
| 10(ii)(r)* |
|
|
|
|
|
| 10(ii)(s)* |
|
|
|
|
|
| 10(ii)(t)* |
|
|
|
|
|
| 10(ii)(u)* |
|
|
|
|
|
| 10(ii)(v)* |
|
|
|
|
|
| 10(ii)(w) |
|
|
|
|
|
| 19 |
|
|
|
|
|
| 21 |
|
|
|
|
|
| 23 |
|
|
|
|
|
| 31(a) |
|
|
|
|
|
| 31(b) |
|
|
|
|
|
| 32(a) |
|
|
|
|
|
|
|
|
|
|
|
|
|
|
| 32(b) |
|
|
|
|
|
| 97 |
|
|
|
|
|
| 101.INS |
|
Inline XBRL Instance Document (filed herewith). |
|
|
|
| 101.SCH |
|
Inline XBRL Taxonomy Extension Schema Document (filed herewith). |
|
|
|
| 101.CAL |
|
Inline XBRL Taxonomy Extension Calculation Linkbase Document (filed herewith). |
|
|
|
| 101.DEF |
|
Inline XBRL Taxonomy Extension Definition Linkbase Document (filed herewith). |
|
|
|
| 101.LAB |
|
Inline XBRL Taxonomy Extension Label Linkbase Document (filed herewith). |
|
|
|
| 101.PRE |
|
Inline XBRL Taxonomy Extension Presentation Linkbase Document (filed herewith). |
|
|
|
| 104 |
|
Cover Page Interactive Data File (formatted as Inline XBRL document and included in Exhibit 101). |
|
|
|
* Denotes management contract or compensatory plan.
† Certain of the exhibits and schedules to this Exhibit have been omitted in accordance with Regulation S-K Item 601(a)(5), and the Company agrees to furnish a copy of all omitted exhibits and schedules to the SEC upon its request.
SCHEDULE II — VALUATION AND QUALIFYING ACCOUNTS
|
|
|
|
|
|
|
|
|
|
|
|
|
|
|
|
|
|
|
|
|
|
|
|
|
|
|
|
|
|
|
|
|
|
|
|
|
|
|
| |
|
|
|
Additions |
Deductions |
|
| Description (in thousands) |
|
Balance at Beginning of Period |
Charged to Costs and Expenses |
|
Charged to Other Accounts (1) |
Charged to Costs and Expenses |
|
Charged to Other Accounts (2) |
Balance at End of Period |
| Year Ended August 31, 2024 |
|
|
|
|
|
|
|
|
|
|
|
|
| Allowance for doubtful accounts |
|
$ |
4,135 |
|
|
$ |
605 |
|
|
$ |
405 |
|
|
$ |
— |
|
|
$ |
(1,651) |
|
|
$ |
3,494 |
|
| Deferred tax valuation allowance |
|
$ |
280,463 |
|
|
$ |
1,537 |
|
|
$ |
— |
|
|
$ |
(25,174) |
|
|
$ |
— |
|
|
$ |
256,826 |
|
| Year Ended August 31, 2023 |
|
|
|
|
|
|
|
|
|
|
|
|
| Allowance for doubtful accounts |
|
$ |
4,990 |
|
|
$ |
463 |
|
|
$ |
157 |
|
|
$ |
— |
|
|
$ |
(1,475) |
|
|
$ |
4,135 |
|
| Deferred tax valuation allowance |
|
$ |
268,547 |
|
|
$ |
16,514 |
|
|
$ |
— |
|
|
$ |
(4,598) |
|
|
$ |
— |
|
|
$ |
280,463 |
|
| Year Ended August 31, 2022 |
|
|
|
|
|
|
|
|
|
|
|
|
| Allowance for doubtful accounts |
|
$ |
5,553 |
|
|
$ |
300 |
|
|
$ |
193 |
|
|
$ |
— |
|
|
$ |
(1,056) |
|
|
$ |
4,990 |
|
| Deferred tax valuation allowance |
|
$ |
278,099 |
|
|
$ |
3,328 |
|
|
$ |
— |
|
|
$ |
(12,880) |
|
|
$ |
— |
|
|
$ |
268,547 |
|
__________________________________
(1) Recoveries and translation adjustments.
(2) Uncollectible accounts charged to the allowance.
SIGNATURES
Pursuant to the requirements of Section 13 or 15(d) of the Securities Exchange Act of 1934, the registrant has duly caused this report to be signed on its behalf by the undersigned, thereunto duly authorized.
|
|
|
|
|
|
|
|
|
|
|
|
|
|
|
| |
|
|
|
|
| |
COMMERCIAL METALS COMPANY
|
|
| |
By |
/s/ Peter R. Matt |
|
| |
|
Peter R. Matt |
|
| |
|
President and Chief Executive Officer |
|
|
|
Date: |
October 17, 2024 |
|
| |
|
|
|
|
Pursuant to the requirements of the Securities Exchange Act of 1934, this report has been signed below by the following persons on behalf of the registrant and in the capacities and on the dates indicated:
|
|
|
|
|
|
|
|
|
|
|
|
|
|
|
|
|
|
|
|
|
| /s/ Peter R. Matt |
|
/s/ Robert S. Wetherbee |
|
|
| |
|
|
|
|
| Peter R. Matt, October 17, 2024 |
|
Robert S. Wetherbee, October 17, 2024 |
|
|
| President, Chief Executive Officer and Director |
|
Chairman of the Board |
|
|
| (Principal Executive Officer) |
|
|
|
|
|
|
|
|
|
| /s/ Sarah E. Raiss |
|
/s/ Charles L. Szews |
|
|
| |
|
|
|
|
| Sarah E. Raiss, October 17, 2024 |
|
Charles L. Szews, October 17, 2024 |
|
|
| Director |
|
Director |
|
|
| |
|
|
|
|
|
|
|
|
|
| /s/ John R. McPherson |
|
/s/ Lisa M. Barton |
|
|
|
|
|
|
|
| John R. McPherson, October 17, 2024 |
|
Lisa M. Barton, October 17, 2024 |
|
|
| Director |
|
Director |
|
|
| |
|
|
|
|
|
|
|
|
|
| /s/ Gary E. McCullough |
|
/s/ Dennis V. Arriola |
|
|
|
|
|
|
|
| Gary E. McCullough, October 17, 2024 |
|
Dennis V. Arriola, October 17, 2024 |
|
|
| Director |
|
Director |
|
|
|
|
|
|
|
|
|
|
|
|
| /s/ Tandra C. Perkins |
|
/s/ Paul J. Lawrence |
|
|
| |
|
|
|
|
| Tandra C. Perkins, October 17, 2024 |
|
Paul J. Lawrence, October 17, 2024 |
|
|
| Director |
|
Senior Vice President and Chief Financial Officer |
|
|
|
|
(Principal Financial Officer) |
|
|
|
|
|
|
|
|
|
/s/ Lindsay L. Sloan |
|
|
|
|
|
|
|
|
|
Lindsay L. Sloan, October 17, 2024 |
|
|
|
|
Vice President and Chief Accounting Officer |
|
|
|
|
(Principal Accounting Officer) |
|
|
EX-19
3
insidertradingpolicy-ex1.htm
EX-19
insidertradingpolicy-ex1

Statement of Company Policy On Insider Trading and Anti-Hedging Commercial Metals Company (the “Company”) and federal securities laws prohibit the purchase or sale of securities, including common stock, options to purchase common stock, preferred stock, bonds and other debt securities, convertible debentures, warrants and any other types of securities the Company may issue, as well as derivative securities not issued by the Company such as exchange-traded put or call options or swaps relating to securities of the Company (collectively, “securities”), while aware of material nonpublic information, or the disclosure of material nonpublic information to others who then trade in the securities, of the Company. Insider trading violations are pursued vigorously by the Securities and Exchange Commission (the “SEC”), the Financial Industry Regulatory Authority and the U.S. Attorney’s Office and are punished severely. While the regulatory authorities concentrate their efforts on the individuals who trade, or who disclose or “tip” inside information to others who trade, the federal securities laws also impose potential liability on companies and other “controlling persons” if they fail to take reasonable steps to prevent insider trading by company personnel. This Statement of Company Policy on Insider Trading and Anti-Hedging (this “Policy”) has been adopted both to promote compliance with federal securities laws and confirm the procedures which employees and directors of the Company must follow with respect to transactions in the Company’s securities and to help Company personnel avoid the severe consequences associated with violations of the insider trading laws. This Policy is also intended to prevent the appearance of improper conduct on the part of anyone employed by or associated with the Company (not just so-called insiders). We have all worked hard over the years to establish a reputation for integrity and ethical conduct, and violations of insider trading laws, or the appearance of trading improprieties, could result in costly damage to our hard-earned reputation. The Consequences The consequences of an insider trading violation can be severe: Traders and Tippers. Company personnel (or their tippees) who trade on inside information may be subject to the following penalties: • A civil penalty of up to three times the profit gained or loss avoided; • A criminal fine of up to $5,000,000 (no matter how small the profit); and • A jail term of up to twenty years. An employee who tips material nonpublic information to a person who then trades (a “tippee”) is subject to the same penalties as the tippee, even if such employee did not trade or profit from the tippee’s trading. Control Persons. The Company and its supervisory personnel, if they fail to take appropriate steps to prevent illegal insider trading, may be subject to the following penalties: • A civil penalty of up to $1,000,000 or, if greater, three times the profit gained or loss avoided as a result of the employee’s violation; and • A criminal penalty of up to $5,000,000 dollars. Additionally, an employee’s failure to comply with this Policy may subject the employee to disciplinary

2 actions, including dismissal for cause, whether or not the employee’s failure to comply results in a violation of law. Statement of Policy It is the policy of the Company that no director, officer or other employee of the Company who is aware of material nonpublic information relating to the Company may, directly or through family members or other persons or entities: • Buy, gift or sell securities of the Company (other than pursuant to a pre-approved trading plan that complies with SEC Rule 10b5-1 (such plan, a “trading plan”)); • engage in any other action to take personal advantage of such information; or • pass such information on to others outside the Company, including family and friends. In addition, it is the policy of the Company that no director, officer or other employee of the Company who, in the course of working for the Company, learns of material nonpublic information about a company with which the Company does business, including a customer or supplier of the Company, may trade, directly or through family members or other persons or entities, in such other company’s securities until the applicable information becomes public or is no longer material. Transactions that may be necessary or justifiable for independent reasons (such as the need to raise money for an emergency expenditure) are not exempt from this Policy. The securities laws do not recognize such mitigating circumstances, and, in any event, even the appearance of an improper transaction must be avoided to preserve the Company’s reputation for adhering to the highest standards of conduct. Needless to say, a violation of law, or even an SEC investigation that does not result in prosecution, can tarnish one’s reputation and irreparably damage a career. Disclosure Of Information To Others. The Company is required under Regulation FD of the federal securities laws to avoid the selective disclosure of material nonpublic information. The Company has established procedures for releasing material information in a manner that is designed to meet the Company’s obligations for timely disclosure and achieve broad public dissemination of the information immediately upon its release. You may not, therefore, disclose material information to anyone outside the Company, including family members and friends, unless previously publicly disclosed by the Company. You also may not discuss the Company or its business in an internet “chat room”, on social media platforms or similar internet-based forums. Any discussions of material information about the Company or its business outside the provisions of this Policy could lead to liability for the insider (tipper) as well as the outsider (tippee). Material Information. Material information is any information that a reasonable investor would consider of significance, as part of the total mix of available information, in making a decision to buy, hold, or sell securities. Information may be significant for this purpose even if it would not alone determine the investor’s decision. Any information that could be expected to affect the Company’s stock price, whether it is positive or negative, should be considered material. Some other examples of information that ordinarily would be regarded as material are: • Projections of future earnings or losses, or other earnings guidance; • Internal financial information that is inconsistent with the consensus expectations of the investment community; • Financial or key operating data for significant operations or each business segment;

3 • Major changes in accounting methods or policies; • A pending or proposed merger, acquisition or tender offer, an important financing transaction, or other major transaction with another company or entity, such as a joint venture or significant licensing agreement; • A pending or proposed acquisition or disposition of a significant asset; • Stock repurchase programs, a change in dividend policy, the declaration of a stock split, or an offering of additional securities; • A change in executive management or board of directors; • Development of a significant new product or process; • The existence of severe liquidity problems; • Current or pending litigation or governmental action; • Disruptions in operations or losses, or other unauthorized access of Company property or systems; • Cybersecurity risks and incidents, including vulnerabilities and breaches; • The gain or loss of a significant customer or supplier; and • The extent to which external events, such as a pandemic or other worldwide, market or industry event, have had or will have a material impact on the Company’s operating results. Note that this list is merely illustrative and not exhaustive. Twenty-Twenty Hindsight. Anyone scrutinizing your transactions will be doing so after the fact, with the benefit of hindsight. As a practical matter, before engaging in any transaction, you should carefully consider how enforcement authorities and others might view the transaction in hindsight. When Information is “Public”. “Nonpublic” means information that has not yet been disclosed generally to the marketplace. If you are aware of material nonpublic information, you may not trade until the information has been disclosed broadly to the marketplace (such as by press release or an SEC filing) and the investing public has had time to absorb the information fully. To avoid the appearance of impropriety, as a general rule, information should not be considered fully absorbed by the marketplace until the second trading day after the information is released. For purposes of this Policy, a “trading day” shall mean any day on which the New York Stock Exchange (the “NYSE”) is open for trading. If, for example, the Company were to make an announcement on a Monday, and the NYSE is open for trading on Tuesday, you should not trade in the Company’s securities until Wednesday. If an announcement were made on a Friday, and the NYSE is open for trading on the following Monday, Tuesday generally would be the first eligible trading day. Transactions by Family Members. This Policy also applies to your family members who reside with you, anyone else who lives in your household, and any family members who do not live in your household but whose transactions in company securities are directed by you or are subject to your influence or control (such as parents, children, siblings, or in-laws who consult with you before they trade in company

4 securities). You are responsible for the transactions of these other persons and therefore should make them aware of the need to confer with you before they trade in the Company’s securities. Transactions by Entities that You Influence or Control. This Policy also applies to any entities that you influence or control, including any corporations, partnerships or trusts (collectively referred to as “Controlled Entities”), and transactions by these Controlled Entities should be treated for the purposes of this Policy and applicable securities laws as if they were for your own account. Transactions Under Company Plans Stock Option Exercises. This Policy does not apply to the exercise of an employee stock option, or, if permitted by the plan and option agreement, to the election to withhold shares subject to an option to satisfy tax withholding requirements. This Policy does apply, however, to any sale of stock as part of a broker-assisted “cashless” exercise of an option, or any other sale of the Company’s stock for the purpose of generating the cash needed to pay the exercise price of an option. Employee Stock Purchase Plan. This Policy does not apply to purchases of Company stock in the general employee stock purchase plan resulting from your periodic contribution of money to the plan pursuant to the election you made at the time of your enrollment in the plan. Rule 10b-5-1 Trading Plan Guidelines From time to time, officers, directors and employees of the Company may enter into trading plans with respect to our securities. This Policy requires that such trading plans (i) comply with all requirements of SEC Rule 10b5-1, which provides an affirmative defense against a claim of insider trading if an insider’s trades are made pursuant to a written plan that was adopted or modified in good faith at a time when the insider was not aware of material nonpublic information, including the requirements set forth below, and (ii) be expressly authorized by the Company’s Chief Legal Officer. Additionally, insiders must report any modification or termination of a trading plan to the Company’s Chief Legal Officer on the date of such modification or termination. Directors, officers and certain key employees are subject to additional restrictions on their transactions in Company securities, including compliance with prohibitions on trading during scheduled and event-specific blackout periods and the obligation to first obtain pre-clearance from the Company’s Chief Legal Officer before engaging in any transaction in securities, which are described in a separate memorandum. Cooling-Off Periods. You may only enter into a trading plan when you are not in possession of material non-public information. If you enter into a trading plan, you will be subject to a cooling-off period, which is the time between the adoption or modification of a trading plan and when the first trade under such plan may occur. With respect to directors and officers, the applicable cooling-off period is the later of (i) 90 days after the adoption or modification of the trading plan or (ii) two business days following the filing of the Form 10-Q or Form 10-K for the fiscal quarter in which the plan was adopted or modified. In any event, the required cooling-off period is not to exceed 120 days following adoption or modification of the trading plan. With respect to persons other than directors or officers, the applicable cooling-off period is 30 days after the adoption or modification of the trading plan. Multiple Overlapping Plans. You generally will be prohibited from having more than one trading plan for open market purchases or sales of the Company’s securities. You may maintain two separate trading plans for open market purchases or sales of the Company’s securities if trading under the later-commencing plan is not authorized to begin until after all trades under the earlier-commencing plan are completed or expire without execution. If the first trading plan is terminated early, the first trade under the later- commencing plan, however, must not be scheduled to occur until after the effective cooling-off period following the termination of the earlier trading plan.

5 Multiple Single-Use Plans. In any 12-month period, you are limited to one “single-trade plan”, which is a trading plan designed to effect the open market purchase or sale of the total amount of the securities subject to the plan as a single transaction. A trading plan will not be treated as a single-trade plan if, for example, it gives your agent discretion over whether to execute the trading plan as a single transaction, or provides that your agent’s future acts will depend on events or data not known at the time the plan is entered into and it is reasonably foreseeable at the time the trading plan is entered into that the trading plan might result in multiple trades. Certifications. When adopting a new or modified trading plan, a director, officer or other employee must also certify that he or she is (i) not aware of material nonpublic information about the Company or its securities at the time of entering into or modifying the trading plan and (ii) adopting or modifying the trading plan in good faith and not as part of a plan or scheme to evade the prohibitions of SEC Rule 10b-5. Additional Prohibited Transactions. The Company considers it improper and inappropriate for any director, officer or other employee of the Company to engage in short-term or speculative transactions in the Company’s securities. It therefore is the Company’s policy that directors, officers and other employees may not engage in any of the following transactions: Short Sales. Short sales of the Company’s securities evidence an expectation on the part of the seller that the securities will decline in value, and therefore signal to the market that the seller has no confidence in the Company or its short-term prospects. In addition, short sales may reduce the seller’s incentive to improve the Company’s performance. For these reasons, short sales of the Company’s securities are prohibited by this Policy. In addition, Section 16(b) of the Securities Exchange Act of 1934 prohibits certain officers and directors from engaging in short sales. Publicly Traded Options. A transaction in options is, in effect, a bet on the short-term movement of the Company’s stock and therefore creates the appearance that the director or employee is trading based on inside information. Transactions in options also may focus the director’s or employee’s attention on short-term performance at the expense of the Company’s long-term objectives. Accordingly, transactions in puts, calls, forwards, futures or other derivative securities on an exchange or in any other organized market, are prohibited by this Policy. Hedging Transactions. Certain forms of hedging or monetization transactions, such as zero-cost collars and forward sale contracts, allow a director or employee to lock in much of the value of his or her stock holdings, often in exchange for all or part of the potential for upside appreciation in the stock. These transactions allow the director or employee to continue to own the covered securities, but without the full risks and rewards of ownership. When that occurs, the director or employee may no longer have the same objectives as the Company’s other shareholders. Therefore, the Company strictly prohibits you from engaging in any hedging of the Company’s stock. Margin Accounts and Pledges. Securities held in a margin account may be sold by the broker without the customer’s consent if the customer fails to meet a margin call. Similarly, securities pledged (or hypothecated) as collateral for a loan may be sold in foreclosure if the borrower defaults on the loan. Directors, officers and other employees are prohibited from holding Company securities in a margin account or pledging Company securities as collateral for a loan. Post-Termination Transactions. This Policy and federal and state security laws continues to apply to your transactions in Company securities, or the securities of other public companies with which the Company does business, even after your directorship or employment with the Company has been terminated. If you are in possession of material nonpublic information when your relationship terminates, you may not trade in Company securities until that information has become public or is no longer material.

6 Company Assistance. Any person who has a question about this Policy or its application to any proposed transaction may obtain additional guidance from the Company’s Chief Legal Officer. Ultimately, however, the responsibility for adhering to this Policy and avoiding unlawful transactions rests with the individual director, officer or other employee. In all cases, the responsibility for determining whether a director, officer or other employee is in possession of material nonpublic information rests with that individual, and any action on the part of the Company, the Company’s Chief Legal Officer or any other employee or director pursuant to this Policy (or otherwise) does not in any way constitute legal advice or insulate any director, officer or other employee from liability under applicable securities laws. Policy Certification. All directors and employees must certify their understanding of and intent to comply with this Policy. This will be accomplished as a part of the certification related to the Code of Business Conduct and Ethics distributed annually. Directors, officers and certain key employees are subject to additional restrictions on their transactions in Company securities, which are described in a separate memorandum. Jody Absher SVP, Chief Legal Officer and Corporate Secretary