| (Exact name of registrant as specified in its charter) | ||
| Delaware | 1-5823 | 36-6169860 | ||||||||||||
| (State or other jurisdiction | (Commission | (IRS Employer | ||||||||||||
| of incorporation) | File Number) | Identification No.) | ||||||||||||
| NOT APPLICABLE | ||
| (Former name or former address, if changed since last report.) | ||
| Title of each class | Trading Symbol(s) | Name of each exchange on which registered | ||||||||||||
| Common Stock, Par value $2.50 | "CNA" | New York Stock Exchange | ||||||||||||
| Chicago Stock Exchange | ||||||||||||||
| Exhibit No. | Description | |||||||
| CNA Financial Corporation press release, issued February 10, 2025, providing information on the fourth quarter and year ended December 31, 2024 results of operations. | ||||||||
| CNA Financial Corporation financial supplement, posted on its website February 10, 2025, providing supplemental financial information on the fourth quarter and year ended December 31, 2024. | ||||||||
| CNA Financial Corporation earnings presentation, posted on its website February 10, 2025, providing information on the fourth quarter and year ended December 31, 2024. | ||||||||
| CNA Financial Corporation earnings remarks, posted on its website February 10, 2025, providing information on the fourth quarter and year ended December 31, 2024. | ||||||||
| 104 | Cover Page Interactive Data File (embedded within the Inline XBRL document) | |||||||
| CNA Financial Corporation | ||||||||
| (Registrant) | ||||||||
| Date: February 10, 2025 | By | /s/ Scott R. Lindquist | ||||||
| (Signature) | ||||||||
| Scott R. Lindquist Executive Vice President and Chief Financial Officer |
||||||||

| Results for the Three Months Ended December 31 | Results for the Year Ended December 31 | ||||||||||||||||||||||
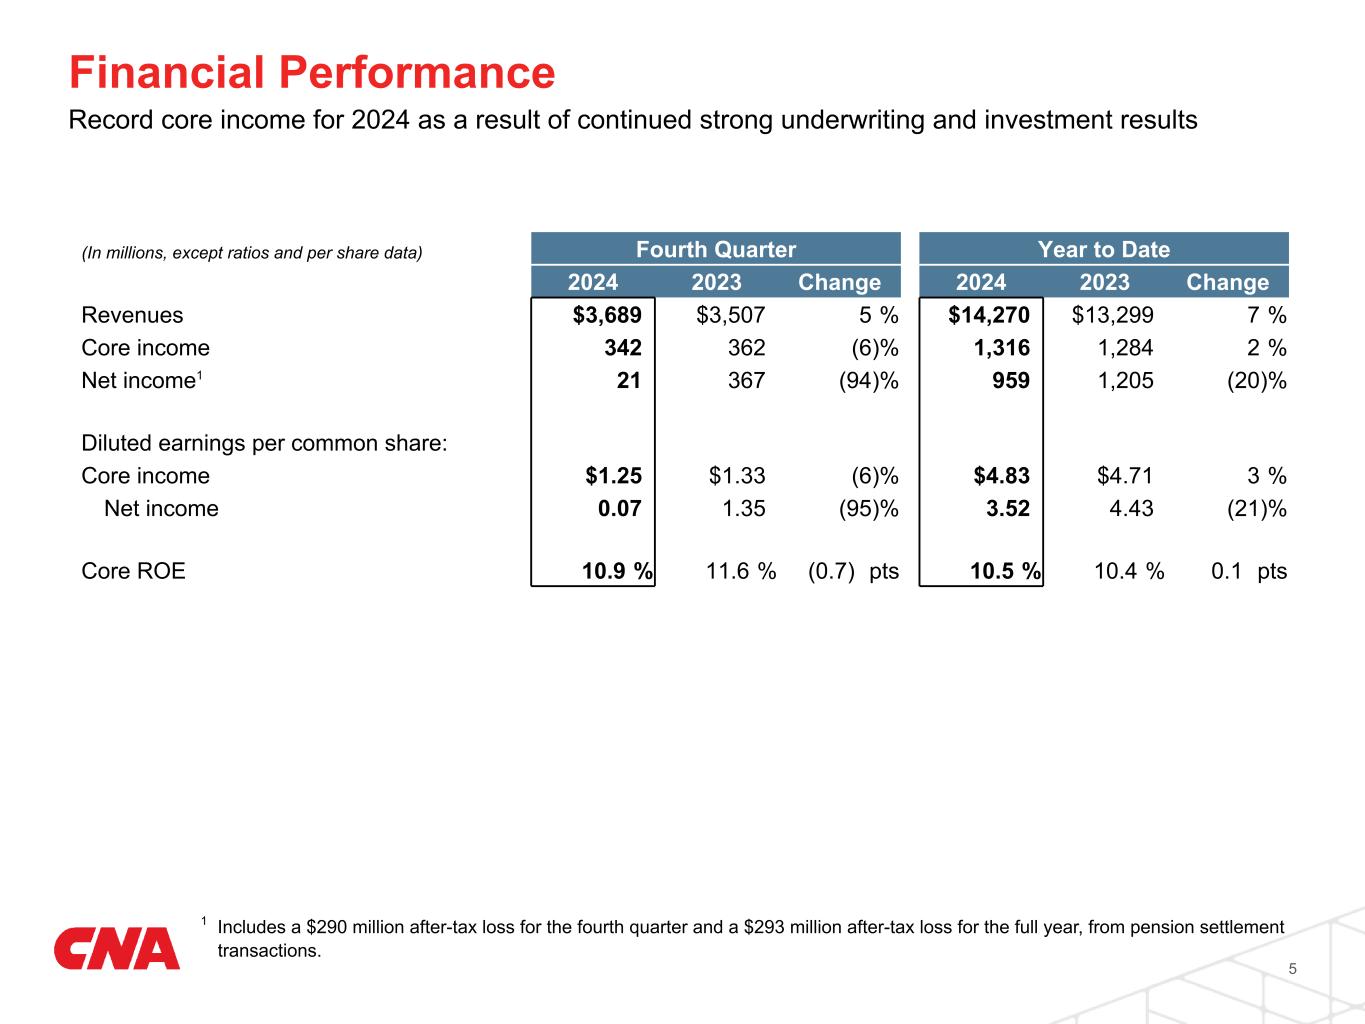
| ($ millions, except per share data) | 2024 | 2023 | 2024 | 2023 | |||||||||||||||||||
| Net income | $ | 21 | $ | 367 | $ | 959 | $ | 1,205 | |||||||||||||||
Core income (a) |
342 | 362 | 1,316 | 1,284 | |||||||||||||||||||
| Net income per diluted share | $ | 0.07 | $ | 1.35 | $ | 3.52 | $ | 4.43 | |||||||||||||||
| Core income per diluted share | 1.25 | 1.33 | 4.83 | 4.71 | |||||||||||||||||||
| December 31, 2024 | December 31, 2023 | ||||||||||||||||
| Book value per share | $ | 38.82 | $ | 36.52 | |||||||||||||
| Book value per share excluding AOCI | 46.16 | 46.39 | |||||||||||||||
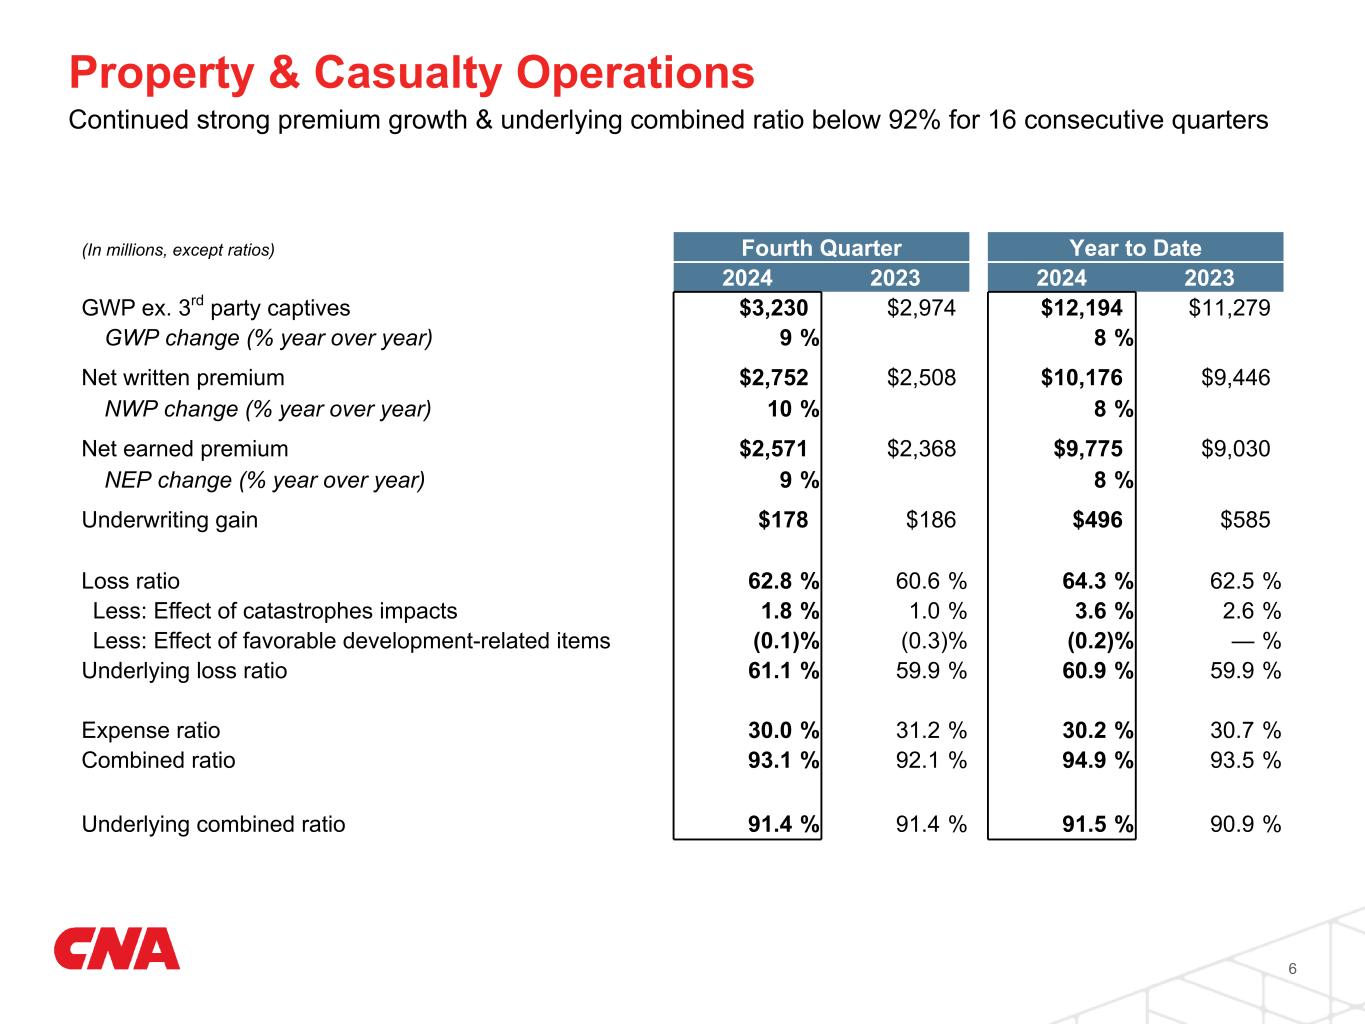
| Results for the Three Months Ended December 31 | Results for the Year Ended December 31 | ||||||||||||||||||||||||||||||||||
| ($ millions) | 2024 | 2023 | 2024 | 2023 | |||||||||||||||||||||||||||||||
Gross written premiums ex. 3rd party captives |
$ | 3,230 | $ | 2,974 | $ | 12,194 | $ | 11,279 | |||||||||||||||||||||||||||
GWP ex. 3rd party captives change (% year over year) |
9 | % | 8 | % | |||||||||||||||||||||||||||||||
| Net written premiums | $ | 2,752 | $ | 2,508 | $ | 10,176 | $ | 9,446 | |||||||||||||||||||||||||||
| NWP change (% year over year) | 10 | % | 8 | % | |||||||||||||||||||||||||||||||
| Net earned premiums | $ | 2,571 | $ | 2,368 | $ | 9,775 | $ | 9,030 | |||||||||||||||||||||||||||
| NEP change (% year over year) | 9 | % | 8 | % | |||||||||||||||||||||||||||||||
| Underwriting gain | $ | 178 | $ | 186 | $ | 496 | $ | 585 | |||||||||||||||||||||||||||
| Net investment income | $ | 400 | $ | 355 | $ | 1,490 | $ | 1,306 | |||||||||||||||||||||||||||
| Core income | $ | 451 | $ | 434 | $ | 1,549 | $ | 1,505 | |||||||||||||||||||||||||||
| Loss ratio | 62.8 | % | 60.6 | % | 64.3 | % | 62.5 | % | |||||||||||||||||||||||||||
| Less: Effect of catastrophe impacts | 1.8 | 1.0 | 3.6 | 2.6 | |||||||||||||||||||||||||||||||
| Less: Effect of favorable development-related items | (0.1) | (0.3) | (0.2) | — | |||||||||||||||||||||||||||||||
| Underlying loss ratio | 61.1 | % | 59.9 | % | 60.9 | % | 59.9 | % | |||||||||||||||||||||||||||
| Expense ratio | 30.0 | % | 31.2 | % | 30.2 | % | 30.7 | % | |||||||||||||||||||||||||||
| Combined ratio | 93.1 | % | 92.1 | % | 94.9 | % | 93.5 | % | |||||||||||||||||||||||||||
| Underlying combined ratio | 91.4 | % | 91.4 | % | 91.5 | % | 90.9 | % | |||||||||||||||||||||||||||
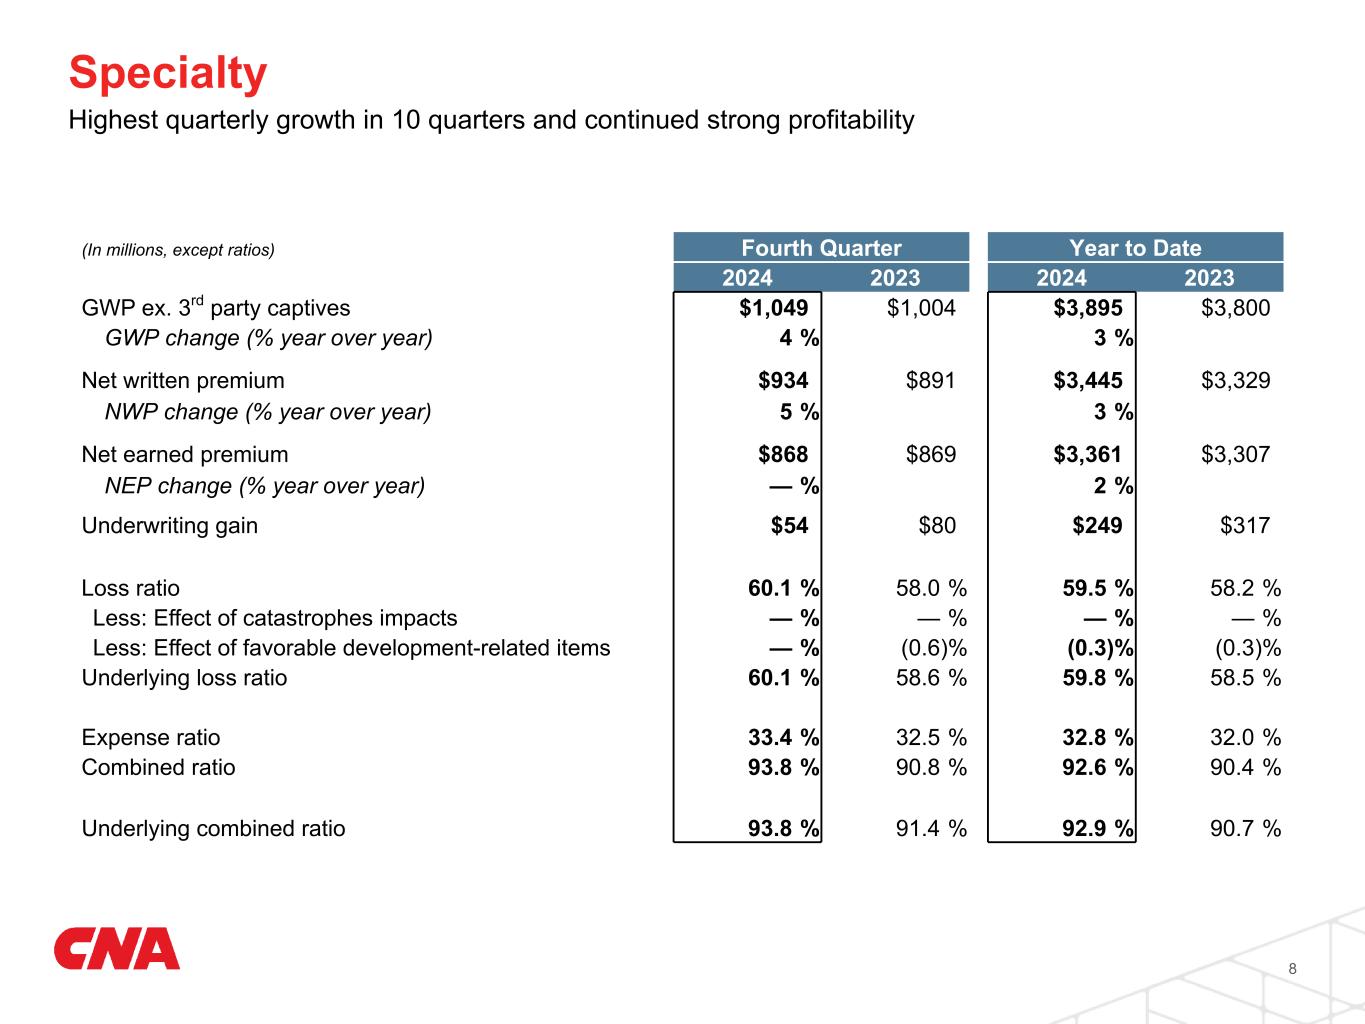
| Results for the Three Months Ended December 31 | Results for the Year Ended December 31 | ||||||||||||||||||||||||||||||||||
| ($ millions) | 2024 | 2023 | 2024 | 2023 | |||||||||||||||||||||||||||||||
Gross written premiums ex. 3rd party captives |
$ | 1,049 | $ | 1,004 | $ | 3,895 | $ | 3,800 | |||||||||||||||||||||||||||
GWP ex. 3rd party captives change (% year over year) |
4 | % | 3 | % | |||||||||||||||||||||||||||||||
| Net written premiums | $ | 934 | $ | 891 | $ | 3,445 | $ | 3,329 | |||||||||||||||||||||||||||
| NWP change (% year over year) | 5 | % | 3 | % | |||||||||||||||||||||||||||||||
| Net earned premiums | $ | 868 | $ | 869 | $ | 3,361 | $ | 3,307 | |||||||||||||||||||||||||||
| NEP change (% year over year) | — | % | 2 | % | |||||||||||||||||||||||||||||||
| Underwriting gain | $ | 54 | $ | 80 | $ | 249 | $ | 317 | |||||||||||||||||||||||||||
| Loss ratio | 60.1 | % | 58.0 | % | 59.5 | % | 58.2 | % | |||||||||||||||||||||||||||
| Less: Effect of catastrophe impacts | — | — | — | — | |||||||||||||||||||||||||||||||
| Less: Effect of favorable development-related items | — | (0.6) | (0.3) | (0.3) | |||||||||||||||||||||||||||||||
| Underlying loss ratio | 60.1 | % | 58.6 | % | 59.8 | % | 58.5 | % | |||||||||||||||||||||||||||
| Expense ratio | 33.4 | % | 32.5 | % | 32.8 | % | 32.0 | % | |||||||||||||||||||||||||||
| Combined ratio | 93.8 | % | 90.8 | % | 92.6 | % | 90.4 | % | |||||||||||||||||||||||||||
| Underlying combined ratio | 93.8 | % | 91.4 | % | 92.9 | % | 90.7 | % | |||||||||||||||||||||||||||
| Results for the Three Months Ended December 31 | Results for the Year Ended December 31 | ||||||||||||||||||||||||||||||||||
| ($ millions) | 2024 | 2023 | 2024 | 2023 | |||||||||||||||||||||||||||||||
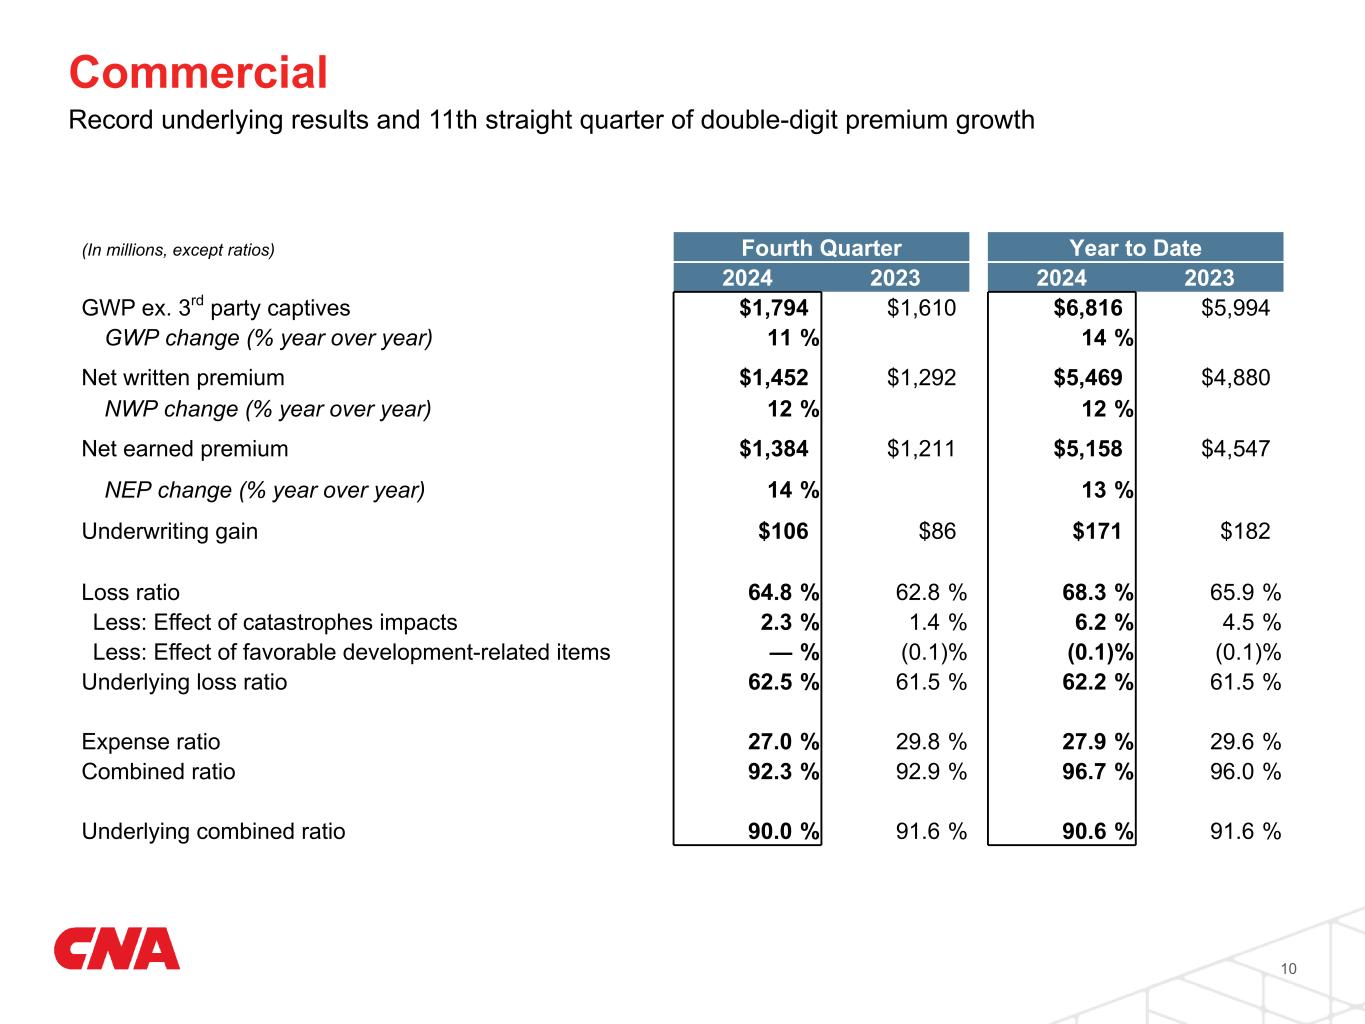
Gross written premiums ex. 3rd party captives |
$ | 1,794 | $ | 1,610 | $ | 6,816 | $ | 5,994 | |||||||||||||||||||||||||||
GWP ex. 3rd party captives change (% year over year) |
11 | % | 14 | % | |||||||||||||||||||||||||||||||
| Net written premiums | $ | 1,452 | $ | 1,292 | $ | 5,469 | $ | 4,880 | |||||||||||||||||||||||||||
| NWP change (% year over year) | 12 | % | 12 | % | |||||||||||||||||||||||||||||||
| Net earned premiums | $ | 1,384 | $ | 1,211 | $ | 5,158 | $ | 4,547 | |||||||||||||||||||||||||||
| NEP change (% year over year) | 14 | % | 13 | % | |||||||||||||||||||||||||||||||
| Underwriting gain | $ | 106 | $ | 86 | $ | 171 | $ | 182 | |||||||||||||||||||||||||||
| Loss ratio | 64.8 | % | 62.8 | % | 68.3 | % | 65.9 | % | |||||||||||||||||||||||||||
| Less: Effect of catastrophe impacts | 2.3 | 1.4 | 6.2 | 4.5 | |||||||||||||||||||||||||||||||
| Less: Effect of favorable development-related items | — | (0.1) | (0.1) | (0.1) | |||||||||||||||||||||||||||||||
| Underlying loss ratio | 62.5 | % | 61.5 | % | 62.2 | % | 61.5 | % | |||||||||||||||||||||||||||
| Expense ratio | 27.0 | % | 29.8 | % | 27.9 | % | 29.6 | % | |||||||||||||||||||||||||||
| Combined ratio | 92.3 | % | 92.9 | % | 96.7 | % | 96.0 | % | |||||||||||||||||||||||||||
| Underlying combined ratio | 90.0 | % | 91.6 | % | 90.6 | % | 91.6 | % | |||||||||||||||||||||||||||
| Results for the Three Months Ended December 31 | Results for the Year Ended December 31 | ||||||||||||||||||||||||||||||||||
| ($ millions) | 2024 | 2023 | 2024 | 2023 | |||||||||||||||||||||||||||||||
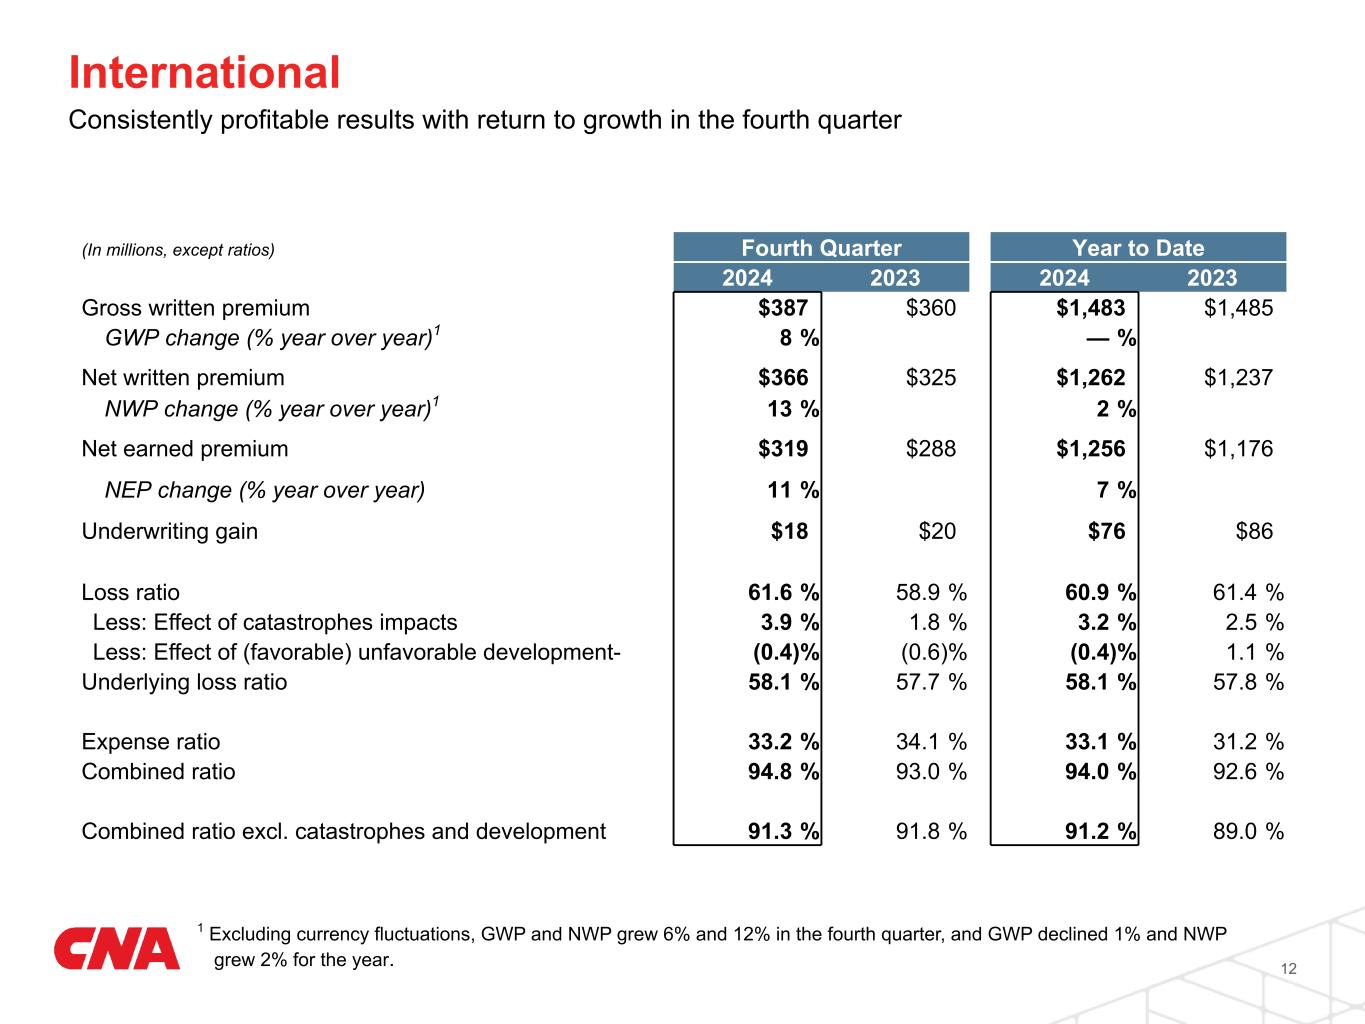
| Gross written premiums | $ | 387 | $ | 360 | $ | 1,483 | $ | 1,485 | |||||||||||||||||||||||||||
| GWP change (% year over year) | 8 | % | — | % | |||||||||||||||||||||||||||||||
| Net written premiums | $ | 366 | $ | 325 | $ | 1,262 | $ | 1,237 | |||||||||||||||||||||||||||
| NWP change (% year over year) | 13 | % | 2 | % | |||||||||||||||||||||||||||||||
| Net earned premiums | $ | 319 | $ | 288 | $ | 1,256 | $ | 1,176 | |||||||||||||||||||||||||||
| NEP change (% year over year) | 11 | % | 7 | % | |||||||||||||||||||||||||||||||
| Underwriting gain | $ | 18 | $ | 20 | $ | 76 | $ | 86 | |||||||||||||||||||||||||||
| Loss ratio | 61.6 | % | 58.9 | % | 60.9 | % | 61.4 | % | |||||||||||||||||||||||||||
| Less: Effect of catastrophe impacts | 3.9 | 1.8 | 3.2 | 2.5 | |||||||||||||||||||||||||||||||
| Less: Effect of (favorable) unfavorable development-related items | (0.4) | (0.6) | (0.4) | 1.1 | |||||||||||||||||||||||||||||||
| Underlying loss ratio | 58.1 | % | 57.7 | % | 58.1 | % | 57.8 | % | |||||||||||||||||||||||||||
| Expense ratio | 33.2 | % | 34.1 | % | 33.1 | % | 31.2 | % | |||||||||||||||||||||||||||
| Combined ratio | 94.8 | % | 93.0 | % | 94.0 | % | 92.6 | % | |||||||||||||||||||||||||||
| Underlying combined ratio | 91.3 | % | 91.8 | % | 91.2 | % | 89.0 | % | |||||||||||||||||||||||||||
| Results for the Three Months Ended December 31 | Results for the Year Ended December 31 | ||||||||||||||||||||||||||||||||||
| ($ millions) | 2024 | 2023 | 2024 | 2023 | |||||||||||||||||||||||||||||||
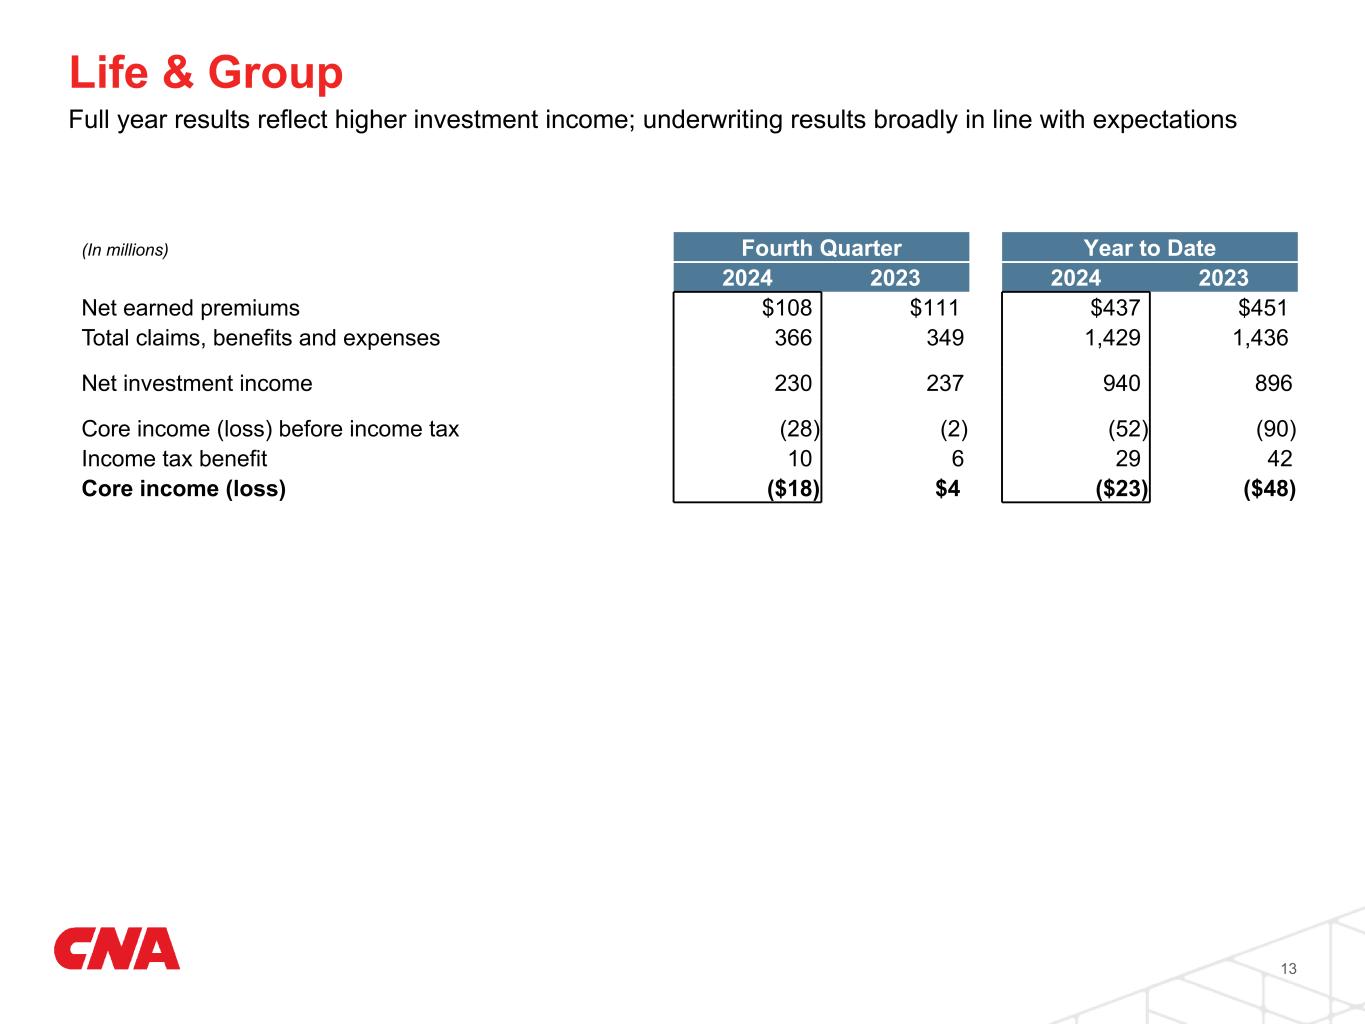
| Net earned premiums | $ | 108 | $ | 111 | $ | 437 | $ | 451 | |||||||||||||||||||||||||||
| Claims, benefits and expenses | 366 | 349 | 1,429 | 1,436 | |||||||||||||||||||||||||||||||
| Net investment income | $ | 230 | $ | 237 | $ | 940 | $ | 896 | |||||||||||||||||||||||||||
| Core (loss) income | $ | (18) | $ | 4 | $ | (23) | $ | (48) | |||||||||||||||||||||||||||
| Results for the Three Months Ended December 31 | Results for the Year Ended December 31 | ||||||||||||||||||||||||||||||||||
| ($ millions) | 2024 | 2023 | 2024 | 2023 | |||||||||||||||||||||||||||||||
| Insurance claims and policyholders' benefits | $ | 71 | $ | 50 | $ | 106 | $ | 82 | |||||||||||||||||||||||||||
| Interest expense | 32 | 33 | 133 | 126 | |||||||||||||||||||||||||||||||
| Net investment income | 14 | 19 | 67 | 62 | |||||||||||||||||||||||||||||||
| Core loss | (91) | (76) | (210) | (173) | |||||||||||||||||||||||||||||||
| Results for the Three Months Ended December 31 | Results for the Year Ended December 31 | ||||||||||||||||||||||||||||||||||
| 2024 | 2023 | 2024 | 2023 | ||||||||||||||||||||||||||||||||
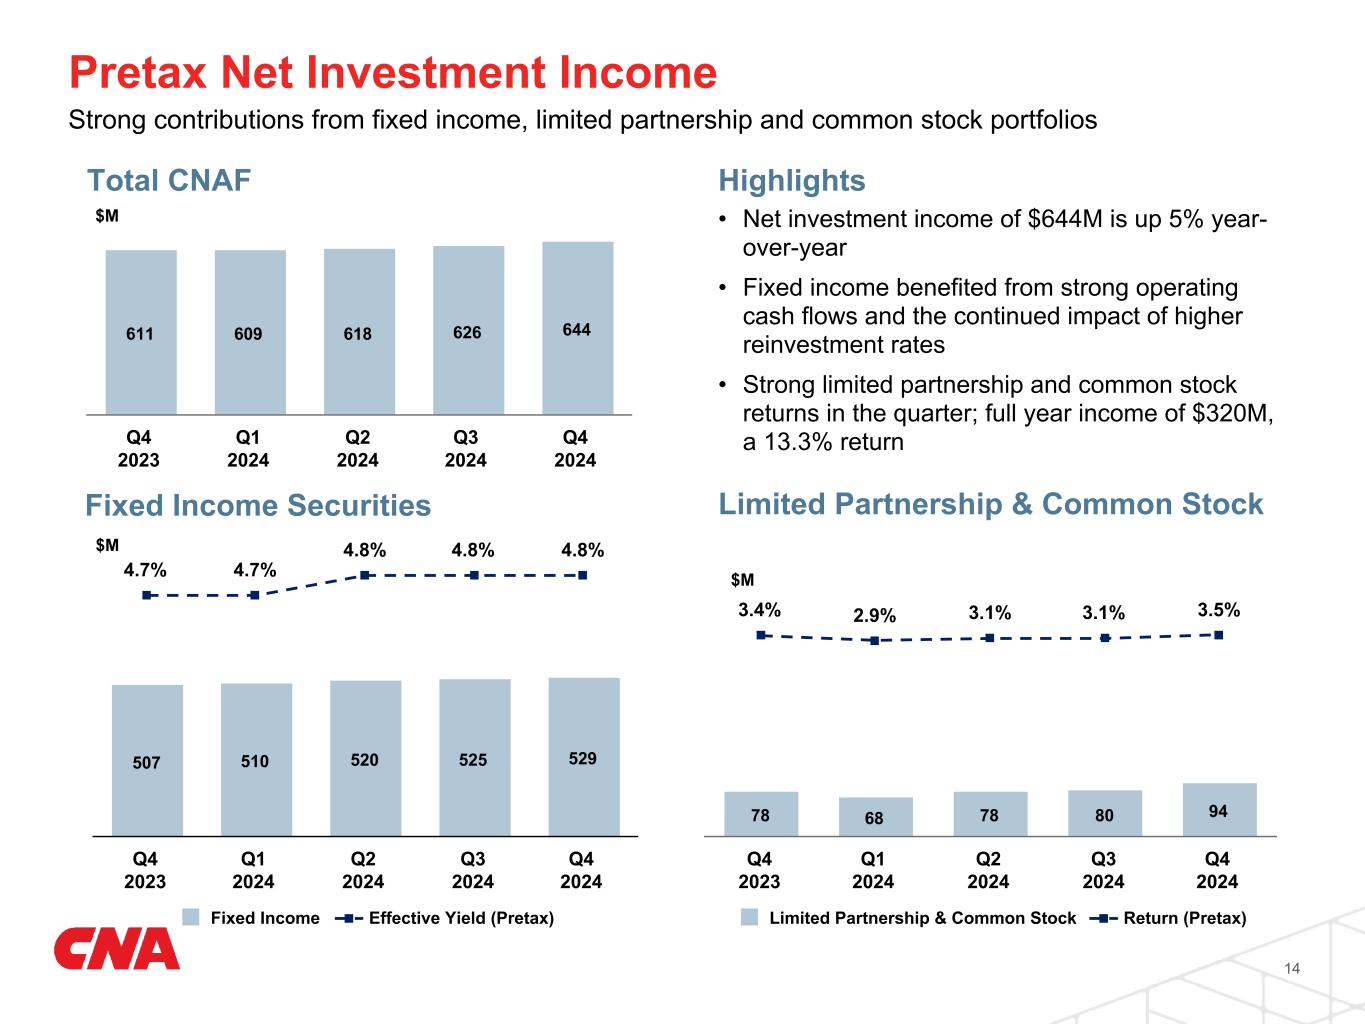
| Fixed income securities and other | $ | 550 | $ | 533 | $ | 2,177 | $ | 2,062 | |||||||||||||||||||||||||||
| Limited partnership and common stock investments | 94 | 78 | 320 | 202 | |||||||||||||||||||||||||||||||
| Net investment income | $ | 644 | $ | 611 | $ | 2,497 | $ | 2,264 | |||||||||||||||||||||||||||
| Media: | Analysts: | |||||||
Kelly Messina | Vice President, Marketing |
Ralitza K. Todorova | Vice President, Investor Relations & Rating Agencies |
|||||||
| 872-817-0350 | 312-822-3834 | |||||||
| Results for the Three Months Ended December 31 | Results for the Year Ended December 31 | ||||||||||||||||||||||
| ($ millions) | 2024 | 2023 | 2024 | 2023 | |||||||||||||||||||
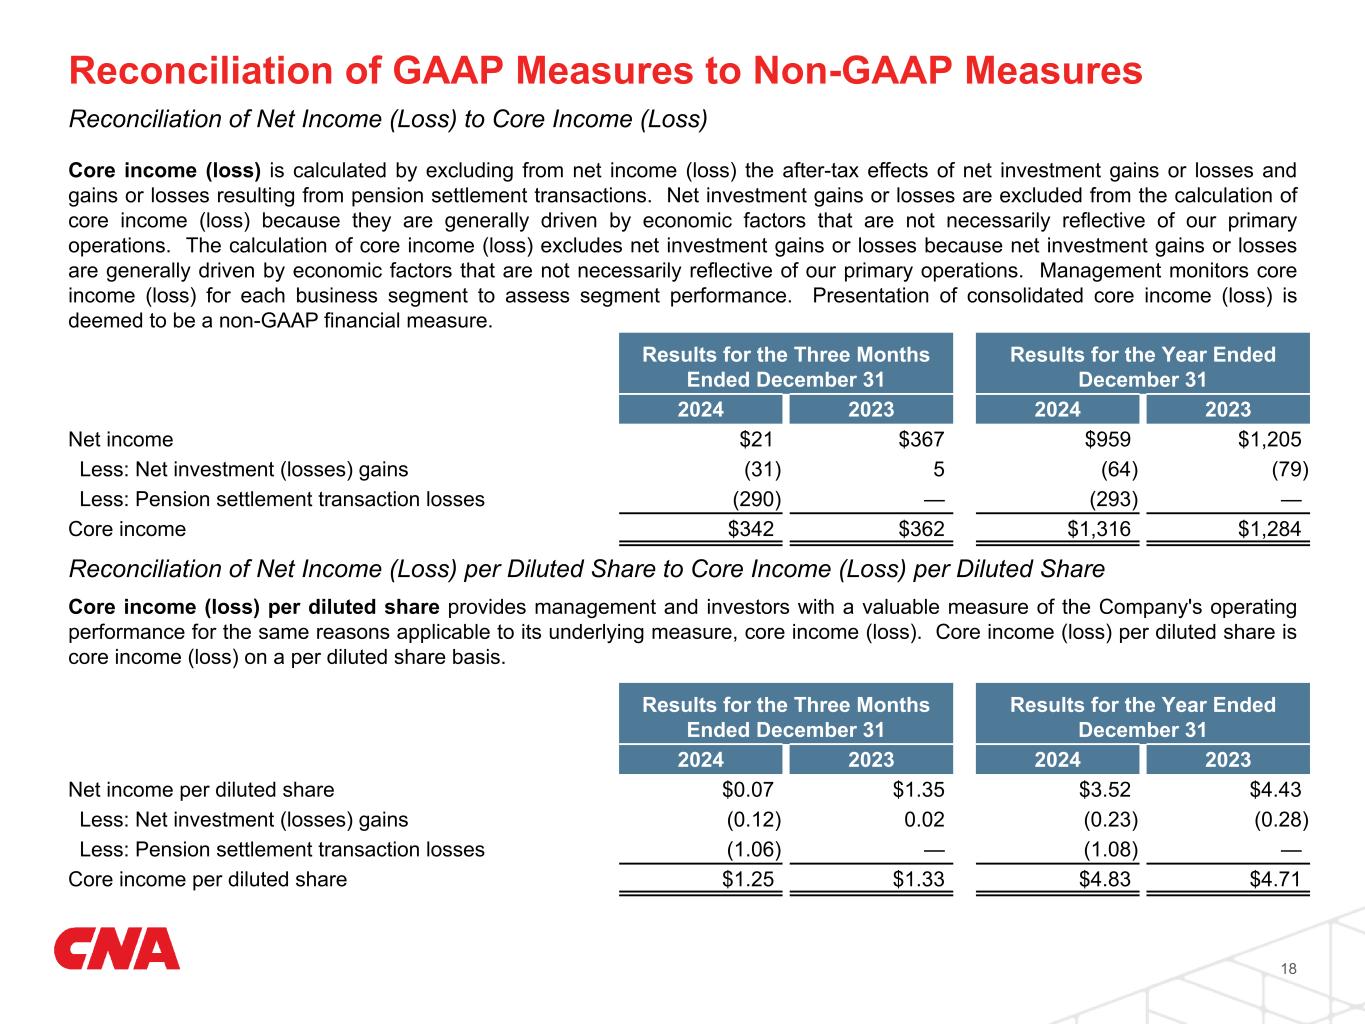
| Net income | $ | 21 | $ | 367 | $ | 959 | $ | 1,205 | |||||||||||||||
| Less: Net investment (losses) gains | (31) | 5 | (64) | (79) | |||||||||||||||||||
| Less: Pension settlement transaction losses | (290) | — | (293) | — | |||||||||||||||||||
| Core income | $ | 342 | $ | 362 | $ | 1,316 | $ | 1,284 | |||||||||||||||
| Results for the Three Months Ended December 31 | Results for the Year Ended December 31 | ||||||||||||||||||||||
| 2024 | 2023 | 2024 | 2023 | ||||||||||||||||||||
| Net income per diluted share | $ | 0.07 | $ | 1.35 | $ | 3.52 | $ | 4.43 | |||||||||||||||
| Less: Net investment (losses) gains | (0.12) | 0.02 | (0.23) | (0.28) | |||||||||||||||||||
| Less: Pension settlement transaction losses | (1.06) | — | (1.08) | — | |||||||||||||||||||
| Core income per diluted share | $ | 1.25 | $ | 1.33 | $ | 4.83 | $ | 4.71 | |||||||||||||||
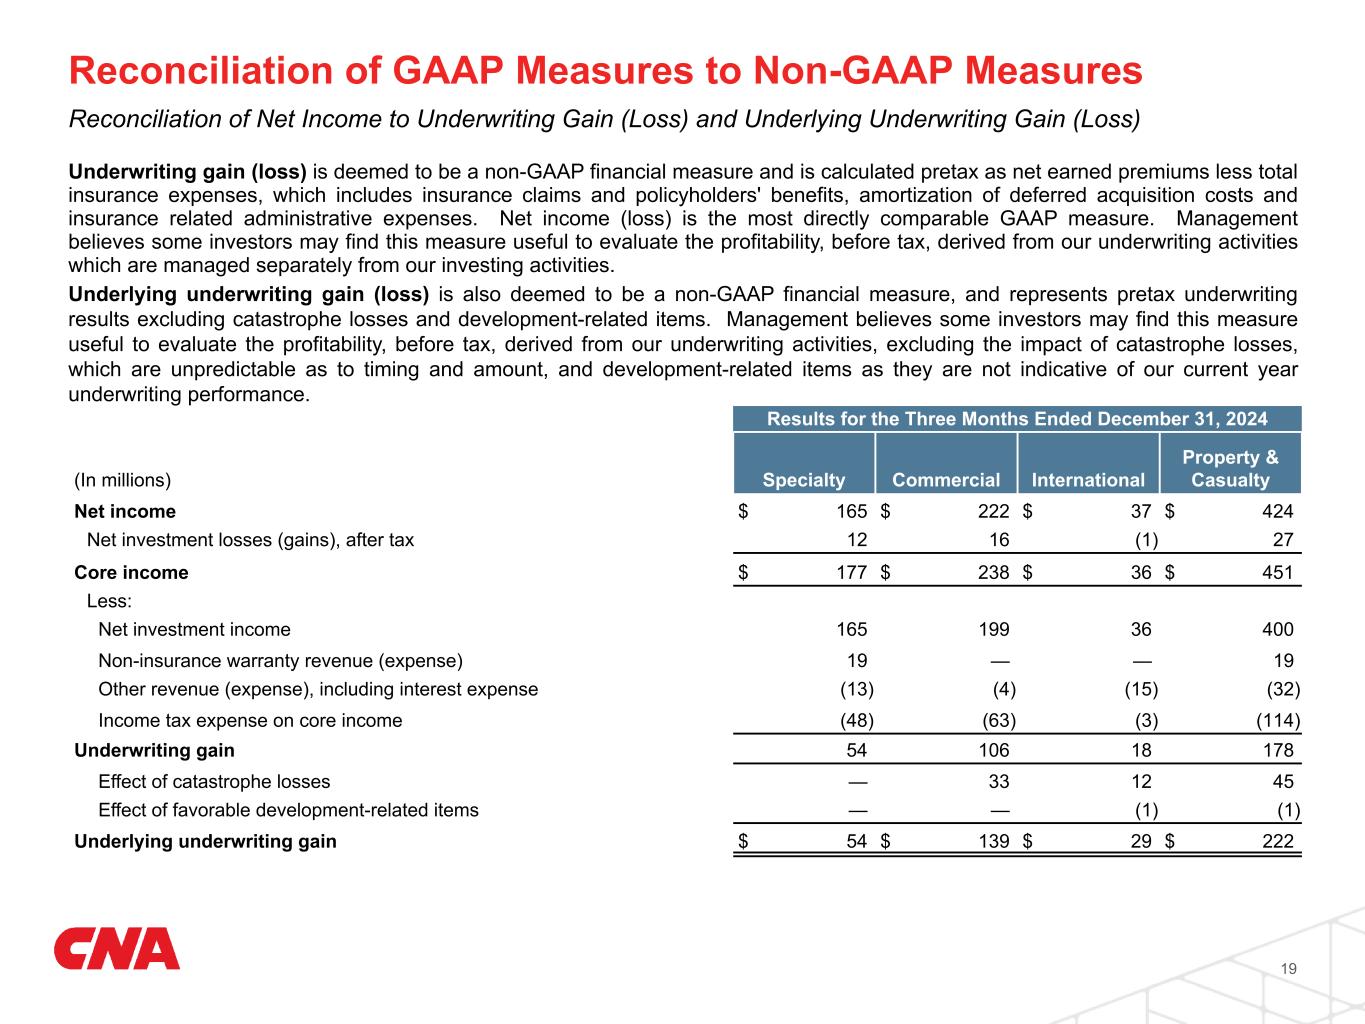
| Results for the Three Months Ended December 31, 2024 | ||||||||||||||
| Specialty | Commercial | International | Property & Casualty | |||||||||||
| (In millions) | ||||||||||||||
| Net income | $ | 165 | $ | 222 | $ | 37 | $ | 424 | ||||||
| Net investment losses (gains), after tax | 12 | 16 | (1) | 27 | ||||||||||
| Core income | $ | 177 | $ | 238 | $ | 36 | $ | 451 | ||||||
| Less: | ||||||||||||||
| Net investment income | 165 | 199 | 36 | 400 | ||||||||||
| Non-insurance warranty revenue (expense) | 19 | — | — | 19 | ||||||||||
| Other revenue (expense), including interest expense | (13) | (4) | (15) | (32) | ||||||||||
| Income tax expense on core income | (48) | (63) | (3) | (114) | ||||||||||
| Underwriting gain | 54 | 106 | 18 | 178 | ||||||||||
| Effect of catastrophe losses | — | 33 | 12 | 45 | ||||||||||
| Effect of favorable development-related items | — | — | (1) | (1) | ||||||||||
| Underlying underwriting gain | $ | 54 | $ | 139 | $ | 29 | $ | 222 | ||||||
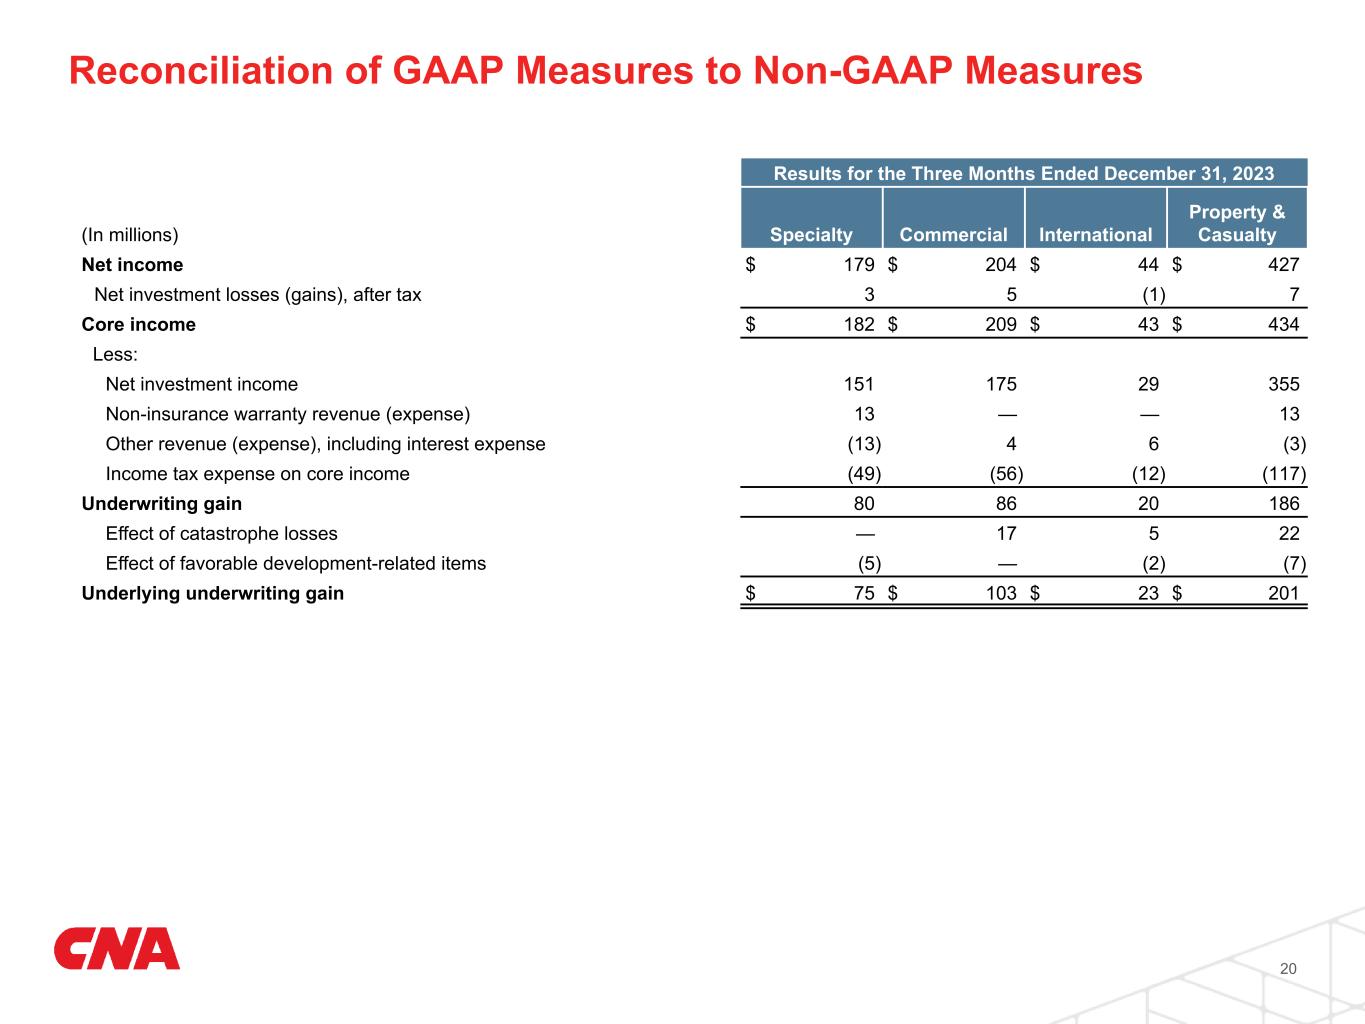
| Results for the Three Months Ended December 31, 2023 | ||||||||||||||
| Specialty | Commercial | International | Property & Casualty | |||||||||||
| (In millions) | ||||||||||||||
| Net income | $ | 179 | $ | 204 | $ | 44 | $ | 427 | ||||||
| Net investment losses (gains), after tax | 3 | 5 | (1) | 7 | ||||||||||
| Core income | $ | 182 | $ | 209 | $ | 43 | $ | 434 | ||||||
| Less: | ||||||||||||||
| Net investment income | 151 | 175 | 29 | 355 | ||||||||||
| Non-insurance warranty revenue (expense) | 13 | — | — | 13 | ||||||||||
| Other revenue (expense), including interest expense | (13) | 4 | 6 | (3) | ||||||||||
| Income tax expense on core income | (49) | (56) | (12) | (117) | ||||||||||
| Underwriting gain | 80 | 86 | 20 | 186 | ||||||||||
| Effect of catastrophe losses | — | 17 | 5 | 22 | ||||||||||
| Effect of favorable development-related items | (5) | — | (2) | (7) | ||||||||||
| Underlying underwriting gain | $ | 75 | $ | 103 | $ | 23 | $ | 201 | ||||||
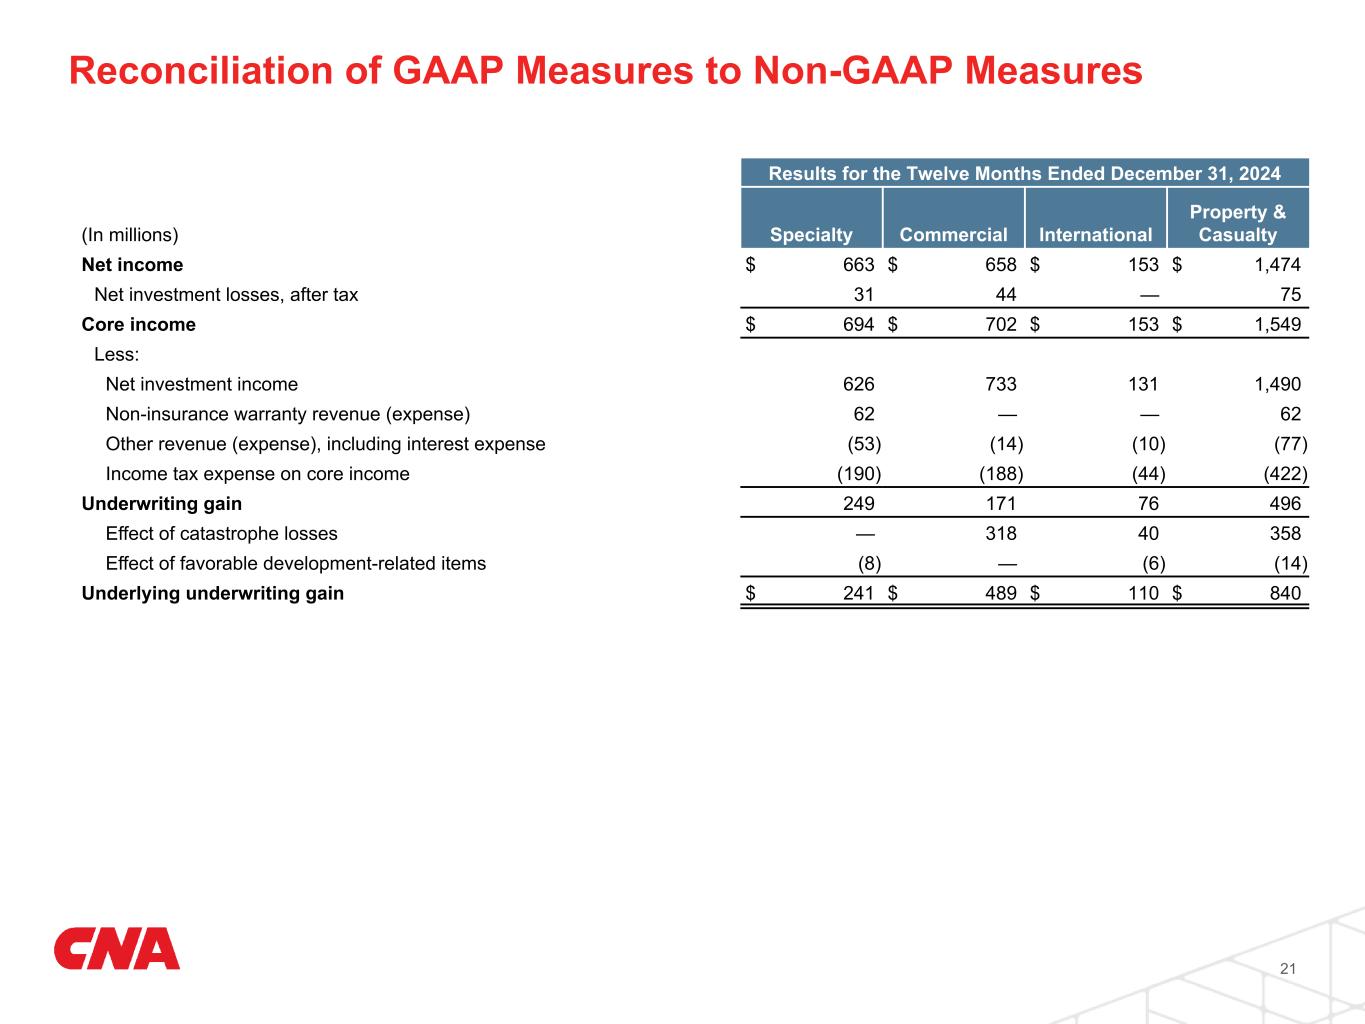
| Results for the Twelve Months Ended December 31, 2024 | ||||||||||||||
| Specialty | Commercial | International | Property & Casualty | |||||||||||
| (In millions) | ||||||||||||||
| Net income | $ | 663 | $ | 658 | $ | 153 | $ | 1,474 | ||||||
| Net investment losses, after tax | 31 | 44 | — | 75 | ||||||||||
| Core income | $ | 694 | $ | 702 | $ | 153 | $ | 1,549 | ||||||
| Less: | ||||||||||||||
| Net investment income | 626 | 733 | 131 | 1,490 | ||||||||||
| Non-insurance warranty revenue (expense) | 62 | — | — | 62 | ||||||||||
| Other revenue (expense), including interest expense | (53) | (14) | (10) | (77) | ||||||||||
| Income tax expense on core income | (190) | (188) | (44) | (422) | ||||||||||
| Underwriting gain | 249 | 171 | 76 | 496 | ||||||||||
| Effect of catastrophe losses | — | 318 | 40 | 358 | ||||||||||
| Effect of favorable development-related items | (8) | — | (6) | (14) | ||||||||||
| Underlying underwriting gain | $ | 241 | $ | 489 | $ | 110 | $ | 840 | ||||||
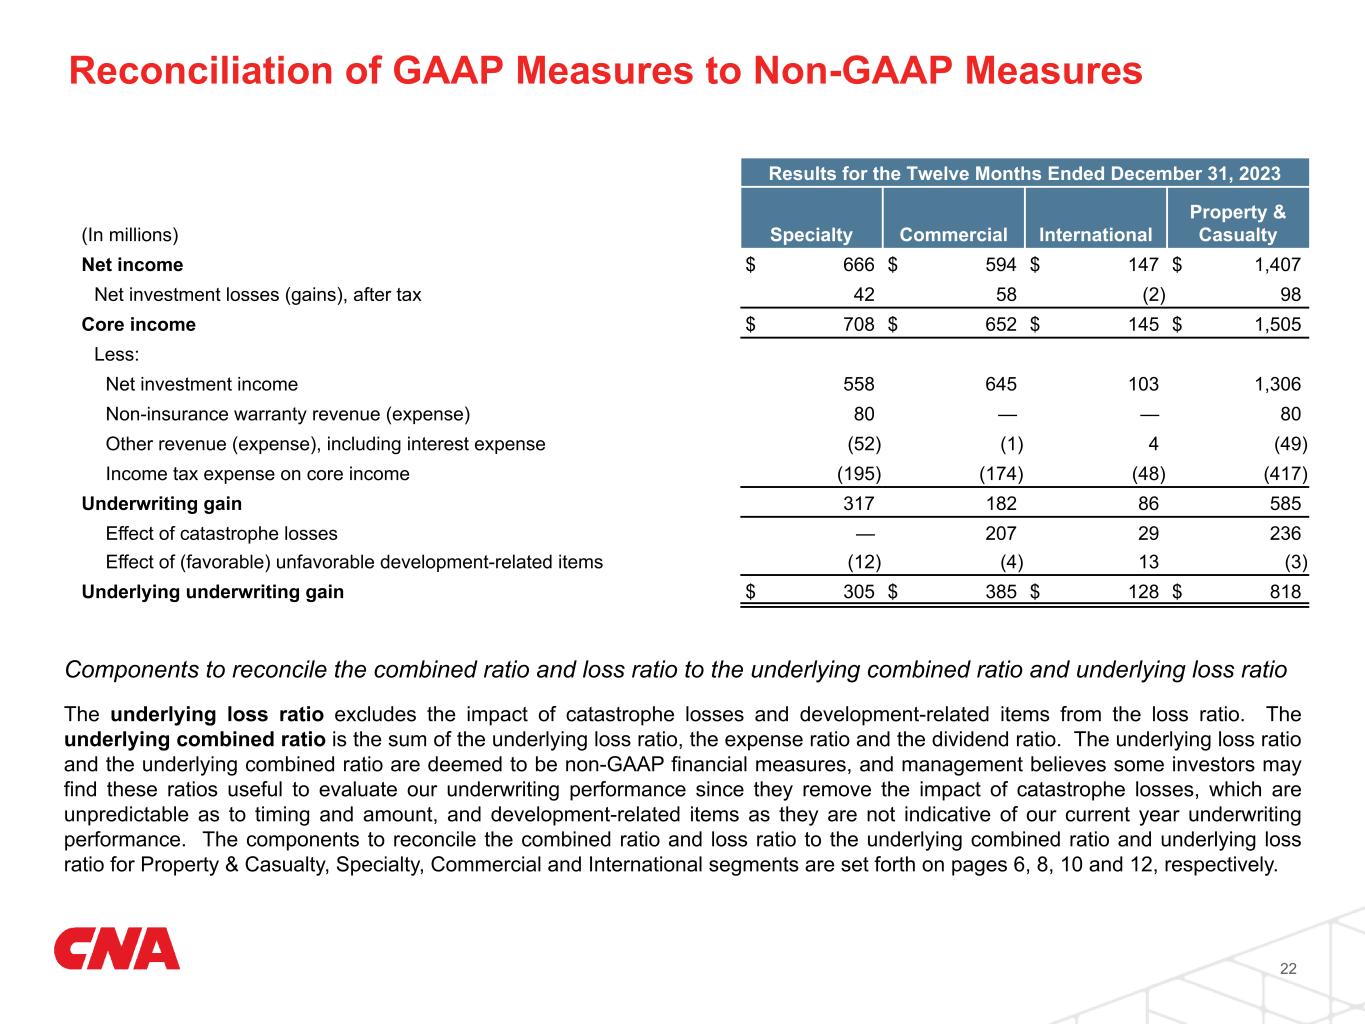
| Results for the Twelve Months Ended December 31, 2023 | ||||||||||||||
| Specialty | Commercial | International | Property & Casualty | |||||||||||
| (In millions) | ||||||||||||||
| Net income | $ | 666 | $ | 594 | $ | 147 | $ | 1,407 | ||||||
| Net investment losses (gains), after tax | 42 | 58 | (2) | 98 | ||||||||||
| Core income | $ | 708 | $ | 652 | $ | 145 | $ | 1,505 | ||||||
| Less: | ||||||||||||||
| Net investment income | 558 | 645 | 103 | 1,306 | ||||||||||
| Non-insurance warranty revenue (expense) | 80 | — | — | 80 | ||||||||||
| Other revenue (expense), including interest expense | (52) | (1) | 4 | (49) | ||||||||||
| Income tax expense on core income | (195) | (174) | (48) | (417) | ||||||||||
| Underwriting gain | 317 | 182 | 86 | 585 | ||||||||||
| Effect of catastrophe losses | — | 207 | 29 | 236 | ||||||||||
| Effect of (favorable) unfavorable development-related items | (12) | (4) | 13 | (3) | ||||||||||
| Underlying underwriting gain | $ | 305 | $ | 385 | $ | 128 | $ | 818 | ||||||
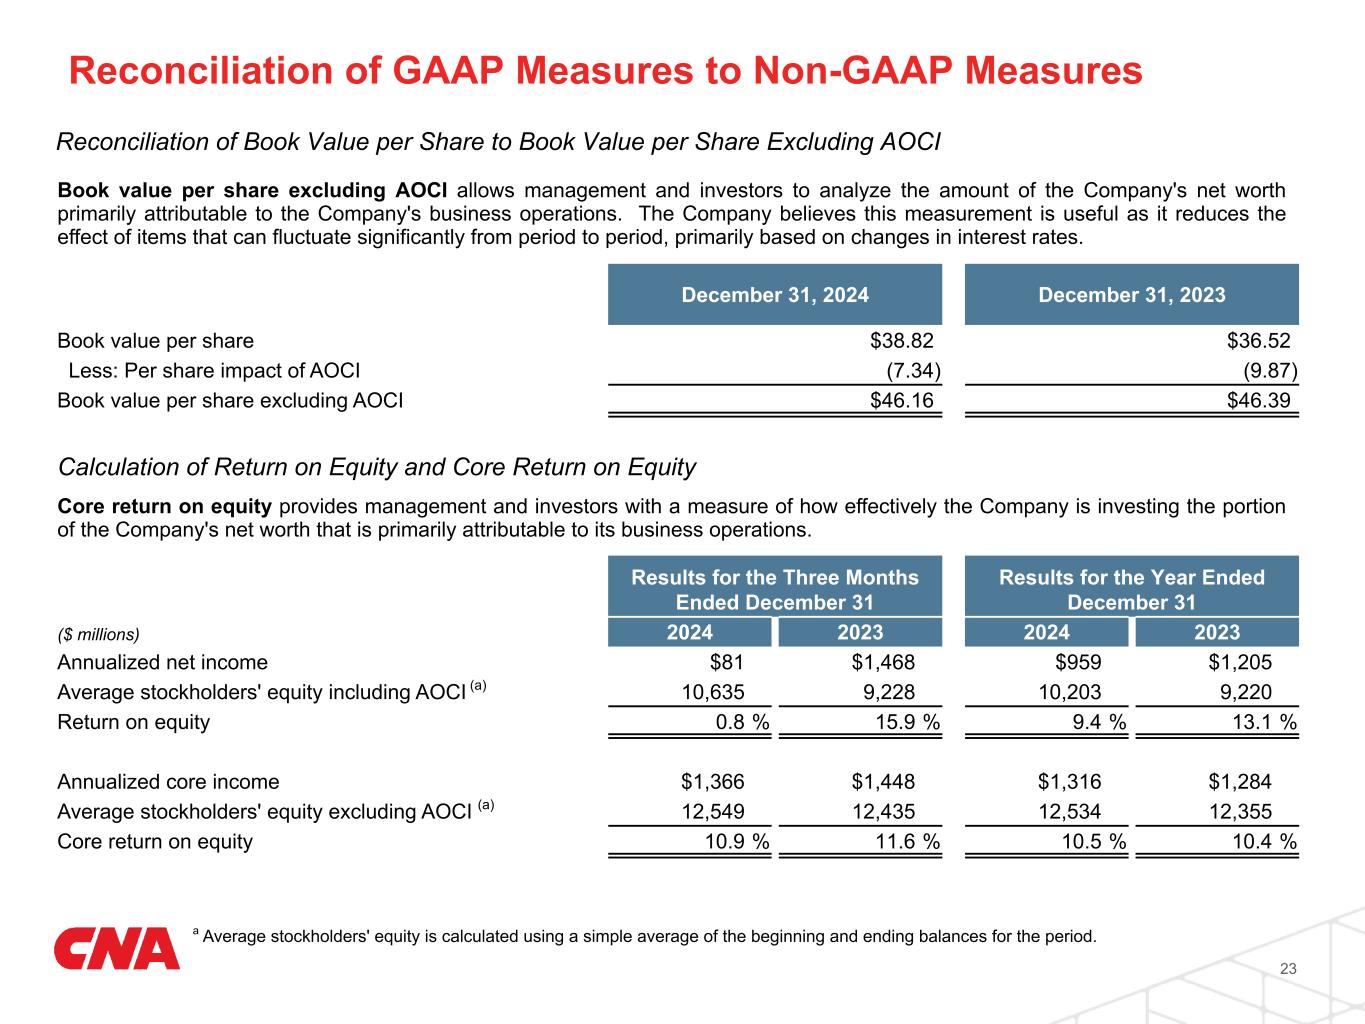
| December 31, 2024 | December 31, 2023 | ||||||||||
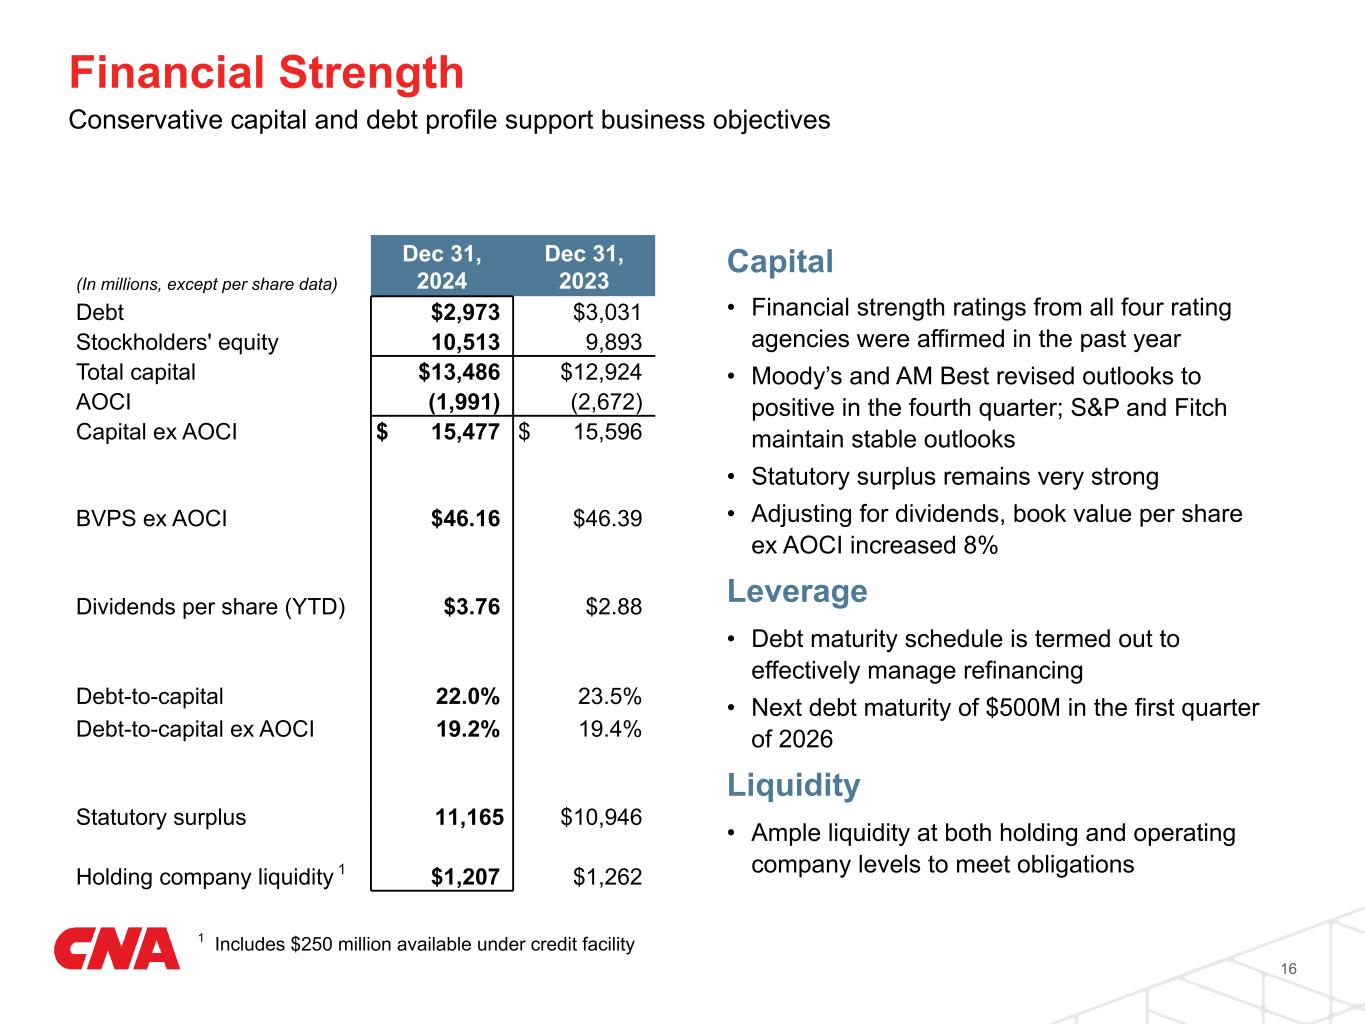
| Book value per share | $ | 38.82 | $ | 36.52 | |||||||
| Less: Per share impact of AOCI | (7.34) | (9.87) | |||||||||
| Book value per share excluding AOCI | $ | 46.16 | $ | 46.39 | |||||||
| Results for the Three Months Ended December 31 | Results for the Year Ended December 31 | |||||||||||||||||||||||||
| ($ millions) | 2024 | 2023 | 2024 | 2023 | ||||||||||||||||||||||
| Annualized net income | $ | 81 | $ | 1,468 | $ | 959 | $ | 1,205 | ||||||||||||||||||
Average stockholders' equity including AOCI (a) |
10,635 | 9,228 | 10,203 | 9,220 | ||||||||||||||||||||||
| Return on equity | 0.8 | % | 15.9 | % | 9.4 | % | 13.1 | % | ||||||||||||||||||
| Annualized core income | $ | 1,366 | $ | 1,448 | $ | 1,316 | $ | 1,284 | ||||||||||||||||||
Average stockholders' equity excluding AOCI (a) |
12,549 | 12,435 | 12,534 | 12,355 | ||||||||||||||||||||||
| Core return on equity | 10.9 | % | 11.6 | % | 10.5 | % | 10.4 | % | ||||||||||||||||||

| Page | |||||
| Consolidated Results | |||||
| Results of Operations | |||||
| Investment Information | |||||
| Investments - Commercial Real Estate Exposure | |||||
| Other | |||||

| Periods ended December 31 | Three Months | Twelve Months | |||||||||||||||||||||||||||||||||||||||
| (In millions) | 2024 | 2023 | Change | 2024 | 2023 | Change | |||||||||||||||||||||||||||||||||||
| Revenues: | |||||||||||||||||||||||||||||||||||||||||
| Net earned premiums | $ | 2,679 | $ | 2,479 | 8 | % | $ | 10,211 | $ | 9,480 | 8 | % | |||||||||||||||||||||||||||||
| Net investment income | 644 | 611 | 5 | 2,497 | 2,264 | 10 | |||||||||||||||||||||||||||||||||||
| Net investment gains (losses) | (39) | 6 | (81) | (99) | |||||||||||||||||||||||||||||||||||||
| Non-insurance warranty revenue | 397 | 403 | 1,609 | 1,624 | |||||||||||||||||||||||||||||||||||||
| Other revenues | 8 | 8 | 34 | 30 | |||||||||||||||||||||||||||||||||||||
| Total revenues | 3,689 | 3,507 | 5 | 14,270 | 13,299 | 7 | |||||||||||||||||||||||||||||||||||
| Claims, Benefits and Expenses: | |||||||||||||||||||||||||||||||||||||||||
Insurance claims and policyholders’ benefits (re-measurement loss of $37, $13, $125 and $88) |
2,030 | 1,810 | 7,738 | 7,068 | |||||||||||||||||||||||||||||||||||||
| Amortization of deferred acquisition costs | 462 | 436 | 1,798 | 1,644 | |||||||||||||||||||||||||||||||||||||
| Non-insurance warranty expense | 378 | 390 | 1,547 | 1,544 | |||||||||||||||||||||||||||||||||||||
Other operating expenses (1) |
766 | 377 | 1,843 | 1,398 | |||||||||||||||||||||||||||||||||||||
| Interest | 32 | 34 | 133 | 127 | |||||||||||||||||||||||||||||||||||||
| Total claims, benefits and expenses | 3,668 | 3,047 | (20) | 13,059 | 11,781 | (11) | |||||||||||||||||||||||||||||||||||
| Income (loss) before income tax | 21 | 460 | 1,211 | 1,518 | |||||||||||||||||||||||||||||||||||||
| Income tax (expense) benefit | — | (93) | (252) | (313) | |||||||||||||||||||||||||||||||||||||
| Net income (loss) | $ | 21 | $ | 367 | (94) | % | $ | 959 | $ | 1,205 | (20) | % | |||||||||||||||||||||||||||||
 1
1| Periods ended December 31 | Three Months | Twelve Months | |||||||||||||||||||||||||||
| (In millions, except per share data) | 2024 | 2023 | 2024 | 2023 | |||||||||||||||||||||||||
| Components of Income (Loss) | |||||||||||||||||||||||||||||
| Core income (loss) | $ | 342 | $ | 362 | $ | 1,316 | $ | 1,284 | |||||||||||||||||||||
| Net investment gains (losses) | (31) | 5 | (64) | (79) | |||||||||||||||||||||||||
| Pension settlement transaction gains (losses) | (290) | — | (293) | — | |||||||||||||||||||||||||
| Net income (loss) | $ | 21 | $ | 367 | $ | 959 | $ | 1,205 | |||||||||||||||||||||
| Diluted Earnings (Loss) Per Common Share | |||||||||||||||||||||||||||||
| Core income (loss) | $ | 1.25 | $ | 1.33 | $ | 4.83 | $ | 4.71 | |||||||||||||||||||||
| Net investment gains (losses) | (0.12) | 0.02 | (0.23) | (0.28) | |||||||||||||||||||||||||
| Pension settlement transaction gains (losses) | (1.06) | — | (1.08) | — | |||||||||||||||||||||||||
| Diluted earnings (loss) per share | $ | 0.07 | $ | 1.35 | $ | 3.52 | $ | 4.43 | |||||||||||||||||||||
| Weighted Average Outstanding Common Stock and Common Stock Equivalents | |||||||||||||||||||||||||||||
| Basic | 271.3 | 271.3 | 271.5 | 271.3 | |||||||||||||||||||||||||
| Diluted | 272.9 | 272.5 | 272.7 | 272.2 | |||||||||||||||||||||||||
| Return on Equity | |||||||||||||||||||||||||||||
Net income (loss) (1) |
0.8 | % | 15.9 | % | 9.4 | % | 13.1 | % | |||||||||||||||||||||
Core income (loss) (2) |
10.9 | 11.6 | 10.5 | 10.4 | |||||||||||||||||||||||||
 2
2| (In millions, except per share data) | December 31, 2024 | December 31, 2023 | |||||||||
| Total investments | $ | 47,482 | $ | 46,562 | |||||||
| Reinsurance receivables, net of allowance for uncollectible receivables | 6,051 | 5,412 | |||||||||
| Total assets | 66,492 | 64,711 | |||||||||
| Insurance reserves | 45,480 | 44,196 | |||||||||
| Claim and claim adjustment expenses | 24,976 | 23,304 | |||||||||
| Unearned premiums | 7,346 | 6,933 | |||||||||
| Future policy benefits | 13,158 | 13,959 | |||||||||
| Debt | 2,973 | 3,031 | |||||||||
| Total liabilities | 55,979 | 54,818 | |||||||||
Accumulated other comprehensive income (loss) (1) |
(1,991) | (2,672) | |||||||||
| Total stockholders' equity | 10,513 | 9,893 | |||||||||
| Book value per common share | $ | 38.82 | $ | 36.52 | |||||||
| Book value per common share excluding AOCI | $ | 46.16 | $ | 46.39 | |||||||
| Outstanding shares of common stock (in millions of shares) | 270.8 | 270.9 | |||||||||
Statutory capital and surplus - Combined Continental Casualty Companies (2) |
$ | 11,165 | $ | 10,946 | |||||||
| Three Months Ended December 31 | 2024 | 2023 | |||||||||
| Net cash flows provided (used) by operating activities | $ | 703 | $ | 520 | |||||||
| Net cash flows provided (used) by investing activities | (555) | (306) | |||||||||
| Net cash flows provided (used) by financing activities | (119) | (359) | |||||||||
| Net cash flows provided (used) by operating, investing and financing activities | $ | 29 | $ | (145) | |||||||
| Twelve Months Ended December 31 | 2024 | 2023 | |||||||||
| Net cash flows provided (used) by operating activities | $ | 2,571 | $ | 2,285 | |||||||
| Net cash flows provided (used) by investing activities | (1,317) | (1,843) | |||||||||
| Net cash flows provided (used) by financing activities | (1,117) | (577) | |||||||||
| Net cash flows provided (used) by operating, investing and financing activities | $ | 137 | $ | (135) | |||||||
 3
3| Periods ended December 31 | Three Months | Twelve Months | |||||||||||||||||||||||||||||||||||||||
| (In millions) | 2024 | 2023 | Change | 2024 | 2023 | Change | |||||||||||||||||||||||||||||||||||
| Gross written premiums | $ | 3,970 | $ | 3,765 | 5 | % | $ | 15,379 | $ | 14,718 | 4 | % | |||||||||||||||||||||||||||||
Gross written premiums ex. 3rd party captives |
3,230 | 2,974 | 9 | 12,194 | 11,279 | 8 | |||||||||||||||||||||||||||||||||||
| Net written premiums | 2,752 | 2,508 | 10 | 10,176 | 9,446 | 8 | |||||||||||||||||||||||||||||||||||
| Net earned premiums | 2,571 | 2,368 | 9 | 9,775 | 9,030 | 8 | |||||||||||||||||||||||||||||||||||
| Insurance claims and policyholders' benefits | 1,624 | 1,441 | 6,324 | 5,669 | |||||||||||||||||||||||||||||||||||||
| Amortization of deferred acquisition costs | 462 | 436 | 1,798 | 1,644 | |||||||||||||||||||||||||||||||||||||
| Insurance related administrative expenses | 307 | 305 | 1,157 | 1,132 | |||||||||||||||||||||||||||||||||||||
| Underwriting gain (loss) | 178 | 186 | (4) | 496 | 585 | (15) | |||||||||||||||||||||||||||||||||||
| Net investment income | 400 | 355 | 13 | 1,490 | 1,306 | 14 | |||||||||||||||||||||||||||||||||||
| Non-insurance warranty revenue | 397 | 403 | 1,609 | 1,624 | |||||||||||||||||||||||||||||||||||||
| Other revenues | 7 | 8 | 31 | 30 | |||||||||||||||||||||||||||||||||||||
| Non-insurance warranty expense | 378 | 390 | 1,547 | 1,544 | |||||||||||||||||||||||||||||||||||||
| Other expenses | 39 | 10 | 108 | 78 | |||||||||||||||||||||||||||||||||||||
| Interest expense | — | 1 | — | 1 | |||||||||||||||||||||||||||||||||||||
| Core income (loss) before income tax | 565 | 551 | 1,971 | 1,922 | |||||||||||||||||||||||||||||||||||||
| Income tax (expense) benefit on core income (loss) | (114) | (117) | (422) | (417) | |||||||||||||||||||||||||||||||||||||
| Core income (loss) | $ | 451 | $ | 434 | 4 | % | $ | 1,549 | $ | 1,505 | 3 | % | |||||||||||||||||||||||||||||
| Other Performance Metrics | |||||||||||||||||||||||||||||||||||||||||
| Underwriting gain (loss) | $ | 178 | $ | 186 | (4) | % | $ | 496 | $ | 585 | (15) | % | |||||||||||||||||||||||||||||
| Effect of catastrophe losses | 45 | 22 | 358 | 236 | |||||||||||||||||||||||||||||||||||||
| (Favorable) unfavorable net prior year loss reserve development | (7) | (12) | (31) | (23) | |||||||||||||||||||||||||||||||||||||
(Favorable) unfavorable other development-related items (1) |
6 | 5 | 17 | 20 | |||||||||||||||||||||||||||||||||||||
| Effect of (favorable) unfavorable development-related items | (1) | (7) | (14) | (3) | |||||||||||||||||||||||||||||||||||||
| Underlying underwriting gain (loss) | $ | 222 | $ | 201 | 10 | % | $ | 840 | $ | 818 | 3 | % | |||||||||||||||||||||||||||||
| Loss & LAE ratio | 62.8 | % | 60.6 | % | (2.2) | pts | 64.3 | % | 62.5 | % | (1.8) | pts | |||||||||||||||||||||||||||||
| Expense ratio | 30.0 | 31.2 | 1.2 | 30.2 | 30.7 | 0.5 | |||||||||||||||||||||||||||||||||||
| Dividend ratio | 0.3 | 0.3 | — | 0.4 | 0.3 | (0.1) | |||||||||||||||||||||||||||||||||||
| Combined ratio | 93.1 | % | 92.1 | % | (1.0) | pts | 94.9 | % | 93.5 | % | (1.4) | pts | |||||||||||||||||||||||||||||
| Less: Effect of catastrophe impacts | 1.8 | 1.0 | (0.8) | 3.6 | 2.6 | (1.0) | |||||||||||||||||||||||||||||||||||
| Less: Effect of (favorable) unfavorable development-related items | (0.1) | (0.3) | (0.2) | (0.2) | — | 0.2 | |||||||||||||||||||||||||||||||||||
| Underlying combined ratio | 91.4 | % | 91.4 | % | — | pts | 91.5 | % | 90.9 | % | (0.6) | pts | |||||||||||||||||||||||||||||
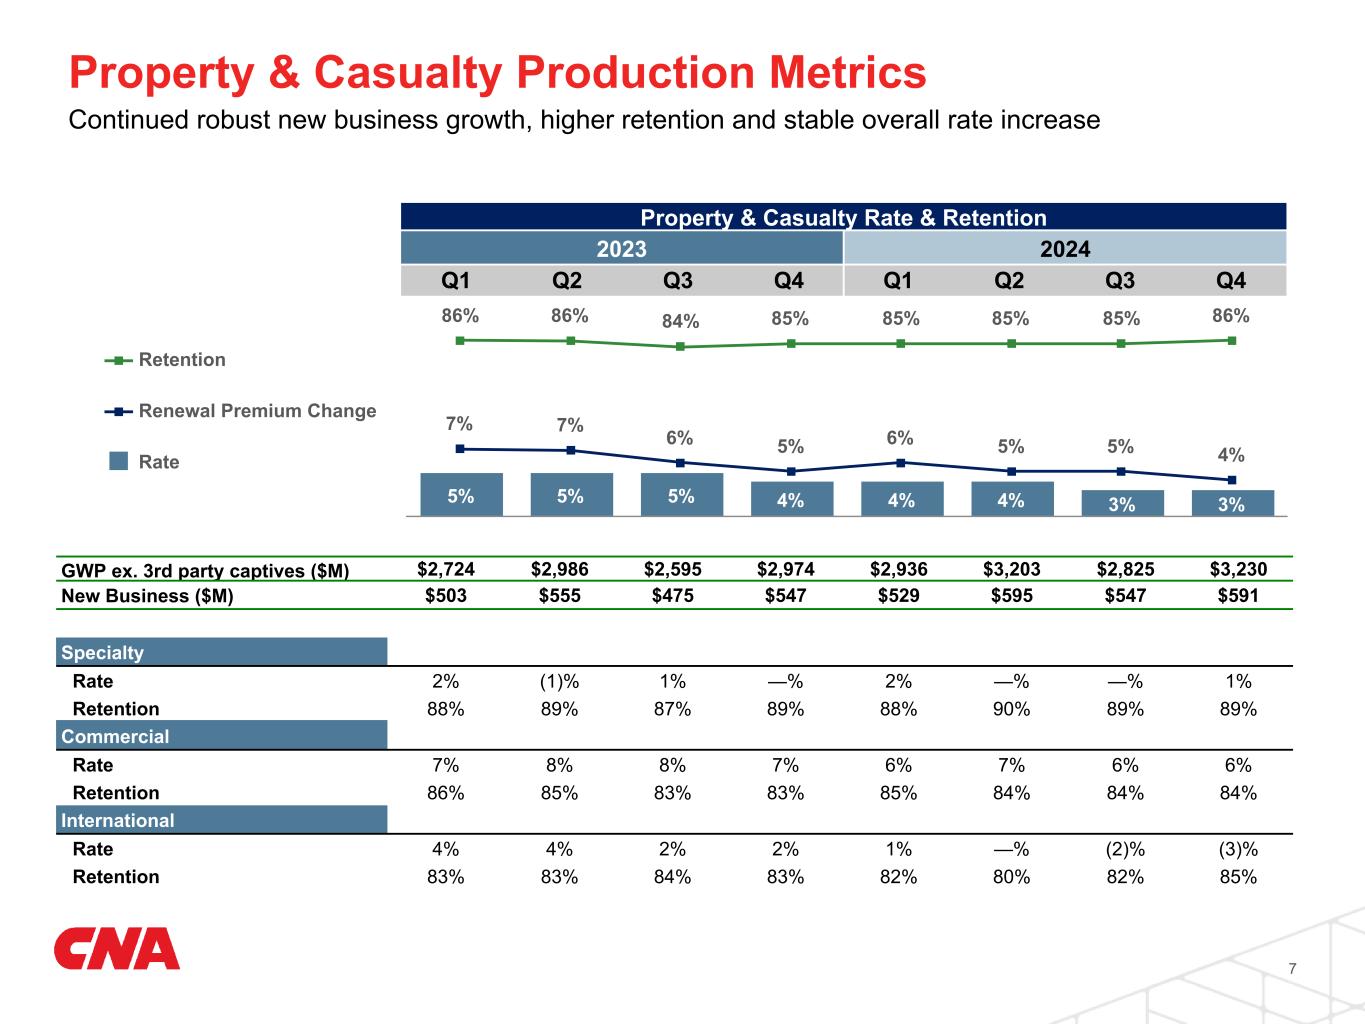
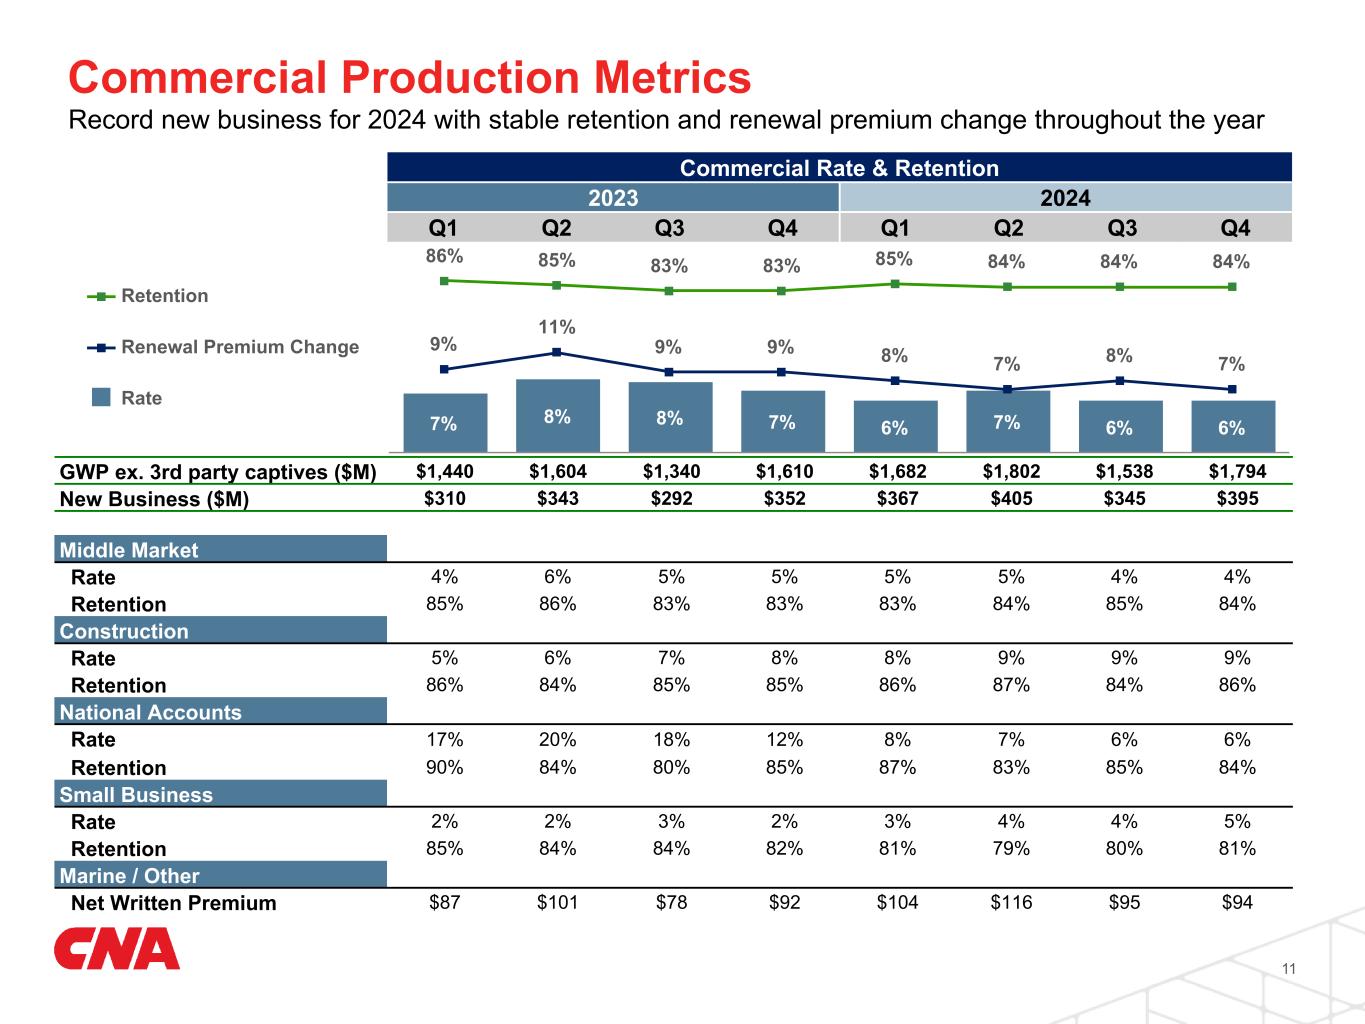
| Rate | 3 | % | 4 | % | (1) | pts | 4 | % | 5 | % | (1) | pts | |||||||||||||||||||||||||||||
| Renewal premium change | 4 | % | 5 | % | (1) | pts | 5 | % | 7 | % | (2) | pts | |||||||||||||||||||||||||||||
| Retention | 86 | % | 85 | % | 1 | pts | 85 | % | 85 | % | — | pts | |||||||||||||||||||||||||||||
| New business | $ | 591 | $ | 547 | 8 | % | $ | 2,262 | $ | 2,080 | 9 | % | |||||||||||||||||||||||||||||
 4
4| Periods ended December 31 | Three Months | Twelve Months | |||||||||||||||||||||||||||||||||||||||
| (In millions) | 2024 | 2023 | Change | 2024 | 2023 | Change | |||||||||||||||||||||||||||||||||||
| Gross written premiums | $ | 1,779 | $ | 1,789 | (1) | % | $ | 6,932 | $ | 7,113 | (3) | % | |||||||||||||||||||||||||||||
Gross written premiums ex. 3rd party captives |
1,049 | 1,004 | 4 | 3,895 | 3,800 | 3 | |||||||||||||||||||||||||||||||||||
| Net written premiums | 934 | 891 | 5 | 3,445 | 3,329 | 3 | |||||||||||||||||||||||||||||||||||
| Net earned premiums | 868 | 869 | — | 3,361 | 3,307 | 2 | |||||||||||||||||||||||||||||||||||
| Insurance claims and policyholders' benefits | 525 | 507 | 2,010 | 1,931 | |||||||||||||||||||||||||||||||||||||
| Amortization of deferred acquisition costs | 194 | 178 | 740 | 686 | |||||||||||||||||||||||||||||||||||||
| Insurance related administrative expenses | 95 | 104 | 362 | 373 | |||||||||||||||||||||||||||||||||||||
| Underwriting gain (loss) | 54 | 80 | (33) | 249 | 317 | (21) | |||||||||||||||||||||||||||||||||||
| Net investment income | 165 | 151 | 9 | 626 | 558 | 12 | |||||||||||||||||||||||||||||||||||
| Non-insurance warranty revenue | 397 | 403 | 1,609 | 1,624 | |||||||||||||||||||||||||||||||||||||
| Other revenues | 1 | 1 | 2 | 1 | |||||||||||||||||||||||||||||||||||||
| Non-insurance warranty expense | 378 | 390 | 1,547 | 1,544 | |||||||||||||||||||||||||||||||||||||
| Other expenses | 14 | 13 | 55 | 52 | |||||||||||||||||||||||||||||||||||||
| Interest expense | — | 1 | — | 1 | |||||||||||||||||||||||||||||||||||||
| Core income (loss) before income tax | 225 | 231 | 884 | 903 | |||||||||||||||||||||||||||||||||||||
| Income tax (expense) benefit on core income (loss) | (48) | (49) | (190) | (195) | |||||||||||||||||||||||||||||||||||||
| Core income (loss) | $ | 177 | $ | 182 | (3) | % | $ | 694 | $ | 708 | (2) | % | |||||||||||||||||||||||||||||
| Other Performance Metrics | |||||||||||||||||||||||||||||||||||||||||
| Underwriting gain (loss) | $ | 54 | $ | 80 | (33) | % | $ | 249 | $ | 317 | (21) | % | |||||||||||||||||||||||||||||
| Effect of catastrophe losses | — | — | — | — | |||||||||||||||||||||||||||||||||||||
| (Favorable) unfavorable net prior year loss reserve development | (1) | (5) | (9) | (14) | |||||||||||||||||||||||||||||||||||||
(Favorable) unfavorable other development-related items (1) |
1 | — | 1 | 2 | |||||||||||||||||||||||||||||||||||||
| Effect of (favorable) unfavorable development-related items | — | (5) | (8) | (12) | |||||||||||||||||||||||||||||||||||||
| Underlying underwriting gain (loss) | $ | 54 | $ | 75 | (28) | % | $ | 241 | $ | 305 | (21) | % | |||||||||||||||||||||||||||||
| Loss & LAE ratio | 60.1 | % | 58.0 | % | (2.1) | pts | 59.5 | % | 58.2 | % | (1.3) | pts | |||||||||||||||||||||||||||||
| Expense ratio | 33.4 | 32.5 | (0.9) | 32.8 | 32.0 | (0.8) | |||||||||||||||||||||||||||||||||||
| Dividend ratio | 0.3 | 0.3 | — | 0.3 | 0.2 | (0.1) | |||||||||||||||||||||||||||||||||||
| Combined ratio | 93.8 | % | 90.8 | % | (3.0) | pts | 92.6 | % | 90.4 | % | (2.2) | pts | |||||||||||||||||||||||||||||
| Less: Effect of catastrophe impacts | — | — | — | — | — | — | |||||||||||||||||||||||||||||||||||
| Less: Effect of (favorable) unfavorable development-related items | — | (0.6) | (0.6) | (0.3) | (0.3) | — | |||||||||||||||||||||||||||||||||||
| Underlying combined ratio | 93.8 | % | 91.4 | % | (2.4) | pts | 92.9 | % | 90.7 | % | (2.2) | pts | |||||||||||||||||||||||||||||
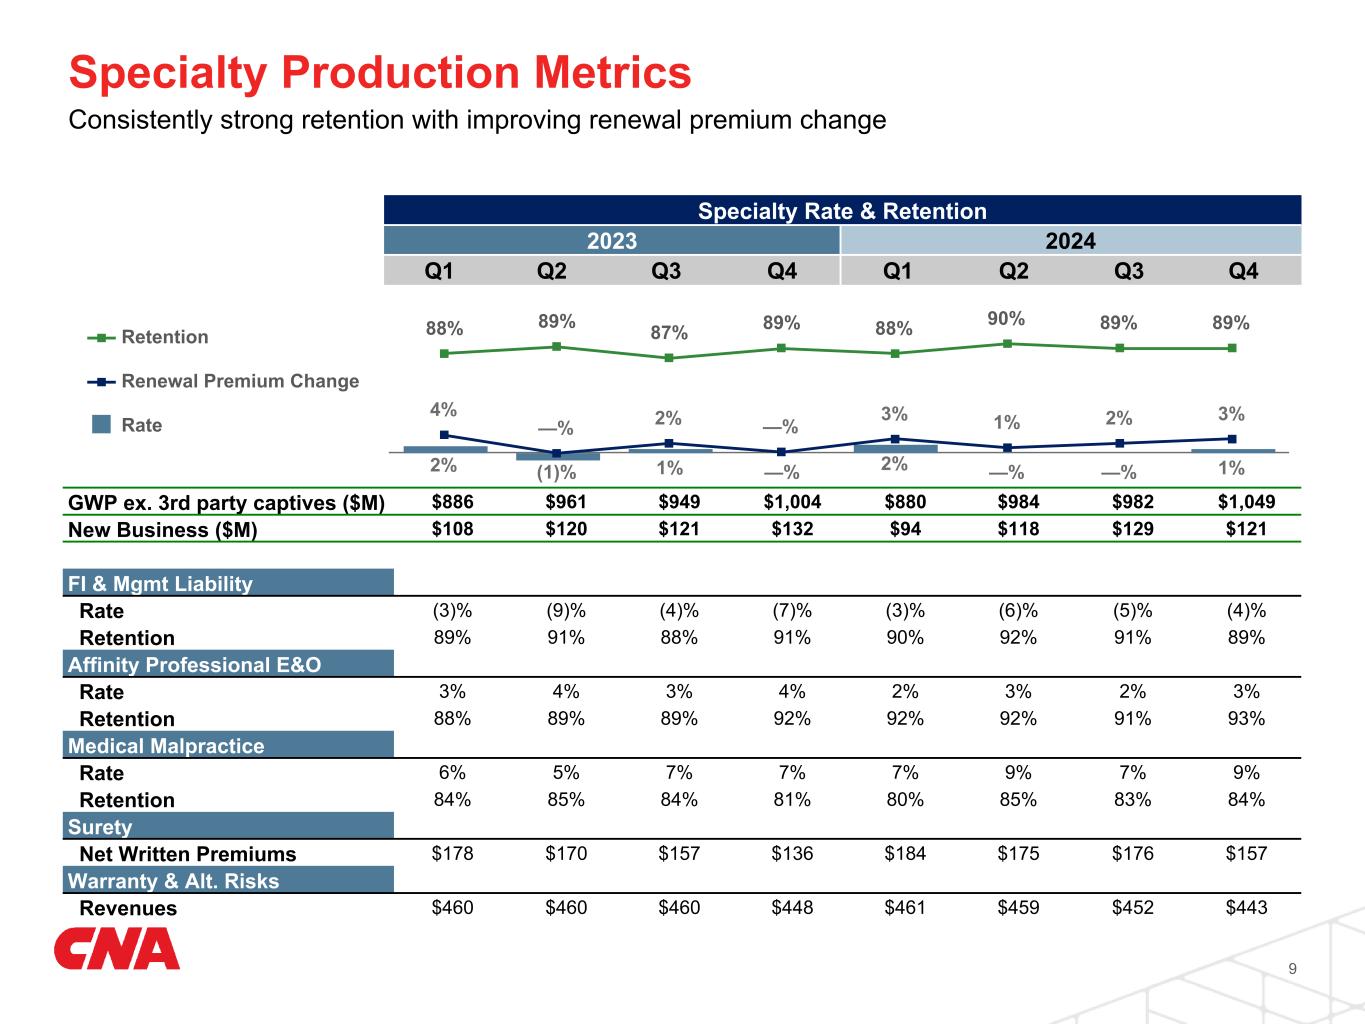
| Rate | 1 | % | — | % | 1 | pts | 1 | % | — | % | 1 | pts | |||||||||||||||||||||||||||||
| Renewal premium change | 3 | % | — | % | 3 | pts | 2 | % | 1 | % | 1 | pts | |||||||||||||||||||||||||||||
| Retention | 89 | % | 89 | % | — | pts | 89 | % | 88 | % | 1 | pts | |||||||||||||||||||||||||||||
| New business | $ | 121 | $ | 132 | (8) | % | $ | 462 | $ | 481 | (4) | % | |||||||||||||||||||||||||||||
 5
5| Periods ended December 31 | Three Months | Twelve Months | |||||||||||||||||||||||||||||||||||||||
| (In millions) | 2024 | 2023 | Change | 2024 | 2023 | Change | |||||||||||||||||||||||||||||||||||
| Gross written premiums | $ | 1,804 | $ | 1,616 | 12 | % | $ | 6,964 | $ | 6,120 | 14 | % | |||||||||||||||||||||||||||||
Gross written premiums ex. 3rd party captives |
1,794 | 1,610 | 11 | 6,816 | 5,994 | 14 | |||||||||||||||||||||||||||||||||||
| Net written premiums | 1,452 | 1,292 | 12 | 5,469 | 4,880 | 12 | |||||||||||||||||||||||||||||||||||
| Net earned premiums | 1,384 | 1,211 | 14 | 5,158 | 4,547 | 13 | |||||||||||||||||||||||||||||||||||
| Insurance claims and policyholders' benefits | 903 | 764 | 3,550 | 3,016 | |||||||||||||||||||||||||||||||||||||
| Amortization of deferred acquisition costs | 216 | 197 | 824 | 729 | |||||||||||||||||||||||||||||||||||||
| Insurance related administrative expenses | 159 | 164 | 613 | 620 | |||||||||||||||||||||||||||||||||||||
| Underwriting gain (loss) | 106 | 86 | 23 | 171 | 182 | (6) | |||||||||||||||||||||||||||||||||||
| Net investment income | 199 | 175 | 14 | 733 | 645 | 14 | |||||||||||||||||||||||||||||||||||
| Other revenues | 6 | 7 | 29 | 29 | |||||||||||||||||||||||||||||||||||||
| Other expenses | 10 | 3 | 43 | 30 | |||||||||||||||||||||||||||||||||||||
| Core income (loss) before income tax | 301 | 265 | 890 | 826 | |||||||||||||||||||||||||||||||||||||
| Income tax (expense) benefit on core income (loss) | (63) | (56) | (188) | (174) | |||||||||||||||||||||||||||||||||||||
| Core income (loss) | $ | 238 | $ | 209 | 14 | % | $ | 702 | $ | 652 | 8 | % | |||||||||||||||||||||||||||||
| Other Performance Metrics | |||||||||||||||||||||||||||||||||||||||||
| Underwriting gain (loss) | $ | 106 | $ | 86 | 23 | % | $ | 171 | $ | 182 | (6) | % | |||||||||||||||||||||||||||||
| Effect of catastrophe losses | 33 | 17 | 318 | 207 | |||||||||||||||||||||||||||||||||||||
| (Favorable) unfavorable net prior year loss reserve development | (5) | (5) | (16) | (22) | |||||||||||||||||||||||||||||||||||||
(Favorable) unfavorable other development-related items (1) |
5 | 5 | 16 | 18 | |||||||||||||||||||||||||||||||||||||
| Effect of (favorable) unfavorable development-related items | — | — | — | (4) | |||||||||||||||||||||||||||||||||||||
| Underlying underwriting gain (loss) | $ | 139 | $ | 103 | 35 | % | $ | 489 | $ | 385 | 27 | % | |||||||||||||||||||||||||||||
| Loss & LAE ratio | 64.8 | % | 62.8 | % | (2.0) | pts | 68.3 | % | 65.9 | % | (2.4) | pts | |||||||||||||||||||||||||||||
| Expense ratio | 27.0 | 29.8 | 2.8 | 27.9 | 29.6 | 1.7 | |||||||||||||||||||||||||||||||||||
| Dividend ratio | 0.5 | 0.3 | (0.2) | 0.5 | 0.5 | — | |||||||||||||||||||||||||||||||||||
| Combined ratio | 92.3 | % | 92.9 | % | 0.6 | pts | 96.7 | % | 96.0 | % | (0.7) | pts | |||||||||||||||||||||||||||||
| Less: Effect of catastrophe impacts | 2.3 | 1.4 | (0.9) | 6.2 | 4.5 | (1.7) | |||||||||||||||||||||||||||||||||||
| Less: Effect of (favorable) unfavorable development-related items | — | (0.1) | (0.1) | (0.1) | (0.1) | — | |||||||||||||||||||||||||||||||||||
| Underlying combined ratio | 90.0 | % | 91.6 | % | 1.6 | pts | 90.6 | % | 91.6 | % | 1.0 | pts | |||||||||||||||||||||||||||||
| Rate | 6 | % | 7 | % | (1) | pts | 6 | % | 7 | % | (1) | pts | |||||||||||||||||||||||||||||
| Renewal premium change | 7 | % | 9 | % | (2) | pts | 7 | % | 10 | % | (3) | pts | |||||||||||||||||||||||||||||
| Retention | 84 | % | 83 | % | 1 | pts | 84 | % | 84 | % | — | pts | |||||||||||||||||||||||||||||
| New business | $ | 395 | $ | 352 | 12 | % | $ | 1,512 | $ | 1,297 | 17 | % | |||||||||||||||||||||||||||||
 6
6| Periods ended December 31 | Three Months | Twelve Months | |||||||||||||||||||||||||||||||||||||||
| (In millions) | 2024 | 2023 | Change | 2024 | 2023 | Change | |||||||||||||||||||||||||||||||||||
| Gross written premiums | $ | 387 | $ | 360 | 8 | % | $ | 1,483 | $ | 1,485 | — | % | |||||||||||||||||||||||||||||
| Net written premiums | 366 | 325 | 13 | 1,262 | 1,237 | 2 | |||||||||||||||||||||||||||||||||||
| Net earned premiums | 319 | 288 | 11 | 1,256 | 1,176 | 7 | |||||||||||||||||||||||||||||||||||
| Insurance claims and policyholders' benefits | 196 | 170 | 764 | 722 | |||||||||||||||||||||||||||||||||||||
| Amortization of deferred acquisition costs | 52 | 61 | 234 | 229 | |||||||||||||||||||||||||||||||||||||
| Insurance related administrative expenses | 53 | 37 | 182 | 139 | |||||||||||||||||||||||||||||||||||||
| Underwriting gain (loss) | 18 | 20 | (10) | 76 | 86 | (12) | |||||||||||||||||||||||||||||||||||
| Net investment income | 36 | 29 | 24 | 131 | 103 | 27 | |||||||||||||||||||||||||||||||||||
| Other revenues | — | — | — | — | |||||||||||||||||||||||||||||||||||||
| Other expenses | 15 | (6) | 10 | (4) | |||||||||||||||||||||||||||||||||||||
| Core income (loss) before income tax | 39 | 55 | 197 | 193 | |||||||||||||||||||||||||||||||||||||
| Income tax (expense) benefit on core income (loss) | (3) | (12) | (44) | (48) | |||||||||||||||||||||||||||||||||||||
| Core income (loss) | $ | 36 | $ | 43 | (16) | % | $ | 153 | $ | 145 | 6 | % | |||||||||||||||||||||||||||||
| Other Performance Metrics | |||||||||||||||||||||||||||||||||||||||||
| Underwriting gain (loss) | $ | 18 | $ | 20 | (10) | % | $ | 76 | $ | 86 | (12) | % | |||||||||||||||||||||||||||||
| Effect of catastrophe losses | 12 | 5 | 40 | 29 | |||||||||||||||||||||||||||||||||||||
| (Favorable) unfavorable net prior year loss reserve development | (1) | (2) | (6) | 13 | |||||||||||||||||||||||||||||||||||||
(Favorable) unfavorable other development-related items (1) |
— | — | — | — | |||||||||||||||||||||||||||||||||||||
| Effect of (favorable) unfavorable development-related items | (1) | (2) | (6) | 13 | |||||||||||||||||||||||||||||||||||||
| Underlying underwriting gain (loss) | $ | 29 | $ | 23 | 26 | % | $ | 110 | $ | 128 | (14) | % | |||||||||||||||||||||||||||||
| Loss & LAE ratio | 61.6 | % | 58.9 | % | (2.7) | pts | 60.9 | % | 61.4 | % | 0.5 | pts | |||||||||||||||||||||||||||||
| Expense ratio | 33.2 | 34.1 | 0.9 | 33.1 | 31.2 | (1.9) | |||||||||||||||||||||||||||||||||||
| Dividend ratio | — | — | — | — | — | — | |||||||||||||||||||||||||||||||||||
| Combined ratio | 94.8 | % | 93.0 | % | (1.8) | pts | 94.0 | % | 92.6 | % | (1.4) | pts | |||||||||||||||||||||||||||||
| Less: Effect of catastrophe impacts | 3.9 | 1.8 | (2.1) | 3.2 | 2.5 | (0.7) | |||||||||||||||||||||||||||||||||||
| Less: Effect of (favorable) unfavorable development-related items | (0.4) | (0.6) | (0.2) | (0.4) | 1.1 | 1.5 | |||||||||||||||||||||||||||||||||||
| Underlying combined ratio | 91.3 | % | 91.8 | % | 0.5 | pts | 91.2 | % | 89.0 | % | (2.2) | pts | |||||||||||||||||||||||||||||
| Rate | (3) | % | 2 | % | (5) | pts | (1) | % | 3 | % | (4) | pts | |||||||||||||||||||||||||||||
| Renewal premium change | (5) | % | 2 | % | (7) | pts | — | % | 6 | % | (6) | pts | |||||||||||||||||||||||||||||
| Retention | 85 | % | 83 | % | 2 | pts | 82 | % | 83 | % | (1) | pts | |||||||||||||||||||||||||||||
| New business | $ | 75 | $ | 63 | 19 | % | $ | 288 | $ | 302 | (5) | % | |||||||||||||||||||||||||||||
 7
7| Periods ended December 31 | Three Months | Twelve Months | ||||||||||||||||||||||||
| (In millions) | 2024 | 2023 | 2024 | 2023 | ||||||||||||||||||||||
| Net earned premiums | $ | 108 | $ | 111 | $ | 437 | $ | 451 | ||||||||||||||||||
| Net investment income | 230 | 237 | 940 | 896 | ||||||||||||||||||||||
| Other revenues | — | (1) | — | (1) | ||||||||||||||||||||||
| Total operating revenues | 338 | 347 | 1,377 | 1,346 | ||||||||||||||||||||||
| Insurance claims and policyholders' benefits | 335 | 319 | 1,308 | 1,317 | ||||||||||||||||||||||
| Insurance related administrative expenses | 31 | 29 | 119 | 118 | ||||||||||||||||||||||
| Other expenses | — | 1 | 2 | 1 | ||||||||||||||||||||||
| Total claims, benefits and expenses | 366 | 349 | 1,429 | 1,436 | ||||||||||||||||||||||
| Core income (loss) before income tax | (28) | (2) | (52) | (90) | ||||||||||||||||||||||
| Income tax (expense) benefit on core income (loss) | 10 | 6 | 29 | 42 | ||||||||||||||||||||||
| Core income (loss) | $ | (18) | $ | 4 | $ | (23) | $ | (48) | ||||||||||||||||||
 8
8| Periods ended December 31 | Three Months | Twelve Months | ||||||||||||||||||||||||
| (In millions) | 2024 | 2023 | 2024 | 2023 | ||||||||||||||||||||||
| Net earned premiums | $ | — | $ | — | $ | (1) | $ | (1) | ||||||||||||||||||
| Net investment income | 14 | 19 | 67 | 62 | ||||||||||||||||||||||
| Other revenues | 1 | 1 | 3 | 1 | ||||||||||||||||||||||
| Total operating revenues | 15 | 20 | 69 | 62 | ||||||||||||||||||||||
| Insurance claims and policyholders' benefits | 71 | 50 | 106 | 82 | ||||||||||||||||||||||
| Insurance related administrative expenses | — | — | (1) | 1 | ||||||||||||||||||||||
| Interest expense | 32 | 33 | 133 | 126 | ||||||||||||||||||||||
| Other expenses | 22 | 32 | 87 | 68 | ||||||||||||||||||||||
| Total claims, benefits and expenses | 125 | 115 | 325 | 277 | ||||||||||||||||||||||
| Core income (loss) before income tax | (110) | (95) | (256) | (215) | ||||||||||||||||||||||
| Income tax (expense) benefit on core income (loss) | 19 | 19 | 46 | 42 | ||||||||||||||||||||||
| Core income (loss) | $ | (91) | $ | (76) | $ | (210) | $ | (173) | ||||||||||||||||||
 9
9| December 31, 2024 | September 30, 2024 | December 31, 2023 | |||||||||||||||||||||||||||||||||
| (In millions) | Carrying Value | Net Unrealized Gains (Losses) | Carrying Value | Net Unrealized Gains (Losses) | Carrying Value | Net Unrealized Gains (Losses) | |||||||||||||||||||||||||||||
| Fixed maturity securities: | |||||||||||||||||||||||||||||||||||
| Corporate and other bonds | $ | 24,944 | $ | (882) | $ | 25,792 | $ | (74) | $ | 24,268 | $ | (748) | |||||||||||||||||||||||
| States, municipalities and political subdivisions: | |||||||||||||||||||||||||||||||||||
| Tax-exempt | 3,167 | (48) | 3,333 | 65 | 3,722 | 88 | |||||||||||||||||||||||||||||
| Taxable | 3,637 | (544) | 3,815 | (323) | 3,670 | (409) | |||||||||||||||||||||||||||||
| Total states, municipalities and political subdivisions | 6,804 | (592) | 7,148 | (258) | 7,392 | (321) | |||||||||||||||||||||||||||||
| Asset-backed: | |||||||||||||||||||||||||||||||||||
| RMBS | 3,244 | (481) | 3,354 | (330) | 3,002 | (409) | |||||||||||||||||||||||||||||
| CMBS | 1,681 | (131) | 1,741 | (126) | 1,631 | (223) | |||||||||||||||||||||||||||||
| Other ABS | 3,541 | (215) | 3,585 | (146) | 3,268 | (243) | |||||||||||||||||||||||||||||
| Total asset-backed | 8,466 | (827) | 8,680 | (602) | 7,901 | (875) | |||||||||||||||||||||||||||||
| U.S. Treasury and obligations of government-sponsored enterprises | 220 | — | 222 | (2) | 151 | (1) | |||||||||||||||||||||||||||||
| Foreign government | 677 | (24) | 737 | (18) | 713 | (28) | |||||||||||||||||||||||||||||
| Redeemable preferred stock | — | — | — | — | — | — | |||||||||||||||||||||||||||||
| Total fixed maturity securities | 41,111 | (2,325) | 42,579 | (954) | 40,425 | (1,973) | |||||||||||||||||||||||||||||
| Equities: | |||||||||||||||||||||||||||||||||||
| Common stock | 180 | — | 183 | — | 191 | — | |||||||||||||||||||||||||||||
| Non-redeemable preferred stock | 479 | — | 485 | — | 492 | — | |||||||||||||||||||||||||||||
| Total equities | 659 | — | 668 | — | 683 | — | |||||||||||||||||||||||||||||
| Limited partnership investments: | |||||||||||||||||||||||||||||||||||
| Hedge funds | 359 | — | 356 | — | 332 | — | |||||||||||||||||||||||||||||
| Private equity funds | 2,161 | — | 2,106 | — | 1,842 | — | |||||||||||||||||||||||||||||
| Total limited partnership investments | 2,520 | — | 2,462 | — | 2,174 | — | |||||||||||||||||||||||||||||
| Other invested assets | 85 | — | 83 | — | 80 | — | |||||||||||||||||||||||||||||
| Mortgage loans | 1,019 | — | 1,003 | — | 1,035 | — | |||||||||||||||||||||||||||||
| Short-term investments | 2,088 | — | 1,900 | — | 2,165 | 1 | |||||||||||||||||||||||||||||
| Total investments | $ | 47,482 | $ | (2,325) | $ | 48,695 | $ | (954) | $ | 46,562 | $ | (1,972) | |||||||||||||||||||||||
| Net receivable/(payable) on investment activity | $ | 16 | $ | (93) | $ | 36 | |||||||||||||||||||||||||||||
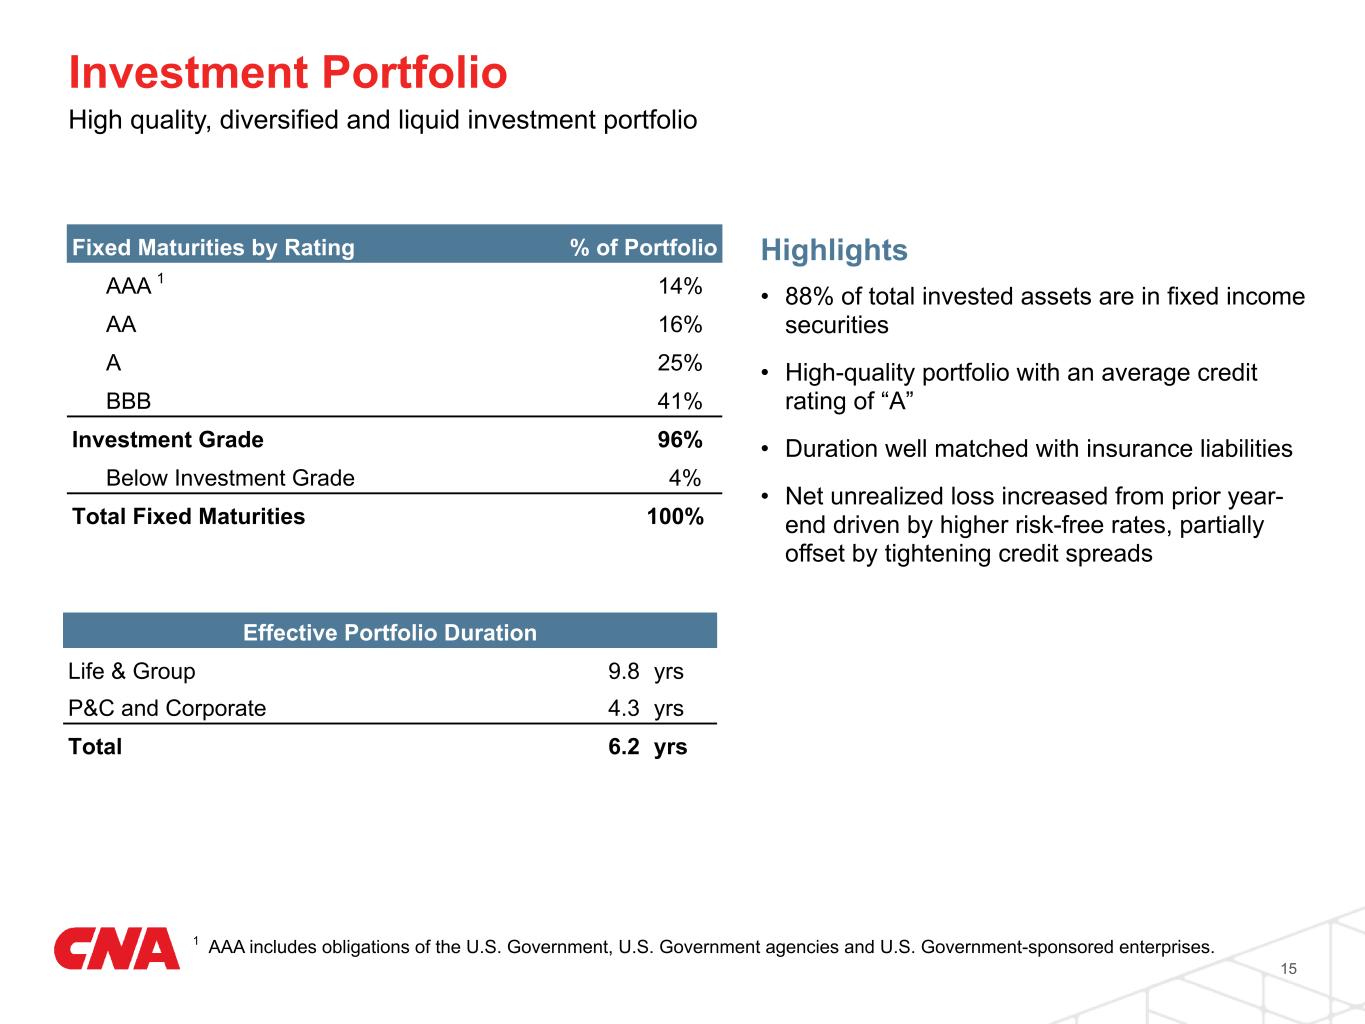
| Effective duration (in years) | 6.2 | 6.4 | 6.5 | ||||||||||||||||||||||||||||||||
Weighted average rating (1) |
A | A | A | ||||||||||||||||||||||||||||||||
 10
10| December 31, 2024 | September 30, 2024 | December 31, 2023 | |||||||||||||||||||||||||||||||||
| (In millions) | Carrying Value | Net Unrealized Gains (Losses) | Carrying Value | Net Unrealized Gains (Losses) | Carrying Value | Net Unrealized Gains (Losses) | |||||||||||||||||||||||||||||
| Fixed maturity securities: | |||||||||||||||||||||||||||||||||||
| Corporate and other bonds | $ | 14,755 | $ | (538) | $ | 15,158 | $ | (333) | $ | 14,424 | $ | (756) | |||||||||||||||||||||||
| States, municipalities and political subdivisions: | |||||||||||||||||||||||||||||||||||
| Tax-exempt | 983 | (189) | 1,027 | (157) | 1,160 | (159) | |||||||||||||||||||||||||||||
| Taxable | 2,157 | (446) | 2,240 | (329) | 2,076 | (399) | |||||||||||||||||||||||||||||
| Total states, municipalities and political subdivisions | 3,140 | (635) | 3,267 | (486) | 3,236 | (558) | |||||||||||||||||||||||||||||
| Asset-backed: | |||||||||||||||||||||||||||||||||||
| RMBS | 3,242 | (481) | 3,352 | (330) | 3,000 | (409) | |||||||||||||||||||||||||||||
| CMBS | 1,659 | (128) | 1,718 | (124) | 1,601 | (221) | |||||||||||||||||||||||||||||
| Other ABS | 2,979 | (105) | 2,983 | (78) | 2,676 | (170) | |||||||||||||||||||||||||||||
| Total asset-backed | 7,880 | (714) | 8,053 | (532) | 7,277 | (800) | |||||||||||||||||||||||||||||
| U.S. Treasury and obligations of government-sponsored enterprises | 211 | — | 213 | (2) | 150 | (1) | |||||||||||||||||||||||||||||
| Foreign government | 631 | (14) | 688 | (11) | 685 | (20) | |||||||||||||||||||||||||||||
| Redeemable preferred stock | — | — | — | — | — | — | |||||||||||||||||||||||||||||
| Total fixed maturity securities | 26,617 | (1,901) | 27,379 | (1,364) | 25,772 | (2,135) | |||||||||||||||||||||||||||||
| Equities: | |||||||||||||||||||||||||||||||||||
| Common stock | 180 | — | 183 | — | 191 | — | |||||||||||||||||||||||||||||
| Non-redeemable preferred stock | 115 | — | 99 | — | 82 | — | |||||||||||||||||||||||||||||
| Total equities | 295 | — | 282 | — | 273 | — | |||||||||||||||||||||||||||||
| Limited partnership investments: | |||||||||||||||||||||||||||||||||||
| Hedge funds | 275 | — | 272 | — | 184 | — | |||||||||||||||||||||||||||||
| Private equity funds | 1,653 | — | 1,611 | — | 1,019 | — | |||||||||||||||||||||||||||||
| Total limited partnership investments | 1,928 | — | 1,883 | — | 1,203 | — | |||||||||||||||||||||||||||||
| Other invested assets | 85 | — | 83 | — | 80 | — | |||||||||||||||||||||||||||||
| Mortgage loans | 844 | — | 814 | — | 842 | — | |||||||||||||||||||||||||||||
| Short-term investments | 2,040 | — | 1,739 | — | 2,094 | 1 | |||||||||||||||||||||||||||||
| Total investments | $ | 31,809 | $ | (1,901) | $ | 32,180 | $ | (1,364) | $ | 30,264 | $ | (2,134) | |||||||||||||||||||||||
| Net receivable/(payable) on investment activity | $ | 7 | $ | (99) | $ | 33 | |||||||||||||||||||||||||||||
| Effective duration (in years) | 4.3 | 4.4 | 4.5 | ||||||||||||||||||||||||||||||||
Weighted average rating (1) |
A | A | A | ||||||||||||||||||||||||||||||||
 11
11| December 31, 2024 | September 30, 2024 | December 31, 2023 | |||||||||||||||||||||||||||||||||
| (In millions) | Carrying Value | Net Unrealized Gains (Losses) | Carrying Value | Net Unrealized Gains (Losses) | Carrying Value | Net Unrealized Gains (Losses) | |||||||||||||||||||||||||||||
| Fixed maturity securities: | |||||||||||||||||||||||||||||||||||
| Corporate and other bonds | $ | 10,189 | $ | (344) | $ | 10,634 | $ | 259 | $ | 9,844 | $ | 8 | |||||||||||||||||||||||
| States, municipalities and political subdivisions: | |||||||||||||||||||||||||||||||||||
| Tax-exempt | 2,184 | 141 | 2,306 | 222 | 2,562 | 247 | |||||||||||||||||||||||||||||
| Taxable | 1,480 | (98) | 1,575 | 6 | 1,594 | (10) | |||||||||||||||||||||||||||||
| Total states, municipalities and political subdivisions | 3,664 | 43 | 3,881 | 228 | 4,156 | 237 | |||||||||||||||||||||||||||||
| Asset-backed: | |||||||||||||||||||||||||||||||||||
| RMBS | 2 | — | 2 | — | 2 | — | |||||||||||||||||||||||||||||
| CMBS | 22 | (3) | 23 | (2) | 30 | (2) | |||||||||||||||||||||||||||||
| Other ABS | 562 | (110) | 602 | (68) | 592 | (73) | |||||||||||||||||||||||||||||
| Total asset-backed | 586 | (113) | 627 | (70) | 624 | (75) | |||||||||||||||||||||||||||||
| U.S. Treasury and obligations of government-sponsored enterprises | 9 | — | 9 | — | 1 | — | |||||||||||||||||||||||||||||
| Foreign government | 46 | (10) | 49 | (7) | 28 | (8) | |||||||||||||||||||||||||||||
| Redeemable preferred stock | — | — | — | — | — | — | |||||||||||||||||||||||||||||
| Total fixed maturity securities | 14,494 | (424) | 15,200 | 410 | 14,653 | 162 | |||||||||||||||||||||||||||||
| Equities: | |||||||||||||||||||||||||||||||||||
| Common stock | — | — | — | — | — | — | |||||||||||||||||||||||||||||
| Non-redeemable preferred stock | 364 | — | 386 | — | 410 | — | |||||||||||||||||||||||||||||
| Total equities | 364 | — | 386 | — | 410 | — | |||||||||||||||||||||||||||||
| Limited partnership investments: | |||||||||||||||||||||||||||||||||||
| Hedge funds | 84 | — | 84 | — | 148 | — | |||||||||||||||||||||||||||||
| Private equity funds | 508 | — | 495 | — | 823 | — | |||||||||||||||||||||||||||||
| Total limited partnership investments | 592 | — | 579 | — | 971 | — | |||||||||||||||||||||||||||||
| Other invested assets | — | — | — | — | — | — | |||||||||||||||||||||||||||||
| Mortgage loans | 175 | — | 189 | — | 193 | — | |||||||||||||||||||||||||||||
| Short-term investments | 48 | — | 161 | — | 71 | — | |||||||||||||||||||||||||||||
| Total investments | $ | 15,673 | $ | (424) | $ | 16,515 | $ | 410 | $ | 16,298 | $ | 162 | |||||||||||||||||||||||
| Net receivable/(payable) on investment activity | $ | 9 | $ | 6 | $ | 3 | |||||||||||||||||||||||||||||
| Effective duration (in years) | 9.8 | 10.1 | 10.2 | ||||||||||||||||||||||||||||||||
Weighted average rating (1) |
A- | A- | A- | ||||||||||||||||||||||||||||||||
 12
12| December 31, 2024 | U.S. Government, Government agencies and Government-sponsored enterprises | AAA | AA | A | BBB | Non-investment grade | Total | ||||||||||||||||||||||||||||||||||||||||||||||||||||||||||||||||||||||||||||
| (In millions) | Fair Value | Net Unrealized Gains (Losses) | Fair Value | Net Unrealized Gains (Losses) | Fair Value | Net Unrealized Gains (Losses) | Fair Value | Net Unrealized Gains (Losses) | Fair Value | Net Unrealized Gains (Losses) | Fair Value | Net Unrealized Gains (Losses) | Fair Value | Net Unrealized Gains (Losses) | |||||||||||||||||||||||||||||||||||||||||||||||||||||||||||||||||||||
| Corporate and other bonds | $ | — | $ | — | $ | 23 | $ | — | $ | 715 | $ | (32) | $ | 7,693 | $ | (225) | $ | 14,976 | $ | (592) | $ | 1,537 | $ | (33) | $ | 24,944 | $ | (882) | |||||||||||||||||||||||||||||||||||||||||||||||||||||||
| States, municipalities and political subdivisions | — | — | 1,086 | (67) | 4,430 | (402) | 1,011 | (70) | 258 | (47) | 19 | (6) | 6,804 | (592) | |||||||||||||||||||||||||||||||||||||||||||||||||||||||||||||||||||||
| Asset-backed: | |||||||||||||||||||||||||||||||||||||||||||||||||||||||||||||||||||||||||||||||||||
| RMBS | 2,716 | (369) | 512 | (115) | 8 | — | — | — | — | — | 8 | 3 | 3,244 | (481) | |||||||||||||||||||||||||||||||||||||||||||||||||||||||||||||||||||||
| CMBS | — | — | 736 | (14) | 609 | (60) | 163 | (20) | 139 | (20) | 34 | (17) | 1,681 | (131) | |||||||||||||||||||||||||||||||||||||||||||||||||||||||||||||||||||||
| Other ABS | — | — | 460 | (19) | 253 | (65) | 1,355 | (58) | 1,292 | (62) | 181 | (11) | 3,541 | (215) | |||||||||||||||||||||||||||||||||||||||||||||||||||||||||||||||||||||
| Total asset-backed | 2,716 | (369) | 1,708 | (148) | 870 | (125) | 1,518 | (78) | 1,431 | (82) | 223 | (25) | 8,466 | (827) | |||||||||||||||||||||||||||||||||||||||||||||||||||||||||||||||||||||
| U.S. Treasury and obligations of government-sponsored enterprises | 220 | — | — | — | — | — | — | — | — | — | — | — | 220 | — | |||||||||||||||||||||||||||||||||||||||||||||||||||||||||||||||||||||
| Foreign government | — | — | 193 | (2) | 354 | (8) | 38 | (6) | 92 | (8) | — | — | 677 | (24) | |||||||||||||||||||||||||||||||||||||||||||||||||||||||||||||||||||||
| Redeemable preferred stock | — | — | — | — | — | — | — | — | — | — | — | — | — | — | |||||||||||||||||||||||||||||||||||||||||||||||||||||||||||||||||||||
| Total fixed maturity securities | $ | 2,936 | $ | (369) | $ | 3,010 | $ | (217) | $ | 6,369 | $ | (567) | $ | 10,260 | $ | (379) | $ | 16,757 | $ | (729) | $ | 1,779 | $ | (64) | $ | 41,111 | $ | (2,325) | |||||||||||||||||||||||||||||||||||||||||||||||||||||||
| Percentage of total fixed maturity securities | 7 | % | 7 | % | 16 | % | 25 | % | 41 | % | 4 | % | 100 | % | |||||||||||||||||||||||||||||||||||||||||||||||||||||||||||||||||||||
 13
13| December 31, 2024 | December 31, 2023 | ||||||||||||||||||||||
| (In millions) | Estimated Fair Value | Net Unrealized Gains (Losses) | Estimated Fair Value | Net Unrealized Gains (Losses) | |||||||||||||||||||
| Commercial mortgage-backed: | |||||||||||||||||||||||
| Single asset, single borrower: | |||||||||||||||||||||||
| Office | $ | 339 | $ | (43) | $ | 306 | $ | (70) | |||||||||||||||
| Lodging | 271 | (8) | 227 | (23) | |||||||||||||||||||
| Retail | 268 | (10) | 283 | (28) | |||||||||||||||||||
| Multifamily | 50 | (1) | 59 | (3) | |||||||||||||||||||
| Industrial | 42 | (3) | 93 | (4) | |||||||||||||||||||
| Total single asset, single borrower | 970 | (65) | 968 | (128) | |||||||||||||||||||
| Conduits (multi property, multi borrower pools) | 711 | (66) | 663 | (95) | |||||||||||||||||||
| Total commercial mortgage-backed | $ | 1,681 | $ | (131) | $ | 1,631 | $ | (223) | |||||||||||||||
| December 31, 2024 | December 31, 2023 | ||||||||||||||||||||||
| (In millions) | Estimated Fair Value | Net Unrealized Gains (Losses) | Estimated Fair Value | Net Unrealized Gains (Losses) | |||||||||||||||||||
| Commercial mortgage-backed: | |||||||||||||||||||||||
| AAA | $ | 736 | $ | (14) | $ | 570 | $ | (27) | |||||||||||||||
| AA | 609 | (60) | 594 | (95) | |||||||||||||||||||
| A | 163 | (20) | 202 | (30) | |||||||||||||||||||
| BBB | 139 | (20) | 216 | (45) | |||||||||||||||||||
| Non-investment grade | 34 | (17) | 49 | (26) | |||||||||||||||||||
| Total commercial mortgage-backed | $ | 1,681 | $ | (131) | $ | 1,631 | $ | (223) | |||||||||||||||
 14
14| December 31, 2024 | December 31, 2023 | ||||||||||||||||||||||
| (In millions) | Estimated Fair Value | Net Unrealized Gains (Losses) | Estimated Fair Value | Net Unrealized Gains (Losses) | |||||||||||||||||||
| Corporate and other bonds - REITs: | |||||||||||||||||||||||
| Retail | $ | 478 | $ | (18) | $ | 515 | $ | (25) | |||||||||||||||
| Office | 239 | (12) | 250 | (20) | |||||||||||||||||||
| Self-Storage | 98 | (5) | 85 | (6) | |||||||||||||||||||
| Industrial | 93 | (3) | 99 | (1) | |||||||||||||||||||
Other (1) |
387 | (10) | 367 | (16) | |||||||||||||||||||
Total corporate and other bonds - REITs (2) |
$ | 1,295 | $ | (48) | $ | 1,316 | $ | (68) | |||||||||||||||
| December 31, 2024 | December 31, 2023 | ||||||||||||||||||||||
| (In millions) | Estimated Fair Value | Net Unrealized Gains (Losses) | Estimated Fair Value | Net Unrealized Gains (Losses) | |||||||||||||||||||
| Corporate and other bonds - REITs: | |||||||||||||||||||||||
| AA | $ | 6 | $ | — | $ | 10 | $ | — | |||||||||||||||
| A | 310 | (6) | 285 | (3) | |||||||||||||||||||
| BBB | 942 | (40) | 994 | (64) | |||||||||||||||||||
| Non-investment grade | 37 | (2) | 27 | (1) | |||||||||||||||||||
Total corporate and other bonds - REITs (2) |
$ | 1,295 | $ | (48) | $ | 1,316 | $ | (68) | |||||||||||||||
| December 31, 2024 | December 31, 2023 | ||||||||||||||||||||||
| (In millions) | Carrying Value | Percentage of Total | Carrying Value | Percentage of Total | |||||||||||||||||||
| Mortgage loans: | |||||||||||||||||||||||
| Retail | $ | 527 | 50 | % | $ | 520 | 48 | % | |||||||||||||||
| Office | 239 | 22 | % | 245 | 23 | % | |||||||||||||||||
| Industrial | 123 | 12 | % | 124 | 12 | % | |||||||||||||||||
| Other | 165 | 16 | % | 181 | 17 | % | |||||||||||||||||
| Total mortgage loans | 1,054 | 100 | % | 1,070 | 100 | % | |||||||||||||||||
| Less: Allowance for expected credit losses | (35) | (35) | |||||||||||||||||||||
| Total mortgage loans - net of allowance | $ | 1,019 | $ | 1,035 | |||||||||||||||||||
| (1) Other includes a diversified mix of property type strategies including healthcare and apartments. | |||||||||||||||||||||||
| (2) REITs - Real estate investment trusts | |||||||||||||||||||||||
 15
15| Consolidated | ||||||||||||||||||||||||||
| Periods ended December 31 | Three Months | Twelve Months | ||||||||||||||||||||||||
| (In millions) | 2024 | 2023 | 2024 | 2023 | ||||||||||||||||||||||
| Taxable fixed income securities | $ | 494 | $ | 467 | $ | 1,940 | $ | 1,798 | ||||||||||||||||||
| Tax-exempt fixed income securities | 35 | 40 | 144 | 178 | ||||||||||||||||||||||
| Total fixed income securities | 529 | 507 | 2,084 | 1,976 | ||||||||||||||||||||||
| Common stock | 18 | 12 | 49 | 28 | ||||||||||||||||||||||
| Limited partnerships - hedge funds | 7 | 18 | 42 | 37 | ||||||||||||||||||||||
| Limited partnerships - private equity funds | 69 | 48 | 229 | 137 | ||||||||||||||||||||||
| Total limited partnership and common stock investments | 94 | 78 | 320 | 202 | ||||||||||||||||||||||
| Other, net of investment expense | 21 | 26 | 93 | 86 | ||||||||||||||||||||||
| Net investment income | $ | 644 | $ | 611 | $ | 2,497 | $ | 2,264 | ||||||||||||||||||
| Effective income yield for fixed income securities portfolio | 4.8 | % | 4.7 | % | 4.8 | % | 4.7 | % | ||||||||||||||||||
| Limited partnership and common stock return | 3.5 | 3.4 | 13.3 | 9.4 | ||||||||||||||||||||||
| Property & Casualty and Corporate & Other | ||||||||||||||||||||||||||
| Periods ended December 31 | Three Months | Twelve Months | ||||||||||||||||||||||||
| (In millions) | 2024 | 2023 | 2024 | 2023 | ||||||||||||||||||||||
| Taxable fixed income securities | $ | 303 | $ | 285 | $ | 1,196 | $ | 1,101 | ||||||||||||||||||
| Tax-exempt fixed income securities | 10 | 11 | 37 | 43 | ||||||||||||||||||||||
| Total fixed income securities | 313 | 296 | 1,233 | 1,144 | ||||||||||||||||||||||
| Common stock | 18 | 12 | 49 | 28 | ||||||||||||||||||||||
| Limited partnerships - hedge funds | 5 | 9 | 27 | 20 | ||||||||||||||||||||||
| Limited partnerships - private equity funds | 53 | 27 | 142 | 76 | ||||||||||||||||||||||
| Total limited partnership and common stock investments | 76 | 48 | 218 | 124 | ||||||||||||||||||||||
| Other, net of investment expense | 25 | 30 | 106 | 100 | ||||||||||||||||||||||
| Net investment income | $ | 414 | $ | 374 | $ | 1,557 | $ | 1,368 | ||||||||||||||||||
| Effective income yield for fixed income securities portfolio | 4.4 | % | 4.3 | % | 4.3 | % | 4.2 | % | ||||||||||||||||||
| Life & Group | ||||||||||||||||||||||||||
| Periods ended December 31 | Three Months | Twelve Months | ||||||||||||||||||||||||
| (In millions) | 2024 | 2023 | 2024 | 2023 | ||||||||||||||||||||||
| Taxable fixed income securities | $ | 191 | $ | 182 | $ | 744 | $ | 697 | ||||||||||||||||||
| Tax-exempt fixed income securities | 25 | 29 | 107 | 135 | ||||||||||||||||||||||
| Total fixed income securities | 216 | 211 | 851 | 832 | ||||||||||||||||||||||
| Common stock | — | — | — | — | ||||||||||||||||||||||
| Limited partnerships - hedge funds | 2 | 9 | 15 | 17 | ||||||||||||||||||||||
| Limited partnerships - private equity funds | 16 | 21 | 87 | 61 | ||||||||||||||||||||||
| Total limited partnership and common stock investments | 18 | 30 | 102 | 78 | ||||||||||||||||||||||
| Other, net of investment expense | (4) | (4) | (13) | (14) | ||||||||||||||||||||||
| Net investment income | $ | 230 | $ | 237 | $ | 940 | $ | 896 | ||||||||||||||||||
| Effective income yield for fixed income securities portfolio | 5.7 | % | 5.6 | % | 5.6 | % | 5.6 | % | ||||||||||||||||||
 16
16| Periods ended December 31 | Consolidated | ||||||||||||||||||||||
| Three Months | Twelve Months | ||||||||||||||||||||||
| (In millions) | 2024 | 2023 | 2024 | 2023 | |||||||||||||||||||
| Fixed maturity securities: | |||||||||||||||||||||||
| Corporate and other bonds | $ | (19) | $ | (11) | $ | (57) | $ | (57) | |||||||||||||||
| States, municipalities and political subdivisions | 4 | 7 | 1 | 10 | |||||||||||||||||||
| Asset-backed | (21) | (1) | (46) | (44) | |||||||||||||||||||
| Total fixed maturity securities | (36) | (5) | (102) | (91) | |||||||||||||||||||
| Non-redeemable preferred stock | (4) | 13 | 21 | 4 | |||||||||||||||||||
| Derivatives, short-term and other | 1 | (2) | — | (1) | |||||||||||||||||||
| Mortgage loans | — | — | — | (11) | |||||||||||||||||||
| Net investment gains (losses) | (39) | 6 | (81) | (99) | |||||||||||||||||||
| Income tax benefit (expense) on net investment gains (losses) | 8 | (1) | 17 | 20 | |||||||||||||||||||
| Net investment gains (losses), after tax | $ | (31) | $ | 5 | $ | (64) | $ | (79) | |||||||||||||||
 17
17|
Three months ended December 31, 2024
(In millions)
|
Specialty |
Commercial |
International | P&C Operations | Life & Group | Corporate & Other | Total Operations | ||||||||||||||||||||||||||||||||||
| Claim & claim adjustment expense reserves, beginning of period | |||||||||||||||||||||||||||||||||||||||||
| Gross | $ | 7,328 | $ | 11,018 | $ | 2,990 | $ | 21,336 | $ | 650 | $ | 2,572 | $ | 24,558 | |||||||||||||||||||||||||||
| Ceded | 1,395 | 1,286 | 491 | 3,172 | 86 | 2,184 | 5,442 | ||||||||||||||||||||||||||||||||||
| Net | 5,933 | 9,732 | 2,499 | 18,164 | 564 | 388 | 19,116 | ||||||||||||||||||||||||||||||||||
| Net incurred claim & claim adjustment expenses | 522 | 897 | 196 | 1,615 | 8 | 26 | 1,649 | ||||||||||||||||||||||||||||||||||
| Net claim & claim adjustment expense payments | (476) | (687) | (144) | (1,307) | (12) | (26) | (1,345) | ||||||||||||||||||||||||||||||||||
| Foreign currency translation adjustment and other | — | (3) | (135) | (138) | (19) | — | (157) | ||||||||||||||||||||||||||||||||||
| Claim & claim adjustment expense reserves, end of period | |||||||||||||||||||||||||||||||||||||||||
| Net | 5,979 | 9,939 | 2,416 | 18,334 | 541 | 388 | 19,263 | ||||||||||||||||||||||||||||||||||
| Ceded | 1,447 | 1,397 | 504 | 3,348 | 81 | 2,284 | 5,713 | ||||||||||||||||||||||||||||||||||
| Gross | $ | 7,426 | $ | 11,336 | $ | 2,920 | $ | 21,682 | $ | 622 | $ | 2,672 | $ | 24,976 | |||||||||||||||||||||||||||
|
Twelve months ended December 31, 2024
(In millions)
|
Specialty |
Commercial |
International | P&C Operations | Life & Group | Corporate & Other | Total Operations | ||||||||||||||||||||||||||||||||||
| Claim & claim adjustment expense reserves, beginning of period | |||||||||||||||||||||||||||||||||||||||||
| Gross | $ | 7,131 | $ | 10,103 | $ | 2,709 | $ | 19,943 | $ | 675 | $ | 2,686 | $ | 23,304 | |||||||||||||||||||||||||||
| Ceded | 1,215 | 1,082 | 433 | 2,730 | 93 | 2,318 | 5,141 | ||||||||||||||||||||||||||||||||||
| Net | 5,916 | 9,021 | 2,276 | 17,213 | 582 | 368 | 18,163 | ||||||||||||||||||||||||||||||||||
| Net incurred claim & claim adjustment expenses | 2,001 | 3,526 | 764 | 6,291 | 24 | 96 | 6,411 | ||||||||||||||||||||||||||||||||||
| Net claim & claim adjustment expense payments | (1,937) | (2,606) | (525) | (5,068) | (45) | (76) | (5,189) | ||||||||||||||||||||||||||||||||||
| Foreign currency translation adjustment and other | (1) | (2) | (99) | (102) | (20) | — | (122) | ||||||||||||||||||||||||||||||||||
| Claim & claim adjustment expense reserves, end of period | |||||||||||||||||||||||||||||||||||||||||
| Net | 5,979 | 9,939 | 2,416 | 18,334 | 541 | 388 | 19,263 | ||||||||||||||||||||||||||||||||||
| Ceded | 1,447 | 1,397 | 504 | 3,348 | 81 | 2,284 | 5,713 | ||||||||||||||||||||||||||||||||||
| Gross | $ | 7,426 | $ | 11,336 | $ | 2,920 | $ | 21,682 | $ | 622 | $ | 2,672 | $ | 24,976 | |||||||||||||||||||||||||||
 18
18Three months ended December 31, 2024 (In millions) |
Claim and claim adjustment expenses | Future policy benefits | Total | ||||||||||||||
| Beginning of Period | $ | 564 | $ | 14,047 | $ | 14,611 | |||||||||||
Incurred claims and policyholders' benefits (1) |
8 | 327 | 335 | ||||||||||||||
| Benefit and expense payments | (12) | (304) | (316) | ||||||||||||||
| Change in discount rate assumptions and other (AOCI) | (19) | (912) | (931) | ||||||||||||||
| End of Period | $ | 541 | $ | 13,158 | $ | 13,699 | |||||||||||
Twelve months ended December 31, 2024 (In millions) |
Claim and claim adjustment expenses | Future policy benefits | Total | ||||||||||||||
| Beginning of Period | $ | 582 | $ | 13,959 | $ | 14,541 | |||||||||||
Incurred claims and policyholders' benefits (1) |
24 | 1,286 | 1,310 | ||||||||||||||
| Benefit and expense payments | (45) | (1,187) | (1,232) | ||||||||||||||
| Change in discount rate assumptions and other (AOCI) | (20) | (900) | (920) | ||||||||||||||
| End of Period | $ | 541 | $ | 13,158 | $ | 13,699 | |||||||||||
 19
19 20
20 21
21



| Results for the Three Months Ended December 31 | Results for the Year Ended December 31 | ||||||||||||||||||||||
| ($ millions) | 2024 | 2023 | 2024 | 2023 | |||||||||||||||||||
| Net income | $ | 21 | $ | 367 | $ | 959 | $ | 1,205 | |||||||||||||||
| Less: Net investment (losses) gains | (31) | 5 | (64) | (79) | |||||||||||||||||||
| Less: Pension settlement transaction losses | (290) | — | (293) | — | |||||||||||||||||||
| Core income | $ | 342 | $ | 362 | $ | 1,316 | $ | 1,284 | |||||||||||||||
| Results for the Three Months Ended December 31 | Results for the Year Ended December 31 | ||||||||||||||||||||||
| 2024 | 2023 | 2024 | 2023 | ||||||||||||||||||||
| Net income per diluted share | $ | 0.07 | $ | 1.35 | $ | 3.52 | $ | 4.43 | |||||||||||||||
| Less: Net investment (losses) gains | (0.12) | 0.02 | (0.23) | (0.28) | |||||||||||||||||||
| Less: Pension settlement transaction losses | (1.06) | — | (1.08) | — | |||||||||||||||||||
| Core income per diluted share | $ | 1.25 | $ | 1.33 | $ | 4.83 | $ | 4.71 | |||||||||||||||

| Results for the Three Months Ended December 31, 2024 | ||||||||||||||
| Specialty | Commercial | International | Property & Casualty | |||||||||||
| (In millions) | ||||||||||||||
| Net income | $ | 165 | $ | 222 | $ | 37 | $ | 424 | ||||||
| Net investment losses (gains), after tax | 12 | 16 | (1) | 27 | ||||||||||
| Core income | $ | 177 | $ | 238 | $ | 36 | $ | 451 | ||||||
| Less: | ||||||||||||||
| Net investment income | 165 | 199 | 36 | 400 | ||||||||||
| Non-insurance warranty revenue (expense) | 19 | — | — | 19 | ||||||||||
| Other revenue (expense), including interest expense | (13) | (4) | (15) | (32) | ||||||||||
| Income tax expense on core income | (48) | (63) | (3) | (114) | ||||||||||
| Underwriting gain | 54 | 106 | 18 | 178 | ||||||||||
| Effect of catastrophe losses | — | 33 | 12 | 45 | ||||||||||
| Effect of favorable development-related items | — | — | (1) | (1) | ||||||||||
| Underlying underwriting gain | $ | 54 | $ | 139 | $ | 29 | $ | 222 | ||||||
| Results for the Three Months Ended December 31, 2023 | ||||||||||||||
| Specialty | Commercial | International | Property & Casualty | |||||||||||
| (In millions) | ||||||||||||||
| Net income | $ | 179 | $ | 204 | $ | 44 | $ | 427 | ||||||
| Net investment losses (gains), after tax | 3 | 5 | (1) | 7 | ||||||||||
| Core income | $ | 182 | $ | 209 | $ | 43 | $ | 434 | ||||||
| Less: | ||||||||||||||
| Net investment income | 151 | 175 | 29 | 355 | ||||||||||
| Non-insurance warranty revenue (expense) | 13 | — | — | 13 | ||||||||||
| Other revenue (expense), including interest expense | (13) | 4 | 6 | (3) | ||||||||||
| Income tax expense on core income | (49) | (56) | (12) | (117) | ||||||||||
| Underwriting gain | 80 | 86 | 20 | 186 | ||||||||||
| Effect of catastrophe losses | — | 17 | 5 | 22 | ||||||||||
| Effect of favorable development-related items | (5) | — | (2) | (7) | ||||||||||
| Underlying underwriting gain | $ | 75 | $ | 103 | $ | 23 | $ | 201 | ||||||

| Results for the Twelve Months Ended December 31, 2024 | ||||||||||||||
| Specialty | Commercial | International | Property & Casualty | |||||||||||
| (In millions) | ||||||||||||||
| Net income | $ | 663 | $ | 658 | $ | 153 | $ | 1,474 | ||||||
| Net investment losses, after tax | 31 | 44 | — | 75 | ||||||||||
| Core income | $ | 694 | $ | 702 | $ | 153 | $ | 1,549 | ||||||
| Less: | ||||||||||||||
| Net investment income | 626 | 733 | 131 | 1,490 | ||||||||||
| Non-insurance warranty revenue (expense) | 62 | — | — | 62 | ||||||||||
| Other revenue (expense), including interest expense | (53) | (14) | (10) | (77) | ||||||||||
| Income tax expense on core income | (190) | (188) | (44) | (422) | ||||||||||
| Underwriting gain | 249 | 171 | 76 | 496 | ||||||||||
| Effect of catastrophe losses | — | 318 | 40 | 358 | ||||||||||
| Effect of favorable development-related items | (8) | — | (6) | (14) | ||||||||||
| Underlying underwriting gain | $ | 241 | $ | 489 | $ | 110 | $ | 840 | ||||||
| Results for the Twelve Months Ended December 31, 2023 | ||||||||||||||
| Specialty | Commercial | International | Property & Casualty | |||||||||||
| (In millions) | ||||||||||||||
| Net income | $ | 666 | $ | 594 | $ | 147 | $ | 1,407 | ||||||
| Net investment losses (gains), after tax | 42 | 58 | (2) | 98 | ||||||||||
| Core income | $ | 708 | $ | 652 | $ | 145 | $ | 1,505 | ||||||
| Less: | ||||||||||||||
| Net investment income | 558 | 645 | 103 | 1,306 | ||||||||||
| Non-insurance warranty revenue (expense) | 80 | — | — | 80 | ||||||||||
| Other revenue (expense), including interest expense | (52) | (1) | 4 | (49) | ||||||||||
| Income tax expense on core income | (195) | (174) | (48) | (417) | ||||||||||
| Underwriting gain | 317 | 182 | 86 | 585 | ||||||||||
| Effect of catastrophe losses | — | 207 | 29 | 236 | ||||||||||
| Effect of (favorable) unfavorable development-related items | (12) | (4) | 13 | (3) | ||||||||||
| Underlying underwriting gain | $ | 305 | $ | 385 | $ | 128 | $ | 818 | ||||||

| Results for the Three Months Ended December 31 | Results for the Twelve Months Ended December 31 |
||||||||||||||||||||||||||||||||||
| 2024 | 2023 | 2024 | 2023 | ||||||||||||||||||||||||||||||||
Loss ratio |
60.1 | % |
58.0 | % |
59.5 | % |
58.2 | % |
|||||||||||||||||||||||||||
| Less: Effect of catastrophe impacts | — | — | — | — | |||||||||||||||||||||||||||||||
| Less: Effect of favorable development-related items | — | (0.6) | (0.3) | (0.3) | |||||||||||||||||||||||||||||||
Underlying loss ratio |
60.1 | % |
58.6 | % |
59.8 | % |
58.5 | % |
|||||||||||||||||||||||||||
Combined ratio |
93.8 | % |
90.8 | % |
92.6 | % |
90.4 | % |
|||||||||||||||||||||||||||
Underlying combined ratio |
93.8 | % |
91.4 | % |
92.9 | % |
90.7 | % |
|||||||||||||||||||||||||||
| Results for the Three Months Ended December 31 | Results for the Twelve Months Ended December 31 | ||||||||||||||||||||||||||||||||||
| 2024 | 2023 | 2024 | 2023 | ||||||||||||||||||||||||||||||||
Loss ratio |
64.8 | % |
62.8 | % |
68.3 | % |
65.9 | % |
|||||||||||||||||||||||||||
| Less: Effect of catastrophe impacts | 2.3 | 1.4 | 6.2 | 4.5 | |||||||||||||||||||||||||||||||
| Less: Effect of favorable development-related items | — | (0.1) | (0.1) | (0.1) | |||||||||||||||||||||||||||||||
Underlying loss ratio |
62.5 | % |
61.5 | % |
62.2 | % |
61.5 | % |
|||||||||||||||||||||||||||
Combined ratio |
92.3 | % |
92.9 | % |
96.7 | % |
96.0 | % |
|||||||||||||||||||||||||||
Underlying combined ratio |
90.0 | % |
91.6 | % |
90.6 | % |
91.6 | % |
|||||||||||||||||||||||||||
| Results for the Three Months Ended December 31 | Results for the Twelve Months Ended December 31 | ||||||||||||||||||||||||||||||||||
| 2024 | 2023 | 2024 | 2023 | ||||||||||||||||||||||||||||||||
Loss ratio |
61.6 | % |
58.9 | % |
60.9 | % |
61.4 | % |
|||||||||||||||||||||||||||
| Less: Effect of catastrophe impacts | 3.9 | 1.8 | 3.2 | 2.5 | |||||||||||||||||||||||||||||||
| Less: Effect of (favorable) unfavorable development-related items | (0.4) | (0.6) | (0.4) | 1.1 | |||||||||||||||||||||||||||||||
Underlying loss ratio |
58.1 | % |
57.7 | % |
58.1 | % |
57.8 | % |
|||||||||||||||||||||||||||
Combined ratio |
94.8 | % |
93.0 | % |
94.0 | % |
92.6 | % |
|||||||||||||||||||||||||||
Underlying combined ratio |
91.3 | % |
91.8 | % |
91.2 | % |
89.0 | % |
|||||||||||||||||||||||||||

| Results for the Three Months Ended December 31 | Results for the Twelve Months Ended December 31 | ||||||||||||||||||||||||||||||||||
| 2024 | 2023 | 2024 | 2023 | ||||||||||||||||||||||||||||||||
Loss ratio |
62.8 | % |
60.6 | % |
64.3 | % |
62.5 | % |
|||||||||||||||||||||||||||
| Less: Effect of catastrophe impacts | 1.8 | 1.0 | 3.6 | 2.6 | |||||||||||||||||||||||||||||||
| Less: Effect of favorable development-related items | (0.1) | (0.3) | (0.2) | — | |||||||||||||||||||||||||||||||
Underlying loss ratio |
61.1 | % |
59.9 | % |
60.9 | % |
59.9 | % |
|||||||||||||||||||||||||||
Combined ratio |
93.1 | % |
92.1 | % |
94.9 | % |
93.5 | % |
|||||||||||||||||||||||||||
Underlying combined ratio |
91.4 | % |
91.4 | % |
91.5 | % |
90.9 | % |
|||||||||||||||||||||||||||
| December 31, 2024 | December 31, 2023 | ||||||||||
| Book value per share | $ | 38.82 | $ | 36.52 | |||||||
| Less: Per share impact of AOCI | (7.34) | (9.87) | |||||||||
| Book value per share excluding AOCI | $ | 46.16 | $ | 46.39 | |||||||
| Results for the Three Months Ended December 31 | Results for the Year Ended December 31 | |||||||||||||||||||||||||
| ($ millions) | 2024 | 2023 | 2024 | 2023 | ||||||||||||||||||||||
| Annualized net income | $ | 81 | $ | 1,468 | $ | 959 | $ | 1,205 | ||||||||||||||||||
Average stockholders' equity including AOCI (a) |
10,635 | 9,228 | 10,203 | 9,220 | ||||||||||||||||||||||
| Return on equity | 0.8 | % | 15.9 | % | 9.4 | % | 13.1 | % | ||||||||||||||||||
| Annualized core income | $ | 1,366 | $ | 1,448 | $ | 1,316 | $ | 1,284 | ||||||||||||||||||
Average stockholders' equity excluding AOCI (a) |
12,549 | 12,435 | 12,534 | 12,355 | ||||||||||||||||||||||
| Core return on equity | 10.9 | % | 11.6 | % | 10.5 | % | 10.4 | % | ||||||||||||||||||

