株探米国株
日本語 英語
エドガーで原本を確認する
0000021175falseCommon Stock, Par value $2.50"CNA"00000211752024-11-042024-11-040000021175exch:XNYS2024-11-042024-11-040000021175exch:XCHI2024-11-042024-11-04

UNITED STATES
SECURITIES AND EXCHANGE COMMISSION
Washington, D.C. 20549
FORM 8-K

CURRENT REPORT
Pursuant to Section 13 or 15(d) of The Securities Exchange Act of 1934

Date of Report (Date of earliest event reported) November 4, 2024

CNA FINANCIAL CORPORATION
(Exact name of registrant as specified in its charter)

Delaware 1-5823 36-6169860
(State or other jurisdiction (Commission (IRS Employer
of incorporation) File Number) Identification No.)

151 N. Franklin
Chicago, IL 60606
(Address of principal executive offices) (Zip Code)
(312) 822-5000
(Registrant's telephone number, including area code)

NOT APPLICABLE
(Former name or former address, if changed since last report.)
Check the appropriate box below if the Form 8-K filing is intended to simultaneously satisfy the filing obligation of the registrant under any of the following provisions (see General Instruction A.2. below):
☐ Written communications pursuant to Rule 425 under the Securities Act (17 CFR 230.425)
☐ Soliciting material pursuant to Rule 14a-12 under the Exchange Act (17 CFR 240.14a-12)
☐ Pre-commencement communications pursuant to Rule 14d-2(b) under the Exchange Act (17 CFR 240.14d-2(b))
☐ Pre-commencement communications pursuant to Rule 13e-4(c) under the Exchange Act (17 CFR 240.13e-4(c))

Securities registered pursuant to Section 12(b) of the Act:
Title of each class Trading Symbol(s) Name of each exchange on which registered
Common Stock, Par value $2.50 "CNA" New York Stock Exchange
Chicago Stock Exchange
Indicate by check mark whether the registrant is an emerging growth company as defined in Rule 405 of the Securities Act of 1933 (§230.405 of this chapter) or Rule 12b-2 of the Securities Exchange Act of 1934 (§240.12b-2 of this chapter).
Emerging growth company ☐
If an emerging growth company, indicate by check mark if the registrant has elected not to use the extended transition period for complying with any new or revised financial accounting standards provided pursuant to Section 13(a) of the Exchange Act. ☐


ITEM 2.02 RESULTS OF OPERATIONS AND FINANCIAL CONDITION.
On November 4, 2024, the registrant issued a press release and posted on its website (www.cna.com) a financial supplement, earnings presentation and earnings remarks providing information on its results of operations for the third quarter 2024. The press release is furnished as Exhibit 99.1, the financial supplement is furnished as Exhibit 99.2, the earnings presentation is furnished as Exhibit 99.3 and the earnings remarks are furnished as Exhibit 99.4 to this Form 8-K.
The information under Item 2.02 and in Exhibits 99.1, 99.2, 99.3 and 99.4 in this Current Report is being furnished and shall not be deemed “filed” for the purpose of Section 18 of the Securities Exchange Act of 1934, as amended, or otherwise subject to the liabilities of that Section. The information under Item 2.02 and in Exhibits 99.1, 99.2, 99.3 and 99.4 in this Current Report shall not be incorporated by reference into any registration statement or other document pursuant to the Securities Act of 1933, as amended.

ITEM 9.01 FINANCIAL STATEMENTS AND EXHIBITS.
(d) Exhibits:
See Exhibit Index.


EXHIBIT INDEX

Exhibit No. Description
CNA Financial Corporation press release, issued November 4, 2024, providing information on the third quarter 2024 results of operations.
CNA Financial Corporation financial supplement, posted on its website November 4, 2024, providing supplemental financial information on the third quarter 2024.
CNA Financial Corporation earnings presentation, posted on its website November 4, 2024, providing information on the third quarter 2024 results of operations.
CNA Financial Corporation earnings remarks, posted on its website November 4, 2024, providing information on the third quarter 2024 results of operations.
104 Cover Page Interactive Data File (embedded within the Inline XBRL document)


SIGNATURES

Pursuant to the requirements of the Securities Exchange Act of 1934, the registrant has duly caused this report to be signed on its behalf by the undersigned hereunto duly authorized.

CNA Financial Corporation
(Registrant)
Date:  November 4, 2024 By /s/ Scott R. Lindquist
(Signature)
Scott R. Lindquist
Executive Vice President and
Chief Financial Officer


EX-99.1 2 q32024exhibit991.htm EX-99.1 Document


cnalogoq42019.jpg


FOR IMMEDIATE RELEASE
CNA FINANCIAL ANNOUNCES THIRD QUARTER 2024
NET INCOME OF $1.04 PER SHARE AND CORE INCOME OF $1.08 PER SHARE
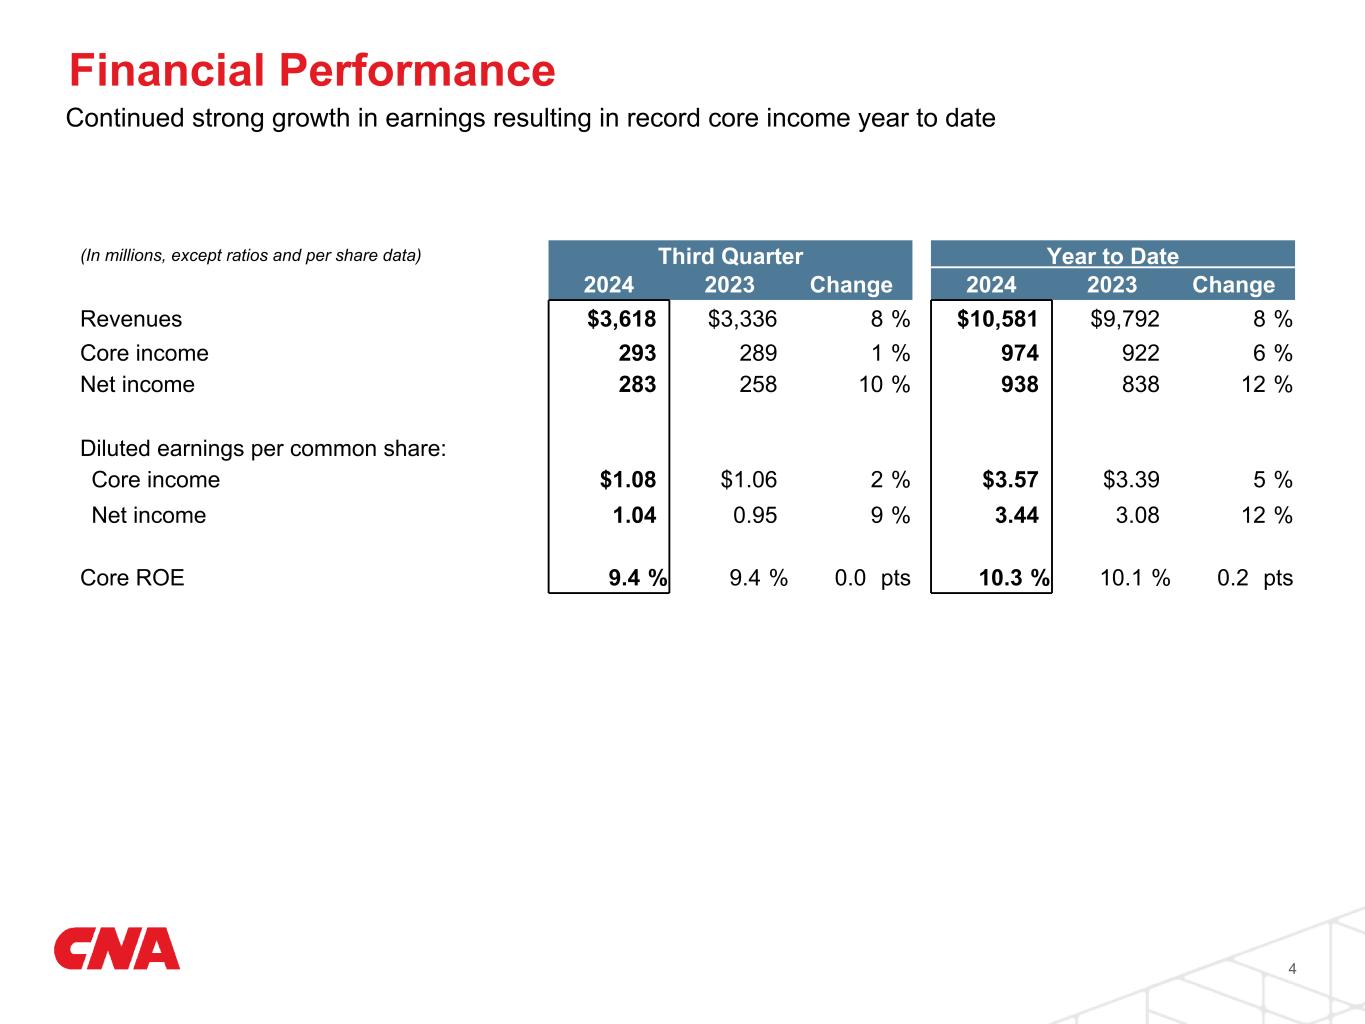
•Net income up 10% to $283 million versus $258 million in the prior year quarter; core income of $293 million versus $289 million in the prior year quarter. Year to date core income up 6% to a record $974 million.
•P&C core income of $346 million versus $351 million, reflects the largely offsetting impacts of higher catastrophe losses and higher investment income.
•Life & Group core loss of $9 million versus $29 million in the prior year quarter, reflects higher investment income.
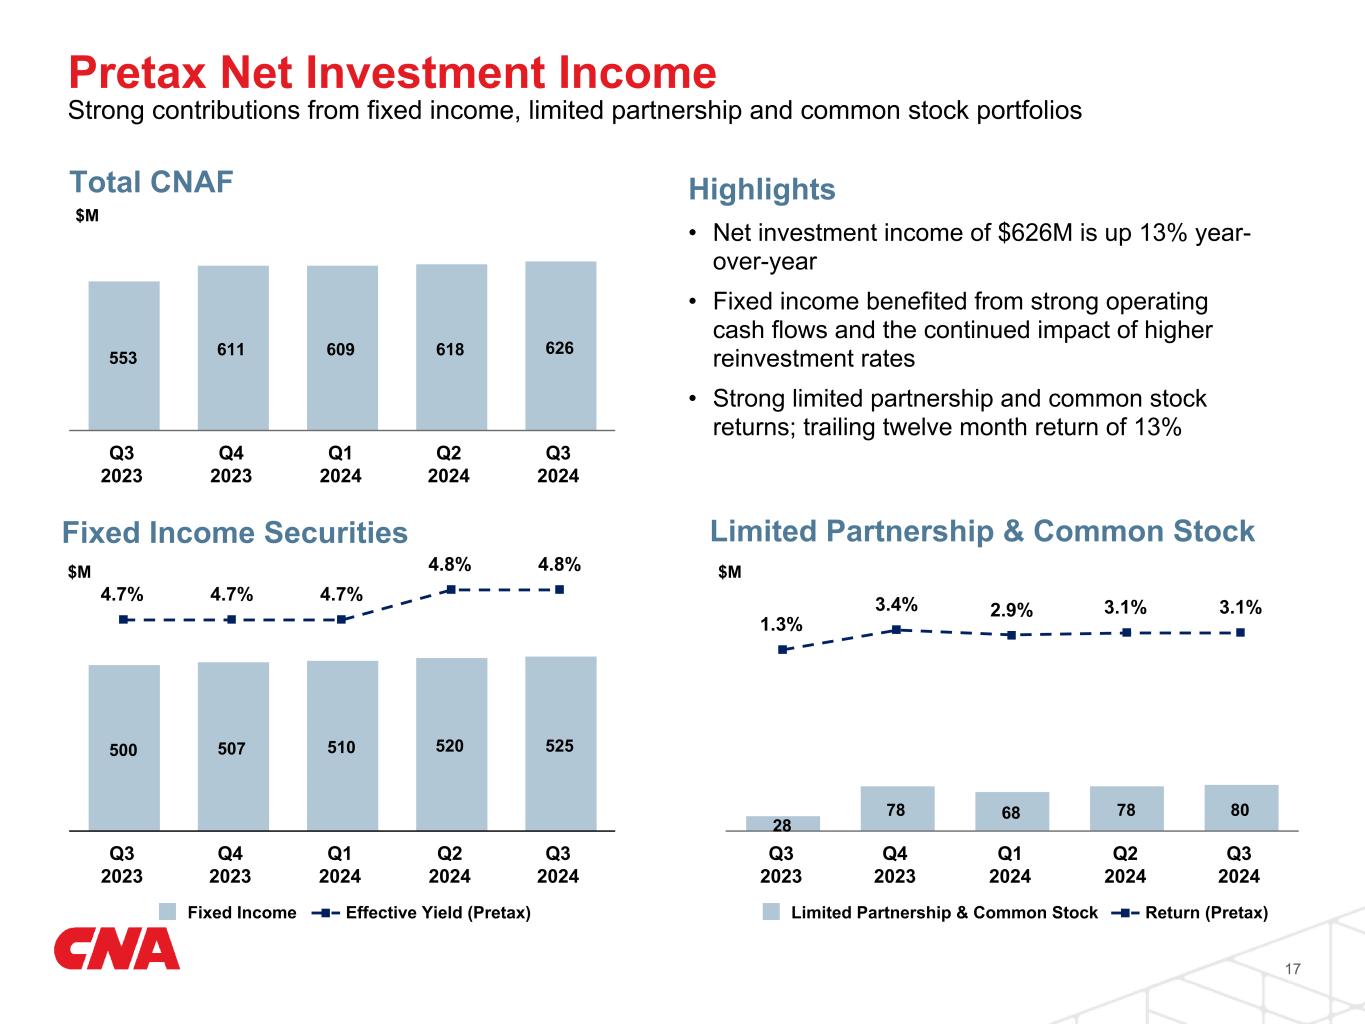
•Net investment income up 13% to $626 million pretax, includes a $52 million increase from limited partnerships and common stock to $80 million and a $21 million increase from fixed income securities and other investments to $546 million.
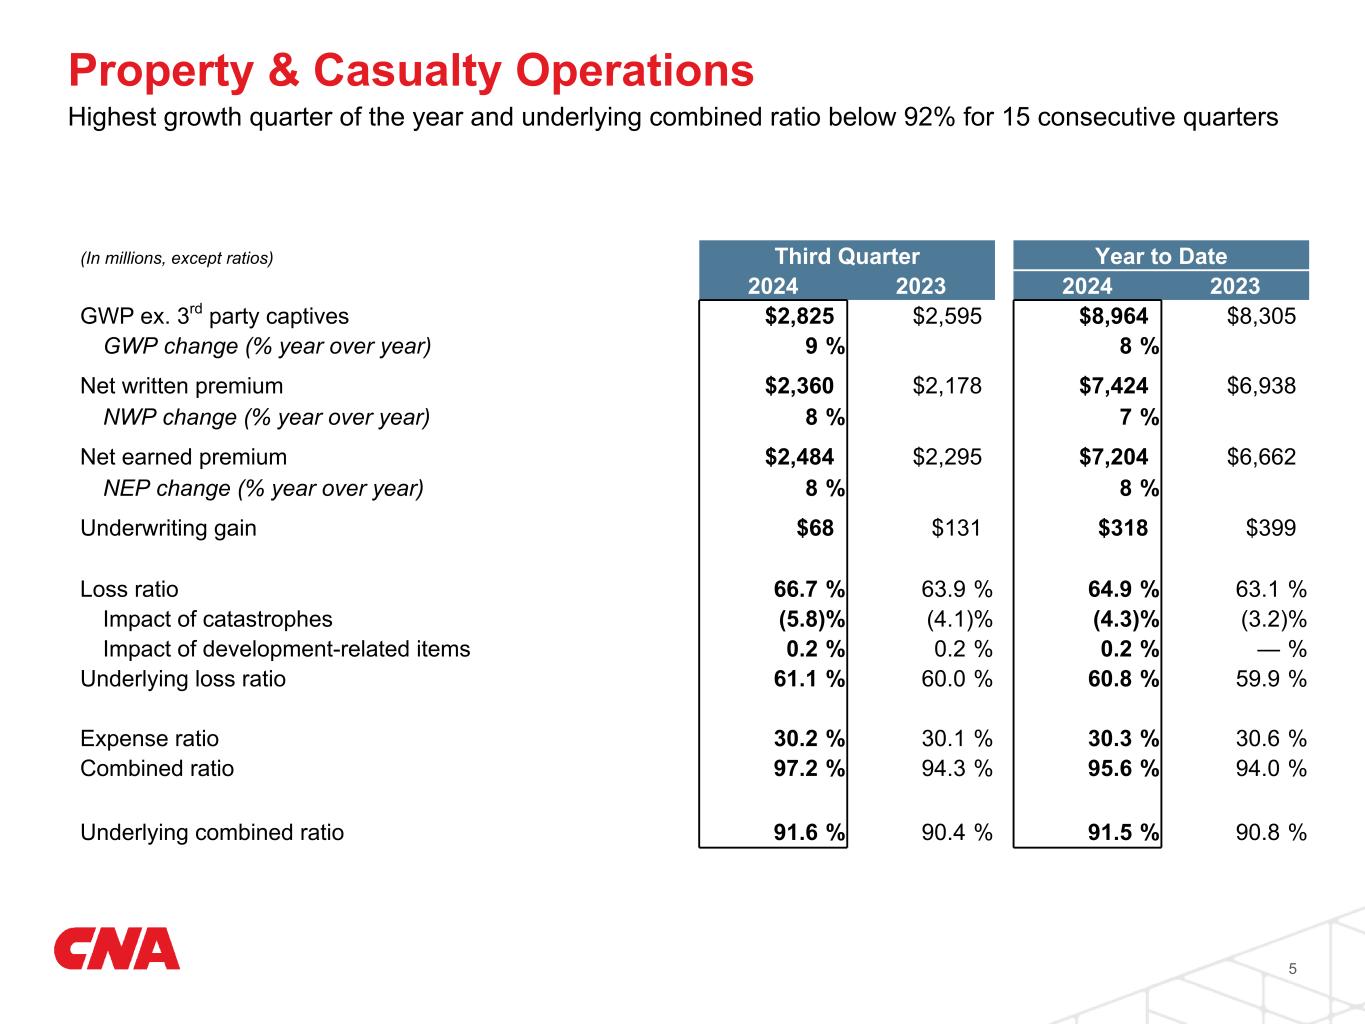
•P&C combined ratio of 97.2%, compared with 94.3% in the prior year quarter, including 5.8 points of catastrophe loss impact compared with 4.1 points in the prior year quarter. P&C underlying combined ratio was 91.6% compared with 90.4% in the prior year quarter. P&C underlying loss ratio was 61.1% and the expense ratio was 30.2%.
•Preannounced catastrophe losses of $143 million pretax, includes $55 million for Hurricane Helene, versus $94 million in the prior year quarter.
•P&C segments, excluding third party captives, generated gross written premium growth of 9% and net written premium growth of 8% for the third quarter of 2024.
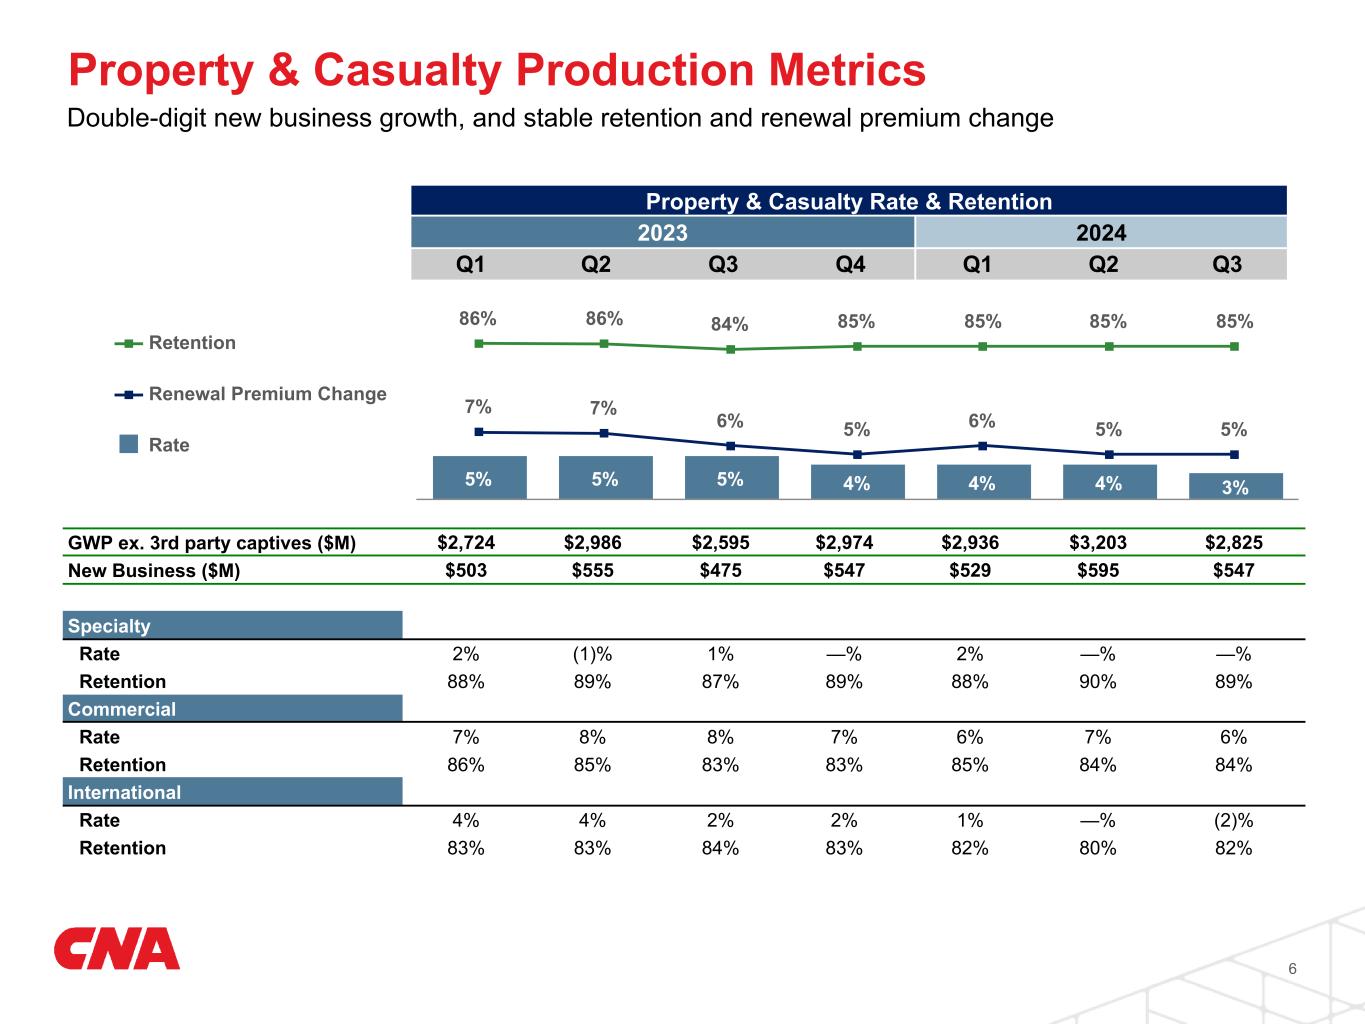
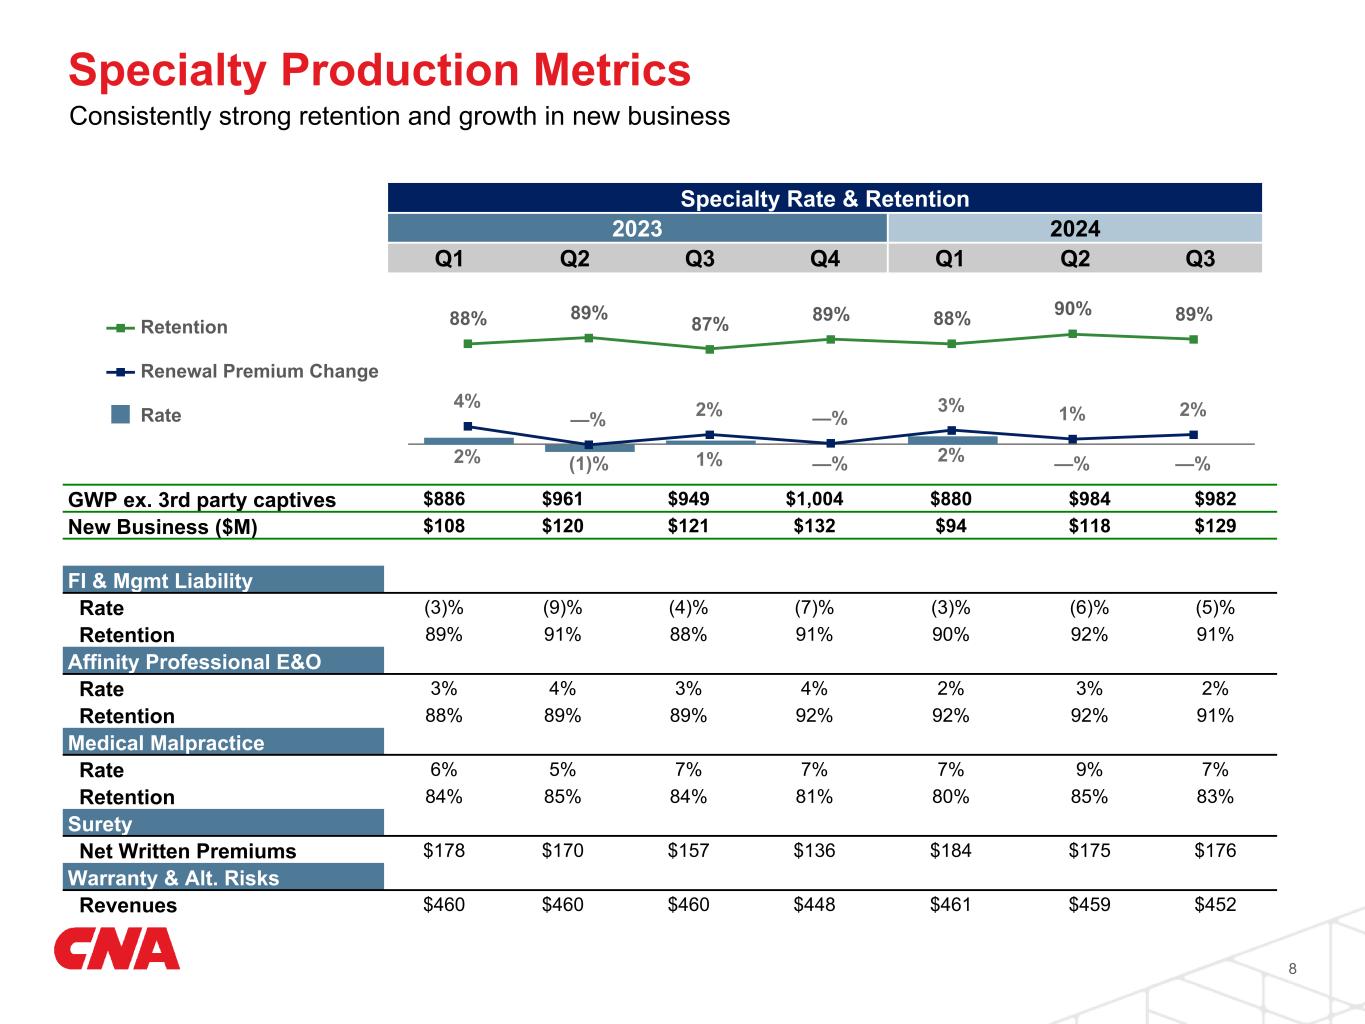
•P&C renewal premium change of +5%, consistent with the prior quarter, with written rate of +3%. Commercial renewal premium change of +8% and Specialty renewal premium change of +2%, each up 1 point from the prior quarter. International renewal premium change of +1%, down 1 point from the prior quarter.
•Book value per share of $39.72; book value per share excluding AOCI of $46.50, a 7% increase from year-end 2023 adjusting for $3.32 of dividends per share paid.
•Board of Directors declares regular quarterly cash dividend of $0.44 per share.
1


CHICAGO, November 4, 2024 --- CNA Financial Corporation (NYSE: CNA) today announced third quarter 2024 net income of $283 million, or $1.04 per share, versus $258 million, or $0.95 per share, in the prior year quarter. Net investment losses for the quarter were $7 million compared to $31 million in the prior year quarter. Core income for the quarter was $293 million, or $1.08 per share, versus $289 million, or $1.06 per share, in the prior year quarter.
Our Property & Casualty segments produced core income of $346 million for the third quarter of 2024, a decrease of $5 million compared to the prior year quarter driven by the largely offsetting impacts of higher catastrophe losses and higher investment income. P&C segments, excluding third party captives, generated gross written premium growth of 9% and net written premium growth of 8%, driven by new business growth of 15%, retention of 85% and renewal premium change of +5%.
Our Life & Group segment produced a core loss of $9 million for the third quarter of 2024, versus core loss of $29 million in the prior year quarter. Our Corporate & Other segment produced a core loss of $44 million for the third quarter of 2024, versus $33 million in the prior year quarter.
CNA Financial declared a quarterly dividend of $0.44 per share payable December 5, 2024 to stockholders of record on November 18, 2024.
Results for the Three Months Ended September 30 Results for the Nine Months Ended September 30
($ millions, except per share data) 2024 2023 2024 2023
Net income $ 283  $ 258  $ 938  $ 838 
Core income (a)
293  289  974  922 
Net income per diluted share $ 1.04  $ 0.95  $ 3.44  $ 3.08 
Core income per diluted share 1.08  1.06  3.57  3.39 
September 30, 2024 December 31, 2023
Book value per share $ 39.72 $ 36.52
Book value per share excluding AOCI 46.50 46.39
(a)Management utilizes the core income (loss) financial measure to monitor the Company's operations. Please refer herein to the Reconciliation of GAAP Measures to Non-GAAP Measures section of this press release for further discussion of this non-GAAP measure.
"We continue to produce excellent results with core income increasing to $293 million and our core income after nine months is a record high of $974 million. Net investment income was up 13% and the P&C all-in combined ratio was 97.2%, inclusive of pretax catastrophe losses of $143 million or 5.8 points which is consistent with our third quarter average over the last five years.
The underlying combined ratio was 91.6%, the fifteenth consecutive quarter below 92%, and included a record low underlying combined ratio of 90.7% in Commercial.
Gross written premium ex. captives was up 9%, and net written premium was up 8%, each up two points from last quarter and representing the strongest quarterly growth of the year. Renewal premium change increased by a point in the U.S. to 6% and increased by two points for Commercial excluding workers' compensation to 10%. Rate change remained stable in the U.S. at 4%.
New business grew 15%, also the highest of the year with strong contributions from Commercial and International. The overall P&C retention remained strong at 85% for the quarter.
We are very pleased with our results for the quarter with the continuation of strong renewal pricing in the lines most impacted by social inflation, which continues to exceed our loss cost trends. We remain optimistic about our abilities to capitalize on the favorable market conditions we expect to persist in many classes of business," said Dino E. Robusto, Chairman & Chief Executive Officer of CNA Financial Corporation.
2


Property & Casualty Operations
Results for the Three Months Ended September 30 Results for the Nine Months Ended September 30
($ millions) 2024 2023 2024 2023
Gross written premiums ex. 3rd party captives
$ 2,825  $ 2,595  $ 8,964  $ 8,305 
GWP ex. 3rd party captives change (% year over year)
% %
Net written premiums $ 2,360  $ 2,178  $ 7,424  $ 6,938 
NWP change (% year over year) % %
Net earned premiums $ 2,484  $ 2,295  $ 7,204  $ 6,662 
NEP change (% year over year) % %
Underwriting gain $ 68  $ 131  $ 318  $ 399 
Net investment income $ 372  $ 318  $ 1,090  $ 951 
Core income $ 346  $ 351  $ 1,098  $ 1,071 
Loss ratio 66.7  % 63.9  % 64.9  % 63.1  %
Effect of catastrophe impacts (5.8) (4.1) (4.3) (3.2)
Effect of development-related items 0.2  0.2  0.2  — 
Underlying loss ratio 61.1  % 60.0  % 60.8  % 59.9  %
Expense ratio 30.2  % 30.1  % 30.3  % 30.6  %
Combined ratio 97.2  % 94.3  % 95.6  % 94.0  %
Underlying combined ratio 91.6  % 90.4  % 91.5  % 90.8  %
•The underlying combined ratio increased 1.2 points as compared with the prior year quarter. The underlying loss ratio increased 1.1 points as compared with the prior year quarter due to increases in our Commercial and Specialty segments. The expense ratio was generally consistent with the prior year quarter, with the impact of a favorable International reinsurance acquisition related catch-up adjustment in the prior year quarter largely offset by higher net earned premiums in the current quarter.
•The combined ratio increased 2.9 points as compared with the prior year quarter which reflects an underwriting gain of $68 million compared with $131 million in the prior year quarter. Preannounced catastrophe losses were $143 million, or 5.8 points of the loss ratio in the quarter compared with $94 million, or 4.1 points of the loss ratio, for the prior year quarter. Catastrophe losses for the third quarter of 2024 include $55 million for Hurricane Helene. Favorable net prior period development improved the loss ratio by 0.2 points in the current and prior year quarter.
•P&C segments, excluding third party captives, generated gross written premium growth of 9% and net written premium growth of 8%.
3


Business Operating Highlights
Specialty
Results for the Three Months Ended September 30 Results for the Nine Months Ended September 30
($ millions) 2024 2023 2024 2023
Gross written premiums ex. 3rd party captives
$ 982  $ 949  $ 2,846  $ 2,796 
GWP ex. 3rd party captives change (% year over year)
% %
Net written premiums $ 862  $ 825  $ 2,511  $ 2,438 
NWP change (% year over year) % %
Net earned premiums $ 848  $ 829  $ 2,493  $ 2,438 
NEP change (% year over year) % %
Underwriting gain $ 59  $ 83  $ 195  $ 237 
Loss ratio 60.1  % 58.0  % 59.3  % 58.2  %
Effect of catastrophe impacts —  —  —  — 
Effect of development-related items —  0.6  0.3  0.3 
Underlying loss ratio 60.1  % 58.6  % 59.6  % 58.5  %
Expense ratio 32.7  % 31.8  % 32.5  % 31.9  %
Combined ratio 93.0  % 90.1  % 92.1  % 90.3  %
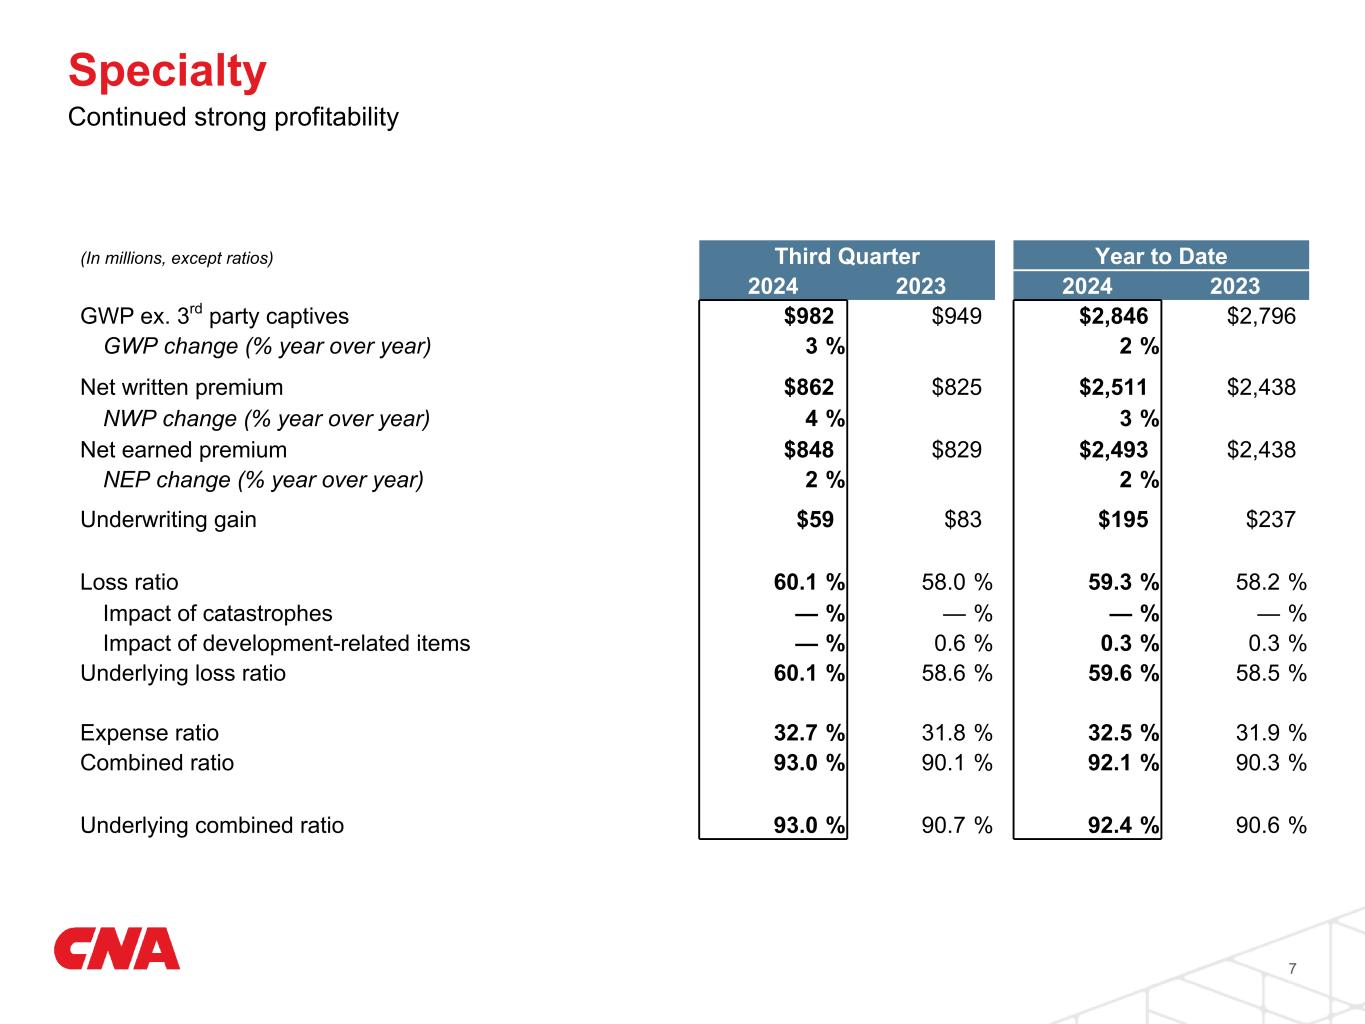
Underlying combined ratio 93.0  % 90.7  % 92.4  % 90.6  %
•The underlying combined ratio increased 2.3 points as compared with the prior year quarter. The underlying loss ratio increased 1.5 points primarily driven by continued pricing pressure in management liability lines over the last several quarters. The expense ratio increased 0.9 points primarily driven by higher employee related costs.
•The combined ratio increased 2.9 points as compared with the prior year quarter. There was no net prior period development in the current quarter compared with 0.6 points of favorable development improving the loss ratio in the prior year quarter.
•Gross written premiums, excluding third party captives, grew 3% and net written premiums grew 4% for the third quarter of 2024.
4


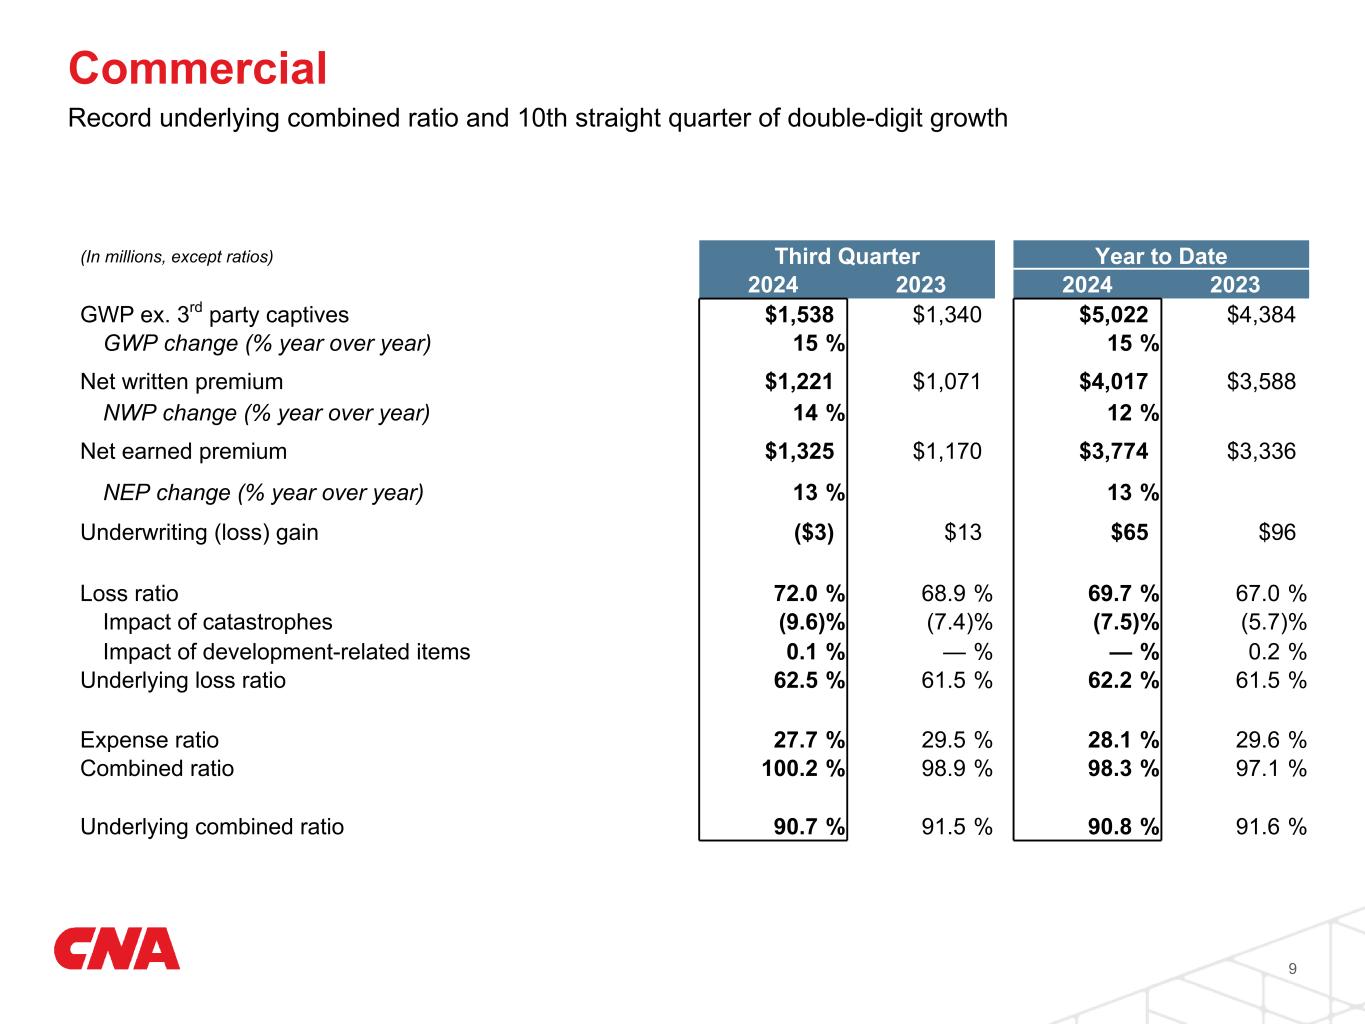
Commercial
Results for the Three Months Ended September 30 Results for the Nine Months Ended September 30
($ millions) 2024 2023 2024 2023
Gross written premiums ex. 3rd party captives
$ 1,538  $ 1,340  $ 5,022  $ 4,384 
GWP ex. 3rd party captives change (% year over year)
15  % % 15  %
Net written premiums $ 1,221  $ 1,071  $ 4,017  $ 3,588 
NWP change (% year over year) 14  % % 12  %
Net earned premiums $ 1,325  $ 1,170  $ 3,774  $ 3,336 
NEP change (% year over year) 13  % % 13  %
Underwriting (loss) gain $ (3) $ 13  $ 65  $ 96 
Loss ratio 72.0  % 68.9  % 69.7  % 67.0  %
Effect of catastrophe impacts (9.6) (7.4) (7.5) (5.7)
Effect of development-related items 0.1  —  —  0.2 
Underlying loss ratio 62.5  % 61.5  % 62.2  % 61.5  %
Expense ratio 27.7  % 29.5  % 28.1  % 29.6  %
Combined ratio 100.2  % 98.9  % 98.3  % 97.1  %
Underlying combined ratio 90.7  % 91.5  % 90.8  % 91.6  %
•The underlying combined ratio improved 0.8 points as compared with the prior year quarter, and is the lowest on record. The expense ratio improved 1.8 points, to a record low, primarily driven by net earned premium growth of 13%. The underlying loss ratio increased 1.0 point as compared with the prior year quarter driven by the continuation of elevated loss cost trends in commercial auto and mix of business.
•The combined ratio increased 1.3 points as compared with the prior year quarter. Catastrophe losses were $127 million, or 9.6 points of the loss ratio in the quarter compared with $87 million, or 7.4 points of the loss ratio, for the prior year quarter. Favorable net prior period development improved the loss ratio by 0.1 point in the current quarter compared with no net prior period development in the prior year quarter.
•Gross written premiums, excluding third party captives, grew 15% and net written premiums grew 14% for the third quarter of 2024.
5


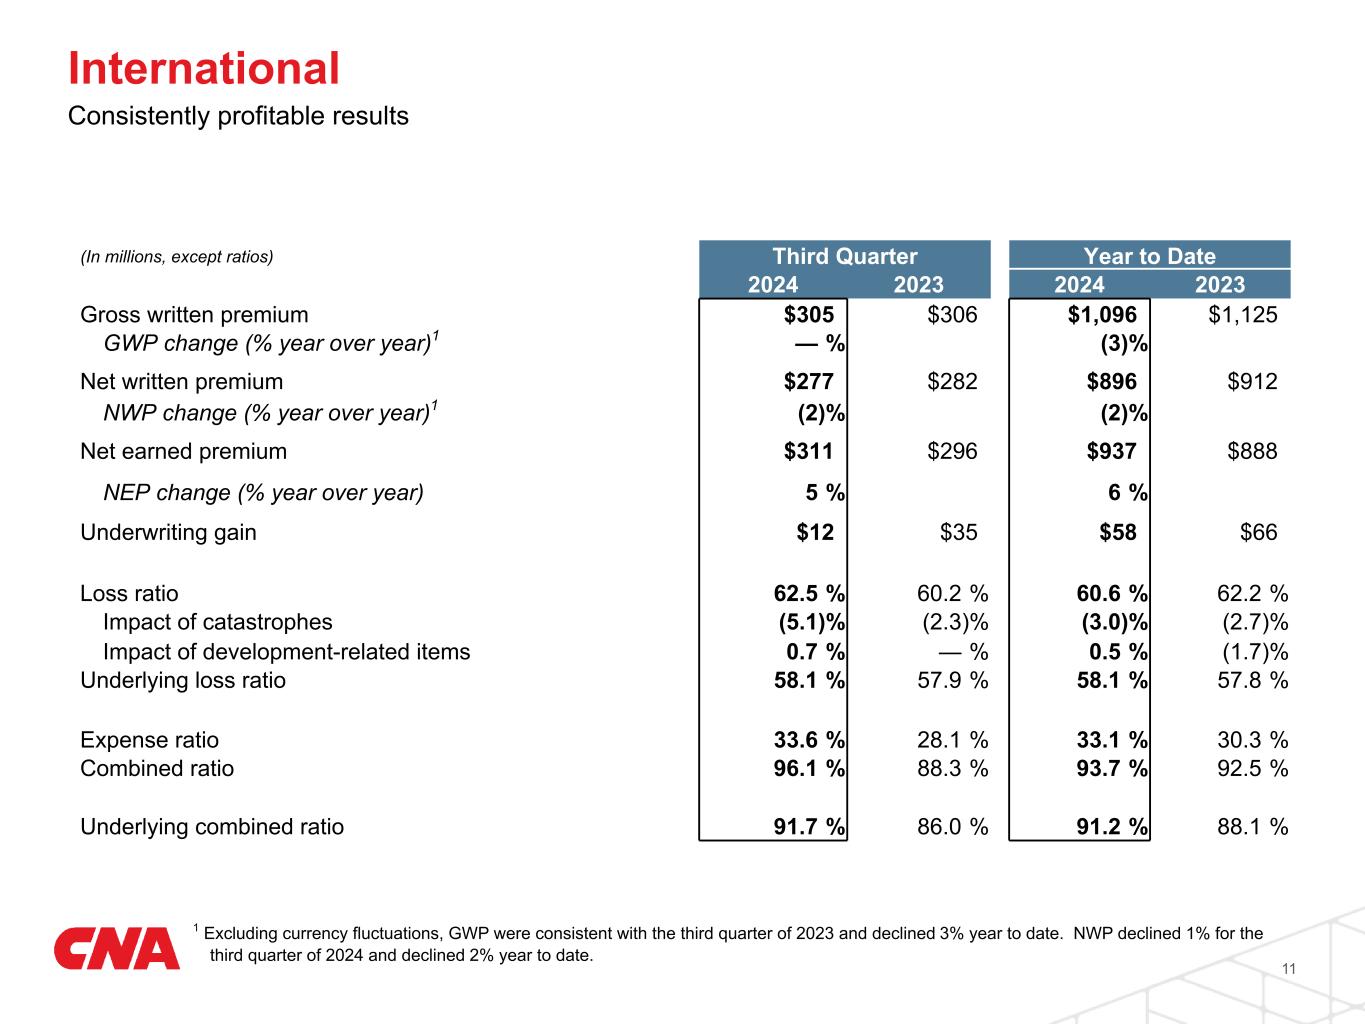
International
Results for the Three Months Ended September 30 Results for the Nine Months Ended September 30
($ millions) 2024 2023 2024 2023
Gross written premiums $ 305  $ 306  $ 1,096  $ 1,125 
GWP change (% year over year) —  % (3) %
Net written premiums $ 277  $ 282  $ 896  $ 912 
NWP change (% year over year) (2) % (2) %
Net earned premiums $ 311  $ 296  $ 937  $ 888 
NEP change (% year over year) % %
Underwriting gain $ 12  $ 35  $ 58  $ 66 
Loss ratio 62.5  % 60.2  % 60.6  % 62.2  %
Effect of catastrophe impacts (5.1) (2.3) (3.0) (2.7)
Effect of development-related items 0.7  —  0.5  (1.7)
Underlying loss ratio 58.1  % 57.9  % 58.1  % 57.8  %
Expense ratio 33.6  % 28.1  % 33.1  % 30.3  %
Combined ratio 96.1  % 88.3  % 93.7  % 92.5  %
Underlying combined ratio 91.7  % 86.0  % 91.2  % 88.1  %
•The underlying combined ratio increased 5.7 points as compared with the prior year quarter. The expense ratio increased 5.5 points primarily driven by a favorable reinsurance acquisition related catch-up adjustment in the prior year quarter and higher employee related costs in the current quarter. The underlying loss ratio increased 0.2 points as compared with the prior year quarter.
•The combined ratio increased 7.8 points as compared with the prior year quarter. Catastrophe losses were $16 million, or 5.1 points of the loss ratio in the quarter compared with $7 million, or 2.3 points of the loss ratio, for the prior year quarter. Favorable net prior period development improved the loss ratio by 0.7 points in the current quarter compared with no net prior period development in the prior year quarter.
•Excluding currency fluctuations, gross written premiums were consistent with the third quarter of 2023 and net written premiums declined 1% for the third quarter of 2024.
6


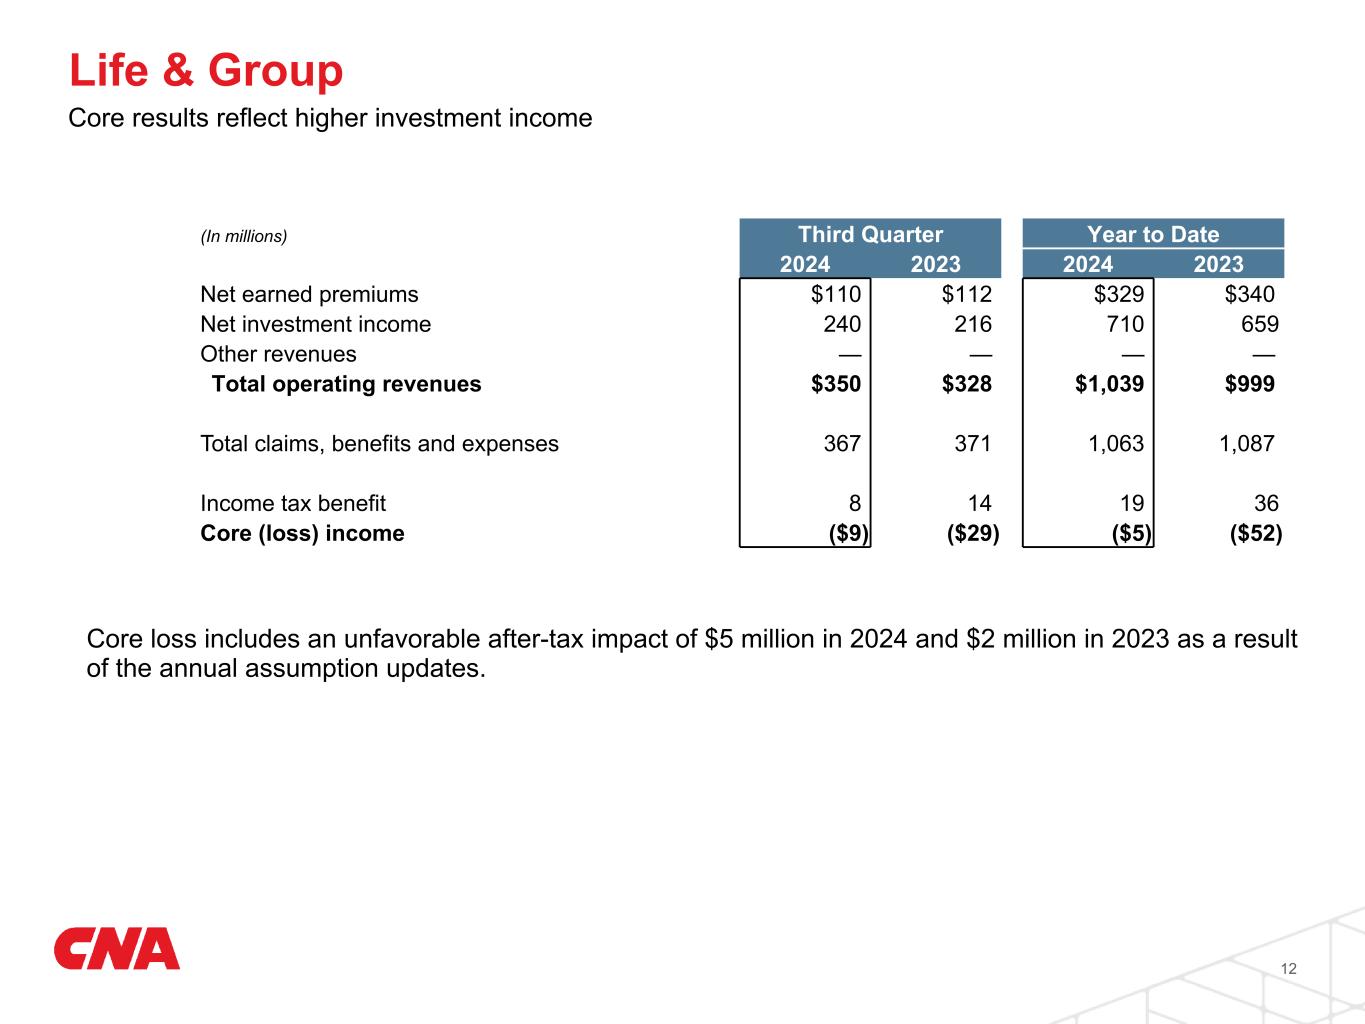
Life & Group
Results for the Three Months Ended September 30 Results for the Nine Months Ended September 30
($ millions) 2024 2023 2024 2023
Net earned premiums $ 110  $ 112  $ 329  $ 340 
Claims, benefits and expenses 367  371  1,063  1,087 
Net investment income 240  216  710  659 
Core loss (9) (29) (5) (52)
Core loss improved $20 million for the third quarter of 2024 as compared with the prior year quarter primarily due to higher net investment income. Both periods are inclusive of assumption updates as a result of the annual reserve reviews.
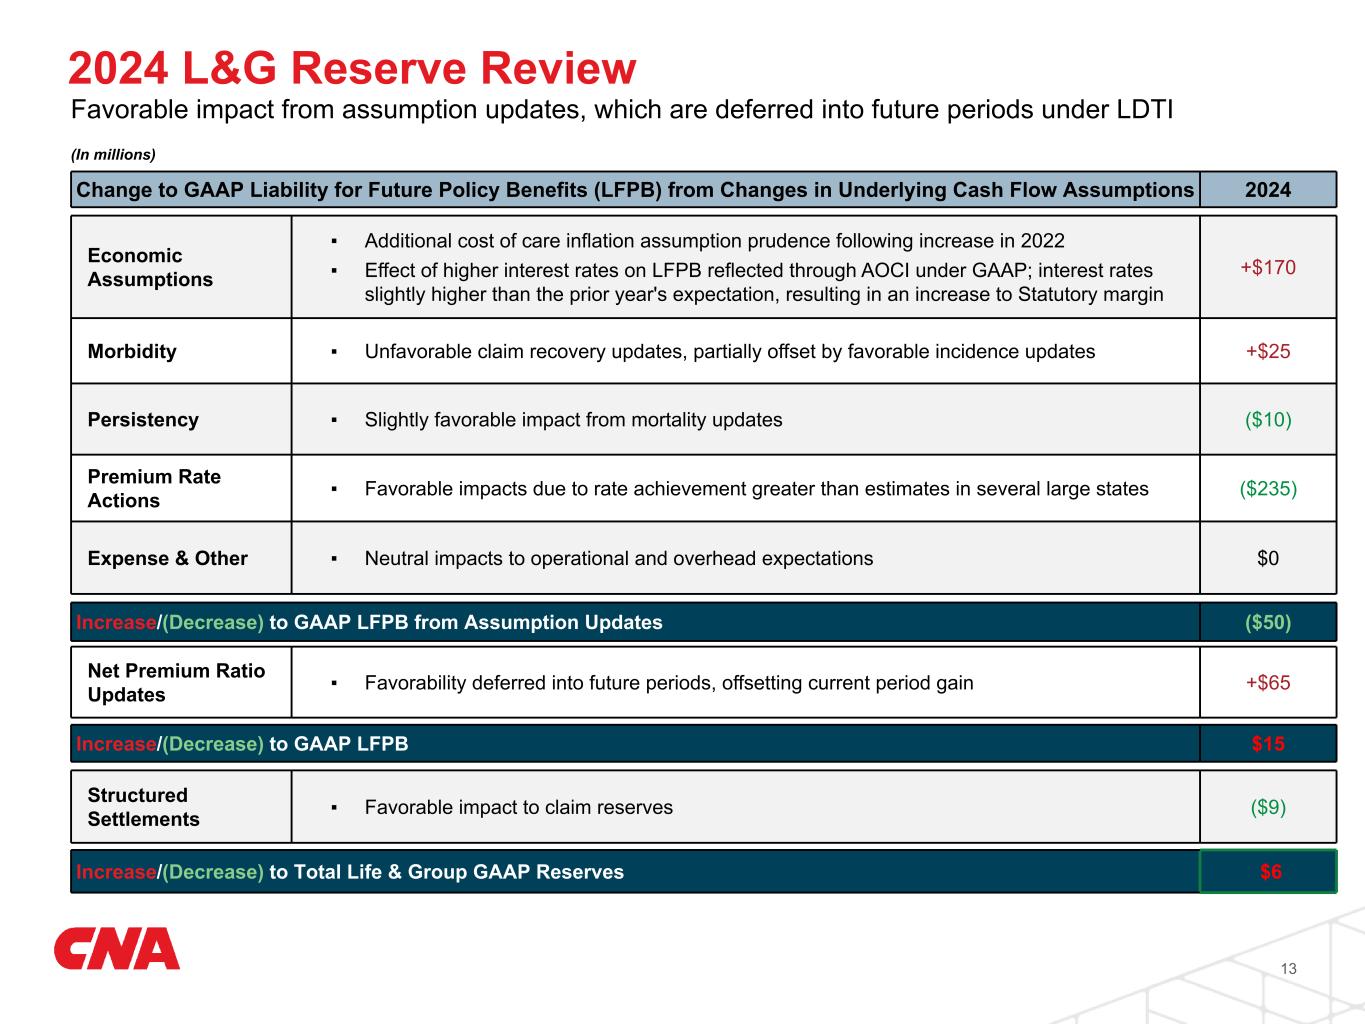
The assumption updates in the third quarter of 2024 unfavorably impacted core loss by $5 million after-tax, which is comprised of a $15 million increase in long-term care reserves, partially offset by a $9 million reduction in structured settlement reserves.
The assumption updates in the third quarter of 2023 unfavorably impacted core loss by $2 million after-tax, which included an $8 million increase in long-term care reserves, partially offset by a $6 million reduction in structured settlement reserves.
Corporate & Other
Results for the Three Months Ended September 30 Results for the Nine Months Ended September 30
($ millions) 2024 2023 2024 2023
Insurance claims and policyholders' benefits $ 16  $ 10  $ 35  $ 32 
Interest expense 32  35  101  93 
Net investment income 14  19  53  43 
Core loss (44) (33) (119) (97)
Core loss increased $11 million for the third quarter of 2024 as compared with the prior year quarter primarily driven by $3 million after-tax lower amortization of the deferred gain related to the A&EP Loss Portfolio Transfer and a $3 million after-tax charge related to office consolidation. The current quarter includes a $17 million after-tax charge related to unfavorable prior year development largely associated with legacy mass tort abuse claims as compared with a $16 million after-tax charge in the prior year quarter.
Net Investment Income
Results for the Three Months Ended September 30 Results for the Nine Months Ended September 30
2024 2023 2024 2023
Fixed income securities and other $ 546  $ 525  $ 1,627  $ 1,529 
Limited partnership and common stock investments 80  28  226  124 
Net investment income $ 626  $ 553  $ 1,853  $ 1,653 
Net investment income increased $73 million for the third quarter of 2024 as compared with the prior year quarter. The increase was driven by favorable limited partnership and common stock returns, as well as higher income from fixed income securities as a result of favorable reinvestment rates and a larger invested asset base.
Stockholders' Equity
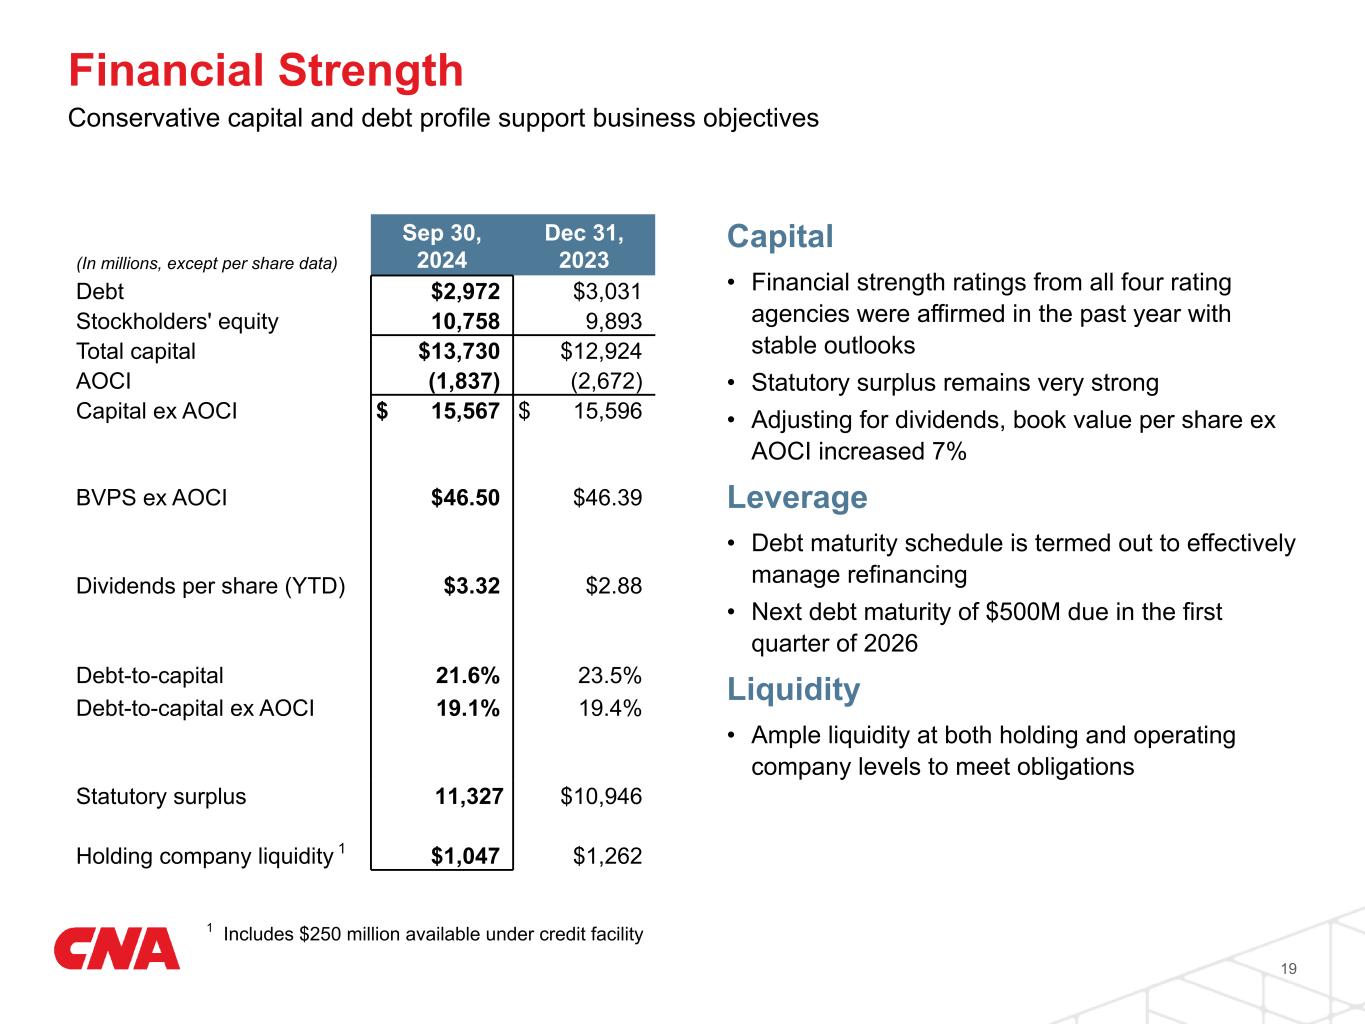
Stockholders’ equity of $10.8 billion improved 9% from year-end 2023, primarily due to an improvement in net unrealized investment losses and net income, partially offset by dividends paid to stockholders.
Book value per share ex AOCI of $46.50 increased 7% from year-end 2023 adjusting for $3.32 of dividends per share paid. As of September 30, 2024, statutory capital and surplus for the Combined Continental Casualty Companies was $11.3 billion.
7


About the Company
CNA is one of the largest U.S. commercial property and casualty insurance companies. Backed by more than 125 years of experience, CNA provides a broad range of standard and specialized insurance products and services for businesses and professionals in the U.S., Canada and Europe.  For more information, please visit CNA at www.cna.com.
Contacts
Media: Analysts:
Kelly Messina | Vice President, Marketing
Ralitza K. Todorova | Vice President, Investor Relations & Rating Agencies
872-817-0350 312-822-3834
Earnings Remarks & Materials
A transcript of earnings remarks will be available on CNA's website at www.cna.com via the Investor Relations section. Remarks will include commentary from the Company's Chairman & Chief Executive Officer, Dino Robusto, and Chief Financial Officer, Scott Lindquist. An earnings presentation and financial supplement information related to the results will also be posted and available on the CNA website.
Definition of Reported Segments
•Specialty provides management and professional liability and other coverages through property and casualty products and services using a network of brokers, independent agencies and managing general underwriters.
•Commercial works with a network of brokers and independent agents to market a broad range of property and casualty insurance products to all types of insureds targeting small business, construction, middle markets and other commercial customers.
•International underwrites property and casualty coverages on a global basis through a branch operation in Canada, a European business consisting of insurance companies based in the U.K and Luxembourg and Hardy, our Lloyd's Syndicate.
•Life & Group includes the individual and group run-off long-term care businesses as well as structured settlement obligations not funded by annuities related to certain property and casualty claimants.
•Corporate & Other primarily includes certain corporate expenses, including interest on corporate debt, and the results of certain property and casualty business in run-off, including CNA Re, asbestos and environmental pollution (A&EP), a legacy portfolio of excess workers' compensation (EWC) policies and legacy mass tort reserves.
Financial Measures
Management utilizes the following metrics in their evaluation of the Property & Casualty Operations.
These ratios are calculated using financial results prepared in accordance with accounting principles generally accepted in the United States of America (GAAP).
•Loss ratio is the percentage of net incurred claim and claim adjustment expenses to net earned premiums.
•Underlying loss ratio represents the loss ratio excluding catastrophe losses and development-related items.
•Expense ratio is the percentage of insurance underwriting and acquisition expenses, including the amortization of deferred acquisition costs, to net earned premiums.
•Dividend ratio is the ratio of policyholders' dividends incurred to net earned premiums.
•Combined ratio is the sum of the loss, expense and dividend ratios.
•Underlying combined ratio is the sum of the underlying loss, expense and dividend ratios.
The underlying loss ratio and the underlying combined ratio are deemed to be non-GAAP financial measures, and management believes some investors may find these ratios useful to evaluate our underwriting performance since they remove the impact of catastrophe losses which are unpredictable as to timing and amount, and development-related items as they are not indicative of our current year underwriting performance. The components to reconcile the combined ratio and loss ratio to the underlying combined ratio and underlying loss ratio for Property & Casualty, Specialty, Commercial and International segments are set forth on pages 3, 4, 5 and 6, respectively.
Renewal premium change represents the estimated change in average premium on policies that renew, including rate and exposure changes.
Rate represents the average change in price on policies that renew excluding exposure change.
Exposure represents the measure of risk used in the pricing of the insurance product. The change in exposure represents the change in premium dollars on policies that renew as a result of the change in risk of the policy.
Retention represents the percentage of premium dollars renewed, excluding rate and exposure changes, in comparison to the expiring premium dollars from policies available to renew.
8


New business represents premiums from policies written with new customers and additional policies written with existing customers.
Gross written premiums ex. 3rd party captives represents gross written premiums excluding business which is ceded to third party captives, including business related to large warranty programs.
Development-related items represents net prior year loss reserve and premium development, and includes the effects of interest accretion and change in allowance for uncollectible reinsurance and deductible amounts.
Statutory capital and surplus represents the excess of an insurance company's admitted assets over its liabilities, including loss reserves, as determined in accordance with statutory accounting practices. Statutory capital and surplus as of the current period is preliminary.
The Company's investment portfolio is monitored by management through analysis of various factors including unrealized gains and losses on securities, portfolio duration and exposure to market and credit risk.
Reconciliation of GAAP Measures to Non-GAAP Measures
Management utilizes financial measures not in accordance with GAAP to monitor the Company's insurance operations and investment portfolio. The Company believes the presentation of these measures provides investors with a better understanding of the significant factors that comprise the Company's operating performance. Reconciliations of these measures to the most comparable GAAP measures follow below.
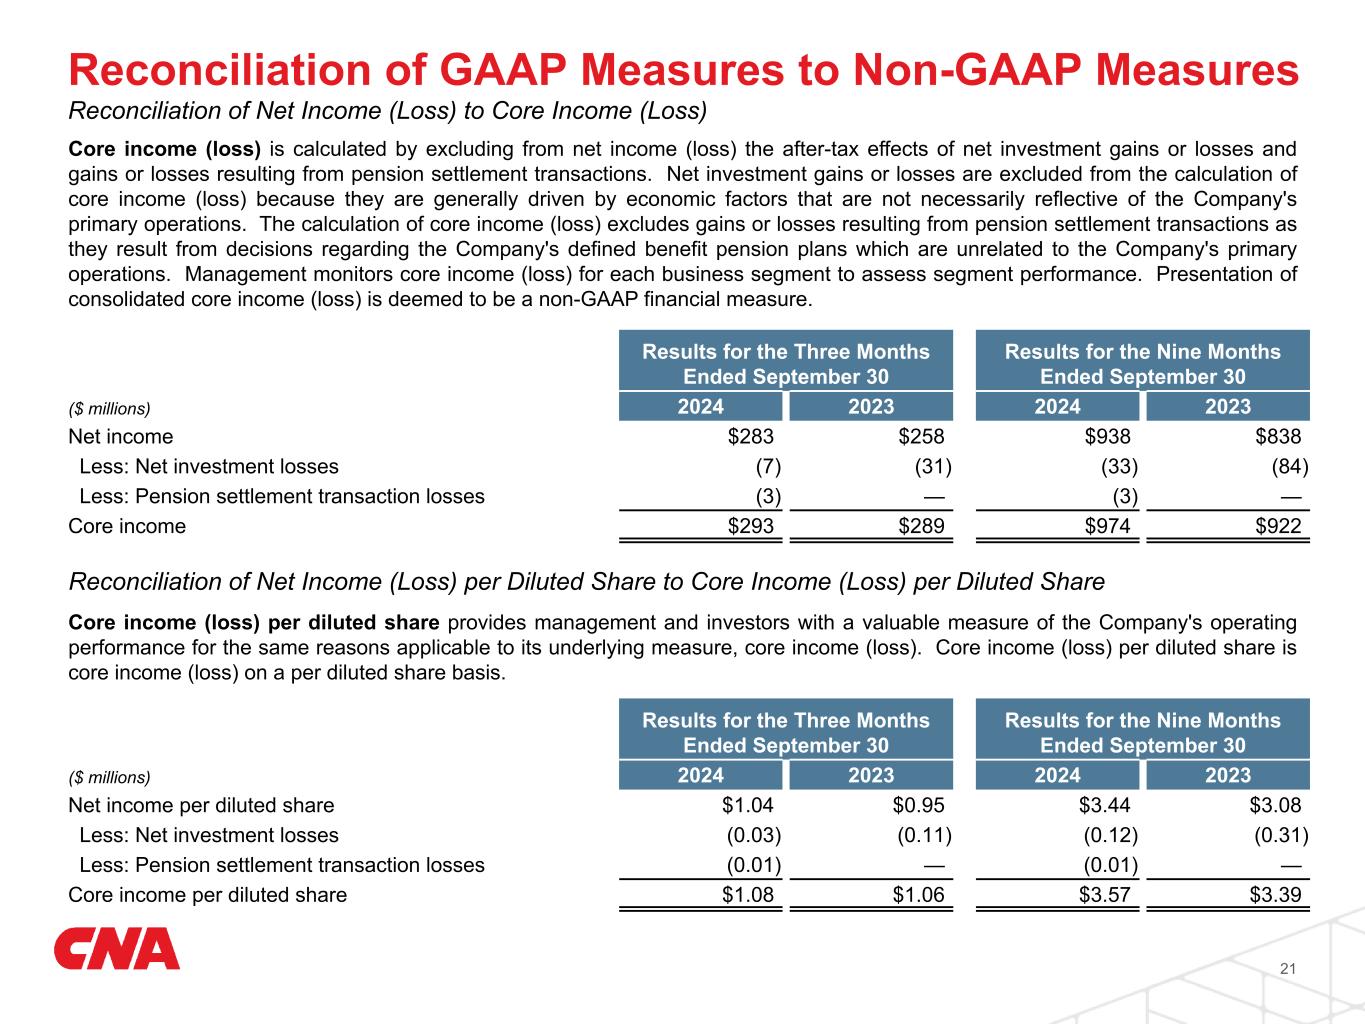
Reconciliation of Net Income (Loss) to Core Income (Loss)
Core income (loss) is calculated by excluding from net income (loss) the after-tax effects of net investment gains or losses and gains or losses resulting from pension settlement transactions. Net investment gains or losses are excluded from the calculation of core income (loss) because they are generally driven by economic factors that are not necessarily reflective of our primary operations. The calculation of core income (loss) excludes gains or losses resulting from pension settlement transactions as they result from decisions regarding our defined benefit pension plans which are unrelated to our primary operations. Management monitors core income (loss) for each business segment to assess segment performance. Presentation of consolidated core income (loss) is deemed to be a non-GAAP financial measure.
Results for the Three Months Ended September 30 Results for the Nine Months Ended September 30
($ millions) 2024 2023 2024 2023
Net income $ 283  $ 258  $ 938  $ 838 
Less: Net investment losses (7) (31) (33) (84)
Less: Pension settlement transaction losses (3) —  (3) — 
Core income $ 293  $ 289  $ 974  $ 922 
Reconciliation of Net Income (Loss) per Diluted Share to Core Income (Loss) per Diluted Share
Core income (loss) per diluted share provides management and investors with a valuable measure of the Company's operating performance for the same reasons applicable to its underlying measure, core income (loss). Core income (loss) per diluted share is core income (loss) on a per diluted share basis.
Results for the Three Months Ended September 30 Results for the Nine Months Ended September 30
2024 2023 2024 2023
Net income per diluted share $ 1.04  $ 0.95  $ 3.44  $ 3.08 
Less: Net investment losses (0.03) (0.11) (0.12) (0.31)
Less: Pension settlement transaction losses (0.01) —  (0.01) — 
Core income per diluted share $ 1.08  $ 1.06  $ 3.57  $ 3.39 


9


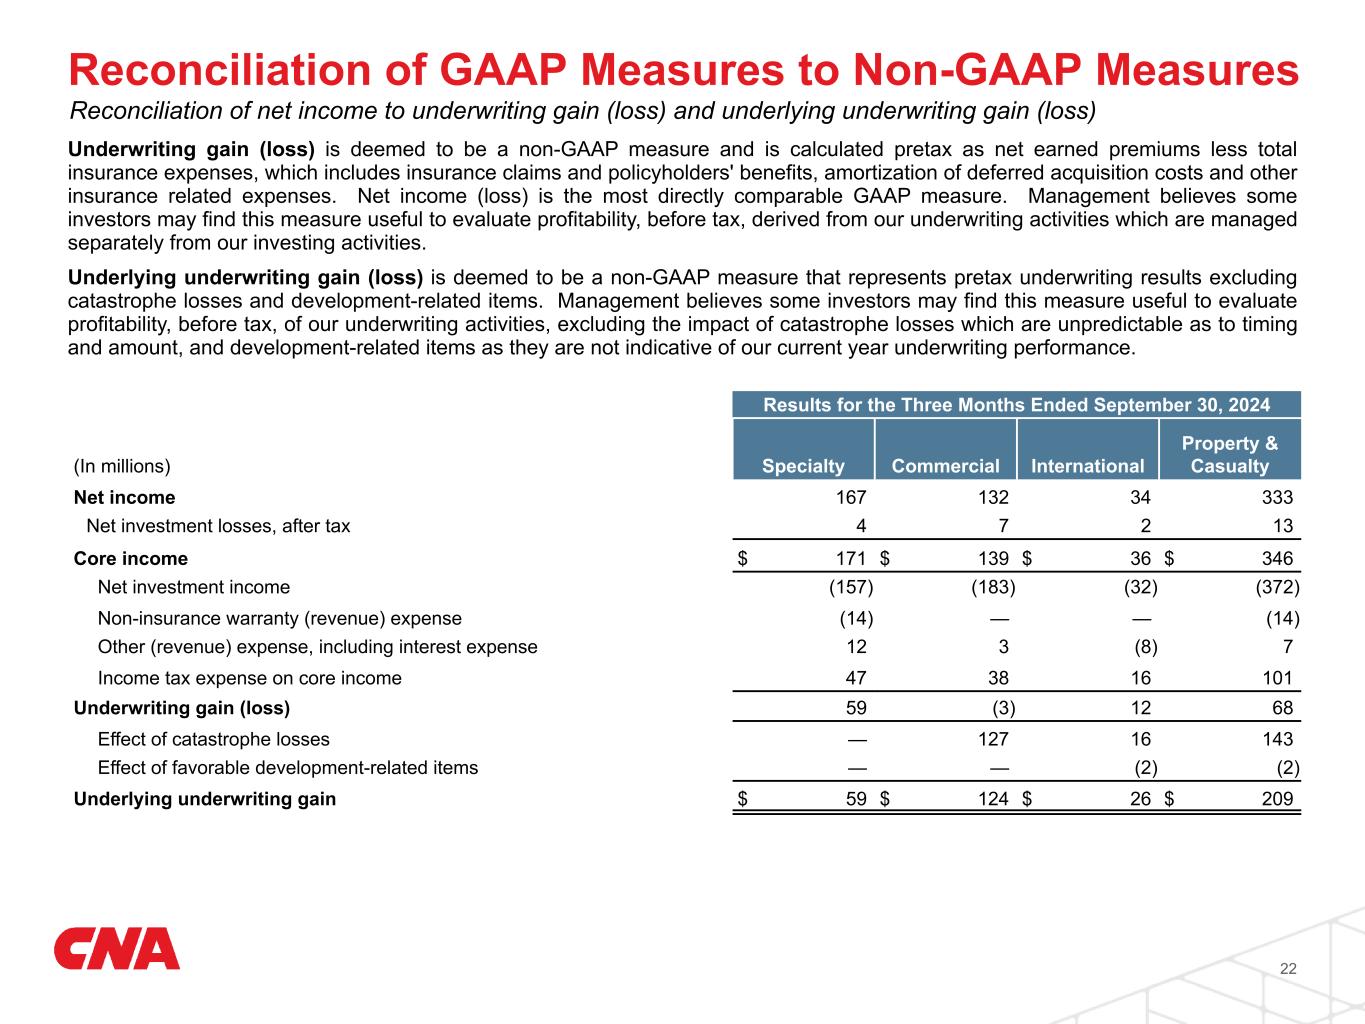
Reconciliation of Net Income (Loss) to Underwriting Gain (Loss) and Underlying Underwriting Gain (Loss)
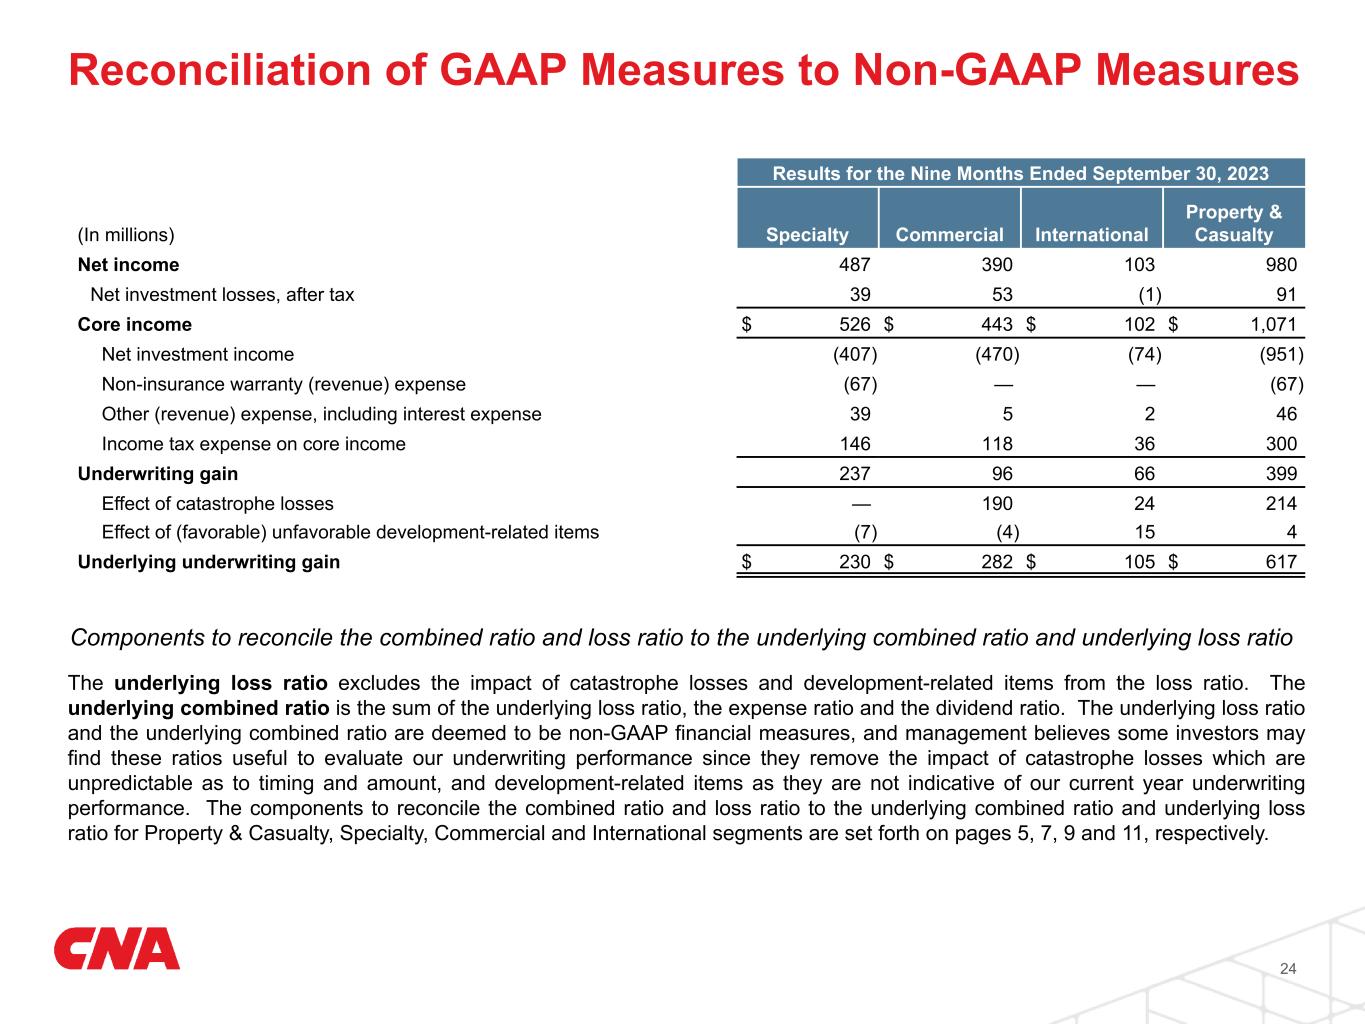
Underwriting gain (loss) is deemed to be a non-GAAP measure and is calculated pretax as net earned premiums less total insurance expenses, which includes insurance claims and policyholders' benefits, amortization of deferred acquisition costs and other insurance related expenses. Net income (loss) is the most directly comparable GAAP measure. Management believes some investors may find this measure useful to evaluate the profitability, before tax, derived from our underwriting activities which are managed separately from our investing activities.
Underlying underwriting gain (loss) is deemed to be a non-GAAP measure that represents pretax underwriting results excluding catastrophe losses and development-related items. Management believes some investors may find this measure useful to evaluate profitability, before tax, of our underwriting activities, excluding the impact of catastrophe losses which are unpredictable as to timing and amount, and development-related items as they are not indicative of our current year underwriting performance.
Results for the Three Months Ended
September 30, 2024
Specialty Commercial International Property & Casualty
(In millions)
Net income $ 167  $ 132  $ 34  $ 333 
Net investment losses, after tax 13 
Core income $ 171  $ 139  $ 36  $ 346 
Net investment income (157) (183) (32) (372)
Non-insurance warranty (revenue) expense (14) —  —  (14)
Other (revenue) expense, including interest expense 12  (8)
Income tax expense on core income 47  38  16  101 
Underwriting gain (loss) 59  (3) 12  68 
Effect of catastrophe losses —  127  16  143 
Effect of favorable development-related items —  —  (2) (2)
Underlying underwriting gain $ 59  $ 124  $ 26  $ 209 
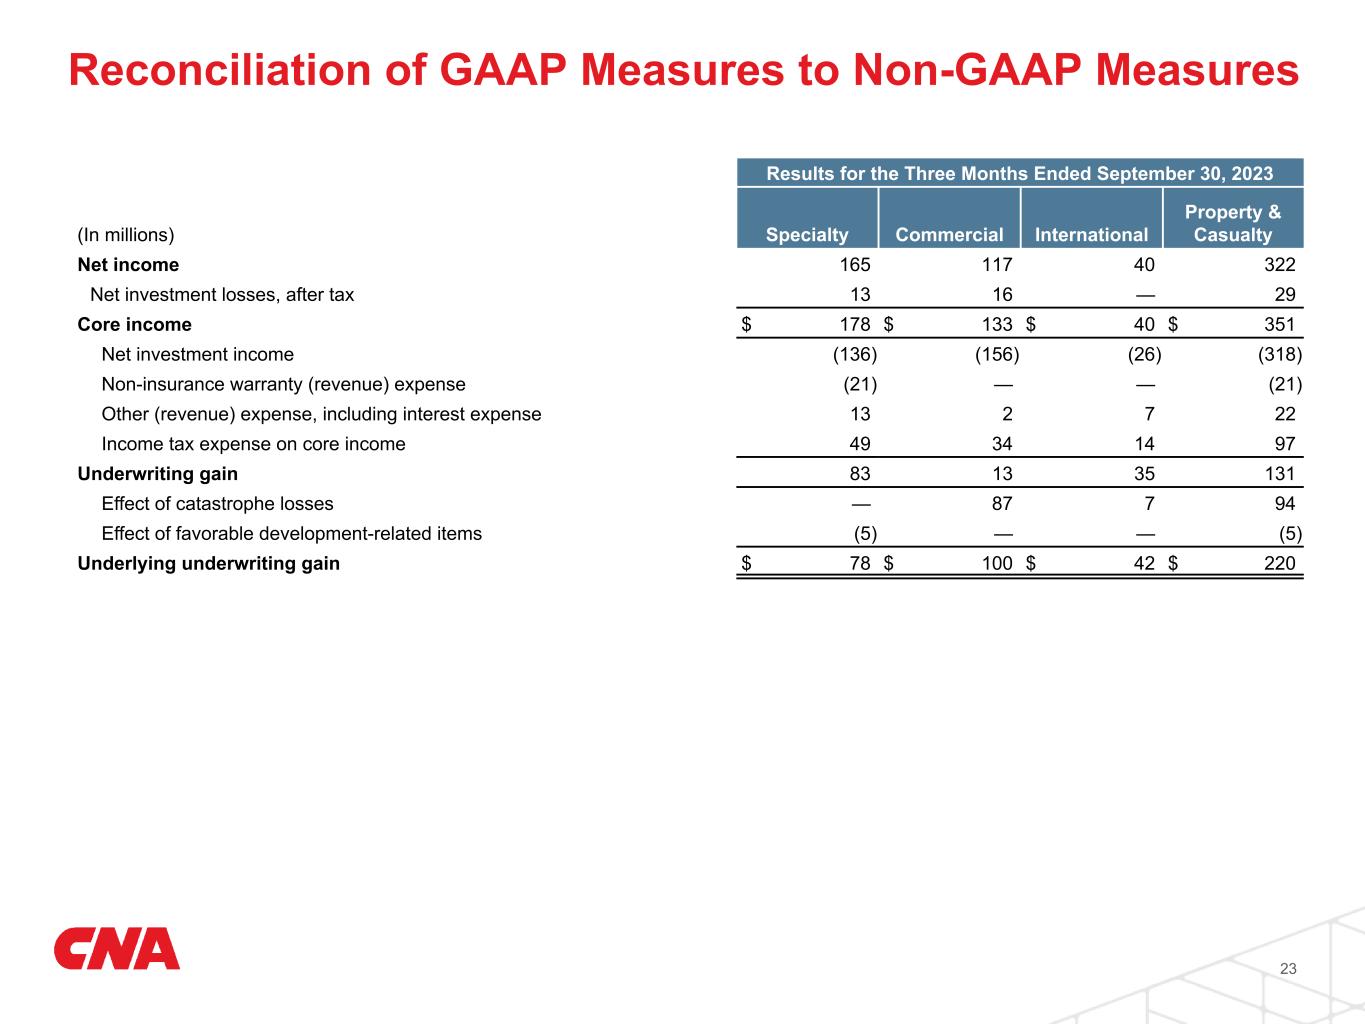
Results for the Three Months Ended September 30, 2023
Specialty Commercial International Property & Casualty
(In millions)
Net income $ 165  $ 117  $ 40  $ 322 
Net investment losses, after tax 13  16  —  29 
Core income $ 178  $ 133  $ 40  $ 351 
Net investment income (136) (156) (26) (318)
Non-insurance warranty (revenue) expense (21) —  —  (21)
Other (revenue) expense, including interest expense 13  22 
Income tax expense on core income 49  34  14  97 
Underwriting gain 83  13  35  131 
Effect of catastrophe losses —  87  94 
Effect of favorable development-related items (5) —  —  (5)
Underlying underwriting gain $ 78  $ 100  $ 42  $ 220 


10


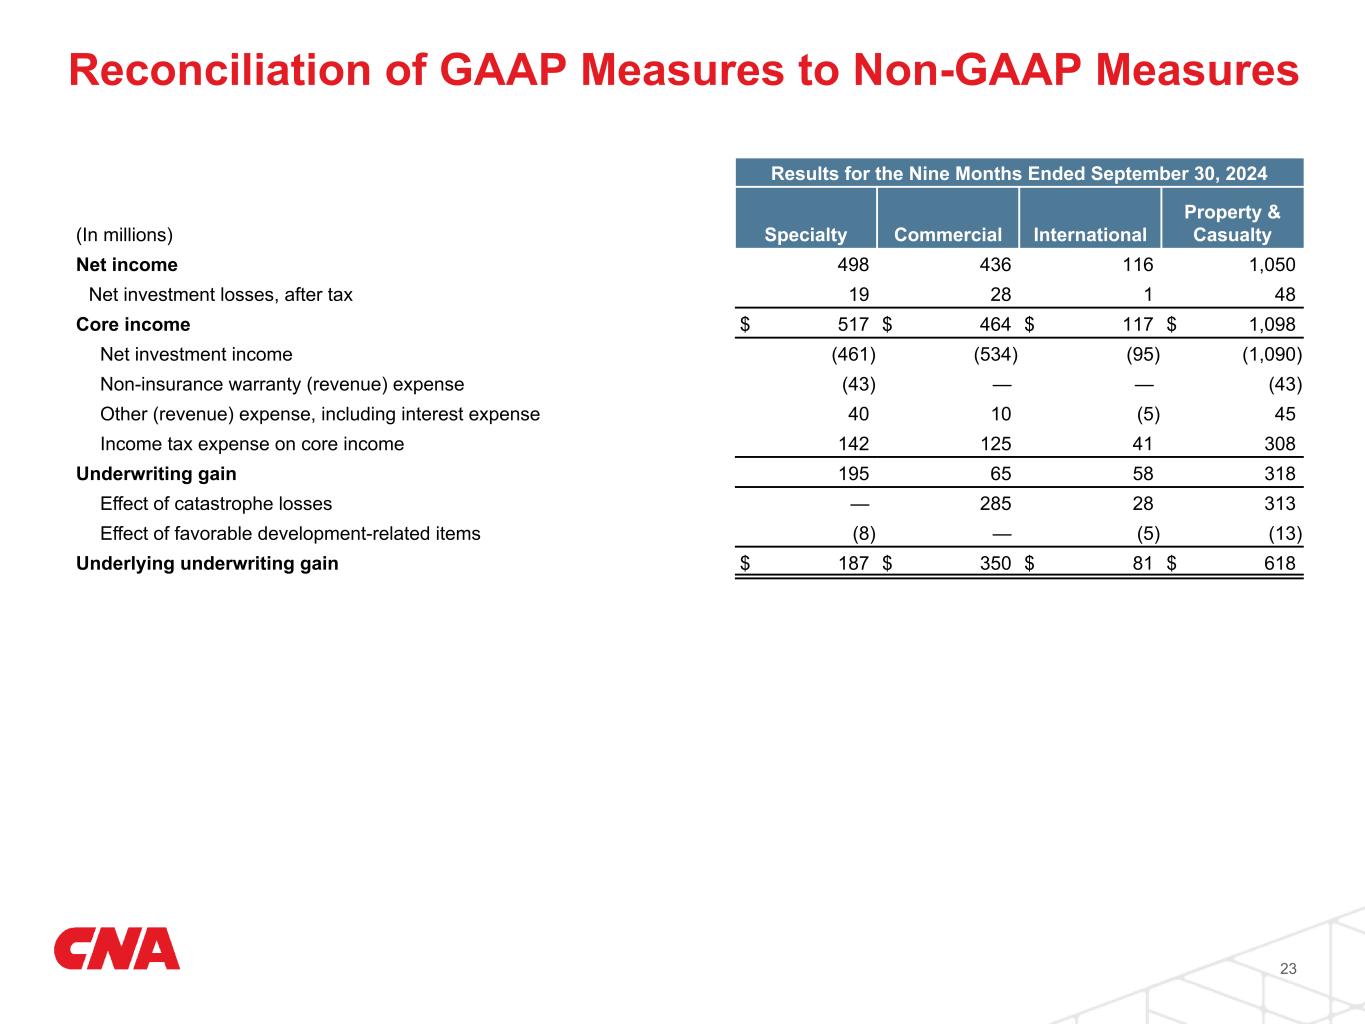
Results for the Nine Months Ended September 30, 2024
Specialty Commercial International Property & Casualty
(In millions)
Net income $ 498  $ 436  $ 116  $ 1,050 
Net investment losses, after tax 19  28  48 
Core income $ 517  $ 464  $ 117  $ 1,098 
Net investment income (461) (534) (95) (1,090)
Non-insurance warranty (revenue) expense (43) —  —  (43)
Other (revenue) expense, including interest expense 40  10  (5) 45 
Income tax expense on core income 142  125  41  308 
Underwriting gain 195  65  58  318 
Effect of catastrophe losses —  285  28  313 
Effect of favorable development-related items (8) —  (5) (13)
Underlying underwriting gain $ 187  $ 350  $ 81  $ 618 

Results for the Nine Months Ended September 30, 2023
Specialty Commercial International Property & Casualty
(In millions)
Net income $ 487  $ 390  $ 103  $ 980 
Net investment losses (gains), after tax 39  53  (1) 91 
Core income $ 526  $ 443  $ 102  $ 1,071 
Net investment income (407) (470) (74) (951)
Non-insurance warranty (revenue) expense (67) —  —  (67)
Other (revenue) expense, including interest expense 39  46 
Income tax expense on core income 146  118  36  300 
Underwriting gain 237  96  66  399 
Effect of catastrophe losses —  190  24  214 
Effect of (favorable) unfavorable development-related items (7) (4) 15 
Underlying underwriting gain $ 230  $ 282  $ 105  $ 617 
11


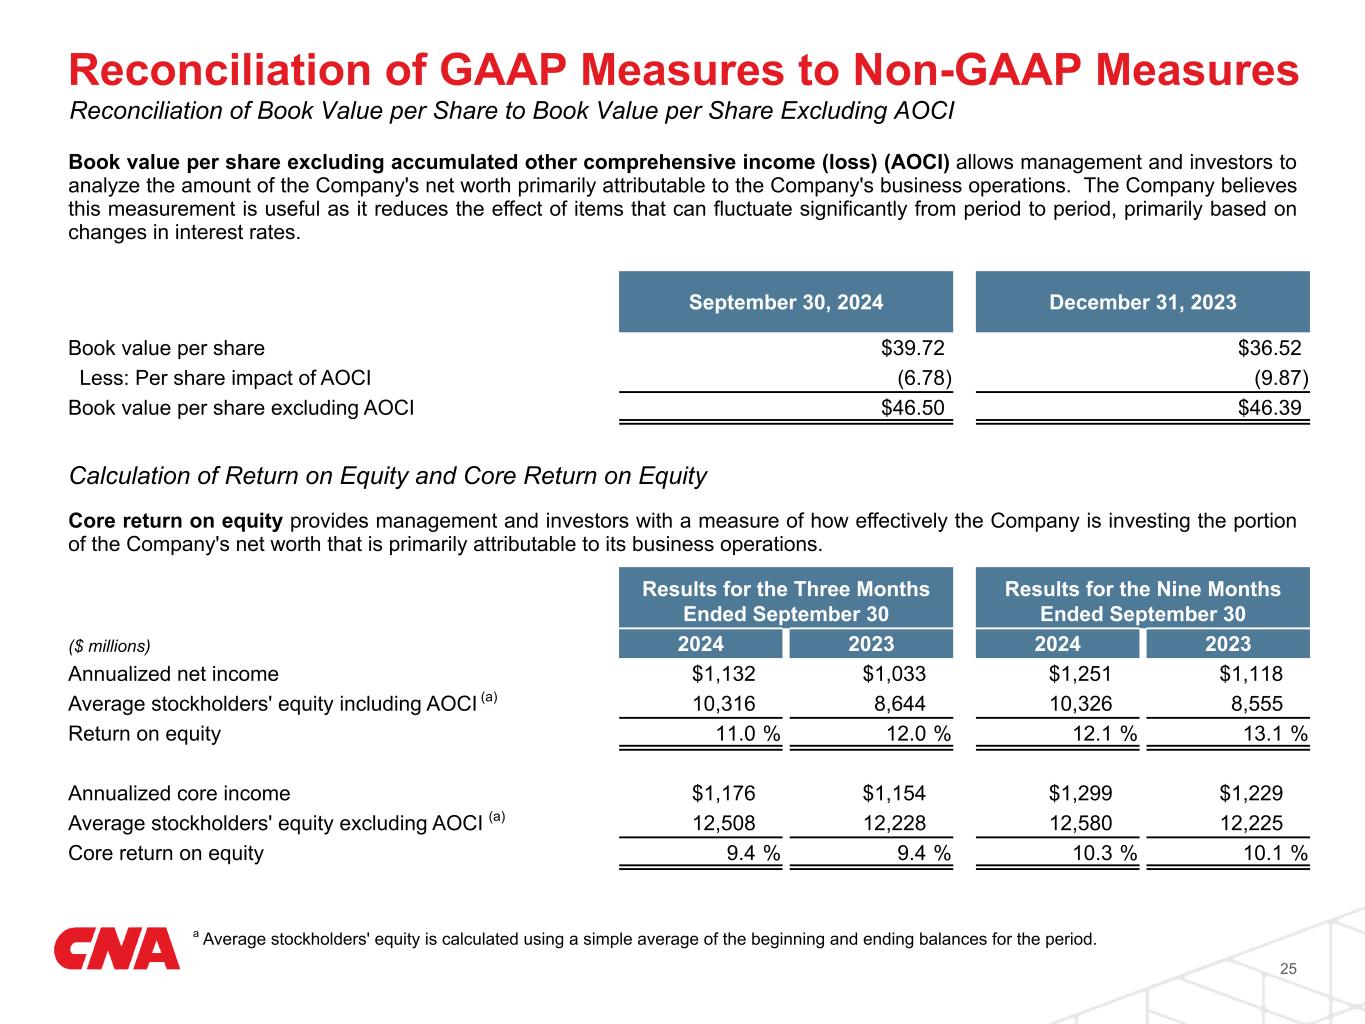
Reconciliation of Book Value per Share to Book Value per Share Excluding AOCI
Book value per share excluding accumulated other comprehensive income (loss) (AOCI) allows management and investors to analyze the amount of the Company's net worth primarily attributable to the Company's business operations. The Company believes this measurement is useful as it reduces the effect of items that can fluctuate significantly from period to period, primarily based on changes in interest rates.
September 30, 2024 December 31, 2023
Book value per share $ 39.72  $ 36.52 
Less: Per share impact of AOCI (6.78) (9.87)
Book value per share excluding AOCI $ 46.50  $ 46.39 
Calculation of Return on Equity and Core Return on Equity
Core return on equity provides management and investors with a measure of how effectively the Company is investing the portion of the Company's net worth that is primarily attributable to its business operations.
Results for the Three Months Ended September 30 Results for the Nine Months Ended September 30
($ millions) 2024 2023 2024 2023
Annualized net income $ 1,132  $ 1,033  $ 1,251  $ 1,118 
Average stockholders' equity including AOCI (a)
10,316  8,644  10,326  8,555 
Return on equity 11.0  % 11.9  % 12.1  % 13.1  %
Annualized core income $ 1,176  $ 1,154  $ 1,299  $ 1,229 
Average stockholders' equity excluding AOCI (a)
12,508  12,228  12,580  12,225 
Core return on equity 9.4  % 9.4  10.3  % 10.1  %
(a)Average stockholders' equity is calculated using a simple average of the beginning and ending balances for the period.
For additional information, please refer to CNA's most recent 10-K on file with the Securities and Exchange Commission, as well as the financial supplement, available at www.cna.com.
Forward-Looking Statements
This press release includes statements that relate to anticipated future events (forward-looking statements) rather than actual present conditions or historical events. These statements are made pursuant to the safe harbor provisions of the Private Securities Litigation Reform Act of 1995 and generally include words such as “believes,” “expects,” “intends,” “anticipates,” “estimates” and similar expressions. Forward-looking statements, by their nature, are subject to a variety of inherent risks and uncertainties that could cause actual results to differ materially from the results projected. Many of these risks and uncertainties cannot be controlled by CNA. For a detailed description of these risks and uncertainties, please refer to CNA’s filings with the Securities and Exchange Commission, available at www.cna.com.
Any forward-looking statements made in this press release are made by CNA as of the date of this press release. Further, CNA does not have any obligation to update or revise any forward-looking statement contained in this press release, even if CNA’s expectations or any related events, conditions or circumstances change.
Any descriptions of coverage under CNA policies or programs in this press release are provided for convenience only and are not to be relied upon with respect to questions of coverage, exclusions or limitations. With regard to all such matters, the terms and provisions of relevant insurance policies are primary and controlling. In addition, please note that all coverages may not be available in all states.
“CNA" is a registered trademark of CNA Financial Corporation. Certain CNA Financial Corporation subsidiaries use the "CNA" trademark in connection with insurance underwriting and claims activities. Copyright © 2024 CNA. All rights reserved.

# # #
12
EX-99.2 3 q32024exhibit992.htm EX-99.2 Document


cnalogoq42019a.jpg


CNA Financial Corporation
Supplemental Financial Information


September 30, 2024


This report is for informational purposes only and includes consolidated financial statements and financial exhibits that are unaudited. This report should be read in conjunction with documents filed with the U.S. Securities and Exchange Commission, including the most recent Annual Report on Form 10-K and Quarterly Reports on Form 10-Q.


Table of Contents

cnalogoq42019a.jpg


Statements of Operations
Periods ended September 30 Three Months Nine Months
(In millions) 2024 2023 Change 2024 2023 Change
Revenues:
Net earned premiums $ 2,593 $ 2,406 % $ 7,532 $ 7,001 %
Net investment income 626 553 13  1,853 1,653 12 
Net investment (losses) gains (10) (38) (42) (105)
Non-insurance warranty revenue 401 407 1,212 1,221
Other revenues 8 8 26 22

Total revenues 3,618  3,336  10,581  9,792 
Claims, Benefits and Expenses:
Insurance claims and policyholders’ benefits (re-measurement loss of $(48), $(41), $(88) and $(75))
2,019 1,826 5,708 5,258
Amortization of deferred acquisition costs 457 426 1,336 1,208
Non-insurance warranty expense 387 386 1,169 1,154
Other operating expenses 362 338 1,077 1,021
Interest 32 34 101 93
Total claims, benefits and expenses 3,257  3,010  (8) 9,391  8,734  (8)
Income (loss) before income tax 361  326  1,190  1,058 
Income tax (expense) benefit (78) (68) (252) (220)
Net income (loss) $ 283  $ 258  10  % $ 938  $ 838  12  %


cnalogoq42019a.jpg 1


Components of Income (Loss), Per Share Data and Return on Equity
Periods ended September 30 Three Months Nine Months
(In millions, except per share data) 2024 2023 2024 2023
Components of Income (Loss)
Core income (loss) $ 293  $ 289  $ 974  $ 922 
Net investment gains (losses) (7) (31) (33) (84)
Pension settlement transaction gains (losses) (3) —  (3) — 
Net income (loss) $ 283  $ 258  $ 938  $ 838 
Diluted Earnings (Loss) Per Common Share
Core income (loss) $ 1.08  $ 1.06  $ 3.57  $ 3.39 
Net investment gains (losses) (0.03) (0.11) (0.12) (0.31)
Pension settlement transaction gains (losses) (0.01) —  (0.01) — 
Diluted earnings (loss) per share $ 1.04  $ 0.95  $ 3.44  $ 3.08 
Weighted Average Outstanding Common Stock and Common Stock Equivalents
Basic 271.3  271.2  271.5  271.2 
Diluted 272.7  272.3  272.7  272.2 
Return on Equity
Net income (loss) (1)
11.0  % 11.9  % 12.1  % 13.1  %
Core income (loss) (2)
9.4  9.4  10.3  10.1 
(1) Annualized net income (loss) divided by the average stockholders' equity including accumulated other comprehensive income (loss) (AOCI) for the period. Average equity including AOCI is calculated using a simple average of the beginning and ending balances for the period.
(2) Annualized core income (loss) divided by the average stockholders' equity excluding AOCI for the period. Average equity excluding AOCI is calculated using a simple average of the beginning and ending balances for the period.


cnalogoq42019a.jpg 2


Selected Balance Sheet Data and Statements of Cash Flows Data
(In millions, except per share data) September 30, 2024 December 31, 2023
Total investments $ 48,695  $ 46,562 
Reinsurance receivables, net of allowance for uncollectible receivables 5,798  5,412 
Total assets 67,356  64,711 
Insurance reserves 45,864  44,196 
Claim and claim adjustment expenses 24,558  23,304 
Unearned premiums 7,259  6,933 
Future policy benefits 14,047  13,959 
Debt 2,972  3,031 
Total liabilities 56,598  54,818 
Accumulated other comprehensive income (loss) (1)
(1,837) (2,672)
Total stockholders' equity 10,758  9,893 
Book value per common share $ 39.72  $ 36.52 
Book value per common share excluding AOCI $ 46.50  $ 46.39 
Outstanding shares of common stock (in millions of shares) 270.8  270.9 
Statutory capital and surplus - Combined Continental Casualty Companies (2)
$ 11,327  $ 10,946 
Three Months Ended September 30 2024 2023
Net cash flows provided (used) by operating activities $ 748  $ 828 
Net cash flows provided (used) by investing activities (553) (679)
Net cash flows provided (used) by financing activities (120) (18)
Net cash flows provided (used) by operating, investing and financing activities $ 75  $ 131 
Nine Months Ended September 30 2024 2023
Net cash flows provided (used) by operating activities $ 1,868  $ 1,765 
Net cash flows provided (used) by investing activities (762) (1,537)
Net cash flows provided (used) by financing activities (998) (218)
Net cash flows provided (used) by operating, investing and financing activities $ 108  $ 10 
(1) As of September 30, 2024 and December 31, 2023, AOCI included after-tax cumulative impacts of changes in discount rates used to measure long duration contracts of $(368) million and $(359) million.
(2) Statutory capital and surplus as of September 30, 2024 is preliminary.

cnalogoq42019a.jpg 3


Property & Casualty - Results of Operations
Periods ended September 30 Three Months Nine Months
(In millions) 2024 2023 Change 2024 2023 Change
Gross written premiums $ 3,595  $ 3,424  % $ 11,409  $ 10,953  %
Gross written premiums ex. 3rd party captives
2,825  2,595  8,964  8,305 
Net written premiums 2,360  2,178  7,424  6,938 
Net earned premiums 2,484  2,295  7,204  6,662 
Insurance claims and policyholders' benefits 1,667  1,473  4,700  4,228 
Amortization of deferred acquisition costs 457  426  1,336  1,208 
Other insurance related expenses 292  265  850  827 
Underwriting gain (loss) 68  131  (48) 318  399  (20)
Net investment income 372  318  17  1,090  951  15 
Non-insurance warranty revenue 401  407  1,212  1,221 
Other revenues 24  22 
Non-insurance warranty expense 387  386  1,169  1,154 
Other expenses 13  30  69  68 
Core income (loss) before income tax 447  448  1,406  1,371 
Income tax (expense) benefit on core income (loss) (101) (97) (308) (300)
Core income (loss) $ 346  $ 351  (1) % $ 1,098  $ 1,071  %
Other Performance Metrics
Underwriting gain (loss) $ 68  $ 131  (48) % $ 318  $ 399  (20) %
Effect of catastrophe losses 143  94  313  214 
Effect of (favorable) unfavorable development-related items (2) (5) (13)
Underlying underwriting gain (loss) $ 209  $ 220  (5) % $ 618  $ 617  —  %
Loss & LAE ratio 66.7  % 63.9  % (2.8) pts 64.9  % 63.1  % (1.8) pts
Expense ratio 30.2  30.1  (0.1) 30.3  30.6  0.3 
Dividend ratio 0.3  0.3  —  0.4  0.3  (0.1)
Combined ratio 97.2  % 94.3  % (2.9) pts 95.6  % 94.0  % (1.6) pts
Effect of catastrophe impacts (5.8) (4.1) 1.7  (4.3) (3.2) 1.1 
Effect of development-related items 0.2  0.2  —  0.2  —  (0.2)
Underlying combined ratio 91.6  % 90.4  % (1.2) pts 91.5  % 90.8  % (0.7) pts
Rate % % (2) pts % % (1) pts
Renewal premium change % % (1) pts % % (2) pts
Retention 85  % 84  % pts 85  % 85  % —  pts
New business $ 547  $ 475  15  % $ 1,671  $ 1,533  %


cnalogoq42019a.jpg 4


Specialty - Results of Operations
Periods ended September 30 Three Months Nine Months
(In millions) 2024 2023 Change 2024 2023 Change
Gross written premiums $ 1,743  $ 1,775  (2) % $ 5,153  $ 5,324  (3) %
Gross written premiums ex. 3rd party captives
982  949  2,846  2,796 
Net written premiums 862  825  2,511  2,438 
Net earned premiums 848  829  2,493  2,438 
Insurance claims and policyholders' benefits 511  482  1,485  1,424 
Amortization of deferred acquisition costs 188  175  546  508 
Other insurance related expenses 90  89  267  269 
Underwriting gain (loss) 59  83  (29) 195  237  (18)
Net investment income 157  136  15  461  407  13 
Non-insurance warranty revenue 401  407  1,212  1,221 
Other revenues —  — 
Non-insurance warranty expense 387  386  1,169  1,154 
Other expenses 13  13  41  39 
Core income (loss) before income tax 218  227  659  672 
Income tax (expense) benefit on core income (loss) (47) (49) (142) (146)
Core income (loss) $ 171  $ 178  (4) % $ 517  $ 526  (2) %
Other Performance Metrics
Underwriting gain (loss) $ 59  $ 83  (29) % $ 195  $ 237  (18) %
Effect of catastrophe losses —  —  —  — 
Effect of (favorable) unfavorable development-related items —  (5) (8) (7)
Underlying underwriting gain (loss) $ 59  $ 78  (24) % $ 187  $ 230  (19) %
Loss & LAE ratio 60.1  % 58.0  % (2.1) pts 59.3  % 58.2  % (1.1) pts
Expense ratio 32.7  31.8  (0.9) 32.5  31.9  (0.6)
Dividend ratio 0.2  0.3  0.1  0.3  0.2  (0.1)
Combined ratio 93.0  % 90.1  % (2.9) pts 92.1  % 90.3  % (1.8) pts
Effect of catastrophe impacts —  —  —  —  —  — 
Effect of development-related items —  0.6  0.6  0.3  0.3  — 
Underlying combined ratio 93.0  % 90.7  % (2.3) pts 92.4  % 90.6  % (1.8) pts
Rate —  % % (1) pts % % —  pts
Renewal premium change % % —  pts % % —  pts
Retention 89  % 87  % pts 89  % 88  % pts
New business $ 129  $ 121  % $ 341  $ 349  (2) %

cnalogoq42019a.jpg 5


Commercial - Results of Operations
Periods ended September 30 Three Months Nine Months
(In millions) 2024 2023 Change 2024 2023 Change
Gross written premiums $ 1,547  $ 1,343  15  % $ 5,160  $ 4,504  15  %
Gross written premiums ex. 3rd party captives
1,538  1,340  15  5,022  4,384  15 
Net written premiums 1,221  1,071  14  4,017  3,588  12 
Net earned premiums 1,325  1,170  13  3,774  3,336  13 
Insurance claims and policyholders' benefits 961  813  2,647  2,252 
Amortization of deferred acquisition costs 209  188  608  532 
Other insurance related expenses 158  156  454  456 
Underwriting gain (loss) (3) 13  (123) 65  96  (32)
Net investment income 183  156  17  534  470  14 
Other revenues 23  22 
Other expenses 11  33  27 
Core income (loss) before income tax 177  167  589  561 
Income tax (expense) benefit on core income (loss) (38) (34) (125) (118)
Core income (loss) $ 139  $ 133  % $ 464  $ 443  %
Other Performance Metrics
Underwriting gain (loss) $ (3) $ 13  (123) % $ 65  $ 96  (32) %
Effect of catastrophe losses 127  87  285  190 
Effect of (favorable) unfavorable development-related items —  —  —  (4)
Underlying underwriting gain (loss) $ 124  $ 100  24  % $ 350  $ 282  24  %
Loss & LAE ratio 72.0  % 68.9  % (3.1) pts 69.7  % 67.0  % (2.7) pts
Expense ratio 27.7  29.5  1.8  28.1  29.6  1.5 
Dividend ratio 0.5  0.5  —  0.5  0.5  — 
Combined ratio 100.2  % 98.9  % (1.3) pts 98.3  % 97.1  % (1.2) pts
Effect of catastrophe impacts (9.6) (7.4) 2.2  (7.5) (5.7) 1.8 
Effect of development-related items 0.1  —  (0.1) —  0.2  0.2 
Underlying combined ratio 90.7  % 91.5  % 0.8  pts 90.8  % 91.6  % 0.8  pts
Rate % % (2) pts % % (2) pts
Renewal premium change % % (1) pts % 10  % (2) pts
Retention 84  % 83  % pts 84  % 85  % (1) pts
New business $ 345  $ 292  18  % $ 1,117  $ 945  18  %

cnalogoq42019a.jpg 6


International - Results of Operations
Periods ended September 30 Three Months Nine Months
(In millions) 2024 2023 Change 2024 2023 Change
Gross written premiums $ 305  $ 306  —  % $ 1,096  $ 1,125  (3) %
Net written premiums 277  282  (2) 896  912  (2)
Net earned premiums 311  296  937  888 
Insurance claims and policyholders' benefits 195  178  568  552 
Amortization of deferred acquisition costs 60  63  182  168 
Other insurance related expenses 44  20  129  102 
Underwriting gain (loss) 12  35  (66) 58  66  (12)
Net investment income 32  26  23  95  74  28 
Other revenues —  (1) —  — 
Other expenses (8) (5)
Core income (loss) before income tax 52  54  158  138 
Income tax (expense) benefit on core income (loss) (16) (14) (41) (36)
Core income (loss) $ 36  $ 40  (10) % $ 117  $ 102  15  %
Other Performance Metrics
Underwriting gain (loss) $ 12  $ 35  (66) % $ 58  $ 66  (12) %
Effect of catastrophe losses 16  28  24 
Effect of (favorable) unfavorable development-related items (2) —  (5) 15 
Underlying underwriting gain (loss) $ 26  $ 42  (38) % $ 81  $ 105  (23) %
Loss & LAE ratio 62.5  % 60.2  % (2.3) pts 60.6  % 62.2  % 1.6  pts
Expense ratio 33.6  28.1  (5.5) 33.1  30.3  (2.8)
Dividend ratio —  —  —  —  —  — 
Combined ratio 96.1  % 88.3  % (7.8) pts 93.7  % 92.5  % (1.2) pts
Effect of catastrophe impacts (5.1) (2.3) 2.8  (3.0) (2.7) 0.3 
Effect of development-related items 0.7  —  (0.7) 0.5  (1.7) (2.2)
Underlying combined ratio 91.7  % 86.0  % (5.7) pts 91.2  % 88.1  % (3.1) pts
Rate (2) % % (4) pts —  % % (4) pts
Renewal premium change % % (6) pts % % (5) pts
Retention 82  % 84  % (2) pts 81  % 83  % (2) pts
New business $ 73  $ 62  18  % $ 213  $ 239  (11) %

cnalogoq42019a.jpg 7


Life & Group - Results of Operations
Periods ended September 30 Three Months Nine Months
(In millions) 2024 2023 2024 2023
Net earned premiums $ 110  $ 112  $ 329  $ 340 
Net investment income 240  216  710  659 
Other revenues —  —  —  — 
Total operating revenues 350  328  1,039  999 
Insurance claims and policyholders' benefits 336  343  973  998 
Other insurance related expenses 30  29  88  89 
Other expenses (1) — 
Total claims, benefits and expenses 367  371  1,063  1,087 
Core income (loss) before income tax (17) (43) (24) (88)
Income tax (expense) benefit on core income (loss) 14  19  36 
Core income (loss) $ (9) $ (29) $ (5) $ (52)

cnalogoq42019a.jpg 8


Corporate & Other - Results of Operations
Periods ended September 30 Three Months Nine Months
(In millions) 2024 2023 2024 2023
Net earned premiums $ (1) $ (1) $ (1) $ (1)
Net investment income 14  19  53  43 
Other revenues —  — 
Total operating revenues 15  18  54  42 
Insurance claims and policyholders' benefits 16  10  35  32 
Other insurance related expenses (1) —  (1)
Interest expense 32  35  101  93 
Other expenses 23  14  65  36 
Total claims, benefits and expenses 70  59  200  162 
Core income (loss) before income tax (55) (41) (146) (120)
Income tax (expense) benefit on core income (loss) 11  27  23 
Core income (loss) $ (44) $ (33) $ (119) $ (97)


cnalogoq42019a.jpg 9


Investment Summary - Consolidated
September 30, 2024 June 30, 2024 December 31, 2023
(In millions) Carrying Value Net Unrealized Gains (Losses) Carrying Value Net Unrealized Gains (Losses) Carrying Value Net Unrealized Gains (Losses)
Fixed maturity securities:
Corporate and other bonds $ 25,792  $ (74) $ 24,372  $ (1,095) $ 24,268  $ (748)
States, municipalities and political subdivisions:
Tax-exempt 3,333 65  3,333 (33) 3,722 88 
Taxable 3,815 (323) 3,696 (498) 3,670 (409)
Total states, municipalities and political subdivisions 7,148  (258) 7,029  (531) 7,392  (321)
Asset-backed:
RMBS 3,354  (330) 3,115  (487) 3,002  (409)
CMBS 1,741  (126) 1,611  (179) 1,631  (223)
Other ABS 3,585  (146) 3,379  (243) 3,268  (243)
Total asset-backed 8,680  (602) 8,105  (909) 7,901  (875)
U.S. Treasury and obligations of government-sponsored enterprises 222  (2) 191  (2) 151  (1)
Foreign government 737  (18) 706  (36) 713  (28)
Redeemable preferred stock —  —  —  —  —  — 
Total fixed maturity securities 42,579  (954) 40,403  (2,573) 40,425  (1,973)
Equities:
Common stock 183  —  180  —  191  — 
Non-redeemable preferred stock 485  —  489  —  492  — 
Total equities 668  —  669  —  683  — 
Limited partnership investments:
Hedge funds 356  —  347 —  332  — 
Private equity funds 2,106  —  2,020 —  1,842  — 
Total limited partnership investments 2,462  —  2,367  —  2,174  — 
Other invested assets 83  —  73  —  80  — 
Mortgage loans 1,003  —  986  —  1,035  — 
Short-term investments 1,900  —  1,747  —  2,165 
Total investments $ 48,695  $ (954) $ 46,245  $ (2,573) $ 46,562  $ (1,972)
Net receivable/(payable) on investment activity $ (93) $ (6) $ 36 
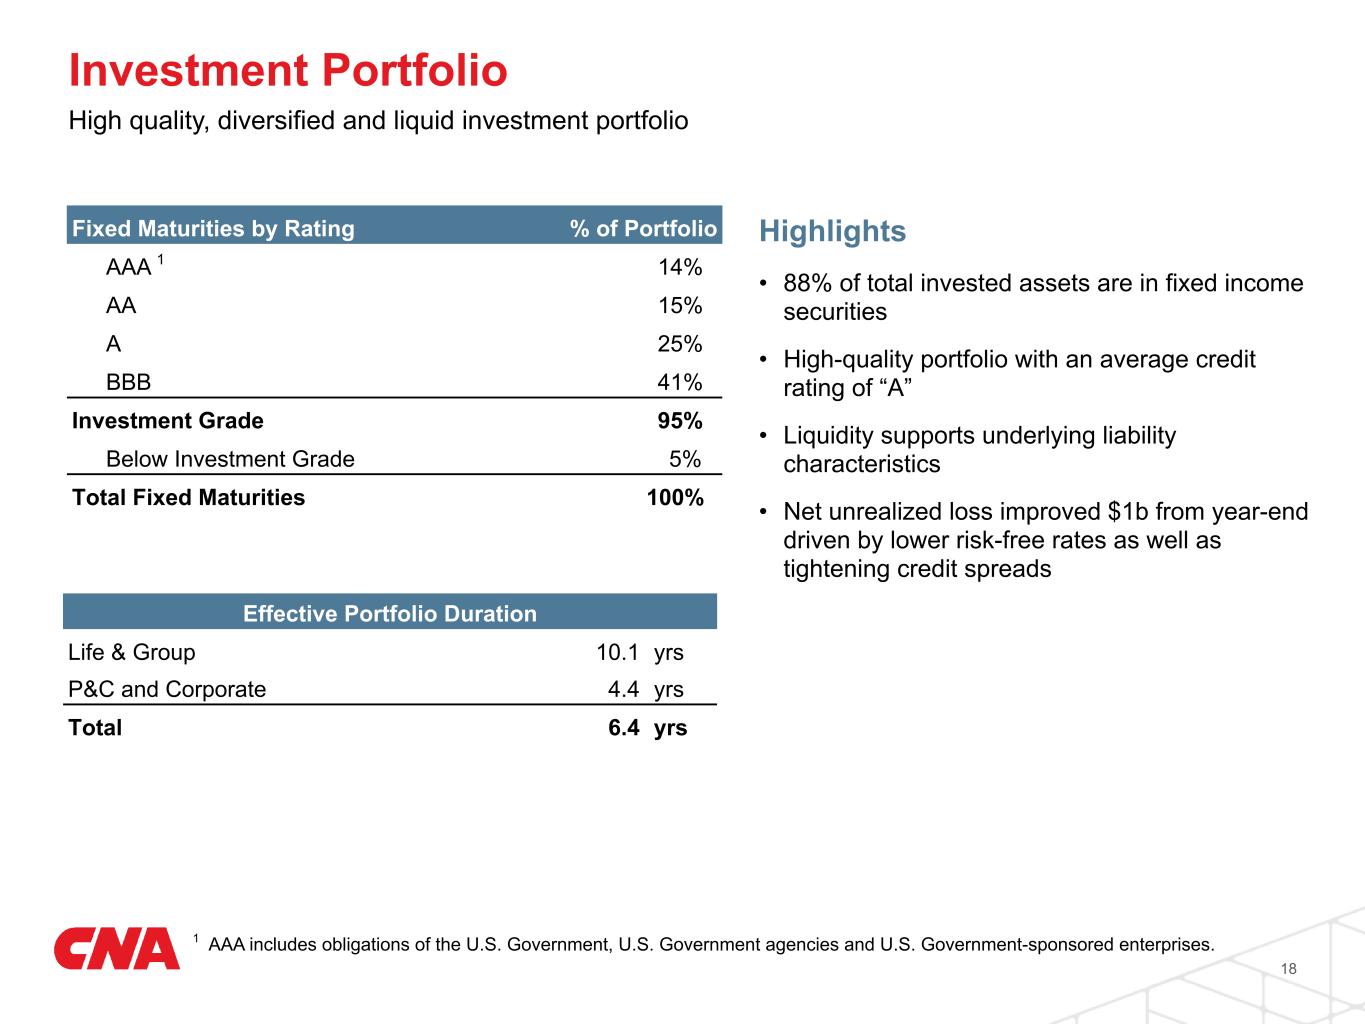
Effective duration (in years) 6.4  6.4  6.5 
Weighted average rating (1)
A A A
RMBS - Residential mortgage-backed securities
CMBS - Commercial mortgage-backed securities
Other ABS - Other asset-backed securities
(1) Obligations of the U.S. Government, U.S. Government agencies and U.S. Government-sponsored enterprises were classified as AAA for purposes of calculating the weighted average rating.

cnalogoq42019a.jpg 10


Investment Summary - Property & Casualty and Corporate & Other
September 30, 2024 June 30, 2024 December 31, 2023
(In millions) Carrying Value Net Unrealized Gains (Losses) Carrying Value Net Unrealized Gains (Losses) Carrying Value Net Unrealized Gains (Losses)
Fixed maturity securities:
Corporate and other bonds $ 15,158  $ (333) $ 14,311  $ (779) $ 14,424  $ (756)
States, municipalities and political subdivisions:
Tax-exempt 1,027 (157) 1,008 (190) 1,160 (159)
Taxable 2,240 (329) 2,133 (428) 2,076 (399)
Total states, municipalities and political subdivisions 3,267  (486) 3,141  (618) 3,236  (558)
Asset-backed:
RMBS 3,352  (330) 3,113  (487) 3,000  (409)
CMBS 1,718  (124) 1,588  (177) 1,601  (221)
Other ABS 2,983  (78) 2,813  (140) 2,676  (170)
Total asset-backed 8,053  (532) 7,514  (804) 7,277  (800)
U.S. Treasury and obligations of government-sponsored enterprises 213  (2) 191  (2) 150  (1)
Foreign government 688  (11) 660  (26) 685  (20)
Redeemable preferred stock —  —  —  —  —  — 
Total fixed maturity securities 27,379  (1,364) 25,817  (2,229) 25,772  (2,135)
Equities:
Common stock 183  —  180  —  191  — 
Non-redeemable preferred stock 99  —  82  —  82  — 
Total equities 282  —  262  —  273  — 
Limited partnership investments:
Hedge funds 272  —  265 —  184  — 
Private equity funds 1,611  —  1,545 —  1,019  — 
Total limited partnership investments 1,883  —  1,810  —  1,203  — 
Other invested assets 83  —  73  —  80  — 
Mortgage loans 814  —  796  —  842  — 
Short-term investments 1,739  —  1,698  —  2,094 
Total investments $ 32,180  $ (1,364) $ 30,456  $ (2,229) $ 30,264  $ (2,134)
Net receivable/(payable) on investment activity $ (99) $ (19) $ 33 
Effective duration (in years) 4.4 4.4 4.5
Weighted average rating (1)
A A A
(1) Obligations of the U.S. Government, U.S. Government agencies and U.S. Government-sponsored enterprises were classified as AAA for purposes of calculating the weighted average rating.

cnalogoq42019a.jpg 11


Investment Summary - Life & Group
September 30, 2024 June 30, 2024 December 31, 2023
(In millions) Carrying Value Net Unrealized Gains (Losses) Carrying Value Net Unrealized Gains (Losses) Carrying Value Net Unrealized Gains (Losses)
Fixed maturity securities:
Corporate and other bonds $ 10,634  $ 259  $ 10,061  $ (316) $ 9,844  $
States, municipalities and political subdivisions:
Tax-exempt 2,306 222 2,325 157  2,562 247
Taxable 1,575 1,563 (70) 1,594 (10)
Total states, municipalities and political subdivisions 3,881  228  3,888  87  4,156  237 
Asset-backed:
RMBS —  —  — 
CMBS 23  (2) 23  (2) 30  (2)
Other ABS 602  (68) 566  (103) 592  (73)
Total asset-backed 627  (70) 591  (105) 624  (75)
U.S. Treasury and obligations of government-sponsored enterprises —  —  —  — 
Foreign government 49  (7) 46  (10) 28  (8)
Redeemable preferred stock —  —  —  —  —  — 
Total fixed maturity securities 15,200  410  14,586  (344) 14,653  162 
Equities:
Common stock —  —  —  —  —  — 
Non-redeemable preferred stock 386  —  407  —  410  — 
Total equities 386  —  407  —  410  — 
Limited partnership investments:
Hedge funds 84  —  82 —  148  — 
Private equity funds 495  —  475 —  823  — 
Total limited partnership investments 579  —  557  —  971  — 
Other invested assets —  —  —  —  —  — 
Mortgage loans 189  —  190  —  193  — 
Short-term investments 161  —  49  —  71  — 
Total investments $ 16,515  $ 410  $ 15,789  $ (344) $ 16,298  $ 162 
Net receivable/(payable) on investment activity $ $ 13  $
Effective duration (in years) 10.1 9.9 10.2
Weighted average rating (1)
A- A- A-
(1) Obligations of the U.S. Government, U.S. Government agencies and U.S. Government-sponsored enterprises were classified as AAA for purposes of calculating the weighted average rating.

cnalogoq42019a.jpg 12


Investments - Fixed Maturity Securities by Credit Rating
September 30, 2024 U.S. Government, Government agencies and Government-sponsored enterprises AAA AA A BBB Non-investment grade Total
(In millions) Fair Value Net Unrealized Gains (Losses) Fair Value Net Unrealized Gains (Losses) Fair Value Net Unrealized Gains (Losses) Fair Value Net Unrealized Gains (Losses) Fair Value Net Unrealized Gains (Losses) Fair Value Net Unrealized Gains (Losses) Fair Value Net Unrealized Gains (Losses)
Corporate and other bonds $ —  $ —  $ 29  $ —  $ 745  $ (3) $ 7,941  $ 24  $ 15,454  $ (66) $ 1,623  $ (29) $ 25,792  $ (74)
States, municipalities and political subdivisions —  —  1,126  (17) 4,503  (195) 1,229  (5) 270  (36) 20  (5) 7,148  (258)
Asset-backed:
RMBS 2,843  (240) 494  (93) —  —  —  —  —  3,354  (330)
CMBS —  —  700  (7) 628  (52) 189  (19) 183  (21) 41  (27) 1,741  (126)
Other ABS —  —  480  —  270  (47) 1,346  (37) 1,305  (49) 184  (13) 3,585  (146)
Total asset-backed 2,843  (240) 1,674  (100) 906  (99) 1,535  (56) 1,488  (70) 234  (37) 8,680  (602)
U.S. Treasury and obligations of government-sponsored enterprises 222  (2) —  —  —  —  —  —  —  —  —  —  222  (2)
Foreign government —  —  214  (2) 390  (6) 40  (5) 93  (5) —  —  737  (18)
Redeemable preferred stock —  —  —  —  —  —  —  —  —  —  —  —  —  — 
Total fixed maturity securities $ 3,065  $ (242) $ 3,043  $ (119) $ 6,544  $ (303) $ 10,745  $ (42) $ 17,305  $ (177) $ 1,877  $ (71) $ 42,579  $ (954)
Percentage of total fixed maturity securities % % 15  % 25  % 41  % % 100  %

cnalogoq42019a.jpg 13


Components of Net Investment Income
Periods ended September 30 Consolidated
Three Months Nine Months
(In millions) 2024 2023 2024 2023
Taxable fixed income securities $ 490  $ 457  $ 1,446  $ 1,331 
Tax-exempt fixed income securities 35  43  109  138 
Total fixed income securities 525  500  1,555  1,469 
Common stock 13 —  31 16
Limited partnerships - hedge funds 13 (2) 35 19
Limited partnerships - private equity funds 54 30 160 89
Total limited partnership and common stock investments 80  28  226  124 
Other, net of investment expense 21  25  72  60 
Net investment income $ 626  $ 553  $ 1,853  $ 1,653 
Effective income yield for fixed income securities portfolio 4.8  % 4.7  % 4.8  % 4.6  %
Limited partnership and common stock return for the period 3.1  1.3  9.4  5.8 
Property & Casualty and Corporate & Other
Periods ended September 30
Three Months Nine Months
(In millions) 2024 2023 2024 2023
Taxable fixed income securities $ 301  $ 283  $ 893  $ 816 
Tax-exempt fixed income securities 10  27  32 
Total fixed income securities 309  293  920  848 
Common stock 13 —  31 16
Limited partnerships - hedge funds 10 —  22 11
Limited partnerships - private equity funds 30 16  89 49
Total limited partnership and common stock investments 53  16  142  76 
Other, net of investment expense 24  28  81  70 
Net investment income $ 386  $ 337  $ 1,143  $ 994 
Effective income yield for fixed income securities portfolio 4.3  % 4.2  % 4.3  % 4.1  %
Periods ended September 30 Life & Group
Three Months Nine Months
(In millions) 2024 2023 2024 2023
Taxable fixed income securities $ 189  $ 174  $ 553  $ 515 
Tax-exempt fixed income securities 27  33  82  106 
Total fixed income securities 216  207  635  621 
Common stock —  —  —  — 
Limited partnerships - hedge funds 3 (2) 13
Limited partnerships - private equity funds 24 14 71 40
Total limited partnership and common stock investments 27  12  84  48 
Other, net of investment expense (3) (3) (9) (10)
Net investment income $ 240  $ 216  $ 710  $ 659 
Effective income yield for fixed income securities portfolio 5.7  % 5.6  % 5.6  % 5.6  %

cnalogoq42019a.jpg 14


Net Investment Gains (Losses)
Periods ended September 30 Consolidated
Three Months Nine Months
(In millions) 2024 2023 2024 2023
Fixed maturity securities:
Corporate and other bonds $ (17) $ (11) $ (38) $ (46)
States, municipalities and political subdivisions (1) (4) (3)
Asset-backed (4) (22) (25) (43)
Total fixed maturity securities (22) (37) (66) (86)
Non-redeemable preferred stock 13  25  (9)
Derivatives, short-term and other (1) (1)
Mortgage loans —  (5) —  (11)
Net investment gains (losses) (10) (38) (42) (105)
Income tax benefit (expense) on net investment gains (losses) 21 
Net investment gains (losses), after tax $ (7) $ (31) $ (33) $ (84)

cnalogoq42019a.jpg 15


Claim & Claim Adjustment Expense Reserve Rollforward
Three months ended September 30, 2024
(In millions)

Specialty

Commercial
International P&C Operations Life & Group Corporate & Other Total Operations
Claim & claim adjustment expense reserves, beginning of period
Gross $ 7,319  $ 10,617  $ 2,783  $ 20,719  $ 651  $ 2,604  $ 23,974 
Ceded 1,407  1,184  443  3,034  90  2,234  5,358 
Net 5,912  9,433  2,340  17,685  561  370  18,616 
Net incurred claim & claim adjustment expenses 510  955  195  1,660  (2) 26  1,684 
Net claim & claim adjustment expense payments (489) (656) (112) (1,257) (11) (9) (1,277)
Foreign currency translation adjustment and other —  —  76  76  16  93 
Claim & claim adjustment expense reserves, end of period
Net 5,933  9,732  2,499  18,164  564  388  19,116 
Ceded 1,395  1,286  491  3,172  86  2,184  5,442 
Gross $ 7,328  $ 11,018  $ 2,990  $ 21,336  $ 650  $ 2,572  $ 24,558 
Nine months ended September 30, 2024
(In millions)

Specialty

Commercial
International P&C Operations Life & Group Corporate & Other Total Operations
Claim & claim adjustment expense reserves, beginning of period
Gross $ 7,131  $ 10,103  $ 2,709  $ 19,943  $ 675  $ 2,686  $ 23,304 
Ceded 1,215  1,082  433  2,730  93  2,318  5,141 
Net 5,916  9,021  2,276  17,213  582  368  18,163 
Net incurred claim & claim adjustment expenses 1,479  2,629  568  4,676  16  70  4,762 
Net claim & claim adjustment expense payments (1,461) (1,919) (381) (3,761) (33) (50) (3,844)
Foreign currency translation adjustment and other (1) 36  36  (1) —  35 
Claim & claim adjustment expense reserves, end of period
Net 5,933  9,732  2,499  18,164  564  388  19,116 
Ceded 1,395  1,286  491  3,172  86  2,184  5,442 
Gross $ 7,328  $ 11,018  $ 2,990  $ 21,336  $ 650  $ 2,572  $ 24,558 


cnalogoq42019a.jpg 16


Life & Group Policyholder Reserves
Three months ended September 30, 2024 (In millions)
Claim and claim adjustment expenses Future policy benefits Total
Beginning of Period $ 561  $ 13,211  $ 13,772 
Incurred claims and policyholders' benefits (1)
(2) 338  336 
Benefit and expense payments (11) (291) (302)
Change in discount rate assumptions and other (AOCI) 16  789  805 
End of Period $ 564  $ 14,047  14,611 
Nine months ended September 30, 2024 (In millions)
Claim and claim adjustment expenses Future policy benefits Total
Beginning of Period $ 582  $ 13,959  $ 14,541 
Incurred claims and policyholders' benefits (1)
16  959  975 
Benefit and expense payments (33) (883) (916)
Change in discount rate assumptions and other (AOCI) (1) 12  11 
End of Period $ 564  $ 14,047  $ 14,611 
(1) Incurred claims and policyholders' benefits above does not agree to Net incurred claims and benefits as reflected in Note J to the Condensed Consolidated Financial Statements included under Part I, Item 1 of the Quarterly Report on Form 10-Q due to the timing of benefit and expense cash flows in determining Future Policy Benefit reserves, along with the allowable expenses in the reserve.


cnalogoq42019a.jpg 17


Definitions and Presentation
•Collectively, CNA Financial Corporation (CNAF) and its subsidiaries are referred to as CNA or the Company.
•P&C Operations includes Specialty, Commercial and International.
•Life & Group segment includes the individual and group run-off long-term care businesses as well as structured settlement obligations not funded by annuities related to certain property and casualty claimants.
•Corporate & Other segment primarily includes certain corporate expenses, including interest on corporate debt, and the results of certain property and casualty business in run-off, including CNA Re, asbestos and environmental pollution (A&EP), a legacy portfolio of excess workers' compensation (EWC) policies and certain legacy mass tort reserves.
•Management uses the core income (loss) financial measure to monitor the Company’s operations for the Specialty, Commercial and International segments. Core income (loss) is calculated by excluding from net income (loss) the after-tax effects of net investment gains or losses and gains or losses resulting from pension settlement transactions. Net investment gains or losses are excluded from the calculation of core income (loss) because they are generally driven by economic factors that are not necessarily reflective of our primary operations. The calculation of core income (loss) excludes gains or losses resulting from pension settlement transactions as they result from decisions regarding our defined benefit pension plans which are unrelated to our primary operations. Management monitors core income (loss) for each business segment to assess segment performance. Presentation of consolidated core income (loss) is deemed to be a non-GAAP financial measure and management believes some investors may find this measure useful to evaluate the Company's primary operations. Please refer to Note P to the Consolidated Financial Statements within the December 31, 2023 Form 10-K for further discussion regarding how the Company manages its business.
•In evaluating the results of the Specialty, Commercial and International segments, management uses the loss ratio, the underlying loss ratio, the expense ratio, the dividend ratio, the combined ratio and the underlying combined ratio. These ratios are calculated using financial results prepared in accordance with accounting principles generally accepted in the United States of America. The loss ratio is the percentage of net incurred claim and claim adjustment expenses to net earned premiums. The underlying loss ratio excludes the impact of catastrophe losses and development-related items from the loss ratio. Development-related items represents net prior year loss reserve and premium development, and includes the effects of interest accretion and change in allowance for uncollectible reinsurance and deductible amounts. The expense ratio is the percentage of insurance underwriting and acquisition expenses, including the amortization of deferred acquisition costs, to net earned premiums. The dividend ratio is the ratio of policyholders' dividends incurred to net earned premiums. The combined ratio is the sum of the loss, expense and dividend ratios. The underlying combined ratio is the sum of the underlying loss ratio, the expense ratio and the dividend ratio. The underlying loss ratio and the underlying combined ratio are deemed to be non-GAAP financial measures, and management believes some investors may find these ratios useful to evaluate our underwriting performance since they remove the impact of catastrophe losses which are unpredictable as to timing and amount, and development-related items as they are not indicative of our current year underwriting performance. In addition, management also utilizes renewal premium change, rate, retention and new business in evaluating operating trends. Renewal premium change represents the estimated change in average premium on policies that renew, including rate and exposure changes. Rate represents the average change in price on policies that renew excluding exposure change. Exposure represents the measure of risk used in the pricing of the insurance product. The change in exposure represents the change in premium dollars on policies that renew as a result of the change in risk of the policy. Retention represents the percentage of premium dollars renewed, excluding rate and exposure changes, in comparison to the expiring premium dollars from policies available to renew. New business represents premiums from policies written with new customers and additional policies written with existing customers.


cnalogoq42019a.jpg 18


•Management uses underwriting gain (loss), calculated using GAAP financial results, to monitor insurance operations of our Specialty, Commercial and International segments. Underwriting gain (loss) is deemed to be a non-GAAP measure and is calculated pretax as net earned premiums less total insurance expenses, which includes insurance claims and policyholders' benefits, amortization of deferred acquisition costs and other insurance related expenses. Net income (loss) is the most directly comparable GAAP measure. Management believes some investors may find this measure useful to evaluate profitability, before tax, derived from our underwriting activities which are managed separately from our investing activities. Underlying underwriting gain (loss) is deemed to be a non-GAAP measure that represents pretax underwriting gain (loss) excluding catastrophe losses and development-related items. Management believes some investors may find this measure useful to evaluate profitability, before tax, of our underwriting activities, excluding the impact of catastrophe losses which are unpredictable as to timing and amount, and development-related items as they are not indicative of our current year underwriting performance.
•This financial supplement may also reference or contain financial measures utilized to monitor the Company's investment portfolio that are not in accordance with GAAP. The Company's investment portfolio is monitored by management through analysis of various factors including unrealized gains and losses on securities, portfolio duration and exposure to market and credit risk.
•For reconciliations of non-GAAP measures to the most comparable GAAP measures and other information, please refer herein and/or to CNA's filings with the Securities and Exchange Commission, available at www.cna.com.
•Gross written premiums ex. 3rd party captives represents gross written premiums excluding business which is ceded to third party captives, including business related to large warranty programs.
•Statutory capital and surplus represents the excess of an insurance company's admitted assets over its liabilities, including loss reserves, as determined in accordance with statutory accounting practices.
•Net investment income from fixed income securities, as presented, includes both fixed maturity securities and non-redeemable preferred stock.
•Certain immaterial differences are due to rounding.
•N/M = Not Meaningful


cnalogoq42019a.jpg 19

EX-99.3 4 q32024ex993earningsprese.htm EX-99.3 q32024ex993earningsprese
CNA Financial Corporation Third Quarter 2024 Results November 4, 2024


Notices and Disclaimers Forward Looking Statements The statements made in the course of this presentation and/or contained in the presentation materials may include statements that relate to anticipated future events (forward-looking statements) rather than actual present conditions or historical events. These statements are made pursuant to the safe harbor provisions of the Private Securities Litigation Reform Act of 1995 and generally include words such as “believes,” “expects,” “intends,” “anticipates,” “estimates” and similar expressions. Forward-looking statements, by their nature, are subject to a variety of inherent risks and uncertainties that could cause actual results to differ materially from the results projected. Many of these risks and uncertainties cannot be controlled by CNA. For a detailed description of these risks and uncertainties, please refer to CNA’s filings with the Securities and Exchange Commission available at www.cna.com. Any forward-looking statements and other financial information contained in this presentation speak only as of the date hereof. Further, CNA does not have any obligation to update or revise any forward-looking statement made in the course of this presentation and/or contained in the presentation materials even if CNA’s expectations or any related events, conditions or circumstances change. Reconciliation of GAAP Measures to Non-GAAP Measures This earnings presentation contains financial measures that are not in accordance with accounting principles generally accepted in the United States of America (GAAP). Management utilizes these financial measures to monitor the Company's insurance operations and investment portfolio. The Company believes the presentation of these measures provides investors with a better understanding of the significant factors that comprise the Company's operating performance. Reconciliations of these measures to the most comparable GAAP measures can be found in the Appendix to this presentation. For additional information, please refer to CNA's filings with the Securities and Exchange Commission, available at www.cna.com Available Information and Risk Factors CNA files annual, quarterly and current reports and other information with the SEC. The SEC filings are available on the CNA website (www.cna.com) and at the SEC's website (www.sec.gov). These filings describe some of the more material risks we face and how these risks could lead to events or circumstances that may have a material adverse effect on our business, financial condition, results of operations or cash flows. You should review these filings as they contain important information about CNA and its business. "CNA" is a registered trademark of CNA Financial Corporation. Certain CNA Financial Corporation subsidiaries use the "CNA" trademark in connection with insurance underwriting and claims activities. Copyright © 2024 CNA. All rights reserved. 2


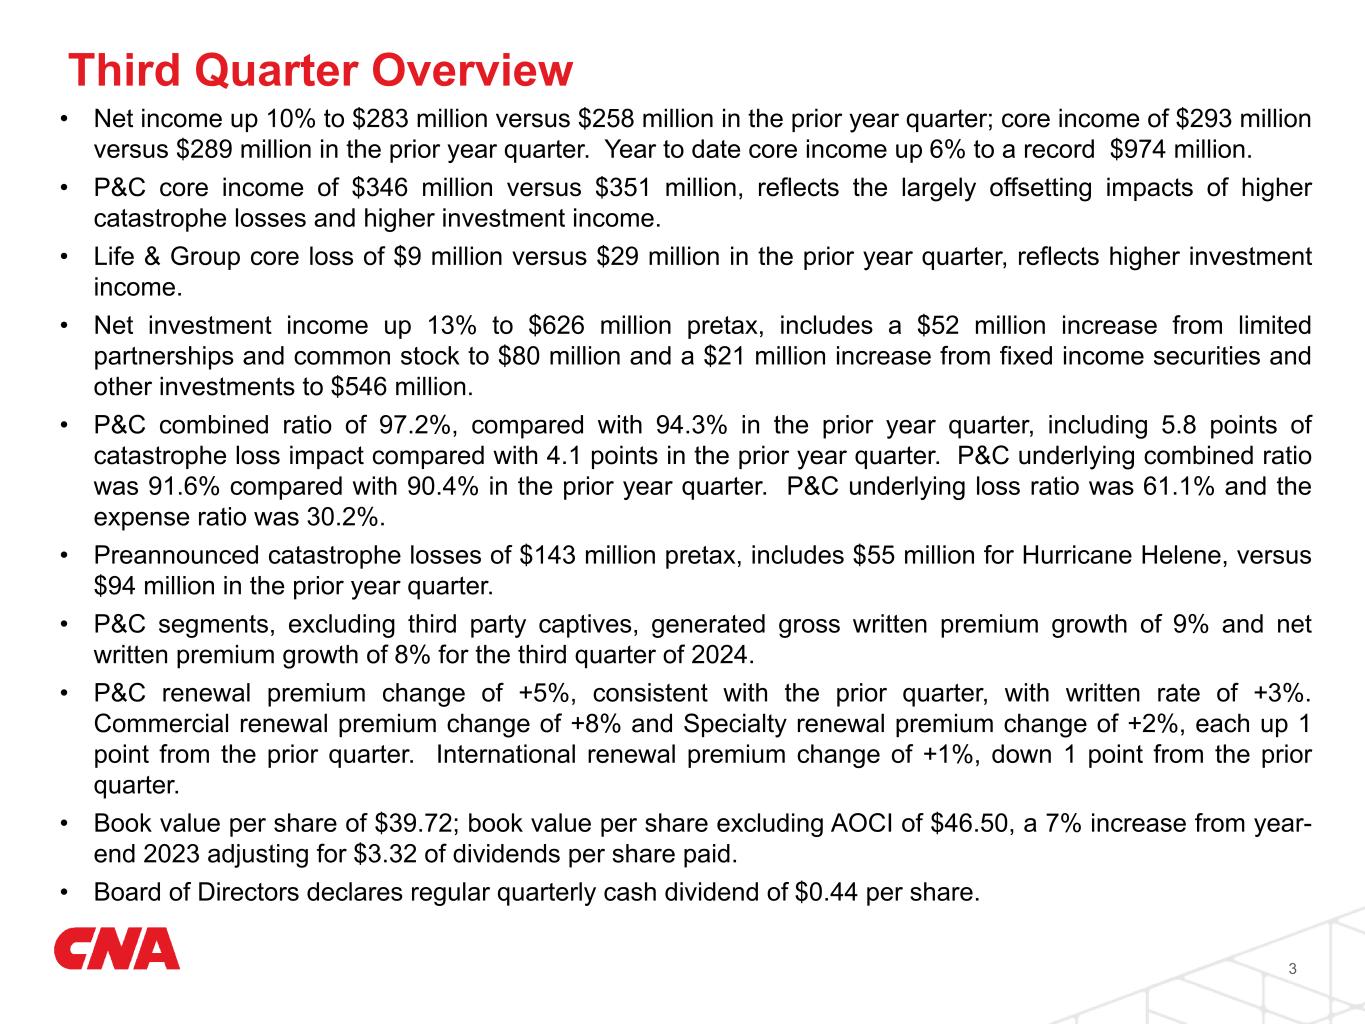
Third Quarter Overview • Net income up 10% to $283 million versus $258 million in the prior year quarter; core income of $293 million versus $289 million in the prior year quarter. Year to date core income up 6% to a record $974 million. • P&C core income of $346 million versus $351 million, reflects the largely offsetting impacts of higher catastrophe losses and higher investment income. • Life & Group core loss of $9 million versus $29 million in the prior year quarter, reflects higher investment income. • Net investment income up 13% to $626 million pretax, includes a $52 million increase from limited partnerships and common stock to $80 million and a $21 million increase from fixed income securities and other investments to $546 million. • P&C combined ratio of 97.2%, compared with 94.3% in the prior year quarter, including 5.8 points of catastrophe loss impact compared with 4.1 points in the prior year quarter. P&C underlying combined ratio was 91.6% compared with 90.4% in the prior year quarter. P&C underlying loss ratio was 61.1% and the expense ratio was 30.2%. • Preannounced catastrophe losses of $143 million pretax, includes $55 million for Hurricane Helene, versus $94 million in the prior year quarter. • P&C segments, excluding third party captives, generated gross written premium growth of 9% and net written premium growth of 8% for the third quarter of 2024. • P&C renewal premium change of +5%, consistent with the prior quarter, with written rate of +3%. Commercial renewal premium change of +8% and Specialty renewal premium change of +2%, each up 1 point from the prior quarter. International renewal premium change of +1%, down 1 point from the prior quarter. • Book value per share of $39.72; book value per share excluding AOCI of $46.50, a 7% increase from year- end 2023 adjusting for $3.32 of dividends per share paid. • Board of Directors declares regular quarterly cash dividend of $0.44 per share. 3


Financial Performance 4 Continued strong growth in earnings resulting in record core income year to date (In millions, except ratios and per share data) Third Quarter Year to Date 2024 2023 Change 2024 2023 Change Revenues $3,618 $3,336 8 % $10,581 $9,792 8 % Core income 293 289 1 % 974 922 6 % Net income 283 258 10 % 938 838 12 % Diluted earnings per common share: Core income $1.08 $1.06 2 % $3.57 $3.39 5 % Net income 1.04 0.95 9 % 3.44 3.08 12 % Core ROE 9.4 % 9.4 % 0.0 pts 10.3 % 10.1 % 0.2 pts


Highest growth quarter of the year and underlying combined ratio below 92% for 15 consecutive quarters Property & Casualty Operations 5 (In millions, except ratios) Third Quarter Year to Date 2024 2023 2024 2023 GWP ex. 3rd party captives $2,825 $2,595 $8,964 $8,305 GWP change (% year over year) 9 % 8 % Net written premium $2,360 $2,178 $7,424 $6,938 NWP change (% year over year) 8 % 7 % Net earned premium $2,484 $2,295 $7,204 $6,662 NEP change (% year over year) 8 % 8 % Underwriting gain $68 $131 $318 $399 Loss ratio 66.7 % 63.9 % 64.9 % 63.1 % Impact of catastrophes (5.8) % (4.1) % (4.3) % (3.2) % Impact of development-related items 0.2 % 0.2 % 0.2 % — % Underlying loss ratio 61.1 % 60.0 % 60.8 % 59.9 % Expense ratio 30.2 % 30.1 % 30.3 % 30.6 % Combined ratio 97.2 % 94.3 % 95.6 % 94.0 % Underlying combined ratio 91.6 % 90.4 % 91.5 % 90.8 %


Property & Casualty Production Metrics Double-digit new business growth, and stable retention and renewal premium change 6 Property & Casualty Rate & Retention 2023 2024 Q1 Q2 Q3 Q4 Q1 Q2 Q3 5% 5% 5% 4% 4% 4% 3% 7% 7% 6% 5% 6% 5% 5% 86% 86% 84% 85% 85% 85% 85% Retention Renewal Premium Change Rate GWP ex. 3rd party captives ($M) $2,724 $2,986 $2,595 $2,974 $2,936 $3,203 $2,825 New Business ($M) $503 $555 $475 $547 $529 $595 $547 Specialty Rate 2% (1)% 1% —% 2% —% —% Retention 88% 89% 87% 89% 88% 90% 89% Commercial Rate 7% 8% 8% 7% 6% 7% 6% Retention 86% 85% 83% 83% 85% 84% 84% International Rate 4% 4% 2% 2% 1% —% (2)% Retention 83% 83% 84% 83% 82% 80% 82%


Specialty Continued strong profitability 7 (In millions, except ratios) Third Quarter Year to Date 2024 2023 2024 2023 GWP ex. 3rd party captives $982 $949 $2,846 $2,796 GWP change (% year over year) 3 % 2 % Net written premium $862 $825 $2,511 $2,438 NWP change (% year over year) 4 % 3 % Net earned premium $848 $829 $2,493 $2,438 NEP change (% year over year) 2 % 2 % Underwriting gain $59 $83 $195 $237 Loss ratio 60.1 % 58.0 % 59.3 % 58.2 % Impact of catastrophes — % — % — % — % Impact of development-related items — % 0.6 % 0.3 % 0.3 % Underlying loss ratio 60.1 % 58.6 % 59.6 % 58.5 % Expense ratio 32.7 % 31.8 % 32.5 % 31.9 % Combined ratio 93.0 % 90.1 % 92.1 % 90.3 % Underlying combined ratio 93.0 % 90.7 % 92.4 % 90.6 %


Specialty Production Metrics Consistently strong retention and growth in new business 8 Specialty Rate & Retention 2023 2024 Q1 Q2 Q3 Q4 Q1 Q2 Q3 2% (1)% 1% —% 2% —% —% 4% —% 2% —% 3% 1% 2% 88% 89% 87% 89% 88% 90% 89%Retention Renewal Premium Change Rate GWP ex. 3rd party captives $886 $961 $949 $1,004 $880 $984 $982 New Business ($M) $108 $120 $121 $132 $94 $118 $129 FI & Mgmt Liability Rate (3)% (9)% (4)% (7)% (3)% (6)% (5)% Retention 89% 91% 88% 91% 90% 92% 91% Affinity Professional E&O Rate 3% 4% 3% 4% 2% 3% 2% Retention 88% 89% 89% 92% 92% 92% 91% Medical Malpractice Rate 6% 5% 7% 7% 7% 9% 7% Retention 84% 85% 84% 81% 80% 85% 83% Surety Net Written Premiums $178 $170 $157 $136 $184 $175 $176 Warranty & Alt. Risks Revenues $460 $460 $460 $448 $461 $459 $452


Commercial 9 (In millions, except ratios) Third Quarter Year to Date 2024 2023 2024 2023 GWP ex. 3rd party captives $1,538 $1,340 $5,022 $4,384 GWP change (% year over year) 15 % 15 % Net written premium $1,221 $1,071 $4,017 $3,588 NWP change (% year over year) 14 % 12 % Net earned premium $1,325 $1,170 $3,774 $3,336 NEP change (% year over year) 13 % 13 % Underwriting (loss) gain ($3) $13 $65 $96 Loss ratio 72.0 % 68.9 % 69.7 % 67.0 % Impact of catastrophes (9.6) % (7.4) % (7.5) % (5.7) % Impact of development-related items 0.1 % — % — % 0.2 % Underlying loss ratio 62.5 % 61.5 % 62.2 % 61.5 % Expense ratio 27.7 % 29.5 % 28.1 % 29.6 % Combined ratio 100.2 % 98.9 % 98.3 % 97.1 % Underlying combined ratio 90.7 % 91.5 % 90.8 % 91.6 % Record underlying combined ratio and 10th straight quarter of double-digit growth


Commercial Production Metrics 10 Commercial Rate & Retention 2023 2024 Q1 Q2 Q3 Q4 Q1 Q2 Q3 7% 8% 8% 7% 6% 7% 6% 9% 11% 9% 9% 8% 7% 8% 86% 85% 83% 83% 85% 84% 84%Retention Renewal Premium Change Rate GWP ex. 3rd party captives $1,440 $1,604 $1,340 $1,610 $1,682 $1,802 $1,538 New Business ($M) $310 $343 $292 $352 $367 $405 $345 Middle Market Rate 4% 6% 5% 5% 5% 5% 4% Retention 85% 86% 83% 83% 83% 84% 85% Construction Rate 5% 6% 7% 8% 8% 9% 9% Retention 86% 84% 85% 85% 86% 87% 84% National Accounts Rate 17% 20% 18% 12% 8% 7% 6% Retention 90% 84% 80% 85% 87% 83% 85% Small Business Rate 2% 2% 3% 2% 3% 4% 4% Retention 85% 84% 84% 82% 81% 79% 80% Marine / Other Net Written Premium $87 $101 $78 $92 $104 $116 $95 Excellent new business growth, stable retention and higher renewal premium change


International Consistently profitable results 11 (In millions, except ratios) Third Quarter Year to Date 2024 2023 2024 2023 Gross written premium $305 $306 $1,096 $1,125 GWP change (% year over year)1 — % (3) % Net written premium $277 $282 $896 $912 NWP change (% year over year)1 (2) % (2) % Net earned premium $311 $296 $937 $888 NEP change (% year over year) 5 % 6 % Underwriting gain $12 $35 $58 $66 Loss ratio 62.5 % 60.2 % 60.6 % 62.2 % Impact of catastrophes (5.1) % (2.3) % (3.0) % (2.7) % Impact of development-related items 0.7 % — % 0.5 % (1.7) % Underlying loss ratio 58.1 % 57.9 % 58.1 % 57.8 % Expense ratio 33.6 % 28.1 % 33.1 % 30.3 % Combined ratio 96.1 % 88.3 % 93.7 % 92.5 % Underlying combined ratio 91.7 % 86.0 % 91.2 % 88.1 % 1 Excluding currency fluctuations, GWP were consistent with the third quarter of 2023 and declined 3% year to date. NWP declined 1% for the third quarter of 2024 and declined 2% year to date.


Life & Group Core results reflect higher investment income 12 (In millions) Third Quarter Year to Date 2024 2023 2024 2023 Net earned premiums $110 $112 $329 $340 Net investment income 240 216 710 659 Other revenues — — — — Total operating revenues $350 $328 $1,039 $999 Total claims, benefits and expenses 367 371 1,063 1,087 Income tax benefit 8 14 19 36 Core (loss) income ($9) ($29) ($5) ($52) Core loss includes an unfavorable after-tax impact of $5 million in 2024 and $2 million in 2023 as a result of the annual assumption updates.


2024 L&G Reserve Review Favorable impact from assumption updates, which are deferred into future periods under LDTI (In millions) Change to GAAP Liability for Future Policy Benefits (LFPB) from Changes in Underlying Cash Flow Assumptions 2024 Economic Assumptions ▪ Additional cost of care inflation assumption prudence following increase in 2022 ▪ Effect of higher interest rates on LFPB reflected through AOCI under GAAP; interest rates slightly higher than the prior year's expectation, resulting in an increase to Statutory margin +$170 Morbidity ▪ Unfavorable claim recovery updates, partially offset by favorable incidence updates +$25 Persistency ▪ Slightly favorable impact from mortality updates ($10) Premium Rate Actions ▪ Favorable impacts due to rate achievement greater than estimates in several large states ($235) Expense & Other ▪ Neutral impacts to operational and overhead expectations $0 Increase/(Decrease) to GAAP LFPB from Assumption Updates ($50) Net Premium Ratio Updates ▪ Favorability deferred into future periods, offsetting current period gain +$65 Increase/(Decrease) to GAAP LFPB $15 Structured Settlements ▪ Favorable impact to claim reserves ($9) Increase/(Decrease) to Total Life & Group GAAP Reserves $6 13


LTC Progress Focused on Active Management Proactive approach to managing block across all dimensions of the business 14 Material progress made recently • 35 rate increase approvals in 2024 with an average rate increase amount of 75% • Approximately 2,100 policy buyouts, totaling $67M in cash payments in 2024 • Increased the fixed-income duration for the LTC portfolio to ~10 years, up ~1 year from 2021, taking advantage of the higher interest rate environment; asset and liability durations generally matched • Strategic investments in foundational capabilities to maintain CNA as a leader in the wellness space Ability to Withstand Stresses • Prudent reserving assumptions informed by historical experience (no morbidity improvement, 10 years of mortality improvement, minimal future rate actions, ultimate 10 year treasury rate of 3.00%) • $1.4b of Statutory reserve margin as of September 30, 2024, following 2024 annual assumption review Significantly improved runoff Long-Term Care business compared to 2015 • Individual LTC block closed in 2004; Group LTC block closed to new accounts in 2004 and closed to new enrollees in 2016 • 46% reduction in both individual and group policy counts since 2015 • Premium rates are ~50% higher than in 2015 & ~80k policyholders have reduced coverage since 2017 • Normative 10 year risk free rate assumption of 3.00% compared to 2015’s assumption of 4.80%


Individual LTC Block Characteristics More mature, richer benefit ILTC reserves have reached inflection point 15 Commentary Block Characteristics • De-risking of the more mature ILTC block with richer policy benefits is well underway ◦ We believe the ILTC reserve balance is at peak levels and declining with significant policyholder experience utilized for assumption setting ◦ Total ILTC policies have declined by 46% (~87,000 policies) since 2015 with stable open claim counts ◦ We expect approximately 65% of existing ILTC policies will run off over the next 10 years Individual Block B en ef its Average Age 82 years old Average Max Daily Benefit $287 % of policies with Lifetime Benefits 39% Average Benefit Period (non-lifetime) 3.9 years % of policies with Compound Inflation 44% % of policies with Simple Inflation 23% C la im s # of Open Claims 12.9k Average Age of New Claimant 86 years old 1 Reserves are discounted at locked-in discount rates. 2 ILTC metrics do not include CNA's 50% coinsurance business (27k healthy policies and 3k claims as of Q3 2024). 3 Healthy policies do not include 8k non-forfeiture limited benefit policies as of Q3 2024. Total Inforce ILTC Policies 2,3 Actual & Projected GAAP Reserves ($b) 1, 2 177 166 155 144 133 124 115 107 97 91 14 14 14 14 15 14 13 13 13 13 Healthy Policies Open Claims / Disabled Lives 2015 2016 2017 2018 2019 2020 2021 2022 2023 2024 Q3 46% Reduction $9.7 $3.3 2020 2022 2024 2026 2028 2030 2032 2034 2036 2038 2040 Projections Using 2024 Assumptions Actuals (In thousands)


Total Inforce GLTC Policies 2 Group LTC Block Characteristics Less rich benefits, more appropriately priced and peak reserves significantly below ILTC peak reserves 16 Commentary Block Characteristics • We believe the projected GAAP GLTC reserves will peak in the mid-2030’s at substantially lower than peak ILTC reserves ◦ Group's expected lower reserve trajectory primarily driven by less rich benefits and is more appropriately priced compared to ILTC • Total GLTC policies have declined 46% (~106,000 insureds) since 2015 from our continued active management with claim counts remaining stable throughout ◦ Healthy policy counts have declined 11% since year-end 2022 ◦ We expect approximately 25% of existing GLTC policies will run off over the next 10 years Group Block B en ef its Average Age 69 years old Average Max Daily Benefit $216 % of policies with Lifetime Benefits 1% Average Benefit Period (non-lifetime) 4.5 years % of policies with Compound Inflation 13% % of policies with Simple Inflation 1% C la im s # of Open Claims 3.2k Average Age of New Claimant 78 years old 1 Reserves are discounted at locked-in discount rates. 2 Healthy policies do not include 86k non-forfeiture limited benefit policies as of Q3 2024. Actual & Projected GAAP Reserves ($b) 1, 2 $2.7 $3.8 2020 2022 2024 2026 2028 2030 2032 2034 2036 2038 2040 Projections Using 2024 Assumptions Actuals 227 207 185 158 149 144 139 135 125 120 2 2 3 3 3 3 3 3 3 3 Healthy Policies Open Claims / Disabled Lives 2015 2016 2017 2018 2019 2020 2021 2022 2023 2024 Q3 46% Reduction (In thousands)


Pretax Net Investment Income 553 611 609 618 626 Q3 2023 Q4 2023 Q1 2024 Q2 2024 Q3 2024 Total CNAF Limited Partnership & Common Stock Highlights Fixed Income Securities 500 507 510 520 525 4.7% 4.7% 4.7% 4.8% 4.8% Fixed Income Effective Yield (Pretax) Q3 2023 Q4 2023 Q1 2024 Q2 2024 Q3 2024 28 78 68 78 80 1.3% 3.4% 2.9% 3.1% 3.1% Limited Partnership & Common Stock Return (Pretax) Q3 2023 Q4 2023 Q1 2024 Q2 2024 Q3 2024 $M $M $M 17 • Net investment income of $626M is up 13% year- over-year • Fixed income benefited from strong operating cash flows and the continued impact of higher reinvestment rates • Strong limited partnership and common stock returns; trailing twelve month return of 13% Strong contributions from fixed income, limited partnership and common stock portfolios


Investment Portfolio Effective Portfolio Duration Life & Group 10.1 yrs P&C and Corporate 4.4 yrs Total 6.4 yrs Fixed Maturities by Rating % of Portfolio AAA 1 14% AA 15% A 25% BBB 41% Investment Grade 95% Below Investment Grade 5% Total Fixed Maturities 100% 18 1 AAA includes obligations of the U.S. Government, U.S. Government agencies and U.S. Government-sponsored enterprises. Highlights • 88% of total invested assets are in fixed income securities • High-quality portfolio with an average credit rating of “A” • Liquidity supports underlying liability characteristics • Net unrealized loss improved $1b from year-end driven by lower risk-free rates as well as tightening credit spreads High quality, diversified and liquid investment portfolio


Capital • Financial strength ratings from all four rating agencies were affirmed in the past year with stable outlooks • Statutory surplus remains very strong • Adjusting for dividends, book value per share ex AOCI increased 7% Leverage • Debt maturity schedule is termed out to effectively manage refinancing • Next debt maturity of $500M due in the first quarter of 2026 Liquidity • Ample liquidity at both holding and operating company levels to meet obligations Financial Strength (In millions, except per share data) Sep 30, 2024 Dec 31, 2023 Debt $2,972 $3,031 Stockholders' equity 10,758 9,893 Total capital $13,730 $12,924 AOCI (1,837) (2,672) Capital ex AOCI $ 15,567 $ 15,596 BVPS ex AOCI $46.50 $46.39 Dividends per share (YTD) $3.32 $2.88 Debt-to-capital 21.6 % 23.5 % Debt-to-capital ex AOCI 19.1 % 19.4 % Statutory surplus 11,327 $10,946 Holding company liquidity 1 $1,047 $1,262 19 1 Includes $250 million available under credit facility Conservative capital and debt profile support business objectives


APPENDIX 20


Results for the Three Months Ended September 30 Results for the Nine Months Ended September 30 ($ millions) 2024 2023 2024 2023 Net income $283 $258 $938 $838 Less: Net investment losses (7) (31) (33) (84) Less: Pension settlement transaction losses (3) — (3) — Core income $293 $289 $974 $922 Core income (loss) is calculated by excluding from net income (loss) the after-tax effects of net investment gains or losses and gains or losses resulting from pension settlement transactions. Net investment gains or losses are excluded from the calculation of core income (loss) because they are generally driven by economic factors that are not necessarily reflective of the Company's primary operations. The calculation of core income (loss) excludes gains or losses resulting from pension settlement transactions as they result from decisions regarding the Company's defined benefit pension plans which are unrelated to the Company's primary operations. Management monitors core income (loss) for each business segment to assess segment performance. Presentation of consolidated core income (loss) is deemed to be a non-GAAP financial measure. Reconciliation of Net Income (Loss) per Diluted Share to Core Income (Loss) per Diluted Share Results for the Three Months Ended September 30 Results for the Nine Months Ended September 30 ($ millions) 2024 2023 2024 2023 Net income per diluted share $1.04 $0.95 $3.44 $3.08 Less: Net investment losses (0.03) (0.11) (0.12) (0.31) Less: Pension settlement transaction losses (0.01) — (0.01) — Core income per diluted share $1.08 $1.06 $3.57 $3.39 Core income (loss) per diluted share provides management and investors with a valuable measure of the Company's operating performance for the same reasons applicable to its underlying measure, core income (loss). Core income (loss) per diluted share is core income (loss) on a per diluted share basis. 21 Reconciliation of GAAP Measures to Non-GAAP Measures Reconciliation of Net Income (Loss) to Core Income (Loss)


22 Reconciliation of GAAP Measures to Non-GAAP Measures Underwriting gain (loss) is deemed to be a non-GAAP measure and is calculated pretax as net earned premiums less total insurance expenses, which includes insurance claims and policyholders' benefits, amortization of deferred acquisition costs and other insurance related expenses. Net income (loss) is the most directly comparable GAAP measure. Management believes some investors may find this measure useful to evaluate profitability, before tax, derived from our underwriting activities which are managed separately from our investing activities. Underlying underwriting gain (loss) is deemed to be a non-GAAP measure that represents pretax underwriting results excluding catastrophe losses and development-related items. Management believes some investors may find this measure useful to evaluate profitability, before tax, of our underwriting activities, excluding the impact of catastrophe losses which are unpredictable as to timing and amount, and development-related items as they are not indicative of our current year underwriting performance. Results for the Three Months Ended September 30, 2024 (In millions) Specialty Commercial International Property & Casualty Net income 167 132 34 333 Net investment losses, after tax 4 7 2 13 Core income $ 171 $ 139 $ 36 $ 346 Net investment income (157) (183) (32) (372) Non-insurance warranty (revenue) expense (14) — — (14) Other (revenue) expense, including interest expense 12 3 (8) 7 Income tax expense on core income 47 38 16 101 Underwriting gain (loss) 59 (3) 12 68 Effect of catastrophe losses — 127 16 143 Effect of favorable development-related items — — (2) (2) Underlying underwriting gain $ 59 $ 124 $ 26 $ 209 Reconciliation of net income to underwriting gain (loss) and underlying underwriting gain (loss)


23 Reconciliation of GAAP Measures to Non-GAAP Measures Results for the Three Months Ended September 30, 2023 (In millions) Specialty Commercial International Property & Casualty Net income 165 117 40 322 Net investment losses, after tax 13 16 — 29 Core income $ 178 $ 133 $ 40 $ 351 Net investment income (136) (156) (26) (318) Non-insurance warranty (revenue) expense (21) — — (21) Other (revenue) expense, including interest expense 13 2 7 22 Income tax expense on core income 49 34 14 97 Underwriting gain 83 13 35 131 Effect of catastrophe losses — 87 7 94 Effect of favorable development-related items (5) — — (5) Underlying underwriting gain $ 78 $ 100 $ 42 $ 220


23 Reconciliation of GAAP Measures to Non-GAAP Measures Results for the Nine Months Ended September 30, 2024 (In millions) Specialty Commercial International Property & Casualty Net income 498 436 116 1,050 Net investment losses, after tax 19 28 1 48 Core income $ 517 $ 464 $ 117 $ 1,098 Net investment income (461) (534) (95) (1,090) Non-insurance warranty (revenue) expense (43) — — (43) Other (revenue) expense, including interest expense 40 10 (5) 45 Income tax expense on core income 142 125 41 308 Underwriting gain 195 65 58 318 Effect of catastrophe losses — 285 28 313 Effect of favorable development-related items (8) — (5) (13) Underlying underwriting gain $ 187 $ 350 $ 81 $ 618


24 Reconciliation of GAAP Measures to Non-GAAP Measures Results for the Nine Months Ended September 30, 2023 (In millions) Specialty Commercial International Property & Casualty Net income 487 390 103 980 Net investment losses, after tax 39 53 (1) 91 Core income $ 526 $ 443 $ 102 $ 1,071 Net investment income (407) (470) (74) (951) Non-insurance warranty (revenue) expense (67) — — (67) Other (revenue) expense, including interest expense 39 5 2 46 Income tax expense on core income 146 118 36 300 Underwriting gain 237 96 66 399 Effect of catastrophe losses — 190 24 214 Effect of (favorable) unfavorable development-related items (7) (4) 15 4 Underlying underwriting gain $ 230 $ 282 $ 105 $ 617 The underlying loss ratio excludes the impact of catastrophe losses and development-related items from the loss ratio. The underlying combined ratio is the sum of the underlying loss ratio, the expense ratio and the dividend ratio. The underlying loss ratio and the underlying combined ratio are deemed to be non-GAAP financial measures, and management believes some investors may find these ratios useful to evaluate our underwriting performance since they remove the impact of catastrophe losses which are unpredictable as to timing and amount, and development-related items as they are not indicative of our current year underwriting performance. The components to reconcile the combined ratio and loss ratio to the underlying combined ratio and underlying loss ratio for Property & Casualty, Specialty, Commercial and International segments are set forth on pages 5, 7, 9 and 11, respectively. Components to reconcile the combined ratio and loss ratio to the underlying combined ratio and underlying loss ratio


September 30, 2024 December 31, 2023 Book value per share $39.72 $36.52 Less: Per share impact of AOCI (6.78) (9.87) Book value per share excluding AOCI $46.50 $46.39 Book value per share excluding accumulated other comprehensive income (loss) (AOCI) allows management and investors to analyze the amount of the Company's net worth primarily attributable to the Company's business operations. The Company believes this measurement is useful as it reduces the effect of items that can fluctuate significantly from period to period, primarily based on changes in interest rates. Calculation of Return on Equity and Core Return on Equity Results for the Three Months Ended September 30 Results for the Nine Months Ended September 30 ($ millions) 2024 2023 2024 2023 Annualized net income $1,132 $1,033 $1,251 $1,118 Average stockholders' equity including AOCI (a) 10,316 8,644 10,326 8,555 Return on equity 11.0 % 12.0 % 12.1 % 13.1 % Annualized core income $1,176 $1,154 $1,299 $1,229 Average stockholders' equity excluding AOCI (a) 12,508 12,228 12,580 12,225 Core return on equity 9.4 % 9.4 % 10.3 % 10.1 % Core return on equity provides management and investors with a measure of how effectively the Company is investing the portion of the Company's net worth that is primarily attributable to its business operations. a Average stockholders' equity is calculated using a simple average of the beginning and ending balances for the period. 25 Reconciliation of GAAP Measures to Non-GAAP Measures Reconciliation of Book Value per Share to Book Value per Share Excluding AOCI


EX-99.4 5 q32024ex994earningsremarks.htm EX-99.4 Document


CNA Financial Third Quarter 2024 Earnings Remarks
Dino Robusto, Chairman and Chief Executive Officer:
In the third quarter, we produced very strong results with increased core income, the highest quarterly top-line growth of the year, excellent profitability including the sixth consecutive quarter with pretax underlying underwriting gain of $200 million or greater, higher investment income, and a one point increase in renewal premium change for both Commercial and Specialty compared to the second quarter.
On a year-to-date basis, core income is a record high at $974 million with an all-in combined ratio of 95.6% and an underlying combined ratio of 91.5%, up a little over a half point compared to the first nine months of 2023.
Drilling down on third quarter, core income was $293 million including a $73 million year-over-year increase in net investment income to $626 million pretax. Our alternatives portfolio generated over half of the increase, and the growth in our fixed income portfolio was due to both a higher book yield and a larger invested asset base.
The P&C all-in combined ratio was 97.2%, with previously announced catastrophe losses of $143 million or 5.8 points of the combined ratio, in line with the third quarter average over the last five years. Prior period development for P&C overall was favorable by 0.2 points of the combined ratio. The P&C underlying combined ratio of 91.6% represents the fifteenth consecutive quarter below 92%.
In the quarter, we achieved the strongest production performance of the year with 9% growth in gross written premiums excluding captives and 8% growth in net written premiums. Renewal premium change for P&C overall was stable with the second quarter at 5%, but was up one point in the U.S. to 6%, and down in International by a point to 1%. Rate increases in the U.S. remained stable at 4% while in International rates in the aggregate went slightly negative. P&C retention remained high at 85% this quarter even as we achieved an additional point of renewal premium change in the U.S. New business was up 15% in the quarter to $547 million, reflecting the strongest quarterly growth of the year with each operating segment contributing to positive new business growth.
Turning to our three business units, the all-in combined ratio for Commercial was 100.2%. Catastrophe losses of $127 million this quarter added 9.6 points to the combined ratio. The underlying combined ratio of 90.7% was a record low and was 0.8 points lower than the prior year quarter. The underlying loss ratio was 62.5% - up half a point from the second quarter as a result of the continuing impact of the mix shift toward national accounts as well as the continuation of the more recent loss activity in commercial auto being higher than the embedded long run trend, each of which we addressed in our remarks last quarter. The expense ratio was a record low at 27.7%, resulting in a record high underlying underwriting gain of $124 million.
Gross written premiums excluding captives grew 15% in the quarter, and growth is also 15% on a year-to-date basis. Net written premiums growth was 14%. New business grew 18%, the strongest level this year, and retention was 84% in the quarter. Retentions improved in our middle market and national accounts business units but dropped a few points in construction as we walked away from accounts where we couldn’t get the necessary pricing on the auto exposures. Renewal premium change in Commercial was up a point from the second quarter to 8%. Renewal premium change for Commercial excluding workers’ compensation was up two points to 10%.
Rate change in Commercial was 6%, down one point compared to last quarter as the rate in property dropped two points but was still a healthy 7%. Commercial auto rates continue to rise and were 15% this quarter, and excess casualty rates were 10% and have been double-digit all year. Primary general liability rates continue to increase in the mid single-digit range with renewal premium change in the high single-digits. For commercial casualty lines, including auto, primary general liability and excess casualty, renewal premium change was 11%. In workers’ compensation, rates continue to be negative due to favorable loss ratio results, but we see beneficial exposure increases due to rising payrolls.
cnalogoq42019b.jpg                                                 1


Within Specialty, the all-in and underlying combined ratio remained very profitable in the third quarter at 93.0%. The expense ratio was 32.7% and the underlying loss ratio was 60.1% - up a half point from the second quarter primarily from continued pricing pressure in management liability lines, which have now experienced ten consecutive quarters of rate declines. While the portfolio continues to perform very well, the protracted period of rates below loss cost trends portends potential margin compression in the future as the decreases earn in, so we continue to react prudently.
The small underlying loss ratio adjustments in Commercial and Specialty this quarter compared to the second quarter reflect our best estimate of the impacts for the latter half of accident year 2024.
Specialty production performance in the quarter improved with gross written premiums excluding captives growth of 3% this quarter and net written premiums growth of 4%. We achieved double-digit growth in surety this quarter where several project backlogs came to fruition with some of our long-standing accounts. Our healthcare business grew mid single-digits this quarter, and our financial institution and management liability business grew mid single-digits from strong retention and double-digit new business growth in private directors and officers (D&O).
Within Specialty, rates in aggregate were flat this quarter, similar to last quarter. We continue to secure high single-digit rate increases in our healthcare business. Our affinity programs continue to produce stable low single-digit rate increases, and rates in financial institutions and management liability continue to fluctuate on a quarterly basis, and while still negative, improved by a point this quarter. Notwithstanding the more recent rate declines, we continue to optimize our portfolio through risk selection and managing limits and attachment points. Retention in Specialty was 89% and has remained stable at about this level for over two years.
For International, the all-in combined ratio was 96.1% in the quarter, including $16 million or 5.1 points of catastrophe losses. The underlying combined ratio continues to be very strong at 91.7%, with an underlying loss ratio of 58.1%, and an expense ratio of 33.6% compared to 28.1% in the prior year quarter. The expense ratio increase was primarily driven by a favorable reinsurance acquisition related catch-up adjustment in the prior year quarter and higher employee related costs in the current quarter.
Competition continues to be strong in our International segment resulting in flat growth in gross written premiums. Net written premiums were down 2%, or 1% excluding currency fluctuation. Rates in aggregate for International turned low single-digit negative this quarter; but there are differences in pricing and competition by geography and product, which allowed us to continue to grow new business by 18% in the quarter and improve retention by two points to 82%.
Scott Lindquist, Chief Financial Officer:
CNA’s third quarter core income of $293 million is slightly above the prior year quarter, while year to date core income is up 6% to a record best of $974 million, which translates to an annualized core return on equity of 10.3% and reflects another quarter of strong underwriting and investment results.
Our P&C expense ratio for the third quarter was 30.2% and is about flat to the prior year quarter. A favorable International reinsurance acquisition related catch-up adjustment in the prior year quarter was largely offset by higher net earned premiums in the current quarter.
The P&C net prior period development impact on the combined ratio was 0.2 points favorable in the current quarter. In the Specialty segment, prior period development was neutral overall, and this was mostly attributable to favorable development in surety offset by unfavorable development in management liability related to accident year 2019. In the Commercial segment, prior period development was slightly favorable overall with favorable development in workers’ compensation, the majority of which is attributable to accident years 2018 and prior, unfavorable development in commercial auto in recent accident years, and unfavorable development in general liability driven by excess casualty across multiple accident years back to 2015. In the International segment, prior period development was slightly favorable in the quarter.
cnalogoq42019b.jpg                                                 2


Our Corporate segment produced a core loss of $44 million in the third quarter, compared to a $33 million loss in the prior year quarter. The current quarter includes $11 million of income from the amortization of a deferred gain related to the asbestos and environmental pollution loss portfolio transfer, compared to $15 million in the prior year quarter, and a $3 million after-tax charge related to the planned office consolidation efforts we have disclosed previously. The Corporate segment results also include a $17 million after-tax charge related to unfavorable prior period development largely associated with legacy mass tort abuse claims, compared to a $16 million after-tax charge in the prior year quarter. We note that, as has been the case in recent years, the results of our annual asbestos and environmental reserve review will be reflected in our fourth quarter earnings in the Corporate segment.
In the Life & Group segment, we recorded a core loss of $9 million for the third quarter compared to a $29 million core loss in the prior year quarter. Life & Group investment income was up $24 million pretax compared to the prior year quarter, primarily driven by our alternatives performance, while underwriting results for the quarter include a negligible impact from $23 million of cash policy buyouts. In addition, both periods were impacted by our annual reserve assumption updates – a $5 million unfavorable after-tax impact in 2024 and a $2 million unfavorable impact for 2023.
Each year in the third quarter, we undertake our reserve reviews for Life & Group, which includes the analysis of reserving assumptions underlying our Long-Term Care (LTC) and structured settlement reserves. The assumption updates for LTC and structured settlements were favorable, with the LTC favorability being deferred into future periods under Long Duration Targeted Improvements (LDTI) accounting. Taken together, the third quarter reserve reviews resulted in an essentially neutral impact to reserves for Life & Group. The results of our annual reviews are highlighted on slide 13 of our earnings presentation. Our analysis involves a thorough review of all our reserving assumptions including cost of care inflation, morbidity, persistency and rate increase assumptions. Notably for this year’s assumption update, we meaningfully outperformed rate increase assumptions driven by significant rate approvals in several large states. We also strengthened our assumption on cost of care inflation. Under LDTI accounting, the net premium ratio can defer favorable or unfavorable results into future periods – depending on which policy year cohort is impacted. The 2024 assumption updates were favorable, lowering our net premium ratio and deferring the favorability into future periods based on cohort. The result was a $15 million unfavorable adjustment to LTC reserves after the deferral of $65 million of favorability into future periods over the remaining life of the policies.
Updates to best-estimate assumptions also impact our LTC statutory margin. These assumption revisions increased our statutory margin to $1.4 billion, up from $1.3 billion a year ago. Similar to GAAP, the statutory margin benefited from outperformance on recent rate approvals, offset by the strengthening of our assumption on cost of care inflation. Additionally, the higher interest rate environment positively impacted the LTC statutory margin from interest rates exceeding expectations. Finally, the annual structured settlement reserve review resulted in a $9 million favorable adjustment to GAAP reserves, driven by higher interest rates.
Slide 14 of our earnings presentation provides an update on our LTC business. We believe our proactive approach to managing this portfolio, combined with the higher interest rate environment over the last three years, has considerably improved the outlook for this business.
Our Individual block has been closed since 2004 and our Group block has been closed since 2016. We have achieved substantial reduction in policy exposure since then, while at the same time obtaining substantive rate increases and benefit reductions via our active inforce management, inclusive of our ongoing policy buyout program. On the investment side, the favorable interest rate environment since early 2022 has improved the underlying economics of this business, as we have been able to lock-in high quality, longer duration securities at attractive coupons to support the underlying liabilities of the business - essentially achieving appropriately matching asset and liability durations. This is evident in the statutory margin which has grown by nearly $300 million since 2022.
cnalogoq42019b.jpg                                                 3


Slide 15 of the earnings presentation provides details on the Individual block characteristics. This block is more mature with an average attained age of 82 years and generally features richer benefits including inflation riders on most policies and lifetime benefits on some policies. The de-risking of this block continues through inforce initiatives, with policy counts down by 46% since 2015 and stable open claim counts. Going forward, we currently expect policy counts to decline by 65% from the current level over the next ten years. We believe the Individual LTC reserves have hit an inflection point and have begun to decline using locked-in discount rate assumptions.
Slide 16 of the earnings presentation provides details on the Group block characteristics. The attained age is 69 years, and compared to the Individual block, the Group block features less rich policy benefits. Only 1% of Group policies feature lifetime benefit periods and the block has a relatively modest exposure to inflation. As is the case with the Individual block, the de-risking of the group block continues through inforce initiatives, with policy counts down by 46% since 2015 and stable open claim counts. Going forward, we currently expect policy counts to decline by 25% from the current level over the next ten years. We currently believe Group LTC reserves will peak in the mid-2030s, and at a substantially lower level relative to the Individual block primarily due to the lower benefit features and more appropriate pricing.
Turning to investments, total pretax net investment income was $626 million in the third quarter compared with $553 million in the prior year quarter, an increase of 13%. The increase was primarily driven by our alternatives portfolio, which returned an $80 million gain, or 3.1%, in the current quarter compared to a $28 million gain, or 1.3%, in the prior year quarter.
Fixed income and other investments generated $546 million of income, up 4% compared to the prior year quarter. Our fixed income portfolio continues to provide consistent contributions to core income, which have been steadily increasing because of favorable reinvestment rates and strong cash flow from operations. The effective income yield of our consolidated fixed income portfolio was 4.8% in the third quarter, up from 4.7% in the prior year quarter. Reinvestment rates continue to be above our P&C portfolio effective income yield of 4.3% and are fairly in line with our Life & Group portfolio effective income yield of 5.7%.
Based on the current interest rate environment, we expect income from fixed income and other investments to be about $550 million in the fourth quarter, bringing the full year 2024 figure to about $2,175 million, or a 5% increase as compared to the full year 2023.
At quarter end, our balance sheet continues to be very solid with stockholders’ equity excluding accumulated other comprehensive income (AOCI) of $12.6 billion, or $46.50 per share, an increase of 7% from year-end 2023 after adjusting for dividends paid. Stockholders’ equity including AOCI was $10.8 billion or $39.72 per share, at September 30, 2024. As a result of falling interest rates during the quarter, the net unrealized loss in our fixed income portfolio was reduced to $1.0 billion as of quarter-end. Our debt-to-capital excluding AOCI remains just under 20% and our next debt maturity of $500 million is due in the first quarter of 2026. Finally, we ended the quarter with statutory capital and surplus for the combined Continental Casualty Companies of $11.3 billion, up modestly from year-end 2023 reflecting strong statutory earnings net of dividends paid to our holding company.
Operating cash flow was strong at $748 million for the quarter as compared to $828 million in the prior year quarter. The current quarter’s cash flow results reflect certain ceded reinsurance premium payments that occurred in last year’s fourth quarter. Despite this, operating cash flow remains strong reflecting strong underwriting and investment results.
Turning to taxes, the effective tax rate on core income was 21.9% for the third quarter, and 21.2% for the year-to-date period, which is in line with our full year 2024 expectations.
We closed on the previously announced pension risk transfer transaction on October 10, 2024, that will impact our fourth quarter results. Through the purchase of a group annuity contract, we transferred over $1 billion, or approximately 60%, of our legacy U.S. pension obligations to Metropolitan Life Insurance Company.
cnalogoq42019b.jpg                                                 4


This transaction accomplishes a significant de-risking of our legacy pension obligations while protecting plan participants. As we previously noted, this transaction will result in a one-time, non-cash, pretax settlement charge of $370 million ($290 million, net of tax) in the fourth quarter of 2024. This charge is largely driven by the accelerated recognition of the actuarial pension loss from accumulated other comprehensive income into net income, which such acceleration does not impact stockholders’ equity. The actual charge will depend on finalization of actuarial and other assumptions. This charge will not impact core income or cash flow for the fourth quarter of 2024. For further information on this transaction, please refer to our third quarter 2024 Form 10-Q.
Finally, we are pleased to announce our regular quarterly dividend of $0.44 per share to be paid on December 5, 2024 to stockholders of record on November 18, 2024.
Dino Robusto, Chairman and Chief Executive Officer:
CNA had a very strong third quarter, following up on an excellent first half, and has generated record core income on a year-to-date basis and for the most recent four-quarter period. Record levels of core income are reflective of disciplined underlying underwriting execution and prudent catastrophe management, profitable growth and high levels of net investment income. We achieved 9% growth in gross written premiums excluding captives, which is up two points from the second quarter and represents our strongest quarter of the year. We are achieving strong renewal pricing increases in the lines most impacted by social inflation, which continue to exceed long-run loss cost trends. Our retention remains very strong at 85%, and our new business production growth in the quarter was the highest of any quarter this year.
We remain optimistic about our ability to continue to successfully navigate the market to capitalize on the best opportunities and grow profitably, even while stepping back without hesitation when the competitive landscape doesn’t allow us to secure our required returns.
Building on our year-to-date performance, we look forward to providing comments to you next quarter. As we announced earlier in the year, effective January 1, 2025, I will be transitioning to the role of Executive Chairman of the Board as Doug Worman becomes the President and Chief Executive Officer of CNA. I look forward to my new role in the Company, and I am confident that Doug, together with the remarkable leadership team at CNA, will continue to build on our track record of profitable growth. It has been an absolute pleasure for me to serve as the CEO of CNA over the last 8 years, in large part because of the opportunity to work closely with approximately 6,500 extremely talented team members across the organization who will continue to drive CNA’s success going forward.
cnalogoq42019b.jpg                                                 5


Questions and Answers
We invite shareholders and analysts to submit questions for management in advance of each quarter’s earnings release. Below we address some questions we have received as well as some timely and topical focus areas for CNA and our industry.
Are you seeing anything on workers’ compensation that makes you feel differently about the line?
We continue to feel great about workers’ compensation. Though loss cost trends are up a little bit from where they were a few years ago due to higher medical inflation, they continue to be below our long-run loss cost trend assumptions based on much longer-run historical averages that we never lowered. This line remains profitable.
Are you seeing increased plaintiff attorney representation on casualty claims?
Yes, we continue to see this dynamic play out. The increasingly aggressive plaintiffs’ bar and higher attorney representation has been one of the major drivers of social inflation over the last several years on casualty lines in our book.
As to the pension risk transfer transaction, what will be the impact on expenses on a run-rate basis?
We closed on a pension risk transfer transaction several weeks ago for about 60% of our $1.7 billion defined benefit pension obligation. We previously disclosed that we will incur a one-time, non-cash charge of approximately $290 million (after-tax) in our fourth quarter earnings, which will be outside of core income. This reflects settlement accounting where we record an approximate pro-rata portion of our unamortized net actuarial loss that resides in AOCI into earnings. In normal course this unamortized net actuarial loss would otherwise be amortized into earnings in future years as the pension obligation runs-off. If you look at Note H of our third quarter 2024 financials in our 10-Q, you will see our net pension expense is minimal for the year, excluding settlement charges. Each component of the pension expense would be reduced by roughly 60% into 2025 (as we’ve now reduced the assets supporting the pension, the pension obligation and actuarial loss by roughly 60%) so we expect the impact on expenses to continue to be insignificant going forward, all else equal. As a reminder, there are other moving parts that will determine total 2025 pension expense including where interest rates are on December 31, 2024, and our go-forward assumption of expected return on pension assets. Accordingly, we anticipate disclosing additional information regarding the precise effect of this transaction and updated assumptions in our first quarter 2025 results.
In review of CNA’s Financial Supplement, it looks like you recently reallocated about half of the limited partnership balance in the Life & Group portfolio to Property & Casualty and Corporate & Other. Can you speak to this shift in allocation?
During the second quarter we reduced the limited partnership allocation in our Life & Group portfolio by $500 million. These investments were redeployed in our P&C portfolio in exchange for high quality, long duration fixed income securities with attractive yields that will further aid our asset-liability management objectives. Over the past two years we have been able to take advantage of higher interest rates to extend the maturity of our Life & Group fixed income portfolio while also achieving yields that surpassed our reserving assumptions. The cumulative result of this activity has significantly reduced the level of reinvestment risk in this block, with the duration gap between our assets and liabilities now under one year.

cnalogoq42019b.jpg                                                 6


In review of CNA’s Financial Supplement, for the International segment in the Other expenses line, there is a $14 million variance from a loss last year to a gain this year - can you tell me what is happening here?
The International segment’s core income was favorably impacted by a pretax foreign currency exchange (FX) gain of approximately $8 million compared to a pretax loss of approximately $6 million in the third quarter of 2023, which drove the variance in the Other expenses line.
The FX gain this quarter was driven by the U.S. dollar weakening against the British pound during the quarter. Our Lloyd’s syndicate has U.S. dollar insurance reserves that revalue to the syndicate’s functional currency of the British pound through the income statement. Note that economically our Lloyd’s investment portfolio is also denominated in the U.S. dollar, thus effectively hedging our currency risk and this change is reflected through other comprehensive income within stockholders’ equity.

cnalogoq42019b.jpg                                                 7


Reconciliation of GAAP Measures to Non-GAAP Measures
These earnings remarks contain financial measures that are not in accordance with accounting principles generally accepted in the United States of America (GAAP). Management utilizes these financial measures to monitor the Company's insurance operations and investment portfolio. The Company believes the presentation of these measures provides investors with a better understanding of the significant factors that comprise the Company's operating performance. Reconciliations of these measures to the most comparable GAAP measures follow below.
Reconciliation of Net Income (Loss) to Core Income (Loss)
Core income (loss) is calculated by excluding from net income (loss) the after-tax effects of net investment gains or losses and gains or losses resulting from pension settlement transactions. Net investment gains or losses are excluded from the calculation of core income (loss) because they are generally driven by economic factors that are not necessarily reflective of the Company’s primary operations. The calculation of core income (loss) excludes gains or losses resulting from pension settlement transactions as they result from decisions regarding the Company’s defined benefit pension plans which are unrelated to the primary operations. Management monitors core income (loss) for each business segment to assess segment performance. Presentation of consolidated core income (loss) is deemed to be a non-GAAP financial measure.
Results for the Three Months Ended September 30 Results for the Nine Months Ended September 30
($ millions) 2024 2023 2024 2023
Net income $ 283  $ 258  $ 938  $ 838 
Less: Net investment losses (7) (31) (33) (84)
Less: Pension settlement transaction losses (3) —  (3) — 
Core income $ 293  $ 289  $ 974  $ 922 
Reconciliation of Net Income (Loss) per Diluted Share to Core Income (Loss) per Diluted Share
Core income (loss) per diluted share provides management and investors with a valuable measure of the Company's operating performance for the same reasons applicable to its underlying measure, core income (loss). Core income (loss) per diluted share is core income (loss) on a per diluted share basis.
Results for the Three Months Ended September 30 Results for the Nine Months Ended September 30
2024 2023 2024 2023
Net income per diluted share $ 1.04  $ 0.95  $ 3.44  $ 3.08 
Less: Net investment losses (0.03) (0.11) (0.12) (0.31)
Less: Pension settlement transaction losses (0.01) —  (0.01) — 
Core income per diluted share $ 1.08  $ 1.06  $ 3.57  $ 3.39 


cnalogoq42019b.jpg                                                 8


Reconciliation of Net Income to Underwriting Gain (Loss) and Underlying Underwriting Gain (Loss)
Underwriting gain (loss) is deemed to be a non-GAAP measure and is calculated pretax as net earned premiums less total insurance expenses, which includes insurance claims and policyholders' benefits, amortization of deferred acquisition costs and other insurance related expenses. Net income (loss) is the most directly comparable GAAP measure. Management believes that underwriting gain (loss) provides investors with a valuable measure of profitability, before tax, derived from our underwriting activities which are managed separately from our investing activities.
Underlying underwriting gain (loss) is deemed to be a non-GAAP measure that represents pretax underwriting results excluding catastrophe losses and development-related items. Management believes some investors may find this measure useful to evaluate profitability, before tax, of our underwriting activities, excluding the impact of catastrophe losses which are unpredictable as to timing and amount, and development-related items as they are not indicative of our current year underwriting performance.

Results for the Three Months Ended September 30, 2024
Specialty Commercial International Property & Casualty
(In millions)
Net income $ 167  $ 132  $ 34  $ 333 
Net investment losses, after tax 13 
Core income $ 171  $ 139  $ 36  $ 346 
Net investment income (157) (183) (32) (372)
Non-insurance warranty (revenue) expense (14) —  —  (14)
Other (revenue) expense, including interest expense 12  (8)
Income tax expense on core income 47  38  16  101 
Underwriting gain (loss) 59  (3) 12  68 
Effect of catastrophe losses —  127  16  143 
Effect of favorable development-related items —  —  (2) (2)
Underlying underwriting gain $ 59  $ 124  $ 26  $ 209 

Results for the Three Months Ended September 30, 2023
Specialty Commercial International Property & Casualty
(In millions)
Net income $ 165  $ 117  $ 40  $ 322 
Net investment losses, after tax 13  16  —  29 
Core income $ 178  $ 133  $ 40  $ 351 
Net investment income (136) (156) (26) (318)
Non-insurance warranty (revenue) expense (21) —  —  (21)
Other (revenue) expense, including interest expense 13  22 
Income tax expense on core income 49  34  14  97 
Underwriting gain 83  13  35  131 
Effect of catastrophe losses —  87  94 
Effect of favorable development-related items (5) —  —  (5)
Underlying underwriting gain $ 78  $ 100  $ 42  $ 220 


cnalogoq42019b.jpg                                                 9


Results for the Nine Months Ended September 30, 2024
Specialty Commercial International Property & Casualty
(In millions)
Net income $ 498  $ 436  $ 116  $ 1,050 
Net investment losses, after tax 19  28  48 
Core income $ 517  $ 464  $ 117  $ 1,098 
Net investment income (461) (534) (95) (1,090)
Non-insurance warranty (revenue) expense (43) —  —  (43)
Other (revenue) expense, including interest expense 40  10  (5) 45 
Income tax expense on core income 142  125  41  308 
Underwriting gain 195  65  58  318 
Effect of catastrophe losses —  285  28  313 
Effect of favorable development-related items (8) —  (5) (13)
Underlying underwriting gain $ 187  $ 350  $ 81  $ 618 

Results for the Nine Months Ended September 30, 2023
Specialty Commercial International Property & Casualty
(In millions)
Net income $ 487  $ 390  $ 103  $ 980 
Net investment losses, after tax 39  53  (1) 91 
Core income $ 526  $ 443  $ 102  $ 1,071 
Net investment income (407) (470) (74) (951)
Non-insurance warranty (revenue) expense (67) —  —  (67)
Other (revenue) expense, including interest expense 39  46 
Income tax expense on core income 146  118  36  300 
Underwriting gain 237  96  66  399 
Effect of catastrophe losses —  190  24  214 
Effect of (favorable) unfavorable development-related items (7) (4) 15 
Underlying underwriting gain $ 230  $ 282  $ 105  $ 617 


cnalogoq42019b.jpg                                                 10


Components to reconcile the combined ratio and loss ratio to the underlying combined ratio and underlying loss ratio
The underlying loss ratio excludes the impact of catastrophe losses and development-related items from the loss ratio. The underlying combined ratio is the sum of the underlying loss ratio, the expense ratio and the dividend ratio. The underlying loss ratio and the underlying combined ratio are deemed to be non-GAAP financial measures, and management believes some investors may find these ratios useful to evaluate our underwriting performance since they remove the impact of catastrophe losses which are unpredictable as to timing and amount, and development-related items as they are not indicative of our current year underwriting performance.
Specialty
Results for the Three Months Ended September 30
Results for the Nine Months Ended September 30
2024
2023
2024
2023
Loss ratio
60.1 
%
58.0 
%
59.3 
%
58.2 
%
Effect of catastrophe impacts
—  —  —  — 
Effect of development-related items —  0.6  0.3  0.3 
Underlying loss ratio
60.1 
%
58.6 
%
59.6 
%
58.5 
%
Combined ratio
93.0 
%
90.1 
%
92.1 
%
90.3 
%
Underlying combined ratio
93.0 
%
90.7 
%
92.4 
%
90.6 
%

Commercial
Results for the Three Months Ended September 30
Results for the Nine Months Ended September 30
2024
2023
2024
2023
Loss ratio
72.0 
%
68.9 
%
69.7 
%
67.0 
%
Effect of catastrophe impacts
(9.6) (7.4) (7.5) (5.7)
Effect of development-related items
0.1  —  —  0.2 
Underlying loss ratio
62.5 
%
61.5 
%
62.2 
%
61.5 
%
Combined ratio
100.2 
%
98.9 
%
98.3 
%
97.1 
%
Underlying combined ratio
90.7 
%
91.5 
%
90.8 
%
91.6 
%

International
Results for the Three Months Ended September 30
Results for the Nine Months Ended September 30
2024
2023
2024
2023
Loss ratio
62.5 
%
60.2 
%
60.6 
%
62.2 
%
Effect of catastrophe impacts
(5.1) (2.3) (3.0) (2.7)
Effect of development-related items
0.7  —  0.5  (1.7)
Underlying loss ratio
58.1 
%
57.9 
%
58.1 
%
57.8 
%
Combined ratio
96.1 
%
88.3 
%
93.7 
%
92.5 
%
Underlying combined ratio
91.7 
%
86.0 
%
91.2 
%
88.1 
%


cnalogoq42019b.jpg                                                 11


Property & Casualty
Results for the Three Months Ended September 30
Results for the Nine Months Ended September 30
2024
2023
2024
2023
Loss ratio
66.7 
%
63.9 
%
64.9 
%
63.1 
%
Effect of catastrophe impacts
(5.8) (4.1) (4.3) (3.2)
Effect of development-related items
0.2  0.2  0.2  — 
Underlying loss ratio
61.1 
%
60.0 
%
60.8 
%
59.9 
%
Combined ratio
97.2 
%
94.3 
%
95.6 
%
94.0 
%
Underlying combined ratio
91.6 
%
90.4 
%
91.5 
%
90.8 
%

Reconciliation of Book Value per Share to Book Value per Share Excluding AOCI
Book value per share excluding accumulated other comprehensive income (loss) (AOCI) allows management and investors to analyze the amount of the Company's net worth primarily attributable to the Company's business operations. The Company believes this measurement is useful as it reduces the effect of items that can fluctuate significantly from period to period, primarily based on changes in interest rates.
September 30, 2024 December 31, 2023
Book value per share $ 39.72  $ 36.52 
Less: Per share impact of AOCI (6.78) (9.87)
Book value per share excluding AOCI $ 46.50  $ 46.39 
Calculation of Return on Equity and Core Return on Equity
Core return on equity provides management and investors with a measure of how effectively the Company is investing the portion of the Company's net worth that is primarily attributable to its business operations.
Results for the Three Months Ended September 30 Results for the Nine Months Ended September 30
($ millions) 2024 2023 2024 2023
Annualized net income $ 1,132  $ 1,033  $ 1,251  $ 1,118 
Average stockholders' equity including AOCI (a)
10,316 8,644 10,326 8,555
Return on equity 11.0  % 11.9  % 12.1  % 13.1  %
Annualized core income $ 1,176  $ 1,154  $ 1,299  $ 1,229 
Average stockholders' equity excluding AOCI (a)
12,508 12,228 12,580 12,225
Core return on equity 9.4  % 9.4  % 10.3  % 10.1  %
(a)Average stockholders' equity is calculated using a simple average of the beginning and ending balances for the period.

cnalogoq42019b.jpg                                                 12


For additional information, please refer to CNA's filings with the Securities and Exchange Commission available at www.cna.com.
Forward-Looking Statements
These earnings remarks include statements that relate to anticipated future events (forward-looking statements) rather than actual present conditions or historical events. These statements are made pursuant to the safe harbor provisions of the Private Securities Litigation Reform Act of 1995 and generally include words such as “believes,” “expects,” “intends,” “anticipates,” “estimates” and similar expressions. Forward-looking statements, by their nature, are subject to a variety of inherent risks and uncertainties that could cause actual results to differ materially from the results projected. Many of these risks and uncertainties cannot be controlled by CNA. For a detailed description of these risks and uncertainties, please refer to CNA’s filings with the Securities and Exchange Commission, available at www.cna.com.
Any forward-looking statements made in these earnings remarks are made by CNA as of the date of these remarks. Further, CNA does not have any obligation to update or revise any forward-looking statement contained in these remarks, even if CNA’s expectations or any related events, conditions or circumstances change.


cnalogoq42019b.jpg                                                 13