| For the fiscal year ended | Commission file | |||||||||||||
| December 31, 2023 | number | 1-5805 | ||||||||||||
| Delaware | 13-2624428 | ||||||||||
| (State or other jurisdiction of incorporation or organization) |
(I.R.S. employer identification no.) |
||||||||||
| 383 Madison Avenue, | |||||||||||
| New York, | New York | 10179 | |||||||||
| (Address of principal executive offices) | (Zip Code) | ||||||||||
| Title of each class | Trading Symbol(s) | Name of each exchange on which registered | ||||||
| Common stock | JPM | The New York Stock Exchange | ||||||
Depositary Shares, each representing a one-four hundredth interest in a share of 5.75% Non-Cumulative Preferred Stock, Series DD |
JPM PR D | The New York Stock Exchange | ||||||
Depositary Shares, each representing a one-four hundredth interest in a share of 6.00% Non-Cumulative Preferred Stock, Series EE |
JPM PR C | The New York Stock Exchange | ||||||
| Depositary Shares, each representing a one-four hundredth interest in a share of 4.75% Non-Cumulative Preferred Stock, Series GG | JPM PR J | The New York Stock Exchange | ||||||
| Depositary Shares, each representing a one-four hundredth interest in a share of 4.55% Non-Cumulative Preferred Stock, Series JJ | JPM PR K | The New York Stock Exchange | ||||||
| Depositary Shares, each representing a one-four hundredth interest in a share of 4.625% Non-Cumulative Preferred Stock, Series LL | JPM PR L | The New York Stock Exchange | ||||||
| Depositary Shares, each representing a one-four hundredth interest in a share of 4.20% Non-Cumulative Preferred Stock, Series MM | JPM PR M | The New York Stock Exchange | ||||||
| Alerian MLP Index ETNs due May 24, 2024 | AMJ | NYSE Arca, Inc. | ||||||
| Guarantee of Callable Fixed Rate Notes due June 10, 2032 of JPMorgan Chase Financial Company LLC | JPM/32 | The New York Stock Exchange | ||||||
Guarantee of Alerian MLP Index ETNs due January 28, 2044 of JPMorgan Chase Financial Company LLC |
AMJB |
NYSE Arca, Inc. |
||||||
☒ |
Large accelerated filer | ☐ |
Accelerated filer |
☐
|
Non-accelerated filer | ☐ | Smaller reporting company | ☐ | Emerging growth company | ||||||||||||||||||||
| Page | ||||||||
| 1 | ||||||||
| 1 | ||||||||
| 1 | ||||||||
| 1 | ||||||||
| 2-3 | ||||||||
| 4-8 | ||||||||
| 310-314 | ||||||||
| 46, 170, 310 | ||||||||
| 227 | ||||||||
| 113-130, 235-254 | ||||||||
| 131-133, 255-260 | ||||||||
| 274 | ||||||||
| 9-33 | ||||||||
| 34 | ||||||||
| 34 | ||||||||
| 34 | ||||||||
| 34 | ||||||||
| 35 | ||||||||
| 35 | ||||||||
| 35 | ||||||||
| 35 | ||||||||
| 36 | ||||||||
| 36 | ||||||||
| 36 | ||||||||
| 37 | ||||||||
| 37 | ||||||||
| 38 | ||||||||
| 39 | ||||||||
| 39 | ||||||||
| 39 | ||||||||
| 39 | ||||||||
| 40-43 | ||||||||
1 |
||||||||
| Employee Breakdown by Region | Employee Breakdown by LOB and Corporate | |||||||||||||||||||
| Region | Employees | LOB | Employees | |||||||||||||||||
| North America | 186,751 | CCB | 141,640 | |||||||||||||||||
| Asia-Pacific | 88,406 | CIB | 74,404 | |||||||||||||||||
| Europe/Middle East/Africa | 29,583 | CB | 17,867 | |||||||||||||||||
| Latin America/Caribbean | 5,186 | AWM | 28,485 | |||||||||||||||||
| Total Firm | 309,926 | Corporate | 47,530 | |||||||||||||||||
| Total Firm | 309,926 | |||||||||||||||||||
| December 31, 2023 | Total employees |
Senior level employees(e) |
Operating Committee | Board of Directors(f) |
|||||||||||||||||||||||||
Race/Ethnicity(a): |
|||||||||||||||||||||||||||||
| White | 43 | % | 75 | % | 88 | % | 82 | % | |||||||||||||||||||||
| Hispanic | 21 | % | 6 | % | 6 | % | — | ||||||||||||||||||||||
| Asian | 19 | % | 13 | % | 6 | % | — | ||||||||||||||||||||||
| Black | 14 | % | 5 | % | — | 18 | % | ||||||||||||||||||||||
Other(b) |
3 | % | 1 | % | — | — | |||||||||||||||||||||||
Gender(c): |
|||||||||||||||||||||||||||||
| Men | 51 | % | 72 | % | 59 | % | 55 | % | |||||||||||||||||||||
| Women | 49 | % | 28 | % | 41 | % | 45 | % | |||||||||||||||||||||
LGBTQ+(d) |
4 | % | 3 | % | 6 | % | — | ||||||||||||||||||||||
Military veterans(d) |
3 | % | 2 | % | — | 9 | % | ||||||||||||||||||||||
People with disabilities(d) |
4 | % | 3 | % | — | — | (g) |
||||||||||||||||||||||
2 |
||||||||
3 |
||||||||
4 |
||||||||
5 |
||||||||
6 |
||||||||
7 |
||||||||
8 |
||||||||
9 |
||||||||
10 |
||||||||
11 |
||||||||
12 |
||||||||
13 |
||||||||
14 |
||||||||
15 |
||||||||
16 |
||||||||
17 |
||||||||
18 |
||||||||
19 |
||||||||
20 |
||||||||
21 |
||||||||
22 |
||||||||
23 |
||||||||
24 |
||||||||
25 |
||||||||
26 |
||||||||
27 |
||||||||
28 |
||||||||
29 |
||||||||
30 |
||||||||
31 |
||||||||
32 |
||||||||
33 |
||||||||
| December 31, 2023 (in millions) |
Approximate square footage | ||||
United States(a) |
|||||
New York City, New York |
|||||
383 Madison Avenue, New York, New York |
1.1 | ||||
All other New York City locations |
5.9 | ||||
Total New York City, New York |
7.0 | ||||
Other U.S. locations |
|||||
Columbus/Westerville, Ohio |
3.5 | ||||
Chicago, Illinois |
2.7 | ||||
Dallas/Plano/Fort Worth, Texas |
2.5 | ||||
Wilmington/Newark, Delaware |
2.2 | ||||
Houston, Texas |
1.6 | ||||
Jersey City, New Jersey |
1.4 | ||||
Phoenix/Tempe, Arizona |
1.3 | ||||
All other U.S. locations |
34.5 | ||||
Total United States |
56.7 | ||||
Europe, the Middle East and Africa (“EMEA”) |
|||||
25 Bank Street, London, U.K. |
1.4 | ||||
All other U.K. locations |
2.4 | ||||
All other EMEA locations |
1.5 | ||||
Total EMEA |
5.3 | ||||
Asia-Pacific, Latin America and Canada |
|||||
India |
5.8 | ||||
| Philippines | 1.7 | ||||
All other locations |
2.8 | ||||
Total Asia-Pacific, Latin America and Canada |
10.3 | ||||
Total |
72.3 | ||||
34 |
||||||||
| Year ended December 31, 2023 | Total number of shares of common stock repurchased |
Average price paid per share of common stock(a) |
Aggregate purchase price of common stock repurchases
(in millions)(a)
|
Dollar value
of remaining
authorized
repurchase
(in millions)(a)(b)
|
|||||||||||||||||||||||||
| First quarter | 21,995,253 | $ | 133.67 | $ | 2,940 | $ | 26,693 | ||||||||||||||||||||||
| Second quarter | 16,711,299 | 137.20 | 2,293 | 24,400 | |||||||||||||||||||||||||
| Third quarter | 15,608,838 | 151.46 | 2,364 | 22,036 | |||||||||||||||||||||||||
| October | 5,533,418 | 143.44 | 794 | 21,242 | |||||||||||||||||||||||||
| November | 5,173,068 | 148.50 | 768 | 20,474 | |||||||||||||||||||||||||
| December | 4,527,383 | 163.15 | 739 | 19,735 | |||||||||||||||||||||||||
| Fourth quarter | 15,233,869 | 151.02 | 2,301 | 19,735 | |||||||||||||||||||||||||
Full year |
69,549,259 | $ | 142.31 | $ | 9,898 | $ | 19,735 | ||||||||||||||||||||||
35 |
||||||||
36 |
||||||||
| Name | Title | Adoption date | Duration(b) |
Aggregate number of shares to be sold |
||||||||||
| Lori Beer | Chief Information Officer | November 13, 2023 | November 13, 2023 - May 17, 2024 | 7,840 | ||||||||||
James Dimon(a) |
Chairman and CEO | October 26, 2023 | October 26, 2023 - August 23, 2024 | 1,000,000 | ||||||||||
| Stacey Friedman | General Counsel | November 7, 2023 | November 7, 2023 - May 17, 2024 | 6,030 | ||||||||||
37 |
||||||||
| Age | ||||||||
| Name | (at December 31, 2023) | Positions and offices | ||||||
| James Dimon | 67 | Chairman of the Board since December 2006 and Chief Executive Officer since December 2005. |
||||||
| Ashley Bacon | 54 | Chief Risk Officer since June 2013. | ||||||
| Jeremy Barnum | 51 | Chief Financial Officer since May 2021, prior to which he was Head of Global Research for the Corporate & Investment Bank since February 2021. He previously served as Chief Financial Officer of the Corporate & Investment Bank from July 2013 until February 2021. |
||||||
| Lori A. Beer | 56 | Chief Information Officer since September 2017. |
||||||
| Mary Callahan Erdoes | 56 | Chief Executive Officer of Asset & Wealth Management since September 2009. | ||||||
| Stacey Friedman | 55 | General Counsel since January 2016. |
||||||
Marianne Lake(a) |
54 | Co-Chief Executive Officer of Consumer & Community Banking since May 2021, prior to which she had been Chief Executive Officer of Consumer Lending since May 2019. She was Chief Financial Officer from January 2013 until May 2019. |
||||||
| Robin Leopold | 59 | Head of Human Resources since January 2018. |
||||||
Douglas B. Petno |
58 | Chief Executive Officer of Commercial Banking since January 2012. | ||||||
Jennifer A. Piepszak(a) |
53 | Co-Chief Executive Officer of Consumer & Community Banking since May 2021, prior to which she had been Chief Financial Officer since May 2019. She previously served as Chief Executive Officer for Card Services from February 2017 until May 2019. |
||||||
Daniel E. Pinto(a) |
61 | President and Chief Operating Officer since January 2022 and Chief Executive Officer of the Corporate & Investment Bank since March 2014, having previously served as Co-President and Co-Chief Operating Officer since January 2018. |
||||||
| Peter L. Scher |
62 | Vice Chairman since March 2021. He previously served as Chairman of the Mid-Atlantic Region from February 2015 until December 2022 and Head of Corporate Responsibility from April 2011 until September 2021. |
||||||
38 |
||||||||
| December 31, 2023 | Number of shares to be issued upon exercise of outstanding options/stock appreciation rights | Weighted-average exercise price of outstanding options/stock appreciation rights |
Number of shares remaining available for future issuance under stock incentive plans | |||||||||||||||||||||||
| Plan category | ||||||||||||||||||||||||||
| Employee share-based incentive plans approved by shareholders | 2,250,000 | (a) |
$ | 152.19 | 53,807,804 | (b) |
||||||||||||||||||||
| Total | 2,250,000 | $ | 152.19 | 53,807,804 | ||||||||||||||||||||||
39 |
||||||||
| 1 | Financial statements | |||||||
| The Consolidated Financial Statements, the Notes thereto and the report of the Independent Registered Public Accounting Firm thereon listed in Item 8 are set forth commencing on page 156. | ||||||||
| 2 | Financial statement schedules | |||||||
| 3 | Exhibits | |||||||
| 3.1 | ||||||||
| 3.2 | ||||||||
| 3.3 | ||||||||
| 3.4 | ||||||||
| 3.5 | ||||||||
| 3.6 | ||||||||
| 3.7 | ||||||||
| 3.8 | ||||||||
| 3.9 |
|
|||||||
| 3.10 |
|
|||||||
| 3.11 | ||||||||
| 3.12 | ||||||||
| 3.13 | ||||||||
| 3.14 | ||||||||
| 3.15 | ||||||||
| 3.16 | ||||||||
| 3.17 | ||||||||
40 |
||||||||
| 3.18 | ||||||||
| 3.19 | ||||||||
| 4.1(a) | ||||||||
| 4.1(b) | ||||||||
| 4.2(a) | ||||||||
| 4.2(b) | ||||||||
| 4.3(a) | ||||||||
| 4.3(b) | ||||||||
| 4.4 | ||||||||
| 4.5 | ||||||||
| 4.6 | ||||||||
| Other instruments defining the rights of holders of long-term debt securities of JPMorgan Chase & Co. and its subsidiaries are omitted pursuant to Section (b)(4)(iii)(A) of Item 601 of Regulation S-K. JPMorgan Chase & Co. agrees to furnish copies of these instruments to the SEC upon request. | ||||||||
| 10.1 |
Deferred Compensation Plan for Non-Employee Directors of JPMorgan Chase & Co., as amended and restated July 2001 and as of December 31, 2004 (incorporated by reference to Exhibit 10.1 to the Annual Report on Form 10-K of JPMorgan Chase & Co. (File No. 1-5805) for the year ended December 31, 2007).(a)
|
|||||||
| 10.2 | ||||||||
| 10.3 | ||||||||
| 10.4 | ||||||||
| 10.5 | ||||||||
41 |
||||||||
42 |
||||||||
| 10.20 | ||||||||
| 10.21 | ||||||||
| 21 | ||||||||
| 22.1 | Annual Report on Form 11-K of The JPMorgan Chase 401(k) Savings Plan for the year ended December 31, 2023 (to be filed pursuant to Rule 15d-21 under the Securities Exchange Act of 1934). |
|||||||
| 22.2 | ||||||||
| 23 | ||||||||
| 31.1 | ||||||||
| 31.2 | ||||||||
| 32 | ||||||||
| 97 | ||||||||
| 101.INS | The instance document does not appear in the interactive data file because its XBRL tags are embedded within the Inline XBRL document.(d) |
|||||||
| 101.SCH |
XBRL Taxonomy Extension Schema
Document.(b)
|
|||||||
| 101.CAL | XBRL Taxonomy Extension Calculation Linkbase Document.(b) |
|||||||
| 101.DEF | XBRL Taxonomy Extension Definition Linkbase Document.(b) |
|||||||
| 101.LAB | XBRL Taxonomy Extension Label Linkbase Document.(b) |
|||||||
| 101.PRE | XBRL Taxonomy Extension Presentation Linkbase Document.(b) |
|||||||
| 104 | Cover Page Interactive Data File (embedded within the Inline XBRL document and included in Exhibit 101). |
|||||||
43 |
||||||||
44 |
||||||||
| Financial: | Audited financial statements: | |||||||||||||||||||
| 46 | 162 | |||||||||||||||||||
| 47 | 163 | |||||||||||||||||||
| Management’s discussion and analysis: | 166 | |||||||||||||||||||
| 48 | 171 | |||||||||||||||||||
| 49 | ||||||||||||||||||||
| 54 | ||||||||||||||||||||
| 58 | Supplementary information: | |||||||||||||||||||
| 62 | 310 | |||||||||||||||||||
| 65 | 315 | |||||||||||||||||||
| 86 | ||||||||||||||||||||
| 90 | ||||||||||||||||||||
| 91 | ||||||||||||||||||||
| 102 | ||||||||||||||||||||
| 111 | ||||||||||||||||||||
| 135 | ||||||||||||||||||||
| 144 | ||||||||||||||||||||
| 146 | ||||||||||||||||||||
| 147 | ||||||||||||||||||||
| 155 | ||||||||||||||||||||
| 159 | ||||||||||||||||||||
| 161 | ||||||||||||||||||||
JPMorgan Chase & Co./2023 Form 10-K |
45 |
|||||||
|
As of or for the year ended December 31,
(in millions, except per share, ratio, employee data and where otherwise noted)
|
|||||||||||||||||||||||
| 2023 | 2022 | 2021 | |||||||||||||||||||||
| Selected income statement data | |||||||||||||||||||||||
| Total net revenue | $ | 158,104 | $ | 128,695 | $ | 121,649 | |||||||||||||||||
| Total noninterest expense | 87,172 | 76,140 | 71,343 | ||||||||||||||||||||
Pre-provision profit(a) |
70,932 | 52,555 | 50,306 | ||||||||||||||||||||
| Provision for credit losses | 9,320 | 6,389 | (9,256) | ||||||||||||||||||||
| Income before income tax expense | 61,612 | 46,166 | 59,562 | ||||||||||||||||||||
| Income tax expense | 12,060 | 8,490 | 11,228 | ||||||||||||||||||||
| Net income | $ | 49,552 | $ | 37,676 | $ | 48,334 | |||||||||||||||||
| Earnings per share data | |||||||||||||||||||||||
| Net income: Basic | $ | 16.25 | $ | 12.10 | $ | 15.39 | |||||||||||||||||
| Diluted | 16.23 | 12.09 | 15.36 | ||||||||||||||||||||
| Average shares: Basic | 2,938.6 | 2,965.8 | 3,021.5 | ||||||||||||||||||||
| Diluted | 2,943.1 | 2,970.0 | 3,026.6 | ||||||||||||||||||||
| Market and per common share data | |||||||||||||||||||||||
| Market capitalization | 489,320 | 393,484 | 466,206 | ||||||||||||||||||||
| Common shares at period-end | 2,876.6 | 2,934.2 | 2,944.1 | ||||||||||||||||||||
| Book value per share | 104.45 | 90.29 | 88.07 | ||||||||||||||||||||
Tangible book value per share (“TBVPS”)(a) |
86.08 | 73.12 | 71.53 | ||||||||||||||||||||
| Cash dividends declared per share | 4.10 | 4.00 | 3.80 | ||||||||||||||||||||
| Selected ratios and metrics | |||||||||||||||||||||||
Return on common equity (“ROE”) |
17 | % | 14 | % | 19 | % | |||||||||||||||||
Return on tangible common equity (“ROTCE”)(a) |
21 | 18 | 23 | ||||||||||||||||||||
Return on assets (“ROA”) |
1.30 | 0.98 | 1.30 | ||||||||||||||||||||
| Overhead ratio | 55 | 59 | 59 | ||||||||||||||||||||
| Loans-to-deposits ratio | 55 | 49 | 44 | ||||||||||||||||||||
Firm Liquidity coverage ratio (“LCR”) (average)(b) |
113 | 112 | 111 | ||||||||||||||||||||
JPMorgan Chase Bank, N.A. LCR (average)(b) |
129 | 151 | 178 | ||||||||||||||||||||
Common equity Tier 1 (“CET1”) capital ratio(c)(d) |
15.0 | 13.2 | 13.1 | ||||||||||||||||||||
Tier 1 capital ratio(c)(d) |
16.6 | 14.9 | 15.0 | ||||||||||||||||||||
Total capital ratio(c)(d) |
18.5 | 16.8 | 16.8 | ||||||||||||||||||||
Tier 1 leverage ratio(b)(c) |
7.2 | 6.6 | 6.5 | ||||||||||||||||||||
Supplementary leverage ratio (“SLR”)(b)(c) |
6.1 | 5.6 | 5.4 | ||||||||||||||||||||
Selected balance sheet data (period-end) |
|||||||||||||||||||||||
| Trading assets | $ | 540,607 | $ | 453,799 | $ | 433,575 | |||||||||||||||||
| Investment securities, net of allowance for credit losses | 571,552 | 631,162 | 672,232 | ||||||||||||||||||||
| Loans | 1,323,706 | 1,135,647 | 1,077,714 | ||||||||||||||||||||
| Total assets | 3,875,393 | 3,665,743 | 3,743,567 | ||||||||||||||||||||
| Deposits | 2,400,688 | 2,340,179 | 2,462,303 | ||||||||||||||||||||
| Long-term debt | 391,825 | 295,865 | 301,005 | ||||||||||||||||||||
| Common stockholders’ equity | 300,474 | 264,928 | 259,289 | ||||||||||||||||||||
| Total stockholders’ equity | 327,878 | 292,332 | 294,127 | ||||||||||||||||||||
Employees(e) |
309,926 | (f) |
293,723 | 271,025 | |||||||||||||||||||
| Credit quality metrics | |||||||||||||||||||||||
| Allowances for credit losses | $ | 24,765 | $ | 22,204 | $ | 18,689 | |||||||||||||||||
| Allowance for loan losses to total retained loans | 1.75 | % | 1.81 | % | 1.62 | % | |||||||||||||||||
| Nonperforming assets | $ | 7,597 | $ | 7,247 | $ | 8,346 | |||||||||||||||||
| Net charge-offs | 6,209 | 2,853 | 2,865 | ||||||||||||||||||||
| Net charge-off rate | 0.52 | % | 0.27 | % | 0.30 | % | |||||||||||||||||
46 |
JPMorgan Chase & Co./2023 Form 10-K |
|||||||
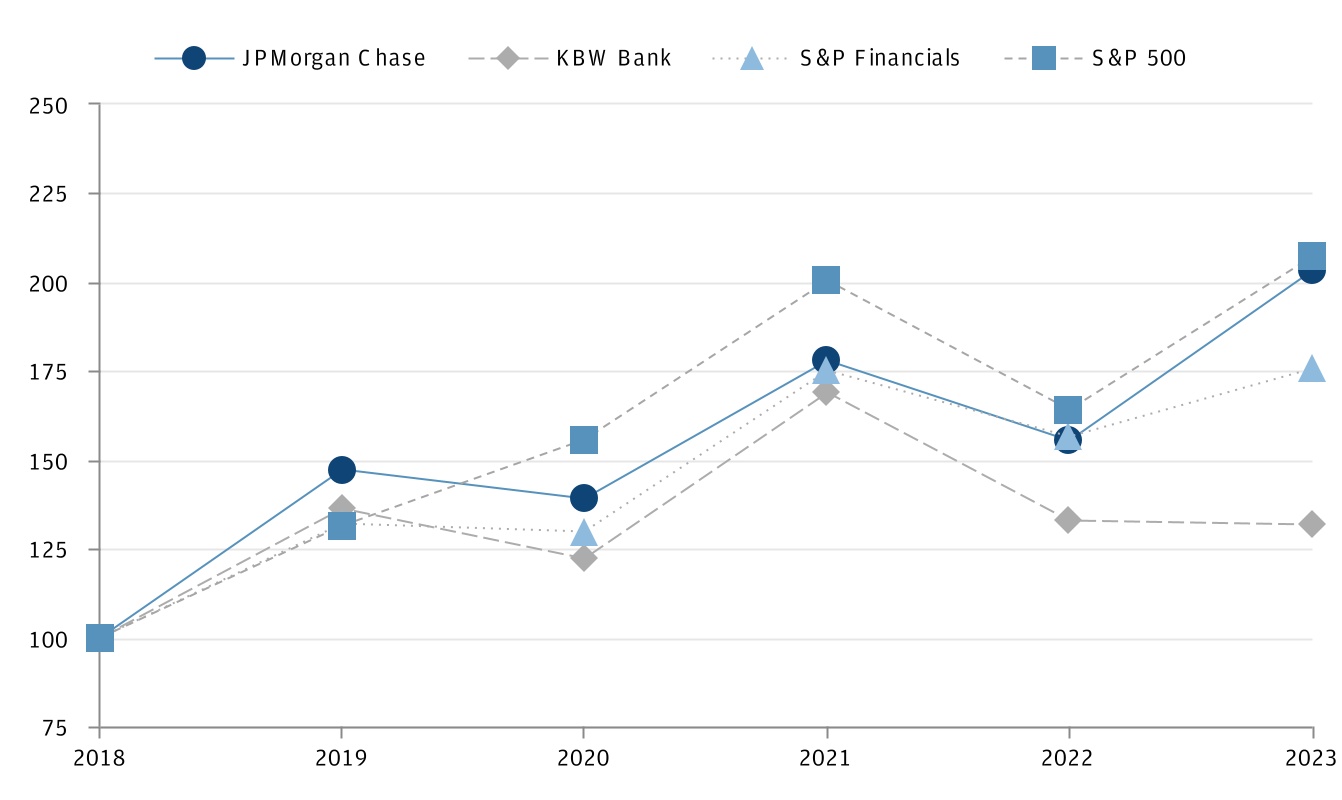
| December 31, (in dollars) |
2018 | 2019 | 2020 | 2021 | 2022 | 2023 | |||||||||||||||||||||||||||||
| JPMorgan Chase | $ | 100.00 | $ | 147.27 | $ | 139.14 | $ | 177.72 | $ | 155.33 | $ | 203.09 | |||||||||||||||||||||||
| KBW Bank Index | 100.00 | 136.12 | 122.09 | 168.90 | 132.76 | 131.58 | |||||||||||||||||||||||||||||
| S&P Financials Index | 100.00 | 132.09 | 129.77 | 175.02 | 156.59 | 175.61 | |||||||||||||||||||||||||||||
| S&P 500 Index | 100.00 | 131.48 | 155.65 | 200.29 | 164.02 | 207.13 | |||||||||||||||||||||||||||||
JPMorgan Chase & Co./2023 Form 10-K |
47 |
|||||||
| INTRODUCTION | ||||||||||||||
48 |
JPMorgan Chase & Co./2023 Form 10-K |
|||||||
| EXECUTIVE OVERVIEW | ||||||||||||||
| Financial performance of JPMorgan Chase | ||||||||||||||
| Year ended December 31, (in millions, except per share data and ratios) |
||||||||||||||
| 2023 | 2022 | Change | ||||||||||||
| Selected income statement data | ||||||||||||||
| Noninterest revenue | $ | 68,837 | $ | 61,985 | 11% | |||||||||
| Net interest income | 89,267 | 66,710 | 34 | |||||||||||
| Total net revenue | 158,104 | 128,695 | 23 | |||||||||||
| Total noninterest expense | 87,172 | 76,140 | 14 | |||||||||||
| Pre-provision profit | 70,932 | 52,555 | 35 | |||||||||||
| Provision for credit losses | 9,320 | 6,389 | 46 | |||||||||||
| Net income | 49,552 | 37,676 | 32 | |||||||||||
| Diluted earnings per share | 16.23 | 12.09 | 34 | |||||||||||
| Selected ratios and metrics | ||||||||||||||
| Return on common equity | 17 | % | 14 | % | ||||||||||
Return on tangible common equity |
21 | 18 | ||||||||||||
| Book value per share | $ | 104.45 | $ | 90.29 | 16 | |||||||||
| Tangible book value per share | 86.08 | 73.12 | 18 | |||||||||||
Capital ratios(a)(b) |
||||||||||||||
| CET1 capital | 15.0 | % | 13.2 | % | ||||||||||
| Tier 1 capital | 16.6 | 14.9 | ||||||||||||
Total capital |
18.5 | 16.8 | ||||||||||||
| Memo: | ||||||||||||||
NII excluding Markets(c) |
$ | 90,041 | $ | 62,355 | 44 | |||||||||
NIR excluding Markets(c) |
44,533 | 40,938 | 9 | |||||||||||
Markets(c) |
27,792 | 28,984 | (4) | |||||||||||
| Total net revenue - managed basis | $ | 162,366 | $ | 132,277 | 23 | |||||||||
JPMorgan Chase & Co./2023 Form 10-K |
49 |
|||||||
50 |
JPMorgan Chase & Co./2023 Form 10-K |
|||||||
|
CCB
ROE 38%
|
•Average deposits down 3%; client investment assets up 47%, or up 25% excluding First Republic
•Average loans up 20%, or up 6% excluding First Republic; Card Services net charge-off rate of 2.45%
•Debit and credit card sales volume(a) up 8%
•Active mobile customers(b) up 8%
|
|||||||
|
CIB
ROE 13%
|
•#1 ranking for Global Investment Banking fees with 8.8% wallet share for the year
•Total Markets revenue of $27.8 billion, down 4%, with Fixed Income Markets up 1% and Equity Markets down 13%
|
|||||||
|
CB
ROE 20%
|
•Gross Investment Banking and Markets revenue of $3.4 billion, up 14%
•Average loans up 20%, or up 8% excluding First Republic; average deposits down 9%
|
|||||||
|
AWM
ROE 31%
|
•Assets under management (“AUM”) of $3.4 trillion, up 24%
•Average loans up 2%, or down 2% excluding First Republic; average deposits down 17%
|
|||||||
$2.3 trillion |
Total credit provided and capital raised (including loans and commitments) |
|||||||
|
$239
billion
|
Credit for consumers |
|||||||
|
$36
billion
|
Credit for U.S. small businesses |
|||||||
$1.0 trillion |
Credit for corporations |
|||||||
$915 billion |
Capital for corporate clients and non-U.S. government entities |
|||||||
|
$47
billion
|
Credit and capital for nonprofit and U.S. government entities(a) |
|||||||
JPMorgan Chase & Co./2023 Form 10-K |
51 |
|||||||
52 |
JPMorgan Chase & Co./2023 Form 10-K |
|||||||
JPMorgan Chase & Co./2023 Form 10-K |
53 |
|||||||
| CONSOLIDATED RESULTS OF OPERATIONS | ||||||||||||||
| Revenue | ||||||||||||||
| Year ended December 31, (in millions) |
||||||||||||||
| 2023 | 2022 | 2021 | ||||||||||||
| Investment banking fees | $ | 6,519 | $ | 6,686 | $ | 13,216 | ||||||||
| Principal transactions | 24,460 | 19,912 | 16,304 | |||||||||||
| Lending- and deposit-related fees | 7,413 | 7,098 | 7,032 | |||||||||||
| Asset management fees | 15,220 | 14,096 | 14,405 | |||||||||||
| Commissions and other fees | 6,836 | 6,581 | 6,624 | |||||||||||
Investment securities losses |
(3,180) | (2,380) | (345) | |||||||||||
Mortgage fees and related income |
1,176 | 1,250 | 2,170 | |||||||||||
| Card income | 4,784 | 4,420 | 5,102 | |||||||||||
Other income(a) |
5,609 | (b) |
4,322 | 4,830 | ||||||||||
| Noninterest revenue | 68,837 | 61,985 | 69,338 | |||||||||||
| Net interest income | 89,267 | 66,710 | 52,311 | |||||||||||
| Total net revenue | $ | 158,104 | $ | 128,695 | $ | 121,649 | ||||||||
54 |
JPMorgan Chase & Co./2023 Form 10-K |
|||||||
JPMorgan Chase & Co./2023 Form 10-K |
55 |
|||||||
| Provision for credit losses | |||||||||||||||||
| Year ended December 31, | |||||||||||||||||
| (in millions) | 2023 | 2022 | 2021 | ||||||||||||||
Consumer, excluding credit card |
$ | 935 | $ | 506 | $ | (1,933) | |||||||||||
| Credit card | 6,048 | 3,353 | (4,838) | ||||||||||||||
| Total consumer | 6,983 | 3,859 | (6,771) | ||||||||||||||
| Wholesale | 2,299 | 2,476 | (2,449) | ||||||||||||||
| Investment securities | 38 | 54 | (36) | ||||||||||||||
Total provision for credit losses |
$ | 9,320 | $ | 6,389 | $ | (9,256) | |||||||||||
56 |
JPMorgan Chase & Co./2023 Form 10-K |
|||||||
| Noninterest expense | |||||||||||
| Year ended December 31, | |||||||||||
| (in millions) | 2023 | 2022 | 2021 | ||||||||
Compensation expense |
$ | 46,465 | $ | 41,636 | $ | 38,567 | |||||
Noncompensation expense: |
|||||||||||
| Occupancy | 4,590 | 4,696 | 4,516 | ||||||||
Technology, communications and equipment(a) |
9,246 | 9,358 | 9,941 | ||||||||
Professional and outside services |
10,235 | 10,174 | 9,814 | ||||||||
| Marketing | 4,591 | 3,911 | 3,036 | ||||||||
Other(b) |
12,045 | 6,365 | 5,469 | ||||||||
Total noncompensation expense(c) |
40,707 | 34,504 | 32,776 | ||||||||
Total noninterest expense |
$ | 87,172 | $ | 76,140 | $ | 71,343 | |||||
| Income tax expense | |||||||||||||||||
| Year ended December 31, (in millions, except rate) |
|||||||||||||||||
| 2023 | 2022 | 2021 | |||||||||||||||
Income before income tax expense |
$ | 61,612 | $ | 46,166 | $ | 59,562 | |||||||||||
| Income tax expense | 12,060 | 8,490 | 11,228 | ||||||||||||||
| Effective tax rate | 19.6 | % | 18.4 | % | 18.9 | % | |||||||||||
JPMorgan Chase & Co./2023 Form 10-K |
57 |
|||||||
| CONSOLIDATED BALANCE SHEETS AND CASH FLOWS ANALYSIS | ||||||||||||||
| Selected Consolidated balance sheets data | ||||||||||||||
| December 31, (in millions) | 2023 | 2022 | Change | |||||||||||
| Assets | ||||||||||||||
| Cash and due from banks | $ | 29,066 | $ | 27,697 | 5 | % | ||||||||
| Deposits with banks | 595,085 | 539,537 | 10 | |||||||||||
Federal funds sold and securities purchased under resale agreements |
276,152 | 315,592 | (12) | |||||||||||
| Securities borrowed | 200,436 | 185,369 | 8 | |||||||||||
| Trading assets | 540,607 | 453,799 | 19 | |||||||||||
| Available-for-sale securities | 201,704 | 205,857 | (2) | |||||||||||
| Held-to-maturity securities | 369,848 | 425,305 | (13) | |||||||||||
| Investment securities, net of allowance for credit losses | 571,552 | 631,162 | (9) | |||||||||||
| Loans | 1,323,706 | 1,135,647 | 17 | |||||||||||
| Allowance for loan losses | (22,420) | (19,726) | 14 | |||||||||||
| Loans, net of allowance for loan losses | 1,301,286 | 1,115,921 | 17 | |||||||||||
Accrued interest and accounts receivable |
107,363 | 125,189 | (14) | |||||||||||
| Premises and equipment | 30,157 | 27,734 | 9 | |||||||||||
| Goodwill, MSRs and other intangible assets | 64,381 | 60,859 | 6 | |||||||||||
| Other assets | 159,308 | 182,884 | (13) | |||||||||||
| Total assets | $ | 3,875,393 | $ | 3,665,743 | 6 | % | ||||||||
58 |
JPMorgan Chase & Co./2023 Form 10-K |
|||||||
| Selected Consolidated balance sheets data | ||||||||||||||
| December 31, (in millions) | 2023 | 2022 | Change | |||||||||||
| Liabilities | ||||||||||||||
| Deposits | $ | 2,400,688 | $ | 2,340,179 | 3 | |||||||||
Federal funds purchased and securities loaned or sold under repurchase agreements |
216,535 | 202,613 | 7 | |||||||||||
| Short-term borrowings | 44,712 | 44,027 | 2 | |||||||||||
| Trading liabilities | 180,428 | 177,976 | 1 | |||||||||||
| Accounts payable and other liabilities | 290,307 | 300,141 | (3) | |||||||||||
Beneficial interests issued by consolidated variable interest entities (“VIEs”) |
23,020 | 12,610 | 83 | |||||||||||
| Long-term debt | 391,825 | 295,865 | 32 | |||||||||||
| Total liabilities | 3,547,515 | 3,373,411 | 5 | |||||||||||
| Stockholders’ equity | 327,878 | 292,332 | 12 | |||||||||||
Total liabilities and stockholders’ equity |
$ | 3,875,393 | $ | 3,665,743 | 6 | % | ||||||||
JPMorgan Chase & Co./2023 Form 10-K |
59 |
|||||||
60 |
JPMorgan Chase & Co./2023 Form 10-K |
|||||||
| (in millions) | Year ended December 31, | |||||||||||||||||||
| 2023 | 2022 | 2021 | ||||||||||||||||||
Net cash provided by/(used in) |
||||||||||||||||||||
| Operating activities | $ | 12,974 | $ | 107,119 | $ | 78,084 | ||||||||||||||
| Investing activities | 67,643 | (137,819) | (129,344) | |||||||||||||||||
Financing activities |
(25,571) | (126,257) | 275,993 | |||||||||||||||||
Effect of exchange rate changes on cash |
1,871 | (16,643) | (11,508) | |||||||||||||||||
Net increase/(decrease) in cash and due from banks and deposits with banks |
$ | 56,917 | $ | (173,600) | $ | 213,225 | ||||||||||||||
JPMorgan Chase & Co./2023 Form 10-K |
61 |
|||||||
EXPLANATION AND RECONCILIATION OF THE FIRM’S USE OF NON-GAAP FINANCIAL MEASURES | ||
| 2023 | 2022 | 2021 | |||||||||||||||||||||||||||||||||||||||||||||||||||
| Year ended December 31, (in millions, except ratios) |
Reported | Fully taxable-equivalent adjustments(a) |
Managed basis |
Reported | Fully taxable-equivalent adjustments(a) |
Managed basis |
Reported | Fully taxable-equivalent adjustments(a) |
Managed basis |
||||||||||||||||||||||||||||||||||||||||||||
| Other income | $ | 5,609 | $ | 3,782 | $ | 9,391 | $ | 4,322 | $ | 3,148 | $ | 7,470 | $ | 4,830 | $ | 3,225 | $ | 8,055 | |||||||||||||||||||||||||||||||||||
| Total noninterest revenue | 68,837 | 3,782 | 72,619 | 61,985 | 3,148 | 65,133 | 69,338 | 3,225 | 72,563 | ||||||||||||||||||||||||||||||||||||||||||||
| Net interest income | 89,267 | 480 | 89,747 | 66,710 | 434 | 67,144 | 52,311 | 430 | 52,741 | ||||||||||||||||||||||||||||||||||||||||||||
| Total net revenue | 158,104 | 4,262 | 162,366 | 128,695 | 3,582 | 132,277 | 121,649 | 3,655 | 125,304 | ||||||||||||||||||||||||||||||||||||||||||||
| Total noninterest expense | 87,172 | NA | 87,172 | 76,140 | NA | 76,140 | 71,343 | NA | 71,343 | ||||||||||||||||||||||||||||||||||||||||||||
| Pre-provision profit | 70,932 | 4,262 | 75,194 | 52,555 | 3,582 | 56,137 | 50,306 | 3,655 | 53,961 | ||||||||||||||||||||||||||||||||||||||||||||
| Provision for credit losses | 9,320 | NA | 9,320 | 6,389 | NA | 6,389 | (9,256) | NA | (9,256) | ||||||||||||||||||||||||||||||||||||||||||||
| Income before income tax expense | 61,612 | 4,262 | 65,874 | 46,166 | 3,582 | 49,748 | 59,562 | 3,655 | 63,217 | ||||||||||||||||||||||||||||||||||||||||||||
| Income tax expense | 12,060 | 4,262 | 16,322 | 8,490 | 3,582 | 12,072 | 11,228 | 3,655 | 14,883 | ||||||||||||||||||||||||||||||||||||||||||||
| Net income | $ | 49,552 | NA | $ | 49,552 | $ | 37,676 | NA | $ | 37,676 | $ | 48,334 | NA | $ | 48,334 | ||||||||||||||||||||||||||||||||||||||
| Overhead ratio | 55 | % | NM | 54 | % | 59 | % | NM | 58 | % | 59 | % | NM | 57 | % | ||||||||||||||||||||||||||||||||||||||
62 |
JPMorgan Chase & Co./2023 Form 10-K |
|||||||
| Year ended December 31, (in millions, except rates) |
2023 | 2022 | 2021 | ||||||||
| Net interest income – reported | $ | 89,267 | $ | 66,710 | $ | 52,311 | |||||
| Fully taxable-equivalent adjustments | 480 | 434 | 430 | ||||||||
Net interest income – managed basis(a) |
$ | 89,747 | $ | 67,144 | $ | 52,741 | |||||
Less: Markets net interest income(b) |
(294) | 4,789 | 8,243 | ||||||||
Net interest income excluding Markets(a) |
$ | 90,041 | $ | 62,355 | $ | 44,498 | |||||
| Average interest-earning assets | $ | 3,325,708 | $ | 3,349,079 | $ | 3,215,942 | |||||
Less: Average Markets interest-earning assets(b) |
985,777 | 953,195 | 888,238 | ||||||||
| Average interest-earning assets excluding Markets | $ | 2,339,931 | $ | 2,395,884 | $ | 2,327,704 | |||||
| Net yield on average interest-earning assets – managed basis | 2.70 | % | 2.00 | % | 1.64 | % | |||||
Net yield on average Markets interest-earning assets(b) |
(0.03) | 0.50 | 0.93 | ||||||||
| Net yield on average interest-earning assets excluding Markets | 3.85 | % | 2.60 | % | 1.91 | % | |||||
| Noninterest revenue – reported | $ | 68,837 | $ | 61,985 | $ | 69,338 | |||||
| Fully taxable-equivalent adjustments | 3,782 | 3,148 | 3,225 | ||||||||
| Noninterest revenue – managed basis | $ | 72,619 | $ | 65,133 | $ | 72,563 | |||||
Less: Markets noninterest revenue(b) |
28,086 | 24,195 | 19,151 | ||||||||
| Noninterest revenue excluding Markets | $ | 44,533 | $ | 40,938 | $ | 53,412 | |||||
Memo: Total Markets net revenue(b) |
$ | 27,792 | $ | 28,984 | $ | 27,394 | |||||
Calculation of certain U.S. GAAP and non-GAAP financial measures | ||||||||||||||
Certain U.S. GAAP and non-GAAP financial measures are calculated as follows: | ||||||||||||||
|
Book value per share (“BVPS”)
Common stockholders’ equity at period-end /
Common shares at period-end
| ||||||||||||||
|
Overhead ratio
Total noninterest expense / Total net revenue
| ||||||||||||||
|
ROA
Reported net income / Total average assets
| ||||||||||||||
|
ROE
Net income* / Average common stockholders’ equity
| ||||||||||||||
|
ROTCE
Net income* / Average tangible common equity
| ||||||||||||||
|
TBVPS
Tangible common equity at period-end / Common shares at period-end
| ||||||||||||||
* Represents net income applicable to common equity | ||||||||||||||
JPMorgan Chase & Co./2023 Form 10-K |
63 |
|||||||
| Period-end | Average | |||||||||||||||||||
| Dec 31, 2023 |
Dec 31, 2022 |
Year ended December 31, | ||||||||||||||||||
| (in millions, except per share and ratio data) | 2023 | 2022 | 2021 | |||||||||||||||||
Common stockholders’ equity |
$ | 300,474 | $ | 264,928 | $ | 282,056 | $ | 253,068 | $ | 250,968 | ||||||||||
| Less: Goodwill | 52,634 | 51,662 | 52,258 | 50,952 | 49,584 | |||||||||||||||
Less: Other intangible assets |
3,225 | 1,224 | 2,572 | 1,112 | 876 | |||||||||||||||
Add: Certain deferred tax liabilities(a) |
2,996 | 2,510 | 2,883 | 2,505 | 2,474 | |||||||||||||||
| Tangible common equity | $ | 247,611 | $ | 214,552 | $ | 230,109 | $ | 203,509 | $ | 202,982 | ||||||||||
| Return on tangible common equity | NA | NA | 21 | % | 18 | % | 23 | % | ||||||||||||
| Tangible book value per share | $ | 86.08 | $ | 73.12 | NA | NA | NA | |||||||||||||
64 |
JPMorgan Chase & Co./2023 Form 10-K |
|||||||
| BUSINESS SEGMENT RESULTS | ||||||||||||||
JPMorgan Chase (a) | ||||||||||||||||||||||||||||||||||||||
| Consumer Businesses | Wholesale Businesses | |||||||||||||||||||||||||||||||||||||
| Consumer & Community Banking | Corporate & Investment Bank | Commercial Banking | Asset & Wealth Management | |||||||||||||||||||||||||||||||||||
| Banking & Wealth Management |
Home Lending | Card Services & Auto | Banking | Markets & Securities Services |
• Middle Market Banking |
• Asset Management |
||||||||||||||||||||||||||||||||
|
• Consumer Banking
• J.P. Morgan Wealth Management
• Business Banking
|
• Home Lending Production
• Home Lending Servicing
• Real Estate Portfolios
|
• Card Services
• Auto
|
• Investment Banking
• Payments
• Lending
|
• Fixed
Income
Markets
|
• Corporate Client Banking |
• Global Private Bank
|
||||||||||||||||||||||||||||||||
|
• Equity Markets
• Securities Services
• Credit Adjustments & Other
|
• Commercial Real Estate Banking |
|||||||||||||||||||||||||||||||||||||
JPMorgan Chase & Co./2023 Form 10-K |
65 |
|||||||
| Year ended December 31, | Consumer & Community Banking | Corporate & Investment Bank | Commercial Banking | ||||||||||||||||||||||||||||||||||||||
| (in millions, except ratios) | 2023 | 2022 | 2021 | 2023 | 2022 | 2021 | 2023 | 2022 | 2021 | ||||||||||||||||||||||||||||||||
| Total net revenue | $ | 70,148 | $ | 54,814 | (a) |
$ | 49,879 | (a) |
$ | 48,807 | $ | 48,102 | (a) |
$ | 51,943 | (a) |
$ | 15,546 | $ | 11,533 | $ | 10,008 | |||||||||||||||||||
| Total noninterest expense | 34,819 | 31,208 | (a) |
29,028 | (a) |
28,594 | 27,350 | (a) |
25,553 | (a) |
5,378 | 4,719 | 4,041 | ||||||||||||||||||||||||||||
| Pre-provision profit/(loss) | 35,329 | 23,606 | 20,851 | 20,213 | 20,752 | 26,390 | 10,168 | 6,814 | 5,967 | ||||||||||||||||||||||||||||||||
| Provision for credit losses | 6,899 | 3,813 | (6,989) | 121 | 1,158 | (1,174) | 1,970 | 1,268 | (947) | ||||||||||||||||||||||||||||||||
| Net income/(loss) | 21,232 | 14,916 | (a) |
20,957 | (a) |
14,129 | 14,925 | (a) |
21,107 | (a) |
6,143 | 4,213 | 5,246 | ||||||||||||||||||||||||||||
| Return on equity (“ROE”) | 38 | % | 29 | % | 41 | % | 13 | % | 14 | % | 25 | % | 20 | % | 16 | % | 21 | % | |||||||||||||||||||||||
| Year ended December 31, | Asset & Wealth Management | Corporate | Total | ||||||||||||||||||||||||||||||||
| (in millions, except ratios) | 2023 | 2022 | 2021 | 2023 | 2022 | 2021 | 2023 | 2022 | 2021 | ||||||||||||||||||||||||||
| Total net revenue | $ | 19,827 | $ | 17,748 | $ | 16,957 | $ | 8,038 | $ | 80 | $ | (3,483) | $ | 162,366 | $ | 132,277 | $ | 125,304 | |||||||||||||||||
| Total noninterest expense | 12,780 | 11,829 | 10,919 | 5,601 | 1,034 | 1,802 | 87,172 | 76,140 | 71,343 | ||||||||||||||||||||||||||
| Pre-provision profit/(loss) | 7,047 | 5,919 | 6,038 | 2,437 | (954) | (5,285) | 75,194 | 56,137 | 53,961 | ||||||||||||||||||||||||||
| Provision for credit losses | 159 | 128 | (227) | 171 | 22 | 81 | 9,320 | 6,389 | (9,256) | ||||||||||||||||||||||||||
| Net income/(loss) | 5,227 | 4,365 | 4,737 | 2,821 | (743) | (3,713) | 49,552 | 37,676 | 48,334 | ||||||||||||||||||||||||||
| Return on equity (“ROE”) | 31 | % | 25 | % | 33 | % | NM | NM | NM | 17 | % | 14 | % | 19 | % | ||||||||||||||||||||
66 |
JPMorgan Chase & Co./2023 Form 10-K |
|||||||
| Year ended December 31, | 2023 | 2022 | 2021 | |||||||||||
Client assets (in billions)(a) |
$ | 3,177 | (b) |
$ | 2,438 | $ | 2,456 | |||||||
| Number of client advisors | 8,971 | 8,166 | 7,463 | |||||||||||
| (in millions, except where otherwise noted) | |||||||||||
| Year ended December 31, | 2023 | 2022 | 2021 | ||||||||
Total net revenue(a) |
$ | 18,248 | $ | 13,909 | $ | 9,861 | |||||
| Merchant processing volume (in billions) | 2,408 | 2,158 | 1,887 | ||||||||
| Average deposits (in billions) | 715 | 779 | 800 | ||||||||
| As of or for the year ended December 31, 2023 | ||||||||||||||||||||||||||||||||
| (in millions) | Consumer & Community Banking | Commercial Banking | Asset & Wealth Management | Corporate | Total | |||||||||||||||||||||||||||
| Selected Income Statement Data | ||||||||||||||||||||||||||||||||
| Revenue | ||||||||||||||||||||||||||||||||
| Asset management fees | $ | 387 | $ | — | $ | — | $ | — | $ | 387 | ||||||||||||||||||||||
| All other income | 489 | 201 | 503 | 2,862 | (b) |
4,055 | ||||||||||||||||||||||||||
| Noninterest revenue | 876 | 201 | 503 | 2,862 | 4,442 | |||||||||||||||||||||||||||
| Net interest income | 2,401 | 704 | 668 | (55) | 3,718 | |||||||||||||||||||||||||||
| Total net revenue | 3,277 | 905 | 1,171 | 2,807 | 8,160 | |||||||||||||||||||||||||||
| Provision for credit losses | 421 | 731 | 128 | — | 1,280 | |||||||||||||||||||||||||||
| Noninterest expense | 1,219 | 45 | 50 | 1,033 | (c) |
2,347 | ||||||||||||||||||||||||||
| Net income | 1,244 | 98 | 753 | 2,015 | 4,110 | |||||||||||||||||||||||||||
| Selected Balance Sheet Data (period-end) | ||||||||||||||||||||||||||||||||
| Loans | $ | 94,671 | $ | 38,495 | $ | 11,436 | $ | — | $ | 144,602 | (d) |
|||||||||||||||||||||
Deposits (a) |
42,710 | 6,163 | 12,098 | — | 60,971 | (d) |
||||||||||||||||||||||||||
JPMorgan Chase & Co./2023 Form 10-K |
67 |
|||||||
| CONSUMER & COMMUNITY BANKING | ||||||||||||||
Consumer & Community Banking offers products and services to consumers and small businesses through bank branches, ATMs, digital (including mobile and online) and telephone banking. CCB is organized into Banking & Wealth Management (including Consumer Banking, J.P. Morgan Wealth Management and Business Banking), Home Lending (including Home Lending Production, Home Lending Servicing and Real Estate Portfolios) and Card Services & Auto. Banking & Wealth Management offers deposit, investment and lending products, cash management, payments and services. Home Lending includes mortgage origination and servicing activities, as well as portfolios consisting of residential mortgages and home equity loans. Card Services issues credit cards and offers travel services. Auto originates and services auto loans and leases. | ||
| Selected income statement data | ||||||||||||||||||||
| Year ended December 31, | ||||||||||||||||||||
| (in millions, except ratios) | 2023 | 2022 | 2021 | |||||||||||||||||
| Revenue | ||||||||||||||||||||
| Lending- and deposit-related fees | $ | 3,356 | $ | 3,316 | $ | 3,034 | ||||||||||||||
| Asset management fees | 3,282 | (d) |
2,734 | 2,794 | ||||||||||||||||
| Mortgage fees and related income | 1,175 | 1,236 | 2,159 | |||||||||||||||||
| Card income | 2,532 | 2,469 | (f) |
3,364 | (f) |
|||||||||||||||
All other income(a) |
4,773 | (d) |
5,131 | (f) |
5,741 | (f) |
||||||||||||||
| Noninterest revenue | 15,118 | 14,886 | 17,092 | |||||||||||||||||
| Net interest income | 55,030 | (d) |
39,928 | 32,787 | ||||||||||||||||
| Total net revenue | 70,148 | 54,814 | 49,879 | |||||||||||||||||
| Provision for credit losses | 6,899 | (d) |
3,813 | (6,989) | ||||||||||||||||
| Noninterest expense | ||||||||||||||||||||
| Compensation expense | 15,171 | 13,092 | 12,142 | |||||||||||||||||
Noncompensation expense(b) |
19,648 | 18,116 | (f) |
16,886 | (f) |
|||||||||||||||
| Total noninterest expense | 34,819 | (d) |
31,208 | 29,028 | ||||||||||||||||
| Income before income tax expense | 28,430 | 19,793 | 27,840 | |||||||||||||||||
| Income tax expense | 7,198 | 4,877 | (f) |
6,883 | (f) |
|||||||||||||||
| Net income | $ | 21,232 | $ | 14,916 | $ | 20,957 | ||||||||||||||
| Revenue by line of business | ||||||||||||||||||||
| Banking & Wealth Management | $ | 43,199 | (e) |
$ | 30,059 | (f) |
$ | 23,786 | (f) |
|||||||||||
| Home Lending | 4,140 | (e) |
3,674 | 5,291 | ||||||||||||||||
| Card Services & Auto | 22,809 | 21,081 | 20,802 | |||||||||||||||||
| Mortgage fees and related income details: | ||||||||||||||||||||
| Production revenue | 421 | 497 | 2,215 | |||||||||||||||||
|
Net mortgage servicing
revenue(c)
|
754 | 739 | (56) | |||||||||||||||||
| Mortgage fees and related income | $ | 1,175 | $ | 1,236 | $ | 2,159 | ||||||||||||||
| Financial ratios | ||||||||||||||||||||
| Return on equity | 38 | % | 29 | % | 41 | % | ||||||||||||||
| Overhead ratio | 50 | 57 | 58 | |||||||||||||||||
68 |
JPMorgan Chase & Co./2023 Form 10-K |
|||||||
JPMorgan Chase & Co./2023 Form 10-K |
69 |
|||||||
| Selected metrics | ||||||||||||||
| As of or for the year ended December 31, |
||||||||||||||
(in millions, except employees) |
2023 | 2022 | 2021 | |||||||||||
| Selected balance sheet data (period-end) | ||||||||||||||
| Total assets | $ | 642,951 | $ | 514,085 | $ | 500,370 | ||||||||
| Loans: | ||||||||||||||
Banking & Wealth Management(a) |
31,142 | (d) |
29,008 | 35,095 | ||||||||||
Home Lending(b) |
259,181 | (d) |
172,554 | 180,529 | ||||||||||
| Card Services | 211,175 | 185,175 | 154,296 | |||||||||||
| Auto | 77,705 | 68,191 | 69,138 | |||||||||||
| Total loans | 579,203 | 454,928 | 439,058 | |||||||||||
| Deposits | 1,094,738 | (e) |
1,131,611 | 1,148,110 | ||||||||||
| Equity | 55,500 | 50,000 | 50,000 | |||||||||||
| Selected balance sheet data (average) | ||||||||||||||
| Total assets | $ | 584,367 | $ | 497,263 | $ | 489,771 | ||||||||
| Loans: | ||||||||||||||
| Banking & Wealth Management | 30,142 | (f) |
31,545 | 44,906 | ||||||||||
Home Lending(c) |
232,115 | (f) |
176,285 | 181,049 | ||||||||||
| Card Services | 191,424 | 163,335 | 140,405 | |||||||||||
| Auto | 72,674 | 68,098 | 67,624 | |||||||||||
| Total loans | 526,355 | 439,263 | 433,984 | |||||||||||
| Deposits | 1,126,552 | (g) |
1,162,680 | 1,054,956 | ||||||||||
| Equity | 54,349 | 50,000 | 50,000 | |||||||||||
Employees |
141,640 | 135,347 | 128,863 | |||||||||||
| Selected metrics | ||||||||||||||||||||
| As of or for the year ended December 31, |
||||||||||||||||||||
| (in millions, except ratio data) | 2023 | 2022 | 2021 | |||||||||||||||||
| Credit data and quality statistics | ||||||||||||||||||||
Nonaccrual loans(a)(b) |
$ | 3,740 | $ | 3,899 | $ | 4,875 | ||||||||||||||
| Net charge-offs/(recoveries) | ||||||||||||||||||||
| Banking & Wealth Management | 340 | 370 | 289 | |||||||||||||||||
| Home Lending | (56) | (229) | (275) | |||||||||||||||||
| Card Services | 4,699 | 2,403 | 2,712 | |||||||||||||||||
| Auto | 357 | 144 | 35 | |||||||||||||||||
| Total net charge-offs/(recoveries) | $ | 5,340 | $ | 2,688 | $ | 2,761 | ||||||||||||||
| Net charge-off/(recovery) rate | ||||||||||||||||||||
Banking & Wealth Management(c) |
1.13 | % | 1.17 | % | 0.64 | % | ||||||||||||||
| Home Lending | (0.02) | (0.14) | (0.17) | |||||||||||||||||
| Card Services | 2.45 | 1.47 | 1.94 | |||||||||||||||||
| Auto | 0.49 | 0.21 | 0.05 | |||||||||||||||||
| Total net charge-off/(recovery) rate | 1.02 | % | 0.62 | % | 0.66 | % | ||||||||||||||
| 30+ day delinquency rate | ||||||||||||||||||||
Home Lending(d)(e) |
0.66 | % | 0.83 | % | 1.25 | % | ||||||||||||||
| Card Services | 2.14 | 1.45 | 1.04 | |||||||||||||||||
| Auto | 1.19 | 1.01 | 0.64 | |||||||||||||||||
90+ day delinquency rate - Card Services |
1.05 | % | 0.68 | % | 0.50 | % | ||||||||||||||
| Allowance for loan losses | ||||||||||||||||||||
| Banking & Wealth Management | $ | 685 | $ | 722 | $ | 697 | ||||||||||||||
| Home Lending | 578 | (f) |
867 | 660 | ||||||||||||||||
| Card Services | 12,453 | 11,200 | 10,250 | |||||||||||||||||
| Auto | 742 | 715 | 733 | |||||||||||||||||
| Total allowance for loan losses | $ | 14,458 | (g) |
$ | 13,504 | $ | 12,340 | |||||||||||||
70 |
JPMorgan Chase & Co./2023 Form 10-K |
|||||||
| Selected metrics | ||||||||||||||||||||
| As of or for the year ended December 31, | ||||||||||||||||||||
| (in billions, except ratios and where otherwise noted) | 2023 | 2022 | 2021 | |||||||||||||||||
| Business Metrics | ||||||||||||||||||||
CCB Consumer customers (in millions)(a) |
82.1 | (g) |
79.2 | 76.5 | ||||||||||||||||
CCB Small business customers (in millions)(a) |
6.4 | (g) |
5.7 | 5.3 | ||||||||||||||||
| Number of branches | 4,897 | 4,787 | 4,790 | |||||||||||||||||
|
Active digital customers
(in thousands)(b)
|
66,983 | (g) |
63,136 | 58,857 | ||||||||||||||||
|
Active mobile customers
(in thousands)(c)
|
53,828 | (g) |
49,710 | 45,452 | ||||||||||||||||
| Debit and credit card sales volume
|
$ | 1,678.6 | $ | 1,555.4 | $ | 1,360.7 | ||||||||||||||
Total payments transaction volume (in trillions)(d) |
5.9 | (g) |
5.6 | 5.0 | ||||||||||||||||
| Banking & Wealth Management | ||||||||||||||||||||
| Average deposits | $ | 1,111.7 | (h) |
$ | 1,145.7 | $ | 1,035.4 | |||||||||||||
| Deposit margin | 2.84 | % | 1.71 | % | 1.27 | % | ||||||||||||||
| Business Banking average loans | $ | 19.6 | $ | 22.3 | $ | 37.5 | ||||||||||||||
| Business Banking origination volume
|
4.8 | 4.3 | 13.9 | (j) |
||||||||||||||||
Client investment assets(e) |
951.1 | 647.1 | 718.1 | |||||||||||||||||
| Number of client advisors | 5,456 | 5,029 | 4,725 | |||||||||||||||||
| Home Lending | ||||||||||||||||||||
| Mortgage origination volume by channel | ||||||||||||||||||||
| Retail | $ | 22.4 | (i) |
$ | 38.5 | $ | 91.8 | |||||||||||||
| Correspondent | 12.7 | 26.9 | 70.9 | |||||||||||||||||
Total mortgage origination volume(f) |
$ | 35.1 | $ | 65.4 | $ | 162.7 | ||||||||||||||
| Third-party mortgage loans serviced (period-end) | $ | 631.2 | $ | 584.3 | $ | 519.2 | ||||||||||||||
| MSR carrying value (period-end)
|
8.5 | 8.0 | 5.5 | |||||||||||||||||
| Card Services | ||||||||||||||||||||
| Sales volume, excluding commercial card | $ | 1,163.6 | $ | 1,064.7 | $ | 893.5 | ||||||||||||||
| Net revenue rate | 9.72 | % | 9.87 | % | 10.51 | % | ||||||||||||||
| Net yield on average loans | 9.61 | 9.77 | 9.88 | |||||||||||||||||
New credit card accounts opened (in millions) |
10.0 | 9.6 | 8.0 | |||||||||||||||||
| Auto | ||||||||||||||||||||
| Loan and lease origination volume
|
$ | 41.3 | $ | 30.4 | $ | 43.6 | ||||||||||||||
| Average auto operating lease assets
|
10.9 | 14.3 | 19.1 | |||||||||||||||||
JPMorgan Chase & Co./2023 Form 10-K |
71 |
|||||||
| CORPORATE & INVESTMENT BANK | ||||||||||||||
The Corporate & Investment Bank, which consists of Banking and Markets & Securities Services, offers a broad suite of investment banking, market-making, prime brokerage, lending, and treasury and securities products and services to a global client base of corporations, investors, financial institutions, merchants, government and municipal entities. Banking offers a full range of investment banking products and services in all major capital markets, including advising on corporate strategy and structure, capital-raising in equity and debt markets, as well as loan origination and syndication. Banking also includes Payments, which provides services, that enable clients to manage payments globally across liquidity and account solutions, commerce solutions, clearing, trade and working capital. Markets & Securities Services includes Markets, a global market-maker across products, including cash and derivative instruments, which also offers sophisticated risk management solutions, prime brokerage, clearing and research. Markets & Securities Services also includes Securities Services, a leading global custodian which provides custody, fund accounting and administration, and securities lending products principally for asset managers, insurance companies and public and private investment funds. | ||
| Selected income statement data | ||||||||||||||||||||
| Year ended December 31, | ||||||||||||||||||||
| (in millions) | 2023 | 2022 | 2021 | |||||||||||||||||
| Revenue | ||||||||||||||||||||
Investment banking fees(a) |
$ | 6,582 | $ | 6,929 | $ | 13,359 | ||||||||||||||
| Principal transactions | 23,671 | 19,926 | 15,764 | |||||||||||||||||
| Lending- and deposit-related fees | 2,213 | 2,419 | 2,514 | |||||||||||||||||
| Commissions and other fees | 4,821 | 5,058 | 4,995 | |||||||||||||||||
| Card income | 1,450 | 1,249 | (c) |
1,108 | (c) |
|||||||||||||||
| All other income | 1,578 | 621 | (c) |
663 | (c) |
|||||||||||||||
| Noninterest revenue | 40,315 | 36,202 | 38,403 | |||||||||||||||||
| Net interest income | 8,492 | 11,900 | 13,540 | |||||||||||||||||
Total net revenue(b) |
48,807 | 48,102 | 51,943 | |||||||||||||||||
| Provision for credit losses | 121 | 1,158 | (1,174) | |||||||||||||||||
| Noninterest expense | ||||||||||||||||||||
| Compensation expense | 14,345 | 13,918 | 13,096 | |||||||||||||||||
| Noncompensation expense | 14,249 | 13,432 | (c) |
12,457 | (c) |
|||||||||||||||
| Total noninterest expense | 28,594 | 27,350 | 25,553 | |||||||||||||||||
Income before income tax expense |
20,092 | 19,594 | 27,564 | |||||||||||||||||
| Income tax expense | 5,963 | 4,669 | (c) |
6,457 | (c) |
|||||||||||||||
| Net income | $ | 14,129 | $ | 14,925 | $ | 21,107 | ||||||||||||||
| Selected income statement data | ||||||||||||||||||||
| Year ended December 31, | ||||||||||||||||||||
| (in millions, except ratios) | 2023 | 2022 | 2021 | |||||||||||||||||
| Financial ratios | ||||||||||||||||||||
| Return on equity | 13 | % | 14 | % | 25 | % | ||||||||||||||
| Overhead ratio | 59 | 57 | 49 | |||||||||||||||||
|
Compensation expense as
percentage of total net
revenue
|
29 | 29 | 25 | |||||||||||||||||
| Revenue by business | ||||||||||||||||||||
| Investment Banking | $ | 6,243 | $ | 6,510 | $ | 12,506 | ||||||||||||||
| Payments | 9,273 | 7,579 | (b) |
6,464 | (b) |
|||||||||||||||
| Lending | 1,007 | 1,377 | 1,001 | |||||||||||||||||
| Total Banking | 16,523 | 15,466 | 19,971 | |||||||||||||||||
| Fixed Income Markets | 18,813 | 18,617 | 16,865 | |||||||||||||||||
| Equity Markets | 8,979 | 10,367 | 10,529 | |||||||||||||||||
| Securities Services | 4,772 | 4,488 | 4,328 | |||||||||||||||||
Credit Adjustments & Other(a) |
(280) | (836) | 250 | |||||||||||||||||
|
Total Markets & Securities
Services
|
32,284 | 32,636 | 31,972 | |||||||||||||||||
| Total net revenue | $ | 48,807 | $ | 48,102 | $ | 51,943 | ||||||||||||||
72 |
JPMorgan Chase & Co./2023 Form 10-K |
|||||||
JPMorgan Chase & Co./2023 Form 10-K |
73 |
|||||||
| Selected metrics | ||||||||||||||||||||
|
As of or for the year ended
December 31, (in millions, except employees)
|
||||||||||||||||||||
| 2023 | 2022 | 2021 | ||||||||||||||||||
Selected balance sheet data (period-end) |
||||||||||||||||||||
| Total assets | $ | 1,338,168 | $ | 1,334,296 | $ | 1,259,896 | ||||||||||||||
| Loans: | ||||||||||||||||||||
Loans retained(a) |
197,523 | 187,642 | 159,786 | |||||||||||||||||
Loans held-for-sale and loans at fair value(b) |
38,919 | 42,304 | 50,386 | |||||||||||||||||
| Total loans | 236,442 | 229,946 | 210,172 | |||||||||||||||||
| Equity | 108,000 | 103,000 | 83,000 | |||||||||||||||||
Selected balance sheet data (average) |
||||||||||||||||||||
| Total assets | $ | 1,428,904 | $ | 1,406,250 | $ | 1,334,518 | ||||||||||||||
| Trading assets-debt and equity instruments | 508,799 | 405,916 | 448,099 | |||||||||||||||||
| Trading assets-derivative receivables | 63,836 | 77,802 | 68,203 | |||||||||||||||||
| Loans: | ||||||||||||||||||||
Loans retained(a) |
190,601 | 172,627 | 145,137 | |||||||||||||||||
Loans held-for-sale and loans at fair value(b) |
39,831 | 46,846 | 51,072 | |||||||||||||||||
| Total loans | 230,432 | 219,473 | 196,209 | |||||||||||||||||
| Deposits | 728,537 | 739,700 | 760,048 | |||||||||||||||||
| Equity | 108,000 | 103,000 | 83,000 | |||||||||||||||||
Employees |
74,404 | 73,452 | 67,546 | |||||||||||||||||
| Selected metrics | |||||||||||||||||
| As of or for the year ended December 31, (in millions, except ratios) |
|||||||||||||||||
| 2023 | 2022 | 2021 | |||||||||||||||
Credit data and quality statistics |
|||||||||||||||||
Net charge-offs/(recoveries) |
$ | 272 | $ | 82 | $ | 6 | |||||||||||
| Nonperforming assets: | |||||||||||||||||
| Nonaccrual loans: | |||||||||||||||||
Nonaccrual loans retained(a) |
866 | 718 | 584 | ||||||||||||||
Nonaccrual loans held-for-sale and loans at fair value(b) |
828 | 848 | 844 | ||||||||||||||
Total nonaccrual loans |
1,694 | 1,566 | 1,428 | ||||||||||||||
| Derivative receivables | 364 | 296 | 316 | ||||||||||||||
Assets acquired in loan satisfactions |
115 | 87 | 91 | ||||||||||||||
Total nonperforming assets |
2,173 | 1,949 | 1,835 | ||||||||||||||
| Allowance for credit losses: | |||||||||||||||||
| Allowance for loan losses | 2,321 | 2,292 | 1,348 | ||||||||||||||
| Allowance for lending-related commitments | 1,048 | 1,448 | 1,372 | ||||||||||||||
Total allowance for credit losses |
3,369 | 3,740 | 2,720 | ||||||||||||||
Net charge-off/(recovery) rate(c) |
0.14 | % | 0.05 | % | — | % | |||||||||||
|
Allowance for loan losses to period-end loans
retained
|
1.18 | 1.22 | 0.84 | ||||||||||||||
Allowance for loan losses to period-end loans retained, excluding trade finance and conduits(d) |
1.64 | 1.67 | 1.12 | ||||||||||||||
|
Allowance for loan losses to nonaccrual loans
retained(a)
|
268 | 319 | 231 | ||||||||||||||
| Nonaccrual loans to total period-end loans | 0.72 | 0.68 | 0.68 | ||||||||||||||
74 |
JPMorgan Chase & Co./2023 Form 10-K |
|||||||
Investment banking fees |
|||||||||||||||||
| Year ended December 31, | |||||||||||||||||
(in millions) |
2023 | 2022 | 2021 | ||||||||||||||
Advisory |
$ | 2,814 | $ | 3,051 | $ | 4,381 | |||||||||||
Equity underwriting |
1,151 | 1,034 | 3,953 | ||||||||||||||
Debt underwriting(a) |
2,617 | 2,844 | 5,025 | ||||||||||||||
Total investment banking fees |
$ | 6,582 | $ | 6,929 | $ | 13,359 | |||||||||||
| League table results – wallet share | ||||||||||||||||||||||||||
| 2023 | 2022 | 2021 | ||||||||||||||||||||||||
| Year ended December 31, | Rank | Share | Rank | Share | Rank | Share | ||||||||||||||||||||
Based on fees(a) |
||||||||||||||||||||||||||
M&A(b) |
||||||||||||||||||||||||||
Global |
# | 2 | 9.3 | % | # | 2 | 7.9 | % | # | 2 | 9.6 | % | ||||||||||||||
U.S. |
2 | 11.2 | 2 | 9.0 | 2 | 10.7 | ||||||||||||||||||||
Equity and equity-related(c) |
||||||||||||||||||||||||||
Global |
1 | 7.8 | 2 | 5.7 | 3 | 8.8 | ||||||||||||||||||||
U.S. |
1 | 14.1 | 1 | 13.9 | 2 | 11.8 | ||||||||||||||||||||
Long-term debt(d) |
||||||||||||||||||||||||||
Global |
1 | 7.2 | 1 | 6.9 | 1 | 8.4 | ||||||||||||||||||||
U.S. |
1 | 10.9 | 1 | 12.2 | 1 | 12.1 | ||||||||||||||||||||
Loan syndications |
||||||||||||||||||||||||||
| Global | 1 | 12.1 | 1 | 11.0 | 1 | 10.9 | ||||||||||||||||||||
| U.S. | 1 | 15.1 | 1 | 12.8 | 1 | 12.6 | ||||||||||||||||||||
Global investment banking fees(e) |
# | 1 | 8.8 | % | # | 1 | 7.8 | % | # | 1 | 9.3 | % | ||||||||||||||
JPMorgan Chase & Co./2023 Form 10-K |
75 |
|||||||
| 2023 | 2022 | 2021 | |||||||||||||||||||||||||||||||||
| Year ended December 31, (in millions, except where otherwise noted) |
Fixed Income Markets | Equity Markets | Total Markets | Fixed Income Markets | Equity Markets | Total Markets | Fixed Income Markets | Equity Markets | Total Markets | ||||||||||||||||||||||||||
Principal transactions |
$ | 12,064 | $ | 11,514 | $ | 23,578 | $ | 11,682 | $ | 8,846 | $ | 20,528 | $ | 7,911 | $ | 7,519 | $ | 15,430 | |||||||||||||||||
Lending- and deposit-related fees |
307 | 40 | 347 | 303 | 22 | 325 | 321 | 17 | 338 | ||||||||||||||||||||||||||
| Commissions and other fees | 596 | 1,908 | 2,504 | 550 | 1,975 | 2,525 | 545 | 1,948 | 2,493 | ||||||||||||||||||||||||||
| All other income | 1,744 | (87) | 1,657 | 916 | (99) | 817 | 972 | (82) | 890 | ||||||||||||||||||||||||||
| Noninterest revenue | 14,711 | 13,375 | 28,086 | 13,451 | 10,744 | 24,195 | 9,749 | 9,402 | 19,151 | ||||||||||||||||||||||||||
Net interest income(a) |
4,102 | (4,396) | (294) | 5,166 | (377) | 4,789 | 7,116 | 1,127 | 8,243 | ||||||||||||||||||||||||||
| Total net revenue | $ | 18,813 | $ | 8,979 | $ | 27,792 | $ | 18,617 | $ | 10,367 | $ | 28,984 | $ | 16,865 | $ | 10,529 | $ | 27,394 | |||||||||||||||||
Loss days(b) |
3 | 7 | 4 | ||||||||||||||||||||||||||||||||
Selected metrics |
|||||||||||||||||
| As of or for the year ended December 31, (in millions, except where otherwise noted) |
2023 | 2022 | 2021 | ||||||||||||||
| Assets under custody ("AUC") by asset class (period-end) (in billions): | |||||||||||||||||
| Fixed Income | $ | 15,543 | $ | 14,361 | $ | 16,098 | |||||||||||
| Equity | 12,927 | 10,748 | 12,962 | ||||||||||||||
Other(a) |
3,922 | 3,526 | 4,161 | ||||||||||||||
| Total AUC | $ | 32,392 | $ | 28,635 | $ | 33,221 | |||||||||||
Merchant processing volume (in billions)(b) |
$ | 2,408 | $ | 2,158 | $ | 1,887 | |||||||||||
Client deposits and other third party liabilities (average)(c) |
$ | 645,074 | $ | 687,391 | $ | 714,910 | |||||||||||
76 |
JPMorgan Chase & Co./2023 Form 10-K |
|||||||
| International metrics | ||||||||||||||||||||
| As of or for the year ended December 31, (in millions, except where otherwise noted) |
2023 | 2022 | 2021 | |||||||||||||||||
Total net revenue(a) |
||||||||||||||||||||
| Europe/Middle East/Africa | $ | 13,725 | $ | 15,303 | $ | 13,954 | ||||||||||||||
| Asia-Pacific | 7,607 | 7,846 | 7,555 | |||||||||||||||||
| Latin America/Caribbean | 2,094 | 2,239 | 1,833 | |||||||||||||||||
| Total international net revenue | 23,426 | 25,388 | 23,342 | |||||||||||||||||
| North America | 25,381 | 22,714 | (c) |
28,601 | (c) |
|||||||||||||||
| Total net revenue | $ | 48,807 | $ | 48,102 | $ | 51,943 | ||||||||||||||
Loans retained (period-end)(a) |
||||||||||||||||||||
| Europe/Middle East/Africa | $ | 42,792 | $ | 39,424 | $ | 33,084 | ||||||||||||||
| Asia-Pacific | 14,333 | 15,571 | 14,471 | |||||||||||||||||
| Latin America/Caribbean | 8,341 | 8,599 | 7,006 | |||||||||||||||||
| Total international loans | 65,466 | 63,594 | 54,561 | |||||||||||||||||
| North America | 132,057 | 124,048 | 105,225 | |||||||||||||||||
| Total loans retained | $ | 197,523 | $ | 187,642 | $ | 159,786 | ||||||||||||||
Client deposits and other third-party liabilities (average)(b) |
||||||||||||||||||||
| Europe/Middle East/Africa | $ | 230,225 | $ | 247,203 | $ | 243,867 | ||||||||||||||
| Asia-Pacific | 126,918 | 129,134 | 132,241 | |||||||||||||||||
| Latin America/Caribbean | 39,134 | 39,917 | 46,045 | |||||||||||||||||
| Total international | $ | 396,277 | $ | 416,254 | $ | 422,153 | ||||||||||||||
| North America | 248,797 | 271,137 | 292,757 | |||||||||||||||||
Total client deposits and other third-party liabilities |
$ | 645,074 | $ | 687,391 | $ | 714,910 | ||||||||||||||
AUC (period-end)(b) (in billions) |
||||||||||||||||||||
| North America | $ | 21,792 | $ | 19,219 | $ | 21,655 | ||||||||||||||
| All other regions | 10,600 | 9,416 | 11,566 | |||||||||||||||||
| Total AUC | $ | 32,392 | $ | 28,635 | $ | 33,221 | ||||||||||||||
JPMorgan Chase & Co./2023 Form 10-K |
77 |
|||||||
| COMMERCIAL BANKING | ||||||||||||||
|
Commercial Banking provides comprehensive financial solutions, including lending, payments, investment banking and asset management products across three primary client segments: Middle Market Banking, Corporate Client Banking and Commercial Real Estate Banking. Other includes amounts not aligned with a primary client segment.
Middle Market Banking covers small and midsized companies, local governments and nonprofit clients.
Corporate Client Banking covers large corporations.
Commercial Real Estate Banking covers investors, developers, and owners of multifamily, office, retail, industrial and affordable housing properties.
| ||
| Selected income statement data | |||||||||||||||||
| Year ended December 31, (in millions) |
2023 | 2022 | 2021 | ||||||||||||||
| Revenue | |||||||||||||||||
| Lending- and deposit-related fees | $ | 1,210 | (b) |
$ | 1,243 | $ | 1,392 | ||||||||||
| Card income | 763 | 685 | 624 | ||||||||||||||
All other income |
1,521 | 1,408 | 1,913 | ||||||||||||||
| Noninterest revenue | 3,494 | 3,336 | 3,929 | ||||||||||||||
| Net interest income | 12,052 | (b) |
8,197 | 6,079 | |||||||||||||
Total net revenue(a) |
15,546 | 11,533 | 10,008 | ||||||||||||||
| Provision for credit losses | 1,970 | (b) |
1,268 | (947) | |||||||||||||
| Noninterest expense | |||||||||||||||||
| Compensation expense | 2,760 | (b) |
2,296 | 1,973 | |||||||||||||
| Noncompensation expense | 2,618 | 2,423 | 2,068 | ||||||||||||||
| Total noninterest expense | 5,378 | 4,719 | 4,041 | ||||||||||||||
Income before income tax expense |
8,198 | 5,546 | 6,914 | ||||||||||||||
| Income tax expense | 2,055 | 1,333 | 1,668 | ||||||||||||||
| Net income | $ | 6,143 | $ | 4,213 | $ | 5,246 | |||||||||||
78 |
JPMorgan Chase & Co./2023 Form 10-K |
|||||||
|
CB product revenue consists of the following:
Lending includes a variety of financing alternatives, which are primarily provided on a secured basis; collateral includes receivables, inventory, equipment, real estate or other assets. Products include term loans, revolving lines of credit, bridge financing, asset-based structures, leases, and standby letters of credit.
Payments includes services that enable CB clients to manage payments globally across liquidity and account solutions, commerce solutions, clearing, trade and working capital.
Investment banking includes revenue from a range of products providing CB clients with sophisticated capital-raising alternatives, as well as balance sheet and risk management tools through advisory, equity underwriting, and loan syndications. Revenue from fixed income and equity markets products used by CB clients is also included.
Other revenue primarily includes tax-equivalent adjustments generated from Community Development Banking and activity derived from principal transactions.
| ||||||||||||||
| Selected income statement data (continued) | |||||||||||||||||
| Year ended December 31, (in millions, except ratios) |
2023 | 2022 | 2021 | ||||||||||||||
| Revenue by product | |||||||||||||||||
| Lending | $ | 5,993 | (d) |
$ | 4,524 | $ | 4,629 | ||||||||||
Payments(a) |
8,250 | 5,691 | 3,653 | ||||||||||||||
Investment banking(a)(b) |
1,167 | 1,064 | 1,611 | ||||||||||||||
| Other | 136 | 254 | 115 | ||||||||||||||
| Total net revenue | $ | 15,546 | $ | 11,533 | $ | 10,008 | |||||||||||
Investment Banking and Markets revenue, gross(c) |
$ | 3,393 | $ | 2,978 | $ | 5,092 | |||||||||||
| Revenue by client segment | |||||||||||||||||
| Middle Market Banking | $ | 7,371 | (e) |
$ | 5,134 | $ | 4,004 | ||||||||||
| Corporate Client Banking | 4,777 | 3,918 | 3,508 | ||||||||||||||
Commercial Real Estate Banking |
3,308 | (e) |
2,461 | 2,419 | |||||||||||||
| Other | 90 | 20 | 77 | ||||||||||||||
| Total net revenue | $ | 15,546 | $ | 11,533 | $ | 10,008 | |||||||||||
| Financial ratios | |||||||||||||||||
| Return on equity | 20 | % | 16 | % | 21 | % | |||||||||||
| Overhead ratio | 35 | 41 | 40 | ||||||||||||||
| Selected metrics | |||||||||||||||||
As of or for the year ended December 31, (in millions, except employees) |
2023 | 2022 | 2021 | ||||||||||||||
Selected balance sheet data (period-end) |
|||||||||||||||||
| Total assets | $ | 300,325 | $ | 257,106 | $ | 230,776 | |||||||||||
| Loans: | |||||||||||||||||
| Loans retained | 277,663 | (b) |
233,879 | 206,220 | |||||||||||||
Loans held-for-sale and loans at fair value |
545 | 707 | 2,223 | ||||||||||||||
| Total loans | $ | 278,208 | $ | 234,586 | $ | 208,443 | |||||||||||
| Equity | 30,000 | 25,000 | 24,000 | ||||||||||||||
Period-end loans by client segment |
|||||||||||||||||
Middle Market Banking(a) |
$ | 78,043 | (c) |
$ | 72,625 | $ | 61,159 | ||||||||||
| Corporate Client Banking | 56,132 | 53,840 | 45,315 | ||||||||||||||
| Commercial Real Estate Banking | 143,507 | (c) |
107,999 | 101,751 | |||||||||||||
| Other | 526 | 122 | 218 | ||||||||||||||
Total loans(a) |
$ | 278,208 | $ | 234,586 | $ | 208,443 | |||||||||||
Selected balance sheet data (average) |
|||||||||||||||||
| Total assets | $ | 287,851 | $ | 243,108 | $ | 225,548 | |||||||||||
| Loans: | |||||||||||||||||
| Loans retained | 267,285 | (d) |
222,388 | 201,920 | |||||||||||||
Loans held-for-sale and loans at fair value |
1,060 | 1,350 | 3,122 | ||||||||||||||
| Total loans | $ | 268,345 | $ | 223,738 | $ | 205,042 | |||||||||||
| Deposits | 267,758 | (e) |
294,180 | 301,343 | |||||||||||||
| Equity | 29,507 | 25,000 | 24,000 | ||||||||||||||
Average loans by client segment |
|||||||||||||||||
| Middle Market Banking | $ | 77,130 | (f) |
$ | 67,830 | $ | 60,128 | ||||||||||
| Corporate Client Banking | 58,770 | 50,281 | 44,361 | ||||||||||||||
| Commercial Real Estate Banking | 132,114 | (f) |
105,459 | 100,331 | |||||||||||||
| Other | 331 | 168 | 222 | ||||||||||||||
| Total loans | $ | 268,345 | $ | 223,738 | $ | 205,042 | |||||||||||
Employees |
17,867 | 14,687 | 12,902 | ||||||||||||||
JPMorgan Chase & Co./2023 Form 10-K |
79 |
|||||||
| Selected metrics | |||||||||||||||||
| As of or for the year ended December 31, (in millions, except ratios) | 2023 | 2022 | 2021 | ||||||||||||||
Credit data and quality statistics |
|||||||||||||||||
| Net charge-offs/(recoveries) | $ | 316 | $ | 84 | $ | 71 | |||||||||||
| Nonperforming assets | |||||||||||||||||
| Nonaccrual loans: | |||||||||||||||||
Nonaccrual loans retained(a) |
$ | 809 | $ | 766 | $ | 740 | |||||||||||
Nonaccrual loans held-for-sale and loans at fair value |
— | — | — | ||||||||||||||
| Total nonaccrual loans | $ | 809 | $ | 766 | $ | 740 | |||||||||||
Assets acquired in loan satisfactions |
54 | — | 17 | ||||||||||||||
| Total nonperforming assets | $ | 863 | $ | 766 | $ | 757 | |||||||||||
| Allowance for credit losses: | |||||||||||||||||
| Allowance for loan losses | $ | 5,005 | $ | 3,324 | $ | 2,219 | |||||||||||
Allowance for lending-related commitments |
801 | 830 | 749 | ||||||||||||||
Total allowance for credit losses |
$ | 5,806 | (c) |
$ | 4,154 | $ | 2,968 | ||||||||||
Net charge-off/(recovery) rate(b) |
0.12% | 0.04% | 0.04% | ||||||||||||||
Allowance for loan losses to period-end loans retained |
1.80 | 1.42 | 1.08 | ||||||||||||||
Allowance for loan losses to nonaccrual loans retained(a) |
619 | 434 | 300 | ||||||||||||||
Nonaccrual loans to period-end total loans |
0.29 | 0.33 | 0.36 | ||||||||||||||
80 |
JPMorgan Chase & Co./2023 Form 10-K |
|||||||
| ASSET & WEALTH MANAGEMENT | ||||||||||||||
|
Asset & Wealth Management, with client assets of $5.0 trillion, is a global leader in investment and wealth management.
Asset Management
Offers multi-asset investment management solutions across equities, fixed income, alternatives and money market funds to institutional and retail investors providing for a broad range of clients’ investment needs.
Global Private Bank
Provides retirement products and services, brokerage, custody, estate planning, lending, deposits and investment management to high net worth clients.
The majority of AWM’s client assets are in actively managed portfolios.
| ||
| Selected income statement data | ||||||||||||||
| Year ended December 31, (in millions, except ratios) |
2023 | 2022 | 2021 | |||||||||||
| Revenue | ||||||||||||||
| Asset management fees | $ | 11,826 | $ | 11,510 | $ | 11,518 | ||||||||
| Commissions and other fees | 697 | 662 | $ | 815 | ||||||||||
| All other income | 1,037 | (a)(b) |
335 | 738 | ||||||||||
| Noninterest revenue | 13,560 | 12,507 | 13,071 | |||||||||||
| Net interest income | 6,267 | 5,241 | 3,886 | |||||||||||
| Total net revenue | 19,827 | 17,748 | 16,957 | |||||||||||
| Provision for credit losses | 159 | 128 | (227) | |||||||||||
| Noninterest expense | ||||||||||||||
| Compensation expense | 7,115 | 6,336 | 5,692 | |||||||||||
| Noncompensation expense | 5,665 | 5,493 | 5,227 | |||||||||||
| Total noninterest expense | 12,780 | 11,829 | 10,919 | |||||||||||
Income before income tax expense |
6,888 | 5,791 | 6,265 | |||||||||||
| Income tax expense | 1,661 | 1,426 | 1,528 | |||||||||||
| Net income | $ | 5,227 | $ | 4,365 | $ | 4,737 | ||||||||
| Revenue by line of business | ||||||||||||||
| Asset Management | $ | 9,129 | $ | 8,818 | $ | 9,246 | ||||||||
| Global Private Bank | 10,698 | 8,930 | 7,711 | |||||||||||
| Total net revenue | $ | 19,827 | $ | 17,748 | $ | 16,957 | ||||||||
| Financial ratios | ||||||||||||||
| Return on equity | 31 | % | 25 | % | 33 | % | ||||||||
| Overhead ratio | 64 | 67 | 64 | |||||||||||
| Pre-tax margin ratio: | ||||||||||||||
| Asset Management | 31 | 30 | 35 | |||||||||||
| Global Private Bank | 38 | 35 | 39 | |||||||||||
| Asset & Wealth Management | 35 | 33 | 37 | |||||||||||
JPMorgan Chase & Co./2023 Form 10-K |
81 |
|||||||
| Asset Management has two high-level measures of its overall fund performance. | ||||||||||||||
• Percentage of active mutual fund and active ETF assets under management in funds rated 4- or 5-star: Mutual fund rating services rank funds based on their risk adjusted performance over various periods. A 5-star rating is the best rating and represents the top 10% of industry-wide ranked funds. A 4-star rating represents the next 22.5% of industry-wide ranked funds. A 3-star rating represents the next 35% of industry-wide ranked funds. A 2-star rating represents the next 22.5% of industry-wide ranked funds. A 1-star rating is the worst rating and represents the bottom 10% of industrywide ranked funds. An overall Morningstar rating is derived from a weighted average of the performance associated with a fund’s three-, five and ten- year (if applicable) Morningstar Rating metrics. For U.S.-domiciled funds, separate star ratings are provided at the individual share class level. The Nomura “star rating” is based on three-year risk-adjusted performance only. Funds with fewer than three years of history are not rated and hence excluded from these rankings. All ratings, the assigned peer categories and the asset values used to derive these rankings are sourced from the applicable fund rating provider. Where applicable, the fund rating providers redenominate asset values into U.S. dollars. The percentage of AUM is based on star ratings at the share class level for U.S.-domiciled funds, and at a “primary share class” level to represent the star rating of all other funds, except for Japan, for which Nomura provides ratings at the fund level. The performance data may have been different if all share classes had been included. Past performance is not indicative of future results. | ||||||||||||||
• Percentage of active mutual fund and active ETF assets under management in funds ranked in the 1st or 2nd quartile (one, three and five years):All quartile rankings, the assigned peer categories and the asset values used to derive these rankings are sourced from the fund rating providers. Quartile rankings are based on the net-of-fee absolute return of each fund. Where applicable, the fund rating providers redenominate asset values into U.S. dollars. The percentage of AUM is based on fund performance and associated peer rankings at the share class level for U.S.-domiciled funds, at a “primary share class” level to represent the quartile ranking for U.K., Luxembourg and Hong Kong SAR funds and at the fund level for all other funds. The performance data may have been different if all share classes had been included. Past performance is not indicative of future results. | ||||||||||||||
“Primary share class” means the C share class for European funds and Acc share class for Hong Kong SAR and Taiwan funds. If these share classes are not available, the oldest share class is used as the primary share class. | ||||||||||||||
| Selected metrics | ||||||||||||||
|
As of or for the year ended December 31,
(in millions, except ranking data, ratios and employees)
|
2023 | 2022 | 2021 | |||||||||||
% of JPM mutual fund assets and ETFs rated as 4- or 5-star(a) |
69 | % | 73 | % | 69 | % | ||||||||
|
% of JPM mutual fund assets and ETFs ranked in 1st or 2nd
quartile:(b)
|
||||||||||||||
| 1 year | 40 | 68 | 54 | |||||||||||
| 3 years | 67 | 76 | 73 | |||||||||||
| 5 years | 71 | 81 | 80 | |||||||||||
Selected balance sheet data (period-end)(c) |
||||||||||||||
| Total assets | $ | 245,512 | $ | 232,037 | $ | 234,425 | ||||||||
| Loans | 227,929 | (d) |
214,006 | 218,271 | ||||||||||
| Deposits | 233,232 | (e) |
233,130 | 282,052 | ||||||||||
| Equity | 17,000 | 17,000 | 14,000 | |||||||||||
Selected balance sheet data (average)(c) |
||||||||||||||
| Total assets | $ | 240,222 | $ | 232,438 | $ | 217,187 | ||||||||
| Loans | 220,487 | (f) |
215,582 | 198,487 | ||||||||||
| Deposits | 216,178 | (e) |
261,489 | 230,296 | ||||||||||
| Equity | 16,671 | 17,000 | 14,000 | |||||||||||
Employees |
28,485 | 26,041 | 22,762 | |||||||||||
| Number of Global Private Bank client advisors | 3,515 | 3,137 | 2,738 | |||||||||||
Credit data and quality statistics(c) |
||||||||||||||
| Net charge-offs/(recoveries) | $ | 13 | $ | (7) | $ | 26 | ||||||||
| Nonaccrual loans | 650 | 459 | 708 | |||||||||||
| Allowance for credit losses: | ||||||||||||||
| Allowance for loan losses | $ | 633 | $ | 494 | $ | 365 | ||||||||
Allowance for lending-related commitments |
28 | 20 | 18 | |||||||||||
Total allowance for credit losses |
$ | 661 | (g) |
$ | 514 | $ | 383 | |||||||
| Net charge-off/(recovery) rate | 0.01 | % | — | % | 0.01 | % | ||||||||
Allowance for loan losses to period-end loans |
0.28 | 0.23 | 0.17 | |||||||||||
Allowance for loan losses to nonaccrual loans |
97 | 108 | 52 | |||||||||||
Nonaccrual loans to period-end loans |
0.29 | 0.21 | 0.32 | |||||||||||
82 |
JPMorgan Chase & Co./2023 Form 10-K |
|||||||
| Client assets | |||||||||||
| December 31, (in billions) |
2023 | 2022 | 2021 | ||||||||
| Assets by asset class | |||||||||||
| Liquidity | $ | 926 | $ | 654 | $ | 708 | |||||
| Fixed income | 751 | 638 | 693 | ||||||||
| Equity | 868 | 670 | 779 | ||||||||
| Multi-asset | 680 | 603 | 732 | ||||||||
| Alternatives | 197 | 201 | 201 | ||||||||
| Total assets under management | 3,422 | 2,766 | 3,113 | ||||||||
|
Custody/brokerage/
administration/deposits
|
1,590 | 1,282 | 1,182 | ||||||||
Total client assets(a) |
$ | 5,012 | $ | 4,048 | $ | 4,295 | |||||
| Assets by client segment | |||||||||||
| Private Banking | $ | 974 | $ | 751 | $ | 805 | |||||
| Global Institutional | 1,488 | 1,252 | 1,430 | ||||||||
| Global Funds | 960 | 763 | 878 | ||||||||
| Total assets under management | $ | 3,422 | $ | 2,766 | $ | 3,113 | |||||
Private Banking |
$ | 2,452 | $ | 1,964 | $ | 1,931 | |||||
| Global Institutional | 1,594 | 1,314 | 1,479 | ||||||||
| Global Funds | 966 | 770 | 885 | ||||||||
Total client assets(a) |
$ | 5,012 | $ | 4,048 | $ | 4,295 | |||||
| Client assets (continued) | |||||||||||
| Year ended December 31, (in billions) |
2023 | 2022 | 2021 | ||||||||
Assets under management rollforward |
|||||||||||
| Beginning balance | $ | 2,766 | $ | 3,113 | $ | 2,716 | |||||
| Net asset flows: | |||||||||||
| Liquidity | 242 | (55) | 68 | ||||||||
| Fixed income | 70 | 13 | 36 | ||||||||
| Equity | 70 | 35 | 85 | ||||||||
| Multi-asset | 1 | (9) | 17 | ||||||||
| Alternatives | (1) | 8 | 26 | ||||||||
| Market/performance/other impacts | 274 | (339) | 165 | ||||||||
| Ending balance, December 31 | $ | 3,422 | $ | 2,766 | $ | 3,113 | |||||
| Client assets rollforward | |||||||||||
| Beginning balance | $ | 4,048 | $ | 4,295 | $ | 3,652 | |||||
| Net asset flows | 490 | 49 | 389 | ||||||||
| Market/performance/other impacts | 474 | (296) | 254 | ||||||||
| Ending balance, December 31 | $ | 5,012 | $ | 4,048 | $ | 4,295 | |||||
| International metrics | |||||||||||
| Year ended December 31, (in billions, except where otherwise noted) |
2023 | 2022 | 2021 | ||||||||
Total net revenue (in millions)(a) |
|||||||||||
| Europe/Middle East/Africa | $ | 3,377 | $ | 3,240 | $ | 3,571 | |||||
| Asia-Pacific | 1,876 | 1,836 | 2,017 | ||||||||
| Latin America/Caribbean | 985 | 967 | 886 | ||||||||
| Total international net revenue | 6,238 | 6,043 | 6,474 | ||||||||
| North America | 13,589 | 11,705 | 10,483 | ||||||||
| Total net revenue | $ | 19,827 | $ | 17,748 | $ | 16,957 | |||||
| Assets under management | |||||||||||
| Europe/Middle East/Africa | $ | 539 | $ | 487 | $ | 561 | |||||
| Asia-Pacific | 263 | 218 | 254 | ||||||||
| Latin America/Caribbean | 86 | 69 | 79 | ||||||||
| Total international assets under management | 888 | 774 | 894 | ||||||||
| North America | 2,534 | 1,992 | 2,219 | ||||||||
| Total assets under management | $ | 3,422 | $ | 2,766 | $ | 3,113 | |||||
| Client assets | |||||||||||
| Europe/Middle East/Africa | $ | 740 | $ | 610 | $ | 687 | |||||
| Asia-Pacific | 406 | 331 | 381 | ||||||||
| Latin America/Caribbean | 232 | 189 | 195 | ||||||||
| Total international client assets | 1,378 | 1,130 | 1,263 | ||||||||
| North America | 3,634 | 2,918 | 3,032 | ||||||||
| Total client assets | $ | 5,012 | $ | 4,048 | $ | 4,295 | |||||
JPMorgan Chase & Co./2023 Form 10-K |
83 |
|||||||
| CORPORATE | ||||||||||||||
|
The Corporate segment consists of Treasury and Chief Investment Office (“CIO”) and Other Corporate. Treasury and CIO is predominantly responsible for measuring, monitoring, reporting and managing the Firm’s liquidity, funding, capital, structural interest rate and foreign exchange risks.
Other Corporate includes staff functions and expense that is centrally managed as well as certain Firm initiatives and activities not solely aligned to a specific LOB. The major Other Corporate functions include Real Estate, Technology, Legal, Corporate Finance, Human Resources, Internal Audit, Risk Management, Compliance, Control Management, Corporate Responsibility and various Other Corporate groups.
|
|||||
| Selected income statement and balance sheet data | ||||||||||||||
|
Year ended December 31,
(in millions, except employees)
|
2023 | 2022 | 2021 | |||||||||||
| Revenue | ||||||||||||||
| Principal transactions | $ | 302 | $ | (227) | $ | 187 | ||||||||
| Investment securities gains/(losses) | (3,180) | (2,380) | (345) | |||||||||||
| All other income | 3,010 | (c) |
809 | 226 | ||||||||||
| Noninterest revenue | 132 | (1,798) | 68 | |||||||||||
| Net interest income | 7,906 | (c) |
1,878 | (3,551) | ||||||||||
Total net revenue(a) |
8,038 | 80 | (3,483) | |||||||||||
| Provision for credit losses | 171 | 22 | 81 | |||||||||||
| Noninterest expense | 5,601 | (c)(d) |
1,034 | 1,802 | ||||||||||
| Income/(loss) before income tax expense/(benefit) | 2,266 | (976) | (5,366) | |||||||||||
| Income tax expense/(benefit) | (555) | (e) |
(233) | (1,653) | ||||||||||
| Net income/(loss) | $ | 2,821 | $ | (743) | $ | (3,713) | ||||||||
| Total net revenue | ||||||||||||||
| Treasury and CIO | 6,072 | (439) | (3,464) | |||||||||||
| Other Corporate | 1,966 | (c) |
519 | (19) | ||||||||||
| Total net revenue | $ | 8,038 | $ | 80 | $ | (3,483) | ||||||||
| Net income/(loss) | ||||||||||||||
| Treasury and CIO | 4,206 | (197) | (3,057) | |||||||||||
| Other Corporate | (1,385) | (c)(d) |
(546) | (656) | ||||||||||
| Total net income/(loss) | $ | 2,821 | $ | (743) | $ | (3,713) | ||||||||
| Total assets (period-end) | $ | 1,348,437 | $ | 1,328,219 | $ | 1,518,100 | ||||||||
| Loans (period-end) | 1,924 | 2,181 | 1,770 | |||||||||||
Deposits(b) |
21,826 | 14,203 | 396 | |||||||||||
Employees |
47,530 | 44,196 | 38,952 | |||||||||||
84 |
JPMorgan Chase & Co./2023 Form 10-K |
|||||||
| Selected income statement and balance sheet data | |||||||||||||||||
| As of or for the year ended December 31, (in millions) | 2023 | 2022 | 2021 | ||||||||||||||
| Investment securities losses | $ | (3,180) | $ | (2,380) | $ | (345) | |||||||||||
| Available-for-sale securities (average) | $ | 200,708 | $ | 239,924 | $ | 306,827 | |||||||||||
Held-to-maturity securities (average)(a) |
402,010 | 412,180 | 285,086 | ||||||||||||||
Investment securities portfolio (average) |
$ | 602,718 | $ | 652,104 | $ | 591,913 | |||||||||||
| Available-for-sale securities (period-end) | $ | 199,354 | (c) |
$ | 203,981 | $ | 306,352 | ||||||||||
Held-to-maturity securities (period–end)(a) |
369,848 | 425,305 | 363,707 | ||||||||||||||
Investment securities portfolio, net of allowance for credit losses (period–end)(b) |
$ | 569,202 | $ | 629,286 | $ | 670,059 | |||||||||||
JPMorgan Chase & Co./2023 Form 10-K |
85 |
|||||||
FIRMWIDE RISK MANAGEMENT | ||||||||||||||
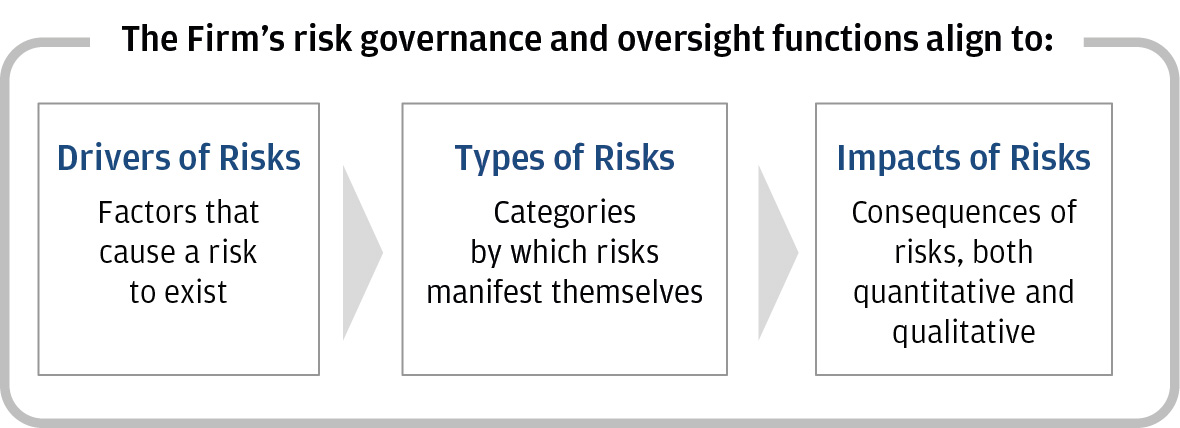
86 |
JPMorgan Chase & Co./2023 Form 10-K |
|||||||
JPMorgan Chase & Co./2023 Form 10-K |
87 |
|||||||
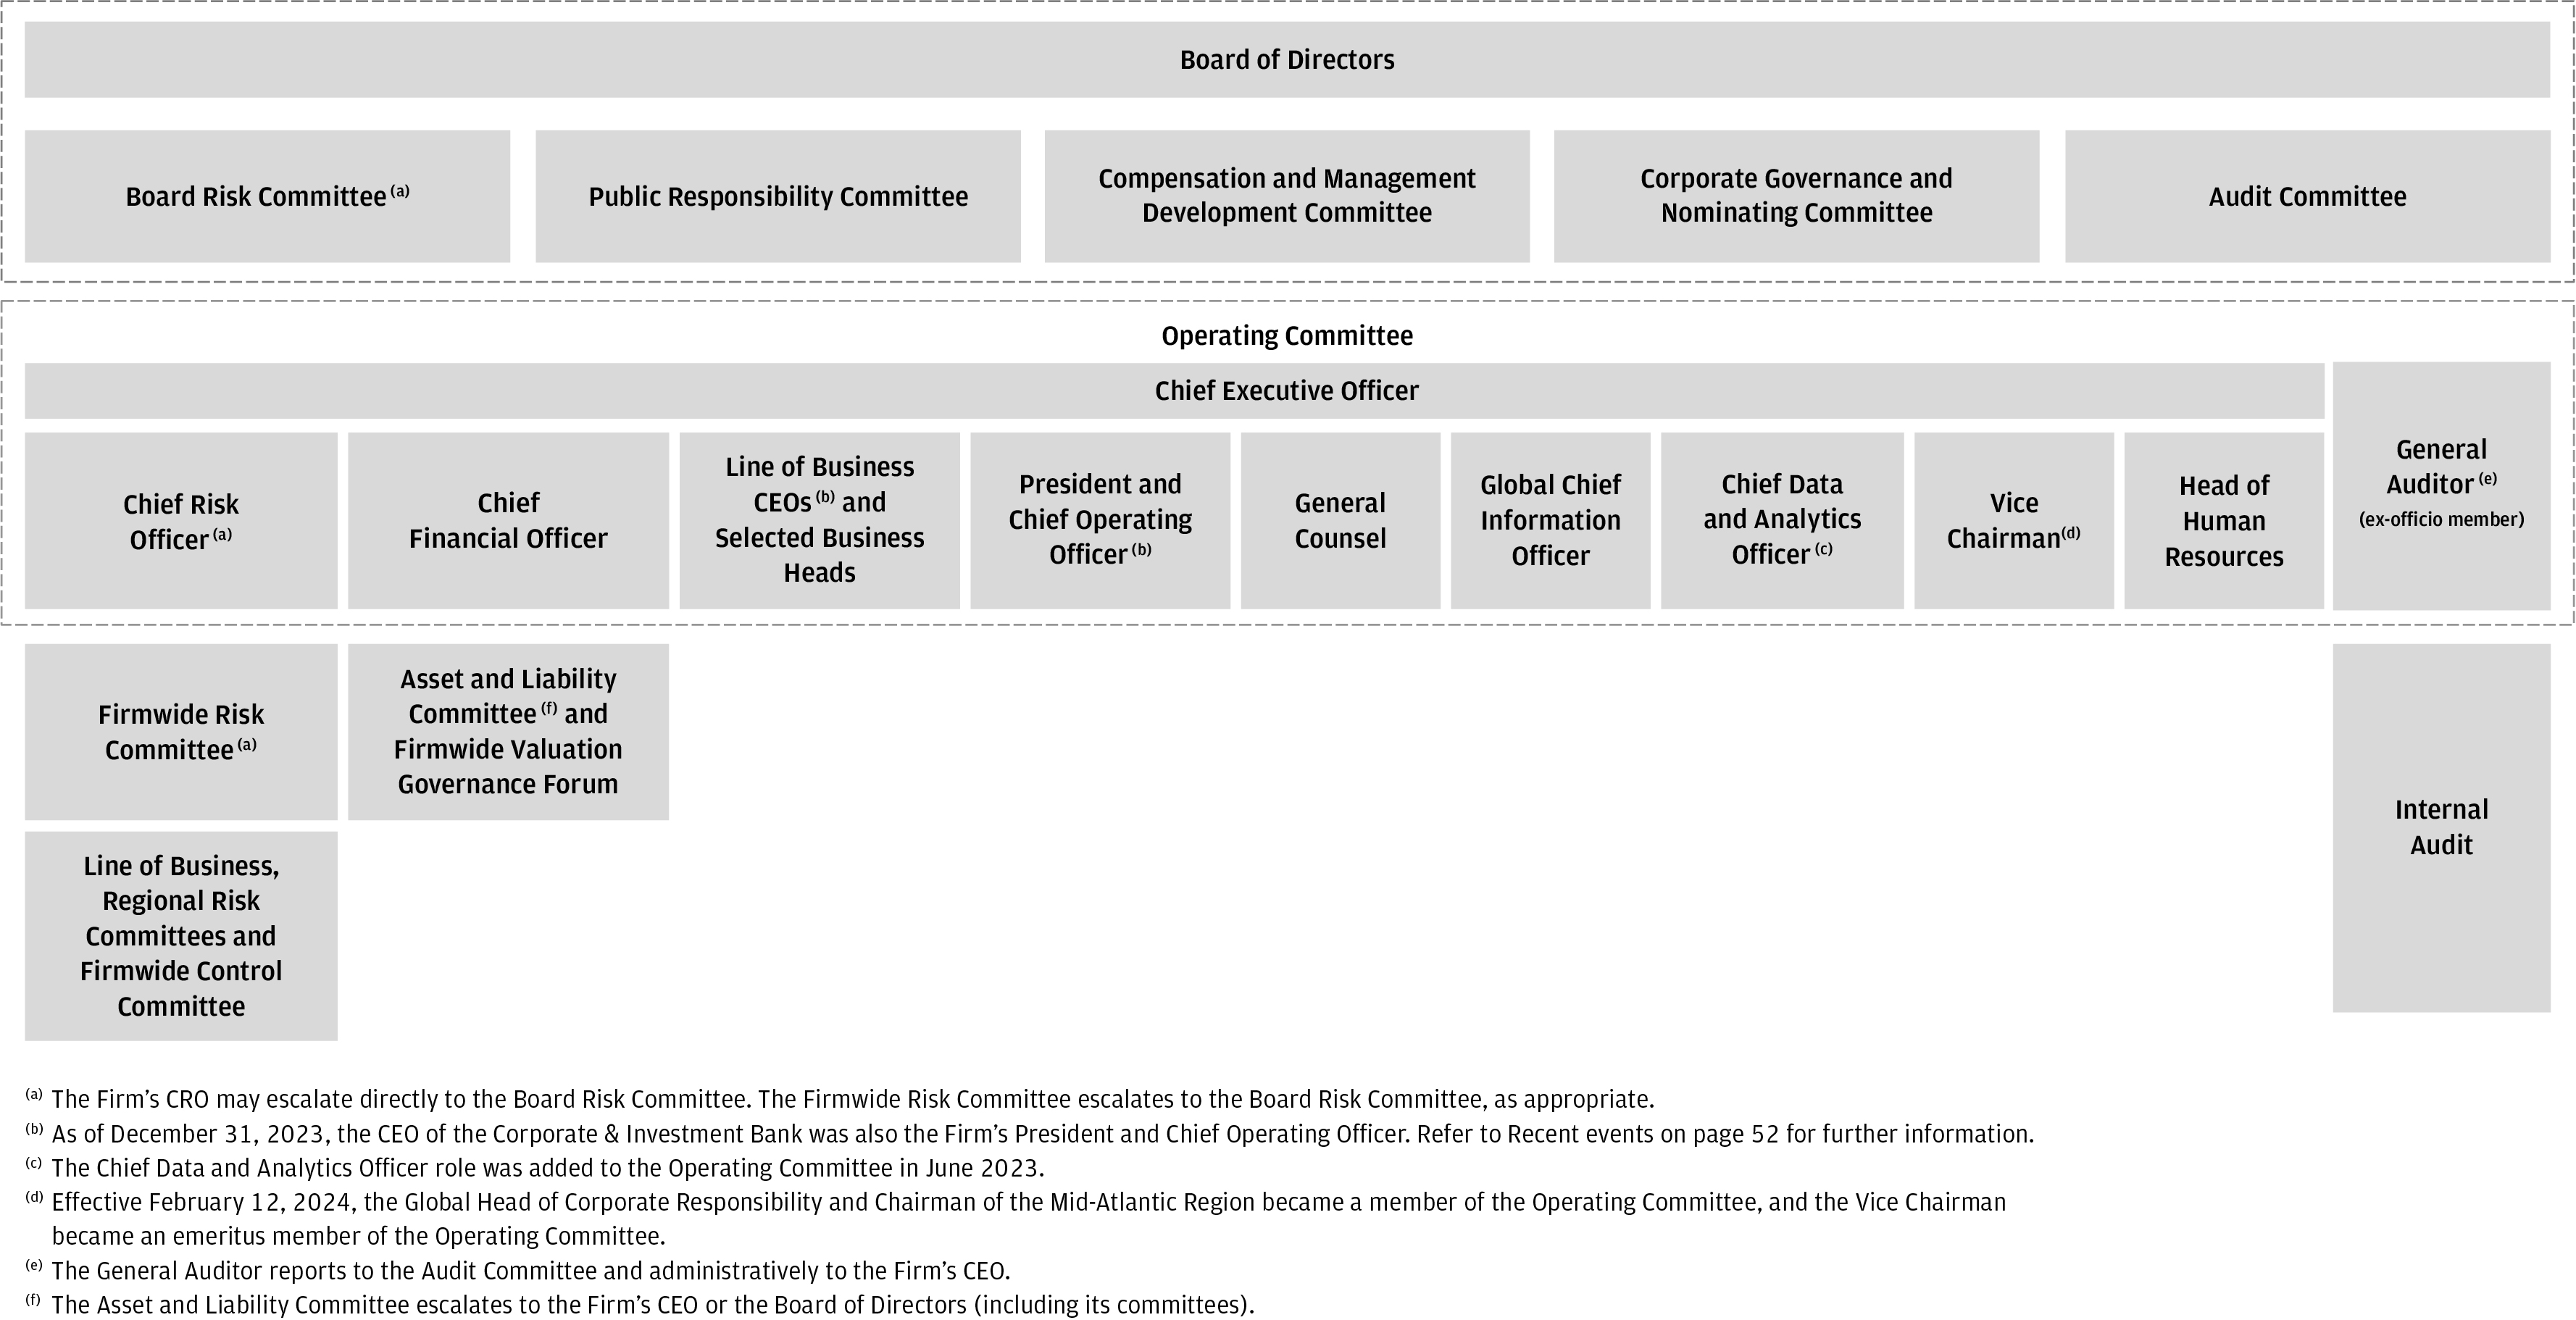
88 |
JPMorgan Chase & Co./2023 Form 10-K |
|||||||
| Risk governance and oversight functions | Page | ||||
| Strategic Risk | 90 | ||||
| Capital Risk | 91-101 | ||||
| Liquidity Risk | 102-109 | ||||
| Reputation Risk | 110 | ||||
| Consumer Credit Risk | 114-119 | ||||
| Wholesale Credit Risk | 120-130 | ||||
| Investment Portfolio Risk | 134 | ||||
| Market Risk | 135-143 | ||||
| Country Risk | 144-145 | ||||
| Climate Risk | 146 | ||||
| Operational Risk | 147-150 | ||||
| Compliance Risk | 151 | ||||
| Conduct Risk | 152 | ||||
| Legal Risk | 153 | ||||
| Estimations and Model Risk | 154 | ||||
JPMorgan Chase & Co./2023 Form 10-K |
89 |
|||||||
STRATEGIC RISK MANAGEMENT | ||||||||||||||
90 |
JPMorgan Chase & Co./2023 Form 10-K |
|||||||
CAPITAL RISK MANAGEMENT | ||||||||||||||
JPMorgan Chase & Co./2023 Form 10-K |
91 |
|||||||
92 |
JPMorgan Chase & Co./2023 Form 10-K |
|||||||
JPMorgan Chase & Co./2023 Form 10-K |
93 |
|||||||
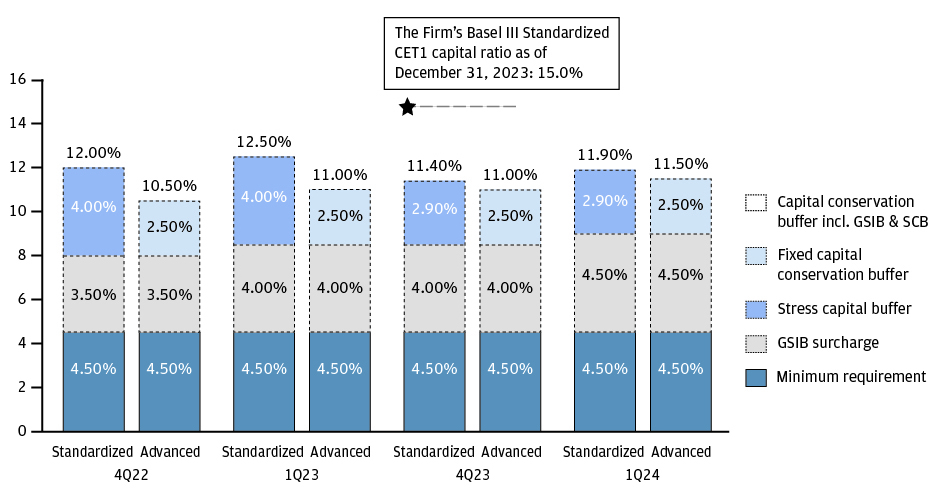
94 |
JPMorgan Chase & Co./2023 Form 10-K |
|||||||
| 2024 | 2023 | 2022 | |||||||||
| Method 1 | 2.5 | % | 2.5 | % | 2.0 | % | |||||
| Method 2 | 4.5 | % | 4.0 | % | 3.5 | % | |||||
JPMorgan Chase & Co./2023 Form 10-K |
95 |
|||||||
| Standardized | Advanced | ||||||||||||||||||||||||||||||||||
(in millions, except ratios) |
December 31, 2023 |
December 31, 2022 |
Capital ratio requirements(b) |
December 31, 2023 |
December 31, 2022 |
Capital ratio requirements(b) |
|||||||||||||||||||||||||||||
Risk-based capital metrics:(a) |
|||||||||||||||||||||||||||||||||||
| CET1 capital | $ | 250,585 | $ | 218,934 | $ | 250,585 | $ | 218,934 | |||||||||||||||||||||||||||
| Tier 1 capital | 277,306 | 245,631 | 277,306 | 245,631 | |||||||||||||||||||||||||||||||
| Total capital | 308,497 | 277,769 | 295,417 | (c) |
264,583 | ||||||||||||||||||||||||||||||
| Risk-weighted assets | 1,671,995 | 1,653,538 | 1,669,156 | (c) |
1,609,773 | ||||||||||||||||||||||||||||||
| CET1 capital ratio | 15.0 | % | 13.2 | % | 11.4 | % | 15.0 | % | 13.6 | % | 11.0 | % | |||||||||||||||||||||||
| Tier 1 capital ratio | 16.6 | 14.9 | 12.9 | 16.6 | 15.3 | 12.5 | |||||||||||||||||||||||||||||
| Total capital ratio | 18.5 | 16.8 | 14.9 | 17.7 | 16.4 | 14.5 | |||||||||||||||||||||||||||||
| Three months ended (in millions, except ratios) |
December 31, 2023 |
December 31, 2022 |
Capital ratio requirements(c) |
|||||||||||
Leverage-based capital metrics:(a) |
||||||||||||||
Adjusted average assets(b) |
$ | 3,831,200 | $ | 3,703,873 | ||||||||||
| Tier 1 leverage ratio | 7.2 | % | 6.6 | % | 4.0 | % | ||||||||
| Total leverage exposure | $ | 4,540,465 | $ | 4,367,092 | ||||||||||
| SLR | 6.1 | % | 5.6 | % | 5.0 | % | ||||||||
96 |
JPMorgan Chase & Co./2023 Form 10-K |
|||||||
| (in millions) | December 31, 2023 |
December 31, 2022 |
||||||||||||
| Total stockholders’ equity | $ | 327,878 | $ | 292,332 | ||||||||||
| Less: Preferred stock | 27,404 | 27,404 | ||||||||||||
| Common stockholders’ equity | 300,474 | 264,928 | ||||||||||||
| Add: | ||||||||||||||
Certain deferred tax liabilities(a) |
2,996 | 2,510 | ||||||||||||
Other CET1 capital adjustments(b) |
4,717 | 6,221 | ||||||||||||
| Less: | ||||||||||||||
Goodwill(c) |
54,377 | 53,501 | ||||||||||||
Other intangible assets |
3,225 | 1,224 | ||||||||||||
Standardized/Advanced CET1 capital |
250,585 | 218,934 | ||||||||||||
| Add: Preferred stock | 27,404 | 27,404 | ||||||||||||
Less: Other Tier 1 adjustments |
683 | 707 | ||||||||||||
Standardized/Advanced Tier 1 capital |
$ | 277,306 | $ | 245,631 | ||||||||||
Long-term debt and other instruments qualifying as Tier 2 capital |
$ | 11,779 | $ | 13,569 | ||||||||||
Qualifying allowance for credit losses(d) |
20,102 | 19,353 | ||||||||||||
Other |
(690) | (784) | ||||||||||||
Standardized Tier 2 capital |
$ | 31,191 | $ | 32,138 | ||||||||||
Standardized Total capital |
$ | 308,497 | $ | 277,769 | ||||||||||
Adjustment in qualifying allowance for credit losses for Advanced Tier 2 capital(e) |
(13,080) | (f) |
(13,186) | |||||||||||
Advanced Tier 2 capital |
$ | 18,111 | $ | 18,952 | ||||||||||
| Advanced Total capital | $ | 295,417 | $ | 264,583 | ||||||||||
| Year ended December 31, (in millions) | 2023 | ||||
| Standardized/Advanced CET1 capital at December 31, 2022 | $ | 218,934 | |||
| Net income applicable to common equity | 48,051 | ||||
| Dividends declared on common stock | (12,055) | ||||
Net purchase of treasury stock |
(8,881) | ||||
Changes in additional paid-in capital |
1,084 | ||||
| Changes related to AOCI applicable to capital: | |||||
| Unrealized gains/(losses) on investment securities | 5,381 | ||||
Translation adjustments, net of hedges(a) |
329 | ||||
| Fair value hedges | (101) | ||||
| Defined benefit pension and other postretirement employee benefit (“OPEB”) plans | 373 | ||||
Changes related to other CET1 capital adjustments(b) |
(2,530) | ||||
| Change in Standardized/Advanced CET1 capital | 31,651 | ||||
|
Standardized/Advanced CET1 capital at
December 31, 2023
|
$ | 250,585 | |||
| Standardized/Advanced Tier 1 capital at December 31, 2022 | $ | 245,631 | |||
Change in CET1 capital(b) |
31,651 | ||||
| Redemptions of noncumulative perpetual preferred stock | — | ||||
| Other | 24 | ||||
| Change in Standardized/Advanced Tier 1 capital | 31,675 | ||||
| Standardized/Advanced Tier 1 capital at December 31, 2023 | $ | 277,306 | |||
| Standardized Tier 2 capital at December 31, 2022 | $ | 32,138 | |||
Change in long-term debt and other instruments qualifying as Tier 2 |
(1,790) | ||||
Change in qualifying allowance for credit losses(b) |
749 | ||||
Other |
94 | ||||
Change in Standardized Tier 2 capital |
(947) | ||||
| Standardized Tier 2 capital at December 31, 2023 | $ | 31,191 | |||
| Standardized Total capital at December 31, 2023 | $ | 308,497 | |||
| Advanced Tier 2 capital at December 31, 2022 | $ | 18,952 | |||
Change in long-term debt and other instruments qualifying as Tier 2 |
(1,790) | ||||
Change in qualifying allowance for credit losses(b)(c) |
855 | ||||
Other |
94 | ||||
Change in Advanced Tier 2 capital |
(841) | ||||
| Advanced Tier 2 capital at December 31, 2023 | $ | 18,111 | |||
| Advanced Total capital at December 31, 2023 | $ | 295,417 | |||
JPMorgan Chase & Co./2023 Form 10-K |
97 |
|||||||
| Standardized | Advanced | |||||||||||||||||||||||||
| Year ended December 31, 2023 (in millions) |
Credit risk RWA(c) |
Market risk RWA | Total RWA | Credit risk RWA(c)(d) |
Market risk RWA | Operational risk RWA |
Total RWA | |||||||||||||||||||
| December 31, 2022 | $ | 1,568,536 | $ | 85,002 | $ | 1,653,538 | $ | 1,078,076 | $ | 85,432 | $ | 446,265 | $ | 1,609,773 | ||||||||||||
Model & data changes(a) |
(11,024) | (4,883) | (15,907) | (11,313) | (4,883) | — | (16,196) | |||||||||||||||||||
Movement in portfolio levels(b) |
46,339 | (11,975) | 34,364 | 88,498 | (11,946) | (973) | 75,579 | |||||||||||||||||||
| Changes in RWA | 35,315 | (16,858) | 18,457 | 77,185 | (16,829) | (973) | 59,383 | |||||||||||||||||||
| December 31, 2023 | $ | 1,603,851 | $ | 68,144 | $ | 1,671,995 | $ | 1,155,261 | $ | 68,603 | $ | 445,292 | $ | 1,669,156 | ||||||||||||
|
Three months ended
(in millions, except ratio)
|
December 31, 2023 |
December 31, 2022 |
||||||
Tier 1 capital |
$ | 277,306 | $ | 245,631 | ||||
| Total average assets | 3,885,632 | 3,755,271 | ||||||
Less: Regulatory capital adjustments(a) |
54,432 | 51,398 | ||||||
Total adjusted average assets(b) |
3,831,200 | 3,703,873 | ||||||
Add: Off-balance sheet exposures(c) |
709,265 | 663,219 | ||||||
Total leverage exposure |
$ | 4,540,465 | $ | 4,367,092 | ||||
SLR |
6.1 | % | 5.6 | % | ||||
| Line of business equity (Allocated capital) | ||||||||||||||
| December 31, | ||||||||||||||
| (in billions) | January 1, 2024 |
2023(a) |
2022 | |||||||||||
| Consumer & Community Banking | $ | 54.5 | $ | 55.5 | $ | 50.0 | ||||||||
| Corporate & Investment Bank | 102.0 | 108.0 | 103.0 | |||||||||||
| Commercial Banking | 30.0 | 30.0 | 25.0 | |||||||||||
| Asset & Wealth Management | 15.5 | 17.0 | 17.0 | |||||||||||
| Corporate | 98.5 | 90.0 | 69.9 | |||||||||||
Total common stockholders’ equity |
$ | 300.5 | $ | 300.5 | $ | 264.9 | ||||||||
98 |
JPMorgan Chase & Co./2023 Form 10-K |
|||||||
| Year ended December 31, | 2023 | 2022 | 2021 | ||||||||||||||
| Common dividend payout ratio | 25 | % | 33 | % | 25 | % | |||||||||||
| Year ended December 31, (in millions) | 2023 | 2022(b) |
2021(c) |
|||||||||||||||||
Total number of shares of common stock repurchased |
69.5 | 23.1 | 119.7 | |||||||||||||||||
Aggregate purchase price of common stock repurchases(a) |
$ | 9,898 | $ | 3,122 | $ | 18,448 | ||||||||||||||
JPMorgan Chase & Co./2023 Form 10-K |
99 |
|||||||
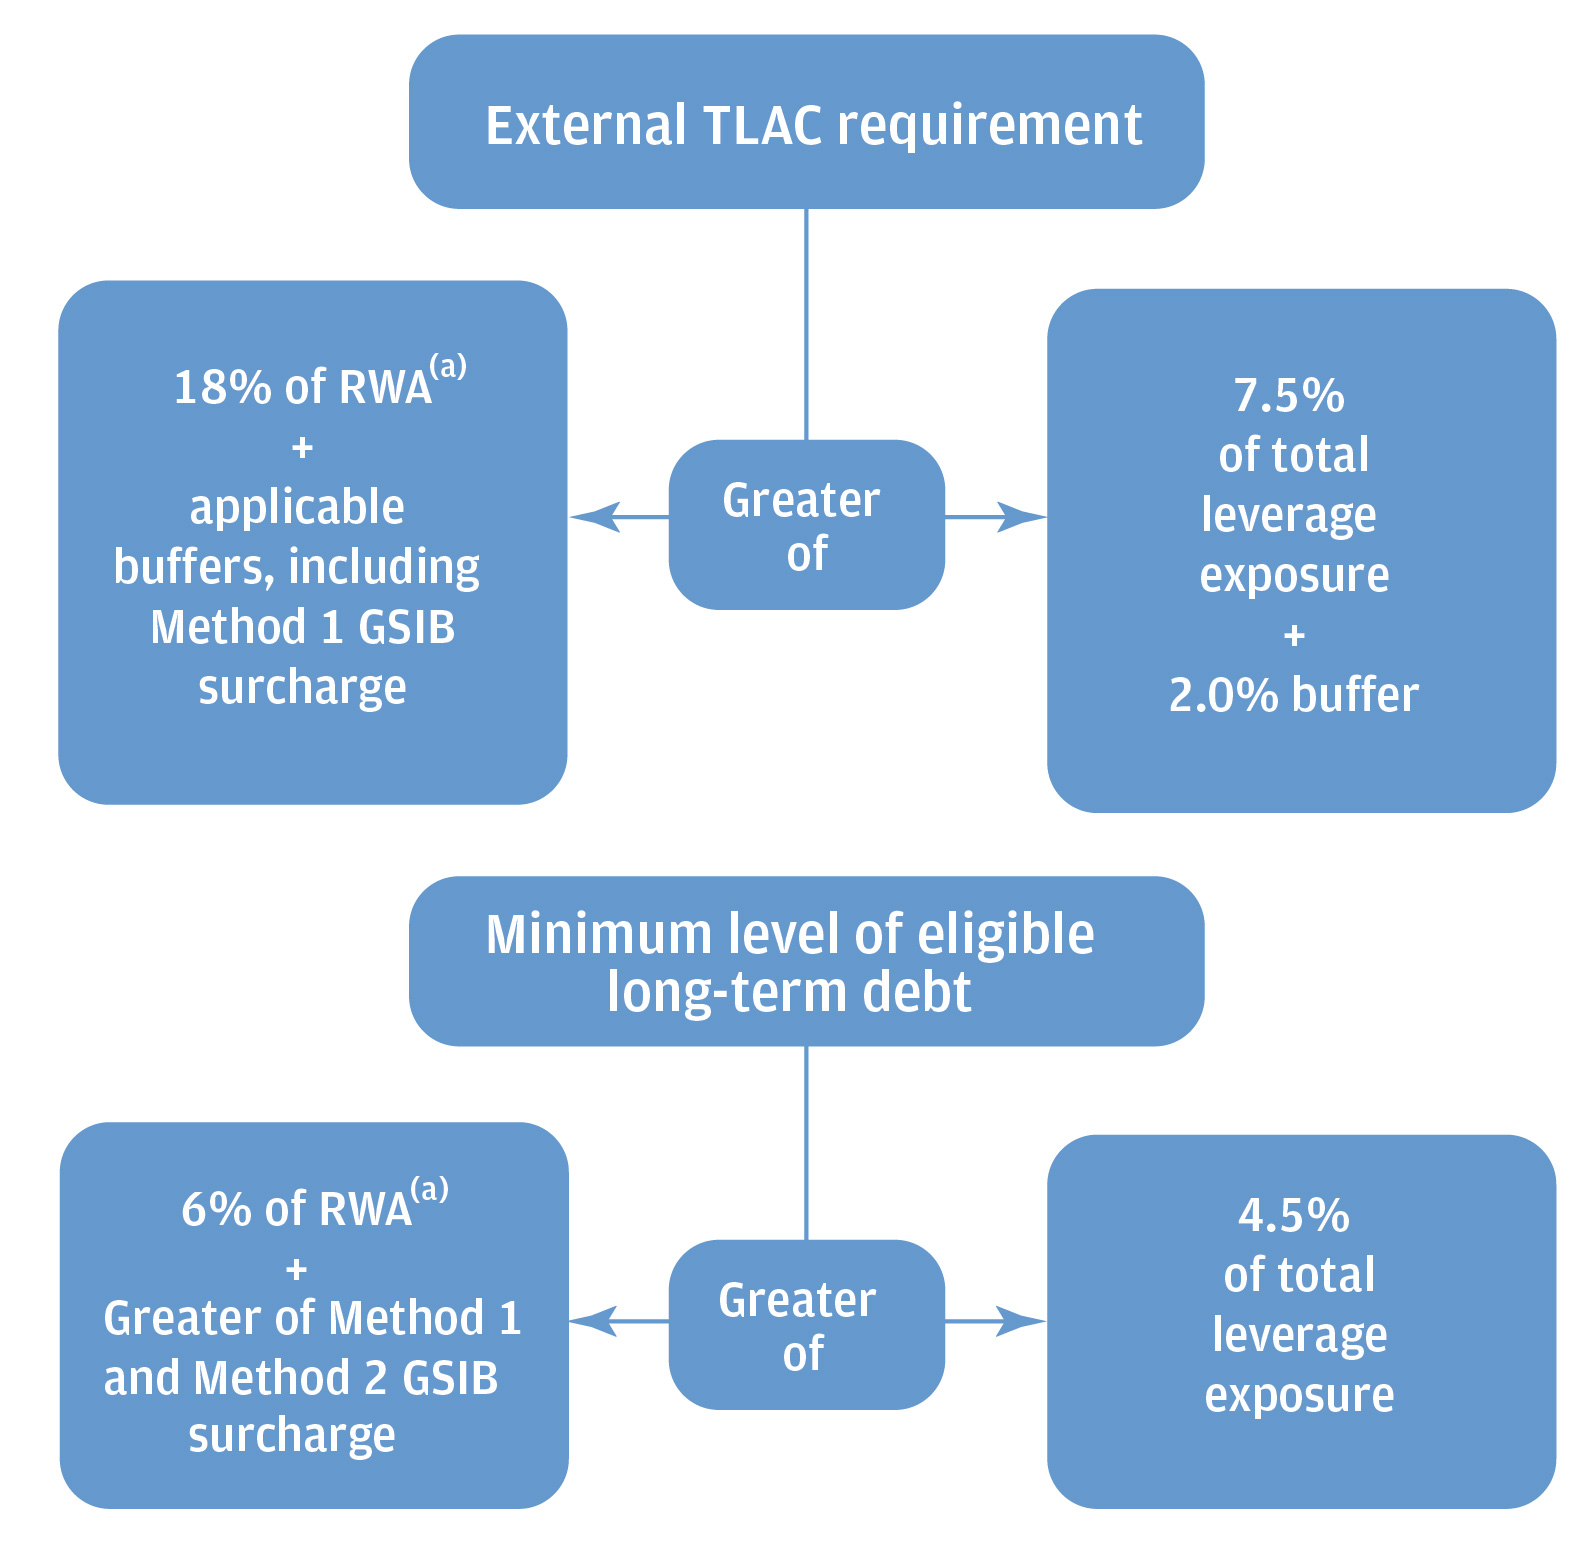
| December 31, 2023 | December 31, 2022 |
|||||||||||||
| (in billions, except ratio) | External TLAC | LTD | External TLAC | LTD | ||||||||||
| Total eligible amount | $ | 513.8 | $ | 222.6 | $ | 486.0 | $ | 228.5 | ||||||
| % of RWA | 30.7 | % | 13.3 | % | 29.4 | % | 13.8 | % | ||||||
| Regulatory requirements | 23.0 | 10.0 | 22.5 | 9.5 | ||||||||||
| Surplus/(shortfall) | $ | 129.2 | $ | 55.4 | $ | 114.0 | $ | 71.4 | ||||||
| % of total leverage exposure | 11.3 | % | 4.9 | % | 11.1 | % | 5.2 | % | ||||||
| Regulatory requirements | 9.5 | 4.5 | 9.5 | 4.5 | ||||||||||
| Surplus/(shortfall) | $ | 82.5 | $ | 18.3 | $ | 71.2 | $ | 32.0 | ||||||
100 |
JPMorgan Chase & Co./2023 Form 10-K |
|||||||
| December 31, 2023 | ||||||||
| (in millions) | Actual | Minimum | ||||||
| Net Capital | $ | 27,865 | $ | 5,346 | ||||
| December 31, 2023 | |||||||||||
| (in millions, except ratios) | Actual | Regulatory Minimum ratios(a) |
|||||||||
| Total capital | $ | 52,522 | |||||||||
| CET1 capital ratio | 16.9 | % | 4.5 | % | |||||||
| Tier 1 capital ratio | 22.3 | 6.0 | |||||||||
| Total capital ratio | 28.1 | 8.0 | |||||||||
| Tier 1 leverage ratio | 7.3 | 3.3 | (b) | ||||||||
| December 31, 2023 | Regulatory Minimum ratios(a) |
|||||||
| (in millions, except ratios) | Actual | |||||||
| Total capital | $ | 44,158 | ||||||
| CET1 capital ratio | 18.1 | % | 4.5 | % | ||||
| Tier 1 capital ratio | 18.1 | 6.0 | ||||||
| Total capital ratio | 32.2 | 8.0 | ||||||
| Tier 1 leverage ratio | 5.8 | 3.0 | ||||||
JPMorgan Chase & Co./2023 Form 10-K |
101 |
|||||||
LIQUIDITY RISK MANAGEMENT | ||||||||||||||
102 |
JPMorgan Chase & Co./2023 Form 10-K |
|||||||
| Three months ended | |||||||||||
| Average amount (in millions) |
December 31, 2023 | September 30, 2023 | December 31, 2022 |
||||||||
JPMorgan Chase & Co.: |
|||||||||||
| HQLA | |||||||||||
Eligible cash(a) |
$ | 485,263 | $ | 402,663 | $ | 542,847 | |||||
Eligible securities(b)(c) |
313,365 | 378,702 | 190,201 | ||||||||
Total HQLA(d) |
$ | 798,628 | $ | 781,365 | $ | 733,048 | |||||
| Net cash outflows | $ | 704,857 | $ | 696,668 | $ | 652,580 | |||||
| LCR | 113 | % | 112 | % | 112 | % | |||||
Net excess eligible HQLA(d) |
$ | 93,771 | $ | 84,697 | $ | 80,468 | |||||
JPMorgan Chase Bank, N.A.: | |||||||||||
| LCR | 129 | % | 123 | % | 151 | % | |||||
| Net excess eligible HQLA | $ | 215,190 | $ | 167,096 | $ | 356,733 | |||||
JPMorgan Chase & Co./2023 Form 10-K |
103 |
|||||||
104 |
JPMorgan Chase & Co./2023 Form 10-K |
|||||||
| As of or for the year ended December 31, | Average | |||||||||||||||||||
| (in millions) | 2023 | 2022 | 2023 | 2022 | ||||||||||||||||
Consumer & Community Banking |
$ | 1,094,738 | $ | 1,131,611 | $ | 1,126,552 | $ | 1,162,680 | ||||||||||||
Corporate & Investment Bank |
777,638 | 689,893 | 728,537 | 739,700 | ||||||||||||||||
Commercial Banking |
273,254 | 271,342 | 267,758 | 294,180 | ||||||||||||||||
Asset & Wealth Management |
233,232 | 233,130 | 216,178 | 261,489 | ||||||||||||||||
Corporate |
21,826 | 14,203 | 20,042 | 9,866 | ||||||||||||||||
| Total Firm | $ | 2,400,688 | $ | 2,340,179 | $ | 2,359,067 | $ | 2,467,915 | ||||||||||||
JPMorgan Chase & Co./2023 Form 10-K |
105 |
|||||||
| (in millions) | December 31, 2023 |
December 31, 2022 |
||||||||||||||||||
| U.S. | Non-U.S. | U.S. | Non-U.S. | |||||||||||||||||
| Three months or less | $ | 82,719 | $ | 77,466 | $ | 43,513 | $ | 68,765 | ||||||||||||
| Over three months but within 6 months | 17,736 | 5,358 | 8,670 | 3,658 | ||||||||||||||||
| Over six months but within 12 months | 10,294 | 4,820 | 7,035 | 2,850 | ||||||||||||||||
| Over 12 months | 710 | 2,543 | 787 | 2,634 | ||||||||||||||||
| Total | $ | 111,459 | $ | 90,187 | $ | 60,005 | $ | 77,907 | ||||||||||||
| As of December 31, (in billions except ratios) |
||||||||
| 2023 | 2022 | |||||||
Deposits |
$ | 2,400.7 | $ | 2,340.2 | ||||
Deposits as a % of total liabilities |
68 | % | 69 | % | ||||
Loans |
$ | 1,323.7 | $ | 1,135.6 | ||||
Loans-to-deposits ratio |
55 | % | 49 | % | ||||
| (Unaudited) Year ended December 31, |
Average balances | Average interest rates | |||||||||||||||||||||||||||||||||
| (in millions, except interest rates) | 2023 | 2022 | 2021 | 2023 | 2022 | 2021 | |||||||||||||||||||||||||||||
| U.S. offices | |||||||||||||||||||||||||||||||||||
| Noninterest-bearing | $ | 635,791 | $ | 691,206 | $ | 648,170 | NA | NA | NA | ||||||||||||||||||||||||||
| Interest-bearing | |||||||||||||||||||||||||||||||||||
Demand(a) |
279,725 | 324,512 | 322,122 | 3.50 | % | 0.92 | % | 0.06 | % | ||||||||||||||||||||||||||
Savings(b) |
864,558 | 971,788 | 930,866 | 1.10 | 0.28 | 0.06 | |||||||||||||||||||||||||||||
| Time | 145,827 | 62,022 | 48,628 | 4.74 | 2.07 | 0.26 | |||||||||||||||||||||||||||||
| Total interest-bearing deposits | 1,290,110 | 1,358,322 | 1,301,616 | 2.03 | 0.52 | 0.07 | |||||||||||||||||||||||||||||
| Total deposits in U.S. offices | 1,925,901 | 2,049,528 | 1,949,786 | 1.36 | 0.34 | 0.05 | |||||||||||||||||||||||||||||
| Non-U.S. offices | |||||||||||||||||||||||||||||||||||
| Noninterest-bearing | 24,747 | 28,043 | 26,315 | NA | NA | NA | |||||||||||||||||||||||||||||
| Interest-bearing | |||||||||||||||||||||||||||||||||||
| Demand | 321,976 | 324,740 | 313,304 | 2.71 | 0.57 | (0.10) | |||||||||||||||||||||||||||||
| Time | 86,443 | 65,604 | 57,749 | 5.82 | 1.85 | (0.09) | |||||||||||||||||||||||||||||
| Total interest-bearing deposits | 408,419 | 390,344 | 371,053 | 3.37 | 0.78 | (0.10) | |||||||||||||||||||||||||||||
| Total deposits in non-U.S. offices | 433,166 | 418,387 | 397,368 | 3.18 | 0.73 | (0.09) | |||||||||||||||||||||||||||||
| Total deposits | $ | 2,359,067 | $ | 2,467,915 | $ | 2,347,154 | 1.70 | % | 0.41 | % | 0.02 | % | |||||||||||||||||||||||
106 |
JPMorgan Chase & Co./2023 Form 10-K |
|||||||
| Sources of funds (excluding deposits) | ||||||||||||||||||||
| As of or for the year ended December 31, | Average | |||||||||||||||||||
| (in millions) | 2023 | 2022 | 2023 | 2022 | ||||||||||||||||
Commercial paper |
$ | 14,737 | $ | 12,557 | $ | 12,675 | $ | 16,151 | ||||||||||||
Other borrowed funds |
8,200 | 8,418 | 9,712 | 12,250 | ||||||||||||||||
| Federal funds purchased | 787 | 1,684 | 1,754 | 1,567 | ||||||||||||||||
| Total short-term unsecured funding | $ | 23,724 | $ | 22,659 | $ | 24,141 | $ | 29,968 | ||||||||||||
Securities sold under agreements to repurchase(a) |
$ | 212,804 | $ | 198,382 | $ | 249,661 | $ | 236,192 | ||||||||||||
Securities loaned(a) |
2,944 | 2,547 | 4,671 | 5,003 | ||||||||||||||||
| Other borrowed funds | 21,775 | (g) |
23,052 | 22,010 | 25,211 | |||||||||||||||
Obligations of Firm-administered multi-seller conduits(b) |
17,781 | 9,236 | 14,918 | 7,387 | ||||||||||||||||
Total short-term secured funding |
$ | 255,304 | $ | 233,217 | $ | 291,260 | $ | 273,793 | ||||||||||||
| Senior notes | $ | 191,202 | $ | 188,025 | $ | 181,803 | $ | 189,047 | ||||||||||||
| Subordinated debt | 19,708 | 21,803 | 20,374 | 20,125 | ||||||||||||||||
Structured notes(c) |
86,056 | 70,839 | 76,574 | 68,656 | ||||||||||||||||
| Total long-term unsecured funding | $ | 296,966 | $ | 280,667 | $ | 278,751 | $ | 277,828 | ||||||||||||
Credit card securitization(b) |
$ | 2,998 | $ | 1,999 | $ | 1,634 | $ | 1,950 | ||||||||||||
| FHLB advances | 41,246 | (g) |
11,093 | 28,865 | 11,103 | |||||||||||||||
Purchase Money Note(d) |
48,989 | NA | $ | 32,829 | NA | |||||||||||||||
Other long-term secured funding(e) |
4,624 | 4,105 | 4,513 | 3,837 | ||||||||||||||||
| Total long-term secured funding | $ | 97,857 | $ | 17,197 | $ | 67,841 | $ | 16,890 | ||||||||||||
Preferred stock(f) |
$ | 27,404 | $ | 27,404 | $ | 27,404 | $ | 31,893 | ||||||||||||
Common stockholders’ equity(f) |
$ | 300,474 | $ | 264,928 | $ | 282,056 | $ | 253,068 | ||||||||||||
JPMorgan Chase & Co./2023 Form 10-K |
107 |
|||||||
| Long-term unsecured funding | |||||||||||||||||
| Year ended December 31, | 2023 | 2022 | 2023 | 2022 | |||||||||||||
| (Notional in millions) | Parent Company | Subsidiaries | |||||||||||||||
| Issuance | |||||||||||||||||
| Senior notes issued in the U.S. market | $ | 14,256 | $ | 32,600 | $ | 3,750 | $ | — | |||||||||
| Senior notes issued in non-U.S. markets | 2,141 | 2,752 | — | — | |||||||||||||
| Total senior notes | 16,397 | 35,352 | 3,750 | — | |||||||||||||
| Subordinated debt | — | 3,500 | — | — | |||||||||||||
Structured notes(a) |
3,013 | 2,535 | 35,281 | 35,577 | |||||||||||||
Total long-term unsecured funding – issuance |
$ | 19,410 | $ | 41,387 | $ | 39,031 | $ | 35,577 | |||||||||
| Maturities/redemptions | |||||||||||||||||
| Senior notes | $ | 21,483 | $ | 16,700 | $ | 67 | $ | 65 | |||||||||
| Subordinated debt | 2,090 | — | — | — | |||||||||||||
| Structured notes | 1,532 | 1,594 | 28,777 | 25,481 | |||||||||||||
Total long-term unsecured funding – maturities/redemptions |
$ | 25,105 | $ | 18,294 | $ | 28,844 | $ | 25,546 | |||||||||
| Long-term secured funding | ||||||||||||||||||||
| Year ended December 31, | Issuance | Maturities/Redemptions | ||||||||||||||||||
| (in millions) | 2023 | 2022 | 2023 | 2022 | ||||||||||||||||
Credit card securitization |
$ | 1,998 | $ | 999 | $ | 1,000 | $ | 1,400 | ||||||||||||
| FHLB advances | 39,775 | — | 9,485 | 14 | ||||||||||||||||
Purchase Money Note(a) |
50,000 | NA | — | NA | ||||||||||||||||
Other long-term secured funding(b) |
991 | 476 | 432 | 268 | ||||||||||||||||
Total long-term secured funding |
$ | 92,764 | $ | 1,475 | $ | 10,917 | $ | 1,682 | ||||||||||||
108 |
JPMorgan Chase & Co./2023 Form 10-K |
|||||||
| JPMorgan Chase & Co. | JPMorgan Chase Bank, N.A. |
J.P. Morgan Securities LLC
J.P. Morgan Securities plc
J.P. Morgan SE
|
|||||||||||||||||||||||||||||||||
| December 31, 2023 | Long-term issuer | Short-term issuer | Outlook | Long-term issuer | Short-term issuer | Outlook | Long-term issuer | Short-term issuer | Outlook | ||||||||||||||||||||||||||
| Moody’s Investors Service | A1 | P-1 | Stable | Aa2 | P-1 | Negative | (b) |
Aa3 | P-1 | Stable | |||||||||||||||||||||||||
Standard & Poor’s(a) |
A- | A-2 | Stable | A+ | A-1 | Stable | A+ | A-1 | Stable | ||||||||||||||||||||||||||
| Fitch Ratings | AA- | F1+ | Stable | AA | F1+ | Stable | AA | F1+ | Stable | ||||||||||||||||||||||||||
JPMorgan Chase & Co./2023 Form 10-K |
109 |
|||||||
REPUTATION RISK MANAGEMENT | ||||||||||||||
110 |
JPMorgan Chase & Co./2023 Form 10-K |
|||||||
| CREDIT AND INVESTMENT RISK MANAGEMENT | ||||||||||||||
JPMorgan Chase & Co./2023 Form 10-K |
111 |
|||||||
112 |
JPMorgan Chase & Co./2023 Form 10-K |
|||||||
| CREDIT PORTFOLIO | ||||||||||||||
| Total credit portfolio | ||||||||||||||||||||
| December 31, (in millions) |
Credit exposure | Nonperforming(d) |
||||||||||||||||||
| 2023 | 2022 | 2023 | 2022 | |||||||||||||||||
| Loans retained | $ | 1,280,870 | $ | 1,089,598 | $ | 5,989 | $ | 5,837 | ||||||||||||
| Loans held-for-sale | 3,985 | 3,970 | 184 | 54 | ||||||||||||||||
| Loans at fair value | 38,851 | 42,079 | 744 | 829 | ||||||||||||||||
| Total loans | 1,323,706 | 1,135,647 | 6,917 | 6,720 | ||||||||||||||||
| Derivative receivables | 54,864 | 70,880 | 364 | 296 | ||||||||||||||||
Receivables from customers(a) |
47,625 | 49,257 | — | — | ||||||||||||||||
Total credit-related assets |
1,426,195 | 1,255,784 | 7,281 | 7,016 | ||||||||||||||||
Assets acquired in loan satisfactions |
||||||||||||||||||||
| Real estate owned | NA | NA | 274 | 203 | ||||||||||||||||
| Other | NA | NA | 42 | 28 | ||||||||||||||||
Total assets acquired in loan satisfactions |
NA | NA | 316 | 231 | ||||||||||||||||
| Lending-related commitments | 1,497,847 | 1,326,782 | 464 | 455 | ||||||||||||||||
| Total credit portfolio | $ | 2,924,042 | (c) |
$ | 2,582,566 | $ | 8,061 | $ | 7,702 | |||||||||||
Credit derivatives and credit-related notes used in credit portfolio management activities(b) |
$ | (37,779) | $ | (19,330) | $ | — | $ | — | ||||||||||||
| Liquid securities and other cash collateral held against derivatives | (22,461) | (23,014) | NA | NA | ||||||||||||||||
| December 31, (in millions, except ratios) |
2023 | 2022 | ||||||
| Total nonaccrual loans | $ | 6,917 | $ | 6,720 | ||||
| Total loans | 1,323,706 | 1,135,647 | ||||||
| Firmwide nonaccrual loans to total loans outstanding | 0.52 | % | 0.59 | % | ||||
| Year ended December 31, (in millions, except ratios) |
2023 | 2022 | ||||||
| Net charge-offs | $ | 6,209 | $ | 2,853 | ||||
Average retained loans |
1,202,348 | 1,044,765 | ||||||
Net charge-off rates |
0.52 | % | 0.27 | % | ||||
JPMorgan Chase & Co./2023 Form 10-K |
113 |
|||||||
| CONSUMER CREDIT PORTFOLIO | ||||||||||||||
114 |
JPMorgan Chase & Co./2023 Form 10-K |
|||||||
| Consumer credit portfolio | ||||||||||||||||||||
| December 31, (in millions) |
Credit exposure | Nonaccrual loans(j)(k)(l) |
||||||||||||||||||
| 2023 | 2022 | 2023 | 2022 | |||||||||||||||||
| Consumer, excluding credit card | ||||||||||||||||||||
Residential real estate(a) |
$ | 326,409 | $ | 237,561 | $ | 3,466 | $ | 3,745 | ||||||||||||
Auto and other(b)(c) |
70,866 | 63,192 | 177 | 129 | ||||||||||||||||
| Total loans - retained | 397,275 | 300,753 | 3,643 | 3,874 | ||||||||||||||||
| Loans held-for-sale | 487 | 618 | 95 | 28 | ||||||||||||||||
Loans at fair value(d) |
12,331 | 10,004 | 465 | 423 | ||||||||||||||||
| Total consumer, excluding credit card loans | 410,093 | 311,375 | 4,203 | 4,325 | ||||||||||||||||
Lending-related commitments(e) |
45,403 | 33,518 | ||||||||||||||||||
Total consumer exposure, excluding credit card |
455,496 | (i) |
344,893 | |||||||||||||||||
| Credit card | ||||||||||||||||||||
Loans retained(f) |
211,123 | 185,175 | NA | NA | ||||||||||||||||
| Total credit card loans | 211,123 | 185,175 | NA | NA | ||||||||||||||||
Lending-related commitments(e)(g) |
915,658 | 821,284 | ||||||||||||||||||
| Total credit card exposure | 1,126,781 | 1,006,459 | ||||||||||||||||||
| Total consumer credit portfolio | $ | 1,582,277 | $ | 1,351,352 | $ | 4,203 | $ | 4,325 | ||||||||||||
Credit-related notes used in credit portfolio management activities(h) |
$ | (790) | $ | (1,187) | ||||||||||||||||
| Year ended December 31, | ||||||||||||||||||||||||||
| (in millions, except ratios) | Net charge-offs/(recoveries) | Average loans - retained | Net charge-off/(recovery) rate(m) |
|||||||||||||||||||||||
| 2023 | 2022 | 2023 | 2022 | 2023 | 2022 | |||||||||||||||||||||
Consumer, excluding credit card |
||||||||||||||||||||||||||
| Residential real estate | $ | (52) | $ | (226) | $ | 296,515 | $ | 233,454 | (0.02) | % | (0.10) | % | ||||||||||||||
| Auto and other | 684 | 495 | 67,546 | 65,955 | 1.01 | 0.75 | ||||||||||||||||||||
| Total consumer, excluding credit card - retained | 632 | 269 | 364,061 | 299,409 | 0.17 | 0.09 | ||||||||||||||||||||
| Credit card - retained | 4,698 | 2,403 | 191,412 | 163,335 | 2.45 | 1.47 | ||||||||||||||||||||
| Total consumer - retained | $ | 5,330 | $ | 2,672 | $ | 555,473 | $ | 462,744 | 0.96 | % | 0.58 | % | ||||||||||||||
JPMorgan Chase & Co./2023 Form 10-K |
115 |
|||||||
| December 31, 2023 (in millions) |
Within
1 year(e)
|
1-5 years |
5-15 years |
After 15 years | Total | ||||||||||||||||||||||||
| Consumer, excluding credit card | |||||||||||||||||||||||||||||
| Residential real estate | $ | 17,830 | $ | 27,447 | $ | 110,504 | $ | 181,593 | $ | 337,374 | |||||||||||||||||||
| Auto and other | 20,191 | (f) |
47,315 | 5,209 | 4 | 72,719 | |||||||||||||||||||||||
Total consumer, excluding credit card loans(a) |
$ | 38,021 | $ | 74,762 | $ | 115,713 | $ | 181,597 | $ | 410,093 | |||||||||||||||||||
| Total credit card loans | $ | 210,418 | $ | 700 | $ | 5 | $ | — | $ | 211,123 | |||||||||||||||||||
| Total consumer loans | $ | 248,439 | $ | 75,462 | $ | 115,718 | $ | 181,597 | $ | 621,216 | |||||||||||||||||||
| Loans due after one year at fixed interest rates | |||||||||||||||||||||||||||||
Residential real estate(b) |
$ | 20,337 | $ | 59,603 | $ | 89,044 | |||||||||||||||||||||||
| Auto and other | 47,236 | 3,767 | 4 | ||||||||||||||||||||||||||
| Credit card | 700 | 5 | — | ||||||||||||||||||||||||||
Loans due after one year at variable interest rates(c) |
|||||||||||||||||||||||||||||
Residential real estate(d) |
$ | 7,110 | $ | 50,901 | $ | 92,549 | |||||||||||||||||||||||
| Auto and other | 79 | 1,442 | — | ||||||||||||||||||||||||||
| Total consumer loans | $ | 75,462 | $ | 115,718 | $ | 181,597 | |||||||||||||||||||||||
116 |
JPMorgan Chase & Co./2023 Form 10-K |
|||||||
| (in millions) | December 31, 2023 | December 31, 2022 | ||||||
| Current | $ | 446 | $ | 659 | ||||
| 30-89 days past due | 102 | 136 | ||||||
| 90 or more days past due | 182 | 302 | ||||||
| Total government guaranteed loans | $ | 730 | $ | 1,097 | ||||
JPMorgan Chase & Co./2023 Form 10-K |
117 |
|||||||
Nonperforming assets(a) |
||||||||
| December 31, (in millions) | 2023 | 2022 | ||||||
| Nonaccrual loans | ||||||||
Residential real estate(b) |
$ | 4,015 | $ | 4,196 | ||||
Auto and other(c) |
188 | 129 | ||||||
| Total nonaccrual loans | 4,203 | 4,325 | ||||||
| Assets acquired in loan satisfactions | ||||||||
| Real estate owned | 120 | 129 | ||||||
| Other | 42 | 28 | ||||||
| Total assets acquired in loan satisfactions | 162 | 157 | ||||||
| Total nonperforming assets | $ | 4,365 | $ | 4,482 | ||||
| Nonaccrual loan activity | ||||||||
| Year ended December 31, | ||||||||
| (in millions) | 2023 | 2022 | ||||||
| Beginning balance | $ | 4,325 | $ | 5,350 | ||||
| Additions: | 2,894 | 2,196 | ||||||
| Reductions: | ||||||||
Principal payments and other(a) |
1,306 | 1,393 | ||||||
| Charge-offs | 472 | 255 | ||||||
| Returned to performing status | 1,052 | 1,405 | ||||||
| Foreclosures and other liquidations | 186 | 168 | ||||||
| Total reductions | 3,016 | 3,221 | ||||||
| Net changes | (122) | (1,025) | ||||||
| Ending balance | $ | 4,203 | $ | 4,325 | ||||
118 |
JPMorgan Chase & Co./2023 Form 10-K |
|||||||
JPMorgan Chase & Co./2023 Form 10-K |
119 |
|||||||
| WHOLESALE CREDIT PORTFOLIO | ||||||||||||||
| Wholesale credit portfolio | |||||||||||||||||
| December 31, (in millions) |
Credit exposure | Nonperforming | |||||||||||||||
| 2023 | 2022 | 2023 | 2022 | ||||||||||||||
| Loans retained | $ | 672,472 | $ | 603,670 | $ | 2,346 | $ | 1,963 | |||||||||
| Loans held-for-sale | 3,498 | 3,352 | 89 | 26 | |||||||||||||
| Loans at fair value | 26,520 | 32,075 | 279 | 406 | |||||||||||||
| Loans | 702,490 | 639,097 | 2,714 | 2,395 | |||||||||||||
| Derivative receivables | 54,864 | 70,880 | 364 | 296 | |||||||||||||
Receivables from customers(a) |
47,625 | 49,257 | — | — | |||||||||||||
Total wholesale credit-related assets |
804,979 | 759,234 | 3,078 | 2,691 | |||||||||||||
Assets acquired in loan satisfactions |
|||||||||||||||||
| Real estate owned | NA | NA | 154 | 74 | |||||||||||||
| Other | NA | NA | — | — | |||||||||||||
Total assets acquired in loan satisfactions |
NA | NA | 154 | 74 | |||||||||||||
| Lending-related commitments | 536,786 | 471,980 | 464 | 455 | |||||||||||||
Total wholesale credit portfolio |
$ | 1,341,765 | (c) |
$ | 1,231,214 | $ | 3,696 | $ | 3,220 | ||||||||
Credit derivatives and credit-related notes used in credit portfolio management activities(b) |
$ | (36,989) | $ | (18,143) | $ | — | $ | — | |||||||||
| Liquid securities and other cash collateral held against derivatives | (22,461) | (23,014) | NA | NA | |||||||||||||
120 |
JPMorgan Chase & Co./2023 Form 10-K |
|||||||
Maturity profile(d) |
Ratings profile | ||||||||||||||||||||||||||||||||||
| 1 year or less |
After 1 year through 5 years |
After 5 years | Total | Total | Total % of IG |
||||||||||||||||||||||||||||||
|
December 31, 2023
(in millions, except ratios)
|
Investment-grade | Noninvestment-grade | |||||||||||||||||||||||||||||||||
| Loans retained | $ | 211,104 | $ | 280,821 | $ | 180,547 | $ | 672,472 | $ | 458,838 | $ | 213,634 | $ | 672,472 | 68 | % | |||||||||||||||||||
| Derivative receivables | 54,864 | 54,864 | |||||||||||||||||||||||||||||||||
| Less: Liquid securities and other cash collateral held against derivatives | (22,461) | (22,461) | |||||||||||||||||||||||||||||||||
| Total derivative receivables, net of collateral | 8,007 | 8,970 | 15,426 | 32,403 | 24,919 | 7,484 | 32,403 | 77 | |||||||||||||||||||||||||||
| Lending-related commitments | 143,337 | 368,646 | 24,803 | 536,786 | 341,611 | 195,175 | 536,786 | 64 | |||||||||||||||||||||||||||
| Subtotal | 362,448 | 658,437 | 220,776 | 1,241,661 | 825,368 | 416,293 | 1,241,661 | 66 | |||||||||||||||||||||||||||
Loans held-for-sale and loans at fair value(a) |
30,018 | 30,018 | |||||||||||||||||||||||||||||||||
| Receivables from customers | 47,625 | 47,625 | |||||||||||||||||||||||||||||||||
| Total exposure – net of liquid securities and other cash collateral held against derivatives | $ | 1,319,304 | $ | 1,319,304 | |||||||||||||||||||||||||||||||
Credit derivatives and credit-related notes used in credit portfolio management activities(b)(c) |
$ | (3,311) | $ | (28,353) | $ | (5,325) | $ | (36,989) | $ | (28,869) | $ | (8,120) | $ | (36,989) | 78 | % | |||||||||||||||||||
Maturity profile(d) |
Ratings profile | |||||||||||||||||||||||||||||||||||||
| 1 year or less |
After 1 year through 5 years |
After 5 years | Total | Total | Total % of IG |
|||||||||||||||||||||||||||||||||
| December 31, 2022 (in millions, except ratios) |
Investment-grade | Noninvestment-grade | ||||||||||||||||||||||||||||||||||||
| Loans retained | $ | 204,761 | $ | 253,896 | $ | 145,013 | $ | 603,670 | $ | 425,412 | $ | 178,258 | $ | 603,670 | 70 | % | ||||||||||||||||||||||
| Derivative receivables | 70,880 | 70,880 | ||||||||||||||||||||||||||||||||||||
| Less: Liquid securities and other cash collateral held against derivatives | (23,014) | (23,014) | ||||||||||||||||||||||||||||||||||||
| Total derivative receivables, net of collateral | 13,508 | 14,880 | 19,478 | 47,866 | 36,231 | 11,635 | 47,866 | 76 | ||||||||||||||||||||||||||||||
| Lending-related commitments | 101,083 | 347,456 | 23,441 | 471,980 | 327,168 | 144,812 | 471,980 | 69 | ||||||||||||||||||||||||||||||
| Subtotal | 319,352 | 616,232 | 187,932 | 1,123,516 | 788,811 | 334,705 | 1,123,516 | 70 | ||||||||||||||||||||||||||||||
Loans held-for-sale and loans at fair value(a) |
35,427 | 35,427 | ||||||||||||||||||||||||||||||||||||
| Receivables from customers | 49,257 | 49,257 | ||||||||||||||||||||||||||||||||||||
| Total exposure – net of liquid securities and other cash collateral held against derivatives | $ | 1,208,200 | $ | 1,208,200 | ||||||||||||||||||||||||||||||||||
Credit derivatives and credit-related notes used in credit portfolio management activities(b)(c) |
$ | (2,817) | $ | (13,530) | $ | (1,796) | $ | (18,143) | $ | (15,115) | $ | (3,028) | $ | (18,143) | 83 | % | ||||||||||||||||||||||
JPMorgan Chase & Co./2023 Form 10-K |
121 |
|||||||
Wholesale credit exposure – industries(a) |
|||||||||||||||||||||||||||||
| Selected metrics | |||||||||||||||||||||||||||||
|
30 days or more past due and accruing
loans(i)
|
Net charge-offs/ (recoveries) |
Credit derivative and credit-related notes(i) |
Liquid securities and other cash collateral held against derivative receivables |
||||||||||||||||||||||||||
| Noninvestment-grade | |||||||||||||||||||||||||||||
|
Credit
exposure(f)(g)(h)
|
Investment- grade |
Noncriticized | Criticized performing | Criticized nonperforming |
|||||||||||||||||||||||||
|
As of or for the year ended
December 31, 2023
(in millions)
| |||||||||||||||||||||||||||||
| Real Estate | $ | 208,261 | $ | 148,866 | $ | 50,190 | $ | 8,558 | $ | 647 | $ | 717 | $ | 275 | $ | (574) | $ | — | |||||||||||
Individuals and Individual Entities(b) |
145,849 | 110,673 | 34,261 | 334 | 581 | 861 | 10 | — | — | ||||||||||||||||||||
Asset Managers |
129,574 | 83,857 | 45,623 | 90 | 4 | 201 | 1 | — | (7,209) | ||||||||||||||||||||
| Consumer & Retail | 127,086 | 60,168 | 58,606 | 7,863 | 449 | 318 | 161 | (4,204) | — | ||||||||||||||||||||
| Technology, Media & Telecommunications | 77,296 | 40,468 | 27,094 | 9,388 | 346 | 36 | 81 | (4,287) | — | ||||||||||||||||||||
| Industrials | 75,092 | 40,951 | 30,586 | 3,419 | 136 | 213 | 31 | (2,949) | — | ||||||||||||||||||||
| Healthcare | 65,025 | 43,163 | 18,396 | 3,005 | 461 | 130 | 17 | (3,070) | — | ||||||||||||||||||||
| Banks & Finance Companies | 57,177 | 33,881 | 22,744 | 545 | 7 | 9 | 277 | (511) | (412) | ||||||||||||||||||||
| Utilities | 36,061 | 25,242 | 9,929 | 765 | 125 | 1 | (3) | (2,373) | — | ||||||||||||||||||||
State & Municipal Govt(c) |
35,986 | 33,561 | 2,390 | 27 | 8 | 31 | — | (4) | — | ||||||||||||||||||||
| Oil & Gas | 34,475 | 18,276 | 16,076 | 111 | 12 | 45 | 11 | (1,927) | (5) | ||||||||||||||||||||
| Automotive | 33,977 | 23,152 | 10,060 | 640 | 125 | 59 | — | (653) | — | ||||||||||||||||||||
| Chemicals & Plastics | 20,773 | 11,353 | 8,352 | 916 | 152 | 106 | 2 | (1,045) | — | ||||||||||||||||||||
| Insurance | 20,501 | 14,503 | 5,700 | 298 | — | 2 | — | (961) | (6,898) | ||||||||||||||||||||
| Central Govt | 17,704 | 17,264 | 312 | 127 | 1 | — | — | (3,490) | (2,085) | ||||||||||||||||||||
| Transportation | 16,060 | 8,865 | 5,943 | 1,196 | 56 | 23 | (26) | (574) | — | ||||||||||||||||||||
| Metals & Mining | 15,508 | 8,403 | 6,514 | 536 | 55 | 12 | 44 | (229) | — | ||||||||||||||||||||
| Securities Firms | 8,689 | 4,570 | 4,118 | 1 | — | — | — | (14) | (2,765) | ||||||||||||||||||||
| Financial Markets Infrastructure | 4,251 | 4,052 | 199 | — | — | — | — | — | — | ||||||||||||||||||||
All other(d) |
134,777 | 115,711 | 18,618 | 439 | 9 | 21 | (2) | (10,124) | (3,087) | ||||||||||||||||||||
| Subtotal | $ | 1,264,122 | $ | 846,979 | $ | 375,711 | $ | 38,258 | $ | 3,174 | $ | 2,785 | $ | 879 | $ | (36,989) | $ | (22,461) | |||||||||||
| Loans held-for-sale and loans at fair value | 30,018 | ||||||||||||||||||||||||||||
| Receivables from customers | 47,625 | ||||||||||||||||||||||||||||
Total(e) |
$ | 1,341,765 | |||||||||||||||||||||||||||
122 |
JPMorgan Chase & Co./2023 Form 10-K |
|||||||
| Selected metrics | ||||||||||||||||||||||||||||||||||||||
| 30 days or more past due and accruing loans |
Net charge-offs/ (recoveries) |
Credit derivative and credit-related notes (i) |
Liquid securities and other cash collateral held against derivative receivables |
|||||||||||||||||||||||||||||||||||
| Noninvestment-grade | ||||||||||||||||||||||||||||||||||||||
|
Credit
exposure(f)(g)
|
Investment- grade |
Noncriticized | Criticized performing | Criticized nonperforming |
||||||||||||||||||||||||||||||||||
| As of or for the year ended December 31, 2022 (in millions) |
||||||||||||||||||||||||||||||||||||||
| Real Estate | $ | 170,857 | $ | 129,866 | $ | 36,945 | $ | 3,609 | $ | 437 | $ | 543 | $ | 19 | $ | (113) | $ | — | ||||||||||||||||||||
Individuals and Individual Entities(b) |
130,815 | 112,006 | 18,104 | 360 | 345 | 1,038 | 1 | — | — | |||||||||||||||||||||||||||||
Asset Managers |
95,656 | 78,925 | 16,665 | 61 | 5 | 15 | (1) | — | (8,278) | |||||||||||||||||||||||||||||
| Consumer & Retail | 120,555 | 60,781 | 51,871 | 7,295 | 608 | 321 | 49 | (1,157) | — | |||||||||||||||||||||||||||||
| Technology, Media & Telecommunications | 72,286 | 39,199 | 25,689 | 7,096 | 302 | 62 | 39 | (1,766) | — | |||||||||||||||||||||||||||||
| Industrials | 72,483 | 39,052 | 30,500 | 2,809 | 122 | 282 | 44 | (1,258) | — | |||||||||||||||||||||||||||||
| Healthcare | 62,613 | 43,839 | 17,117 | 1,479 | 178 | 43 | 27 | (1,055) | — | |||||||||||||||||||||||||||||
| Banks & Finance Companies | 51,816 | 27,811 | 22,994 | 961 | 50 | 36 | — | (262) | (994) | |||||||||||||||||||||||||||||
| Utilities | 36,218 | 25,981 | 9,294 | 807 | 136 | 21 | 15 | (607) | (1) | |||||||||||||||||||||||||||||
State & Municipal Govt(c) |
33,847 | 33,191 | 529 | 126 | 1 | 36 | — | (9) | (5) | |||||||||||||||||||||||||||||
| Oil & Gas | 38,668 | 20,547 | 17,616 | 474 | 31 | 57 | (6) | (414) | — | |||||||||||||||||||||||||||||
| Automotive | 33,287 | 23,908 | 8,839 | 416 | 124 | 198 | (2) | (513) | — | |||||||||||||||||||||||||||||
| Chemicals & Plastics | 20,030 | 12,134 | 7,103 | 744 | 49 | 10 | 3 | (298) | — | |||||||||||||||||||||||||||||
| Insurance | 21,045 | 15,468 | 5,396 | 181 | — | 1 | — | (273) | (7,296) | |||||||||||||||||||||||||||||
| Central Govt | 19,095 | 18,698 | 362 | 35 | — | — | 10 | (4,591) | (677) | |||||||||||||||||||||||||||||
| Transportation | 15,009 | 6,497 | 6,862 | 1,574 | 76 | 24 | 2 | (339) | — | |||||||||||||||||||||||||||||
| Metals & Mining | 15,915 | 8,825 | 6,863 | 222 | 5 | 7 | (1) | (27) | (4) | |||||||||||||||||||||||||||||
| Securities Firms | 8,066 | 4,235 | 3,716 | 115 | — | — | (13) | (26) | (2,811) | |||||||||||||||||||||||||||||
| Financial Markets Infrastructure | 4,962 | 4,525 | 437 | — | — | — | — | — | — | |||||||||||||||||||||||||||||
All other(d) |
123,307 | 105,284 | 17,555 | 223 | 245 | 4 | (5) | (5,435) | (2,948) | |||||||||||||||||||||||||||||
| Subtotal | $ | 1,146,530 | $ | 810,772 | $ | 304,457 | $ | 28,587 | $ | 2,714 | $ | 2,698 | $ | 181 | $ | (18,143) | $ | (23,014) | ||||||||||||||||||||
| Loans held-for-sale and loans at fair value | 35,427 | |||||||||||||||||||||||||||||||||||||
| Receivables from customers | 49,257 | |||||||||||||||||||||||||||||||||||||
Total(e) |
$ | 1,231,214 | ||||||||||||||||||||||||||||||||||||
JPMorgan Chase & Co./2023 Form 10-K |
123 |
|||||||
| December 31, 2023 | ||||||||||||||||||||||||||||||||
| (in millions, except ratios) | Loans and Lending-related Commitments | Derivative Receivables | Credit exposure | % Investment-grade | % Drawn(e) |
|||||||||||||||||||||||||||
Multifamily(a) |
$ | 121,946 | $ | 21 | $ | 121,967 | 79 | % | 90 | % | ||||||||||||||||||||||
| Industrial | 20,254 | 18 | 20,272 | 70 | 72 | |||||||||||||||||||||||||||
Office |
16,462 | 32 | 16,494 | 51 | 81 | |||||||||||||||||||||||||||
| Services and Non Income Producing | 16,145 | 74 | 16,219 | 62 | 46 | |||||||||||||||||||||||||||
Other Income Producing Properties(b) |
15,542 | 208 | 15,750 | 55 | 63 | |||||||||||||||||||||||||||
| Retail | 12,763 | 48 | 12,811 | 75 | 73 | |||||||||||||||||||||||||||
| Lodging | 4,729 | 19 | 4,748 | 30 | 48 | |||||||||||||||||||||||||||
Total Real Estate Exposure(c) |
$ | 207,841 | $ | 420 | $ | 208,261 | (d) |
71 | % | 80 | % | |||||||||||||||||||||
| December 31, 2022 | ||||||||||||||||||||||||||||||||
| (in millions, except ratios) | Loans and Lending-related Commitments | Derivative Receivables |
Credit exposure | % Investment- grade |
% Drawn(e) |
|||||||||||||||||||||||||||
Multifamily(a) |
$ | 99,555 | $ | 17 | $ | 99,572 | 82 | % | 87 | % | ||||||||||||||||||||||
| Industrial | 15,928 | 1 | 15,929 | 72 | 71 | |||||||||||||||||||||||||||
Office |
14,917 | 25 | 14,942 | 74 | 73 | |||||||||||||||||||||||||||
| Services and Non Income Producing | 13,968 | 10 | 13,978 | 65 | 48 | |||||||||||||||||||||||||||
Other Income Producing Properties(b) |
12,701 | 150 | 12,851 | 70 | 62 | |||||||||||||||||||||||||||
| Retail | 10,192 | 8 | 10,200 | 75 | 68 | |||||||||||||||||||||||||||
| Lodging | 3,347 | 38 | 3,385 | 6 | 37 | |||||||||||||||||||||||||||
| Total Real Estate Exposure | $ | 170,608 | $ | 249 | $ | 170,857 | 76 | % | 77 | % | ||||||||||||||||||||||
124 |
JPMorgan Chase & Co./2023 Form 10-K |
|||||||
| December 31, 2023 | ||||||||||||||||||||||||||||||||
| (in millions, except ratios) | Loans and Lending-related Commitments | Derivative Receivables | Credit exposure | % Investment-grade | % Drawn(d) |
|||||||||||||||||||||||||||
Retail(a) |
$ | 36,042 | $ | 334 | $ | 36,376 | 51 | % | 30 | % | ||||||||||||||||||||||
| Business and Consumer Services | 34,822 | 392 | 35,214 | 42 | 42 | |||||||||||||||||||||||||||
| Food and Beverage | 32,256 | 930 | 33,186 | 57 | 36 | |||||||||||||||||||||||||||
| Consumer Hard Goods | 13,169 | 197 | 13,366 | 43 | 33 | |||||||||||||||||||||||||||
Leisure(b) |
8,784 | 160 | 8,944 | 25 | 47 | |||||||||||||||||||||||||||
Total Consumer & Retail(c) |
$ | 125,073 | $ | 2,013 | $ | 127,086 | 47 | % | 36 | % | ||||||||||||||||||||||
| December 31, 2022 | ||||||||||||||||||||||||||||||||
| (in millions, except ratios) | Loans and Lending-related Commitments | Derivative Receivables |
Credit exposure | % Investment- grade |
% Drawn(d) |
|||||||||||||||||||||||||||
Retail(a) |
$ | 33,891 | $ | 309 | $ | 34,200 | 50 | % | 33 | % | ||||||||||||||||||||||
| Business and Consumer Services | 31,256 | 384 | 31,640 | 50 | 40 | |||||||||||||||||||||||||||
| Food and Beverage | 31,706 | 736 | 32,442 | 59 | 39 | |||||||||||||||||||||||||||
| Consumer Hard Goods | 13,879 | 172 | 14,051 | 51 | 39 | |||||||||||||||||||||||||||
Leisure(b) |
8,173 | 49 | 8,222 | 21 | 45 | |||||||||||||||||||||||||||
Total Consumer & Retail |
$ | 118,905 | $ | 1,650 | $ | 120,555 | 50 | % | 38 | % | ||||||||||||||||||||||
| December 31, 2023 | ||||||||||||||||||||||||||||||||
| (in millions, except ratios) | Loans and Lending-related Commitments | Derivative Receivables | Credit exposure | % Investment-grade | % Drawn(c) |
|||||||||||||||||||||||||||
| Exploration & Production ("E&P") and Oil field Services | $ | 18,121 | $ | 536 | $ | 18,657 | 51 | % | 26 | % | ||||||||||||||||||||||
Other Oil & Gas(a) |
15,649 | 169 | 15,818 | 55 | 22 | |||||||||||||||||||||||||||
Total Oil & Gas(b) |
$ | 33,770 | $ | 705 | $ | 34,475 | 53 | % | 25 | % | ||||||||||||||||||||||
| December 31, 2022 | ||||||||||||||||||||||||||||||||
| (in millions, except ratios) | Loans and Lending-related Commitments | Derivative Receivables |
Credit exposure | % Investment- grade |
% Drawn(c) |
|||||||||||||||||||||||||||
| Exploration & Production ("E&P") and Oil field Services | $ | 17,729 | $ | 4,666 | $ | 22,395 | 50 | % | 25 | % | ||||||||||||||||||||||
Other Oil & Gas(a) |
15,818 | 455 | 16,273 | 57 | 25 | |||||||||||||||||||||||||||
| Total Oil & Gas | $ | 33,547 | $ | 5,121 | $ | 38,668 | 53 | % | 25 | % | ||||||||||||||||||||||
JPMorgan Chase & Co./2023 Form 10-K |
125 |
|||||||
| Wholesale nonaccrual loan activity | |||||||||||
| Year ended December 31, (in millions) | 2023 | 2022 | |||||||||
| Beginning balance | $ | 2,395 | $ | 2,445 | |||||||
| Additions | 3,543 | 2,119 | |||||||||
| Reductions: | |||||||||||
| Paydowns and other | 1,336 | 1,329 | |||||||||
| Gross charge-offs | 965 | 213 | |||||||||
| Returned to performing status | 616 | 594 | |||||||||
| Sales | 307 | 33 | |||||||||
| Total reductions | 3,224 | 2,169 | |||||||||
| Net changes | 319 | (50) | |||||||||
| Ending balance | $ | 2,714 | $ | 2,395 | |||||||
| Wholesale net charge-offs/(recoveries) | ||||||||
| Year ended December 31, (in millions, except ratios) |
2023 |
2022 |
||||||
| Loans | ||||||||
| Average loans retained | $ | 646,875 | $ | 582,021 | ||||
| Gross charge-offs | 1,011 | 322 | ||||||
| Gross recoveries collected | (132) | (141) | ||||||
| Net charge-offs/(recoveries) | 879 | 181 | ||||||
| Net charge-off/(recovery) rate | 0.14 | % | 0.03 | % | ||||
126 |
JPMorgan Chase & Co./2023 Form 10-K |
|||||||
|
December 31, 2023
(in millions, except ratios)
|
1 year or less(g) |
After 1 year through 5 years | After 5 years through 15 years | After 15 years | Total | ||||||||||||||||||||||||
| Wholesale loans: | |||||||||||||||||||||||||||||
Secured by real estate(a) |
$ | 16,144 | $ | 61,764 | $ | 48,972 | $ | 42,417 | $ | 169,297 | |||||||||||||||||||
| Commercial and industrial | 52,351 | 112,339 | 8,469 | 35 | 173,194 | ||||||||||||||||||||||||
Other(b) |
173,752 | 141,760 | 38,558 | 5,929 | 359,999 | ||||||||||||||||||||||||
| Total wholesale loans | $ | 242,247 | $ | 315,863 | $ | 95,999 | $ | 48,381 | $ | 702,490 | |||||||||||||||||||
| Loans due after one year at fixed interest rates | |||||||||||||||||||||||||||||
Secured by real estate(c) |
$ | 15,871 | $ | 11,185 | $ | 720 | |||||||||||||||||||||||
| Commercial and industrial | 5,004 | 1,376 | 34 | ||||||||||||||||||||||||||
| Other | 25,264 | 17,656 | 3,910 | ||||||||||||||||||||||||||
Loans due after one year at variable interest rates(d) |
|||||||||||||||||||||||||||||
Secured by real estate(e) |
$ | 45,893 | $ | 37,787 | $ | 41,696 | |||||||||||||||||||||||
| Commercial and industrial | 107,334 | 7,093 | 2 | ||||||||||||||||||||||||||
Other(f) |
116,497 | 20,902 | 2,019 | ||||||||||||||||||||||||||
| Total wholesale loans | $ | 315,863 | $ | 95,999 | $ | 48,381 | |||||||||||||||||||||||
| Year ended December 31, | |||||||||||||||||||||||||||||||||||
| Secured by real estate | Commercial and industrial |
Other | Total | ||||||||||||||||||||||||||||||||
|
(in millions, except ratios) |
2023 | 2022 | 2023 | 2022 | 2023 | 2022 | 2023 | 2022 | |||||||||||||||||||||||||||
| Net charge-offs/(recoveries) | $ | 178 | $ | 6 | $ | 370 | $ | 145 | $ | 331 | $ | 30 | $ | 879 | $ | 181 | |||||||||||||||||||
| Average retained loans | 151,214 | 122,904 | 170,503 | 160,611 | 325,158 | 298,506 | 646,875 | 582,021 | |||||||||||||||||||||||||||
| Net charge-off/(recovery) rate | 0.12 | % | — | % | 0.22 | % | 0.09 | % | 0.10 | % | 0.01 | % | 0.14 | % | 0.03 | % | |||||||||||||||||||
JPMorgan Chase & Co./2023 Form 10-K |
127 |
|||||||
128 |
JPMorgan Chase & Co./2023 Form 10-K |
|||||||
| Derivative receivables | ||||||||
| December 31, (in millions) | 2023 | 2022 | ||||||
| Total, net of cash collateral | $ | 54,864 | $ | 70,880 | ||||
| Liquid securities and other cash collateral held against derivative receivables | (22,461) | (23,014) | ||||||
| Total, net of liquid securities and other cash collateral | $ | 32,403 | $ | 47,866 | ||||
| Other collateral held against derivative receivables
|
(993) | (1,261) | ||||||
| Total, net of collateral | $ | 31,410 | $ | 46,605 | ||||
| Ratings profile of derivative receivables | ||||||||||||||||||||
2023 |
2022 |
|||||||||||||||||||
| December 31, (in millions, except ratios) |
Exposure net of collateral | % of exposure net of collateral |
Exposure net of collateral | % of exposure net of collateral |
||||||||||||||||
| Investment-grade | $ | 24,004 | 76 | % | $ | 35,097 | 75 | % | ||||||||||||
| Noninvestment-grade | 7,406 | 24 | 11,508 | 25 | ||||||||||||||||
| Total | $ | 31,410 | 100 | % | $ | 46,605 | 100 | % | ||||||||||||
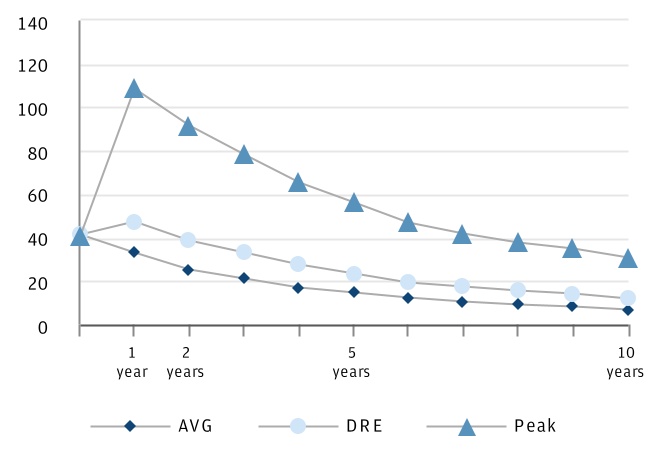
JPMorgan Chase & Co./2023 Form 10-K |
129 |
|||||||
| Credit derivatives and credit-related notes used in credit portfolio management activities | ||||||||||||||
|
Notional amount of protection
purchased and sold(a)
|
||||||||||||||
| December 31, (in millions) | 2023 | 2022 | ||||||||||||
| Credit derivatives and credit-related notes used to manage: | ||||||||||||||
| Loans and lending-related commitments | $ | 24,157 | $ | 6,422 | ||||||||||
| Derivative receivables | 12,832 | 11,721 | ||||||||||||
| Credit derivatives and credit-related notes used in credit portfolio management activities | $ | 36,989 | $ | 18,143 | ||||||||||
130 |
JPMorgan Chase & Co./2023 Form 10-K |
|||||||
| ALLOWANCE FOR CREDIT LOSSES | ||||||||||||||
| Central case assumptions at December 31, 2023 |
|||||||||||
| 2Q24 | 4Q24 | 2Q25 | |||||||||
U.S. unemployment rate(a) |
4.1 | % | 4.4 | % | 4.1 | % | |||||
YoY growth in U.S. real GDP(b) |
1.8 | % | 0.7 | % | 1.0 | % | |||||
| Central case assumptions at December 31, 2022 |
|||||||||||
| 2Q23 | 4Q23 | 2Q24 | |||||||||
U.S. unemployment rate(a) |
3.8 | % | 4.3 | % | 5.0 | % | |||||
YoY growth in U.S. real GDP(b) |
1.5 | % | 0.4 | % | — | % | |||||
JPMorgan Chase & Co./2023 Form 10-K |
131 |
|||||||
| Allowance for credit losses and related information | |||||||||||||||||||||||||||||
| 2023 | 2022 | ||||||||||||||||||||||||||||
| Year ended December 31, | Consumer, excluding credit card |
Credit card | Wholesale | Total | Consumer, excluding credit card |
Credit card | Wholesale | Total | |||||||||||||||||||||
| (in millions, except ratios) | |||||||||||||||||||||||||||||
| Allowance for loan losses | |||||||||||||||||||||||||||||
| Beginning balance at January 1, | $ | 2,040 | $ | 11,200 | $ | 6,486 | $ | 19,726 | $ | 1,765 | $ | 10,250 | $ | 4,371 | $ | 16,386 | |||||||||||||
Cumulative effect of a change in accounting principle(a) |
(489) | (100) | 2 | (587) | NA | NA | NA | NA | |||||||||||||||||||||
| Gross charge-offs | 1,151 | 5,491 | 1,011 | 7,653 | 812 | 3,192 | 322 | 4,326 | |||||||||||||||||||||
| Gross recoveries collected | (519) | (793) | (132) | (1,444) | (543) | (789) | (141) | (1,473) | |||||||||||||||||||||
| Net charge-offs | 632 | 4,698 | 879 | 6,209 | 269 | 2,403 | 181 | 2,853 | |||||||||||||||||||||
| Provision for loan losses | 936 | 6,048 | 2,484 | 9,468 | 543 | 3,353 | 2,293 | 6,189 | |||||||||||||||||||||
| Other | 1 | — | 21 | 22 | 1 | — | 3 | 4 | |||||||||||||||||||||
| Ending balance at December 31, | $ | 1,856 | $ | 12,450 | $ | 8,114 | $ | 22,420 | $ | 2,040 | $ | 11,200 | $ | 6,486 | $ | 19,726 | |||||||||||||
Allowance for lending-related commitments |
|||||||||||||||||||||||||||||
| Beginning balance at January 1, | $ | 76 | $ | — | $ | 2,306 | $ | 2,382 | $ | 113 | $ | — | $ | 2,148 | $ | 2,261 | |||||||||||||
Provision for lending-related commitments |
(1) | — | (407) | (408) | (37) | — | 157 | 120 | |||||||||||||||||||||
| Other | — | — | — | — | — | — | 1 | 1 | |||||||||||||||||||||
| Ending balance at December 31, | $ | 75 | $ | — | $ | 1,899 | $ | 1,974 | $ | 76 | $ | — | $ | 2,306 | $ | 2,382 | |||||||||||||
| Impairment methodology | |||||||||||||||||||||||||||||
Asset-specific(b) |
$ | (876) | $ | — | $ | 392 | $ | (484) | $ | (624) | $ | 223 | $ | 467 | $ | 66 | |||||||||||||
| Portfolio-based | 2,732 | 12,450 | 7,722 | 22,904 | 2,664 | 10,977 | 6,019 | 19,660 | |||||||||||||||||||||
| Total allowance for loan losses | $ | 1,856 | $ | 12,450 | $ | 8,114 | $ | 22,420 | $ | 2,040 | $ | 11,200 | $ | 6,486 | $ | 19,726 | |||||||||||||
| Impairment methodology | |||||||||||||||||||||||||||||
| Asset-specific | $ | — | $ | — | $ | 89 | $ | 89 | $ | — | $ | — | $ | 90 | $ | 90 | |||||||||||||
| Portfolio-based | 75 | — | 1,810 | 1,885 | 76 | — | 2,216 | 2,292 | |||||||||||||||||||||
| Total allowance for lending-related commitments | $ | 75 | $ | — | $ | 1,899 | $ | 1,974 | $ | 76 | $ | — | $ | 2,306 | $ | 2,382 | |||||||||||||
| Total allowance for investment securities | NA | NA | NA | $ | 128 | NA | NA | NA | $ | 96 | |||||||||||||||||||
Total allowance for credit losses(c)(d) |
$ | 1,931 | $ | 12,450 | $ | 10,013 | $ | 24,522 | $ | 2,116 | $ | 11,200 | $ | 8,792 | $ | 22,204 | |||||||||||||
| Memo: | |||||||||||||||||||||||||||||
Retained loans, end of period |
$ | 397,275 | $ | 211,123 | $ | 672,472 | $ | 1,280,870 | $ | 300,753 | $ | 185,175 | $ | 603,670 | $ | 1,089,598 | |||||||||||||
Retained loans, average |
364,061 | 191,412 | 646,875 | 1,202,348 | 299,409 | 163,335 | 582,021 | 1,044,765 | |||||||||||||||||||||
| Credit ratios | |||||||||||||||||||||||||||||
Allowance for loan losses to retained loans |
0.47 | % | 5.90 | % | 1.21 | % | 1.75 | % | 0.68 | % | 6.05 | % | 1.07 | % | 1.81 | % | |||||||||||||
Allowance for loan losses to retained nonaccrual loans(e) |
51 | NA | 346 | 374 | 53 | NM | 330 | 338 | |||||||||||||||||||||
Allowance for loan losses to retained nonaccrual loans excluding credit card |
51 | NA | 346 | 166 | 53 | NM | 330 | 146 | |||||||||||||||||||||
| Net charge-off rates | 0.17 | 2.45 | 0.14 | 0.52 | 0.09 | 1.47 | 0.03 | 0.27 | |||||||||||||||||||||
132 |
JPMorgan Chase & Co./2023 Form 10-K |
|||||||
| 2023 | 2022 | ||||||||||||||||
| December 31, (in millions, except ratios) |
Allowance for loan losses | Percent of retained loans to total retained loans | Allowance for loan losses | Percent of retained loans to total retained loans | |||||||||||||
| Residential real estate | $ | 817 | 25 | % | $ | 1,070 | 22 | % | |||||||||
| Auto and other | 1,039 | 6 | 970 | 6 | |||||||||||||
| Consumer, excluding credit card | 1,856 | 31 | 2,040 | 28 | |||||||||||||
| Credit card | 12,450 | 16 | 11,200 | 17 | |||||||||||||
| Total consumer | 14,306 | 47 | 13,240 | 45 | |||||||||||||
| Secured by real estate | 2,997 | 13 | 1,782 | 12 | |||||||||||||
| Commercial and industrial | 3,519 | 13 | 3,507 | 15 | |||||||||||||
| Other | 1,598 | 27 | 1,197 | 28 | |||||||||||||
| Total wholesale | 8,114 | 53 | 6,486 | 55 | |||||||||||||
Total(a) |
$ | 22,420 | 100 | % | $ | 19,726 | 100 | % | |||||||||
JPMorgan Chase & Co./2023 Form 10-K |
133 |
|||||||
| INVESTMENT PORTFOLIO RISK MANAGEMENT | ||||||||||||||
| (in billions) | December 31, 2023 | December 31, 2022 | |||||||||
Tax-oriented investments, primarily in alternative energy and affordable housing(a) |
$ | 28.8 | $ | 26.2 | |||||||
Private equity, various debt and equity instruments, and real assets |
10.5 | 10.8 | |||||||||
| Total carrying value | $ | 39.3 | $ | 37.0 | |||||||
134 |
JPMorgan Chase & Co./2023 Form 10-K |
|||||||
| MARKET RISK MANAGEMENT | ||||||||||||||
JPMorgan Chase & Co./2023 Form 10-K |
135 |
|||||||
| LOBs and Corporate | Predominant business activities | Related market risks | Positions included in Risk Management VaR | Positions included in earnings-at-risk | Positions included in other sensitivity-based measures | ||||||||||||
| CCB |
•Originates and services mortgage loans
•Originates loans and takes deposits
|
•Risk from changes in the probability of newly originated mortgage commitments closing
•Interest rate risk and prepayment risk
|
•Mortgage commitments, classified as derivatives
•Warehouse loans that are fair value option elected, classified as loans – debt instruments
•MSRs
•Hedges of mortgage commitments, warehouse loans and MSRs, classified as derivatives
•Interest-only and mortgage-backed securities, classified as trading assets debt instruments, and related hedges, classified as derivatives
•Fair value option elected liabilities(a)
|
•Retained loan portfolio
•Deposits
|
•Fair value option elected liabilities DVA(a)
|
||||||||||||
| CIB |
•Makes markets and services clients across fixed income, foreign exchange, equities and commodities
•Originates loans and takes deposits
|
•Risk of loss from adverse movements in market prices and implied volatilities across interest rate, foreign exchange, credit, commodity and equity instruments
•Basis and correlation risk from changes in the way asset values move relative to one another
•Interest rate risk and prepayment risk
|
•Trading assets/liabilities – debt and marketable equity instruments, and derivatives, including hedges of the retained loan portfolio
•Certain securities purchased, loaned or sold under resale agreements and securities borrowed
•Fair value option elected liabilities(a)
•Certain fair value option elected loans
•Derivative CVA and associated hedges
•Marketable equity investments
|
•Retained loan portfolio
•Deposits
|
•Privately held equity and other investments measured at fair value; and certain real estate-related fair value option elected loans
•Derivatives FVA and fair value option elected liabilities DVA(a)
•Credit risk component of CVA and associated hedges for counterparties with credit spreads that have widened to elevated levels
C
|
||||||||||||
| CB | •Originates loans and takes deposits |
•Interest rate risk and prepayment risk |
•Marketable equity investments(b) |
•Retained loan portfolio
•Deposits
|
|||||||||||||
| AWM |
•Provides initial capital investments in products such as mutual funds and capital invested alongside third-party investors
•Originates loans and takes deposits
|
•Risk from adverse movements in market factors (e.g., market prices, rates and credit spreads)
•Interest rate risk and prepayment risk
|
•Debt securities held in advance of distribution to clients, classified as trading assets - debt instruments(b)
•Trading assets/liabilities - derivatives that hedge the retained loan portfolio(b)
|
•Retained loan portfolio
•Deposits
|
•Initial seed capital investments and related hedges, classified as derivatives
•Certain deferred compensation and related hedges, classified as derivatives
•Capital invested alongside third-party investors, typically in privately distributed collective vehicles managed by AWM (i.e., co-investments)
|
||||||||||||
| Corporate | •Manages the Firm’s liquidity, funding, capital, structural interest rate and foreign exchange risks |
•Structural interest rate risk from the Firm’s traditional banking activities
•Structural non-USD foreign exchange risks
|
•Derivative positions measured through noninterest revenue in earnings
•Marketable equity investments
|
•Deposits with banks
•Investment securities portfolio and related interest rate hedges
•Long-term debt and related interest rate hedges
•Deposits
|
•Privately held equity and other investments measured at fair value
•Foreign exchange exposure related to Firm-issued non-USD long-term debt (“LTD”) and related hedges
|
||||||||||||
136 |
JPMorgan Chase & Co./2023 Form 10-K |
|||||||
JPMorgan Chase & Co./2023 Form 10-K |
137 |
|||||||
| Total VaR | |||||||||||||||||||||||||||||||||||||||||
| As of or for the year ended December 31, | 2023 | 2022 | |||||||||||||||||||||||||||||||||||||||
| (in millions) | Avg. | Min | Max | Avg. | Min | Max | |||||||||||||||||||||||||||||||||||
| CIB trading VaR by risk type | |||||||||||||||||||||||||||||||||||||||||
| Fixed income | $ | 49 | $ | 31 | $ | 71 | $ | 59 | $ | 33 | $ | 82 | |||||||||||||||||||||||||||||
| Foreign exchange | 12 | 6 | 26 | 8 | 3 | 15 | |||||||||||||||||||||||||||||||||||
| Equities | 7 | 3 | 11 | 12 | 7 | 20 | |||||||||||||||||||||||||||||||||||
| Commodities and other | 11 | 6 | 19 | 15 | 10 | 28 | |||||||||||||||||||||||||||||||||||
Diversification benefit to CIB trading VaR (a) |
(42) | NM | NM | (43) | NM | NM | |||||||||||||||||||||||||||||||||||
| CIB trading VaR | 37 | 24 | 55 | 51 | 34 | 69 | |||||||||||||||||||||||||||||||||||
Credit Portfolio VaR(b) |
14 | 8 | 26 | 16 | 4 | 235 | (d) |
||||||||||||||||||||||||||||||||||
Diversification benefit to CIB VaR(a) |
(11) | NM | NM | (10) | NM | NM | |||||||||||||||||||||||||||||||||||
CIB VaR |
40 | 23 | 58 | 57 | 35 | 240 | |||||||||||||||||||||||||||||||||||
CCB VaR |
7 | 1 | 15 | 6 | 2 | 20 | |||||||||||||||||||||||||||||||||||
Corporate and other LOB VaR(c) |
12 | 9 | 17 | 12 | 9 | 16 | |||||||||||||||||||||||||||||||||||
Diversification benefit to other VaR(a) |
(5) | NM | NM | (4) | NM | NM | |||||||||||||||||||||||||||||||||||
| Other VaR | 14 | 9 | 22 | 14 | 10 | 24 | |||||||||||||||||||||||||||||||||||
Diversification benefit to CIB and other VaR(a) |
(11) | NM | NM | (13) | NM | NM | |||||||||||||||||||||||||||||||||||
| Total VaR | $ | 43 | $ | 26 | $ | 57 | $ | 58 | $ | 34 | $ | 242 | (d) |
||||||||||||||||||||||||||||
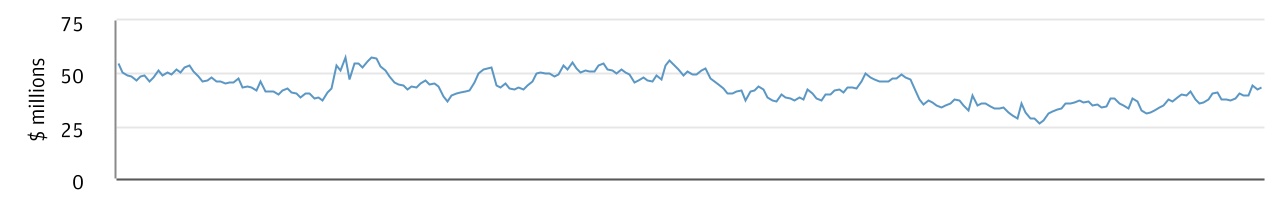
| First Quarter 2023 |
Second Quarter 2023 |
Third Quarter 2023 |
Fourth Quarter 2023 |
||||||||
138 |
JPMorgan Chase & Co./2023 Form 10-K |
|||||||
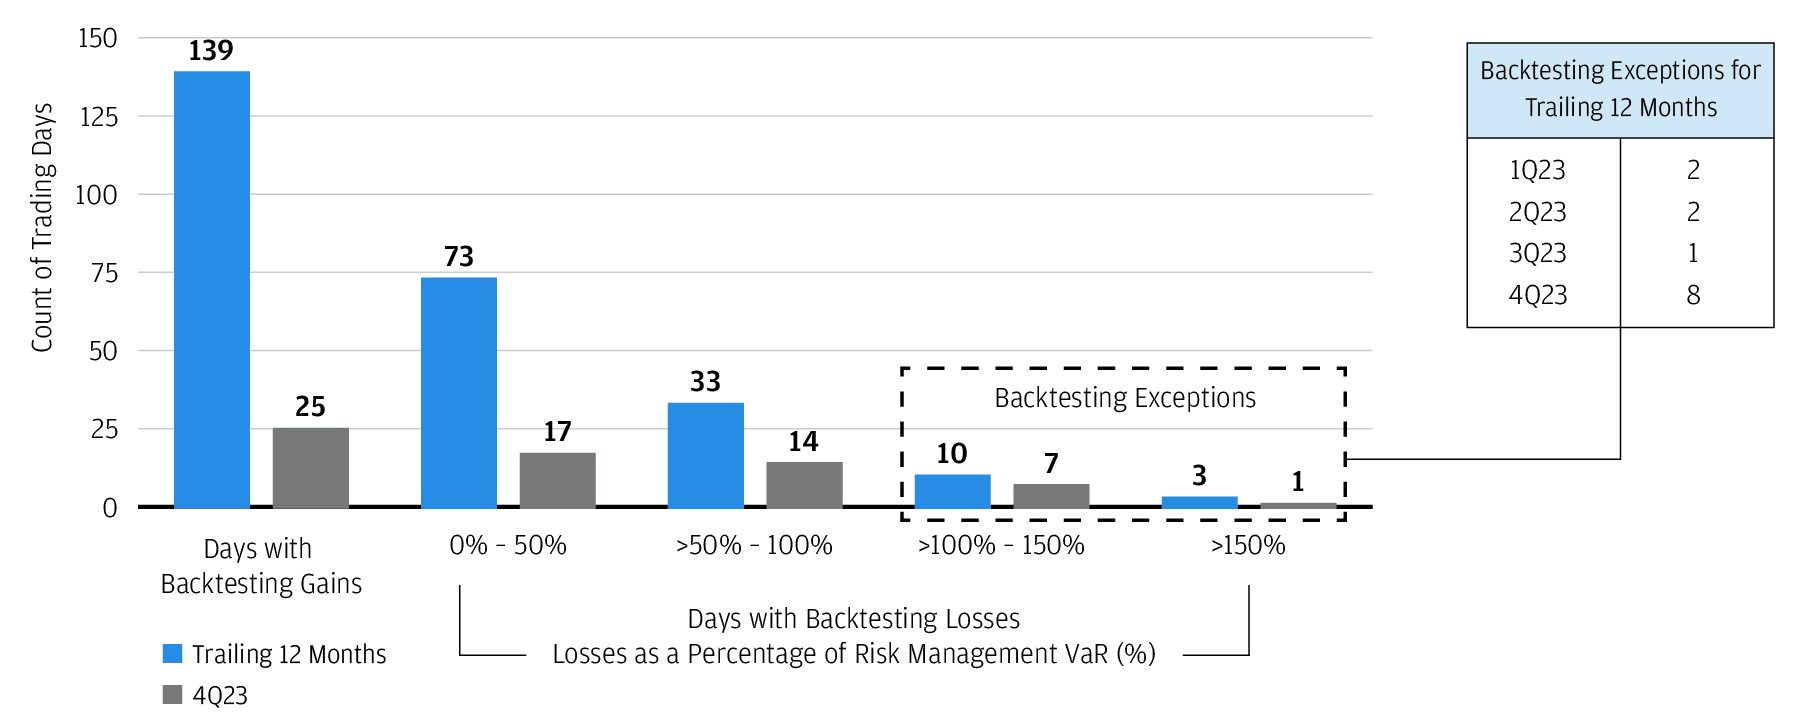
JPMorgan Chase & Co./2023 Form 10-K |
139 |
|||||||
140 |
JPMorgan Chase & Co./2023 Form 10-K |
|||||||
| December 31, (in billions) |
2023 | 2022 | |||||||||
U.S. dollar: (a) |
|||||||||||
Parallel shift: (b) |
|||||||||||
| +100 bps shift in rates | $ | 2.4 | $ | (2.0) | |||||||
| -100 bps shift in rates | (2.1) | 2.4 | |||||||||
| +200 bps shift in rates | 4.8 | (4.2) | |||||||||
| -200 bps shift in rates | (4.6) | 3.3 | |||||||||
| Steeper yield curve: | |||||||||||
| +100 bps shift in long-term rates | 0.6 | 0.8 | |||||||||
| -100 bps shift in short-term rates | (1.5) | 3.2 | |||||||||
| Flatter yield curve: | |||||||||||
| +100 bps shift in short-term rates | 1.8 | (2.8) | |||||||||
| -100 bps shift in long-term rates | (0.5) | (0.9) | |||||||||
Non-U.S. dollar: |
|||||||||||
Parallel shift: (b) |
|||||||||||
| +100 bps shift in rates | $ | 0.7 | $ | 0.7 | |||||||
| -100 bps shift in rates | (0.7) | (0.6) | |||||||||
JPMorgan Chase & Co./2023 Form 10-K |
141 |
|||||||
142 |
JPMorgan Chase & Co./2023 Form 10-K |
|||||||
Gain/(loss) (in millions) |
|||||||||||||||||||||||
| Activity | Description | Sensitivity measure | December 31, 2023 | December 31, 2022 | |||||||||||||||||||
Debt and equity(a) |
|||||||||||||||||||||||
| Asset Management activities | Consists of seed capital and related hedges; fund co-investments(c); and certain deferred compensation and related hedges(d) |
10% decline in market value | $ | (61) | $ | (56) | |||||||||||||||||
| Other debt and equity | Consists of certain real estate-related fair value option elected loans, privately held equity and other investments held at fair value(c) |
10% decline in market value | (1,044) | (1,046) | |||||||||||||||||||
| Credit- and funding-related exposures | |||||||||||||||||||||||
Non-USD LTD cross-currency basis |
Represents the basis risk on derivatives used to hedge the foreign exchange risk on the non-USD LTD(e) |
1 basis point parallel tightening of cross currency basis | (12) | (12) | |||||||||||||||||||
Non-USD LTD hedges foreign currency (“FX”) exposure |
Primarily represents the foreign exchange revaluation on the fair value of the derivative hedges(e) |
10% depreciation of currency | 16 | 3 | |||||||||||||||||||
| Derivatives – funding spread risk | Impact of changes in the spread related to derivatives FVA(c) |
1 basis point parallel increase in spread | (3) | (4) | |||||||||||||||||||
CVA - counterparty credit risk(b) |
Credit risk component of CVA and associated hedges | 10% credit spread widening | — | (1) | |||||||||||||||||||
| Fair value option elected liabilities - funding spread risk | Impact of changes in the spread related to fair value option elected liabilities DVA(e) |
1 basis point parallel increase in spread | 46 | 43 | |||||||||||||||||||
Fair value option elected liabilities –interest rate sensitivity |
Interest rate sensitivity on fair value option elected liabilities resulting from a change in the Firm’s own credit spread(e) |
1 basis point parallel increase in spread | — | — | |||||||||||||||||||
Interest rate sensitivity related to risk management of changes in the Firm’s own credit spread on the fair value option elected liabilities noted above(c) |
1 basis point parallel increase in spread | — | — | ||||||||||||||||||||
JPMorgan Chase & Co./2023 Form 10-K |
143 |
|||||||
| COUNTRY RISK MANAGEMENT | ||||||||||||||
144 |
JPMorgan Chase & Co./2023 Form 10-K |
|||||||
Top 20 country exposures (excluding the U.S.)(a) | |||||||||||||||||||||||
| December 31, (in billions) | 2023 | 2022(f) |
|||||||||||||||||||||
Deposits with banks(b) |
Lending(c) |
Trading and investing(d) |
Other(e) |
Total exposure | Total exposure | ||||||||||||||||||
| Germany | $ | 69.8 | $ | 12.1 | $ | 2.1 | $ | 0.8 | $ | 84.8 | $ | 93.2 | |||||||||||
| United Kingdom | 36.4 | 25.5 | 13.5 | 1.7 | 77.1 | 70.1 | |||||||||||||||||
| Japan | 29.4 | 2.4 | 3.9 | 0.3 | 36.0 | 55.8 | |||||||||||||||||
| Australia | 9.7 | 6.9 | 1.7 | — | 18.3 | 25.7 | |||||||||||||||||
| Brazil | 5.2 | 5.3 | 6.2 | — | 16.7 | 17.8 | |||||||||||||||||
| Canada | 2.3 | 11.4 | 2.0 | 0.3 | 16.0 | 14.4 | |||||||||||||||||
| China | 3.5 | 5.5 | 5.0 | — | 14.0 | 13.7 | |||||||||||||||||
| Switzerland | 5.2 | 3.6 | 1.2 | 0.9 | 10.9 | 15.3 | |||||||||||||||||
| France | 0.6 | 10.9 | (2.2) | 0.8 | 10.1 | 18.1 | |||||||||||||||||
| Singapore | 1.9 | 3.8 | 3.8 | 0.3 | 9.8 | 9.9 | |||||||||||||||||
| India | 1.2 | 3.8 | 4.3 | 0.4 | 9.7 | 9.0 | |||||||||||||||||
| Mexico | 1.1 | 3.7 | 3.4 | — | 8.2 | 5.4 | |||||||||||||||||
| Belgium | 5.6 | 2.1 | 0.3 | — | 8.0 | 9.2 | |||||||||||||||||
| South Korea | 0.8 | 3.2 | 3.5 | 0.3 | 7.8 | 10.0 | |||||||||||||||||
Saudi Arabia |
0.6 | 5.2 | 1.9 | — | 7.7 | 7.9 | |||||||||||||||||
Spain |
0.3 | 5.2 | 0.8 | — | 6.3 | 3.4 | |||||||||||||||||
| Italy | 0.1 | 5.9 | (0.2) | 0.2 | 6.0 | 5.8 | |||||||||||||||||
| Netherlands | 0.1 | 6.4 | (1.2) | 0.3 | 5.6 | 7.1 | |||||||||||||||||
| Malaysia | 3.5 | 0.2 | 0.4 | 0.1 | 4.2 | 5.3 | |||||||||||||||||
| Luxembourg | 0.9 | 2.2 | 0.9 | — | 4.0 | 4.2 | |||||||||||||||||
JPMorgan Chase & Co./2023 Form 10-K |
145 |
|||||||
CLIMATE RISK MANAGEMENT | ||||||||||||||
146 |
JPMorgan Chase & Co./2023 Form 10-K |
|||||||
OPERATIONAL RISK MANAGEMENT | ||||||||||||||
JPMorgan Chase & Co./2023 Form 10-K |
147 |
|||||||
148 |
JPMorgan Chase & Co./2023 Form 10-K |
|||||||
JPMorgan Chase & Co./2023 Form 10-K |
149 |
|||||||
150 |
JPMorgan Chase & Co./2023 Form 10-K |
|||||||
COMPLIANCE RISK MANAGEMENT | ||||||||||||||
JPMorgan Chase & Co./2023 Form 10-K |
151 |
|||||||
CONDUCT RISK MANAGEMENT | ||||||||||||||
152 |
JPMorgan Chase & Co./2023 Form 10-K |
|||||||
LEGAL RISK MANAGEMENT | ||||||||||||||
JPMorgan Chase & Co./2023 Form 10-K |
153 |
|||||||
ESTIMATIONS AND MODEL RISK MANAGEMENT | ||||||||||||||
154 |
JPMorgan Chase & Co./2023 Form 10-K |
|||||||
| CRITICAL ACCOUNTING ESTIMATES USED BY THE FIRM | ||||||||||||||
JPMorgan Chase & Co./2023 Form 10-K |
155 |
|||||||
| December 31, 2023 (in millions, except ratios) |
Total assets at fair value | Total level 3 assets | |||||||||
| Federal funds sold and securities purchased under resale agreements | $ | 259,813 | $ | — | |||||||
| Securities borrowed | 70,086 | — | |||||||||
| Trading assets: | |||||||||||
| Trading-debt and equity instruments | 485,701 | 2,373 | |||||||||
Derivative receivables(a) |
54,864 | 8,924 | |||||||||
| Total trading assets | 540,565 | 11,297 | |||||||||
| AFS securities | 201,704 | — | |||||||||
| Loans | 38,851 | 3,079 | |||||||||
| MSRs | 8,522 | 8,522 | |||||||||
| Other | 11,322 | 758 | |||||||||
Total assets measured at fair value on a recurring basis |
1,130,863 | 23,656 | |||||||||
Total assets measured at fair value on a nonrecurring basis |
3,141 | 2,490 | |||||||||
Total assets measured at fair value |
$ | 1,134,004 | $ | 26,146 | |||||||
| Total Firm assets | $ | 3,875,393 | |||||||||
Level 3 assets at fair value as a percentage of total Firm assets(a) |
1 | % | |||||||||
Level 3 assets at fair value as a percentage of total Firm assets at fair value(a) |
2 | % | |||||||||
156 |
JPMorgan Chase & Co./2023 Form 10-K |
|||||||
JPMorgan Chase & Co./2023 Form 10-K |
157 |
|||||||
158 |
JPMorgan Chase & Co./2023 Form 10-K |
|||||||
| ACCOUNTING AND REPORTING DEVELOPMENTS | ||||||||||||||
| Financial Accounting Standards Board (“FASB”) Standards Adopted since January 1, 2021 | |||||||||||
| Standard | Summary of guidance | Effects on financial statements | |||||||||
|
Reference Rate
Reform
Issued March
2020 and updated January 2021 and December 2022
|
•Provides optional expedients and exceptions to current accounting guidance when financial instruments, hedge accounting relationships, and other transactions are amended due to reference rate reform.
|
•Issued and effective March 12, 2020. The January 7, 2021 and December 21, 2022 updates were effective when issued.
|
|||||||||
FASB Standards Adopted since January 1, 2023 | |||||||||||
Standard |
Summary of guidance |
Effects on financial statements |
|||||||||
|
Derivatives and Hedging: Fair Value Hedging – Portfolio Layer Method
Issued March 2022
|
•Expands the ability to hedge a portfolio of fixed-rate assets to allow more types of assets to be included in the portfolio, and to allow more of the portfolio to be hedged.
•Clarifies the types of derivatives that can be used as hedges, and the balance sheet presentation and disclosure requirements for the hedge accounting adjustments.
•Allows a one-time reclassification from HTM to AFS upon adoption.
|
•Adopted prospectively on January 1, 2023.
•Refer to Note 1 for further information.
|
|||||||||
|
Financial Instruments – Credit Losses: Troubled Debt Restructurings and Vintage Disclosures
Issued March 2022
|
•Eliminates existing accounting and disclosure requirements for Troubled Debt Restructurings, including the requirement to measure the allowance using a discounted cash flow methodology.
•Requires disclosure of loan modifications for borrowers experiencing financial difficulty involving principal forgiveness, interest rate reduction, other-than-insignificant payment delay, term extension or a combination of these modifications.
•Requires disclosure of current period loan charge-off information by origination year.
•May be adopted prospectively, or by using a modified retrospective method wherein the effect of adoption is reflected as an adjustment to retained earnings at the effective date.
|
•Adopted under the modified retrospective method on January 1, 2023.
•Refer to Note 1 for further information.
|
|||||||||
JPMorgan Chase & Co./2023 Form 10-K |
159 |
|||||||
FASB Standards Issued but not yet Adopted as of December 31, 2023 | |||||||||||
Standard |
Summary of guidance |
Effects on financial statements |
|||||||||
|
Investments - Equity Method and Joint Ventures: Accounting for Investments in Tax Credit Structures Using the Proportional Amortization Method
Issued March 2023
|
•Expands the ability to elect proportional amortization for more types of tax-oriented investments (beyond low income housing tax credit investments) on a program-by-program basis.
•May be adopted using a full retrospective method, or a modified retrospective method wherein the effect of adoption is reflected as an adjustment to retained earnings at the effective date.
|
•Adopted under the modified retrospective method on January 1, 2024, which resulted in a decrease to retained earnings of approximately $200 million.
|
|||||||||
|
Segment Reporting: Improvements to Reportable Segment Disclosures
Issued November 2023
|
•Requires disclosure of significant segment expenses that are readily provided to the chief operating decision maker (“CODM”) and included in segment profit or loss.
•Requires disclosure of the composition and aggregate amount of other segment items, which represent the difference between profit or loss and segment revenues less significant segment expenses.
•Requires disclosure of the title and position of the CODM and an explanation of how the CODM uses the reported segment measures in assessing segment performance and deciding how to allocate resources.
|
•Required effective date: Annual financial statements for the year ending December 31, 2024 and interim financial statements for the year ending December 31, 2025.(a)
•The Firm is currently assessing the potential impact on its segment disclosures.
|
|||||||||
|
Income Taxes: Improvements to Income Tax Disclosures
Issued December 2023
|
•Requires disclosure of income taxes paid disaggregated by 1) federal, state, and foreign taxes and 2) individual jurisdiction on the basis of a quantitative threshold of equal to or greater than 5 percent of total income taxes paid (net of refunds received).
•Requires disclosure of the effective tax rate reconciliation by specific categories, at a minimum, with accompanying qualitative disclosures, and separate disclosure of reconciling items based on quantitative thresholds.
•Requires categories within the effective tax rate reconciliation to be further disaggregated if quantitative thresholds are met.
|
•Required effective date: Annual financial statements for the year ending December 31, 2025.(a)
•The guidance can be applied on a prospective basis with the option to apply the standard retrospectively.
•The Firm is evaluating the potential impact on the Consolidated Financial Statements disclosures, as well as the Firm’s planned date of adoption.
|
|||||||||
160 |
JPMorgan Chase & Co./2023 Form 10-K |
|||||||
| FORWARD-LOOKING STATEMENTS | ||||||||||||||
JPMorgan Chase & Co./2023 Form 10-K |
161 |
|||||||


162 |
JPMorgan Chase & Co./2023 Form 10-K |
|||||||

PricewaterhouseCoopers LLP 300 Madison Avenue New York, NY 10017 | ||
JPMorgan Chase & Co./2023 Form 10-K |
163 |
|||||||
164 |
JPMorgan Chase & Co./2023 Form 10-K |
|||||||

JPMorgan Chase & Co./2023 Form 10-K |
165 |
|||||||
| Year ended December 31, (in millions, except per share data) | 2023 | 2022 | 2021 | ||||||||||||||
| Revenue | |||||||||||||||||
| Investment banking fees | $ | 6,519 | $ | 6,686 | $ | 13,216 | |||||||||||
| Principal transactions | 24,460 | 19,912 | 16,304 | ||||||||||||||
| Lending- and deposit-related fees | 7,413 | 7,098 | 7,032 | ||||||||||||||
| Asset management fees | 15,220 | 14,096 | 14,405 | ||||||||||||||
| Commissions and other fees | 6,836 | 6,581 | 6,624 | ||||||||||||||
Investment securities losses |
(3,180) | (2,380) | (345) | ||||||||||||||
| Mortgage fees and related income | 1,176 | 1,250 | 2,170 | ||||||||||||||
| Card income | 4,784 | 4,420 | 5,102 | ||||||||||||||
| Other income | 5,609 | 4,322 | 4,830 | ||||||||||||||
| Noninterest revenue | 68,837 | 61,985 | 69,338 | ||||||||||||||
| Interest income | 170,588 | 92,807 | 57,864 | ||||||||||||||
| Interest expense | 81,321 | 26,097 | 5,553 | ||||||||||||||
| Net interest income | 89,267 | 66,710 | 52,311 | ||||||||||||||
| Total net revenue | 158,104 | 128,695 | 121,649 | ||||||||||||||
| Provision for credit losses | 9,320 | 6,389 | (9,256) | ||||||||||||||
| Noninterest expense | |||||||||||||||||
| Compensation expense | 46,465 | 41,636 | 38,567 | ||||||||||||||
| Occupancy expense | 4,590 | 4,696 | 4,516 | ||||||||||||||
| Technology, communications and equipment expense | 9,246 | 9,358 | 9,941 | ||||||||||||||
| Professional and outside services | 10,235 | 10,174 | 9,814 | ||||||||||||||
| Marketing | 4,591 | 3,911 | 3,036 | ||||||||||||||
| Other expense | 12,045 | 6,365 | 5,469 | ||||||||||||||
| Total noninterest expense | 87,172 | 76,140 | 71,343 | ||||||||||||||
| Income before income tax expense | 61,612 | 46,166 | 59,562 | ||||||||||||||
| Income tax expense | 12,060 | 8,490 | 11,228 | ||||||||||||||
| Net income | $ | 49,552 | $ | 37,676 | $ | 48,334 | |||||||||||
| Net income applicable to common stockholders | $ | 47,760 | $ | 35,892 | $ | 46,503 | |||||||||||
| Net income per common share data | |||||||||||||||||
| Basic earnings per share | $ | 16.25 | $ | 12.10 | $ | 15.39 | |||||||||||
| Diluted earnings per share | 16.23 | 12.09 | 15.36 | ||||||||||||||
| Weighted-average basic shares | 2,938.6 | 2,965.8 | 3,021.5 | ||||||||||||||
| Weighted-average diluted shares | 2,943.1 | 2,970.0 | 3,026.6 | ||||||||||||||
166 |
JPMorgan Chase & Co./2023 Form 10-K |
|||||||
| Year ended December 31, (in millions) | 2023 | 2022 | 2021 | |||||||||||||||||
| Net income | $ | 49,552 | $ | 37,676 | $ | 48,334 | ||||||||||||||
| Other comprehensive income/(loss), after–tax | ||||||||||||||||||||
| Unrealized gains/(losses) on investment securities | 5,381 | (11,764) | (5,540) | |||||||||||||||||
| Translation adjustments, net of hedges | 329 | (611) | (461) | |||||||||||||||||
| Fair value hedges | (101) | 98 | (19) | |||||||||||||||||
| Cash flow hedges | 1,724 | (5,360) | (2,679) | |||||||||||||||||
| Defined benefit pension and OPEB plans | 373 | (1,241) | 922 | |||||||||||||||||
| DVA on fair value option elected liabilities | (808) | 1,621 | (293) | |||||||||||||||||
| Total other comprehensive income/(loss), after–tax | 6,898 | (17,257) | (8,070) | |||||||||||||||||
| Comprehensive income | $ | 56,450 | $ | 20,419 | $ | 40,264 | ||||||||||||||
JPMorgan Chase & Co./2023 Form 10-K |
167 |
|||||||
| December 31, (in millions, except share data) | 2023 | 2022 | |||||||||
| Assets | |||||||||||
| Cash and due from banks | $ | 29,066 | $ | 27,697 | |||||||
| Deposits with banks | 595,085 | 539,537 | |||||||||
Federal funds sold and securities purchased under resale agreements (included $259,813 and $311,883 at fair value) |
276,152 | 315,592 | |||||||||
Securities borrowed (included $70,086 and $70,041 at fair value) |
200,436 | 185,369 | |||||||||
Trading assets (included assets pledged of $128,994 and $93,687) |
540,607 | 453,799 | |||||||||
Available-for-sale securities (amortized cost of $205,456 and $216,188; included assets pledged of $9,219 and $9,158) |
201,704 | 205,857 | |||||||||
| Held-to-maturity securities | 369,848 | 425,305 | |||||||||
| Investment securities, net of allowance for credit losses | 571,552 | 631,162 | |||||||||
Loans (included $38,851 and $42,079 at fair value) |
1,323,706 | 1,135,647 | |||||||||
| Allowance for loan losses | (22,420) | (19,726) | |||||||||
| Loans, net of allowance for loan losses | 1,301,286 | 1,115,921 | |||||||||
| Accrued interest and accounts receivable | 107,363 | 125,189 | |||||||||
| Premises and equipment | 30,157 | 27,734 | |||||||||
| Goodwill, MSRs and other intangible assets | 64,381 | 60,859 | |||||||||
Other assets (included $12,306 and $14,921 at fair value and assets pledged of $6,764 and $7,998) |
159,308 | 182,884 | |||||||||
Total assets(a) |
$ | 3,875,393 | $ | 3,665,743 | |||||||
| Liabilities | |||||||||||
Deposits (included $78,384 and $28,620 at fair value) |
$ | 2,400,688 | $ | 2,340,179 | |||||||
Federal funds purchased and securities loaned or sold under repurchase agreements (included $169,003 and $151,999 at fair value) |
216,535 | 202,613 | |||||||||
Short-term borrowings (included $20,042 and $15,792 at fair value) |
44,712 | 44,027 | |||||||||
| Trading liabilities | 180,428 | 177,976 | |||||||||
Accounts payable and other liabilities (included $5,637 and $7,038 at fair value) |
290,307 | 300,141 | |||||||||
Beneficial interests issued by consolidated VIEs (included $1 and $5 at fair value) |
23,020 | 12,610 | |||||||||
Long-term debt (included $87,924 and $72,281 at fair value) |
391,825 | 295,865 | |||||||||
Total liabilities(a) |
3,547,515 | 3,373,411 | |||||||||
| Commitments and contingencies (refer to Notes 28, 29 and 30) | |||||||||||
| Stockholders’ equity | |||||||||||
Preferred stock ($1 par value; authorized 200,000,000 shares: issued 2,740,375 and 2,740,375 shares) |
27,404 | 27,404 | |||||||||
Common stock ($1 par value; authorized 9,000,000,000 shares; issued 4,104,933,895 shares) |
4,105 | 4,105 | |||||||||
| Additional paid-in capital | 90,128 | 89,044 | |||||||||
| Retained earnings | 332,901 | 296,456 | |||||||||
| Accumulated other comprehensive losses | (10,443) | (17,341) | |||||||||
Treasury stock, at cost (1,228,275,301 and 1,170,676,094 shares) |
(116,217) | (107,336) | |||||||||
| Total stockholders’ equity | 327,878 | 292,332 | |||||||||
| Total liabilities and stockholders’ equity | $ | 3,875,393 | $ | 3,665,743 | |||||||
| December 31, (in millions) | 2023 | 2022 | |||||||||
| Assets | |||||||||||
| Trading assets | $ | 2,170 | $ | 2,151 | |||||||
| Loans | 37,611 | 34,411 | |||||||||
| All other assets | 591 | 550 | |||||||||
| Total assets | $ | 40,372 | $ | 37,112 | |||||||
| Liabilities | |||||||||||
| Beneficial interests issued by consolidated VIEs | $ | 23,020 | $ | 12,610 | |||||||
| All other liabilities | 263 | 279 | |||||||||
| Total liabilities | $ | 23,283 | $ | 12,889 | |||||||
168 |
JPMorgan Chase & Co./2023 Form 10-K |
|||||||
| Year ended December 31, (in millions, except per share data) | 2023 | 2022 | 2021 | |||||||||||||||||
| Preferred stock | ||||||||||||||||||||
| Balance at January 1 | $ | 27,404 | $ | 34,838 | $ | 30,063 | ||||||||||||||
| Issuance | — | — | 7,350 | |||||||||||||||||
| Redemption | — | (7,434) | (2,575) | |||||||||||||||||
| Balance at December 31 | 27,404 | 27,404 | 34,838 | |||||||||||||||||
| Common stock | ||||||||||||||||||||
| Balance at January 1 and December 31 | 4,105 | 4,105 | 4,105 | |||||||||||||||||
| Additional paid-in capital | ||||||||||||||||||||
| Balance at January 1 | 89,044 | 88,415 | 88,394 | |||||||||||||||||
Shares issued and commitments to issue common stock for employee share-based compensation awards, and related tax effects |
1,084 | 629 | 152 | |||||||||||||||||
| Other | — | — | (131) | |||||||||||||||||
| Balance at December 31 | 90,128 | 89,044 | 88,415 | |||||||||||||||||
| Retained earnings | ||||||||||||||||||||
| Balance at January 1 | 296,456 | 272,268 | 236,990 | |||||||||||||||||
| Cumulative effect of change in accounting principles | 449 | — | — | |||||||||||||||||
| Net income | 49,552 | 37,676 | 48,334 | |||||||||||||||||
| Dividends declared: | ||||||||||||||||||||
| Preferred stock | (1,501) | (1,595) | (1,600) | |||||||||||||||||
Common stock ($4.10, $4.00 and $3.80 per share for 2023, 2022 and 2021, respectively) |
(12,055) | (11,893) | (11,456) | |||||||||||||||||
| Balance at December 31 | 332,901 | 296,456 | 272,268 | |||||||||||||||||
| Accumulated other comprehensive income/(loss) | ||||||||||||||||||||
| Balance at January 1 | (17,341) | (84) | 7,986 | |||||||||||||||||
| Other comprehensive income/(loss), after-tax | 6,898 | (17,257) | (8,070) | |||||||||||||||||
| Balance at December 31 | (10,443) | (17,341) | (84) | |||||||||||||||||
| Treasury stock, at cost | ||||||||||||||||||||
| Balance at January 1 | (107,336) | (105,415) | (88,184) | |||||||||||||||||
| Repurchase | (9,980) | (3,122) | (18,448) | |||||||||||||||||
| Reissuance | 1,099 | 1,201 | 1,217 | |||||||||||||||||
| Balance at December 31 | (116,217) | (107,336) | (105,415) | |||||||||||||||||
| Total stockholders’ equity | $ | 327,878 | $ | 292,332 | $ | 294,127 | ||||||||||||||
JPMorgan Chase & Co./2023 Form 10-K |
169 |
|||||||
| Year ended December 31, (in millions) | 2023 | 2022 | 2021 | ||||||||||||||
| Operating activities | |||||||||||||||||
| Net income | $ | 49,552 | $ | 37,676 | $ | 48,334 | |||||||||||
Adjustments to reconcile net income to net cash provided by operating activities: |
|||||||||||||||||
| Provision for credit losses | 9,320 | 6,389 | (9,256) | ||||||||||||||
| Depreciation and amortization | 7,512 | 7,051 | 7,932 | ||||||||||||||
| Deferred tax (benefit)/expense | (4,534) | (2,738) | 3,748 | ||||||||||||||
| Bargain purchase gain associated with the First Republic acquisition | (2,775) | — | — | ||||||||||||||
| Other | 4,301 | 5,174 | 3,274 | ||||||||||||||
| Originations and purchases of loans held-for-sale | (115,245) | (149,167) | (347,864) | ||||||||||||||
| Proceeds from sales, securitizations and paydowns of loans held-for-sale | 116,430 | 167,709 | 336,413 | ||||||||||||||
| Net change in: | |||||||||||||||||
| Trading assets | (74,091) | (31,449) | 85,710 | ||||||||||||||
| Securities borrowed | (14,902) | 20,203 | (45,635) | ||||||||||||||
| Accrued interest and accounts receivable | 19,928 | (22,970) | (12,401) | ||||||||||||||
| Other assets | 32,970 | (2,882) | (11,745) | ||||||||||||||
| Trading liabilities | 5,315 | 11,170 | (23,190) | ||||||||||||||
| Accounts payable and other liabilities | (25,388) | 58,614 | 43,162 | ||||||||||||||
| Other operating adjustments | 4,581 | 2,339 | (398) | ||||||||||||||
Net cash provided by operating activities |
12,974 | 107,119 | 78,084 | ||||||||||||||
| Investing activities | |||||||||||||||||
| Net change in: | |||||||||||||||||
| Federal funds sold and securities purchased under resale agreements | 39,740 | (54,278) | 34,473 | ||||||||||||||
| Held-to-maturity securities: | |||||||||||||||||
| Proceeds from paydowns and maturities | 53,056 | 48,626 | 50,897 | ||||||||||||||
| Purchases | (4,141) | (33,676) | (111,756) | ||||||||||||||
| Available-for-sale securities: | |||||||||||||||||
| Proceeds from paydowns and maturities | 53,744 | 39,159 | 50,075 | ||||||||||||||
| Proceeds from sales | 108,434 | 84,616 | 162,748 | ||||||||||||||
| Purchases | (115,499) | (126,258) | (248,785) | ||||||||||||||
| Proceeds from sales and securitizations of loans held-for-investment | 47,312 | 44,892 | 35,845 | ||||||||||||||
| Other changes in loans, net | (88,343) | (128,968) | (91,797) | ||||||||||||||
Net cash used in First Republic Acquisition |
(9,920) | — | — | ||||||||||||||
| All other investing activities, net | (16,740) | (11,932) | (11,044) | ||||||||||||||
Net cash provided by/(used in) investing activities |
67,643 | (137,819) | (129,344) | ||||||||||||||
| Financing activities | |||||||||||||||||
| Net change in: | |||||||||||||||||
| Deposits | (32,196) | (136,895) | 293,764 | ||||||||||||||
| Federal funds purchased and securities loaned or sold under repurchase agreements | 13,801 | 8,455 | (20,799) | ||||||||||||||
| Short-term borrowings | (1,934) | (8,984) | 7,773 | ||||||||||||||
| Beneficial interests issued by consolidated VIEs | 9,029 | 2,205 | (4,254) | ||||||||||||||
| Proceeds from long-term borrowings | 75,417 | 78,442 | 82,409 | ||||||||||||||
| Payments of long-term borrowings | (64,880) | (45,556) | (54,932) | ||||||||||||||
| Proceeds from issuance of preferred stock | — | — | 7,350 | ||||||||||||||
| Redemption of preferred stock | — | (7,434) | (2,575) | ||||||||||||||
| Treasury stock repurchased | (9,824) | (3,162) | (18,408) | ||||||||||||||
| Dividends paid | (13,463) | (13,562) | (12,858) | ||||||||||||||
| All other financing activities, net | (1,521) | 234 | (1,477) | ||||||||||||||
| Net cash provided by/(used in) financing activities | (25,571) | (126,257) | 275,993 | ||||||||||||||
| Effect of exchange rate changes on cash and due from banks and deposits with banks | 1,871 | (16,643) | (11,508) | ||||||||||||||
| Net increase/(decrease) in cash and due from banks and deposits with banks | 56,917 | (173,600) | 213,225 | ||||||||||||||
| Cash and due from banks and deposits with banks at the beginning of the period | 567,234 | 740,834 | 527,609 | ||||||||||||||
| Cash and due from banks and deposits with banks at the end of the period | $ | 624,151 | $ | 567,234 | $ | 740,834 | |||||||||||
| Cash interest paid | $ | 77,114 | $ | 23,143 | $ | 5,142 | |||||||||||
| Cash income taxes paid, net | 9,908 | 4,355 | 18,737 | ||||||||||||||
170 |
JPMorgan Chase & Co./2023 Form 10-K |
|||||||
JPMorgan Chase & Co./2023 Form 10-K |
171 |
|||||||
172 |
JPMorgan Chase & Co./2023 Form 10-K |
|||||||
JPMorgan Chase & Co./2023 Form 10-K |
173 |
|||||||
| Fair value measurement | Note 2 | page 175 | |||||||||
| Fair value option | Note 3 | page 197 | |||||||||
| Derivative instruments | Note 5 | page 203 | |||||||||
Noninterest revenue and noninterest expense |
Note 6 | page 217 | |||||||||
| Interest income and Interest expense | Note 7 | page 221 | |||||||||
Pension and other postretirement employee benefit plans |
Note 8 | page 222 | |||||||||
| Employee share-based incentives | Note 9 | page 225 | |||||||||
| Investment securities | Note 10 | page 227 | |||||||||
| Securities financing activities | Note 11 | page 232 | |||||||||
| Loans | Note 12 | page 235 | |||||||||
| Allowance for credit losses | Note 13 | page 255 | |||||||||
| Variable interest entities | Note 14 | page 261 | |||||||||
Goodwill, mortgage servicing rights, and other intangible assets |
Note 15 | page 269 | |||||||||
| Premises and equipment | Note 16 | page 274 | |||||||||
| Leases | Note 18 | page 275 | |||||||||
Accounts payable & other liabilities |
Note 19 |
page 277 | |||||||||
| Long-term debt | Note 20 | page 278 | |||||||||
| Earnings per share | Note 23 | page 283 | |||||||||
| Income taxes | Note 25 | page 285 | |||||||||
Off–balance sheet lending-related financial instruments, guarantees and other commitments |
Note 28 | page 291 | |||||||||
| Litigation | Note 30 | page 298 | |||||||||
174 |
JPMorgan Chase & Co./2023 Form 10-K |
|||||||
JPMorgan Chase & Co./2023 Form 10-K |
175 |
|||||||
176 |
JPMorgan Chase & Co./2023 Form 10-K |
|||||||
| Product/instrument | Valuation methodology | Classifications in the fair value hierarchy | ||||||
| Securities financing agreements | Valuations are based on discounted cash flows, which consider: | Predominantly level 2 | ||||||
| • Derivative features: refer to the discussion of derivatives below for further information | ||||||||
• Market rates for the respective maturity | ||||||||
• Collateral characteristics | ||||||||
|
Loans and lending-related commitments — wholesale
Loans carried at fair value
(trading loans and non-trading loans) and associated
lending-related commitments
|
Where observable market data is available, valuations are based on: | Level 2 or 3 | ||||||
• Observed market prices (circumstances are infrequent) | ||||||||
• Relevant broker quotes | ||||||||
• Observed market prices for similar instruments | ||||||||
| Where observable market data is unavailable or limited, valuations are based on discounted cash flows, which consider the following: | ||||||||
• Credit spreads derived from the cost of CDS; or benchmark credit curves developed by the Firm, by industry and credit rating | ||||||||
• Prepayment speed | ||||||||
• Collateral characteristics | ||||||||
| Loans — consumer | Fair value is based on observable market prices for mortgage-backed securities with similar collateral and incorporates adjustments to these prices to account for differences between the securities and the value of the underlying loans, which include credit characteristics, portfolio composition, and liquidity. | Predominantly level 2 | ||||||
| Loans carried at fair value — conforming residential mortgage loans expected to be sold | ||||||||
| Investment and trading securities | Quoted market prices | Level 1 | ||||||
| In the absence of quoted market prices, securities are valued based on: | Level 2 or 3 | |||||||
| • Observable market prices for similar securities | ||||||||
• Relevant broker quotes | ||||||||
• Discounted cash flows | ||||||||
| In addition, the following inputs to discounted cash flows are used for the following products: | ||||||||
| Mortgage- and asset-backed securities specific inputs: | ||||||||
• Collateral characteristics | ||||||||
| • Deal-specific payment and loss allocations | ||||||||
• Current market assumptions related to yield, prepayment speed, conditional default rates and loss severity | ||||||||
| Collateralized loan obligations (“CLOs”) specific inputs: | ||||||||
• Collateral characteristics | ||||||||
• Deal-specific payment and loss allocations | ||||||||
• Expected prepayment speed, conditional default rates, loss severity | ||||||||
• Credit spreads | ||||||||
| • Credit rating data | ||||||||
| Physical commodities | Valued using observable market prices or data. | Level 1 or 2 | ||||||
JPMorgan Chase & Co./2023 Form 10-K |
177 |
|||||||
| Product/instrument | Valuation methodology | Classifications in the fair value hierarchy | ||||||
| Derivatives | Actively traded derivatives, e.g., exchange-traded derivatives, that are valued using quoted prices. | Level 1 | ||||||
|
Derivatives that are valued using models such as the Black-Scholes option pricing model, simulation models, or a combination of models that may use observable or unobservable valuation inputs as well as considering the contractual terms.
The key valuation inputs used will depend on the type of derivative and the nature of the underlying instruments and may include equity prices, commodity prices, foreign exchange rates, volatilities, correlations, CDS spreads, recovery rates and prepayment speed.
|
Level 2 or 3 | |||||||
| In addition, specific inputs used for derivatives that are valued based on models with significant unobservable inputs are as follows: | ||||||||
| Interest rate and FX exotic derivatives specific inputs include: | ||||||||
• Interest rate curve | ||||||||
• Interest rate volatility | ||||||||
• Interest rate spread volatility | ||||||||
• Bermudan switch value | ||||||||
• Interest rate correlation | ||||||||
• Interest rate-FX correlation | ||||||||
• Foreign exchange correlation | ||||||||
| Credit derivatives specific inputs include: | ||||||||
• Credit correlation between the underlying debt instruments | ||||||||
| Equity derivatives specific inputs include: | ||||||||
• Forward equity price | ||||||||
• Equity volatility | ||||||||
• Equity correlation | ||||||||
• Equity-FX correlation | ||||||||
• Equity-IR correlation | ||||||||
| Commodity derivatives specific inputs include: | ||||||||
• Forward commodity price | ||||||||
• Commodity volatility | ||||||||
• Commodity correlation | ||||||||
Additionally, adjustments are made to reflect counterparty credit quality (CVA) and the impact of funding (FVA). Refer to page 192 of this Note. | ||||||||
| Mortgage servicing rights | Refer to Mortgage servicing rights in Note 15. |
Level 3 | ||||||
| Private equity direct investments | Fair value is estimated using all available information; the range of potential inputs include: | Level 2 or 3 | ||||||
• Transaction prices | ||||||||
| • Trading multiples of comparable public companies | ||||||||
| • Operating performance of the underlying portfolio company | ||||||||
• Adjustments as required, since comparable public companies are not identical to the company being valued, and for company-specific issues including lack of liquidity | ||||||||
| • Additional available inputs relevant to the investment | ||||||||
| Fund investments (e.g., mutual/collective investment funds, private equity funds, hedge funds, and real estate funds) | Net asset value | |||||||
| • NAV is supported by the ability to redeem and purchase at the NAV level | Level 1 | |||||||
| • Adjustments to the NAV as required, for restrictions on redemption (e.g., lock-up periods or withdrawal limitations) or where observable activity is limited | Level 2 or 3(a) |
|||||||
| Beneficial interests issued by consolidated VIEs | Valued using observable market information, where available. | Level 2 or 3 | ||||||
| In the absence of observable market information, valuations are based on the fair value of the underlying assets held by the VIE. | ||||||||
178 |
JPMorgan Chase & Co./2023 Form 10-K |
|||||||
| Product/instrument | Valuation methodology | Classification in the fair value hierarchy | ||||||
| Structured notes (included in deposits, short-term borrowings and long-term debt) |
Valuations are based on discounted cash flow analyses that consider the embedded derivative and the terms and payment structure of the note.
The embedded derivative features are considered using models such as the Black-Scholes option pricing model, simulation models, or a combination of models that may use observable or unobservable valuation inputs, depending on the embedded derivative. The specific inputs used vary according to the nature of the embedded derivative features, as described in the discussion above regarding derivatives valuation. Adjustments are then made to this base valuation to reflect the Firm’s own credit risk (DVA). Refer to page 192 of this Note.
|
Level 2 or 3 | ||||||
JPMorgan Chase & Co./2023 Form 10-K |
179 |
|||||||
| Assets and liabilities measured at fair value on a recurring basis | |||||||||||||||||||||||
| Fair value hierarchy | |||||||||||||||||||||||
| December 31, 2023 (in millions) | Level 1 | Level 2 | Level 3 | Derivative netting adjustments(f) |
Total fair value | ||||||||||||||||||
| Federal funds sold and securities purchased under resale agreements | $ | — | $ | 259,813 | $ | — | $ | — | $ | 259,813 | |||||||||||||
| Securities borrowed | — | 70,086 | — | — | 70,086 | ||||||||||||||||||
| Trading assets: | |||||||||||||||||||||||
| Debt instruments: | |||||||||||||||||||||||
| Mortgage-backed securities: | |||||||||||||||||||||||
U.S. GSEs and government agencies(a) |
— | 73,840 | 758 | — | 74,598 | ||||||||||||||||||
| Residential – nonagency | — | 1,921 | 5 | — | 1,926 | ||||||||||||||||||
| Commercial – nonagency | — | 1,362 | 12 | — | 1,374 | ||||||||||||||||||
| Total mortgage-backed securities | — | 77,123 | 775 | — | 77,898 | ||||||||||||||||||
U.S. Treasury, GSEs and government agencies(a) |
133,997 | 9,998 | — | — | 143,995 | ||||||||||||||||||
| Obligations of U.S. states and municipalities | — | 5,858 | 10 | — | 5,868 | ||||||||||||||||||
Certificates of deposit, bankers’ acceptances and commercial paper |
— | 756 | — | — | 756 | ||||||||||||||||||
| Non-U.S. government debt securities | 24,846 | 55,557 | 179 | — | 80,582 | ||||||||||||||||||
| Corporate debt securities | — | 32,854 | 484 | — | 33,338 | ||||||||||||||||||
| Loans | — | 7,872 | 684 | — | 8,556 | ||||||||||||||||||
| Asset-backed securities | — | 2,199 | 6 | — | 2,205 | ||||||||||||||||||
| Total debt instruments | 158,843 | 192,217 | 2,138 | — | 353,198 | ||||||||||||||||||
| Equity securities | 107,926 | 679 | 127 | — | 108,732 | ||||||||||||||||||
Physical commodities(b) |
2,479 | 3,305 | 7 | — | 5,791 | ||||||||||||||||||
| Other | — | 17,879 | 101 | — | 17,980 | ||||||||||||||||||
Total debt and equity instruments(c) |
269,248 | 214,080 | 2,373 | — | 485,701 | ||||||||||||||||||
| Derivative receivables: | |||||||||||||||||||||||
| Interest rate | 2,815 | 243,578 | 4,298 | (224,367) | 26,324 | ||||||||||||||||||
| Credit | — | 8,644 | 1,010 | (9,103) | 551 | ||||||||||||||||||
| Foreign exchange | 149 | 204,737 | 889 | (187,756) | 18,019 | ||||||||||||||||||
| Equity | — | 55,167 | 2,522 | (52,761) | 4,928 | ||||||||||||||||||
| Commodity | — | 15,234 | 205 | (10,397) | 5,042 | ||||||||||||||||||
| Total derivative receivables | 2,964 | 527,360 | 8,924 | (484,384) | 54,864 | ||||||||||||||||||
Total trading assets(d) |
272,212 | 741,440 | 11,297 | (484,384) | 540,565 | ||||||||||||||||||
| Available-for-sale securities: | |||||||||||||||||||||||
| Mortgage-backed securities: | |||||||||||||||||||||||
U.S. GSEs and government agencies(a) |
— | 85,170 | — | — | 85,170 | ||||||||||||||||||
| Residential – nonagency | — | 3,639 | — | — | 3,639 | ||||||||||||||||||
| Commercial – nonagency | — | 2,803 | — | — | 2,803 | ||||||||||||||||||
| Total mortgage-backed securities | — | 91,612 | — | — | 91,612 | ||||||||||||||||||
| U.S. Treasury and government agencies | 57,683 | 122 | — | — | 57,805 | ||||||||||||||||||
| Obligations of U.S. states and municipalities | — | 21,367 | — | — | 21,367 | ||||||||||||||||||
| Non-U.S. government debt securities | 13,095 | 8,187 | — | — | 21,282 | ||||||||||||||||||
| Corporate debt securities | — | 100 | — | — | 100 | ||||||||||||||||||
| Asset-backed securities: | |||||||||||||||||||||||
| Collateralized loan obligations | — | 6,752 | — | — | 6,752 | ||||||||||||||||||
Other(a) |
— | 2,786 | — | — | 2,786 | ||||||||||||||||||
| Total available-for-sale securities | 70,778 | 130,926 | — | — | 201,704 | ||||||||||||||||||
Loans(e) |
— | 35,772 | 3,079 | — | 38,851 | ||||||||||||||||||
| Mortgage servicing rights | — | — | 8,522 | — | 8,522 | ||||||||||||||||||
Other assets(d) |
6,635 | 3,929 | 758 | — | 11,322 | ||||||||||||||||||
| Total assets measured at fair value on a recurring basis | $ | 349,625 | $ | 1,241,966 | $ | 23,656 | $ | (484,384) | $ | 1,130,863 | |||||||||||||
| Deposits | $ | — | $ | 76,551 | $ | 1,833 | $ | — | $ | 78,384 | |||||||||||||
Federal funds purchased and securities loaned or sold under repurchase agreements |
— | 169,003 | — | — | 169,003 | ||||||||||||||||||
| Short-term borrowings | — | 18,284 | 1,758 | — | 20,042 | ||||||||||||||||||
| Trading liabilities: | |||||||||||||||||||||||
Debt and equity instruments(c) |
107,292 | 32,252 | 37 | — | 139,581 | ||||||||||||||||||
| Derivative payables: | |||||||||||||||||||||||
| Interest rate | 4,409 | 232,277 | 3,796 | (228,586) | 11,896 | ||||||||||||||||||
| Credit | — | 11,293 | 745 | (10,949) | 1,089 | ||||||||||||||||||
| Foreign exchange | 147 | 211,289 | 827 | (199,643) | 12,620 | ||||||||||||||||||
| Equity | — | 60,887 | 4,924 | (56,443) | 9,368 | ||||||||||||||||||
| Commodity | — | 15,894 | 484 | (10,504) | 5,874 | ||||||||||||||||||
| Total derivative payables | 4,556 | 531,640 | 10,776 | (506,125) | 40,847 | ||||||||||||||||||
| Total trading liabilities | 111,848 | 563,892 | 10,813 | (506,125) | 180,428 | ||||||||||||||||||
| Accounts payable and other liabilities | 3,968 | 1,617 | 52 | — | 5,637 | ||||||||||||||||||
| Beneficial interests issued by consolidated VIEs | — | 1 | — | — | 1 | ||||||||||||||||||
| Long-term debt | — | 60,198 | 27,726 | — | 87,924 | ||||||||||||||||||
| Total liabilities measured at fair value on a recurring basis | $ | 115,816 | $ | 889,546 | $ | 42,182 | $ | (506,125) | $ | 541,419 | |||||||||||||
180 |
JPMorgan Chase & Co./2023 Form 10-K |
|||||||
| Fair value hierarchy | ||||||||||||||||||||||||||
| December 31, 2022 (in millions) | Level 1 | Level 2 | Level 3 | Derivative netting adjustments(f) |
Total fair value | |||||||||||||||||||||
| Federal funds sold and securities purchased under resale agreements | $ | — | $ | 311,883 | $ | — | $ | — | $ | 311,883 | ||||||||||||||||
| Securities borrowed | — | 70,041 | — | — | 70,041 | |||||||||||||||||||||
| Trading assets: | ||||||||||||||||||||||||||
| Debt instruments: | ||||||||||||||||||||||||||
| Mortgage-backed securities: | ||||||||||||||||||||||||||
U.S. GSEs and government agencies(a) |
— | 68,162 | 759 | — | 68,921 | |||||||||||||||||||||
| Residential – nonagency | — | 2,498 | 5 | — | 2,503 | |||||||||||||||||||||
| Commercial – nonagency | — | 1,448 | 7 | — | 1,455 | |||||||||||||||||||||
| Total mortgage-backed securities | — | 72,108 | 771 | — | 72,879 | |||||||||||||||||||||
U.S. Treasury, GSEs and government agencies(a) |
61,191 | 8,546 | — | — | 69,737 | |||||||||||||||||||||
| Obligations of U.S. states and municipalities | — | 6,608 | 7 | — | 6,615 | |||||||||||||||||||||
Certificates of deposit, bankers’ acceptances and commercial paper |
— | 2,009 | — | — | 2,009 | |||||||||||||||||||||
| Non-U.S. government debt securities | 18,213 | 48,429 | 155 | — | 66,797 | |||||||||||||||||||||
| Corporate debt securities | — | 25,626 | 463 | — | 26,089 | |||||||||||||||||||||
| Loans | — | 5,744 | 759 | — | 6,503 | |||||||||||||||||||||
| Asset-backed securities | — | 2,536 | 23 | — | 2,559 | |||||||||||||||||||||
| Total debt instruments | 79,404 | 171,606 | 2,178 | — | 253,188 | |||||||||||||||||||||
| Equity securities | 82,483 | 2,060 | 665 | — | 85,208 | |||||||||||||||||||||
Physical commodities(b) |
9,595 | 16,673 | 2 | — | 26,270 | |||||||||||||||||||||
| Other | — | 18,146 | 64 | — | 18,210 | |||||||||||||||||||||
Total debt and equity instruments(c) |
171,482 | 208,485 | 2,909 | — | 382,876 | |||||||||||||||||||||
| Derivative receivables: | ||||||||||||||||||||||||||
| Interest rate | 3,390 | 292,956 | 4,069 | (271,996) | 28,419 | |||||||||||||||||||||
| Credit | — | 9,722 | 607 | (9,239) | 1,090 | |||||||||||||||||||||
| Foreign exchange | 169 | 240,207 | 1,203 | (218,214) | 23,365 | |||||||||||||||||||||
| Equity | — | 57,485 | 4,428 | (52,774) | 9,139 | |||||||||||||||||||||
| Commodity | — | 24,982 | 375 | (16,490) | 8,867 | |||||||||||||||||||||
| Total derivative receivables | 3,559 | 625,352 | 10,682 | (568,713) | 70,880 | |||||||||||||||||||||
Total trading assets(d) |
175,041 | 833,837 | 13,591 | (568,713) | 453,756 | |||||||||||||||||||||
| Available-for-sale securities: | ||||||||||||||||||||||||||
| Mortgage-backed securities: | ||||||||||||||||||||||||||
U.S. GSEs and government agencies(a) |
3 | 71,500 | — | — | 71,503 | |||||||||||||||||||||
| Residential – nonagency | — | 4,620 | — | — | 4,620 | |||||||||||||||||||||
| Commercial – nonagency | — | 1,958 | — | — | 1,958 | |||||||||||||||||||||
| Total mortgage-backed securities | 3 | 78,078 | — | — | 78,081 | |||||||||||||||||||||
| U.S. Treasury and government agencies | 92,060 | — | — | — | 92,060 | |||||||||||||||||||||
| Obligations of U.S. states and municipalities | — | 6,786 | — | — | 6,786 | |||||||||||||||||||||
| Non-U.S. government debt securities | 10,591 | 9,105 | — | — | 19,696 | |||||||||||||||||||||
| Corporate debt securities | — | 118 | 239 | — | 357 | |||||||||||||||||||||
| Asset-backed securities: | ||||||||||||||||||||||||||
| Collateralized loan obligations | — | 5,792 | — | — | 5,792 | |||||||||||||||||||||
| Other | — | 3,085 | — | — | 3,085 | |||||||||||||||||||||
| Total available-for-sale securities | 102,654 | 102,964 | 239 | — | 205,857 | |||||||||||||||||||||
Loans(e) |
— | 40,661 | 1,418 | — | 42,079 | |||||||||||||||||||||
| Mortgage servicing rights | — | — | 7,973 | — | 7,973 | |||||||||||||||||||||
Other assets(d) |
7,544 | 6,065 | 405 | — | 14,014 | |||||||||||||||||||||
| Total assets measured at fair value on a recurring basis | $ | 285,239 | $ | 1,365,451 | $ | 23,626 | $ | (568,713) | $ | 1,105,603 | ||||||||||||||||
| Deposits | $ | — | $ | 26,458 | $ | 2,162 | $ | — | $ | 28,620 | ||||||||||||||||
Federal funds purchased and securities loaned or sold under repurchase agreements |
— | 151,999 | — | — | 151,999 | |||||||||||||||||||||
| Short-term borrowings | — | 14,391 | 1,401 | — | 15,792 | |||||||||||||||||||||
| Trading liabilities: | ||||||||||||||||||||||||||
Debt and equity instruments(c) |
98,719 | 28,032 | 84 | — | 126,835 | |||||||||||||||||||||
| Derivative payables: | ||||||||||||||||||||||||||
| Interest rate | 2,643 | 284,280 | 3,368 | (274,321) | 15,970 | |||||||||||||||||||||
| Credit | — | 9,377 | 594 | (9,217) | 754 | |||||||||||||||||||||
| Foreign exchange | 160 | 250,647 | 714 | (232,665) | 18,856 | |||||||||||||||||||||
| Equity | — | 57,649 | 4,812 | (53,657) | 8,804 | |||||||||||||||||||||
| Commodity | — | 22,748 | 521 | (16,512) | 6,757 | |||||||||||||||||||||
| Total derivative payables | 2,803 | 624,701 | 10,009 | (586,372) | 51,141 | |||||||||||||||||||||
| Total trading liabilities | 101,522 | 652,733 | 10,093 | (586,372) | 177,976 | |||||||||||||||||||||
| Accounts payable and other liabilities | 5,702 | 1,283 | 53 | — | 7,038 | |||||||||||||||||||||
| Beneficial interests issued by consolidated VIEs | — | 5 | — | — | 5 | |||||||||||||||||||||
| Long-term debt | — | 48,189 | 24,092 | — | 72,281 | |||||||||||||||||||||
| Total liabilities measured at fair value on a recurring basis | $ | 107,224 | $ | 895,058 | $ | 37,801 | $ | (586,372) | $ | 453,711 | ||||||||||||||||
JPMorgan Chase & Co./2023 Form 10-K |
181 |
|||||||
182 |
JPMorgan Chase & Co./2023 Form 10-K |
|||||||
JPMorgan Chase & Co./2023 Form 10-K |
183 |
|||||||
Level 3 inputs(a) |
||||||||||||||||||||||||||
| December 31, 2023 | ||||||||||||||||||||||||||
| Product/Instrument | Fair value (in millions) |
Principal valuation technique | Unobservable inputs(g) |
Range of input values | Average(i) |
|||||||||||||||||||||
Residential mortgage-backed securities and loans(b) |
$ | 1,743 | Discounted cash flows | Yield | 0% | 72% | 7% | |||||||||||||||||||
| Prepayment speed | 3% | 12% | 9% | |||||||||||||||||||||||
| Conditional default rate | 0% | 6% | 0% | |||||||||||||||||||||||
| Loss severity | 0% | 110% | 3% | |||||||||||||||||||||||
Commercial mortgage-backed securities and loans(c) |
1,460 | Market comparables | Price | $0 | $90 | $80 | ||||||||||||||||||||
| Corporate debt securities | 484 | Market comparables | Price | $0 | $242 | $98 | ||||||||||||||||||||
Loans(d) |
1,335 | Market comparables | Price | $0 | $108 | $79 | ||||||||||||||||||||
| Non-U.S. government debt securities | 179 | Market comparables | Price | $2 | $109 | $91 | ||||||||||||||||||||
| Net interest rate derivatives | 495 | Option pricing | Interest rate volatility | 25bps | 420bps | 117bps | ||||||||||||||||||||
| Interest rate spread volatility | 37bps | 77bps | 64bps | |||||||||||||||||||||||
| Bermudan switch value | 0% | 54% | 19% | |||||||||||||||||||||||
| Interest rate correlation | (82)% | 90% | 19% | |||||||||||||||||||||||
| IR-FX correlation | (35)% | 60% | 5% | |||||||||||||||||||||||
| 7 | Discounted cash flows | Prepayment speed | 0% | 20% | 5% | |||||||||||||||||||||
| Net credit derivatives | 233 | Discounted cash flows | Credit correlation | 35% | 70% | 51% | ||||||||||||||||||||
| Credit spread | 0bps | 3,617bps | 384bps | |||||||||||||||||||||||
| Recovery rate | 10% | 90% | 55% | |||||||||||||||||||||||
| 32 | Market comparables | Price | $0 | $115 | $73 | |||||||||||||||||||||
| Net foreign exchange derivatives | 128 | Option pricing | IR-FX correlation | (40)% | 60% | 20% | ||||||||||||||||||||
| (66) | Discounted cash flows | Prepayment speed | 11% | 11% | ||||||||||||||||||||||
| Interest rate curve | 2% | 17% | 7% | |||||||||||||||||||||||
| Net equity derivatives | (2,402) | Option pricing | Forward equity price(h) |
74% | 148% | 100% | ||||||||||||||||||||
| Equity volatility | 3% | 145% | 28% | |||||||||||||||||||||||
| Equity correlation | 15% | 100% | 57% | |||||||||||||||||||||||
| Equity-FX correlation | (88)% | 65% | (30)% | |||||||||||||||||||||||
| Equity-IR correlation | (19)% | 20% | 12% | |||||||||||||||||||||||
| Net commodity derivatives | (279) | Option pricing | Oil commodity forward | $84 / BBL | $270 / BBL | $177 / BBL | ||||||||||||||||||||
| Natural gas commodity forward | $2 / MMBTU | $6 / MMBTU | $4 / MMBTU | |||||||||||||||||||||||
| Commodity volatility | 17% | 20% | 18% | |||||||||||||||||||||||
| Commodity correlation | (35)% | 98% | 31% | |||||||||||||||||||||||
| MSRs | 8,522 | Discounted cash flows | Refer to Note 15 | |||||||||||||||||||||||
Long-term debt, short-term borrowings, and deposits(e) |
30,078 | Option pricing | Interest rate volatility | 25bps | 420bps | 117bps | ||||||||||||||||||||
| Bermudan switch value | 0% | 54% | 19% | |||||||||||||||||||||||
| Interest rate correlation | (82)% | 90% | 19% | |||||||||||||||||||||||
| IR-FX correlation | (35)% | 60% | 5% | |||||||||||||||||||||||
| Equity correlation | 15% | 100% | 57% | |||||||||||||||||||||||
| Equity-FX correlation | (88)% | 65% | (30)% | |||||||||||||||||||||||
| Equity-IR correlation | (19)% | 20% | 12% | |||||||||||||||||||||||
| 1,239 | Discounted cash flows | Credit correlation | 35% | 70% | 51% | |||||||||||||||||||||
| Yield | 5% | 20% | 12% | |||||||||||||||||||||||
| Loss severity | 0% | 100% | 50% | |||||||||||||||||||||||
Other level 3 assets and liabilities, net(f) |
920 | |||||||||||||||||||||||||
184 |
JPMorgan Chase & Co./2023 Form 10-K |
|||||||
JPMorgan Chase & Co./2023 Form 10-K |
185 |
|||||||
186 |
JPMorgan Chase & Co./2023 Form 10-K |
|||||||
| Fair value measurements using significant unobservable inputs | |||||||||||||||||||||||||||||||||||||||||
| Year ended December 31, 2023 (in millions) |
Fair value at January 1, 2023 | Total realized/unrealized gains/(losses) | Transfers into level 3 |
Transfers (out of) level 3 | Fair value at Dec. 31, 2023 | Change in unrealized gains/(losses) related to financial instruments held at Dec. 31, 2023 | |||||||||||||||||||||||||||||||||||
Purchases(g) |
Sales | Settlements(h) |
|||||||||||||||||||||||||||||||||||||||
Assets:(a) |
|||||||||||||||||||||||||||||||||||||||||
| Federal funds sold and securities purchased under resale agreements | $ | — | $ | — | $ | — | $ | — | $ | — | $ | — | $ | — | $ | — | $ | — | |||||||||||||||||||||||
| Trading assets: | |||||||||||||||||||||||||||||||||||||||||
| Debt instruments: | |||||||||||||||||||||||||||||||||||||||||
| Mortgage-backed securities: | |||||||||||||||||||||||||||||||||||||||||
| U.S. GSEs and government agencies | 759 | 4 | 249 | (133) | (107) | — | (14) | 758 | 1 | ||||||||||||||||||||||||||||||||
| Residential – nonagency | 5 | 6 | — | (6) | (1) | 1 | — | 5 | 1 | ||||||||||||||||||||||||||||||||
| Commercial – nonagency | 7 | 6 | — | — | (1) | 8 | (8) | 12 | 7 | ||||||||||||||||||||||||||||||||
Total mortgage-backed securities |
771 | 16 | 249 | (139) | (109) | 9 | (22) | 775 | 9 | ||||||||||||||||||||||||||||||||
Obligations of U.S. states and municipalities |
7 | — | 1 | — | (1) | 3 | — | 10 | — | ||||||||||||||||||||||||||||||||
Non-U.S. government debt securities |
155 | 74 | 217 | (254) | — | 22 | (35) | 179 | 74 | ||||||||||||||||||||||||||||||||
| Corporate debt securities | 463 | 36 | 322 | (172) | (41) | 114 | (238) | 484 | 35 | ||||||||||||||||||||||||||||||||
Loans |
759 | (15) | 1,027 | (499) | (441) | 382 | (529) | 684 | 30 | ||||||||||||||||||||||||||||||||
| Asset-backed securities | 23 | — | 7 | (12) | (1) | 5 | (16) | 6 | — | ||||||||||||||||||||||||||||||||
| Total debt instruments | 2,178 | 111 | 1,823 | (1,076) | (593) | 535 | (840) | 2,138 | 148 | ||||||||||||||||||||||||||||||||
| Equity securities | 665 | (53) | 164 | (239) | (384) | 192 | (218) | 127 | (422) | ||||||||||||||||||||||||||||||||
| Physical commodities | 2 | — | 7 | — | (2) | — | — | 7 | — | ||||||||||||||||||||||||||||||||
| Other | 64 | (58) | 141 | — | (5) | 1 | (42) | 101 | (28) | ||||||||||||||||||||||||||||||||
Total trading assets – debt and equity instruments |
2,909 | — | 2,135 | (1,315) | (984) | 728 | (1,100) | 2,373 | (302) | (c) |
|||||||||||||||||||||||||||||||
Net derivative receivables:(b) |
|||||||||||||||||||||||||||||||||||||||||
| Interest rate | 701 | 556 | 251 | (255) | 654 | (1,117) | (288) | 502 | 419 | ||||||||||||||||||||||||||||||||
| Credit | 13 | 304 | (60) | (25) | 47 | 15 | (29) | 265 | 230 | ||||||||||||||||||||||||||||||||
| Foreign exchange | 489 | 31 | 151 | (144) | (187) | 144 | (422) | 62 | (80) | ||||||||||||||||||||||||||||||||
| Equity | (384) | 191 | 928 | (1,931) | (1,306) | 700 | (600) | (2,402) | (646) | ||||||||||||||||||||||||||||||||
| Commodity | (146) | (59) | 59 | (290) | (51) | (11) | 219 | (279) | (144) | ||||||||||||||||||||||||||||||||
| Total net derivative receivables | 673 | 1,023 | (c) |
1,329 | (2,645) | (843) | (269) | (1,120) | (1,852) | (221) | (c) |
||||||||||||||||||||||||||||||
| Available-for-sale securities: | |||||||||||||||||||||||||||||||||||||||||
| Corporate debt securities | 239 | 24 | — | (225) | — | — | (38) | — | — | ||||||||||||||||||||||||||||||||
| Total available-for-sale securities | 239 | 24 | (d) |
— | (225) | — | — | (38) | — | — | |||||||||||||||||||||||||||||||
Loans |
1,418 | 289 | (c) |
2,398 | (120) | (1,147) | 1,306 | (1,065) | 3,079 | 293 | (c) |
||||||||||||||||||||||||||||||
| Mortgage servicing rights | 7,973 | 467 | (e) |
1,281 | (188) | (1,011) | — | — | 8,522 | 467 | (e) |
||||||||||||||||||||||||||||||
Other assets |
405 | (36) | (c) |
525 | (20) | (147) | 45 | (14) | 758 | (82) | (c) |
||||||||||||||||||||||||||||||
| Fair value measurements using significant unobservable inputs | |||||||||||||||||||||||||||||||||||||||||
| Year ended December 31, 2023 (in millions) |
Fair value at January 1, 2023 | Total realized/unrealized (gains)/losses | Transfers (out of) level 3 | Fair value at Dec. 31, 2023 | Change in unrealized (gains)/losses related to financial instruments held at Dec. 31, 2023 | ||||||||||||||||||||||||||||||||||||
| Purchases | Sales | Issuances | Settlements(h) |
Transfers into level 3 |
|||||||||||||||||||||||||||||||||||||
Liabilities:(a) |
|||||||||||||||||||||||||||||||||||||||||
| Deposits | $ | 2,162 | $ | 95 | (c)(f) |
$ | — | $ | — | $ | 940 | $ | (1,043) | $ | — | $ | (321) | $ | 1,833 | $ | 73 | (c)(f) |
|||||||||||||||||||
| Short-term borrowings | 1,401 | 201 | (c)(f) |
— | — | 4,522 | (4,345) | 3 | (24) | 1,758 | 14 | (c)(f) |
|||||||||||||||||||||||||||||
Trading liabilities – debt and equity instruments |
84 | (21) | (c) |
(32) | 9 | — | (2) | 19 | (20) | 37 | — | ||||||||||||||||||||||||||||||
Accounts payable and other liabilities |
53 | (4) | (c) |
(16) | 24 | — | — | 8 | (13) | 52 | (4) | (c) |
|||||||||||||||||||||||||||||
| Long-term debt | 24,092 | 3,010 | (c)(f) |
— | — | 12,679 | (11,555) | 229 | (729) | 27,726 | 2,870 | (c)(f) |
|||||||||||||||||||||||||||||
JPMorgan Chase & Co./2023 Form 10-K |
187 |
|||||||
| Fair value measurements using significant unobservable inputs | |||||||||||||||||||||||||||||||||||||||||
| Year ended December 31, 2022 (in millions) |
Fair value at January 1, 2022 | Total realized/unrealized gains/(losses) | Transfers (out of) level 3 | Fair value at Dec. 31, 2022 | Change in unrealized gains/(losses) related to financial instruments held at Dec. 31, 2022 | ||||||||||||||||||||||||||||||||||||
Purchases(g) |
Sales | Settlements(h) |
Transfers into level 3 |
||||||||||||||||||||||||||||||||||||||
Assets:(a) |
|||||||||||||||||||||||||||||||||||||||||
| Federal funds sold and securities purchased under resale agreements | $ | — | $ | — | $ | 1 | $ | (1) | $ | (1) | $ | 1 | $ | — | $ | — | $ | — | |||||||||||||||||||||||
| Trading assets: | |||||||||||||||||||||||||||||||||||||||||
| Debt instruments: | |||||||||||||||||||||||||||||||||||||||||
| Mortgage-backed securities: | |||||||||||||||||||||||||||||||||||||||||
| U.S. GSEs and government agencies | 265 | 31 | 673 | (125) | (84) | 4 | (5) | 759 | 29 | ||||||||||||||||||||||||||||||||
| Residential – nonagency | 28 | (1) | 7 | (5) | (12) | — | (12) | 5 | — | ||||||||||||||||||||||||||||||||
| Commercial – nonagency | 10 | — | — | (1) | — | 3 | (5) | 7 | — | ||||||||||||||||||||||||||||||||
Total mortgage-backed securities |
303 | 30 | 680 | (131) | (96) | 7 | (22) | 771 | 29 | ||||||||||||||||||||||||||||||||
Obligations of U.S. states and municipalities |
7 | — | — | — | — | — | — | 7 | — | ||||||||||||||||||||||||||||||||
Non-U.S. government debt securities |
81 | (92) | 494 | (338) | (4) | 84 | (70) | 155 | (153) | ||||||||||||||||||||||||||||||||
| Corporate debt securities | 332 | (30) | 404 | (178) | (100) | 357 | (322) | 463 | (48) | ||||||||||||||||||||||||||||||||
Loans |
708 | (51) | 652 | (605) | (230) | 925 | (640) | 759 | (26) | ||||||||||||||||||||||||||||||||
| Asset-backed securities | 26 | 5 | 19 | (24) | (1) | 5 | (7) | 23 | 1 | ||||||||||||||||||||||||||||||||
| Total debt instruments | 1,457 | (138) | 2,249 | (1,276) | (431) | 1,378 | (1,061) | 2,178 | (197) | ||||||||||||||||||||||||||||||||
| Equity securities | 662 | (1,036) | 473 | (377) | (2) | 1,066 | (121) | 665 | (840) | ||||||||||||||||||||||||||||||||
| Physical commodities | — | (1) | 3 | — | — | — | — | 2 | (1) | ||||||||||||||||||||||||||||||||
| Other | 160 | 93 | 37 | — | (221) | 1 | (6) | 64 | 46 | ||||||||||||||||||||||||||||||||
Total trading assets – debt and equity instruments |
2,279 | (1,082) | (c) |
2,762 | (1,653) | (654) | 2,445 | (1,188) | 2,909 | (992) | (c) |
||||||||||||||||||||||||||||||
Net derivative receivables:(b) |
|||||||||||||||||||||||||||||||||||||||||
| Interest rate | (16) | 187 | 325 | (483) | 329 | 732 | (373) | 701 | 332 | ||||||||||||||||||||||||||||||||
| Credit | 74 | 226 | 17 | (9) | (271) | 5 | (29) | 13 | 170 | ||||||||||||||||||||||||||||||||
| Foreign exchange | (419) | 726 | 215 | (114) | 83 | 3 | (5) | 489 | 459 | ||||||||||||||||||||||||||||||||
| Equity | (3,626) | 5,016 | 1,226 | (2,530) | 96 | (656) | 90 | (384) | 3,435 | ||||||||||||||||||||||||||||||||
| Commodity | (907) | 571 | 110 | (331) | 350 | 5 | 56 | (146) | 369 | ||||||||||||||||||||||||||||||||
| Total net derivative receivables | (4,894) | 6,726 | (c) |
1,893 | (3,467) | 587 | 89 | (261) | 673 | 4,765 | (c) |
||||||||||||||||||||||||||||||
| Available-for-sale securities: | |||||||||||||||||||||||||||||||||||||||||
| Corporate debt securities | 161 | 5 | 88 | — | (15) | — | — | 239 | 5 | ||||||||||||||||||||||||||||||||
| Total available-for-sale securities | 161 | 5 | (d) |
88 | — | (15) | — | — | 239 | 5 | (d) |
||||||||||||||||||||||||||||||
Loans |
1,933 | (158) | (c) |
568 | (261) | (886) | 1,053 | (831) | 1,418 | (76) | (c) |
||||||||||||||||||||||||||||||
| Mortgage servicing rights | 5,494 | 2,039 | (e) |
2,198 | (822) | (936) | — | — | 7,973 | 2,039 | (e) |
||||||||||||||||||||||||||||||
Other assets |
306 | 194 | (c) |
50 | (38) | (103) | 2 | (6) | 405 | 191 | (c) |
||||||||||||||||||||||||||||||
| Fair value measurements using significant unobservable inputs | |||||||||||||||||||||||||||||||||||||||||
| Year ended December 31, 2022 (in millions) |
Fair value at January 1, 2022 | Total realized/unrealized (gains)/losses | Transfers (out of) level 3 | Fair value at Dec. 31, 2022 | Change in unrealized (gains)/losses related to financial instruments held at Dec. 31, 2022 | ||||||||||||||||||||||||||||||||||||
| Purchases | Sales | Issuances | Settlements(h) |
Transfers into level 3 |
|||||||||||||||||||||||||||||||||||||
Liabilities:(a) |
|||||||||||||||||||||||||||||||||||||||||
| Deposits | $ | 2,317 | $ | (292) | (c)(f) |
$ | — | $ | — | $ | 531 | $ | (114) | $ | — | $ | (280) | $ | 2,162 | $ | (76) | (c)(f) |
|||||||||||||||||||
| Short-term borrowings | 2,481 | (358) | (c)(f) |
— | — | 3,963 | (4,685) | 15 | (15) | 1,401 | 90 | (c)(f) |
|||||||||||||||||||||||||||||
Trading liabilities – debt and equity instruments |
30 | (31) | (c) |
(41) | 77 | — | — | 57 | (8) | 84 | 101 | (c) |
|||||||||||||||||||||||||||||
Accounts payable and other liabilities |
69 | (16) | (c) |
(37) | 42 | — | — | 1 | (6) | 53 | (16) | (c) |
|||||||||||||||||||||||||||||
| Long-term debt | 24,374 | (3,869) | (c)(f) |
— | — | 12,714 | (8,876) | 793 | (1,044) | 24,092 | (3,447) | (c)(f) |
|||||||||||||||||||||||||||||
188 |
JPMorgan Chase & Co./2023 Form 10-K |
|||||||
| Fair value measurements using significant unobservable inputs | ||||||||||||||||||||||||||||||||||||||||||||||||||
| Year ended December 31, 2021 (in millions) |
Fair value at January 1, 2021 | Total realized/unrealized gains/(losses) | Transfers (out of) level 3 | Fair value at Dec. 31, 2021 |
Change in unrealized gains/(losses) related to financial instruments held at Dec. 31, 2021 | |||||||||||||||||||||||||||||||||||||||||||||
Purchases(g) |
Sales | Settlements(h) |
Transfers into level 3 |
|||||||||||||||||||||||||||||||||||||||||||||||
Assets:(a) |
||||||||||||||||||||||||||||||||||||||||||||||||||
| Federal funds sold and securities purchased under resale agreements | $ | — | $ | — | $ | — | $ | — | $ | — | $ | — | $ | — | $ | — | $ | — | ||||||||||||||||||||||||||||||||
| Trading assets: | ||||||||||||||||||||||||||||||||||||||||||||||||||
| Debt instruments: | ||||||||||||||||||||||||||||||||||||||||||||||||||
| Mortgage-backed securities: | ||||||||||||||||||||||||||||||||||||||||||||||||||
| U.S. GSEs and government agencies | 449 | (28) | 21 | (67) | (110) | 1 | (1) | 265 | (31) | |||||||||||||||||||||||||||||||||||||||||
| Residential – nonagency | 28 | — | 26 | (24) | (5) | 4 | (1) | 28 | (3) | |||||||||||||||||||||||||||||||||||||||||
| Commercial – nonagency | 3 | 5 | 12 | (7) | (17) | 14 | — | 10 | (2) | |||||||||||||||||||||||||||||||||||||||||
Total mortgage-backed securities |
480 | (23) | 59 | (98) | (132) | 19 | (2) | 303 | (36) | |||||||||||||||||||||||||||||||||||||||||
Obligations of U.S. states and municipalities |
8 | — | — | — | (1) | — | — | 7 | — | |||||||||||||||||||||||||||||||||||||||||
Non-U.S. government debt securities |
182 | (14) | 359 | (332) | (7) | — | (107) | 81 | (10) | |||||||||||||||||||||||||||||||||||||||||
| Corporate debt securities | 507 | (23) | 404 | (489) | (4) | 162 | (225) | 332 | (16) | |||||||||||||||||||||||||||||||||||||||||
Loans |
893 | 2 | 994 | (669) | (287) | 648 | (873) | 708 | (20) | |||||||||||||||||||||||||||||||||||||||||
| Asset-backed securities | 28 | 28 | 76 | (99) | (2) | 2 | (7) | 26 | (2) | |||||||||||||||||||||||||||||||||||||||||
| Total debt instruments | 2,098 | (30) | 1,892 | (1,687) | (433) | 831 | (1,214) | 1,457 | (84) | |||||||||||||||||||||||||||||||||||||||||
| Equity securities | 476 | (77) | 378 | (168) | — | 164 | (111) | 662 | (335) | |||||||||||||||||||||||||||||||||||||||||
| Physical commodities | — | — | — | — | — | — | — | — | — | |||||||||||||||||||||||||||||||||||||||||
| Other | 49 | 74 | 233 | — | (98) | 5 | (103) | 160 | 31 | |||||||||||||||||||||||||||||||||||||||||
Total trading assets – debt and equity instruments |
2,623 | (33) | (c) |
2,503 | (1,855) | (531) | 1,000 | (1,428) | 2,279 | (388) | (c) |
|||||||||||||||||||||||||||||||||||||||
Net derivative receivables:(b) |
||||||||||||||||||||||||||||||||||||||||||||||||||
| Interest rate | 258 | 1,789 | 116 | (192) | (2,011) | 112 | (88) | (16) | 282 | |||||||||||||||||||||||||||||||||||||||||
| Credit | (224) | 130 | 6 | (12) | 146 | 34 | (6) | 74 | 141 | |||||||||||||||||||||||||||||||||||||||||
| Foreign exchange | (434) | (209) | 110 | (110) | 222 | (12) | 14 | (419) | 13 | |||||||||||||||||||||||||||||||||||||||||
| Equity | (3,862) | (480) | 1,285 | (2,813) | 1,758 | 315 | 171 | (3,626) | (155) | |||||||||||||||||||||||||||||||||||||||||
| Commodity | (731) | (728) | 145 | (493) | 916 | (4) | (12) | (907) | (426) | |||||||||||||||||||||||||||||||||||||||||
| Total net derivative receivables | (4,993) | 502 | (c) |
1,662 | (3,620) | 1,031 | 445 | 79 | (4,894) | (145) | (c) |
|||||||||||||||||||||||||||||||||||||||
| Available-for-sale securities: | ||||||||||||||||||||||||||||||||||||||||||||||||||
| Corporate debt securities | — | (1) | 162 | — | — | — | — | 161 | (1) | |||||||||||||||||||||||||||||||||||||||||
| Total available-for-sale securities | — | (1) | (d) |
162 | — | — | — | — | 161 | (1) | (d) |
|||||||||||||||||||||||||||||||||||||||
Loans |
2,305 | (87) | (c) |
612 | (439) | (965) | 1,301 | (794) | 1,933 | (59) | (c) |
|||||||||||||||||||||||||||||||||||||||
| Mortgage servicing rights | 3,276 | 98 | (e) |
3,022 | (114) | (788) | — | — | 5,494 | 98 | (e) |
|||||||||||||||||||||||||||||||||||||||
Other assets |
538 | 16 | (c) |
9 | (17) | (239) | — | (1) | 306 | 11 | (c) |
|||||||||||||||||||||||||||||||||||||||
| Fair value measurements using significant unobservable inputs | ||||||||||||||||||||||||||||||||||||||||||||||||||
| Year ended December 31, 2021 (in millions) |
Fair value at January 1, 2021 | Total realized/unrealized (gains)/losses | Transfers into level 3 |
Transfers (out of) level 3 | Fair value at Dec. 31, 2021 |
Change in unrealized (gains)/losses related to financial instruments held at Dec. 31, 2021 | ||||||||||||||||||||||||||||||||||||||||||||
| Purchases | Sales | Issuances | Settlements(h) |
|||||||||||||||||||||||||||||||||||||||||||||||
Liabilities:(a) |
||||||||||||||||||||||||||||||||||||||||||||||||||
| Deposits | $ | 2,913 | $ | (80) | (c)(f) |
$ | — | $ | — | $ | 431 | $ | (467) | $ | 2 | $ | (482) | $ | 2,317 | $ | (77) | (c)(f) |
||||||||||||||||||||||||||||
| Short-term borrowings | 2,420 | (1,391) | (c)(f) |
— | — | 6,823 | (5,308) | 9 | (72) | 2,481 | (83) | (c)(f) |
||||||||||||||||||||||||||||||||||||||
Trading liabilities – debt and equity instruments |
51 | (8) | (c) |
(101) | 38 | — | — | 64 | (14) | 30 | (157) | (c) |
||||||||||||||||||||||||||||||||||||||
Accounts payable and other liabilities |
68 | 8 | (c) |
— | 1 | — | — | — | (8) | 69 | 8 | (c) |
||||||||||||||||||||||||||||||||||||||
| Long-term debt | 23,397 | 369 | (c)(f) |
— | — | 13,505 | (12,191) | 103 | (809) | 24,374 | 87 | (c)(f) |
||||||||||||||||||||||||||||||||||||||
JPMorgan Chase & Co./2023 Form 10-K |
189 |
|||||||
190 |
JPMorgan Chase & Co./2023 Form 10-K |
|||||||
JPMorgan Chase & Co./2023 Form 10-K |
191 |
|||||||
| Year ended December 31, (in millions) |
2023 | 2022 | 2021 | ||||||||||||||
| Credit and funding adjustments: | |||||||||||||||||
| Derivatives CVA | $ | 221 | $ | 22 | $ | 362 | |||||||||||
| Derivatives FVA | 114 | 42 | 47 | ||||||||||||||
192 |
JPMorgan Chase & Co./2023 Form 10-K |
|||||||
| December 31, 2023 (in millions) |
Fair value hierarchy | Total fair value | |||||||||||||||||||||
Level 1 |
Level 2 |
Level 3 |
|||||||||||||||||||||
| Loans | $ | — | $ | 599 | $ | 1,156 | $ | 1,755 | |||||||||||||||
Other assets(a) |
— | 52 | 1,334 | 1,386 | |||||||||||||||||||
| Total assets measured at fair value on a nonrecurring basis | $ | — | $ | 651 | $ | 2,490 | $ | 3,141 | |||||||||||||||
| Accounts payable and other liabilities | — | — | — | — | |||||||||||||||||||
| Total liabilities measured at fair value on a nonrecurring basis | $ | — | $ | — | $ | — | $ | — | |||||||||||||||
| December 31, 2022 (in millions) |
Fair value hierarchy | Total fair value | |||||||||||||||||||||
Level 1 |
Level 2 |
Level 3 |
|||||||||||||||||||||
| Loans | $ | — | $ | 643 | $ | 627 | $ | 1,270 | |||||||||||||||
| Other assets | — | 36 | 1,352 | 1,388 | |||||||||||||||||||
| Total assets measured at fair value on a nonrecurring basis | $ | — | $ | 679 | $ | 1,979 | $ | 2,658 | |||||||||||||||
Accounts payable and other liabilities |
— | — | 84 | 84 | |||||||||||||||||||
| Total liabilities measured at fair value on a nonrecurring basis | $ | — | $ | — | $ | 84 | $ | 84 | |||||||||||||||
| December 31, (in millions) | 2023 | 2022 | 2021 | ||||||||||||||
| Loans | $ | (276) | $ | (55) | $ | (72) | |||||||||||
Other assets(a) |
(789) | (409) | 344 | ||||||||||||||
| Accounts payable and other liabilities | — | (83) | 5 | ||||||||||||||
Total nonrecurring fair value gains/(losses) |
$ | (1,065) | $ | (547) | $ | 277 | |||||||||||
JPMorgan Chase & Co./2023 Form 10-K |
193 |
|||||||
| As of or for the year ended December 31, | |||||||||||
| (in millions) | 2023 | 2022 | |||||||||
| Other assets | |||||||||||
Carrying value(a) |
$ | 4,457 | $ | 4,096 | |||||||
Upward carrying value changes(b) |
93 | 488 | |||||||||
Downward carrying value changes/impairment(c) |
(325) | (826) | |||||||||
194 |
JPMorgan Chase & Co./2023 Form 10-K |
|||||||
| December 31, 2023 | December 31, 2022 | ||||||||||||||||||||||||||||||||||||||||
| Estimated fair value hierarchy | Estimated fair value hierarchy | ||||||||||||||||||||||||||||||||||||||||
| (in billions) | Carrying value |
Level 1 | Level 2 | Level 3 | Total estimated fair value |
Carrying value |
Level 1 | Level 2 | Level 3 | Total estimated fair value |
|||||||||||||||||||||||||||||||
| Financial assets | |||||||||||||||||||||||||||||||||||||||||
| Cash and due from banks | $ | 29.1 | $ | 29.1 | $ | — | $ | — | $ | 29.1 | $ | 27.7 | $ | 27.7 | $ | — | $ | — | $ | 27.7 | |||||||||||||||||||||
| Deposits with banks | 595.1 | 594.6 | 0.5 | — | 595.1 | 539.5 | 539.3 | 0.2 | — | 539.5 | |||||||||||||||||||||||||||||||
Accrued interest and accounts receivable |
107.1 | — | 107.0 | 0.1 | 107.1 | 124.7 | — | 124.6 | 0.1 | 124.7 | |||||||||||||||||||||||||||||||
Federal funds sold and securities purchased under resale agreements |
16.3 | — | 16.3 | — | 16.3 | 3.7 | — | 3.7 | — | 3.7 | |||||||||||||||||||||||||||||||
Securities borrowed |
130.3 | — | 130.3 | — | 130.3 | 115.3 | — | 115.3 | — | 115.3 | |||||||||||||||||||||||||||||||
Investment securities, held-to-maturity |
369.8 | 160.6 | 182.2 | — | 342.8 | 425.3 | 189.1 | 199.5 | — | 388.6 | |||||||||||||||||||||||||||||||
Loans, net of allowance for loan losses(a) |
1,262.5 | — | 285.6 | 964.6 | 1,250.2 | 1,073.9 | — | 194.0 | 853.9 | 1,047.9 | |||||||||||||||||||||||||||||||
| Other | 76.1 | — | 74.9 | 1.4 | 76.3 | 101.2 | — | 99.6 | 1.7 | 101.3 | |||||||||||||||||||||||||||||||
| Financial liabilities | |||||||||||||||||||||||||||||||||||||||||
| Deposits | $ | 2,322.3 | $ | — | $ | 2,322.6 | $ | — | $ | 2,322.6 | $ | 2,311.6 | $ | — | $ | 2,311.5 | $ | — | $ | 2,311.5 | |||||||||||||||||||||
Federal funds purchased and securities loaned or sold under repurchase agreements |
47.5 | — | 47.5 | — | 47.5 | 50.6 | — | 50.6 | — | 50.6 | |||||||||||||||||||||||||||||||
Short-term borrowings(b) |
24.7 | — | 24.7 | — | 24.7 | 28.2 | — | 28.2 | — | 28.2 | |||||||||||||||||||||||||||||||
Accounts payable and other liabilities |
241.8 | — | 233.3 | 8.1 | 241.4 | 257.5 | — | 251.2 | 5.6 | 256.8 | |||||||||||||||||||||||||||||||
Beneficial interests issued by consolidated VIEs |
23.0 | — | 23.0 | — | 23.0 | 12.6 | — | 12.6 | — | 12.6 | |||||||||||||||||||||||||||||||
Long-term debt(b) |
303.9 | — | 252.2 | 51.3 | 303.5 | 223.6 | — | 216.5 | 2.8 | 219.3 | |||||||||||||||||||||||||||||||
JPMorgan Chase & Co./2023 Form 10-K |
195 |
|||||||
| December 31, 2023 | December 31, 2022 | ||||||||||||||||||||||||||||||||||
| Estimated fair value hierarchy | Estimated fair value hierarchy | ||||||||||||||||||||||||||||||||||
| (in billions) | Carrying value(a)(b)(c) |
Level 1 | Level 2 | Level 3 | Total estimated fair value | Carrying value(a)(b) |
Level 1 | Level 2 | Level 3 | Total estimated fair value | |||||||||||||||||||||||||
Wholesale lending-related commitments |
$ | 3.0 | $ | — | $ | — | $ | 4.8 | $ | 4.8 | $ | 2.3 | $ | — | $ | — | $ | 3.2 | $ | 3.2 | |||||||||||||||
196 |
JPMorgan Chase & Co./2023 Form 10-K |
|||||||
JPMorgan Chase & Co./2023 Form 10-K |
197 |
|||||||
| 2023 | 2022 | 2021 | ||||||||||||||||||||||||||||||||||||||||||||||||
| December 31, (in millions) | Principal transactions | All other income | Total changes in fair value recorded(e) |
Principal transactions | All other income | Total changes in fair value recorded(e) |
Principal transactions | All other income | Total changes in fair value recorded(e) |
|||||||||||||||||||||||||||||||||||||||||
Federal funds sold and securities purchased under resale agreements |
$ | 300 | $ | — | $ | 300 | $ | (384) | $ | — | $ | (384) | $ | (112) | $ | — | $ | (112) | ||||||||||||||||||||||||||||||||
| Securities borrowed | 164 | — | 164 | (499) | — | (499) | (200) | — | (200) | |||||||||||||||||||||||||||||||||||||||||
| Trading assets: | ||||||||||||||||||||||||||||||||||||||||||||||||||
Debt and equity instruments, excluding loans |
3,656 | — | 3,656 | (1,703) | — | (1,703) | (2,171) | (1) | (c) |
(2,172) | ||||||||||||||||||||||||||||||||||||||||
|
Loans reported as trading
assets:
|
||||||||||||||||||||||||||||||||||||||||||||||||||
| Changes in instrument-specific credit risk | 248 | — | 248 | (136) | — | (136) | 353 | — | 353 | |||||||||||||||||||||||||||||||||||||||||
| Other changes in fair value | 3 | 5 | (c) |
8 | (59) | — | (59) | (8) | — | (8) | ||||||||||||||||||||||||||||||||||||||||
| Loans: | ||||||||||||||||||||||||||||||||||||||||||||||||||
| Changes in instrument-specific credit risk | 322 | (4) | (c) |
318 | (242) | 21 | (c) |
(221) | 589 | (7) | (c) |
582 | ||||||||||||||||||||||||||||||||||||||
| Other changes in fair value | 427 | 216 | (c) |
643 | (1,421) | (794) | (c) |
(2,215) | (139) | 2,056 | (c) |
1,917 | ||||||||||||||||||||||||||||||||||||||
| Other assets | 282 | (4) | (d) |
278 | 39 | (6) | (d) |
33 | 12 | (26) | (d) |
(14) | ||||||||||||||||||||||||||||||||||||||
Deposits(a) |
(2,582) | — | (2,582) | 901 | — | 901 | (183) | — | (183) | |||||||||||||||||||||||||||||||||||||||||
Federal funds purchased and securities loaned or sold under repurchase agreements |
(121) | — | (121) | 181 | — | 181 | 69 | — | 69 | |||||||||||||||||||||||||||||||||||||||||
Short-term borrowings(a) |
(567) | — | (567) | 473 | — | 473 | (366) | — | (366) | |||||||||||||||||||||||||||||||||||||||||
| Trading liabilities | (24) | — | (24) | 43 | — | 43 | 7 | — | 7 | |||||||||||||||||||||||||||||||||||||||||
Beneficial interests issued by consolidated VIEs |
— | — | — | (1) | — | (1) | — | — | — | |||||||||||||||||||||||||||||||||||||||||
Other liabilities |
(16) | — | (16) | (11) | — | (11) | (17) | — | (17) | |||||||||||||||||||||||||||||||||||||||||
Long-term debt(a)(b) |
(5,875) | (78) | (c)(d) |
(5,953) | 8,990 | 98 | (c)(d) |
9,088 | (980) | 4 | (c)(d) |
(976) | ||||||||||||||||||||||||||||||||||||||
198 |
JPMorgan Chase & Co./2023 Form 10-K |
|||||||
| 2023 | 2022 | ||||||||||||||||||||||||||||
| December 31, (in millions) | Contractual principal outstanding | Fair value | Fair value over/(under) contractual principal outstanding | Contractual principal outstanding | Fair value | Fair value over/(under) contractual principal outstanding | |||||||||||||||||||||||
| Loans | |||||||||||||||||||||||||||||
| Nonaccrual loans | |||||||||||||||||||||||||||||
| Loans reported as trading assets | $ | 2,987 | $ | 588 | $ | (2,399) | $ | 2,517 | $ | 368 | $ | (2,149) | |||||||||||||||||
| Loans | 838 | 732 | (106) | 967 | 829 | (138) | |||||||||||||||||||||||
| Subtotal | 3,825 | 1,320 | (2,505) | 3,484 | 1,197 | (2,287) | |||||||||||||||||||||||
| 90 or more days past due and government guaranteed | |||||||||||||||||||||||||||||
Loans(a) |
65 | 59 | (6) | 124 | 115 | (9) | |||||||||||||||||||||||
All other performing loans(b) |
|||||||||||||||||||||||||||||
| Loans reported as trading assets | 9,547 | 7,968 | (1,579) | 7,823 | 6,135 | (1,688) | |||||||||||||||||||||||
| Loans | 38,948 | 38,060 | (888) | 42,588 | 41,135 | (1,453) | |||||||||||||||||||||||
| Subtotal | 48,495 | 46,028 | (2,467) | 50,411 | 47,270 | (3,141) | |||||||||||||||||||||||
| Total loans | $ | 52,385 | $ | 47,407 | $ | (4,978) | $ | 54,019 | $ | 48,582 | $ | (5,437) | |||||||||||||||||
| Long-term debt | |||||||||||||||||||||||||||||
| Principal-protected debt | $ | 47,768 | (d) |
$ | 38,882 | $ | (8,886) | $ | 41,341 | (d) |
$ | 31,105 | $ | (10,236) | |||||||||||||||
Nonprincipal-protected debt(c) |
NA | 49,042 | NA | NA | 41,176 | NA | |||||||||||||||||||||||
| Total long-term debt | NA | $ | 87,924 | NA | NA | $ | 72,281 | NA | |||||||||||||||||||||
| Long-term beneficial interests | |||||||||||||||||||||||||||||
Nonprincipal-protected debt(c) |
NA | $ | 1 | NA | NA | $ | 5 | NA | |||||||||||||||||||||
| Total long-term beneficial interests | NA | $ | 1 | NA | NA | $ | 5 | NA | |||||||||||||||||||||
JPMorgan Chase & Co./2023 Form 10-K |
199 |
|||||||
| December 31, 2023 | December 31, 2022 | ||||||||||||||||||||||||||||||||||||||||||||||
| (in millions) | Long-term debt | Short-term borrowings | Deposits | Total | Long-term debt | Short-term borrowings | Deposits | Total | |||||||||||||||||||||||||||||||||||||||
| Risk exposure | |||||||||||||||||||||||||||||||||||||||||||||||
| Interest rate | $ | 38,604 | $ | 654 | $ | 74,526 | $ | 113,784 | $ | 31,973 | $ | 260 | $ | 24,655 | $ | 56,888 | |||||||||||||||||||||||||||||||
| Credit | 5,444 | 350 | — | 5,794 | 4,105 | 170 | — | 4,275 | |||||||||||||||||||||||||||||||||||||||
| Foreign exchange | 2,605 | 941 | 187 | 3,733 | 2,674 | 788 | 50 | 3,512 | |||||||||||||||||||||||||||||||||||||||
| Equity | 38,685 | 5,483 | 2,905 | 47,073 | 30,864 | 4,272 | 3,545 | 38,681 | |||||||||||||||||||||||||||||||||||||||
| Commodity | 1,862 | 11 | 1 | (a) |
1,874 | 1,655 | 16 | 2 | (a) |
1,673 | |||||||||||||||||||||||||||||||||||||
| Total structured notes | $ | 87,200 | $ | 7,439 | $ | 77,619 | $ | 172,258 | $ | 71,271 | $ | 5,506 | $ | 28,252 | $ | 105,029 | |||||||||||||||||||||||||||||||
200 |
JPMorgan Chase & Co./2023 Form 10-K |
|||||||
JPMorgan Chase & Co./2023 Form 10-K |
201 |
|||||||
| 2023 | 2022 | |||||||||||||||||||||||||||||||||||||
Credit exposure(h)(i) |
On-balance sheet | Off-balance sheet(k) |
Credit exposure(h) |
On-balance sheet | Off-balance sheet(k) |
|||||||||||||||||||||||||||||||||
| December 31, (in millions) | Loans | Derivatives | Loans | Derivatives | ||||||||||||||||||||||||||||||||||
| Consumer, excluding credit card | $ | 455,496 | $ | 410,093 | $ | — | $ | 45,403 | $ | 344,893 | $ | 311,375 | (j) |
$ | — | $ | 33,518 | |||||||||||||||||||||
Credit card(a) |
1,126,781 | 211,123 | — | 915,658 | 1,006,459 | 185,175 | — | 821,284 | ||||||||||||||||||||||||||||||
Total consumer(a) |
1,582,277 | 621,216 | — | 961,061 | 1,351,352 | 496,550 | — | 854,802 | ||||||||||||||||||||||||||||||
Wholesale(b) |
||||||||||||||||||||||||||||||||||||||
| Real Estate | 208,261 | 166,372 | 420 | 41,469 | 170,857 | 131,681 | 249 | 38,927 | ||||||||||||||||||||||||||||||
Individuals and Individual Entities(c) |
145,849 | 126,339 | 725 | 18,785 | 130,815 | 120,424 | 434 | 9,957 | ||||||||||||||||||||||||||||||
Asset Managers |
129,574 | 52,178 | 9,925 | 67,471 | 95,656 | 40,511 | 16,397 | 38,748 | ||||||||||||||||||||||||||||||
| Consumer & Retail | 127,086 | 46,274 | 2,013 | 78,799 | 120,555 | 45,867 | 1,650 | 73,038 | ||||||||||||||||||||||||||||||
| Technology, Media & Telecommunications |
77,296 | 22,450 | 2,451 | 52,395 | 72,286 | 21,622 | 2,950 | 47,714 | ||||||||||||||||||||||||||||||
| Industrials | 75,092 | 26,548 | 1,335 | 47,209 | 72,483 | 26,960 | 1,770 | 43,753 | ||||||||||||||||||||||||||||||
| Healthcare | 65,025 | 23,169 | 1,577 | 40,279 | 62,613 | 22,970 | 1,683 | 37,960 | ||||||||||||||||||||||||||||||
| Banks & Finance Companies | 57,177 | 33,941 | 2,898 | 20,338 | 51,816 | 32,172 | 3,246 | 16,398 | ||||||||||||||||||||||||||||||
| Utilities | 36,061 | 7,067 | 3,396 | 25,598 | 36,218 | 9,107 | 3,269 | 23,842 | ||||||||||||||||||||||||||||||
State & Municipal Govt(d) |
35,986 | 20,019 | 442 | 15,525 | 33,847 | 18,147 | 585 | 15,115 | ||||||||||||||||||||||||||||||
Oil & Gas |
34,475 | 8,480 | 705 | 25,290 | 38,668 | 9,632 | 5,121 | 23,915 | ||||||||||||||||||||||||||||||
| Automotive | 33,977 | 17,459 | 428 | 16,090 | 33,287 | 14,735 | 529 | 18,023 | ||||||||||||||||||||||||||||||
| Chemicals & Plastics | 20,773 | 6,458 | 441 | 13,874 | 20,030 | 5,771 | 407 | 13,852 | ||||||||||||||||||||||||||||||
| Insurance | 20,501 | 2,535 | 7,138 | 10,828 | 21,045 | 2,387 | 8,081 | 10,577 | ||||||||||||||||||||||||||||||
| Central Govt | 17,704 | 5,463 | 10,669 | 1,572 | 19,095 | 3,167 | 12,955 | 2,973 | ||||||||||||||||||||||||||||||
| Transportation | 16,060 | 5,080 | 555 | 10,425 | 15,009 | 5,005 | 567 | 9,437 | ||||||||||||||||||||||||||||||
| Metals & Mining | 15,508 | 4,655 | 274 | 10,579 | 15,915 | 5,398 | 475 | 10,042 | ||||||||||||||||||||||||||||||
| Securities Firms | 8,689 | 865 | 3,285 | 4,539 | 8,066 | 556 | 3,387 | 4,123 | ||||||||||||||||||||||||||||||
| Financial Markets Infrastructure | 4,251 | 86 | 2,155 | 2,010 | 4,962 | 13 | 3,050 | 1,899 | ||||||||||||||||||||||||||||||
All other(e) |
134,777 | 97,034 | 4,032 | 33,711 | 123,307 | 87,545 | 4,075 | 31,687 | ||||||||||||||||||||||||||||||
| Subtotal | 1,264,122 | 672,472 | 54,864 | 536,786 | 1,146,530 | 603,670 | 70,880 | 471,980 | ||||||||||||||||||||||||||||||
Loans held-for-sale and loans at fair value |
30,018 | 30,018 | — | — | 35,427 | 35,427 | — | — | ||||||||||||||||||||||||||||||
Receivables from customers(f) |
47,625 | — | — | — | 49,257 | — | — | — | ||||||||||||||||||||||||||||||
| Total wholesale | 1,341,765 | 702,490 | 54,864 | 536,786 | 1,231,214 | 639,097 | 70,880 | 471,980 | ||||||||||||||||||||||||||||||
Total exposure(g)(h) |
$ | 2,924,042 | $ | 1,323,706 | $ | 54,864 | $ | 1,497,847 | $ | 2,582,566 | $ | 1,135,647 | $ | 70,880 | $ | 1,326,782 | ||||||||||||||||||||||
202 |
JPMorgan Chase & Co./2023 Form 10-K |
|||||||
JPMorgan Chase & Co./2023 Form 10-K |
203 |
|||||||
204 |
JPMorgan Chase & Co./2023 Form 10-K |
|||||||
| Type of Derivative | Use of Derivative | Designation and disclosure | Affected segment or unit | Page reference | ||||||||||
| Manage specifically identified risk exposures in qualifying hedge accounting relationships: | ||||||||||||||
•Interest rate |
Hedge fixed rate assets and liabilities | Fair value hedge | Corporate |
211-212 | ||||||||||
•Interest rate |
Hedge floating-rate assets and liabilities | Cash flow hedge | Corporate |
213 | ||||||||||
•Foreign exchange |
Hedge foreign currency-denominated assets and liabilities |
Fair value hedge |
Corporate |
211-212 | ||||||||||
•Foreign exchange |
Hedge foreign currency-denominated forecasted revenue and expense |
Cash flow hedge | Corporate |
213 | ||||||||||
•Foreign exchange |
Hedge the value of the Firm’s investments in non-U.S. dollar functional currency entities |
Net investment hedge |
Corporate |
213 | ||||||||||
•Commodity |
Hedge commodity inventory | Fair value hedge |
CIB, AWM | 211-212 | ||||||||||
Manage specifically identified risk exposures not designated in qualifying hedge accounting relationships: |
||||||||||||||
•Interest rate |
Manage the risk associated with mortgage commitments, warehouse loans and MSRs |
Specified risk management | CCB | 214 | ||||||||||
•Credit |
Manage the credit risk associated with wholesale lending exposures |
Specified risk management |
CIB, AWM |
214 | ||||||||||
•Interest rate and foreign exchange |
Manage the risk associated with certain other specified assets and liabilities | Specified risk management |
Corporate, CIB |
214 | ||||||||||
Market-making derivatives and other activities: |
||||||||||||||
•Various |
Market-making and related risk management | Market-making and other |
CIB | 214 | ||||||||||
•Various |
Other derivatives | Market-making and other |
CIB, AWM, Corporate | 214 | ||||||||||
JPMorgan Chase & Co./2023 Form 10-K |
205 |
|||||||
Notional amounts(b) |
|||||||||||
| December 31, (in billions) | 2023 | 2022 | |||||||||
| Interest rate contracts | |||||||||||
Swaps |
$ | 23,251 | $ | 24,491 | |||||||
Futures and forwards |
2,690 | 2,636 | |||||||||
Written options |
3,370 | 3,047 | |||||||||
Purchased options |
3,362 | 2,992 | |||||||||
Total interest rate contracts |
32,673 | 33,166 | |||||||||
Credit derivatives(a) |
1,045 | 1,132 | |||||||||
Foreign exchange contracts |
|||||||||||
Cross-currency swaps |
4,721 | 4,196 | |||||||||
Spot, futures and forwards |
6,957 | 7,017 | |||||||||
Written options |
830 | 775 | |||||||||
Purchased options |
798 | 759 | |||||||||
Total foreign exchange contracts |
13,306 | 12,747 | |||||||||
| Equity contracts | |||||||||||
Swaps |
639 | 618 | |||||||||
Futures and forwards |
157 | 110 | |||||||||
Written options |
778 | 636 | |||||||||
Purchased options |
698 | 580 | |||||||||
| Total equity contracts | 2,272 | 1,944 | |||||||||
| Commodity contracts | |||||||||||
Swaps |
115 | 136 | |||||||||
Spot, futures and forwards |
157 | 136 | |||||||||
Written options |
130 | 117 | |||||||||
Purchased options |
115 | 98 | |||||||||
Total commodity contracts |
517 | 487 | |||||||||
Total derivative notional amounts |
$ | 49,813 | $ | 49,476 | |||||||
206 |
JPMorgan Chase & Co./2023 Form 10-K |
|||||||
Free-standing derivative receivables and payables(a) |
|||||||||||||||||||||||||||||||||||||||||||||||
| Gross derivative receivables | Gross derivative payables | ||||||||||||||||||||||||||||||||||||||||||||||
| December 31, 2023 (in millions) |
Not designated as hedges | Designated as hedges | Total derivative receivables | Net derivative receivables(b) |
Not designated as hedges | Designated as hedges | Total derivative payables | Net derivative payables(b) |
|||||||||||||||||||||||||||||||||||||||
| Trading assets and liabilities | |||||||||||||||||||||||||||||||||||||||||||||||
| Interest rate | $ | 250,689 | $ | 2 | $ | 250,691 | $ | 26,324 | $ | 240,482 | $ | — | $ | 240,482 | $ | 11,896 | |||||||||||||||||||||||||||||||
| Credit | 9,654 | — | 9,654 | 551 | 12,038 | — | 12,038 | 1,089 | |||||||||||||||||||||||||||||||||||||||
| Foreign exchange | 205,010 | 765 | 205,775 | 18,019 | 210,623 | 1,640 | 212,263 | 12,620 | |||||||||||||||||||||||||||||||||||||||
| Equity | 57,689 | — | 57,689 | 4,928 | 65,811 | — | 65,811 | 9,368 | |||||||||||||||||||||||||||||||||||||||
| Commodity | 15,228 | 211 | 15,439 | 5,042 | 16,286 | 92 | 16,378 | 5,874 | |||||||||||||||||||||||||||||||||||||||
Total fair value of trading assets and liabilities |
$ | 538,270 | $ | 978 | $ | 539,248 | $ | 54,864 | $ | 545,240 | $ | 1,732 | $ | 546,972 | $ | 40,847 | |||||||||||||||||||||||||||||||
| Gross derivative receivables | Gross derivative payables | ||||||||||||||||||||||||||||||||||||||||||||||
| December 31, 2022 (in millions) |
Not designated as hedges | Designated as hedges | Total derivative receivables | Net derivative receivables(b) |
Not designated as hedges | Designated as hedges | Total derivative payables |
Net
derivative payables(b)
|
|||||||||||||||||||||||||||||||||||||||
| Trading assets and liabilities | |||||||||||||||||||||||||||||||||||||||||||||||
| Interest rate | $ | 300,411 | $ | 4 | $ | 300,415 | $ | 28,419 | $ | 290,291 | $ | — | $ | 290,291 | $ | 15,970 | |||||||||||||||||||||||||||||||
| Credit | 10,329 | — | 10,329 | 1,090 | 9,971 | — | 9,971 | 754 | |||||||||||||||||||||||||||||||||||||||
| Foreign exchange | 239,946 | 1,633 | 241,579 | 23,365 | 248,911 | 2,610 | 251,521 | 18,856 | |||||||||||||||||||||||||||||||||||||||
| Equity | 61,913 | — | 61,913 | 9,139 | 62,461 | — | 62,461 | 8,804 | |||||||||||||||||||||||||||||||||||||||
| Commodity | 23,652 | 1,705 | 25,357 | 8,867 | 20,758 | 2,511 | 23,269 | 6,757 | |||||||||||||||||||||||||||||||||||||||
Total fair value of trading assets and liabilities |
$ | 636,251 | $ | 3,342 | $ | 639,593 | $ | 70,880 | $ | 632,392 | $ | 5,121 | $ | 637,513 | $ | 51,141 | |||||||||||||||||||||||||||||||
JPMorgan Chase & Co./2023 Form 10-K |
207 |
|||||||
| 2023 | 2022 | ||||||||||||||||||||||||||||||||||
| December 31, (in millions) | Gross derivative receivables | Amounts netted on the Consolidated balance sheets | Net derivative receivables | Gross derivative receivables | Amounts netted on the Consolidated balance sheets | Net derivative receivables |
|||||||||||||||||||||||||||||
U.S. GAAP nettable derivative receivables |
|||||||||||||||||||||||||||||||||||
| Interest rate contracts: | |||||||||||||||||||||||||||||||||||
| OTC | $ | 176,901 | $ | (152,703) | $ | 24,198 | $ | 203,922 | $ | (178,261) | $ | 25,661 | |||||||||||||||||||||||
| OTC–cleared | 71,419 | (71,275) | 144 | 93,800 | (93,424) | 376 | |||||||||||||||||||||||||||||
Exchange-traded(a) |
402 | (389) | 13 | 559 | (311) | 248 | |||||||||||||||||||||||||||||
| Total interest rate contracts | 248,722 | (224,367) | 24,355 | 298,281 | (271,996) | 26,285 | |||||||||||||||||||||||||||||
| Credit contracts: | |||||||||||||||||||||||||||||||||||
| OTC | 7,637 | (7,226) | 411 | 8,474 | (7,535) | 939 | |||||||||||||||||||||||||||||
| OTC–cleared | 1,904 | (1,877) | 27 | 1,746 | (1,704) | 42 | |||||||||||||||||||||||||||||
| Total credit contracts | 9,541 | (9,103) | 438 | 10,220 | (9,239) | 981 | |||||||||||||||||||||||||||||
| Foreign exchange contracts: | |||||||||||||||||||||||||||||||||||
| OTC | 203,624 | (187,295) | 16,329 | 237,941 | (216,796) | 21,145 | |||||||||||||||||||||||||||||
| OTC–cleared | 469 | (459) | 10 | 1,461 | (1,417) | 44 | |||||||||||||||||||||||||||||
Exchange-traded(a) |
6 | (2) | 4 | 15 | (1) | 14 | |||||||||||||||||||||||||||||
| Total foreign exchange contracts | 204,099 | (187,756) | 16,343 | 239,417 | (218,214) | 21,203 | |||||||||||||||||||||||||||||
| Equity contracts: | |||||||||||||||||||||||||||||||||||
| OTC | 25,001 | (23,677) | 1,324 | 30,323 | (25,665) | 4,658 | |||||||||||||||||||||||||||||
Exchange-traded(a) |
30,462 | (29,084) | 1,378 | 28,467 | (27,109) | 1,358 | |||||||||||||||||||||||||||||
| Total equity contracts | 55,463 | (52,761) | 2,702 | 58,790 | (52,774) | 6,016 | |||||||||||||||||||||||||||||
| Commodity contracts: | |||||||||||||||||||||||||||||||||||
| OTC | 8,049 | (5,084) | 2,965 | 14,430 | (7,633) | 6,797 | |||||||||||||||||||||||||||||
| OTC–cleared | 133 | (123) | 10 | 120 | (112) | 8 | |||||||||||||||||||||||||||||
Exchange-traded(a) |
5,214 | (5,190) | 24 | 9,103 | (8,745) | 358 | |||||||||||||||||||||||||||||
| Total commodity contracts | 13,396 | (10,397) | 2,999 | 23,653 | (16,490) | 7,163 | |||||||||||||||||||||||||||||
Derivative receivables with appropriate legal opinion |
531,221 | (484,384) | 46,837 | (d) |
630,361 | (568,713) | 61,648 | (d) |
|||||||||||||||||||||||||||
Derivative receivables where an appropriate legal opinion has not been either sought or obtained |
8,027 | 8,027 | 9,232 | 9,232 | |||||||||||||||||||||||||||||||
Total derivative receivables recognized on the Consolidated balance sheets |
$ | 539,248 | $ | 54,864 | $ | 639,593 | $ | 70,880 | |||||||||||||||||||||||||||
Collateral not nettable on the Consolidated balance sheets(b)(c) |
(22,461) | (23,014) | |||||||||||||||||||||||||||||||||
Net amounts |
$ | 32,403 | $ | 47,866 | |||||||||||||||||||||||||||||||
208 |
JPMorgan Chase & Co./2023 Form 10-K |
|||||||
| 2023 | 2022 | ||||||||||||||||||||||||||||||||||
| December 31, (in millions) | Gross derivative payables | Amounts netted on the Consolidated balance sheets | Net derivative payables | Gross derivative payables | Amounts netted on the Consolidated balance sheets | Net derivative payables |
|||||||||||||||||||||||||||||
U.S. GAAP nettable derivative payables |
|||||||||||||||||||||||||||||||||||
| Interest rate contracts: | |||||||||||||||||||||||||||||||||||
| OTC | $ | 161,901 | $ | (152,467) | $ | 9,434 | $ | 190,108 | $ | (176,890) | $ | 13,218 | |||||||||||||||||||||||
| OTC–cleared | 76,007 | (75,729) | 278 | 97,417 | (97,126) | 291 | |||||||||||||||||||||||||||||
Exchange-traded(a) |
436 | (390) | 46 | 327 | (305) | 22 | |||||||||||||||||||||||||||||
| Total interest rate contracts | 238,344 | (228,586) | 9,758 | 287,852 | (274,321) | 13,531 | |||||||||||||||||||||||||||||
| Credit contracts: | |||||||||||||||||||||||||||||||||||
| OTC | 10,332 | (9,313) | 1,019 | 8,054 | (7,572) | 482 | |||||||||||||||||||||||||||||
| OTC–cleared | 1,639 | (1,636) | 3 | 1,674 | (1,645) | 29 | |||||||||||||||||||||||||||||
| Total credit contracts | 11,971 | (10,949) | 1,022 | 9,728 | (9,217) | 511 | |||||||||||||||||||||||||||||
| Foreign exchange contracts: | |||||||||||||||||||||||||||||||||||
| OTC | 209,386 | (199,173) | 10,213 | 246,457 | (231,248) | 15,209 | |||||||||||||||||||||||||||||
| OTC–cleared | 552 | (470) | 82 | 1,488 | (1,417) | 71 | |||||||||||||||||||||||||||||
Exchange-traded(a) |
6 | — | 6 | 20 | — | 20 | |||||||||||||||||||||||||||||
| Total foreign exchange contracts | 209,944 | (199,643) | 10,301 | 247,965 | (232,665) | 15,300 | |||||||||||||||||||||||||||||
| Equity contracts: | |||||||||||||||||||||||||||||||||||
| OTC | 29,999 | (27,360) | 2,639 | 29,833 | (26,554) | 3,279 | |||||||||||||||||||||||||||||
Exchange-traded(a) |
33,137 | (29,083) | 4,054 | 28,291 | (27,103) | 1,188 | |||||||||||||||||||||||||||||
| Total equity contracts | 63,136 | (56,443) | 6,693 | 58,124 | (53,657) | 4,467 | |||||||||||||||||||||||||||||
| Commodity contracts: | |||||||||||||||||||||||||||||||||||
| OTC | 8,788 | (5,192) | 3,596 | 11,954 | (7,642) | 4,312 | |||||||||||||||||||||||||||||
| OTC–cleared | 120 | (120) | — | 112 | (112) | — | |||||||||||||||||||||||||||||
Exchange-traded(a) |
5,376 | (5,192) | 184 | 9,021 | (8,758) | 263 | |||||||||||||||||||||||||||||
| Total commodity contracts | 14,284 | (10,504) | 3,780 | 21,087 | (16,512) | 4,575 | |||||||||||||||||||||||||||||
Derivative payables with appropriate legal opinion |
537,679 | (506,125) | 31,554 | (d) |
624,756 | (586,372) | 38,384 | (d) |
|||||||||||||||||||||||||||
Derivative payables where an appropriate legal opinion has not been either sought or obtained |
9,293 | 9,293 | 12,757 | 12,757 | |||||||||||||||||||||||||||||||
Total derivative payables recognized on the Consolidated balance sheets |
$ | 546,972 | $ | 40,847 | $ | 637,513 | $ | 51,141 | |||||||||||||||||||||||||||
Collateral not nettable on the Consolidated balance sheets(b)(c) |
(4,547) | (3,318) | |||||||||||||||||||||||||||||||||
Net amounts |
$ | 36,300 | $ | 47,823 | |||||||||||||||||||||||||||||||
JPMorgan Chase & Co./2023 Form 10-K |
209 |
|||||||
| OTC and OTC-cleared derivative payables containing downgrade triggers | |||||||||||||||||||||||
| (in millions) | December 31, 2023 | December 31, 2022 | |||||||||||||||||||||
| Aggregate fair value of net derivative payables | $ | 14,655 | $ | 16,023 | |||||||||||||||||||
| Collateral posted | 14,673 | 15,505 | |||||||||||||||||||||
| Liquidity impact of downgrade triggers on OTC and OTC-cleared derivatives | |||||||||||||||||
| December 31, 2023 | December 31, 2022 | ||||||||||||||||
| (in millions) | Single-notch downgrade | Two-notch downgrade | Single-notch downgrade | Two-notch downgrade | |||||||||||||
Amount of additional collateral to be posted upon downgrade(a) |
$ | 75 | $ | 1,153 | $ | 128 | $ | 1,293 | |||||||||
Amount required to settle contracts with termination triggers upon downgrade(b) |
93 | 592 | 88 | 925 | |||||||||||||
210 |
JPMorgan Chase & Co./2023 Form 10-K |
|||||||
| Gains/(losses) recorded in income | Income statement impact of excluded components(e) |
OCI impact | ||||||||||||||||||||||||
| Year ended December 31, 2023 (in millions) |
Derivatives | Hedged items | Income statement impact | Amortization approach | Changes in fair value | Derivatives - Gains/(losses) recorded in OCI(f) |
||||||||||||||||||||
| Contract type | ||||||||||||||||||||||||||
Interest rate(a)(b) |
$ | 1,554 | $ | (1,248) | $ | 306 | $ | — | $ | 157 | $ | — | ||||||||||||||
Foreign exchange(c) |
722 | (483) | 239 | (601) | 239 | (134) | ||||||||||||||||||||
Commodity(d) |
1,227 | (706) | 521 | — | 525 | — | ||||||||||||||||||||
| Total | $ | 3,503 | $ | (2,437) | $ | 1,066 | $ | (601) | $ | 921 | $ | (134) | ||||||||||||||
| Gains/(losses) recorded in income | Income statement impact of excluded components(e) |
OCI impact | ||||||||||||||||||||||||
| Year ended December 31, 2022 (in millions) |
Derivatives | Hedged items | Income statement impact | Amortization approach | Changes in fair value | Derivatives - Gains/(losses) recorded in OCI(f) |
||||||||||||||||||||
| Contract type | ||||||||||||||||||||||||||
Interest rate(a)(b) |
$ | (14,352) | $ | 14,047 | $ | (305) | $ | — | $ | (262) | $ | — | ||||||||||||||
Foreign exchange(c) |
(1,317) | 1,423 | 106 | (528) | 106 | 130 | ||||||||||||||||||||
Commodity(d) |
106 | (70) | 36 | — | 48 | — | ||||||||||||||||||||
| Total | $ | (15,563) | $ | 15,400 | $ | (163) | $ | (528) | $ | (108) | $ | 130 | ||||||||||||||
| Gains/(losses) recorded in income | Income statement impact of excluded components(e) |
OCI impact | ||||||||||||||||||||||||
| Year ended December 31, 2021 (in millions) |
Derivatives | Hedged items | Income statement impact | Amortization approach | Changes in fair value | Derivatives - Gains/(losses) recorded in OCI(f) |
||||||||||||||||||||
| Contract type | ||||||||||||||||||||||||||
Interest rate(a)(b) |
$ | (4,323) | $ | 3,765 | $ | (558) | $ | — | $ | (439) | $ | — | ||||||||||||||
Foreign exchange(c) |
(1,317) | 1,349 | 32 | (286) | 32 | (26) | ||||||||||||||||||||
Commodity(d) |
(9,609) | 9,710 | 101 | — | 72 | — | ||||||||||||||||||||
| Total | $ | (15,249) | $ | 14,824 | $ | (425) | $ | (286) | $ | (335) | $ | (26) | ||||||||||||||
JPMorgan Chase & Co./2023 Form 10-K |
211 |
|||||||
Carrying amount of the hedged items(a)(b) |
Cumulative amount of fair value hedging adjustments included in the carrying amount of hedged items: | |||||||||||||||||||
| December 31, 2023 (in millions) |
Active hedging relationships(d) |
Discontinued hedging relationships(d)(e) |
Total | |||||||||||||||||
| Assets | ||||||||||||||||||||
| Investment securities - AFS | $ | 151,752 | (c) |
$ | 549 | $ | (2,010) | $ | (1,461) | |||||||||||
| Liabilities | ||||||||||||||||||||
| Long-term debt | $ | 195,455 | $ | (2,042) | $ | (9,727) | $ | (11,769) | ||||||||||||
Carrying amount of the hedged items(a)(b) |
Cumulative amount of fair value hedging adjustments included in the carrying amount of hedged items: | |||||||||||||||||||
| December 31, 2022 (in millions) |
Active hedging relationships(d) |
Discontinued hedging relationships(d)(e) |
Total | |||||||||||||||||
| Assets | ||||||||||||||||||||
| Investment securities - AFS | $ | 84,073 | (c) |
$ | (4,149) | $ | (1,542) | $ | (5,691) | |||||||||||
| Liabilities | ||||||||||||||||||||
| Long-term debt | $ | 175,257 | $ | (11,879) | $ | (3,313) | $ | (15,192) | ||||||||||||
212 |
JPMorgan Chase & Co./2023 Form 10-K |
|||||||
| Derivatives gains/(losses) recorded in income and other comprehensive income/(loss) | |||||||||||||||||||||||||||||
| Year ended December 31, 2023 (in millions) |
Amounts reclassified from AOCI to income |
Amounts recorded in OCI |
Total change
in OCI for period
|
||||||||||||||||||||||||||
| Contract type | |||||||||||||||||||||||||||||
Interest rate(a) |
$ | (1,839) | $ | 274 | $ | 2,113 | |||||||||||||||||||||||
Foreign exchange(b) |
64 | 209 | 145 | ||||||||||||||||||||||||||
| Total | $ | (1,775) | $ | 483 | $ | 2,258 | |||||||||||||||||||||||
| Derivatives gains/(losses) recorded in income and other comprehensive income/(loss) | |||||||||||||||||||||||||||||
| Year ended December 31, 2022 (in millions) |
Amounts reclassified from AOCI to income |
Amounts recorded in OCI |
Total change in OCI for period |
||||||||||||||||||||||||||
| Contract type | |||||||||||||||||||||||||||||
Interest rate(a) |
$ | (153) | $ | (7,131) | $ | (6,978) | |||||||||||||||||||||||
Foreign exchange(b) |
(267) | (342) | (75) | ||||||||||||||||||||||||||
| Total | $ | (420) | $ | (7,473) | $ | (7,053) | |||||||||||||||||||||||
| Derivatives gains/(losses) recorded in income and other comprehensive income/(loss) | |||||||||||||||||||||||||||||
| Year ended December 31, 2021 (in millions) |
Amounts reclassified from AOCI to income |
Amounts recorded in OCI |
Total change in OCI for period |
||||||||||||||||||||||||||
| Contract type | |||||||||||||||||||||||||||||
Interest rate(a) |
$ | 1,032 | $ | (2,370) | $ | (3,402) | |||||||||||||||||||||||
Foreign exchange(b) |
190 | 67 | (123) | ||||||||||||||||||||||||||
| Total | $ | 1,222 | $ | (2,303) | $ | (3,525) | |||||||||||||||||||||||
| 2023 | 2022 | 2021 | ||||||||||||||||||||||||
| Year ended December 31, (in millions) |
Amounts recorded in income(a)(b) |
Amounts recorded in OCI |
Amounts recorded in income(a)(b) |
Amounts recorded in OCI |
Amounts recorded in income(a)(b) |
Amounts recorded in OCI |
||||||||||||||||||||
| Foreign exchange derivatives | $384 | $(1,732) | $(123) | $3,591 | $(228) | $2,452 | ||||||||||||||||||||
JPMorgan Chase & Co./2023 Form 10-K |
213 |
|||||||
| Derivatives gains/(losses) recorded in income |
|||||||||||||||||
| Year ended December 31, (in millions) |
2023 | 2022 | 2021 | ||||||||||||||
| Contract type | |||||||||||||||||
Interest rate(a) |
$ | (135) | $ | (827) | $ | 1,078 | |||||||||||
Credit(b) |
(441) | 51 | (94) | ||||||||||||||
Foreign exchange(c) |
(2) | (48) | 94 | ||||||||||||||
| Total | $ | (578) | $ | (824) | $ | 1,078 | |||||||||||
214 |
JPMorgan Chase & Co./2023 Form 10-K |
|||||||
JPMorgan Chase & Co./2023 Form 10-K |
215 |
|||||||
Total credit derivatives and credit-related notes |
|||||||||||||||||||||||
| Maximum payout/Notional amount | |||||||||||||||||||||||
| Protection sold | Protection purchased with identical underlyings(c) |
Net protection (sold)/purchased(d) |
Other protection purchased(e) |
||||||||||||||||||||
| December 31, 2023 (in millions) |
|||||||||||||||||||||||
| Credit derivatives | |||||||||||||||||||||||
| Credit default swaps | $ | (450,172) | $ | 473,823 | $ | 23,651 | $ | 7,517 | |||||||||||||||
Other credit derivatives(a) |
(38,846) | 45,416 | 6,570 | 29,206 | |||||||||||||||||||
| Total credit derivatives | (489,018) | 519,239 | 30,221 | 36,723 | |||||||||||||||||||
Credit-related notes(b) |
— | — | — | 9,788 | |||||||||||||||||||
| Total | $ | (489,018) | $ | 519,239 | $ | 30,221 | $ | 46,511 | |||||||||||||||
| Maximum payout/Notional amount | |||||||||||||||||||||||
| Protection sold | Protection purchased with identical underlyings(c) |
Net protection (sold)/purchased(d) |
Other protection purchased(e) |
||||||||||||||||||||
| December 31, 2022 (in millions) | |||||||||||||||||||||||
| Credit derivatives | |||||||||||||||||||||||
| Credit default swaps | $ | (495,557) | $ | 509,846 | $ | 14,289 | $ | 2,917 | |||||||||||||||
Other credit derivatives(a) |
(47,165) | 65,029 | 17,864 | 11,746 | |||||||||||||||||||
| Total credit derivatives | (542,722) | 574,875 | 32,153 | 14,663 | |||||||||||||||||||
Credit-related notes(b) |
— | — | — | 7,863 | |||||||||||||||||||
| Total | $ | (542,722) | $ | 574,875 | $ | 32,153 | $ | 22,526 | |||||||||||||||
Protection sold – credit derivatives ratings(a)/maturity profile |
|||||||||||||||||||||||||||||||||||||||||
| December 31, 2023 (in millions) |
<1 year | 1–5 years | >5 years | Total notional amount | Fair value of receivables(b) |
Fair value of payables(b) |
Net fair value | ||||||||||||||||||||||||||||||||||
| Risk rating of reference entity | |||||||||||||||||||||||||||||||||||||||||
| Investment-grade | $ | (89,981) | $ | (263,834) | $ | (29,470) | $ | (383,285) | $ | 3,659 | $ | (1,144) | $ | 2,515 | |||||||||||||||||||||||||||
| Noninvestment-grade | (31,419) | (69,515) | (4,799) | (105,733) | 2,466 | (1,583) | 883 | ||||||||||||||||||||||||||||||||||
| Total | $ | (121,400) | $ | (333,349) | $ | (34,269) | $ | (489,018) | $ | 6,125 | $ | (2,727) | $ | 3,398 | |||||||||||||||||||||||||||
| December 31, 2022 (in millions) |
<1 year | 1–5 years | >5 years | Total notional amount | Fair value of receivables(b) |
Fair value of payables(b) |
Net fair value | ||||||||||||||||||||||||||||||||||
| Risk rating of reference entity | |||||||||||||||||||||||||||||||||||||||||
| Investment-grade | $ | (90,484) | $ | (294,791) | $ | (30,822) | $ | (416,097) | $ | 2,324 | $ | (1,495) | $ | 829 | |||||||||||||||||||||||||||
| Noninvestment-grade | (33,244) | (87,011) | (6,370) | (126,625) | 1,267 | (3,209) | (1,942) | ||||||||||||||||||||||||||||||||||
| Total | $ | (123,728) | $ | (381,802) | $ | (37,192) | $ | (542,722) | $ | 3,591 | $ | (4,704) | $ | (1,113) | |||||||||||||||||||||||||||
216 |
JPMorgan Chase & Co./2023 Form 10-K |
|||||||
| Year ended December 31, (in millions) |
2023 | 2022 | 2021 | ||||||||||||||
| Underwriting | |||||||||||||||||
| Equity | $ | 1,149 | $ | 975 | $ | 3,969 | |||||||||||
| Debt | 2,610 | 2,732 | 4,853 | ||||||||||||||
| Total underwriting | 3,759 | 3,707 | 8,822 | ||||||||||||||
| Advisory | 2,760 | 2,979 | 4,394 | ||||||||||||||
| Total investment banking fees | $ | 6,519 | $ | 6,686 | $ | 13,216 | |||||||||||
JPMorgan Chase & Co./2023 Form 10-K |
217 |
|||||||
| Year ended December 31, (in millions) |
2023 | 2022 | 2021 | |||||||||||||||||
|
Trading revenue by
instrument type
|
||||||||||||||||||||
Interest rate(a) |
$ | 5,607 | $ | 3,010 | $ | 1,646 | ||||||||||||||
Credit(b) |
1,434 | 1,412 | (c) |
2,691 | ||||||||||||||||
| Foreign exchange | 5,082 | 5,119 | 2,787 | |||||||||||||||||
| Equity | 10,229 | 8,068 | 7,773 | |||||||||||||||||
| Commodity | 2,202 | 2,348 | 1,428 | |||||||||||||||||
| Total trading revenue | 24,554 | 19,957 | 16,325 | |||||||||||||||||
Private equity losses |
(94) | (45) | (21) | |||||||||||||||||
| Principal transactions | $ | 24,460 | $ | 19,912 | $ | 16,304 | ||||||||||||||
| Year ended December 31, (in millions) |
2023 | 2022 | 2021 | ||||||||||||||
| Lending-related fees | $ | 2,365 | (a) |
$ | 1,468 | $ | 1,472 | ||||||||||
| Deposit-related fees | 5,048 | 5,630 | 5,560 | ||||||||||||||
Total lending- and deposit-related fees |
$ | 7,413 | $ | 7,098 | $ | 7,032 | |||||||||||
| Year ended December 31, (in millions) |
2023 | 2022 | 2021 | ||||||||||||||
| Asset management fees | |||||||||||||||||
Investment management fees |
$ | 14,908 | (a) |
$ | 13,765 | $ | 14,027 | ||||||||||
All other asset management fees |
312 | 331 | 378 | ||||||||||||||
| Total asset management fees | $ | 15,220 | $ | 14,096 | $ | 14,405 | |||||||||||
218 |
JPMorgan Chase & Co./2023 Form 10-K |
|||||||
| Year ended December 31, (in millions) |
2023 | 2022 | 2021 | ||||||||||||||
| Commissions and other fees | |||||||||||||||||
Brokerage commissions |
$ | 2,820 | $ | 2,831 | $ | 3,046 | |||||||||||
Administration fees |
2,310 | 2,348 | 2,554 | ||||||||||||||
All other commissions and fees(a) |
1,706 | 1,402 | 1,024 | ||||||||||||||
| Total commissions and other fees | $ | 6,836 | $ | 6,581 | $ | 6,624 | |||||||||||
| Year ended December 31, (in millions) |
2023 | 2022 | 2021 | ||||||||||||||
Interchange and merchant processing income |
$ | 31,021 | $ | 28,085 | $ | 23,592 | |||||||||||
| Reward costs and partner payments | (24,601) | (22,162) | (17,868) | ||||||||||||||
All other(a) |
(1,636) | (1,503) | (622) | ||||||||||||||
| Total card income | $ | 4,784 | $ | 4,420 | $ | 5,102 | |||||||||||
JPMorgan Chase & Co./2023 Form 10-K |
219 |
|||||||
| Year ended December 31, (in millions) |
2023 | 2022 | 2021 | ||||||||||||||
| Operating lease income | $ | 2,843 | $ | 3,654 | $ | 4,914 | |||||||||||
Losses on tax-oriented investments |
(1,538) | (1,491) | (1,570) | ||||||||||||||
| Estimated bargain purchase gain associated with the First Republic acquisition | 2,775 | (a) |
— | — | |||||||||||||
| Gain related to the acquisition of CIFM | 339 | (b) |
— | — | |||||||||||||
| Gain on sale of Visa B shares | — | 914 | — | ||||||||||||||
| Year ended December 31, (in millions) |
2023 | 2022 | 2021 | ||||||||||||||
| Legal expense | $ | 1,436 | $ | 266 | $ | 426 | |||||||||||
| FDIC-related expense | 4,203 | (a) |
860 | 730 | |||||||||||||
| First Republic-related expense | 1,060 | (b) |
— | ||||||||||||||
220 |
JPMorgan Chase & Co./2023 Form 10-K |
|||||||
| Year ended December 31, (in millions) |
2023 | 2022 | 2021 | |||||||||||
| Interest income | ||||||||||||||
Loans |
$ | 83,384 | (e) |
$ | 52,736 | $ | 41,537 | |||||||
| Taxable securities | 17,390 | 10,372 | 6,460 | |||||||||||
Non-taxable securities(a) |
1,336 | 975 | 1,063 | |||||||||||
Total investment securities |
18,726 | (e) |
11,347 | 7,523 | ||||||||||
| Trading assets - debt instruments | 15,950 | 9,053 | 6,825 | |||||||||||
Federal funds sold and securities purchased under resale agreements |
15,079 | 4,632 | 958 | |||||||||||
Securities borrowed(b) |
7,983 | 2,237 | (385) | |||||||||||
| Deposits with banks | 21,797 | 9,039 | 512 | |||||||||||
All other interest-earning assets(c) |
7,669 | 3,763 | 894 | |||||||||||
| Total interest income | $ | 170,588 | $ | 92,807 | $ | 57,864 | ||||||||
| Interest expense | ||||||||||||||
| Interest bearing deposits | $ | 40,016 | $ | 10,082 | $ | 531 | ||||||||
Federal funds purchased and securities loaned or sold under repurchase agreements |
13,259 | 3,721 | 274 | |||||||||||
Short-term borrowings |
1,894 | 747 | 126 | |||||||||||
Trading liabilities - debt and all other interest-bearing liabilities(d) |
9,396 | 3,246 | 257 | |||||||||||
| Long-term debt | 15,803 | 8,075 | 4,282 | |||||||||||
Beneficial interest issued by consolidated VIEs |
953 | 226 | 83 | |||||||||||
| Total interest expense | $ | 81,321 | $ | 26,097 | $ | 5,553 | ||||||||
| Net interest income | $ | 89,267 | $ | 66,710 | $ | 52,311 | ||||||||
| Provision for credit losses | 9,320 | 6,389 | (9,256) | |||||||||||
Net interest income after provision for credit losses |
$ | 79,947 | $ | 60,321 | $ | 61,567 | ||||||||
JPMorgan Chase & Co./2023 Form 10-K |
221 |
|||||||
| As of or for the year ended December 31, | Defined benefit pension and OPEB plans |
||||||||||
| (in millions) | 2023 | 2022 | |||||||||
| Projected benefit obligations | $ | (14,740) | $ | (13,545) | |||||||
| Fair value of plan assets | 22,013 | 19,890 | |||||||||
| Net funded status | 7,273 | 6,345 | |||||||||
| Accumulated other comprehensive income/(loss) | (1,517) | (1,916) | |||||||||
| Pension and OPEB plans | |||||||||||||||||
| Year ended December 31, (in millions) | 2023 | 2022 | 2021 | ||||||||||||||
Total net periodic defined benefit plan cost/(credit)(a) |
$ | (393) | $ | (192) | (b) |
$ | (201) | (b) |
|||||||||
| Total defined contribution plans | 1,609 | 1,408 | 1,333 | ||||||||||||||
| Total pension and OPEB cost included in noninterest expense | $ | 1,216 | $ | 1,216 | $ | 1,132 | |||||||||||
| Total recognized in other comprehensive (income)/loss | $ | (421) | $ | 1,459 | $ | (1,129) | |||||||||||
222 |
JPMorgan Chase & Co./2023 Form 10-K |
|||||||
| Defined benefit pension and OPEB plans | ||||||||||||||
| Year ended December 31, | 2023 | 2022 | 2021 | |||||||||||
| Discount rate | 5.14 | % | 2.54 | % | 2.17 | % | ||||||||
| Expected long-term rate of return on plan assets | 5.74 | % | 3.68 | % | 2.97 | % | ||||||||
| Pension plan assets and liabilities measured at fair value | ||||||||||||||||||||||||||
| Defined benefit pension and OPEB plans | ||||||||||||||||||||||||||
| 2023 | 2022 | |||||||||||||||||||||||||
|
December 31,
(in millions)
|
Level 1(a) |
Level 2(b) |
Level 3(c) |
Total fair value | Level 1(a) |
Level 2(b) |
Level 3(c) |
Total fair value | ||||||||||||||||||
Assets measured at fair value classified in the fair value hierarchy |
$ | 6,521 | $ | 10,713 | $ | 3,124 | $ | 20,358 | $ | 5,308 | $ | 9,617 | $ | 2,613 | $ | 17,538 | ||||||||||
Assets measured at fair value using NAV as a practical expedient |
2,097 | 2,593 | ||||||||||||||||||||||||
Net defined benefit pension plan payables |
(442) | (241) | ||||||||||||||||||||||||
| Total fair value of plan assets | $ | 22,013 | $ | 19,890 | ||||||||||||||||||||||
JPMorgan Chase & Co./2023 Form 10-K |
223 |
|||||||
| Year ended December 31, (in millions) |
Defined benefit pension and OPEB plans | |||||||||||||
| 2024 | $ | 1,142 | ||||||||||||
| 2025 | 1,125 | |||||||||||||
| 2026 | 1,113 | |||||||||||||
| 2027 | 1,077 | |||||||||||||
| 2028 | 1,063 | |||||||||||||
| Years 2029–2033 | 5,143 | |||||||||||||
224 |
JPMorgan Chase & Co./2023 Form 10-K |
|||||||
JPMorgan Chase & Co./2023 Form 10-K |
225 |
|||||||
| RSUs/PSUs | SARs |
|||||||||||||||||||||||||||||||
| Year ended December 31, 2023 | Number of units |
Weighted-average grant date fair value |
Number of awards | Weighted-average exercise price | Weighted-average remaining contractual life (in years) |
Aggregate intrinsic value | ||||||||||||||||||||||||||
(in thousands, except weighted-average data, and where otherwise stated) |
||||||||||||||||||||||||||||||||
| Outstanding, January 1 | 47,726 | $ | 139.90 | 2,511 | $ | 141.19 | ||||||||||||||||||||||||||
| Granted | 23,758 | 139.39 | — | — | ||||||||||||||||||||||||||||
| Exercised or vested | (17,773) | 134.86 | (261) | 46.58 | ||||||||||||||||||||||||||||
| Forfeited | (1,468) | 142.11 | — | — | ||||||||||||||||||||||||||||
| Canceled | NA | NA | — | — | ||||||||||||||||||||||||||||
| Outstanding, December 31 | 52,243 | $ | 141.31 | 2,250 | $ | 152.19 | 7.7 | $ | 40,444 | |||||||||||||||||||||||
| Exercisable, December 31 | NA | NA | — | — | — | — | ||||||||||||||||||||||||||
| Year ended December 31, (in millions) | 2023 | 2022 | 2021 | |||||||||||||||||
Cost of prior grants of RSUs, PSUs and SARs that are amortized over their applicable vesting periods |
$ | 1,510 | $ | 1,253 | $ | 1,161 | ||||||||||||||
| Accrual of estimated costs of share-based awards to be granted in future periods, predominantly those to full-career eligible employees | 1,607 | 1,541 | 1,768 | |||||||||||||||||
Total noncash compensation expense related to employee share-based incentive plans |
$ | 3,117 | $ | 2,794 | $ | 2,929 | ||||||||||||||
226 |
JPMorgan Chase & Co./2023 Form 10-K |
|||||||
JPMorgan Chase & Co./2023 Form 10-K |
227 |
|||||||
| 2023 | 2022 | |||||||||||||||||||||||||||||||
| December 31, (in millions) | Amortized cost(c)(d) |
Gross unrealized gains | Gross unrealized losses | Fair value |
Amortized cost(c)(d) |
Gross unrealized gains | Gross unrealized losses | Fair value |
||||||||||||||||||||||||
| Available-for-sale securities | ||||||||||||||||||||||||||||||||
| Mortgage-backed securities: | ||||||||||||||||||||||||||||||||
| U.S. GSEs and government agencies | $ | 88,377 | $ | 870 | $ | 4,077 | $ | 85,170 | $ | 77,194 | $ | 479 | $ | 6,170 | $ | 71,503 | ||||||||||||||||
| Residential: | ||||||||||||||||||||||||||||||||
| U.S. | 2,086 | 10 | 68 | 2,028 | 1,576 | 1 | 111 | 1,466 | ||||||||||||||||||||||||
| Non-U.S. | 1,608 | 4 | 1 | 1,611 | 3,176 | 5 | 27 | 3,154 | ||||||||||||||||||||||||
| Commercial | 2,930 | 12 | 139 | 2,803 | 2,113 | — | 155 | 1,958 | ||||||||||||||||||||||||
| Total mortgage-backed securities | 95,001 | 896 | 4,285 | 91,612 | 84,059 | 485 | 6,463 | 78,081 | ||||||||||||||||||||||||
| U.S. Treasury and government agencies | 58,051 | 276 | 522 | 57,805 | 95,217 | 302 | 3,459 | 92,060 | ||||||||||||||||||||||||
| Obligations of U.S. states and municipalities | 21,243 | 390 | 266 | 21,367 | 7,103 | 86 | 403 | 6,786 | ||||||||||||||||||||||||
| Non-U.S. government debt securities | 21,387 | 254 | 359 | 21,282 | 20,360 | 14 | 678 | 19,696 | ||||||||||||||||||||||||
| Corporate debt securities | 128 | — | 28 | 100 | 381 | — | 24 | 357 | ||||||||||||||||||||||||
| Asset-backed securities: | ||||||||||||||||||||||||||||||||
| Collateralized loan obligations | 6,769 | 11 | 28 | 6,752 | 5,916 | 1 | 125 | 5,792 | ||||||||||||||||||||||||
| Other | 2,804 | 8 | 26 | 2,786 | 3,152 | 2 | 69 | 3,085 | ||||||||||||||||||||||||
|
Unallocated portfolio layer fair value
basis adjustments(a)
|
73 | (73) | — | NA | NA | NA | NA | NA | ||||||||||||||||||||||||
| Total available-for-sale securities | 205,456 | 1,762 | 5,514 | 201,704 | (e) |
216,188 | 890 | 11,221 | 205,857 | |||||||||||||||||||||||
Held-to-maturity securities(b) |
||||||||||||||||||||||||||||||||
| Mortgage-backed securities: | ||||||||||||||||||||||||||||||||
| U.S. GSEs and government agencies | 105,614 | 39 | 11,643 | 94,010 | 113,492 | 35 | 13,709 | 99,818 | ||||||||||||||||||||||||
| U.S. Residential | 9,709 | 4 | 970 | 8,743 | 10,503 | 3 | 1,244 | 9,262 | ||||||||||||||||||||||||
| Commercial | 10,534 | 13 | 581 | 9,966 | 10,361 | 10 | 734 | 9,637 | ||||||||||||||||||||||||
| Total mortgage-backed securities | 125,857 | 56 | 13,194 | 112,719 | 134,356 | 48 | 15,687 | 118,717 | ||||||||||||||||||||||||
| U.S. Treasury and government agencies | 173,666 | — | 13,074 | 160,592 | 207,463 | — | 18,363 | 189,100 | ||||||||||||||||||||||||
| Obligations of U.S. states and municipalities | 9,945 | 74 | 591 | 9,428 | 19,747 | 53 | 1,080 | 18,720 | ||||||||||||||||||||||||
| Asset-backed securities: | ||||||||||||||||||||||||||||||||
| Collateralized loan obligations | 58,565 | 47 | 352 | 58,260 | 61,414 | 4 | 1,522 | 59,896 | ||||||||||||||||||||||||
| Other | 1,815 | 1 | 61 | 1,755 | 2,325 | — | 110 | 2,215 | ||||||||||||||||||||||||
| Total held-to-maturity securities | 369,848 | 178 | 27,272 | 342,754 | 425,305 | 105 | 36,762 | 388,648 | ||||||||||||||||||||||||
| Total investment securities, net of allowance for credit losses | $ | 575,304 | $ | 1,940 | $ | 32,786 | $ | 544,458 | $ | 641,493 | $ | 995 | $ | 47,983 | $ | 594,505 | ||||||||||||||||
228 |
JPMorgan Chase & Co./2023 Form 10-K |
|||||||
| Available-for-sale securities with gross unrealized losses | ||||||||||||||||||||||||||
| Less than 12 months | 12 months or more | |||||||||||||||||||||||||
| Year ended December 31, 2023 (in millions) |
Fair value | Gross unrealized losses |
Fair value | Gross unrealized losses |
Total fair value | Total gross unrealized losses | ||||||||||||||||||||
| Available-for-sale securities | ||||||||||||||||||||||||||
| Mortgage-backed securities: | ||||||||||||||||||||||||||
| Residential: | ||||||||||||||||||||||||||
| U.S. | $ | 81 | $ | — | $ | 1,160 | $ | 68 | $ | 1,241 | $ | 68 | ||||||||||||||
| Non-U.S. | — | — | 722 | 1 | 722 | 1 | ||||||||||||||||||||
| Commercial | 228 | 3 | 1,775 | 136 | 2,003 | 139 | ||||||||||||||||||||
| Total mortgage-backed securities | 309 | 3 | 3,657 | 205 | 3,966 | 208 | ||||||||||||||||||||
| Obligations of U.S. states and municipalities | 2,134 | 20 | 2,278 | 246 | 4,412 | 266 | ||||||||||||||||||||
| Non-U.S. government debt securities | 7,145 | 23 | 4,987 | 336 | 12,132 | 359 | ||||||||||||||||||||
| Corporate debt securities | 9 | — | 79 | 28 | 88 | 28 | ||||||||||||||||||||
| Asset-backed securities: | ||||||||||||||||||||||||||
| Collateralized loan obligations | 932 | 2 | 3,744 | 26 | 4,676 | 28 | ||||||||||||||||||||
| Other | 208 | 1 | 1,288 | 25 | 1,496 | 26 | ||||||||||||||||||||
| Total available-for-sale securities with gross unrealized losses | $ | 10,737 | (a) | $ | 49 | $ | 16,033 | $ | 866 | $ | 26,770 | $ | 915 | |||||||||||||
| Available-for-sale securities with gross unrealized losses | |||||||||||||||||||||||
| Less than 12 months | 12 months or more | ||||||||||||||||||||||
| Year ended December 31, 2022 (in millions) |
Fair value | Gross unrealized losses |
Fair value | Gross unrealized losses |
Total fair value | Total gross unrealized losses | |||||||||||||||||
| Available-for-sale securities | |||||||||||||||||||||||
| Mortgage-backed securities: | |||||||||||||||||||||||
| Residential: | |||||||||||||||||||||||
| U.S. | $ | 1,187 | $ | 71 | $ | 260 | $ | 40 | $ | 1,447 | $ | 111 | |||||||||||
| Non-U.S. | 2,848 | 25 | 70 | 2 | 2,918 | 27 | |||||||||||||||||
| Commercial | 1,131 | 74 | 813 | 81 | 1,944 | 155 | |||||||||||||||||
| Total mortgage-backed securities | 5,166 | 170 | 1,143 | 123 | 6,309 | 293 | |||||||||||||||||
| Obligations of U.S. states and municipalities | 3,051 | 241 | 364 | 162 | 3,415 | 403 | |||||||||||||||||
| Non-U.S. government debt securities | 6,941 | 321 | 3,848 | 357 | 10,789 | 678 | |||||||||||||||||
| Corporate debt securities | 150 | 2 | 207 | 22 | 357 | 24 | |||||||||||||||||
| Asset-backed securities: | |||||||||||||||||||||||
| Collateralized loan obligations | 3,010 | 61 | 2,701 | 64 | 5,711 | 125 | |||||||||||||||||
| Other | 2,586 | 51 | 256 | 18 | 2,842 | 69 | |||||||||||||||||
| Total available-for-sale securities with gross unrealized losses | $ | 20,904 | $ | 846 | $ | 8,519 | $ | 746 | $ | 29,423 | $ | 1,592 | |||||||||||
JPMorgan Chase & Co./2023 Form 10-K |
229 |
|||||||
| Year ended December 31, (in millions) |
2023 | 2022 | 2021 | ||||||||||||||
| Realized gains | $ | 622 | $ | 198 | $ | 595 | |||||||||||
| Realized losses | (3,802) | (2,578) | (940) | ||||||||||||||
| Investment securities losses | $ | (3,180) | $ | (2,380) | $ | (345) | |||||||||||
| Provision for credit losses | $ | 38 | $ | 54 | $ | (36) | |||||||||||
230 |
JPMorgan Chase & Co./2023 Form 10-K |
|||||||
| By remaining maturity December 31, 2023 (in millions) |
Due in one year or less |
Due after one year through five years | Due after five years through 10 years |
Due after
10 years(c)
|
Total | |||||||||||||||
| Available-for-sale securities | ||||||||||||||||||||
| Mortgage-backed securities | ||||||||||||||||||||
| Amortized cost | $ | — | $ | 5,166 | $ | 5,660 | $ | 84,175 | $ | 95,001 | ||||||||||
| Fair value | — | 5,072 | 5,662 | 80,878 | 91,612 | (d) |
||||||||||||||
Average yield(a) |
— | % | 5.27 | % | 6.15 | % | 4.96 | % | 5.05 | % | ||||||||||
| U.S. Treasury and government agencies | ||||||||||||||||||||
| Amortized cost | $ | 1 | $ | 27,430 | $ | 23,884 | $ | 6,736 | $ | 58,051 | ||||||||||
| Fair value | 1 | 27,212 | 23,933 | 6,659 | 57,805 | |||||||||||||||
Average yield(a) |
5.44 | % | 5.84 | % | 6.15 | % | 6.60 | % | 6.06 | % | ||||||||||
| Obligations of U.S. states and municipalities | ||||||||||||||||||||
| Amortized cost | $ | 10 | $ | 55 | $ | 531 | $ | 20,647 | $ | 21,243 | ||||||||||
| Fair value | 10 | 54 | 533 | 20,770 | 21,367 | (d) |
||||||||||||||
Average yield(a) |
3.70 | % | 3.03 | % | 4.51 | % | 5.93 | % | 5.89 | % | ||||||||||
| Non-U.S. government debt securities | ||||||||||||||||||||
| Amortized cost | $ | 8,841 | $ | 4,553 | $ | 3,658 | $ | 4,335 | $ | 21,387 | ||||||||||
| Fair value | 8,814 | 4,537 | 3,470 | 4,461 | 21,282 | |||||||||||||||
Average yield(a) |
3.68 | % | 4.35 | % | 2.00 | % | 3.79 | % | 3.55 | % | ||||||||||
| Corporate debt securities | ||||||||||||||||||||
| Amortized cost | $ | 81 | $ | 67 | $ | 14 | $ | — | $ | 162 | ||||||||||
| Fair value | 20 | 66 | 14 | — | 100 | |||||||||||||||
Average yield(a) |
15.37 | % | 6.25 | % | 4.10 | % | — | % | 10.62 | % | ||||||||||
| Asset-backed securities | ||||||||||||||||||||
| Amortized cost | $ | 23 | $ | 869 | $ | 3,506 | $ | 5,175 | $ | 9,573 | ||||||||||
| Fair value | 23 | 861 | 3,503 | 5,151 | 9,538 | (d) |
||||||||||||||
Average yield(a) |
6.13 | % | 3.72 | % | 6.48 | % | 6.82 | % | 6.41 | % | ||||||||||
| Total available-for-sale securities | ||||||||||||||||||||
Amortized cost(b) |
$ | 8,956 | $ | 38,140 | $ | 37,253 | $ | 121,068 | $ | 205,417 | ||||||||||
| Fair value | 8,868 | 37,802 | 37,115 | 117,919 | 201,704 | (d) |
||||||||||||||
Average yield(a) |
3.79 | % | 5.53 | % | 5.75 | % | 5.25 | % | 5.33 | % | ||||||||||
| Held-to-maturity securities | ||||||||||||||||||||
| Mortgage-backed securities | ||||||||||||||||||||
| Amortized cost | $ | — | $ | 5,868 | $ | 8,382 | $ | 111,649 | $ | 125,899 | ||||||||||
| Fair value | — | 5,480 | 7,448 | 99,791 | 112,719 | |||||||||||||||
Average yield(a) |
— | % | 2.56 | % | 2.58 | % | 3.02 | % | 2.97 | % | ||||||||||
| U.S. Treasury and government agencies | ||||||||||||||||||||
| Amortized cost | $ | 63,974 | $ | 60,763 | $ | 48,929 | $ | — | $ | 173,666 | ||||||||||
| Fair value | 63,012 | 56,064 | 41,516 | — | 160,592 | |||||||||||||||
Average yield(a) |
0.63 | % | 0.97 | % | 1.26 | % | — | % | 0.93 | % | ||||||||||
| Obligations of U.S. states and municipalities | ||||||||||||||||||||
| Amortized cost | $ | — | $ | — | $ | 283 | $ | 9,714 | $ | 9,997 | ||||||||||
| Fair value | — | — | 254 | 9,174 | 9,428 | |||||||||||||||
Average yield(a) |
— | % | — | % | 3.21 | % | 3.94 | % | 3.92 | % | ||||||||||
| Asset-backed securities | ||||||||||||||||||||
| Amortized cost | $ | — | $ | 16 | $ | 20,345 | $ | 40,019 | $ | 60,380 | ||||||||||
| Fair value | — | 16 | 20,262 | 39,737 | 60,015 | |||||||||||||||
Average yield(a) |
— | % | 6.86 | % | 6.36 | % | 6.58 | % | 6.50 | % | ||||||||||
| Total held-to-maturity securities | ||||||||||||||||||||
Amortized cost(b) |
$ | 63,974 | $ | 66,647 | $ | 77,939 | $ | 161,382 | $ | 369,942 | ||||||||||
| Fair value | 63,012 | 61,560 | 69,480 | 148,702 | 342,754 | |||||||||||||||
Average yield(a) |
0.63 | % | 1.11 | % | 2.74 | % | 3.96 | % | 2.61 | % | ||||||||||
JPMorgan Chase & Co./2023 Form 10-K |
231 |
|||||||
232 |
JPMorgan Chase & Co./2023 Form 10-K |
|||||||
| December 31, 2023 | ||||||||||||||||||||
| (in millions) | Gross amounts | Amounts netted on the Consolidated balance sheets | Amounts presented on the Consolidated balance sheets |
Amounts not
nettable on the Consolidated
balance sheets(b)
|
Net amounts(c) |
|||||||||||||||
Assets |
||||||||||||||||||||
Securities purchased under resale agreements |
$ | 523,308 | $ | (247,181) | $ | 276,127 | $ | (267,582) | $ | 8,545 | ||||||||||
Securities borrowed |
244,046 | (43,610) | 200,436 | (144,543) | 55,893 | |||||||||||||||
Liabilities |
||||||||||||||||||||
| Securities sold under repurchase agreements | $ | 459,985 | $ | (247,181) | $ | 212,804 | $ | (182,011) | $ | 30,793 | ||||||||||
Securities loaned and other(a) |
52,142 | (43,610) | 8,532 | (8,501) | 31 | |||||||||||||||
| December 31, 2022 | ||||||||||||||||||||
| (in millions) | Gross amounts | Amounts netted on the Consolidated balance sheets | Amounts presented on the Consolidated balance sheets |
Amounts not
nettable on the Consolidated
balance sheets(b)
|
Net amounts(c) |
|||||||||||||||
Assets |
||||||||||||||||||||
Securities purchased under resale agreements |
$ | 597,912 | $ | (282,411) | $ | 315,501 | $ | (304,120) | $ | 11,381 | ||||||||||
Securities borrowed |
228,279 | (42,910) | 185,369 | (131,578) | 53,791 | |||||||||||||||
Liabilities |
||||||||||||||||||||
| Securities sold under repurchase agreements | $ | 480,793 | $ | (282,411) | $ | 198,382 | $ | (167,427) | $ | 30,955 | ||||||||||
Securities loaned and other(a) |
52,443 | (42,910) | 9,533 | (9,527) | 6 | |||||||||||||||
JPMorgan Chase & Co./2023 Form 10-K |
233 |
|||||||
| Gross liability balance | |||||||||||||||||||||||
| 2023 | 2022 | ||||||||||||||||||||||
| December 31, (in millions) | Securities sold under repurchase agreements | Securities loaned and other | Securities sold under repurchase agreements | Securities loaned and other | |||||||||||||||||||
| Mortgage-backed securities: | |||||||||||||||||||||||
| U.S. GSEs and government agencies | $ | 71,064 | $ | — | $ | 58,050 | $ | — | |||||||||||||||
| Residential - nonagency | 2,292 | — | 2,414 | — | |||||||||||||||||||
| Commercial - nonagency | 2,669 | — | 2,007 | — | |||||||||||||||||||
| U.S. Treasury, GSEs and government agencies | 216,467 | 1,034 | 191,254 | 1,464 | |||||||||||||||||||
| Obligations of U.S. states and municipalities | 2,323 | — | 1,735 | 5 | |||||||||||||||||||
| Non-U.S. government debt | 97,400 | 1,455 | 155,156 | 1,259 | |||||||||||||||||||
| Corporate debt securities | 39,247 | 2,025 | 37,121 | 461 | |||||||||||||||||||
| Asset-backed securities | 2,703 | — | 2,981 | — | |||||||||||||||||||
| Equity securities | 25,820 | 47,628 | 30,075 | 49,254 | |||||||||||||||||||
Total |
$ | 459,985 | $ | 52,142 | $ | 480,793 | $ | 52,443 | |||||||||||||||
| Remaining contractual maturity of the agreements | |||||||||||||||||||||||||||||
| December 31, 2023 (in millions)
|
Overnight and continuous | Greater than 90 days |
|||||||||||||||||||||||||||
| Up to 30 days | 30 – 90 days | Total | |||||||||||||||||||||||||||
| Total securities sold under repurchase agreements | $ | 259,048 | $ | 102,941 | $ | 20,960 | $ | 77,036 | $ | 459,985 | |||||||||||||||||||
| Total securities loaned and other | 49,610 | 1,544 | — | 988 | 52,142 | ||||||||||||||||||||||||
| Remaining contractual maturity of the agreements | |||||||||||||||||||||||||||||
| December 31, 2022 (in millions) |
Overnight and continuous | Greater than 90 days |
|||||||||||||||||||||||||||
| Up to 30 days | 30 – 90 days | Total | |||||||||||||||||||||||||||
| Total securities sold under repurchase agreements | $ | 205,235 | $ | 170,696 | $ | 37,120 | $ | 67,742 | $ | 480,793 | |||||||||||||||||||
| Total securities loaned and other | 50,138 | 1,285 | 3 | 1,017 | 52,443 | ||||||||||||||||||||||||
234 |
JPMorgan Chase & Co./2023 Form 10-K |
|||||||
JPMorgan Chase & Co./2023 Form 10-K |
235 |
|||||||
236 |
JPMorgan Chase & Co./2023 Form 10-K |
|||||||
JPMorgan Chase & Co./2023 Form 10-K |
237 |
|||||||
|
Consumer, excluding
credit card
|
Credit card | Wholesale(c)(d) |
||||||||||||
|
• Residential real estate(a)
• Auto and other(b)
|
• Credit card loans |
• Secured by real estate
• Commercial and industrial
• Other(e)
|
||||||||||||
| December 31, 2023 | Consumer, excluding credit card | Credit card | Wholesale | Total(b)(c) |
|||||||||||||||||||||||||||||||
| (in millions) | |||||||||||||||||||||||||||||||||||
| Retained | $ | 397,275 | (a) |
$ | 211,123 | $ | 672,472 | (a) |
$ | 1,280,870 | |||||||||||||||||||||||||
| Held-for-sale | 487 | — | 3,498 | 3,985 | |||||||||||||||||||||||||||||||
| At fair value | 12,331 | (a) |
— | 26,520 | 38,851 | ||||||||||||||||||||||||||||||
| Total | $ | 410,093 | $ | 211,123 | $ | 702,490 | $ | 1,323,706 | |||||||||||||||||||||||||||
| December 31, 2022 | Consumer, excluding credit card | Credit card | Wholesale | Total(b)(c) |
|||||||||||||||||||||||||||||||
| (in millions) | |||||||||||||||||||||||||||||||||||
| Retained | $ | 300,753 | $ | 185,175 | $ | 603,670 | $ | 1,089,598 | |||||||||||||||||||||||||||
| Held-for-sale | 618 | — | 3,352 | 3,970 | |||||||||||||||||||||||||||||||
| At fair value | 10,004 | — | 32,075 | 42,079 | |||||||||||||||||||||||||||||||
| Total | $ | 311,375 | $ | 185,175 | $ | 639,097 | $ | 1,135,647 | |||||||||||||||||||||||||||
| 2023 | ||||||||||||||||||||||||||||||||||||||
| Year ended December 31, (in millions) |
Consumer, excluding credit card |
Credit card | Wholesale | Total | ||||||||||||||||||||||||||||||||||
| Purchases | $ | 92,205 | (b)(c)(d) |
$ | — | $ | 60,300 | (d) |
$ | 152,505 | ||||||||||||||||||||||||||||
| Sales | 2,202 | — | 43,949 | 46,151 | ||||||||||||||||||||||||||||||||||
Retained loans reclassified to held-for-sale(a) |
274 | — | 1,486 | 1,760 | ||||||||||||||||||||||||||||||||||
| 2022 | ||||||||||||||||||||||||||||||||||||||
| Year ended December 31, (in millions) |
Consumer, excluding credit card |
Credit card | Wholesale | Total | ||||||||||||||||||||||||||||||||||
| Purchases | $ | 1,625 | (b)(c) |
$ | — | $ | 1,088 | $ | 2,713 | |||||||||||||||||||||||||||||
| Sales | 2,884 | — | 41,934 | 44,818 | ||||||||||||||||||||||||||||||||||
Retained loans reclassified to held-for-sale(a) |
229 | — | 1,055 | 1,284 | ||||||||||||||||||||||||||||||||||
238 |
JPMorgan Chase & Co./2023 Form 10-K |
|||||||
| 2021 | |||||||||||||||||||||||||||||||||||
| Year ended December 31, (in millions) |
Consumer, excluding credit card |
Credit card | Wholesale | Total | |||||||||||||||||||||||||||||||
| Purchases | $ | 515 | (b)(c) |
$ | — | $ | 1,122 | $ | 1,637 | ||||||||||||||||||||||||||
| Sales | 799 | — | 31,022 | 31,821 | |||||||||||||||||||||||||||||||
Retained loans reclassified to held-for-sale(a) |
1,225 | — | 2,178 | 3,403 | |||||||||||||||||||||||||||||||
JPMorgan Chase & Co./2023 Form 10-K |
239 |
|||||||
| December 31, (in millions) | 2023 | 2022 | |||||||||
| Residential real estate | $ | 326,409 | (a) |
$ | 237,561 | ||||||
| Auto and other | 70,866 | 63,192 | |||||||||
| Total retained loans | $ | 397,275 | $ | 300,753 | |||||||
240 |
JPMorgan Chase & Co./2023 Form 10-K |
|||||||
| (in millions, except ratios) | December 31, 2023 | ||||||||||||||||||||||||||||||||||
Term loans by origination year(f) |
Revolving loans | Total | |||||||||||||||||||||||||||||||||
| 2023 | 2022 | 2021 | 2020 | 2019 | Prior to 2019 | Within the revolving period | Converted to term loans | ||||||||||||||||||||||||||||
Loan delinquency(a)(b) |
|||||||||||||||||||||||||||||||||||
Current(c) |
$ | 23,216 | $ | 64,366 | $ | 84,496 | $ | 55,546 | $ | 21,530 | $ | 59,563 | $ | 7,479 | $ | 8,151 | $ | 324,347 | |||||||||||||||||
| 30–149 days past due | 33 | 74 | 89 | 70 | 41 | 801 | 49 | 223 | 1,380 | ||||||||||||||||||||||||||
| 150 or more days past due | 1 | 10 | 17 | 8 | 21 | 456 | 5 | 164 | 682 | ||||||||||||||||||||||||||
| Total retained loans | $ | 23,250 | $ | 64,450 | $ | 84,602 | $ | 55,624 | $ | 21,592 | $ | 60,820 | $ | 7,533 | $ | 8,538 | $ | 326,409 | |||||||||||||||||
% of 30+ days past due to total retained loans(d)(e) |
0.15 | % | 0.13 | % | 0.13 | % | 0.14 | % | 0.29 | % | 2.04 | % | 0.72 | % | 4.53 | % | 0.63 | % | |||||||||||||||||
| Gross charge-offs | $ | — | $ | — | $ | — | $ | — | $ | 4 | $ | 167 | $ | 26 | $ | 7 | $ | 204 | |||||||||||||||||
| (in millions, except ratios) | December 31, 2022 | ||||||||||||||||||||||||||||||||||
Term loans by origination year(f) |
Revolving loans | Total | |||||||||||||||||||||||||||||||||
| 2022 | 2021 | 2020 | 2019 | 2018 | Prior to 2018 | Within the revolving period | Converted to term loans | ||||||||||||||||||||||||||||
Loan delinquency(a)(b) |
|||||||||||||||||||||||||||||||||||
| Current | $ | 39,934 | $ | 66,072 | $ | 43,315 | $ | 15,397 | $ | 6,339 | $ | 49,632 | $ | 5,589 | $ | 9,685 | $ | 235,963 | |||||||||||||||||
| 30–149 days past due | 29 | 11 | 14 | 20 | 20 | 597 | 15 | 208 | 914 | ||||||||||||||||||||||||||
| 150 or more days past due | 1 | 1 | 6 | 10 | 7 | 480 | 4 | 175 | 684 | ||||||||||||||||||||||||||
| Total retained loans | $ | 39,964 | $ | 66,084 | $ | 43,335 | $ | 15,427 | $ | 6,366 | $ | 50,709 | $ | 5,608 | $ | 10,068 | $ | 237,561 | |||||||||||||||||
% of 30+ days past due to total retained loans(d) |
0.08 | % | 0.02 | % | 0.05 | % | 0.19 | % | 0.42 | % | 2.07 | % | 0.34 | % | 3.80 | % | 0.66 | % | |||||||||||||||||
JPMorgan Chase & Co./2023 Form 10-K |
241 |
|||||||
| (in millions, except weighted-average data) | December 31, 2023 | December 31, 2022 | |||||||||
Nonaccrual loans(a)(b)(c)(d)(e) |
$ | 3,466 | $ | 3,745 | |||||||
Current estimated LTV ratios(f)(g)(h) |
|||||||||||
Greater than 125% and refreshed FICO scores: |
|||||||||||
| Equal to or greater than 660 | $ | 72 | $ | 2 | |||||||
| Less than 660 | — | — | |||||||||
101% to 125% and refreshed FICO scores: |
|||||||||||
| Equal to or greater than 660 | 223 | 174 | |||||||||
| Less than 660 | 4 | 6 | |||||||||
80% to 100% and refreshed FICO scores: |
|||||||||||
| Equal to or greater than 660 | 6,491 | (l) |
12,034 | ||||||||
| Less than 660 | 102 | 184 | |||||||||
Less than 80% and refreshed FICO scores: |
|||||||||||
| Equal to or greater than 660 | 309,251 | (l) |
215,096 | ||||||||
| Less than 660 | 9,277 | (l) |
8,659 | ||||||||
No FICO/LTV available(i) |
989 | 1,406 | |||||||||
Total retained loans |
$ | 326,409 | (m) |
$ | 237,561 | ||||||
Weighted average LTV ratio(f)(j) |
49 | % | 51 | % | |||||||
Weighted average FICO(g)(j) |
770 | 769 | |||||||||
Geographic region(i)(k) |
|||||||||||
| California | $ | 127,072 | (n) |
$ | 73,112 | ||||||
| New York | 48,815 | (n) |
34,471 | ||||||||
| Florida | 22,778 | (n) |
18,870 | ||||||||
| Texas | 15,506 | 14,968 | |||||||||
| Massachusetts | 14,213 | (n) |
6,380 | ||||||||
| Illinois | 10,856 | 11,296 | |||||||||
| Colorado | 10,800 | 9,968 | |||||||||
| Washington | 9,923 | 9,060 | |||||||||
| New Jersey | 8,050 | 7,108 | |||||||||
| Connecticut | 7,163 | 5,432 | |||||||||
| All other | 51,233 | 46,896 | |||||||||
Total retained loans |
$ | 326,409 | $ | 237,561 | |||||||
242 |
JPMorgan Chase & Co./2023 Form 10-K |
|||||||
| Year ended December 31, | 2022 | 2021 | ||||||
| Number of loans approved for a trial modification | 3,902 | 6,246 | ||||||
| Number of loans permanently modified | 4,182 | 4,588 | ||||||
Concession granted:(a) |
||||||||
| Interest rate reduction | 54 | % | 74 | % | ||||
| Term or payment extension | 67 | 53 | ||||||
| Principal and/or interest deferred | 10 | 23 | ||||||
| Principal forgiveness | 1 | 2 | ||||||
Other(b) |
37 | 36 | ||||||
| Year ended December 31, (in millions, except weighted - average data) |
2022 | 2021 | ||||||
| Weighted-average interest rate of loans with interest rate reductions – before TDR | 4.75 | % | 4.54 | % | ||||
| Weighted-average interest rate of loans with interest rate reductions – after TDR | 3.35 | 2.92 | ||||||
| Weighted-average remaining contractual term (in years) of loans with term or payment extensions – before TDR | 22 | 23 | ||||||
| Weighted-average remaining contractual term (in years) of loans with term or payment extensions – after TDR | 38 | 38 | ||||||
| Charge-offs recognized upon permanent modification | $ | 1 | $ | — | ||||
| Principal deferred | 16 | 28 | ||||||
| Principal forgiven | 2 | 1 | ||||||
Balance of loans that redefaulted within one year of permanent modification(a) |
$ | 147 | $ | 160 | ||||
JPMorgan Chase & Co./2023 Form 10-K |
243 |
|||||||
| December 31, 2023 | |||||||||||||||||||||||||||||||||||||||||
|
(in millions, except ratios) |
Term loans by origination year | Revolving loans | |||||||||||||||||||||||||||||||||||||||
| 2023 | 2022 | 2021 | 2020 | 2019 | Prior to 2019 | Within the revolving period | Converted to term loans | Total | |||||||||||||||||||||||||||||||||
| Loan delinquency | |||||||||||||||||||||||||||||||||||||||||
Current |
$ | 30,328 | $ | 14,797 | $ | 12,825 | $ | 6,538 | $ | 1,777 | $ | 511 | $ | 2,984 | $ | 102 | $ | 69,862 | |||||||||||||||||||||||
| 30–119 days past due | 276 | 279 | 231 | 78 | 43 | 17 | 19 | 24 | 967 | ||||||||||||||||||||||||||||||||
| 120 or more days past due | 1 | 1 | 7 | 8 | — | — | 3 | 17 | 37 | ||||||||||||||||||||||||||||||||
| Total retained loans | $ | 30,605 | $ | 15,077 | $ | 13,063 | $ | 6,624 | $ | 1,820 | $ | 528 | $ | 3,006 | $ | 143 | $ | 70,866 | |||||||||||||||||||||||
% of 30+ days past due to total retained loans(a) |
0.91 | % | 1.86 | % | 1.75 | % | 1.15 | % | 2.36 | % | 3.22 | % | 0.73 | % | 28.67 | % | 1.39 | % | |||||||||||||||||||||||
| Gross charge-offs | $ | 333 | $ | 297 | $ | 161 | $ | 53 | $ | 35 | $ | 64 | $ | — | $ | 4 | $ | 947 | |||||||||||||||||||||||
| December 31, 2022 | |||||||||||||||||||||||||||||||||||||||||
|
(in millions, except ratios) |
Term loans by origination year | Revolving loans | |||||||||||||||||||||||||||||||||||||||
| 2022 | 2021 | 2020 | 2019 | 2018 | Prior to 2018 | Within the revolving period | Converted to term loans | Total | |||||||||||||||||||||||||||||||||
| Loan delinquency | |||||||||||||||||||||||||||||||||||||||||
Current |
$ | 22,187 | $ | 20,212 | $ | 11,401 | $ | 3,991 | $ | 1,467 | $ | 578 | $ | 2,342 | $ | 118 | $ | 62,296 | |||||||||||||||||||||||
| 30–119 days past due | 263 | 308 | 100 | 68 | 33 | 17 | 12 | 10 | 811 | ||||||||||||||||||||||||||||||||
| 120 or more days past due | — | 53 | 24 | — | — | 1 | 2 | 5 | 85 | ||||||||||||||||||||||||||||||||
| Total retained loans | $ | 22,450 | $ | 20,573 | $ | 11,525 | $ | 4,059 | $ | 1,500 | $ | 596 | $ | 2,356 | $ | 133 | $ | 63,192 | |||||||||||||||||||||||
% of 30+ days past due to total retained loans(a) |
1.17 | % | 1.15 | % | 0.83 | % | 1.68 | % | 2.20 | % | 3.02 | % | 0.59 | % | 11.28 | % | 1.18 | % | |||||||||||||||||||||||
244 |
JPMorgan Chase & Co./2023 Form 10-K |
|||||||
| (in millions) | Total Auto and other | |||||||
| December 31, 2023 | December 31, 2022 | |||||||
Nonaccrual loans(a)(b)(c) |
$ | 177 | $ | 129 | ||||
Geographic region(d) |
||||||||
| California | $ | 10,959 | $ | 9,689 | ||||
| Texas | 8,502 | 7,216 | ||||||
| Florida | 5,684 | 4,847 | ||||||
| New York | 4,938 | 4,345 | ||||||
| Illinois | 3,147 | 2,839 | ||||||
| New Jersey | 2,609 | 2,219 | ||||||
| Georgia | 1,912 | 1,708 | ||||||
| Pennsylvania | 1,900 | 1,822 | ||||||
| Arizona | 1,779 | 1,551 | ||||||
| North Carolina | 1,714 | 1,481 | ||||||
| All other | 27,722 | 25,475 | ||||||
| Total retained loans | $ | 70,866 | $ | 63,192 | ||||
JPMorgan Chase & Co./2023 Form 10-K |
245 |
|||||||
|
(in millions, except ratios)
|
December 31, 2023 | ||||||||||
| Within the revolving period | Converted to term loans | Total | |||||||||
Loan delinquency |
|||||||||||
Current and less than 30 days past due and still accruing |
$ | 205,731 | $ | 882 | $ | 206,613 | |||||
30–89 days past due and still accruing |
2,217 | 84 | 2,301 | ||||||||
90 or more days past due and still accruing |
2,169 | 40 | 2,209 | ||||||||
| Total retained loans | $ | 210,117 | $ | 1,006 | $ | 211,123 | |||||
| Loan delinquency ratios | |||||||||||
% of 30+ days past due to total retained loans |
2.09 | % | 12.33 | % | 2.14 | % | |||||
% of 90+ days past due to total retained loans |
1.03 | 3.98 | 1.05 | ||||||||
| Gross charge-offs | $ | 5,325 | $ | 166 | $ | 5,491 | |||||
|
(in millions, except ratios)
|
December 31, 2022 | ||||||||||
| Within the revolving period | Converted to term loans | Total | |||||||||
Loan delinquency |
|||||||||||
Current and less than 30 days past due and still accruing |
$ | 181,793 | $ | 696 | $ | 182,489 | |||||
30–89 days past due and still accruing |
1,356 | 64 | 1,420 | ||||||||
90 or more days past due and still accruing |
1,230 | 36 | 1,266 | ||||||||
| Total retained loans | $ | 184,379 | $ | 796 | $ | 185,175 | |||||
| Loan delinquency ratios | |||||||||||
% of 30+ days past due to total retained loans |
1.40 | % | 12.56 | % | 1.45 | % | |||||
% of 90+ days past due to total retained loans |
0.67 | 4.52 | 0.68 | ||||||||
246 |
JPMorgan Chase & Co./2023 Form 10-K |
|||||||
| (in millions, except ratios) | December 31, 2023 | December 31, 2022 | ||||||
Geographic region(a) |
||||||||
| California | $ | 32,652 | $ | 28,154 | ||||
| Texas | 22,086 | 19,171 | ||||||
| New York | 16,915 | 15,046 | ||||||
| Florida | 15,103 | 12,905 | ||||||
| Illinois | 11,364 | 10,089 | ||||||
| New Jersey | 8,688 | 7,643 | ||||||
| Ohio | 6,424 | 5,792 | ||||||
| Colorado | 6,307 | 5,493 | ||||||
| Pennsylvania | 6,088 | 5,517 | ||||||
| Arizona | 5,209 | 4,487 | ||||||
| All other | 80,287 | 70,878 | ||||||
| Total retained loans | $ | 211,123 | $ | 185,175 | ||||
Percentage of portfolio based on carrying value with estimated refreshed FICO scores |
||||||||
| Equal to or greater than 660 | 85.8 | % | 86.8 | % | ||||
| Less than 660 | 14.0 | 13.0 | ||||||
| No FICO available | 0.2 | 0.2 | ||||||
| Year ended December 31, 2023 (in millions) |
Amortized cost basis |
% of loan modifications to total retained credit card loans | Financial effect of loan modification | ||||||||
| Loan modification | |||||||||||
Term extension and interest rate reduction(a)(b) |
$ | 648 | 0.31 | % | Term extension with a reduction in the weighted average contractual interest rate from 23.19% to 3.64% |
||||||
| Total | $ | 648 | |||||||||
| Year ended December 31, 2023 (in millions) |
Amortized cost basis | ||||
| Current and less than 30 days past due and still accruing | $ | 558 | |||
| 30-89 days past due and still accruing | 59 | ||||
| 90 or more days past due and still accruing | 31 | ||||
| Total | $ | 648 | |||
JPMorgan Chase & Co./2023 Form 10-K |
247 |
|||||||
| Year ended December 31, (in millions, except weighted-average data) |
2022 | 2021 | ||||||
Balance of new TDRs(a) |
$ | 418 | $ | 393 | ||||
| Weighted-average interest rate of loans – before TDR | 19.86 | % | 17.75 | % | ||||
Weighted-average interest rate of loans – after TDR |
4.13 | 5.14 | ||||||
Balance of loans that redefaulted within one year of modification(b) |
$ | 34 | $ | 57 | ||||
248 |
JPMorgan Chase & Co./2023 Form 10-K |
|||||||
JPMorgan Chase & Co./2023 Form 10-K |
249 |
|||||||
| December 31, (in millions, except ratios) |
Secured by real estate | Commercial and industrial | Other(b) |
Total retained loans | ||||||||||||||||||||||||||||||||||||||||
| 2023 | 2022 | 2023 | 2022 | 2023 | 2022 | 2023 | 2022 | |||||||||||||||||||||||||||||||||||||
| Loans by risk ratings | ||||||||||||||||||||||||||||||||||||||||||||
| Investment-grade | $ | 120,405 | $ | 99,552 | $ | 72,624 | $ | 76,275 | $ | 265,809 | $ | 249,585 | $ | 458,838 | $ | 425,412 | ||||||||||||||||||||||||||||
| Noninvestment- grade: | ||||||||||||||||||||||||||||||||||||||||||||
| Noncriticized | 34,241 | 23,272 | 80,637 | 81,393 | 75,178 | 57,888 | 190,056 | 162,553 | ||||||||||||||||||||||||||||||||||||
| Criticized performing | 7,291 | 3,662 | 12,684 | 8,974 | 1,257 | 1,106 | 21,232 | 13,742 | ||||||||||||||||||||||||||||||||||||
| Criticized nonaccrual | 401 | 246 | 1,221 | 1,018 | 724 | 699 | 2,346 | 1,963 | ||||||||||||||||||||||||||||||||||||
| Total noninvestment- grade | 41,933 | 27,180 | 94,542 | 91,385 | 77,159 | 59,693 | 213,634 | 178,258 | ||||||||||||||||||||||||||||||||||||
Total retained loans(a) |
$ | 162,338 | $ | 126,732 | $ | 167,166 | $ | 167,660 | $ | 342,968 | $ | 309,278 | $ | 672,472 | $ | 603,670 | ||||||||||||||||||||||||||||
| % of investment-grade to total retained loans | 74.17 | % | 78.55 | % | 43.44 | % | 45.49 | % | 77.50 | % | 80.70 | % | 68.23 | % | 70.47 | % | ||||||||||||||||||||||||||||
| % of total criticized to total retained loans | 4.74 | 3.08 | 8.32 | 5.96 | 0.58 | 0.58 | 3.51 | 2.60 | ||||||||||||||||||||||||||||||||||||
| % of criticized nonaccrual to total retained loans | 0.25 | 0.19 | 0.73 | 0.61 | 0.21 | 0.23 | 0.35 | 0.33 | ||||||||||||||||||||||||||||||||||||
| Secured by real estate | |||||||||||||||||||||||||||||||||||
|
(in millions) |
December 31, 2023 | ||||||||||||||||||||||||||||||||||
| Term loans by origination year | Revolving loans | ||||||||||||||||||||||||||||||||||
| 2023 | 2022 | 2021 | 2020 | 2019 | Prior to 2019 | Within the revolving period | Converted to term loans | Total | |||||||||||||||||||||||||||
| Loans by risk ratings | |||||||||||||||||||||||||||||||||||
| Investment-grade | $ | 10,687 | $ | 28,874 | $ | 25,784 | $ | 16,820 | $ | 15,677 | $ | 21,108 | $ | 1,455 | $ | — | $ | 120,405 | |||||||||||||||||
| Noninvestment-grade | 4,477 | 12,579 | 7,839 | 3,840 | 3,987 | 7,918 | 1,291 | 2 | 41,933 | ||||||||||||||||||||||||||
Total retained loans(a) |
$ | 15,164 | $ | 41,453 | $ | 33,623 | $ | 20,660 | $ | 19,664 | $ | 29,026 | $ | 2,746 | $ | 2 | $ | 162,338 | |||||||||||||||||
| Gross charge-offs | $ | 20 | $ | 48 | $ | 22 | $ | — | $ | 23 | $ | 78 | $ | — | $ | 1 | $ | 192 | |||||||||||||||||
| Secured by real estate | |||||||||||||||||||||||||||||||||||
|
(in millions) |
December 31, 2022 | ||||||||||||||||||||||||||||||||||
| Term loans by origination year | Revolving loans | ||||||||||||||||||||||||||||||||||
| 2022 | 2021 | 2020 | 2019 | 2018 | Prior to 2018 | Within the revolving period | Converted to term loans | Total | |||||||||||||||||||||||||||
| Loans by risk ratings | |||||||||||||||||||||||||||||||||||
| Investment-grade | $ | 24,134 | $ | 22,407 | $ | 14,773 | $ | 14,666 | $ | 5,277 | $ | 17,289 | $ | 1,006 | $ | — | $ | 99,552 | |||||||||||||||||
| Noninvestment-grade | 6,072 | 5,602 | 3,032 | 3,498 | 2,395 | 5,659 | 920 | 2 | 27,180 | ||||||||||||||||||||||||||
| Total retained loans | $ | 30,206 | $ | 28,009 | $ | 17,805 | $ | 18,164 | $ | 7,672 | $ | 22,948 | $ | 1,926 | $ | 2 | $ | 126,732 | |||||||||||||||||
250 |
JPMorgan Chase & Co./2023 Form 10-K |
|||||||
| Commercial and industrial | ||||||||||||||||||||||||||||||||||||||
|
(in millions) |
December 31, 2023 | |||||||||||||||||||||||||||||||||||||
| Term loans by origination year | Revolving loans | |||||||||||||||||||||||||||||||||||||
| 2023 | 2022 | 2021 | 2020 | 2019 | Prior to 2019 | Within the revolving period | Converted to term loans | Total | ||||||||||||||||||||||||||||||
Loans by risk ratings |
||||||||||||||||||||||||||||||||||||||
| Investment-grade | $ | 14,875 | $ | 10,642 | $ | 4,276 | $ | 2,291 | $ | 1,030 | $ | 1,115 | $ | 38,394 | $ | 1 | $ | 72,624 | ||||||||||||||||||||
| Noninvestment-grade | 18,890 | 16,444 | 9,299 | 1,989 | 1,144 | 1,006 | 45,696 | 74 | 94,542 | |||||||||||||||||||||||||||||
Total retained loans(a) |
$ | 33,765 | $ | 27,086 | $ | 13,575 | $ | 4,280 | $ | 2,174 | $ | 2,121 | $ | 84,090 | $ | 75 | $ | 167,166 | ||||||||||||||||||||
| Gross charge-offs | $ | 25 | $ | 8 | $ | 110 | $ | 55 | $ | 2 | $ | 12 | $ | 259 | $ | 8 | $ | 479 | ||||||||||||||||||||
| Commercial and industrial | ||||||||||||||||||||||||||||||||||||||
|
(in millions) |
December 31, 2022 | |||||||||||||||||||||||||||||||||||||
| Term loans by origination year | Revolving loans | |||||||||||||||||||||||||||||||||||||
| 2022 | 2021 | 2020 | 2019 | 2018 | Prior to 2018 | Within the revolving period | Converted to term loans | Total | ||||||||||||||||||||||||||||||
| Loans by risk ratings | ||||||||||||||||||||||||||||||||||||||
| Investment-grade | $ | 21,072 | $ | 8,338 | $ | 3,045 | $ | 1,995 | $ | 748 | $ | 989 | $ | 40,087 | $ | 1 | $ | 76,275 | ||||||||||||||||||||
| Noninvestment-grade | 24,088 | 12,444 | 3,459 | 2,506 | 525 | 1,014 | 47,267 | 82 | 91,385 | |||||||||||||||||||||||||||||
| Total retained loans | $ | 45,160 | $ | 20,782 | $ | 6,504 | $ | 4,501 | $ | 1,273 | $ | 2,003 | $ | 87,354 | $ | 83 | $ | 167,660 | ||||||||||||||||||||
Other(a) |
|||||||||||||||||||||||||||||||||||
|
(in millions) |
December 31, 2023 | ||||||||||||||||||||||||||||||||||
| Term loans by origination year | Revolving loans | ||||||||||||||||||||||||||||||||||
| 2023 | 2022 | 2021 | 2020 | 2019 | Prior to 2019 | Within the revolving period | Converted to term loans | Total | |||||||||||||||||||||||||||
Loans by risk ratings |
|||||||||||||||||||||||||||||||||||
| Investment-grade | $ | 38,338 | $ | 18,034 | $ | 10,033 | $ | 10,099 | $ | 3,721 | $ | 6,662 | $ | 176,728 | $ | 2,194 | $ | 265,809 | |||||||||||||||||
| Noninvestment-grade | 14,054 | 8,092 | 6,169 | 2,172 | 811 | 2,001 | 43,801 | 59 | 77,159 | ||||||||||||||||||||||||||
Total retained loans(b) |
$ | 52,392 | $ | 26,126 | $ | 16,202 | $ | 12,271 | $ | 4,532 | $ | 8,663 | $ | 220,529 | $ | 2,253 | $ | 342,968 | |||||||||||||||||
| Gross charge-offs | $ | 5 | $ | 298 | $ | 8 | $ | 8 | $ | — | $ | 8 | $ | 13 | $ | — | $ | 340 | |||||||||||||||||
Other(a) |
|||||||||||||||||||||||||||||||||||
|
(in millions) |
December 31, 2022 | ||||||||||||||||||||||||||||||||||
| Term loans by origination year | Revolving loans | ||||||||||||||||||||||||||||||||||
| 2022 | 2021 | 2020 | 2019 | 2018 | Prior to 2018 | Within the revolving period | Converted to term loans | Total | |||||||||||||||||||||||||||
| Loans by risk ratings | |||||||||||||||||||||||||||||||||||
| Investment-grade | $ | 32,121 | $ | 15,864 | $ | 13,015 | $ | 4,529 | $ | 2,159 | $ | 7,251 | $ | 171,049 | $ | 3,597 | $ | 249,585 | |||||||||||||||||
| Noninvestment-grade | 16,829 | 7,096 | 1,821 | 699 | 451 | 475 | 32,240 | 82 | 59,693 | ||||||||||||||||||||||||||
| Total retained loans | $ | 48,950 | $ | 22,960 | $ | 14,836 | $ | 5,228 | $ | 2,610 | $ | 7,726 | $ | 203,289 | $ | 3,679 | $ | 309,278 | |||||||||||||||||
JPMorgan Chase & Co./2023 Form 10-K |
251 |
|||||||
| December 31, (in millions, except ratios) |
Multifamily | Other Commercial | Total retained loans secured by real estate | ||||||||||||||||||||||||||
| 2023 | 2022 | 2023 | 2022 | 2023 | 2022 | ||||||||||||||||||||||||
| Retained loans secured by real estate | $ | 100,725 | $ | 79,139 | $ | 61,613 | $ | 47,593 | $ | 162,338 | (a) |
$ | 126,732 | ||||||||||||||||
| Criticized | 3,596 | 1,916 | 4,096 | 1,992 | 7,692 | 3,908 | |||||||||||||||||||||||
| % of criticized to total retained loans secured by real estate | 3.57 | % | 2.42 | % | 6.65 | % | 4.19 | % | 4.74 | % | 3.08 | % | |||||||||||||||||
| Criticized nonaccrual | $ | 76 | $ | 51 | $ | 325 | $ | 195 | $ | 401 | $ | 246 | |||||||||||||||||
| % of criticized nonaccrual loans to total retained loans secured by real estate | 0.08 | % | 0.06 | % | 0.53 | % | 0.41 | % | 0.25 | % | 0.19 | % | |||||||||||||||||
| Secured by real estate | Commercial and industrial |
Other | Total retained loans |
||||||||||||||||||||||||||||||||
| December 31, (in millions) |
2023 | 2022 | 2023 | 2022 | 2023 | 2022 | 2023 | 2022 | |||||||||||||||||||||||||||
Loans by geographic distribution(a)(b) |
|||||||||||||||||||||||||||||||||||
| Total U.S. | $ | 159,499 | $ | 123,740 | $ | 127,638 | $ | 125,324 | $ | 262,499 | $ | 230,525 | $ | 549,636 | $ | 479,589 | |||||||||||||||||||
| Total non-U.S. | 2,839 | 2,992 | 39,528 | 42,336 | 80,469 | 78,753 | 122,836 | 124,081 | |||||||||||||||||||||||||||
| Total retained loans | $ | 162,338 | $ | 126,732 | $ | 167,166 | $ | 167,660 | $ | 342,968 | $ | 309,278 | $ | 672,472 | $ | 603,670 | |||||||||||||||||||
| Loan delinquency | |||||||||||||||||||||||||||||||||||
Current and less than 30 days past due and still accruing |
$ | 161,314 | $ | 126,083 | $ | 164,899 | $ | 165,415 | $ | 341,128 | $ | 307,511 | $ | 667,341 | $ | 599,009 | |||||||||||||||||||
| 30–89 days past due and still accruing | 473 | 402 | 884 | 1,127 | 1,090 | 1,015 | 2,447 | 2,544 | |||||||||||||||||||||||||||
90 or more days past due and still accruing(c) |
150 | 1 | 162 | 100 | 26 | 53 | 338 | 154 | |||||||||||||||||||||||||||
Criticized nonaccrual(c) |
401 | 246 | 1,221 | 1,018 | 724 | 699 | 2,346 | 1,963 | |||||||||||||||||||||||||||
| Total retained loans | $ | 162,338 | $ | 126,732 | $ | 167,166 | $ | 167,660 | $ | 342,968 | $ | 309,278 | $ | 672,472 | $ | 603,670 | |||||||||||||||||||
| December 31, (in millions) |
Secured by real estate | Commercial and industrial |
Other | Total retained loans |
||||||||||||||||||||||||||||||||||
| 2023 | 2022 | 2023 | 2022 | 2023 | 2022 | 2023 | 2022 | |||||||||||||||||||||||||||||||
| Nonaccrual loans | ||||||||||||||||||||||||||||||||||||||
| With an allowance | $ | 129 | $ | 172 | $ | 776 | $ | 686 | $ | 492 | $ | 487 | $ | 1,397 | $ | 1,345 | ||||||||||||||||||||||
Without an allowance(a) |
272 | 74 | 445 | 332 | 232 | 212 | 949 | 618 | ||||||||||||||||||||||||||||||
Total nonaccrual loans(b) |
$ | 401 | $ | 246 | $ | 1,221 | $ | 1,018 | $ | 724 | $ | 699 | $ | 2,346 | $ | 1,963 | ||||||||||||||||||||||
252 |
JPMorgan Chase & Co./2023 Form 10-K |
|||||||
|
(in millions)
|
Secured by real estate | ||||||||||
Year ended December 31, 2023 |
|||||||||||
| Amortized cost basis | % of loan modifications to total retained Real Estate loans |
Financial effect of loan modification | |||||||||
| Loan modification | |||||||||||
| Single modifications | |||||||||||
| Term extension | $ | 149 | 0.09 | % | Extended loans by a weighted average of 14 months |
||||||
Other-than-insignificant payment deferral |
3 | — | % | Provided payment deferrals with delayed amounts primarily re-amortized over the remaining life of the loan |
|||||||
| Multiple modifications | |||||||||||
Interest rate reduction and term extension |
3 | — | % | Reduced weighted average contractual interest by 350 bps and extended loans by a weighted average of 3 months |
|||||||
Other-than-insignificant payment deferral and interest rate reduction |
5 | — | % | Provided payment deferrals with delayed amounts primarily recaptured at maturity and reduced weighted average contractual interest by 184 bps |
|||||||
| Total | $ | 160 | |||||||||
|
(in millions) |
Commercial and industrial | ||||||||||
Year ended December 31, 2023 |
|||||||||||
| Amortized cost basis | % of loan modifications to total retained Commercial and industrial loans | Financial effect of loan modification | |||||||||
| Loan modification | |||||||||||
| Single modifications | |||||||||||
| Term extension | $ | 916 | 0.55 | % | Extended loans by a weighted average of 17 months |
||||||
Other-than-insignificant payment deferral |
402 | 0.24 | % | Provided payment deferrals with delayed amounts primarily recaptured at the end of the deferral period |
|||||||
| Multiple modifications | |||||||||||
Other-than-insignificant payment deferral and term extension |
$ | 35 | 0.02 | % | Provided payment deferrals with delayed amounts primarily re-amortized over the remaining life of the loan and extended loans by a weighted-average of 7 months |
||||||
Other-than-insignificant payment deferral and interest rate reduction and term extension |
2 | — | % | Provided payment deferrals with delayed amounts primarily re-amortized over the remaining life of the loan, reduced weighted average contractual interest by 75 bps and extended loans by a weighted average of 29 months |
|||||||
| Term extension and principal forgiveness | 7 | — | % | Extended loans by a weighted average of 76 months and reduced amortized cost basis of the loans by $5 million |
|||||||
| Interest rate reduction and term extension | 1 | — | % | Reduced weighted average contractual interest rate over the life of the loan as a result of converting from variable to fixed rate and extended loans by a weighted average of 16 months |
|||||||
| $ | 1,363 | ||||||||||
JPMorgan Chase & Co./2023 Form 10-K |
253 |
|||||||
|
(in millions) |
Other | ||||||||||
Year ended December 31, 2023 |
|||||||||||
| Amortized cost basis | % of loan modifications to total retained Other loans | Financial effect of loan modification | |||||||||
| Loan modification | |||||||||||
| Single modifications | |||||||||||
| Interest rate reduction | $ | 9 | — | % | Reduced weighted average contractual interest by 654 bps |
||||||
| Term extension | 355 | 0.10 | % | Extended loans by a weighted average of 23 months |
|||||||
| Multiple modifications | |||||||||||
Other-than-insignificant payment deferral and term extension |
245 | 0.07 | % | Provided payment deferrals with delayed amounts primarily recaptured at the end of the deferral period and extended loans by a weighted average of 137 months |
|||||||
Total(a) |
$ | 609 | |||||||||
| Amortized cost basis | |||||||||||
| Secured by real estate | Commercial and industrial | Other | |||||||||
| (in millions) | Year ended December 31, 2023 |
Year ended December 31, 2023 |
Year ended December 31, 2023 |
||||||||
| Current and less than 30 days past due and still accruing | $ | 118 | $ | 947 | $ | 400 | |||||
| 30-89 days past due and still accruing | 2 | 42 | — | ||||||||
| Criticized nonaccrual | 40 | 374 | 209 | ||||||||
| Total | $ | 160 | $ | 1,363 | $ | 609 | |||||
|
(in millions) |
Amortized cost basis | |||||||||||||
| Secured by real estate | Commercial and industrial | Other | ||||||||||||
Year ended December 31, 2023 |
Year ended December 31, 2023 |
Year ended December 31, 2023 |
||||||||||||
| Loan modification | ||||||||||||||
| Term extension | $ | 1 | $ | 49 | $ | 31 | ||||||||
Other-than-insignificant payment deferral |
2 | — | — | |||||||||||
| Interest rate reduction and term extension | 3 | 1 | — | |||||||||||
Total(a) |
$ | 6 | $ | 50 | $ | 31 | ||||||||
254 |
JPMorgan Chase & Co./2023 Form 10-K |
|||||||
JPMorgan Chase & Co./2023 Form 10-K |
255 |
|||||||
256 |
JPMorgan Chase & Co./2023 Form 10-K |
|||||||
JPMorgan Chase & Co./2023 Form 10-K |
257 |
|||||||
| (Table continued on next page) | |||||||||||||||||||||||
2023 |
|||||||||||||||||||||||
| Year ended December 31, (in millions) |
Consumer, excluding credit card |
Credit card | Wholesale | Total | |||||||||||||||||||
| Allowance for loan losses | |||||||||||||||||||||||
| Beginning balance at January 1, | $ | 2,040 | $ | 11,200 | $ | 6,486 | $ | 19,726 | |||||||||||||||
Cumulative effect of a change in accounting principle(a) |
(489) | (100) | 2 | (587) | |||||||||||||||||||
| Gross charge-offs | 1,151 | 5,491 | 1,011 | 7,653 | |||||||||||||||||||
| Gross recoveries collected | (519) | (793) | (132) | (1,444) | |||||||||||||||||||
| Net charge-offs | 632 | 4,698 | 879 | 6,209 | |||||||||||||||||||
| Provision for loan losses | 936 | 6,048 | 2,484 | 9,468 | |||||||||||||||||||
Other |
1 | — | 21 | 22 | |||||||||||||||||||
| Ending balance at December 31, | $ | 1,856 | $ | 12,450 | $ | 8,114 | $ | 22,420 | |||||||||||||||
Allowance for lending-related commitments |
|||||||||||||||||||||||
Beginning balance at January 1, |
$ | 76 | $ | — | $ | 2,306 | $ | 2,382 | |||||||||||||||
Cumulative effect of a change in accounting principle(a) |
— | NA | — | NA | |||||||||||||||||||
Provision for lending-related commitments |
(1) | — | (407) | (408) | |||||||||||||||||||
Other |
— | — | — | — | |||||||||||||||||||
| Ending balance at December 31, | $ | 75 | $ | — | $ | 1,899 | $ | 1,974 | |||||||||||||||
| Total allowance for investment securities | NA | NA | NA | $ | 128 | ||||||||||||||||||
Total allowance for credit losses(b)(c) |
$ | 1,931 | $ | 12,450 | $ | 10,013 | $ | 24,522 | |||||||||||||||
Allowance for loan losses by impairment methodology |
|||||||||||||||||||||||
Asset-specific(d) |
$ | (876) | $ | — | $ | 392 | $ | (484) | |||||||||||||||
| Portfolio-based | 2,732 | 12,450 | 7,722 | 22,904 | |||||||||||||||||||
| Total allowance for loan losses | $ | 1,856 | $ | 12,450 | $ | 8,114 | $ | 22,420 | |||||||||||||||
| Loans by impairment methodology | |||||||||||||||||||||||
Asset-specific(d) |
$ | 3,287 | $ | — | $ | 2,338 | $ | 5,625 | |||||||||||||||
| Portfolio-based | 393,988 | 211,123 | 670,134 | 1,275,245 | |||||||||||||||||||
| Total retained loans | $ | 397,275 | $ | 211,123 | $ | 672,472 | $ | 1,280,870 | |||||||||||||||
| Collateral-dependent loans | |||||||||||||||||||||||
| Net charge-offs | $ | 6 | $ | — | $ | 180 | $ | 186 | |||||||||||||||
Loans measured at fair value of collateral less cost to sell |
3,216 | — | 1,012 | 4,228 | |||||||||||||||||||
Allowance for lending-related commitments by impairment methodology |
|||||||||||||||||||||||
Asset-specific |
$ | — | $ | — | $ | 89 | $ | 89 | |||||||||||||||
| Portfolio-based | 75 | — | 1,810 | 1,885 | |||||||||||||||||||
Total allowance for lending-related commitments(e) |
$ | 75 | $ | — | $ | 1,899 | $ | 1,974 | |||||||||||||||
Lending-related commitments by impairment methodology |
|||||||||||||||||||||||
Asset-specific |
$ | — | $ | — | $ | 464 | $ | 464 | |||||||||||||||
Portfolio-based(f) |
28,248 | — | 516,577 | 544,825 | |||||||||||||||||||
Total lending-related commitments |
$ | 28,248 | $ | — | $ | 517,041 | $ | 545,289 | |||||||||||||||
258 |
JPMorgan Chase & Co./2023 Form 10-K |
|||||||
| (table continued from previous page) | ||||||||||||||||||||||||||||||||||||||||||||
| 2022 | 2021 | |||||||||||||||||||||||||||||||||||||||||||
| Consumer, excluding credit card |
Credit card | Wholesale | Total | Consumer, excluding credit card |
Credit card | Wholesale | Total | |||||||||||||||||||||||||||||||||||||
| $ | 1,765 | $ | 10,250 | $ | 4,371 | $ | 16,386 | $ | 3,636 | $ | 17,800 | $ | 6,892 | $ | 28,328 | |||||||||||||||||||||||||||||
| NA | NA | NA | NA | NA | NA | NA | NA | |||||||||||||||||||||||||||||||||||||
| 812 | 3,192 | 322 | 4,326 | 630 | 3,651 | 283 | 4,564 | |||||||||||||||||||||||||||||||||||||
| (543) | (789) | (141) | (1,473) | (619) | (939) | (141) | (1,699) | |||||||||||||||||||||||||||||||||||||
| 269 | 2,403 | 181 | 2,853 | 11 | 2,712 | 142 | 2,865 | |||||||||||||||||||||||||||||||||||||
| 543 | 3,353 | 2,293 | 6,189 | (1,858) | (4,838) | (2,375) | (9,071) | |||||||||||||||||||||||||||||||||||||
| 1 | — | 3 | 4 | (2) | — | (4) | (6) | |||||||||||||||||||||||||||||||||||||
| $ | 2,040 | $ | 11,200 | $ | 6,486 | $ | 19,726 | $ | 1,765 | $ | 10,250 | $ | 4,371 | $ | 16,386 | |||||||||||||||||||||||||||||
| $ | 113 | $ | — | $ | 2,148 | $ | 2,261 | $ | 187 | $ | — | $ | 2,222 | $ | 2,409 | |||||||||||||||||||||||||||||
| NA | NA | NA | NA | NA | NA | NA | NA | |||||||||||||||||||||||||||||||||||||
| (37) | — | 157 | 120 | (75) | — | (74) | (149) | |||||||||||||||||||||||||||||||||||||
| — | — | 1 | 1 | 1 | — | — | 1 | |||||||||||||||||||||||||||||||||||||
| $ | 76 | $ | — | $ | 2,306 | $ | 2,382 | $ | 113 | $ | — | $ | 2,148 | $ | 2,261 | |||||||||||||||||||||||||||||
| NA | NA | NA | $ | 96 | NA | NA | NA | $ | 42 | |||||||||||||||||||||||||||||||||||
| $ | 2,116 | $ | 11,200 | $ | 8,792 | $ | 22,204 | $ | 1,878 | $ | 10,250 | $ | 6,519 | $ | 18,689 | |||||||||||||||||||||||||||||
| $ | (624) | $ | 223 | $ | 467 | $ | 66 | $ | (665) | $ | 313 | $ | 263 | $ | (89) | |||||||||||||||||||||||||||||
| 2,664 | 10,977 | 6,019 | 19,660 | 2,430 | 9,937 | 4,108 | 16,475 | |||||||||||||||||||||||||||||||||||||
| $ | 2,040 | $ | 11,200 | $ | 6,486 | $ | 19,726 | $ | 1,765 | $ | 10,250 | $ | 4,371 | $ | 16,386 | |||||||||||||||||||||||||||||
| $ | 11,978 | $ | 796 | $ | 2,189 | $ | 14,963 | $ | 13,919 | $ | 987 | $ | 2,255 | $ | 17,161 | |||||||||||||||||||||||||||||
| 288,775 | 184,379 | 601,481 | 1,074,635 | 281,637 | 153,309 | 558,099 | 993,045 | |||||||||||||||||||||||||||||||||||||
| $ | 300,753 | $ | 185,175 | $ | 603,670 | $ | 1,089,598 | $ | 295,556 | $ | 154,296 | $ | 560,354 | $ | 1,010,206 | |||||||||||||||||||||||||||||
| $ | (33) | $ | — | $ | 16 | $ | (17) | $ | 33 | $ | — | $ | 38 | $ | 71 | |||||||||||||||||||||||||||||
| 3,585 | — | 464 | 4,049 | 4,472 | — | 617 | 5,089 | |||||||||||||||||||||||||||||||||||||
| $ | — | $ | — | $ | 90 | $ | 90 | $ | — | $ | — | $ | 167 | $ | 167 | |||||||||||||||||||||||||||||
| 76 | — | 2,216 | 2,292 | 113 | — | 1,981 | 2,094 | |||||||||||||||||||||||||||||||||||||
| $ | 76 | $ | — | $ | 2,306 | $ | 2,382 | $ | 113 | $ | — | $ | 2,148 | $ | 2,261 | |||||||||||||||||||||||||||||
| $ | — | $ | — | $ | 455 | $ | 455 | $ | — | $ | — | $ | 764 | $ | 764 | |||||||||||||||||||||||||||||
| 20,423 | — | 461,688 | 482,111 | 29,588 | — | 453,571 | 483,159 | |||||||||||||||||||||||||||||||||||||
| $ | 20,423 | $ | — | $ | 462,143 | $ | 482,566 | $ | 29,588 | $ | — | $ | 454,335 | $ | 483,923 | |||||||||||||||||||||||||||||
JPMorgan Chase & Co./2023 Form 10-K |
259 |
|||||||
| Central case assumptions at December 31, 2023 |
|||||||||||
| 2Q24 | 4Q24 | 2Q25 | |||||||||
U.S. unemployment rate(a) |
4.1 | % | 4.4 | % | 4.1 | % | |||||
YoY growth in U.S. real GDP(b) |
1.8 | % | 0.7 | % | 1.0 | % | |||||
| Central case assumptions at December 31, 2022 |
|||||||||||
| 2Q23 | 4Q23 | 2Q24 | |||||||||
U.S. unemployment rate(a) |
3.8 | % | 4.3 | % | 5.0 | % | |||||
YoY growth in U.S. real GDP(b) |
1.5 | % | 0.4 | % | — | % | |||||
260 |
JPMorgan Chase & Co./2023 Form 10-K |
|||||||
| Line of Business | Transaction Type | Activity | 2023 Form 10-K page references |
||||||||
| CCB | Credit card securitization trusts | Securitization of originated credit card receivables | pages 261–262 | ||||||||
| Mortgage securitization trusts | Servicing and securitization of both originated and purchased residential mortgages | pages 262–264 | |||||||||
| CIB | Mortgage and other securitization trusts | Securitization of both originated and purchased residential and commercial mortgages, and other consumer loans | pages 262–264 | ||||||||
| Multi-seller conduits | Assisting clients in accessing the financial markets in a cost-efficient manner and structuring transactions to meet investor needs | page 264 | |||||||||
| Municipal bond vehicles | Financing of municipal bond investments | pages 264–265 | |||||||||
JPMorgan Chase & Co./2023 Form 10-K |
261 |
|||||||
| Principal amount outstanding | JPMorgan Chase interest in securitized assets in nonconsolidated VIEs(c)(d)(e) |
|||||||||||||||||||||||||
| December 31, 2023 (in millions) |
Total assets held by securitization VIEs | Assets held in consolidated securitization VIEs |
Assets held in nonconsolidated securitization VIEs with continuing involvement | Trading assets | Investment securities | Other financial assets | Total interests held by JPMorgan Chase | |||||||||||||||||||
Securitization-related(a) |
||||||||||||||||||||||||||
| Residential mortgage: | ||||||||||||||||||||||||||
| Prime/Alt-A and option ARMs | $ | 58,570 | $ | 675 | $ | 39,319 | $ | 595 | $ | 1,981 | $ | 60 | $ | 2,636 | ||||||||||||
| Subprime | 8,881 | — | 1,312 | 3 | — | — | 3 | |||||||||||||||||||
Commercial and other(b) |
168,042 | — | 120,262 | 831 | 5,638 | 1,354 | 7,823 | |||||||||||||||||||
| Total | $ | 235,493 | $ | 675 | $ | 160,893 | $ | 1,429 | $ | 7,619 | $ | 1,414 | $ | 10,462 | ||||||||||||
| Principal amount outstanding | JPMorgan Chase interest in securitized assets in nonconsolidated VIEs(c)(d)(e) |
|||||||||||||||||||||||||
| December 31, 2022 (in millions) |
Total assets held by securitization VIEs | Assets held in consolidated securitization VIEs |
Assets held in nonconsolidated securitization VIEs with continuing involvement | Trading assets | Investment securities | Other financial assets | Total interests held by JPMorgan Chase | |||||||||||||||||||
Securitization-related(a) |
||||||||||||||||||||||||||
| Residential mortgage: | ||||||||||||||||||||||||||
| Prime/Alt-A and option ARMs | $ | 55,362 | $ | 754 | $ | 37,058 | $ | 744 | $ | 1,918 | $ | — | $ | 2,662 | ||||||||||||
| Subprime | 9,709 | — | 1,743 | 10 | — | — | 10 | |||||||||||||||||||
Commercial and other(b) |
164,915 | — | 127,037 | 888 | 5,373 | 670 | 6,931 | |||||||||||||||||||
| Total | $ | 229,986 | $ | 754 | $ | 165,838 | $ | 1,642 | $ | 7,291 | $ | 670 | $ | 9,603 | ||||||||||||
262 |
JPMorgan Chase & Co./2023 Form 10-K |
|||||||
| Year ended December 31, (in millions) |
2023 | 2022 | 2021 | ||||||||||||||
Transfers of securities to VIEs |
|||||||||||||||||
| U.S. GSEs and government agencies | $ | 18,864 | $ | 16,128 | $ | 53,923 | |||||||||||
JPMorgan Chase & Co./2023 Form 10-K |
263 |
|||||||
| Nonconsolidated re-securitization VIEs |
|||||||||||
| December 31, (in millions) |
2023 | 2022 | |||||||||
U.S. GSEs and government agencies |
|||||||||||
Interest in VIEs |
$ | 3,371 | $ | 2,580 | |||||||
264 |
JPMorgan Chase & Co./2023 Form 10-K |
|||||||
| Assets | Liabilities | ||||||||||||||||||||||||||||
| December 31, 2023 (in millions) |
Trading assets | Loans | Other(b) |
Total
assets(c)
|
Beneficial interests in
VIE assets(d)
|
Other(e) |
Total liabilities |
||||||||||||||||||||||
| VIE program type | |||||||||||||||||||||||||||||
| Firm-sponsored credit card trusts | $ | — | $ | 9,460 | $ | 117 | $ | 9,577 | $ | 2,998 | $ | 6 | $ | 3,004 | |||||||||||||||
| Firm-administered multi-seller conduits | 1 | 27,372 | 194 | 27,567 | 17,781 | 30 | 17,811 | ||||||||||||||||||||||
| Municipal bond vehicles | 2,056 | — | 22 | 2,078 | 2,116 | 11 | 2,127 | ||||||||||||||||||||||
Mortgage securitization entities(a) |
— | 693 | 8 | 701 | 125 | 57 | 182 | ||||||||||||||||||||||
| Other | 113 | 86 | 250 | 449 | — | 159 | 159 | ||||||||||||||||||||||
| Total | $ | 2,170 | $ | 37,611 | $ | 591 | $ | 40,372 | $ | 23,020 | $ | 263 | $ | 23,283 | |||||||||||||||
| Assets | Liabilities | ||||||||||||||||||||||||||||
| December 31, 2022 (in millions) |
Trading assets | Loans | Other(b) |
Total
assets(c)
|
Beneficial interests in
VIE assets(d)
|
Other(e) |
Total liabilities |
||||||||||||||||||||||
| VIE program type | |||||||||||||||||||||||||||||
| Firm-sponsored credit card trusts | $ | — | $ | 9,699 | $ | 100 | $ | 9,799 | $ | 1,999 | $ | 2 | $ | 2,001 | |||||||||||||||
| Firm-administered multi-seller conduits | — | 22,819 | 170 | 22,989 | 9,236 | 39 | 9,275 | ||||||||||||||||||||||
| Municipal bond vehicles | 2,089 | — | 7 | 2,096 | 1,232 | 10 | 1,242 | ||||||||||||||||||||||
Mortgage securitization entities(a) |
— | 781 | 10 | 791 | 143 | 67 | 210 | ||||||||||||||||||||||
| Other | 62 | 1,112 | (f) |
263 | 1,437 | — | 161 | 161 | |||||||||||||||||||||
| Total | $ | 2,151 | $ | 34,411 | $ | 550 | $ | 37,112 | $ | 12,610 | $ | 279 | $ | 12,889 | |||||||||||||||
JPMorgan Chase & Co./2023 Form 10-K |
265 |
|||||||
266 |
JPMorgan Chase & Co./2023 Form 10-K |
|||||||
| 2023 | 2022 | 2021 | ||||||||||||||||||||||||
| Year ended December 31, (in millions) |
Residential mortgage(d) |
Commercial and other(e) |
Residential mortgage(d) |
Commercial and other(e) |
Residential mortgage(d) |
Commercial and other(e) |
||||||||||||||||||||
| Principal securitized | $ | 7,678 | $ | 3,901 | $ | 10,218 | $ | 9,036 | $ | 23,876 | $ | 14,917 | ||||||||||||||
All cash flows during the period:(a) |
||||||||||||||||||||||||||
Proceeds received from loan sales as financial instruments(b)(c) |
$ | 7,251 | $ | 3,896 | $ | 9,783 | $ | 8,921 | $ | 24,450 | $ | 15,044 | ||||||||||||||
| Servicing fees collected | 24 | 5 | 62 | 2 | 153 | 1 | ||||||||||||||||||||
Cash flows received on interests |
325 | 425 | 489 | 285 | 578 | 273 | ||||||||||||||||||||
| Year ended December 31, | 2023 | 2022 | 2021 | |||||||||||||||||
| Residential mortgage retained interest: | ||||||||||||||||||||
| Weighted-average life (in years) | 9.6 | 10.8 | 3.9 | |||||||||||||||||
| Weighted-average discount rate | 4.8 | % | 4.0 | % | 3.3 | % | ||||||||||||||
| Commercial mortgage retained interest: | ||||||||||||||||||||
| Weighted-average life (in years) | 3.0 | 5.9 | 6.0 | |||||||||||||||||
| Weighted-average discount rate | 4.6 | % | 2.9 | % | 1.2 | % | ||||||||||||||
JPMorgan Chase & Co./2023 Form 10-K |
267 |
|||||||
| Year ended December 31, (in millions) |
2023 | 2022 | 2021 | ||||||||
| Carrying value of loans sold | $ | 19,906 | $ | 48,891 | $ | 105,035 | |||||
Proceeds received from loan sales as cash |
$ | 300 | $ | 22 | $ | 161 | |||||
Proceeds from loan sales as securities(a)(b) |
19,389 | 48,096 | 103,286 | ||||||||
Total proceeds received from loan sales(c) |
$ | 19,689 | $ | 48,118 | $ | 103,447 | |||||
Gains/(losses) on loan sales(d)(e) |
$ | — | $ | (25) | $ | 9 | |||||
| December 31, (in millions) |
2023 | 2022 | ||||||
Loans repurchased or option to repurchase(a) |
$ | 597 | $ | 839 | ||||
Real estate owned |
8 | 10 | ||||||
Foreclosed government-guaranteed residential mortgage loans(b) |
22 | 27 | ||||||
| As of or for the year ended December 31, (in millions) |
Securitized assets | 90 days past due | Net liquidation losses / (recoveries) | ||||||||||||||||||||||||||
| 2023 | 2022 | 2023 | 2022 | 2023 | 2022 | ||||||||||||||||||||||||
| Securitized loans | |||||||||||||||||||||||||||||
| Residential mortgage: | |||||||||||||||||||||||||||||
| Prime/ Alt-A & option ARMs | $ | 39,319 | $ | 37,058 | $ | 440 | $ | 511 | $ | 14 | $ | (29) | |||||||||||||||||
| Subprime | 1,312 | 1,743 | 131 | 212 | 5 | (1) | |||||||||||||||||||||||
| Commercial and other | 120,262 | 127,037 | 2,874 | 948 | 60 | 50 | |||||||||||||||||||||||
| Total loans securitized | $ | 160,893 | $ | 165,838 | $ | 3,445 | $ | 1,671 | $ | 79 | $ | 20 | |||||||||||||||||
268 |
JPMorgan Chase & Co./2023 Form 10-K |
|||||||
| December 31, (in millions) | 2023 | 2022 | 2021 | ||||||||
| Consumer & Community Banking | $ | 32,116 | $ | 32,121 | $ | 31,474 | |||||
| Corporate & Investment Bank | 8,266 | 8,008 | 7,906 | ||||||||
| Commercial Banking | 2,985 | 2,985 | 2,986 | ||||||||
| Asset & Wealth Management | 8,582 | 7,902 | 7,222 | ||||||||
Corporate |
685 | 646 | 727 | ||||||||
| Total goodwill | $ | 52,634 | $ | 51,662 | $ | 50,315 | |||||
| Year ended December 31, (in millions) | 2023 | 2022 | 2021 | ||||||||
| Balance at beginning of period | $ | 51,662 | $ | 50,315 | $ | 49,248 | |||||
Changes during the period from: |
|||||||||||
Business combinations(a) |
917 | 1,426 | 1,073 | ||||||||
Other(b) |
55 | (79) | (6) | ||||||||
| Balance at December 31, | $ | 52,634 | $ | 51,662 | $ | 50,315 | |||||
JPMorgan Chase & Co./2023 Form 10-K |
269 |
|||||||
270 |
JPMorgan Chase & Co./2023 Form 10-K |
|||||||
| As of or for the year ended December 31, (in millions, except where otherwise noted) | 2023 | 2022 | 2021 | ||||||||||||||
| Fair value at beginning of period | $ | 7,973 | $ | 5,494 | $ | 3,276 | |||||||||||
| MSR activity: | |||||||||||||||||
| Originations of MSRs | 253 | 798 | 1,659 | ||||||||||||||
Purchase of MSRs(a) |
1,028 | 1,400 | 1,363 | ||||||||||||||
Disposition of MSRs(b) |
(188) | (822) | (114) | ||||||||||||||
| Net additions/(dispositions) | 1,093 | 1,376 | 2,908 | ||||||||||||||
Changes due to collection/realization of expected cash flows |
(1,011) | (936) | (788) | ||||||||||||||
| Changes in valuation due to inputs and assumptions: | |||||||||||||||||
Changes due to market interest rates and other(c) |
424 | 2,022 | 404 | ||||||||||||||
| Changes in valuation due to other inputs and assumptions: | |||||||||||||||||
Projected cash flows (e.g., cost to service) |
(22) | 14 | 109 | ||||||||||||||
Discount rates |
14 | — | — | ||||||||||||||
Prepayment model changes and other(d) |
51 | 3 | (415) | ||||||||||||||
| Total changes in valuation due to other inputs and assumptions | 43 | 17 | (306) | ||||||||||||||
| Total changes in valuation due to inputs and assumptions | 467 | 2,039 | 98 | ||||||||||||||
| Fair value at December 31, | $ | 8,522 | $ | 7,973 | $ | 5,494 | |||||||||||
Change in unrealized gains/(losses) included in income related to MSRs held at December 31, |
$ | 467 | $ | 2,039 | $ | 98 | |||||||||||
| Contractual service fees, late fees and other ancillary fees included in income | 1,590 | 1,535 | 1,298 | ||||||||||||||
| Third-party mortgage loans serviced at December 31, (in billions) | 632 | 584 | 520 | ||||||||||||||
Servicer advances, net of an allowance for uncollectible amounts, at December 31(e) |
659 | 758 | 1,611 | ||||||||||||||
JPMorgan Chase & Co./2023 Form 10-K |
271 |
|||||||
| Year ended December 31, (in millions) |
2023 | 2022 | 2021 | ||||||||||||||
CCB mortgage fees and related income |
|||||||||||||||||
| Production revenue | $ | 421 | $ | 497 | $ | 2,215 | |||||||||||
| Net mortgage servicing revenue: | |||||||||||||||||
| Operating revenue: | |||||||||||||||||
| Loan servicing revenue | 1,634 | 1,582 | 1,257 | ||||||||||||||
Changes in MSR asset fair value due to collection/realization of expected cash flows |
(1,011) | (936) | (788) | ||||||||||||||
| Total operating revenue | 623 | 646 | 469 | ||||||||||||||
| Risk management: | |||||||||||||||||
Changes in MSR asset fair value due to market interest rates and other(a) |
424 | 2,022 | 404 | ||||||||||||||
Other changes in MSR asset fair value due to other inputs and assumptions in model(b) |
43 | 17 | (306) | ||||||||||||||
Change in derivative fair value and other |
(336) | (1,946) | (623) | ||||||||||||||
| Total risk management | 131 | 93 | (525) | ||||||||||||||
| Total net mortgage servicing revenue | 754 | 739 | (56) | ||||||||||||||
| Total CCB mortgage fees and related income | 1,175 | 1,236 | 2,159 | ||||||||||||||
| All other | 1 | 14 | 11 | ||||||||||||||
Mortgage fees and related income |
$ | 1,176 | $ | 1,250 | $ | 2,170 | |||||||||||
| December 31, (in millions, except rates) |
2023 | 2022 | |||||||||
Weighted-average prepayment speed assumption (constant prepayment rate) |
6.29 | % | 6.12 | % | |||||||
Impact on fair value of 10% adverse change |
$ | (206) | $ | (183) | |||||||
Impact on fair value of 20% adverse change |
(401) | (356) | |||||||||
Weighted-average option adjusted spread(a) |
6.10 | % | 5.77 | % | |||||||
Impact on fair value of 100 basis points adverse change |
$ | (369) | $ | (341) | |||||||
Impact on fair value of 200 basis points adverse change |
(709) | (655) | |||||||||
272 |
JPMorgan Chase & Co./2023 Form 10-K |
|||||||
| December 31, (millions) | Finite-lived intangible assets | ||||
| 2024 | $ | 330 | |||
| 2025 | 294 | ||||
| 2026 | 290 | ||||
| 2027 | 288 | ||||
| 2028 | 272 | ||||
JPMorgan Chase & Co./2023 Form 10-K |
273 |
|||||||
| December 31, (in millions) | 2023 | 2022 | ||||||||||||
Land, buildings and leasehold improvements |
$ | 14,862 | $ | 13,486 | ||||||||||
Right-of-use assets(a) |
7,917 | 7,432 | ||||||||||||
Other premises and equipment(b) |
7,378 | 6,816 | ||||||||||||
Total premises and equipment |
$ | 30,157 | $ | 27,734 | ||||||||||
| December 31, (in millions) | 2023 | 2022 | |||||||||
| U.S. offices | |||||||||||
Noninterest-bearing (included $75,393 and $26,363 at fair value)(a) |
$ | 643,748 | $ | 644,902 | |||||||
Interest-bearing (included $573 and $586 at fair value)(a) |
1,303,100 | 1,276,346 | |||||||||
| Total deposits in U.S. offices | 1,946,848 | 1,921,248 | |||||||||
| Non-U.S. offices | |||||||||||
Noninterest-bearing (included $1,737 and $1,398 at fair value)(a) |
23,097 | 27,005 | |||||||||
Interest-bearing (included $681 and $273 at fair value)(a) |
430,743 | 391,926 | |||||||||
| Total deposits in non-U.S. offices | 453,840 | 418,931 | |||||||||
| Total deposits | $ | 2,400,688 | $ | 2,340,179 | |||||||
| December 31, (in millions) | 2023 | 2022 | ||||||||||||
| U.S. offices | $ | 132,654 | $ | 64,622 | ||||||||||
Non-U.S. offices(a) |
90,187 | 77,907 | ||||||||||||
| Total | $ | 222,841 | $ | 142,529 | ||||||||||
|
December 31,
(in millions)
|
||||||||||||||||||||
| U.S. | Non-U.S. | Total | ||||||||||||||||||
| 2024 | $ | 194,895 | $ | 86,971 | $ | 281,866 | ||||||||||||||
| 2025 | 742 | 180 | 922 | |||||||||||||||||
| 2026 | 243 | 21 | 264 | |||||||||||||||||
| 2027 | 140 | 35 | 175 | |||||||||||||||||
| 2028 | 136 | 992 | 1,128 | |||||||||||||||||
| After 5 years | 475 | 251 | 726 | |||||||||||||||||
| Total | $ | 196,631 | $ | 88,450 | $ | 285,081 | ||||||||||||||
274 |
JPMorgan Chase & Co./2023 Form 10-K |
|||||||
| December 31, (in millions, except where otherwise noted) |
|||||||||||
| 2023 | 2022 | ||||||||||
| Right-of-use assets | $ | 8,431 | (a) |
$ | 7,782 | ||||||
| Lease liabilities | 8,833 | (b) |
8,183 | ||||||||
| Weighted average remaining lease term (in years) | 8.4 | 8.4 | |||||||||
| Weighted average discount rate | 4.01 | % | 3.55 | % | |||||||
| Supplemental cash flow information | |||||||||||
| Cash paid for amounts included in the measurement of lease liabilities - operating cash flows | $ | 1,662 | $ | 1,613 | |||||||
| Supplemental non-cash information | |||||||||||
| Right-of-use assets obtained in exchange for operating lease obligations | $ | 2,094 | $ | 1,435 | |||||||
| Year ended December 31, (in millions) |
2023 | 2022 | ||||||
| Rental expense | ||||||||
| Gross rental expense | $ | 2,079 | $ | 2,079 | ||||
| Sublease rental income | (72) | (119) | ||||||
| Net rental expense | $ | 2,007 | $ | 1,960 | ||||
| Year ended December 31, (in millions) | |||||
| 2024 | $ | 1,685 | |||
| 2025 | 1,576 | ||||
| 2026 | 1,318 | ||||
| 2027 | 1,169 | ||||
| 2028 | 1,015 | ||||
| After 2028 | 3,767 | ||||
| Total future minimum lease payments | 10,530 | ||||
| Less: Imputed interest | (1,697) | ||||
| Total | $ | 8,833 | |||
JPMorgan Chase & Co./2023 Form 10-K |
275 |
|||||||
| December 31, (in millions) |
2023 | 2022 | |||||||||
Carrying value of assets subject to operating leases, net of accumulated depreciation |
$ | 10,663 | $ | 12,302 | |||||||
Accumulated depreciation |
3,288 | 4,282 | |||||||||
|
Year ended December 31, (in millions) |
2023 | 2022 | 2021 | |||||||||||
| Operating lease income | $ | 2,843 | $ | 3,654 | $ | 4,914 | ||||||||
| Depreciation expense | 1,778 | 2,475 | 3,380 | |||||||||||
| Year ended December 31, (in millions) | |||||
| 2024 | $ | 1,868 | |||
| 2025 | 1,158 | ||||
| 2026 | 451 | ||||
| 2027 | 32 | ||||
| 2028 | 9 | ||||
| After 2028 | 8 | ||||
| Total future minimum lease receipts | $ | 3,526 | |||
276 |
JPMorgan Chase & Co./2023 Form 10-K |
|||||||
| December 31, (in millions) | 2023 | 2022 | ||||||||||||
| Brokerage payables | $ | 161,960 | $ | 188,692 | ||||||||||
Other payables and liabilities(a) |
128,347 | 111,449 | ||||||||||||
Total accounts payable and other liabilities |
$ | 290,307 | $ | 300,141 | ||||||||||
JPMorgan Chase & Co./2023 Form 10-K |
277 |
|||||||
| By remaining maturity at December 31, (in millions, except rates) |
2023 | 2022 | |||||||||||||||||||||||||||||||||
| Under 1 year | 1-5 years | After 5 years | Total | Total | |||||||||||||||||||||||||||||||
| Parent company | |||||||||||||||||||||||||||||||||||
| Senior debt: | Fixed rate | $ | 5,981 | $ | 86,113 | $ | 108,890 | $ | 200,984 | $ | 194,515 | ||||||||||||||||||||||||
| Variable rate | 131 | 5,989 | 1,985 | 8,105 | 11,565 | ||||||||||||||||||||||||||||||
Interest rates(f) |
2.52 | % | 2.91 | % | 3.72 | % | 3.32 | % | 3.06 | % | |||||||||||||||||||||||||
| Subordinated debt: | Fixed rate | $ | 2,976 | $ | 5,886 | $ | 8,863 | $ | 17,725 | $ | 19,693 | ||||||||||||||||||||||||
| Variable rate | — | — | — | — | — | ||||||||||||||||||||||||||||||
Interest rates(f) |
3.88 | % | 4.88 | % | 4.69 | % | 4.62 | % | 4.50 | % | |||||||||||||||||||||||||
| Subtotal | $ | 9,088 | $ | 97,988 | $ | 119,738 | $ | 226,814 | $ | 225,773 | |||||||||||||||||||||||||
| Subsidiaries | |||||||||||||||||||||||||||||||||||
| Federal Home Loan Banks advances: | Fixed rate | $ | 13,940 | $ | 9,269 | $ | 37 | $ | 23,246 | (g) |
$ | 93 | |||||||||||||||||||||||
| Variable rate | 4,000 | 14,000 | — | 18,000 | 11,000 | ||||||||||||||||||||||||||||||
Interest rates(f) |
4.59 | % | 5.12 | % | 6.06 | % | 4.89 | % | 4.32 | % | |||||||||||||||||||||||||
Purchase Money Note(a): |
Fixed rate | $ | — | $ | 48,989 | $ | — | $ | 48,989 | NA | |||||||||||||||||||||||||
Interest rates(f) |
— | % | 3.40 | % | — | % | 3.40 | % | NA | ||||||||||||||||||||||||||
| Senior debt: | Fixed rate | $ | 2,958 | $ | 11,551 | $ | 6,236 | $ | 20,745 | $ | 15,383 | ||||||||||||||||||||||||
| Variable rate | 20,933 | 25,336 | 5,779 | 52,048 | 41,506 | ||||||||||||||||||||||||||||||
Interest rates(f) |
4.28 | % | 5.41% | 1.48 | % | 3.91 | % | 2.02 | % | ||||||||||||||||||||||||||
| Subordinated debt: | Fixed rate | $ | 255 | $ | — | $ | — | $ | 255 | $ | 262 | ||||||||||||||||||||||||
| Variable rate | — | — | — | — | — | ||||||||||||||||||||||||||||||
Interest rates(f) |
8.25 | % | — | % | — | % | 8.25 | % | 8.25 | % | |||||||||||||||||||||||||
| Subtotal | $ | 42,086 | $ | 109,145 | $ | 12,052 | $ | 163,283 | $ | 68,244 | |||||||||||||||||||||||||
| Junior subordinated debt: | Fixed rate | $ | — | $ | — | $ | 518 | $ | 518 | $ | 550 | ||||||||||||||||||||||||
| Variable rate | — | 420 | 790 | 1,210 | 1,298 | ||||||||||||||||||||||||||||||
Interest rates(f) |
— | % | 6.18 | % | 7.45 | % | 7.14 | % | 6.33 | % | |||||||||||||||||||||||||
| Subtotal | $ | — | $ | 420 | $ | 1,308 | $ | 1,728 | $ | 1,848 | |||||||||||||||||||||||||
Total long-term debt(b)(c)(d) |
$ | 51,174 | $ | 207,553 | $ | 133,098 | $ | 391,825 | (h)(i) |
$ | 295,865 | ||||||||||||||||||||||||
| Long-term beneficial interests: | |||||||||||||||||||||||||||||||||||
| Fixed rate | $ | — | $ | 2,998 | $ | — | $ | 2,998 | $ | 1,999 | |||||||||||||||||||||||||
| Variable rate | — | — | 125 | 125 | 143 | ||||||||||||||||||||||||||||||
Interest rates(f) |
— | % | 4.74 | % | 3.45 | % | 4.69 | % | 2.81 | % | |||||||||||||||||||||||||
Total long-term beneficial interests(e) |
$ | — | $ | 2,998 | $ | 125 | $ | 3,123 | $ | 2,142 | |||||||||||||||||||||||||
278 |
JPMorgan Chase & Co./2023 Form 10-K |
|||||||
JPMorgan Chase & Co./2023 Form 10-K |
279 |
|||||||
Shares(a) |
Carrying value (in millions) |
Issue date |
Contractual rate
in effect at
December 31, 2023
|
Earliest redemption date(b) |
Floating annualized
rate(c)
|
Dividend declared per share(d) |
||||||||||||||||||||||||||||||||||||||
| December 31, | December 31, | Year ended December 31, | ||||||||||||||||||||||||||||||||||||||||||
| 2023 | 2022 | 2023 | 2022 | 2023 | 2022 | 2021 | ||||||||||||||||||||||||||||||||||||||
Fixed-rate: |
||||||||||||||||||||||||||||||||||||||||||||
Series AA |
— | — | $ | — | $ | — | 6/4/2015 | — | % | 9/1/2020 | NA | $ | — | $ | — | $ | 305.00 | |||||||||||||||||||||||||||
Series BB |
— | — | — | — | 7/29/2015 | — | 9/1/2020 | NA | — | — | 307.50 | |||||||||||||||||||||||||||||||||
Series DD |
169,625 | 169,625 | 1,696 | 1,696 | 9/21/2018 | 5.750 | 12/1/2023 | NA | 575.00 | 575.00 | 575.00 | |||||||||||||||||||||||||||||||||
Series EE |
185,000 | 185,000 | 1,850 | 1,850 | 1/24/2019 | 6.000 | 3/1/2024 | NA | 600.00 | 600.00 | 600.00 | |||||||||||||||||||||||||||||||||
Series GG |
90,000 | 90,000 | 900 | 900 | 11/7/2019 | 4.750 | 12/1/2024 | NA | 475.00 | 475.00 | 475.00 | |||||||||||||||||||||||||||||||||
| Series JJ | 150,000 | 150,000 | 1,500 | 1,500 | 3/17/2021 | 4.550 | 6/1/2026 | NA | 455.00 | 455.00 | 321.03 | (e) |
||||||||||||||||||||||||||||||||
| Series LL | 185,000 | 185,000 | 1,850 | 1,850 | 5/20/2021 | 4.625 | 6/1/2026 | NA | 462.52 | 462.52 | 245.39 | (e) |
||||||||||||||||||||||||||||||||
| Series MM | 200,000 | 200,000 | 2,000 | 2,000 | 7/29/2021 | 4.200 | 9/1/2026 | NA | 420.00 | 420.00 | 142.33 | (e) |
||||||||||||||||||||||||||||||||
Fixed-to-floating rate: |
||||||||||||||||||||||||||||||||||||||||||||
Series I |
— | — | $ | — | $ | — | 4/23/2008 | — | % | 4/30/2018 | — | % | $ | — | $ | 375.03 | $ | 370.38 | ||||||||||||||||||||||||||
Series Q |
150,000 | 150,000 | 1,500 | 1,500 | 4/23/2013 | SOFR + 3.25 |
5/1/2023 | SOFR + 3.25 |
801.41 | 515.00 | 515.00 | (f) |
||||||||||||||||||||||||||||||||
Series R |
150,000 | 150,000 | 1,500 | 1,500 | 7/29/2013 | SOFR + 3.30 |
8/1/2023 | SOFR + 3.30 |
756.73 | 600.00 | 600.00 | (g) |
||||||||||||||||||||||||||||||||
| Series S | 200,000 | 200,000 | 2,000 | 2,000 | 1/22/2014 | 6.750 | 2/1/2024 | SOFR + 3.78 |
675.00 | 675.00 | 675.00 | |||||||||||||||||||||||||||||||||
Series U |
100,000 | 100,000 | 1,000 | 1,000 | 3/10/2014 | 6.125 | 4/30/2024 | SOFR + 3.33 |
612.50 | 612.50 | 612.50 | |||||||||||||||||||||||||||||||||
| Series V | — | — | — | — | 6/9/2014 | — | 7/1/2019 | — | — | 340.91 | 353.65 | |||||||||||||||||||||||||||||||||
Series X |
160,000 | 160,000 | 1,600 | 1,600 | 9/23/2014 | 6.100 | 10/1/2024 | SOFR + 3.33 |
610.00 | 610.00 | 610.00 | |||||||||||||||||||||||||||||||||
Series Z |
— | — | — | — | 4/21/2015 | — | 5/1/2020 | — | — | — | 401.44 | |||||||||||||||||||||||||||||||||
Series CC |
125,750 | 125,750 | 1,258 | 1,258 | 10/20/2017 | SOFR + 2.58 |
11/1/2022 | SOFR + 2.58 |
804.08 | 526.27 | 462.50 | (h) |
||||||||||||||||||||||||||||||||
Series FF |
225,000 | 225,000 | 2,250 | 2,250 | 7/31/2019 | 5.000 | 8/1/2024 | SOFR + 3.38 |
500.00 | 500.00 | 500.00 | |||||||||||||||||||||||||||||||||
| Series HH | 300,000 | 300,000 | 3,000 | 3,000 | 1/23/2020 | 4.600 | 2/1/2025 | SOFR + 3.125 |
460.00 | 460.00 | 460.00 | |||||||||||||||||||||||||||||||||
| Series II | 150,000 | 150,000 | 1,500 | 1,500 | 2/24/2020 | 4.000 | 4/1/2025 | SOFR + 2.745 |
400.00 | 400.00 | 400.00 | |||||||||||||||||||||||||||||||||
| Series KK | 200,000 | 200,000 | 2,000 | 2,000 | 5/12/2021 | 3.650 | 6/1/2026 | CMT + 2.85 |
365.00 | 365.00 | 201.76 | (e) |
||||||||||||||||||||||||||||||||
| Total preferred stock | 2,740,375 | 2,740,375 | $ | 27,404 | $ | 27,404 | ||||||||||||||||||||||||||||||||||||||
280 |
JPMorgan Chase & Co./2023 Form 10-K |
|||||||
JPMorgan Chase & Co./2023 Form 10-K |
281 |
|||||||
| Year ended December 31, (in millions) |
2023 | 2022 | 2021 | ||||||||
Total issued – balance at January 1 |
4,104.9 | 4,104.9 | 4,104.9 | ||||||||
| Treasury – balance at January 1 | (1,170.7) | (1,160.8) | (1,055.5) | ||||||||
| Repurchase | (69.5) | (23.1) | (119.7) | ||||||||
| Reissuance: | |||||||||||
Employee benefits and compensation plans |
10.9 | 12.0 | 13.5 | ||||||||
Employee stock purchase plans |
1.0 | 1.2 | 0.9 | ||||||||
| Total reissuance | 11.9 | 13.2 | 14.4 | ||||||||
Total treasury – balance at December 31 |
(1,228.3) | (1,170.7) | (1,160.8) | ||||||||
| Outstanding at December 31 | 2,876.6 | 2,934.2 | 2,944.1 | ||||||||
| Year ended December 31, (in millions) |
2023 | 2022(b) |
2021(c) |
|||||||||||
| Total number of shares of common stock repurchased | 69.5 | 23.1 | 119.7 | |||||||||||
Aggregate purchase price of common stock repurchases(a) |
$ | 9,898 | $ | 3,122 | $ | 18,448 | ||||||||
282 |
JPMorgan Chase & Co./2023 Form 10-K |
|||||||
| Year ended December 31, (in millions, except per share amounts) |
2023 | 2022 | 2021 | ||||||||
| Basic earnings per share | |||||||||||
| Net income | $ | 49,552 | $ | 37,676 | $ | 48,334 | |||||
| Less: Preferred stock dividends | 1,501 | 1,595 | 1,600 | ||||||||
Net income applicable to common equity |
48,051 | 36,081 | 46,734 | ||||||||
Less: Dividends and undistributed earnings allocated to participating securities |
291 | 189 | 231 | ||||||||
Net income applicable to common stockholders |
$ | 47,760 | $ | 35,892 | $ | 46,503 | |||||
Total weighted-average basic shares outstanding |
2,938.6 | 2,965.8 | 3,021.5 | ||||||||
| Net income per share | $ | 16.25 | $ | 12.10 | $ | 15.39 | |||||
| Diluted earnings per share | |||||||||||
Net income applicable to common stockholders |
$ | 47,760 | $ | 35,892 | $ | 46,503 | |||||
Total weighted-average basic shares outstanding |
2,938.6 | 2,965.8 | 3,021.5 | ||||||||
| Add: Dilutive impact of unvested PSUs, nondividend-earning RSUs and SARs | 4.5 | 4.2 | 5.1 | ||||||||
Total weighted-average diluted shares outstanding |
2,943.1 | 2,970.0 | 3,026.6 | ||||||||
| Net income per share | $ | 16.23 | $ | 12.09 | $ | 15.36 | |||||
JPMorgan Chase & Co./2023 Form 10-K |
283 |
|||||||
| Year ended December 31, (in millions) |
Unrealized gains/(losses) on investment securities |
Translation adjustments, net of hedges | Fair value hedges |
Cash flow hedges | Defined benefit pension and OPEB plans | DVA on fair value option elected liabilities | Accumulated other comprehensive income/(loss) | |||||||||||||||||||||||||||||||||||||||||||||||||||||||
| Balance at December 31, 2020 | $ | 8,180 | $ | (473) | $ | (112) | $ | 2,383 | $ | (1,132) | $ | (860) | $ | 7,986 | ||||||||||||||||||||||||||||||||||||||||||||||||
| Net change | (5,540) | (461) | (19) | (2,679) | 922 | (293) | (8,070) | |||||||||||||||||||||||||||||||||||||||||||||||||||||||
| Balance at December 31, 2021 | $ | 2,640 | (a) |
$ | (934) | $ | (131) | $ | (296) | $ | (210) | $ | (1,153) | $ | (84) | |||||||||||||||||||||||||||||||||||||||||||||||
| Net change | (11,764) | (611) | 98 | (5,360) | (1,241) | 1,621 | (17,257) | |||||||||||||||||||||||||||||||||||||||||||||||||||||||
| Balance at December 31, 2022 | $ | (9,124) | (a) |
$ | (1,545) | $ | (33) | $ | (5,656) | $ | (1,451) | $ | 468 | $ | (17,341) | |||||||||||||||||||||||||||||||||||||||||||||||
| Net change | 5,381 | 329 | (101) | 1,724 | 373 | (808) | 6,898 | |||||||||||||||||||||||||||||||||||||||||||||||||||||||
| Balance at December 31, 2023 | $ | (3,743) | (a) |
$ | (1,216) | $ | (134) | $ | (3,932) | $ | (1,078) | $ | (340) | $ | (10,443) | |||||||||||||||||||||||||||||||||||||||||||||||
| 2023 | 2022 | 2021 | |||||||||||||||||||||||||||||||||||||||||||||||||||
| Year ended December 31, (in millions) | Pre-tax | Tax effect | After-tax | Pre-tax | Tax effect | After-tax | Pre-tax | Tax effect | After-tax | ||||||||||||||||||||||||||||||||||||||||||||
Unrealized gains/(losses) on investment securities: |
|||||||||||||||||||||||||||||||||||||||||||||||||||||
Net unrealized gains/(losses) arising during the period |
$ | 3,891 | $ | (922) | $ | 2,969 | $ | (17,862) | $ | 4,290 | $ | (13,572) | $ | (7,634) | $ | 1,832 | $ | (5,802) | |||||||||||||||||||||||||||||||||||
Reclassification adjustment for realized (gains)/losses included in net income(a) |
3,180 | (768) | 2,412 | 2,380 | (572) | 1,808 | 345 | (83) | 262 | ||||||||||||||||||||||||||||||||||||||||||||
| Net change | 7,071 | (1,690) | 5,381 | (15,482) | 3,718 | (11,764) | (7,289) | 1,749 | (5,540) | ||||||||||||||||||||||||||||||||||||||||||||
Translation adjustments(b): |
|||||||||||||||||||||||||||||||||||||||||||||||||||||
| Translation | 1,714 | (95) | 1,619 | (3,574) | 265 | (3,309) | (2,447) | 125 | (2,322) | ||||||||||||||||||||||||||||||||||||||||||||
| Hedges | (1,697) | 407 | (1,290) | 3,553 | (855) | 2,698 | 2,452 | (591) | 1,861 | ||||||||||||||||||||||||||||||||||||||||||||
| Net change | 17 | 312 | 329 | (21) | (590) | (611) | 5 | (466) | (461) | ||||||||||||||||||||||||||||||||||||||||||||
Fair value hedges, net change(c): |
(134) | 33 | (101) | 130 | (32) | 98 | (26) | 7 | (19) | ||||||||||||||||||||||||||||||||||||||||||||
Cash flow hedges: |
|||||||||||||||||||||||||||||||||||||||||||||||||||||
Net unrealized gains/(losses) arising during the period |
483 | (114) | 369 | (7,473) | 1,794 | (5,679) | (2,303) | 553 | (1,750) | ||||||||||||||||||||||||||||||||||||||||||||
Reclassification adjustment for realized (gains)/losses included in net income(d) |
1,775 | (420) | 1,355 | 420 | (101) | 319 | (1,222) | 293 | (929) | ||||||||||||||||||||||||||||||||||||||||||||
| Net change | 2,258 | (534) | 1,724 | (7,053) | 1,693 | (5,360) | (3,525) | 846 | (2,679) | ||||||||||||||||||||||||||||||||||||||||||||
Defined benefit pension and OPEB plans, net change(e): |
421 | (48) | 373 | (1,459) | 218 | (1,241) | 1,129 | (207) | 922 | ||||||||||||||||||||||||||||||||||||||||||||
DVA on fair value option elected liabilities, net change: |
(1,066) | 258 | (808) | 2,141 | (520) | 1,621 | (393) | 100 | (293) | ||||||||||||||||||||||||||||||||||||||||||||
| Total other comprehensive income/(loss) | $ | 8,567 | $ | (1,669) | $ | 6,898 | $ | (21,744) | $ | 4,487 | $ | (17,257) | $ | (10,099) | $ | 2,029 | $ | (8,070) | |||||||||||||||||||||||||||||||||||
284 |
JPMorgan Chase & Co./2023 Form 10-K |
|||||||
| Effective tax rate | ||||||||||||||||||||
| Year ended December 31, | 2023 | 2022 | 2021 | |||||||||||||||||
| Statutory U.S. federal tax rate | 21.0 | % | 21.0 | % | 21.0 | % | ||||||||||||||
Increase/(decrease) in tax rate resulting from: |
||||||||||||||||||||
U.S. state and local income taxes, net of U.S. federal income tax benefit |
2.8 | 3.5 | 3.0 | |||||||||||||||||
Tax-exempt income |
(0.9) | (0.9) | (0.9) | |||||||||||||||||
Non-U.S. earnings |
1.5 | 0.4 | 0.1 | |||||||||||||||||
Business tax credits |
(4.4) | (5.4) | (4.2) | |||||||||||||||||
Other, net |
(0.4) | (0.2) | (0.1) | |||||||||||||||||
| Effective tax rate | 19.6 | % | (a) |
18.4 | % | 18.9 | % | |||||||||||||
| Income tax expense/(benefit) | ||||||||||||||||||||
| Year ended December 31, (in millions) |
2023 | 2022 | 2021 | |||||||||||||||||
| Current income tax expense/(benefit) | ||||||||||||||||||||
| U.S. federal | $ | 8,973 | $ | 5,606 | $ | 2,865 | ||||||||||||||
| Non-U.S. | 4,355 | 2,992 | 2,718 | |||||||||||||||||
| U.S. state and local | 3,266 | 2,630 | 1,897 | |||||||||||||||||
Total current income tax expense/(benefit) |
16,594 | 11,228 | 7,480 | |||||||||||||||||
Deferred income tax expense/(benefit) |
||||||||||||||||||||
| U.S. federal | (3,475) | (2,004) | 3,460 | |||||||||||||||||
| Non-U.S. | 35 | (154) | (101) | |||||||||||||||||
| U.S. state and local | (1,094) | (580) | 389 | |||||||||||||||||
Total deferred income tax expense/(benefit) |
(4,534) | (2,738) | 3,748 | |||||||||||||||||
Total income tax expense |
$ | 12,060 | $ | 8,490 | $ | 11,228 | ||||||||||||||
| Year ended December 31, (in millions) |
2023 | 2022 | 2021 | |||||||||||||||||
| U.S. | $ | 46,868 | $ | 34,626 | $ | 50,126 | ||||||||||||||
Non-U.S.(a) |
14,744 | 11,540 | 9,436 | |||||||||||||||||
Income before income tax expense |
$ | 61,612 | $ | 46,166 | $ | 59,562 | ||||||||||||||
JPMorgan Chase & Co./2023 Form 10-K |
285 |
|||||||
| December 31, (in millions) | 2023 | 2022 | ||||||||||||
| Deferred tax assets | ||||||||||||||
| Allowance for loan losses | $ | 5,809 | $ | 5,193 | ||||||||||
| Employee benefits | 1,247 | 1,342 | ||||||||||||
Accrued expenses and other |
9,887 | (a) |
8,577 | |||||||||||
| Non-U.S. operations | 860 | 1,148 | ||||||||||||
| Tax attribute carryforwards | 290 | 365 | ||||||||||||
| Gross deferred tax assets | 18,093 | 16,625 | ||||||||||||
| Valuation allowance | (183) | (198) | ||||||||||||
Deferred tax assets, net of valuation allowance |
$ | 17,910 | $ | 16,427 | ||||||||||
| Deferred tax liabilities | ||||||||||||||
| Depreciation and amortization | $ | 779 | $ | 2,044 | ||||||||||
Mortgage servicing rights, net of hedges |
1,794 | 1,864 | ||||||||||||
| Leasing transactions | 2,254 | 2,843 | ||||||||||||
| Other, net | 2,935 | 3,801 | ||||||||||||
| Gross deferred tax liabilities | 7,762 | 10,552 | ||||||||||||
Net deferred tax assets |
$ | 10,148 | $ | 5,875 | ||||||||||
286 |
JPMorgan Chase & Co./2023 Form 10-K |
|||||||
| Year ended December 31, (in millions) |
2023 | 2022 | 2021 | |||||||||||||||||
| Balance at January 1, | $ | 5,043 | $ | 4,636 | $ | 4,250 | ||||||||||||||
Increases based on tax positions related to the current period |
1,440 | 1,234 | 798 | |||||||||||||||||
Increases based on tax positions related to prior periods |
37 | 123 | 393 | |||||||||||||||||
Decreases based on tax positions related to prior periods |
(1,110) | (824) | (657) | |||||||||||||||||
Decreases related to cash settlements with taxing authorities |
(9) | (126) | (148) | |||||||||||||||||
| Balance at December 31, | $ | 5,401 | $ | 5,043 | $ | 4,636 | ||||||||||||||
| Periods under examination | Status | |||||||||||||
JPMorgan Chase – U.S. |
2011 – 2013 | Field examination of amended returns; certain matters at Appellate level |
||||||||||||
JPMorgan Chase – U.S. |
2014 - 2020 |
Field examination of original and amended returns; certain matters at Appellate level |
||||||||||||
JPMorgan Chase – New York State |
2012 - 2014 | Field Examination | ||||||||||||
JPMorgan Chase – New York City |
2015 - 2017 | Field Examination | ||||||||||||
JPMorgan Chase – U.K. |
2011 – 2020 | Field examination of certain select entities | ||||||||||||
JPMorgan Chase & Co./2023 Form 10-K |
287 |
|||||||
| December 31, (in billions) | 2023 | 2022 | ||||||
Segregated for the benefit of securities and cleared derivative customers |
10.3 | 18.7 | ||||||
Cash reserves at non-U.S. central banks and held for other general purposes |
9.3 | 8.1 | ||||||
Total restricted cash(a) |
$ | 19.6 | $ | 26.8 | ||||
288 |
JPMorgan Chase & Co./2023 Form 10-K |
|||||||
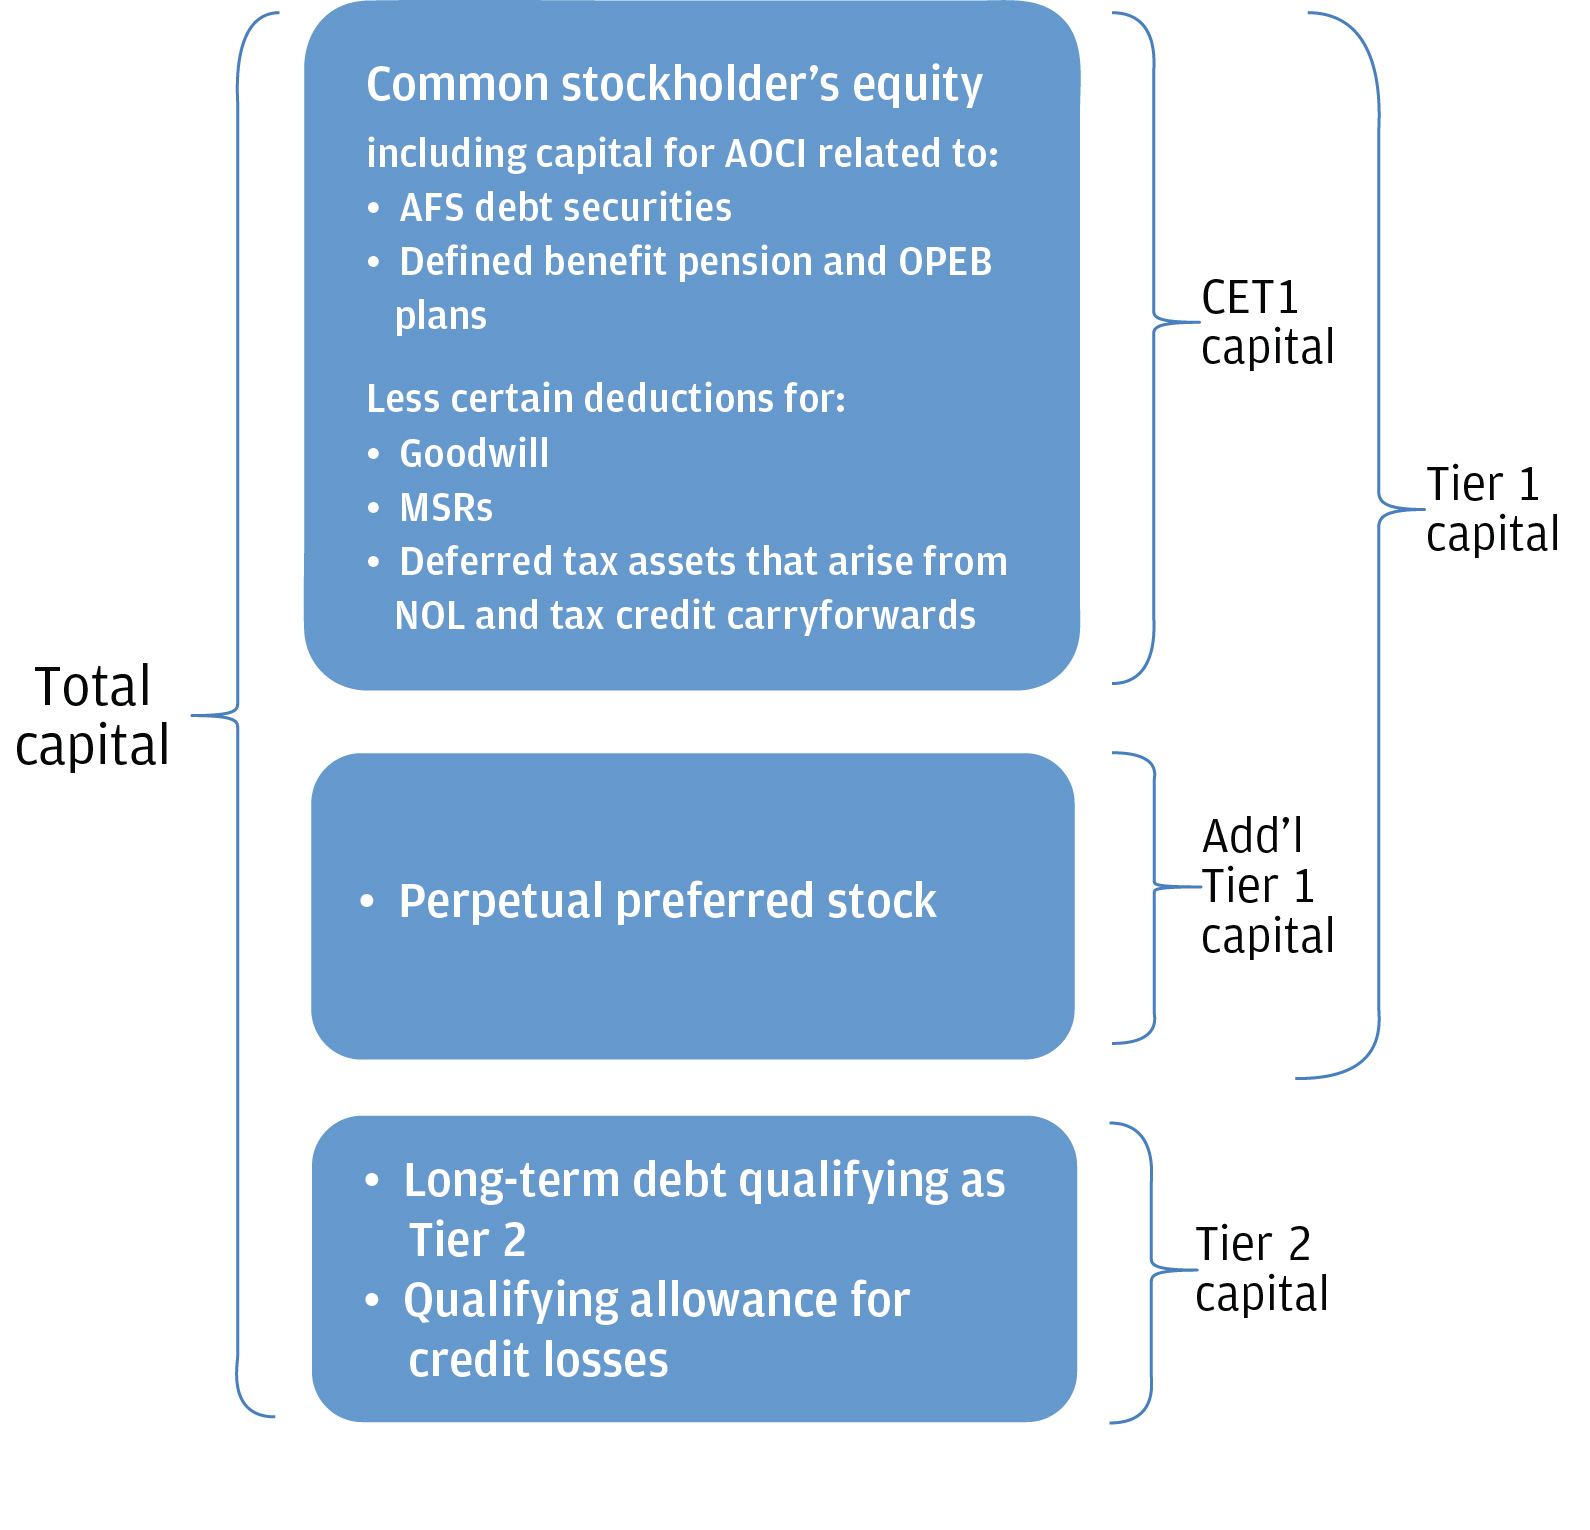
Standardized capital ratio requirements |
Advanced capital ratio requirements |
Well-capitalized ratios | ||||||||||||||||||
BHC(a)(b) |
IDI(c) |
BHC(a)(b) |
IDI(c) |
BHC(d) |
IDI(e) |
|||||||||||||||
| Risk-based capital ratios | ||||||||||||||||||||
| CET1 capital | 11.4 | % | 7.0 | % | 11.0 | % | 7.0 | % | NA | 6.5 | % | |||||||||
| Tier 1 capital | 12.9 | 8.5 | 12.5 | 8.5 | 6.0 | % | 8.0 | |||||||||||||
| Total capital | 14.9 | 10.5 | 14.5 | 10.5 | 10.0 | 10.0 | ||||||||||||||
Capital ratio requirements(a) |
Well-capitalized ratios | |||||||||||||||||||
| BHC | IDI | BHC(b) |
IDI | |||||||||||||||||
| Leverage-based capital ratios | ||||||||||||||||||||
| Tier 1 leverage | 4.0 | % | 4.0 | % | NA | 5.0 | % | |||||||||||||
| SLR | 5.0 | 6.0 | NA | 6.0 | ||||||||||||||||
JPMorgan Chase & Co./2023 Form 10-K |
289 |
|||||||
| December 31, 2023 (in millions, except ratios) |
Basel III Standardized | Basel III Advanced | ||||||||||||||||||
|
JPMorgan
Chase & Co.
|
JPMorgan
Chase Bank, N.A.
|
JPMorgan
Chase & Co.
|
JPMorgan
Chase Bank, N.A.
|
|||||||||||||||||
Risk-based capital metrics:(a) |
||||||||||||||||||||
CET1 capital |
$ | 250,585 | $ | 262,030 | $ | 250,585 | $ | 262,030 | ||||||||||||
Tier 1 capital |
277,306 | 262,032 | 277,306 | 262,032 | ||||||||||||||||
Total capital |
308,497 | 281,308 | 295,417 | (b) | 268,392 | |||||||||||||||
| Risk-weighted assets | 1,671,995 | 1,621,789 | 1,669,156 | (b) | 1,526,952 | |||||||||||||||
| CET1 capital ratio | 15.0 | % | 16.2 | % | 15.0 | % | 17.2 | % | ||||||||||||
| Tier 1 capital ratio | 16.6 | 16.2 | 16.6 | 17.2 | ||||||||||||||||
| Total capital ratio | 18.5 | 17.3 | 17.7 | 17.6 | ||||||||||||||||
| December 31, 2022 (in millions, except ratios) |
Basel III Standardized | Basel III Advanced | ||||||||||||||||||
|
JPMorgan
Chase & Co.
|
JPMorgan
Chase Bank, N.A.
|
JPMorgan
Chase & Co.
|
JPMorgan
Chase Bank, N.A.
|
|||||||||||||||||
Risk-based capital metrics:(a) |
||||||||||||||||||||
CET1 capital |
$ | 218,934 | $ | 269,668 | $ | 218,934 | $ | 269,668 | ||||||||||||
Tier 1 capital |
245,631 | 269,672 | 245,631 | 269,672 | ||||||||||||||||
Total capital |
277,769 | 288,433 | 264,583 | 275,255 | ||||||||||||||||
| Risk-weighted assets | 1,653,538 | 1,597,072 | 1,609,773 | 1,475,602 | ||||||||||||||||
| CET1 capital ratio | 13.2 | % | 16.9 | % | 13.6 | % | 18.3 | % | ||||||||||||
| Tier 1 capital ratio | 14.9 | 16.9 | 15.3 | 18.3 | ||||||||||||||||
| Total capital ratio | 16.8 | 18.1 | 16.4 | 18.7 | ||||||||||||||||
| Three months ended (in millions, except ratios) |
December 31, 2023 | December 31, 2022 | |||||||||||||||
| JPMorgan Chase & Co. |
JPMorgan Chase Bank, N.A. |
JPMorgan Chase & Co. |
JPMorgan Chase Bank, N.A. |
||||||||||||||
Leverage-based capital metrics:(a) |
|||||||||||||||||
Adjusted average assets(b) |
$ | 3,831,200 | $ | 3,337,842 | $ | 3,703,873 | $ | 3,249,912 | |||||||||
Tier 1 leverage ratio |
7.2 | % | 7.9 | % | 6.6 | % | 8.3 | % | |||||||||
| Total leverage exposure | $ | 4,540,465 | $ | 4,038,739 | $ | 4,367,092 | $ | 3,925,502 | |||||||||
| SLR | 6.1 | % | 6.5 | % | 5.6 | % | 6.9 | % | |||||||||
290 |
JPMorgan Chase & Co./2023 Form 10-K |
|||||||
JPMorgan Chase & Co./2023 Form 10-K |
291 |
|||||||
| Off–balance sheet lending-related financial instruments, guarantees and other commitments | ||||||||||||||||||||||||||||||||||||||
| Contractual amount | Carrying value(h)(i) |
|||||||||||||||||||||||||||||||||||||
| 2023 | 2022 | 2023 | 2022 | |||||||||||||||||||||||||||||||||||
| By remaining maturity as of December 31, (in millions) |
Expires in 1 year or less | Expires after 1 year through 3 years |
Expires after 3 years through 5 years |
Expires after 5 years | Total | Total | ||||||||||||||||||||||||||||||||
| Lending-related | ||||||||||||||||||||||||||||||||||||||
| Consumer, excluding credit card: | ||||||||||||||||||||||||||||||||||||||
Residential Real Estate(a) |
$ | 6,917 | $ | 7,175 | $ | 6,493 | $ | 9,540 | $ | 30,125 | $ | 21,287 | 678 | (j) |
75 | |||||||||||||||||||||||
| Auto and other | 12,247 | 159 | — | 2,872 | 15,278 | 12,231 | 148 | (j) |
— | |||||||||||||||||||||||||||||
| Total consumer, excluding credit card | 19,164 | 7,334 | 6,493 | 12,412 | 45,403 | 33,518 | 826 | 75 | ||||||||||||||||||||||||||||||
Credit card(b) |
915,658 | — | — | — | 915,658 | 821,284 | — | — | ||||||||||||||||||||||||||||||
Total consumer(c) |
934,822 | 7,334 | 6,493 | 12,412 | 961,061 | 854,802 | 826 | 75 | ||||||||||||||||||||||||||||||
| Wholesale: | ||||||||||||||||||||||||||||||||||||||
Other unfunded commitments to extend credit(d) |
125,478 | 175,190 | 179,046 | 23,812 | 503,526 | 440,407 | 2,797 | (j)(k) |
2,328 | (k) |
||||||||||||||||||||||||||||
Standby letters of credit and other financial guarantees(d) |
13,775 | 10,478 | 3,628 | 991 | 28,872 | 27,439 | 479 | 408 | ||||||||||||||||||||||||||||||
Other letters of credit(d) |
4,084 | 222 | 82 | — | 4,388 | 4,134 | 37 | 6 | ||||||||||||||||||||||||||||||
Total wholesale(c) |
143,337 | 185,890 | 182,756 | 24,803 | 536,786 | 471,980 | 3,313 | 2,742 | ||||||||||||||||||||||||||||||
| Total lending-related | $ | 1,078,159 | $ | 193,224 | $ | 189,249 | $ | 37,215 | $ | 1,497,847 | $ | 1,326,782 | $ | 4,139 | $ | 2,817 | ||||||||||||||||||||||
| Other guarantees and commitments | ||||||||||||||||||||||||||||||||||||||
Securities lending indemnification agreements and guarantees(e) |
$ | 283,664 | $ | — | $ | — | $ | — | $ | 283,664 | $ | 283,386 | $ | — | $ | — | ||||||||||||||||||||||
| Derivatives qualifying as guarantees | 1,693 | 364 | 11,657 | 40,848 | 54,562 | 59,180 | 89 | 649 | ||||||||||||||||||||||||||||||
Unsettled resale and securities borrowed agreements |
94,920 | 186 | — | — | 95,106 | 116,975 | — | (2) | ||||||||||||||||||||||||||||||
Unsettled repurchase and securities loaned agreements |
60,170 | 554 | — | — | 60,724 | 66,407 | — | (7) | ||||||||||||||||||||||||||||||
Loan sale and securitization-related indemnifications: |
||||||||||||||||||||||||||||||||||||||
| Mortgage repurchase liability | NA | NA | NA | NA | NA | NA | 76 | 76 | ||||||||||||||||||||||||||||||
| Loans sold with recourse | NA | NA | NA | NA | 803 | 820 | 24 | 28 | ||||||||||||||||||||||||||||||
Exchange & clearing house guarantees and commitments(f) |
265,887 | — | — | — | 265,887 | 191,068 | — | — | ||||||||||||||||||||||||||||||
Other guarantees and commitments (g) |
9,216 | 1,516 | 314 | 4,028 | 15,074 | 8,634 | 38 | 53 | ||||||||||||||||||||||||||||||
292 |
JPMorgan Chase & Co./2023 Form 10-K |
|||||||
| 2023 | 2022 | ||||||||||||||||||||||||||||||||||
| December 31, (in millions) |
Standby letters of credit and other financial guarantees |
Other letters of credit |
Standby letters of credit and other financial guarantees |
Other letters of credit |
|||||||||||||||||||||||||||||||
Investment-grade(a) |
$ | 19,694 | $ | 3,552 | $ | 19,205 | $ | 3,040 | |||||||||||||||||||||||||||
Noninvestment-grade(a) |
9,178 | 836 | 8,234 | 1,094 | |||||||||||||||||||||||||||||||
| Total contractual amount | $ | 28,872 | $ | 4,388 | $ | 27,439 | $ | 4,134 | |||||||||||||||||||||||||||
| Allowance for lending-related commitments | $ | 110 | $ | 37 | $ | 82 | $ | 6 | |||||||||||||||||||||||||||
| Guarantee liability | 369 | — | 326 | — | |||||||||||||||||||||||||||||||
| Total carrying value | $ | 479 | $ | 37 | $ | 408 | $ | 6 | |||||||||||||||||||||||||||
| Commitments with collateral | $ | 16,861 | $ | 539 | $ | 15,296 | $ | 795 | |||||||||||||||||||||||||||
JPMorgan Chase & Co./2023 Form 10-K |
293 |
|||||||
| (in millions) | December 31, 2023 | December 31, 2022 | |||||||||
| Notional amounts | |||||||||||
| Derivative guarantees | $ | 54,562 | $ | 59,180 | |||||||
Stable value contracts with contractually limited exposure |
32,488 | 31,820 | |||||||||
Maximum exposure of stable value contracts with contractually limited exposure |
1,652 | 2,063 | |||||||||
| Fair value | |||||||||||
| Derivative payables | 89 | 649 | |||||||||
294 |
JPMorgan Chase & Co./2023 Form 10-K |
|||||||
JPMorgan Chase & Co./2023 Form 10-K |
295 |
|||||||
296 |
JPMorgan Chase & Co./2023 Form 10-K |
|||||||
| December 31, (in billions) | 2023 | 2022 | ||||||||||||
| Assets that may be sold or repledged or otherwise used by secured parties | $ | 145.0 | $ | 110.8 | ||||||||||
Assets that may not be sold or repledged or otherwise used by secured parties (a) |
244.2 | 114.8 | ||||||||||||
| Assets pledged at Federal Reserve banks and FHLBs | 675.6 | 567.6 | ||||||||||||
| Total pledged assets | $ | 1,064.8 | $ | 793.2 | ||||||||||
| December 31, (in billions) | 2023 | 2022 | ||||||||||||
| Investment securities | $ | 108.6 | $ | 104.4 | ||||||||||
| Loans | 681.7 | 485.9 | ||||||||||||
| Trading assets and other | 274.5 | 202.9 | ||||||||||||
| Total pledged assets | $ | 1,064.8 | $ | 793.2 | ||||||||||
| December 31, (in billions) | 2023 | 2022 | ||||||||||||
| Collateral permitted to be sold or repledged, delivered, or otherwise used | $ | 1,303.9 | $ | 1,346.9 | ||||||||||
| Collateral sold, repledged, delivered or otherwise used | 982.8 | 1,019.4 | ||||||||||||
JPMorgan Chase & Co./2023 Form 10-K |
297 |
|||||||
298 |
JPMorgan Chase & Co./2023 Form 10-K |
|||||||
JPMorgan Chase & Co./2023 Form 10-K |
299 |
|||||||
300 |
JPMorgan Chase & Co./2023 Form 10-K |
|||||||
JPMorgan Chase & Co./2023 Form 10-K |
301 |
|||||||
| As of or for the year ended December 31, (in millions) |
Revenue(c) |
Expense(d) |
Income before income tax expense |
Net income | Total assets | ||||||||||||||||||||||||||||||
| 2023 | |||||||||||||||||||||||||||||||||||
| Europe/Middle East/Africa | $ | 20,974 | $ | 11,947 | $ | 9,027 | $ | 6,402 | $ | 529,335 | (e) |
||||||||||||||||||||||||
| Asia-Pacific | 10,605 | 6,550 | 4,055 | 2,709 | 251,588 | ||||||||||||||||||||||||||||||
| Latin America/Caribbean | 3,294 | 1,971 | 1,323 | 994 | 83,003 | ||||||||||||||||||||||||||||||
| Total international | 34,873 | 20,468 | 14,405 | 10,105 | 863,926 | ||||||||||||||||||||||||||||||
North America(a)(b) |
123,231 | 76,024 | 47,207 | 39,447 | 3,011,467 | ||||||||||||||||||||||||||||||
| Total | $ | 158,104 | $ | 96,492 | $ | 61,612 | $ | 49,552 | $ | 3,875,393 | |||||||||||||||||||||||||
2022 |
|||||||||||||||||||||||||||||||||||
| Europe/Middle East/Africa | $ | 18,765 | $ | 11,754 | $ | 7,011 | $ | 5,158 | $ | 558,430 | (e) |
||||||||||||||||||||||||
| Asia-Pacific | 10,025 | 6,763 | 3,262 | 2,119 | 281,479 | ||||||||||||||||||||||||||||||
| Latin America/Caribbean | 3,178 | 1,697 | 1,481 | 1,156 | 78,673 | ||||||||||||||||||||||||||||||
| Total international | 31,968 | 20,214 | 11,754 | 8,433 | 918,582 | ||||||||||||||||||||||||||||||
North America(a) |
96,727 | 62,315 | 34,412 | 29,243 | 2,747,161 | ||||||||||||||||||||||||||||||
| Total | $ | 128,695 | $ | 82,529 | $ | 46,166 | $ | 37,676 | $ | 3,665,743 | |||||||||||||||||||||||||
2021 |
|||||||||||||||||||||||||||||||||||
| Europe/Middle East/Africa | $ | 16,561 | $ | 10,833 | $ | 5,728 | $ | 4,202 | $ | 517,904 | (e) |
||||||||||||||||||||||||
| Asia-Pacific | 9,654 | 6,372 | 3,282 | 2,300 | 277,897 | ||||||||||||||||||||||||||||||
| Latin America/Caribbean | 2,756 | 1,589 | 1,167 | 878 | 65,040 | ||||||||||||||||||||||||||||||
| Total international | 28,971 | 18,794 | 10,177 | 7,380 | 860,841 | ||||||||||||||||||||||||||||||
North America(a) |
92,678 | 43,293 | 49,385 | 40,954 | 2,882,726 | ||||||||||||||||||||||||||||||
| Total | $ | 121,649 | $ | 62,087 | $ | 59,562 | $ | 48,334 | $ | 3,743,567 | |||||||||||||||||||||||||
302 |
JPMorgan Chase & Co./2023 Form 10-K |
|||||||
JPMorgan Chase & Co./2023 Form 10-K |
303 |
|||||||
| (Table continued on next page) | ||||||||||||||||||||||||||||||||||||||||||||||||||||||||||||||
| As of or for the year ended December 31, (in millions, except ratios) |
Consumer & Community Banking | Corporate & Investment Bank | Commercial Banking | Asset & Wealth Management | ||||||||||||||||||||||||||||||||||||||||||||||||||||||||||
| 2023 | 2022 | 2021 | 2023 | 2022 | 2021 | 2023 | 2022 | 2021 | 2023 | 2022 | 2021 | |||||||||||||||||||||||||||||||||||||||||||||||||||
| Noninterest revenue | $ | 15,118 | $ | 14,886 | (b) |
$ | 17,092 | (b) |
$ | 40,315 | $ | 36,202 | (b) |
$ | 38,403 | (b) |
$ | 3,494 | $ | 3,336 | $ | 3,929 | $ | 13,560 | $ | 12,507 | $ | 13,071 | ||||||||||||||||||||||||||||||||||
| Net interest income | 55,030 | 39,928 | 32,787 | 8,492 | 11,900 | 13,540 | 12,052 | 8,197 | 6,079 | 6,267 | 5,241 | 3,886 | ||||||||||||||||||||||||||||||||||||||||||||||||||
| Total net revenue | 70,148 | 54,814 | 49,879 | 48,807 | 48,102 | 51,943 | 15,546 | 11,533 | 10,008 | 19,827 | 17,748 | 16,957 | ||||||||||||||||||||||||||||||||||||||||||||||||||
Provision for credit losses |
6,899 | 3,813 | (6,989) | 121 | 1,158 | (1,174) | 1,970 | 1,268 | (947) | 159 | 128 | (227) | ||||||||||||||||||||||||||||||||||||||||||||||||||
| Noninterest expense | 34,819 | 31,208 | (b) |
29,028 | (b) |
28,594 | 27,350 | (b) |
25,553 | (b) |
5,378 | 4,719 | 4,041 | 12,780 | 11,829 | 10,919 | ||||||||||||||||||||||||||||||||||||||||||||||
Income/(loss) before income tax expense/(benefit) |
28,430 | 19,793 | 27,840 | 20,092 | 19,594 | 27,564 | 8,198 | 5,546 | 6,914 | 6,888 | 5,791 | 6,265 | ||||||||||||||||||||||||||||||||||||||||||||||||||
Income tax expense/(benefit) |
7,198 | 4,877 | (b) |
6,883 | (b) |
5,963 | 4,669 | (b) |
6,457 | (b) |
2,055 | 1,333 | 1,668 | 1,661 | 1,426 | 1,528 | ||||||||||||||||||||||||||||||||||||||||||||||
| Net income/(loss) | $ | 21,232 | $ | 14,916 | $ | 20,957 | $ | 14,129 | $ | 14,925 | $ | 21,107 | $ | 6,143 | $ | 4,213 | $ | 5,246 | $ | 5,227 | $ | 4,365 | $ | 4,737 | ||||||||||||||||||||||||||||||||||||||
Average equity |
$ | 54,349 | $ | 50,000 | $ | 50,000 | $ | 108,000 | $ | 103,000 | $ | 83,000 | $ | 29,507 | $ | 25,000 | $ | 24,000 | $ | 16,671 | $ | 17,000 | $ | 14,000 | ||||||||||||||||||||||||||||||||||||||
| Total assets | 642,951 | 514,085 | 500,370 | 1,338,168 | 1,334,296 | 1,259,896 | 300,325 | 257,106 | 230,776 | 245,512 | 232,037 | 234,425 | ||||||||||||||||||||||||||||||||||||||||||||||||||
Return on equity |
38 | % | 29 | % | 41 | % | 13 | % | 14 | % | 25 | % | 20 | % | 16 | % | 21 | % | 31 | % | 25 | % | 33 | % | ||||||||||||||||||||||||||||||||||||||
| Overhead ratio | 50 | 57 | 58 | 59 | 57 | 49 | 35 | 41 | 40 | 64 | 67 | 64 | ||||||||||||||||||||||||||||||||||||||||||||||||||
304 |
JPMorgan Chase & Co./2023 Form 10-K |
|||||||
| (Table continued from previous page) | ||||||||||||||||||||||||||||||||||||||||||||
| As of or for the year ended December 31, (in millions, except ratios) |
Corporate | Reconciling Items(a) |
Total | |||||||||||||||||||||||||||||||||||||||||
| 2023 | 2022 | 2021 | 2023 | 2022 | 2021 | 2023 | 2022 | 2021 | ||||||||||||||||||||||||||||||||||||
| Noninterest revenue | $ | 132 | $ | (1,798) | $ | 68 | $ | (3,782) | $ | (3,148) | $ | (3,225) | $ | 68,837 | $ | 61,985 | $ | 69,338 | ||||||||||||||||||||||||||
| Net interest income | 7,906 | 1,878 | (3,551) | (480) | (434) | (430) | 89,267 | 66,710 | 52,311 | |||||||||||||||||||||||||||||||||||
| Total net revenue | 8,038 | 80 | (3,483) | (4,262) | (3,582) | (3,655) | 158,104 | 128,695 | 121,649 | |||||||||||||||||||||||||||||||||||
Provision for credit losses |
171 | 22 | 81 | — | — | — | 9,320 | 6,389 | (9,256) | |||||||||||||||||||||||||||||||||||
| Noninterest expense | 5,601 | 1,034 | 1,802 | — | — | — | 87,172 | 76,140 | 71,343 | |||||||||||||||||||||||||||||||||||
|
Income/(loss) before income
tax expense/(benefit)
|
2,266 | (976) | (5,366) | (4,262) | (3,582) | (3,655) | 61,612 | 46,166 | 59,562 | |||||||||||||||||||||||||||||||||||
Income tax expense/(benefit) |
(555) | (233) | (1,653) | (4,262) | (3,582) | (3,655) | 12,060 | 8,490 | 11,228 | |||||||||||||||||||||||||||||||||||
| Net income/(loss) | $ | 2,821 | $ | (743) | $ | (3,713) | $ | — | $ | — | $ | — | $ | 49,552 | $ | 37,676 | $ | 48,334 | ||||||||||||||||||||||||||
Average equity |
$ | 73,529 | $ | 58,068 | $ | 79,968 | $ | — | $ | — | $ | — | $ | 282,056 | $ | 253,068 | $ | 250,968 | ||||||||||||||||||||||||||
| Total assets | 1,348,437 | 1,328,219 | 1,518,100 | NA | NA | NA | 3,875,393 | 3,665,743 | 3,743,567 | |||||||||||||||||||||||||||||||||||
Return on equity |
NM | NM | NM | NM | NM | NM | 17 | % | 14 | % | 19 | % | ||||||||||||||||||||||||||||||||
| Overhead ratio | NM | NM | NM | NM | NM | NM | 55 | 59 | 59 | |||||||||||||||||||||||||||||||||||
JPMorgan Chase & Co./2023 Form 10-K |
305 |
|||||||
Statements of income and comprehensive income | ||||||||||||||||||||
| Year ended December 31, (in millions) |
2023 | 2022 | 2021 | |||||||||||||||||
| Income | ||||||||||||||||||||
| Dividends from subsidiaries and affiliates: | ||||||||||||||||||||
| Bank and bank holding company | $ | 61,000 | $ | 40,500 | $ | 10,000 | ||||||||||||||
| Non-bank | — | — | — | |||||||||||||||||
| Interest income from subsidiaries | 1,166 | 498 | 32 | |||||||||||||||||
| Other income/(expense) from subsidiaries: | ||||||||||||||||||||
| Bank and bank holding company | 1,801 | (3,497) | 859 | |||||||||||||||||
| Non-bank | 250 | 335 | 366 | |||||||||||||||||
| Other income/(expense) | (654) | 5,271 | 1,137 | |||||||||||||||||
| Total income | 63,563 | 43,107 | 12,394 | |||||||||||||||||
| Expense | ||||||||||||||||||||
Interest expense/(income) to subsidiaries and affiliates(a) |
2,258 | 22,731 | 5,353 | |||||||||||||||||
Other interest expense/(income)(a) |
11,714 | (14,658) | (1,349) | |||||||||||||||||
| Noninterest expense | 3,431 | 2,817 | 2,637 | |||||||||||||||||
| Total expense | 17,403 | 10,890 | 6,641 | |||||||||||||||||
| Income before income tax benefit and undistributed net income of subsidiaries | 46,160 | 32,217 | 5,753 | |||||||||||||||||
| Income tax benefit | 1,525 | 1,260 | 1,329 | |||||||||||||||||
| Equity in undistributed net income of subsidiaries | 1,867 | 4,199 | 41,252 | |||||||||||||||||
| Net income | $ | 49,552 | $ | 37,676 | $ | 48,334 | ||||||||||||||
| Other comprehensive income/(loss), net | 6,898 | (17,257) | (8,070) | |||||||||||||||||
| Comprehensive income | $ | 56,450 | $ | 20,419 | $ | 40,264 | ||||||||||||||
| Balance sheets | ||||||||||||||
| December 31, (in millions) | 2023 | 2022 | ||||||||||||
| Assets | ||||||||||||||
| Cash and due from banks | $ | 42 | $ | 41 | ||||||||||
| Deposits with banking subsidiaries | 9,804 | 9,806 | ||||||||||||
| Trading assets | 3,198 | 2,727 | ||||||||||||
| Advances to, and receivables from, subsidiaries: | ||||||||||||||
| Bank and bank holding company | 152 | 136 | ||||||||||||
| Non-bank | 21 | 46 | ||||||||||||
| Investments (at equity) in subsidiaries and affiliates: | ||||||||||||||
| Bank and bank holding company | 568,472 | 532,759 | ||||||||||||
| Non-bank | 1,045 | 1,064 | ||||||||||||
| Other assets | 8,962 | 9,108 | ||||||||||||
| Total assets | $ | 591,696 | $ | 555,687 | ||||||||||
| Liabilities and stockholders’ equity | ||||||||||||||
| Borrowings from, and payables to, subsidiaries and affiliates | $ | 22,777 | $ | 24,164 | ||||||||||
| Short-term borrowings | 999 | 1,130 | ||||||||||||
| Other liabilities | 11,500 | 10,440 | ||||||||||||
Long-term debt(b)(c) |
228,542 | 227,621 | ||||||||||||
Total liabilities(c) |
263,818 | 263,355 | ||||||||||||
| Total stockholders’ equity | 327,878 | 292,332 | ||||||||||||
| Total liabilities and stockholders’ equity | $ | 591,696 | $ | 555,687 | ||||||||||
| Statements of cash flows | ||||||||||||||||||||
| Year ended December 31, (in millions) |
2023 | 2022 | 2021 | |||||||||||||||||
| Operating activities | ||||||||||||||||||||
| Net income | $ | 49,552 | $ | 37,676 | $ | 48,334 | ||||||||||||||
| Less: Net income of subsidiaries and affiliates | 62,868 | 44,699 | 51,252 | |||||||||||||||||
| Parent company net loss | (13,316) | (7,023) | (2,918) | |||||||||||||||||
| Cash dividends from subsidiaries and affiliates | 61,000 | 40,500 | 10,000 | |||||||||||||||||
| Other operating adjustments | 9,412 | (23,747) | (12,677) | |||||||||||||||||
| Net cash provided by/(used in) operating activities | 57,096 | 9,730 | (5,595) | |||||||||||||||||
| Investing activities | ||||||||||||||||||||
| Net change in: | ||||||||||||||||||||
| Advances to and investments in subsidiaries and affiliates, net | (25,000) | — | (3,000) | |||||||||||||||||
| All other investing activities, net | 25 | 31 | 31 | |||||||||||||||||
| Net cash provided by/(used in) investing activities | (24,975) | 31 | (2,969) | |||||||||||||||||
| Financing activities | ||||||||||||||||||||
| Net change in: | ||||||||||||||||||||
| Borrowings from subsidiaries and affiliates | (2,249) | (4,491) | 2,647 | |||||||||||||||||
| Short-term borrowings | — | — | — | |||||||||||||||||
| Proceeds from long-term borrowings | 19,398 | 41,389 | 49,169 | |||||||||||||||||
| Payments of long-term borrowings | (25,105) | (18,294) | (15,543) | |||||||||||||||||
| Proceeds from issuance of preferred stock | — | — | 7,350 | |||||||||||||||||
| Redemption of preferred stock | — | (7,434) | (2,575) | |||||||||||||||||
| Treasury stock repurchased | (9,824) | (3,162) | (18,408) | |||||||||||||||||
| Dividends paid | (13,463) | (13,562) | (12,858) | |||||||||||||||||
| All other financing activities, net | (879) | (1,205) | (1,238) | |||||||||||||||||
| Net cash provided by/(used in) financing activities | (32,122) | (6,759) | 8,544 | |||||||||||||||||
| Net increase/(decrease) in cash and due from banks and deposits with banking subsidiaries | (1) | 3,002 | (20) | |||||||||||||||||
| Cash and due from banks and deposits with banking subsidiaries at the beginning of the year | 9,847 | 6,845 | 6,865 | |||||||||||||||||
| Cash and due from banks and deposits with banking subsidiaries at the end of the year | $ | 9,846 | $ | 9,847 | $ | 6,845 | ||||||||||||||
| Cash interest paid | $ | 13,742 | $ | 7,462 | $ | 4,065 | ||||||||||||||
Cash income taxes paid, net(d) |
10,291 | 6,941 | 15,259 | |||||||||||||||||
306 |
JPMorgan Chase & Co./2023 Form 10-K |
|||||||
JPMorgan Chase & Co./2023 Form 10-K |
307 |
|||||||
| Fair value purchase price allocation as of May 1, 2023 |
|||||
| (in millions) | |||||
| Purchase price consideration | |||||
Amounts paid/due to the FDIC, net of cash acquired(a) |
$ | 13,524 | |||
| Purchase Money Note (at fair value) | 48,848 | ||||
Settlement of First Republic deposit and other related party transactions(b) |
5,447 | ||||
| Contingent consideration - Shared-loss agreements | 15 | ||||
| Purchase price consideration | $ | 67,834 | |||
| Assets | |||||
| Securities | $ | 30,285 | |||
Loans(c) |
153,242 | ||||
| Core deposit and customer relationship intangibles | 1,455 | ||||
| Indemnification assets - Shared-loss agreements | 675 | ||||
Accounts receivable and other assets(c)(d) |
6,574 | ||||
| Total assets acquired | $ | 192,231 | |||
| Liabilities | |||||
| Deposits | $ | 87,572 | |||
| FHLB advances | 27,919 | ||||
| Lending-related commitments | 2,614 | ||||
Accounts payable and other liabilities(c)(d) |
2,793 | ||||
| Deferred tax liabilities | 724 | ||||
| Total liabilities assumed | $ | 121,622 | |||
| Fair value of net assets acquired | $ | 70,609 | |||
Estimated gain on acquisition, after-tax |
$ | 2,775 | |||
308 |
JPMorgan Chase & Co./2023 Form 10-K |
|||||||
| May 1, 2023 | |||||||||||
| (in millions) | UPB | Fair value | |||||||||
| Residential real estate | $ | 106,240 | $ | 92,053 | |||||||
| Auto and other | 3,093 | 2,030 | |||||||||
| Total consumer | 109,333 | 94,083 | |||||||||
| Secured by real estate | 37,117 | 33,602 | |||||||||
| Commercial & industrial | 4,332 | 3,932 | |||||||||
Other(a) |
23,499 | 21,625 | |||||||||
Total wholesale |
64,948 | 59,159 | |||||||||
| Total loans | $ | 174,281 | $ | 153,242 | |||||||
| Year ended December 31, | ||||||||||||||
| (in millions) | 2023 | 2022 | ||||||||||||
| Noninterest revenue | $ | 65,816 | $ | 66,510 | ||||||||||
| Net interest income | 90,856 | 71,005 | ||||||||||||
| Net income | 48,665 | 41,089 | ||||||||||||
JPMorgan Chase & Co./2023 Form 10-K |
309 |
|||||||
| (Table continued on next page) | ||||||||||||||||||||
| (Unaudited) | 2023 | |||||||||||||||||||
| Year ended December 31, (Taxable-equivalent interest and rates; in millions, except rates) |
Average balance |
Interest(g) |
Rate | |||||||||||||||||
| Assets | ||||||||||||||||||||
| Deposits with banks | $ | 499,396 | $ | 21,797 | 4.36 | % | ||||||||||||||
| Federal funds sold and securities purchased under resale agreements | 317,159 | 15,079 | 4.75 | |||||||||||||||||
| Securities borrowed | 193,228 | 7,983 | 4.13 | |||||||||||||||||
| Trading assets – debt instruments | 376,928 | 16,001 | 4.25 | |||||||||||||||||
| Taxable securities | 573,914 | 17,390 | 3.03 | |||||||||||||||||
Non-taxable securities(a) |
30,886 | 1,560 | 5.05 | |||||||||||||||||
| Total investment securities | 604,800 | 18,950 | 3.13 | (i) |
||||||||||||||||
| Loans | 1,248,076 | 83,589 | (h) |
6.70 | ||||||||||||||||
All other interest-earning assets(b)(c) |
86,121 | 7,669 | 8.90 | |||||||||||||||||
| Total interest-earning assets | 3,325,708 | 171,068 | 5.14 | |||||||||||||||||
| Allowance for loan losses | (20,762) | |||||||||||||||||||
| Cash and due from banks | 24,853 | |||||||||||||||||||
| Trading assets – equity and other instruments | 160,087 | |||||||||||||||||||
| Trading assets – derivative receivables | 64,227 | |||||||||||||||||||
| Goodwill, MSRs and other intangible assets | 63,212 | |||||||||||||||||||
| All other noninterest-earning assets | 204,899 | |||||||||||||||||||
| Total assets | $ | 3,822,224 | ||||||||||||||||||
| Liabilities | ||||||||||||||||||||
| Interest-bearing deposits | $ | 1,698,529 | $ | 40,016 | 2.36 | % | ||||||||||||||
| Federal funds purchased and securities loaned or sold under repurchase agreements | 256,086 | 13,259 | 5.18 | |||||||||||||||||
Short-term borrowings |
37,468 | 1,894 | 5.05 | |||||||||||||||||
Trading liabilities – debt and all other interest-bearing liabilities(d)(e) |
286,605 | 9,396 | 3.28 | |||||||||||||||||
| Beneficial interests issued by consolidated VIEs | 18,648 | 953 | 5.11 | |||||||||||||||||
| Long-term debt | 296,433 | 15,803 | 5.33 | |||||||||||||||||
| Total interest-bearing liabilities | 2,593,769 | 81,321 | 3.14 | |||||||||||||||||
| Noninterest-bearing deposits | 660,538 | |||||||||||||||||||
Trading liabilities – equity and other instruments(e) |
30,501 | |||||||||||||||||||
| Trading liabilities – derivative payables | 46,355 | |||||||||||||||||||
| All other liabilities, including the allowance for lending-related commitments | 181,601 | |||||||||||||||||||
| Total liabilities | 3,512,764 | |||||||||||||||||||
| Stockholders’ equity | ||||||||||||||||||||
| Preferred stock | 27,404 | |||||||||||||||||||
| Common stockholders’ equity | 282,056 | |||||||||||||||||||
| Total stockholders’ equity | 309,460 | (f) |
||||||||||||||||||
| Total liabilities and stockholders’ equity | $ | 3,822,224 | ||||||||||||||||||
| Interest rate spread | 2.00 | % | ||||||||||||||||||
| Net interest income and net yield on interest-earning assets | $ | 89,747 | 2.70 | |||||||||||||||||
310 |
JPMorgan Chase & Co./2023 Form 10-K |
|||||||
| (Table continued from previous page) | ||||||||||||||||||||||||||||||||||||||
| 2022 | 2021 | |||||||||||||||||||||||||||||||||||||
| Average balance |
Interest(g) |
Rate | Average balance |
Interest(g) |
Rate | |||||||||||||||||||||||||||||||||
| $ | 670,773 | $ | 9,039 | 1.35 | % | $ | 719,772 | $ | 512 | 0.07 | % | |||||||||||||||||||||||||||
| 307,150 | 4,632 | 1.51 | 269,231 | 958 | 0.36 | |||||||||||||||||||||||||||||||||
| 205,516 | 2,237 | 1.09 | 190,655 | (385) | (0.20) | (j) |
||||||||||||||||||||||||||||||||
| 283,108 | 9,097 | 3.21 | 283,829 | 6,856 | 2.42 | |||||||||||||||||||||||||||||||||
| 626,122 | 10,372 | 1.66 | 563,147 | 6,460 | 1.15 | |||||||||||||||||||||||||||||||||
| 27,863 | 1,224 | 4.39 | 30,830 | 1,336 | 4.33 | |||||||||||||||||||||||||||||||||
| 653,985 | 11,596 | 1.77 | (i) |
593,977 | 7,796 | 1.31 | (i) |
|||||||||||||||||||||||||||||||
| 1,100,318 | 52,877 | (h) |
4.81 | 1,035,399 | 41,663 | (h) |
4.02 | |||||||||||||||||||||||||||||||
| 128,229 | 3,763 | 2.93 | 123,079 | 894 | 0.73 | |||||||||||||||||||||||||||||||||
| 3,349,079 | 93,241 | 2.78 | 3,215,942 | 58,294 | 1.81 | |||||||||||||||||||||||||||||||||
| (17,399) | (22,179) | |||||||||||||||||||||||||||||||||||||
| 27,601 | 26,776 | |||||||||||||||||||||||||||||||||||||
| 140,778 | 172,822 | |||||||||||||||||||||||||||||||||||||
| 78,606 | 69,101 | |||||||||||||||||||||||||||||||||||||
| 59,467 | 55,003 | |||||||||||||||||||||||||||||||||||||
| 215,408 | 207,737 | |||||||||||||||||||||||||||||||||||||
| $ | 3,853,540 | $ | 3,725,202 | |||||||||||||||||||||||||||||||||||
| $ | 1,748,666 | $ | 10,082 | 0.58 | % | $ | 1,672,669 | $ | 531 | 0.03 | % | |||||||||||||||||||||||||||
| 242,762 | 3,721 | 1.53 | 259,302 | 274 | 0.11 | |||||||||||||||||||||||||||||||||
| 46,063 | 747 | 1.62 | 44,618 | 126 | 0.28 | |||||||||||||||||||||||||||||||||
| 268,019 | 3,246 | 1.21 | 241,431 | 257 | 0.11 | |||||||||||||||||||||||||||||||||
| 11,208 | 226 | 2.02 | 14,595 | 83 | 0.57 | |||||||||||||||||||||||||||||||||
| 250,080 | 8,075 | 3.23 | 250,378 | 4,282 | 1.71 | |||||||||||||||||||||||||||||||||
| 2,566,798 | 26,097 | 1.02 | 2,482,993 | 5,553 | 0.22 | |||||||||||||||||||||||||||||||||
| 719,249 | 674,485 | |||||||||||||||||||||||||||||||||||||
| 39,155 | 36,656 | |||||||||||||||||||||||||||||||||||||
| 57,388 | 60,318 | |||||||||||||||||||||||||||||||||||||
| 185,989 | 186,755 | |||||||||||||||||||||||||||||||||||||
| 3,568,579 | 3,441,207 | |||||||||||||||||||||||||||||||||||||
| 31,893 | 33,027 | |||||||||||||||||||||||||||||||||||||
| 253,068 | 250,968 | |||||||||||||||||||||||||||||||||||||
| 284,961 | (f) |
283,995 | (f) |
|||||||||||||||||||||||||||||||||||
| $ | 3,853,540 | $ | 3,725,202 | |||||||||||||||||||||||||||||||||||
| 1.76 | % | 1.59 | % | |||||||||||||||||||||||||||||||||||
| $ | 67,144 | 2.00 | $ | 52,741 | 1.64 | |||||||||||||||||||||||||||||||||
JPMorgan Chase & Co./2023 Form 10-K |
311 |
|||||||
| (Table continued on next page) | ||||||||||||||
| 2023 | ||||||||||||||
|
(Unaudited)
Year ended December 31,
(Taxable-equivalent interest and rates; in millions, except rates)
|
Average balance | Interest | Rate | |||||||||||
| Interest-earning assets | ||||||||||||||
| Deposits with banks: | ||||||||||||||
| U.S. | $ | 296,784 | $ | 15,348 | 5.17 | % | ||||||||
| Non-U.S. | 202,612 | 6,449 | 3.18 | |||||||||||
| Federal funds sold and securities purchased under resale agreements: | ||||||||||||||
| U.S. | 155,304 | 8,330 | 5.36 | |||||||||||
| Non-U.S. | 161,855 | 6,749 | 4.17 | |||||||||||
Securities borrowed: |
||||||||||||||
| U.S. | 133,805 | 6,239 | 4.66 | |||||||||||
| Non-U.S. | 59,423 | 1,744 | 2.93 | |||||||||||
| Trading assets – debt instruments: | ||||||||||||||
| U.S. | 248,541 | 10,721 | 4.31 | |||||||||||
| Non-U.S. | 128,387 | 5,280 | 4.11 | |||||||||||
| Investment securities: | ||||||||||||||
| U.S. | 568,505 | 17,469 | 3.07 | |||||||||||
| Non-U.S. | 36,295 | 1,481 | 4.08 | |||||||||||
| Loans: | ||||||||||||||
| U.S. | 1,137,162 | 76,884 | 6.76 | |||||||||||
| Non-U.S. | 110,914 | 6,705 | 6.05 | |||||||||||
All other interest-earning assets, predominantly U.S.(a) |
86,121 | 7,669 | 8.90 | |||||||||||
| Total interest-earning assets | 3,325,708 | 171,068 | 5.14 | |||||||||||
| Interest-bearing liabilities | ||||||||||||||
| Interest-bearing deposits: | ||||||||||||||
| U.S. | 1,290,110 | 26,253 | 2.03 | |||||||||||
| Non-U.S. | 408,419 | 13,763 | 3.37 | |||||||||||
| Federal funds purchased and securities loaned or sold under repurchase agreements: | ||||||||||||||
| U.S. | 197,049 | 10,639 | 5.40 | |||||||||||
| Non-U.S. | 59,037 | 2,620 | 4.44 | |||||||||||
Trading liabilities – debt, short-term and all other interest-bearing liabilities: |
||||||||||||||
| U.S. | 205,388 | 7,774 | 3.79 | |||||||||||
| Non-U.S. | 118,685 | 3,516 | 2.96 | |||||||||||
| Beneficial interests issued by consolidated VIEs, predominantly U.S. | 18,648 | 953 | 5.11 | |||||||||||
| Long-term debt: | ||||||||||||||
| U.S. | 293,218 | 15,749 | 5.37 | |||||||||||
| Non-U.S. | 3,215 | 54 | 1.68 | |||||||||||
| Total interest-bearing liabilities | 2,593,769 | 81,321 | 3.14 | |||||||||||
Noninterest-bearing liabilities(b) |
731,939 | |||||||||||||
| Total investable funds | $ | 3,325,708 | $ | 81,321 | 2.45 | % | ||||||||
| Net interest income and net yield: | $ | 89,747 | 2.70 | % | ||||||||||
| U.S. | 77,923 | 3.01 | ||||||||||||
| Non-U.S. | 11,824 | 1.61 | ||||||||||||
| Percentage of total assets and liabilities attributable to non-U.S. operations: | ||||||||||||||
| Assets | 24.7 | |||||||||||||
| Liabilities | 20.2 | |||||||||||||
312 |
JPMorgan Chase & Co./2023 Form 10-K |
|||||||
| (Table continued from previous page) | ||||||||||||||||||||||||||||||||
| 2022 | 2021 | |||||||||||||||||||||||||||||||
| Average balance | Interest | Rate | Average balance | Interest | Rate | |||||||||||||||||||||||||||
| $ | 456,366 | $ | 7,418 | 1.63 | % | $ | 527,340 | $ | 693 | 0.13 | % | |||||||||||||||||||||
| 214,407 | 1,621 | 0.76 | 192,432 | (181) | (0.09) | |||||||||||||||||||||||||||
| 130,213 | 2,191 | 1.68 | 114,406 | 299 | 0.26 | |||||||||||||||||||||||||||
| 176,937 | 2,441 | 1.38 | 154,825 | 659 | 0.43 | |||||||||||||||||||||||||||
| 142,736 | 1,811 | 1.27 | 137,752 | (319) | (0.23) | (c) |
||||||||||||||||||||||||||
| 62,780 | 426 | 0.68 | 52,903 | (66) | (0.12) | (c) |
||||||||||||||||||||||||||
| 170,975 | 5,414 | 3.17 | 158,793 | 3,530 | 2.22 | |||||||||||||||||||||||||||
| 112,133 | 3,683 | 3.28 | 125,036 | 3,326 | 2.66 | |||||||||||||||||||||||||||
| 623,285 | 10,994 | 1.76 | 563,109 | 7,399 | 1.31 | |||||||||||||||||||||||||||
| 30,700 | 602 | 1.96 | 30,868 | 397 | 1.29 | |||||||||||||||||||||||||||
| 985,187 | 48,953 | 4.97 | 924,713 | 39,215 | 4.24 | |||||||||||||||||||||||||||
| 115,131 | 3,924 | 3.41 | 110,686 | 2,448 | 2.21 | |||||||||||||||||||||||||||
| 128,229 | 3,763 | 2.93 | 123,079 | 894 | 0.73 | |||||||||||||||||||||||||||
| 3,349,079 | 93,241 | 2.78 | 3,215,942 | 58,294 | 1.81 | |||||||||||||||||||||||||||
| 1,358,322 | 7,026 | 0.52 | 1,301,616 | 901 | 0.07 | |||||||||||||||||||||||||||
| 390,344 | 3,056 | 0.78 | 371,053 | (370) | (0.10) | |||||||||||||||||||||||||||
| 173,016 | 3,083 | 1.78 | 199,220 | 222 | 0.11 | |||||||||||||||||||||||||||
| 69,746 | 638 | 0.91 | 60,082 | 52 | 0.09 | |||||||||||||||||||||||||||
| 194,570 | 2,384 | 1.23 | 176,466 | (345) | (0.20) | |||||||||||||||||||||||||||
| 119,512 | 1,609 | 1.35 | 109,583 | 728 | 0.66 | |||||||||||||||||||||||||||
| 11,208 | 226 | 2.02 | 14,595 | 83 | 0.57 | |||||||||||||||||||||||||||
| 246,670 | 8,026 | 3.25 | 244,850 | 4,229 | 1.73 | |||||||||||||||||||||||||||
| 3,410 | 49 | 1.44 | 5,528 | 53 | 0.96 | |||||||||||||||||||||||||||
| 2,566,798 | 26,097 | 1.02 | 2,482,993 | 5,553 | 0.22 | |||||||||||||||||||||||||||
| 782,281 | 732,949 | |||||||||||||||||||||||||||||||
| $ | 3,349,079 | $ | 26,097 | 0.78 | % | $ | 3,215,942 | $ | 5,553 | 0.17 | % | |||||||||||||||||||||
| $ | 67,144 | 2.00 | % | $ | 52,741 | 1.64 | % | |||||||||||||||||||||||||
| 58,950 | 2.27 | 46,622 | 1.86 | |||||||||||||||||||||||||||||
| 8,194 | 1.09 | 6,119 | 0.87 | |||||||||||||||||||||||||||||
| 24.9 | 24.6 | |||||||||||||||||||||||||||||||
| 20.6 | 20.4 | |||||||||||||||||||||||||||||||
JPMorgan Chase & Co./2023 Form 10-K |
313 |
|||||||
| 2023 versus 2022 | 2022 versus 2021 | ||||||||||||||||||||||||||||||||||
| (Unaudited) | Increase/(decrease) due to change in: | Increase/(decrease) due to change in: | |||||||||||||||||||||||||||||||||
| Year ended December 31, (On a taxable-equivalent basis; in millions) |
Volume | Rate | Net change |
Volume | Rate | Net change |
|||||||||||||||||||||||||||||
| Interest-earning assets | |||||||||||||||||||||||||||||||||||
| Deposits with banks: | |||||||||||||||||||||||||||||||||||
| U.S. | $ | (8,225) | $ | 16,155 | $ | 7,930 | $ | (1,185) | $ | 7,910 | $ | 6,725 | |||||||||||||||||||||||
| Non-U.S. | (361) | 5,189 | 4,828 | 166 | 1,636 | 1,802 | |||||||||||||||||||||||||||||
Federal funds sold and securities purchased under resale agreements: |
|||||||||||||||||||||||||||||||||||
| U.S. | 1,347 | 4,792 | 6,139 | 267 | 1,625 | 1,892 | |||||||||||||||||||||||||||||
| Non-U.S. | (629) | 4,937 | 4,308 | 311 | 1,471 | 1,782 | |||||||||||||||||||||||||||||
Securities borrowed: |
|||||||||||||||||||||||||||||||||||
| U.S. | (411) | 4,839 | 4,428 | 64 | 2,066 | 2,130 | |||||||||||||||||||||||||||||
| Non-U.S. | (95) | 1,413 | 1,318 | 69 | 423 | 492 | |||||||||||||||||||||||||||||
| Trading assets – debt instruments: | |||||||||||||||||||||||||||||||||||
| U.S. | 3,358 | 1,949 | 5,307 | 375 | 1,509 | 1,884 | |||||||||||||||||||||||||||||
| Non-U.S. | 666 | 931 | 1,597 | (418) | 775 | 357 | |||||||||||||||||||||||||||||
| Investment securities: | |||||||||||||||||||||||||||||||||||
| U.S. | (1,690) | 8,165 | 6,475 | 1,061 | 2,534 | 3,595 | |||||||||||||||||||||||||||||
| Non-U.S. | 228 | 651 | 879 | (2) | 207 | 205 | |||||||||||||||||||||||||||||
| Loans: | |||||||||||||||||||||||||||||||||||
| U.S. | 10,296 | 17,635 | 27,931 | 2,988 | 6,750 | 9,738 | |||||||||||||||||||||||||||||
| Non-U.S. | (258) | 3,039 | 2,781 | 148 | 1,328 | 1,476 | |||||||||||||||||||||||||||||
| All other interest-earning assets, predominantly U.S. | (3,749) | 7,655 | 3,906 | 161 | 2,708 | 2,869 | |||||||||||||||||||||||||||||
| Change in interest income | 477 | 77,350 | 77,827 | 4,005 | 30,942 | 34,947 | |||||||||||||||||||||||||||||
| Interest-bearing liabilities | |||||||||||||||||||||||||||||||||||
| Interest-bearing deposits: | |||||||||||||||||||||||||||||||||||
| U.S. | (1,284) | 20,511 | 19,227 | 268 | 5,857 | 6,125 | |||||||||||||||||||||||||||||
| Non-U.S. | 597 | 10,110 | 10,707 | 161 | 3,265 | 3,426 | |||||||||||||||||||||||||||||
Federal funds purchased and securities loaned or sold under repurchase agreements: |
|||||||||||||||||||||||||||||||||||
| U.S. | 1,293 | 6,263 | 7,556 | (466) | 3,327 | 2,861 | |||||||||||||||||||||||||||||
| Non-U.S. | (480) | 2,462 | 1,982 | 93 | 493 | 586 | |||||||||||||||||||||||||||||
Trading liabilities – debt, short-term and all other interest-bearing liabilities: |
|||||||||||||||||||||||||||||||||||
| U.S. | 409 | 4,981 | 5,390 | 206 | 2,523 | 2,729 | |||||||||||||||||||||||||||||
| Non-U.S. | (17) | 1,924 | 1,907 | 125 | 756 | 881 | |||||||||||||||||||||||||||||
Beneficial interests issued by consolidated VIEs, predominantly U.S. |
381 | 346 | 727 | (69) | 212 | 143 | |||||||||||||||||||||||||||||
| Long-term debt: | |||||||||||||||||||||||||||||||||||
| U.S. | 2,494 | 5,229 | 7,723 | 75 | 3,722 | 3,797 | |||||||||||||||||||||||||||||
| Non-U.S. | (3) | 8 | 5 | (31) | 27 | (4) | |||||||||||||||||||||||||||||
| Change in interest expense | 3,390 | 51,834 | 55,224 | 362 | 20,182 | 20,544 | |||||||||||||||||||||||||||||
| Change in net interest income | $ | (2,913) | $ | 25,516 | $ | 22,603 | $ | 3,643 | $ | 10,760 | $ | 14,403 | |||||||||||||||||||||||
314 |
JPMorgan Chase & Co./2023 Form 10-K |
|||||||
JPMorgan Chase & Co./2023 Form 10-K |
315 |
|||||||
316 |
JPMorgan Chase & Co./2023 Form 10-K |
|||||||
JPMorgan Chase & Co./2023 Form 10-K |
317 |
|||||||
318 |
JPMorgan Chase & Co./2023 Form 10-K |
|||||||
JPMorgan Chase & Co./2023 Form 10-K |
319 |
|||||||
320 |
JPMorgan Chase & Co./2023 Form 10-K |
|||||||
JPMorgan Chase & Co./2023 Form 10-K |
321 |
|||||||
| JPMorgan Chase & Co. (Registrant) |
|||||
|
By: /s/ JAMES DIMON
|
|||||
| (James Dimon Chairman and Chief Executive Officer) |
|||||
| February 16, 2024 | |||||
| Capacity | Date | ||||||||||||||||
/s/ JAMES DIMON |
Director, Chairman and Chief Executive Officer (Principal Executive Officer) |
||||||||||||||||
| (James Dimon) | |||||||||||||||||
/s/ LINDA B. BAMMANN |
Director | ||||||||||||||||
| (Linda B. Bammann) | |||||||||||||||||
/s/ STEPHEN B. BURKE |
Director | ||||||||||||||||
| (Stephen B. Burke) | |||||||||||||||||
/s/ TODD A. COMBS |
Director | ||||||||||||||||
| (Todd A. Combs) | |||||||||||||||||
/s/ ALICIA BOLER DAVIS |
Director | February 16, 2024 | |||||||||||||||
(Alicia Boler Davis) |
|||||||||||||||||
/s/ TIMOTHY P. FLYNN |
Director | ||||||||||||||||
| (Timothy P. Flynn) | |||||||||||||||||
/s/ ALEX GORSKY |
Director | ||||||||||||||||
| (Alex Gorsky) | |||||||||||||||||
/s/ MELLODY HOBSON |
Director | ||||||||||||||||
| (Mellody Hobson) | |||||||||||||||||
/s/ MICHAEL A. NEAL |
Director | ||||||||||||||||
| (Michael A. Neal) | |||||||||||||||||
/s/ PHEBE N. NOVAKOVIC |
Director | ||||||||||||||||
| (Phebe N. Novakovic) | |||||||||||||||||
/s/ VIRGINIA M. ROMETTY |
Director | ||||||||||||||||
| (Virginia M. Rometty) | |||||||||||||||||
/s/ MARK A. WEINBERGER |
Director | ||||||||||||||||
(Mark A. Weinberger) |
|||||||||||||||||
/s/ JEREMY BARNUM |
Executive Vice President and Chief Financial Officer | ||||||||||||||||
| (Jeremy Barnum) | (Principal Financial Officer) | ||||||||||||||||
/s/ ELENA KORABLINA |
Managing Director and Firmwide Controller | ||||||||||||||||
| (Elena Korablina) | (Principal Accounting Officer) | ||||||||||||||||
322 |
JPMorgan Chase & Co./2023 Form 10-K |
|||||||
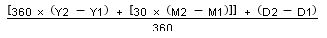
| Asset & Wealth Management | Annual negative pre-tax pre-provision income1 |
||||
| Card and Auto | Annual negative pre-tax pre-loan loss reserve income2 |
||||
| Commercial Banking | Annual negative pre-tax pre-loan loss reserve income2 |
||||
| Corporate & Investment Bank |
Annual negative pre-tax pre-provision income1 for CIB overall or annual negative allocated product revenues (excluding XVA) for:
•Fixed Income
•Equities
•Securities Services
•Global Investment Banking
•Payments
|
||||
| Consumer Banking, J.P. Morgan Wealth Management and Business Banking | Annual negative pre-tax pre-loan loss reserve income2 |
||||
| Corporate Functions (including Chief Investment Office and Strategy & Growth Office) | Annual negative pre-tax pre-provision income1 at the Firm level |
||||
| Home Lending | Annual negative pre-tax pre-loan loss reserve income2 |
||||
|
1Pre-tax pre-provision income means Revenue less Expenses
2Pre-tax pre-loan loss reserve income means Revenue less (Expenses plus Net Charge-offs)
| |||||
| Firm Reported ROTCE (average performance) | Award Payout Percentage | Firm Performance Ranking (average performance) |
Award Payout Percentage | |||||||||||
| >=_________% | _______% | #1 | ________% | |||||||||||
| #2 | ________% | |||||||||||||
| #3 | ________% | |||||||||||||
| ______% to ______% | #4 | ________% | ||||||||||||
Pay by relative ROTCE scale |
———— | #5 | ________% | |||||||||||
| #6 | ________% | |||||||||||||
| <_______% | ______% | #7 | ________% | |||||||||||
| #8 | ________% | |||||||||||||
| #9 | ________% | |||||||||||||
| #10 + | ________% | |||||||||||||
|
December 31, 2023
Name
|
Organized Under The Laws Of |
||||
| JPMorgan Chase Bank, National Association | United States | ||||
| Paymentech, LLC | United States | ||||
| J.P. Morgan International Finance Limited | United States | ||||
| JPMorgan Securities Japan Co., Ltd. | Japan | ||||
| J.P. Morgan Capital Holdings Limited | United Kingdom | ||||
| J.P. Morgan Securities PLC | United Kingdom | ||||
| J.P. Morgan SE | Germany | ||||
| JPMorgan Chase Holdings LLC | United States | ||||
| J.P. Morgan Services India Private Limited | India | ||||
| JPMorgan Asset Management Holdings Inc. | United States | ||||
| JPMorgan Distribution Services, Inc. | United States | ||||
| JPMorgan Asset Management International Limited | United Kingdom | ||||
| JPMorgan Asset Management (UK) Limited | United Kingdom | ||||
| JPMorgan Asset Management Holdings (Luxembourg) S.à r.l. | Luxembourg | ||||
| JPMorgan Asset Management (Europe) S.à r.l. | Luxembourg | ||||
| J.P. Morgan Investment Management Inc. | United States | ||||
| J.P. Morgan Broker-Dealer Holdings Inc. | United States | ||||
| J.P. Morgan Securities LLC | United States | ||||
| Securities | Guarantor | ||||
| JPMorgan Chase Financial Company LLC issues, from time to time, its Global Medium-Term Notes, Series A, under the Indenture dated February 19, 2016 that are each fully and unconditionally guaranteed by JPMorgan Chase & Co. and are currently offered and sold pursuant to a Registration Statement on Form S-3 (Registration Statement Nos. 333-236659 and 333-236659-01), which was declared effective on April 8, 2020. | JPMorgan Chase & Co. | ||||
| Date: | February 16, 2024 | By: | /s/ | James Dimon | |||||||||||||
James Dimon |
|||||||||||||||||
Chairman and Chief Executive Officer |
|||||||||||||||||
| Date: | February 16, 2024 | By: | /s/ | Jeremy Barnum | |||||||||||||
| Jeremy Barnum | |||||||||||||||||
Executive Vice President and Chief Financial Officer |
|||||||||||||||||
| Subject to | Role to Play | |||||||
| Lines of Business | •All |
|||||||
| Corporate Functions | •All |
•Human Resources |
||||||
| Locations | •All |
|||||||
| Legal Entities | •All |
|||||||
| Executive Officer | An Executive Officer is the Firm’s president, principal financial officer, principal accounting officer (or if there is no such accounting officer, the controller), any vice-president of the Firm in charge of a principal business unit, division, or function (such as sales, administration, or finance), any other officer who performs a policy-making function, or any other person who performs similar policy-making functions for the Firm. Policy-making function is not intended to include policy-making functions that are not significant. Identification of an Executive Officer for purposes of this Policy will include at a minimum executive officers identified pursuant to 17 CFR 229.401(b). | ||||
| Financial Reporting Measure | Any measure that is determined and presented in accordance with the accounting principles used in preparing the Firm’s financial statements, and any measures that are derived wholly or in part from such measure. Stock price and total shareholder return are also Financial Reporting Measures. A Financial Reporting Measure need not be presented within the Firm’s financial statements or included in a filing with the SEC. | ||||
| Incentive-Based Compensation | Any compensation that is granted, earned or vested based wholly or in part upon the attainment of a Financial Reporting Measure. | ||||
| Recovery Period | With respect to any accounting restatement, the three completed fiscal years immediately preceding the Restatement Date, and if the Firm changes its fiscal year, any transition period of less than nine months within or immediately following those three completed fiscal years. | ||||
| Restatement | An accounting restatement due to the material noncompliance of the Firm with any financial reporting requirement under the securities laws, including any required accounting restatement to correct an error in previously issued financial statements that is material to the previously issued financial statements (a “Big R” restatement), or that would result in a material misstatement if the error were corrected in the current period or left uncorrected in the current period (a “little r” restatement). | ||||