| Georgia | 1-10312 | 58-1134883 | ||||||
| (State of Incorporation) | (Commission File Number) | (IRS Employer Identification No.) | ||||||
| Title of each class | Trading Symbol | Name of each exchange on which registered | ||||||
Common Stock, $1.00 Par Value |
SNV |
New York Stock Exchange |
||||||
Fixed-to-Floating Rate Non-Cumulative Perpetual Preferred Stock, Series D |
SNV-PrD |
New York Stock Exchange |
||||||
Fixed-Rate Reset Non-Cumulative Perpetual Preferred Stock, Series E |
SNV-PrE |
New York Stock Exchange |
||||||
| Item 2.02 | Results of Operations and Financial Condition | |||||||
On October 16, 2024, Synovus Financial Corp. (the "Company") issued a press release announcing the Company’s financial results for the three and nine month period ended September 30, 2024. |
||||||||
Pursuant to General Instruction F to Current Report on Form 8-K, the press release is attached to this Current Report as Exhibit 99.1 and only those portions of the press release related to the historical results of operations of the Company for the three and nine month period ended September 30, 2024 are incorporated into this Item 2.02 by reference. The information contained in this Item 2.02, including the information set forth in the press release filed as Exhibit 99.1 to, and incorporated in, this Current Report is being "furnished" and shall not be deemed "filed" for the purposes of Section 18 of the Securities Exchange Act of 1934, as amended (the "Exchange Act"), or otherwise subject to the liabilities of that Section. The information in Exhibit 99.1 furnished pursuant to this Item 2.02 shall not be incorporated by reference into any registration statement or other documents pursuant to the Securities Act of 1933, as amended (the "Securities Act"), or into any filing or other document pursuant to the Exchange Act except as otherwise expressly stated in any such filing. |
||||||||
| Item 7.01 | Regulation FD Disclosure | |||||||
On October 16, 2024, the Company made available the supplemental information (the "Supplemental Information") and slide presentation ("Slide Presentation") prepared for use with the press release. The investor call and webcast will be held at 8:30 a.m., ET, on October 17, 2024. |
||||||||
The information contained in this Item 7.01 of this Current Report, including the information set forth in the Supplemental Information and the Slide Presentation filed as Exhibit 99.2 and Exhibit 99.3 to, and incorporated in, this Current Report, is being "furnished" and shall not be deemed "filed" for the purposes of Section 18 of the Exchange Act or otherwise subject to the liabilities of that Section. The information in Exhibit 99.2 and Exhibit 99.3 furnished pursuant to this Item 7.01 shall not be incorporated by reference into any registration statement or other documents pursuant to the Securities Act or into any filing or other document pursuant to the Exchange Act except as otherwise expressly stated in any such filing. |
||||||||
| Item 9.01 | Financial Statements and Exhibits | |||||||
| (d) | Exhibits | |||||||
| Exhibit No. | Description | |||||||
| 99.1 | ||||||||
| 99.2 | ||||||||
| 99.3 | ||||||||
| SYNOVUS FINANCIAL CORP. | |||||
| Date: October 16, 2024 | By: /s/ Allan E. Kamensky |
||||
| Name: Allan E. Kamensky | |||||
| Title: Executive Vice President and General Counsel | |||||

Media Contact |
Investor Contact | |||||||
Audria Belton |
Jennifer H. Demba, CFA | |||||||
Media Relations |
Investor Relations | |||||||
media@synovus.com |
investorrelations@synovus.com | |||||||
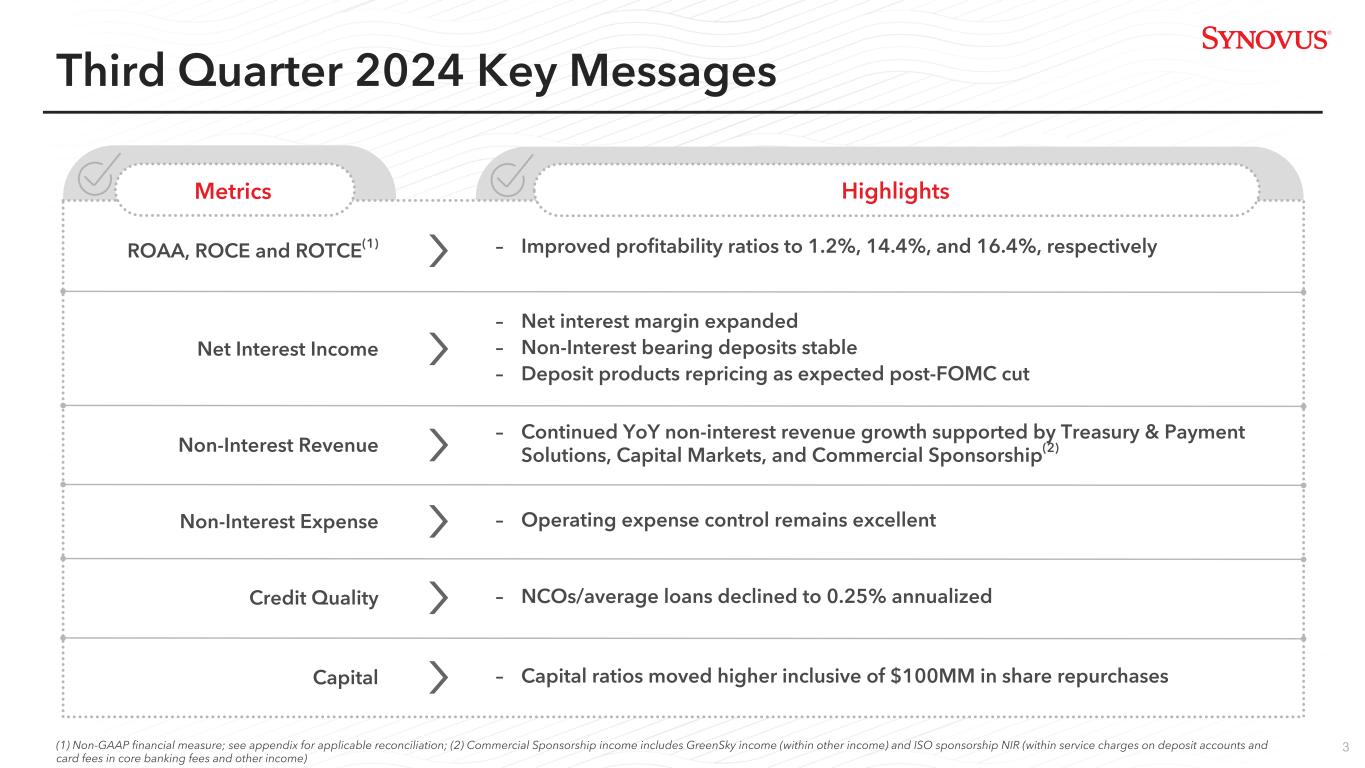
| Reported | Adjusted | ||||||||||||||||||||||||||||||||||
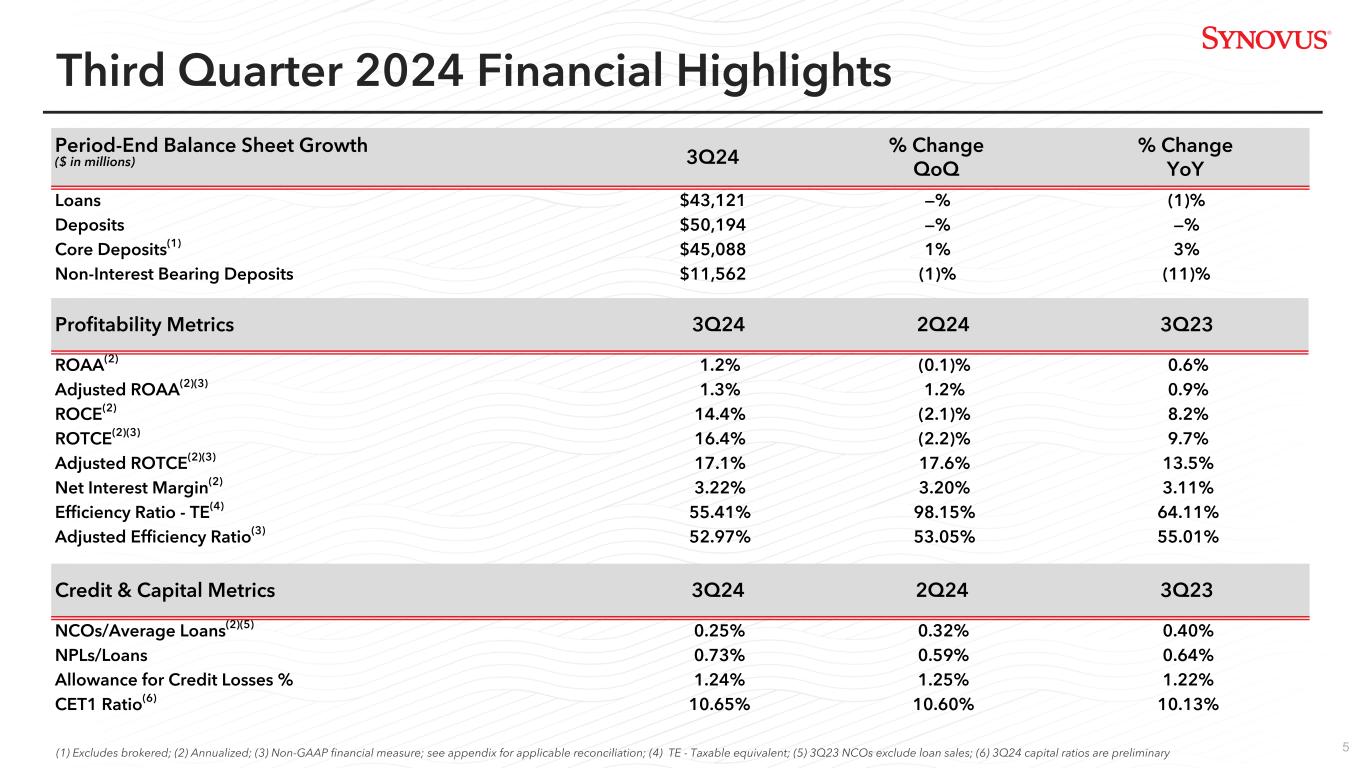
| (dollars in thousands) | 3Q24 | 2Q24 | 3Q23 | 3Q24 | 2Q24 | 3Q23 | |||||||||||||||||||||||||||||
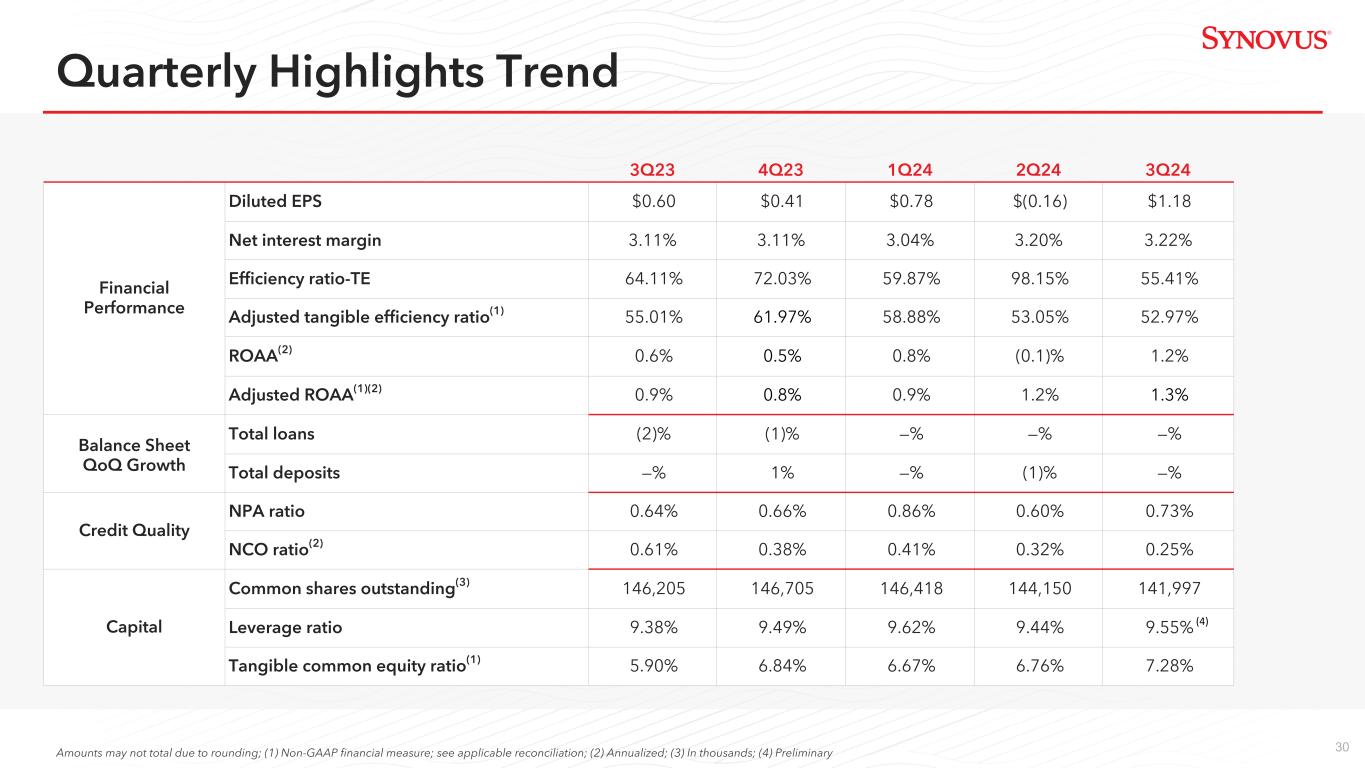
| Net income (loss) available to common shareholders | $ | 169,628 | $ | (23,741) | $ | 87,423 | $ | 177,120 | $ | 169,617 | $ | 122,770 | |||||||||||||||||||||||
Diluted earnings (loss) per share(1) |
1.18 | (0.16) | 0.60 | 1.23 | 1.16 | 0.84 | |||||||||||||||||||||||||||||
| Total revenue | 564,720 | 306,147 | 550,298 | 564,051 | 563,597 | 550,552 | |||||||||||||||||||||||||||||
| Total loans | 43,120,674 | 43,093,397 | 43,679,910 | NA | NA | NA | |||||||||||||||||||||||||||||
| Total deposits | 50,193,740 | 50,195,778 | 50,203,890 | NA | NA | NA | |||||||||||||||||||||||||||||
Return on avg assets(2) |
1.2 | % | (0.1) | % | 0.6 | % | 1.3 | % | 1.2 | % | 0.9 | % | |||||||||||||||||||||||
Return on avg common equity(2) |
14.4 | (2.1) | 8.2 | 15.0 | 15.3 | 11.5 | |||||||||||||||||||||||||||||
Return on avg tangible common equity(2) |
16.4 | (2.2) | 9.7 | 17.1 | 17.6 | 13.5 | |||||||||||||||||||||||||||||
Net interest margin(3) |
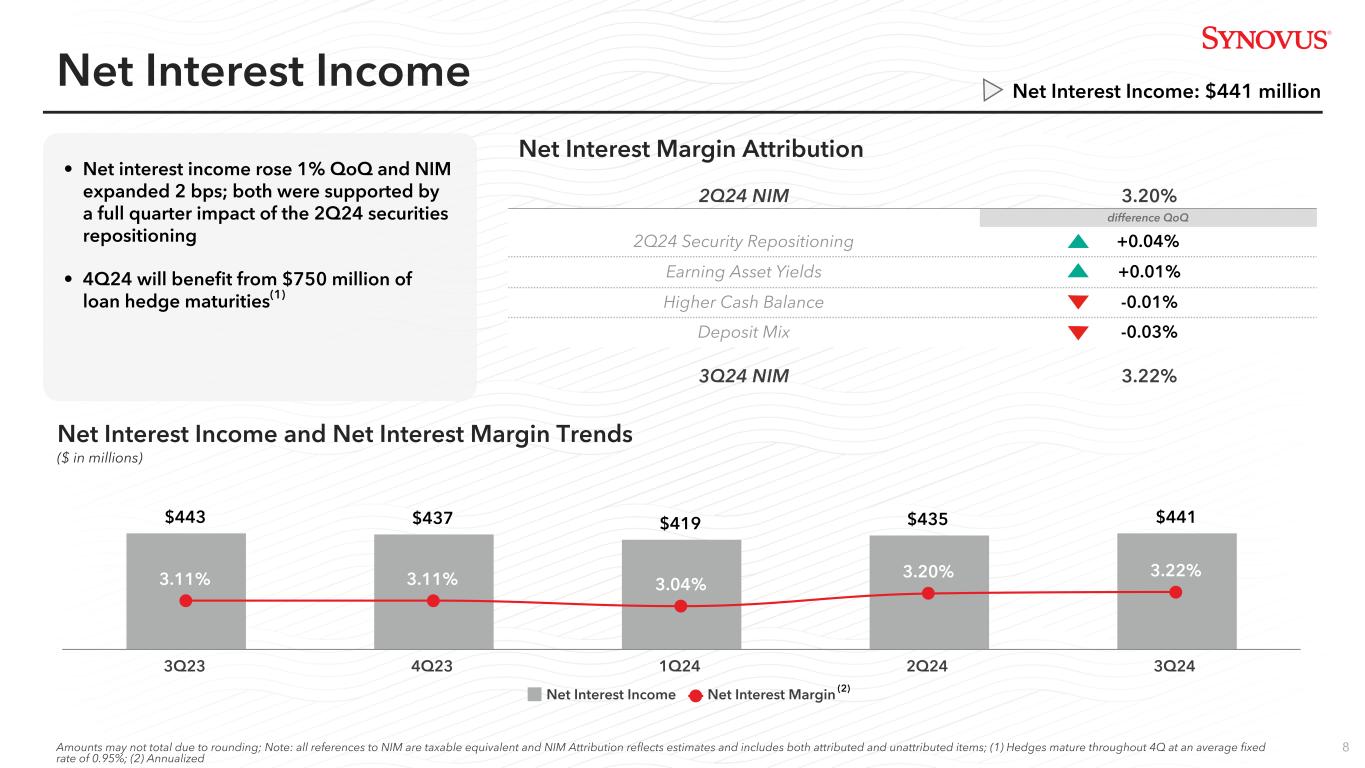
3.22 | % | 3.20 | % | 3.11 | % | NA | NA | NA | ||||||||||||||||||||||||||
Efficiency ratio-TE(3)(4) |
55.41 | 98.15 | 64.11 | 52.97 | 53.05 | 55.01 | |||||||||||||||||||||||||||||
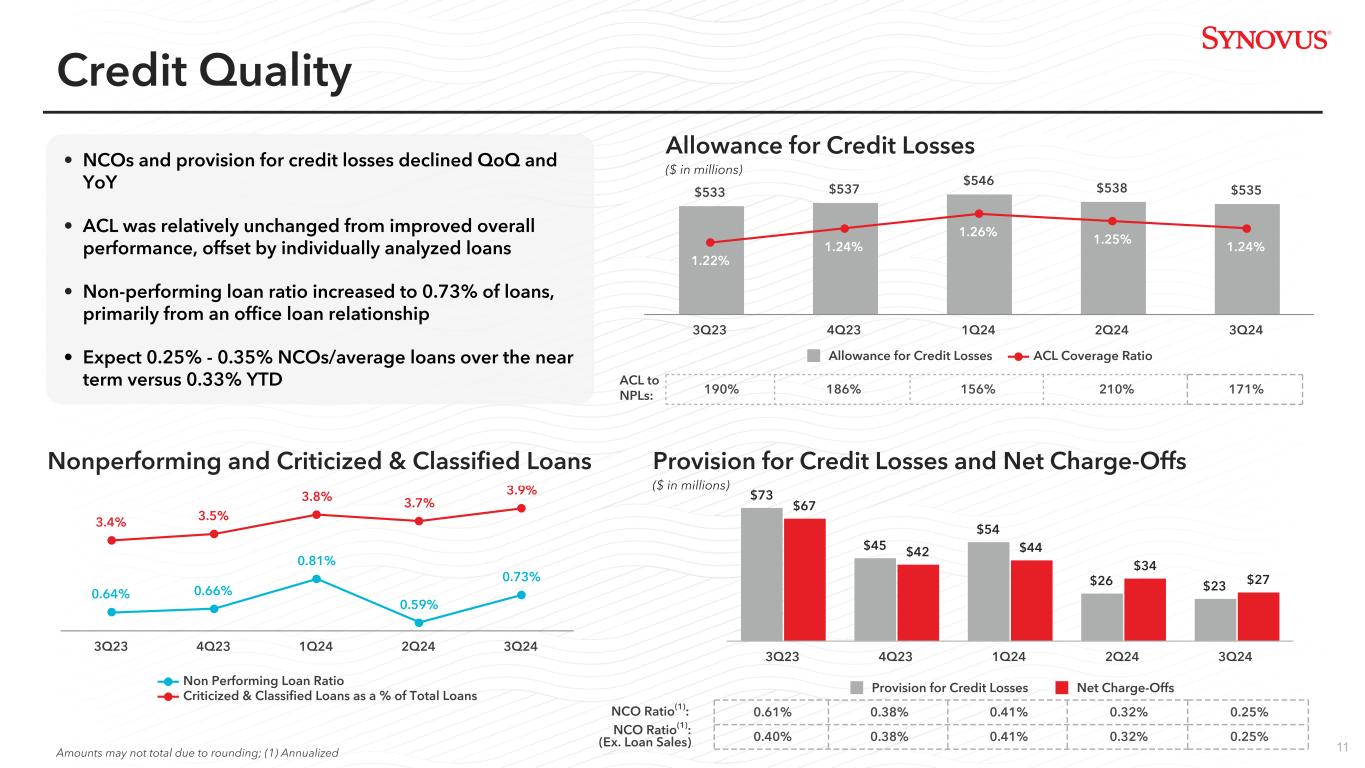
| NCO ratio-QTD | 0.25 | 0.32 | 0.61 | NA | NA | NA | |||||||||||||||||||||||||||||
| NPA ratio | 0.73 | 0.60 | 0.64 | NA | NA | NA | |||||||||||||||||||||||||||||
Loans* |
|||||||||||||||||||||||||||||||||||||||||
| (dollars in millions) | 3Q24 | 2Q24 | Linked Quarter Change | Linked Quarter % Change | 3Q23 | Year/Year Change | Year/Year % Change | ||||||||||||||||||||||||||||||||||
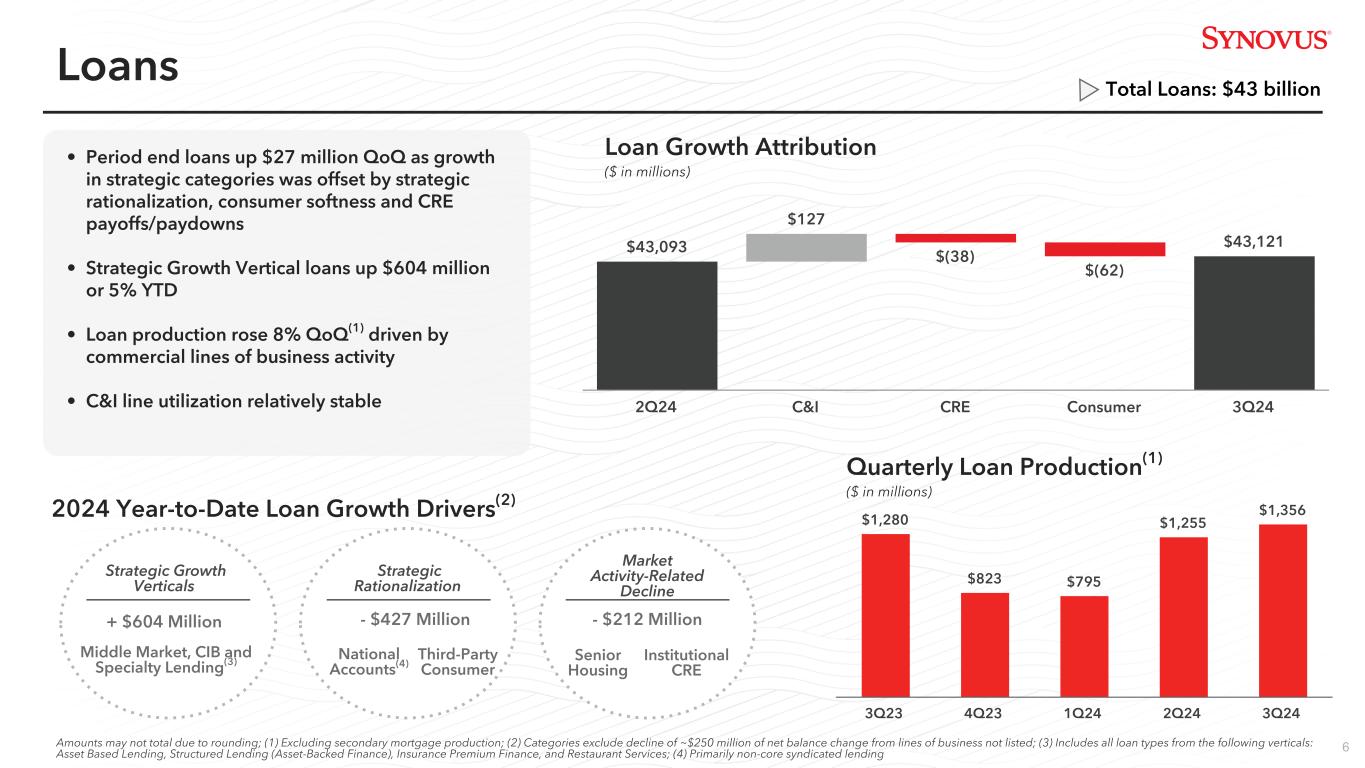
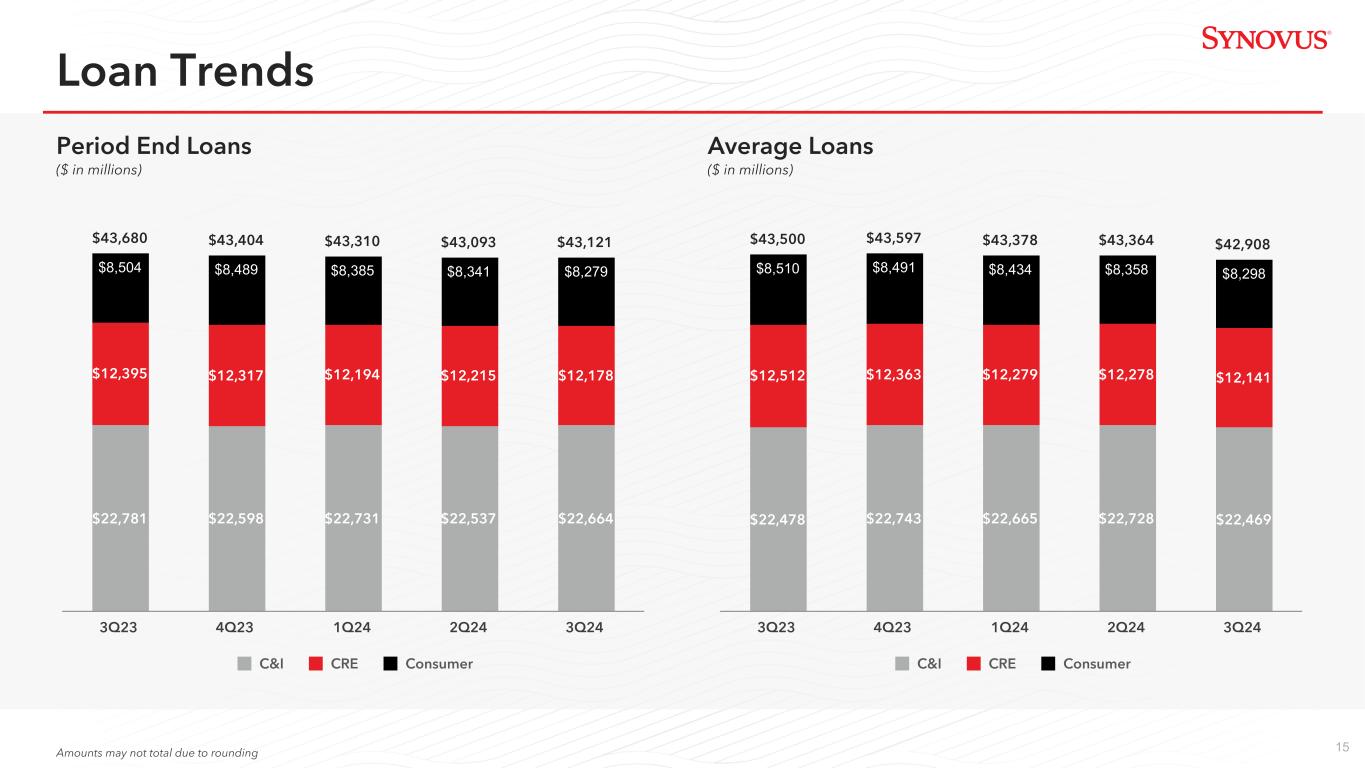
| Commercial & industrial | $ | 22,664.0 | $ | 22,536.6 | $ | 127.4 | 1 | % | $ | 22,781.0 | $ | (117.0) | (1) | % | |||||||||||||||||||||||||||
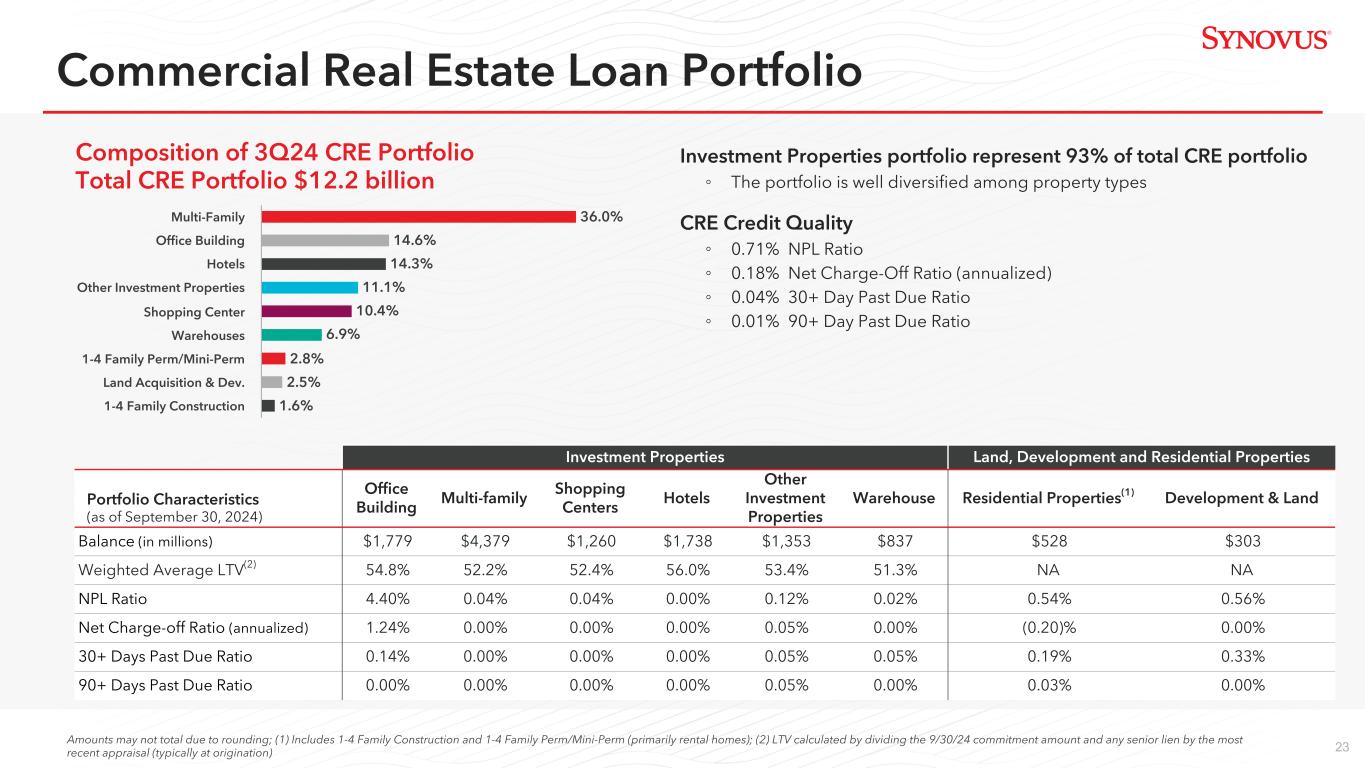
| Commercial real estate | 12,177.5 | 12,215.5 | (38.0) | — | 12,394.9 | (217.4) | (2) | ||||||||||||||||||||||||||||||||||
| Consumer | 8,279.2 | 8,341.3 | (62.1) | (1) | 8,504.1 | (224.9) | (3) | ||||||||||||||||||||||||||||||||||
| Total loans | $ | 43,120.7 | $ | 43,093.4 | $ | 27.3 | — | % | $ | 43,679.9 | $ | (559.3) | (1) | % | |||||||||||||||||||||||||||
Deposits* |
|||||||||||||||||||||||||||||||||||||||||
| (dollars in millions) | 3Q24 | 2Q24 | Linked Quarter Change | Linked Quarter % Change | 3Q23 | Year/Year Change | Year/Year % Change | ||||||||||||||||||||||||||||||||||
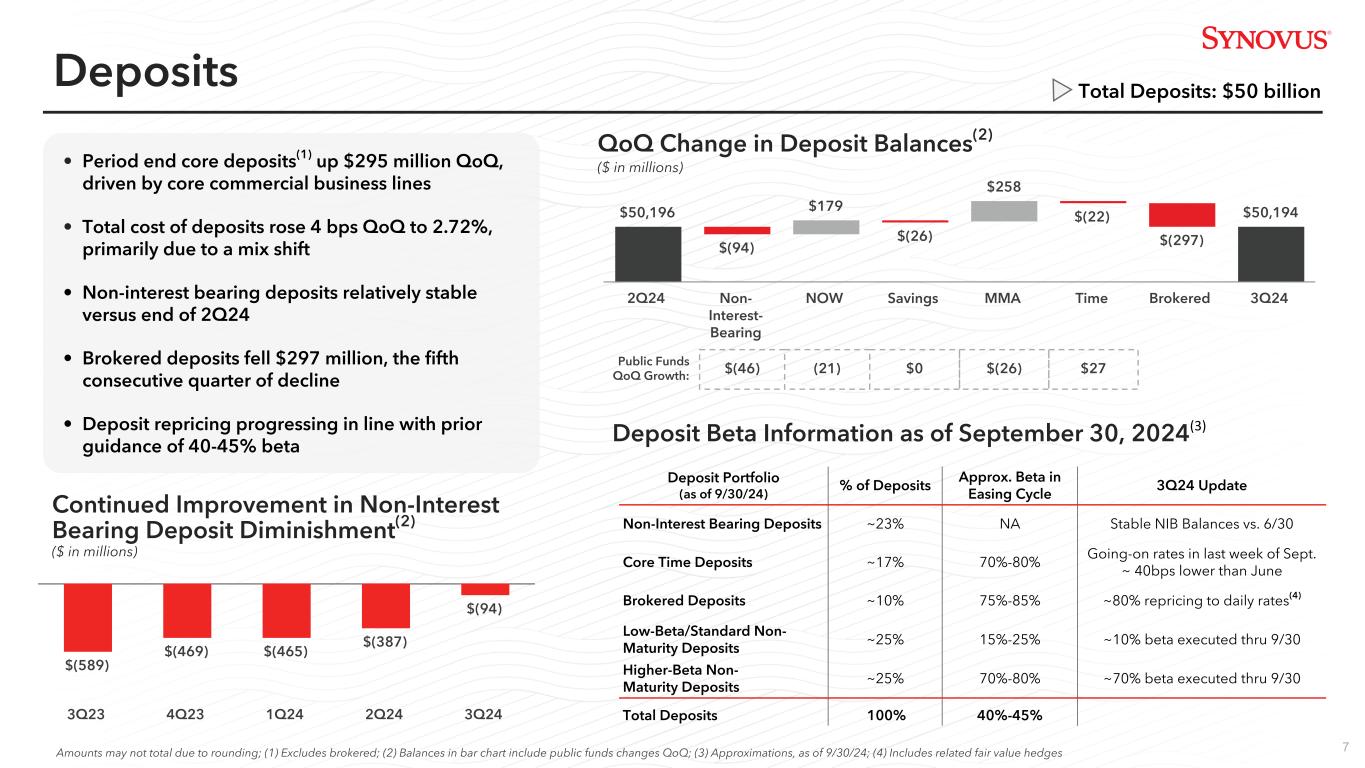
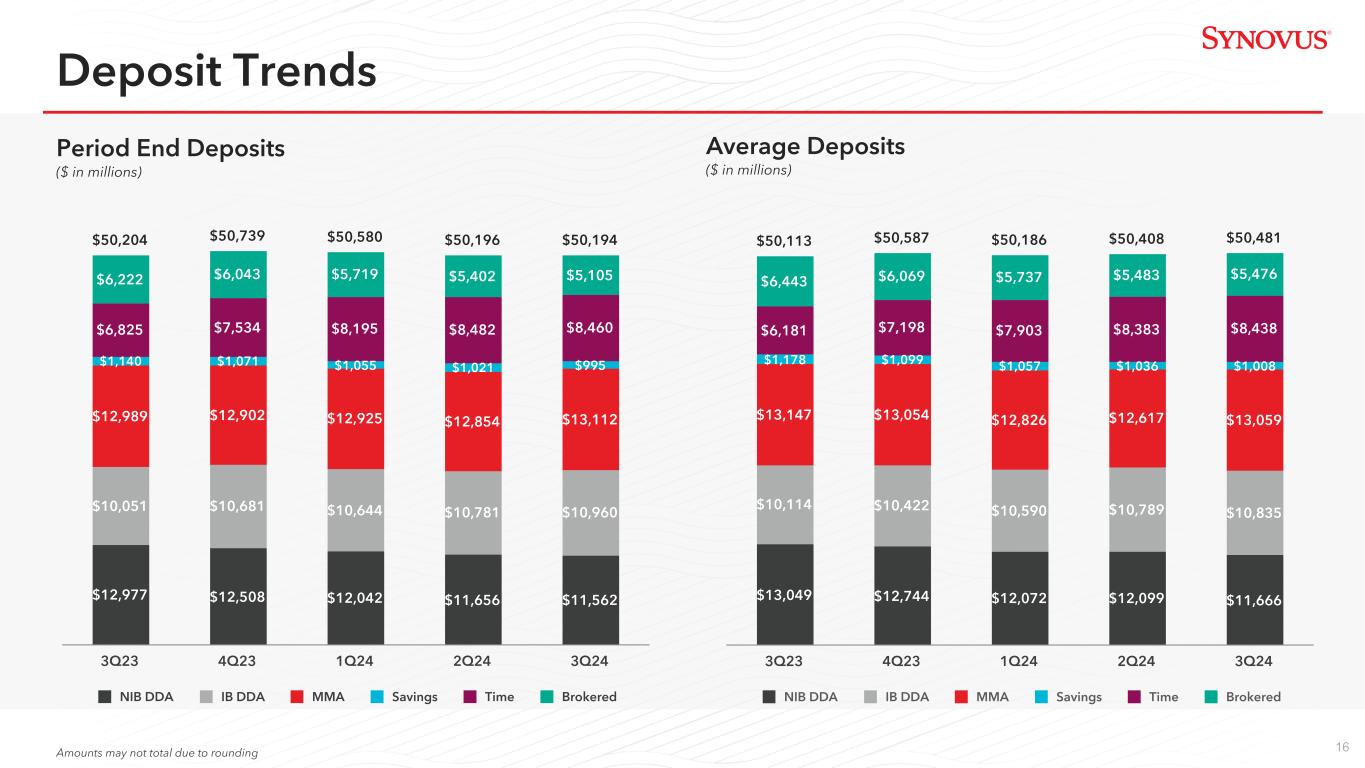
| Non-interest-bearing DDA | $ | 11,129.1 | $ | 11,177.7 | $ | (48.6) | — | % | $ | 12,395.1 | $ | (1,266.0) | (10) | % | |||||||||||||||||||||||||||
| Interest-bearing DDA | 6,821.3 | 6,621.2 | 200.1 | 3 | 6,276.1 | 545.2 | 9 | ||||||||||||||||||||||||||||||||||
| Money market | 11,031.5 | 10,747.9 | 283.6 | 3 | 10,786.3 | 245.2 | 2 | ||||||||||||||||||||||||||||||||||
| Savings | 983.2 | 1,009.8 | (26.7) | (3) | 1,132.5 | (149.3) | (13) | ||||||||||||||||||||||||||||||||||
| Public funds | 7,047.6 | 7,111.9 | (64.3) | (1) | 6,885.7 | 161.9 | 2 | ||||||||||||||||||||||||||||||||||
| Time deposits | 8,075.7 | 8,125.2 | (49.5) | (1) | 6,506.4 | 1,569.3 | 24 | ||||||||||||||||||||||||||||||||||
| Brokered deposits | 5,105.4 | 5,402.0 | (296.6) | (5) | 6,221.8 | (1,116.3) | (18) | ||||||||||||||||||||||||||||||||||
| Total deposits | $ | 50,193.7 | $ | 50,195.8 | $ | (2.0) | — | % | $ | 50,203.9 | $ | (10.2) | — | % | |||||||||||||||||||||||||||
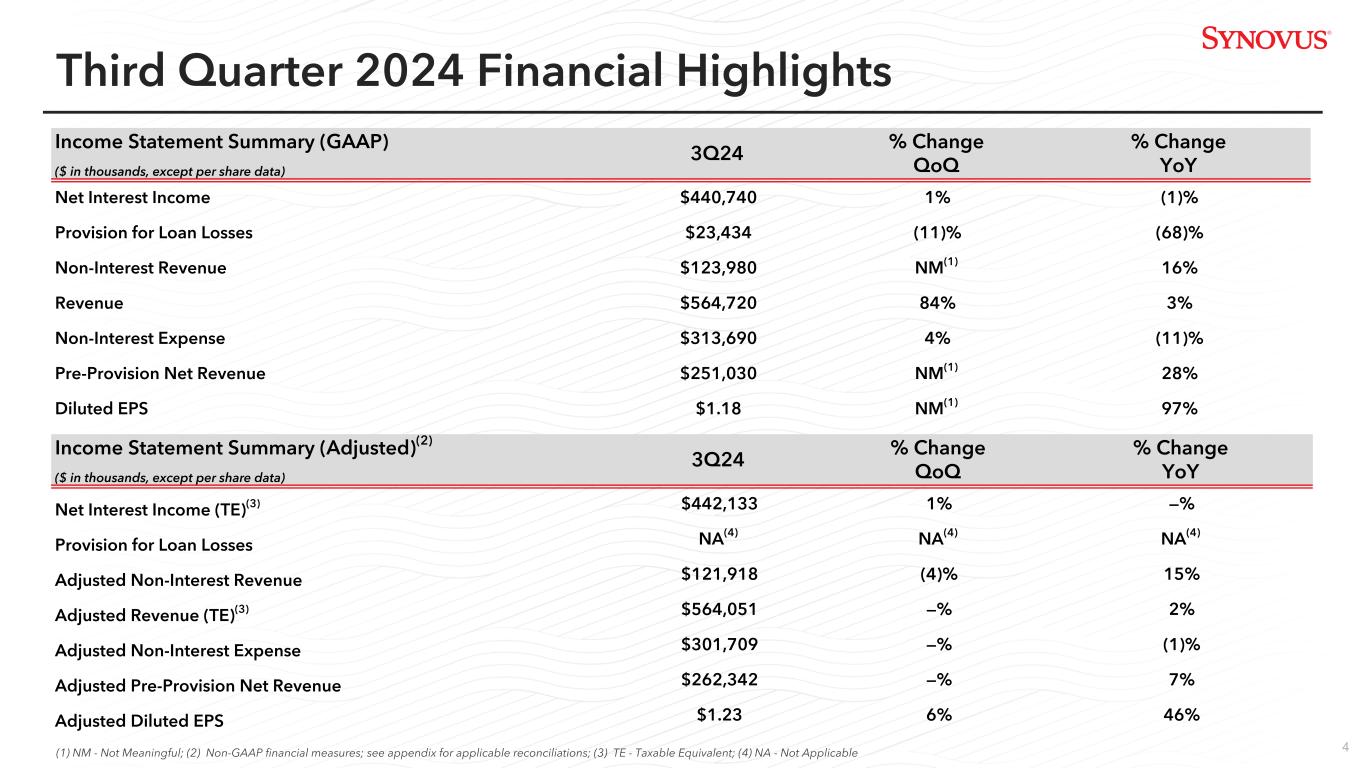
Income Statement Summary** |
|||||||||||||||||||||||||||||||||||||||||
| (in thousands, except per share data) | 3Q24 | 2Q24 | Linked Quarter Change | Linked Quarter % Change | 3Q23 | Year/Year Change | Year/Year % Change | ||||||||||||||||||||||||||||||||||
| Net interest income | $ | 440,740 | $ | 434,998 | $ | 5,742 | 1 | % | $ | 443,159 | $ | (2,419) | (1) | % | |||||||||||||||||||||||||||
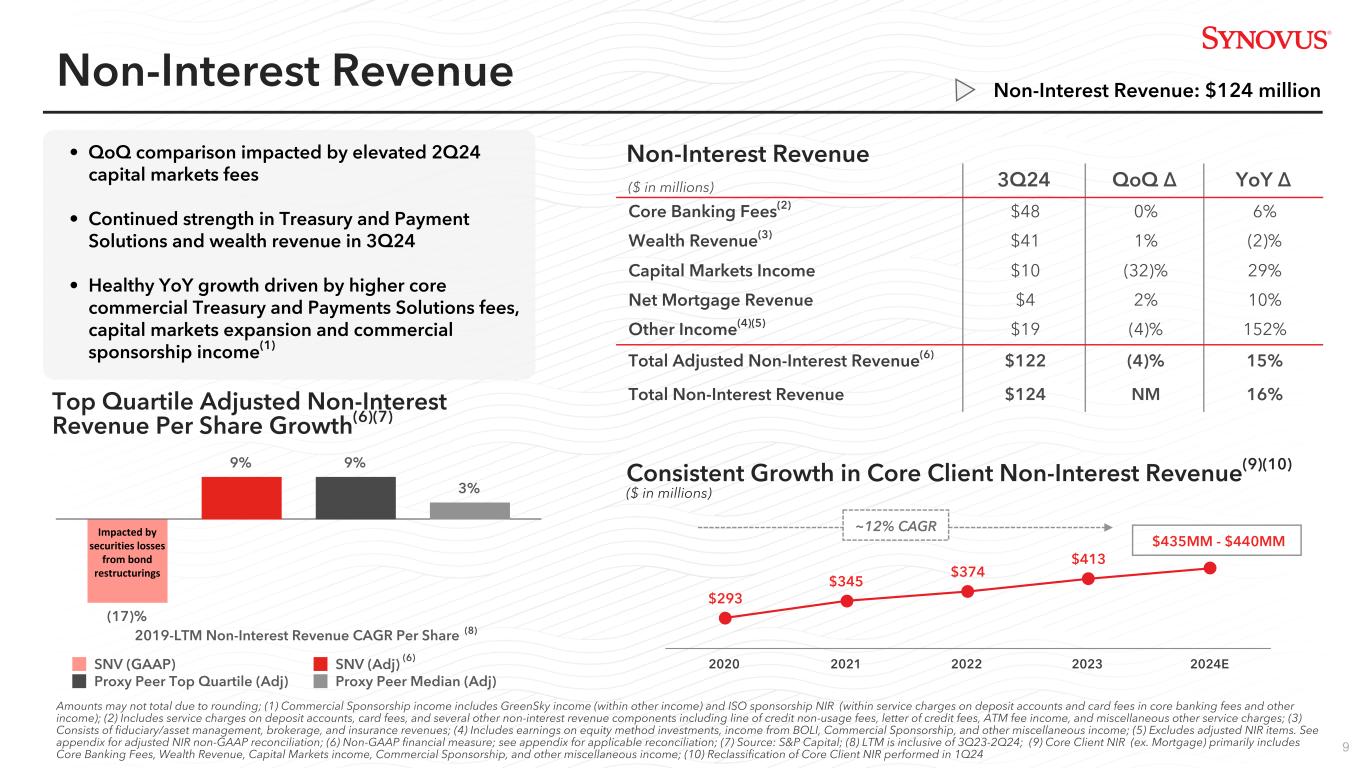
| Non-interest revenue | 123,980 | (128,851) | 252,831 | NM | 107,139 | 16,841 | 16 | ||||||||||||||||||||||||||||||||||
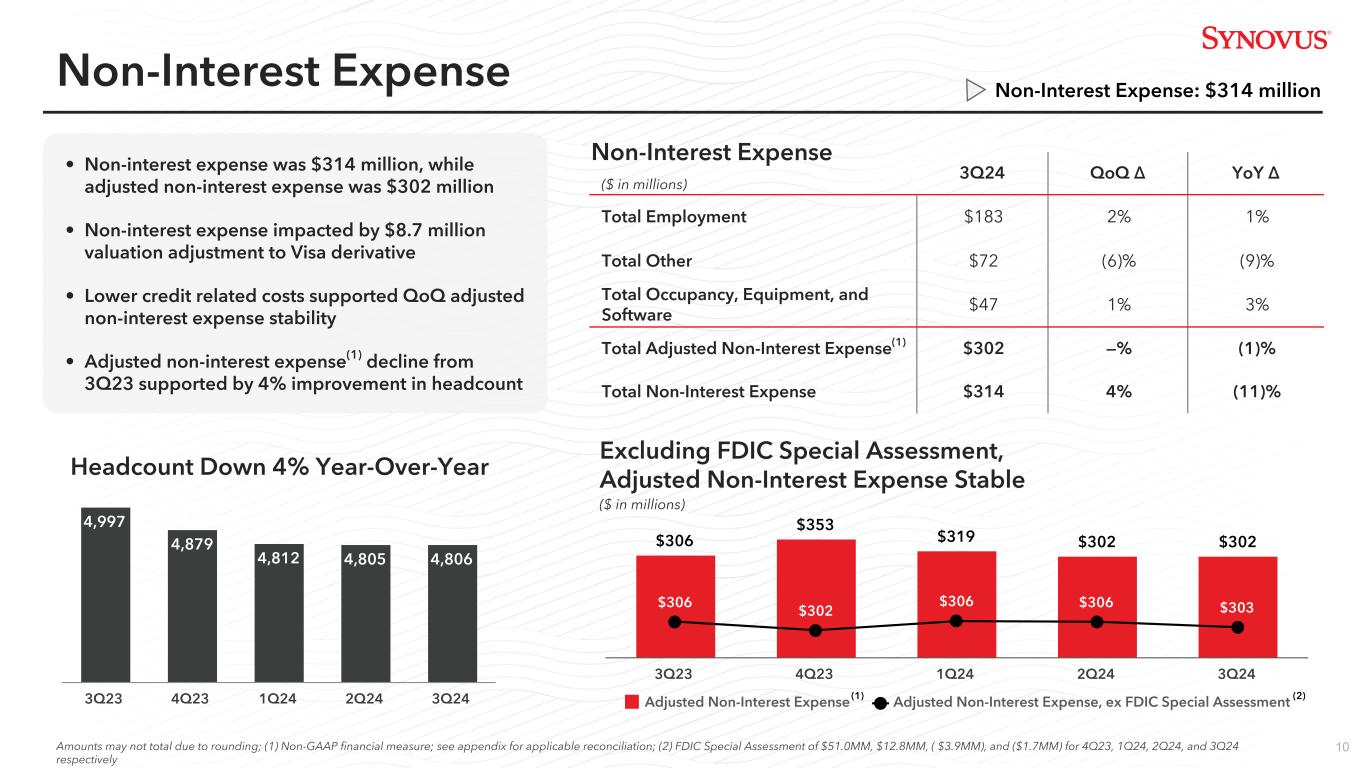
| Non-interest expense | 313,690 | 301,801 | 11,889 | 4 | 353,532 | (39,842) | (11) | ||||||||||||||||||||||||||||||||||
| Provision for (reversal of) credit losses | 23,434 | 26,404 | (2,970) | (11) | 72,572 | (49,138) | (68) | ||||||||||||||||||||||||||||||||||
| Income (loss) before taxes | $ | 227,596 | $ | (22,058) | $ | 249,654 | NM | $ | 124,194 | $ | 103,402 | 83 | % | ||||||||||||||||||||||||||||
| Income tax expense (benefit) | 46,912 | (7,378) | 54,290 | NM | 27,729 | 19,183 | 69 | ||||||||||||||||||||||||||||||||||
| Net income (loss) | 180,684 | (14,680) | 195,364 | NM | 96,465 | 84,219 | 87 | ||||||||||||||||||||||||||||||||||
| Less: Net income (loss) attributable to noncontrolling interest | (871) | (652) | (219) | (34) | (630) | (241) | (38) | ||||||||||||||||||||||||||||||||||
| Net income (loss) attributable to Synovus Financial Corp. | 181,555 | (14,028) | 195,583 | NM | 97,095 | 84,460 | 87 | ||||||||||||||||||||||||||||||||||
| Less: Preferred stock dividends | 11,927 | 9,713 | 2,214 | 23 | 9,672 | 2,255 | 23 | ||||||||||||||||||||||||||||||||||
| Net income (loss) available to common shareholders | $ | 169,628 | $ | (23,741) | $ | 193,369 | NM | $ | 87,423 | $ | 82,205 | 94 | % | ||||||||||||||||||||||||||||
| Weighted average common shares outstanding, diluted | 143,979 | 145,565 | (1,586) | (1) | % | 146,740 | (2,761) | (2) | % | ||||||||||||||||||||||||||||||||
| Diluted earnings (loss) per share | $ | 1.18 | $ | (0.16) | $ | 1.34 | NM | $ | 0.60 | $ | 0.58 | 97 | |||||||||||||||||||||||||||||
Adjusted diluted earnings per share(1) |
1.23 | 1.16 | 0.07 | 6 | 0.84 | 0.39 | 46 | ||||||||||||||||||||||||||||||||||
| Effective tax rate | 20.61% | 33.45% | 22.33% | ||||||||||||||||||||||||||||||||||||||
| Capital Ratios | |||||||||||||||||
| 3Q24 | 2Q24 | 3Q23 | |||||||||||||||
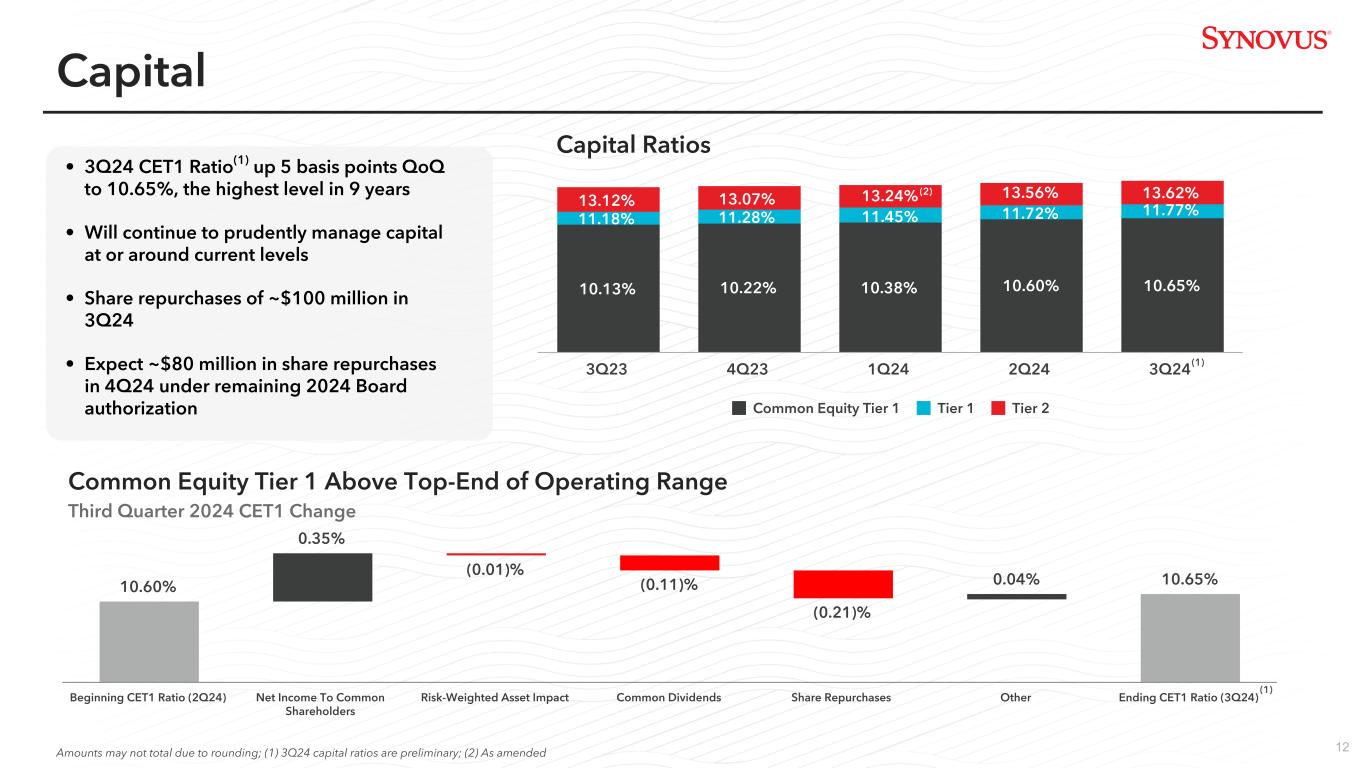
| Common Equity Tier 1 capital (CET1) ratio | 10.65 | % | (1) |
10.60 | % | 10.13 | % | ||||||||||
| Tier 1 capital ratio | 11.77 | (1) |
11.72 | 11.18 | |||||||||||||
| Total risk-based capital ratio | 13.62 | (1) |
13.56 | 13.12 | |||||||||||||
| Tier 1 leverage ratio | 9.55 | (1) |
9.44 | 9.38 | |||||||||||||
| Tangible common equity ratio | 7.28 | 6.76 | 5.90 | ||||||||||||||
| Reconciliation of Non-GAAP Financial Measures | |||||||||||||||||
| (dollars in thousands) | 3Q24 | 2Q24 | 3Q23 | ||||||||||||||
| Adjusted non-interest revenue | |||||||||||||||||
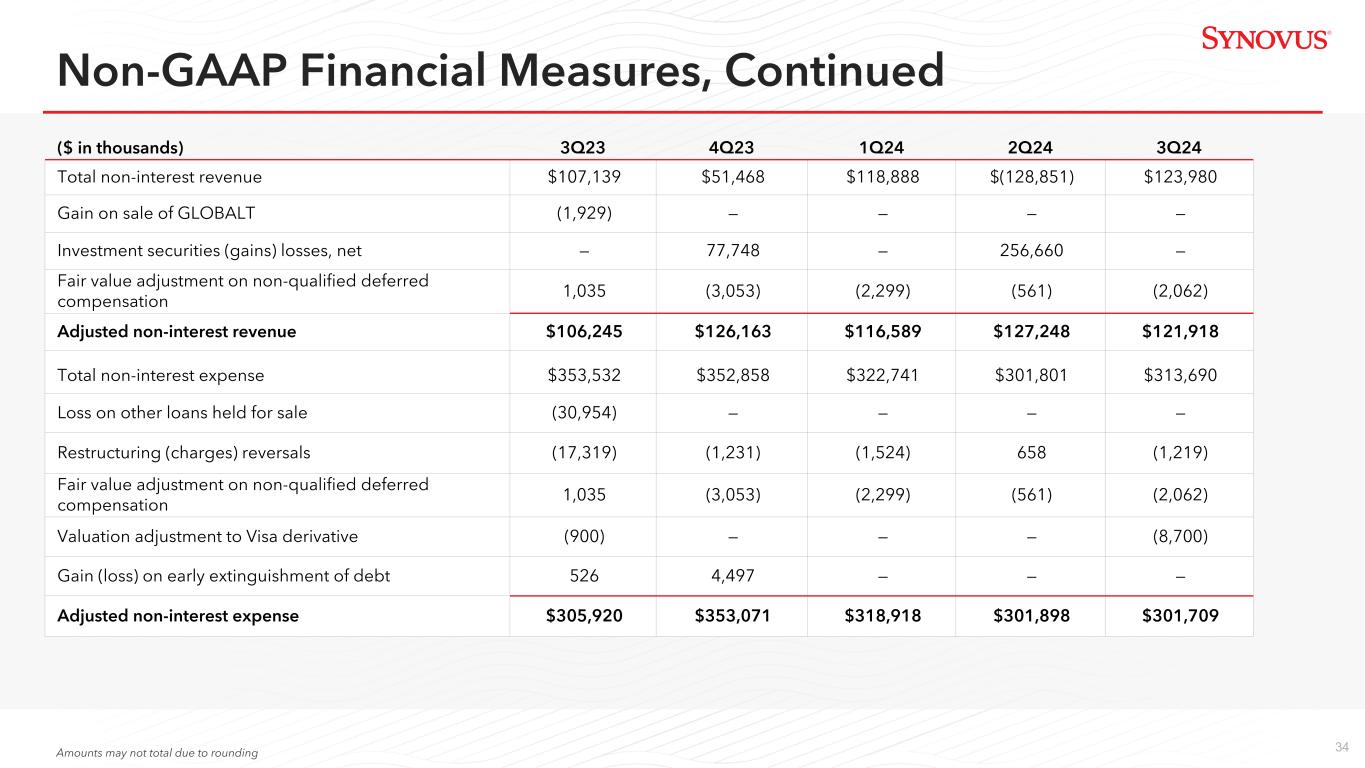
| Total non-interest revenue | $ | 123,980 | $ | (128,851) | $ | 107,139 | |||||||||||
| Investment securities (gains) losses, net | — | 256,660 | — | ||||||||||||||
| Gain on sale of GLOBALT | — | — | (1,929) | ||||||||||||||
| Fair value adjustment on non-qualified deferred compensation | (2,062) | (561) | 1,035 | ||||||||||||||
| Adjusted non-interest revenue | $ | 121,918 | $ | 127,248 | $ | 106,245 | |||||||||||
| Adjusted non-interest expense | |||||||||||||||||
| Total non-interest expense | $ | 313,690 | $ | 301,801 | $ | 353,532 | |||||||||||
| (Loss) gain on other loans held for sale | — | — | (30,954) | ||||||||||||||
| Gain (loss) on early extinguishment of debt | — | — | 526 | ||||||||||||||
| Restructuring (charges) reversals | (1,219) | 658 | (17,319) | ||||||||||||||
| Valuation adjustment to Visa derivative | (8,700) | — | (900) | ||||||||||||||
| Fair value adjustment on non-qualified deferred compensation | (2,062) | (561) | 1,035 | ||||||||||||||
Adjusted non-interest expense |
$ | 301,709 | $ | 301,898 | $ | 305,920 | |||||||||||
| Reconciliation of Non-GAAP Financial Measures, continued | |||||||||||||||||
| (dollars in thousands) | 3Q24 | 2Q24 | 3Q23 | ||||||||||||||
| Adjusted revenue (TE) and tangible efficiency ratio | |||||||||||||||||
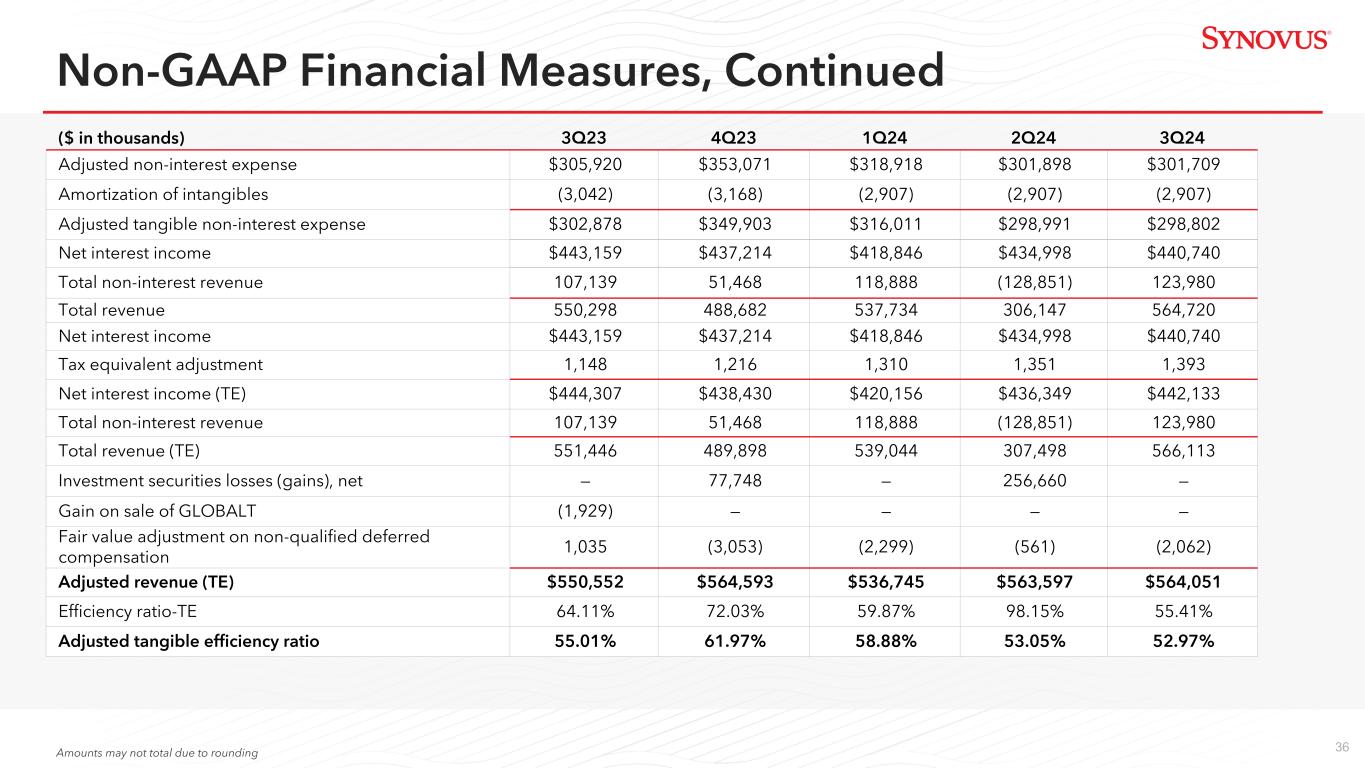
Adjusted non-interest expense |
$ | 301,709 | $ | 301,898 | $ | 305,920 | |||||||||||
| Amortization of intangibles | (2,907) | (2,907) | (3,042) | ||||||||||||||
Adjusted tangible non-interest expense |
$ | 298,802 | $ | 298,991 | $ | 302,878 | |||||||||||
Net interest income |
$ | 440,740 | $ | 434,998 | $ | 443,159 | |||||||||||
| Tax equivalent adjustment | 1,393 | 1,351 | 1,148 | ||||||||||||||
| Net interest income (TE) | 442,133 | 436,349 | 444,307 | ||||||||||||||
| Net interest income | $ | 440,740 | $ | 434,998 | $ | 443,159 | |||||||||||
Total non-interest revenue |
123,980 | (128,851) | 107,139 | ||||||||||||||
Total revenue |
$ | 564,720 | $ | 306,147 | $ | 550,298 | |||||||||||
| Tax equivalent adjustment | 1,393 | 1,351 | 1,148 | ||||||||||||||
| Total TE revenue | 566,113 | 307,498 | 551,446 | ||||||||||||||
| Investment securities losses (gains), net | — | 256,660 | — | ||||||||||||||
| Gain on sale of GLOBALT | — | — | (1,929) | ||||||||||||||
| Fair value adjustment on non-qualified deferred compensation | (2,062) | (561) | 1,035 | ||||||||||||||
Adjusted revenue (TE) |
$ | 564,051 | $ | 563,597 | $ | 550,552 | |||||||||||
Efficiency ratio-TE |
55.41 | % | 98.15 | % | 64.11 | % | |||||||||||
Adjusted tangible efficiency ratio |
52.97 | 53.05 | 55.01 | ||||||||||||||
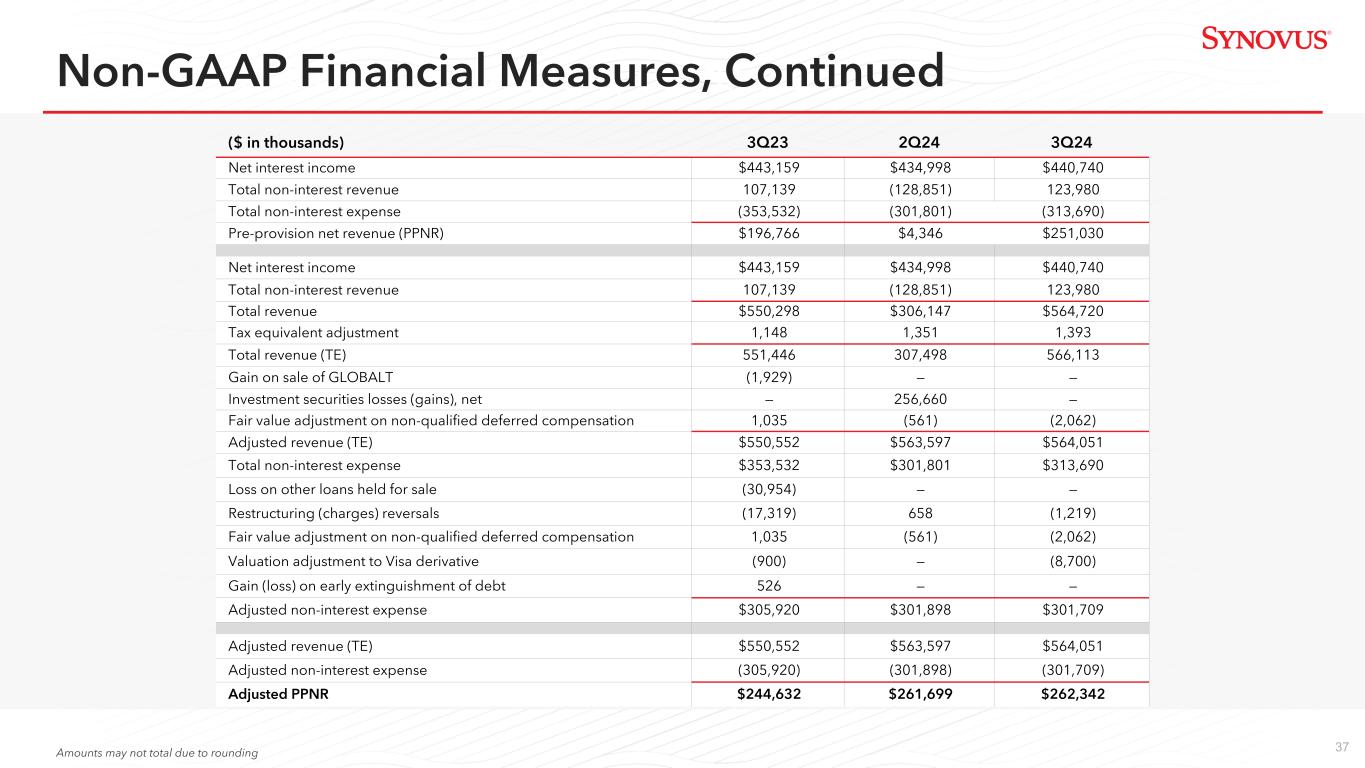
| Adjusted pre-provision net revenue | |||||||||||||||||
| Net interest income | $ | 440,740 | $ | 434,998 | $ | 443,159 | |||||||||||
| Total non-interest revenue | 123,980 | (128,851) | 107,139 | ||||||||||||||
| Total non-interest expense | (313,690) | (301,801) | (353,532) | ||||||||||||||
| Pre-provision net revenue (PPNR) | $ | 251,030 | $ | 4,346 | $ | 196,766 | |||||||||||
Adjusted revenue (TE) |
564,051 | 563,597 | 550,552 | ||||||||||||||
Adjusted non-interest expense |
(301,709) | (301,898) | (305,920) | ||||||||||||||
| Adjusted PPNR | $ | 262,342 | $ | 261,699 | $ | 244,632 | |||||||||||
| Reconciliation of Non-GAAP Financial Measures, continued | |||||||||||||||||
| (dollars in thousands) | 3Q24 | 2Q24 | 3Q23 | ||||||||||||||
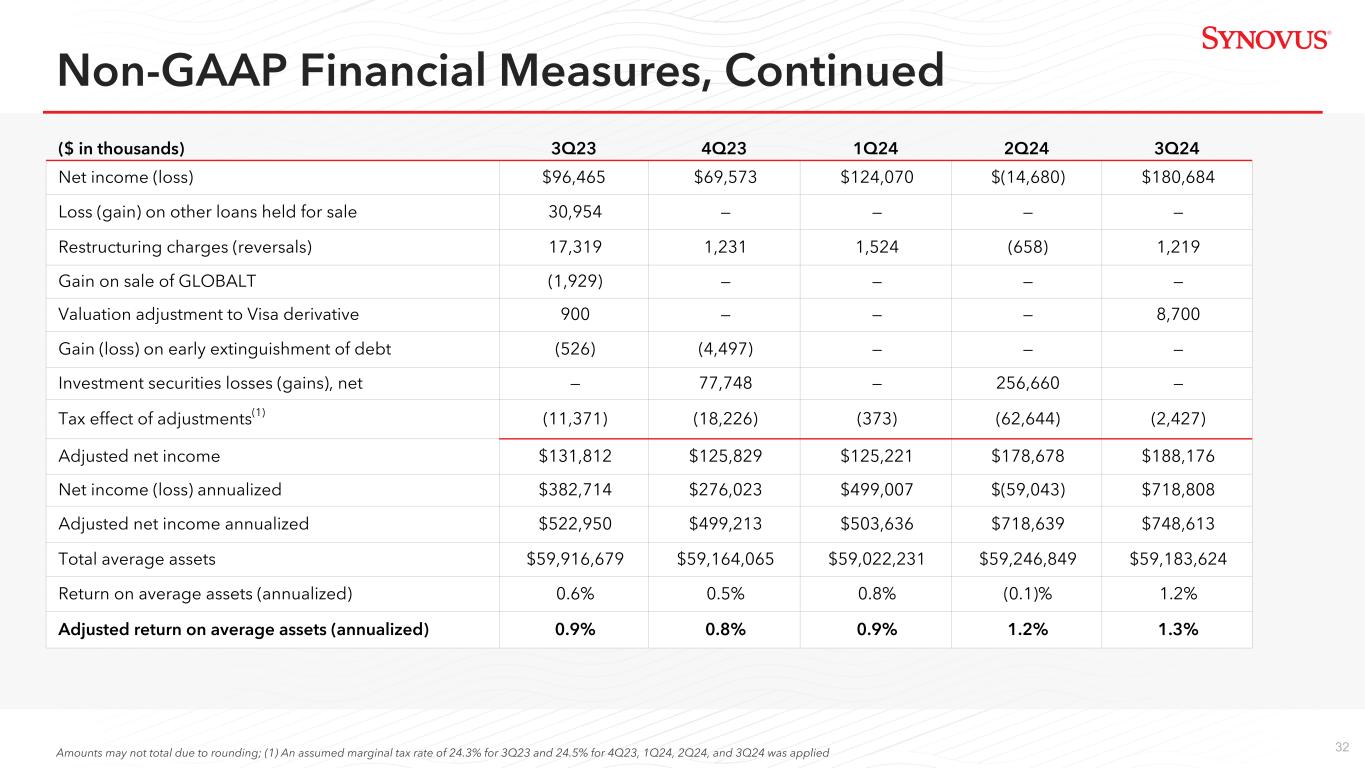
| Adjusted return on average assets (annualized) | |||||||||||||||||
| Net income (loss) | $ | 180,684 | $ | (14,680) | $ | 96,465 | |||||||||||
| Loss (gain) on other loans held for sale | — | — | 30,954 | ||||||||||||||
| (Gain) loss on early extinguishment of debt | — | — | (526) | ||||||||||||||
| Gain on sale of GLOBALT | — | — | (1,929) | ||||||||||||||
| Restructuring charges (reversals) | 1,219 | (658) | 17,319 | ||||||||||||||
| Valuation adjustment to Visa derivative | 8,700 | — | 900 | ||||||||||||||
| Investment securities losses (gains), net | — | 256,660 | — | ||||||||||||||
Tax effect of adjustments(1) |
(2,427) | (62,644) | (11,371) | ||||||||||||||
| Adjusted net income | $ | 188,176 | $ | 178,678 | $ | 131,812 | |||||||||||
| Net income (loss) annualized | $ | 718,808 | $ | (59,043) | $ | 382,714 | |||||||||||
| Adjusted net income annualized | $ | 748,613 | $ | 718,639 | $ | 522,950 | |||||||||||
| Total average assets | $ | 59,183,624 | $ | 59,246,849 | $ | 59,916,679 | |||||||||||
| Return on average assets (annualized) | 1.2 | % | (0.1) | % | 0.6 | % | |||||||||||
| Adjusted return on average assets (annualized) | 1.3 | 1.2 | 0.9 | ||||||||||||||
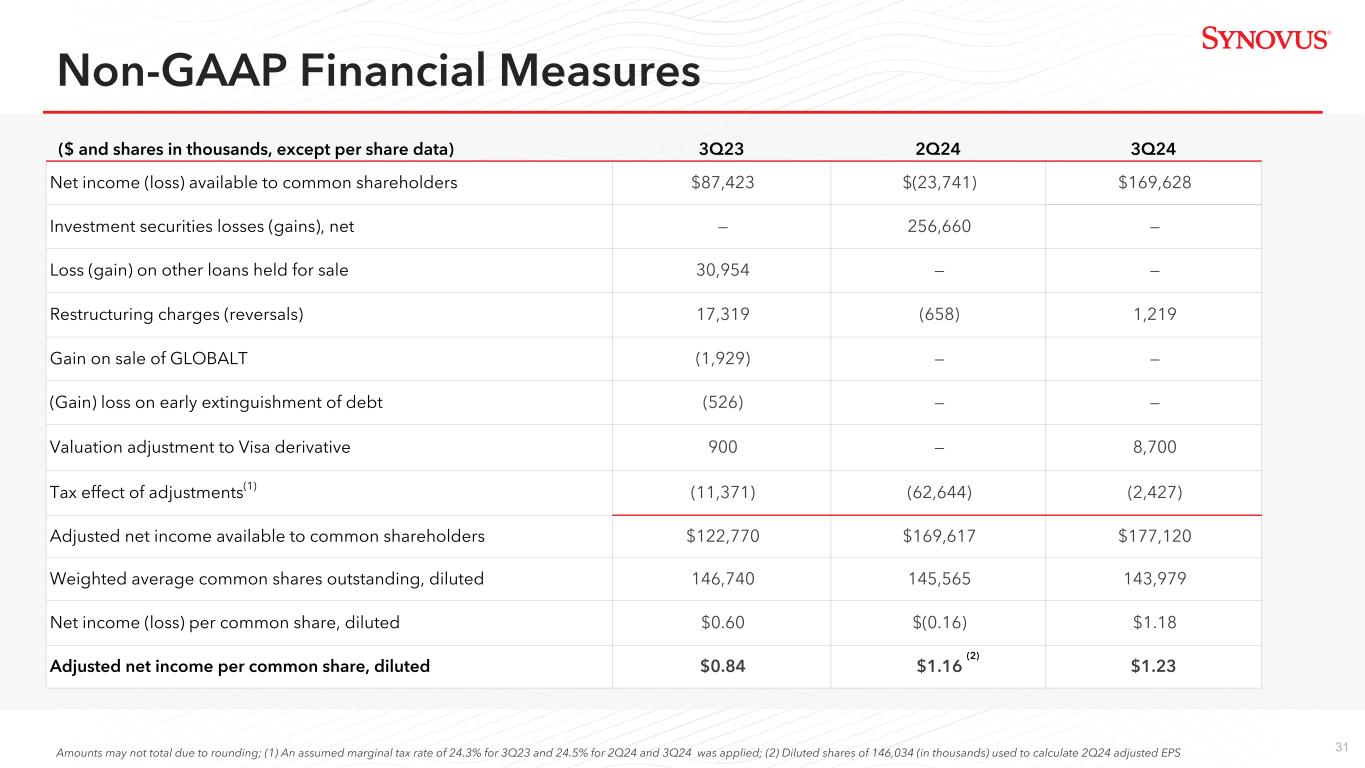
Adjusted net income available to common shareholders and adjusted diluted earnings per share |
|||||||||||||||||
| Net income (loss) available to common shareholders | $ | 169,628 | $ | (23,741) | $ | 87,423 | |||||||||||
| Gain on sale of GLOBALT | — | — | (1,929) | ||||||||||||||
| Loss (gain) on other loans held for sale | — | — | 30,954 | ||||||||||||||
| (Gain) loss on early extinguishment of debt | — | — | (526) | ||||||||||||||
| Restructuring charges (reversals) | 1,219 | (658) | 17,319 | ||||||||||||||
| Valuation adjustment to Visa derivative | 8,700 | — | 900 | ||||||||||||||
| Investment securities losses (gains), net | — | 256,660 | — | ||||||||||||||
Tax effect of adjustments(1) |
(2,427) | (62,644) | (11,371) | ||||||||||||||
| Adjusted net income available to common shareholders | $ | 177,120 | $ | 169,617 | $ | 122,770 | |||||||||||
Weighted average common shares outstanding, diluted(2) |
143,979 | 145,565 | 146,740 | ||||||||||||||
| Diluted earnings per share | $ | 1.18 | $ | (0.16) | $ | 0.60 | |||||||||||
| Adjusted diluted earnings per share | 1.23 | 1.16 | 0.84 | ||||||||||||||
(1) An assumed marginal tax rate of 24.5% for 3Q24 and 2Q24 and 24.3% for 3Q23 was applied. |
|||||||||||||||||
(2) Diluted shares of 146,034 (in thousands) used to calculate 2Q24 adjusted diluted earnings per share. |
|||||||||||||||||
| Reconciliation of Non-GAAP Financial Measures, continued | |||||||||||||||||
| (dollars in thousands) | 3Q24 | 2Q24 | 3Q23 | ||||||||||||||
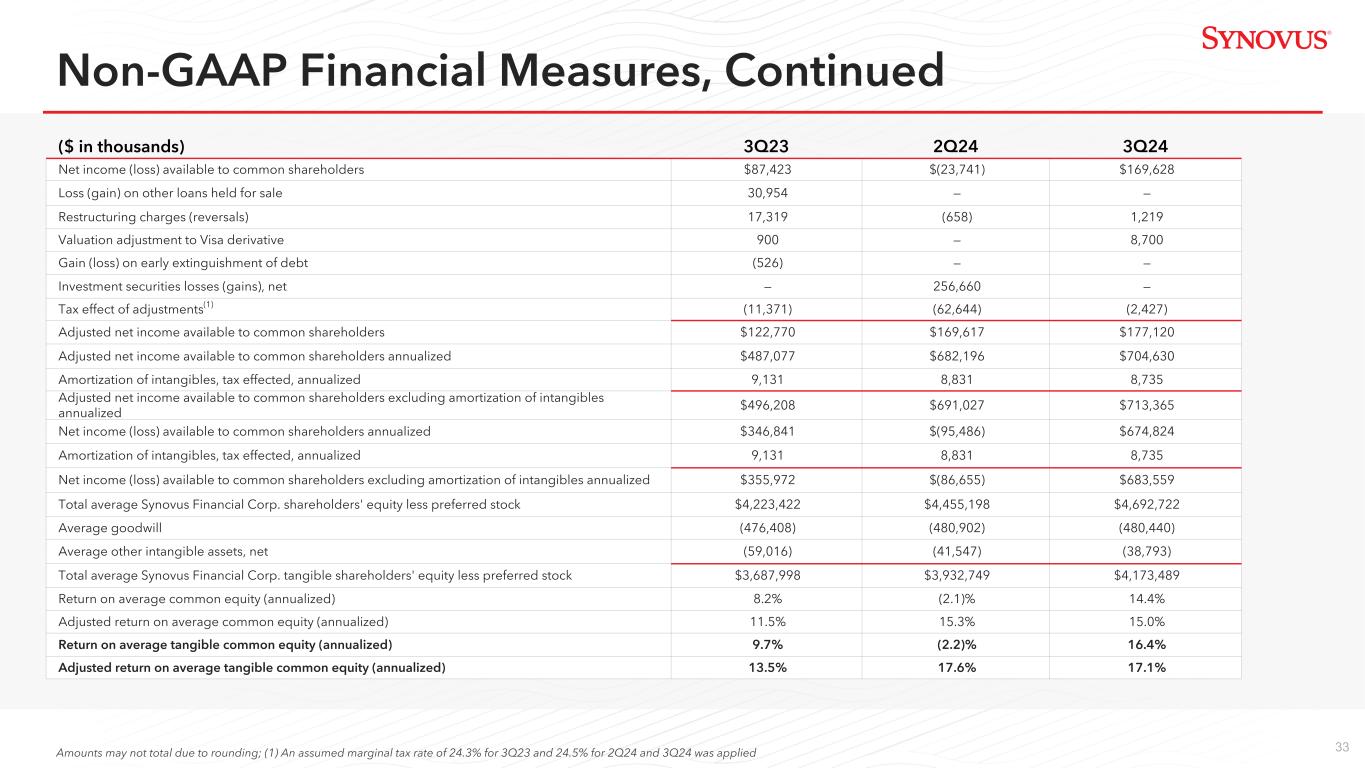
Adjusted return on average common equity, return on average tangible common equity, and adjusted return on average tangible common equity (annualized) |
|||||||||||||||||
| Net income (loss) available to common shareholders | $ | 169,628 | $ | (23,741) | $ | 87,423 | |||||||||||
| Loss (gain) on other loans held for sale | — | — | 30,954 | ||||||||||||||
| (Gain) loss on early extinguishment of debt | — | — | (526) | ||||||||||||||
| Gain on sale of GLOBALT | — | — | (1,929) | ||||||||||||||
| Restructuring charges (reversals) | 1,219 | (658) | 17,319 | ||||||||||||||
| Valuation adjustment to Visa derivative | 8,700 | — | 900 | ||||||||||||||
| Investment securities losses (gains), net | — | 256,660 | — | ||||||||||||||
Tax effect of adjustments(1) |
(2,427) | (62,644) | (11,371) | ||||||||||||||
Adjusted net income available to common shareholders |
$ | 177,120 | $ | 169,617 | $ | 122,770 | |||||||||||
Adjusted net income available to common shareholders annualized |
$ | 704,630 | $ | 682,196 | $ | 487,077 | |||||||||||
Amortization of intangibles, tax effected, annualized |
8,735 | 8,831 | 9,131 | ||||||||||||||
Adjusted net income available to common shareholders excluding amortization of intangibles annualized |
$ | 713,365 | $ | 691,027 | $ | 496,208 | |||||||||||
Net income (loss) available to common shareholders annualized |
$ | 674,824 | $ | (95,486) | $ | 346,841 | |||||||||||
| Amortization of intangibles, tax effected, annualized | 8,735 | 8,831 | 9,131 | ||||||||||||||
| Net income (loss) available to common shareholders excluding amortization of intangibles annualized | $ | 683,559 | $ | (86,655) | $ | 355,972 | |||||||||||
| Total average Synovus Financial Corp. shareholders' equity less preferred stock | $ | 4,692,722 | $ | 4,455,198 | $ | 4,223,422 | |||||||||||
| Average goodwill | (480,440) | (480,902) | (476,408) | ||||||||||||||
| Average other intangible assets, net | (38,793) | (41,547) | (59,016) | ||||||||||||||
| Total average Synovus Financial Corp. tangible shareholders' equity less preferred stock | $ | 4,173,489 | $ | 3,932,749 | $ | 3,687,998 | |||||||||||
| Return on average common equity (annualized) | 14.4 | % | (2.1) | % | 8.2 | % | |||||||||||
| Adjusted return on average common equity (annualized) | 15.0 | 15.3 | 11.5 | ||||||||||||||
| Return on average tangible common equity (annualized) | 16.4 | (2.2) | 9.7 | ||||||||||||||
| Adjusted return on average tangible common equity (annualized) | 17.1 | 17.6 | 13.5 | ||||||||||||||
(1) An assumed marginal tax rate of 24.5% for 3Q24 and 2Q24 and 24.3% for 3Q23 was applied. |
|||||||||||||||||
| Reconciliation of Non-GAAP Financial Measures, continued | |||||||||||||||||
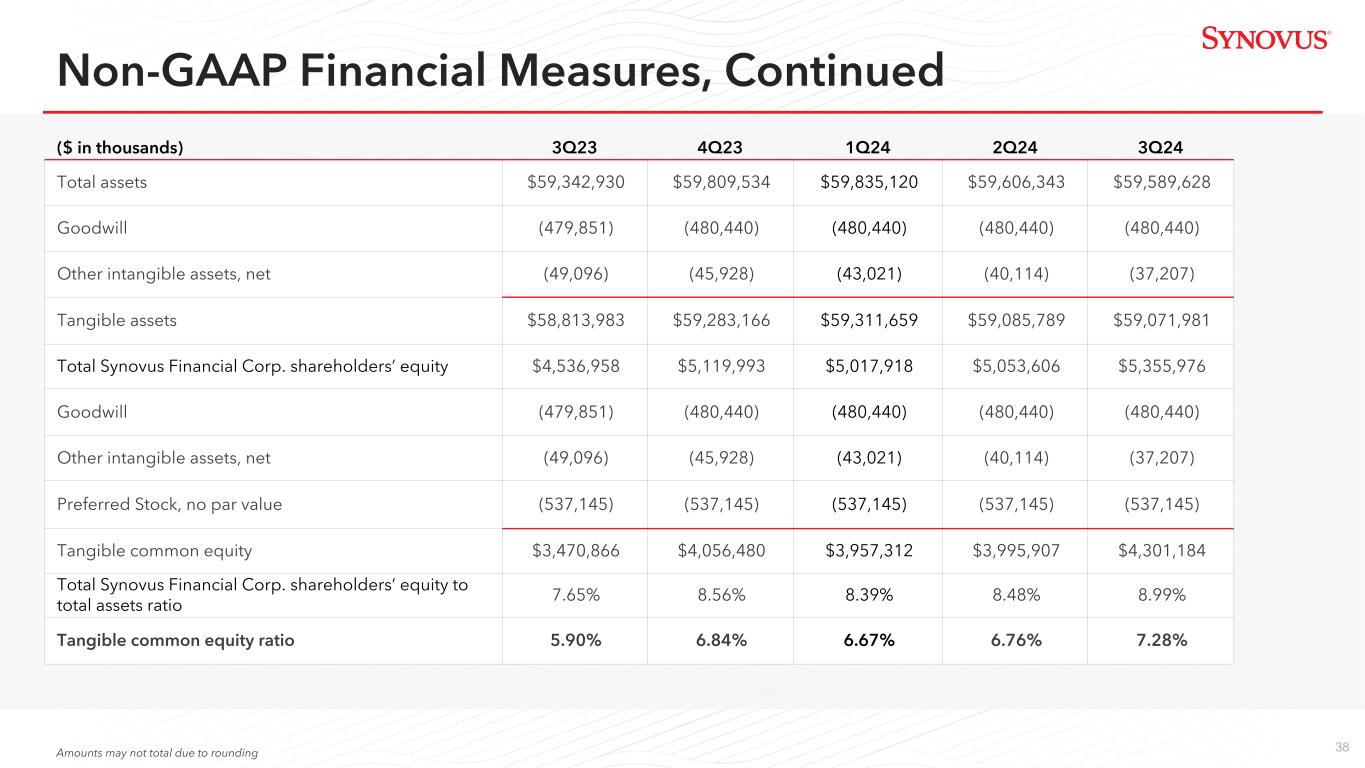
| (dollars in thousands) | September 30, 2024 | December 31, 2023 | September 30, 2023 | ||||||||||||||
Tangible common equity ratio |
|||||||||||||||||
| Total assets | $ | 59,589,628 | $ | 59,809,534 | $ | 59,342,930 | |||||||||||
| Goodwill | (480,440) | (480,440) | (479,851) | ||||||||||||||
| Other intangible assets, net | (37,207) | (45,928) | (49,096) | ||||||||||||||
| Tangible assets | $ | 59,071,981 | $ | 59,283,166 | $ | 58,813,983 | |||||||||||
| Total Synovus Financial Corp. shareholders’ equity | $ | 5,355,976 | $ | 5,119,993 | $ | 4,536,958 | |||||||||||
| Goodwill | (480,440) | (480,440) | (479,851) | ||||||||||||||
| Other intangible assets, net | (37,207) | (45,928) | (49,096) | ||||||||||||||
Preferred Stock, no par value |
(537,145) | (537,145) | (537,145) | ||||||||||||||
| Tangible common equity | $ | 4,301,184 | $ | 4,056,480 | $ | 3,470,866 | |||||||||||
Total Synovus Financial Corp. shareholders’ equity to total assets ratio |
8.99 | % | 8.56 | % | 7.65 | % | |||||||||||
| Tangible common equity ratio | 7.28 | 6.84 | 5.90 | ||||||||||||||
Amounts may not total due to rounding |
|||||||||||||||||
| Synovus | Exhibit 99.2 | |||||||||||||||||||
| INCOME STATEMENT DATA | ||||||||||||||||||||
| (Unaudited) | ||||||||||||||||||||
| (Dollars in thousands, except per share data) | Nine Months Ended September 30, | |||||||||||||||||||
| 2024 | 2023 | '24 vs '23 | ||||||||||||||||||
| % Change | ||||||||||||||||||||
| Interest income | $ | 2,394,459 | $ | 2,262,061 | 6 | % | ||||||||||||||
| Interest expense | 1,099,876 | 882,619 | 25 | |||||||||||||||||
| Net interest income | 1,294,583 | 1,379,442 | (6) | |||||||||||||||||
| Provision for (reversal of) credit losses | 103,818 | 143,607 | (28) | |||||||||||||||||
| Net interest income after provision for credit losses | 1,190,765 | 1,235,835 | (4) | |||||||||||||||||
| Non-interest revenue: | ||||||||||||||||||||
| Service charges on deposit accounts | 68,403 | 67,836 | 1 | |||||||||||||||||
| Fiduciary and asset management fees | 58,455 | 59,928 | (2) | |||||||||||||||||
| Card fees | 57,343 | 51,485 | 11 | |||||||||||||||||
| Brokerage revenue | 63,974 | 68,043 | (6) | |||||||||||||||||
| Mortgage banking income | 11,395 | 12,138 | (6) | |||||||||||||||||
| Capital markets income | 31,988 | 32,589 | (2) | |||||||||||||||||
| Income from bank-owned life insurance | 23,886 | 21,106 | 13 | |||||||||||||||||
| Investment securities gains (losses), net | (256,660) | 1,030 | nm | |||||||||||||||||
| Recovery of NPA | — | 13,126 | nm | |||||||||||||||||
| Other non-interest revenue | 55,233 | 25,260 | 119 | |||||||||||||||||
| Total non-interest revenue | 114,017 | 352,541 | (68) | |||||||||||||||||
| Non-interest expense: | ||||||||||||||||||||
| Salaries and other personnel expense | 552,742 | 551,667 | — | |||||||||||||||||
| Net occupancy, equipment, and software expense | 140,200 | 131,435 | 7 | |||||||||||||||||
| Third-party processing and other services | 63,593 | 64,932 | (2) | |||||||||||||||||
| Professional fees | 34,140 | 28,707 | 19 | |||||||||||||||||
| FDIC insurance and other regulatory fees | 37,694 | 33,266 | 13 | |||||||||||||||||
| Restructuring charges (reversals) | 2,084 | 16,476 | nm | |||||||||||||||||
| Loss on other loans held for sale | — | 50,064 | nm | |||||||||||||||||
| Other operating expenses | 107,779 | 106,019 | 2 | |||||||||||||||||
| Total non-interest expense | 938,232 | 982,566 | (5) | |||||||||||||||||
| Income before income taxes | 366,550 | 605,810 | (39) | |||||||||||||||||
| Income tax expense | 76,476 | 133,242 | (43) | |||||||||||||||||
| Net income | 290,074 | 472,568 | (39) | |||||||||||||||||
| Less: Net income (loss) attributable to noncontrolling interest | (1,960) | (796) | 146 | |||||||||||||||||
| Net income attributable to Synovus Financial Corp. | 292,034 | 473,364 | (38) | |||||||||||||||||
| Less: Preferred stock dividends | 31,325 | 26,254 | 19 | |||||||||||||||||
| Net income available to common shareholders | $ | 260,709 | $ | 447,110 | (42) | % | ||||||||||||||
| Net income per common share, basic | $ | 1.80 | $ | 3.06 | (41) | % | ||||||||||||||
| Net income per common share, diluted | 1.79 | 3.05 | (41) | |||||||||||||||||
| Cash dividends declared per common share | 1.14 | 1.14 | — | |||||||||||||||||
| Return on average assets * | 0.7 | % | 1.0 | % | (30) | bps | ||||||||||||||
| Return on average common equity * | 7.6 | 14.2 | nm | |||||||||||||||||
| Weighted average common shares outstanding, basic | 145,039 | 146,028 | (1) | % | ||||||||||||||||
| Weighted average common shares outstanding, diluted | 145,718 | 146,683 | (1) | |||||||||||||||||
| nm - not meaningful | ||||||||||||||||||||
| bps - basis points | ||||||||||||||||||||
| * - ratios are annualized | ||||||||||||||||||||
Amounts may not total due to rounding |
||||||||||||||||||||
| Synovus | ||||||||||||||||||||||||||||||||||||||
| INCOME STATEMENT DATA | ||||||||||||||||||||||||||||||||||||||
| (Unaudited) | ||||||||||||||||||||||||||||||||||||||
| (Dollars in thousands, except per share data) | 2024 | 2023 | Third Quarter | |||||||||||||||||||||||||||||||||||
| Third Quarter | Second Quarter | First Quarter | Fourth Quarter | Third Quarter | '24 vs '23 | |||||||||||||||||||||||||||||||||
| % Change | ||||||||||||||||||||||||||||||||||||||
| Interest income | $ | 810,507 | 801,242 | 782,710 | 788,297 | 786,039 | 3 | % | ||||||||||||||||||||||||||||||
| Interest expense | 369,767 | 366,244 | 363,864 | 351,083 | 342,880 | 8 | ||||||||||||||||||||||||||||||||
| Net interest income | 440,740 | 434,998 | 418,846 | 437,214 | 443,159 | (1) | ||||||||||||||||||||||||||||||||
| Provision for (reversal of) credit losses | 23,434 | 26,404 | 53,980 | 45,472 | 72,572 | (68) | ||||||||||||||||||||||||||||||||
| Net interest income after provision for credit losses | 417,306 | 408,594 | 364,866 | 391,742 | 370,587 | 13 | ||||||||||||||||||||||||||||||||
| Non-interest revenue: | ||||||||||||||||||||||||||||||||||||||
| Service charges on deposit accounts | 23,683 | 22,907 | 21,813 | 22,260 | 21,385 | 11 | ||||||||||||||||||||||||||||||||
| Fiduciary and asset management fees | 19,714 | 19,728 | 19,013 | 18,149 | 20,205 | (2) | ||||||||||||||||||||||||||||||||
| Card fees | 18,439 | 19,418 | 19,486 | 20,872 | 18,602 | (1) | ||||||||||||||||||||||||||||||||
| Brokerage revenue | 20,810 | 20,457 | 22,707 | 21,961 | 21,387 | (3) | ||||||||||||||||||||||||||||||||
| Mortgage banking income | 4,033 | 3,944 | 3,418 | 3,019 | 3,671 | 10 | ||||||||||||||||||||||||||||||||
| Capital markets income | 10,284 | 15,077 | 6,627 | 6,456 | 7,980 | 29 | ||||||||||||||||||||||||||||||||
| Income from bank-owned life insurance | 8,442 | 8,097 | 7,347 | 10,324 | 6,965 | 21 | ||||||||||||||||||||||||||||||||
| Investment securities gains (losses), net | — | (256,660) | — | (77,748) | — | nm | ||||||||||||||||||||||||||||||||
| Other non-interest revenue | 18,575 | 18,181 | 18,477 | 26,175 | 6,944 | 167 | ||||||||||||||||||||||||||||||||
| Total non-interest revenue | 123,980 | (128,851) | 118,888 | 51,468 | 107,139 | 16 | ||||||||||||||||||||||||||||||||
| Non-interest expense: | ||||||||||||||||||||||||||||||||||||||
| Salaries and other personnel expense | 184,814 | 179,407 | 188,521 | 176,712 | 179,741 | 3 | ||||||||||||||||||||||||||||||||
| Net occupancy, equipment, and software expense | 46,977 | 46,415 | 46,808 | 48,146 | 45,790 | 3 | ||||||||||||||||||||||||||||||||
| Third-party processing and other services | 21,552 | 21,783 | 20,258 | 21,717 | 21,439 | 1 | ||||||||||||||||||||||||||||||||
| Professional fees | 10,854 | 15,655 | 7,631 | 11,147 | 10,147 | 7 | ||||||||||||||||||||||||||||||||
| FDIC insurance and other regulatory fees | 7,382 | 6,493 | 23,819 | 61,470 | 11,837 | (38) | ||||||||||||||||||||||||||||||||
| Restructuring charges (reversals) | 1,219 | (658) | 1,524 | 1,231 | 17,319 | nm | ||||||||||||||||||||||||||||||||
| Loss on other loans held for sale | — | — | — | — | 30,954 | nm | ||||||||||||||||||||||||||||||||
| Other operating expenses | 40,892 | 32,706 | 34,180 | 32,435 | 36,305 | 13 | ||||||||||||||||||||||||||||||||
| Total non-interest expense | 313,690 | 301,801 | 322,741 | 352,858 | 353,532 | (11) | ||||||||||||||||||||||||||||||||
| Income (loss) before income taxes | 227,596 | (22,058) | 161,013 | 90,352 | 124,194 | 83 | ||||||||||||||||||||||||||||||||
| Income tax expense (benefit) | 46,912 | (7,378) | 36,943 | 20,779 | 27,729 | 69 | ||||||||||||||||||||||||||||||||
| Net income (loss) | 180,684 | (14,680) | 124,070 | 69,573 | 96,465 | 87 | ||||||||||||||||||||||||||||||||
| Less: Net income (loss) attributable to noncontrolling interest | (871) | (652) | (437) | (768) | (630) | 38 | ||||||||||||||||||||||||||||||||
| Net income (loss) attributable to Synovus Financial Corp. | 181,555 | (14,028) | 124,507 | 70,341 | 97,095 | 87 | ||||||||||||||||||||||||||||||||
| Less: Preferred stock dividends | 11,927 | 9,713 | 9,685 | 9,696 | 9,672 | 23 | ||||||||||||||||||||||||||||||||
| Net income (loss) available to common shareholders | $ | 169,628 | (23,741) | 114,822 | 60,645 | 87,423 | 94 | % | ||||||||||||||||||||||||||||||
| Net income (loss) per common share, basic | $ | 1.19 | (0.16) | 0.78 | 0.41 | 0.60 | 98 | % | ||||||||||||||||||||||||||||||
| Net income (loss) per common share, diluted | 1.18 | (0.16) | 0.78 | 0.41 | 0.60 | 97 | ||||||||||||||||||||||||||||||||
| Cash dividends declared per common share | 0.38 | 0.38 | 0.38 | 0.38 | 0.38 | — | ||||||||||||||||||||||||||||||||
| Return on average assets * | 1.2 | % | (0.1) | 0.8 | 0.5 | 0.6 | 60 | bps | ||||||||||||||||||||||||||||||
| Return on average common equity * | 14.4 | (2.1) | 10.2 | 5.9 | 8.2 | nm | ||||||||||||||||||||||||||||||||
| Weighted average common shares outstanding, basic | 143,144 | 145,565 | 146,430 | 146,372 | 146,170 | (2) | % | |||||||||||||||||||||||||||||||
| Weighted average common shares outstanding, diluted | 143,979 | 145,565 | 147,122 | 146,877 | 146,740 | (2) | ||||||||||||||||||||||||||||||||
| nm - not meaningful | ||||||||||||||||||||||||||||||||||||||
| bps - basis points | ||||||||||||||||||||||||||||||||||||||
| * - ratios are annualized | ||||||||||||||||||||||||||||||||||||||
Amounts may not total due to rounding |
||||||||||||||||||||||||||||||||||||||
| Synovus | |||||||||||||||||||||||
| BALANCE SHEET DATA | September 30, 2024 | December 31, 2023 | September 30, 2023 | ||||||||||||||||||||
| (Unaudited) | |||||||||||||||||||||||
| (In thousands, except share data) | |||||||||||||||||||||||
| ASSETS | |||||||||||||||||||||||
| Interest-earning deposits with banks and other cash and cash equivalents | $ | 1,807,641 | $ | 2,414,103 | $ | 2,101,455 | |||||||||||||||||
| Federal funds sold and securities purchased under resale agreements | 45,971 | 37,323 | 36,176 | ||||||||||||||||||||
| Cash, cash equivalents, and restricted cash | 1,853,612 | 2,451,426 | 2,137,631 | ||||||||||||||||||||
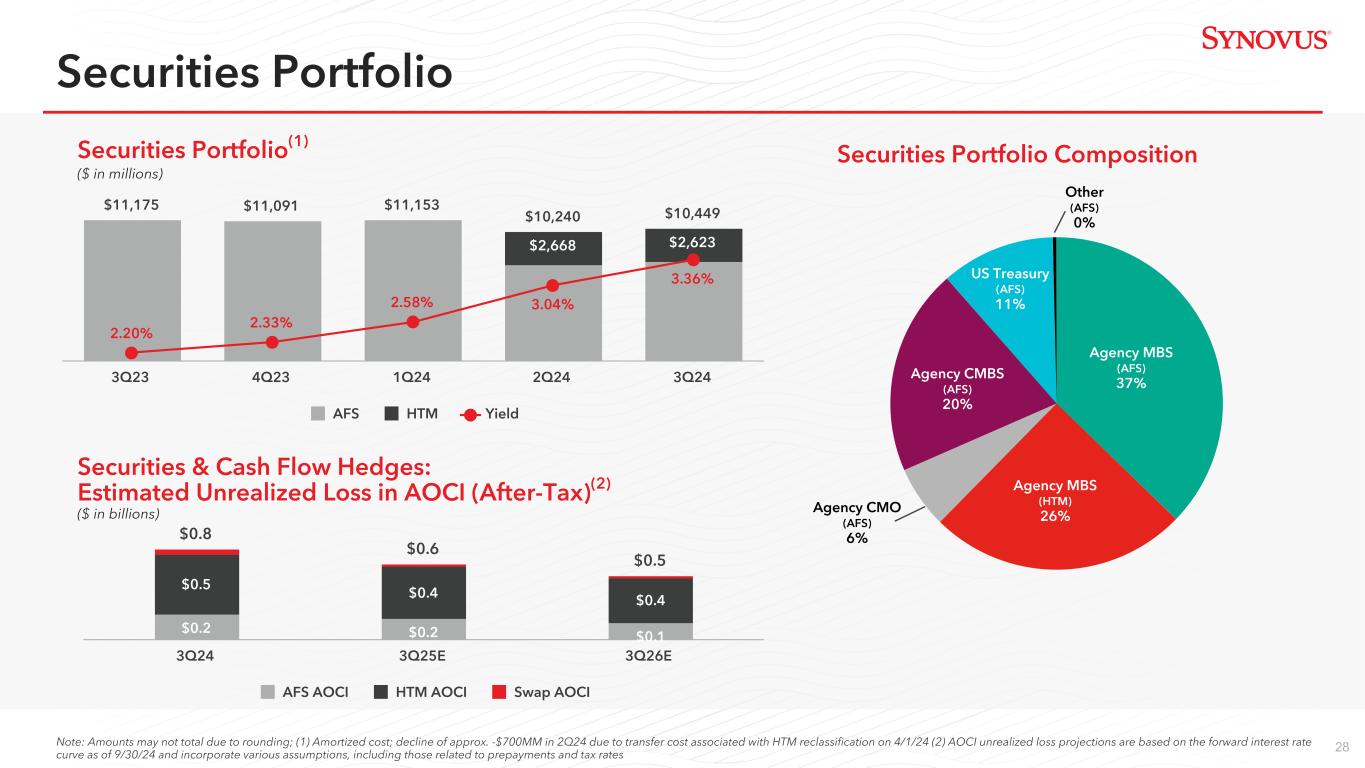
| Investment securities held to maturity | 2,622,457 | — | — | ||||||||||||||||||||
| Investment securities available for sale | 7,554,168 | 9,788,662 | 9,237,191 | ||||||||||||||||||||
Loans held for sale (includes $36,943, $47,338 and $48,994 measured at fair value, respectively) |
121,470 | 52,768 | 66,558 | ||||||||||||||||||||
| Loans, net of deferred fees and costs | 43,120,674 | 43,404,490 | 43,679,910 | ||||||||||||||||||||
| Allowance for loan losses | (484,985) | (479,385) | (477,532) | ||||||||||||||||||||
| Loans, net | 42,635,689 | 42,925,105 | 43,202,378 | ||||||||||||||||||||
| Cash surrender value of bank-owned life insurance | 1,133,652 | 1,112,030 | 1,107,092 | ||||||||||||||||||||
| Premises, equipment, and software, net | 380,267 | 365,851 | 364,054 | ||||||||||||||||||||
| Goodwill | 480,440 | 480,440 | 479,851 | ||||||||||||||||||||
| Other intangible assets, net | 37,207 | 45,928 | 49,096 | ||||||||||||||||||||
| Other assets | 2,770,666 | 2,587,324 | 2,699,079 | ||||||||||||||||||||
| Total assets | $ | 59,589,628 | $ | 59,809,534 | $ | 59,342,930 | |||||||||||||||||
| LIABILITIES AND EQUITY | |||||||||||||||||||||||
| Liabilities: | |||||||||||||||||||||||
| Deposits: | |||||||||||||||||||||||
| Non-interest-bearing deposits | $ | 11,561,626 | $ | 12,507,616 | $ | 12,976,574 | |||||||||||||||||
| Interest-bearing deposits | 38,632,114 | 38,231,569 | 37,227,316 | ||||||||||||||||||||
| Total deposits | 50,193,740 | 50,739,185 | 50,203,890 | ||||||||||||||||||||
| Federal funds purchased and securities sold under repurchase agreements | 94,055 | 189,074 | 98,270 | ||||||||||||||||||||
| Other short-term borrowings | — | 3,496 | 2,362 | ||||||||||||||||||||
| Long-term debt | 2,021,050 | 1,932,534 | 2,704,701 | ||||||||||||||||||||
| Other liabilities | 1,902,612 | 1,801,097 | 1,772,139 | ||||||||||||||||||||
| Total liabilities | 54,211,457 | 54,665,386 | 54,781,362 | ||||||||||||||||||||
| Equity: | |||||||||||||||||||||||
| Shareholders' equity: | |||||||||||||||||||||||
| Preferred stock - no par value. Authorized 100,000,000 shares; issued 22,000,000 | 537,145 | 537,145 | 537,145 | ||||||||||||||||||||
Common stock - $1.00 par value. Authorized 342,857,142 shares; issued 172,077,277, 171,360,188 and 170,859,506 respectively; outstanding 141,997,383, 146,705,330 and 146,204,648 respectively |
172,077 | 171,360 | 170,860 | ||||||||||||||||||||
| Additional paid-in capital | 3,976,706 | 3,955,819 | 3,940,507 | ||||||||||||||||||||
| Treasury stock, at cost; 30,079,894, 24,654,858 and 24,654,858 shares, respectively | (1,167,130) | (944,484) | (944,484) | ||||||||||||||||||||
| Accumulated other comprehensive income (loss), net | (773,786) | (1,117,073) | (1,679,404) | ||||||||||||||||||||
| Retained earnings | 2,610,964 | 2,517,226 | 2,512,334 | ||||||||||||||||||||
| Total Synovus Financial Corp. shareholders’ equity | 5,355,976 | 5,119,993 | 4,536,958 | ||||||||||||||||||||
| Noncontrolling interest in subsidiary | 22,195 | 24,155 | 24,610 | ||||||||||||||||||||
| Total equity | 5,378,171 | 5,144,148 | 4,561,568 | ||||||||||||||||||||
| Total liabilities and equity | $ | 59,589,628 | $ | 59,809,534 | $ | 59,342,930 | |||||||||||||||||
| Synovus | |||||||||||||||||||||||||||||||||||||||||||||||||||||
| AVERAGE BALANCES, INTEREST, AND YIELDS/RATES | |||||||||||||||||||||||||||||||||||||||||||||||||||||
| (Unaudited) | |||||||||||||||||||||||||||||||||||||||||||||||||||||
| Third Quarter 2024 | Second Quarter 2024 | Third Quarter 2023 | |||||||||||||||||||||||||||||||||||||||||||||||||||
(dollars in thousands) |
Average Balance | Interest | Yield/ Rate |
Average Balance | Interest | Yield/ Rate |
Average Balance | Interest | Yield/ Rate |
||||||||||||||||||||||||||||||||||||||||||||
Assets |
|||||||||||||||||||||||||||||||||||||||||||||||||||||
Interest earning assets: |
|||||||||||||||||||||||||||||||||||||||||||||||||||||
Commercial loans (1) (2) (3) |
$ | 34,610,296 | $ | 592,142 | 6.81 | % | $ | 35,006,497 | $ | 593,715 | 6.82 | % | $ | 34,990,459 | $ | 579,177 | 6.57 | % | |||||||||||||||||||||||||||||||||||
Consumer loans (1) (2) |
8,298,130 | 109,908 | 5.28 | 8,358,325 | 109,206 | 5.23 | 8,509,757 | 108,065 | 5.06 | ||||||||||||||||||||||||||||||||||||||||||||
Less: Allowance for loan losses |
(482,863) | — | — | (492,640) | — | — | (461,385) | — | — | ||||||||||||||||||||||||||||||||||||||||||||
Loans, net |
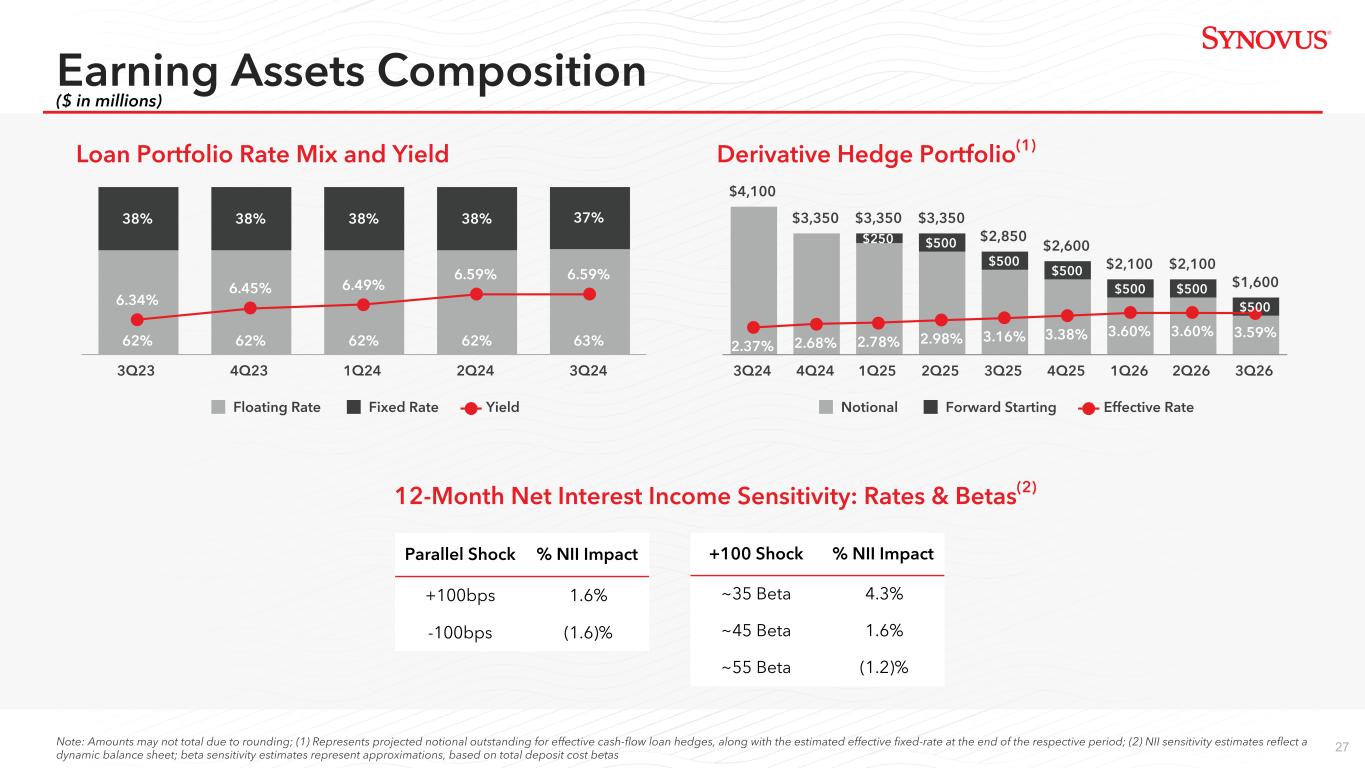
42,425,563 | 702,050 | 6.59 | 42,872,182 | 702,921 | 6.59 | 43,038,831 | 687,242 | 6.34 | ||||||||||||||||||||||||||||||||||||||||||||
Total investment securities(4) |
10,420,665 | 87,643 | 3.36 | 10,373,792 | 78,891 | 3.04 | 11,194,291 | 61,642 | 2.20 | ||||||||||||||||||||||||||||||||||||||||||||
Trading account assets |
14,392 | 246 | 6.84 | 8,809 | 162 | 7.37 | 16,186 | 237 | 5.86 | ||||||||||||||||||||||||||||||||||||||||||||
Other earning assets(5) |
1,408,415 | 18,803 | 5.24 | 1,271,953 | 16,800 | 5.23 | 1,237,445 | 16,369 | 5.17 | ||||||||||||||||||||||||||||||||||||||||||||
FHLB and Federal Reserve Bank stock |
170,977 | 2,113 | 4.94 | 189,706 | 2,687 | 5.67 | 244,906 | 3,783 | 6.18 | ||||||||||||||||||||||||||||||||||||||||||||
Mortgage loans held for sale |
34,890 | 612 | 7.01 | 37,364 | 666 | 7.13 | 53,904 | 879 | 6.52 | ||||||||||||||||||||||||||||||||||||||||||||
| Other loans held for sale | 83,492 | 433 | 2.03 | 96,180 | 466 | 1.92 | 881,067 | 17,035 | 7.57 | ||||||||||||||||||||||||||||||||||||||||||||
Total interest earning assets |
54,558,394 | 811,900 | 5.92 | % | 54,849,986 | 802,593 | 5.89 | % | 56,666,630 | 787,187 | 5.51 | % | |||||||||||||||||||||||||||||||||||||||||
Cash and due from banks |
476,443 | 531,604 | 509,511 | ||||||||||||||||||||||||||||||||||||||||||||||||||
Premises and equipment |
380,003 | 376,293 | 365,568 | ||||||||||||||||||||||||||||||||||||||||||||||||||
Other real estate |
666 | 18,003 | — | ||||||||||||||||||||||||||||||||||||||||||||||||||
Cash surrender value of bank-owned life insurance |
1,128,877 | 1,121,764 | 1,102,626 | ||||||||||||||||||||||||||||||||||||||||||||||||||
Other assets(6) |
2,639,241 | 2,349,199 | 1,272,344 | ||||||||||||||||||||||||||||||||||||||||||||||||||
Total assets |
$ | 59,183,624 | $ | 59,246,849 | $ | 59,916,679 | |||||||||||||||||||||||||||||||||||||||||||||||
Liabilities and Equity |
|||||||||||||||||||||||||||||||||||||||||||||||||||||
Interest-bearing liabilities: |
|||||||||||||||||||||||||||||||||||||||||||||||||||||
Interest-bearing demand deposits |
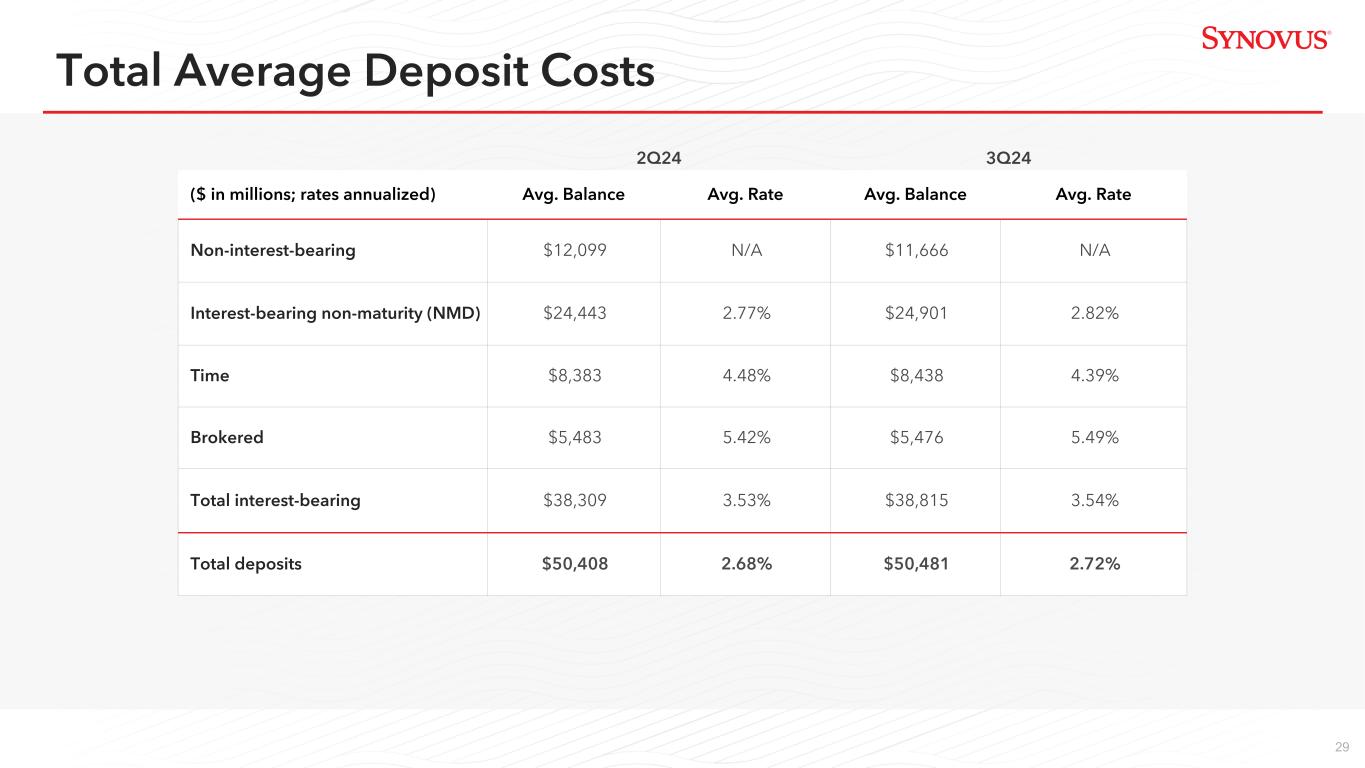
$ | 10,834,829 | 71,786 | 2.64 | % | $ | 10,789,288 | 68,809 | 2.57 | % | $ | 10,114,171 | 52,983 | 2.08 | % | ||||||||||||||||||||||||||||||||||||||
Money market accounts |
13,058,527 | 104,514 | 3.18 | 12,617,120 | 99,380 | 3.17 | 13,147,465 | 95,339 | 2.88 | ||||||||||||||||||||||||||||||||||||||||||||
Savings deposits |
1,007,962 | 355 | 0.14 | 1,036,321 | 304 | 0.12 | 1,178,322 | 280 | 0.09 | ||||||||||||||||||||||||||||||||||||||||||||
Time deposits |
8,437,861 | 93,052 | 4.39 | 8,382,774 | 93,431 | 4.48 | 6,180,584 | 59,972 | 3.85 | ||||||||||||||||||||||||||||||||||||||||||||
| Brokered deposits | 5,476,231 | 75,607 | 5.49 | 5,483,298 | 73,830 | 5.42 | 6,442,690 | 83,486 | 5.14 | ||||||||||||||||||||||||||||||||||||||||||||
Federal funds purchased and securities sold under repurchase agreements |
94,629 | 369 | 1.53 | 114,595 | 570 | 1.97 | 73,344 | 296 | 1.58 | ||||||||||||||||||||||||||||||||||||||||||||
Other short-term borrowings |
2,209 | 29 | 5.20 | 108,946 | 1,530 | 5.55 | 1,722 | — | — | ||||||||||||||||||||||||||||||||||||||||||||
Long-term debt |
1,385,836 | 24,055 | 6.93 | 1,666,731 | 28,390 | 6.79 | 3,230,374 | 50,524 | 6.18 | ||||||||||||||||||||||||||||||||||||||||||||
Total interest-bearing liabilities |
40,298,084 | 369,767 | 3.65 | % | 40,199,073 | 366,244 | 3.66 | % | 40,368,672 | 342,880 | 3.37 | % | |||||||||||||||||||||||||||||||||||||||||
Non-interest-bearing demand deposits |
11,665,661 | 12,099,256 | 13,049,343 | ||||||||||||||||||||||||||||||||||||||||||||||||||
Other liabilities |
1,967,351 | 1,932,822 | 1,713,131 | ||||||||||||||||||||||||||||||||||||||||||||||||||
| Total equity | 5,252,528 | 5,015,698 | 4,785,533 | ||||||||||||||||||||||||||||||||||||||||||||||||||
Total liabilities and equity |
$ | 59,183,624 | $ | 59,246,849 | $ | 59,916,679 | |||||||||||||||||||||||||||||||||||||||||||||||
Net interest income and net interest margin, taxable equivalent (7) |
$ | 442,133 | 3.22 | % | $ | 436,349 | 3.20 | % | $ | 444,307 | 3.11 | % | |||||||||||||||||||||||||||||||||||||||||
Less: taxable-equivalent adjustment |
1,393 | 1,351 | 1,148 | ||||||||||||||||||||||||||||||||||||||||||||||||||
Net interest income |
$ | 440,740 | $ | 434,998 | $ | 443,159 | |||||||||||||||||||||||||||||||||||||||||||||||
| Synovus | ||||||||||||||||||||||||||||||||||||||
| AVERAGE BALANCES, INTEREST, AND YIELDS/RATES | ||||||||||||||||||||||||||||||||||||||
| (Unaudited) | ||||||||||||||||||||||||||||||||||||||
| Nine Months Ended September 30, | ||||||||||||||||||||||||||||||||||||||
| 2024 | 2023 | |||||||||||||||||||||||||||||||||||||
(dollars in thousands) |
Average Balance | Interest | Yield/ Rate |
Average Balance | Interest | Yield/ Rate |
||||||||||||||||||||||||||||||||
Assets |
||||||||||||||||||||||||||||||||||||||
Interest earning assets: |
||||||||||||||||||||||||||||||||||||||
Commercial loans (1) (2) (3) |
$ | 34,852,642 | $ | 1,769,316 | 6.78 | % | $ | 35,216,487 | $ | 1,672,529 | 6.35 | % | ||||||||||||||||||||||||||
Consumer loans (1) (2) |
8,363,281 | 328,681 | 5.24 | 8,580,029 | 316,757 | 4.92 | ||||||||||||||||||||||||||||||||
Less: Allowance for loan losses |
(485,540) | — | — | (457,818) | — | — | ||||||||||||||||||||||||||||||||
Loans, net |
42,730,383 | 2,097,997 | 6.56 | 43,338,698 | 1,989,286 | 6.14 | ||||||||||||||||||||||||||||||||
Total investment securities(4) |
10,646,738 | 238,440 | 2.99 | 11,229,290 | 183,118 | 2.17 | ||||||||||||||||||||||||||||||||
Trading account assets |
11,600 | 473 | 5.44 | 16,302 | 671 | 5.49 | ||||||||||||||||||||||||||||||||
Other earning assets(5) |
1,302,499 | 51,776 | 5.23 | 1,398,211 | 51,660 | 4.87 | ||||||||||||||||||||||||||||||||
FHLB and Federal Reserve Bank stock |
182,793 | 7,073 | 5.16 | 277,136 | 11,439 | 5.50 | ||||||||||||||||||||||||||||||||
Mortgage loans held for sale |
34,012 | 1,773 | 6.95 | 48,398 | 2,297 | 6.33 | ||||||||||||||||||||||||||||||||
| Other loans held for sale | 66,109 | 982 | 1.95 | 625,262 | 26,995 | 5.69 | ||||||||||||||||||||||||||||||||
Total interest earning assets |
54,974,134 | $ | 2,398,514 | 5.83 | % | 56,933,297 | $ | 2,265,466 | 5.32 | % | ||||||||||||||||||||||||||||
Cash and due from banks |
510,807 | 593,023 | ||||||||||||||||||||||||||||||||||||
Premises and equipment |
375,574 | 367,332 | ||||||||||||||||||||||||||||||||||||
Other real estate |
6,223 | — | ||||||||||||||||||||||||||||||||||||
Cash surrender value of bank-owned life insurance |
1,121,807 | 1,096,567 | ||||||||||||||||||||||||||||||||||||
Other assets(6) |
2,162,476 | 1,187,026 | ||||||||||||||||||||||||||||||||||||
Total assets |
$ | 59,151,021 | $ | 60,177,245 | ||||||||||||||||||||||||||||||||||
Liabilities and Equity |
||||||||||||||||||||||||||||||||||||||
Interest-bearing liabilities: |
||||||||||||||||||||||||||||||||||||||
Interest-bearing demand deposits |
$ | 10,738,505 | $ | 206,010 | 2.56 | % | $ | 9,702,651 | $ | 118,007 | 1.63 | % | ||||||||||||||||||||||||||
Money market accounts |
12,834,830 | 307,024 | 3.20 | 13,665,672 | 253,351 | 2.48 | ||||||||||||||||||||||||||||||||
Savings deposits |
1,033,696 | 946 | 0.12 | 1,274,142 | 771 | 0.08 | ||||||||||||||||||||||||||||||||
Time deposits |
8,241,879 | 272,976 | 4.42 | 4,892,146 | 121,019 | 3.31 | ||||||||||||||||||||||||||||||||
| Brokered deposits | 5,565,332 | 226,778 | 5.44 | 6,116,392 | 214,627 | 4.69 | ||||||||||||||||||||||||||||||||
Federal funds purchased and securities sold under repurchase agreements |
107,546 | 1,587 | 1.94 | 98,212 | 1,317 | 1.77 | ||||||||||||||||||||||||||||||||
Other short-term borrowings |
60,763 | 2,514 | 5.44 | 705,292 | 24,559 | 4.59 | ||||||||||||||||||||||||||||||||
Long-term debt |
1,604,966 | 82,041 | 6.80 | 3,400,156 | 148,968 | 5.80 | ||||||||||||||||||||||||||||||||
Total interest-bearing liabilities |
40,187,517 | $ | 1,099,876 | 3.66 | % | 39,854,663 | $ | 882,619 | 2.96 | % | ||||||||||||||||||||||||||||
Non-interest-bearing demand deposits |
11,944,508 | 13,972,152 | ||||||||||||||||||||||||||||||||||||
Other liabilities |
1,894,545 | 1,592,230 | ||||||||||||||||||||||||||||||||||||
| Total equity | 5,124,451 | 4,758,200 | ||||||||||||||||||||||||||||||||||||
Total liabilities and equity |
$ | 59,151,021 | $ | 60,177,245 | ||||||||||||||||||||||||||||||||||
Net interest income, taxable equivalent net interest margin (7) |
$ | 1,298,638 | 3.16 | % | $ | 1,382,847 | 3.25 | % | ||||||||||||||||||||||||||||||
Less: taxable-equivalent adjustment |
4,055 | 3,405 | ||||||||||||||||||||||||||||||||||||
Net interest income |
$ | 1,294,583 | $ | 1,379,442 | ||||||||||||||||||||||||||||||||||
| Synovus | ||||||||||||||||||||||||||||||||
| LOANS OUTSTANDING BY TYPE | ||||||||||||||||||||||||||||||||
| (Unaudited) | Total Loans | Total Loans | Linked Quarter | Total Loans | Year/Year | |||||||||||||||||||||||||||
| (Dollars in thousands) | ||||||||||||||||||||||||||||||||
| Loan Type | September 30, 2024 | June 30, 2024 | % Change | September 30, 2023 | % Change | |||||||||||||||||||||||||||
| Commercial, Financial, and Agricultural | $ | 14,563,913 | $ | 14,519,608 | — | % | $ | 14,498,966 | — | % | ||||||||||||||||||||||
| Owner-Occupied | 8,100,084 | 8,017,004 | 1 | 8,281,988 | (2) | |||||||||||||||||||||||||||
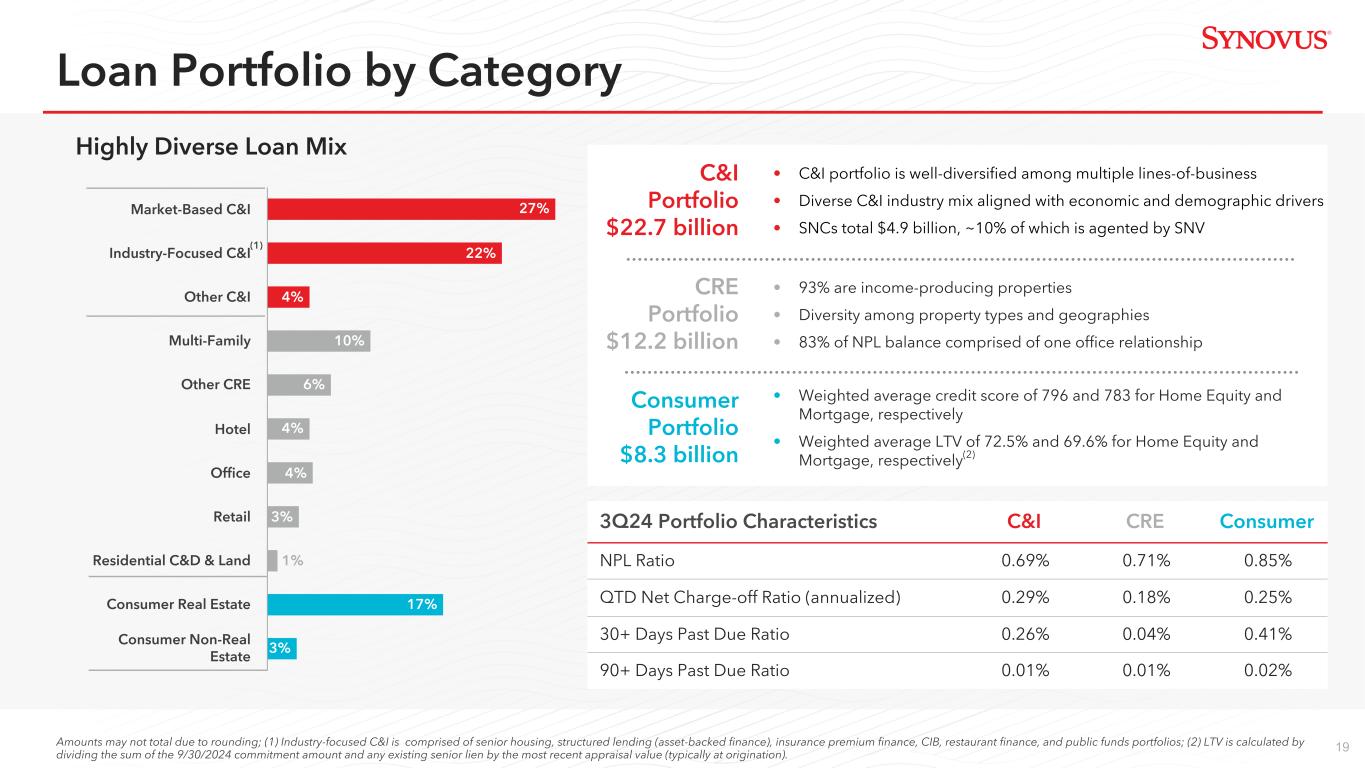
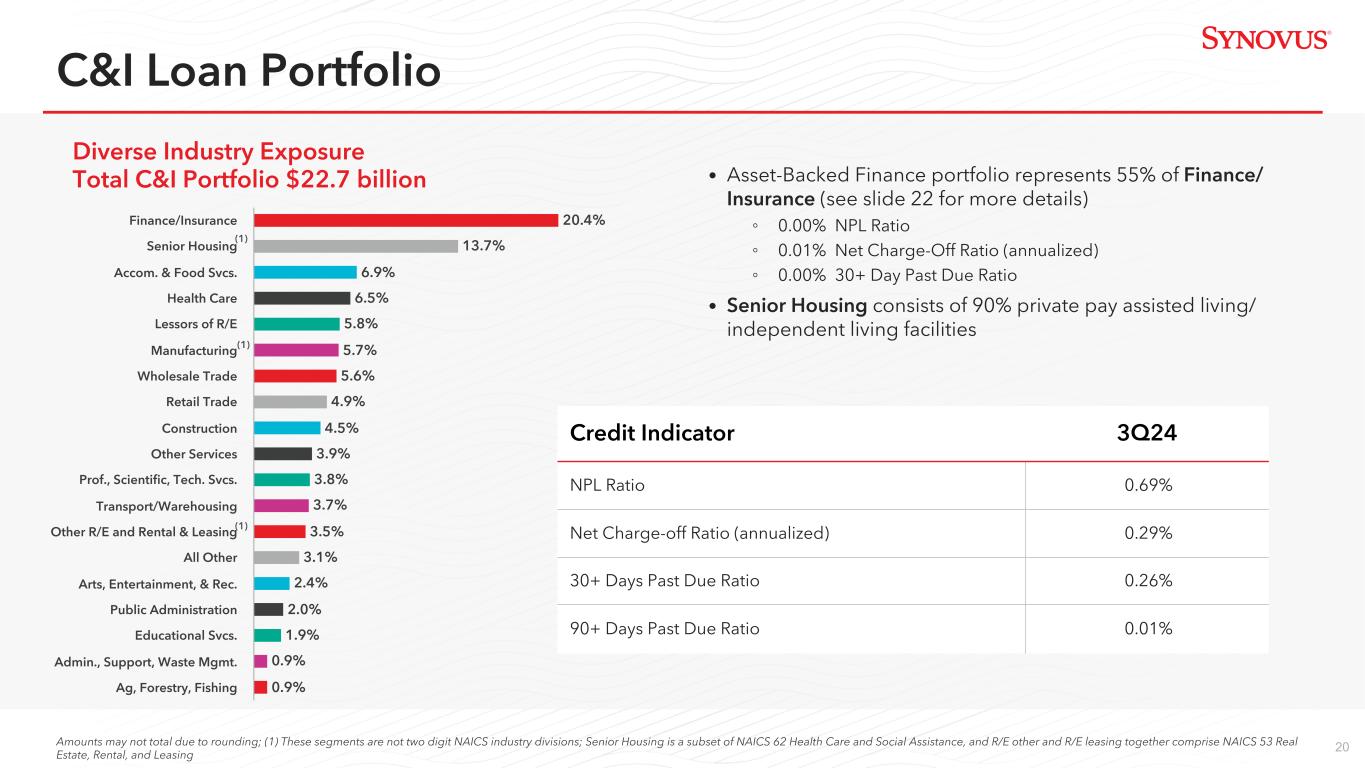
| Total Commercial & Industrial | 22,663,997 | 22,536,612 | 1 | 22,780,954 | (1) | |||||||||||||||||||||||||||
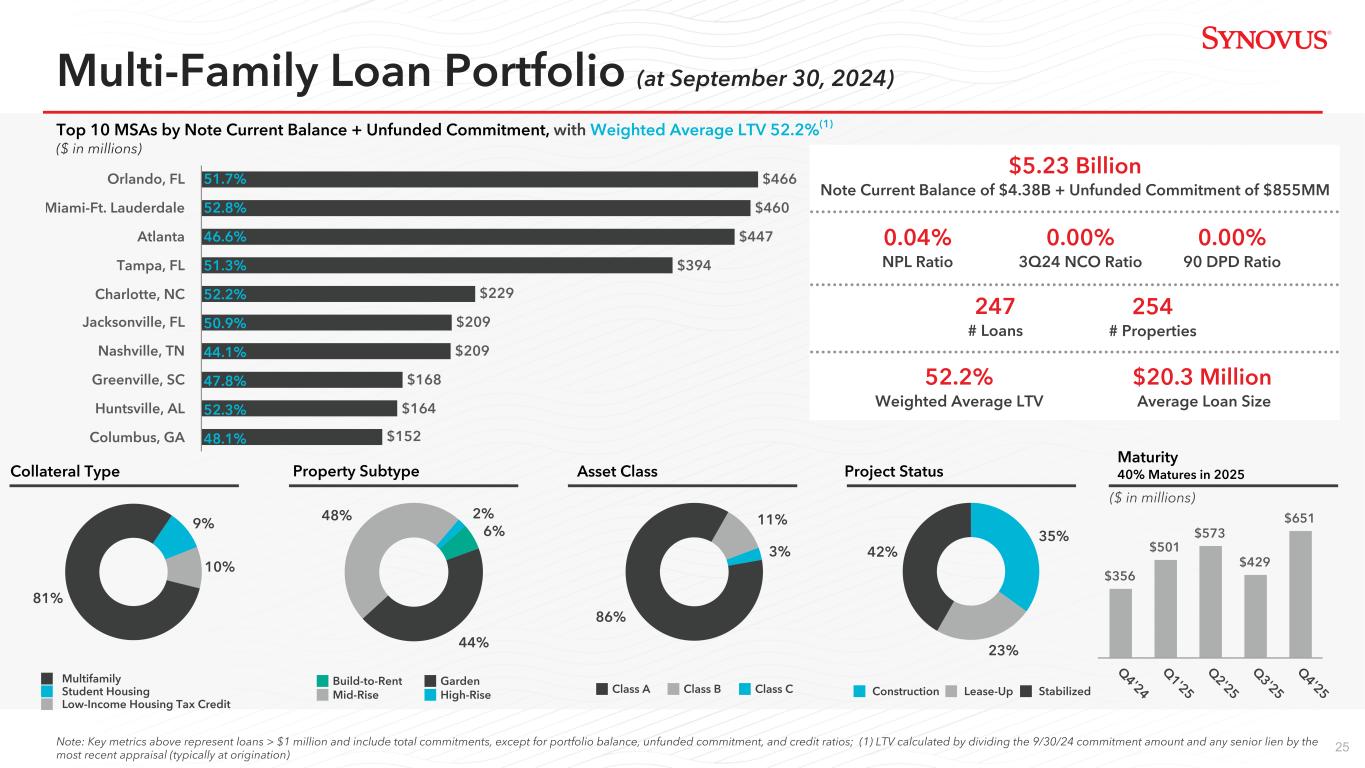
| Multi-Family | 4,379,459 | 4,288,436 | 2 | 3,930,617 | 11 | |||||||||||||||||||||||||||
| Hotels | 1,738,068 | 1,802,076 | (4) | 1,790,094 | (3) | |||||||||||||||||||||||||||
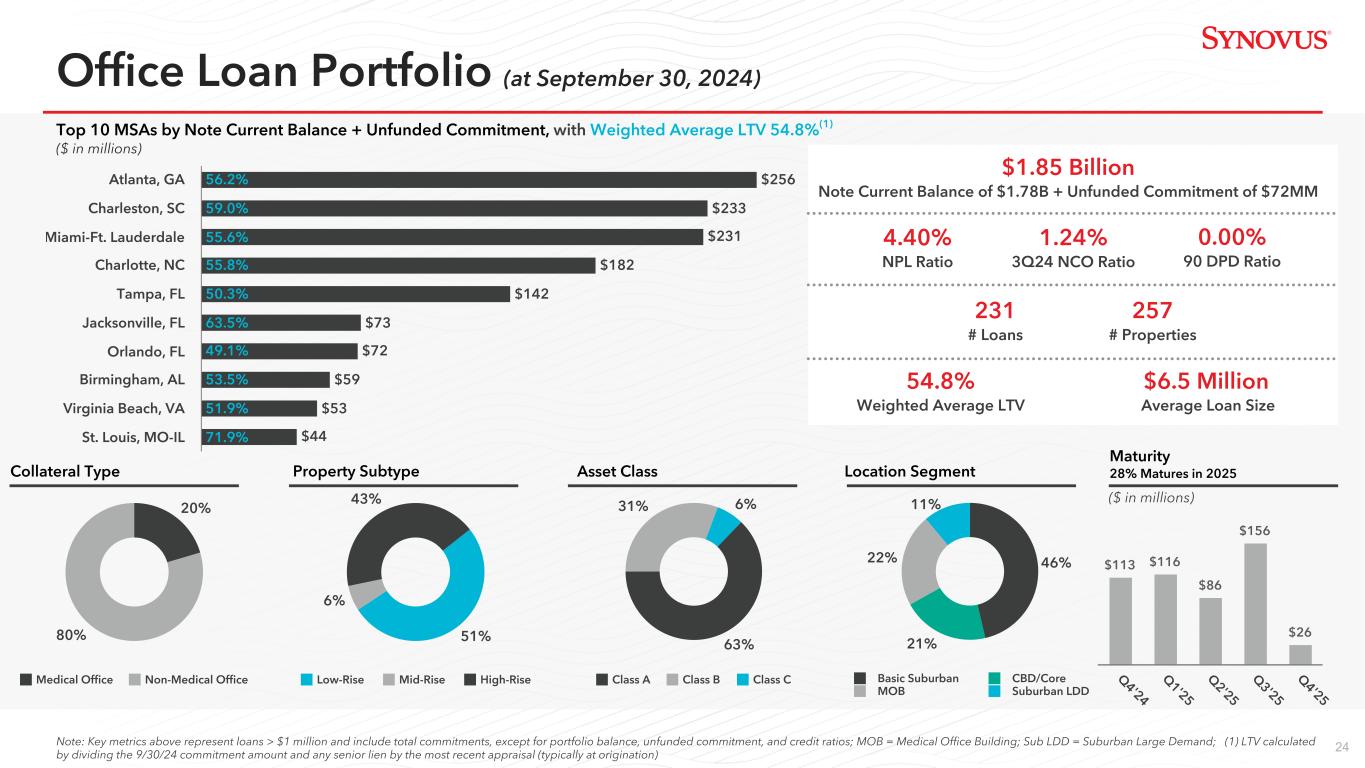
| Office Buildings | 1,778,698 | 1,801,945 | (1) | 1,911,095 | (7) | |||||||||||||||||||||||||||
| Shopping Centers | 1,260,460 | 1,298,967 | (3) | 1,327,770 | (5) | |||||||||||||||||||||||||||
| Warehouses | 837,145 | 865,359 | (3) | 985,723 | (15) | |||||||||||||||||||||||||||
| Other Investment Property | 1,352,719 | 1,271,266 | 6 | 1,432,456 | (6) | |||||||||||||||||||||||||||
| Total Investment Properties | 11,346,549 | 11,328,049 | — | 11,377,755 | — | |||||||||||||||||||||||||||
| 1-4 Family Construction | 190,705 | 171,335 | 11 | 224,091 | (15) | |||||||||||||||||||||||||||
| 1-4 Family Investment Mortgage | 337,425 | 381,212 | (11) | 396,813 | (15) | |||||||||||||||||||||||||||
| Total 1-4 Family Properties | 528,130 | 552,547 | (4) | 620,904 | (15) | |||||||||||||||||||||||||||
| Commercial Development | 48,948 | 65,994 | (26) | 64,212 | (24) | |||||||||||||||||||||||||||
| Residential Development | 67,525 | 67,231 | — | 92,209 | (27) | |||||||||||||||||||||||||||
| Land Acquisition | 186,332 | 201,666 | (8) | 239,773 | (22) | |||||||||||||||||||||||||||
| Land and Development | 302,805 | 334,891 | (10) | 396,194 | (24) | |||||||||||||||||||||||||||
| Total Commercial Real Estate | 12,177,484 | 12,215,487 | — | 12,394,853 | (2) | |||||||||||||||||||||||||||
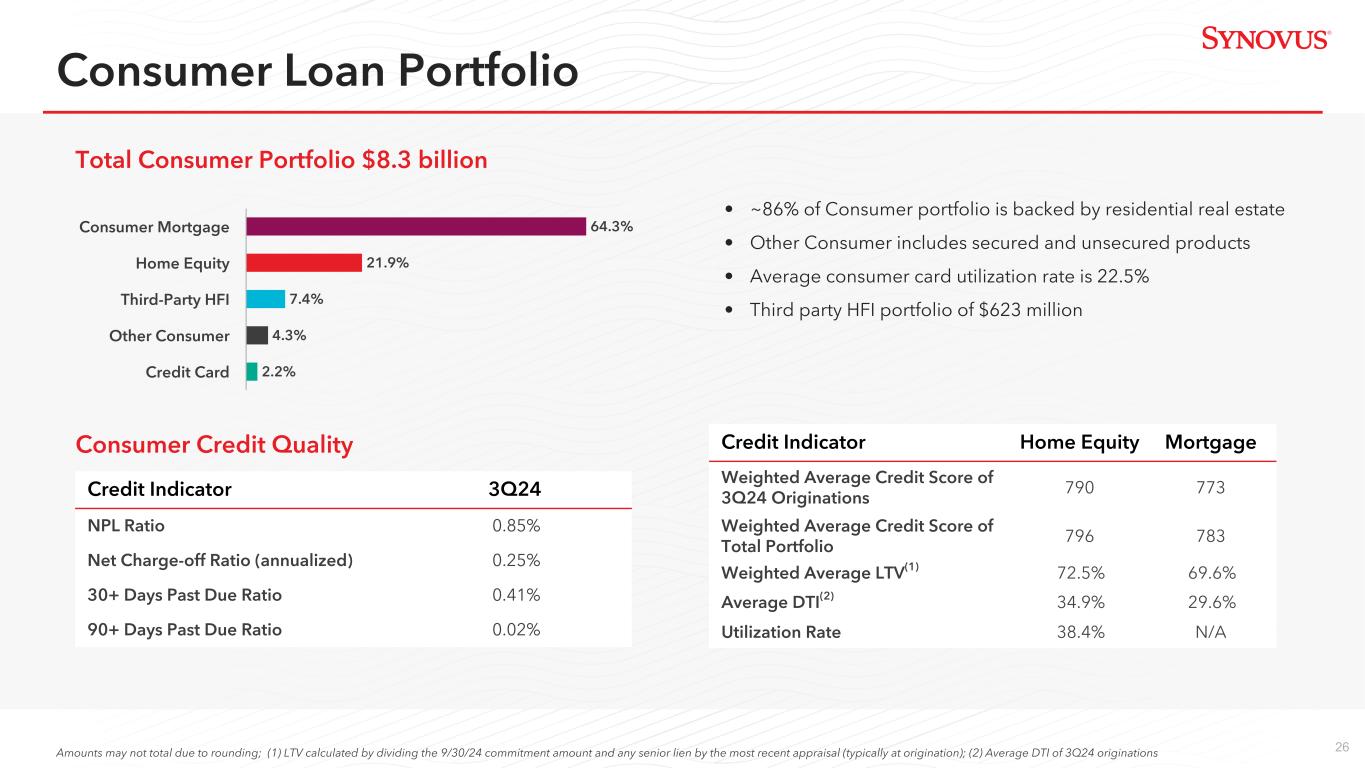
| Consumer Mortgages | 5,323,443 | 5,371,164 | (1) | 5,391,282 | (1) | |||||||||||||||||||||||||||
| Home Equity | 1,809,286 | 1,812,940 | — | 1,784,356 | 1 | |||||||||||||||||||||||||||
| Credit Cards | 181,386 | 178,889 | 1 | 191,046 | (5) | |||||||||||||||||||||||||||
| Other Consumer Loans | 965,078 | 978,305 | (1) | 1,137,419 | (15) | |||||||||||||||||||||||||||
| Total Consumer | 8,279,193 | 8,341,298 | (1) | 8,504,103 | (3) | |||||||||||||||||||||||||||
| Total | $ | 43,120,674 | $ | 43,093,397 | — | % | $ | 43,679,910 | (1) | % | ||||||||||||||||||||||
| NON-PERFORMING LOANS COMPOSITION | ||||||||||||||||||||||||||||||||
| (Unaudited) | Total Non-performing Loans |
Total Non-performing Loans |
Linked Quarter | Total Non-performing Loans |
Year/Year | |||||||||||||||||||||||||||
| (Dollars in thousands) | ||||||||||||||||||||||||||||||||
| Loan Type | September 30, 2024 | June 30, 2024 | % Change | September 30, 2023 | % Change | |||||||||||||||||||||||||||
| Commercial, Financial, and Agricultural | $ | 107,004 | $ | 120,107 | (11) | % | $ | 97,468 | 10 | % | ||||||||||||||||||||||
| Owner-Occupied | 48,390 | 50,977 | (5) | 84,505 | (43) | |||||||||||||||||||||||||||
| Total Commercial & Industrial | 155,394 | 171,084 | (9) | 181,973 | (15) | |||||||||||||||||||||||||||
| Multi-Family | 1,692 | 1,718 | (2) | 1,702 | (1) | |||||||||||||||||||||||||||
| Office Buildings | 78,281 | 7,350 | nm | 27,810 | 181 | |||||||||||||||||||||||||||
| Shopping Centers | 523 | 541 | (3) | 653 | (20) | |||||||||||||||||||||||||||
| Warehouses | 163 | 177 | (8) | 207 | (21) | |||||||||||||||||||||||||||
| Other Investment Property | 1,612 | 1,782 | (10) | 572 | 182 | |||||||||||||||||||||||||||
| Total Investment Properties | 82,271 | 11,568 | nm | 30,944 | 166 | |||||||||||||||||||||||||||
| 1-4 Family Construction | 311 | 311 | — | — | nm | |||||||||||||||||||||||||||
| 1-4 Family Investment Mortgage | 2,533 | 2,749 | (8) | 3,386 | (25) | |||||||||||||||||||||||||||
| Total 1-4 Family Properties | 2,844 | 3,060 | (7) | 3,386 | (16) | |||||||||||||||||||||||||||
| Residential Development | 268 | 303 | (12) | 267 | — | |||||||||||||||||||||||||||
| Land Acquisition | 1,422 | 606 | 135 | 538 | 164 | |||||||||||||||||||||||||||
| Land and Development | 1,690 | 909 | 86 | 805 | 110 | |||||||||||||||||||||||||||
| Total Commercial Real Estate | 86,805 | 15,537 | 459 | 35,135 | 147 | |||||||||||||||||||||||||||
| Consumer Mortgages | 48,956 | 48,352 | 1 | 43,863 | 12 | |||||||||||||||||||||||||||
| Home Equity | 15,837 | 14,947 | 6 | 11,620 | 36 | |||||||||||||||||||||||||||
| Other Consumer Loans | 5,972 | 6,186 | (3) | 7,941 | (25) | |||||||||||||||||||||||||||
| Total Consumer | 70,765 | 69,485 | 2 | 63,424 | 12 | |||||||||||||||||||||||||||
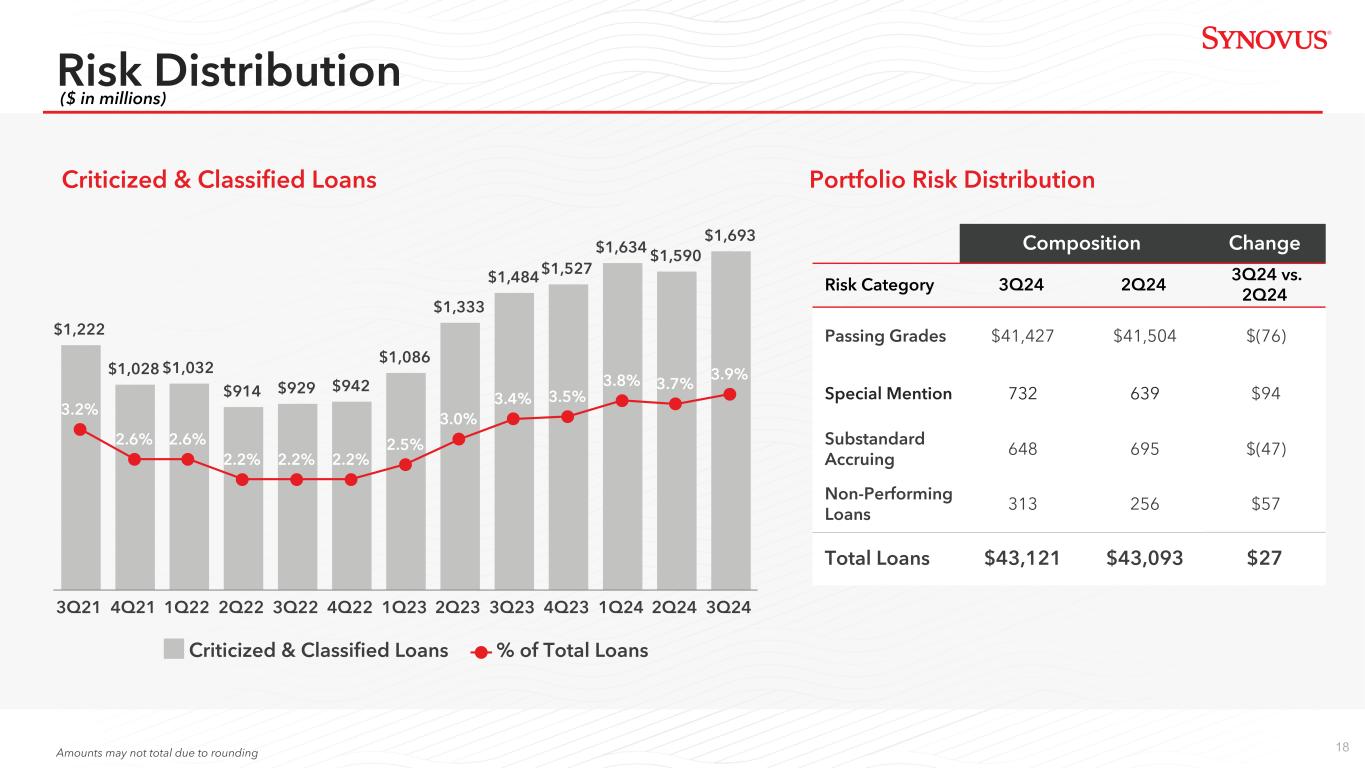
| Total | $ | 312,964 | $ | 256,106 | 22 | % | $ | 280,532 | 12 | % | ||||||||||||||||||||||
| Synovus | |||||||||||||||||||||||||||||||||||||||||
| CREDIT QUALITY DATA | |||||||||||||||||||||||||||||||||||||||||
| (Unaudited) | |||||||||||||||||||||||||||||||||||||||||
| (Dollars in thousands) | 2024 | 2023 | Third Quarter | ||||||||||||||||||||||||||||||||||||||
| Third | Second | First | Fourth | Third | '24 vs '23 | ||||||||||||||||||||||||||||||||||||
| Quarter | Quarter | Quarter | Quarter | Quarter | % Change | ||||||||||||||||||||||||||||||||||||
| Non-performing Loans (NPLs) | $ | 312,964 | 256,106 | 350,450 | 288,177 | 280,532 | 12 | % | |||||||||||||||||||||||||||||||||
| Other Real Estate and Other Assets | 386 | 823 | 21,210 | — | — | nm | |||||||||||||||||||||||||||||||||||
| Non-performing Assets (NPAs) | 313,350 | 256,929 | 371,660 | 288,177 | 280,532 | 12 | |||||||||||||||||||||||||||||||||||
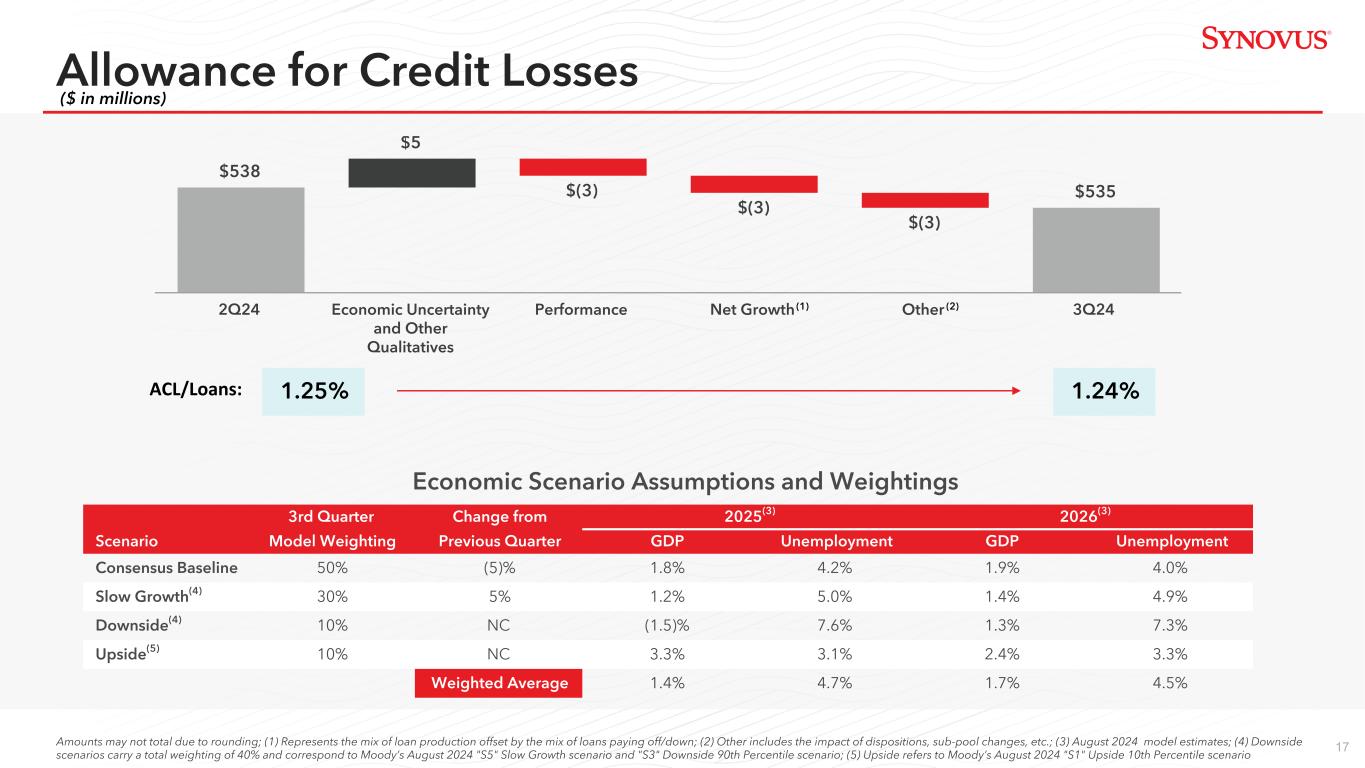
| Allowance for Loan Losses (ALL) | 484,985 | 485,101 | 492,661 | 479,385 | 477,532 | 2 | |||||||||||||||||||||||||||||||||||
| Reserve for Unfunded Commitments | 49,556 | 53,058 | 53,579 | 57,231 | 55,185 | (10) | |||||||||||||||||||||||||||||||||||
Allowance for Credit Losses (ACL) |
534,541 | 538,159 | 546,240 | 536,616 | 532,717 | — | |||||||||||||||||||||||||||||||||||
| Net Charge-Offs - Quarter | 27,052 | 34,485 | 44,356 | 41,574 | 66,822 | ||||||||||||||||||||||||||||||||||||
| Net Charge-Offs - YTD | 105,893 | 78,841 | 44,356 | 153,342 | 111,768 | ||||||||||||||||||||||||||||||||||||
Net Charge-Offs / Average Loans - Quarter (1) |
0.25 | % | 0.32 | 0.41 | 0.38 | 0.61 | |||||||||||||||||||||||||||||||||||
Net Charge-Offs / Average Loans - YTD (1) |
0.33 | 0.36 | 0.41 | 0.35 | 0.34 | ||||||||||||||||||||||||||||||||||||
| NPLs / Loans | 0.73 | 0.59 | 0.81 | 0.66 | 0.64 | ||||||||||||||||||||||||||||||||||||
| NPAs / Loans, ORE and specific other assets | 0.73 | 0.60 | 0.86 | 0.66 | 0.64 | ||||||||||||||||||||||||||||||||||||
| ACL/Loans | 1.24 | 1.25 | 1.26 | 1.24 | 1.22 | ||||||||||||||||||||||||||||||||||||
| ALL/Loans | 1.12 | 1.13 | 1.14 | 1.10 | 1.09 | ||||||||||||||||||||||||||||||||||||
| ACL/NPLs | 170.80 | 210.13 | 155.87 | 186.21 | 189.90 | ||||||||||||||||||||||||||||||||||||
| ALL/NPLs | 154.96 | 189.41 | 140.58 | 166.35 | 170.22 | ||||||||||||||||||||||||||||||||||||
| Past Due Loans over 90 days and Still Accruing | $ | 4,359 | 4,460 | 3,748 | 5,053 | 3,792 | 15 | ||||||||||||||||||||||||||||||||||
| As a Percentage of Loans Outstanding | 0.01 | % | 0.01 | 0.01 | 0.01 | 0.01 | |||||||||||||||||||||||||||||||||||
| Total Past Due Loans and Still Accruing | $ | 97,229 | 129,759 | 54,814 | 59,099 | 54,974 | 77 | ||||||||||||||||||||||||||||||||||
| As a Percentage of Loans Outstanding | 0.23 | % | 0.30 | 0.13 | 0.14 | 0.13 | |||||||||||||||||||||||||||||||||||
(1) Ratio is annualized. |
|||||||||||||||||||||||||||||||||||||||||
SELECTED CAPITAL INFORMATION (1) |
|||||||||||||||||||||||||||||||||||||||||
| (Unaudited) | |||||||||||||||||||||||||||||||||||||||||
| (Dollars in thousands) | |||||||||||||||||||||||||||||||||||||||||
| September 30, 2024 | December 31, 2023 | September 30, 2023 | |||||||||||||||||||||||||||||||||||||||
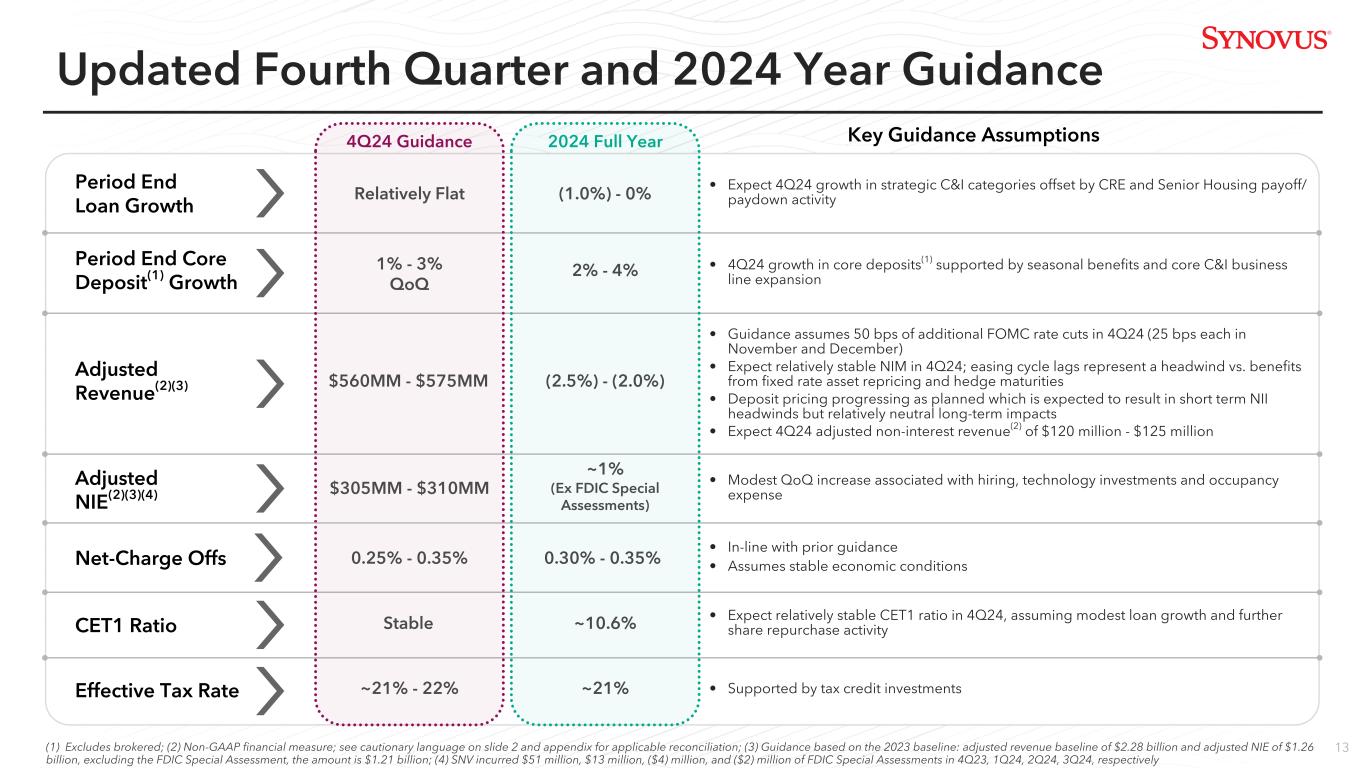
| Common Equity Tier 1 Capital Ratio | 10.65 | % | 10.22 | 10.13 | |||||||||||||||||||||||||||||||||||||
| Tier 1 Capital Ratio | 11.77 | 11.28 | 11.18 | ||||||||||||||||||||||||||||||||||||||
| Total Risk-Based Capital Ratio | 13.62 | 13.07 | 13.12 | ||||||||||||||||||||||||||||||||||||||
| Tier 1 Leverage Ratio | 9.55 | 9.49 | 9.38 | ||||||||||||||||||||||||||||||||||||||
| Total Synovus Financial Corp. shareholders' equity as a Percentage of Total Assets | 8.99 | 8.56 | 7.65 | ||||||||||||||||||||||||||||||||||||||
Tangible Common Equity Ratio (2) (4) |
7.28 | 6.84 | 5.90 | ||||||||||||||||||||||||||||||||||||||
Book Value Per Common Share (3) |
$ | 33.94 | 31.24 | 27.36 | |||||||||||||||||||||||||||||||||||||
Tangible Book Value Per Common Share (2) |
30.29 | 27.65 | 23.74 | ||||||||||||||||||||||||||||||||||||||
(1) Current quarter regulatory capital information is preliminary. |
|||||||||||||||||||||||||||||||||||||||||
(2) Excludes the carrying value of goodwill and other intangible assets from common equity and total assets. |
|||||||||||||||||||||||||||||||||||||||||
(3) Book Value Per Common Share consists of Total Synovus Financial Corp. shareholders’ equity less Preferred stock divided by total common shares outstanding. |
|||||||||||||||||||||||||||||||||||||||||
(4) See "Non-GAAP Financial Measures" for applicable reconciliation. |
|||||||||||||||||||||||||||||||||||||||||
