
Third Quarter 2024 Investor Conference Presentation September 2024 Exhibit 99.1

2 This slide presentation and certain of our other filings with the Securities and Exchange Commission contain statements that constitute "forward-looking statements" within the meaning of, and subject to the protections of, Section 27A of the Securities Act of 1933, as amended, and Section 21E of the Securities Exchange Act of 1934, as amended. All statements other than statements of historical fact are forward-looking statements. You can identify these forward-looking statements through Synovus' use of words such as "believes," "anticipates," "expects," "may," "will," "assumes," "predicts," "could," "should," "would," "intends," "targets," "estimates," "projects," "plans," "potential" and other similar words and expressions of the future or otherwise regarding the outlook for Synovus' future business and financial performance and/or the performance of the banking industry and economy in general. These forward-looking statements include, among others, statements on our expectations related to (1) loan growth; (2) deposit growth and deposit costs; (3) net interest income and net interest margin; (4) revenue growth; (5) non-interest expense; (6) credit trends and key credit performance metrics; (7) our capital position; (8) our future operating and financial performance; (9) our strategy and initiatives for future revenue growth, balance sheet optimization, capital management, and expense management; (10) our effective tax rate; and (11) our assumptions underlying these expectations. Prospective investors are cautioned that any such forward-looking statements are not guarantees of future performance and involve known and unknown risks and uncertainties which may cause the actual results, performance or achievements of Synovus to be materially different from the future results, performance or achievements expressed or implied by such forward-looking statements. Forward- looking statements are based on the information known to, and current beliefs and expectations of, Synovus' management and are subject to significant risks and uncertainties. Actual results may differ materially from those contemplated by such forward-looking statements. A number of factors could cause actual results to differ materially from those contemplated by the forward-looking statements in this presentation. Many of these factors are beyond Synovus' ability to control or predict. These forward-looking statements are based upon information presently known to Synovus' management and are inherently subjective, uncertain and subject to change due to any number of risks and uncertainties, including, without limitation, the risks and other factors set forth in Synovus' filings with the Securities and Exchange Commission, including its Annual Report on Form 10-K for the year ended December 31, 2023 under the captions "Cautionary Notice Regarding Forward-Looking Statements" and "Risk Factors" and in Synovus' quarterly reports on Form 10-Q and current reports on Form 8-K. We believe these forward-looking statements are reasonable; however, undue reliance should not be placed on any forward-looking statements, which are based on current expectations and speak only as of the date that they are made. We do not assume any obligation to update any forward-looking statements as a result of new information, future developments or otherwise, except as otherwise may be required by law. This slide presentation contains certain non-GAAP financial measures determined by methods other than in accordance with generally accepted accounting principles. Such non-GAAP financial measures include the following: adjusted revenue, adjusted non-interest revenue, and adjusted non-interest expense. The most comparable GAAP measures to these measures are total revenue, total non-interest revenue, and total non-interest expense. Management believes that these non-GAAP financial measures provide meaningful additional information about Synovus to assist management and investors in evaluating Synovus' operating results, financial strength, the performance of its business and the strength of its capital position. However, these non-GAAP financial measures have inherent limitations as analytical tools and should not be considered in isolation or as a substitute for analyses of operating results or capital position as reported under GAAP. The non-GAAP financial measures should be considered as additional views of the way our financial measures are affected by significant items and other factors, and since they are not required to be uniformly applied, they may not be comparable to other similarly titled measures at other companies. Adjusted revenue and adjusted non-interest revenue are measures used by management to evaluate total revenue and total non-interest revenue exclusive of net investment securities gains (losses), fair value adjustments on non-qualified deferred compensation, and other items not indicative of ongoing operations that could impact period-to-period comparisons. Adjusted non-interest expense is a measure utilized by management to measure the success of expense management initiatives focused on reducing recurring controllable operating costs. The computations of the non-GAAP financial measures used in this slide presentation are set forth in the appendix to this slide presentation. Management does not provide a reconciliation for forward-looking non-GAAP financial measures where it is unable to provide a meaningful or accurate calculation or estimation of reconciling items and the information is not available without unreasonable effort. This is due to the inherent difficulty of forecasting the occurrence and the financial impact of various items that have not yet occurred, are out of Synovus’ control, or cannot be reasonably predicted. For the same reasons, Synovus’ management is unable to address the probable significance of the unavailable information. Forward-looking non-GAAP financial measures provided without the most directly comparable GAAP financial measures may vary materially from the corresponding GAAP financial measures. Forward-Looking Statements Use of Non-GAAP Financial Measures

3 Wholesale Bank Corporate & Investment Bank Community Bank Consumer Bank Financial Management Services A Diversified Business Model • Sectors Served: – Financial Institutions – Healthcare – Technology, Media & Communications • Private Capital and M&A Advisory • Commercial and SBA Lending • Private Wealth Management • Third Party Payments • Merchant Services • Key Source of Funding • Consumer Lending • Small Business Lending • Online Origination • 247 Branch Offices • Mortgage Lending • Brokerage Services • Personal and Institutional Trust Services • Family Office Services • Treasury Services; Commercial Card • ~$10 Billion in Commercial Analysis Balances • Further Growth Expected from Middle Market and CIB Build-Out • Implementing New Syndication Platform to Allow for Greater Scale • Swaps; Foreign Exchange; Lead Agent/Syndication Capabilities; Commodity Hedging Note: Loan, Deposit and Branch Information as of 6/30/24; (1) Reclassifications within Non-Interest Revenue in 1Q24 resulted in prior periods being reclassified Loans $25.3B Deposits $13.3B Loans $0.7B Deposits $0.1B Loans $8.0B Deposits $10.7B Loans $2.8B Deposits $18.8B Loans $5.3B Deposits $1.3B 2023 Non-Interest Revenue $195MM 2023 Non-Interest Revenue $80MM 2023 Non-Interest Revenue $39MMCapital Markets Treasury & Payment Solutions • Middle Market Lending • CRE Lending • Specialty Lending – Senior Housing – Restaurant Services – Lender Finance – Insurance Premium Finance • Public Funds (1)
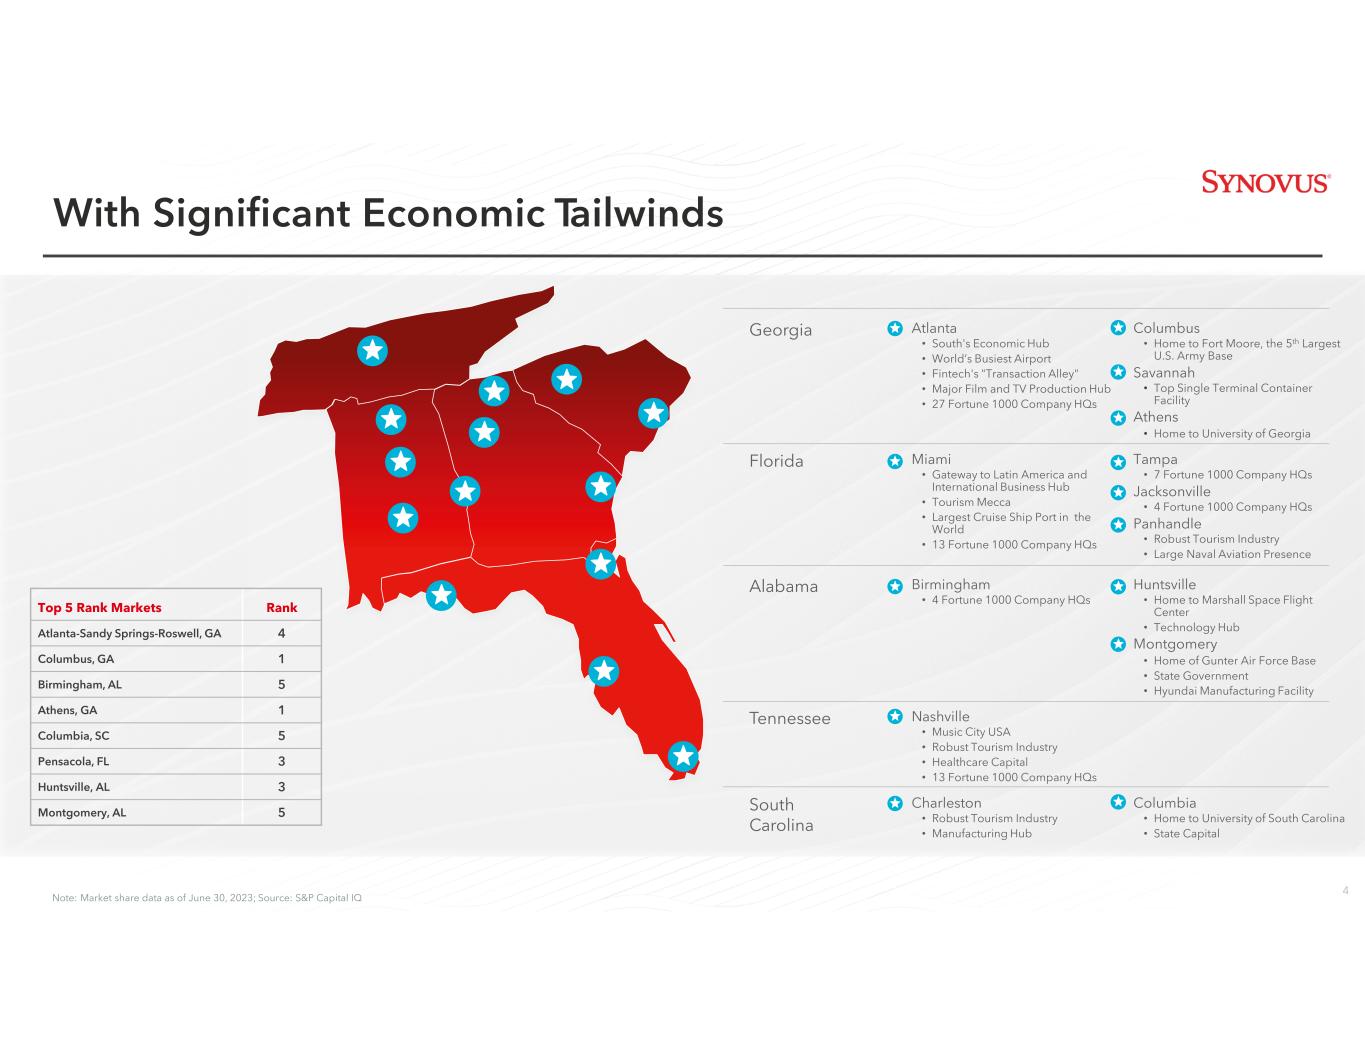
4 Georgia Atlanta • South's Economic Hub • World’s Busiest Airport • Fintech's "Transaction Alley" • Major Film and TV Production Hub • 27 Fortune 1000 Company HQs Columbus • Home to Fort Moore, the 5th Largest U.S. Army Base Savannah • Top Single Terminal Container Facility Athens • Home to University of Georgia Florida Miami • Gateway to Latin America and International Business Hub • Tourism Mecca • Largest Cruise Ship Port in the World • 13 Fortune 1000 Company HQs Tampa • 7 Fortune 1000 Company HQs Jacksonville • 4 Fortune 1000 Company HQs Panhandle • Robust Tourism Industry • Large Naval Aviation Presence Alabama Birmingham • 4 Fortune 1000 Company HQs Huntsville • Home to Marshall Space Flight Center • Technology Hub Montgomery • Home of Gunter Air Force Base • State Government • Hyundai Manufacturing Facility Tennessee Nashville • Music City USA • Robust Tourism Industry • Healthcare Capital • 13 Fortune 1000 Company HQs South Carolina Charleston • Robust Tourism Industry • Manufacturing Hub Columbia • Home to University of South Carolina • State Capital Top 5 Rank Markets Rank Atlanta-Sandy Springs-Roswell, GA 4 Columbus, GA 1 Birmingham, AL 5 Athens, GA 1 Columbia, SC 5 Pensacola, FL 3 Huntsville, AL 3 Montgomery, AL 5 With Significant Economic Tailwinds Note: Market share data as of June 30, 2023; Source: S&P Capital IQ

5 And a Strong Corporate Culture 5 Corporate Culture 25 Greenwich Best Brand and Excellence Awards in 2024 – 4th highest number of awards among 500+ banks evaluated Voice of the Team Member 2023 Survey revealed team member engagement and favorability that ranks in top 5% of the industry Formal Leadership Development Programs Multiple J.D. Power Awards Voted Best Multi- Family Office and Wealth Planning at 11th Annual Family Wealth Report Awards 2024 Best of the Best Self- Service Innovation, Contact Center Award by Customer Contact Week in 2024 Named Great Place To Work 4 Years In A Row Multiple Employee Resource Groups

6 Demonstrated Steady Progress in 1H24 • YTD core deposit(1) growth exceeded loan growth • Reduced brokered deposits significantly; wholesale funding ratio now 12.9% • Non-interest expense down 1% YTD on 7% YoY FTE reduction • Fraud and operating losses down 11% YTD • Net charge-offs/average loans contained at 0.36% YTD (annualized) • Increased ACL modestly to 1.25% of loans from YE 2023 • Increased CET1 Ratio by 38 bps to 10.60% from 12/31/2023 Deepen RelationshipsGrow the Bank • Received 25 Greenwich awards for 2023 performance; 4th highest number of total awards among 500+ banks evaluated • Launched commodity hedging product • Continued to execute on Wealth Management Business Owner Wealth Strategy with 52% conversion rate for qualified clients • Increased Treasury and Payment Solutions sales to existing SNV clients • Launched differentiated, new TPS product Accelerate Pay in April • Launched new brand campaign with TV spots and digital content • Hired new Payments Executive and CEO of Maast • Middle market banker team grew 7% YTD • Generated 8% annualized loan growth in Middle Market, CIB and Specialty Lines • Raised $257 MM of incremental Wholesale Bank core deposits(1) in "Go for the Gold" campaign • Increased Treasury and Payments Solutions revenue by 9% YTD • Grew Commercial Sponsorship revenue significantly YoY due to expanded GreenSky relationship Enhance Profitability and Risk Profile (1) Excludes Brokered

7 Deposit Portfolio (as of 6/30/24) % of Deposits Approximate Beta in Easing Cycle Non-Interest Bearing Deposits 23% —% Core Time Deposits 17% 70% - 80% Brokered Deposits 11% 75% - 85% Low-Beta/Standard Non-Maturity Deposits 24% 15% - 25% Higher-Beta Non-Maturity Deposits 25% 70% - 80% Total Deposits 100% 40% - 45% Leads & Lags in an Easing Cycle Amounts may not total due to rounding; all figures are estimates based on the loan or deposit portfolio(s) composition as of 6/30/24; for loans, excludes effective cash-flow loan hedges of $4.1 billion (as of 6/30/24); for deposits, reflects an estimated repricing beta over a 12-month period, assuming an easing cycle of approximately 100 bps; betas presented may not align with those used for modeling NII sensitivities, as disclosed for Market Risk Variable Loan Portfolio (as of 6/30/24) Loan Balances % of Total Loans SOFR (overnight) ~ $1B 2% Prime ~ $3B 7% 1M Indexes (i.e., 1M SOFR) ~ $19B 44% 3M Indexes (i.e., 3M SOFR) ~ $2B 4% Other Variable Indexes ~ $2B 4% Total Variable Loans ~ $26B ~ 62% Variable Loan Indexes Lead FOMC Rate Changes … … While Deposit Repricing Generally Lags
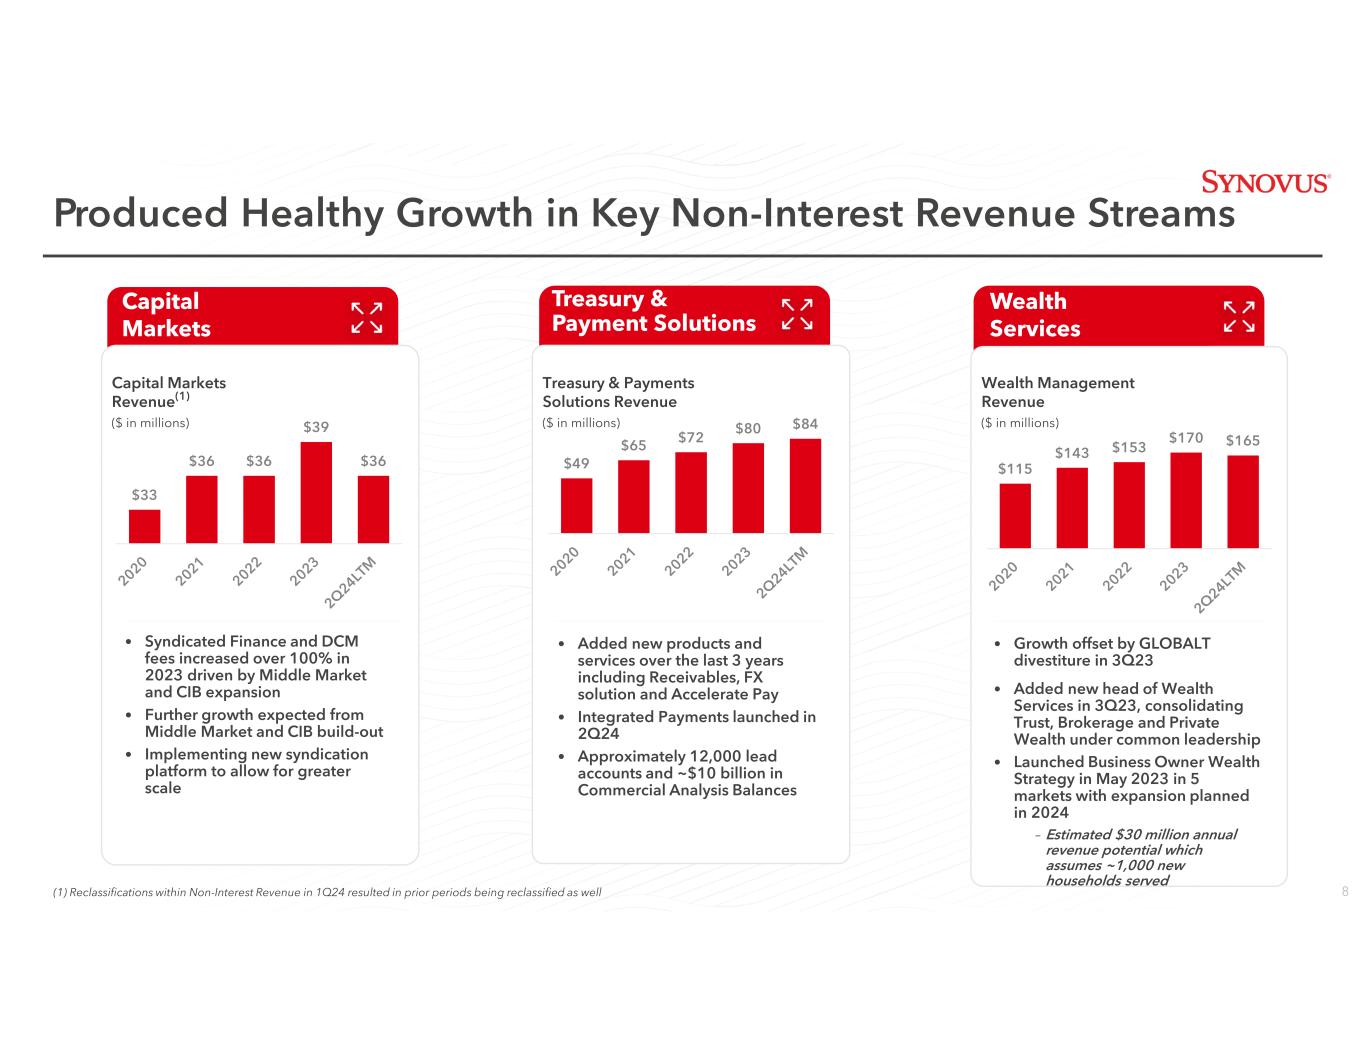
8 Treasury & Payment Solutions • Added new products and services over the last 3 years including Receivables, FX solution and Accelerate Pay • Integrated Payments launched in 2Q24 • Approximately 12,000 lead accounts and ~$10 billion in Commercial Analysis Balances Capital Markets • Syndicated Finance and DCM fees increased over 100% in 2023 driven by Middle Market and CIB expansion • Further growth expected from Middle Market and CIB build-out • Implementing new syndication platform to allow for greater scale Wealth Services • Growth offset by GLOBALT divestiture in 3Q23 • Added new head of Wealth Services in 3Q23, consolidating Trust, Brokerage and Private Wealth under common leadership • Launched Business Owner Wealth Strategy in May 2023 in 5 markets with expansion planned in 2024 – Estimated $30 million annual revenue potential which assumes ~1,000 new households served Capital Markets Revenue ($ in millions) Treasury & Payments Solutions Revenue ($ in millions) Wealth Management Revenue ($ in millions) Produced Healthy Growth in Key Non-Interest Revenue Streams $33 $36 $36 $39 $36 $49 $65 $72 $80 $84 $115 $143 $153 $170 $165 (1) Reclassifications within Non-Interest Revenue in 1Q24 resulted in prior periods being reclassified as well (1)

9 (0.2)% 7.2% 4.2% 5.4% 9.0% 10.3% 3.8% 8.9% 7.1% 2021 2022 2023 SNV Proxy Peers Median KRX Members Median (6.8)% 5.2% 15.4% 2021 2022 2023 Amounts may not total due to rounding; (1) Non-GAAP financial measure; see appendix for applicable reconciliation; (2) Source: S&P Global and SNV filings; (3) For purposes of this graph, 2023 adjusted NIE of $1.21 billion excludes the 4Q23 FDIC Special Assessment of $51.0 million; (4) Proxy peers are: BOKF, BKU, CADE, CMA, CFR, FHN, FNB, HWC, NYCB, PNFP, BPOP, RF, SSB, WBS, WAL, ZION Headcount Down 7% YoY in 2Q24 and 11% Since 2019 Exercised Disciplined Expense Control 5,389 5,247 4,988 5,114 4,879 4,812 4,805 2019 2020 2021 2022 2023 1Q24 2Q24 SNV Headcount SNV Adjusted Non-Interest Expense Growth vs. Peers(1)(2)(3) (4) SNV Reported Non-Interest Expense Growth Up 4.2% Ex Loss on Loan Sales, Restructuring Charges and FDIC Special Assessment
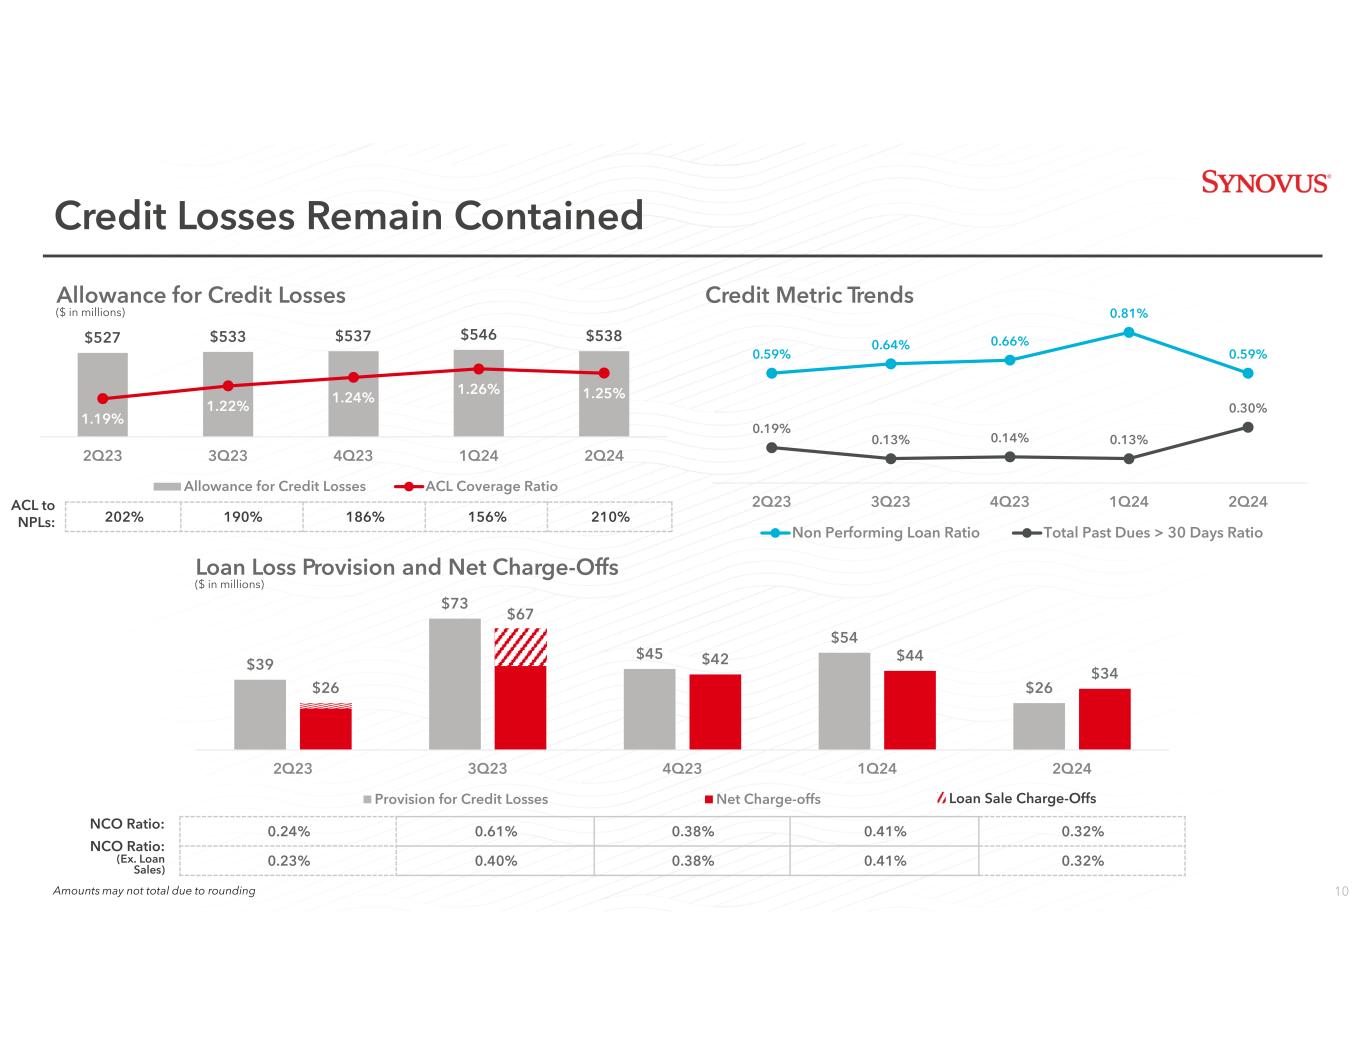
10 $527 $533 $537 $546 $538 1.19% 1.22% 1.24% 1.26% 1.25% 2Q23 3Q23 4Q23 1Q24 2Q24 Allowance for Credit Losses ACL Coverage Ratio ACL to NPLs: Credit Losses Remain Contained Allowance for Credit Losses ($ in millions) Credit Metric Trends 202% 190% 186% 156% 210% NCO Ratio: NCO Ratio: (Ex. Loan Sales) $39 $73 $45 $54 $26$26 $67 $42 $44 $34 2Q23 3Q23 4Q23 1Q24 2Q24 Provision for Credit Losses Net Charge-offs 0.24% 0.61% 0.38% 0.41% 0.32% 0.23% 0.40% 0.38% 0.41% 0.32% Loan Loss Provision and Net Charge-Offs ($ in millions) 0.59% 0.64% 0.66% 0.81% 0.59% 0.19% 0.13% 0.14% 0.13% 0.30% 2Q23 3Q23 4Q23 1Q24 2Q24 Non Performing Loan Ratio Total Past Dues > 30 Days Ratio Loan Sale Charge-Offs Amounts may not total due to rounding

11 Enhanced Safety and Soundness Capital Credit Liquidity CET1 Ratio +97 bps since 12/31/22 Highest Tier 1 Ratio in Over a Decade Reduced CRE % Loans Exposure Stable Non-Performing Loan Ratio Trend In Challenged Environment 2Q24 YoY Borrowings/Assets Improvement(1)(2) Significantly Increased Liquidity Sources Amounts may not total due to rounding; (1) Source: SNV company reports and S&P Global; (2) Includes Fed Funds purchased and securities sold under repo, other short-term borrowings and long-term debt; (3) Proxy peers are: BOKF, BKU, CADE, CMA, CFR, FHN, FNB, HWC, NYCB, PNFP, BPOP, RF, SSB, WBS, WAL, ZION Primary: Dec. 31, 2022 June 30, 2024 $10.8B $14.7B Secondary: $7.1B $17.9B Total: $12.2B $26.9B Primary: Secondary: Total: 10.5% 10.9% 10.4% 10.1% 10.4% 10.6% 10.2% 11.0% 10.7% 10.7% 11.3% 11.5% 11.7% 9.63% 9.77% 9.86% 10.13% 10.22% 10.38% 10.60% 4Q22 1Q23 2Q23 3Q23 4Q23 1Q24 2Q24 30.0% 28.4% 28.4% 28.2% 28.3% 6.8% 4.4% 4.4% 4.3% 4.2% 2Q23 3Q23 4Q23 1Q24 2Q24 CRE Loans/Total Loans Office Loans/Total Loans -5.1% -2.2% SNV Proxy Peers (median) 0.59% 0.64% 0.66% 0.81% 0.59% 2Q23 3Q23 4Q23 1Q24 2Q24 (3)
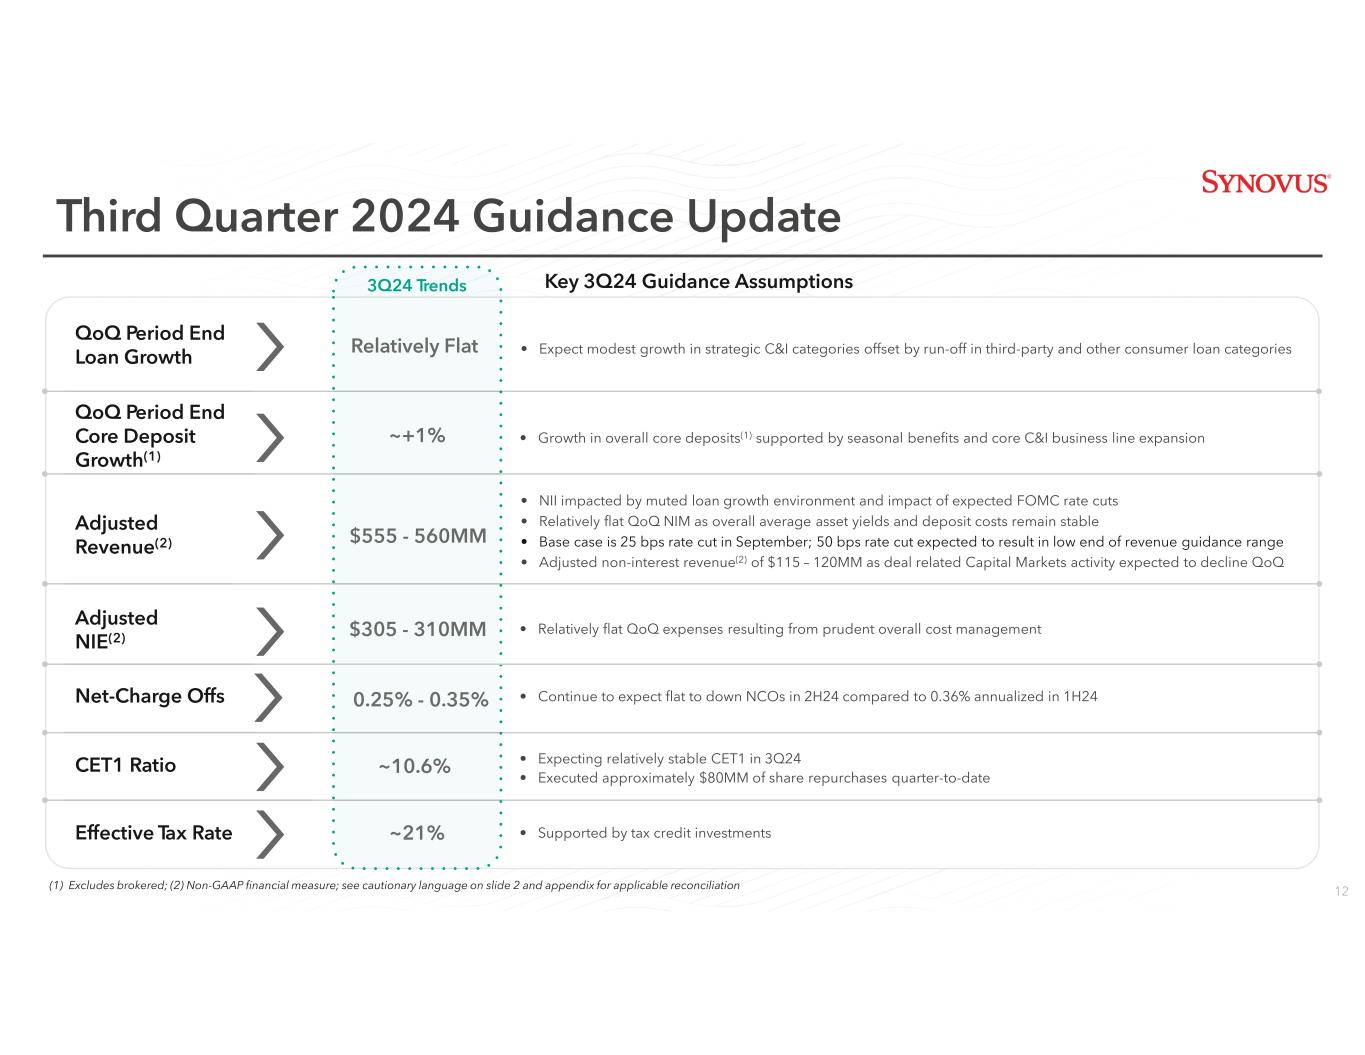
12 Third Quarter 2024 Guidance Update Key 3Q24 Guidance Assumptions QoQ Period End Loan Growth QoQ Period End Core Deposit Growth(1) Adjusted Revenue(2) Adjusted NIE(2) Effective Tax Rate CET1 Ratio (1) Excludes brokered; (2) Non-GAAP financial measure; see cautionary language on slide 2 and appendix for applicable reconciliation • Expect modest growth in strategic C&I categories offset by run-off in third-party and other consumer loan categories • Growth in overall core deposits(1) supported by seasonal benefits and core C&I business line expansion • Expecting relatively stable CET1 in 3Q24 • Executed approximately $80MM of share repurchases quarter-to-date • Supported by tax credit investments • NII impacted by muted loan growth environment and impact of expected FOMC rate cuts • Relatively flat QoQ NIM as overall average asset yields and deposit costs remain stable • Base case is 25 bps rate cut in September; 50 bps rate cut expected to result in low end of revenue guidance range • Adjusted non-interest revenue(2) of $115 – 120MM as deal related Capital Markets activity expected to decline QoQ • Relatively flat QoQ expenses resulting from prudent overall cost management 3Q24 Trends ~+1% Relatively Flat $555 - 560MM $305 - 310MM ~10.6% ~21% Net-Charge Offs 0.25% - 0.35% • Continue to expect flat to down NCOs in 2H24 compared to 0.36% annualized in 1H24

Appendix

14 Consumer Portfolio $8.3 billion CRE Portfolio $12.2 billion C&I Portfolio $22.5 billion 2Q24 Portfolio Characteristics C&I CRE Consumer NPL Ratio 0.76% 0.13% 0.83% QTD Net Charge-off Ratio (annualized) 0.53% (0.01)% 0.24% 30+ Days Past Due Ratio 0.08% 0.67% 0.37% 90+ Days Past Due Ratio 0.01% 0.00% 0.02% Amounts may not total due to rounding; (1) Industry-focused C&I is comprised of senior housing, structured lending (primarily lender finance), insurance premium finance, CIB, restaurant finance, and public funds portfolios; (2) LTV is calculated by dividing the most recent appraisal value (typically at origination) by the sum of the 6/30/2024 commitment amount and any existing senior lien Loan Portfolio by Category Highly Diverse Loan Mix (1) • C&I portfolio is well-diversified among multiple lines-of-business • Diverse C&I industry mix aligned with economic and demographic drivers • SNCs total $5.0 billion, ~$500 million of which is agented by SNV • 93% are income-producing properties • Diversity among property types and geographies • 30+ Days Past Due Ratio includes 0.30% attributable to one office loan that is no longer 30+ days past due as of July 17 • Weighted average credit score of 796 and 782 for Home Equity and Mortgage, respectively • Weighted average LTV of 72.9% and 70.8% for Home Equity and Mortgage, respectively(2)

15 Credit Indicator 2Q24 NPL Ratio 0.76% Net Charge-off Ratio (annualized) 0.53% 30+ Days Past Due Ratio 0.08% 90+ Days Past Due Ratio 0.01% • Finance/Insurance predominantly represented by secured lender finance portfolio 0.00% NPL Ratio (0.01)% Net Charge-Off Ratio (annualized) 0.00% 30+ Day Past Due Ratio • Senior Housing consists of 90% private pay assisted living/independent living facilities Diverse Industry Exposure Total C&I Portfolio $22.5 billion Amounts may not total due to rounding; (1) These segments are not two digit NAICS industry divisions; Senior Housing is a subset of NAICS 62 Health Care and Social Assistance, and R/E other and R/E leasing together comprise NAICS 53 Real Estate, Rental, and Leasing (1) (1) (1) C&I Loan Portfolio

16 Credit Indicator 2Q24 NPL Ratio 0.83% Net Charge-off Ratio (annualized) 0.24% 30+ Days Past Due Ratio 0.37% 90+ Days Past Due Ratio 0.02% Total Consumer Portfolio $8.3 billion Credit Indicator Home Equity Mortgage Weighted Average Credit Score of 2Q24 Originations 795 769 Weighted Average Credit Score of Total Portfolio 796 782 Weighted Average LTV(1) 72.9% 70.8% Average DTI(2) 33.7% 30.9% Utilization Rate 38.1% N/A Amounts may not total due to rounding; (1) LTV is calculated by dividing the most recent appraisal value (typically at origination) by the sum of the 6/30/2024 commitment amount and any existing senior lien; (2) Average DTI of 2Q24 originations Consumer Credit Quality • ~86% of Consumer portfolio is backed by residential real estate • Other Consumer includes secured and unsecured products • Average consumer card utilization rate is 22.3% • Third party HFI portfolio $641 million Consumer Loan Portfolio

17 Commercial Real Estate Loan Portfolio Composition of 2Q24 CRE Portfolio Total CRE Portfolio $12.2 billion Investment Properties Land, Development and Residential Properties Portfolio Characteristics (as of June 30, 2024) Office Building Multi-family Shopping Centers Hotels Other Investment Properties Warehouse Residential Properties(1) Development & Land Balance (in millions) $1,802 $4,288 $1,299 $1,802 $1,271 $865 $553 $335 Weighted Average LTV(2) 54.0% 52.5% 55.2% 56.1% 48.8% 54.4% N/A N/A NPL Ratio 0.41% 0.04% 0.04% 0.00% 0.14% 0.02% 0.55% 0.27% Net Charge-off Ratio (annualized) 0.00% 0.00% 0.04% (0.03)% 0.00% 0.00% (0.03)% (0.17)% 30+ Days Past Due Ratio 4.25% 0.00% 0.00% 0.00% 0.15% 0.00% 0.23% 0.57% 90+ Days Past Due Ratio 0.00% 0.00% 0.00% 0.00% 0.03% 0.00% 0.00% 0.00% Investment Properties portfolio represent 93% of total CRE portfolio The portfolio is well diversified among property types CRE Credit Quality 0.13% NPL Ratio (0.01)% Net Charge-Off Ratio (annualized) 0.67% 30+ Day Past Due Ratio 0.00% 90+ Day Past Due Ratio Office Building 30+ Days Past Due Ratio includes 2.04% attributable to one office loan that is no longer 30+ days past due as of July 17 Amounts may not total due to rounding; (1) Includes 1-4 Family Construction and 1-4 Family Perm/Mini-Perm (primarily rental homes); (2) LTV calculated by dividing most recent appraisal (typically at origination) on non-construction component of portfolio by the 6/30/24 commitment amount and any senior lien

18Note: Amounts may not total due to rounding; Includes IPRE > $1MM only CRE Loan Maturities: 2024-2026 $375,138,006 $208,645,831 $352,879,425 $1,113,639,703 $1,988,471,794 $1,471,525,065 $391,945,055 $268,577,010 $465,004,177 $301,875,710 $257,901,420 $191,615,936 $250,535,266 $235,637,473 $197,055,400 $252,477,259 $172,106,142 2024 2025 2026 Maturities by Quarter – Note Current Balance + Unfunded Commitment Hotels Multifamily Office Buildings Other Shopping Warehouses CRE Sector 2024 2025 2026 Hotels $375,138,006 $208,645,831 $352,879,425 Multifamily $1,113,639,703 $1,988,471,794 $1,471,525,065 Office Buildings $391,945,055 $268,577,010 $465,004,177 Other Investment Properties $301,875,710 $257,901,420 $191,615,936 Shopping Centers $250,535,266 $235,637,473 $197,055,400 Warehouses $49,418,710 $252,477,259 $172,106,142 Total $2,482,554,474 $3,229,710,787 $2,850,186,145 Maturity Year Between 2024-2026 CRE Sector: $2,482,554,474 $3,229,710,787 $2,850,186,145

19 Collateral Type Property Subtype Asset Class Location Segment Top 10 MSAs by Note Current Balance + Unfunded Commitment, with Weighted Average LTV 54.0%(1) ($ in millions) $1.9 Billion Note Current Balance of $1.8B + Unfunded Commitment of $89MM 0.41% NPL Ratio 0.00% 1Q24 NCO Ratio 54.0% Weighted Average LTV 0.00% 90 DPD Ratio Office Loan Portfolio 230 # Loans 268 # Properties Note: Amounts may not total due to rounding; Key metrics above represent loans > $1 million and include total commitments, except for portfolio balance, unfunded commitment, and credit ratios; Sub MDD = Suburban Medical Demand Driver; Sub LDD = Suburban Large Demand; (1) LTV calculated by dividing most recent appraisal (typically at origination) on non-construction component of portfolio by the 6/30/24 commitment amount and any senior lien ($ in millions) Maturity 28.3% Matures in both 2024 & 2025 $6.7 Million Average Loan Size
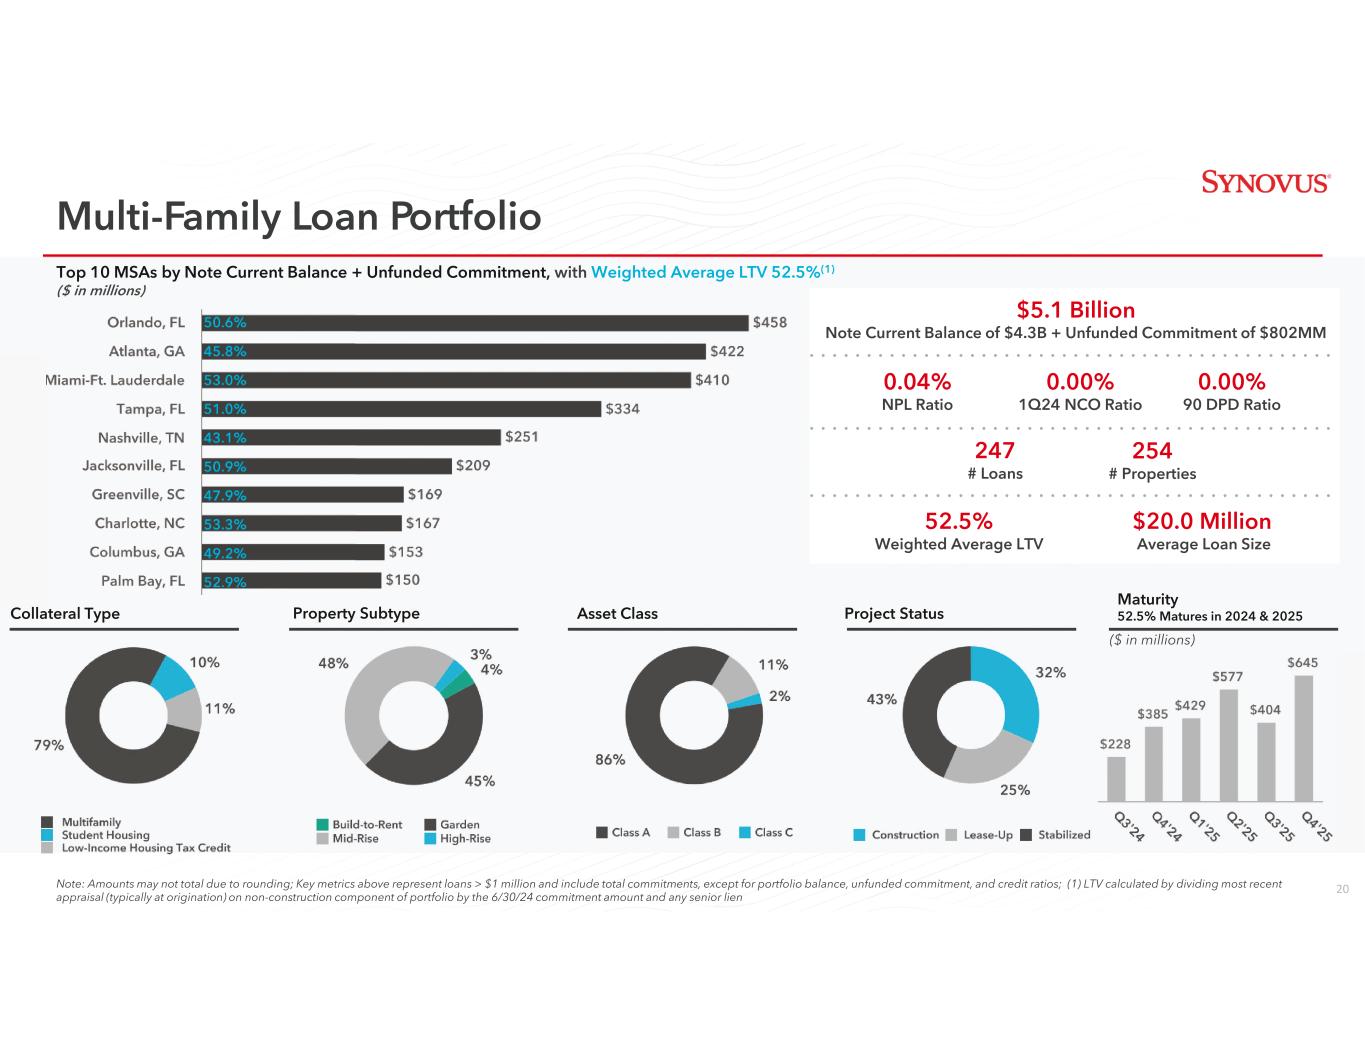
20 Collateral Type Property Subtype Asset Class Project Status Maturity 52.5% Matures in 2024 & 2025 Multi-Family Loan Portfolio Top 10 MSAs by Note Current Balance + Unfunded Commitment, with Weighted Average LTV 52.5%(1) ($ in millions) Note: Amounts may not total due to rounding; Key metrics above represent loans > $1 million and include total commitments, except for portfolio balance, unfunded commitment, and credit ratios; (1) LTV calculated by dividing most recent appraisal (typically at origination) on non-construction component of portfolio by the 6/30/24 commitment amount and any senior lien ($ in millions) $5.1 Billion Note Current Balance of $4.3B + Unfunded Commitment of $802MM 0.04% NPL Ratio 0.00% 1Q24 NCO Ratio 0.00% 90 DPD Ratio 247 # Loans 254 # Properties 52.5% Weighted Average LTV $20.0 Million Average Loan Size
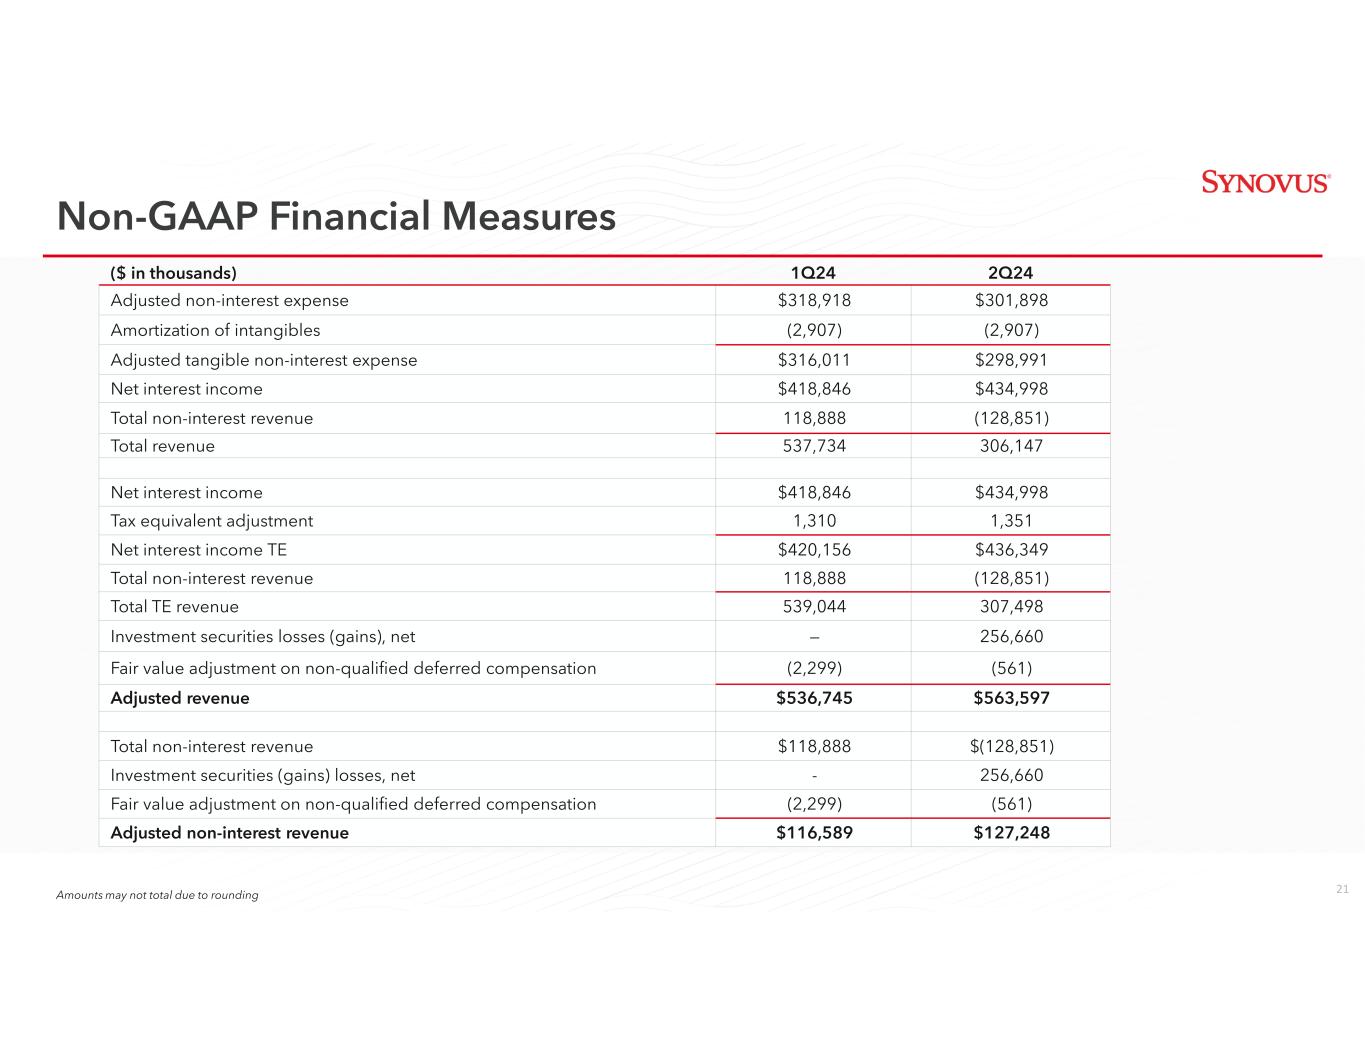
21 ($ in thousands) 1Q24 2Q24 Adjusted non-interest expense $318,918 $301,898 Amortization of intangibles (2,907) (2,907) Adjusted tangible non-interest expense $316,011 $298,991 Net interest income $418,846 $434,998 Total non-interest revenue 118,888 (128,851) Total revenue 537,734 306,147 Net interest income $418,846 $434,998 Tax equivalent adjustment 1,310 1,351 Net interest income TE $420,156 $436,349 Total non-interest revenue 118,888 (128,851) Total TE revenue 539,044 307,498 Investment securities losses (gains), net — 256,660 Fair value adjustment on non-qualified deferred compensation (2,299) (561) Adjusted revenue $536,745 $563,597 Total non-interest revenue $118,888 $(128,851) Investment securities (gains) losses, net - 256,660 Fair value adjustment on non-qualified deferred compensation (2,299) (561) Adjusted non-interest revenue $116,589 $127,248 Amounts may not total due to rounding Non-GAAP Financial Measures

22 ($ in thousands) 2020 2021 2022 2023 1Q24 2Q24 Total non-interest expense $1,179,574 $1,099,904 $1,157,506 $1,335,424 $322,741 $301,801 Restructuring (charges) reversals (26,991) (7,223) 9,690 (17,707) (1,524) 658 Valuation adjustment to Visa derivative (890) (2,656) (6,000) (3,927) — — Gain (loss) on early extinguishment of debt (10,466) — (677) 5,400 — — Fair value adjustment on non-qualified deferred compensation (2,310) (2,816) 4,054 (4,987) (2,299) (561) Loss on other loans held for sale — — — (50,064) — — Earnout liability adjustments (4,908) (507) — — — — Goodwill impairment (44,877) — — — — — Adjusted non-interest expense $1,089,132 $1,086,702 $1,164,573 $1,264,139 $318,918 $301,898 Amounts may not total due to rounding Non-GAAP Financial Measures, Continued


