| UNITED STATES SECURITIES AND EXCHANGE COMMISSION Washington, D.C. 20549 | |||||||||||||||||||||||||||||||||||
 | |||||||||||||||||||||||||||||||||||
| FORM | 8-K | ||||||||||||||||||||||||||||||||||
| Current Report | |||||||||||||||||||||||||||||||||||
|
Pursuant to Section 13 or 15(d) of the Securities Exchange Act of 1934
| |||||||||||||||||||||||||||||||||||
| Date of Report (Date of earliest event reported): | October 31, 2023 | ||||||||||||||||||||||||||||||||||
| CATERPILLAR INC. | |||||||||||||||||||||||||||||||||||
| (Exact name of registrant as specified in its charter) | |||||||||||||||||||||||||||||||||||
| Delaware | 1-768 | 37-0602744 | |||||||||||||||||||||||||||||||||
| (State or other jurisdiction of incorporation) | (Commission File Number) |
(I.R.S Employer Identification No.) |
|||||||||||||||||||||||||||||||||
| 5205 N. O'Connor Blvd., | Suite 100, | Irving, | Texas | 75039 | ||||||||||||||||||||||||||||
| (Address of principal executive offices) | (Zip Code) | |||||||||||||||||||||||||||||||
| Registrant’s telephone number, including area code: | (972) | 891-7700 | ||||||||||||||||||||||||||||||
| Former name or former address, if changed since last report: | N/A | |||||||||||||||||||||||||||||||
| ☐ | Written communications pursuant to Rule 425 under the Securities Act (17 CFR 230.425) | ||||||||||||||||||||||||||||||||||
| ☐ | Soliciting material pursuant to Rule 14a-12 under the Exchange Act (17 CFR 240.14a-12) | ||||||||||||||||||||||||||||||||||
| ☐ | Pre-commencement communications pursuant to Rule 14d-2(b) under the Exchange Act (17 CFR 240.14d-2(b)) | ||||||||||||||||||||||||||||||||||
| ☐ | Pre-commencement communications pursuant to Rule 13e-4(c) under the Exchange Act (17 CFR 240.13e-4(c)) | ||||||||||||||||||||||||||||||||||
|
Securities registered pursuant to Section 12(b) of the Act:
| |||||||||||||||||||||||||||||||||||
| Title of each class | Trading Symbol (s) | Name of each exchange which registered | |||||||||||||||||||||||||||||||||
| Common Stock ($1.00 par value) | CAT | The New York Stock Exchange | |||||||||||||||||||||||||||||||||
| 5.3% Debentures due September 15, 2035 | CAT35 | The New York Stock Exchange | |||||||||||||||||||||||||||||||||
| Check the appropriate box below if the Form 8-K filing is intended to simultaneously satisfy the filing obligation of the registrant under any of the following provisions: | |||||||||||||||||||||||||||||||||||
| Indicate by check mark whether the registrant is an emerging growth company as defined by Rule 405 of the Securities Act of | |||||||||||||||||||||||||||||||||||
| 1933 (17 CFR §230.405 of this chapter) or Rule 12b-2 of the Securities Exchange Act of 1934 (17 CFR §240.12b-2 of this chapter). | |||||||||||||||||||||||||||||||||||
| Emerging growth company | ☐ | ||||||||||||||||||||||||||||||||||
| If an emerging growth company, indicate by check mark if the registrant has elected not to use the extended transition period | |||||||||||||||||||||||||||||||||||
| for complying with any new or revised financial accounting standards provided pursuant to Section 13(a) of the Exchange Act. | ☐ | ||||||||||||||||||||||||||||||||||
| (d) | Exhibits: | ||||||||||
| The following is furnished as an exhibit to this report: | |||||||||||
| 99.1 | |||||||||||
| 99.2 | |||||||||||
| 104 | The cover page from this Current Report on Form 8-K, formatted in Inline XBRL. | ||||||||||
|
SIGNATURES
| ||||||||
| Pursuant to the requirements of the Securities Exchange Act of 1934, the registrant has duly caused this report to be signed on its behalf by the undersigned hereunto duly authorized. | ||||||||
| CATERPILLAR INC. | ||||||||
October 31, 2023 |
By: | /s/ Derek Owens | ||||||
| Derek Owens Senior Vice President and General Counsel |
||||||||
| Third Quarter | |||||||||||
| ($ in billions except profit per share) | 2023 | 2022 | |||||||||
| Sales and Revenues | $16.8 | $15.0 | |||||||||
| Profit Per Share | $5.45 | $3.87 | |||||||||
| Adjusted Profit Per Share | $5.52 | $3.95 | |||||||||
| ● | Third-quarter 2023 sales and revenues increased 12% to $16.8 billion | ||||
| ● | Third-quarter 2023 profit per share of $5.45; adjusted profit per share of $5.52 | ||||
| ● | Returned $1.0 billion to shareholders through dividends and share repurchases in the quarter | ||||
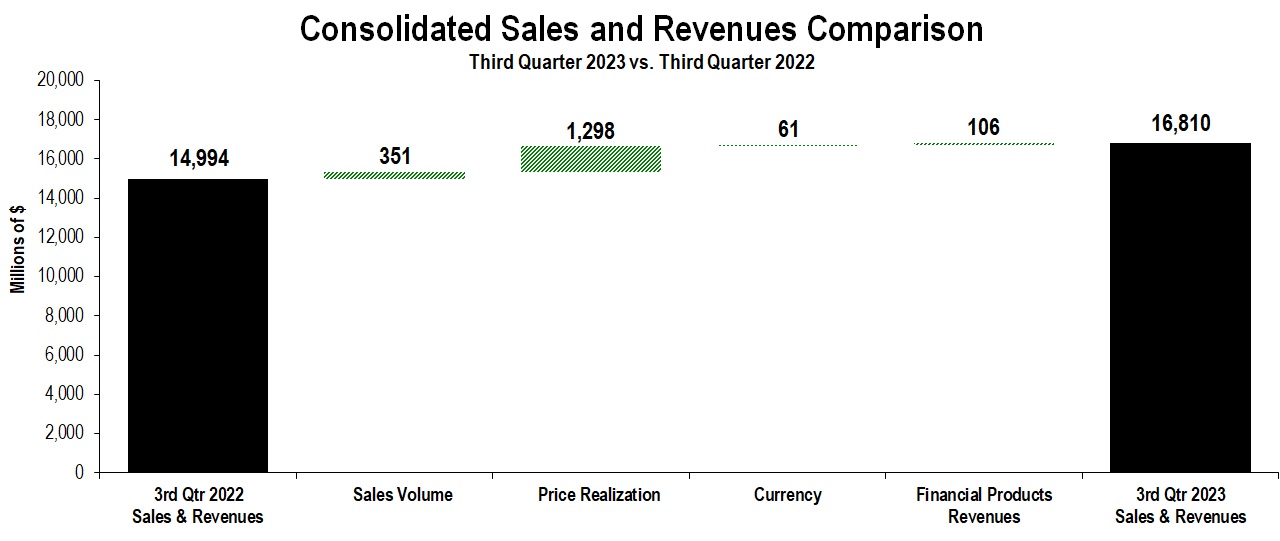
| Sales and Revenues by Segment | |||||||||||||||||||||||||||||||||||||||||||||||
| (Millions of dollars) | Third Quarter 2022 | Sales Volume |
Price Realization |
Currency | Inter-Segment / Other | Third Quarter 2023 | $ Change |
% Change |
|||||||||||||||||||||||||||||||||||||||
| Construction Industries | $ | 6,276 | $ | 62 | $ | 662 | $ | 21 | $ | (22) | $ | 6,999 | $ | 723 | 12% | ||||||||||||||||||||||||||||||||
| Resource Industries | 3,087 | (81) | 336 | (9) | 18 | 3,351 | 264 | 9% | |||||||||||||||||||||||||||||||||||||||
| Energy & Transportation | 6,186 | 415 | 298 | 45 | (85) | 6,859 | 673 | 11% | |||||||||||||||||||||||||||||||||||||||
| All Other Segment | 103 | (7) | 2 | — | 8 | 106 | 3 | 3% | |||||||||||||||||||||||||||||||||||||||
| Corporate Items and Eliminations | (1,374) | (38) | — | 4 | 81 | (1,327) | 47 | ||||||||||||||||||||||||||||||||||||||||
| Machinery, Energy & Transportation | 14,278 | 351 | 1,298 | 61 | — | 15,988 | 1,710 | 12% | |||||||||||||||||||||||||||||||||||||||
| Financial Products Segment | 819 | — | — | — | 160 | 979 | 160 | 20% | |||||||||||||||||||||||||||||||||||||||
| Corporate Items and Eliminations | (103) | — | — | — | (54) | (157) | (54) | ||||||||||||||||||||||||||||||||||||||||
| Financial Products Revenues | 716 | — | — | — | 106 | 822 | 106 | 15% | |||||||||||||||||||||||||||||||||||||||
| Consolidated Sales and Revenues | $ | 14,994 | $ | 351 | $ | 1,298 | $ | 61 | $ | 106 | $ | 16,810 | $ | 1,816 | 12% | ||||||||||||||||||||||||||||||||
| Sales and Revenues by Geographic Region | |||||||||||||||||||||||||||||||||||||||||||||||||||||||||||||||||||||||||||||||||||
| North America | Latin America | EAME | Asia/Pacific | External Sales and Revenues | Inter-Segment | Total Sales and Revenues | |||||||||||||||||||||||||||||||||||||||||||||||||||||||||||||||||||||||||||||
| (Millions of dollars) | $ | % Chg | $ | % Chg | $ | % Chg | $ | % Chg | $ | % Chg | $ | % Chg | $ | % Chg | |||||||||||||||||||||||||||||||||||||||||||||||||||||||||||||||||||||
| Third Quarter 2023 | |||||||||||||||||||||||||||||||||||||||||||||||||||||||||||||||||||||||||||||||||||
| Construction Industries | $ | 4,078 | 31% | $ | 555 | (31%) | $ | 1,351 | 8% | $ | 997 | (8%) | $ | 6,981 | 12% | $ | 18 | (55%) | $ | 6,999 | 12% | ||||||||||||||||||||||||||||||||||||||||||||||||||||||||||||||
| Resource Industries | 1,366 | 22% | 499 | 6% | 508 | (3%) | 886 | (1%) | 3,259 | 8% | 92 | 24% | 3,351 | 9% | |||||||||||||||||||||||||||||||||||||||||||||||||||||||||||||||||||||
| Energy & Transportation | 2,966 | 22% | 460 | (2%) | 1,428 | 12% | 901 | 9% | 5,755 | 15% | 1,104 | (7%) | 6,859 | 11% | |||||||||||||||||||||||||||||||||||||||||||||||||||||||||||||||||||||
| All Other Segment | 16 | —% | (1) | —% | 5 | 25% | 10 | (33%) | 30 | (14%) | 76 | 12% | 106 | 3% | |||||||||||||||||||||||||||||||||||||||||||||||||||||||||||||||||||||
| Corporate Items and Eliminations | (35) | 1 | — | (3) | (37) | (1,290) | (1,327) | ||||||||||||||||||||||||||||||||||||||||||||||||||||||||||||||||||||||||||||
| Machinery, Energy & Transportation | 8,391 | 26% | 1,514 | (13%) | 3,292 | 8% | 2,791 | (1%) | 15,988 | 12% | — | —% | 15,988 | 12% | |||||||||||||||||||||||||||||||||||||||||||||||||||||||||||||||||||||
| Financial Products Segment | 627 | 20% | 110 | 22% | 132 | 32% | 110 | 3% | 979 | 20% | — | —% | 979 | 20% | |||||||||||||||||||||||||||||||||||||||||||||||||||||||||||||||||||||
| Corporate Items and Eliminations | (91) | (21) | (22) | (23) | (157) | — | (157) | ||||||||||||||||||||||||||||||||||||||||||||||||||||||||||||||||||||||||||||
| Financial Products Revenues | 536 | 15% | 89 | 27% | 110 | 25% | 87 | (3%) | 822 | 15% | — | —% | 822 | 15% | |||||||||||||||||||||||||||||||||||||||||||||||||||||||||||||||||||||
| Consolidated Sales and Revenues | $ | 8,927 | 25% | $ | 1,603 | (11%) | $ | 3,402 | 8% | $ | 2,878 | (1%) | $ | 16,810 | 12% | $ | — | —% | $ | 16,810 | 12% | ||||||||||||||||||||||||||||||||||||||||||||||||||||||||||||||
| Third Quarter 2022 | |||||||||||||||||||||||||||||||||||||||||||||||||||||||||||||||||||||||||||||||||||
| Construction Industries | $ | 3,106 | $ | 799 | $ | 1,247 | $ | 1,084 | $ | 6,236 | $ | 40 | $ | 6,276 | |||||||||||||||||||||||||||||||||||||||||||||||||||||||||||||||||||||
| Resource Industries | 1,122 | 472 | 526 | 893 | 3,013 | 74 | 3,087 | ||||||||||||||||||||||||||||||||||||||||||||||||||||||||||||||||||||||||||||
| Energy & Transportation | 2,422 | 468 | 1,280 | 827 | 4,997 | 1,189 | 6,186 | ||||||||||||||||||||||||||||||||||||||||||||||||||||||||||||||||||||||||||||
| All Other Segment | 16 | — | 4 | 15 | 35 | 68 | 103 | ||||||||||||||||||||||||||||||||||||||||||||||||||||||||||||||||||||||||||||
| Corporate Items and Eliminations | 1 | — | — | (4) | (3) | (1,371) | (1,374) | ||||||||||||||||||||||||||||||||||||||||||||||||||||||||||||||||||||||||||||
| Machinery, Energy & Transportation | 6,667 | 1,739 | 3,057 | 2,815 | 14,278 | — | 14,278 | ||||||||||||||||||||||||||||||||||||||||||||||||||||||||||||||||||||||||||||
| Financial Products Segment | 522 | 90 | 100 | 107 | 819 | — | 819 | ||||||||||||||||||||||||||||||||||||||||||||||||||||||||||||||||||||||||||||
| Corporate Items and Eliminations | (54) | (20) | (12) | (17) | (103) | — | (103) | ||||||||||||||||||||||||||||||||||||||||||||||||||||||||||||||||||||||||||||
| Financial Products Revenues | 468 | 70 | 88 | 90 | 716 | — | 716 | ||||||||||||||||||||||||||||||||||||||||||||||||||||||||||||||||||||||||||||
| Consolidated Sales and Revenues | $ | 7,135 | $ | 1,809 | $ | 3,145 | $ | 2,905 | $ | 14,994 | $ | — | $ | 14,994 | |||||||||||||||||||||||||||||||||||||||||||||||||||||||||||||||||||||
| Profit (Loss) by Segment | |||||||||||||||||||||||
| (Millions of dollars) | Third Quarter 2023 | Third Quarter 2022 | $ Change |
%
Change
|
|||||||||||||||||||
| Construction Industries | $ | 1,847 | $ | 1,209 | $ | 638 | 53 | % | |||||||||||||||
| Resource Industries | 730 | 506 | 224 | 44 | % | ||||||||||||||||||
| Energy & Transportation | 1,181 | 935 | 246 | 26 | % | ||||||||||||||||||
| All Other Segment | 21 | 8 | 13 | 163 | % | ||||||||||||||||||
| Corporate Items and Eliminations | (386) | (373) | (13) | ||||||||||||||||||||
| Machinery, Energy & Transportation | 3,393 | 2,285 | 1,108 | 48 | % | ||||||||||||||||||
| Financial Products Segment | 203 | 220 | (17) | (8 | %) | ||||||||||||||||||
| Corporate Items and Eliminations | 18 | 30 | (12) | ||||||||||||||||||||
| Financial Products | 221 | 250 | (29) | (12 | %) | ||||||||||||||||||
| Consolidating Adjustments | (165) | (110) | (55) | ||||||||||||||||||||
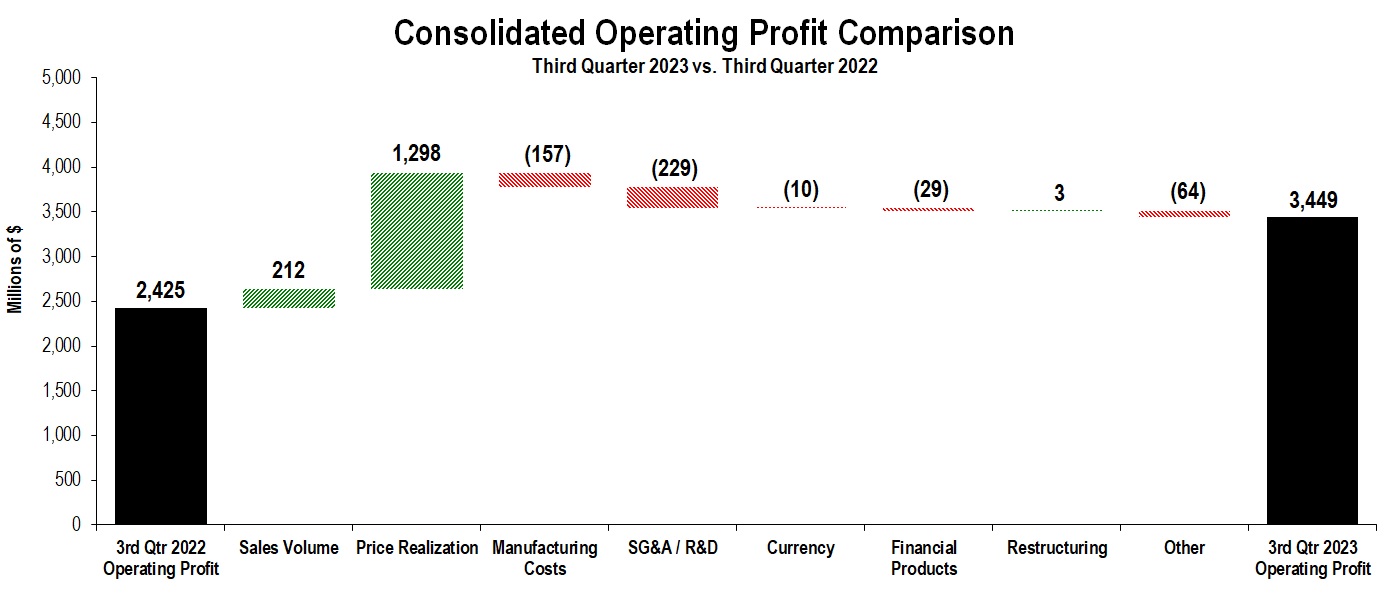
| Consolidated Operating Profit | $ | 3,449 | $ | 2,425 | $ | 1,024 | 42 | % | |||||||||||||||
| CONSTRUCTION INDUSTRIES | ||||||||||||||||||||||||||||||||||||||||||||||||||
| (Millions of dollars) | ||||||||||||||||||||||||||||||||||||||||||||||||||
| Segment Sales | ||||||||||||||||||||||||||||||||||||||||||||||||||
| Third Quarter 2022 | Sales Volume | Price Realization | Currency | Inter-Segment | Third Quarter 2023 | $ Change |
% Change |
|||||||||||||||||||||||||||||||||||||||||||
| Total Sales | $ | 6,276 | $ | 62 | $ | 662 | $ | 21 | $ | (22) | $ | 6,999 | $ | 723 | 12 | % | ||||||||||||||||||||||||||||||||||
| Sales by Geographic Region | ||||||||||||||||||||||||||||||||||||||||||||||||||
| Third Quarter 2023 | Third Quarter 2022 | $ Change |
% Change |
|||||||||||||||||||||||||||||||||||||||||||||||
| North America | $ | 4,078 | $ | 3,106 | $ | 972 | 31 | % | ||||||||||||||||||||||||||||||||||||||||||
| Latin America | 555 | 799 | (244) | (31 | %) | |||||||||||||||||||||||||||||||||||||||||||||
| EAME | 1,351 | 1,247 | 104 | 8 | % | |||||||||||||||||||||||||||||||||||||||||||||
| Asia/Pacific | 997 | 1,084 | (87) | (8 | %) | |||||||||||||||||||||||||||||||||||||||||||||
| External Sales | 6,981 | 6,236 | 745 | 12 | % | |||||||||||||||||||||||||||||||||||||||||||||
| Inter-segment | 18 | 40 | (22) | (55 | %) | |||||||||||||||||||||||||||||||||||||||||||||
| Total Sales | $ | 6,999 | $ | 6,276 | $ | 723 | 12 | % | ||||||||||||||||||||||||||||||||||||||||||
| Segment Profit | ||||||||||||||||||||||||||||||||||||||||||||||||||
| Third Quarter 2023 | Third Quarter 2022 |
Change |
% Change |
|||||||||||||||||||||||||||||||||||||||||||||||
| Segment Profit | $ | 1,847 | $ | 1,209 | $ | 638 | 53 | % | ||||||||||||||||||||||||||||||||||||||||||
| Segment Profit Margin | 26.4 | % | 19.3 | % | 7.1 | pts | ||||||||||||||||||||||||||||||||||||||||||||
| RESOURCE INDUSTRIES | ||||||||||||||||||||||||||||||||||||||||||||||||||
| (Millions of dollars) | ||||||||||||||||||||||||||||||||||||||||||||||||||
| Segment Sales | ||||||||||||||||||||||||||||||||||||||||||||||||||
| Third Quarter 2022 | Sales Volume | Price Realization | Currency | Inter-Segment | Third Quarter 2023 | $ Change |
% Change |
|||||||||||||||||||||||||||||||||||||||||||
| Total Sales | $ | 3,087 | $ | (81) | $ | 336 | $ | (9) | $ | 18 | $ | 3,351 | $ | 264 | 9 | % | ||||||||||||||||||||||||||||||||||
| Sales by Geographic Region | ||||||||||||||||||||||||||||||||||||||||||||||||||
| Third Quarter 2023 | Third Quarter 2022 | $ Change |
% Change |
|||||||||||||||||||||||||||||||||||||||||||||||
| North America | $ | 1,366 | $ | 1,122 | $ | 244 | 22 | % | ||||||||||||||||||||||||||||||||||||||||||
| Latin America | 499 | 472 | 27 | 6 | % | |||||||||||||||||||||||||||||||||||||||||||||
| EAME | 508 | 526 | (18) | (3 | %) | |||||||||||||||||||||||||||||||||||||||||||||
| Asia/Pacific | 886 | 893 | (7) | (1 | %) | |||||||||||||||||||||||||||||||||||||||||||||
| External Sales | 3,259 | 3,013 | 246 | 8 | % | |||||||||||||||||||||||||||||||||||||||||||||
| Inter-segment | 92 | 74 | 18 | 24 | % | |||||||||||||||||||||||||||||||||||||||||||||
| Total Sales | $ | 3,351 | $ | 3,087 | $ | 264 | 9 | % | ||||||||||||||||||||||||||||||||||||||||||
| Segment Profit | ||||||||||||||||||||||||||||||||||||||||||||||||||
| Third Quarter 2023 | Third Quarter 2022 |
Change |
% Change |
|||||||||||||||||||||||||||||||||||||||||||||||
| Segment Profit | $ | 730 | $ | 506 | $ | 224 | 44 | % | ||||||||||||||||||||||||||||||||||||||||||
| Segment Profit Margin | 21.8 | % | 16.4 | % | 5.4 | pts | ||||||||||||||||||||||||||||||||||||||||||||
| ENERGY & TRANSPORTATION | ||||||||||||||||||||||||||||||||||||||||||||||||||
| (Millions of dollars) | ||||||||||||||||||||||||||||||||||||||||||||||||||
| Segment Sales | ||||||||||||||||||||||||||||||||||||||||||||||||||
| Third Quarter 2022 | Sales Volume | Price Realization | Currency | Inter-Segment | Third Quarter 2023 | $ Change |
% Change |
|||||||||||||||||||||||||||||||||||||||||||
| Total Sales | $ | 6,186 | $ | 415 | $ | 298 | $ | 45 | $ | (85) | $ | 6,859 | $ | 673 | 11 | % | ||||||||||||||||||||||||||||||||||
| Sales by Application | ||||||||||||||||||||||||||||||||||||||||||||||||||
| Third Quarter 2023 | Third Quarter 2022 | $ Change |
% Change |
|||||||||||||||||||||||||||||||||||||||||||||||
| Oil and Gas | $ | 1,667 | $ | 1,323 | $ | 344 | 26 | % | ||||||||||||||||||||||||||||||||||||||||||
| Power Generation | 1,598 | 1,320 | 278 | 21 | % | |||||||||||||||||||||||||||||||||||||||||||||
| Industrial | 1,220 | 1,158 | 62 | 5 | % | |||||||||||||||||||||||||||||||||||||||||||||
| Transportation | 1,270 | 1,196 | 74 | 6 | % | |||||||||||||||||||||||||||||||||||||||||||||
| External Sales | 5,755 | 4,997 | 758 | 15 | % | |||||||||||||||||||||||||||||||||||||||||||||
| Inter-segment | 1,104 | 1,189 | (85) | (7 | %) | |||||||||||||||||||||||||||||||||||||||||||||
| Total Sales | $ | 6,859 | $ | 6,186 | $ | 673 | 11 | % | ||||||||||||||||||||||||||||||||||||||||||
| Segment Profit | ||||||||||||||||||||||||||||||||||||||||||||||||||
| Third Quarter 2023 | Third Quarter 2022 |
Change |
% Change |
|||||||||||||||||||||||||||||||||||||||||||||||
| Segment Profit | $ | 1,181 | $ | 935 | $ | 246 | 26 | % | ||||||||||||||||||||||||||||||||||||||||||
| Segment Profit Margin | 17.2 | % | 15.1 | % | 2.1 | pts | ||||||||||||||||||||||||||||||||||||||||||||
| FINANCIAL PRODUCTS SEGMENT | ||||||||||||||||||||||||||||||||||||||||||||||||||
| (Millions of dollars) | ||||||||||||||||||||||||||||||||||||||||||||||||||
| Revenues by Geographic Region | ||||||||||||||||||||||||||||||||||||||||||||||||||
| Third Quarter 2023 | Third Quarter 2022 | $ Change |
% Change |
|||||||||||||||||||||||||||||||||||||||||||||||
| North America | $ | 627 | $ | 522 | $ | 105 | 20 | % | ||||||||||||||||||||||||||||||||||||||||||
| Latin America | 110 | 90 | 20 | 22 | % | |||||||||||||||||||||||||||||||||||||||||||||
| EAME | 132 | 100 | 32 | 32 | % | |||||||||||||||||||||||||||||||||||||||||||||
| Asia/Pacific | 110 | 107 | 3 | 3 | % | |||||||||||||||||||||||||||||||||||||||||||||
| Total Revenues | $ | 979 | $ | 819 | $ | 160 | 20 | % | ||||||||||||||||||||||||||||||||||||||||||
| Segment Profit | ||||||||||||||||||||||||||||||||||||||||||||||||||
| Third Quarter 2023 | Third Quarter 2022 |
Change |
% Change |
|||||||||||||||||||||||||||||||||||||||||||||||
| Segment Profit | $ | 203 | $ | 220 | $ | (17) | (8 | %) | ||||||||||||||||||||||||||||||||||||||||||
| (Dollars in millions except per share data) | Operating Profit | Operating Profit Margin | Profit Before Taxes | Provision (Benefit) for Income Taxes | Effective Tax Rate | Profit | Profit per Share | |||||||||||||||||||||||||||||||||||||
Three Months Ended September 30, 2023 - U.S. GAAP |
$ | 3,449 | 20.5 | % | $ | 3,515 | $ | 734 | 20.9 | % | $ | 2,794 | $ | 5.45 | ||||||||||||||||||||||||||||||
| Restructuring costs | 46 | 0.3 | % | 46 | 10 | 20.0 | % | 36 | 0.07 | |||||||||||||||||||||||||||||||||||
Three Months Ended September 30, 2023 - Adjusted |
$ | 3,495 | 20.8 | % | $ | 3,561 | $ | 744 | 20.9 | % | $ | 2,830 | $ | 5.52 | ||||||||||||||||||||||||||||||
Three Months Ended September 30, 2022 - U.S. GAAP |
$ | 2,425 | 16.2 | % | $ | 2,558 | $ | 527 | 20.6 | % | $ | 2,041 | $ | 3.87 | ||||||||||||||||||||||||||||||
| Restructuring costs | 49 | 0.3 | % | 49 | 9 | 18.4 | % | 40 | 0.08 | |||||||||||||||||||||||||||||||||||
Three Months Ended September 30, 2022 - Adjusted |
$ | 2,474 | 16.5 | % | $ | 2,607 | $ | 536 | 20.6 | % | $ | 2,081 | $ | 3.95 | ||||||||||||||||||||||||||||||
| Three Months Ended September 30, | Nine Months Ended September 30, | ||||||||||||||||||||||
| 2023 | 2022 | 2023 | 2022 | ||||||||||||||||||||
| Sales and revenues: | |||||||||||||||||||||||
| Sales of Machinery, Energy & Transportation | $ | 15,988 | $ | 14,278 | $ | 47,632 | $ | 40,703 | |||||||||||||||
| Revenues of Financial Products | 822 | 716 | 2,358 | 2,127 | |||||||||||||||||||
| Total sales and revenues | 16,810 | 14,994 | 49,990 | 42,830 | |||||||||||||||||||
| Operating costs: | |||||||||||||||||||||||
| Cost of goods sold | 10,583 | 10,202 | 31,751 | 29,736 | |||||||||||||||||||
| Selling, general and administrative expenses | 1,624 | 1,401 | 4,615 | 4,172 | |||||||||||||||||||
| Research and development expenses | 554 | 476 | 1,554 | 1,413 | |||||||||||||||||||
| Interest expense of Financial Products | 280 | 151 | 742 | 377 | |||||||||||||||||||
| Other operating (income) expenses | 320 | 339 | 1,496 | 908 | |||||||||||||||||||
| Total operating costs | 13,361 | 12,569 | 40,158 | 36,606 | |||||||||||||||||||
| Operating profit | 3,449 | 2,425 | 9,832 | 6,224 | |||||||||||||||||||
| Interest expense excluding Financial Products | 129 | 109 | 385 | 326 | |||||||||||||||||||
| Other income (expense) | 195 | 242 | 354 | 755 | |||||||||||||||||||
| Consolidated profit before taxes | 3,515 | 2,558 | 9,801 | 6,653 | |||||||||||||||||||
| Provision (benefit) for income taxes | 734 | 527 | 2,194 | 1,423 | |||||||||||||||||||
| Profit of consolidated companies | 2,781 | 2,031 | 7,607 | 5,230 | |||||||||||||||||||
| Equity in profit (loss) of unconsolidated affiliated companies | 12 | 9 | 52 | 20 | |||||||||||||||||||
| Profit of consolidated and affiliated companies | 2,793 | 2,040 | 7,659 | 5,250 | |||||||||||||||||||
| Less: Profit (loss) attributable to noncontrolling interests | (1) | (1) | — | (1) | |||||||||||||||||||
Profit 1 |
$ | 2,794 | $ | 2,041 | $ | 7,659 | $ | 5,251 | |||||||||||||||
| Profit per common share | $ | 5.48 | $ | 3.89 | $ | 14.93 | $ | 9.91 | |||||||||||||||
Profit per common share — diluted 2 |
$ | 5.45 | $ | 3.87 | $ | 14.85 | $ | 9.85 | |||||||||||||||
| Weighted-average common shares outstanding (millions) | |||||||||||||||||||||||
| – Basic | 509.8 | 525.0 | 513.0 | 530.1 | |||||||||||||||||||
– Diluted 2 |
512.6 | 527.6 | 515.7 | 533.2 | |||||||||||||||||||
| 1 | Profit attributable to common shareholders. | ||||
| 2 | Diluted by assumed exercise of stock-based compensation awards using the treasury stock method. | ||||
| September 30, 2023 |
December 31, 2022 |
||||||||||
| Assets | |||||||||||
| Current assets: | |||||||||||
| Cash and cash equivalents | $ | 6,545 | $ | 7,004 | |||||||
| Receivables – trade and other | 9,134 | 8,856 | |||||||||
| Receivables – finance | 9,608 | 9,013 | |||||||||
| Prepaid expenses and other current assets | 5,138 | 2,642 | |||||||||
| Inventories | 17,580 | 16,270 | |||||||||
| Total current assets | 48,005 | 43,785 | |||||||||
| Property, plant and equipment – net | 12,287 | 12,028 | |||||||||
| Long-term receivables – trade and other | 1,110 | 1,265 | |||||||||
| Long-term receivables – finance | 11,907 | 12,013 | |||||||||
| Noncurrent deferred and refundable income taxes | 2,719 | 2,213 | |||||||||
| Intangible assets | 604 | 758 | |||||||||
| Goodwill | 5,268 | 5,288 | |||||||||
| Other assets | 4,891 | 4,593 | |||||||||
| Total assets | $ | 86,791 | $ | 81,943 | |||||||
| Liabilities | |||||||||||
| Current liabilities: | |||||||||||
| Short-term borrowings: | |||||||||||
| -- Machinery, Energy & Transportation | $ | — | $ | 3 | |||||||
| -- Financial Products | 4,218 | 5,954 | |||||||||
| Accounts payable | 7,827 | 8,689 | |||||||||
| Accrued expenses | 4,669 | 4,080 | |||||||||
| Accrued wages, salaries and employee benefits | 2,300 | 2,313 | |||||||||
| Customer advances | 2,333 | 1,860 | |||||||||
| Dividends payable | — | 620 | |||||||||
| Other current liabilities | 3,115 | 2,690 | |||||||||
| Long-term debt due within one year: | |||||||||||
| -- Machinery, Energy & Transportation | 1,043 | 120 | |||||||||
| -- Financial Products | 7,619 | 5,202 | |||||||||
| Total current liabilities | 33,124 | 31,531 | |||||||||
| Long-term debt due after one year: | |||||||||||
| -- Machinery, Energy & Transportation | 8,470 | 9,498 | |||||||||
| -- Financial Products | 15,789 | 16,216 | |||||||||
| Liability for postemployment benefits | 4,060 | 4,203 | |||||||||
| Other liabilities | 4,841 | 4,604 | |||||||||
| Total liabilities | 66,284 | 66,052 | |||||||||
| Shareholders’ equity | |||||||||||
| Common stock | 6,698 | 6,560 | |||||||||
| Treasury stock | (33,865) | (31,748) | |||||||||
| Profit employed in the business | 49,888 | 43,514 | |||||||||
| Accumulated other comprehensive income (loss) | (2,232) | (2,457) | |||||||||
| Noncontrolling interests | 18 | 22 | |||||||||
| Total shareholders’ equity | 20,507 | 15,891 | |||||||||
| Total liabilities and shareholders’ equity | $ | 86,791 | $ | 81,943 | |||||||
| Nine Months Ended September 30, | |||||||||||
| 2023 | 2022 | ||||||||||
| Cash flow from operating activities: | |||||||||||
| Profit of consolidated and affiliated companies | $ | 7,659 | $ | 5,250 | |||||||
| Adjustments for non-cash items: | |||||||||||
| Depreciation and amortization | 1,599 | 1,661 | |||||||||
| Provision (benefit) for deferred income taxes | (448) | (349) | |||||||||
| Loss on divestiture | 572 | — | |||||||||
| Other | 205 | 132 | |||||||||
| Changes in assets and liabilities, net of acquisitions and divestitures: | |||||||||||
| Receivables – trade and other | (319) | 365 | |||||||||
| Inventories | (1,424) | (3,088) | |||||||||
| Accounts payable | (532) | 786 | |||||||||
| Accrued expenses | 588 | 70 | |||||||||
| Accrued wages, salaries and employee benefits | — | 15 | |||||||||
| Customer advances | 516 | 751 | |||||||||
| Other assets – net | 128 | 57 | |||||||||
| Other liabilities – net | 338 | (623) | |||||||||
| Net cash provided by (used for) operating activities | 8,882 | 5,027 | |||||||||
| Cash flow from investing activities: | |||||||||||
| Capital expenditures – excluding equipment leased to others | (1,061) | (868) | |||||||||
| Expenditures for equipment leased to others | (1,177) | (1,023) | |||||||||
| Proceeds from disposals of leased assets and property, plant and equipment | 563 | 666 | |||||||||
| Additions to finance receivables | (11,082) | (9,914) | |||||||||
| Collections of finance receivables | 10,391 | 9,738 | |||||||||
| Proceeds from sale of finance receivables | 40 | 50 | |||||||||
| Investments and acquisitions (net of cash acquired) | (67) | (44) | |||||||||
| Proceeds from sale of businesses and investments (net of cash sold) | (14) | 1 | |||||||||
| Proceeds from sale of securities | 747 | 2,080 | |||||||||
| Investments in securities | (3,689) | (2,399) | |||||||||
| Other – net | 32 | 15 | |||||||||
| Net cash provided by (used for) investing activities | (5,317) | (1,698) | |||||||||
| Cash flow from financing activities: | |||||||||||
| Dividends paid | (1,901) | (1,820) | |||||||||
| Common stock issued, including treasury shares reissued | 36 | 2 | |||||||||
| Common shares repurchased | (2,209) | (3,309) | |||||||||
| Proceeds from debt issued (original maturities greater than three months) | 6,360 | 5,570 | |||||||||
| Payments on debt (original maturities greater than three months) | (4,459) | (5,289) | |||||||||
| Short-term borrowings – net (original maturities three months or less) | (1,726) | (1,311) | |||||||||
| Other – net | — | (1) | |||||||||
| Net cash provided by (used for) financing activities | (3,899) | (6,158) | |||||||||
| Effect of exchange rate changes on cash | (119) | (79) | |||||||||
| Increase (decrease) in cash, cash equivalents and restricted cash | (453) | (2,908) | |||||||||
| Cash, cash equivalents and restricted cash at beginning of period | 7,013 | 9,263 | |||||||||
| Cash, cash equivalents and restricted cash at end of period | $ | 6,560 | $ | 6,355 | |||||||
Cash equivalents primarily represent short-term, highly liquid investments with original maturities of generally three months or less. | ||
| Supplemental Consolidating Data | ||||||||||||||||||||||||||
| Consolidated | Machinery, Energy & Transportation | Financial Products |
Consolidating Adjustments |
|||||||||||||||||||||||
| Sales and revenues: | ||||||||||||||||||||||||||
| Sales of Machinery, Energy & Transportation | $ | 15,988 | $ | 15,988 | $ | — | $ | — | ||||||||||||||||||
| Revenues of Financial Products | 822 | — | 1,017 | (195) | 1 | |||||||||||||||||||||
| Total sales and revenues | 16,810 | 15,988 | 1,017 | (195) | ||||||||||||||||||||||
| Operating costs: | ||||||||||||||||||||||||||
| Cost of goods sold | 10,583 | 10,586 | — | (3) | 2 | |||||||||||||||||||||
| Selling, general and administrative expenses | 1,624 | 1,430 | 206 | (12) | 2 | |||||||||||||||||||||
| Research and development expenses | 554 | 554 | — | — | ||||||||||||||||||||||
| Interest expense of Financial Products | 280 | — | 280 | — | ||||||||||||||||||||||
| Other operating (income) expenses | 320 | 25 | 310 | (15) | 2 | |||||||||||||||||||||
| Total operating costs | 13,361 | 12,595 | 796 | (30) | ||||||||||||||||||||||
| Operating profit | 3,449 | 3,393 | 221 | (165) | ||||||||||||||||||||||
| Interest expense excluding Financial Products | 129 | 129 | — | — | ||||||||||||||||||||||
| Other income (expense) | 195 | 42 | (12) | 165 | 3 | |||||||||||||||||||||
| Consolidated profit before taxes | 3,515 | 3,306 | 209 | — | ||||||||||||||||||||||
| Provision (benefit) for income taxes | 734 | 654 | 80 | — | ||||||||||||||||||||||
| Profit of consolidated companies | 2,781 | 2,652 | 129 | — | ||||||||||||||||||||||
| Equity in profit (loss) of unconsolidated affiliated companies | 12 | 12 | — | — | ||||||||||||||||||||||
| Profit of consolidated and affiliated companies | 2,793 | 2,664 | 129 | — | ||||||||||||||||||||||
| Less: Profit (loss) attributable to noncontrolling interests | (1) | (1) | — | — | ||||||||||||||||||||||
Profit 4 |
$ | 2,794 | $ | 2,665 | $ | 129 | $ | — | ||||||||||||||||||
| 1 | Elimination of Financial Products’ revenues earned from ME&T. |
||||
| 2 | Elimination of net expenses recorded by ME&T paid to Financial Products. |
||||
| 3 | Elimination of discount recorded by ME&T on receivables sold to Financial Products and of interest earned between ME&T and Financial Products as well as dividends paid by Financial Products to ME&T. |
||||
| 4 | Profit attributable to common shareholders. | ||||
| Supplemental Consolidating Data | ||||||||||||||||||||||||||
| Consolidated | Machinery, Energy & Transportation | Financial Products |
Consolidating Adjustments |
|||||||||||||||||||||||
| Sales and revenues: | ||||||||||||||||||||||||||
| Sales of Machinery, Energy & Transportation | $ | 14,278 | $ | 14,278 | $ | — | $ | — | ||||||||||||||||||
| Revenues of Financial Products | 716 | — | 852 | (136) | 1 | |||||||||||||||||||||
| Total sales and revenues | 14,994 | 14,278 | 852 | (136) | ||||||||||||||||||||||
| Operating costs: | ||||||||||||||||||||||||||
| Cost of goods sold | 10,202 | 10,203 | — | (1) | 2 | |||||||||||||||||||||
| Selling, general and administrative expenses | 1,401 | 1,271 | 136 | (6) | 2 | |||||||||||||||||||||
| Research and development expenses | 476 | 476 | — | — | ||||||||||||||||||||||
| Interest expense of Financial Products | 151 | — | 151 | — | ||||||||||||||||||||||
| Other operating (income) expenses | 339 | 43 | 315 | (19) | 2 | |||||||||||||||||||||
| Total operating costs | 12,569 | 11,993 | 602 | (26) | ||||||||||||||||||||||
| Operating profit | 2,425 | 2,285 | 250 | (110) | ||||||||||||||||||||||
| Interest expense excluding Financial Products | 109 | 110 | — | (1) | 3 | |||||||||||||||||||||
| Other income (expense) | 242 | 160 | (27) | 109 | 4 | |||||||||||||||||||||
| Consolidated profit before taxes | 2,558 | 2,335 | 223 | — | ||||||||||||||||||||||
| Provision (benefit) for income taxes | 527 | 464 | 63 | — | ||||||||||||||||||||||
| Profit of consolidated companies | 2,031 | 1,871 | 160 | — | ||||||||||||||||||||||
| Equity in profit (loss) of unconsolidated affiliated companies | 9 | 11 | — | (2) | 5 | |||||||||||||||||||||
| Profit of consolidated and affiliated companies | 2,040 | 1,882 | 160 | (2) | ||||||||||||||||||||||
| Less: Profit (loss) attributable to noncontrolling interests | (1) | (1) | 2 | (2) | 6 | |||||||||||||||||||||
Profit 7 |
$ | 2,041 | $ | 1,883 | $ | 158 | $ | — | ||||||||||||||||||
| 1 | Elimination of Financial Products’ revenues earned from ME&T. |
||||
| 2 | Elimination of net expenses recorded by ME&T paid to Financial Products. |
||||
| 3 | Elimination of interest expense recorded between Financial Products and ME&T. |
||||
| 4 | Elimination of discount recorded by ME&T on receivables sold to Financial Products and of interest earned between ME&T and Financial Products as well as dividends paid by Financial Products to ME&T. |
||||
| 5 | Elimination of equity profit (loss) earned from Financial Products’ subsidiaries partially owned by ME&T subsidiaries. |
||||
| 6 | Elimination of noncontrolling interest profit (loss) recorded by Financial Products for subsidiaries partially owned by ME&T subsidiaries. |
||||
| 7 | Profit attributable to common shareholders. | ||||
| Supplemental Consolidating Data | ||||||||||||||||||||||||||
| Consolidated | Machinery, Energy & Transportation | Financial Products |
Consolidating Adjustments |
|||||||||||||||||||||||
| Sales and revenues: | ||||||||||||||||||||||||||
| Sales of Machinery, Energy & Transportation | $ | 47,632 | $ | 47,632 | $ | — | $ | — | ||||||||||||||||||
| Revenues of Financial Products | 2,358 | — | 2,907 | (549) | 1 | |||||||||||||||||||||
| Total sales and revenues | 49,990 | 47,632 | 2,907 | (549) | ||||||||||||||||||||||
| Operating costs: | ||||||||||||||||||||||||||
| Cost of goods sold | 31,751 | 31,758 | — | (7) | 2 | |||||||||||||||||||||
| Selling, general and administrative expenses | 4,615 | 4,139 | 507 | (31) | 2 | |||||||||||||||||||||
| Research and development expenses | 1,554 | 1,554 | — | — | ||||||||||||||||||||||
| Interest expense of Financial Products | 742 | — | 742 | — | ||||||||||||||||||||||
| Other operating (income) expenses | 1,496 | 624 | 923 | (51) | 2 | |||||||||||||||||||||
| Total operating costs | 40,158 | 38,075 | 2,172 | (89) | ||||||||||||||||||||||
| Operating profit | 9,832 | 9,557 | 735 | (460) | ||||||||||||||||||||||
| Interest expense excluding Financial Products | 385 | 385 | — | — | ||||||||||||||||||||||
| Other income (expense) | 354 | 18 | (49) | 385 | 3 | |||||||||||||||||||||
| Consolidated profit before taxes | 9,801 | 9,190 | 686 | (75) | ||||||||||||||||||||||
| Provision (benefit) for income taxes | 2,194 | 1,993 | 201 | — | ||||||||||||||||||||||
| Profit of consolidated companies | 7,607 | 7,197 | 485 | (75) | ||||||||||||||||||||||
| Equity in profit (loss) of unconsolidated affiliated companies | 52 | 55 | — | (3) | 4 | |||||||||||||||||||||
| Profit of consolidated and affiliated companies | 7,659 | 7,252 | 485 | (78) | ||||||||||||||||||||||
| Less: Profit (loss) attributable to noncontrolling interests | — | (2) | 5 | (3) | 5 | |||||||||||||||||||||
Profit 6 |
$ | 7,659 | $ | 7,254 | $ | 480 | $ | (75) | ||||||||||||||||||
| 1 | Elimination of Financial Products’ revenues earned from ME&T. |
||||
| 2 | Elimination of net expenses recorded by ME&T paid to Financial Products. |
||||
| 3 | Elimination of discount recorded by ME&T on receivables sold to Financial Products and of interest earned between ME&T and Financial Products as well as dividends paid by Financial Products to ME&T. |
||||
| 4 | Elimination of equity profit (loss) earned from Financial Products’ subsidiaries partially owned by ME&T subsidiaries. |
||||
| 5 | Elimination of noncontrolling interest profit (loss) recorded by Financial Products for subsidiaries partially owned by ME&T subsidiaries. |
||||
| 6 | Profit attributable to common shareholders. | ||||
| Supplemental Consolidating Data | ||||||||||||||||||||||||||
| Consolidated | Machinery, Energy & Transportation | Financial Products |
Consolidating Adjustments |
|||||||||||||||||||||||
| Sales and revenues: | ||||||||||||||||||||||||||
| Sales of Machinery, Energy & Transportation | $ | 40,703 | $ | 40,703 | $ | — | $ | — | ||||||||||||||||||
| Revenues of Financial Products | 2,127 | — | 2,493 | (366) | 1 | |||||||||||||||||||||
| Total sales and revenues | 42,830 | 40,703 | 2,493 | (366) | ||||||||||||||||||||||
| Operating costs: | ||||||||||||||||||||||||||
| Cost of goods sold | 29,736 | 29,741 | — | (5) | 2 | |||||||||||||||||||||
| Selling, general and administrative expenses | 4,172 | 3,714 | 475 | (17) | 2 | |||||||||||||||||||||
| Research and development expenses | 1,413 | 1,413 | — | — | ||||||||||||||||||||||
| Interest expense of Financial Products | 377 | — | 377 | — | ||||||||||||||||||||||
| Other operating (income) expenses | 908 | 31 | 936 | (59) | 2 | |||||||||||||||||||||
| Total operating costs | 36,606 | 34,899 | 1,788 | (81) | ||||||||||||||||||||||
| Operating profit | 6,224 | 5,804 | 705 | (285) | ||||||||||||||||||||||
| Interest expense excluding Financial Products | 326 | 327 | — | (1) | 3 | |||||||||||||||||||||
| Other income (expense) | 755 | 497 | (26) | 284 | 4 | |||||||||||||||||||||
| Consolidated profit before taxes | 6,653 | 5,974 | 679 | — | ||||||||||||||||||||||
| Provision (benefit) for income taxes | 1,423 | 1,250 | 173 | — | ||||||||||||||||||||||
| Profit of consolidated companies | 5,230 | 4,724 | 506 | — | ||||||||||||||||||||||
| Equity in profit (loss) of unconsolidated affiliated companies | 20 | 26 | — | (6) | 5 | |||||||||||||||||||||
| Profit of consolidated and affiliated companies | 5,250 | 4,750 | 506 | (6) | ||||||||||||||||||||||
| Less: Profit (loss) attributable to noncontrolling interests | (1) | (1) | 6 | (6) | 6 | |||||||||||||||||||||
Profit 7 |
$ | 5,251 | $ | 4,751 | $ | 500 | $ | — | ||||||||||||||||||
| 1 | Elimination of Financial Products’ revenues earned from ME&T. |
||||
| 2 | Elimination of net expenses recorded by ME&T paid to Financial Products. |
||||
| 3 | Elimination of interest expense recorded between Financial Products and ME&T. |
||||
| 4 | Elimination of discount recorded by ME&T on receivables sold to Financial Products and of interest earned between ME&T and Financial Products as well as dividends paid by Financial Products to ME&T. |
||||
| 5 | Elimination of equity profit (loss) earned from Financial Products’ subsidiaries partially owned by ME&T subsidiaries. |
||||
| 6 | Elimination of noncontrolling interest profit (loss) recorded by Financial Products for subsidiaries partially owned by ME&T subsidiaries. |
||||
| 7 | Profit attributable to common shareholders. | ||||
| Supplemental Consolidating Data | ||||||||||||||||||||||||||
| Consolidated | Machinery, Energy & Transportation |
Financial Products |
Consolidating Adjustments |
|||||||||||||||||||||||
| Assets | ||||||||||||||||||||||||||
| Current assets: | ||||||||||||||||||||||||||
| Cash and cash equivalents | $ | 6,545 | $ | 5,874 | $ | 671 | $ | — | ||||||||||||||||||
| Receivables – trade and other | 9,134 | 3,550 | 602 | 4,982 | 1,2 |
|||||||||||||||||||||
| Receivables – finance | 9,608 | — | 14,782 | (5,174) | 2 | |||||||||||||||||||||
| Prepaid expenses and other current assets | 5,138 | 4,957 | 332 | (151) | 3 | |||||||||||||||||||||
| Inventories | 17,580 | 17,580 | — | — | ||||||||||||||||||||||
| Total current assets | 48,005 | 31,961 | 16,387 | (343) | ||||||||||||||||||||||
| Property, plant and equipment – net | 12,287 | 8,243 | 4,044 | — | ||||||||||||||||||||||
| Long-term receivables – trade and other | 1,110 | 497 | 119 | 494 | 1,2 |
|||||||||||||||||||||
| Long-term receivables – finance | 11,907 | — | 12,441 | (534) | 2 | |||||||||||||||||||||
| Noncurrent deferred and refundable income taxes | 2,719 | 3,265 | 118 | (664) | 4 | |||||||||||||||||||||
| Intangible assets | 604 | 604 | — | — | ||||||||||||||||||||||
| Goodwill | 5,268 | 5,268 | — | — | ||||||||||||||||||||||
| Other assets | 4,891 | 3,936 | 1,998 | (1,043) | 5 | |||||||||||||||||||||
| Total assets | $ | 86,791 | $ | 53,774 | $ | 35,107 | $ | (2,090) | ||||||||||||||||||
| Liabilities | ||||||||||||||||||||||||||
| Current liabilities: | ||||||||||||||||||||||||||
| Short-term borrowings | $ | 4,218 | $ | — | $ | 4,218 | $ | — | ||||||||||||||||||
| Accounts payable | 7,827 | 7,734 | 297 | (204) | 6,7 | |||||||||||||||||||||
| Accrued expenses | 4,669 | 4,218 | 451 | — | ||||||||||||||||||||||
| Accrued wages, salaries and employee benefits | 2,300 | 2,252 | 48 | — | ||||||||||||||||||||||
| Customer advances | 2,333 | 2,320 | 1 | 12 | 7 | |||||||||||||||||||||
| Other current liabilities | 3,115 | 2,515 | 775 | (175) | 4,8 |
|||||||||||||||||||||
| Long-term debt due within one year | 8,662 | 1,043 | 7,619 | — | ||||||||||||||||||||||
| Total current liabilities | 33,124 | 20,082 | 13,409 | (367) | ||||||||||||||||||||||
| Long-term debt due after one year | 24,259 | 8,510 | 15,789 | (40) | 9 | |||||||||||||||||||||
| Liability for postemployment benefits | 4,060 | 4,060 | — | — | ||||||||||||||||||||||
| Other liabilities | 4,841 | 3,895 | 1,659 | (713) | 4 | |||||||||||||||||||||
| Total liabilities | 66,284 | 36,547 | 30,857 | (1,120) | ||||||||||||||||||||||
| Shareholders’ equity | ||||||||||||||||||||||||||
| Common stock | 6,698 | 6,698 | 905 | (905) | 10 | |||||||||||||||||||||
| Treasury stock | (33,865) | (33,865) | — | — | ||||||||||||||||||||||
| Profit employed in the business | 49,888 | 45,352 | 4,526 | 10 | 10 | |||||||||||||||||||||
| Accumulated other comprehensive income (loss) | (2,232) | (978) | (1,254) | — | ||||||||||||||||||||||
| Noncontrolling interests | 18 | 20 | 73 | (75) | 10 | |||||||||||||||||||||
| Total shareholders’ equity | 20,507 | 17,227 | 4,250 | (970) | ||||||||||||||||||||||
| Total liabilities and shareholders’ equity | $ | 86,791 | $ | 53,774 | $ | 35,107 | $ | (2,090) | ||||||||||||||||||
| 1 | Elimination of receivables between ME&T and Financial Products. |
||||
| 2 | Reclassification of ME&T’s trade receivables purchased by Financial Products and Financial Products’ wholesale inventory receivables. |
||||
| 3 | Elimination of ME&T's insurance premiums that are prepaid to Financial Products. | ||||
| 4 | Reclassification reflecting required netting of deferred tax assets/liabilities by taxing jurisdiction. |
||||
| 5 | Elimination of other intercompany assets between ME&T and Financial Products. |
||||
| 6 | Elimination of payables between ME&T and Financial Products. |
||||
| 7 | Reclassification of Financial Products' payables to accrued expenses or customer advances. | ||||
| 8 | Elimination of prepaid insurance in Financial Products’ other liabilities. | ||||
| 9 | Elimination of debt between ME&T and Financial Products. |
||||
| 10 | Eliminations associated with ME&T’s investments in Financial Products’ subsidiaries. |
||||
| Supplemental Consolidating Data | ||||||||||||||||||||||||||
| Consolidated | Machinery, Energy & Transportation |
Financial Products |
Consolidating Adjustments |
|||||||||||||||||||||||
| Assets | ||||||||||||||||||||||||||
| Current assets: | ||||||||||||||||||||||||||
| Cash and cash equivalents | $ | 7,004 | $ | 6,042 | $ | 962 | $ | — | ||||||||||||||||||
| Receivables – trade and other | 8,856 | 3,710 | 519 | 4,627 | 1,2 |
|||||||||||||||||||||
| Receivables – finance | 9,013 | — | 13,902 | (4,889) | 2 | |||||||||||||||||||||
| Prepaid expenses and other current assets | 2,642 | 2,488 | 290 | (136) | 3 | |||||||||||||||||||||
| Inventories | 16,270 | 16,270 | — | — | ||||||||||||||||||||||
| Total current assets | 43,785 | 28,510 | 15,673 | (398) | ||||||||||||||||||||||
| Property, plant and equipment – net | 12,028 | 8,186 | 3,842 | — | ||||||||||||||||||||||
| Long-term receivables – trade and other | 1,265 | 418 | 339 | 508 | 1,2 |
|||||||||||||||||||||
| Long-term receivables – finance | 12,013 | — | 12,552 | (539) | 2 | |||||||||||||||||||||
| Noncurrent deferred and refundable income taxes | 2,213 | 2,755 | 115 | (657) | 4 | |||||||||||||||||||||
| Intangible assets | 758 | 758 | — | — | ||||||||||||||||||||||
| Goodwill | 5,288 | 5,288 | — | — | ||||||||||||||||||||||
| Other assets | 4,593 | 3,882 | 1,892 | (1,181) | 5 | |||||||||||||||||||||
| Total assets | $ | 81,943 | $ | 49,797 | $ | 34,413 | $ | (2,267) | ||||||||||||||||||
| Liabilities | ||||||||||||||||||||||||||
| Current liabilities: | ||||||||||||||||||||||||||
| Short-term borrowings | $ | 5,957 | $ | 3 | $ | 5,954 | $ | — | ||||||||||||||||||
| Accounts payable | 8,689 | 8,657 | 294 | (262) | 6 | |||||||||||||||||||||
| Accrued expenses | 4,080 | 3,687 | 393 | — | ||||||||||||||||||||||
| Accrued wages, salaries and employee benefits | 2,313 | 2,264 | 49 | — | ||||||||||||||||||||||
| Customer advances | 1,860 | 1,860 | — | — | ||||||||||||||||||||||
| Dividends payable | 620 | 620 | — | — | ||||||||||||||||||||||
| Other current liabilities | 2,690 | 2,215 | 635 | (160) | 4,7 |
|||||||||||||||||||||
| Long-term debt due within one year | 5,322 | 120 | 5,202 | — | ||||||||||||||||||||||
| Total current liabilities | 31,531 | 19,426 | 12,527 | (422) | ||||||||||||||||||||||
| Long-term debt due after one year | 25,714 | 9,529 | 16,216 | (31) | 8 | |||||||||||||||||||||
| Liability for postemployment benefits | 4,203 | 4,203 | — | — | ||||||||||||||||||||||
| Other liabilities | 4,604 | 3,677 | 1,638 | (711) | 4 | |||||||||||||||||||||
| Total liabilities | 66,052 | 36,835 | 30,381 | (1,164) | ||||||||||||||||||||||
| Shareholders’ equity | ||||||||||||||||||||||||||
| Common stock | 6,560 | 6,560 | 905 | (905) | 9 | |||||||||||||||||||||
| Treasury stock | (31,748) | (31,748) | — | — | ||||||||||||||||||||||
| Profit employed in the business | 43,514 | 39,435 | 4,068 | 11 | 9 | |||||||||||||||||||||
| Accumulated other comprehensive income (loss) | (2,457) | (1,310) | (1,147) | — | ||||||||||||||||||||||
| Noncontrolling interests | 22 | 25 | 206 | (209) | 9 | |||||||||||||||||||||
| Total shareholders’ equity | 15,891 | 12,962 | 4,032 | (1,103) | ||||||||||||||||||||||
| Total liabilities and shareholders’ equity | $ | 81,943 | $ | 49,797 | $ | 34,413 | $ | (2,267) | ||||||||||||||||||
| 1 | Elimination of receivables between ME&T and Financial Products. |
||||
| 2 | Reclassification of ME&T’s trade receivables purchased by Financial Products and Financial Products’ wholesale inventory receivables. |
||||
| 3 | Elimination of ME&T’s insurance premiums that are prepaid to Financial Products. | ||||
| 4 | Reclassification reflecting required netting of deferred tax assets/liabilities by taxing jurisdiction. |
||||
| 5 | Elimination of other intercompany assets between ME&T and Financial Products. |
||||
| 6 | Elimination of payables between ME&T and Financial Products. | ||||
| 7 | Elimination of prepaid insurance in Financial Products’ other liabilities. |
||||
| 8 | Elimination of debt between ME&T and Financial Products. | ||||
| 9 | Eliminations associated with ME&T’s investments in Financial Products’ subsidiaries. |
||||
| Supplemental Consolidating Data | ||||||||||||||||||||||||||
| Consolidated | Machinery, Energy & Transportation | Financial Products |
Consolidating Adjustments |
|||||||||||||||||||||||
| Cash flow from operating activities: | ||||||||||||||||||||||||||
| Profit of consolidated and affiliated companies | $ | 7,659 | $ | 7,252 | $ | 485 | $ | (78) | 1,5 | |||||||||||||||||
| Adjustments for non-cash items: | ||||||||||||||||||||||||||
| Depreciation and amortization | 1,599 | 1,015 | 584 | — | ||||||||||||||||||||||
| Provision (benefit) for deferred income taxes | (448) | (456) | 8 | — | ||||||||||||||||||||||
| Loss on divestiture | 572 | 572 | — | — | ||||||||||||||||||||||
| Other | 205 | 309 | (463) | 359 | 2 | |||||||||||||||||||||
| Changes in assets and liabilities, net of acquisitions and divestitures: | ||||||||||||||||||||||||||
| Receivables – trade and other | (319) | (46) | 70 | (343) | 2,3 |
|||||||||||||||||||||
| Inventories | (1,424) | (1,420) | — | (4) | 2 | |||||||||||||||||||||
| Accounts payable | (532) | (628) | 26 | 70 | 2 | |||||||||||||||||||||
| Accrued expenses | 588 | 557 | 31 | — | ||||||||||||||||||||||
| Accrued wages, salaries and employee benefits | — | 1 | (1) | — | ||||||||||||||||||||||
| Customer advances | 516 | 515 | 1 | — | ||||||||||||||||||||||
| Other assets – net | 128 | 107 | 17 | 4 | 2 | |||||||||||||||||||||
| Other liabilities – net | 338 | 177 | 147 | 14 | 2 | |||||||||||||||||||||
| Net cash provided by (used for) operating activities | 8,882 | 7,955 | 905 | 22 | ||||||||||||||||||||||
| Cash flow from investing activities: | ||||||||||||||||||||||||||
| Capital expenditures – excluding equipment leased to others | (1,061) | (1,088) | (16) | 43 | 2 | |||||||||||||||||||||
| Expenditures for equipment leased to others | (1,177) | (20) | (1,165) | 8 | 2 | |||||||||||||||||||||
| Proceeds from disposals of leased assets and property, plant and equipment | 563 | 46 | 564 | (47) | 2 | |||||||||||||||||||||
| Additions to finance receivables | (11,082) | — | (12,493) | 1,411 | 3 | |||||||||||||||||||||
| Collections of finance receivables | 10,391 | — | 11,554 | (1,163) | 3 | |||||||||||||||||||||
| Net intercompany purchased receivables | — | — | 429 | (429) | 3 | |||||||||||||||||||||
| Proceeds from sale of finance receivables | 40 | — | 40 | — | ||||||||||||||||||||||
| Net intercompany borrowings | — | — | 7 | (7) | 4 | |||||||||||||||||||||
| Investments and acquisitions (net of cash acquired) | (67) | (67) | — | — | ||||||||||||||||||||||
| Proceeds from sale of businesses and investments (net of cash sold) | (14) | (14) | — | — | ||||||||||||||||||||||
| Proceeds from sale of securities | 747 | 553 | 194 | — | ||||||||||||||||||||||
| Investments in securities | (3,689) | (3,340) | (349) | — | ||||||||||||||||||||||
| Other – net | 32 | 43 | (11) | — | ||||||||||||||||||||||
| Net cash provided by (used for) investing activities | (5,317) | (3,887) | (1,246) | (184) | ||||||||||||||||||||||
| Cash flow from financing activities: | ||||||||||||||||||||||||||
| Dividends paid | (1,901) | (1,901) | (155) | 155 | 5 | |||||||||||||||||||||
| Common stock issued, including treasury shares reissued | 36 | 36 | — | — | ||||||||||||||||||||||
| Common shares repurchased | (2,209) | (2,209) | — | — | ||||||||||||||||||||||
| Net intercompany borrowings | — | (7) | — | 7 | 4 | |||||||||||||||||||||
| Proceeds from debt issued > 90 days | 6,360 | — | 6,360 | — | ||||||||||||||||||||||
| Payments on debt > 90 days | (4,459) | (99) | (4,360) | — | ||||||||||||||||||||||
| Short-term borrowings – net < 90 days | (1,726) | (3) | (1,723) | — | ||||||||||||||||||||||
| Net cash provided by (used for) financing activities | (3,899) | (4,183) | 122 | 162 | ||||||||||||||||||||||
| Effect of exchange rate changes on cash | (119) | (55) | (64) | — | ||||||||||||||||||||||
| Increase (decrease) in cash, cash equivalents and restricted cash | (453) | (170) | (283) | — | ||||||||||||||||||||||
| Cash, cash equivalents and restricted cash at beginning of period | 7,013 | 6,049 | 964 | — | ||||||||||||||||||||||
| Cash, cash equivalents and restricted cash at end of period | $ | 6,560 | $ | 5,879 | $ | 681 | $ | — | ||||||||||||||||||
| 1 | Elimination of equity profit earned from Financial Products' subsidiaries partially owned by ME&T subsidiaries. | ||||
| 2 | Elimination of non-cash adjustments and changes in assets and liabilities related to consolidated reporting. | ||||
| 3 | Reclassification of Financial Products’ cash flow activity from investing to operating for receivables that arose from the sale of inventory. | ||||
| 4 | Elimination of net proceeds and payments to/from ME&T and Financial Products. | ||||
| 5 | Elimination of dividend activity between Financial Products and ME&T. | ||||
| Supplemental Consolidating Data | ||||||||||||||||||||||||||
| Consolidated | Machinery, Energy & Transportation | Financial Products |
Consolidating Adjustments |
|||||||||||||||||||||||
| Cash flow from operating activities: | ||||||||||||||||||||||||||
| Profit of consolidated and affiliated companies | $ | 5,250 | $ | 4,750 | $ | 506 | $ | (6) | 1 | |||||||||||||||||
| Adjustments for non-cash items: | ||||||||||||||||||||||||||
| Depreciation and amortization | 1,661 | 1,072 | 589 | — | ||||||||||||||||||||||
| Provision (benefit) for deferred income taxes | (349) | (294) | (55) | — | ||||||||||||||||||||||
| Other | 132 | (83) | (123) | 338 | 2 | |||||||||||||||||||||
| Changes in assets and liabilities, net of acquisitions and divestitures: | ||||||||||||||||||||||||||
| Receivables – trade and other | 365 | 97 | 21 | 247 | 2,3 |
|||||||||||||||||||||
| Inventories | (3,088) | (3,074) | — | (14) | 2 | |||||||||||||||||||||
| Accounts payable | 786 | 701 | 74 | 11 | 2 | |||||||||||||||||||||
| Accrued expenses | 70 | 28 | 42 | — | ||||||||||||||||||||||
| Accrued wages, salaries and employee benefits | 15 | 27 | (12) | — | ||||||||||||||||||||||
| Customer advances | 751 | 752 | (1) | — | ||||||||||||||||||||||
| Other assets – net | 57 | 128 | (28) | (43) | 2 | |||||||||||||||||||||
| Other liabilities – net | (623) | (913) | 239 | 51 | 2 | |||||||||||||||||||||
| Net cash provided by (used for) operating activities | 5,027 | 3,191 | 1,252 | 584 | ||||||||||||||||||||||
| Cash flow from investing activities: | ||||||||||||||||||||||||||
| Capital expenditures – excluding equipment leased to others | (868) | (860) | (10) | 2 | 2 | |||||||||||||||||||||
| Expenditures for equipment leased to others | (1,023) | (20) | (1,024) | 21 | 2 | |||||||||||||||||||||
| Proceeds from disposals of leased assets and property, plant and equipment | 666 | 63 | 612 | (9) | 2 | |||||||||||||||||||||
| Additions to finance receivables | (9,914) | — | (10,584) | 670 | 3 | |||||||||||||||||||||
| Collections of finance receivables | 9,738 | — | 10,328 | (590) | 3 | |||||||||||||||||||||
| Net intercompany purchased receivables | — | — | 678 | (678) | 3 | |||||||||||||||||||||
| Proceeds from sale of finance receivables | 50 | — | 50 | — | ||||||||||||||||||||||
| Net intercompany borrowings | — | — | 5 | (5) | 4 | |||||||||||||||||||||
| Investments and acquisitions (net of cash acquired) | (44) | (44) | — | — | ||||||||||||||||||||||
| Proceeds from sale of businesses and investments (net of cash sold) | 1 | 1 | — | — | ||||||||||||||||||||||
| Proceeds from sale of securities | 2,080 | 1,820 | 260 | — | ||||||||||||||||||||||
| Investments in securities | (2,399) | (1,925) | (474) | — | ||||||||||||||||||||||
| Other – net | 15 | 84 | (69) | — | ||||||||||||||||||||||
| Net cash provided by (used for) investing activities | (1,698) | (881) | (228) | (589) | ||||||||||||||||||||||
| Cash flow from financing activities: | ||||||||||||||||||||||||||
| Dividends paid | (1,820) | (1,820) | — | — | ||||||||||||||||||||||
| Common stock issued, including treasury shares reissued | 2 | 2 | — | — | ||||||||||||||||||||||
| Common shares repurchased | (3,309) | (3,309) | — | — | ||||||||||||||||||||||
| Net intercompany borrowings | — | (5) | — | 5 | 4 | |||||||||||||||||||||
| Proceeds from debt issued > 90 days | 5,570 | — | 5,570 | — | ||||||||||||||||||||||
| Payments on debt > 90 days | (5,289) | (20) | (5,269) | — | ||||||||||||||||||||||
| Short-term borrowings – net < 90 days | (1,311) | (138) | (1,173) | — | ||||||||||||||||||||||
| Other – net | (1) | (1) | — | — | ||||||||||||||||||||||
| Net cash provided by (used for) financing activities | (6,158) | (5,291) | (872) | 5 | ||||||||||||||||||||||
| Effect of exchange rate changes on cash | (79) | (42) | (37) | — | ||||||||||||||||||||||
| Increase (decrease) in cash, cash equivalents and restricted cash | (2,908) | (3,023) | 115 | — | ||||||||||||||||||||||
| Cash, cash equivalents and restricted cash at beginning of period | 9,263 | 8,433 | 830 | — | ||||||||||||||||||||||
| Cash, cash equivalents and restricted cash at end of period | $ | 6,355 | $ | 5,410 | $ | 945 | $ | — | ||||||||||||||||||
| 1 | Elimination of equity profit earned from Financial Products' subsidiaries partially owned by ME&T subsidiaries. | ||||
| 2 | Elimination of non-cash adjustments and changes in assets and liabilities related to consolidated reporting. | ||||
| 3 | Reclassification of Financial Products’ cash flow activity from investing to operating for receivables that arose from the sale of inventory. | ||||
| 4 | Elimination of net proceeds and payments to/from ME&T and Financial Products. | ||||
| Caterpillar Inc. Quarterly Retail Sales Statistics | ||||||||||||||
| Machines and E&T Combined | 3rd Quarter 2023 | 2nd Quarter 2023 | 1st Quarter 2023 | 4th Quarter 2022 | ||||||||||
| World | UP 13% | UP 16% | UP 13% | UP 8% | ||||||||||
| Machines | 3rd Quarter 2023 | 2nd Quarter 2023 | 1st Quarter 2023 | 4th Quarter 2022 | ||||||||||
| Asia/Pacific | DOWN 14% | UP 2% | DOWN 14% | UNCHANGED | ||||||||||
| EAME | DOWN 1% | DOWN 10% | UP 13% | DOWN 6% | ||||||||||
| Latin America | DOWN 5% | UNCHANGED | DOWN 6% | UP 5% | ||||||||||
| North America | UP 25% | UP 21% | UP 15% | UP 13% | ||||||||||
| World | UP 7% | UP 8% | UP 5% | UP 4% | ||||||||||
| Resource Industries (RI) | 3rd Quarter 2023 | 2nd Quarter 2023 | 1st Quarter 2023 | 4th Quarter 2022 | ||||||||||
| Asia/Pacific | DOWN 10% | UP 31% | DOWN 12% | UP 1% | ||||||||||
| EAME | DOWN 6% | DOWN 10% | UP 27% | DOWN 18% | ||||||||||
| Latin America | UP 3% | UP 28% | DOWN 12% | UP 13% | ||||||||||
| North America | UP 49% | UP 47% | UP 56% | UP 61% | ||||||||||
| World | UP 10% | UP 26% | UP 18% | UP 13% | ||||||||||
| Construction Industries (CI) | 3rd Quarter 2023 | 2nd Quarter 2023 | 1st Quarter 2023 | 4th Quarter 2022 | ||||||||||
| Asia/Pacific | DOWN 17% | DOWN 14% | DOWN 15% | DOWN 1% | ||||||||||
| EAME | UP 1% | DOWN 9% | UP 7% | DOWN 2% | ||||||||||
| Latin America | DOWN 9% | DOWN 8% | DOWN 4% | UP 2% | ||||||||||
| North America | UP 20% | UP 16% | UP 5% | UP 4% | ||||||||||
| World | UP 6% | UP 3% | UNCHANGED | UP 1% | ||||||||||
| Reported in dollars and based on unit sales as reported primarily by dealers. | ||||||||||||||
Energy & Transportation (E&T) Retail Sales by industry for the quarter ended as indicated compared with the same period of the prior year: | ||||||||||||||
| Energy & Transportation (E&T) | 3rd Quarter 2023 | 2nd Quarter 2023 | 1st Quarter 2023 | 4th Quarter 2022 | ||||||||||
| Power Gen | UP 44% | UP 30% | UP 43% | UP 14% | ||||||||||
| Industrial | UP 6% | UP 39% | UP 42% | UP 27% | ||||||||||
| Transportation | UP 3% | UP 48% | DOWN 8% | DOWN 36% | ||||||||||
| Oil & Gas | UP 45% | UP 71% | UP 43% | UP 38% | ||||||||||
| Total | UP 34% | UP 47% | UP 39% | UP 19% | ||||||||||
| Reported in dollars based on reporting from dealers and direct sales. | ||||||||||||||
| · Asphalt Pavers | · Motor Graders | · Track-Type Tractors (small, medium) | ||||||
· Backhoe Loaders |
· Pipelayers | · Track Excavators (mini, small, | ||||||
· Cold Planers |
· Road Reclaimers | medium, large) | ||||||
· Compactors |
· Skid Steer Loaders | · Wheel Excavators |
||||||
· Compact Track Loaders |
· Telehandlers | · Wheel Loaders (compact, small, | ||||||
| · Forestry Machines | · Track-Type Loaders | medium) | ||||||
| · Material Handlers | ||||||||
| · Large Track-Type tractors | · Hydraulic Shovels | · Wheel Tractor Scrapers | ||||||
| · Large Mining Trucks | · Rotary Drills | · Wheel Dozers | ||||||
| · Hard Rock Vehicles | · Large Wheel Loaders | · Landfill Compactors | ||||||
| · Electric Rope Shovels | · Off-Highway Trucks | · Soil Compactors | ||||||
| · Draglines | · Articulated Trucks | |||||||