| UNITED STATES SECURITIES AND EXCHANGE COMMISSION Washington, D.C. 20549 | |||||||||||||||||||||||||||||||||||
 | |||||||||||||||||||||||||||||||||||
| FORM | 8-K | ||||||||||||||||||||||||||||||||||
| Current Report | |||||||||||||||||||||||||||||||||||
|
Pursuant to Section 13 or 15(d) of the Securities Exchange Act of 1934
| |||||||||||||||||||||||||||||||||||
| Date of Report (Date of earliest event reported): | April 27, 2023 | ||||||||||||||||||||||||||||||||||
| CATERPILLAR INC. | |||||||||||||||||||||||||||||||||||
| (Exact name of registrant as specified in its charter) | |||||||||||||||||||||||||||||||||||
| Delaware | 1-768 | 37-0602744 | |||||||||||||||||||||||||||||||||
| (State or other jurisdiction of incorporation) | (Commission File Number) |
(I.R.S Employer Identification No.) |
|||||||||||||||||||||||||||||||||
| 5205 N. O'Connor Blvd., | Suite 100, | Irving, | Texas | 75039 | ||||||||||||||||||||||||||||
| (Address of principal executive offices) | (Zip Code) | |||||||||||||||||||||||||||||||
| Registrant’s telephone number, including area code: | (972) | 891-7700 | ||||||||||||||||||||||||||||||
| Former name or former address, if changed since last report: | N/A | |||||||||||||||||||||||||||||||
| ☐ | Written communications pursuant to Rule 425 under the Securities Act (17 CFR 230.425) | ||||||||||||||||||||||||||||||||||
| ☐ | Soliciting material pursuant to Rule 14a-12 under the Exchange Act (17 CFR 240.14a-12) | ||||||||||||||||||||||||||||||||||
| ☐ | Pre-commencement communications pursuant to Rule 14d-2(b) under the Exchange Act (17 CFR 240.14d-2(b)) | ||||||||||||||||||||||||||||||||||
| ☐ | Pre-commencement communications pursuant to Rule 13e-4(c) under the Exchange Act (17 CFR 240.13e-4(c)) | ||||||||||||||||||||||||||||||||||
|
Securities registered pursuant to Section 12(b) of the Act:
| |||||||||||||||||||||||||||||||||||
| Title of each class | Trading Symbol (s) | Name of each exchange which registered | |||||||||||||||||||||||||||||||||
| Common Stock ($1.00 par value) | CAT | The New York Stock Exchange | |||||||||||||||||||||||||||||||||
| 5.3% Debentures due September 15, 2035 | CAT35 | The New York Stock Exchange | |||||||||||||||||||||||||||||||||
| Check the appropriate box below if the Form 8-K filing is intended to simultaneously satisfy the filing obligation of the registrant under any of the following provisions: | |||||||||||||||||||||||||||||||||||
| Indicate by check mark whether the registrant is an emerging growth company as defined by Rule 405 of the Securities Act of | |||||||||||||||||||||||||||||||||||
| 1933 (17 CFR §230.405 of this chapter) or Rule 12b-2 of the Securities Exchange Act of 1934 (17 CFR §240.12b-2 of this chapter). | |||||||||||||||||||||||||||||||||||
| Emerging growth company | ☐ | ||||||||||||||||||||||||||||||||||
| If an emerging growth company, indicate by check mark if the registrant has elected not to use the extended transition period | |||||||||||||||||||||||||||||||||||
| for complying with any new or revised financial accounting standards provided pursuant to Section 13(a) of the Exchange Act. | ☐ | ||||||||||||||||||||||||||||||||||
| (d) | Exhibits: | ||||||||||
| The following is furnished as an exhibit to this report: | |||||||||||
| 99.1 | |||||||||||
| 99.2 | |||||||||||
| 104 | The cover page from this Current Report on Form 8-K, formatted in Inline XBRL. | ||||||||||
|
SIGNATURES
| ||||||||
| Pursuant to the requirements of the Securities Exchange Act of 1934, the registrant has duly caused this report to be signed on its behalf by the undersigned hereunto duly authorized. | ||||||||
| CATERPILLAR INC. | ||||||||
April 27, 2023 |
By: | /s/ Suzette M. Long | ||||||
| Suzette M. Long Chief Legal Officer and General Counsel |
||||||||
| First Quarter | |||||||||||
| ($ in billions except profit per share) | 2023 | 2022 | |||||||||
| Sales and Revenues | $15.9 | $13.6 | |||||||||
| Profit Per Share | $3.74 | $2.86 | |||||||||
| Adjusted Profit Per Share | $4.91 | $2.88 | |||||||||
| ● | First-quarter 2023 sales and revenues increased 17% to $15.9 billion | ||||
| ● | First-quarter 2023 profit per share of $3.74; adjusted profit per share of $4.91 | ||||
| ● | Returned $1.0 billion to shareholders through dividends and share repurchases in the quarter |
||||
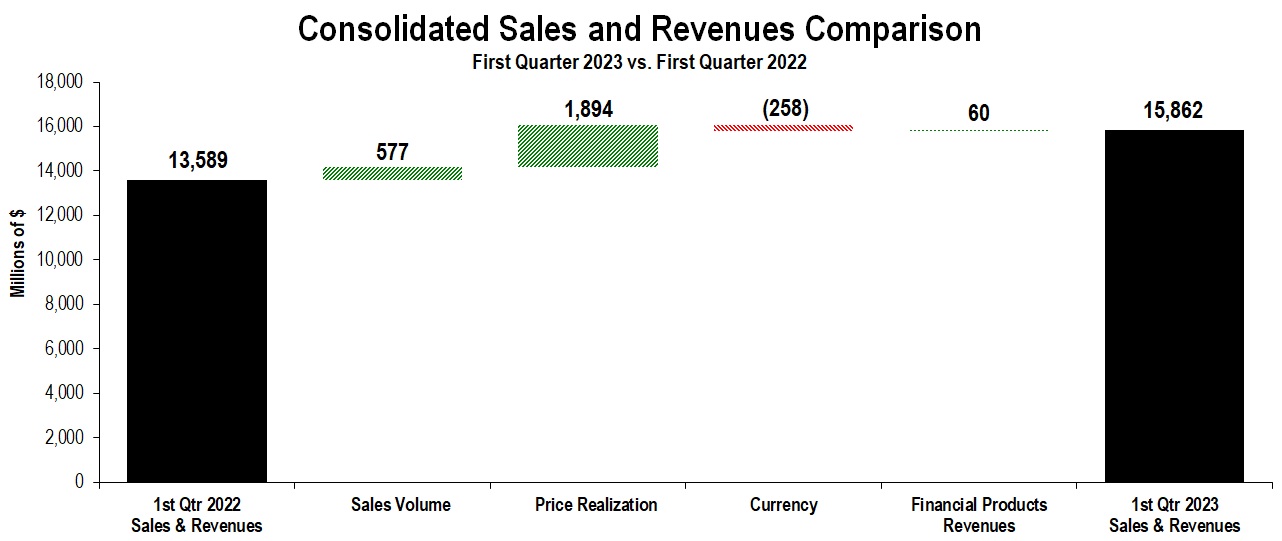
| Sales and Revenues by Segment | |||||||||||||||||||||||||||||||||||||||||||||||
| (Millions of dollars) | First Quarter 2022 | Sales Volume |
Price Realization |
Currency | Inter-Segment / Other | First Quarter 2023 | $ Change |
% Change |
|||||||||||||||||||||||||||||||||||||||
| Construction Industries | $ | 6,115 | $ | (173) | $ | 942 | $ | (151) | $ | 13 | $ | 6,746 | $ | 631 | 10% | ||||||||||||||||||||||||||||||||
| Resource Industries | 2,830 | 157 | 472 | (29) | (3) | 3,427 | 597 | 21% | |||||||||||||||||||||||||||||||||||||||
| Energy & Transportation | 5,038 | 621 | 480 | (78) | 193 | 6,254 | 1,216 | 24% | |||||||||||||||||||||||||||||||||||||||
| All Other Segment | 118 | (2) | — | (1) | (4) | 111 | (7) | (6%) | |||||||||||||||||||||||||||||||||||||||
| Corporate Items and Eliminations | (1,215) | (26) | — | 1 | (199) | (1,439) | (224) | ||||||||||||||||||||||||||||||||||||||||
| Machinery, Energy & Transportation | 12,886 | 577 | 1,894 | (258) | — | 15,099 | 2,213 | 17% | |||||||||||||||||||||||||||||||||||||||
| Financial Products Segment | 783 | — | — | — | 119 | 902 | 119 | 15% | |||||||||||||||||||||||||||||||||||||||
| Corporate Items and Eliminations | (80) | — | — | — | (59) | (139) | (59) | ||||||||||||||||||||||||||||||||||||||||
| Financial Products Revenues | 703 | — | — | — | 60 | 763 | 60 | 9% | |||||||||||||||||||||||||||||||||||||||
| Consolidated Sales and Revenues | $ | 13,589 | $ | 577 | $ | 1,894 | $ | (258) | $ | 60 | $ | 15,862 | $ | 2,273 | 17% | ||||||||||||||||||||||||||||||||
| Sales and Revenues by Geographic Region | |||||||||||||||||||||||||||||||||||||||||||||||||||||||||||||||||||||||||||||||||||
| North America | Latin America | EAME | Asia/Pacific | External Sales and Revenues | Inter-Segment | Total Sales and Revenues | |||||||||||||||||||||||||||||||||||||||||||||||||||||||||||||||||||||||||||||
| (Millions of dollars) | $ | % Chg | $ | % Chg | $ | % Chg | $ | % Chg | $ | % Chg | $ | % Chg | $ | % Chg | |||||||||||||||||||||||||||||||||||||||||||||||||||||||||||||||||||||
| First Quarter 2023 | |||||||||||||||||||||||||||||||||||||||||||||||||||||||||||||||||||||||||||||||||||
| Construction Industries | $ | 3,608 | 33% | $ | 599 | (4%) | $ | 1,336 | 5% | $ | 1,161 | (21%) | $ | 6,704 | 10% | $ | 42 | 45% | $ | 6,746 | 10% | ||||||||||||||||||||||||||||||||||||||||||||||||||||||||||||||
| Resource Industries | 1,308 | 28% | 474 | 19% | 599 | 1% | 978 | 31% | 3,359 | 22% | 68 | (4%) | 3,427 | 21% | |||||||||||||||||||||||||||||||||||||||||||||||||||||||||||||||||||||
| Energy & Transportation | 2,572 | 33% | 380 | 23% | 1,384 | 17% | 719 | 20% | 5,055 | 25% | 1,199 | 19% | 6,254 | 24% | |||||||||||||||||||||||||||||||||||||||||||||||||||||||||||||||||||||
| All Other Segment | 18 | —% | — | —% | 4 | (20%) | 13 | (19%) | 35 | (10%) | 76 | (4%) | 111 | (6%) | |||||||||||||||||||||||||||||||||||||||||||||||||||||||||||||||||||||
| Corporate Items and Eliminations | (48) | — | (1) | (5) | (54) | (1,385) | (1,439) | ||||||||||||||||||||||||||||||||||||||||||||||||||||||||||||||||||||||||||||
| Machinery, Energy & Transportation | 7,458 | 32% | 1,453 | 9% | 3,322 | 9% | 2,866 | 2% | 15,099 | 17% | — | —% | 15,099 | 17% | |||||||||||||||||||||||||||||||||||||||||||||||||||||||||||||||||||||
| Financial Products Segment | 575 | 14% | 104 | 42% | 114 | 19% | 109 | (2%) | 902 | 15% | — | —% | 902 | 15% | |||||||||||||||||||||||||||||||||||||||||||||||||||||||||||||||||||||
| Corporate Items and Eliminations | (83) | (18) | (18) | (20) | (139) | — | (139) | ||||||||||||||||||||||||||||||||||||||||||||||||||||||||||||||||||||||||||||
| Financial Products Revenues | 492 | 5% | 86 | 54% | 96 | 10% | 89 | (4%) | 763 | 9% | — | —% | 763 | 9% | |||||||||||||||||||||||||||||||||||||||||||||||||||||||||||||||||||||
| Consolidated Sales and Revenues | $ | 7,950 | 30% | $ | 1,539 | 10% | $ | 3,418 | 9% | $ | 2,955 | 1% | $ | 15,862 | 17% | $ | — | —% | $ | 15,862 | 17% | ||||||||||||||||||||||||||||||||||||||||||||||||||||||||||||||
| First Quarter 2022 | |||||||||||||||||||||||||||||||||||||||||||||||||||||||||||||||||||||||||||||||||||
| Construction Industries | $ | 2,720 | $ | 627 | $ | 1,277 | $ | 1,462 | $ | 6,086 | $ | 29 | $ | 6,115 | |||||||||||||||||||||||||||||||||||||||||||||||||||||||||||||||||||||
| Resource Industries | 1,018 | 399 | 594 | 748 | 2,759 | 71 | 2,830 | ||||||||||||||||||||||||||||||||||||||||||||||||||||||||||||||||||||||||||||
| Energy & Transportation | 1,938 | 310 | 1,184 | 600 | 4,032 | 1,006 | 5,038 | ||||||||||||||||||||||||||||||||||||||||||||||||||||||||||||||||||||||||||||
| All Other Segment | 18 | — | 5 | 16 | 39 | 79 | 118 | ||||||||||||||||||||||||||||||||||||||||||||||||||||||||||||||||||||||||||||
| Corporate Items and Eliminations | (24) | 1 | (2) | (5) | (30) | (1,185) | (1,215) | ||||||||||||||||||||||||||||||||||||||||||||||||||||||||||||||||||||||||||||
| Machinery, Energy & Transportation | 5,670 | 1,337 | 3,058 | 2,821 | 12,886 | — | 12,886 | ||||||||||||||||||||||||||||||||||||||||||||||||||||||||||||||||||||||||||||
| Financial Products Segment | 503 | 73 | 96 | 111 | 783 | — | 783 | ||||||||||||||||||||||||||||||||||||||||||||||||||||||||||||||||||||||||||||
| Corporate Items and Eliminations | (36) | (17) | (9) | (18) | (80) | — | (80) | ||||||||||||||||||||||||||||||||||||||||||||||||||||||||||||||||||||||||||||
| Financial Products Revenues | 467 | 56 | 87 | 93 | 703 | — | 703 | ||||||||||||||||||||||||||||||||||||||||||||||||||||||||||||||||||||||||||||
| Consolidated Sales and Revenues | $ | 6,137 | $ | 1,393 | $ | 3,145 | $ | 2,914 | $ | 13,589 | $ | — | $ | 13,589 | |||||||||||||||||||||||||||||||||||||||||||||||||||||||||||||||||||||
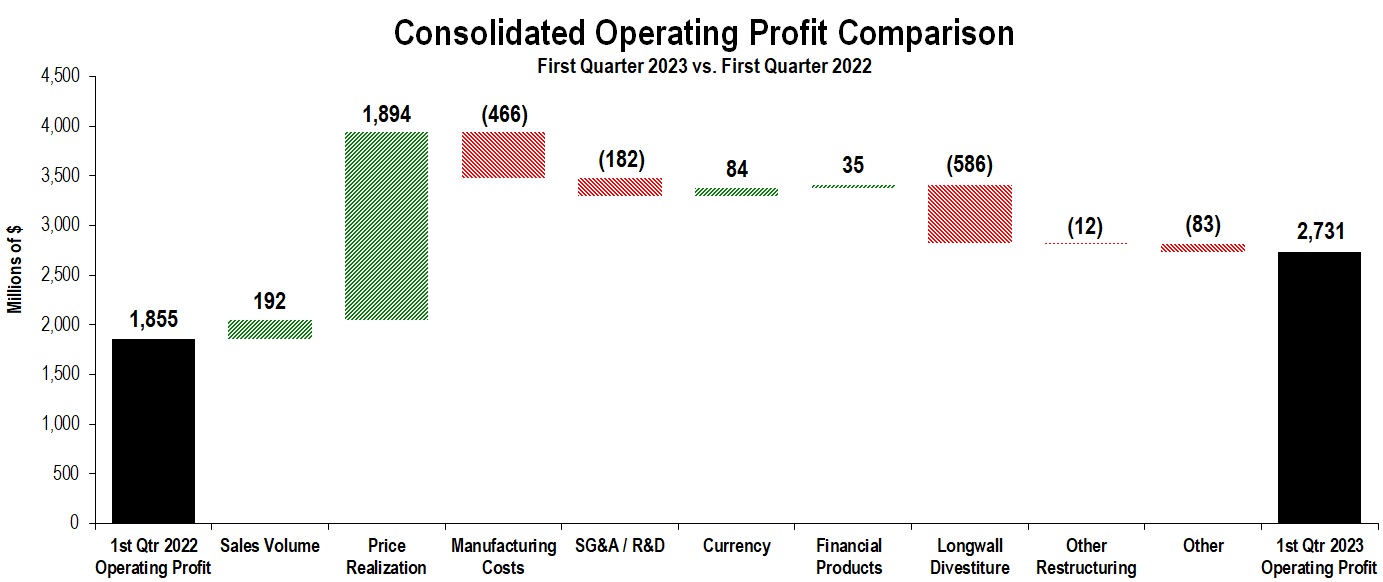
| Profit by Segment | |||||||||||||||||||||||
| (Millions of dollars) | First Quarter 2023 | First Quarter 2022 | $ Change |
%
Change
|
|||||||||||||||||||
| Construction Industries | $ | 1,790 | $ | 1,057 | $ | 733 | 69 | % | |||||||||||||||
| Resource Industries | 764 | 361 | 403 | 112 | % | ||||||||||||||||||
| Energy & Transportation | 1,057 | 538 | 519 | 96 | % | ||||||||||||||||||
| All Other Segment | 11 | 3 | 8 | 267 | % | ||||||||||||||||||
| Corporate Items and Eliminations | (1,008) | (244) | (764) | ||||||||||||||||||||
| Machinery, Energy & Transportation | 2,614 | 1,715 | 899 | 52 | % | ||||||||||||||||||
| Financial Products Segment | 232 | 238 | (6) | (3 | %) | ||||||||||||||||||
| Corporate Items and Eliminations | 25 | (17) | 42 | ||||||||||||||||||||
| Financial Products | 257 | 221 | 36 | 16 | % | ||||||||||||||||||
| Consolidating Adjustments | (140) | (81) | (59) | ||||||||||||||||||||
| Consolidated Operating Profit | $ | 2,731 | $ | 1,855 | $ | 876 | 47 | % | |||||||||||||||
| CONSTRUCTION INDUSTRIES | ||||||||||||||||||||||||||||||||||||||||||||||||||
| (Millions of dollars) | ||||||||||||||||||||||||||||||||||||||||||||||||||
| Segment Sales | ||||||||||||||||||||||||||||||||||||||||||||||||||
| First Quarter 2022 | Sales Volume | Price Realization | Currency | Inter-Segment | First Quarter 2023 | $ Change |
% Change |
|||||||||||||||||||||||||||||||||||||||||||
| Total Sales | $ | 6,115 | $ | (173) | $ | 942 | $ | (151) | $ | 13 | $ | 6,746 | $ | 631 | 10 | % | ||||||||||||||||||||||||||||||||||
| Sales by Geographic Region | ||||||||||||||||||||||||||||||||||||||||||||||||||
| First Quarter 2023 | First Quarter 2022 | $ Change |
% Change |
|||||||||||||||||||||||||||||||||||||||||||||||
| North America | $ | 3,608 | $ | 2,720 | $ | 888 | 33 | % | ||||||||||||||||||||||||||||||||||||||||||
| Latin America | 599 | 627 | (28) | (4 | %) | |||||||||||||||||||||||||||||||||||||||||||||
| EAME | 1,336 | 1,277 | 59 | 5 | % | |||||||||||||||||||||||||||||||||||||||||||||
| Asia/Pacific | 1,161 | 1,462 | (301) | (21 | %) | |||||||||||||||||||||||||||||||||||||||||||||
| External Sales | 6,704 | 6,086 | 618 | 10 | % | |||||||||||||||||||||||||||||||||||||||||||||
| Inter-segment | 42 | 29 | 13 | 45 | % | |||||||||||||||||||||||||||||||||||||||||||||
| Total Sales | $ | 6,746 | $ | 6,115 | $ | 631 | 10 | % | ||||||||||||||||||||||||||||||||||||||||||
| Segment Profit | ||||||||||||||||||||||||||||||||||||||||||||||||||
| First Quarter 2023 | First Quarter 2022 |
Change |
% Change |
|||||||||||||||||||||||||||||||||||||||||||||||
| Segment Profit | $ | 1,790 | $ | 1,057 | $ | 733 | 69 | % | ||||||||||||||||||||||||||||||||||||||||||
| Segment Profit Margin | 26.5 | % | 17.3 | % | 9.2 | pts | ||||||||||||||||||||||||||||||||||||||||||||
| RESOURCE INDUSTRIES | ||||||||||||||||||||||||||||||||||||||||||||||||||
| (Millions of dollars) | ||||||||||||||||||||||||||||||||||||||||||||||||||
| Segment Sales | ||||||||||||||||||||||||||||||||||||||||||||||||||
| First Quarter 2022 | Sales Volume | Price Realization | Currency | Inter-Segment | First Quarter 2023 | $ Change |
% Change |
|||||||||||||||||||||||||||||||||||||||||||
| Total Sales | $ | 2,830 | $ | 157 | $ | 472 | $ | (29) | $ | (3) | $ | 3,427 | $ | 597 | 21 | % | ||||||||||||||||||||||||||||||||||
| Sales by Geographic Region | ||||||||||||||||||||||||||||||||||||||||||||||||||
| First Quarter 2023 | First Quarter 2022 | $ Change |
% Change |
|||||||||||||||||||||||||||||||||||||||||||||||
| North America | $ | 1,308 | $ | 1,018 | $ | 290 | 28 | % | ||||||||||||||||||||||||||||||||||||||||||
| Latin America | 474 | 399 | 75 | 19 | % | |||||||||||||||||||||||||||||||||||||||||||||
| EAME | 599 | 594 | 5 | 1 | % | |||||||||||||||||||||||||||||||||||||||||||||
| Asia/Pacific | 978 | 748 | 230 | 31 | % | |||||||||||||||||||||||||||||||||||||||||||||
| External Sales | 3,359 | 2,759 | 600 | 22 | % | |||||||||||||||||||||||||||||||||||||||||||||
| Inter-segment | 68 | 71 | (3) | (4 | %) | |||||||||||||||||||||||||||||||||||||||||||||
| Total Sales | $ | 3,427 | $ | 2,830 | $ | 597 | 21 | % | ||||||||||||||||||||||||||||||||||||||||||
| Segment Profit | ||||||||||||||||||||||||||||||||||||||||||||||||||
| First Quarter 2023 | First Quarter 2022 |
Change |
% Change |
|||||||||||||||||||||||||||||||||||||||||||||||
| Segment Profit | $ | 764 | $ | 361 | $ | 403 | 112 | % | ||||||||||||||||||||||||||||||||||||||||||
| Segment Profit Margin | 22.3 | % | 12.8 | % | 9.5 | pts | ||||||||||||||||||||||||||||||||||||||||||||
| ENERGY & TRANSPORTATION | ||||||||||||||||||||||||||||||||||||||||||||||||||
| (Millions of dollars) | ||||||||||||||||||||||||||||||||||||||||||||||||||
| Segment Sales | ||||||||||||||||||||||||||||||||||||||||||||||||||
| First Quarter 2022 | Sales Volume | Price Realization | Currency | Inter-Segment | First Quarter 2023 | $ Change |
% Change |
|||||||||||||||||||||||||||||||||||||||||||
| Total Sales | $ | 5,038 | $ | 621 | $ | 480 | $ | (78) | $ | 193 | $ | 6,254 | $ | 1,216 | 24 | % | ||||||||||||||||||||||||||||||||||
| Sales by Application | ||||||||||||||||||||||||||||||||||||||||||||||||||
| First Quarter 2023 | First Quarter 2022 | $ Change |
% Change |
|||||||||||||||||||||||||||||||||||||||||||||||
| Oil and Gas | $ | 1,314 | $ | 948 | $ | 366 | 39 | % | ||||||||||||||||||||||||||||||||||||||||||
| Power Generation | 1,284 | 1,012 | 272 | 27 | % | |||||||||||||||||||||||||||||||||||||||||||||
| Industrial | 1,255 | 1,020 | 235 | 23 | % | |||||||||||||||||||||||||||||||||||||||||||||
| Transportation | 1,202 | 1,052 | 150 | 14 | % | |||||||||||||||||||||||||||||||||||||||||||||
| External Sales | 5,055 | 4,032 | 1,023 | 25 | % | |||||||||||||||||||||||||||||||||||||||||||||
| Inter-segment | 1,199 | 1,006 | 193 | 19 | % | |||||||||||||||||||||||||||||||||||||||||||||
| Total Sales | $ | 6,254 | $ | 5,038 | $ | 1,216 | 24 | % | ||||||||||||||||||||||||||||||||||||||||||
| Segment Profit | ||||||||||||||||||||||||||||||||||||||||||||||||||
| First Quarter 2023 | First Quarter 2022 |
Change |
% Change |
|||||||||||||||||||||||||||||||||||||||||||||||
| Segment Profit | $ | 1,057 | $ | 538 | $ | 519 | 96 | % | ||||||||||||||||||||||||||||||||||||||||||
| Segment Profit Margin | 16.9 | % | 10.7 | % | 6.2 | pts | ||||||||||||||||||||||||||||||||||||||||||||
| FINANCIAL PRODUCTS SEGMENT | ||||||||||||||||||||||||||||||||||||||||||||||||||
| (Millions of dollars) | ||||||||||||||||||||||||||||||||||||||||||||||||||
| Revenues by Geographic Region | ||||||||||||||||||||||||||||||||||||||||||||||||||
| First Quarter 2023 | First Quarter 2022 | $ Change |
% Change |
|||||||||||||||||||||||||||||||||||||||||||||||
| North America | $ | 575 | $ | 503 | $ | 72 | 14 | % | ||||||||||||||||||||||||||||||||||||||||||
| Latin America | 104 | 73 | 31 | 42 | % | |||||||||||||||||||||||||||||||||||||||||||||
| EAME | 114 | 96 | 18 | 19 | % | |||||||||||||||||||||||||||||||||||||||||||||
| Asia/Pacific | 109 | 111 | (2) | (2 | %) | |||||||||||||||||||||||||||||||||||||||||||||
| Total Revenues | $ | 902 | $ | 783 | $ | 119 | 15 | % | ||||||||||||||||||||||||||||||||||||||||||
| Segment Profit | ||||||||||||||||||||||||||||||||||||||||||||||||||
| First Quarter 2023 | First Quarter 2022 |
Change |
% Change |
|||||||||||||||||||||||||||||||||||||||||||||||
| Segment Profit | $ | 232 | $ | 238 | $ | (6) | (3 | %) | ||||||||||||||||||||||||||||||||||||||||||
| (Dollars in millions except per share data) | Operating Profit | Operating Profit Margin | Profit Before Taxes | Provision (Benefit) for Income Taxes | Effective Tax Rate | Profit | Profit per Share | |||||||||||||||||||||||||||||||||||||
Three Months Ended March 31, 2023 - U.S. GAAP |
$ | 2,731 | 17.2 | % | $ | 2,634 | $ | 708 | 26.9 | % | $ | 1,943 | $ | 3.74 | ||||||||||||||||||||||||||||||
| Restructuring costs - Longwall divestiture | 586 | 3.7 | % | 586 | — | — | % | 586 | 1.13 | |||||||||||||||||||||||||||||||||||
| Other restructuring costs | 25 | 0.2 | % | 25 | 5 | 20.0 | % | 20 | 0.04 | |||||||||||||||||||||||||||||||||||
Three Months Ended March 31, 2023 - Adjusted |
$ | 3,342 | 21.1 | % | $ | 3,245 | $ | 713 | 22.0 | % | $ | 2,549 | $ | 4.91 | ||||||||||||||||||||||||||||||
Three Months Ended March 31, 2022 - U.S. GAAP |
$ | 1,855 | 13.7 | % | $ | 1,999 | $ | 469 | 23.4 | % | $ | 1,537 | $ | 2.86 | ||||||||||||||||||||||||||||||
| Restructuring costs | 13 | 0.1 | % | 13 | 2 | 13.0 | % | 11 | 0.02 | |||||||||||||||||||||||||||||||||||
Three Months Ended March 31, 2022 - Adjusted |
$ | 1,868 | 13.7 | % | $ | 2,012 | $ | 471 | 23.4 | % | $ | 1,548 | $ | 2.88 | ||||||||||||||||||||||||||||||
| Three Months Ended March 31, | |||||||||||
| 2023 | 2022 | ||||||||||
| Sales and revenues: | |||||||||||
| Sales of Machinery, Energy & Transportation | $ | 15,099 | $ | 12,886 | |||||||
| Revenues of Financial Products | 763 | 703 | |||||||||
| Total sales and revenues | 15,862 | 13,589 | |||||||||
| Operating costs: | |||||||||||
| Cost of goods sold | 10,103 | 9,559 | |||||||||
| Selling, general and administrative expenses | 1,463 | 1,346 | |||||||||
| Research and development expenses | 472 | 457 | |||||||||
| Interest expense of Financial Products | 217 | 106 | |||||||||
| Other operating (income) expenses | 876 | 266 | |||||||||
| Total operating costs | 13,131 | 11,734 | |||||||||
| Operating profit | 2,731 | 1,855 | |||||||||
| Interest expense excluding Financial Products | 129 | 109 | |||||||||
| Other income (expense) | 32 | 253 | |||||||||
| Consolidated profit before taxes | 2,634 | 1,999 | |||||||||
| Provision (benefit) for income taxes | 708 | 469 | |||||||||
| Profit of consolidated companies | 1,926 | 1,530 | |||||||||
| Equity in profit (loss) of unconsolidated affiliated companies | 16 | 7 | |||||||||
| Profit of consolidated and affiliated companies | 1,942 | 1,537 | |||||||||
| Less: Profit (loss) attributable to noncontrolling interests | (1) | — | |||||||||
Profit 1 |
$ | 1,943 | $ | 1,537 | |||||||
| Profit per common share | $ | 3.76 | $ | 2.88 | |||||||
Profit per common share — diluted 2 |
$ | 3.74 | $ | 2.86 | |||||||
| Weighted-average common shares outstanding (millions) | |||||||||||
| – Basic | 516.2 | 534.5 | |||||||||
– Diluted 2 |
519.4 | 538.3 | |||||||||
| 1 | Profit attributable to common shareholders. | ||||
| 2 | Diluted by assumed exercise of stock-based compensation awards using the treasury stock method. | ||||
| March 31, 2023 |
December 31, 2022 |
||||||||||
| Assets | |||||||||||
| Current assets: | |||||||||||
| Cash and cash equivalents | $ | 6,789 | $ | 7,004 | |||||||
| Receivables – trade and other | 9,230 | 8,856 | |||||||||
| Receivables – finance | 9,119 | 9,013 | |||||||||
| Prepaid expenses and other current assets | 2,889 | 2,642 | |||||||||
| Inventories | 17,633 | 16,270 | |||||||||
| Total current assets | 45,660 | 43,785 | |||||||||
| Property, plant and equipment – net | 11,973 | 12,028 | |||||||||
| Long-term receivables – trade and other | 1,209 | 1,265 | |||||||||
| Long-term receivables – finance | 11,845 | 12,013 | |||||||||
| Noncurrent deferred and refundable income taxes | 2,405 | 2,213 | |||||||||
| Intangible assets | 694 | 758 | |||||||||
| Goodwill | 5,309 | 5,288 | |||||||||
| Other assets | 4,554 | 4,593 | |||||||||
| Total assets | $ | 83,649 | $ | 81,943 | |||||||
| Liabilities | |||||||||||
| Current liabilities: | |||||||||||
| Short-term borrowings: | |||||||||||
| -- Machinery, Energy & Transportation | $ | — | $ | 3 | |||||||
| -- Financial Products | 5,841 | 5,954 | |||||||||
| Accounts payable | 8,951 | 8,689 | |||||||||
| Accrued expenses | 4,121 | 4,080 | |||||||||
| Accrued wages, salaries and employee benefits | 1,368 | 2,313 | |||||||||
| Customer advances | 2,202 | 1,860 | |||||||||
| Dividends payable | — | 620 | |||||||||
| Other current liabilities | 3,035 | 2,690 | |||||||||
| Long-term debt due within one year: | |||||||||||
| -- Machinery, Energy & Transportation | 37 | 120 | |||||||||
| -- Financial Products | 6,287 | 5,202 | |||||||||
| Total current liabilities | 31,842 | 31,531 | |||||||||
| Long-term debt due after one year: | |||||||||||
| -- Machinery, Energy & Transportation | 9,558 | 9,498 | |||||||||
| -- Financial Products | 15,315 | 16,216 | |||||||||
| Liability for postemployment benefits | 4,069 | 4,203 | |||||||||
| Other liabilities | 4,695 | 4,604 | |||||||||
| Total liabilities | 65,479 | 66,052 | |||||||||
| Shareholders’ equity | |||||||||||
| Common stock | 6,546 | 6,560 | |||||||||
| Treasury stock | (32,108) | (31,748) | |||||||||
| Profit employed in the business | 45,457 | 43,514 | |||||||||
| Accumulated other comprehensive income (loss) | (1,746) | (2,457) | |||||||||
| Noncontrolling interests | 21 | 22 | |||||||||
| Total shareholders’ equity | 18,170 | 15,891 | |||||||||
| Total liabilities and shareholders’ equity | $ | 83,649 | $ | 81,943 | |||||||
| Three Months Ended March 31, | |||||||||||
| 2023 | 2022 | ||||||||||
| Cash flow from operating activities: | |||||||||||
| Profit of consolidated and affiliated companies | $ | 1,942 | $ | 1,537 | |||||||
| Adjustments for non-cash items: | |||||||||||
| Depreciation and amortization | 532 | 557 | |||||||||
| Provision (benefit) for deferred income taxes | (191) | (99) | |||||||||
| Loss on divestiture | 572 | — | |||||||||
| Other | 117 | (52) | |||||||||
| Changes in assets and liabilities, net of acquisitions and divestitures: | |||||||||||
| Receivables – trade and other | (329) | (372) | |||||||||
| Inventories | (1,403) | (1,032) | |||||||||
| Accounts payable | 477 | 452 | |||||||||
| Accrued expenses | 38 | (74) | |||||||||
| Accrued wages, salaries and employee benefits | (950) | (965) | |||||||||
| Customer advances | 365 | 311 | |||||||||
| Other assets – net | 107 | 99 | |||||||||
| Other liabilities – net | 296 | (49) | |||||||||
| Net cash provided by (used for) operating activities | 1,573 | 313 | |||||||||
| Cash flow from investing activities: | |||||||||||
| Capital expenditures – excluding equipment leased to others | (422) | (346) | |||||||||
| Expenditures for equipment leased to others | (328) | (333) | |||||||||
| Proceeds from disposals of leased assets and property, plant and equipment | 184 | 269 | |||||||||
| Additions to finance receivables | (3,020) | (2,988) | |||||||||
| Collections of finance receivables | 3,169 | 2,966 | |||||||||
| Proceeds from sale of finance receivables | 24 | 9 | |||||||||
| Investments and acquisitions (net of cash acquired) | (5) | (8) | |||||||||
| Proceeds from sale of businesses and investments (net of cash sold) | (14) | — | |||||||||
| Proceeds from sale of securities | 239 | 571 | |||||||||
| Investments in securities | (536) | (1,438) | |||||||||
| Other – net | 26 | (15) | |||||||||
| Net cash provided by (used for) investing activities | (683) | (1,313) | |||||||||
| Cash flow from financing activities: | |||||||||||
| Dividends paid | (620) | (595) | |||||||||
| Common stock issued, including treasury shares reissued | (25) | (28) | |||||||||
| Common shares repurchased | (400) | (820) | |||||||||
| Proceeds from debt issued (original maturities greater than three months) | 1,517 | 2,131 | |||||||||
| Payments on debt (original maturities greater than three months) | (1,475) | (1,387) | |||||||||
| Short-term borrowings – net (original maturities three months or less) | (103) | (1,016) | |||||||||
| Net cash provided by (used for) financing activities | (1,106) | (1,715) | |||||||||
| Effect of exchange rate changes on cash | (1) | (16) | |||||||||
| Increase (decrease) in cash, cash equivalents and restricted cash | (217) | (2,731) | |||||||||
| Cash, cash equivalents and restricted cash at beginning of period | 7,013 | 9,263 | |||||||||
| Cash, cash equivalents and restricted cash at end of period | $ | 6,796 | $ | 6,532 | |||||||
Cash equivalents primarily represent short-term, highly liquid investments with original maturities of generally three months or less. | ||
| Supplemental Consolidating Data | ||||||||||||||||||||||||||
| Consolidated | Machinery, Energy & Transportation | Financial Products |
Consolidating Adjustments |
|||||||||||||||||||||||
| Sales and revenues: | ||||||||||||||||||||||||||
| Sales of Machinery, Energy & Transportation | $ | 15,099 | $ | 15,099 | $ | — | $ | — | ||||||||||||||||||
| Revenues of Financial Products | 763 | — | 935 | (172) | 1 | |||||||||||||||||||||
| Total sales and revenues | 15,862 | 15,099 | 935 | (172) | ||||||||||||||||||||||
| Operating costs: | ||||||||||||||||||||||||||
| Cost of goods sold | 10,103 | 10,104 | — | (1) | 2 | |||||||||||||||||||||
| Selling, general and administrative expenses | 1,463 | 1,320 | 158 | (15) | 2 | |||||||||||||||||||||
| Research and development expenses | 472 | 472 | — | — | ||||||||||||||||||||||
| Interest expense of Financial Products | 217 | — | 217 | — | ||||||||||||||||||||||
| Other operating (income) expenses | 876 | 589 | 303 | (16) | 2 | |||||||||||||||||||||
| Total operating costs | 13,131 | 12,485 | 678 | (32) | ||||||||||||||||||||||
| Operating profit | 2,731 | 2,614 | 257 | (140) | ||||||||||||||||||||||
| Interest expense excluding Financial Products | 129 | 129 | — | — | ||||||||||||||||||||||
| Other income (expense) | 32 | (14) | (19) | 65 | 3 | |||||||||||||||||||||
| Consolidated profit before taxes | 2,634 | 2,471 | 238 | (75) | ||||||||||||||||||||||
| Provision (benefit) for income taxes | 708 | 648 | 60 | — | ||||||||||||||||||||||
| Profit of consolidated companies | 1,926 | 1,823 | 178 | (75) | ||||||||||||||||||||||
| Equity in profit (loss) of unconsolidated affiliated companies | 16 | 19 | — | (3) | 4 | |||||||||||||||||||||
| Profit of consolidated and affiliated companies | 1,942 | 1,842 | 178 | (78) | ||||||||||||||||||||||
| Less: Profit (loss) attributable to noncontrolling interests | (1) | — | 2 | (3) | 5 | |||||||||||||||||||||
Profit 6 |
$ | 1,943 | $ | 1,842 | $ | 176 | $ | (75) | ||||||||||||||||||
| 1 | Elimination of Financial Products’ revenues earned from ME&T. |
||||
| 2 | Elimination of net expenses recorded by ME&T paid to Financial Products. |
||||
| 3 | Elimination of discount recorded by ME&T on receivables sold to Financial Products and of interest earned between ME&T and Financial Products as well as dividends paid by Financial Products to ME&T. |
||||
| 4 | Elimination of equity profit (loss) earned from Financial Products’ subsidiaries partially owned by ME&T subsidiaries. |
||||
| 5 | Elimination of noncontrolling interest profit (loss) recorded by Financial Products for subsidiaries partially owned by ME&T subsidiaries. |
||||
| 6 | Profit attributable to common shareholders. | ||||
| Supplemental Consolidating Data | ||||||||||||||||||||||||||
| Consolidated | Machinery, Energy & Transportation | Financial Products |
Consolidating Adjustments |
|||||||||||||||||||||||
| Sales and revenues: | ||||||||||||||||||||||||||
| Sales of Machinery, Energy & Transportation | $ | 12,886 | $ | 12,886 | $ | — | $ | — | ||||||||||||||||||
| Revenues of Financial Products | 703 | — | 813 | (110) | 1 | |||||||||||||||||||||
| Total sales and revenues | 13,589 | 12,886 | 813 | (110) | ||||||||||||||||||||||
| Operating costs: | ||||||||||||||||||||||||||
| Cost of goods sold | 9,559 | 9,560 | — | (1) | 2 | |||||||||||||||||||||
| Selling, general and administrative expenses | 1,346 | 1,182 | 172 | (8) | 2 | |||||||||||||||||||||
| Research and development expenses | 457 | 457 | — | — | ||||||||||||||||||||||
| Interest expense of Financial Products | 106 | — | 106 | — | ||||||||||||||||||||||
| Other operating (income) expenses | 266 | (28) | 314 | (20) | 2 | |||||||||||||||||||||
| Total operating costs | 11,734 | 11,171 | 592 | (29) | ||||||||||||||||||||||
| Operating profit | 1,855 | 1,715 | 221 | (81) | ||||||||||||||||||||||
| Interest expense excluding Financial Products | 109 | 109 | — | — | ||||||||||||||||||||||
| Other income (expense) | 253 | 157 | 15 | 81 | 3 | |||||||||||||||||||||
| Consolidated profit before taxes | 1,999 | 1,763 | 236 | — | ||||||||||||||||||||||
| Provision (benefit) for income taxes | 469 | 412 | 57 | — | ||||||||||||||||||||||
| Profit of consolidated companies | 1,530 | 1,351 | 179 | — | ||||||||||||||||||||||
| Equity in profit (loss) of unconsolidated affiliated companies | 7 | 8 | — | (1) | 4 | |||||||||||||||||||||
| Profit of consolidated and affiliated companies | 1,537 | 1,359 | 179 | (1) | ||||||||||||||||||||||
| Less: Profit (loss) attributable to noncontrolling interests | — | — | 1 | (1) | 5 | |||||||||||||||||||||
Profit 6 |
$ | 1,537 | $ | 1,359 | $ | 178 | $ | — | ||||||||||||||||||
| 1 | Elimination of Financial Products’ revenues earned from ME&T. |
||||
| 2 | Elimination of net expenses recorded by ME&T paid to Financial Products. |
||||
| 3 | Elimination of discount recorded by ME&T on receivables sold to Financial Products and of interest earned between ME&T and Financial Products as well as dividends paid by Financial Products to ME&T. |
||||
| 4 | Elimination of equity profit (loss) earned from Financial Products’ subsidiaries partially owned by ME&T subsidiaries. |
||||
| 5 | Elimination of noncontrolling interest profit (loss) recorded by Financial Products for subsidiaries partially owned by ME&T subsidiaries. |
||||
| 6 | Profit attributable to common shareholders. | ||||
| Supplemental Consolidating Data | ||||||||||||||||||||||||||
| Consolidated | Machinery, Energy & Transportation |
Financial Products |
Consolidating Adjustments |
|||||||||||||||||||||||
| Assets | ||||||||||||||||||||||||||
| Current assets: | ||||||||||||||||||||||||||
| Cash and cash equivalents | $ | 6,789 | $ | 6,017 | $ | 772 | $ | — | ||||||||||||||||||
| Receivables – trade and other | 9,230 | 3,481 | 477 | 5,272 | 1,2 |
|||||||||||||||||||||
| Receivables – finance | 9,119 | — | 14,655 | (5,536) | 2 | |||||||||||||||||||||
| Prepaid expenses and other current assets | 2,889 | 2,629 | 289 | (29) | 3 | |||||||||||||||||||||
| Inventories | 17,633 | 17,633 | — | — | ||||||||||||||||||||||
| Total current assets | 45,660 | 29,760 | 16,193 | (293) | ||||||||||||||||||||||
| Property, plant and equipment – net | 11,973 | 8,090 | 3,883 | — | ||||||||||||||||||||||
| Long-term receivables – trade and other | 1,209 | 463 | 276 | 470 | 1,2 |
|||||||||||||||||||||
| Long-term receivables – finance | 11,845 | — | 12,346 | (501) | 2 | |||||||||||||||||||||
| Noncurrent deferred and refundable income taxes | 2,405 | 2,923 | 118 | (636) | 4 | |||||||||||||||||||||
| Intangible assets | 694 | 694 | — | — | ||||||||||||||||||||||
| Goodwill | 5,309 | 5,309 | — | — | ||||||||||||||||||||||
| Other assets | 4,554 | 3,795 | 1,940 | (1,181) | 5 | |||||||||||||||||||||
| Total assets | $ | 83,649 | $ | 51,034 | $ | 34,756 | $ | (2,141) | ||||||||||||||||||
| Liabilities | ||||||||||||||||||||||||||
| Current liabilities: | ||||||||||||||||||||||||||
| Short-term borrowings | $ | 5,841 | $ | — | $ | 5,841 | $ | — | ||||||||||||||||||
| Accounts payable | 8,951 | 8,893 | 342 | (284) | 6,7 | |||||||||||||||||||||
| Accrued expenses | 4,121 | 3,646 | 461 | 14 | 7 | |||||||||||||||||||||
| Accrued wages, salaries and employee benefits | 1,368 | 1,341 | 27 | — | ||||||||||||||||||||||
| Customer advances | 2,202 | 2,196 | — | 6 | 7 | |||||||||||||||||||||
| Other current liabilities | 3,035 | 2,400 | 687 | (52) | 4,8 |
|||||||||||||||||||||
| Long-term debt due within one year | 6,324 | 37 | 6,287 | — | ||||||||||||||||||||||
| Total current liabilities | 31,842 | 18,513 | 13,645 | (316) | ||||||||||||||||||||||
| Long-term debt due after one year | 24,873 | 9,589 | 15,315 | (31) | 9 | |||||||||||||||||||||
| Liability for postemployment benefits | 4,069 | 4,069 | — | — | ||||||||||||||||||||||
| Other liabilities | 4,695 | 3,786 | 1,601 | (692) | 4 | |||||||||||||||||||||
| Total liabilities | 65,479 | 35,957 | 30,561 | (1,039) | ||||||||||||||||||||||
| Shareholders’ equity | ||||||||||||||||||||||||||
| Common stock | 6,546 | 6,546 | 905 | (905) | 10 | |||||||||||||||||||||
| Treasury stock | (32,108) | (32,108) | — | — | ||||||||||||||||||||||
| Profit employed in the business | 45,457 | 41,277 | 4,169 | 11 | 10 | |||||||||||||||||||||
| Accumulated other comprehensive income (loss) | (1,746) | (657) | (1,089) | — | ||||||||||||||||||||||
| Noncontrolling interests | 21 | 19 | 210 | (208) | 10 | |||||||||||||||||||||
| Total shareholders’ equity | 18,170 | 15,077 | 4,195 | (1,102) | ||||||||||||||||||||||
| Total liabilities and shareholders’ equity | $ | 83,649 | $ | 51,034 | $ | 34,756 | $ | (2,141) | ||||||||||||||||||
| 1 | Elimination of receivables between ME&T and Financial Products. |
||||
| 2 | Reclassification of ME&T’s trade receivables purchased by Financial Products and Financial Products’ wholesale inventory receivables. |
||||
| 3 | Elimination of ME&T's insurance premiums that are prepaid to Financial Products. | ||||
| 4 | Reclassification reflecting required netting of deferred tax assets/liabilities by taxing jurisdiction. |
||||
| 5 | Elimination of other intercompany assets between ME&T and Financial Products. |
||||
| 6 | Elimination of payables between ME&T and Financial Products. |
||||
| 7 | Reclassification of Financial Products' payables to accrued expenses or customer advances. | ||||
| 8 | Elimination of prepaid insurance in Financial Products’ other liabilities. | ||||
| 9 | Elimination of debt between ME&T and Financial Products. |
||||
| 10 | Eliminations associated with ME&T’s investments in Financial Products’ subsidiaries. |
||||
| Supplemental Consolidating Data | ||||||||||||||||||||||||||
| Consolidated | Machinery, Energy & Transportation |
Financial Products |
Consolidating Adjustments |
|||||||||||||||||||||||
| Assets | ||||||||||||||||||||||||||
| Current assets: | ||||||||||||||||||||||||||
| Cash and cash equivalents | $ | 7,004 | $ | 6,042 | $ | 962 | $ | — | ||||||||||||||||||
| Receivables – trade and other | 8,856 | 3,710 | 519 | 4,627 | 1,2 |
|||||||||||||||||||||
| Receivables – finance | 9,013 | — | 13,902 | (4,889) | 2 | |||||||||||||||||||||
| Prepaid expenses and other current assets | 2,642 | 2,488 | 290 | (136) | 3 | |||||||||||||||||||||
| Inventories | 16,270 | 16,270 | — | — | ||||||||||||||||||||||
| Total current assets | 43,785 | 28,510 | 15,673 | (398) | ||||||||||||||||||||||
| Property, plant and equipment – net | 12,028 | 8,186 | 3,842 | — | ||||||||||||||||||||||
| Long-term receivables – trade and other | 1,265 | 418 | 339 | 508 | 1,2 |
|||||||||||||||||||||
| Long-term receivables – finance | 12,013 | — | 12,552 | (539) | 2 | |||||||||||||||||||||
| Noncurrent deferred and refundable income taxes | 2,213 | 2,755 | 115 | (657) | 4 | |||||||||||||||||||||
| Intangible assets | 758 | 758 | — | — | ||||||||||||||||||||||
| Goodwill | 5,288 | 5,288 | — | — | ||||||||||||||||||||||
| Other assets | 4,593 | 3,882 | 1,892 | (1,181) | 5 | |||||||||||||||||||||
| Total assets | $ | 81,943 | $ | 49,797 | $ | 34,413 | $ | (2,267) | ||||||||||||||||||
| Liabilities | ||||||||||||||||||||||||||
| Current liabilities: | ||||||||||||||||||||||||||
| Short-term borrowings | $ | 5,957 | $ | 3 | $ | 5,954 | $ | — | ||||||||||||||||||
| Accounts payable | 8,689 | 8,657 | 294 | (262) | 6 | |||||||||||||||||||||
| Accrued expenses | 4,080 | 3,687 | 393 | — | ||||||||||||||||||||||
| Accrued wages, salaries and employee benefits | 2,313 | 2,264 | 49 | — | ||||||||||||||||||||||
| Customer advances | 1,860 | 1,860 | — | — | ||||||||||||||||||||||
| Dividends payable | 620 | 620 | — | — | ||||||||||||||||||||||
| Other current liabilities | 2,690 | 2,215 | 635 | (160) | 4,7 |
|||||||||||||||||||||
| Long-term debt due within one year | 5,322 | 120 | 5,202 | — | ||||||||||||||||||||||
| Total current liabilities | 31,531 | 19,426 | 12,527 | (422) | ||||||||||||||||||||||
| Long-term debt due after one year | 25,714 | 9,529 | 16,216 | (31) | 8 | |||||||||||||||||||||
| Liability for postemployment benefits | 4,203 | 4,203 | — | — | ||||||||||||||||||||||
| Other liabilities | 4,604 | 3,677 | 1,638 | (711) | 4 | |||||||||||||||||||||
| Total liabilities | 66,052 | 36,835 | 30,381 | (1,164) | ||||||||||||||||||||||
| Shareholders’ equity | ||||||||||||||||||||||||||
| Common stock | 6,560 | 6,560 | 905 | (905) | 9 | |||||||||||||||||||||
| Treasury stock | (31,748) | (31,748) | — | — | ||||||||||||||||||||||
| Profit employed in the business | 43,514 | 39,435 | 4,068 | 11 | 9 | |||||||||||||||||||||
| Accumulated other comprehensive income (loss) | (2,457) | (1,310) | (1,147) | — | ||||||||||||||||||||||
| Noncontrolling interests | 22 | 25 | 206 | (209) | 9 | |||||||||||||||||||||
| Total shareholders’ equity | 15,891 | 12,962 | 4,032 | (1,103) | ||||||||||||||||||||||
| Total liabilities and shareholders’ equity | $ | 81,943 | $ | 49,797 | $ | 34,413 | $ | (2,267) | ||||||||||||||||||
| 1 | Elimination of receivables between ME&T and Financial Products. |
||||
| 2 | Reclassification of ME&T’s trade receivables purchased by Financial Products and Financial Products’ wholesale inventory receivables. |
||||
| 3 | Elimination of ME&T’s insurance premiums that are prepaid to Financial Products. | ||||
| 4 | Reclassification reflecting required netting of deferred tax assets/liabilities by taxing jurisdiction. |
||||
| 5 | Elimination of other intercompany assets between ME&T and Financial Products. |
||||
| 6 | Elimination of payables between ME&T and Financial Products. | ||||
| 7 | Elimination of prepaid insurance in Financial Products’ other liabilities. |
||||
| 8 | Elimination of debt between ME&T and Financial Products. | ||||
| 9 | Eliminations associated with ME&T’s investments in Financial Products’ subsidiaries. |
||||
| Supplemental Consolidating Data | ||||||||||||||||||||||||||
| Consolidated | Machinery, Energy & Transportation | Financial Products |
Consolidating Adjustments |
|||||||||||||||||||||||
| Cash flow from operating activities: | ||||||||||||||||||||||||||
| Profit of consolidated and affiliated companies | $ | 1,942 | $ | 1,842 | $ | 178 | $ | (78) | 1,5 | |||||||||||||||||
| Adjustments for non-cash items: | ||||||||||||||||||||||||||
| Depreciation and amortization | 532 | 342 | 190 | — | ||||||||||||||||||||||
| Provision (benefit) for deferred income taxes | (191) | (169) | (22) | — | ||||||||||||||||||||||
| Loss on divestiture | 572 | 572 | — | — | ||||||||||||||||||||||
| Other | 117 | 124 | (143) | 136 | 2 | |||||||||||||||||||||
| Changes in assets and liabilities, net of acquisitions and divestitures: | ||||||||||||||||||||||||||
| Receivables – trade and other | (329) | 205 | 14 | (548) | 2,3 |
|||||||||||||||||||||
| Inventories | (1,403) | (1,402) | — | (1) | 2 | |||||||||||||||||||||
| Accounts payable | 477 | 465 | 34 | (22) | 2 | |||||||||||||||||||||
| Accrued expenses | 38 | 6 | 32 | — | ||||||||||||||||||||||
| Accrued wages, salaries and employee benefits | (950) | (928) | (22) | — | ||||||||||||||||||||||
| Customer advances | 365 | 365 | — | — | ||||||||||||||||||||||
| Other assets – net | 107 | 223 | 4 | (120) | 2 | |||||||||||||||||||||
| Other liabilities – net | 296 | 134 | 37 | 125 | 2 | |||||||||||||||||||||
| Net cash provided by (used for) operating activities | 1,573 | 1,779 | 302 | (508) | ||||||||||||||||||||||
| Cash flow from investing activities: | ||||||||||||||||||||||||||
| Capital expenditures – excluding equipment leased to others | (422) | (414) | (9) | 1 | 2 | |||||||||||||||||||||
| Expenditures for equipment leased to others | (328) | — | (330) | 2 | 2 | |||||||||||||||||||||
| Proceeds from disposals of leased assets and property, plant and equipment | 184 | 7 | 179 | (2) | 2 | |||||||||||||||||||||
| Additions to finance receivables | (3,020) | — | (3,462) | 442 | 3 | |||||||||||||||||||||
| Collections of finance receivables | 3,169 | — | 3,437 | (268) | 3 | |||||||||||||||||||||
| Net intercompany purchased receivables | — | — | (258) | 258 | 3 | |||||||||||||||||||||
| Proceeds from sale of finance receivables | 24 | — | 24 | — | ||||||||||||||||||||||
| Net intercompany borrowings | — | — | 2 | (2) | 4 | |||||||||||||||||||||
| Investments and acquisitions (net of cash acquired) | (5) | (5) | — | — | ||||||||||||||||||||||
| Proceeds from sale of businesses and investments (net of cash sold) | (14) | (14) | — | — | ||||||||||||||||||||||
| Proceeds from sale of securities | 239 | 162 | 77 | — | ||||||||||||||||||||||
| Investments in securities | (536) | (433) | (103) | — | ||||||||||||||||||||||
| Other – net | 26 | 27 | (1) | — | ||||||||||||||||||||||
| Net cash provided by (used for) investing activities | (683) | (670) | (444) | 431 | ||||||||||||||||||||||
| Cash flow from financing activities: | ||||||||||||||||||||||||||
| Dividends paid | (620) | (620) | (75) | 75 | 5 | |||||||||||||||||||||
| Common stock issued, including treasury shares reissued | (25) | (25) | — | — | ||||||||||||||||||||||
| Common shares repurchased | (400) | (400) | — | — | ||||||||||||||||||||||
| Net intercompany borrowings | — | (2) | — | 2 | 4 | |||||||||||||||||||||
| Proceeds from debt issued > 90 days | 1,517 | — | 1,517 | — | ||||||||||||||||||||||
| Payments on debt > 90 days | (1,475) | (90) | (1,385) | — | ||||||||||||||||||||||
| Short-term borrowings – net < 90 days | (103) | (3) | (100) | — | ||||||||||||||||||||||
| Net cash provided by (used for) financing activities | (1,106) | (1,140) | (43) | 77 | ||||||||||||||||||||||
| Effect of exchange rate changes on cash | (1) | 4 | (5) | — | ||||||||||||||||||||||
| Increase (decrease) in cash, cash equivalents and restricted cash | (217) | (27) | (190) | — | ||||||||||||||||||||||
| Cash, cash equivalents and restricted cash at beginning of period | 7,013 | 6,049 | 964 | — | ||||||||||||||||||||||
| Cash, cash equivalents and restricted cash at end of period | $ | 6,796 | $ | 6,022 | $ | 774 | $ | — | ||||||||||||||||||
| 1 | Elimination of equity profit earned from Financial Products' subsidiaries partially owned by ME&T subsidiaries. | ||||
| 2 | Elimination of non-cash adjustments and changes in assets and liabilities related to consolidated reporting. | ||||
| 3 | Reclassification of Financial Products’ cash flow activity from investing to operating for receivables that arose from the sale of inventory. | ||||
| 4 | Elimination of net proceeds and payments to/from ME&T and Financial Products. | ||||
| 5 | Elimination of dividend activity between Financial Products and ME&T. | ||||
| Supplemental Consolidating Data | ||||||||||||||||||||||||||
| Consolidated | Machinery, Energy & Transportation | Financial Products |
Consolidating Adjustments |
|||||||||||||||||||||||
| Cash flow from operating activities: | ||||||||||||||||||||||||||
| Profit of consolidated and affiliated companies | $ | 1,537 | $ | 1,359 | $ | 179 | $ | (1) | 1 | |||||||||||||||||
| Adjustments for non-cash items: | ||||||||||||||||||||||||||
| Depreciation and amortization | 557 | 358 | 199 | — | ||||||||||||||||||||||
| Provision (benefit) for deferred income taxes | (99) | (83) | (16) | — | ||||||||||||||||||||||
| Other | (52) | (46) | (89) | 83 | 2 | |||||||||||||||||||||
| Changes in assets and liabilities, net of acquisitions and divestitures: | ||||||||||||||||||||||||||
| Receivables – trade and other | (372) | (257) | (7) | (108) | 2,3 |
|||||||||||||||||||||
| Inventories | (1,032) | (1,030) | — | (2) | 2 | |||||||||||||||||||||
| Accounts payable | 452 | 393 | 40 | 19 | 2 | |||||||||||||||||||||
| Accrued expenses | (74) | (1) | (73) | — | ||||||||||||||||||||||
| Accrued wages, salaries and employee benefits | (965) | (940) | (25) | — | ||||||||||||||||||||||
| Customer advances | 311 | 311 | — | — | ||||||||||||||||||||||
| Other assets – net | 99 | 137 | (17) | (21) | 2 | |||||||||||||||||||||
| Other liabilities – net | (49) | (279) | 202 | 28 | 2 | |||||||||||||||||||||
| Net cash provided by (used for) operating activities | 313 | (78) | 393 | (2) | ||||||||||||||||||||||
| Cash flow from investing activities: | ||||||||||||||||||||||||||
| Capital expenditures – excluding equipment leased to others | (346) | (344) | (3) | 1 | 2 | |||||||||||||||||||||
| Expenditures for equipment leased to others | (333) | (4) | (335) | 6 | 2 | |||||||||||||||||||||
| Proceeds from disposals of leased assets and property, plant and equipment | 269 | 33 | 241 | (5) | 2 | |||||||||||||||||||||
| Additions to finance receivables | (2,988) | — | (3,139) | 151 | 3 | |||||||||||||||||||||
| Collections of finance receivables | 2,966 | — | 3,159 | (193) | 3 | |||||||||||||||||||||
| Net intercompany purchased receivables | — | — | (42) | 42 | 3 | |||||||||||||||||||||
| Proceeds from sale of finance receivables | 9 | — | 9 | — | ||||||||||||||||||||||
| Net intercompany borrowings | — | — | 1 | (1) | 4 | |||||||||||||||||||||
| Investments and acquisitions (net of cash acquired) | (8) | (8) | — | — | ||||||||||||||||||||||
| Proceeds from sale of securities | 571 | 478 | 93 | — | ||||||||||||||||||||||
| Investments in securities | (1,438) | (1,266) | (172) | — | ||||||||||||||||||||||
| Other – net | (15) | 18 | (33) | — | ||||||||||||||||||||||
| Net cash provided by (used for) investing activities | (1,313) | (1,093) | (221) | 1 | ||||||||||||||||||||||
| Cash flow from financing activities: | ||||||||||||||||||||||||||
| Dividends paid | (595) | (595) | — | — | ||||||||||||||||||||||
| Common stock issued, including treasury shares reissued | (28) | (28) | — | — | ||||||||||||||||||||||
| Common shares repurchased | (820) | (820) | — | — | ||||||||||||||||||||||
| Net intercompany borrowings | — | (1) | — | 1 | 4 | |||||||||||||||||||||
| Proceeds from debt issued > 90 days | 2,131 | — | 2,131 | — | ||||||||||||||||||||||
| Payments on debt > 90 days | (1,387) | (6) | (1,381) | — | ||||||||||||||||||||||
| Short-term borrowings – net < 90 days | (1,016) | (124) | (892) | — | ||||||||||||||||||||||
| Net cash provided by (used for) financing activities | (1,715) | (1,574) | (142) | 1 | ||||||||||||||||||||||
| Effect of exchange rate changes on cash | (16) | (21) | 5 | — | ||||||||||||||||||||||
| Increase (decrease) in cash, cash equivalents and restricted cash | (2,731) | (2,766) | 35 | — | ||||||||||||||||||||||
| Cash, cash equivalents and restricted cash at beginning of period | 9,263 | 8,433 | 830 | — | ||||||||||||||||||||||
| Cash, cash equivalents and restricted cash at end of period | $ | 6,532 | $ | 5,667 | $ | 865 | $ | — | ||||||||||||||||||
| 1 | Elimination of equity profit earned from Financial Products' subsidiaries partially owned by ME&T subsidiaries. | ||||
| 2 | Elimination of non-cash adjustments and changes in assets and liabilities related to consolidated reporting. | ||||
| 3 | Reclassification of Financial Products’ cash flow activity from investing to operating for receivables that arose from the sale of inventory. | ||||
| 4 | Elimination of net proceeds and payments to/from ME&T and Financial Products. | ||||
| Caterpillar Inc. Quarterly Retail Sales Statistics | ||||||||||||||
| Machines and E&T Combined | 1st Quarter 2023 | 4th Quarter 2022 | 3rd Quarter 2022 | 2nd Quarter 2022 | ||||||||||
| World | UP 13% | UP 8% | UP 7% | DOWN 3% | ||||||||||
| Machines | 1st Quarter 2023 | 4th Quarter 2022 | 3rd Quarter 2022 | 2nd Quarter 2022 | ||||||||||
| Asia/Pacific | DOWN 14% | UNCHANGED | UP 4% | DOWN 14% | ||||||||||
| EAME | UP 13% | DOWN 6% | DOWN 2% | DOWN 3% | ||||||||||
| Latin America | DOWN 6% | UP 5% | UP 9% | UP 18% | ||||||||||
| North America | UP 15% | UP 13% | UP 2% | DOWN 3% | ||||||||||
| World | UP 5% | UP 4% | UP 2% | DOWN 4% | ||||||||||
| Resource Industries (RI) | 1st Quarter 2023 | 4th Quarter 2022 | 3rd Quarter 2022 | 2nd Quarter 2022 | ||||||||||
| Asia/Pacific | DOWN 12% | UP 1% | UP 30% | UP 3% | ||||||||||
| EAME | UP 27% | DOWN 18% | UP 5% | DOWN 1% | ||||||||||
| Latin America | DOWN 12% | UP 13% | DOWN 11% | DOWN 4% | ||||||||||
| North America | UP 56% | UP 61% | UP 8% | DOWN 7% | ||||||||||
| World | UP 18% | UP 13% | UP 10% | DOWN 2% | ||||||||||
| Construction Industries (CI) | 1st Quarter 2023 | 4th Quarter 2022 | 3rd Quarter 2022 | 2nd Quarter 2022 | ||||||||||
| Asia/Pacific | DOWN 15% | DOWN 1% | DOWN 7% | DOWN 21% | ||||||||||
| EAME | UP 7% | DOWN 2% | DOWN 5% | DOWN 3% | ||||||||||
| Latin America | DOWN 4% | UP 2% | UP 20% | UP 28% | ||||||||||
| North America | UP 5% | UP 4% | UP 1% | DOWN 3% | ||||||||||
| World | UNCHANGED | UP 1% | UNCHANGED | DOWN 4% | ||||||||||
| Reported in dollars and based on unit sales as reported primarily by dealers. | ||||||||||||||
Energy & Transportation (E&T) Retail Sales by industry for the quarter ended as indicated compared with the same period of the prior year: | ||||||||||||||
| Energy & Transportation (E&T) | 1st Quarter 2023 | 4th Quarter 2022 | 3rd Quarter 2022 | 2nd Quarter 2022 | ||||||||||
| Power Gen | UP 43% | UP 14% | UP 26% | UP 7% | ||||||||||
| Industrial | UP 42% | UP 27% | UP 31% | UP 19% | ||||||||||
| Transportation | DOWN 8% | DOWN 36% | UP 30% | DOWN 9% | ||||||||||
| Oil & Gas | UP 43% | UP 38% | UP 11% | DOWN 13% | ||||||||||
| Total | UP 39% | UP 19% | UP 22% | UNCHANGED | ||||||||||
| Reported in dollars based on reporting from dealers and direct sales. | ||||||||||||||
| · Asphalt Pavers | · Motor Graders | · Track-Type Tractors (small, medium) | ||||||
· Backhoe Loaders |
· Pipelayers | · Track Excavators (mini, small, | ||||||
· Cold Planers |
· Road Reclaimers | medium, large) | ||||||
· Compactors |
· Skid Steer Loaders | · Wheel Excavators |
||||||
· Compact Track Loaders |
· Telehandlers | · Wheel Loaders (compact, small, | ||||||
| · Forestry Machines | · Track-Type Loaders | medium) | ||||||
| · Material Handlers | ||||||||
| · Large Track-Type tractors | · Hydraulic Shovels | · Wheel Tractor Scrapers | ||||||
| · Large Mining Trucks | · Rotary Drills | · Wheel Dozers | ||||||
| · Hard Rock Vehicles | · Large Wheel Loaders | · Landfill Compactors | ||||||
| · Electric Rope Shovels | · Off-Highway Trucks | · Soil Compactors | ||||||
| · Draglines | · Articulated Trucks | |||||||