Document
SELECTED RAILROAD STATISTICS - UNAUDITED
|
|
|
|
|
|
|
|
|
|
|
|
|
2023 |
|
2022 |
|
2021 |
|
| Financial measures |
|
|
|
Key financial performance indicators (1) |
|
|
|
Total revenues ($ millions) |
16,828 |
|
17,107 |
|
14,477 |
|
Freight revenues ($ millions) |
16,236 |
|
16,569 |
|
13,888 |
|
Operating income ($ millions) |
6,597 |
|
6,840 |
|
5,616 |
|
Adjusted operating income ($ millions) (2)(3) |
6,597 |
|
6,862 |
|
5,622 |
|
Net income ($ millions) |
5,625 |
|
5,118 |
|
4,899 |
|
Adjusted net income ($ millions) (2)(3) |
4,800 |
|
5,134 |
|
4,225 |
|
Diluted earnings per share ($) |
8.53 |
|
7.44 |
|
6.90 |
|
Adjusted diluted earnings per share ($) (2)(3) |
7.28 |
|
7.46 |
|
5.95 |
|
Free cash flow ($ millions) (2)(4) |
3,887 |
|
4,259 |
|
3,296 |
|
Gross property additions ($ millions) |
3,217 |
|
2,757 |
|
2,897 |
|
Share repurchases ($ millions) |
4,551 |
|
4,709 |
|
1,582 |
|
Dividends per share ($) |
3.16 |
|
2.93 |
|
2.46 |
|
|
|
|
|
|
|
|
|
|
|
|
|
|
|
|
|
| Financial ratios |
|
|
|
Operating ratio (%) (5) |
60.8 |
|
60.0 |
|
61.2 |
|
Adjusted operating ratio (%) (2)(3) |
60.8 |
|
59.9 |
|
61.2 |
|
Adjusted debt-to-adjusted EBITDA (times) (2)(4) |
2.25 |
|
1.86 |
|
1.82 |
|
Return on invested capital (ROIC) (%) (2)(6) |
16.8 |
|
15.8 |
|
16.4 |
|
Adjusted ROIC (%) (2)(6) |
14.5 |
|
15.9 |
|
14.1 |
|
Operational measures (7) |
|
|
|
| Statistical operating data |
|
|
|
Gross ton miles (GTMs) (millions) |
452,043 |
|
463,710 |
|
458,401 |
|
Revenue ton miles (RTMs) (millions) |
232,614 |
|
235,788 |
|
233,138 |
|
Carloads (thousands) |
5,436 |
|
5,697 |
|
5,701 |
|
Route miles (includes Canada and the U.S., end of year) |
18,800 |
|
18,600 |
|
19,500 |
|
Employees (end of year) |
24,987 |
|
23,971 |
|
22,604 |
|
Employees (average for the year) |
24,920 |
|
23,396 |
|
24,084 |
|
| Key operating measures |
|
|
|
Freight revenue per RTM (cents) |
6.98 |
|
7.03 |
|
5.96 |
|
Freight revenue per carload ($) |
2,987 |
|
2,908 |
|
2,436 |
|
GTMs per average number of employees (thousands) |
18,140 |
|
19,820 |
|
19,033 |
|
Operating expenses per GTM (cents) |
2.26 |
|
2.21 |
|
1.93 |
|
Labor and fringe benefits expense per GTM (cents) |
0.70 |
|
0.63 |
|
0.63 |
|
Diesel fuel consumed (US gallons in millions) |
395.2 |
|
402.2 |
|
405.2 |
|
Average fuel price ($/US gallon) |
4.62 |
|
5.42 |
|
3.28 |
|
Fuel efficiency (US gallons of locomotive fuel consumed per 1,000 GTMs) |
0.874 |
|
0.867 |
|
0.884 |
|
Train weight (tons) |
9,186 |
|
9,324 |
|
9,658 |
|
Train length (feet) |
7,891 |
|
8,160 |
|
8,559 |
|
Car velocity (car miles per day) |
213 |
|
196 |
|
195 |
|
Through dwell (entire railroad, hours) |
7.0 |
|
7.6 |
|
7.9 |
|
Through network train speed (miles per hour) |
19.8 |
|
18.9 |
|
19.2 |
|
Locomotive utilization (trailing GTMs per total horsepower) |
191 |
|
197 |
|
198 |
|
Safety indicators (8) |
|
|
|
Injury frequency rate (per 200,000 person hours) |
0.96 |
|
1.10 |
|
1.36 |
|
Accident rate (per million train miles) |
1.74 |
|
2.10 |
|
1.84 |
|
(1)Amounts expressed in Canadian dollars and prepared in accordance with United States generally accepted accounting principles (GAAP), unless otherwise noted.
(2)These non-GAAP measures do not have any standardized meaning prescribed by GAAP and therefore, may not be comparable to similar measures presented by other companies.
(3)See the section of this MD&A entitled Non-GAAP measures – Adjusted performance measures for an explanation of these non-GAAP measures.
(4)See the section of this MD&A entitled Liquidity and capital resources – Free cash flow and Adjusted debt-to-adjusted EBITDA multiple for an explanation of these non-GAAP measures.
(5)Operating ratio is defined as operating expenses as a percentage of revenues.
(6)See the section of this MD&A entitled Non-GAAP measures – ROIC and adjusted ROIC for an explanation of these non-GAAP measures.
(7)Statistical operating data, key operating measures and safety indicators are unaudited and based on estimated data available at such time and are subject to change as more complete information becomes available. Definitions of gross ton miles, fuel efficiency, train weight, train length, car velocity, through dwell and through network train speed are included within the Company’s Management’s Discussion and Analysis. Definitions of all other indicators are provided on CN's website, www.cn.ca/glossary.
(8)Based on Federal Railroad Administration (FRA) reporting criteria.
CN | 2023 Annual Report 1
MANAGEMENT'S DISCUSSION AND ANALYSIS
2 CN | 2023 Annual Report
MANAGEMENT'S DISCUSSION AND ANALYSIS
Forward-looking statements
Certain statements included in this MD&A are "forward-looking statements" within the meaning of the United States Private Securities Litigation Reform Act of 1995 and under Canadian securities laws, including statements based on management’s assessment and assumptions and publicly available information with respect to CN. By their nature, forward-looking statements involve risks, uncertainties and assumptions. CN cautions that its assumptions may not materialize and that current economic conditions render such assumptions, although reasonable at the time they were made, subject to greater uncertainty. Forward-looking statements may be identified by the use of terminology such as "believes", "expects", "anticipates", "assumes", "outlook", "plans", "targets" or other similar words.
Forward-looking statements include, but are not limited to, those set forth in the table below, which also presents key assumptions used in determining the forward-looking statements. See also the section of this MD&A entitled 2024 Business outlook and assumptions.
|
|
|
|
|
|
| Forward-looking statements |
Key assumptions |
| Statements relating to revenue growth opportunities, including those referring to general economic and business conditions |
•North American and global economic growth in the long term
•Long-term growth opportunities being less affected by current economic conditions
•No material disruption of CN’s operations or of the economy’s supply chains as a result of pandemics or geopolitical conflicts and tensions
|
| Statements relating to the Company's ability to meet debt repayments and future obligations in the foreseeable future, including income tax payments, and capital spending |
•Adequate credit ratios
•Investment-grade credit ratings
•Access to capital markets
•Adequate cash generated from operations and other sources of financing
|
| Statements relating to pension contributions |
•Adequate cash generated from operations and other sources of financing
•Adequate long-term return on investment on pension plan assets
•Level of funding as determined by actuarial valuations, particularly influenced by discount rates for funding purposes
|
Forward-looking statements are not guarantees of future performance and involve risks, uncertainties and other factors which may cause actual results, performance or achievements of CN to be materially different from the outlook or any future results, performance or achievements implied by such statements. Accordingly, readers are advised not to place undue reliance on forward-looking statements. Important risk factors that could affect the forward-looking statements include, but are not limited to, general economic and business conditions, including factors impacting global supply chains such as pandemics and geopolitical conflicts and tensions; industry competition; inflation, currency and interest rate fluctuations; changes in fuel prices; legislative and/or regulatory developments; compliance with environmental laws and regulations; actions by regulators; increases in maintenance and operating costs; security threats; reliance on technology and related cybersecurity risk; trade restrictions or other changes to international trade arrangements; transportation of hazardous materials; various events which could disrupt operations, including illegal blockades of rail networks, and natural events such as severe weather, droughts, fires, floods and earthquakes; climate change; labor negotiations and disruptions; environmental claims; uncertainties of investigations, proceedings and other types of claims and litigation; risks and liabilities arising from derailments; timing and completion of capital programs; the availability of and cost competitiveness of renewable fuels and the development of new locomotive propulsion technology; reputational risks; supplier concentration; pension funding requirements and volatility; and other risks detailed from time to time in reports filed by CN with securities regulators in Canada and the U.S., including its Annual Information Form and Form 40-F. See the section entitled Business risks of this MD&A for a description of major risk factors relating to CN.
Forward-looking statements reflect information as of the date on which they are made. CN assumes no obligation to update or revise forward-looking statements to reflect future events, changes in circumstances, or changes in beliefs, unless required by applicable securities laws. In the event CN does update any forward-looking statement, no inference should be made that CN will make additional updates with respect to that statement, related matters, or any other forward-looking statement. Information contained on, or accessible through, our website is not incorporated by reference into this MD&A.
CN | 2023 Annual Report 3
MANAGEMENT'S DISCUSSION AND ANALYSIS
Introduction
This Management's Discussion and Analysis (MD&A) dated January 31, 2024, relates to the consolidated financial position and results of operations of Canadian National Railway Company, together with its wholly-owned subsidiaries, collectively "CN" or the "Company," and should be read in conjunction with the Company's 2023 Annual Consolidated Financial Statements and Notes thereto. All financial information reflected herein is expressed in Canadian dollars and prepared in accordance with United States generally accepted accounting principles (GAAP), unless otherwise noted.
CN's common shares are listed on the Toronto and New York stock exchanges. Additional information about CN filed with Canadian securities regulatory authorities and the United States Securities and Exchange Commission (SEC), including the Company's 2023 Annual Information Form and Form 40-F, may be found online on SEDAR+ at www.sedarplus.ca, on the SEC's website at www.sec.gov through EDGAR, and on the Company's website at www.cn.ca in the Investors section. Printed copies of such documents may be obtained by contacting CN's Corporate Secretary's Office.
Business profile
CN is engaged in the rail and related transportation business. CN's network of 18,800 route miles of track spans Canada and the United States of America (U.S.), connecting Canada's Eastern and Western coasts with the U.S. South. CN's extensive network and efficient connections to all Class I railroads provide CN customers access to Canada, the U.S. and Mexico. Essential to the economy, to the customers, and to the communities it serves, CN safely transports more than 300 million tons of cargo annually, serving exporters, importers, retailers, farmers and manufacturers. CN and its affiliates have been contributing to community prosperity and sustainable trade since 1919. CN is committed to programs supporting social responsibility and environmental stewardship.
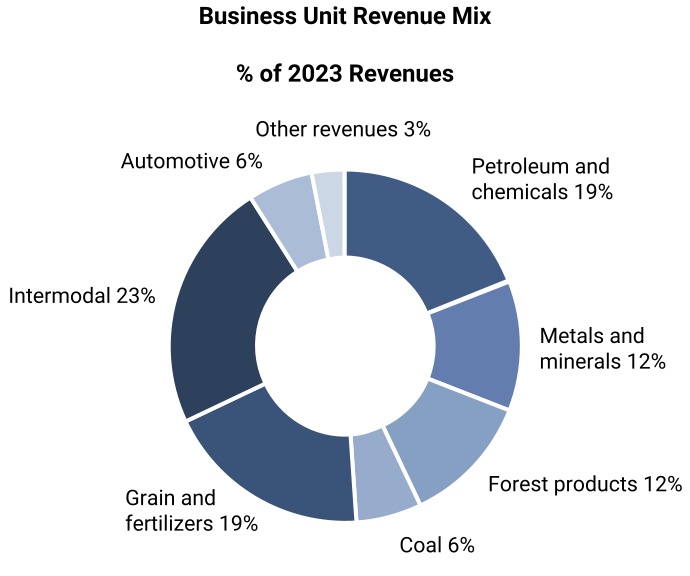
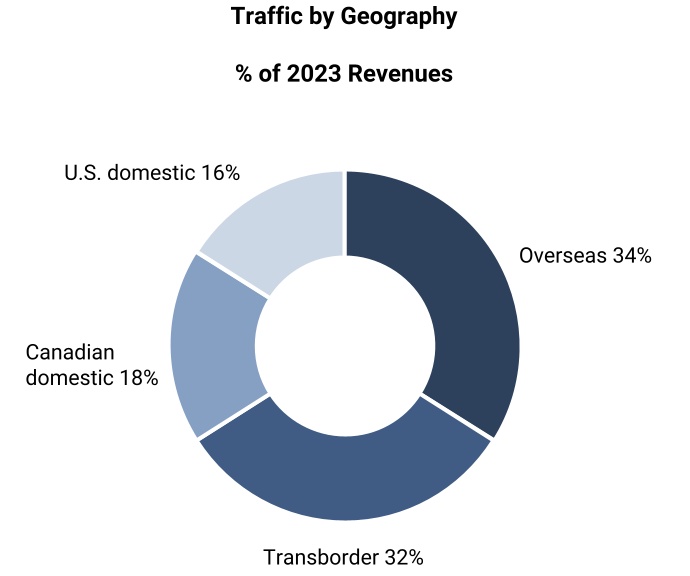
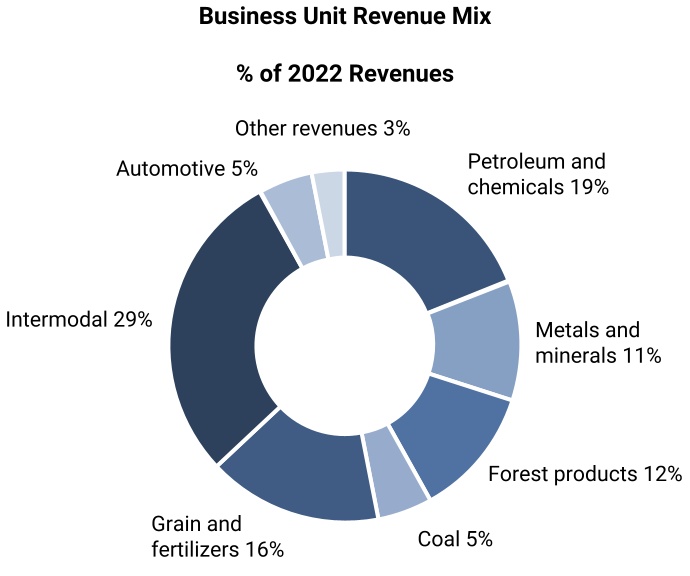
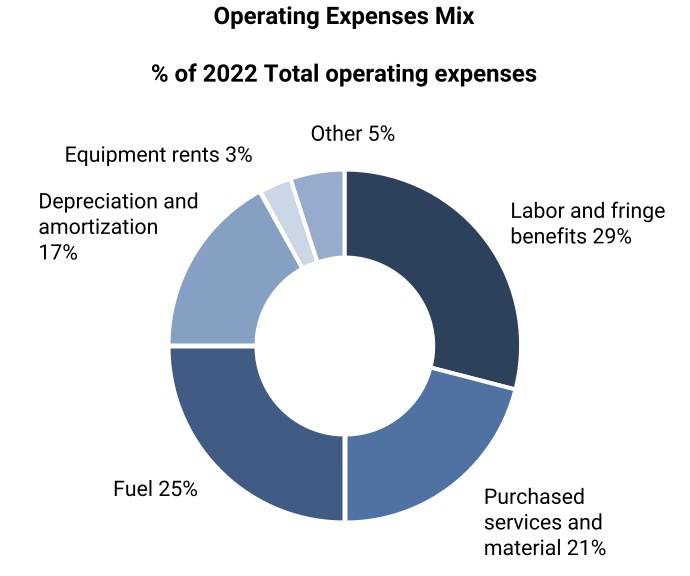
CN's freight revenues are derived from seven commodity groups representing a diversified and balanced portfolio of goods transported between a wide range of origins and destinations. This product and geographic diversity better position the Company to face economic fluctuations and enhances its potential for growth opportunities. For the year ended December 31, 2023, CN's largest commodity group, Intermodal, accounted for 23% of total revenues. From a geographic standpoint, 34% of revenues relate to overseas traffic, 32% to transborder traffic, 18% to Canadian domestic traffic and 16% to U.S. domestic traffic. The Company is the originating carrier for over 85%, and the originating and terminating carrier for over 65%, of traffic moving along its network, which allows it both to capitalize on service advantages and build on opportunities to efficiently use assets.
4 CN | 2023 Annual Report
MANAGEMENT'S DISCUSSION AND ANALYSIS
Corporate organization
The Company manages its rail operations in Canada and the U.S. as one business segment. Financial information reported at this level, such as revenues, operating income and cash flow from operations, is used by the Company's corporate management in evaluating financial and operational performance and allocating resources across CN's network. The Company's strategic initiatives are developed and managed centrally by corporate management and are communicated to its regional activity centers (the Western Region, Eastern Region and U.S. Region), whose role is to manage the day-to-day service requirements of their respective territories, control direct costs incurred locally, and execute the strategy and operating plan established by corporate management.
See Note 24 – Segmented information to the Company's 2023 Annual Consolidated Financial Statements for additional information on the Company's corporate organization, as well as selected financial information by geographic area.
2023 Highlights
Financial results - 2023 compared to 2022
•Revenues of $16,828 million, a decrease of $279 million, or 2%.
•Operating income of $6,597 million, a decrease of $243 million, or 4%.
•Operating ratio, defined as operating expenses as a percentage of revenues, of 60.8%, an increase of 0.8 points, or an increase of 0.9 points on an adjusted basis. (1)(2)
•Net income of $5,625 million, an increase of $507 million, or 10% and adjusted net income of $4,800 million, a decrease of $334 million, or 7%. (1)(2)
•Diluted earnings per share (EPS) of $8.53, an increase of 15% and adjusted diluted EPS of $7.28, a decrease of 2%. (1)(2)
•The Company generated free cash flow of $3,887 million, a 9% decrease. (1)(3)
•ROIC of 16.8%, an increase of 1.0-point and adjusted ROIC of 14.5%, a decrease of 1.4 points. (1)(4)
Operating performance - 2023 compared to 2022
•Injury frequency rate at a record low of 0.96 (per 200,000 person hours), an improvement of 13%.
•Accident rate of 1.74 (per million train miles), an improvement of 17%.
•Through dwell of 7.0 (entire railroad, hours), an improvement of 8%.
•Car velocity of 213 (car miles per day), an improvement of 9%.
•Through network train speed of 19.8 (mph), an improvement of 5%.
•Fuel efficiency of 0.874 (US gallons of locomotive fuel consumed per 1,000 gross ton miles (GTMs)), less efficient by 1%.
•Train length of 7,891 (feet), a decrease of 3%.
•Revenue ton miles (RTMs) of 232,614 (millions), a decrease of 1%.
(1) These non-GAAP measures do not have any standardized meaning prescribed by GAAP and therefore, may not be comparable to similar measures presented by other companies.
(2) See the section of this MD&A entitled Non-GAAP measures – Adjusted performance measures for an explanation of these non-GAAP measures.
(3) See the section of this MD&A entitled Liquidity and capital resources – Free cash flow for an explanation of this non-GAAP measure.
(4) See the section of this MD&A entitled Non-GAAP measures – ROIC and adjusted ROIC for an explanation of these non-GAAP measures.
2023 Financial outlook
During the year, the Company issued and updated its 2023 financial outlook. The 2023 actual results were in line with the Company's last 2023 outlook that was updated on July 25, 2023.
Recent developments
Business acquisitions and combinations
Iowa Northern Railway Company
On December 6, 2023, the Company acquired the shares of the Iowa Northern Railway Company (IANR), a Class III short-line railroad that owns and leases approximately 175 route miles in northeast Iowa that are connected to CN’s U.S. rail network. CN paid US$230 million ($312 million), including transaction costs to date. IANR serves upper Midwest agricultural and industrial markets covering many goods, including biofuels and
CN | 2023 Annual Report 5
MANAGEMENT'S DISCUSSION AND ANALYSIS
grain. This transaction represents a meaningful opportunity to support the growth of local business by creating single-line service to North American destinations, while preserving access to existing carrier options.
The shares of IANR were deposited into an independent voting trust while the U.S Surface Transportation Board (STB) considers the Company's application to acquire control of IANR. During the trust period, IANR will continue to be operated under its current management and the Company cannot exercise day-to-day control. As a result, the Company recorded its investment in IANR at its acquisition cost under the equity method of accounting. Subject to final approval by the STB, the Company would obtain control of IANR and would account for the acquisition as a business combination under the acquisition method of accounting.
On the acquisition date of December 6, 2023, immediately prior to the acquisition, there was a basis difference of $236 million between the consideration paid to acquire IANR and the underlying carrying value of the net assets of IANR. The basis difference related to depreciable properties and if any, intangible assets with definite lives will be amortized over the related assets' remaining useful lives. The remainder of the basis difference, relating to land, intangible assets with indefinite lives if any, and equity method goodwill, would not be amortized and would be carried at cost subject to an assessment for impairment. The estimated fair value of IANR’s underlying net assets is preliminary based on information available to the Company to date and subject to change over the measurement period, which may be up to twelve months from the acquisition date.
Cape Breton & Central Nova Scotia Railway
On November 1, 2023, the Company acquired from Genesee & Wyoming Inc. a stake in the Cape Breton & Central Nova Scotia Railway (CBNS), a Class III short-line railroad that owns approximately 150 route miles. CN paid $78 million in cash, net of cash acquired and including working capital adjustments. The acquisition was accounted for as a business combination. As a result, the Company’s Consolidated Balance Sheet includes the net assets of CBNS as of November 1, 2023, which were comprised of $101 million in fair value of properties mostly track and roadway assets, partly offset by $18 million in deferred tax liabilities. The remaining net assets were comprised of current assets and liabilities which were individually insignificant and there were no identifiable intangible assets. No goodwill was recognized. The fair value of CBNS's underlying net assets has been estimated on a preliminary basis and may be subject to change as additional information becomes available over the next twelve months.
Canadian regulatory update
On June 22, 2023, Bill C-47 an Act to implement certain provisions of the budget tabled in Parliament on March 28, 2023, received Royal Assent and the proposed amendments to the Canada Transportation Act were adopted. These amendments provide for the extension of the interswitching limits located in the Prairie provinces from 30 kilometers to 160 kilometers. This extension will be in force for a trial period of 18 months. On November 24, 2023 the Canadian Transportation Agency (CTA) established interswitching rates for 2024. On December 22, 2023, the Company sought leave to appeal this decision on rates. No assurance can be given that these and any other current or future regulatory or legislative initiatives by the Canadian federal government and agencies will not materially adversely affect the Company's results of operations or its competitive and financial position.
U.S. regulatory update
On September 7, 2023, the STB proposed new regulations for reciprocal switching for inadequate service. Under the STB’s proposal, the new rule allows customers to obtain reciprocal switching access to an alternate carrier in a terminal area if the incumbent railroad’s service falls below one of three objective metrics (original estimated time of arrival, transit time, and first-mile/last-mile service) and if certain other conditions are met. The STB has proposed that if a reciprocal switch were granted for a facility in the United States, that switch would be available for a period between two to four years and could be renewed. In addition, the STB also closed consideration of a 2016 proposal to amend its existing regulations for reciprocal switching to increase competition, which was the subject of a public hearing in 2022. Comments were submitted in November and December 2023, and the STB members conducted meetings with stakeholders. No assurance can be given that these and any other current or future regulatory or legislative initiatives by the U.S. federal government and agencies will not materially adversely affect the Company's results of operations or its competitive and financial position.
Labor workforce and negotiations - Canada
On May 1, 2023, the collective agreement with Unifor was ratified by its members, renewing the collective agreement for a two-year term, retroactive to January 1, 2023, which will expire on December 31, 2024. Unifor represents approximately 3,400 employees in Canada working in various departments such as Mechanical, Intermodal, Facility Management, and in clerical positions.
6 CN | 2023 Annual Report
MANAGEMENT'S DISCUSSION AND ANALYSIS
On May 26, 2023, the collective agreement with Teamsters Canada Rail Conference (TCRC) was ratified by its members, renewing the collective agreement for a one-year term, retroactive to January 1, 2023, which expired on December 31, 2023. TCRC represents approximately 6,000 employees in Canada working as Locomotive Engineers, Yard Coordinators and Yard Conductors on our mainline, short lines and yards. Bargaining commenced on November 27, 2023.
On September 6, 2023, the United Steel Workers Union (USW) served notice to commence bargaining for the renewal of the collective agreement with the Company, governing approximately 2,500 bridge and structures and work equipment employees in Canada, which expired on December 31, 2023. Bargaining commenced on October 23, 2023.
On January 17, 2024, CN reached a tentative agreement with owner-operators affiliated with Unifor. The four-year agreement covers approximately 750 owner-operator truck drivers in Canada under contract with Canadian National Transportation Limited, a wholly owned subsidiary of the Company, until December 31, 2027. Ratification by the membership is expected in the first quarter of 2024.
The Company’s collective agreements remain in effect until the bargaining process outlined under the Canada Labor Code has been exhausted.
Leadership changes
On January 8, 2024, CN announced that Remi G. Lalonde was appointed as CN’s Executive Vice-President and Special Advisor to the CEO, in anticipation of his transition to the role of Executive Vice-President and Chief Commercial Officer (CCO). Mr. Lalonde will succeed Doug MacDonald, Executive Vice-President and Chief Marketing Officer, who will remain in his current role until Mr. Lalonde’s transition is completed later this year.
On October 18, 2023, CN announced that Patrick Whitehead was appointed as CN’s Executive Vice-President and Chief Network Operating Officer and Derek Taylor was appointed as CN’s Executive Vice-President and Chief Field Operating Officer effective November 15, 2023. Mr. Whitehead and Mr. Taylor succeed Edmond (Ed) Harris who has taken on a consultant role until March 31, 2024 to ensure a seamless transition.
Future value creation
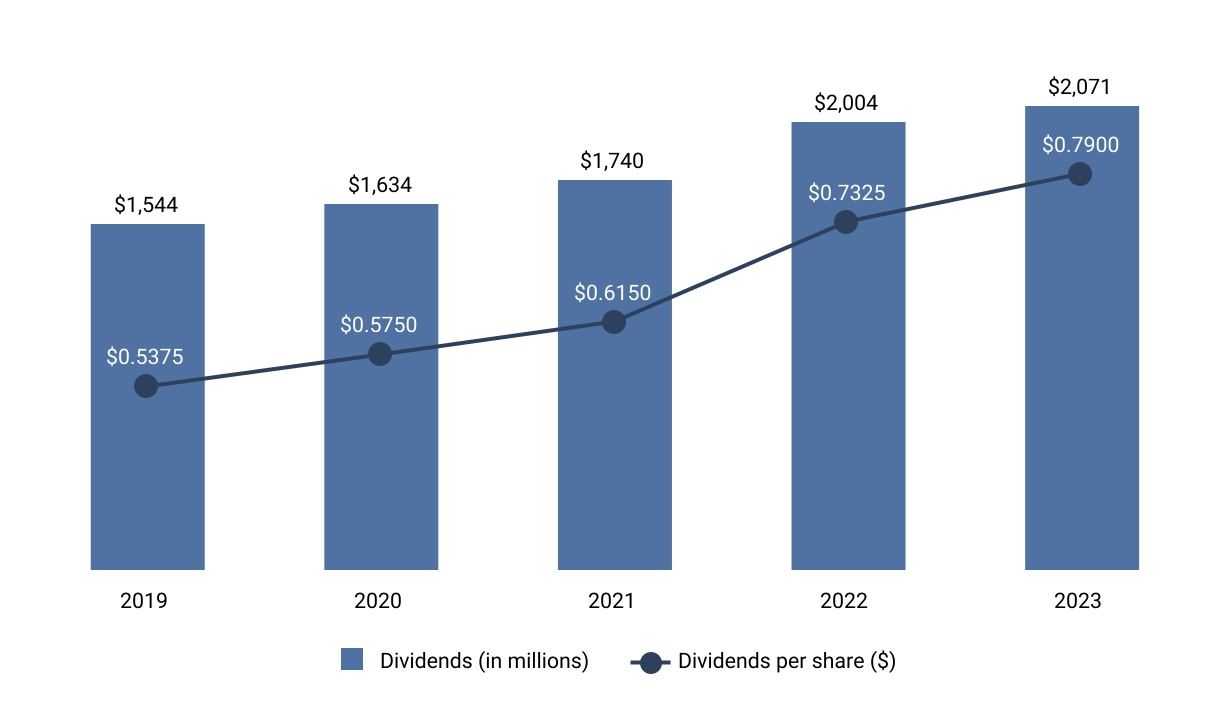
On January 23, 2024, the Company's Board of Directors approved a new Normal Course Issuer Bid (NCIB) that allows for the repurchase of up to 32.0 million common shares between February 1, 2024 and January 31, 2025. In addition, on that same day, the Company's Board of Directors approved an increase of 7% to the quarterly dividend to common shareholders, from $0.7900 per share in 2023 to $0.8450 per share in 2024, effective for the first quarter.
2024 Business outlook and assumptions
The Company assumes slightly positive North American industrial production in 2024. For the 2023/2024 crop year, the grain crop in Canada was below its three-year average (also below when excluding the significantly lower 2021/2022 crop year) and the U.S. grain crop was above its three-year average. The Company assumes that the 2024/2025 grain crop in Canada will be in line with its three-year average (excluding the significantly lower 2021/2022 crop year) and the U.S. grain crop will also be in line with its three-year average.
In 2024, the Company expects to invest approximately $3.5 billion in its capital program, net of amounts reimbursed by customers, to improve the safety, efficiency and integrity of its network. These investments are intended to also enable and support the growth of the Company and will be financed with cash generated from operations or with cash from financing activities.
The forward-looking statements discussed in this section are subject to risks and uncertainties that could cause actual results or performance to differ materially from those expressed or implied in such statements and are based on certain factors and assumptions which the Company considers reasonable about events, developments, prospects and opportunities that may not materialize or that may be offset entirely or partially by other events and developments. In addition to the assumptions and expectations discussed in this section, reference should be made to the section of this MD&A entitled Forward-looking statements for assumptions and risk factors affecting such statements.
CN | 2023 Annual Report 7
MANAGEMENT'S DISCUSSION AND ANALYSIS
Strategy overview
CN’s purpose is to power the economy by enabling global supply chains and moving goods sustainably and efficiently, working together with our customers, our people, and the communities in which we operate. CN is committed to delivering a safe, consistent and reliable scheduled service that creates value for customers, shareholders and stakeholders. In 2023, CN continued its “back to basics” approach, re-establishing a disciplined scheduled operation. CN’s “make the plan, run the plan, sell the plan” operating approach has driven strong operational, safety, and customer service outcomes.
CN aims to drive consistent shareholder returns and earnings growth by striving for sustainable financial performance, including profitable top-line growth, strong free cash flow generation and return on invested capital well above the Company’s cost of capital. CN also returns value to shareholders through dividend payments and share repurchases.
Build service excellence, grow our business and invest in our people
Going forward, CN will continue to focus on sustaining and building service excellence, growing the business and developing our people. Providing reliable and efficient customer service is the foundation for growth. CN aims to leverage its strong customer service and operating efficiency of rail to grow the business profitably. CN continues to invest in the safety and fluidity of the network, and in increasing capacity to cost effectively grow volumes. CN is also investing to drive incremental fuel and carbon efficiency and to improve network resiliency. Critical to CN’s long-term success are also the people investments being made to ensure the optimal workforce, with the right skills and leadership capabilities, are available to meet the challenges of tomorrow.
Delivering Responsibly
Sustainability is at the heart of how CN is building for the future. Delivering Responsibly is the encapsulation of the Company’s sustainability strategy and commitments. The Company is focused on transporting goods safely and efficiently, doing so in a manner that seeks to minimize the impact on the environment, attracting, retaining and engaging top talent, and helping to build stronger, safer communities, while adhering to the highest governance standards. CN understands that transparency is essential for stakeholder trust concerning the Company’s Environmental, Social and Governance (ESG) commitments. In that regard, CN seeks to align its ESG disclosures with global best practice frameworks, reporting on commitments and performance with focus, clarity and comparability. In 2023, CN published its latest biennial sustainability report, outlining the Company's targets, programs and achievements in corporate governance, environment, safety, people, community involvement and stakeholder engagement. CN is proud of its 2023 accomplishments as the Company's sustainability practices earned it a place on the Dow Jones Sustainability World and North American Indices, for the 12th and 15th consecutive year, respectively.
Safety is a core value
CN is committed to the health and safety of its employees, the communities and environments in which it operates and the customers it serves. The Company embraces a values-based safety culture. CN’s objective is to reduce serious injuries and fatalities. The Company is employing advanced technologies and innovative training to help achieve this goal. More specifically, CN is:
•Fostering an engaged workforce that understands and respects Life Critical Rules.
•Embedding a mindset whereby employees take ownership for their own safety and the safety of others by Looking Out for Each Other.
•Training employees to identify and mitigate exposures.
•Using advanced technologies to proactively mitigate human error and reduce risk.
•Maintaining reliable and safe equipment and infrastructure.
•Investing in employee training, coaching, recognition and engagement initiatives.
See the section of this MD&A entitled Human capital management - Health and safety for additional information regarding CN's safety initiatives.
Tackling the impact of climate change
The Company's goal is to conduct its operations in a way that seeks to minimize environmental impact, while offering a carbon-efficient and sustainable way to move goods. CN is focused on making a positive contribution in the fight against climate change and playing a key role in the transition to a lower-carbon economy.
8 CN | 2023 Annual Report
MANAGEMENT'S DISCUSSION AND ANALYSIS
With approximately 85% of its direct greenhouse gas (GHG) emissions generated from rail operations, CN focuses on five key strategic areas: fleet renewal, innovative technology, big data, operating practices and cleaner fuels. Over the years, this focus has resulted in significant progress in decoupling volume growth from carbon emissions intensity. CN continues to maintain its leadership position among Class I North American railways, generating approximately 15% less locomotive GHG emissions per gross ton mile than the industry average. CN was also the first North American railway, and among the first 100 companies globally, to announce an approved science-based climate target. CN aims to reduce GHG emissions in line with the Paris Agreement and in 2021, committed to setting a net-zero target by joining the "Business Ambition for 1.5 °C" and the United Nations' "Race to Zero" campaign.
To achieve its decarbonization targets, CN will need to continue improving the fuel efficiency of its fleets, increase its use of sustainable renewable fuels and test, and eventually deploy alternative propulsion locomotive technologies. Collaboration with suppliers, customers, supply chain partners, innovators and regulators is critical for CN to deliver on its climate commitments and to help drive economic prosperity in a lower-carbon emissions environment.
The Company's CDP Report, including a Task Force on Climate-related Financial Disclosures (TCFD) index, is available on CN's website in the Delivering Responsibly section. Information contained on, or accessible through, our website is not incorporated by reference into this MD&A.
Building the talent and culture to drive CN's continuous performance
CN people have always been the Company's most important differentiator, caring passionately about railroading and bringing optimism, commitment and resilience to daily tasks. CN aims to attract, develop, and retain the very best talent, with a focus on a diverse and inclusive work environment where employees are engaged, inspired and motivated. CN trains its employees with the necessary skills for an increasingly automated and data-driven work environment.
See the section of this MD&A entitled Human capital management for additional information regarding CN's human capital initiatives.
Community engagement
At CN, we are committed to being good neighbors who listen, learn, and do our part to help build safer, stronger, more prosperous communities. Connecting Canada’s Eastern and Western coasts with the U.S. Gulf Coast, CN spans eight provinces, 16 states, and operates within or adjacent to nearly 230 reserve lands of more than 120 First Nations and Métis communities in Canada, seven Tribal communities in the United States, and more than 2,000 towns and cities across its network. CN plays an essential role and contributes to economic prosperity through job creation, investments and freight transportation services. The Company seeks open and proactive engagement to ensure stakeholders and Indigenous communities are aware of its strategy, operations, opportunities and obligations, and aims to foster effective two-way communications that ensures a respectful and beneficial exchange.
CN also partners with communities to enhance railway safety. Under CN's structured Community Engagement program, the Company engages with municipal officers and their emergency responders to assist them in their emergency response planning. During this frequent outreach, CN discusses its comprehensive safety programs and performance, the nature, volume and economic importance of dangerous goods it transports through their communities and emergency response planning. CN annually conducts hundreds of training events for thousands of emergency responders, totaling over 130,000 first responders since 1988. Additional training sites have been constructed to offer onsite full scale dangerous goods training.
The outreach builds on CN's involvement in Transportation Community Awareness and Emergency Response (TRANSCAER®), through which the Company has been working for many years to help communities in Canada and the U.S. understand the movement of hazardous materials and what is required in the event of transportation incidents. All Aboard for Safety is CN’s flagship community education program. Every year, CN employees make hundreds of presentations and talk to thousands of children and adults at schools and community events in Canada and the U.S. about the importance of rail safety and the dangers of walking or playing on or near railway tracks.
As part of CN’s year‑round outreach effort, the CN Police Service continues to be active in communities across the CN network to promote safe behavior around railroad infrastructure. Activities include conducting enforcement initiatives with external agencies and delivering safety presentations to high‑risk groups. During the industry’s annual Rail Safety Week campaign, CN police officers and other employees, in partnership with Operation Lifesaver®, participate in numerous safety initiatives to raise awareness about preventing accidents and injuries around railway property.
CN | 2023 Annual Report 9
MANAGEMENT'S DISCUSSION AND ANALYSIS
CN believes another way to help build more sustainable communities is to actively contribute financially through its CN Stronger Communities Fund to organizations, programs and initiatives that promote diversity and inclusion, innovation and safety, education, environmental protection, and many other causes such as food banks, homeless shelters, domestic violence shelters, healthcare centers, and anti-poverty organizations.
CN is proud of its employees, retirees and their families who volunteer to make their communities better places to live, work and play. The CN Railroaders in the Community program recognizes these acts of kindness by providing grants to the community‑based not‑for‑profit organizations employees (current, retired or family) choose to support through their volunteer efforts. CN also encourages employee community involvement through its annual volunteer CN In Your Community Day.
Working alongside Indigenous communities, CN makes it a priority to strengthen its ties, cultivate respectful and mutually beneficial relationships, and work toward reconciliation. CN continues to engage in open dialogue with Indigenous communities, identify and foster business opportunities, increase our employees’ awareness and understanding of Indigenous culture, and enhance its ability to attract Indigenous talent. CN provides awareness training on Indigenous culture, beliefs, and history to its employees to foster an inclusive work environment. Since the program began in 2014, more than 24,000 employees have completed the training.
Disciplined capital allocation and execution
CN's success depends on a steady stream of capital investments that are aligned with and support its business strategy. These investments cover a wide range of areas, from track infrastructure and rolling stock to information and operating technologies, as well as other equipment and assets that are intended to improve the safety, efficiency, capacity and reliability of CN's service offering. Investments in track infrastructure are designed to enhance the safety and integrity of the physical plant, increase the capacity and fluidity of the network, promote service excellence, and support growth. New locomotives equipped with distributed power capability increase capacity, fuel and carbon productivity and efficiency, and improve service reliability, particularly in cold weather, while improving train handling and safety. Targeted railcar acquisitions aim to tap growth opportunities, complementing the fleet of privately owned railcars that traverse CN's network. CN is also investing in and deploying advanced technologies to automate labor-intensive tasks like track and railcar inspections, as well as to improve the customer experience through ‘track and trace’ functionality. CN's long-term economic viability depends on the presence of a supportive regulatory and government policy environment that encourages investment and innovation.
The multi-year implementation of CN’s strategic plan requires a disciplined, analysis-driven approach to capital investment. Talent, technology and capital need to be fully aligned. The Company’s capital investment roadmap includes several core elements:
•Investing in the maintenance of a safe and reliable network.
•Investing in asset infrastructure to increase the capacity of its three-coast network.
•Developing a portfolio approach to technology with business-led investment decisions, delivering value at each stage of implementation.
•Deepening supply chain partnerships with its customers, including road-to-rail conversion.
•Investing in data analytic systems, including artificial intelligence (AI), to support data-driven decision-making.
•Investing in technologies and capital assets to support decarbonization of its footprint.
•Growing its physical and commercial reach through strategic partnerships and acquisitions.
Human capital management
CN's ability to develop the best railroaders in the industry has been a key contributor to the Company's success. CN recognizes that without the right people, no matter how good a service plan or business model a company may have, it will not be able to fully execute. The Company continues to focus on hiring the right people, onboarding them successfully, helping them build positive relationships with their colleagues and supporting all employees to grow and develop, while deepening its commitment to develop talent and plan for the future.
10 CN | 2023 Annual Report
MANAGEMENT'S DISCUSSION AND ANALYSIS
Governance
CN’s Senior Vice President and Chief Human Resources Officer has leadership accountability for the Company’s workforce policies and programs and reports directly to the CEO. CN’s Board and its committees, including the Governance, Sustainability and Safety Committee and Human Resources and Compensation Committee (HRCC) provide oversight of the Company's human capital management strategies, programs, practices and performance. The HRCC is responsible for monitoring executive management’s performance assessment, compensation and succession planning as well as ensuring effective talent management and monitoring union relations and strategy for consistency with CN’s strategic direction. The HRCC also has the mandate to review human resources practices and policies by ensuring, amongst other things, that appropriate human resources programs, practices and systems are in place so that the Company can attract, motivate and retain the quality and diversity of employees required to meet its business objectives. The Company’s senior management provides regular briefings on human capital matters to the Board and its committees to facilitate oversight.
The Board of Directors and management are committed to maintaining and instilling a strong ethical culture at CN, and as such, have developed a solid ethics program based on CN’s core values of integrity and respect. Each director, executive officer and management employee must certify annually their compliance with the Code of Business Conduct and employees are required to complete an online training course on the Code of Business Conduct. Integrity training is also part of every new employee’s onboarding program. In addition, Anti-Fraud Policy and Guidelines apply to all employees of CN and its wholly owned subsidiaries and set out steps to be taken in response to reported or suspected fraud in all its forms, as well as measures that are taken to identify, prevent and manage fraud-related risks.
Total employees
As at December 31, 2023, CN employed a total of 18,162 employees in Canada (2022 – 17,392), of which 13,346, or 73%, were unionized employees (2022 – 12,841, or 74%) and 6,825 employees in the U.S. (2022 – 6,579) of which 5,786, or 85%, were unionized employees (2022 – 5,571, or 85%).
Canadian workforce
As of January 31, 2024, three of the eight collective agreements in Canada are open for negotiation. See the section of this MD&A entitled 2023 Highlights - Recent developments for additional information regarding labor negotiations. The Company’s collective agreements remain in effect until the bargaining process outlined under the Canada Labor Code has been exhausted.
U.S. workforce
As of January 31, 2024, collective agreements covering all non-operating and operating craft employees at Grand Trunk Western Railroad Company (GTW), companies owned by Illinois Central Corporation (ICC), companies owned by Wisconsin Central Ltd. (WC) and Bessemer & Lake Erie Railroad Company (BLE), and all employees at Pittsburgh and Conneaut Dock Company (PCD) were ratified and remain in place. The agreements in place have various moratorium provisions, which preserve the status quo with respect to the given collective agreement during the terms of such moratoriums. Where negotiations are ongoing, the terms and conditions of existing agreements generally continue to apply until new agreements are reached or the processes of the Railway Labor Act have been exhausted. The general approach to labor negotiations by U.S. Class I railroads is to bargain on a collective national basis with the industry, which GTW, ICC, WC and BLE currently participate in, for collective bargaining agreements covering all union-represented employees.
Health and safety
CN has an uncompromising commitment to the health and safety of its employees, the customers it serves, and the communities and environments in which it operates. The Company's long-term safety improvement is driven by continued investments in infrastructure, rigorous safety processes and exposure reduction efforts, as well as efforts to continue deepening the Company’s safety culture. The attainment of annual accident and injury targets is a component of management’s annual incentive bonus plan. The Company’s injury frequency rate and accident rate, defined according to the criteria of the Federal Railroad Administration (FRA), are provided for the entire company’s operations and are publicly disclosed on a quarterly basis. See the section of this MD&A entitled Selected railroad statistics for additional information on CN’s safety measures.
CN’s culture and commitment to safety is supported by its focus on training, leadership, and technology. CN's Safety Management System is the framework for putting safety at the center of its day-to-day operations. This proactive plan is designed to minimize risk, drive continuous improvement in the reduction of injuries and accidents, and engage employees at all levels of the organization.
CN | 2023 Annual Report 11
MANAGEMENT'S DISCUSSION AND ANALYSIS
The Looking Out For Each Other peer-to-peer engagement program focuses on raising awareness among all employees of the top causes of incidents and injuries, identifying and reviewing safe work procedures, training employees to be aware of their surroundings and recognize potential at-risk work practices, teaching employees how to provide constructive feedback to their peers and learning from past incidents. The Company's Life Critical Rules address the day-to-day activities that have the potential to cause serious harm or even loss of life. They are based on past incidents and are designed to help ensure they do not happen again. CN's safety leadership training program is heavily focused on teaching employees the importance of controlling exposures to risk and on developing the attitudes and behaviors required for a values-driven safety culture.
CN also continues to leverage new technology to drive improved safety performance including installing powerful sensor and AI technology into specially equipped autonomous track inspection cars positioned in existing train service, enabling track inspections at normal track speed. AI technology is also enhancing how CN inspects its railcar fleet. Automated inspection portals feature ultra-high-definition cameras that capture a 360° view of a train as it travels through at track speed. Both these innovations in automation increase inspection frequency and quality and play an important role in preventing incidents. CN has also implemented Electronic Track Authority Verification (ETAV), a geospatial navigation aid application that improves safety by leveraging precise location information to warn track maintenance vehicle operators of approaching or exceeded limits of Track Authority (TA).
CN strives for continuous improvement in our environmental, health, safety, and security (EHS&S) performance and is proud to be a long-standing Responsible Care® Partner. Triennially, CN undergoes a Responsible Care® audit conducted by an external audit team to ensure CN’s processes, programs and policies meet the rigorous Responsible Care® Management System Specifications, Guiding Principles and Stewardship Codes.
CN works closely with all of its customers and suppliers to ensure adherence to Life Critical Rules where applicable, and to encourage a shared commitment to a values-based safety culture.
Talent management
Attraction and recruitment
CN continues to align its talent strategies to the business objectives, by focusing on acquiring as well as developing the various skills and capabilities required to meet its commitments, address challenges, and ensure a solid bench of talent to mitigate risk. CN recruits and hires talent with a broad range of strengths, perspectives and experiences, while also engaging with partners across our network, including Indigenous and other equity-seeking groups to ensure CN reflects the communities it crosses. Over the last year, similar to other organizations, CN has had to compete extensively to attract talent, however its refreshed early career strategy with partner universities and its community engagement and partnerships with diversity organizations across Canada and the U.S., has helped create strong visibility of our jobs and opportunities.
Once again in 2023, CN was recognized as one of Canada’s Top 100 Employers and Montreal’s Top Employers and also listed as one of Canada’s best Diversity Employers by Mediacorp Canada Inc.
Training and development
CN offers a variety of training programs, which cover regulatory or CN mandated requirements or are part of an employee's learning journey and development. This ensures that its employees are equipped to perform in their roles and prepare for career advancement opportunities, as required.
The Company offers trainings in technical, business and leadership programs, with either online, e-learning or virtually-led courses, and, when possible, through in-person sessions. People leaders are supported in building the skills and knowledge needed to successfully perform at each level and this includes a focus on enhancing communication skills, increasing collaboration across teams and creating a strong base of inclusive leadership throughout our workforce. In 2023, CN continued to provide an expanded offering of online and curated playlists/curricula for more self-guided and self-paced learning to allow for development tools to be available throughout the year and to be self-directed by the employee, when it is most convenient. For the Operations group, CN has various entry-level supervisory programs, to onboard front-line management with a focus on providing those leaders with an understanding of railway operations, safety leadership, people leadership and a perspective on customer service. Furthermore, CN also supports its employees through a structured performance management process. At the beginning of each year, non-unionized employees set goals for the year that align to its business strategy and objectives. At mid and year-end, there is a formal discussion and review of progress against these goals as well as how they were achieved. CN continues to emphasize the
12 CN | 2023 Annual Report
MANAGEMENT'S DISCUSSION AND ANALYSIS
importance of a performance-based culture. In 2023, CN also introduced development planning tools and launched the “Aspire to develop yourself” campaign where the Company encourages and equips our employees to own their career and build actionable development plans for growth. In addition, there are also development discussions with key talent to enhance skills, capabilities and experience across the talent pools.
Compensation
CN’s approach to compensation continues to be driven by our goal to deliver sustainable value creation, while ensuring that target compensation supports the attraction and retention of talent. Compensation programs are designed to encourage appropriate behaviors and include appropriate risk mitigation mechanisms. In addition, compensation best practices adopted by CN include industry benchmarking and pay positioning as well as pay equity reviews.
CN offers a competitive compensation portfolio that consists of base salary, employee share investment plan, short-term and long-term incentives (applicable to certain employees only), benefits, retirement plans and other non-monetary elements.
Diversity, Equity and Inclusion (DE&I)
At CN, employees are the Company's single greatest asset and the importance of creating a work environment that welcomes the contribution and uniqueness of every employee is recognized. CN is committed to creating a workforce of top talent that reflects the diversity of the population and stakeholders it serves. The Diversity, Equity and Inclusion Plan ("Diversity Plan") focuses on developing a more inclusive workplace by increasing the representation of women, people of color, Indigenous peoples, persons with disabilities and veterans. The plan applies at all levels within the organization and includes strategies on sourcing (among others, early career sourcing through internships, co-op and new graduate programs), selection, hiring, training and development of diverse candidates, anchoring CN’s commitment to Diversity, Equity and Inclusion (DE&I).
The Company has embedded diversity in its policy regarding composition of the Board and executive management. The Diversity Policy, which also applies to executive management, states that in fulfilling its oversight role, the HRCC regularly reviews CN’s integrated approach to executive and high-potential talent management and succession planning, in order to ensure that CN has diverse candidate pools for potential successors for executive roles.
CN is undertaking various initiatives aimed at better promoting and reinforcing diversity, equity and inclusion which are strongly supported through active involvement by management and the Board. Some examples include:
•building on established DE&I fundamentals by conducting a DE&I diagnostic and creating a revised multi-year DE&I strategy and vision;
•running regular reviews of pay equity and defining a roadmap to address identified gaps;
•refocusing our sponsorships and donations budget to better align with our strategic DE&I vision;
•continually assessing hiring practices to leverage diversity focused recruitment agencies and requiring diverse candidate slates for all recruitment mandates;
•developing inclusive leaders through targeted training and education, including unconscious bias and inclusive leadership training, as leaders will be critical in creating and sustaining an inclusive environment;
•continuing to support and leverage the Employee Resource Groups (ERGs) that are backed by executive sponsors (currently eight ERGs); and
•having sufficient resources to support our DE&I vision.
In January 2024 CN established that moving forward it aspires to maintain a Board composition in which independent Board members are comprised of at least 40% of each gender (male and female) and at least two members come from the broader underrepresented groups, beyond gender. Currently, five out of 10, or 50% of independent Board members are women and two, or 20% of independent Board members are from underrepresented groups. CN has also elected to revise the gender diversity target for executive management (comprising all Vice-Presidents and more senior positions), whereby by the end of 2027, and thereafter, CN aspires to maintain an executive management team in which at least 35% of this group are women. As at December 31, 2023 27%, or eight of the 30 executive management roles, were held by women.
CN | 2023 Annual Report 13
MANAGEMENT'S DISCUSSION AND ANALYSIS
Financial highlights
|
|
|
|
|
|
|
|
|
|
|
|
|
|
|
|
|
|
|
|
|
|
% Change |
|
|
|
|
Favorable/(Unfavorable) |
| In millions, except percentage and per share data |
2023 |
|
2022 |
|
2021 |
|
2023 vs 2022 |
2022 vs 2021 |
| Revenues |
$ |
16,828 |
|
$ |
17,107 |
|
$ |
14,477 |
|
(2 |
%) |
18 |
% |
| Operating income |
$ |
6,597 |
|
$ |
6,840 |
|
$ |
5,616 |
|
(4 |
%) |
22 |
% |
Adjusted operating income (1)(2) |
$ |
6,597 |
|
$ |
6,862 |
|
$ |
5,622 |
|
(4 |
%) |
22 |
% |
Net income |
$ |
5,625 |
|
$ |
5,118 |
|
$ |
4,899 |
|
10 |
% |
4 |
% |
Adjusted net income (1)(2) |
$ |
4,800 |
|
$ |
5,134 |
|
$ |
4,225 |
|
(7 |
%) |
22 |
% |
Basic earnings per share |
$ |
8.55 |
|
$ |
7.46 |
|
$ |
6.91 |
|
15 |
% |
8 |
% |
|
|
|
|
|
|
Diluted earnings per share |
$ |
8.53 |
|
$ |
7.44 |
|
$ |
6.90 |
|
15 |
% |
8 |
% |
Adjusted diluted earnings per share (1)(2) |
$ |
7.28 |
|
$ |
7.46 |
|
$ |
5.95 |
|
(2 |
%) |
25 |
% |
| Dividends declared per share |
$ |
3.16 |
|
$ |
2.93 |
|
$ |
2.46 |
|
8 |
% |
19 |
% |
Operating ratio (3) |
60.8 |
% |
60.0 |
% |
61.2 |
% |
(0.8) |
pts |
1.2 |
pts |
Adjusted operating ratio (1)(2) |
60.8 |
% |
59.9 |
% |
61.2 |
% |
(0.9) |
pts |
1.3 |
pts |
| Net cash provided by operating activities |
$ |
6,965 |
|
$ |
6,667 |
|
$ |
6,971 |
|
4 |
% |
(4 |
%) |
| Net cash used in investing activities |
$ |
3,468 |
|
$ |
2,510 |
|
$ |
2,873 |
|
(38 |
%) |
13 |
% |
Free cash flow (1)(4) |
$ |
3,887 |
|
$ |
4,259 |
|
$ |
3,296 |
|
(9 |
%) |
29 |
% |
|
|
|
|
|
|
|
|
|
|
% Change |
|
|
|
|
Favorable/(Unfavorable) |
| In millions, except percentages |
As at December 31, 2023 |
As at December 31, 2022 |
As at December 31, 2021 |
2023 vs 2022 |
2022 vs 2021 |
| Financial position |
|
|
|
|
|
| Total assets |
$ |
52,666 |
|
$ |
50,662 |
|
$ |
48,538 |
|
4 |
% |
4 |
% |
Total long-term liabilities (5) |
$ |
27,514 |
|
$ |
25,436 |
|
$ |
22,674 |
|
(8 |
%) |
(12 |
%) |
(1)These non-GAAP measures do not have any standardized meaning prescribed by GAAP and therefore, may not be comparable to similar measures presented by other companies.
(2)See the section of this MD&A entitled Non-GAAP measures – Adjusted performance measures for an explanation of these non-GAAP measures.
(3)Operating ratio is defined as operating expenses as a percentage of revenues.
(4)See the section of this MD&A entitled Liquidity and capital resources – Free cash flow for an explanation of this non-GAAP measure.
(5)Total long-term liabilities is the difference between Total liabilities and Total current liabilities.
2023 Results of operations
Revenues for the year ended December 31, 2023 were $16,828 million compared to $17,107 million in 2022. The decrease of $279 million, or 2%, was mainly due to lower shipments of intermodal, crude oil, U.S. grain and forest products as well as lower container storage fees and lower fuel surcharge revenues as a result of lower fuel prices; partly offset by freight rate increases, higher Canadian grain export shipments and higher shipments of potash and the positive translation impact of a weaker Canadian dollar.
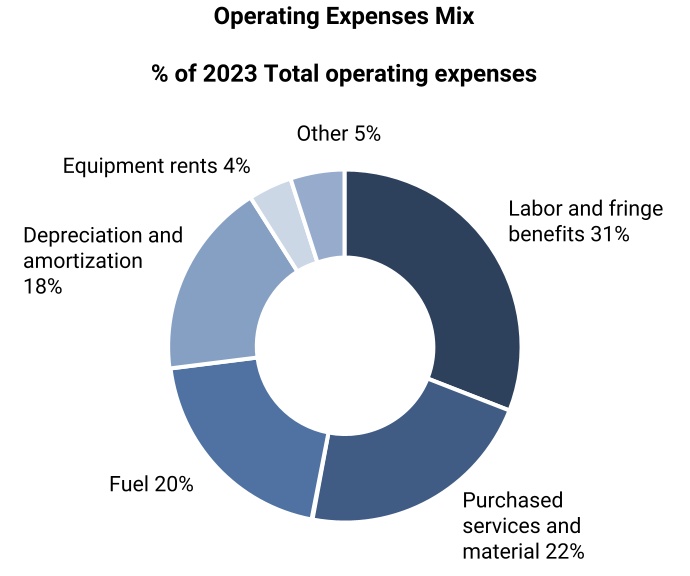
Operating expenses for the year ended December 31, 2023 were $10,231 million compared to $10,267 million in 2022. Operating expenses remained flat mainly due to lower fuel prices; offset by the negative translation impact of a weaker Canadian dollar and higher labor and fringe benefits expense mainly driven by general wage increases and higher average headcount.
Operating income for the year ended December 31, 2023 decreased by $243 million, or 4%, to $6,597 million, when compared to the same period in 2022. The operating ratio was 60.8% in 2023, compared to 60.0% in 2022, a 0.8-point increase.
Net income for the year ended December 31, 2023 was $5,625 million, an increase of $507 million, or 10%, when compared to 2022, and diluted earnings per share increased by 15% to $8.53. The increase was mainly due to a net deferred income tax recovery of $713 million resulting from tax filings consistent with a ruling that the Company received in a non-U.S. foreign jurisdiction in connection with prior taxation years; partly offset by lower revenues.
14 CN | 2023 Annual Report
MANAGEMENT'S DISCUSSION AND ANALYSIS
Key operating metrics
|
|
|
|
|
|
|
|
|
|
|
|
|
|
|
|
|
|
|
|
|
|
% Change |
|
|
|
|
Favorable/(Unfavorable) |
|
2023 |
|
2022 |
|
2021 |
|
2023 vs 2022 |
2022 vs 2021 |
Gross ton miles (GTMs) (millions) (1) |
452,043 |
|
463,710 |
|
458,401 |
|
(3 |
%) |
1 |
% |
Train weight (tons) (2) |
9,186 |
|
9,324 |
|
9,658 |
|
(1 |
%) |
(3 |
%) |
Train length (feet) (3) |
7,891 |
|
8,160 |
|
8,559 |
|
(3 |
%) |
(5 |
%) |
Through network train speed (miles per hour) (4) |
19.8 |
|
18.9 |
|
19.2 |
|
5 |
% |
(2 |
%) |
Fuel efficiency (US gallons of locomotive fuel consumed per 1,000 GTMs) (5) |
0.874 |
|
0.867 |
|
0.884 |
|
(1 |
%) |
2 |
% |
Through dwell (entire railroad, hours) (6) |
7.0 |
|
7.6 |
|
7.9 |
|
8 |
% |
4 |
% |
Car velocity (car miles per day) (7) |
213 |
|
196 |
|
195 |
|
9 |
% |
1 |
% |
(1)GTMs: The workload performed by system trains in hauling freight or equipment. GTMs are calculated by multiplying the trailing weight by the distance the train moved. A larger number is an indicator of more traffic (and thus more revenue) being moved.
(2)Train weight: An efficiency measurement on how much tonnage each mainline train handles on average as it crosses the network. Calculated as the total of GTMs and divided by total train miles, this measure provides insight on how well each train was maximized in terms of its capacity to move traffic. This operating measure was formerly named Train productivity.
(3)Train length: An efficiency measurement on average trailing length of each mainline train on the network. Calculated as the total of car foot miles (the sum of car length multiplied by miles travelled for each trailing car) divided by total train miles, this measure provides insight on how well each train was maximized in terms of its capacity to move traffic.
(4)Through network train speed: A measure of the line-haul movement from origin to destination, including time at terminals. The average speed is calculated by dividing train miles by total hours operated, excluding yard and local trains, passenger trains, maintenance of way trains, and foreign trains. This measure represents the fluidity of trains on the network, with a higher value also indicating a more fluid network.
(5)Fuel efficiency: This measure represents how efficient the Company is in the generation and utilization of locomotive horsepower in freight train operations, with a lower number indicating improved performance. Fuel efficiency is defined as US gallons of locomotive fuel consumed per 1,000 GTMs. Annual fuel efficiency metrics for 2021 have been revised as more complete information became available.
(6)Through dwell: The average time a car resides within terminal boundaries expressed in hours. The measurement begins with a customer release, received interchange, or train arrival event and ends with a customer placement (actual or constructive), delivered or offered in interchange, or train departure event. This excludes stored, bad ordered, maintenance of way cars, or cars with dwell greater than 10 days. This measure represents the efficiency of handling cars within the terminal, with a lower value indicating higher performance.
(7)Car velocity: The average miles per day traveled by loaded and empty cars (including all active cars whether private, foreign or CN owned) on company lines. This measure represents the fluidity of cars on the network, calculated by the sum of miles each car traveled divided by the sum of all of the cars’ active time, with a higher value indicating a smoother and more fluid operation.
The Company’s continued focus on scheduled railroading in 2023, helped by more favorable winter operating conditions partly offset by operational disruptions related to Canadian wildfires and the Canadian West Coast dock workers strike, resulted in improvements in car velocity, train speed and through dwell when compared to 2022. GTMs were negatively impacted in 2023 when compared to 2022 primarily due to weaker demand for freight services. Fuel efficiency decreased by 1% mainly due to running shorter trains.
For the year ended December 31, 2022, when compared to 2021, the Company’s focus on scheduled railroading resulted in improvements in car velocity, through dwell and fuel efficiency, as well as a decrease in train length and train weight, despite negative impacts from the harsh winter in the first quarter of 2022. In addition, the Company's fuel initiatives allowed it to achieve a new record for fuel efficiency.
Non-GAAP measures
This MD&A makes reference to non-GAAP measures including adjusted performance measures, constant currency, return on invested capital (ROIC) and adjusted ROIC, free cash flow, and adjusted debt-to-adjusted EBITDA multiple that do not have any standardized meaning prescribed by GAAP and therefore, may not be comparable to similar measures presented by other companies. From management's perspective, these non-GAAP measures are useful measures of performance and provide investors with supplementary information to assess the Company's results of operations and liquidity. These non-GAAP measures should not be considered in isolation or as a substitute for financial measures prepared in accordance with GAAP.
For further details of these non-GAAP measures, including a reconciliation to the most directly comparable GAAP financial measures, refer to the sections of this MD&A entitled Non-GAAP measures: Adjusted performance measures, ROIC and adjusted ROIC and Constant currency, as well as the section entitled Liquidity and capital resources: Free cash flow and Adjusted debt-to-adjusted EBITDA multiple.
CN | 2023 Annual Report 15
MANAGEMENT'S DISCUSSION AND ANALYSIS
Adjusted performance measures
Adjusted net income, adjusted diluted earnings per share, adjusted operating income, adjusted operating expenses and adjusted operating ratio are non-GAAP measures that are used to set performance goals and to measure CN's performance. Management believes that these adjusted performance measures provide additional insight to management and investors into the Company's operations and underlying business trends as well as facilitate period-to-period comparisons, as they exclude certain significant items that are not reflective of CN's underlying business operations and could distort the analysis of trends in business performance. These items may include:
i.operating expense adjustments: workforce reduction program, depreciation expense on the deployment of replacement system, advisory fees related to shareholder matters, losses and recoveries from assets held for sale, business acquisition-related costs;
ii.non-operating expense adjustments: business acquisition-related financing fees, merger termination income, gains and losses on disposal of property; and
iii.the effect of changes in tax laws including rate enactments, and changes in tax positions affecting prior years.
These non-GAAP measures do not have any standardized meaning prescribed by GAAP and therefore, may not be comparable to similar measures presented by other companies.
For the year ended December 31, 2023, the Company's adjusted net income was $4,800 million, or $7.28 per diluted share, which excludes:
•a gain on disposal of property within the Bala Subdivision located in Markham and Richmond Hill, Ontario, Canada of $129 million, or $112 million after-tax ($0.17 per diluted share) recorded in the fourth quarter in Other income within the Consolidated Statements of Income; and
•a net deferred income tax recovery of $713 million ($1.08 per diluted share) recorded in the fourth quarter resulting from tax filings consistent with a ruling that the Company received in a non-U.S. foreign jurisdiction in connection with prior taxation years.
For the year ended December 31, 2022, the Company's adjusted net income was $5,134 million, or $7.46 per diluted share, which excludes advisory fees related to shareholder matters of $22 million, or $16 million after-tax ($0.02 per diluted share) of which $12 million, or $9 million after-tax ($0.01 per diluted share) was recorded in the second quarter and $10 million, or $7 million after-tax ($0.01 per diluted share) was recorded in the first quarter in Other expense within the Consolidated Statements of Income.
For the year ended December 31, 2021, the Company reported adjusted net income of $4,225 million, or $5.95 per diluted share, which excludes:
•employee termination benefits and severance costs related to a workforce reduction program of $39 million, or $29 million after-tax ($0.04 per diluted share) recorded in the third quarter in Labor and fringe benefits within the Consolidated Statements of Income;
•advisory fees related to shareholder matters of $20 million, or $15 million after-tax ($0.02 per diluted share) of which $13 million, or $10 million after-tax ($0.01 per diluted share) was recorded in the fourth quarter and $7 million, or $5 million after-tax ($0.01 per diluted share) was recorded in the third quarter in Other expense within the Consolidated Statements of Income;
•the recovery of $137 million, or $102 million after-tax ($0.14 per diluted share) recorded in the first quarter related to the loss on assets held for sale in the second quarter of 2020, to reflect an agreement for the sale for on-going rail operations, certain non-core rail lines in Wisconsin, Michigan and Ontario to a short line operator;
•transaction-related costs, consisting of an advance to Kansas City Southern (KCS) and a related refund, net of transaction costs, of $84 million, or $70 million after-tax ($0.10 per diluted share), recorded in the third quarter resulting from the terminated CN Merger Agreement with KCS;
•amortization of bridge financing and other fees of $97 million, or $84 million after-tax ($0.11 per diluted share), of which $65 million, or $60 million after-tax ($0.08 per diluted share) was recorded in the third quarter and $32 million, or $24 million after-tax ($0.03 per diluted share) was recorded in the second quarter, resulting from the KCS transaction, recorded in Interest expense within the Consolidated Statements of Income; and
•merger termination fee paid by KCS to CN of $886 million, or $770 million after-tax ($1.08 per diluted share), recorded in the third quarter resulting from KCS' notice of termination of the CN Merger Agreement with KCS.
16 CN | 2023 Annual Report
MANAGEMENT'S DISCUSSION AND ANALYSIS
Adjusted net income is defined as Net income in accordance with GAAP adjusted for certain significant items. Adjusted diluted earnings per share is defined as adjusted net income divided by the weighted-average diluted shares outstanding. The following table provides a reconciliation of Net income and Earnings per share in accordance with GAAP, as reported for the years ended December 31, 2023, 2022 and 2021, to the non-GAAP adjusted performance measures presented herein:
|
|
|
|
|
|
|
|
|
|
|
|
|
|
|
| In millions, except per share data |
Year ended December 31, |
2023 |
|
2022 |
|
2021 |
|
Net income |
$ |
5,625 |
|
$ |
5,118 |
|
$ |
4,899 |
|
| Adjustments: |
|
|
|
|
| Operating expense adjustments: |
|
|
|
| Workforce reduction program |
|
— |
|
— |
|
39 |
|
|
|
|
|
| Advisory fees related to shareholder matters |
— |
|
22 |
|
20 |
|
| Recovery on assets held for sale |
|
— |
|
— |
|
(137) |
|
| Transaction-related costs |
|
— |
|
— |
|
84 |
|
| Non-operating expense adjustments: |
|
|
|
| Amortization of bridge financing and other fees |
— |
|
— |
|
97 |
|
| Merger termination fee |
|
— |
|
— |
|
(886) |
|
| Gain on disposal of property |
(129) |
|
— |
|
— |
|
| Tax adjustments: |
|
|
|
Tax effect of adjustments (1) |
|
17 |
|
(6) |
|
109 |
|
Tax-deductible goodwill and related impacts (2) |
(713) |
|
— |
|
— |
|
|
|
|
|
| Total adjustments |
(825) |
|
16 |
|
(674) |
|
Adjusted net income |
$ |
4,800 |
|
$ |
5,134 |
|
$ |
4,225 |
|
|
|
|
|
|
|
|
|
|
|
|
|
Diluted earnings per share |
$ |
8.53 |
|
$ |
7.44 |
|
$ |
6.90 |
|
| Impact of adjustments, per share |
(1.25) |
|
0.02 |
|
(0.95) |
|
Adjusted diluted earnings per share |
$ |
7.28 |
|
$ |
7.46 |
|
$ |
5.95 |
|
(1)The tax impact of adjustments is based on the nature of the item for tax purposes and related tax rates in the applicable jurisdiction.
(2)Relates to the impacts resulting from tax filings consistent with a ruling that the Company received in a non-U.S. foreign jurisdiction in connection with prior taxation years.
Adjusted operating income is defined as Operating income in accordance with GAAP adjusted for certain significant operating expense items. Adjusted operating expenses is defined as Operating expenses in accordance with GAAP adjusted for certain significant operating expense items. Adjusted operating ratio is defined as adjusted operating expenses as a percentage of revenues. The following table provides a reconciliation of Operating income, Operating expenses and operating ratio, as reported for the years ended December 31, 2023, 2022 and 2021, to the non-GAAP adjusted performance measures presented herein:
|
|
|
|
|
|
|
|
|
|
|
|
|
|
|
| In millions, except percentages |
Year ended December 31, |
2023 |
|
2022 |
|
2021 |
|
| Operating income |
$ |
6,597 |
|
$ |
6,840 |
|
$ |
5,616 |
|
| Adjustments: |
|
|
|
| Workforce reduction program |
— |
|
— |
|
39 |
|
|
|
|
|
| Advisory fees related to shareholder matters |
— |
|
22 |
|
20 |
|
| Recovery on assets held for sale |
— |
|
— |
|
(137) |
|
| Transaction-related costs |
— |
|
— |
|
84 |
|
| Total adjustments |
|
— |
|
22 |
|
6 |
|
| Adjusted operating income |
$ |
6,597 |
|
$ |
6,862 |
|
$ |
5,622 |
|
|
|
|
|
|
| Operating expenses |
|
10,231 |
|
10,267 |
|
8,861 |
|
| Total adjustments |
|
— |
|
(22) |
|
(6) |
|
| Adjusted operating expenses |
$ |
10,231 |
|
$ |
10,245 |
|
$ |
8,855 |
|
|
|
|
|
|
| Operating ratio |
60.8 |
% |
60.0 |
% |
61.2 |
% |
| Impact of adjustments |
— |
|
(0.1) |
% |
— |
|
| Adjusted operating ratio |
60.8 |
% |
59.9 |
% |
61.2 |
% |
CN | 2023 Annual Report 17
MANAGEMENT'S DISCUSSION AND ANALYSIS
ROIC and adjusted ROIC
ROIC and adjusted ROIC are useful measures for management and investors to evaluate the efficiency of the Company's use of capital funds and allow investors to assess the operating and investment decisions made by management. The Company calculates ROIC as return divided by average invested capital, both of which are non-GAAP measures. Return is defined as Net income plus interest expense after-tax, calculated using the Company's effective tax rate. Average invested capital is defined as the sum of Total shareholders' equity, Long-term debt and Current portion of long-term debt less Cash and cash equivalents, and Restricted cash and cash equivalents, averaged between the beginning and ending balance over the last twelve-month period. The Company calculates adjusted ROIC as adjusted return divided by average invested capital, both of which are non-GAAP measures. Adjusted return is defined as adjusted net income plus interest expense after-tax, calculated using the Company's adjusted effective tax rate. Return, average invested capital, ROIC, adjusted return and adjusted ROIC do not have any standardized meaning prescribed by GAAP and therefore, may not be comparable to similar measures presented by other companies.
The following table provides a reconciliation of Net income and adjusted net income to return and adjusted return, respectively, as well as the calculation of average invested capital, which have been used to calculate ROIC and adjusted ROIC:
|
|
|
|
|
|
|
|
|
|
|
|
|
|
|
| In millions, except percentage |
As at and for the year ended December 31, |
2023 |
|
2022 |
|
2021 |
|
Net income |
$ |
5,625 |
|
$ |
5,118 |
|
$ |
4,899 |
|
| Interest expense |
722 |
|
548 |
|
610 |
|
Tax on interest expense (1) |
(177) |
|
(133) |
|
(139) |
|
Return |
$ |
6,170 |
|
$ |
5,533 |
|
$ |
5,370 |
|
| Average total shareholders' equity |
$ |
20,751 |
|
$ |
22,064 |
|
$ |
21,198 |
|
| Average long-term debt |
15,253 |
|
13,175 |
|
11,987 |
|
| Average current portion of long-term debt |
1,699 |
|
783 |
|
709 |
|
Less: Average cash, cash equivalents, restricted cash and restricted cash equivalents |
(879) |
|
(1,088) |
|
(1,221) |
|
| Average invested capital |
$ |
36,824 |
|
$ |
34,934 |
|
$ |
32,673 |
|
ROIC |
16.8 |
% |
15.8 |
% |
16.4 |
% |
Adjusted net income (2) |
$ |
4,800 |
|
$ |
5,134 |
|
$ |
4,225 |
|
| Interest expense |
722 |
|
548 |
|
610 |
|
Less: Amortization of bridge financing and other fees (3) |
— |
|
— |
|
(97) |
|
Adjusted tax on interest expense (4) |
(177) |
|
(133) |
|
(123) |
|
Adjusted return |
$ |
5,345 |
|
$ |
5,549 |
|
$ |
4,615 |
|
| Average invested capital |
$ |
36,824 |
|
$ |
34,934 |
|
$ |
32,673 |
|
Adjusted ROIC |
14.5 |
% |
15.9 |
% |
14.1 |
% |
(1)The effective tax rate, defined as Income tax expense as a percentage of Income before income taxes, used to calculate the tax on Interest expense for 2023 was 24.5% (2022 - 24.3%; 2021 - 22.8%). Due to the significantly lower effective tax rate reported by the Company in 2023, tax on interest expense for 2023 was calculated using an adjusted effective tax rate.
(2)This non-GAAP measure does not have any standardized meaning prescribed by GAAP and therefore, may not be comparable to similar measures presented by other companies. See the section of this MD&A entitled Non-GAAP measures – Adjusted performance measures for an explanation of this non-GAAP measure.
(3)Relates to amortization of bridge financing and other fees resulting from the KCS transaction, recorded in Interest expense within the Consolidated Statements of Income.
(4)The adjusted effective tax rate is a non-GAAP measure, defined as Income tax expense, net of tax adjustments as presented in Adjusted performance measures as a percentage of Income before taxes, net of pre-tax adjustments as presented in Adjusted performance measures. This measure does not have any standardized meaning prescribed by GAAP and therefore, may not be comparable to a similar measure presented by other companies. The adjusted effective tax rate used to calculate the adjusted tax on interest expense for 2023 was 24.5% (2022 - 24.3%; 2021 - 24.0%).
18 CN | 2023 Annual Report
MANAGEMENT'S DISCUSSION AND ANALYSIS
Constant currency
Financial results at constant currency allow results to be viewed without the impact of fluctuations in foreign currency exchange rates, thereby facilitating period-to-period comparisons in the analysis of trends in business performance. Measures at constant currency are considered non-GAAP measures and do not have any standardized meaning prescribed by GAAP and therefore, may not be comparable to similar measures presented by other companies. Financial results at constant currency are obtained by translating the current period results denominated in US dollars at the weighted average foreign exchange rates used to translate transactions denominated in US dollars of the comparable period of the prior year.
The average foreign exchange rates were $1.350 and $1.301 per US$1.00, for the years ended December 31, 2023 and 2022, respectively. On a constant currency basis, the Company's Net income for the year ended December 31, 2023 would have been lower by $96 million ($0.15 per diluted share).
The following table provides a reconciliation of the impact of constant currency and related percentage change at constant currency on the financial results, as reported for the year ended December 31, 2023:
|
|
|
|
|
|
|
|
|
|
|
|
|
|
|
|
|
|
|
|
| In millions, except per share data |
Year ended December 31, |
2023 |
|
Constant currency impact |
|
2022 |
% Change at constant currency
Fav (Unfav) |
| Revenues |
|
|
|
|
|
|
| Petroleum and chemicals |
|
$ |
3,195 |
|
|
$ |
(71) |
|
|
$ |
3,229 |
|
(3 |
%) |
| Metals and minerals |
|
2,048 |
|
|
(59) |
|
|
1,911 |
|
4 |
% |
| Forest products |
|
1,943 |
|
|
(55) |
|
|
2,006 |
|
(6 |
%) |
| Coal |
|
1,017 |
|
|
(14) |
|
|
937 |
|
7 |
% |
| Grain and fertilizers |
|
3,265 |
|
|
(57) |
|
|
2,783 |
|
15 |
% |
| Intermodal |
|
3,823 |
|
|
(45) |
|
|
4,906 |
|
(23 |
%) |
| Automotive |
|
945 |
|
|
(25) |
|
|
797 |
|
15 |
% |
| Total freight revenues |
|
16,236 |
|
|
(326) |
|
|
16,569 |
|
(4 |
%) |
| Other revenues |
|
592 |
|
|
(12) |
|
|
538 |
|
8 |
% |
| Total revenues |
|
16,828 |
|
|
(338) |
|
|
17,107 |
|
(4 |
%) |
| Operating expenses |
|
|
|
|
|
|
| Labor and fringe benefits |
3,150 |
|
|
(41) |
|
|
2,935 |
|
(6 |
%) |
| Purchased services and material |
2,254 |
|
|
(29) |
|
|
2,191 |
|
(2 |
%) |
| Fuel |
2,097 |
|
|
(69) |
|
|
2,518 |
|
19 |
% |
| Depreciation and amortization |
1,817 |
|
|
(25) |
|
|
1,729 |
|
(4 |
%) |
| Equipment rents |
359 |
|
|
(10) |
|
|
338 |
|
(3 |
%) |
| Other |
554 |
|
|
(13) |
|
|
556 |
|
3 |
% |
|
|
|
|
|
|
|
|
|
|
|
|
|
|
|
|
| Total operating expenses |
10,231 |
|
|
(187) |
|
|
10,267 |
|
2 |
% |
| Operating income |
6,597 |
|
|
(151) |
|
|
6,840 |
|
(6 |
%) |
| Interest expense |
(722) |
|
|
23 |
|
|
(548) |
|
(28 |
%) |
| Other components of net periodic benefit income |
479 |
|
|
— |
|
|
498 |
|
(4 |
%) |
|
|
|
|
|
|
|
|
| Other income (loss) |
134 |
|
|
— |
|
|
(27) |
|
596 |
% |
| Income before income taxes |
6,488 |
|
|
(128) |
|
|
6,763 |
|
(6 |
%) |
| Income tax expense |
(863) |
|
|
32 |
|
|
(1,645) |
|
49 |
% |
| Net income |
$ |
5,625 |
|
|
$ |
(96) |
|
|
$ |
5,118 |
|
8 |
% |
| Diluted earnings per share |
$ |
8.53 |
|
|
$ |
(0.15) |
|
|
$ |
7.44 |
|
13 |
% |
|
|
|
|
|
|
|
CN | 2023 Annual Report 19
MANAGEMENT'S DISCUSSION AND ANALYSIS
Revenues
|
|
|
|
|
|
|
|
|
|
|
|
|
|
|
|
|
|
| In millions, unless otherwise indicated |
Year ended December 31, |
2023 |
2022 |
% Change |
% Change
at constant
currency (1)
|
| Freight revenues |
$ |
16,236 |
|
$ |
16,569 |
|
(2 |
%) |
(4 |
%) |
| Other revenues |
592 |
|
538 |
|
10 |
% |
8 |
% |
| Total revenues |
$ |
16,828 |
|
$ |
17,107 |
|
(2 |
%) |
(4 |
%) |
| Freight revenues |
|
|
|
|
| Petroleum and chemicals |
$ |
3,195 |
|
$ |
3,229 |
|
(1 |
%) |
(3 |
%) |
| Metals and minerals |
2,048 |
|
1,911 |
|
7 |
% |
4 |
% |
| Forest products |
1,943 |
|
2,006 |
|
(3 |
%) |
(6 |
%) |
| Coal |
1,017 |
|
937 |
|
9 |
% |
7 |
% |
| Grain and fertilizers |
3,265 |
|
2,783 |
|
17 |
% |
15 |
% |
| Intermodal |
3,823 |
|
4,906 |
|
(22 |
%) |
(23 |
%) |
| Automotive |
945 |
|
797 |
|
19 |
% |
15 |
% |
| Total freight revenues |
$ |
16,236 |
|
$ |
16,569 |
|
(2 |
%) |
(4 |
%) |
|
|
|
|
|
|
Revenue ton miles (RTMs) (millions) (2) |
232,614 |
|
235,788 |
|
(1 |
%) |
(1 |
%) |
Freight revenue/RTM (cents) (3) |
6.98 |
|
7.03 |
|
(1 |
%) |
(3 |
%) |
Carloads (thousands) |
5,436 |
|
5,697 |
|
(5 |
%) |
(5 |
%) |
Freight revenue/carload ($) |
2,987 |
|
2,908 |
|
3 |
% |
1 |
% |
(1)This non-GAAP measure does not have any standardized meaning prescribed by GAAP and therefore, may not be comparable to similar measures presented by other companies. See the section of this MD&A entitled Non-GAAP measures – Constant currency for an explanation of this non-GAAP measure.
(2)RTMs is a measure of volumes and is calculated by multiplying the weight in tons of the shipment lading being transported by the number of miles that the shipment is transported on company lines. CN uses RTMs as the primary measure of volumes as compared to Carloads, since RTMs also takes into account the length of haul and weight in the movement.
(3)Freight revenue per RTM is an indicator of yield and represents revenue earned for transporting one ton of freight over a distance of one mile.
Revenues for the year ended December 31, 2023 totaled $16,828 million compared to $17,107 million in 2022. The decrease of $279 million, or 2%, was mainly due to:
•lower RTMs of 1% mainly due to lower shipments of intermodal, crude oil, U.S. grain and forest products; partly offset by higher Canadian grain export shipments and higher shipments of potash.
•lower Freight revenue per RTM of 1% due to lower container storage fees and lower fuel surcharge revenues as a result of lower fuel prices; partly offset by freight rate increases, a decrease in the average length of haul and the positive translation impact of a weaker Canadian dollar.
20 CN | 2023 Annual Report
MANAGEMENT'S DISCUSSION AND ANALYSIS
Fuel surcharge revenues decreased by $368 million in 2023 when compared to 2022, mainly due to lower fuel prices and lower volumes; partly offset by the positive translation impact of a weaker Canadian dollar.
Petroleum and chemicals
|
|
|
|
|
|
|
|
|
|
|
|
|
|
|
|
|
|
|
Year ended December 31, |
2023 |
2022 |
% Change |
% Change
at constant
currency |
Revenues (millions) |
$ |
3,195 |
|
$ |
3,229 |
|
(1 |
%) |
(3 |
%) |
RTMs (millions) |
43,846 |
|
46,273 |
|
(5 |
%) |
(5 |
%) |
Revenue/RTM (cents) |
7.29 |
|
6.98 |
|
4 |
% |
2 |
% |
Carloads (thousands) |
634 |
|
636 |
|
— |
% |
— |
% |
Revenue/carload ($) |
|
5,039 |
|
5,077 |
|
(1 |
%) |
(3 |
%) |
The petroleum and chemicals commodity group comprises a wide range of commodities, including chemicals and plastics, refined petroleum products, natural gas liquids, crude oil and sulfur. The primary markets for these commodities are within North America, and as such, the performance of this commodity group is closely correlated with the North American economy as well as oil, gas production, petroleum refining activity, pipeline capacities and related petrochemical commodity prices. Most of the Company's petroleum and chemicals shipments originate in the Alberta Industrial Heartland, a key oil and gas development area and a major center for natural gas feedstock and world-scale petrochemicals and plastics. In addition to servicing the Louisiana petrochemical corridor between New Orleans and Baton Rouge as well as Sarnia’s "Chemical Valley" in Southwestern Ontario, the Company also supplements pipeline capacity by moving petroleum products from facilities in Saskatchewan, British Colombia, Quebec, and Illinois.
For the year ended December 31, 2023, revenues for this commodity group decreased by $34 million, or 1%, when compared to 2022, mainly due to:
•lower RTMs of 5%, mainly due to lower shipments of crude oil due to unfavorable crude oil price spreads;
•partly offset by higher Revenue per RTM of 4%, mainly due to a decrease in the average length of haul, freight rate increases and the positive translation impact of a weaker Canadian dollar; partly offset by lower fuel surcharge revenues.
RTMs decreased more than Carloads in 2023 when compared to 2022, mainly due to lower shipments of crude oil, which has a longer length of haul.
|
|
|
|
|
|
|
|
|
| Percentage of commodity group revenues |
2023 |
2022 |
| Refined petroleum products |
47 |
% |
45 |
% |
| Chemicals and plastics |
39 |
% |
37 |
% |
| Crude and condensate |
9 |
% |
13 |
% |
| Sulfur |
5 |
% |
5 |
% |
CN | 2023 Annual Report 21
MANAGEMENT'S DISCUSSION AND ANALYSIS
Metals and minerals
|
|
|
|
|
|
|
|
|
|
|
|
|
|
|
|
|
|
|
Year ended December 31, |
2023 |
2022 |
% Change |
% Change
at constant
currency |
Revenues (millions) |
$ |
2,048 |
|
$ |
1,911 |
|
7 |
% |
4 |
% |
RTMs (millions) |
28,444 |
|
27,606 |
|
3 |
% |
3 |
% |
Revenue/RTM (cents) |
7.20 |
|
6.92 |
|
4 |
% |
1 |
% |
Carloads (thousands) |
1,002 |
|
956 |
|
5 |
% |
5 |
% |
Revenue/carload ($) |
|
2,044 |
|
1,999 |
|
2 |
% |
(1 |
%) |
The metals and minerals commodity group consists primarily of materials related to oil and gas development such as frac sand, drilling pipe and large diameter pipe, steel, iron ore, non-ferrous base metals and ores, raw materials including scrap metal, industrial materials including aggregates, construction materials such as roofing and railway equipment, machinery and dimensional (large) loads. The Company provides unique rail access to base metals, iron ore and frac sand mining as well as aluminum and steel producing regions, which are among the most important in North America. This strong origin franchise, coupled with the Company's access to port facilities and the end markets for these commodities, has made CN a leader in the transportation of metals and minerals products. The key drivers for this market segment are oil and gas development, automotive production, and non-residential construction.
For the year ended December 31, 2023, revenues for this commodity group increased by $137 million, or 7%, when compared to 2022, mainly due to:
•higher Revenue per RTM of 4% mainly due to freight rate increases and the positive translation impact of a weaker Canadian dollar; partly offset by lower fuel surcharge revenues; and
•higher RTMs of 3% mainly due to higher shipments of frac sand and metals; partly offset by lower exports of iron ore.
|
|
|
|
|
|
|
|
|
| Percentage of commodity group revenues |
2023 |
2022 |
| Metals |
29 |
% |
29 |
% |
| Minerals |
26 |
% |
27 |
% |
| Energy materials |
25 |
% |
24 |
% |
| Iron ore |
20 |
% |
20 |
% |
Forest products
|
|
|
|
|
|
|
|
|
|
|
|
|
|
|
|
|
|
|
Year ended December 31, |
2023 |
2022 |
% Change |
% Change
at constant
currency |
Revenues (millions) |
$ |
1,943 |
|
$ |
2,006 |
|
(3 |
%) |
(6 |
%) |
RTMs (millions) |
23,141 |
|
25,020 |
|
(8 |
%) |
(8 |
%) |
Revenue/RTM (cents) |
8.40 |
|
8.02 |
|
5 |
% |
2 |
% |
Carloads (thousands) |
309 |
|
330 |
|
(6 |
%) |
(6 |
%) |
Revenue/carload ($) |
|
6,288 |
|
6,079 |
|
3 |
% |
1 |
% |
The forest products commodity group includes various types of lumber, panels, paper, board and wrapping paper, wood pulp and other fibers such as logs, recycled paper, wood chips, and wood pellets. The Company has extensive rail access to the western and eastern Canadian fiber-producing regions, which are among the largest fiber source areas in North America. In the U.S., the Company is strategically located to serve both the Midwest and southern U.S. corridors with interline connections to other Class I railroads. The key drivers for the various commodities are: for lumber and panels, housing starts and renovation activities primarily in the U.S.; for fibers (mainly wood pulp), the consumption of paper, pulpboard and tissue in North American and offshore markets; for newsprint, advertising lineage, non-print media and overall economic conditions, primarily in the U.S.; and for board and wrap packaging, growth in eCommerce consumer driven demand and the replacement of plastics by fiber-based packaging.
22 CN | 2023 Annual Report For the year ended December 31, 2023, revenues for this commodity group decreased by $63 million, or 3%, when compared to 2022, mainly due to:
MANAGEMENT'S DISCUSSION AND ANALYSIS
•lower RTMs of 8% mainly due to weaker demand for forest products, primarily lumber and panels, and the negative impact of Canadian wildfires on customer supply chains;
•partly offset by higher Revenue per RTMs of 5% mainly due to freight rate increases and the positive translation impact of a weaker Canadian dollar; partly offset by lower fuel surcharge revenues.
|
|
|
|
|
|
|
|
|
| Percentage of commodity group revenues |
2023 |
2022 |
| Lumber |
37 |
% |
39 |
% |
| Pulp |
29 |
% |
28 |
% |
| Paper |
17 |
% |
17 |
% |
| Panels |
17 |
% |
16 |
% |
Coal
|
|
|
|
|
|
|
|
|
|
|
|
|
|
|
|
|
|
|
Year ended December 31, |
2023 |
2022 |
% Change |
% Change
at constant
currency |
Revenues (millions) |
$ |
1,017 |
|
$ |
937 |
|
9 |
% |
7 |
% |
RTMs (millions) |
22,682 |
|
22,679 |
|
— |
% |
— |
% |
Revenue/RTM (cents) |
4.48 |
|
4.13 |
|
8 |
% |
7 |
% |
Carloads (thousands) |
511 |
|
503 |
|
2 |
% |
2 |
% |
Revenue/carload ($) |
|
1,990 |
|
1,863 |
|
7 |
% |
5 |
% |
The coal commodity group consists of thermal grades of bituminous coal, metallurgical coal and petroleum coke. Canadian thermal and metallurgical coal are largely exported via terminals on the west coast of Canada to offshore markets. In the U.S., thermal coal is transported from mines served in southern Illinois, or from western U.S. mines via interchange with other railroads, to major utilities in the Midwest and Southeast U.S., as well as offshore markets via terminals on the U.S. Gulf Coast and inland river system. Petroleum coke, a by-product of the oil refining process, is exported to offshore markets via terminals on the west coast of Canada, the U.S. Gulf Coast and inland river system, as well as shipped to industrial users in domestic markets. The key drivers for this market segment are weather conditions, environmental regulations, global energy, coal and steel supply and demand conditions, and for U.S. domestic utility coal, the price of natural gas.
For the year ended December 31, 2023, revenues for this commodity group increased by $80 million, or 9%, when compared to 2022, mainly due to:
•higher Revenue per RTM of 8% mainly due to freight rate increases and the positive translation impact of a weaker Canadian dollar; partly offset by lower fuel surcharge revenues.
•RTMs remained flat mainly due to higher shipments of Canadian coal and U.S. petroleum coke; offset by lower shipments of U.S. coal exports.
RTMs remained flat while Carloads increased in 2023 when compared to 2022, mainly due to higher Canadian coal export shipments, which have a longer length of haul; partly offset by lower U.S. coal export shipments which have a longer length of haul.
|
|
|
|
|
|
|
|
|
| Percentage of commodity group revenues |
2023 |
2022 |
| Canadian coal - export |
53 |
% |
54 |
% |
| Petroleum coke |
21 |
% |
20 |
% |
| U.S. coal - export |
13 |
% |
14 |
% |
| U.S. coal - domestic |
13 |
% |
12 |
% |
CN | 2023 Annual Report 23
MANAGEMENT'S DISCUSSION AND ANALYSIS
Grain and fertilizers
|
|
|
|
|
|
|
|
|
|
|
|
|
|
|
|
|
|
|
Year ended December 31, |
2023 |
2022 |
% Change |
% Change
at constant
currency |
Revenues (millions) |
$ |
3,265 |
|
$ |
2,783 |
|
17 |
% |
15 |
% |
RTMs (millions) |
63,479 |
|
55,359 |
|
15 |
% |
15 |
% |
Revenue/RTM (cents) |
5.14 |
|
5.03 |
|
2 |
% |
— |
% |
Carloads (thousands) |
670 |
|
614 |
|
9 |
% |
9 |
% |
Revenue/carload ($) |
|
4,873 |
|
4,533 |
|
8 |
% |
6 |
% |
The grain and fertilizers commodity group depends primarily on crops grown and fertilizers processed in Western Canada and the U.S. Midwest. The grain segment consists of wheat, oats, barley, flaxseed, rye, peas, lentils, corn, corn meal, ethanol, dried distillers grain, canola seed and canola products, soybeans, soybean products, sweeteners and animal fat. Production of grain varies considerably from year to year, affected primarily by weather conditions, seeded and harvested acreage, the mix of grains produced and crop yields. Grain exports are sensitive to the size and quality of the crop produced, international market conditions and foreign government policy. The majority of grain produced in Western Canada and moved by CN is exported via the ports of Vancouver, Prince Rupert and Thunder Bay. These rail movements are subject to government regulation that establishes a maximum revenue entitlement that railways can earn. Although railway companies are free to set freight rates for western grain shipments, total revenue is limited based on a formula that takes into account tonnage, length of haul, and a specified price index. Shipments of grain that are exported to the U.S. are not regulated. Grain grown in the U.S. Midwest is exported as well as transported to domestic processing facilities and feed markets. The Company also serves major producers of potash in Canada, as well as producers of ammonium nitrate, anhydrous ammonia, urea and other fertilizers across Canada and the U.S. The key drivers for fertilizers are input prices, demand, government policies, and international competition.
For the year ended December 31, 2023, revenues for this commodity group increased by $482 million, or 17%, when compared to 2022, mainly due to:
•higher RTMs of 15% mainly due to higher Canadian grain export shipments primarily as a result of a larger 2022/2023 crop versus the prior year and higher shipments of potash due to a major outage at a competitor's export terminal and stronger domestic demand, partly offset by reduced U.S. grain shipments as a result of increased global grain supply; and
•higher Revenue per RTM of 2% mainly due to freight rate increases and the positive translation impact of a weaker Canadian dollar; partly offset by an increase in the average length of haul and lower fuel surcharge revenues.
RTMs increased more than Carloads in 2023 when compared to 2022, mainly due to higher Canadian grain export shipments, which has a longer length of haul.
|
|
|
|
|
|
|
|
|
| Percentage of commodity group revenues |
2023 |
2022 |
| Canadian grain - regulated |
37 |
% |
32 |
% |
| U.S. grain - domestic |
19 |
% |
22 |
% |
| Fertilizers - potash |
16 |
% |
13 |
% |
| Canadian grain - commercial |
13 |
% |
13 |
% |
| Fertilizers - other |
9 |
% |
9 |
% |
| U.S. grain - exports |
6 |
% |
11 |
% |
Intermodal
|
|
|
|
|
|
|
|
|
|
|
|
|
|
|
|
|
|
|
Year ended December 31, |
2023 |
2022 |
% Change |
% Change
at constant
currency |
Revenues (millions) |
$ |
3,823 |
|
$ |
4,906 |
|
(22 |
%) |
(23 |
%) |
RTMs (millions) |
47,886 |
|
56,029 |
|
(15 |
%) |
(15 |
%) |
Revenue/RTM (cents) |
7.98 |
|
8.76 |
|
(9 |
%) |
(10 |
%) |
Carloads (thousands) |
2,078 |
|
2,450 |
|
(15 |
%) |
(15 |
%) |
Revenue/carload ($) |
|
1,840 |
|
2,002 |
|
(8 |
%) |
(9 |
%) |
24 CN | 2023 Annual Report
MANAGEMENT'S DISCUSSION AND ANALYSIS
The intermodal commodity group includes rail and trucking services and is comprised of two markets: domestic intermodal and international intermodal. Domestic intermodal transports consumer products and manufactured goods, serving retail, wholesale and logistics provider channels, within domestic Canada, domestic U.S., Mexico and transborder, while international intermodal handles import and export container traffic, serving the major ports of Vancouver, Prince Rupert, Montreal, Halifax, Saint John, New Orleans and Mobile. CN's network of inland intermodal terminals, located near ports and large urban centers, and a number of interline partnerships with other Class I railroads, connects customers to major markets in North America and overseas. Domestic intermodal is driven by consumer markets, with growth generally tied to the economy. International intermodal is driven by North American economic and trade conditions as well as global trade patterns. Revenues for CN owned trucking businesses, including TransX, are included in this commodity group within the domestic market.
For the year ended December 31, 2023, revenues for this commodity group decreased by $1,083 million, or 22%, when compared to 2022, mainly due to:
•lower RTMs of 15% mainly due to decreased shipments in the international and domestic segments driven by weaker demand for consumer goods and the lingering negative impact of the Canadian West Coast dock workers strike; and
•lower Revenue per RTM of 9% mainly due to lower container storage fees compared to significantly higher container storage fees in 2022 resulting from customer supply chain challenges, reduced trucking services and lower fuel surcharge revenues; partly offset by a decrease in the average length of haul, freight rate increases and the positive translation impact of a weaker Canadian dollar.
|
|
|
|
|
|
|
|
|
| Percentage of commodity group revenues |
2023 |
2022 |
| International |
60 |
% |
63 |
% |
| Domestic |
40 |
% |
37 |
% |
Automotive
|
|
|
|
|
|
|
|
|
|
|
|
|
|
|
|
|
|
|
Year ended December 31, |
2023 |
2022 |
% Change |
% Change
at constant
currency |
Revenues (millions) |
$ |
945 |
|
$ |
797 |
|
19 |
% |
15 |
% |
RTMs (millions) |
3,136 |
|
2,822 |
|
11 |
% |
11 |
% |
Revenue/RTM (cents) |
30.13 |
|
28.24 |
|
7 |
% |
4 |
% |
Carloads (thousands) |
232 |
|
208 |
|
12 |
% |
12 |
% |
Revenue/carload ($) |
|
4,073 |
|
3,832 |
|
6 |
% |
3 |
% |
The automotive commodity group moves both domestic finished vehicles and parts throughout North America, providing service to certain vehicle assembly plants in Ontario, Michigan and Mississippi. The Company also serves vehicle distribution facilities in Canada and the U.S., as well as parts production facilities in Michigan and Ontario. The Company serves shippers of finished vehicle imports via the ports of Halifax and Vancouver, and through interchange with other railroads for vehicles produced outside CN’s directly served network, including in Mexico. CN's broad network of auto compounds is used to facilitate distribution of vehicles throughout Canada and the U.S. Midwest. The primary drivers for this market are automotive sales in North America, which are driven by population growth, age of vehicles and household spending.
For the year ended December 31, 2023, revenues for this commodity group increased by $148 million, or 19%, when compared to 2022, mainly due to:
•higher RTMs of 11% mainly due to higher shipments of finished vehicles as a result of automotive dealership restocking; and
•higher Revenue per RTM of 7% mainly due to freight rate increases and the positive translation impact of a weaker Canadian dollar; partly offset by lower fuel surcharge revenues and an increase in the average length of haul.
|
|
|
|
|
|
|
|
|
| Percentage of commodity group revenues |
2023 |
2022 |
| Finished vehicles |
93 |
% |
93 |
% |
| Auto parts |
7 |
% |
7 |
% |
CN | 2023 Annual Report 25
MANAGEMENT'S DISCUSSION AND ANALYSIS
Other revenues
|
|
|
|
|
|
|
|
|
|
|
|
|
|
|
|
|
|
|
Year ended December 31, |
2023 |
2022 |
% Change |
% Change
at constant
currency |
Revenues (millions) |
$ |
592 |
|
$ |
538 |
|
10 |
% |
8 |
% |
Other revenues are derived from non-rail logistics services that support the Company's rail business including vessels and docks, transloading and distribution, automotive logistics, and freight forwarding and transportation management.
For the year ended December 31, 2023, Other revenues increased by $54 million, or 10%, when compared to 2022, mainly due to higher vessel and dock revenues from the iron ore supply chain, increased automotive logistics revenues and the positive impact of a weaker Canadian dollar; partly offset by lower freight forwarding revenues.
|
|
|
|
|
|
|
|
|
| Percentage of other revenues |
2023 |
2022 |
| Vessels and docks |
55 |
% |
54 |
% |
| Other non-rail services |
37 |
% |
38 |
% |
| Other revenues |
8 |
% |
8 |
% |
Operating expenses
Operating expenses for the year ended December 31, 2023, amounted to $10,231 million compared to $10,267 million in 2022. Operating expenses remained flat mainly due to lower fuel prices; offset by the negative translation impact of a weaker Canadian dollar and higher labor and fringe benefits expense mainly driven by general wage increases and higher average headcount.
|
|
|
|
|
|
|
|
|
|
|
|
|
|
|
|
|
|
| In millions |
Year ended December 31, |
2023 |
2022 |
% Change |
% Change
at constant
currency (1)
|
Labor and fringe benefits |
$ |
3,150 |
|
$ |
2,935 |
|
(7 |
%) |
(6 |
%) |
| Purchased services and material |
2,254 |
|
2,191 |
|
(3 |
%) |
(2 |
%) |
| Fuel |
2,097 |
|
2,518 |
|
17 |
% |
19 |
% |
| Depreciation and amortization |
1,817 |
|
1,729 |
|
(5 |
%) |
(4 |
%) |
| Equipment rents |
359 |
|
338 |
|
(6 |
%) |
(3 |
%) |
| Other |
554 |
|
556 |
|
— |
% |
3 |
% |
|
|
|
|
|
|
|
|
|
|
| Total operating expenses |
$ |
10,231 |
|
$ |
10,267 |
|
— |
% |
2 |
% |
(1)This non-GAAP measure does not have any standardized meaning prescribed by GAAP and therefore, may not be comparable to similar measures presented by other companies. See the section of this MD&A entitled Non-GAAP measures – Constant currency for an explanation of this non-GAAP measure.
26 CN | 2023 Annual Report
MANAGEMENT'S DISCUSSION AND ANALYSIS
Labor and fringe benefits
Labor and fringe benefits expense includes wages, payroll taxes and employee benefits such as incentive compensation, including stock-based compensation, health and welfare, current service cost for pensions and postretirement benefits. Certain incentive compensation plans are based mainly on financial performance targets and the related expense is recorded in relation to the attainment of such targets.
Labor and fringe benefits expense increased by $215 million, or 7%, in 2023 when compared to 2022. The increase was mainly due to higher general wage increases, higher average headcount and the negative translation impact of a weaker Canadian dollar; partly offset by lower pension expense, lower incentive compensation and the incremental wage accrual in 2022 for the agreements with the U.S unions.
Purchased services and material
Purchased services and material expense includes the cost of services purchased from outside contractors; materials used in the maintenance of the Company's track, facilities and equipment; transportation and lodging for train crew employees; utility costs; and the net costs of operating facilities jointly used by the Company and other railroads.
Purchased services and material expense increased by $63 million, or 3%, in 2023 when compared to 2022. The increase was mainly due to higher contracted services, higher material costs and the negative translation impact of a weaker Canadian dollar; partly offset by lower freight forwarding expense.
Fuel
Fuel expense includes fuel consumed by assets, including locomotives, vessels, vehicles and other equipment as well as federal, provincial and state fuel taxes.
Fuel expense decreased by $421 million, or 17%, in 2023 when compared to 2022. The decrease was mainly due to lower fuel prices, lower volumes and the negative translation impact of a weaker Canadian dollar.
Depreciation and amortization
Depreciation and amortization expense includes the costs associated with the use of properties and intangible assets over their estimated service lives. Depreciation expense is affected by capital additions, railroad property retirements from disposal, sale and/or abandonment and other adjustments including asset impairments.
Depreciation and amortization expense increased by $88 million, or 5%, in 2023 when compared to 2022. The increase was mainly due to a higher depreciable asset base and the negative translation impact of a weaker Canadian dollar.
Equipment rents
Equipment rents expense includes rental expense for the use of freight cars owned by other railroads (car hire) or private companies and for the lease of freight cars, locomotives and intermodal equipment, net of rental income from other railroads for the use of the Company's freight cars (car hire) and locomotives.
Equipment rents expense increased by $21 million, or 6%, in 2023 when compared to 2022. The increase was mainly due to higher rail car lease costs and the negative translation impact of a weaker Canadian dollar.
Other
Other expense includes operating taxes; software, support and cloud computing costs; insurance; environmental; freight and property damage; personal injury claims; travel expenses; advisory fees related to shareholder matters; bad debt; as well as other general expenses.
Other expense remained flat in 2023 when compared to 2022 mainly due to lower incident costs and advisory fees related to shareholder matters of $22 million in 2022; offset by higher personal injury claim provisions, higher software and support costs and the negative translation impact of a weaker Canadian dollar.
CN | 2023 Annual Report 27
MANAGEMENT'S DISCUSSION AND ANALYSIS
Other income and expenses
Interest expense
In 2023, Interest expense was $722 million compared to $548 million in 2022. The increase was mainly due to the higher average level of debt, higher average interest rates and the negative translation impact of a weaker Canadian dollar.
Other components of net periodic benefit income
In 2023, Other components of net periodic benefit income was $479 million compared to $498 million in 2022. The decrease was mainly due to higher interest cost; partly offset by lower amortization of net actuarial loss and higher expected return on assets. These effects primarily resulted from changes to discount rates, lower actual returns compared to expected returns, as well as an increase to the Company’s expected long-term rate of return assumption in 2023.
Other income (loss)
In 2023, Other income was $134 million compared to Other loss of $27 million in 2022. The favorable variance of $161 million was mainly due to a gain on disposal of property within the Bala Subdivision located in Markham and Richmond Hill, Ontario, Canada of $129 million.
Income tax expense
In 2023, the Company recorded an income tax expense of $863 million compared to an income tax expense of $1,645 million in 2022.
In the fourth quarter of 2023, the Company received a ruling from taxation authorities in a non-U.S. foreign jurisdiction in connection with prior taxation years. Consistent with the ruling, and effective as of January 1, 2021, the Company has foregone favorable tax deductions of a permanent nature on certain income generated from intercompany arrangements. This resulted in the Company generating tax-deductible goodwill approximating the value of the foregone tax deductions, which is available to be amortized over a period of up to ten years.
As a result, the Company recorded a net deferred income tax recovery of $682 million, comprised of a $767 million deferred income tax recovery related to the tax-deductible goodwill initially generated as of January 1, 2021, partly offset by a $85 million income tax expense related to the foregone tax deduction ($31 million for 2023 and $54 million for prior years) which was initially recorded in current taxes and was then reclassified to deferred taxes following the amortization of the tax-deductible goodwill for those years. As a result, the remaining deferred income tax asset as at December 31, 2023 was $682 million, representing the tax impact of unamortized tax-deductible goodwill of $5.8 billion.
The effective tax rate for 2023 was 13.3% compared to 24.3% in 2022 and the adjusted effective tax rate for 2023 was 24.5%. (1)
In addition, the Organization for Economic Co-operation and Development (OECD) finalized its Pillar Two guidelines on some key components of global tax reform which include a global minimum corporate tax rate of 15% and the application of a top-up tax. These guidelines are effective in 2024 and have been or are expected to be enacted in a number of OECD member countries, which include the main jurisdictions in which CN operates (other than the U.S.), and as a result will affect the Company’s effective tax rate for 2024 and thereafter.
For 2024, the Company anticipates the estimated annual effective tax rate to be approximately 25.0%, and reflects the impacts of the foregone tax deductions and the Pillar Two guidelines of approximately 0.5%.
The Company’s net income tax payments for taxation years 2021 to 2023 were not affected and are not expected to be affected for 2024 and the next six years thereafter as a result of the tax-deductible goodwill available to be amortized in those years.
(1) Adjusted effective tax rate is a non-GAAP measure, defined as Income tax expense, net of tax adjustments as presented in Adjusted performance measures as a percentage of Income before taxes, net of pre-tax adjustments as presented in Adjusted performance measures. This measure does not have any standard meaning prescribed by GAAP and therefore, may not be comparable to a similar measure presented by other companies.
28 CN | 2023 Annual Report
MANAGEMENT'S DISCUSSION AND ANALYSIS
2022 Results of operations
Revenues for the year ended December 31, 2022 were $17,107 million compared to $14,477 million in 2021. The increase of $2,630 million, or 18%, was mainly attributable to higher fuel surcharge revenue as a result of higher fuel prices, freight rate increases, the positive translation impact of a weaker Canadian dollar, higher Canadian export volumes of coal via west coast ports and higher volumes of U.S. grain; partly offset by lower international container traffic volumes via the port of Vancouver as a result of supply chain congestion and significantly lower export volumes of Canadian grain in the first half of 2022.
Operating expenses for the year ended December 31, 2022 were $10,267 million compared to $8,861 million in 2021. The increase of $1,406 million, or 16%, was mainly as a result of higher fuel prices, the negative translation impact of a weaker Canadian dollar as well the recovery of the loss on assets held for sale of $137 million recorded in the first quarter of 2021 resulting from the Company entering into an agreement for the sale of non-core lines; partly offset by transaction-related costs of $84 million recorded in the third quarter of 2021 resulting from the terminated CN Merger Agreement with KCS.
Operating income for the year ended December 31, 2022 increased by $1,224 million, or 22%, to $6,840 million, when compared to the same period in 2021. The operating ratio was 60.0% in 2022, compared to 61.2% in 2021, a 1.2-point improvement.
Net income for the year ended December 31, 2022 was $5,118 million, an increase of $219 million, or 4%, when compared to 2021, and diluted earnings per share increased by 8% to $7.44. The increase was mainly driven by higher operating income in 2022, partly offset by a merger termination fee of $886 million ($770 million after-tax) received from KCS in 2021.
Assets held for sale
In the first quarter of 2021, CN entered into an agreement with a short line operator, for the sale of non-core lines in Wisconsin, Michigan and Ontario representing 850 miles that were classified as assets held for sale plus an additional 50 miles of track and roadway assets, resulting in a $137 million recovery ($102 million after-tax) of the $486 million loss ($363 million after-tax) recorded in the second quarter of 2020 to adjust the carrying amount of the track and roadway assets to their then estimated net selling price.
In the fourth quarter of 2021, the STB approved the Company's agreement with the short line operator without condition and the transaction closed in the first quarter of 2022 for proceeds of $273 million.
CN | 2023 Annual Report 29
MANAGEMENT'S DISCUSSION AND ANALYSIS
Constant currency
Financial results at constant currency allow results to be viewed without the impact of fluctuations in foreign currency exchange rates, thereby facilitating period-to-period comparisons in the analysis of trends in business performance. Measures at constant currency are considered non-GAAP measures and do not have any standardized meaning prescribed by GAAP and therefore, may not be comparable to similar measures presented by other companies. Financial results at constant currency are obtained by translating the current period results denominated in US dollars at the weighted average foreign exchange rates used to translate transactions denominated in US dollars of the comparable period of the prior year.
The average foreign exchange rates were $1.301 and $1.254 per US$1.00, for the years ended December 31, 2022 and 2021, respectively.
On a constant currency basis, the Company's Net income for the year ended December 31, 2022 would have been lower by $90 million ($0.13 per diluted share).
The following table provides a reconciliation of the impact of constant currency and related percentage change at constant currency on the financial results, as reported for the year ended December 31, 2022:
|
|
|
|
|
|
|
|
|
|
|
|
|
|
|
|
|
|
|
|
| In millions, except per share data |
Year ended December 31, |
2022 |
|
Constant currency impact |
|
2021 |
% Change at constant currency
Fav (Unfav) |
| Revenues |
|
|
|
|
|
|
| Petroleum and chemicals |
|
$ |
3,229 |
|
$ |
(74) |
|
|
$ |
2,816 |
12 |
% |
| Metals and minerals |
|
1,911 |
|
(57) |
|
|
1,548 |
20 |
% |
| Forest products |
|
2,006 |
|
(57) |
|
|
1,740 |
12 |
% |
| Coal |
|
937 |
|
(11) |
|
|
618 |
50 |
% |
| Grain and fertilizers |
|
2,783 |
|
(56) |
|
|
2,475 |
10 |
% |
| Intermodal |
|
4,906 |
|
(58) |
|
|
4,115 |
18 |
% |
| Automotive |
|
797 |
|
(24) |
|
|
576 |
34 |
% |
| Total freight revenues |
|
16,569 |
|
(337) |
|
|
13,888 |
17 |
% |
| Other revenues |
|
538 |
|
(15) |
|
|
589 |
(11 |
%) |
| Total revenues |
|
17,107 |
|
(352) |
|
|
14,477 |
16 |
% |
| Operating expenses |
|
|
|
|
|
|
| Labor and fringe benefits |
2,935 |
|
(43) |
|
|
2,879 |
— |
% |
| Purchased services and material |
2,191 |
|
(33) |
|
|
2,082 |
(4 |
%) |
| Fuel |
2,518 |
|
(88) |
|
|
1,513 |
(61 |
%) |
| Depreciation and amortization |
1,729 |
|
(25) |
|
|
1,598 |
(7 |
%) |
| Equipment rents |
338 |
|
(10) |
|
|
336 |
2 |
% |
| Other |
556 |
|
(15) |
|
|
506 |
(7 |
%) |
| Recovery of loss on assets held for sale |
|
— |
|
— |
|
|
(137) |
(100 |
%) |
| Transaction-related costs |
|
— |
|
— |
|
|
84 |
100 |
% |
| Total operating expenses |
10,267 |
|
(214) |
|
|
8,861 |
(13 |
%) |
| Operating income |
6,840 |
|
(138) |
|
|
5,616 |
19 |
% |
| Interest expense |
(548) |
|
18 |
|
|
(610) |
13 |
% |
Other components of net periodic benefit income |
498 |
|
— |
|
|
407 |
22 |
% |
| Merger termination fee |
|
— |
|
— |
|
|
886 |
(100 |
%) |
| Other income (loss) |
(27) |
|
— |
|
|
43 |
(163 |
%) |
Income before income taxes |
6,763 |
|
(120) |
|
|
6,342 |
5 |
% |
Income tax expense |
(1,645) |
|
30 |
|
|
(1,443) |
(12 |
%) |
Net income |
$ |
5,118 |
|
$ |
(90) |
|
|
$ |
4,899 |
3 |
% |
Diluted earnings per share |
$ |
7.44 |
|
$ |
(0.13) |
|
|
$ |
6.90 |
6 |
% |
30 CN | 2023 Annual Report
MANAGEMENT'S DISCUSSION AND ANALYSIS
Revenues
|
|
|
|
|
|
|
|
|
|
|
|
|
|
|
|
|
|
| In millions, unless otherwise indicated |
Year ended December 31, |
2022 |
|
2021 |
|
% Change |
% Change
at constant
currency (1)
|
| Freight revenues |
$ |
16,569 |
|
$ |
13,888 |
|
19 |
% |
17 |
% |
| Other revenues |
538 |
|
589 |
|
(9 |
%) |
(11 |
%) |
| Total revenues |
$ |
17,107 |
|
$ |
14,477 |
|
18 |
% |
16 |
% |
| Freight revenues |
|
|
|
|
| Petroleum and chemicals |
$ |
3,229 |
|
$ |
2,816 |
|
15 |
% |
12 |
% |
| Metals and minerals |
1,911 |
|
1,548 |
|
23 |
% |
20 |
% |
| Forest products |
2,006 |
|
1,740 |
|
15 |
% |
12 |
% |
| Coal |
937 |
|
618 |
|
52 |
% |
50 |
% |
| Grain and fertilizers |
2,783 |
|
2,475 |
|
12 |
% |
10 |
% |
| Intermodal |
4,906 |
|
4,115 |
|
19 |
% |
18 |
% |
| Automotive |
797 |
|
576 |
|
38 |
% |
34 |
% |
| Total freight revenues |
$ |
16,569 |
|
$ |
13,888 |
|
19 |
% |
17 |
% |
Revenue ton miles (RTMs) (millions) |
235,788 |
|
233,138 |
|
1 |
% |
1 |
% |
Freight revenue/RTM (cents) |
7.03 |
|
5.96 |
|
18 |
% |
15 |
% |
Carloads (thousands) |
5,697 |
|
5,701 |
|
— |
% |
— |
% |
Freight revenue/carload ($) |
2,908 |
|
2,436 |
|
19 |
% |
17 |
% |
(1)This non-GAAP measure does not have any standardized meaning prescribed by GAAP and therefore, may not be comparable to similar measures presented by other companies. See the section of this MD&A entitled 2022 Results of operations – Constant currency for an explanation of this non-GAAP measure.
Revenues for the year ended December 31, 2022 totaled $17,107 million compared to $14,477 million in 2021. The increase of $2,630 million, or 18%, was mainly attributable to higher fuel surcharge revenue as a result of higher fuel prices, freight rate increases, the positive translation impact of a weaker Canadian dollar, higher Canadian export volumes of coal via west coast ports and higher volumes of U.S. grain; partly offset by lower international container traffic volumes via the port of Vancouver as a result of supply chain congestion and significantly lower export volumes of Canadian grain in the first half of 2022.
Fuel surcharge revenues increased by $1,592 million in 2022, mainly as a result of higher fuel prices.
In 2022, RTMs, measuring the weight and distance of freight transported by the Company, increased by 1% relative to 2021. Freight revenue per RTM increased by 18% in 2022 when compared to 2021, mainly driven by higher fuel surcharge revenue as a result of higher fuel prices, freight rate increases, a decrease in the average length of haul and the positive translation impact of a weaker Canadian dollar.
Petroleum and chemicals
|
|
|
|
|
|
|
|
|
|
|
|
|
|
|
|
|
|
|
Year ended December 31, |
2022 |
2021 |
% Change |
% Change
at constant
currency |
Revenues (millions) |
$ |
3,229 |
|
$ |
2,816 |
|
15 |
% |
12 |
% |
RTMs (millions) |
46,273 |
|
42,436 |
|
9 |
% |
9 |
% |
Revenue/RTM (cents) |
6.98 |
|
6.64 |
|
5 |
% |
3 |
% |
Carloads (thousands) |
636 |
|
596 |
|
7 |
% |
7 |
% |
Revenue/carload ($) |
|
5,077 |
|
4,725 |
|
7 |
% |
5 |
% |
For the year ended December 31, 2022, revenues for this commodity group increased by $413 million, or 15%, when compared to 2021, mainly due to higher fuel surcharge revenue, increased volumes of refined petroleum products, natural gas liquids and petroleum crude, freight rate increases and the positive translation impact of a weaker Canadian dollar.
Revenue per RTM increased by 5% in 2022 when compared to 2021, mainly due to higher fuel surcharge revenue, freight rate increases and the positive translation impact of a weaker Canadian dollar.
CN | 2023 Annual Report 31
MANAGEMENT'S DISCUSSION AND ANALYSIS
Metals and minerals
|
|
|
|
|
|
|
|
|
|
|
|
|
|
|
|
|
|
|
Year ended December 31, |
2022 |
2021 |
% Change |
% Change
at constant
currency |
Revenues (millions) |
$ |
1,911 |
|
$ |
1,548 |
|
23 |
% |
20 |
% |
RTMs (millions) |
27,606 |
|
26,743 |
|
3 |
% |
3 |
% |
Revenue/RTM (cents) |
6.92 |
|
5.79 |
|
20 |
% |
16 |
% |
Carloads (thousands) |
956 |
|
969 |
|
(1 |
%) |
(1 |
%) |
Revenue/carload ($) |
|
1,999 |
|
1,598 |
|
25 |
% |
21 |
% |
For the year ended December 31, 2022, revenues for this commodity group increased by $363 million, or 23%, when compared to 2021, mainly due to higher fuel surcharge revenue, freight rate increases, the positive translation impact of a weaker Canadian dollar, more revenue generating moves of empty customer-owned cars and increased volumes of frac sand.
Revenue per RTM increased by 20% in 2022 when compared to 2021, mainly due to higher fuel surcharge revenue, freight rate increases, the positive translation impact of a weaker Canadian dollar, and more revenue generating moves of empty customer-owned cars; partly offset by an increase in the average length of haul.
Forest products
|
|
|
|
|
|
|
|
|
|
|
|
|
|
|
|
|
|
|
Year ended December 31, |
2022 |
2021 |
% Change |
% Change
at constant
currency |
Revenues (millions) |
$ |
2,006 |
|
$ |
1,740 |
|
15 |
% |
12 |
% |
RTMs (millions) |
25,020 |
|
25,948 |
|
(4 |
%) |
(4 |
%) |
Revenue/RTM (cents) |
8.02 |
|
6.71 |
|
20 |
% |
16 |
% |
Carloads (thousands) |
330 |
|
339 |
|
(3 |
%) |
(3 |
%) |
Revenue/carload ($) |
|
6,079 |
|
5,133 |
|
18 |
% |
15 |
% |
For the year ended December 31, 2022, revenues for this commodity group increased by $266 million, or 15%, when compared to 2021, mainly due to higher fuel surcharge revenue, freight rate increases and the positive translation impact of a weaker Canadian dollar; partly offset by lower volumes of lumber and woodpulp as a result of continuing supply chain challenges.
Revenue per RTM increased by 20% in 2022 when compared to 2021, mainly due to higher fuel surcharge revenue, freight rate increases and the positive translation impact of a weaker Canadian dollar.
Coal
|
|
|
|
|
|
|
|
|
|
|
|
|
|
|
|
|
|
|
Year ended December 31, |
2022 |
2021 |
% Change |
% Change
at constant
currency |
Revenues (millions) |
$ |
937 |
|
$ |
618 |
|
52 |
% |
50 |
% |
RTMs (millions) |
22,679 |
|
18,471 |
|
23 |
% |
23 |
% |
Revenue/RTM (cents) |
4.13 |
|
3.35 |
|
23 |
% |
22 |
% |
Carloads (thousands) |
503 |
|
379 |
|
33 |
% |
33 |
% |
Revenue/carload ($) |
|
1,863 |
|
1,631 |
|
14 |
% |
13 |
% |
For the year ended December 31, 2022, revenues for this commodity group increased by $319 million, or 52%, when compared to 2021, mainly due to higher Canadian export volumes of thermal and metallurgical coal via west coast ports due to the re-opening of two mines in November 2021 and favorable market conditions due to rising energy prices, as well as higher fuel surcharge revenue.
Revenue per RTM increased by 23% in 2022 when compared to 2021, mainly due to higher fuel surcharge revenue and a decrease in the average length of haul.
32 CN | 2023 Annual Report
MANAGEMENT'S DISCUSSION AND ANALYSIS
Grain and fertilizers
|
|
|
|
|
|
|
|
|
|
|
|
|
|
|
|
|
|
|
Year ended December 31, |
2022 |
2021 |
% Change |
% Change
at constant
currency |
Revenues (millions) |
$ |
2,783 |
|
$ |
2,475 |
|
12 |
% |
10 |
% |
RTMs (millions) |
55,359 |
|
58,733 |
|
(6 |
%) |
(6 |
%) |
Revenue/RTM (cents) |
5.03 |
|
4.21 |
|
19 |
% |
17 |
% |
Carloads (thousands) |
614 |
|
628 |
|
(2 |
%) |
(2 |
%) |
Revenue/carload ($) |
|
4,533 |
|
3,941 |
|
15 |
% |
13 |
% |
For the year ended December 31, 2022, revenues for this commodity group increased by $308 million, or 12%, when compared to 2021, mainly due to higher fuel surcharge revenue, freight rate increases and increased volumes of U.S. grain and the positive translation impact of a weaker Canadian dollar; partly offset by significantly lower export volumes of Canadian grain in the first half of 2022 compared to record volumes in the prior year and reduced potash shipments.
Revenue per RTM increased by 19% in 2022 when compared to 2021, mainly due to higher fuel surcharge revenue, freight rate increases, a decrease in the average length of haul and the positive translation impact of a weaker Canadian dollar.
Intermodal
|
|
|
|
|
|
|
|
|
|
|
|
|
|
|
|
|
|
|
Year ended December 31, |
2022 |
2021 |
% Change |
% Change
at constant
currency |
Revenues (millions) |
$ |
4,906 |
|
$ |
4,115 |
|
19 |
% |
18 |
% |
RTMs (millions) |
56,029 |
|
58,412 |
|
(4 |
%) |
(4 |
%) |
Revenue/RTM (cents) |
8.76 |
|
7.04 |
|
24 |
% |
23 |
% |
Carloads (thousands) |
2,450 |
|
2,611 |
|
(6 |
%) |
(6 |
%) |
Revenue/carload ($) |
|
2,002 |
|
1,576 |
|
27 |
% |
26 |
% |
For the year ended December 31, 2022, revenues for this commodity group increased by $791 million, or 19%, when compared to 2021, mainly due to higher fuel surcharge revenue, an increase in ancillary services including container storage, freight rate increases and the positive translation impact of a weaker Canadian dollar; partly offset by lower international container traffic volumes via the port of Vancouver as a result of supply chain congestion.
Revenue per RTM increased by 24% in 2022 when compared to 2021, mainly due to higher fuel surcharge revenue, an increase in ancillary services including container storage, freight rate increases and the positive translation impact of a weaker Canadian dollar.
Automotive
|
|
|
|
|
|
|
|
|
|
|
|
|
|
|
|
|
|
|
Year ended December 31, |
2022 |
2021 |
% Change |
% Change
at constant
currency |
Revenues (millions) |
$ |
797 |
|
$ |
576 |
|
38 |
% |
34 |
% |
RTMs (millions) |
2,822 |
|
2,395 |
|
18 |
% |
18 |
% |
Revenue/RTM (cents) |
28.24 |
|
24.05 |
|
17 |
% |
14 |
% |
Carloads (thousands) |
208 |
|
179 |
|
16 |
% |
16 |
% |
Revenue/carload ($) |
|
3,832 |
|
3,218 |
|
19 |
% |
15 |
% |
For the year ended December 31, 2022, revenues for this commodity group increased by $221 million, or 38%, when compared to 2021, mainly due to higher fuel surcharge revenue, higher volumes of finished vehicles, the positive translation impact of a weaker Canadian dollar and freight rate increases.
Revenue per RTM increased by 17% in 2022 when compared to 2021, mainly due to higher fuel surcharge revenue, the positive translation impact of a weaker Canadian dollar, a decrease in the average length of haul and freight rate increases.
CN | 2023 Annual Report 33
MANAGEMENT'S DISCUSSION AND ANALYSIS
Other revenues
|
|
|
|
|
|
|
|
|
|
|
|
|
|
|
|
|
|
|
Year ended December 31, |
2022 |
2021 |
% Change |
% Change
at constant
currency |
Revenues (millions) |
$ |
538 |
|
$ |
589 |
|
(9 |
%) |
(11 |
%) |
For the year ended December 31, 2022, Other revenues decreased by $51 million, or 9%, when compared to 2021, mainly due to lower revenues for international freight forwarding as a result of closing down CN Worldwide.
Operating expenses
Operating expenses for the year ended December 31, 2022, amounted to $10,267 million compared to $8,861 million in 2021. The increase of $1,406 million, or 16%,was mainly as a result of higher fuel prices, the negative translation impact of a weaker Canadian dollar as well the Recovery of the loss on assets held for sale of $137 million recorded in the first quarter of 2021 resulting from the Company entering into an agreement for the sale of non-core lines; partly offset by Transaction-related costs of $84 million recorded in the third quarter of 2021 resulting from the terminated CN Merger Agreement with KCS.
|
|
|
|
|
|
|
|
|
|
|
|
|
|
|
|
|
|
| In millions |
Year ended December 31, |
2022 |
2021 |
% Change |
% Change
at constant
currency (1)
|
| Labor and fringe benefits |
$ |
2,935 |
|
$ |
2,879 |
|
(2 |
%) |
— |
% |
| Purchased services and material |
2,191 |
|
2,082 |
|
(5 |
%) |
(4 |
%) |
| Fuel |
2,518 |
|
1,513 |
|
(66 |
%) |
(61 |
%) |
| Depreciation and amortization |
1,729 |
|
1,598 |
|
(8 |
%) |
(7 |
%) |
| Equipment rents |
338 |
|
336 |
|
(1 |
%) |
2 |
% |
| Other |
556 |
|
506 |
|
(10 |
%) |
(7 |
%) |
| Recovery of the loss on assets held for sale |
— |
|
(137) |
|
(100 |
%) |
(100 |
%) |
| Transaction-related costs |
— |
|
84 |
|
100 |
% |
100 |
% |
| Total operating expenses |
$ |
10,267 |
|
$ |
8,861 |
|
(16 |
%) |
(13 |
%) |
(1)This non-GAAP measure does not have any standardized meaning prescribed by GAAP and therefore, may not be comparable to similar measures presented by other companies. See the section of this MD&A entitled 2022 Results of operations – Constant currency for an explanation of this non-GAAP measure.
Labor and fringe benefits
Labor and fringe benefits expense increased by $56 million, or 2%, in 2022 when compared to 2021. The increase was mainly due to general wage increases, an incremental wage accrual for the tentative agreements with the U.S. unions and the negative translation impact of a weaker Canadian dollar; partly offset by lower average headcount, lower pension expense and employee termination benefits and severance costs related to a workforce reduction program in the third quarter of 2021.
Purchased services and material
Purchased services and material expense increased by $109 million, or 5%, in 2022 when compared to 2021. The increase was mainly due to higher material costs, the negative translation impact of a weaker Canadian dollar and higher snow clearing and utility costs driven by harsher winter operating conditions; partly offset by lower international freight forwarding expense as a result of closing down CN Worldwide.
Fuel
Fuel expense increased by $1,005 million, or 66%, in 2022 when compared to 2021. The increase was mainly as a result of higher fuel prices and the negative translation impact of a weaker Canadian dollar.
Depreciation and amortization
Depreciation and amortization expense increased by $131 million, or 8%, in 2022 when compared to 2021. The increase was mainly due to a higher depreciable asset base and the negative translation impact of a weaker Canadian dollar.
Equipment rents
Equipment rents expense increased by $2 million, or 1%, in 2022 when compared to 2021. The increase was mainly due to the negative translation impact of a weaker Canadian dollar; partly offset by higher locomotive horsepower-hour income.
34 CN | 2023 Annual Report
MANAGEMENT'S DISCUSSION AND ANALYSIS
Other
Other expense increased by $50 million, or 10% in 2022 when compared to 2021. The increase was mainly due to higher cloud computing costs, travel costs and operating taxes as well as the negative translation impact of a weaker Canadian dollar; partly offset by higher passenger train recoveries.
Recovery of loss on assets held for sale
Recovery of loss on assets held for sale of $137 million in the first quarter of 2021 resulting from the Company entering into an agreement with a short line operator, for the sale of non-core lines in Wisconsin, Michigan and Ontario representing 850 miles that were classified as assets held for sale plus an additional 50 miles of track and roadway assets. See Note 6 – Assets held for sale to the Company's 2022 Annual Consolidated Financial Statements for additional information.
Transaction-related costs
For the year ended December 31, 2021, the Company incurred transaction costs related to the terminated CN Merger Agreement of $84 million, consisting of $125 million of transaction-related costs; US$700 million ($845 million) paid to KCS and reported as an advance to KCS in the second quarter and expensed in the third quarter; and the related refund received of US$700 million ($886 million) in the third quarter. See Note 4 – Acquisition to the Company's 2022 Annual Consolidated Financial Statements for additional information.
Other income and expenses
Interest expense
In 2022, Interest expense was $548 million compared to $610 million in 2021. The decrease was mainly due to amortization of bridge financing and other fees of $97 million recorded in 2021 (see Note 4 – Acquisition to the Company's 2022 Annual Consolidated Financial Statements for additional information); partly offset by a higher average level of debt and a negative translation impact of a weaker Canadian dollar.
Other components of net periodic benefit income
In 2022, Other components of net periodic benefit income was $498 million compared to $407 million in 2021. The increase was mainly due to lower amortization of net actuarial loss and higher expected return on assets; partly offset by higher interest cost.
Merger termination fee
In 2021, the Company received a US$700 million ($886 million) termination fee resulting from KCS terminating the CN Merger Agreement and entering into a merger agreement with CP. See Note 4 – Acquisition to the Company's 2022 Annual Consolidated Financial Statements for additional information.
Other income (loss)
In 2022, Other loss was $27 million compared to Other income of $43 million in 2021. The unfavorable variance was mainly due to fluctuations in the fair value of an equity investment in autonomous driving technology.
Income tax expense
In 2022, the Company recorded an income tax expense of $1,645 million compared to an income tax expense of $1,443 million in 2021.
The effective tax rate for 2022 was 24.3% compared to 22.8% in 2021. The increase in the effective tax rate was mainly attributable to the merger termination fee, transaction-related costs, and bridge financing and other fees resulting from the KCS transaction recorded in the 2021 Consolidated Statements of Income, taxed at a lower inclusion rate.
CN | 2023 Annual Report 35
MANAGEMENT'S DISCUSSION AND ANALYSIS
Summary of quarterly financial data
|
|
|
|
|
|
|
|
|
|
|
|
|
|
|
|
|
|
|
|
|
|
|
|
|
|
|
|
|
|
|
2023 |
2022 |
|
Quarters |
Quarters |
| In millions, except per share data |
Fourth |
Third |
Second |
First |
Fourth |
Third |
Second |
First |
| Revenues |
$ |
4,471 |
|
$ |
3,987 |
|
$ |
4,057 |
|
$ |
4,313 |
|
$ |
4,542 |
|
$ |
4,513 |
|
$ |
4,344 |
|
$ |
3,708 |
|
Operating income (1) |
$ |
1,818 |
|
$ |
1,517 |
|
$ |
1,600 |
|
$ |
1,662 |
|
$ |
1,912 |
|
$ |
1,932 |
|
$ |
1,769 |
|
$ |
1,227 |
|
Net income (1) |
$ |
2,130 |
|
$ |
1,108 |
|
$ |
1,167 |
|
$ |
1,220 |
|
$ |
1,420 |
|
$ |
1,455 |
|
$ |
1,325 |
|
$ |
918 |
|
| Basic earnings per share |
$ |
3.30 |
|
$ |
1.69 |
|
$ |
1.76 |
|
$ |
1.83 |
|
$ |
2.10 |
|
$ |
2.13 |
|
$ |
1.92 |
|
$ |
1.31 |
|
Diluted earnings per share (1) |
$ |
3.29 |
|
$ |
1.69 |
|
$ |
1.76 |
|
$ |
1.82 |
|
$ |
2.10 |
|
$ |
2.13 |
|
$ |
1.92 |
|
$ |
1.31 |
|
| Dividends per share |
$ |
0.7900 |
|
$ |
0.7900 |
|
$ |
0.7900 |
|
$ |
0.7900 |
|
$ |
0.7325 |
|
$ |
0.7325 |
|
$ |
0.7325 |
|
$ |
0.7325 |
|
(1)Certain quarters include items that management believes do not necessarily arise as part of CN's normal day-to-day operations and can distort the analysis of trends in business performance. See the section of this MD&A entitled Non-GAAP measures – Adjusted performance measures for additional information on these items.
Revenues generated by the Company during the year are influenced by seasonal weather conditions, general economic conditions, cyclical demand for rail transportation and competitive forces in the transportation marketplace (see the section entitled Business risks of this MD&A for additional information). Operating expenses reflect the impact of freight volumes, seasonal weather conditions, labor costs, fuel prices, and the Company's productivity initiatives. Fluctuations in the Canadian dollar relative to the US dollar have also affected the conversion of the Company's US dollar-denominated revenues and expenses and resulted in fluctuations in Net income in the rolling eight quarters presented above.
2023 Fourth quarter operating results
Revenues for the fourth quarter of 2023 were $4,471 million compared to $4,542 million in 2022. The decrease of $71 million, or 2%, was mainly due to lower shipments of intermodal and grain, primarily as a result of weaker demand for freight services to move consumer goods, the lingering negative impact of the Canadian West Coast dock workers strike and increased global grain supply; as well as lower container storage fees and lower fuel surcharge revenues as a result of lower fuel prices; partly offset by freight rate increases and higher shipments of potash, natural gas liquids and refined petroleum products.
Fuel surcharge revenues decreased by $114 million in the fourth quarter of 2023 when compared to 2022, mainly due to lower fuel prices.
Operating expenses for the fourth quarter of 2023 increased by $23 million, or 1%, to $2,653 million, when compared to the same period in 2022. The increase was mainly due to higher Labor and fringe benefits expense mainly driven by general wage increases and higher average headcount and higher personal injury and legal claim provisions; partly offset by lower fuel prices.
Operating income for the fourth quarter of 2023 decreased by $94 million, or 5%, to $1,818 million, when compared to the same period in 2022. The operating ratio was 59.3% in the fourth quarter of 2023 compared to 57.9% in the fourth quarter of 2022, a 1.4-point increase.
Net income for the fourth quarter of 2023 was $2,130 million, an increase of $710 million, or 50%, when compared to the same period in 2022, and diluted earnings per share increased by 57% to $3.29. The increase was mainly due to a net deferred income tax recovery of $713 million resulting from tax filings consistent with a ruling that the Company received in a non-U.S. foreign jurisdiction in connection with prior taxation years.
36 CN | 2023 Annual Report
MANAGEMENT'S DISCUSSION AND ANALYSIS
Financial position
The following tables provide an analysis of the Company's balance sheet as at December 31, 2023 as compared to 2022. Assets and liabilities denominated in US dollars have been translated to Canadian dollars using the foreign exchange rate in effect at the balance sheet date. As at December 31, 2023 and 2022, the foreign exchange rates were $1.3243 and $1.3554 per US$1.00, respectively.
|
|
|
|
|
|
|
|
|
|
|
|
|
|
|
|
|
|
| In millions |
As at December 31, |
2023 |
2022 |
Variance |
Explanation of variance |
| Total assets |
$ |
52,666 |
|
$ |
50,662 |
|
$ |
2,004 |
|
|
| Cash and cash equivalents and restricted cash and cash equivalents |
924 |
|
834 |
|
90 |
|
Refer to the Consolidated Statements of Cash Flows of the Company’s 2023 Annual Consolidated Financial Statements. |
| Other current assets, excluding cash and cash equivalents and restricted cash and cash equivalents |
2,165 |
|
2,383 |
|
(218) |
|
Decrease primarily due to lower accounts receivable, prepaid expenses and income taxes receivable. |
| Properties |
44,617 |
|
43,537 |
|
1,080 |
|
See the section of this MD&A entitled Liquidity and capital resources - Investing activities, increase primarily due to gross property additions of $3,217 million, partly offset by depreciation of $1,811 million and the effect of foreign exchange. |
| Operating lease right-of-use-assets |
424 |
|
470 |
|
(46) |
|
Decrease primarily due to lower lease renewals. |
| Pension asset |
3,140 |
|
3,033 |
|
107 |
|
Increase primarily due to actual returns of $1,867 million, partly offset by actuarial losses arising from the reduction in the year-end discount rate from 5.26% to 4.64% of $1,013 million, interest cost of $671 million and current service cost of $78 million. |
Deferred income tax assets |
682 |
|
— |
|
682 |
|
Represents the tax impact of unamortized tax-deductible goodwill. |
| Intangible assets, goodwill and other |
714 |
|
405 |
|
309 |
|
Increase primarily due to the acquisition of the shares of IANR. See Note 4 - Business acquisitions and combinations to the Company's 2023 Annual Consolidated Financial Statements for additional information. |
| Total liabilities and shareholders' equity |
$ |
52,666 |
|
$ |
50,662 |
|
$ |
2,004 |
|
|
| Accounts payable and other excluding current portion of operating lease liabilities |
2,578 |
|
2,660 |
|
(82) |
|
Decrease primarily due to timing of payments for payroll-related accruals, partly offset by higher accrued charges. |
Deferred income tax liabilities |
10,066 |
|
9,796 |
|
270 |
|
Increase primarily due to a deferred income tax expense of $394 million recorded in Net income, partly offset by a foreign exchange loss of $100 million and a deferred income tax recovery of $29 million recorded in Other comprehensive income. The deferred income expense and recovery were mostly attributable to new temporary differences generated during the year. |
| Other liabilities and deferred credits |
522 |
|
441 |
|
81 |
|
Increase primarily due to higher contract liabilities and higher provisions for personal injury and other claims. |
| Pension and other postretirement benefits |
495 |
|
486 |
|
9 |
|
Increase primarily due to interest cost of $39 million, actuarial losses arising from the reduction in year-end discount rates of $24 million, partly offset by actual returns of $25 million and employer contributions of $25 million. |
| Total long-term debt, including the current portion |
18,473 |
|
15,429 |
|
3,044 |
|
See the section of this MD&A entitled Liquidity and capital resources - Financing activities, increase primarily due to the issuance of Notes and the net issuance of commercial paper, partly offset by the effect of foreign exchange. |
| Operating lease liabilities including the current portion |
415 |
|
466 |
|
(51) |
|
Decrease primarily due to lower lease renewals. |
| Total shareholders' equity |
20,117 |
|
21,384 |
|
(1,267) |
|
Refer to the Consolidated Statements of Changes in Shareholders’ Equity of the Company’s 2023 Annual Consolidated Financial Statements. |
CN | 2023 Annual Report 37
MANAGEMENT'S DISCUSSION AND ANALYSIS
Liquidity and capital resources
The Company's principal source of liquidity is cash generated from operations, which is supplemented by borrowings in the money markets and capital markets. To meet its short-term liquidity needs, the Company has access to various financing sources, including unsecured revolving credit facilities, commercial paper programs, and an accounts receivable securitization program. In addition to these sources, the Company can use equipment loans or issue debt securities to meet its longer-term liquidity needs. The strong focus on cash generation from all sources gives the Company increased flexibility in terms of meeting its financing requirements.
The Company's primary short-term and long-term cash requirements are discussed below:
•Short-term cash requirements: includes working capital requirements, such as labor and fringe benefits, fuel, income tax instalments, pension contributions, and contractual obligations; interest and principal payments on current debt financing; dividends; and share repurchases.
•Long-term cash requirements: includes capital expenditures relating to track infrastructure and other, interest and principal repayments of long-term debt financing, operating and finance lease obligations; business acquisitions and long-term contractual obligations.
The Company sets priorities on its uses of available funds based on short-term operational requirements, expenditures to continue to operate a safe railway and pursue strategic initiatives, while also considering its long-term contractual obligations and returning value to its shareholders; and as part of its financing strategy, the Company regularly reviews its capital structure, cost of capital, and the need for additional debt financing. For a summary of short-term and long-term contractual obligations, including material cash requirements related to such obligations, refer to the table within this section entitled Contractual obligations.
The Company has a working capital deficit, which is common in the capital-intensive rail industry, and is not an indication of a lack of liquidity. The Company maintains adequate resources to meet daily cash requirements, and has sufficient financial capacity to manage its day-to-day cash requirements and current obligations. As at December 31, 2023 and 2022, the Company had Cash and cash equivalents of $475 million and $328 million, respectively; Restricted cash and cash equivalents of $449 million and $506 million, respectively; and a working capital deficit of $1,946 million and $625 million, respectively. (1) The increase in the working capital deficit was mainly due to higher commercial paper. The cash and cash equivalents pledged as collateral for a minimum term of one month pursuant to the Company's bilateral letter of credit facilities are recorded as Restricted cash and cash equivalents. There are currently no specific requirements relating to working capital other than in the normal course of business as discussed herein.
The Company's U.S. and other foreign subsidiaries maintain sufficient cash to meet their respective operational requirements. If the Company should require more liquidity in Canada than is generated by its domestic operations, the Company could decide to repatriate funds associated with undistributed earnings of its foreign operations, including its U.S. and other foreign subsidiaries. The impact on liquidity resulting from the repatriation of funds held outside Canada would not be significant as such repatriation of funds would not cause significant tax implications to the Company under the tax laws of Canada and the U.S. and other foreign tax jurisdictions, and the tax treaties currently in effect between them.
The Company expects cash from operations and its various sources of financing to be sufficient to meet its ongoing obligations. The Company is not aware of any trends or expected fluctuations in its liquidity that would impact its ongoing operations or financial condition as of the date of this MD&A.
(1)The Company defines working capital as current assets of $3,089 million (2022 - $3,217 million) less current liabilities of $5,035 million (2022 - $3,842 million).
Available financing sources
Shelf prospectus and registration statement
On May 4, 2022, the Company filed a shelf prospectus with Canadian securities regulators and a registration statement with the SEC, pursuant to which CN may issue up to $6.0 billion of debt securities in the Canadian and U.S. capital markets over a 25-month period following the filing date. This shelf prospectus and registration statement replaced CN's previous shelf prospectus and registration statement that expired on March 11, 2022.
As at December 31, 2023, the remaining capacity of this shelf prospectus and registration statement was $1.5 billion. Access to the Canadian and U.S. capital markets under the shelf prospectus and registration statement is dependent on market conditions.
38 CN | 2023 Annual Report
MANAGEMENT'S DISCUSSION AND ANALYSIS
The Company's access to long-term funds in the capital markets depends on its credit ratings and market conditions. The Company believes that it continues to have access to the capital markets. If the Company were unable to borrow funds at acceptable rates in the capital markets, the Company could borrow under its credit facilities, draw down on its accounts receivable securitization program, access the pledged cash under its letter of credit facilities, raise cash by disposing of surplus properties or otherwise monetizing assets, reduce discretionary spending or take a combination of these measures to assure that it has adequate funding for its business.
Revolving credit facilities
The Company has unsecured revolving credit facilities with a consortium of lenders. The unsecured credit facility of $2.5 billion is available for general corporate purposes and backstopping the Company's commercial paper programs. The facility consists of two tranches of $1.25 billion and was amended on March 17, 2023 to extend its tenor by one year to March 31, 2026 and March 31, 2028. This revolving credit facility agreement is structured as a sustainability linked loan whereby its applicable margins are adjusted up or down based on the Company's performance under certain sustainability targets. The unsecured credit facility of $1.0 billion is available for general corporate purposes and was amended on March 17, 2023 to extend its tenor by one year to March 17, 2025. Both credit facilities provide borrowings at various benchmark interest rates, such as the Secured Overnight Financing Rate (SOFR) and the Canadian Dollar Offered Rate (CDOR), plus applicable margins, based on CN's credit ratings. The facilities were also amended in March 2023 to include fallback language that addresses the cessation of CDOR and adoption of the Canadian Overnight Repo Rate Average (CORRA) as the alternative benchmark.
As at December 31, 2023 and 2022, the Company had no outstanding borrowings under these revolving credit facilities.
Equipment loans
The Company has various secured non-revolving term loan credit facilities for financing or refinancing the purchase of equipment. The equipment loans made under the non-revolving credit facilities have a tenor at inception varying from 15 to 20 years and are secured by rolling stock.
On March 31, 2023, the Company entered into new loan supplements to the existing agreement for an additional principal amount of US$304 million, which is available to be drawn, in Canadian or U.S. dollars, through March 31, 2024. On November 3, 2023, the Company entered into a new term loan facility for a principal amount of $366 million, which is available to be drawn through November 4, 2024. Borrowings under the non-revolving term loan facilities are provided at SOFR and/or CDOR, plus applicable margins. On March 31, 2023, outstanding loans referencing the London Interbank Offered Rate (LIBOR), were transitioned to SOFR. The facilities also include fallback language that addressed the cessation of CDOR and adoption of CORRA as the alternative benchmark. The Company made no draws under these facilities in 2023.
As at December 31, 2023, the Company had outstanding borrowings of $677 million (2022 - $734 million) and had $769 million (2022 - $nil) available to be drawn under this these facilities.
Commercial paper
The Company has a commercial paper program in Canada and in the U.S. Both programs are backstopped by the Company's revolving credit facility. The maximum aggregate principal amount of commercial paper that can be issued is $2.5 billion, or the US dollar equivalent, on a combined basis. The commercial paper programs, which are subject to market rates in effect at the time of financing, provide the Company with a flexible financing alternative, and can be used for general corporate purposes. The cost of commercial paper and access to the commercial paper market in Canada and the U.S. are dependent on credit ratings and market conditions. If the Company were to lose access to its commercial paper program for an extended period of time, the Company could rely on its revolving credit facilities to meet its short-term liquidity needs.
As at December 31, 2023 and 2022, the Company had total commercial paper borrowings of US$1,360 million ($1,801 million) and US$594 million ($805 million), respectively, presented in Current portion of long-term debt on the Consolidated Balance Sheets.
Accounts receivable securitization program
The Company has an agreement to sell an undivided co-ownership interest in a revolving pool of accounts receivable to unrelated trusts for maximum cash proceeds of $450 million. On January 19, 2023, the Company extended the term of its agreement by one year to February 1, 2025. The trusts are multi-seller trusts and the Company is not the primary beneficiary. Funding for the acquisition of these assets is customarily through the issuance of asset-backed commercial paper notes by the unrelated trusts.
CN | 2023 Annual Report 39
MANAGEMENT'S DISCUSSION AND ANALYSIS
The Company has retained the responsibility for servicing, administering and collecting the receivables sold. The average servicing period is approximately one month and the interest on borrowings under the accounts receivable securitization program is renewed based on commercial paper rates then in effect or SOFR or CDOR if the commercial paper market is inaccessible and includes fallback language that allows for the succession of CDOR to an alternative rate consistent with market convention. Subject to customary indemnifications, each trust's recourse is limited to the accounts receivable transferred.
The accounts receivable securitization program provides the Company with readily available short-term financing for general corporate use. In the event the program is terminated before its scheduled maturity, the Company expects to meet its future payment obligations through its various sources of financing including its revolving credit facilities and commercial paper program, and/or access to capital markets.
As at December 31, 2023, and 2022 the Company had no outstanding borrowings under the accounts receivable securitization program.
Bilateral letter of credit facilities
The Company has a series of committed and uncommitted bilateral letter of credit facility agreements. On March 17, 2023, the Company extended the maturity date of its committed bilateral letter of credit facility agreements to April 28, 2026. The agreements are held with various banks to support the Company's requirements to post letters of credit in the ordinary course of business. Under these agreements, the Company has the option from time to time to pledge collateral in the form of cash or cash equivalents, for a minimum term of one month, equal to at least the face value of the letters of credit issued.
As at December 31, 2023, the Company had outstanding letters of credit of $337 million (2022 - $396 million) under the committed facilities from a total available amount of $361 million (2022 - $470 million) and $152 million (2022 - $100 million) under the uncommitted facilities.
As at December 31, 2023, included in Restricted cash and cash equivalents was $339 million (2022 - $397 million) pledged as collateral under the committed bilateral letter of credit facilities, $100 million (2022 - $100 million) pledged as collateral under the uncommitted bilateral letter of credit facilities, and $10 million (2022 - $9 million) held in escrow.
Additional information relating to the Company's financing sources is provided in Note 16 – Debt to the Company's 2023 Annual Consolidated Financial Statements.
Credit ratings
The Company's ability to access funding in the debt capital markets and the cost and amount of funding available depends in part on its credit ratings. Rating downgrades could limit the Company's access to the capital markets, or increase its borrowing costs.
In the second quarter of 2023 the rating agencies took the following actions:
•DBRS maintained the outlook at stable and confirmed CN's long-term and short-term ratings at current levels at A and R-1 (low).
•Moody's Investors Service changed their outlook from negative to stable and confirmed the long-term and short-term debt ratings at A2 and P-1 respectively.
•S&P Global Ratings changed their outlook from negative to stable and downgraded the long-term debt rating from A to A- and the commercial paper rating from A-1 to A-2.
The following table provides the Company's long-term debt and commercial paper credit ratings as of the date of this MD&A:
|
|
|
|
|
|
|
|
|
|
|
|
|
Outlook |
Long-term debt rating (1) |
Commercial paper rating (1) |
| DBRS Morningstar |
Stable |
A |
R-1 (low) |
| Moody's Investors Service |
Stable |
A2 |
P-1 |
S&P Global Ratings |
Stable |
A- |
A-2 |
(1)These credit ratings are not recommendations to purchase, hold, or sell the securities referred to above. Ratings may be revised or withdrawn at any time by the credit rating agencies. Each credit rating should be evaluated independently of any other credit rating.
40 CN | 2023 Annual Report
MANAGEMENT'S DISCUSSION AND ANALYSIS
Cash flows
|
|
|
|
|
|
|
|
|
|
|
|
|
|
|
|
|
|
| In millions |
Year ended December 31, |
2023 |
2022 |
Variance |
| Net cash provided by operating activities |
$ |
6,965 |
|
$ |
6,667 |
|
$ |
298 |
|
| Net cash used in investing activities |
(3,468) |
|
(2,510) |
|
(958) |
|
| Net cash used in financing activities |
(3,406) |
|
(4,667) |
|
1,261 |
|
Effect of foreign exchange fluctuations on cash, cash equivalents, restricted cash, and restricted cash equivalents |
(1) |
|
3 |
|
(4) |
|
|
Net increase (decrease) in cash, cash equivalents, restricted cash, and
restricted cash equivalents
|
90 |
|
(507) |
|
597 |
|
|
Cash, cash equivalents, restricted cash, and restricted cash equivalents,
beginning of year
|
834 |
|
1,341 |
|
(507) |
|
| Cash, cash equivalents, restricted cash, and restricted cash equivalents, end of year |
$ |
924 |
|
$ |
834 |
|
$ |
90 |
|
Free cash flow
Free cash flow is a useful measure of liquidity as it demonstrates the Company's ability to generate cash for debt obligations and for discretionary uses such as payment of dividends, share repurchases and strategic opportunities. The Company defines its free cash flow measure as the difference between net cash provided by operating activities and net cash used in investing activities, adjusted for the impact of (i) business acquisitions and combinations and (ii) merger transaction-related payments, cash receipts and cash income taxes, which are items that are not indicative of operating trends. Free cash flow does not have any standardized meaning prescribed by GAAP and therefore, may not be comparable to similar measures presented by other companies.
The following table provides a reconciliation of Net cash provided by operating activities in accordance with GAAP, as reported for the years ended December 31, 2023, 2022 and 2021, to the non-GAAP free cash flow presented herein:
|
|
|
|
|
|
|
|
|
|
|
|
|
|
|
|
| In millions |
Year ended December 31, |
2023 |
2022 |
2021 |
| Net cash provided by operating activities |
$ |
6,965 |
|
$ |
6,667 |
|
$ |
6,971 |
|
| Net cash used in investing activities |
(3,468) |
|
(2,510) |
|
(2,873) |
|
| Net cash provided before financing activities |
3,497 |
|
4,157 |
|
4,098 |
|
| Adjustments: |
|
|
|
|
|
Business acquisitions and combinations (1) |
390 |
|
— |
|
— |
|
Cash income taxes for merger transaction-related payments and cash receipts (2) |
— |
|
102 |
|
— |
|
Transaction-related costs (3) |
|
|
— |
|
— |
|
125 |
|
Advance for acquisition (4) |
|
|
— |
|
— |
|
845 |
|
Refund of advance for acquisition (4) |
|
|
— |
|
— |
|
(886) |
|
Merger termination fee (4) |
— |
|
— |
|
(886) |
|
| Total adjustments |
|
|
$ |
390 |
|
$ |
102 |
|
$ |
(802) |
|
| Free cash flow |
$ |
3,887 |
|
$ |
4,259 |
|
$ |
3,296 |
|
(1)Relates to the acquisition of the shares of Iowa Northern Railway Company for $312 million and the business combination of Cape Breton & Central Nova Scotia Railway for $78 million. See Note 4 – Business acquisitions and combinations to the Company's 2023 Annual Consolidated Financial Statements for additional information.
(2)Relates to income tax payments of $102 million for KCS merger transaction-related payments and cash receipts. See Note 4 – Business acquisitions and combinations to the Company's 2023 Annual Consolidated Financial Statements for additional information.
(3)Relates to transaction-related costs of $125 million paid. See Note 4 – Business acquisitions and combinations to the Company's 2023 Annual Consolidated Financial Statements for additional information.
(4)See Note 4 – Business acquisitions and combinations to the Company's 2023 Annual Consolidated Financial Statements for additional information.
Operating activities
Net cash provided by operating activities increased by $298 million in 2023 when compared to 2022, mainly due to the reduction in accounts receivable and lower income tax payments; partly offset by lower cash earnings.
CN | 2023 Annual Report 41
MANAGEMENT'S DISCUSSION AND ANALYSIS
Pension contributions
The Company's contributions to its various defined benefit pension plans are made in accordance with the applicable legislation in Canada and the U.S. and such contributions follow minimum and maximum thresholds as determined by actuarial valuations. Pension contributions for the years ended December 31, 2023 and 2022 were $51 million and $70 million, respectively. For 2022, given the fully funded status of the CN Pension Plan as determined by the latest actuarial valuation for funding purposes as at December 31, 2021, the Company was prohibited from making contributions once the actuarial valuation report was filed in April 2022. For 2023, based on the results of the December 31, 2022 funding valuations, the CN Pension Plan remained fully funded and at a level such that the Company continues to be prohibited from making contributions to the CN Pension Plan.
Based on the anticipated results of the Company's next actuarial valuations for funding purposes, the CN Pension Plan is expected to remain fully funded and at a level such that the Company would continue to be prohibited from making contributions to the CN Pension Plan in 2024. As such, the Company expects to make total cash contributions of approximately $70 million in 2024 for all other pension plans, and includes the impact of affected non-unionized members transferring from the Company's defined benefit pension plans to defined contribution pension plans effective April 1, 2024.
See the section of this MD&A entitled Critical accounting estimates – Pensions and other postretirement benefits for additional information pertaining to the funding of the Company's pension plans. Additional information relating to the pension plans is provided in Note 18 – Pensions and other postretirement benefits to the Company's 2023 Annual Consolidated Financial Statements.
Income tax payments
The Company is required to make scheduled instalment payments as prescribed by the tax authorities. In Canada, the Company's domestic jurisdiction, tax instalments in a given year are generally based on the prior year's taxable income whereas in the U.S., the Company's predominant foreign jurisdiction, they are based on forecasted taxable income of the current year.
In 2023, net income tax payments were $1,197 million (2022 - $1,288 million). The decrease was mainly due to lower required instalment payments in the U.S. mainly caused by lower pre-tax income.
For 2024, the Company's net income tax payments are expected to be approximately $1.4 billion. The increase is mostly due to higher required instalment payments mainly caused by higher expected pre-tax income.
Investing activities
Net cash used in investing activities increased by $958 million in 2023 when compared to 2022, mainly due to the higher property additions as well as the acquisition of IANR and the business combination of CBNS. See the section of this MD&A entitled 2023 Highlights - Recent developments for additional information pertaining to the IANR and CBNS transactions.
Property additions
|
|
|
|
|
|
|
|
|
|
|
|
|
|
|
| In millions |
Year ended December 31, |
2023 |
2022 |
Track and roadway (1) |
$ |
1,963 |
|
$ |
1,841 |
|
| Rolling stock |
663 |
|
390 |
|
| Buildings |
90 |
|
96 |
|
| Information technology |
302 |
|
293 |
|
| Other |
199 |
|
137 |
|
| Gross property additions |
3,217 |
|
2,757 |
|
| Less: Finance leases |
30 |
|
7 |
|
Property additions (2) |
$ |
3,187 |
|
$ |
2,750 |
|
(1)In 2023, approximately 76% (2022 - 80%) of the Track and roadway property additions were incurred to renew basic infrastructure. Costs relating to normal repairs and maintenance of Track and roadway properties are expensed as incurred, and amounted to approximately 10% of the Company's total operating expenses in 2023 (2022 - 10%).
(2)In 2023 and 2022, property additions included expenditures of $66 million and $16 million, respectively, related to construction obligations in freight contracts for which the Company has received contract consideration (or such consideration is due) from its customers. Such consideration is recorded in Contract liabilities in the Consolidated Balance Sheets and recognized in Revenues over the life of the freight service obligation.
42 CN | 2023 Annual Report
MANAGEMENT'S DISCUSSION AND ANALYSIS
Reinvestment in the business
In 2023, CN spent approximately $3.2 billion in its capital program, of which $1.6 billion were invested to maintain the safety and integrity of its network, particularly track infrastructure. CN's capital spending also included $0.9 billion for strategic initiatives to increase capacity, enable growth and improve network resiliency, including line capacity upgrades and information technology initiatives, and $0.7 billion on equipment, including the acquisition of 500 new grain hopper cars.
Financing activities
Net cash used in financing activities decreased by $1,261 million in 2023 when compared to 2022, mainly due to higher net issuance of debt including commercial paper and lower repurchases of common shares.
Debt financing activities
Debt financing activities in 2023 included the following:
•On November 1, 2023, issuance of US$300 million ($416 million) 5.85% Notes due 2033 and US$300 ($416 million) 6.13% Notes due 2053, in the U.S. capital markets, which resulted in total net proceeds of $824 million;
•On May 15, 2023, repayment of US$150 million ($203 million) 7.63% Notes due 2023 upon maturity;
•On May 10, 2023, issuance of $550 million 4.15% Notes due 2030, $400 million 4.40% Notes due 2033 and $800 million 4.70% Notes due 2053 in the Canadian capital markets, which resulted in total net proceeds of $1,730 million;
•Repayment of equipment loans of $41 million;
•Net issuance of commercial paper of $908 million; and
•Repayment of finance leases of $2 million.
Debt financing activities in 2022 included the following:
•On November 15, 2022, repayment of US$250 million ($332 million) 2.25% Notes due 2022 upon maturity;
•On August 5, 2022, issuance of US$800 million ($1,028 million) 3.85% Notes due 2032 and US$700 million ($900 million) 4.40% Notes due 2052, in the U.S capital markets, which resulted in total net proceeds of $1,901 million;
•Repayment of equipment loans of $40 million;
•Net issuance of commercial paper of $563 million; and
•Repayment of finance leases of $7 million.
Cash obtained from the issuance of debt was used for general corporate purposes, including the redemption and refinancing of outstanding indebtedness and share repurchases. Additional information relating to the Company's outstanding debt securities is provided in Note 16 – Debt to the Company's 2023 Annual Consolidated Financial Statements.
CN | 2023 Annual Report 43
MANAGEMENT'S DISCUSSION AND ANALYSIS
Repurchase of common shares
The Company may repurchase its common shares pursuant to a NCIB at prevailing market prices plus brokerage fees, or such other prices as may be permitted by the Toronto Stock Exchange (TSX). The Company repurchased 26.6 million common shares under its NCIB effective between February 1, 2023 and January 31, 2024, which allowed for the repurchase of up to 32.0 million common shares. Previous NCIBs allowed for the repurchase of up to 42.0 million common shares between February 1, 2022 and January 31, 2023, and up to 14.0 million common shares between February 1, 2021 and January 31, 2022.
|
|
|
|
|
|
|
|
|
|
|
|
|
|
|
|
|
|
|
|
|
| In millions, except per share data |
Year ended December 31, |
2023 |
2022 |
2021 |
Total NCIB |
February 2023 - January 2024 NCIB |
|
|
|
|
| Number of common shares |
26.6 |
|
N/A |
N/A |
26.6 |
|
Weighted-average price per share (1) |
$ |
155.75 |
|
N/A |
N/A |
$ |
155.75 |
|
Amount of repurchase (1) |
$ |
4,142 |
|
N/A |
N/A |
$ |
4,142 |
|
February 2022 - January 2023 NCIB |
|
|
|
|
| Number of common shares |
2.5 |
|
29.4 |
|
N/A |
31.9 |
|
Weighted-average price per share (1) |
$ |
162.88 |
|
$ |
156.06 |
|
N/A |
$ |
156.60 |
|
Amount of repurchase (1) |
$ |
409 |
|
$ |
4,591 |
|
N/A |
$ |
5,000 |
|
February 2021 - January 2022 NCIB (2) |
|
|
|
|
| Number of common shares |
N/A |
0.8 |
|
10.3 |
|
11.1 |
|
Weighted-average price per share (1) |
N/A |
$ |
153.54 |
|
$ |
153.69 |
|
$ |
153.68 |
|
Amount of repurchase (1) |
N/A |
$ |
118 |
|
$ |
1,582 |
|
$ |
1,700 |
|
| Total for the year |
|
|
|
|
| Number of common shares |
29.1 |
|
30.2 |
|
10.3 |
|
|
Weighted-average price per share (1) |
$ |
156.37 |
|
$ |
156.00 |
|
$ |
153.69 |
|
|
Amount of repurchase (1) |
$ |
4,551 |
|
$ |
4,709 |
|
$ |
1,582 |
|
|
(1)Includes brokerage fees.
(2)The Company suspended its share repurchase at the end of April 2021 in connection with the CN Merger Agreement with KCS. Following the termination of the CN Merger Agreement, the Company resumed share repurchases at the end of September 2021.
On January 23, 2024, the Board of Directors of the Company approved a new NCIB, which allows for the repurchase of up to 32.0 million common shares between February 1, 2024 and January 31, 2025.
On August 16, 2022, the U.S. government enacted the Inflation Reduction Act (IRA). The IRA imposes a one percent excise tax on specified repurchases of stock by certain publicly traded corporations, effective for repurchases after December 31, 2022. The amount on which the tax is imposed is reduced by the value of any stock issued by such corporation during the tax year. This provision currently does not impact CN. Future regulations and interpretations are expected to be issued to clarify how the excise tax will be applied in practice and may alter the Company’s initial assessment. Payments of this excise tax, if it became applicable, would increase the cost of making repurchases. It would not, however, affect the Company’s results of operations as they would be accounted for as direct costs of common share repurchases and recorded within Total shareholders’ equity.
On March 28, 2023, the Canadian government introduced draft legislation as part of the 2023 federal budget to implement a new two percent tax on repurchases of stock effective in 2024. If this proposed two percent tax on repurchases of stock is enacted, it is expected to affect the Company. Payments of this excise tax would increase the cost of making repurchases. It would not, however, affect the Company’s results of operations as they would be accounted for as direct costs of common share repurchases and recorded within Total shareholders’ equity. The Company continues to monitor the developments of this draft legislation.
The Company’s NCIB notices may be found online on SEDAR+ at www.sedarplus.ca and on the SEC's website at www.sec.gov through EDGAR. Printed copies may be obtained by contacting the Corporate Secretary’s Office. Information contained on, or accessible through, our website is not incorporated by reference into this MD&A.
44 CN | 2023 Annual Report
MANAGEMENT'S DISCUSSION AND ANALYSIS
Share Trusts
The Company's Employee Benefit Plan Trusts ("Share Trusts") purchase CN's common shares on the open market, which are used to deliver common shares under the Share Units Plan and the Employee Share Investment Plan (ESIP). Shares purchased by the Share Trusts are retained until the Company instructs the trustee to transfer shares to participants of the Share Units Plan or the ESIP. Additional information relating to Share Trusts is provided in Note 19 – Share capital to the Company's 2023 Annual Consolidated Financial Statements.
Share purchases
|
|
|
|
|
|
|
|
|
|
|
|
|
|
|
| In millions, except per share data |
Year ended December 31, |
2023 |
2022 |
2021 |
| Share purchases by Share Units Plan Share Trusts |
|
|
|
|
| Number of common shares |
|
— |
|
0.5 |
|
— |
|
| Weighted-average price per share |
|
$ |
— |
|
$ |
170.85 |
|
$ |
— |
|
| Amount of purchase |
|
$ |
— |
|
$ |
81 |
|
$ |
— |
|
| Share purchases by ESIP Share Trusts |
|
|
|
|
| Number of common shares |
|
0.2 |
|
0.2 |
|
0.2 |
|
| Weighted-average price per share |
|
$ |
156.89 |
|
$ |
155.53 |
|
$ |
142.90 |
|
| Amount of purchase |
|
$ |
28 |
|
$ |
24 |
|
$ |
26 |
|
| Total purchases |
|
$ |
28 |
|
$ |
105 |
|
$ |
26 |
|
Share settlements
|
|
|
|
|
|
|
|
|
|
|
|
|
|
|
| In millions, except per share data |
Year ended December 31, |
2023 |
2022 |
2021 |
| Share settlements by Share Units Plan Share Trusts |
|
|
|
|
| Number of common shares |
|
0.3 |
|
0.2 |
|
0.2 |
|
| Weighted-average price per share |
|
$ |
122.08 |
|
$ |
88.23 |
|
$ |
88.23 |
|
| Amount of settlement |
|
$ |
31 |
|
$ |
15 |
|
$ |
20 |
|
| Share settlements by ESIP Share Trusts |
|
|
|
|
| Number of common shares |
|
0.2 |
|
0.2 |
|
0.2 |
|
| Weighted-average price per share |
|
$ |
151.32 |
|
$ |
141.60 |
|
$ |
128.40 |
|
| Amount of settlements |
|
$ |
23 |
|
$ |
23 |
|
$ |
18 |
|
| Total settlements |
|
$ |
54 |
|
$ |
38 |
|
$ |
38 |
|
CN | 2023 Annual Report 45
MANAGEMENT'S DISCUSSION AND ANALYSIS
Dividends paid
During 2023, the Company paid quarterly dividends of $0.7900 per share amounting to $2,071 million, compared to $2,004 million, at the rate of $0.7325 per share, in 2022 and $1,740 million, at the rate of $0.6150 per share, in 2021. On January 23, 2024, the Company's Board of Directors approved an increase of 7% to the quarterly dividend to common shareholders, from $0.7900 per share in 2023 to $0.8450 per share in 2024.
The following is a summary of the dividends paid and dividends per share for the last five one-year periods ended December 31, 2023, 2022, 2021, 2020 and 2019. CN's dividend growth rate has increased at a compound annual growth rate (CAGR) of 10% over the last 5 years:
Contractual obligations
In the normal course of business, the Company incurs contractual obligations. The following table sets forth the Company's contractual obligations and related cash requirements for the following items as at December 31, 2023:
|
|
|
|
|
|
|
|
|
|
|
|
|
|
|
|
|
|
|
|
|
|
|
|
|
|
|
| In millions |
Total |
2024 |
2025 |
2026 |
2027 |
2028 |
2029 & thereafter |
Debt obligations (1) |
$ |
18,435 |
|
$ |
2,309 |
|
$ |
383 |
|
$ |
695 |
|
$ |
34 |
|
$ |
1,014 |
|
$ |
14,000 |
|
| Interest on debt obligations |
12,834 |
|
738 |
|
722 |
|
700 |
|
689 |
|
686 |
|
9,299 |
|
| Finance lease obligations |
39 |
|
31 |
|
2 |
|
4 |
|
1 |
|
1 |
|
— |
|
Operating lease obligations (2) |
451 |
|
131 |
|
111 |
|
74 |
|
48 |
|
29 |
|
58 |
|
Purchase obligations (3) |
2,222 |
|
1,785 |
|
128 |
|
63 |
|
45 |
|
201 |
|
— |
|
Other long-term liabilities (4) |
1,019 |
|
90 |
|
68 |
|
53 |
|
49 |
|
46 |
|
713 |
|
| Total contractual obligations |
$ |
35,000 |
|
$ |
5,084 |
|
$ |
1,414 |
|
$ |
1,589 |
|
$ |
866 |
|
$ |
1,977 |
|
$ |
24,070 |
|
(1)Presented net of unamortized discounts and debt issuance costs and excludes finance lease obligations.
(2)Includes $70 million related to renewal options reasonably certain to be exercised and $36 million of imputed interest.
(3)Includes fixed and variable commitments for locomotives, engineering services, information technology services and licenses, railroad cars, rail, rail ties, wheels as well as other equipment and services. Costs of variable commitments were estimated using forecasted prices and volumes.
(4)Includes expected payments for workers' compensation, pension benefit payments for the Company's non-registered supplemental pension plan, postretirement benefits other than pensions, net unrecognized tax benefits and environmental liabilities.
46 CN | 2023 Annual Report
MANAGEMENT'S DISCUSSION AND ANALYSIS
Adjusted debt-to-adjusted EBITDA multiple
Management believes that the adjusted debt-to-adjusted EBITDA multiple is a useful credit measure because it reflects the Company's ability to service its debt and other long-term obligations. The Company calculates the adjusted debt-to-adjusted EBITDA multiple as adjusted debt divided by the last twelve months of adjusted EBITDA. Adjusted debt is defined as the sum of Long-term debt and Current portion of long-term debt as reported on the Company’s Consolidated Balance Sheets as well as Operating lease liabilities, including current portion and pension plans in deficiency recognized on the Company's Consolidated Balance Sheets due to the debt-like nature of their contractual and financial obligations. Adjusted EBITDA is calculated as Net income excluding Interest expense, Income tax expense, Depreciation and amortization, operating lease cost, Other components of net periodic benefit income, Other income (loss), and other significant items that are not reflective of CN's underlying business operations and which could distort the analysis of trends in business performance. Adjusted debt and adjusted EBITDA are non-GAAP measures used to compute the Adjusted debt-to-adjusted EBITDA multiple. These measures do not have any standardized meaning prescribed by GAAP and therefore, may not be comparable to similar measures presented by other companies.
The following table provides a reconciliation of debt and Net income in accordance with GAAP, reported as at and for the years ended December 31, 2023, 2022 and 2021, respectively, to adjusted debt and adjusted EBITDA, which have been used to calculate the non-GAAP adjusted debt-to-adjusted EBITDA multiple:
|
|
|
|
|
|
|
|
|
|
|
|
|
|
|
| In millions, unless otherwise indicated |
As at and for the year ended December 31, |
2023 |
2022 |
2021 |
| Debt |
$ |
18,473 |
|
$ |
15,429 |
|
$ |
12,485 |
|
| Adjustments: |
|
|
|
Operating lease liabilities, including current portion (1) |
415 |
|
466 |
|
430 |
|
Pension plans in deficiency (2) |
362 |
|
353 |
|
447 |
|
| Adjusted debt |
$ |
19,250 |
|
$ |
16,248 |
|
$ |
13,362 |
|
Net income |
$ |
5,625 |
|
$ |
5,118 |
|
$ |
4,899 |
|
| Interest expense |
722 |
|
548 |
|
610 |
|
Income tax expense |
863 |
|
1,645 |
|
1,443 |
|
| Depreciation and amortization |
1,817 |
|
1,729 |
|
1,598 |
|
Operating lease cost (3) |
149 |
|
142 |
|
131 |
|
Other components of net periodic benefit income |
(479) |
|
(498) |
|
(407) |
|
| Other loss (income) |
(134) |
|
27 |
|
(43) |
|
|
|
|
|
| Adjustments: |
|
|
|
Workforce reduction program (4) |
|
— |
|
— |
|
39 |
|
Advisory fees related to shareholder matters (5) |
— |
|
22 |
|
20 |
|
Recovery on assets held for sale (6) |
— |
|
— |
|
(137) |
|
Transaction-related costs (7) |
|
— |
|
— |
|
84 |
|
Merger termination fee (8) |
|
— |
|
— |
|
(886) |
|
| Adjusted EBITDA |
$ |
8,563 |
|
$ |
8,733 |
|
$ |
7,351 |
|
Adjusted debt-to-adjusted EBITDA multiple (times) |
2.25 |
|
1.86 |
|
1.82 |
|
(1)Represents the present value of operating lease payments. See Note 13 – Leases to the Company's 2023 Annual Consolidated Financial Statements for additional information.
(2)Represents the total funded deficit of all defined benefit pension plans with a projected benefit obligation in excess of plan assets. See Note 18 – Pensions and other postretirement benefits to the Company's 2023 Annual Consolidated Financial Statements for additional information.
(3)Represents the operating lease costs recorded in Purchased services and material and Equipment rents within the Consolidated Statements of Income. See Note 13 – Leases to the Company's 2023 Annual Consolidated Financial Statements for additional information.
(4)Relates to employee termination benefits and severance costs related to a workforce reduction program, recorded in Labor and fringe benefits within the Consolidated Statements of Income. See the section of this MD&A entitled Non-GAAP measures – Adjusted performance measures for additional information.
(5)Relates to advisory fees related to shareholder matters recorded in Other expense within the Consolidated Statements of Income. See the section of this MD&A entitled Non-GAAP measures – Adjusted performance measures for additional information.
(6)Relates to the recovery of $137 million of the $486 million loss on assets held for sale recorded in the second quarter of 2020, resulting from the Company entering into an agreement for the sale of non-core lines. See Note 6 – Assets held for sale to the Company's 2023 Annual Consolidated Financial Statements for additional information.
(7)Relates to transaction costs incurred as a result of the terminated CN Merger Agreement of $84 million, consisting of $125 million of transaction-related costs, partially offset by $41 million of income generated as a result of the applicable foreign exchange rates prevailing at the time of payment and related receipt of the US$700 million advance to KCS. See Note 4 – Business acquisitions and combinations to the Company's 2023 Annual Consolidated Financial Statements for additional information.
(8)Relates to the termination fee resulting from KCS terminating the CN Merger Agreement and entering into a merger agreement with CP. See Note 4 – Business acquisitions and combinations to the Company's 2023 Annual Consolidated Financial Statements for additional information.
CN | 2023 Annual Report 47
MANAGEMENT'S DISCUSSION AND ANALYSIS
Off balance sheet arrangements
Guarantees and indemnifications
In the normal course of business, the Company enters into agreements that may involve providing guarantees or indemnifications to third parties and others, which may extend beyond the term of the agreements. These include, but are not limited to, standby letters of credit, surety and other bonds, and indemnifications that are customary for the type of transaction or for the railway business. As at December 31, 2023, the Company has not recorded a liability with respect to guarantees and indemnifications. Additional information relating to guarantees and indemnifications is provided in Note 22 – Major commitments and contingencies to the Company's 2023 Annual Consolidated Financial Statements.
Outstanding share data
As at January 31, 2024, the Company had 640.7 million common shares and 3.6 million stock options outstanding.
Financial instruments
Risk management
In the normal course of business, the Company is exposed to various risks from its use of financial instruments. To manage these risks, the Company follows a financial risk management framework, which is monitored and approved by the Company's Audit, Finance and Risk Committee, with a goal of maintaining a strong balance sheet, optimizing earnings per share and free cash flow, financing its operations at an optimal cost of capital and preserving its liquidity. The Company has limited involvement with derivative financial instruments in the management of its risks and does not hold or issue them for trading or speculative purposes.
Credit risk
Credit risk arises from cash and temporary investments, accounts receivable and derivative financial instruments. To manage credit risk associated with cash and temporary investments, the Company places these financial assets with governments, major financial institutions, or other creditworthy counterparties, and performs ongoing reviews of these entities. To manage credit risk associated with accounts receivable, the Company reviews the credit history of each new customer, monitors the financial condition and credit limits of its customers, and keeps the average daily sales outstanding within an acceptable range. The Company works with customers to ensure timely payments, and in certain cases, requires financial security, including letters of credit. CN also obtains credit insurance for certain high risk customers. Although the Company believes there are no significant concentrations of customer credit risk, economic conditions can affect the Company's customers and can result in an increase to the Company's credit risk and exposure to business failures of its customers. A widespread deterioration of customer credit and business failures of customers could have a material adverse effect on the Company's results of operations, financial position or liquidity. The Company considers the risk due to the possible non-performance by its customers to be remote.
The Company has limited involvement with derivative financial instruments, however from time to time, it may enter into derivative financial instruments to manage its exposure to interest rates or foreign currency exchange rates. To manage the counterparty risk associated with the use of derivative financial instruments, the Company enters into contracts with major financial institutions that have been accorded investment grade ratings. Though the Company is exposed to potential credit losses due to non-performance of these counterparties, the Company considers this risk to be remote.
48 CN | 2023 Annual Report
MANAGEMENT'S DISCUSSION AND ANALYSIS
Liquidity risk
Liquidity risk is the risk that sufficient funds will not be available to satisfy financial obligations as they come due. In addition to cash generated from operations, which represents its principal source of liquidity, the Company manages liquidity risk by aligning other external sources of funds which can be obtained upon short notice, such as revolving credit facilities, commercial paper programs, and an accounts receivable securitization program. As well, the Company can issue debt securities in the Canadian and U.S. capital markets under its shelf prospectus and registration statement. The Company's access to long-term funds in the debt capital markets depends on its credit ratings and market conditions. The Company believes that its investment grade credit ratings contribute to reasonable access to capital markets. See the section of this MD&A entitled Liquidity and capital resources for additional information relating to the Company's available financing sources and its credit ratings.
Foreign currency risk
The Company conducts its business in both Canada and the U.S. and as a result, is affected by currency fluctuations. Changes in the exchange rate between the Canadian dollar and the US dollar affect the Company's revenues and expenses. To manage foreign currency risk, the Company designates US dollar-denominated debt of the parent company as a foreign currency hedge of its net investment in foreign operations. As a result, from the dates of designation, foreign exchange gains and losses on translation of the Company's US dollar-denominated debt are recorded in Accumulated other comprehensive loss, which minimizes volatility of earnings resulting from the conversion of US dollar-denominated debt into the Canadian dollar.
The Company also enters into foreign exchange forward contracts to manage its exposure to foreign currency risk. As at December 31, 2023, the Company had outstanding foreign exchange forward contracts to purchase a notional value of US$1,496 million (2022 - US$1,311 million). These outstanding contracts are at a weighted-average exchange rate of $1.37 per US$1.00 (2022 - $1.33 per US$1.00) with exchange rates ranging from $1.34 to $1.39 per US$1.00 (2022 - $1.29 to $1.37 per US$1.00). The weighted-average term of the contracts is 77 days (2022 - 157 days) with terms ranging from 26 days to 178 days (2022 - 29 days to 300 days). Changes in the fair value of foreign exchange forward contracts, resulting from changes in foreign exchange rates, are recognized in Other income in the Consolidated Statements of Income as they occur. For the year ended December 31, 2023, the Company recorded a loss of $45 million (2022 - gain of $129 million; 2021 - loss of $18 million), related to foreign exchange forward contracts. These gains and losses were largely offset by the re-measurement of US dollar-denominated monetary assets and liabilities recognized in Other income. As at December 31, 2023, the fair value of outstanding foreign exchange forward contracts included in Other current assets and Accounts payable and other was $nil and $64 million, respectively (2022 - $33 million and $4 million, respectively).
The estimated annual impact on Net income of a one-cent change in the Canadian dollar relative to the US dollar is approximately $31 million.
Interest rate risk
The Company is exposed to interest rate risk, which is the risk that the fair value or future cash flows of a financial instrument will vary as a result of changes in market interest rates. Such risk exists in relation to the Company's debt. The Company mainly issues fixed-rate debt, which exposes the Company to variability in the fair value of the debt. The Company also issues debt with variable interest rates, which exposes the Company to variability in interest expense. To manage interest rate risk, the Company manages its borrowings in line with liquidity needs, maturity schedule, and currency and interest rate profile. In anticipation of future debt issuances, the Company may use derivative instruments such as forward rate agreements.
During 2023 and 2022, the Company entered into treasury lock agreements to hedge US Treasury benchmark rates related to expected debt issuances in 2023 and 2022, respectively. The treasury locks were designated as cash flow hedging instruments with cumulative gains or losses recorded in Accumulated other comprehensive loss in derivative instruments. In conjunction with the November 1, 2023 debt issuance, the Company settled a notional US$450 million ($622 million) of treasury locks, resulting in a cumulative gain of $97 million. The cash proceeds were included in operating activities in the Consolidated Statements of Cash Flows, and the gain was recorded in Accumulated other comprehensive loss and is being amortized over the term of the corresponding debt and recognized as an adjustment to interest expense on the Consolidated Statements of Income. In conjunction with the August 5, 2022 debt issuance, the Company settled a notional US$675 million ($868 million) of treasury locks, resulting in a cumulative loss of $2 million. This loss was recorded in Accumulated other comprehensive loss and is being amortized over the term of the corresponding debt and recognized as an adjustment to interest expense on the Consolidated Statements of Income. As at December 31, 2023 and 2022, there were no treasury locks outstanding.
The estimated annual impact on Net income of a one-percent change in the interest rate on floating rate debt is approximately $21 million.
CN | 2023 Annual Report 49
MANAGEMENT'S DISCUSSION AND ANALYSIS
Commodity price risk
The Company is exposed to commodity price risk related to purchases of fuel and the potential reduction in Net income due to increases in the price of diesel. Fuel prices are impacted by geopolitical events, changes in the economy or supply disruptions. Fuel shortages can occur due to refinery disruptions, production quota restrictions, climate, and labor and political instability.
The Company manages fuel price risk by offsetting the impact of rising fuel prices with the Company's fuel surcharge program. The surcharge applied to customers is determined in the second calendar month prior to the month in which it is applied, and is generally calculated using the average monthly price of On-Highway Diesel.
While the Company's fuel surcharge program provides effective coverage, residual exposure remains given that fuel price risk cannot be completely managed due to timing and given the volatility in the market. As such, the Company may enter into derivative instruments to manage such risk when considered appropriate.
Fair value of financial instruments
The financial instruments that the Company measures at fair value on a recurring basis in periods subsequent to initial recognition are categorized into the following levels of the fair value hierarchy based on the degree to which inputs are observable:
•Level 1: Inputs are quoted prices for identical instruments in active markets
•Level 2: Significant inputs (other than quoted prices included in Level 1) are observable
•Level 3: Significant inputs are unobservable
The carrying amounts of Cash and cash equivalents and Restricted cash and cash equivalents approximate fair value. These financial instruments include highly liquid investments purchased three months or less from maturity, for which the fair value is determined by reference to quoted prices in active markets.
The carrying amounts of Accounts receivable, Other current assets and Accounts payable and other approximate fair value due to their short maturity, unless otherwise specified. The fair value of equity investments with readily determinable fair values, included in Intangible assets, goodwill and other, is classified as Level 1 with gains and losses being recorded in Other income within the Consolidated Statements of Income. The fair value of derivative financial instruments, included in Other current assets and Accounts payable and other is classified as Level 2 and is used to manage the Company's exposure to foreign currency risk. The fair value is measured by discounting future cash flows using a discount rate derived from market data for financial instruments subject to similar risks and maturities.
The carrying amount of the Company's debt does not approximate fair value. The fair value is estimated based on quoted market prices for the same or similar debt instruments, as well as discounted cash flows using current interest rates for debt with similar terms, company rating, and remaining maturity. The Company classifies debt as Level 2. As at December 31, 2023, the Company's debt, excluding finance leases, had a carrying amount of $18,435 million (2022 - $15,419 million) and a fair value of $17,844 million (2022 - $14,137 million). The carrying amount of debt excluding finance leases exceeded the fair value due to an increase in market rates compared to the stated coupon rate.
50 CN | 2023 Annual Report
MANAGEMENT'S DISCUSSION AND ANALYSIS
Recent accounting pronouncements
The following recent Accounting Standards Updates (ASU) issued by the Financial Accounting Standards Board (FASB) has an effective date after December 31, 2023 and has not been adopted by the Company:
ASU 2023-07 Segment reporting (Topic 280): Improvements to reportable segment disclosures
The ASU will improve financial disclosures about a public entity's reportable segments and address requests from investors for additional and more detailed information regarding reportable segment expenses. The main amendments in the ASU require public entities, including those that have a single reportable segment, to disclose on an annual and interim basis the significant segment expenses provided to the chief operating decision maker (CODM), disclose the title/position of the CODM and how the segment expenses information is used in the decision making process.
The ASU is effective for annual periods beginning after December 15, 2023. Early adoption is permitted.
The adoption of the ASU will have an impact on the Company’s Consolidated Financial Statements disclosures. The Company will include the relevant disclosure within the 2024 Annual Consolidated Financial Statements and 2025 Interim Financial Statements.
ASU 2023-09 – Income Taxes (Topic 740): Improvements to income tax disclosures
The ASU amends the rules on income tax disclosures by modifying or eliminating certain existing income tax disclosure requirements in addition to establishing new requirements. The amendments address investor requests for more transparency about income taxes, including jurisdictional information, by requiring consistent categories and greater disaggregation of information. The ASU’s two primary amendments relate to the rate reconciliation and income taxes paid annual disclosures.
Reconciling items presented in the rate reconciliation will be in dollar amounts and percentages, and will be disaggregated into specified categories with certain reconciling items further broken out by nature and/or jurisdiction using a 5% threshold of domestic federal taxes. Income taxes paid will be disaggregated between federal, provincial/territorial, and foreign taxing jurisdictions using a 5% threshold of total income taxes paid net of refunds received.
The ASU is effective for annual periods beginning after December 15, 2024. Early adoption is permitted for annual financial statements that have not yet been issued or made available for issuance. The ASU should be applied prospectively. Retrospective application is permitted.
The adoption of the ASU will have an impact on the Company’s Consolidated Financial Statements disclosures. The required disclosure changes will be reflected in the Company’s Consolidated Financial Statements when the ASU is adopted.
The following Accounting Standards Updates (ASU) issued by the Financial Accounting Standards Board (FASB) have been adopted by the Company:
ASU 2020-04 and ASU 2022-06 Reference rate reform (Topic 848): Facilitation of the effects of reference rate reform on financial reporting and related amendments
USD London Interbank Offered Rate (LIBOR) and Canadian Dollar Offered Rate (CDOR) are benchmark interest rates referenced in a variety of agreements. The publication of certain LIBOR and CDOR rates were discontinued in January 2022 and May 2021, respectively. The remaining LIBOR rates were discontinued on June 30, 2023 and the remaining CDOR rates are expected to be discontinued on June 30, 2024. The recommended alternative reference rates for LIBOR and CDOR are the Secured Overnight Financing Rate (SOFR) and Canadian Overnight Repo Rate Average (CORRA), respectively.
The ASU provides optional expedients and exceptions for applying generally accepted accounting principles to transactions affected by reference rate reform if certain criteria are met. These transactions include contract modifications, hedging relationships, and sale or transfer of debt securities classified as held-to-maturity. The ASU was effective starting on March 12, 2020, and is available to be adopted on a prospective basis no later than December 31, 2024, following the amendments of ASU 2022-06.
CN | 2023 Annual Report 51
MANAGEMENT'S DISCUSSION AND ANALYSIS
The Company was eligible and has elected to use the optional expedient provided by the ASU which allowed the amendment to be accounted for as a non substantial modification of an existing debt. As a result, the amendment did not have a significant impact to the Company's Consolidated Financial Statements and related disclosures. See the section of this MD&A entitled Liquidity and capital resources - Available financing sources for additional information on reference rate reform with respect to the non-revolving credit facility, revolving credit facilities, equipment loans and accounts receivable securitization program.
Other recently issued ASUs required to be applied on or after December 31, 2023 have been evaluated by the Company and are not expected to have a significant impact on the Company's Consolidated Financial Statements.
Critical accounting estimates
The preparation of financial statements in accordance with GAAP requires management to make estimates, judgments and assumptions that affect the reported amounts of revenues, expenses, assets and liabilities, and the disclosure of contingent assets and liabilities at the date of the financial statements. On an ongoing basis, management reviews its estimates based upon available information. Actual results could differ from these estimates. The Company's policies for income taxes, capital expenditures and depreciation and pensions and other postretirement benefits require management's more significant judgments and estimates in the preparation of the Company's consolidated financial statements and, as such, are considered to be critical. The following information should be read in conjunction with the Company's 2023 Annual Consolidated Financial Statements and Notes thereto.
Management discusses the development and selection of the Company's critical accounting policies, including the underlying estimates and assumptions, with the Audit, Finance and Risk Committee of the Company's Board of Directors. The Audit, Finance and Risk Committee has reviewed the Company's related disclosures.
Income taxes
The Company follows the asset and liability method of accounting for income taxes. Under the asset and liability method, the change in the net deferred income tax asset or liability is included in the computation of Net income or Other comprehensive income (loss). Deferred income tax assets and liabilities are measured using enacted income tax rates expected to apply to taxable income in the years in which temporary differences are expected to be recovered or settled. As a result, a projection of taxable income is required for those years, as well as an assumption of the ultimate recovery/settlement period for temporary differences. The projection of future taxable income is based on management's best estimate and may vary from actual taxable income.
On an annual basis, the Company assesses the need to establish a valuation allowance for its deferred income tax assets, and if it is deemed more likely than not that its deferred income tax assets will not be realized, a valuation allowance is recorded. The ultimate realization of deferred income tax assets is dependent upon the generation of future taxable income, of the necessary character, during the periods in which those temporary differences become deductible. Management considers the scheduled reversals of deferred income tax liabilities, the available carryback and carryforward periods, and projected future taxable income in making this assessment. As at December 31, 2023, in order to fully realize all of the deferred income tax assets excluding the tax-deductible goodwill, the Company will need to generate future taxable income of approximately $1.8 billion, and, based upon the level of historical taxable income, projections of future taxable income of the necessary character over the periods in which the deferred income tax assets are deductible, and the reversal of taxable temporary differences, management believes, following an assessment of the current economic environment, it is more likely than not that the Company will realize the benefits of these deductible differences. Management believes it is more likely than not that CN will fully realize the benefits of the remaining $5.8 billion unamortized tax-deductible goodwill because under the current tax laws the Company has the ability and intent to maintain the necessary intercompany arrangements that will generate sufficient future taxable income of the appropriate character in the non-U.S. foreign jurisdiction, and to fully utilize the tax-deductible goodwill. As at December 31, 2023, the Company has not recognized a deferred income tax asset of $217 million (2022 - $196 million) on the unrealized foreign exchange loss recorded in Accumulated other comprehensive loss relating to its net investment in U.S. subsidiaries, as the Company does not expect this temporary difference to reverse in the foreseeable future.
52 CN | 2023 Annual Report
MANAGEMENT'S DISCUSSION AND ANALYSIS
In addition, Canadian, or domestic, tax rules and regulations, as well as those relating to foreign jurisdictions, are subject to interpretation and require judgment by the Company that may be challenged by the taxation authorities upon audit of the filed income tax returns. Tax benefits are recognized if it is more likely than not that the tax position will be sustained on examination by the taxation authorities. As at December 31, 2023, the total amount of gross unrecognized tax benefits was $46 million, before considering tax treaties and other arrangements between taxation authorities. The amount of net unrecognized tax benefits as at December 31, 2023 was $32 million. If recognized, $18 million of the net unrecognized tax benefits as at December 31, 2023 would affect the effective tax rate.
The Company believes that it is reasonably possible that $13 million of the net unrecognized tax benefits as at December 31, 2023 related to Canadian and U.S. federal, state, and provincial income tax matters, each of which are individually insignificant, may be recognized over the next twelve months as a result of settlements and a lapse of the applicable statute of limitations of which approximately half will affect the effective tax rate as the remaining amount relates to temporary differences.
The Company's deferred income tax assets are mainly composed of temporary differences related to tax-deductible goodwill, net operating losses and tax credit carryforwards, lease liabilities, the pension liability, accruals for personal injury and other claims, other postretirement benefits liability, and compensation reserves. The Company's deferred income tax liabilities are mainly composed of temporary differences related to properties, the pension asset and operating lease right-of-use assets. These deferred income tax assets and liabilities are recorded at the enacted tax rates of the periods in which the related temporary differences are expected to reverse. As a result, fiscal budget changes and/or changes in income tax laws that affect a change in the timing, the amount, and/or the income tax rate at which the temporary difference components will reverse, could materially affect deferred income tax expense as recorded in the Company's results of operations. The reversal of temporary differences is expected at future-enacted income tax rates which could change due to fiscal budget changes and/or changes in income tax laws. As a result, a change in the timing and/or the income tax rate at which the components will reverse, could materially affect deferred income tax expense as recorded in the Company's results of operations. From time to time, the federal, provincial, and state governments enact new corporate income tax rates resulting in either lower or higher tax liabilities. A one-percentage-point change in the Canadian, U.S., and non-U.S. statutory federal tax rate would have the effect of changing the deferred income tax expense by $223 million, $155 million, and $58 million, respectively, in 2023.
For the year ended December 31, 2023, the Company recorded an income tax expense of $863 million, of which $288 million was a deferred income tax recovery. The deferred income tax recovery included a net recovery of $682 million resulting from tax filings consistent with a ruling that the Company received in a non-U.S. foreign jurisdiction in connection with prior taxation years, comprised of a $767 million deferred income tax recovery related to the tax-deductible goodwill initially generated as of January 1, 2021, partly offset by a $85 million income tax expense related to the foregone tax deduction ($31 million for 2023 and $54 million for prior years) which was initially recorded in current taxes and was then reclassified to deferred taxes following the amortization of the tax-deductible goodwill for those years.
For the year ended December 31, 2022, the Company recorded an income tax expense of $1,645 million, of which $404 million was a deferred income tax expense.
For the year ended December 31, 2021, the Company recorded an income tax expense of $1,443 million, of which $513 million was a deferred income tax expense.
As at December 31, 2023, the Company had deferred income tax assets of $682 million (2022 - $nil) and deferred income tax liabilities of $10,066 million (2022 - $9,796 million). Additional disclosures are provided in Note 8 – Income taxes to the Company's 2023 Annual Consolidated Financial Statements.
Capital expenditures and depreciation
Properties are carried at cost less accumulated depreciation including asset impairment write-downs. The Company has a process in place to determine whether or not costs qualify for capitalization, which requires judgment. The cost of properties, including those under finance leases, net of asset impairment write-downs, is depreciated on a straight-line basis over their estimated service lives, measured in years, except for rail and ballast whose services lives are measured in millions of gross tons. The Company follows the group method of depreciation whereby a single composite depreciation rate is applied to the gross investment in a class of similar assets, despite small differences in the service life or salvage value of individual property units within the same asset class. The Company uses approximately 40 different depreciable asset classes.
CN | 2023 Annual Report 53
MANAGEMENT'S DISCUSSION AND ANALYSIS
For all depreciable assets, the depreciation rate is based on the estimated service lives of the assets. Assessing the reasonableness of the estimated service lives of properties requires judgment and is based on currently available information, including periodic depreciation studies conducted by the Company. The Company's U.S. properties are subject to comprehensive depreciation studies as required by the STB and are conducted by external experts. Depreciation studies for Canadian properties are not required by regulation and are conducted internally. Studies are performed on specific asset groups on a periodic basis. Changes in the estimated service lives of the assets and their related composite depreciation rates are implemented prospectively.
The studies consider, among other factors, the analysis of historical retirement data using recognized life analysis techniques, and the forecasting of asset life characteristics. Changes in circumstances, such as technological advances, changes to the Company's business strategy, changes in the Company's capital strategy or changes in regulations can result in the actual service lives differing from the Company's estimates.
A change in the remaining service life of a group of assets, or their estimated net salvage value, will affect the depreciation rate used to amortize the group of assets and thus affect depreciation expense as reported in the Company's results of operations. A change of one year in the composite service life of the Company's fixed asset base would impact annual depreciation expense by approximately $74 million.
Depreciation studies are a means of ensuring that the assumptions used to estimate the service lives of particular asset groups are still valid and where they are not, they serve as the basis to establish the new depreciation rates to be used on a prospective basis. In 2023, the Company completed depreciation studies for equipment properties and as a result, the Company changed the estimated service lives for various types of equipment assets and their related composite depreciation rates. The results of these depreciation studies did not materially affect the Company's annual depreciation expense.
Given the nature of the railroad and the composition of its network which is made up of homogeneous long-lived assets, it is impractical to maintain records of specific properties at their lowest unit of property.
Retirements of assets occur through the replacement of an asset in the normal course of business, the sale of an asset or the abandonment of a section of track. For retirements in the normal course of business, generally the life of the retired asset is within a reasonable range of the expected useful life, as determined in the depreciation studies, and, as such, no gain or loss is recognized under the group method. The asset's cost is removed from the asset account and the difference between its cost and estimated related accumulated depreciation (net of salvage proceeds), if any, is recorded as an adjustment to accumulated depreciation and no gain or loss is recognized. The historical cost of the retired asset is estimated by using deflation factors or indices that closely correlate to the properties comprising the asset classes in combination with the estimated age of the retired asset using a first-in, first-out approach, and applying it to the replacement value of the asset.
In each depreciation study, an estimate is made of any excess or deficiency in accumulated depreciation for all corresponding asset classes to ensure that the depreciation rates remain appropriate. The excess or deficiency in accumulated depreciation is amortized over the remaining life of the asset class.
For retirements of depreciable properties that do not occur in the normal course of business, the historical cost, net of salvage proceeds, is recorded as a gain or loss in income. A retirement is considered not to be in the normal course of business if it meets the following criteria: (i) it is unusual, (ii) it is significant in amount, and (iii) it varies significantly from the retirement pattern identified through depreciation studies. A gain or loss is recognized in Other income for the sale of land or disposal of assets that are not part of railroad operations.
For the year ended December 31, 2023, the Company recorded total depreciation expense of $1,811 million (2022 - $1,723 million; 2021 - $1,593 million). As at December 31, 2023, the Company had Properties of $44,617 million, net of accumulated depreciation of $17,394 million (2022 - $43,537 million, net of accumulated depreciation of $16,526 million). Additional disclosures are provided in Note 12 – Properties to the Company's 2023 Annual Consolidated Financial Statements.
GAAP requires the use of historical cost as the basis of reporting in financial statements. As a result, the cumulative effect of inflation, which has significantly increased asset replacement costs for capital-intensive companies such as CN, is not reflected in operating expenses. Depreciation charges on an inflation-adjusted basis, assuming that all operating assets are replaced at current price levels, would be substantially greater than historically reported amounts.
54 CN | 2023 Annual Report
MANAGEMENT'S DISCUSSION AND ANALYSIS
Pensions
Effective January 1, 2022, CN elected to change its accounting methodology for determining the market-related value of assets for the Company’s defined benefit pension plans. The new accounting method changed the calculation of market-related value of pension plan assets used to determine net periodic benefit cost but had no impact on the annual funded status of the plans. The Company's previous methodology calculated market-related value for pensions whereby realized and unrealized gains/losses and appreciation/depreciation in the value of the investments were recognized over a period of five years. The Company's new methodology applies a corridor approach so that the market-related value does not result in a value that deviates excessively from its fair value. Specifically, the market-related value will not exceed 110% or be less than 90% of the fair value. This change established a corridor approach whereby the amount causing the market-related value to be outside of the 10% corridor is recognized immediately in the market-related value of assets and will not be subject to the five-year period of recognition. There is no change in the recognition approach for investment income.
Pensions and other postretirement benefits
The Company's plans have a measurement date of December 31.
|
|
|
|
|
|
|
|
|
|
|
|
| In millions |
As at December 31, |
2023 |
2022 |
| Pension asset |
$ |
3,140 |
|
$ |
3,033 |
|
| Pension liability |
$ |
362 |
|
$ |
353 |
|
Other postretirement benefits liability (1) |
$ |
145 |
|
$ |
147 |
|
(1)Includes current portion of $12 million as at December 31, 2023 (2022 - $14 million). See Note 15 – Accounts payable and other to the Company's 2023 Annual Consolidated Financial Statements for the related current portion.
The descriptions in the following paragraphs pertaining to pensions relate generally to the Company's main pension plan, the CN Pension Plan, unless otherwise specified.
Amendments to postretirement medical benefits plans in the U.S.
In June 2022, CN approved changes affecting members participating in the Company’s postretirement medical benefits plans in the U.S. Beginning in 2023, Medicare-eligible retirees are covered by a health reimbursement arrangement, which is an employer-funded account that can be used for reimbursement of eligible medical expenses. Non-Medicare eligible retirees continue to be covered by the existing self-insured program. This change constituted a plan amendment event resulting in a $28 million reduction to the affected plans’ Accumulated projected benefit obligation, recorded in Other comprehensive income, and is composed of a prior service credit of $21 million and an actuarial gain of $7 million, substantially all due to lower expected future benefit payments and to the approximate 130 basis point increase in the end of period discount rates between December 31, 2021 and May 31, 2022, respectively.
Curtailment event
On October 31, 2021, the CN Board of Directors approved changes affecting non-unionized members participating in the Company’s defined benefit pension plans. Effective April 1, 2024, the affected defined benefit pension plans will be amended to cease benefits accruals for non-unionized members, generally known as a delayed hard freeze. Effective April 1, 2024, all non-unionized members will be transferred to the Company’s defined contribution pension plans for their future service. This delayed hard freeze constitutes a plan curtailment event recognized on October 31, 2021 resulting in a $52 million reduction to the Projected benefit obligation, recorded in Other comprehensive income as an actuarial gain, mostly due to reflecting projected future salary increases and service only up to April 1, 2024. The curtailment event also triggered an interim re-measurement of the funded status of the affected defined benefit pension plans resulting in an actuarial gain of $1,915 million recorded in Other comprehensive income composed of i) an actuarial gain on the Projected benefit obligation of $1,808 million substantially all due to the 84 basis point increase in the end of period discount rate between December 31, 2020 of 2.55% and October 31, 2021 of 3.39%, and ii) an actuarial gain on the Plan assets of $107 million due to higher actual returns of $982 million compared to expected returns of $875 million over that same ten-month period. Due to the interim re-measurement, the resulting Net periodic benefit income recorded during the fourth quarter of 2021 increased by $25 million composed of i) a decrease to Current service cost of $9 million, and ii) an increase to Other components of net periodic benefit income of $16 million.
CN | 2023 Annual Report 55
MANAGEMENT'S DISCUSSION AND ANALYSIS
Calculation of net periodic benefit cost (income)
In accounting for pensions and other postretirement benefits, assumptions are required for, among other things, the discount rate, the expected long-term rate of return on plan assets, the rate of compensation increase, health care cost trend rates, mortality rates, employee early retirements, terminations and disability. Changes in these assumptions result in actuarial gains or losses, which are recognized in Other comprehensive income (loss). The Company generally amortizes these gains or losses into net periodic benefit cost (income) over the expected average remaining service life of the employee group covered by the plans only to the extent that the unrecognized net actuarial gains and losses are in excess of the corridor threshold, which is calculated as 10% of the greater of the beginning-of-year balances of the projected benefit obligation or market-related value of plan assets. The Company's net periodic benefit cost (income) for future periods is dependent on demographic experience, economic conditions and investment performance. Recent demographic experience has revealed no material net gains or losses on termination, retirement, disability and mortality. Experience with respect to economic conditions and investment performance is further discussed herein.
Net periodic benefit cost (income)
|
|
|
|
|
|
|
|
|
|
|
|
|
|
|
| In millions |
Year ended December 31, |
2023 |
2022 |
2021 |
Net periodic benefit income for pensions |
$ |
(393) |
|
$ |
(340) |
|
$ |
(210) |
|
| Net periodic benefit cost for other postretirement benefits |
$ |
(2) |
|
$ |
1 |
|
$ |
2 |
|
Projected pension benefit obligation and accumulated other postretirement benefit obligation
|
|
|
|
|
|
|
|
|
|
|
|
| In millions |
As at December 31, |
2023 |
2022 |
| Projected pension benefit obligation |
$ |
14,755 |
|
$ |
13,909 |
|
| Accumulated other postretirement benefit obligation |
$ |
145 |
|
$ |
147 |
|
Discount rate assumption
The Company's discount rate assumption, which is set annually at the end of each year, is determined by management with the aid of third-party actuaries. The discount rate is used to measure the single amount that, if invested at the measurement date in a portfolio of high-quality debt instruments with a rating of AA or better, would provide the necessary cash flows to pay for pension benefits as they become due. For the Canadian pension and other postretirement benefit plans, future expected benefit payments are discounted using spot rates based on a derived AA corporate bond yield curve for each maturity year. A year-end discount rate of 4.64% based on bond yields prevailing at December 31, 2023 (2022 - 5.26%) was considered appropriate by the Company.
The Company uses the spot rate approach to measure current service cost and interest cost for all defined benefit pension and other postretirement benefit plans. Under the spot rate approach, individual spot discount rates along the same yield curve used in the determination of the projected benefit obligation are applied to the relevant projected cash flows for current service cost at the relevant maturity. More specifically, current service cost is measured using the cash flows related to benefits expected to be accrued in the following year by active members of a plan and interest cost is measured using the projected cash flows making up the projected benefit obligation multiplied by the corresponding spot discount rate at each maturity. As at December 31, 2023, the rate to determine current service cost was 5.25% (2022 - 3.40%) and the rate to determine interest cost was 5.21% (2022 - 2.67%).
As at December 31, 2023, a 0.25% decrease in discount rates used to determine the projected benefit obligation, current service cost and interest cost would have resulted in a decrease of approximately $380 million to the funded status for pensions and would result in a decrease of approximately $18 million to the 2024 projected net periodic benefit income. A 0.25% increase in discount rates would have resulted in an increase of approximately $360 million to the funded status for pensions and would result in an increase of approximately $17 million to the 2024 projected net periodic benefit income.
56 CN | 2023 Annual Report
MANAGEMENT'S DISCUSSION AND ANALYSIS
Expected long-term rate of return assumption
The expected long-term rate of return is determined based on expected future performance for each asset class and is weighted based on the investment policy. Consideration is taken of the historical performance, the premium return generated from an actively managed portfolio, as well as current target asset allocations, published market return expectations, economic developments, inflation rates and administrative expenses. Based on these factors, the rate is determined by the Company. For 2023, the Company used a long-term rate of return assumption of 7.60% on the market-related value of plan assets to compute net periodic benefit cost (income). In 2024, the Company will decrease the expected long-term rate of return on plan assets by 30 basis points to 7.30% to reflect management's current view of long-term investment returns.
The assets of the Company's various plans are primarily held in separate trust funds ("Trusts") which are diversified by asset type, geography, sector and investment strategy. Each year, the CN Board of Directors reviews and confirms or amends the Statement of Investment Policies and Procedures (SIPP) which includes the plans' long-term target asset allocation ("Policy") and related benchmark indices. This Policy is based on the long-term expectations of the economy and financial market returns and considers the dynamics of the plans' pension benefit obligations. In 2023, the Policy was amended to implement a target asset allocation change to bonds and mortgages and equities. These changes were taken into account in the determination of the Company's expected long-term rate of return assumption. In 2023, the Policy was: 2% cash and short-term investments, 41% bonds and mortgages, 2% emerging market debt, 3% private debt, 29% equities, 4% real estate, 5% resource and royalties, 4% infrastructure, 2% specialty portfolio, 12% absolute return investments and negative 4% for investment-related liabilities.
Annually, the CN Investment Division ("Investment Manager"), a division of the Company created to invest and administer the assets of the plans, can also implement an investment strategy ("Strategy") which can lead the Plan's actual asset allocation to deviate from the Policy due to changing market risks and opportunities. The Pension and Investment Committee of the Board of Directors ("Committee") regularly compares the actual plan asset allocation to the Policy and Strategy and compares the actual performance of the Company's pension plan assets to the performance of the benchmark indices.
The Committee's approval is required for all major investments in illiquid securities. The SIPP allows for the use of derivative financial instruments to implement strategies, to hedge and to adjust existing or anticipated exposures. The SIPP prohibits investments in securities of the Company or its subsidiaries.
|
|
|
|
|
|
|
|
|
|
|
|
|
|
|
|
|
|
|
2023 |
2022 |
2021 |
2020 |
2019 |
| Actual |
11.9 |
% |
(14.2 |
%) |
8.7 |
% |
12.5 |
% |
12.2 |
% |
| Market-related value |
5.0 |
% |
2.8 |
% |
8.0 |
% |
7.1 |
% |
6.1 |
% |
| Expected |
7.60 |
% |
7.00 |
% |
6.79 |
% |
7.00 |
% |
7.00 |
% |
The Company's expected long-term rate of return on plan assets reflects management's view of long-term investment returns and the effect of a 1% variation in such rate of return would result in a change to the net periodic benefit cost (income) of approximately $110 million. Management's assumption of the expected long-term rate of return is subject to risks and uncertainties that could cause the actual rate of return to differ materially from management's assumption. There can be no assurance that the plan assets will be able to earn the expected long-term rate of return on plan assets.
Net periodic benefit income for pensions for 2024
In 2024, the Company expects net periodic benefit income to be approximately $350 million for all its defined benefit pension plans, as compared to actual net periodic benefit income of $393 million for the year ended December 31, 2023.
Plan asset allocation
Based on the fair value of the assets held as at December 31, 2023, the assets of the Company's various plans are comprised of 2% in cash and short-term investments, 41% in bonds and mortgages, 2% in emerging market debt, 6% in private debt, 25% in equities, 3% in real estate, 7% in resource and royalties, 4% in infrastructure, 2% in specialty portfolio, 14% in absolute return investments and negative 6% in investment-related liabilities. See Note 18 – Pensions and other postretirement benefits to the Company's 2023 Annual Consolidated Financial Statements for additional information on the fair value measurements of such assets.
CN | 2023 Annual Report 57
MANAGEMENT'S DISCUSSION AND ANALYSIS
A significant portion of the plans' assets are invested in publicly traded equity securities whose return is primarily driven by stock market performance. Debt securities also account for a significant portion of the plans' investments and provide a partial offset to the variation in the pension benefit obligation that is driven by changes in the discount rate. The funded status of the plan fluctuates with market conditions and impacts funding requirements. The Company will continue to make contributions to the pension plans that as a minimum meet pension legislative requirements.
Rate of compensation increase
The rate of compensation increase is determined by the Company based upon its long-term plans for such increases. For 2023, a basic rate of compensation increase of 2.75% was used to determine the projected benefit obligation and the net periodic benefit cost (income).
Mortality
The Canadian Institute of Actuaries (CIA) published in 2014 a report on Canadian Pensioners' Mortality ("Report"). The Report contained Canadian pensioners' mortality tables and improvement scales based on experience studies conducted by the CIA. The CIA's conclusions were taken into account in selecting management's best estimate mortality assumption used to calculate the projected benefit obligation as at December 31, 2023, 2022 and 2021.
Funding of pension plans
The Company's main Canadian defined benefit pension plan, the CN Pension Plan, accounts for 93% of the Company's pension obligation and can produce significant volatility in pension funding requirements, given the pension fund's size, the many factors that drive the plan's funded status, and Canadian statutory pension funding requirements. Adverse changes to the assumptions used to calculate the plan's funding status, particularly the discount rate used for funding purposes, as well as changes to existing federal pension legislation, regulation and guidance could significantly impact the Company's future contributions.
For accounting purposes, the funded status is calculated under generally accepted accounting principles for all pension plans. For funding purposes, the funded status is also calculated under going concern and solvency scenarios as prescribed under pension legislation and subject to guidance issued by the CIA and the Office of the Superintendent of Financial Institutions (OSFI) for all registered Canadian defined benefit pension plans. The Company's funding requirements are determined upon completion of actuarial valuations. Actuarial valuations are generally required on an annual basis for all Canadian defined benefit pension plans, or when deemed appropriate by the OSFI. Actuarial valuations are also required annually for the Company's U.S. qualified defined benefit pension plans.
The Company's most recently filed actuarial valuations for funding purposes for its Canadian registered defined pension plans conducted as at December 31, 2022 indicated a funding excess on a going concern basis of approximately $4.4 billion and a funding excess on a solvency basis of approximately $1.6 billion, calculated using the three-year average of the plans' hypothetical wind-up ratio in accordance with the Pension Benefit Standards Regulations, 1985. The federal pension legislation requires funding deficits, if any, to be paid over a number of years, as calculated under current pension regulations. Alternatively, a letter of credit can be subscribed to fulfill required solvency deficit payments.
The Company's next actuarial valuations for funding purposes for its Canadian registered defined benefit pension plans required as at December 31, 2023 will be performed in 2024. These actuarial valuations are expected to identify a funding excess on a going concern basis of approximately $4.9 billion, while on a solvency basis a funding excess of approximately $2.6 billion is expected.
Based on the anticipated results of these valuations, the CN Pension Plan is expected to remain fully funded and at a level such that the Company would continue to be prohibited from making contributions to the CN Pension Plan in 2024. As such, the Company expects to make total cash contributions of approximately $70 million in 2024 for all other pension plans, and includes the impact of affected non-unionized members transferring from the Company's defined benefit pension plans to defined contribution pension plans effective April 1, 2024. The Company expects cash from operations and its other sources of financing to be sufficient to meet its 2024 funding obligations.
58 CN | 2023 Annual Report
MANAGEMENT'S DISCUSSION AND ANALYSIS
Information disclosed by major pension plan
|
|
|
|
|
|
|
|
|
|
|
|
|
|
|
|
|
|
| In millions |
December 31, 2023 |
CN Pension Plan
|
BC Rail Pension Plan
|
U.S. and other plans
|
Total |
| Plan assets by category |
|
|
|
|
| Cash and short-term investments |
$ |
360 |
|
$ |
3 |
|
$ |
4 |
|
$ |
367 |
|
| Bonds |
6,540 |
|
425 |
|
185 |
|
7,150 |
|
| Mortgages |
1 |
|
— |
|
— |
|
1 |
|
| Emerging market debt |
350 |
|
— |
|
2 |
|
352 |
|
| Private debt |
1,016 |
|
— |
|
5 |
|
1,021 |
|
| Public equities |
4,035 |
|
96 |
|
48 |
|
4,179 |
|
| Private equities |
613 |
|
— |
|
3 |
|
616 |
|
| Real estate |
437 |
|
— |
|
2 |
|
439 |
|
| Resource and royalties |
1,266 |
|
— |
|
6 |
|
1,272 |
|
| Infrastructure |
657 |
|
— |
|
3 |
|
660 |
|
| Absolute return |
2,334 |
|
26 |
|
12 |
|
2,372 |
|
|
|
|
|
|
| Total investments |
17,609 |
|
550 |
|
270 |
|
18,429 |
|
Investment-related liabilities (1) |
(799) |
|
(65) |
|
(4) |
|
(868) |
|
Other (2) |
(48) |
|
3 |
|
17 |
|
(28) |
|
| Total plan assets |
$ |
16,762 |
|
$ |
488 |
|
$ |
283 |
|
$ |
17,533 |
|
| Projected benefit obligation at end of year |
$ |
13,711 |
|
$ |
401 |
|
$ |
643 |
|
$ |
14,755 |
|
Company contributions in 2023 |
$ |
— |
|
$ |
— |
|
$ |
25 |
|
$ |
25 |
|
Employee contributions in 2023 |
$ |
64 |
|
$ |
— |
|
$ |
— |
|
$ |
64 |
|
(1)Investment-related liabilities include securities sold under repurchase agreements.
(2)Other consists of operating assets of $143 million and liabilities of $171 million required to administer the Trusts' investment assets and the plans' benefit and funding activities.
Additional disclosures are provided in Note 18 – Pensions and other postretirement benefits to the Company's 2023 Annual Consolidated Financial Statements.
Business risks
In the normal course of business, the Company is exposed to various business risks and uncertainties that can have an effect on the Company's results of operations, financial position, or liquidity. While some exposures may be reduced by the Company's risk management strategies, many risks are driven by external factors beyond the Company's control or are of a nature which cannot be eliminated. The key areas of business risks and uncertainties described in this section are not the only ones that can affect the Company. Additional risks and uncertainties not currently known to management or that may currently not be considered material by management, could nevertheless also have an adverse effect on the Company's business.
Competition
The Company faces significant competition, including from rail carriers and other modes of transportation, and is also affected by its customers' flexibility to select among various origins and destinations, including ports, in getting their products to market. Specifically, the Company faces competition from Canadian Pacific Kansas City Limited (CPKC), which operates the other major rail system in Canada and services most of the same industrial areas, commodity resources and population centers as the Company; major U.S. railroads and other Canadian and U.S. railroads; long-distance trucking companies, transportation via the St. Lawrence-Great Lakes Seaway and the Mississippi River and transportation via pipelines. In addition, while railroads must build or acquire and maintain their rail systems, motor carriers and barges are able to use public rights-of-way that are built and maintained by public entities without paying fees covering the entire costs of their usage.
CN | 2023 Annual Report 59
MANAGEMENT'S DISCUSSION AND ANALYSIS
Competition is generally based on the quality and the reliability of the service provided, access to markets, as well as price. Factors affecting the competitive position of customers, including exchange rates and energy cost, could materially adversely affect the demand for goods supplied by the sources served by the Company and, therefore, the Company's volumes, revenues and profit margins. Factors affecting the general market conditions for the Company's customers can result in an imbalance of transportation capacity relative to demand. An extended period of supply/demand imbalance could negatively impact market rate levels for all transportation services, and more specifically the Company's ability to maintain or increase rates. This, in turn, could materially and adversely affect the Company's business, results of operations or financial position.
Previous consolidation of rail systems in the U.S. have resulted in larger rail systems that are in a position to compete effectively with the Company in numerous markets.
There can be no assurance that the Company will be able to compete effectively against current or future competitors in the transportation industry, or that further consolidation within the transportation industry and legislation allowing for more leniency in size and weight for motor carriers will not adversely affect the Company's competitive position. No assurance can be given that competitive pressures in transportation markets will not lead to reduced revenues, profit margins or both.
Environmental matters
The Company's operations are subject to numerous federal, provincial, state, municipal and local environmental laws and regulations in Canada and the U.S. concerning, among other things, emissions into the air; discharges into waters; the generation, handling, storage, transportation, treatment and disposal of waste, hazardous substances and other materials; decommissioning of underground and aboveground storage tanks; and soil and groundwater contamination. A risk of environmental liability is inherent in railroad and related transportation operations; real estate ownership, operation or control; and other commercial activities of the Company with respect to both current and past operations. As a result, the Company incurs significant operating and capital costs, on an ongoing basis, associated with environmental regulatory compliance and clean-up requirements in its railroad operations and relating to its past and present ownership, operation or control of real property.
While the Company believes that it has identified the costs likely to be incurred for environmental matters in the next several years based on known information, the discovery of new facts, the participation and financial viability of other parties responsible for any such liability, future changes in laws, the possibility of releases of hazardous materials into the environment and the Company's ongoing efforts to identify potential environmental liabilities that may be associated with its properties may result in the identification of additional environmental liabilities and related costs.
In railroad and related transportation operations, it is possible that derailments or other accidents, including spills and releases of hazardous materials, may occur that could cause harm to human health or to the environment. In addition, the Company is also exposed to potential catastrophic liability risk, faced by the railroad industry in general, in connection with the transportation of toxic inhalation hazard materials such as chlorine and anhydrous ammonia, or other dangerous commodities such as crude oil and propane that the Company may be required to transport as a result of its common carrier obligations. Therefore, the Company may incur costs in the future, which may be material, to address any such harm, compliance with laws or other risks, including costs relating to the performance of clean-ups, payment of environmental penalties and remediation obligations, and damages relating to harm to individuals or property.
The environmental liability for any given contaminated site varies depending on the nature and extent of the contamination; the available clean-up techniques; evolving regulatory standards governing environmental liability; and the number of potentially responsible parties and their financial viability. As such, the ultimate cost of addressing known contaminated sites cannot be definitively established. Also, additional contaminated sites yet unknown may be discovered or future operations may result in accidental releases.
While some exposures may be reduced by the Company's risk mitigation strategies (including periodic audits, employee training programs, emergency plans and procedures, and insurance), many environmental risks are driven by external factors beyond the Company's control or are of a nature which cannot be completely eliminated. Therefore, there can be no assurance, notwithstanding the Company's mitigation strategies, that liabilities or costs related to environmental matters will not be incurred in the future or that environmental matters will not have a material adverse effect on the Company's results of operations, financial position or liquidity, or reputation.
60 CN | 2023 Annual Report
MANAGEMENT'S DISCUSSION AND ANALYSIS
Personal injury and other claims
In the normal course of business, the Company becomes involved in various legal actions seeking compensatory and occasionally punitive damages, including actions brought on behalf of various purported classes of claimants and claims relating to employee and third-party personal injuries, occupational disease, and property damage, arising out of harm to individuals or property allegedly caused by, but not limited to, derailments or other accidents. The Company maintains provisions for such items, which it considers to be adequate for all of its outstanding or pending claims and benefits from insurance coverage for occurrences in excess of certain amounts. The final outcome with respect to actions outstanding or pending at December 31, 2023, or with respect to future claims, cannot be predicted with certainty, and therefore there can be no assurance that their resolution will not have a material adverse effect on the Company's results of operations, financial position or liquidity, in a particular quarter or fiscal year.
Labor negotiations
The working conditions of the Company's unionized workforce are governed by collective agreements which are negotiated from time to time. Disputes relating to the renewal of collective agreements have previously resulted in and could in the future potentially result in strikes, lockouts, slowdown of the business and ultimately loss of business. There can be no assurance that the Company will be able to renew and have its collective agreements ratified without a strike or lockout or that the resolution of these negotiations will not have a material adverse effect on the Company's results or financial position. Future labor agreements could increase labor and fringe benefits and related expenses.
Economic conditions
The Company is susceptible to changes in the economic conditions of the industries and geographic areas that produce and consume the freight it transports or the supplies it requires to operate. In addition, many of the goods and commodities carried by the Company experience cyclical demand. For example, the volatility in domestic and global energy markets could impact the demand for transportation services as well as impact the Company's fuel costs and surcharges, and such price increases could have a material adverse effect on the Company's results of operations. In addition, the volatility in other commodity markets such as coal and iron ore could have an impact on volumes. Many of the bulk commodities the Company transports move offshore and are affected more by global rather than North American economic conditions. Adverse North American and global economic conditions, or economic or industrial restructuring, that affect the producers and consumers of the commodities carried by the Company, including customer insolvency, may have a material adverse effect on the volume of rail shipments and/or revenues from commodities carried by the Company, and thus materially and negatively affect its results of operations, financial position, or liquidity. Moreover, supply chain disruptions in North America and internationally, including labor shortages or other services disruptions affecting trucking, ports, handling facilities, customer facilities or other railroads, may adversely affect volumes of goods and timelines, and therefore adversely affect CN’s operations and financial results.
Regulation
The Company is subject to regulatory and legislative initiatives in the operation of its business.
Economic regulation – Canada
The Company's rail operations in Canada are subject to economic regulation by the Canadian Transportation Agency under the Canada Transportation Act, which provides rate and service remedies, including final offer arbitration, long-haul interswitching rates and mandatory interswitching. It also regulates the maximum revenue entitlement for the movement of regulated grain, charges for railway ancillary services and noise-related disputes. In addition, various Company business transactions must gain prior regulatory approval, with attendant risks and uncertainties, and the Company is subject to government oversight with respect to rate, service and business practice issues.
Economic regulation – U.S.
The Company's U.S. rail operations are subject to economic regulation by the STB. The STB serves as both an adjudicatory and regulatory body and has jurisdiction over certain railroad rate and service issues and rail restructuring transactions such as mergers, line sales, line construction and line abandonments. As such, various Company business transactions must gain prior regulatory approval and aspects of its pricing and service practices may be subject to challenge, with attendant risks and uncertainties. Recent proposals in proceedings undertaken by the STB in a number of significant matters remain pending.
CN | 2023 Annual Report 61
MANAGEMENT'S DISCUSSION AND ANALYSIS
Safety regulation – Canada
The Company's rail operations in Canada are subject to safety regulation by the Minister under the Railway Safety Act as well as the rail portions of other safety-related statutes, which are administered by Transport Canada. The Company may be required to transport toxic inhalation hazard materials as a result of its common carrier obligations and, as such, is also subject to additional regulatory oversight in Canada. The Transportation of Dangerous Goods Act, also administered by Transport Canada, establishes the safety requirements for the transportation of goods classified as dangerous and enables the adoption of regulations for security training and screening of personnel working with dangerous goods, as well as the development of a program to require a transportation security clearance for dangerous goods, the tracking of dangerous goods during transport and the development of an emergency response plan.
Safety regulation – U.S.
The Company's U.S. rail operations are subject to safety regulation by the FRA under the Federal Railroad Safety Act as well as rail portions of other safety statutes, with the transportation of certain hazardous commodities also governed by regulations promulgated by the Pipeline and Hazardous Materials Safety Administration (PHMSA). PHMSA requires carriers operating in the U.S. to report annually the volume and route-specific data for cars containing these commodities; conduct a safety and security risk analysis for each used route; identify a commercially practicable alternative route for each used route; and select for use the practical route posing the least safety and security risk. In addition, the Transportation Security Administration (TSA) requires rail carriers to provide upon request, within five minutes for a single car and 30 minutes for multiple cars, location and shipping information on cars on their networks containing toxic inhalation hazard materials and certain radioactive or explosive materials; and ensure the secure, attended transfer of all such cars to and from shippers, receivers and other carriers that will move from, to, or through designated high-threat urban areas.
Regulation – Vessels
The Company's vessel operations are subject to regulation by the U.S. Coast Guard and the Department of Transportation, Maritime Administration, which regulate the ownership and operation of vessels operating on the Great Lakes and in U.S. coastal waters. In addition, the Environmental Protection Agency has authority to regulate air emissions from these vessels.
Security
The Company is subject to statutory and regulatory directives in the U.S. addressing homeland security concerns. In the U.S., safety matters related to security are overseen by the TSA, which is part of the U.S. Department of Homeland Security (DHS) and PHMSA, which, like the FRA, is part of the U.S. Department of Transportation. Border security falls under the jurisdiction of U.S. Customs and Border Protection (CBP), which is part of the DHS. In Canada, the Company is subject to regulation by the Canada Border Services Agency (CBSA). Matters related to agriculture-related shipments crossing the Canada/U.S. border also fall under the jurisdiction of the U.S. Department of Agriculture (USDA) and the Food and Drug Administration (FDA) in the U.S. and the Canadian Food Inspection Agency (CFIA) in Canada. More specifically, the Company is subject to:
•border security arrangements, pursuant to an agreement the Company and CPKC entered into with the CBP and the CBSA;
•the CBP's Customs-Trade Partnership Against Terrorism (C-TPAT) program and designation as a low-risk carrier under CBSA's Customs Self-Assessment (CSA) program;
•regulations imposed by the CBP requiring advance notification by all modes of transportation for all shipments into the U.S. The CBSA is also working on similar requirements for Canada-bound traffic;
•inspection for imported fruits and vegetables grown in Canada and the agricultural quarantine and inspection (AQI) user fee for all traffic entering the U.S. from Canada; and
•gamma ray screening of cargo entering the U.S. from Canada, and potential security and agricultural inspections at the Canada/U.S. border.
The Company has worked with the AAR to develop and put in place an extensive industry-wide security plan to address terrorism and security-driven efforts by state and local governments seeking to restrict the routings of certain hazardous materials. If such state and local routing restrictions were to go into force, they would be likely to add to security concerns by foreclosing the Company's most optimal and secure transportation routes, leading to increased yard handling, longer hauls, and the transfer of traffic to lines less suitable for moving hazardous materials, while also infringing upon the exclusive and uniform federal oversight over railroad security matters.
While the Company will continue to work closely with the CBSA, CBP, and other Canadian and U.S. agencies, as described above, no assurance can be given that these and future decisions by the U.S., Canadian, provincial, state, or local governments on homeland security matters, legislation on security matters enacted by the U.S. Congress or Parliament, or joint decisions by the industry in response to threats to the North American rail network, will not materially adversely affect the Company's results of operations, or its competitive and financial position.
62 CN | 2023 Annual Report
MANAGEMENT'S DISCUSSION AND ANALYSIS
Transportation of hazardous materials
As a result of its common carrier obligations, the Company is legally required to transport dangerous goods and hazardous materials, including toxic inhalation hazard materials regardless of risk or potential exposure or loss. A train accident involving the transport of these commodities could result in significant costs and claims for personal injury, property damage, environmental penalties and remediation in excess of insurance coverage for these risks, which may materially adversely affect the Company's results of operations, or its competitive and financial position.
No assurance can be given that these and any other current or future regulatory or legislative initiatives by the Canadian or U.S. federal government and agencies will not materially adversely affect the Company's results of operations or its competitive and financial position.
Pandemic risk
Severe disruptions in regional economies and the world economy can be caused by the outbreak of a contagious illness, such as the COVID-19 pandemic. Such pandemics and efforts to contain them could result in international, national and local border closings, travel restrictions, significant disruptions to business operations, supply chains, customer activity and demand, service cancellations, reductions and other changes, significant challenges in healthcare service preparation and delivery, and quarantines, as well as considerable general concern and uncertainty, all of which could negatively affect the economic environment and may in the future have further impacts, as was the case for the COVID-19 pandemic. It is not possible to predict what measures and restrictions may be imposed by governmental authorities and the period of time during which those measures and restrictions may apply. Economic and supply chain disruptions, including temporary staff shortages resulting from a pandemic, could further materially affect the Company's financial results and operations. A pandemic could also further and significantly impact freight demand and commodity prices in connection with ensuing economic disruption, supply shortages, trade disruption, temporary staff shortages and temporary closures of facilities in geographic locations more importantly impacted by the outbreak. The scope and severity of such disruptions and their impact on the Company's financial results and operations could be material.
Pension funding volatility
The Company's funding requirements for its defined benefit pension plans are determined using actuarial valuations. See the section of this MD&A entitled Critical accounting estimates – Pensions and other postretirement benefits for information relating to the funding of the Company's defined benefit pension plans. Adverse changes with respect to pension plan returns and the level of interest rates as well as changes to existing federal pension legislation and regulation may significantly impact future pension contributions and have a material adverse effect on the funding status of the plans and the Company's results of operations.
There can be no assurance that the Company's pension expense and funding of its defined benefit pension plans will not increase in the future and thereby negatively impact earnings and/or cash flow.
Reliance on technology and related cybersecurity risk
The Company relies on information technology operated by it or under the control of third parties in all aspects of its business. The Company’s and its key third-party vendors’ information technology systems are critical to its ability to safely and effectively meet customer expectations, track, maintain, and operate trains and related vehicles, manage employees, and interface with customers, suppliers, vendors, and other third parties.
CN | 2023 Annual Report 63
MANAGEMENT'S DISCUSSION AND ANALYSIS
The Company and its third-party vendors and service providers have been subject to, and are likely to continue to be the target of, data breaches, cyber-attacks and other similar incidents. These incidents may include, among other things, malware, ransomware, distributed denial of service attacks, social engineering, phishing, theft, malfeasance or improper access by employees or third-party vendors, human error, fraud, or other modes of attack or disruption. Security threats continue to grow, are increasing in frequency, levels of persistence, intensity and sophistication, and can come from nation states, organized criminals, hacktivists and others. The Company and its third-party vendors and service providers are at heightened risk due to the Company’s position as a critical component of both the Canadian and U.S. infrastructure and may be impacted by cyber-attacks or security incidents, whether accidental or malicious. While the Company has security and mitigation programs, including business continuity and disaster recovery plans, in place to protect its operations, as well as information and technology assets, a cyber-attack, significant disruption or failure of its information technology and communications systems or those of its third-party vendors or service providers, including system failure, security breach, disruption by malware or other damage could interrupt or delay the Company’s operations, result in service interruptions, safety failures, security violations, regulatory compliance failures or other operational difficulties, damage its reputation, cause a loss of customers, vendors, suppliers, agents, or third-party capacity providers and lead to misappropriation of assets, misuse or corruption of critical data and proprietary information, and unauthorized system and data access or disclosures. The Company may experience security breaches that could remain undetected for an extended period and, therefore, have a greater impact on the services provided. A cyber incident or interruption of information technology systems, even for short periods of time, could expose the Company to a risk of loss, litigation, regulatory oversight, enforcement actions, damage to its reputation or cause it to incur significant time and expense to remedy such an event, any of which could have a material adverse impact on its operational and financial position.
Cybersecurity laws and regulations continue to evolve, and are increasingly demanding, both in the U.S. and Canada, which adds compliance complexity and may increase the Company’s costs of compliance and expose it to reputational damage or litigation, monetary damages, regulatory enforcement actions, or fines. The Company has invested and continues to invest in technology security initiatives, information technology risk management, business continuity and disaster recovery plans, and other security and mitigation programs to meet evolving network and cybersecurity expectations and regulations. The development and maintenance of these measures is costly and requires ongoing monitoring and updating as technologies change and efforts to overcome security measures become increasingly more frequent, intense, and sophisticated. Despite the Company’s efforts, however, it remains subject to the risk of cyber-attacks that could have a material adverse impact on its operational and financial position.
In addition, if the Company is unable to acquire or implement new technology, the Company may suffer a competitive disadvantage within the rail industry and with companies providing other modes of transportation service, which could also have an adverse effect on its operational and financial position.
Trade restrictions
Global as well as North American trade conditions, including trade barriers on certain commodities, may interfere with the free circulation of goods across Canada and the U.S. or the cost associated therewith.
There can be no assurance that trade actions will not materially adversely affect the volume of rail shipments and/or revenues from commodities carried by the Company, and thus materially and negatively impact earnings and/or cash flow.
Terrorism and international conflicts
Potential terrorist actions can have a direct or indirect impact on the transportation infrastructure, including railway infrastructure in North America, and can interfere with the free flow of goods. Rail lines, facilities and equipment could be directly targeted or become indirect casualties, which could interfere with the free flow of goods. International conflicts, including war, can also have an impact on the Company's markets. Government response to such events could adversely affect the Company's operations. Insurance premiums could also increase significantly or coverage could become unavailable.
Customer credit risk
In the normal course of business, the Company monitors the financial condition and credit limits of its customers and reviews the credit history of each new customer. Although the Company believes there are no significant concentrations of credit risk, economic conditions can affect the Company's customers and can result in an increase to the Company's credit risk and exposure to the business failures of its customers. A widespread deterioration of customer credit and/or business failures of customers could have a material adverse effect on the Company's results of operations, financial position or liquidity.
64 CN | 2023 Annual Report
MANAGEMENT'S DISCUSSION AND ANALYSIS
Liquidity
Disruptions in financial markets or deterioration of the Company's credit ratings could hinder the Company's access to external sources of funding to meet its liquidity needs. There can be no assurance that changes in the financial markets will not have a negative effect on the Company's liquidity and its access to capital at acceptable terms and rates.
Supplier concentration
The Company operates in a capital-intensive industry where the complexity of rail equipment (including rolling stock equipment, locomotives, rail and ties) limits the number of suppliers available. The Company also competes with other industries for available capacity and raw materials used in the production of locomotives and certain rail and rolling stock equipment. The supply market could be disrupted if changes in the economy caused any of the Company's suppliers to cease production or to experience capacity or supply shortages. The supply market could become further concentrated and could result in changes to the product or service offerings by suppliers. This could also result in cost increases to the Company and difficulty in obtaining and maintaining the Company's rail equipment and materials. Since the Company also has foreign suppliers, international relations, trade restrictions and global economic and other conditions may potentially interfere with the Company's ability to procure necessary equipment and materials. Widespread business failures of, or restrictions on suppliers, could have a material adverse effect on the Company's results of operations or financial position.
Availability of qualified personnel
The Company may experience demographic challenges in the employment levels of its workforce. Changes in employee demographics, training requirements and the availability of qualified personnel, particularly locomotive engineers and conductors and information technologists, could negatively impact the Company's ability to meet demand for rail service. The Company monitors employment levels and seeks to ensure that there is an adequate supply of personnel to meet rail service requirements. However, the Company's efforts to attract and retain qualified personnel may be hindered by specific conditions in the job market. No assurance can be given that demographic or other challenges will not materially adversely affect the Company's results of operations or its financial position.
Fuel costs and supply disruptions
The Company is susceptible to the volatility of fuel prices due to changes in the economy or supply disruptions. Rapid fluctuations in fuel prices or fuel supply disruptions can occur due to refinery disruptions, production quota restrictions, increased demand in existing or emerging foreign markets, climate, international politics, labor and political instability, as well as war. Increases in fuel prices or supply disruptions may materially adversely affect the Company's results of operations, financial position or liquidity.
Foreign exchange
The Company conducts its business in both Canada and the U.S. and as a result, is affected by currency fluctuations. Changes in the exchange rate between the Canadian dollar and other currencies (including the US dollar) make the goods transported by the Company more or less competitive in the world marketplace and thereby may adversely affect the Company's revenues and expenses.
Interest rates
The Company is exposed to interest rate risk relating to the Company's debt. The Company mainly issues fixed-rate debt, which exposes the Company to variability in the fair value of the debt. The Company also issues debt with variable interest rates, which exposes the Company to variability in interest expense. Adverse changes to market interest rates may significantly impact the fair value or future cash flows of the Company's financial instruments. There can be no assurance that changes in the market interest rates will not have a negative effect on the Company's results of operations or liquidity.
CN | 2023 Annual Report 65
MANAGEMENT'S DISCUSSION AND ANALYSIS
Transportation network disruptions
Due to the integrated nature of the North American freight transportation infrastructure, the Company's operations may be negatively affected by service disruptions of its own network, including illegal blockades, as well as of other transportation links such as ports and other railroads which interchange with the Company. A significant prolonged service disruption of CN's network or one or more of these entities could have an adverse effect on the Company's results of operations, financial position or liquidity. Furthermore, deterioration in the cooperative relationships with the Company's connecting carriers could directly affect the Company's operations.
Severe weather
The Company's success is dependent on its ability to operate its railroad efficiently. Severe weather and natural disasters, such as extreme cold or heat, flooding, droughts, fires, hurricanes, landslides and earthquakes, can disrupt operations and service for the railroad, affect the performance of locomotives and rolling stock, disrupt operations for both the Company and its customers as well as damage the Company's infrastructure or properties. Changes in weather patterns caused by climate change are expected to increase the frequency, severity or duration of certain adverse weather conditions. Business interruptions resulting from severe weather could result in increased costs, including modifications to existing infrastructure or implementation of new infrastructure to prevent or reduce severity of future impacts to the Company's business, and increased liabilities and lower revenues, which could have a material adverse effect on the Company's results of operations, financial condition or liquidity. If any natural occurrence leads to catastrophic interruption of service, the Company may not be able to restore service without a significant interruption in operations.
Insurance maintained by the Company to protect against loss of business and other related consequences resulting from these natural occurrences is subject to coverage limitations, depending on the nature of the risk insured. This insurance may not be sufficient to cover all of the Company's damages or damages to others, and may not continue to be available at commercially reasonable rates.
Climate change
Market changes
The Company’s business is based on transporting a wide variety of commodities from suppliers to the marketplace. The Company regularly transports energy commodities that serve refineries, processing locations, and end-users across North America and global markets. The Company’s business lines include thermal and metallurgical coal, crude oil and petroleum products, including liquefied petroleum gas, fuel oil, asphalt, gasoline, condensate (diluent), and lubricant oils. Shifting consumer demand to lower-carbon products and increased climate-focused regulations, such as carbon pricing and fuel regulations, may bring about a broad transition in the energy sector. Programs that place a price on carbon emissions or other government restrictions on certain market sectors may further impact current and potential freight rail customers in the energy sector. A comprehensive transition in the energy sector could significantly impact the markets of the Company's energy customers or lead to market differentiation through geographic variation in policies and demand trends. A portion of the Company’s business could be materially affected by potential future changes and instability of such a transition. Government incentives encouraging the use of alternative sources of energy also could affect certain of the Company's customers and the markets for certain of the commodities it carries in a manner that could alter our traffic patterns. Climate change could affect the markets for, or the volume of, the goods the Company carries or otherwise have a material adverse effect on the Company's results of operations, financial positions or liquidity.
Government actions
Government action or inaction to address climate change could also affect CN. The Company is currently subject to climate change and other emissions-related laws and regulations that have been proposed and, in some cases adopted, at the federal, provincial and state levels. While CN is continually focused on efficiency improvements and reducing its carbon footprint, cap and trade systems, carbon taxes, or other controls on emissions of greenhouse gases imposed by various government bodies could increase the Company's capital and operating costs. An escalating price on carbon emissions could materially increase direct costs related to fuel purchases and indirect expenses related to purchased goods, materials, and electricity required to operate our business. The Company may not be able to offset such impacts through, for example, higher freight rates. Climate change legislation and regulation could also affect CN's customers; make it difficult for CN's customers to produce products in a cost-competitive manner due to increased energy costs; and increase legal costs related to defending and resolving legal claims and other litigation related to climate change.
66 CN | 2023 Annual Report
MANAGEMENT'S DISCUSSION AND ANALYSIS
Reputation
The Company has a well-recognized brand that our customers associate with quality and safe transportation services. Failure to maintain quality, ethical and socially responsible operations across the Company's supply chain could materially adversely affect its brand and reputation. Public concerns about the environmental impact of the Company’s operations could also negatively impact consumers’ perceptions of the Company’s brand and reputation. Any negative publicity about, or significant damage to, the Company’s brand and reputation could have an adverse impact on customer perception and confidence, which could materially adversely affect the Company's results of operations or its financial position. Also, the pervasiveness and viral nature of social media could exacerbate any negative publicity with respect to the Company's business practices.
Moreover, increasing governmental and public awareness and concern about ESG matters, notably climate change, sustainability, diversity and Indigenous relations, could result in enhanced legal requirements or public expectations, in each case, that aim or require to expand the nature, scope and complexity of matters that the Company is required to control, assess, comply with or report. The Company's inability to meet evolving requirements and/or expectations could materially adversely affect the Company's brand and reputation, which could in turn materially adversely affect the Company's results of operations or its financial position. The Company's access to capital could also be negatively affected if financial institutions, rating agencies and/or lenders adopt more restrictive ESG policies that the Company may not be able to meet.
Additionally, CN has set a number of specific climate targets, which are subject to ongoing disclosure by the Company. Achieving these targets is subject to several risks and uncertainties, and there can be no certainty that the Company will achieve these targets within the stated timeframe, or that achieving any of these targets will meet all of the expectations of its stakeholders or applicable legal requirements. Risks associated with achieving the Company's climate targets include but are not limited to future investments in and the availability of greenhouse gas (GHG) emissions-reduction tools and technologies, significant changes in the Company's GHG emissions profile as a result of changes to its railway asset base, the Company's ability to work with governments and third parties to mitigate the impacts of climate change, domestic and international economic conditions, including exchange rates, the effects of competition and regulation, uncertainties in the financial markets, capital spending, actions of vendors, the willingness of customers to acquire our services, cost of network expansion, maintenance and retrofits, and physical impact of climate change on our business. Also, the implementation of these objectives may expose it to certain additional heightened financial and operational risks, and is expected to require additional costs, which may be higher than anticipated. If the Company is unable to achieve its climate targets or satisfy the expectations of its stakeholders, its brand and reputation could be materially and adversely affected.
Controls and procedures
The Company's Chief Executive Officer and its Chief Financial Officer, after evaluating the effectiveness of the Company's disclosure controls and procedures (as defined in Exchange Act Rules 13a-15(e) and 15d-15(e)) as of December 31, 2023, have concluded that the Company's disclosure controls and procedures were effective.
During the fourth quarter ended December 31, 2023, there were no changes in the Company's internal control over financial reporting (as defined in Exchange Act Rules 13a-15(f) and 15d-15(f)) that materially affected, or are reasonably likely to materially affect, the Company's internal control over financial reporting.
As of December 31, 2023, management has assessed the effectiveness of the Company's internal control over financial reporting (as defined in Exchange Act Rules 13a-15(f) and 15d-15(f)) using the criteria set forth by the Committee of Sponsoring Organizations of the Treadway Commission in Internal Control – Integrated Framework (2013). Based on this assessment, management has determined that the Company's internal control over financial reporting was effective as of December 31, 2023, and issued Management's Report on Internal Control over Financial Reporting dated January 31, 2024 to that effect.
CN | 2023 Annual Report 67