0000014693false2024FYTRUETRUEExpensed first time advertising takes placeExpensed first time advertising takes placehttp://fasb.org/us-gaap/2023#OtherOperatingIncomeExpenseNethttp://fasb.org/us-gaap/2023#OtherOperatingIncomeExpenseNethttp://fasb.org/us-gaap/2023#DomesticPlanMemberhttp://fasb.org/us-gaap/2023#DomesticPlanMemberhttp://fasb.org/us-gaap/2023#DomesticPlanMemberhttp://fasb.org/us-gaap/2023#DomesticPlanMemberTRUEhttp://fasb.org/us-gaap/2023#OtherOperatingIncomeExpenseNethttp://fasb.org/us-gaap/2023#OtherOperatingIncomeExpenseNetiso4217:USDxbrli:sharesiso4217:USDxbrli:sharesxbrli:pureiso4217:EURiso4217:GBP00000146932023-05-012024-04-300000014693us-gaap:CommonClassAMember2023-05-012024-04-300000014693us-gaap:NonvotingCommonStockMember2023-05-012024-04-300000014693bfb:OnePointTwoPercentNotesDueinFiscalTwoThousandTwentySevenMember2023-05-012024-04-300000014693bfb:TwoPointSixPercentNotesDueinFiscalTwoThousandTwentyNineMember2023-05-012024-04-3000000146932024-04-300000014693us-gaap:CommonClassAMember2024-06-100000014693us-gaap:NonvotingCommonStockMember2024-06-1000000146932021-05-012022-04-3000000146932022-05-012023-04-3000000146932023-04-300000014693us-gaap:CommonClassAMember2023-04-300000014693us-gaap:CommonClassAMember2024-04-300000014693us-gaap:NonvotingCommonStockMember2023-04-300000014693us-gaap:NonvotingCommonStockMember2024-04-3000000146932021-04-3000000146932022-04-300000014693us-gaap:CommonClassAMemberus-gaap:CommonStockMember2021-04-300000014693us-gaap:NonvotingCommonStockMemberus-gaap:CommonStockMember2021-04-300000014693us-gaap:AdditionalPaidInCapitalMember2021-04-300000014693us-gaap:RetainedEarningsMember2021-04-300000014693us-gaap:AccumulatedOtherComprehensiveIncomeMember2021-04-300000014693us-gaap:TreasuryStockCommonMember2021-04-300000014693us-gaap:RetainedEarningsMember2021-05-012022-04-300000014693us-gaap:AccumulatedOtherComprehensiveIncomeMember2021-05-012022-04-300000014693us-gaap:AdditionalPaidInCapitalMember2021-05-012022-04-300000014693us-gaap:TreasuryStockCommonMember2021-05-012022-04-300000014693us-gaap:CommonClassAMemberus-gaap:CommonStockMember2022-04-300000014693us-gaap:NonvotingCommonStockMemberus-gaap:CommonStockMember2022-04-300000014693us-gaap:AdditionalPaidInCapitalMember2022-04-300000014693us-gaap:RetainedEarningsMember2022-04-300000014693us-gaap:AccumulatedOtherComprehensiveIncomeMember2022-04-300000014693us-gaap:TreasuryStockCommonMember2022-04-300000014693us-gaap:RetainedEarningsMember2022-05-012023-04-300000014693us-gaap:AccumulatedOtherComprehensiveIncomeMember2022-05-012023-04-300000014693us-gaap:AdditionalPaidInCapitalMember2022-05-012023-04-300000014693us-gaap:TreasuryStockCommonMember2022-05-012023-04-300000014693us-gaap:CommonClassAMemberus-gaap:CommonStockMember2023-04-300000014693us-gaap:NonvotingCommonStockMemberus-gaap:CommonStockMember2023-04-300000014693us-gaap:AdditionalPaidInCapitalMember2023-04-300000014693us-gaap:RetainedEarningsMember2023-04-300000014693us-gaap:AccumulatedOtherComprehensiveIncomeMember2023-04-300000014693us-gaap:TreasuryStockCommonMember2023-04-300000014693us-gaap:RetainedEarningsMember2023-05-012024-04-300000014693us-gaap:AccumulatedOtherComprehensiveIncomeMember2023-05-012024-04-300000014693us-gaap:TreasuryStockCommonMember2023-05-012024-04-300000014693us-gaap:AdditionalPaidInCapitalMember2023-05-012024-04-300000014693us-gaap:CommonClassAMemberus-gaap:CommonStockMember2024-04-300000014693us-gaap:NonvotingCommonStockMemberus-gaap:CommonStockMember2024-04-300000014693us-gaap:AdditionalPaidInCapitalMember2024-04-300000014693us-gaap:RetainedEarningsMember2024-04-300000014693us-gaap:AccumulatedOtherComprehensiveIncomeMember2024-04-300000014693us-gaap:TreasuryStockCommonMember2024-04-300000014693srt:MinimumMemberus-gaap:BuildingImprovementsMember2024-04-300000014693srt:MaximumMemberus-gaap:BuildingImprovementsMember2024-04-300000014693srt:MinimumMemberus-gaap:MachineryAndEquipmentMember2024-04-300000014693srt:MaximumMemberus-gaap:MachineryAndEquipmentMember2024-04-300000014693srt:MinimumMemberus-gaap:ComputerSoftwareIntangibleAssetMember2024-04-300000014693srt:MaximumMemberus-gaap:ComputerSoftwareIntangibleAssetMember2024-04-300000014693bfb:DuckhornMember2024-04-300000014693bfb:ThreePointFivePercentNotesDueinFiscalTwoThousandTwentyFiveMember2023-04-300000014693bfb:ThreePointFivePercentNotesDueinFiscalTwoThousandTwentyFiveMember2024-04-300000014693bfb:ThreePointFivePercentNotesDueinFiscalTwoThousandTwentyFiveMember2023-05-012024-04-300000014693bfb:ThreePointFivePercentNotesDueinFiscalTwoThousandTwentyFiveMember2022-05-012023-04-300000014693bfb:OnePointTwoPercentNotesDueinFiscalTwoThousandTwentySevenMember2023-04-300000014693bfb:OnePointTwoPercentNotesDueinFiscalTwoThousandTwentySevenMember2024-04-300000014693bfb:OnePointTwoPercentNotesDueinFiscalTwoThousandTwentySevenMember2022-05-012023-04-300000014693bfb:TwoPointSixPercentNotesDueinFiscalTwoThousandTwentyNineMember2023-04-300000014693bfb:TwoPointSixPercentNotesDueinFiscalTwoThousandTwentyNineMember2024-04-300000014693bfb:TwoPointSixPercentNotesDueinFiscalTwoThousandTwentyNineMember2022-05-012023-04-300000014693bfb:FourPointSevenFivePercentNotesDueInFiscalTwoThousandThirtyThreeMember2023-04-300000014693bfb:FourPointSevenFivePercentNotesDueInFiscalTwoThousandThirtyThreeMember2024-04-300000014693bfb:FourPointSevenFivePercentNotesDueInFiscalTwoThousandThirtyThreeMember2023-05-012024-04-300000014693bfb:FourPointSevenFivePercentNotesDueInFiscalTwoThousandThirtyThreeMember2022-05-012023-04-300000014693bfb:FourPointZeroPercentNotesDueinFiscalTwoThousandEightMember2024-04-300000014693bfb:FourPointZeroPercentNotesDueinFiscalTwoThousandEightMember2023-04-300000014693bfb:FourPointZeroPercentNotesDueinFiscalTwoThousandEightMember2023-05-012024-04-300000014693bfb:FourPointZeroPercentNotesDueinFiscalTwoThousandEightMember2022-05-012023-04-300000014693bfb:ThreePointSevenFivePercentNotesDueInFiscalTwoThousandFortyThreeMember2023-04-300000014693bfb:ThreePointSevenFivePercentNotesDueInFiscalTwoThousandFortyThreeMember2024-04-300000014693bfb:ThreePointSevenFivePercentNotesDueInFiscalTwoThousandFortyThreeMember2023-05-012024-04-300000014693bfb:ThreePointSevenFivePercentNotesDueInFiscalTwoThousandFortyThreeMember2022-05-012023-04-300000014693bfb:FourPointFivePercentNotesDueinFiscalTwoThousandFortySixMember2023-04-300000014693bfb:FourPointFivePercentNotesDueinFiscalTwoThousandFortySixMember2024-04-300000014693bfb:FourPointFivePercentNotesDueinFiscalTwoThousandFortySixMember2022-05-012023-04-300000014693bfb:FourPointFivePercentNotesDueinFiscalTwoThousandFortySixMember2023-05-012024-04-300000014693us-gaap:CommonClassAMember2021-04-300000014693us-gaap:NonvotingCommonStockMember2021-04-300000014693us-gaap:CommonClassAMember2021-05-012022-04-300000014693us-gaap:NonvotingCommonStockMember2021-05-012022-04-300000014693us-gaap:CommonClassAMember2022-04-300000014693us-gaap:NonvotingCommonStockMember2022-04-300000014693us-gaap:CommonClassAMember2022-05-012023-04-300000014693us-gaap:NonvotingCommonStockMember2022-05-012023-04-300000014693country:US2021-05-012022-04-300000014693country:US2022-05-012023-04-300000014693country:US2023-05-012024-04-300000014693bfb:DevelopedInternationalMember2021-05-012022-04-300000014693bfb:DevelopedInternationalMember2022-05-012023-04-300000014693bfb:DevelopedInternationalMember2023-05-012024-04-300000014693bfb:EmergingMember2021-05-012022-04-300000014693bfb:EmergingMember2022-05-012023-04-300000014693bfb:EmergingMember2023-05-012024-04-300000014693bfb:TravelRetailMember2021-05-012022-04-300000014693bfb:TravelRetailMember2022-05-012023-04-300000014693bfb:TravelRetailMember2023-05-012024-04-300000014693bfb:NonbrandedandbulkMember2021-05-012022-04-300000014693bfb:NonbrandedandbulkMember2022-05-012023-04-300000014693bfb:NonbrandedandbulkMember2023-05-012024-04-300000014693bfb:WhiskeyMember2021-05-012022-04-300000014693bfb:WhiskeyMember2022-05-012023-04-300000014693bfb:WhiskeyMember2023-05-012024-04-300000014693bfb:ReadyToDrinkMember2021-05-012022-04-300000014693bfb:ReadyToDrinkMember2022-05-012023-04-300000014693bfb:ReadyToDrinkMember2023-05-012024-04-300000014693bfb:TequilaMember2021-05-012022-04-300000014693bfb:TequilaMember2022-05-012023-04-300000014693bfb:TequilaMember2023-05-012024-04-300000014693bfb:WineMember2021-05-012022-04-300000014693bfb:WineMember2022-05-012023-04-300000014693bfb:WineMember2023-05-012024-04-300000014693bfb:VodkaMember2021-05-012022-04-300000014693bfb:VodkaMember2022-05-012023-04-300000014693bfb:VodkaMember2023-05-012024-04-300000014693bfb:NonbrandedandbulkMember2021-05-012022-04-300000014693bfb:NonbrandedandbulkMember2022-05-012023-04-300000014693bfb:NonbrandedandbulkMember2023-05-012024-04-300000014693bfb:RestofportfolioMember2021-05-012022-04-300000014693bfb:RestofportfolioMember2022-05-012023-04-300000014693bfb:RestofportfolioMember2023-05-012024-04-300000014693us-gaap:PensionPlansDefinedBenefitMember2022-04-300000014693us-gaap:PensionPlansDefinedBenefitMember2023-04-300000014693us-gaap:OtherPostretirementBenefitPlansDefinedBenefitMember2022-04-300000014693us-gaap:OtherPostretirementBenefitPlansDefinedBenefitMember2023-04-300000014693us-gaap:PensionPlansDefinedBenefitMember2022-05-012023-04-300000014693us-gaap:PensionPlansDefinedBenefitMember2023-05-012024-04-300000014693us-gaap:OtherPostretirementBenefitPlansDefinedBenefitMember2022-05-012023-04-300000014693us-gaap:OtherPostretirementBenefitPlansDefinedBenefitMember2023-05-012024-04-300000014693us-gaap:PensionPlansDefinedBenefitMember2024-04-300000014693us-gaap:OtherPostretirementBenefitPlansDefinedBenefitMember2024-04-300000014693bfb:PublicEquityInvestmentsMember2024-04-300000014693us-gaap:FixedIncomeInvestmentsMember2024-04-300000014693bfb:AlternativeInvestmentsMember2024-04-300000014693us-gaap:EquitySecuritiesMemberus-gaap:FairValueInputsLevel1Member2023-04-300000014693us-gaap:EquitySecuritiesMemberus-gaap:FairValueInputsLevel2Member2023-04-300000014693us-gaap:FairValueInputsLevel3Memberus-gaap:EquitySecuritiesMember2023-04-300000014693us-gaap:FairValueInputsLevel12And3Memberus-gaap:EquitySecuritiesMember2023-04-300000014693bfb:CashAndTemporaryInvestmentsMemberus-gaap:FairValueInputsLevel1Member2023-04-300000014693bfb:CashAndTemporaryInvestmentsMemberus-gaap:FairValueInputsLevel2Member2023-04-300000014693us-gaap:FairValueInputsLevel3Memberbfb:CashAndTemporaryInvestmentsMember2023-04-300000014693us-gaap:FairValueInputsLevel12And3Memberbfb:CashAndTemporaryInvestmentsMember2023-04-300000014693us-gaap:PrivateEquityFundsMemberus-gaap:FairValueInputsLevel1Member2023-04-300000014693us-gaap:FairValueInputsLevel2Memberus-gaap:PrivateEquityFundsMember2023-04-300000014693us-gaap:FairValueInputsLevel3Memberus-gaap:PrivateEquityFundsMember2023-04-300000014693us-gaap:FairValueInputsLevel12And3Memberus-gaap:PrivateEquityFundsMember2023-04-300000014693us-gaap:FairValueInputsLevel1Member2023-04-300000014693us-gaap:FairValueInputsLevel2Member2023-04-300000014693us-gaap:FairValueInputsLevel3Member2023-04-300000014693us-gaap:FairValueInputsLevel12And3Member2023-04-300000014693us-gaap:FairValueMeasuredAtNetAssetValuePerShareMemberus-gaap:EquityFundsMember2023-04-300000014693us-gaap:FairValueMeasuredAtNetAssetValuePerShareMemberus-gaap:FixedIncomeFundsMember2023-04-300000014693us-gaap:FairValueMeasuredAtNetAssetValuePerShareMemberus-gaap:RealEstateMember2023-04-300000014693us-gaap:FairValueMeasuredAtNetAssetValuePerShareMemberus-gaap:ShortTermInvestmentsMember2023-04-300000014693us-gaap:FairValueMeasuredAtNetAssetValuePerShareMemberus-gaap:PrivateEquityFundsMember2023-04-300000014693us-gaap:EquitySecuritiesMemberus-gaap:FairValueInputsLevel1Member2024-04-300000014693us-gaap:EquitySecuritiesMemberus-gaap:FairValueInputsLevel2Member2024-04-300000014693us-gaap:FairValueInputsLevel3Memberus-gaap:EquitySecuritiesMember2024-04-300000014693us-gaap:FairValueInputsLevel12And3Memberus-gaap:EquitySecuritiesMember2024-04-300000014693us-gaap:FairValueInputsLevel1Memberus-gaap:FixedIncomeInvestmentsMember2024-04-300000014693us-gaap:FairValueInputsLevel2Memberus-gaap:FixedIncomeInvestmentsMember2024-04-300000014693us-gaap:FairValueInputsLevel3Memberus-gaap:FixedIncomeInvestmentsMember2024-04-300000014693us-gaap:FairValueInputsLevel12And3Memberus-gaap:FixedIncomeInvestmentsMember2024-04-300000014693us-gaap:PrivateEquityFundsMemberus-gaap:FairValueInputsLevel1Member2024-04-300000014693us-gaap:FairValueInputsLevel2Memberus-gaap:PrivateEquityFundsMember2024-04-300000014693us-gaap:FairValueInputsLevel3Memberus-gaap:PrivateEquityFundsMember2024-04-300000014693us-gaap:FairValueInputsLevel12And3Memberus-gaap:PrivateEquityFundsMember2024-04-300000014693bfb:PendingTransactionsMemberus-gaap:FairValueInputsLevel1Member2024-04-300000014693us-gaap:FairValueInputsLevel2Memberbfb:PendingTransactionsMember2024-04-300000014693us-gaap:FairValueInputsLevel3Memberbfb:PendingTransactionsMember2024-04-300000014693us-gaap:FairValueInputsLevel12And3Memberbfb:PendingTransactionsMember2024-04-300000014693us-gaap:FairValueInputsLevel1Member2024-04-300000014693us-gaap:FairValueInputsLevel2Member2024-04-300000014693us-gaap:FairValueInputsLevel3Member2024-04-300000014693us-gaap:FairValueInputsLevel12And3Member2024-04-300000014693us-gaap:FairValueMeasuredAtNetAssetValuePerShareMemberus-gaap:EquityFundsMember2024-04-300000014693us-gaap:FairValueMeasuredAtNetAssetValuePerShareMemberus-gaap:FixedIncomeFundsMember2024-04-300000014693us-gaap:FairValueMeasuredAtNetAssetValuePerShareMemberus-gaap:RealEstateMember2024-04-300000014693us-gaap:FairValueMeasuredAtNetAssetValuePerShareMemberus-gaap:ShortTermInvestmentsMember2024-04-300000014693us-gaap:FairValueMeasuredAtNetAssetValuePerShareMemberus-gaap:PrivateEquityFundsMember2024-04-300000014693us-gaap:FairValueInputsLevel3Member2022-04-300000014693us-gaap:FairValueInputsLevel3Member2022-05-012023-04-300000014693us-gaap:FairValueInputsLevel3Member2023-05-012024-04-300000014693us-gaap:PensionPlansDefinedBenefitMember2021-05-012022-04-300000014693us-gaap:OtherPostretirementBenefitPlansDefinedBenefitMember2021-05-012022-04-300000014693us-gaap:StockAppreciationRightsSARSMember2023-04-300000014693us-gaap:StockAppreciationRightsSARSMember2023-05-012024-04-300000014693us-gaap:StockAppreciationRightsSARSMember2024-04-300000014693us-gaap:StockAppreciationRightsSARSMember2021-05-012022-04-300000014693us-gaap:StockAppreciationRightsSARSMember2022-05-012023-04-300000014693bfb:PBRSUMember2023-04-300000014693bfb:PBRSUMember2023-05-012024-04-300000014693bfb:PBRSUMember2024-04-300000014693bfb:PBRSUMember2021-05-012022-04-300000014693bfb:PBRSUMember2022-05-012023-04-300000014693us-gaap:RestrictedStockUnitsRSUMember2023-04-300000014693us-gaap:RestrictedStockUnitsRSUMember2023-05-012024-04-300000014693us-gaap:RestrictedStockUnitsRSUMember2024-04-300000014693bfb:DeferredStockUnitsDSUsMember2024-04-300000014693bfb:DeferredStockUnitsDSUsMember2021-05-012022-04-300000014693bfb:DeferredStockUnitsDSUsMember2022-05-012023-04-300000014693bfb:DeferredStockUnitsDSUsMember2023-05-012024-04-300000014693us-gaap:DomesticCountryMember2023-04-300000014693us-gaap:DomesticCountryMember2024-04-300000014693us-gaap:ForeignCountryMember2023-04-300000014693us-gaap:ForeignCountryMember2024-04-300000014693us-gaap:DomesticCountryMemberbfb:NotSubjecttoExpirationMember2024-04-300000014693bfb:SubjectToExpirationMemberus-gaap:DomesticCountryMember2024-04-300000014693us-gaap:ForeignCountryMemberbfb:NotSubjecttoExpirationMember2024-04-300000014693bfb:SubjectToExpirationMemberus-gaap:ForeignCountryMember2024-04-300000014693bfb:GinMareMember2022-11-030000014693bfb:GinMareMember2022-11-032022-11-030000014693bfb:GinMareMember2023-05-012024-04-300000014693bfb:GinMareMemberbfb:PriorAllocationMember2022-11-030000014693bfb:AdjustmentsMemberbfb:GinMareMember2022-11-030000014693bfb:DiplomaticoMember2023-01-050000014693bfb:DiplomaticoMember2023-01-052023-01-050000014693bfb:AdjustmentsMemberbfb:DiplomaticoMember2023-01-050000014693bfb:DiplomaticoMember2023-05-012024-04-300000014693bfb:DiplomaticoMemberbfb:PriorAllocationMember2023-01-050000014693us-gaap:SellingGeneralAndAdministrativeExpensesMember2023-05-012024-04-300000014693bfb:OtherExpenseIncomeNetMember2023-05-012024-04-300000014693bfb:FinlandiaMember2023-11-010000014693bfb:FinlandiaMember2023-05-012024-04-300000014693bfb:SonomaCutrerMember2023-05-012024-04-300000014693bfb:SonomaCutrerMember2024-04-300000014693us-gaap:ForeignExchangeContractMember2023-04-300000014693us-gaap:ForeignExchangeContractMember2024-04-300000014693us-gaap:NetInvestmentHedgingMemberus-gaap:DesignatedAsHedgingInstrumentMember2023-04-300000014693us-gaap:NetInvestmentHedgingMemberus-gaap:DesignatedAsHedgingInstrumentMember2024-04-300000014693us-gaap:ForeignExchangeContractMember2021-05-012022-04-300000014693us-gaap:ForeignExchangeContractMember2022-05-012023-04-300000014693us-gaap:ForeignExchangeContractMember2023-05-012024-04-300000014693us-gaap:ForeignExchangeContractMemberus-gaap:SalesMember2021-05-012022-04-300000014693us-gaap:ForeignExchangeContractMemberus-gaap:SalesMember2022-05-012023-04-300000014693us-gaap:ForeignExchangeContractMemberus-gaap:SalesMember2023-05-012024-04-300000014693us-gaap:ForeignExchangeContractMemberus-gaap:OtherIncomeMember2021-05-012022-04-300000014693us-gaap:ForeignExchangeContractMemberus-gaap:OtherIncomeMember2022-05-012023-04-300000014693us-gaap:ForeignExchangeContractMemberus-gaap:OtherIncomeMember2023-05-012024-04-300000014693us-gaap:InterestRateContractMember2021-05-012022-04-300000014693us-gaap:InterestRateContractMember2022-05-012023-04-300000014693us-gaap:InterestRateContractMember2023-05-012024-04-300000014693bfb:ForeignCurrencyDenominatedDebtMember2021-05-012022-04-300000014693bfb:ForeignCurrencyDenominatedDebtMember2022-05-012023-04-300000014693bfb:ForeignCurrencyDenominatedDebtMember2023-05-012024-04-300000014693bfb:GainOnBusinessDivestituresMemberbfb:ForeignCurrencyDenominatedDebtMember2021-05-012022-04-300000014693bfb:GainOnBusinessDivestituresMemberbfb:ForeignCurrencyDenominatedDebtMember2022-05-012023-04-300000014693bfb:GainOnBusinessDivestituresMemberbfb:ForeignCurrencyDenominatedDebtMember2023-05-012024-04-300000014693us-gaap:OtherCurrentAssetsMemberus-gaap:DesignatedAsHedgingInstrumentMemberus-gaap:ForeignExchangeContractMemberus-gaap:CashFlowHedgingMember2023-04-300000014693us-gaap:DesignatedAsHedgingInstrumentMemberus-gaap:ForeignExchangeContractMemberus-gaap:CashFlowHedgingMemberus-gaap:OtherAssetsMember2023-04-300000014693us-gaap:DesignatedAsHedgingInstrumentMemberus-gaap:ForeignExchangeContractMemberus-gaap:CashFlowHedgingMemberbfb:AccruedExpensesMember2023-04-300000014693us-gaap:OtherLiabilitiesMemberus-gaap:DesignatedAsHedgingInstrumentMemberus-gaap:ForeignExchangeContractMemberus-gaap:CashFlowHedgingMember2023-04-300000014693us-gaap:NondesignatedMemberus-gaap:OtherCurrentAssetsMemberus-gaap:ForeignExchangeContractMember2023-04-300000014693us-gaap:OtherCurrentAssetsMemberus-gaap:DesignatedAsHedgingInstrumentMemberus-gaap:ForeignExchangeContractMemberus-gaap:CashFlowHedgingMember2024-04-300000014693us-gaap:DesignatedAsHedgingInstrumentMemberus-gaap:ForeignExchangeContractMemberus-gaap:CashFlowHedgingMemberus-gaap:OtherAssetsMember2024-04-300000014693us-gaap:NondesignatedMemberus-gaap:ForeignExchangeContractMemberbfb:AccruedExpensesMember2024-04-300000014693us-gaap:AccumulatedTranslationAdjustmentMember2021-05-012022-04-300000014693us-gaap:AccumulatedNetGainLossFromDesignatedOrQualifyingCashFlowHedgesMember2021-05-012022-04-300000014693us-gaap:AccumulatedDefinedBenefitPlansAdjustmentMember2021-05-012022-04-300000014693us-gaap:AccumulatedTranslationAdjustmentMember2022-05-012023-04-300000014693us-gaap:AccumulatedNetGainLossFromDesignatedOrQualifyingCashFlowHedgesMember2022-05-012023-04-300000014693us-gaap:AccumulatedDefinedBenefitPlansAdjustmentMember2022-05-012023-04-300000014693us-gaap:AccumulatedTranslationAdjustmentMember2023-05-012024-04-300000014693us-gaap:AccumulatedNetGainLossFromDesignatedOrQualifyingCashFlowHedgesMember2023-05-012024-04-300000014693us-gaap:AccumulatedDefinedBenefitPlansAdjustmentMember2023-05-012024-04-300000014693us-gaap:AccumulatedDefinedBenefitPlansAdjustmentMemberus-gaap:OtherIncomeMember2021-05-012022-04-300000014693country:MX2021-05-012022-04-300000014693country:MX2022-05-012023-04-300000014693country:MX2023-05-012024-04-300000014693country:DE2021-05-012022-04-300000014693country:DE2022-05-012023-04-300000014693country:DE2023-05-012024-04-300000014693country:AU2021-05-012022-04-300000014693country:AU2022-05-012023-04-300000014693country:AU2023-05-012024-04-300000014693country:GB2021-05-012022-04-300000014693country:GB2022-05-012023-04-300000014693country:GB2023-05-012024-04-300000014693bfb:OtherCountriesMember2021-05-012022-04-300000014693bfb:OtherCountriesMember2022-05-012023-04-300000014693bfb:OtherCountriesMember2023-05-012024-04-300000014693us-gaap:CustomerConcentrationRiskMemberus-gaap:RevenueFromContractWithCustomerMemberbfb:LargestCustomerMember2021-05-012022-04-300000014693us-gaap:CustomerConcentrationRiskMemberus-gaap:RevenueFromContractWithCustomerMemberbfb:SecondLargestCustomerMember2021-05-012022-04-300000014693us-gaap:CustomerConcentrationRiskMemberus-gaap:RevenueFromContractWithCustomerMemberbfb:LargestCustomerMember2022-05-012023-04-300000014693us-gaap:CustomerConcentrationRiskMemberus-gaap:RevenueFromContractWithCustomerMemberbfb:SecondLargestCustomerMember2022-05-012023-04-300000014693us-gaap:CustomerConcentrationRiskMemberus-gaap:RevenueFromContractWithCustomerMemberbfb:LargestCustomerMember2023-05-012024-04-300000014693us-gaap:CustomerConcentrationRiskMemberus-gaap:RevenueFromContractWithCustomerMemberbfb:SecondLargestCustomerMember2023-05-012024-04-300000014693us-gaap:NonUsMember2023-04-300000014693us-gaap:NonUsMember2024-04-3000000146932024-02-012024-04-300000014693us-gaap:AllowanceForCreditLossMember2021-04-300000014693us-gaap:AllowanceForCreditLossMember2021-05-012022-04-300000014693us-gaap:AllowanceForCreditLossMember2022-04-300000014693us-gaap:ValuationAllowanceOfDeferredTaxAssetsMember2021-04-300000014693us-gaap:ValuationAllowanceOfDeferredTaxAssetsMember2021-05-012022-04-300000014693us-gaap:ValuationAllowanceOfDeferredTaxAssetsMember2022-04-300000014693us-gaap:AllowanceForCreditLossMember2022-05-012023-04-300000014693us-gaap:AllowanceForCreditLossMember2023-04-300000014693us-gaap:ValuationAllowanceOfDeferredTaxAssetsMember2022-05-012023-04-300000014693us-gaap:ValuationAllowanceOfDeferredTaxAssetsMember2023-04-300000014693us-gaap:AllowanceForCreditLossMember2023-05-012024-04-300000014693us-gaap:AllowanceForCreditLossMember2024-04-300000014693us-gaap:ValuationAllowanceOfDeferredTaxAssetsMember2023-05-012024-04-300000014693us-gaap:ValuationAllowanceOfDeferredTaxAssetsMember2024-04-30
UNITED STATES
SECURITIES AND EXCHANGE COMMISSION
Washington, D.C. 20549
Form 10-K
|
|
|
|
|
|
| (Mark One) |
|
| ☑ |
ANNUAL REPORT PURSUANT TO SECTION 13 OR 15(d) OF
THE SECURITIES EXCHANGE ACT OF 1934 |
For the fiscal year ended April 30, 2024
OR
|
|
|
|
|
|
| ☐ |
TRANSITION REPORT PURSUANT TO SECTION 13 OR 15(d) OF
THE SECURITIES EXCHANGE ACT OF 1934 |
For the transition period from to
Commission File Number 001-00123
BROWN-FORMAN CORPORATION
(Exact name of registrant as specified in its charter)
|
|
|
|
|
|
|
|
|
| Delaware |
61-0143150 |
| (State or other jurisdiction of incorporation or organization) |
(IRS Employer Identification No.) |
| 850 Dixie Highway |
|
| Louisville, |
Kentucky |
40210 |
| (Address of principal executive offices) |
(Zip Code) |
Registrant’s telephone number, including area code (502) 585-1100
Securities registered pursuant to Section 12(b) of the Act:
|
|
|
|
|
|
|
|
|
| Title of each class |
Trading Symbol(s) |
Name of each exchange on which registered |
| Class A Common Stock (voting), $0.15 par value |
BFA |
New York Stock Exchange |
| Class B Common Stock (nonvoting), $0.15 par value |
BFB |
New York Stock Exchange |
| 1.200% Notes due 2026 |
BF26 |
New York Stock Exchange |
| 2.600% Notes due 2028 |
BF28 |
New York Stock Exchange |
Securities registered pursuant to Section 12(g) of the Act: None
Indicate by check mark if the registrant is a well-known seasoned issuer, as defined in Rule 405 of the Securities Act. Yes ☑ No ☐
Indicate by check mark if the registrant is not required to file reports pursuant to Section 13 or Section 15(d) of the Act. Yes ☐ No ☑
Indicate by check mark whether the registrant (1) has filed all reports required to be filed by Section 13 or 15(d) of the Securities Exchange Act of 1934 during the preceding 12 months (or for such shorter period that the registrant was required to file such reports), and (2) has been subject to such filing requirements for the past 90 days. Yes ☑ No ☐
Indicate by check mark whether the registrant has submitted electronically every Interactive Data File required to be submitted pursuant to Rule 405 of Regulation S-T during the preceding 12 months (or for such shorter period that the registrant was required to submit such files). Yes ☑ No ☐
Indicate by check mark whether the registrant is a large accelerated filer, an accelerated filer, a non-accelerated filer, a smaller reporting company, or an emerging growth company. See the definitions of “large accelerated filer,” “accelerated filer,” “smaller reporting company,” and “emerging growth company” in Rule 12b-2 of the Exchange Act.
|
|
|
|
|
|
|
|
|
|
|
|
|
|
|
| Large accelerated filer |
☑ |
|
Accelerated filer |
☐ |
| Non-accelerated filer |
☐ |
|
Smaller reporting company |
☐ |
|
|
|
Emerging growth company |
☐ |
If an emerging growth company, indicate by check mark if the registrant has elected not to use the extended transition period for complying with any new or revised financial accounting standards provided pursuant to Section 13(a) of the Exchange Act. ☐
Indicate by check mark whether the registrant has filed a report on and attestation to its management’s assessment of the effectiveness of its internal control over financial reporting under Section 404(b) of the Sarbanes-Oxley Act by the registered public accounting firm that prepared or issued its audit report. ☑
If securities are registered pursuant to Section 12(b) of the Act, indicate by check mark whether the financial statements of the registrant included in the filing reflect the correction of an error to previously issued financial statements. ☐
Indicate by check mark whether any of those error corrections are restatements that required a recovery analysis of incentive-based compensation received by any of the registrant’s executive officers during the relevant recovery period pursuant to §240.10D-1(b). ☐
Indicate by check mark whether the registrant is a shell company (as defined in Rule 12b-2 of the Act). Yes ☐ No ☑
The aggregate market value, as of the last business day of the most recently completed second fiscal quarter, of the voting and nonvoting equity held by nonaffiliates of the registrant was approximately $19,400,000,000.
The number of shares outstanding for each of the registrant’s classes of Common Stock on June 10, 2024, was:
|
|
|
|
|
|
| Class A Common Stock (voting), $0.15 par value |
169,123,305 |
|
| Class B Common Stock (nonvoting), $0.15 par value |
303,536,661 |
|
DOCUMENTS INCORPORATED BY REFERENCE
Portions of Registrant’s Proxy Statement for use in connection with the Annual Meeting of Stockholders to be held July 25, 2024, are incorporated by reference into Part III of this report.
|
|
|
|
|
|
|
|
|
|
Table of Contents |
|
|
|
Page |
| PART I |
|
| Item 1. |
|
|
| Item 1A. |
|
|
| Item 1B. |
|
|
| Item 1C. |
|
|
| Item 2. |
|
|
| Item 3. |
|
|
| Item 4. |
|
|
| PART II |
|
| Item 5. |
|
|
| Item 6. |
|
|
|
|
|
| Item 7. |
|
|
| Item 7A. |
|
|
| Item 8. |
|
|
| Item 9. |
|
|
| Item 9A. |
|
|
| Item 9B. |
|
|
| Item 9C. |
|
|
| PART III |
|
| Item 10. |
|
|
| Item 11. |
|
|
| Item 12. |
|
|
| Item 13. |
|
|
| Item 14. |
|
|
| PART IV |
|
| Item 15. |
|
|
| Item 16. |
|
|
|
|
|
|
Forward-Looking Statement Information. Certain matters discussed in this report, including the information presented in Part II under “Item 7. Management’s Discussion and Analysis of Financial Condition and Results of Operations,” contain statements, estimates, and projections that are “forward-looking statements” as defined under U.S. federal securities laws. Words such as “aim,” “ambition,” “anticipate,” “aspire,” “believe,” “can,” “continue,” “could,” “envision,” “estimate,” “expect,” “expectation,” “intend,” “may,” “might,” “plan,” “potential,” “project,” “pursue,” “see,” “seek,” “should,” “will,” “would,” and similar words indicate forward-looking statements, which speak only as of the date we make them. Except as required by law, we do not intend to update or revise any forward-looking statements, whether as a result of new information, future events, or otherwise. By their nature, forward-looking statements involve risks, uncertainties, and other factors (many beyond our control) that could cause our actual results to differ materially from our historical experience or from our current expectations or projections. These risks and uncertainties include, but are not limited to, those described in Part I under “Item 1A. Risk Factors” and those described from time to time in our future reports filed with the Securities and Exchange Commission, including:
•Our substantial dependence upon the continued health of the Jack Daniel’s family of brands
•Route-to-consumer changes that affect the timing of our sales, temporarily disrupt the marketing or sale of our products, or result in higher fixed costs
•Disruption of our distribution network or inventory fluctuations in our products by distributors, wholesalers, or retailers
•Changes in consumer preferences, consumption, or purchase patterns – particularly away from larger producers in favor of small distilleries or local producers, or away from brown spirits, our premium products, or spirits generally, and our ability to anticipate or react to them; further legalization of marijuana; bar, restaurant, travel, or other on-premise declines; shifts in demographic or health and wellness trends; or unfavorable consumer reaction to new products, line extensions, package changes, product reformulations, or other product innovation
•Substantial competition from new entrants, consolidations by competitors and retailers, and other competitive activities, such as pricing actions (including price reductions, promotions, discounting, couponing, or free goods), marketing, category expansion, product introductions, or entry or expansion in our geographic markets or distribution networks
•Production facility, aging warehouse, or supply chain disruption
•Imprecision in supply/demand forecasting
•Higher costs, lower quality, or unavailability of energy, water, raw materials, product ingredients, or labor
•Risks associated with acquisitions, dispositions, business partnerships, or investments – such as acquisition integration, termination difficulties or costs, or impairment in recorded value
•Impact of health epidemics and pandemics, and the risk of the resulting negative economic impacts and related governmental actions
•Unfavorable global or regional economic conditions and related economic slowdowns or recessions, low consumer confidence, high unemployment, weak credit or capital markets, budget deficits, burdensome government debt, austerity measures, higher interest rates, higher taxes, political instability, higher inflation, deflation, lower returns on pension assets, or lower discount rates for pension obligations
•Product recalls or other product liability claims, product tampering, contamination, or quality issues
•Negative publicity related to our industry, company, products, brands, marketing, executive leadership, employees, Board of Directors, family stockholders, operations, business performance, or prospects, including labor strikes and work stoppages
•Failure to attract or retain key executive or employee talent
•Risks associated with being a U.S.-based company with a global business, including commercial, political, and financial risks; local labor policies and conditions, including labor strikes and work stoppages; protectionist trade policies, or economic or trade sanctions, including additional retaliatory tariffs on American whiskeys and the effectiveness of our actions to mitigate the negative impact on our margins, sales, and distributors; compliance with local trade practices and other regulations; terrorism, kidnapping, extortion, or other types of violence; and health pandemics
•Failure to comply with anti-corruption laws, trade sanctions and restrictions, or similar laws or regulations
•Fluctuations in foreign currency exchange rates, particularly a stronger U.S. dollar
•Changes in laws, regulatory measures, or governmental policies, especially those affecting production, exportation, importation, marketing and promotion, labeling, pricing, distribution, sale, or consumption of our beverage alcohol products
•Tax rate changes (including excise, corporate, sales or value-added taxes, property taxes, payroll taxes, import and export duties, and tariffs) or changes in related reserves, changes in tax rules or accounting standards, and the unpredictability and suddenness with which they can occur
•Decline in the social acceptability of beverage alcohol in significant markets
•Significant additional labeling or warning requirements or limitations on availability of our beverage alcohol products
•Counterfeiting and inadequate protection of our intellectual property rights
•Significant legal disputes and proceedings, or government investigations
•Cyber breach or failure or corruption of our key information technology systems or those of our suppliers, customers, or direct and indirect business partners, or failure to comply with personal data protection laws
•Our status as a family “controlled company” under New York Stock Exchange rules, and our dual-class share structure
Use of Non-GAAP Financial Information. Certain matters discussed in this report, including the information presented in Part II under “Item 7. Management's Discussion and Analysis of Financial Condition and Results of Operations,” include measures that are not measures of financial performance under U.S. generally accepted accounting principles (GAAP). These non-GAAP measures should not be considered in isolation or as a substitute for any measure derived in accordance with GAAP, and also may be inconsistent with similarly titled measures presented by other companies. In Part II under “Item 7. Management's Discussion and Analysis of Financial Condition and Results of Operations,” we present the reasons we use these measures under the heading “Non-GAAP Financial Measures,” and we reconcile these measures to the most closely comparable GAAP measures under the heading “Results of Operations.”
PART I
Item 1. Business
Overview
Brown-Forman Corporation (the “Company,” “Brown-Forman,” “we,” “us,” or “our” below) was incorporated under the laws of the State of Delaware in 1933, successor to a business founded in 1870 as a partnership and later incorporated under the laws of the Commonwealth of Kentucky in 1901. We primarily manufacture, distill, bottle, import, export, market, and sell a wide variety of beverage alcohol products under recognized brands. We employ approximately 5,700 people (excluding individuals who work on a part-time or temporary basis) on six continents, including approximately 2,600 people in the United States (approximately 13% of whom are represented by a union) and 1,100 people in Louisville, Kentucky, USA, home of our world headquarters. According to International Wine & Spirit Research (IWSR), we are the largest American-owned spirits and wine company with global reach. We are a “controlled company” under New York Stock Exchange rules because the Brown family owns more than 50% of our voting stock.
For a discussion of recent developments, see “Item 7. Management's Discussion and Analysis of Financial Condition and Results of Operations – Executive Summary.”
Brands
Beginning in 1870 with Old Forester Kentucky Straight Bourbon Whisky – our founding brand – and spanning the generations since, we have built a portfolio of more than 40 spirit, ready-to-drink (RTD) cocktail, and wine brands that includes some of the best-known and most loved trademarks in our industry. The most important and iconic brand in our portfolio is Jack Daniel’s Tennessee Whiskey, the #1 selling American whiskey in the world.1 Jack Daniel’s Tennessee Whiskey was recently named the most valuable spirits brand in the world in the 2023 Interbrand “Best Global Brands” rankings, and the newly released Glenglassaugh Sandend was named the “2023 Whisky of the Year” by Whisky Advocate. Our premium bourbons, Woodford Reserve and Old Forester, were once again selected for the Impact “Hot Brands”2 list, marking eleven and six consecutive years on the list, respectively, as were Jack Daniel's RTDs.
|
|
|
|
|
|
|
|
|
Principal Brands |
| Jack Daniel's Tennessee Whiskey |
|
el Jimador Tequilas5 |
Jack Daniel's RTD3 |
|
el Jimador New Mix RTD |
| Jack Daniel's Tennessee Honey |
|
Herradura Tequilas9 |
| Gentleman Jack Rare Tennessee Whiskey |
|
Korbel California Champagnes6 |
Jack Daniel's Tennessee Apple |
|
Korbel California Brandy6 |
| Jack Daniel's Tennessee Fire |
|
Sonoma-Cutrer California Wines7 |
Jack Daniel's Single Barrel Collection4 |
|
Old Forester Whiskey Row Series |
Jack Daniel's Bonded Tennessee Whiskey |
|
Old Forester Kentucky Straight Bourbon Whisky |
| Jack Daniel's Sinatra Select |
|
Old Forester Kentucky Straight Rye Whisky |
| Jack Daniel’s Winter Jack |
|
Finlandia Vodkas8 |
| Jack Daniel's Tennessee Rye |
|
The Glendronach Single Malt Scotch Whiskies9 |
| Jack Daniel's Triple Mash Blended Straight Whiskey |
|
Glenglassaugh Single Malt Scotch Whiskies9 |
| Jack Daniel's Bottled-in-Bond |
|
Benriach Single Malt Scotch Whiskies9 |
| Jack Daniel's American Single Malt |
|
Diplomático Rums9 |
| Jack Daniel’s 12 Year Old |
|
Chambord Liqueur |
| Jack Daniel’s 10 Year Old |
|
Gin Mare9 |
| Woodford Reserve Kentucky Bourbon |
|
Fords Gin |
| Woodford Reserve Double Oaked |
|
Slane Irish Whiskey |
Woodford Reserve Batch Proof |
|
Coopers' Craft Kentucky Bourbon |
| Woodford Reserve Kentucky Rye Whiskey |
|
|
| Woodford Reserve Baccarat Edition |
|
|
|
|
|
|
|
|
|
|
1IWSR 2023 Data. |
2Impact Databank, March 2024. |
3Jack Daniel's RTD includes Jack Daniel's & Cola, Jack Daniel’s & Coca-Cola RTD, Jack Daniel's Country Cocktails, Jack Daniel's Double Jack, and other malt- and spirit-based Jack Daniel’s RTDs. |
4The Jack Daniel's Single Barrel Collection includes Jack Daniel's Single Barrel Select, Jack Daniel's Single Barrel Barrel Proof, Jack Daniel's Single Barrel Rye Barrel Proof, and other Jack Daniel’s Single Barrel special-release expressions. |
5el Jimador Tequilas comprise all full-strength expressions of el Jimador. |
6Korbel is not an owned brand. We sell Korbel products under contract in the United States and other select markets. |
7Sonoma-Cutrer California Wines was divested on April 30, 2024. |
|
8Finlandia Vodka was divested on November 1, 2023. |
|
9Comprises all expressions of this brand. |
See “Item 7. Management's Discussion and Analysis of Financial Condition and Results of Operations – Results of Operations – Fiscal 2024 Brand Highlights” for brand performance details.
Our vision in marketing is to be the best brand-builder in the industry. We build our brands by investing in platforms that we believe create enduring connections with our consumers. These platforms cover a wide spectrum of activities, including media advertising (TV, radio, print, outdoor, digital, and social), consumer and trade promotions, sponsorships, and visitors' center programs at our distilleries. We aim to grow our sales and profits by consistently delivering creative, responsible marketing programs that drive brand recognition, brand trial, brand loyalty, and, ultimately, consumer demand around the world.
Markets
We sell our products in over 170 countries. The United States, our most important market, accounted for 45% of our net sales in fiscal 2024 and the other 55% were outside of the United States. The table below shows the percentage of total reported net sales for our top markets in our three most recent fiscal years:
|
|
|
|
|
|
|
|
|
|
|
|
|
|
Percentage of Total Reported Net Sales by Geographic Area |
|
|
|
Year ended April 30 |
|
|
2022 |
2023 |
2024 |
| United States |
|
|
49 |
% |
47 |
% |
45 |
% |
| Mexico |
|
|
5 |
% |
6 |
% |
7 |
% |
| Germany |
|
|
6 |
% |
6 |
% |
6 |
% |
| Australia |
|
|
6 |
% |
5 |
% |
5 |
% |
| United Kingdom |
|
|
6 |
% |
5 |
% |
4 |
% |
| Other |
|
|
28 |
% |
31 |
% |
32 |
% |
|
|
|
|
|
|
| TOTAL |
|
|
100 |
% |
100 |
% |
100 |
% |
Note: Totals may differ due to rounding
|
|
|
|
|
|
For details about net sales in our top markets, see “Item 7. Management's Discussion and Analysis of Financial Condition and Results of Operations – Results of Operations – Fiscal 2024 Market Highlights.” For details about our reportable segment and for additional geographic information about net sales and long-lived assets, see Note 19 to the Consolidated Financial Statements in “Item 8. Financial Statements and Supplementary Data.” For details on risks related to our global operations, see “Item 1A. Risk Factors.”
Distribution Network and Customers
Our distribution network, or our “route to consumer” (RTC), varies depending on (a) the laws and regulatory framework for trade in beverage alcohol by market, (b) our assessment of a market's long-term attractiveness and competitive dynamics, (c) the relative profitability of distribution options available to us, (d) the structure of the retail and wholesale trade in a market, and (e) our portfolio's development stage in a market. As these factors change, we evaluate our RTC strategy and, from time to time, adapt our model.
In the United States, which generally prohibits spirits and wine manufacturers from selling their products directly to consumers, we sell our brands either to distributors or to state governments (in states that directly control alcohol sales) that then sell to retail customers and consumers.
Outside the United States, we use a variety of RTC models, which can be grouped into three categories: owned distribution, partner, and government-controlled markets. We own and operate distribution companies for Australia, Belgium and Luxembourg, Brazil, Czechia, France, Germany, Japan, Mexico, Poland, Slovakia, South Korea, Spain, Taiwan, Thailand, Türkiye, and the United Kingdom. In these owned-distribution markets, and in a large portion of the Travel Retail channel, we sell our products directly to retailers or wholesalers. In many other markets, we rely on third parties to distribute our brands, generally under fixed-term distribution contracts. In Canada, we sell our products to provincial governments.
We believe that our customer relationships are good and that our exposure to concentrations of credit risk is limited due to the diverse geographic areas covered by our operations and our thorough evaluation of each customer. In fiscal 2024, our two largest customers accounted for approximately 13% and 11% of consolidated net sales, respectively. No other customer accounted for 10% or more of our consolidated net sales in fiscal 2024.
Seasonality
Holiday buying makes the fourth calendar quarter the peak season for our business. Approximately 29%, 27%, and 28% of our reported net sales for fiscal 2022, fiscal 2023, and fiscal 2024, respectively, were in the fourth calendar quarter.
Competition
Trade information indicates that we are one of the largest global suppliers of premium spirits. According to IWSR, for calendar year 2023, the ten largest global spirits companies controlled over 20% of the total spirits volume sold around the world. While we believe that the overall market environment offers considerable growth opportunities for us, our industry is, and will remain, highly competitive. We compete against many global, regional, and local brands in a variety of categories of beverage alcohol, but our brands compete primarily in the industry's premium-and-above price points. Our competitors include major global spirits and wine companies, such as Bacardi Limited, Becle S.A.B. de C.V., Davide Campari-Milano N.V., Diageo PLC, LVMH Moët Hennessy Louis Vuitton SE, Pernod Ricard SA, Rémy Cointreau, and Suntory Global Spirits. In addition, particularly in the United States, we compete with national companies and craft spirit brands, many of which entered the market in the last few years.
Brand recognition, brand provenance, quality of product and packaging, availability, flavor profile, and price affect consumers' choices among competing brands in our industry. Other factors also influence consumers, including advertising, promotions, merchandising at the point of sale, expert or celebrity endorsement, social media and word of mouth, and the timing and relevance of new product introductions. Although some competitors have substantially greater resources than we do, we believe that our competitive position is strong, particularly as it relates to brand awareness, quality, availability, and relevance of new product introductions.
Ingredients and Other Supplies
The principal raw materials used in manufacturing and packaging our distilled spirits, liqueurs, RTD products, and wines1 are shown in the table below.
|
|
|
|
|
|
|
|
|
|
|
|
|
|
|
|
|
|
|
|
|
|
|
|
|
|
|
Principal Raw Materials |
| Distilled Spirits |
|
Liqueurs |
|
RTD Products |
|
Wines1 |
|
Packaging |
| Agave |
|
Flavorings |
|
Carbon dioxide |
|
Grapes |
|
Aluminum cans |
| Barley |
|
Neutral spirits |
|
Flavorings |
|
Wood |
|
Cartons |
| Corn |
|
Sugar |
|
Malt |
|
|
|
Closures |
| Malted barley |
|
Water |
|
Neutral spirits |
|
|
|
Glass bottles |
| Molasses |
|
Whiskey |
|
Sugar |
|
|
|
Labels |
| Rye |
|
Wine |
|
Tequila |
|
|
|
PET2 bottles |
| Sugar |
|
|
|
Water |
|
|
|
|
| Water |
|
|
|
Whiskey |
|
|
|
|
| Wood |
|
|
|
|
|
|
|
|
|
|
|
|
|
|
|
|
1Sonoma-Cutrer California Wines was divested on April 30, 2024. |
|
2Polyethylene terephthalate (PET) is a polymer used in non-glass containers. |
None of these raw materials are in short supply, but shortages could occur in the future. From time to time, our agricultural ingredients (agave, barley, corn, grapes1, malted barley, molasses, rye, sugar, and wood) could be adversely affected by weather and other forces out of our control that might constrain supply or reduce our inventory below desired levels for optimum production.
Whiskeys, certain tequilas, rums, and some other distilled spirits must be aged. Because we must produce these distilled spirits years in advance to meet projected future demand, our inventories of these products may be larger in relation to sales and total assets than in many other businesses.
For details on risks related to the unavailability of raw materials and the inherent uncertainty in forecasting supply and demand, see “Item 1A. Risk Factors.”
Intellectual Property
Our intellectual property includes trademarks, copyrights, proprietary packaging and trade dress, proprietary manufacturing technologies, know-how, and patents. Our intellectual property, especially our trademarks, is essential to our business. We register our trademarks broadly around the world, focusing primarily on where we sell or expect to sell our products. We protect our intellectual property rights vigorously but fairly. We have licensed some of our trademarks to third parties for use with services or on products other than alcoholic beverages, which we believe enhances the awareness and protection of our brands. Depending on the jurisdiction, trademarks are valid as long as they are in use and/or their registrations are properly maintained. We also have various licenses and distribution agreements for the production, sale, and marketing of our products, and for the sale and marketing of products of others. These licenses and distribution agreements have varying terms and durations.
For details on risks related to the protection of our intellectual property, see “Item 1A. Risk Factors.” For details on our most important brands, see “Item 7. Management's Discussion and Analysis of Financial Condition and Results of Operations – Results of Operations – Fiscal 2024 Brand Highlights.”
Regulatory Environment
Federal, state, local, and foreign authorities regulate how we produce, store, transport, distribute, market, and sell our products. Some countries and local jurisdictions prohibit or restrict the marketing or sale of distilled spirits in whole or in part.
In the United States, at the federal level, the Alcohol and Tobacco Tax and Trade Bureau of the U.S. Department of the Treasury regulates the spirits and wine industry with respect to the production, blending, bottling, labeling, advertising, sales, and transportation of beverage alcohol. Similar regulatory regimes exist at the state level and in most non-U.S. jurisdictions where we sell our products. In addition, beverage alcohol products are subject to customs duties, excise taxes, and/or sales taxes in many countries, including taxation at the federal, state, and local level in the United States.
Many countries set their own distilling and maturation requirements. For example, under U.S. federal and state regulations, bourbon and Tennessee whiskeys must be aged in new, charred oak barrels; we typically age our whiskeys at least three years. Mexican authorities regulate the production and bottling of tequilas; they mandate minimum aging periods for extra añejo (three years), añejo (one year), and reposado (two months). Irish whiskey must be matured at least three years in a wood cask, such as oak, on the island of Ireland. Scotch whisky must be matured in oak casks for at least three years in Scotland. We comply with all of the applicable laws and regulations.
Our operations are also subject to various environmental protection statutes and regulations, and our policy is to comply with them. Complying with these statutes and regulations has not materially impacted our capital expenditures, earnings, or competitive position, and is not expected to have a material impact during fiscal 2025.
Integrated Strategy and Performance

For more than 150 years, Brown-Forman and the Brown family have been committed to driving sustainable growth and preserving Brown-Forman as a thriving, family-controlled, independent company. The image on the left illustrates our highest ambition, “Nothing Better in the Market,” surrounded by the values that have guided us for decades: integrity, respect, trust, teamwork, and excellence. In addition to these guiding principles, our success depends on several strategic priorities, as illustrated in the image on the right: the quality of our brands within our portfolio, our geographic reach, the talent and diversity of our people, and the return on our investments. Moreover, taking an integrated approach means that many aspects of our company contribute to this value creation and are fundamental to our strategy, including our commitment to environmental sustainability, alcohol and marketing responsibility, diversity and inclusion, and to building communities in which we live and work. We call these efforts Living a Spirit of Commitment.
Over the past four fiscal years, we faced a challenging, volatile environment, including supply chain disruptions and a global pandemic. Our employees' unique mix of agility, resilience, energy, and collaboration enabled us to succeed despite these challenges. Our values drive our decisions, and our core purpose and our highest ambition continue to guide us as we move forward to a reimagined future with renewed enthusiasm for the opportunities that lie ahead. We believe we are well positioned to navigate the ever-changing landscape. We will make bold moves with a commitment to improve continuously as we work together to deliver sustained long-term growth.
This Integrated Annual Report on Form 10-K for the fiscal year ended April 30, 2024, presents not only our financial performance but also our environmental, social, and governance strategies, commitments, and results. It provides a more holistic view of Brown-Forman, our culture, our strategic approach to our business, and how we achieve results.
Portfolio and Responsibility
We seek to build brands and create stockholder value responsibly by delivering strong, sustainable growth, solid margins, and high returns on invested capital. We focus on building brands that can be meaningful for our company and our legal drinking age consumers (consumers) over the longer term. We aim to grow our premium spirits portfolio both organically and through innovation. Opportunistically and thoughtfully, we also consider acquisitions and partnerships that will enhance our capacity to deliver meaningful growth, improve margins, and increase stockholder returns.
We strive to grow our brands and enhance consumers' experience with them. Even as we do so, we remain committed to marketing our brands responsibly and promoting responsible drinking. Regulation of our industry is not new, and external interest from the World Health Organization and other health bodies has grown over time. We uphold high standards of self-regulation by adhering to industry guidelines on responsible marketing and advertising. We promote alcohol responsibility both independently and with industry organizations such as the International Alliance for Responsible Drinking, the Foundation for Advancing Alcohol Responsibility (responsibility.org) in the United States, the Portman Group in the United Kingdom, DrinkWise in Australia, and FISAC in Mexico.
The Jack Daniel's family of brands, led by Jack Daniel's Tennessee Whiskey (JDTW), is our most valuable asset – the engine of our overall financial performance and the foundation of our leadership position in the American whiskey category.1 We strive to strengthen the brand's leadership position continually, and will work steadfastly to keep JDTW relevant to consumers worldwide. We will also pursue opportunities to grow the Jack Daniel's family of brands across markets, premium-and-above price points, channels, and consumer groups. Product innovation continues to contribute meaningfully to our performance. Different Jack Daniel's expressions have brought new consumers to the franchise, including Jack Daniel's Tennessee Honey (2011), Jack Daniel's Tennessee Fire (2015), Jack Daniel's Tennessee Apple (2019), Jack Daniel's Bonded Tennessee Whiskey and Triple Mash Blended Straight Whiskey (2022), and our most recent launches, Jack Daniel’s Bonded Tennessee Rye Whiskey and Jack Daniel’s American Single Malt (2023), which individually and collectively add great value to the company and to our consumers the world over.
In addition to the leadership of our Jack Daniel's family of brands, we expect strong worldwide growth from our other whiskey brands, particularly Woodford Reserve and Old Forester. Woodford Reserve is the leading super-premium American whiskey globally,1 growing volumes at a strong double-digit compound annual growth rate since the brand was introduced over 25 years ago. Woodford Reserve sold over 1.7 million nine-liter cases for the fiscal year ended April 30, 2024. We believe the brand is poised for continued growth as the bourbon category continues to grow around the world. Old Forester has continued its return to prominence in the United States and in select international markets. Innovation has played an important role in the premiumization of both of these brands, including the success of high-end expressions such as Woodford Reserve Double Oaked and the Old Forester Whiskey Row Series.
Outside of our American whiskey brands, we believe our portfolio remains well positioned in other high-growth categories, with meaningful premium brands and a focus on accelerating our super-premium portfolio. Our tequila portfolio is led by two brands steeped in Mexican heritage, Herradura and el Jimador. Despite the cyclical cost pressures of agave, we remain committed to the growth of our tequila business in the United States and the long-term growth prospects of this business globally. We believe that our Scotch whiskies The Glendronach, Benriach, and Glenglassaugh, and our Irish whiskey, Slane, are well-positioned in their respective categories. We expect them all to contribute meaningfully over the longer term. In addition, the acquisitions of Gin Mare (2022) and Diplomático (2023) provide us with leadership positions in the super-premium-and-above gin and rum categories, respectively, and we look to grow these brands globally.
Our RTD portfolio continues to evolve globally. In June 2022, we jointly announced a global relationship with The Coca-Cola Company to introduce the iconic Jack & Coke cocktail as a branded, ready-to-drink, pre-mixed cocktail. Since the announcement, we have launched the product in over 25 markets, including the top RTD markets such as the United States, Japan, the United Kingdom, Mexico, and Germany. Jack Daniel's Country Cocktails in the United States are produced, sold, and distributed under our relationship with the Pabst Brewing Company.
We appreciate the power of our brands to enrich the experience of life, and we believe it is our duty to ensure that our products are marketed with deep respect for our consumers. Our mission for alcohol responsibility is to empower mindful choices around beverage alcohol. We launched the Pause campaign in 2019. Pause is Brown-Forman’s driving effort to encourage mindful choices. In 2022, we launched our 2030 Alcohol Responsibility strategy to prioritize strategic programs and partnerships, in-market tools and resources, and to continue empowering our employees and business partners. We execute our 2030 Alcohol Responsibility strategy through the lens of our Pause campaign to showcase the importance of alcohol responsibility and inspire action among our consumers, colleagues, and business partners.
Geography
The United States remains our largest market, and growth there is important to our long-term success. We expect to foster this growth by emphasizing fast-growing spirits categories, continuing product and packaging innovation, and building brands within growing consumer segments. This includes increasing emphasis on inclusive, digital, and integrated marketing and the growth of our e-commerce capabilities to better connect and engage with consumers where they are.
Outside the United States, our improved routes to consumers continue to increase our competitiveness. In fiscal 2024, we established our owned-distribution organizations in Japan and Slovakia; and announced plans to distribute our own brands in Italy, effective May 1, 2025. More direct connection with customers and consumers enabled through owned distribution is an important part of our strategic growth.
1 IWSR 2023 Data
People, Diversity & Inclusion, and Ethics & Compliance
As we work to increase our brands' relevance and appeal to diverse consumer groups around the world, we believe a diversity of experiences, perspectives, and mindsets within our own workforce is essential. Our vision is to create an environment where leveraging diversity and fostering inclusion occurs naturally, giving us a sustainable marketplace advantage. By 2030, we aspire to have 50% women in professional- and leader-level roles globally, 40% women in senior leadership positions globally, 25% people of color in our United States workforce, and 6% self-identified LGBTQ+ employees in our United States workforce. Also by 2030, we aspire for 16% of our supplier spend to be with businesses that are woman- or minority-owned in locations such as the United States, the United Kingdom, and Australia. For more than a decade, we have earned a perfect score in the Corporate Equality Index, a national benchmarking survey and report on corporate policies and practices related to LGBTQ+ workplace equality administered by the Human Rights Campaign Foundation. We also extended our diversity and inclusion commitment more deeply in our communities, especially our hometown of Louisville, Kentucky.
One of the main drivers of our inclusive culture is the continued growth and leadership of our ten Employee Resource Groups (ERGs). We believe ERGs are instrumental in enriching our company's culture and our employees experience by:
•supporting development and engagement of our diverse workforce;
•driving cultural awareness and competency across the organization;
•enabling authentic engagement with our consumers; and
•creating spaces for our employees and their allies to connect with, support, and advocate for one another.
Our core values of integrity, respect, trust, teamwork, and excellence form the foundation of our ethics and compliance program. “Values Drive Decisions” is the key theme of this program, and we use it to teach our employees to rely on our values when faced with a difficult decision and to “speak up” if they believe they, a colleague, or a business partner may have violated the law, our Code of Conduct, or company policy. In 46 countries, we offer a third-party service to employees and others who choose to “speak up” anonymously. As we train our managers, we reinforce our commitment to non-retaliation and maintaining a “speak up” culture.
We convey our compliance expectations to employees via our Code of Conduct, and our employees certify annually that they will comply with it and report potential violations. The Code of Conduct details expectations for 20 different risks; links to Q&A, policies, and training; and gives contact details for subject-matter experts. We refresh our Code of Conduct and certification annually and make them available in 12 languages.
Investment and Sustainability
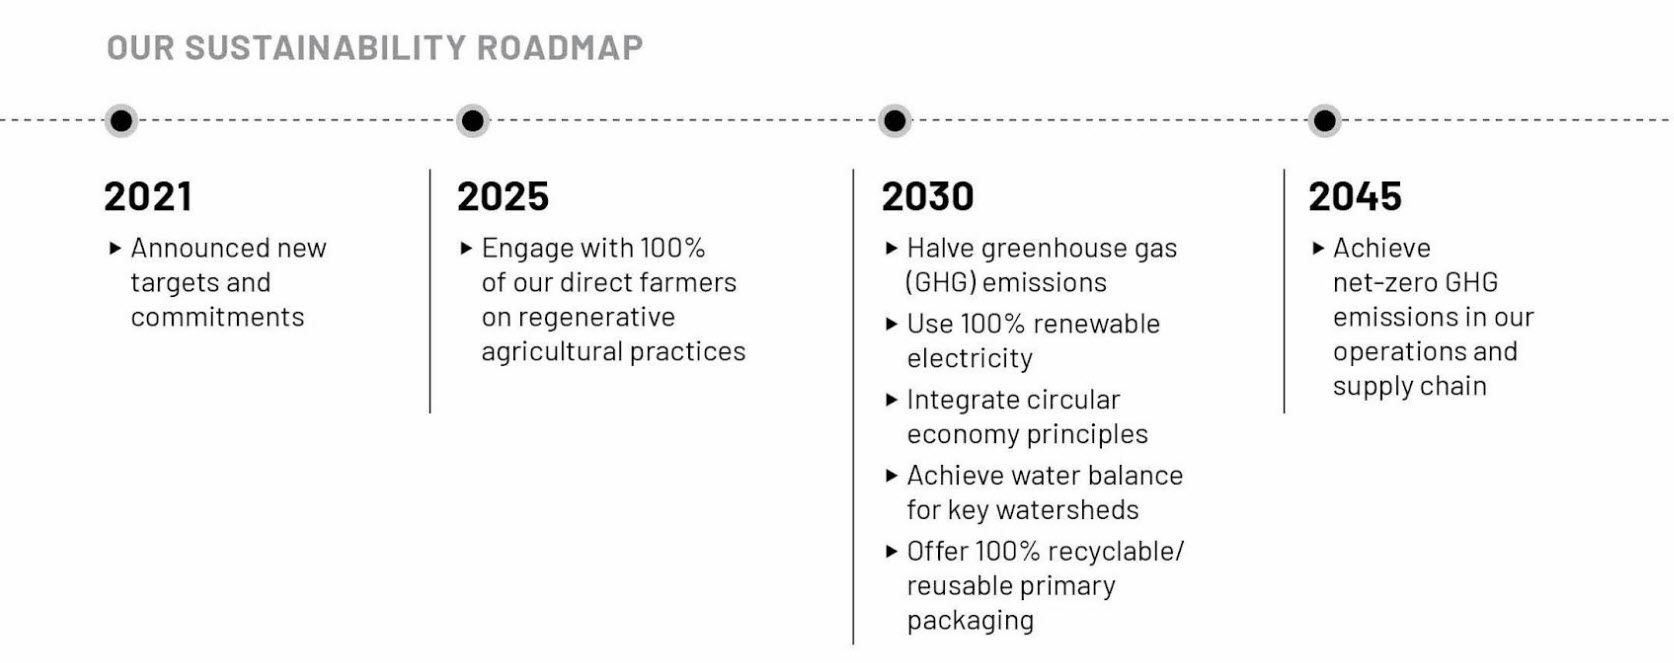
For over a century and a half, we have learned that long-term success requires investment and a mindset of sustainability. We understand the need to invest in our brands, global supply chain facilities, homeplace and visitor centers, and aging inventory. For example, in May 2023, we announced a $200 million capital investment to expand our Casa Herradura tequila distillery to meet anticipated consumer demand. Additionally, during fiscal 2022, we announced a £30 million expansion of our The Glendronach distillery to meet strong demand. We also understand the importance of investing in our people, communities, and the environment. We recognize that climate change is a business issue with risks and opportunities. As such, we are committed to actions that will ensure the long-term health of the planet and our business. In fiscal 2021, we established a new 2030 Sustainability Strategy to align our efforts with industry best practices and the most current climate science. Our goals broaden our focus beyond business operations to include our supply chain, where the majority of our environmental footprint resides. With this evolving strategy, we have a roadmap for continued progress over the next quarter-century.
Our continued investments in renewable energy and resource stewardship underscore our long-term focus:
•Renewable Electricity: In fiscal 2024, we installed a rooftop solar system at our Newbridge bottling plant in Edinburgh, Scotland, in partnership with YLEM Energy, and our Slane Distillery signed a Corporate Power Purchase Agreement with Flogas Enterprise for renewable electricity from a wind farm in Ireland.
•Byproducts to Energy: In fiscal 2024, construction continued on the anaerobic digester at the Jack Daniel Distillery that will convert a portion of the distillery byproducts to renewable energy and fertilizer. The project is expected to become operational in fiscal 2025.
•Water Stewardship: In fiscal 2024, we continued our work with Waterplan to improve the measurement of water- related risk at eight of our facilities and to identify opportunities for water efficiency improvements and water reuse at our Casa Herradura facility. We will expand this collaboration in fiscal 2025 to begin measuring water risk in our supply chain and further enhance our water stewardship program.
•Sustainable Agriculture: In June 2023, our Woodford Reserve Distillery announced a five-year commitment to purchase the rye grown by Kentucky farmers as part of the Rye in Kentucky research being led by the University of Kentucky. In fiscal 2024, we met our target to engage with 100% of our direct farmers on regenerative agriculture practices, and will continue engaging with direct farmers in fiscal 2025.
•Sustainable Forestry: In June 2023, the Jack Daniel Seed Orchard and our continued relationship with the University of Tennessee celebrated its 25th anniversary. In December 2023, the Tennessee Forestry Association, supported by Jack Daniel’s, announced that it received a grant from the National Fish and Wildlife Federation to engage with family forest landowners on sustainable management practices to improve Tennessee’s shortleaf pine and white oak forests.
Community
We believe we are a responsible and caring corporate citizen and invest in the communities where employees live and work. We encourage employees to participate in philanthropic outreach efforts by giving their time and talents to support those non-profit organizations most meaningful to them. This civic engagement, as well as our philanthropic contributions, further promotes Brown-Forman’s caring culture and commitment to the community.
We continue to expand our civic engagement in Brown-Forman global office locations, allowing those employees closest to the needs of their communities to decide how to invest their charitable-giving resources. We leverage our key community relations partners to stay informed of collaborative opportunities where we work and live and to shape our charitable-giving strategy to meet the essential needs of the communities that sustain us. We created the Brown-Forman Foundation (the Foundation) in fiscal year 2018 to help fund our ongoing philanthropic endeavors, with an emphasis on the communities surrounding Brown-Forman’s headquarters in Louisville, KY. The Foundation's resources provide a consistent source of support for charitable giving independent of our annual earnings. We work to partner with organizations that support our key focus areas: empowering responsible and sustainable living, ensuring essential living standards, and enhancing arts and cultural living. As part of our commitment to be better and do better as neighbors and as corporate citizens, the Brown-Forman Foundation made a 10-year, $50 million commitment to five organizations in west Louisville in fiscal year 2022, which is the largest investment in its history.
Our partner organizations include AMPED, the Louisville Central Community Center, the Louisville Urban League, Simmons College of Kentucky, and the West End School. Together, these organizations will advance educational opportunities from early childhood through adult learning.
We believe that having a long-term-focused, committed, and engaged stockholder base, anchored by the Brown family, gives us a distinct strategic advantage, particularly in a business with multi-generational brands and products that must be aged. We are committed to continually improving our environmental, social, and governance performance and acting upon our deeply held values. Recognizing the strong cash-generating capacity and the capital efficiency of our business, we will continue to pursue top-tier stockholder return through stockholder-friendly capital allocation and socially and environmentally conscious investments to fuel long-term growth.
Human Capital Resources
Overview
We put our values at the forefront of all our decisions and actions in an effort to make our employees feel respected, safe, and supported so they can make, market, and sell our products with the finest craftsmanship, quality, and care. What enables our success are the approximately 5,700 people (excluding individuals that work on a part-time or temporary basis) we employ in over 45 countries around the world. This includes approximately 3,600 salaried employees and 2,100 hourly employees, with the largest percentage of our employees residing within the United States, Mexico, and the United Kingdom. We believe our employee relations are good and our turnover rate is low.
Total Rewards
We strive to pay our employees fairly and competitively. Each fiscal year, we review the compensation for all salaried roles both internally and externally, ensuring that every employee is paid fairly compared to each other and competitively against the market. All roles are priced based on compensation survey data for the market where the employee resides. We will continue to refresh our data and monitor pay equity annually.
Talent Development
We continually seek opportunities to develop our employees to ensure that we have the capabilities to grow our business. We do this through a combination of succession planning, planned learning, short-term assignments, international opportunities, and thoughtful talent management. Given our low turnover, we are intentional about moving employees through new roles, ensuring that they have the opportunity to learn new skills. We track all internal movement and are comfortable that we are providing an appropriate level of growth and development for our employees.
Diversity & Inclusion
We are continuing to pursue our 2030 Diversity & Inclusion ambitions, as outlined in our Many Spirits, One Brown-Forman strategy. We remain focused on ensuring our workforce mirrors the consumers and communities we serve. We regularly monitor our progress with women in senior leadership globally, and people of color and LGBTQ+ salaried employees in the United States. We track promotion and lateral movement by gender (globally) and ethnicity (in the United States) and, based on that data, we can confirm that our growth opportunities for women and people of color are proportional to our salaried employee population.
To support our culture of inclusion, we have continued to build awareness of the foundations of inclusive leadership and inclusive behaviors. We also have ten ERGs that help foster an inclusive environment across the organization.
Workforce Stability
We have historically enjoyed low turnover among our salaried population and continue to track our departures, given the acceleration in the job market in recent years. We analyze our quantitative and qualitative attrition data each quarter, and our voluntary turnover among salaried employees remains consistent with our historical levels. We will continue to monitor our data carefully.
Executive Officers
Information about Our Executive Officers
The following persons served as executive officers as of June 14, 2024:
|
|
|
|
|
|
|
|
|
| Name |
Age |
Principal Occupation and Business Experience |
| Lawson E. Whiting |
55 |
President and Chief Executive Officer since January 2019. Executive Vice President and Chief Operating Officer from October 2017 to December 2018. Executive Vice President and Chief Brands and Strategy Officer from February 2015 to September 2017. Senior Vice President and Chief Brands Officer from January 2013 to January 2015. |
| Matias Bentel |
49 |
Executive Vice President and Chief Brands Officer since March 2023. Senior Vice President and Chief Brands Officer from January 2020 to March 2023. Senior Vice President and Managing Director of Jack Daniel’s Family of Brands from August 2018 to January 2020. Vice President and General Manager of Mexico from January 2016 to August 2018. Vice President Latin America Marketing and Chief of Staff from October 2009 to January 2016. |
|
Michael E. Carr, Jr.
|
44 |
Executive Vice President, General Counsel and Secretary since May 2024. Vice President, Associate General Counsel - Regional and Corporate Development from October 2022 to April 2024. Vice President, Associate General Counsel - Europe from May 2018 to October 2022. Vice President, Managing Attorney and Assistant Corporate Secretary from September 2013 to May 2018. |
| Leanne D. Cunningham |
54 |
Executive Vice President and Chief Financial Officer since March 2023. Senior Vice President and Chief Financial Officer from July 2021 to March 2023. Senior Vice President, Shareholder Relations Officer, Global Commercial Finance, and Financial Planning and Analysis from August 2020 to July 2021. Senior Vice President, Shareholder Relations Officer from August 2019 to July 2020. Senior Vice President, and General Manager - Brown-Forman Brands from May 2015 to July 2019. Vice President, Director of Finance Global Production from October 2013 to April 2015. |
| Marshall B. Farrer |
53 |
Executive Vice President, Chief Strategic Growth Officer since March 2024. Executive Vice President, Chief Strategic Growth Officer and President Europe from January 2023 to March 2024. Senior Vice President, President Europe from August 2020 to January 2023. Senior Vice President, Managing Director, Global Travel Retail and Developed APAC Region from August 2018 to July 2020. Senior Vice President, Managing Director, Global Travel Retail from May 2015 to July 2018. Vice President, Managing Director, Jack Daniel’s Tennessee Honey from January 2014 to April 2015.
|
| Kirsten M. Hawley |
54 |
Executive Vice President, Chief People, Places, and Communications Officer since March 2023. Senior Vice President, Chief People, Places, and Communications Officer from May 2021 to March 2023. Senior Vice President, Chief Human Resources and Corporate Communications Officer from March 2019 to April 2021. Senior Vice President and Chief Human Resources Officer from February 2015 to February 2019. Senior Vice President and Director of Human Resources Business Partnerships from August 2013 to January 2015. |
| Thomas W. Hinrichs |
62 |
Executive Vice President, President Emerging International since March 2023. Senior Vice President, President Emerging International from August 2020 to March 2023. Senior Vice President, President, International Division from June 2018 to July 2020. Senior Vice President and President for Europe, North Asia, and ANZSEA from February 2015 to June 2018. Senior Vice President and Managing Director for Europe from January 2013 to January 2015. |
| Timothy M. Nall |
53 |
Executive Vice President, Chief Global Supply Chain and Technology Officer since March 2023. Senior Vice President, Chief Global Supply Chain and Technology Officer from March 2022 to March 2023. Senior Vice President, Chief Information and Advanced Analytics Officer from January 2015 to February 2022. Vice President Director Technical Services from May 2013 to December 2014. |
|
Yiannis Pafilis
|
53 |
Executive Vice President and President, Europe since March 2024. Senior Vice President, Managing Director of Germany, Czechia, Poland and Europe Commercial Strategy from September 2023 to February 2024. Vice President, Managing Director of Germany, Czechia, Poland and Europe Strategy from October 2022 to August 2023. Vice President, Managing Director of Germany, Czechia and Europe Commercial Strategy from August 2020 to September 2022. Vice President, General Manager of Germany and Czechia from September 2017 to July 2020. General Manager of Russia from July 2014 to August 2017. |
| Crystal L. Peterson |
53 |
Executive Vice President, Chief Inclusion and Global Community Relations Officer since March 2023. Senior Vice President, Chief Inclusion and Global Community Relations Officer from June 2022 to March 2023. Vice President and Chief Diversity Officer from February 2022 to June 2022. Vice President and Human Resources Director - Global Production, Diversity and Inclusion from March 2021 to January 2022. Vice President and Human Resources Director - Global Production from August 2017 to February 2021. Vice President and Human Resources Director - North America Region from May 2015 to July 2017. Human Resources Director - North America Region and Latin America Region from May 2013 to April 2015. |
|
|
|
|
|
|
|
|
|
| Name |
Age |
Principal Occupation and Business Experience |
| Jeremy J. Shepherd |
49 |
Executive Vice President, President USA & Canada since March 2023. Senior Vice President, President USA & Canada from July 2022 to March 2023. Vice President, General Manager for the United Kingdom & Ireland from January 2018 to July 2022. Vice President Director Midwest Division from May 2015 to December 2017. Portfolio Integration Director from September 2014 to May 2015. |
| Kelli N. Brown |
54 |
Senior Vice President and Chief Accounting Officer since August 2018. Vice President and Director Finance (North America Region) from May 2015 to August 2018. Director NAR Division Finance (North America Region) from November 2013 to April 2015. |
|
|
|
Available Information
Our website address is www.brown-forman.com. Our annual reports on Form 10-K, quarterly reports on Form 10-Q, current reports on Form 8-K, and any amendments to these reports are available free of charge on our website as soon as reasonably practicable after we electronically file those reports with the Securities and Exchange Commission (SEC). The information provided on our website, and any other website referenced herein, is not part of this report, and is therefore not incorporated by reference into this report or any other filing we make with the SEC, unless that information is otherwise specifically incorporated by reference.
On our website, we have posted our Code of Conduct that applies to all our directors and employees, and our Code of Ethics that applies specifically to our senior financial officers. If we amend or waive any of the provisions of our Code of Conduct or our Code of Ethics applicable to our principal executive officer, principal financial officer, or principal accounting officer that relates to any element of the definition of “code of ethics” enumerated in Item 406(b) of Regulation S-K under the Securities Exchange Act of 1934 Act, as amended, we intend to disclose these actions on our website. We have also posted on our website our Corporate Governance Guidelines and the charters of our Audit Committee, Compensation Committee, Corporate Governance and Nominating Committee, and Executive Committee of our Board of Directors. Copies of these materials are available free of charge by writing to our Secretary at 850 Dixie Highway, Louisville, Kentucky 40210 or emailing Secretary@b-f.com.
Item 1A. Risk Factors
We believe the following discussion identifies the material risks and uncertainties that could adversely affect our business. If any of the following risks were actually to occur, our business, results of operations, cash flows, or financial condition could be materially and adversely affected. Additional risks not currently known to us, or that we currently deem to be immaterial, could also materially and adversely affect our business, results of operations, cash flows, or financial condition.
Risks Related to Our Business and Operations
Our business performance depends substantially on the continued health of the Jack Daniel's family of brands.
The Jack Daniel's family of brands is the primary driver of our revenue and Jack Daniel's is an iconic global trademark with a loyal consumer fan base. We invest much effort and many resources to protect and preserve the brand's reputation for authenticity, craftsmanship, and quality. A brand's reputational value is based in large part on consumer perceptions, and even an isolated incident that causes harm – particularly one resulting in widespread negative publicity – could adversely influence these perceptions and erode consumer trust and confidence in the brand. Significant damage to the brand equity of the Jack Daniel's family of brands would adversely affect our business. Given the importance of Jack Daniel's to our overall success, a significant or sustained decline in volume or selling price of our Jack Daniel's products, as a result of negative publicity or otherwise, would have a negative effect on our financial results. Additionally, if we are not successful in our efforts to maintain or increase the relevance of the Jack Daniel's brand to current and future consumers, our business and operating results could suffer. For details on the importance of the Jack Daniel's family of brands to our business, see “Item 7. Management's Discussion and Analysis of Financial Condition and Results of Operations - Results of Operations - Fiscal 2024 Brand Highlights.”
Changes to our route-to-consumer models and consolidation among beverage alcohol producers, distributors, wholesalers, suppliers, and retailers, could hinder the marketing, sale, or distribution of our products.
We use various business models to market and distribute our products in different countries around the world. In the United States, we sell our products either to distributors for resale to retail outlets or e-commerce retailers or, in those states that control alcohol sales, to state governments who then sell them to retail customers and consumers. In our non-U.S. markets, we use a variety of route-to-consumer models – including, in many markets, reliance on third parties to distribute, market, and sell our products. We own and operate distribution companies for 16 international markets. Transitioning from a third-party distribution model to an owned-distribution model involves a significant undertaking, and subjects us to risks associated with that geographic region.
If we are unsuccessful in our route-to-consumer strategies, including any transition to owned distribution, the sale and marketing of our products could be disrupted.
Changes to any of our route-to-consumer models or distribution partners in important markets could result in temporary or longer-term sales disruption, higher costs, and harm to other business relationships we might have with that partner. Disruption of our distribution network or fluctuations in our product inventory levels at distributors, wholesalers, or retailers could negatively affect our results for a particular period. Moreover, other suppliers, as well as wholesalers and retailers of our brands, offer products that compete directly with ours for shelf space, promotional displays, and consumer purchases. Pricing (including price promotions, discounting, couponing, and free goods), marketing, new product introductions, entry into our distribution networks, and other competitive behavior by other suppliers, and by wholesalers and traditional and e-commerce retailers, could adversely affect our growth, business, and financial results. While we seek to take advantage of the efficiencies and opportunities that large retail customers can offer, they often seek lower pricing and increased purchase volume flexibility, offer competing private label products, and represent a large number of other competing products. If the buying power of these large retail customers continues to increase, it could negatively affect our financial results. Further, while we believe we have sufficient scale to succeed relative to our major competitors, we nevertheless face a risk that continuing consolidation of large beverage alcohol companies could put us at a competitive disadvantage.
Consolidation, whether domestically or internationally, among spirits producers, distributors, wholesalers, suppliers, or retailers and the increased growth of the e-commerce environment across the consumer product goods market has created and could continue to create a more challenging competitive landscape for our products. Consolidation at any level could hinder the distribution and sale of our products as a result of reduced attention and resources allocated to our brands both during and after transition periods, because our brands might represent a smaller portion of the new business portfolio. Furthermore, consolidation of distributors may lead to the erosion of margins. Changes in distributors' strategies, including a reduction in the number of brands they carry, the allocation of shelf space for our competitors' brands, or private label products, may adversely affect our growth, business, financial results, and market share. Our competitors may respond to industry and economic conditions and shifts in consumer behaviors more rapidly or effectively than we do. To remain competitive, we must be agile and efficient in adopting digital technologies and building analytical capabilities, which our competitors may be able to achieve with more agility and resources.
Changes in consumer preferences and purchases, any decline in the social acceptability of our products, or governmental adoption of policies disadvantageous to beverage alcohol could negatively affect our business results.
We are a branded consumer products company in a highly competitive market, and our success depends substantially on our continued ability to offer consumers appealing, high-quality products. Consumer preferences and purchases may shift, often in unpredictable ways, as a result of a variety of factors, including health and wellness trends; changes in economic conditions, demographic, and social trends; public health policies and initiatives; changes in government regulation of beverage alcohol products; concerns or regulations related to product safety; legalization of cannabis and its use on a more widespread basis in the markets where we operate; and changes in trends related to travel, leisure, dining, gifting, entertaining, and beverage consumption. As a result, consumers may begin to shift their consumption and purchases from our premium and super-premium products, or away from alcoholic beverages entirely. This shift includes consumption at home as a result of various factors, including shifts in social trends, and shifts in the channels for the purchases of our products. These shifts in consumption and purchasing channels could adversely impact our profitability. Consumers also may begin to prefer the products of competitors or may generally reduce their demand for brands produced by larger companies. Over the past several decades, the number of small, local distilleries in the United States has grown significantly. This growth is being driven by a trend of consumers showing increasing interest in locally produced, regionally sourced products. As more brands enter the market, increased competition could negatively affect demand for our premium and super-premium American whiskey brands, including Jack Daniel’s. In addition, we could experience unfavorable business results if we fail to attract consumers from diverse backgrounds and ethnicities in all markets where we sell our products.
Expansion into new product categories by other suppliers, or innovation by new entrants into the market, could increase competition in our product categories. For example, we have observed an increase in diversification by various consumer goods companies such as the entrance of both traditional beer and soft drink companies into the ready-to-drink market and the entrance of both beer and spirits companies into the cannabis market – expanding the potential for competition in the spirits market from various sectors of the consumer goods industry. Increased competition may, among other things, negatively impact our ability to maintain or gain market share; increase pricing pressure, which inhibits our ability to adequately respond to inflationary changes in commodities used in making our products; require increases in marketing and promotional activities; and negatively impact the market for our premium and super-premium products. To continue to succeed, we must anticipate or react effectively to shifts in demographics, our competition, consumer behavior, consumer preferences, drinking tastes, and drinking occasions.
Our long-term plans call for the continued growth of the Jack Daniel's family of brands. If these plans do not succeed, or if we otherwise fail to develop or implement effective business, portfolio, and brand strategies, our growth, business, or financial results could suffer. More broadly, if consumers shift away from spirits (particularly brown spirits such as American whiskey and bourbon), our premium-priced brands, or our ready-to-drink products, our financial results could be adversely affected.
We believe that new products, line extensions, label and bottle changes, product reformulations, and similar product innovations by both our competitors and us will increase competition in our industry. Product innovation, particularly for our core brands, is a significant element of our growth strategy; however, there can be no assurance that we will continue to develop and implement successful line extensions, packaging, formulation or flavor changes, or new products.
Unsuccessful implementation or short-lived popularity of our product innovations could result in inventory write-offs and other costs, could reduce profits from one year to the next, and could also damage consumers' perception of our brands. Our inability to attract consumers to our product innovations relative to our competitors' products – especially over time – could negatively affect our growth, business, and financial results.
Production facility disruption could adversely affect our business.
Some of our largest brands, including Jack Daniel's and our tequilas, are distilled at single locations. A catastrophic event causing physical damage, disruption, or failure at any one of our major distillation or bottling facilities, including facilities that support the production of our premium brands such as Woodford Reserve and Old Forester, could adversely affect our business. Further, because whiskeys, rums, and some tequilas are aged for various periods, we maintain a substantial inventory of aged and maturing products in warehouses at a number of different sites. The loss of a substantial amount of aged inventory – through fire, other natural or man-made disaster, contamination, or otherwise – could significantly reduce the supply of the affected product or products. These and other supply (or supply chain) disruptions could prevent us from meeting consumer demand for the affected products in the short and medium term. In addition to catastrophic events identified above, supply disruptions could include the temporary inability to make our products at normal levels or at all. We could also experience disruptions if our suppliers are unable to deliver supplies. Our business continuity plans may not prevent business disruption, and reconstruction of any damaged facilities could require a significant amount of time and resources.
The inherent uncertainty in supply/demand forecasting could adversely affect our business, particularly with respect to our aged products.
There is an inherent risk of forecasting imprecision in determining the quantity of aged and maturing products to produce and hold in inventory in a given year for future sale. The forecasting strategies we use to balance product supply with fluctuations in consumer demand may not be effective for particular years or products. For example, in addition to our American and Irish whiskeys, rums, and some tequilas, which are aged for various periods, our Scotch whisky brands require long-term maturation – an average of 12 years with limited releases of 30 years or more – making forecasts of demand for such products in future periods subject to significant uncertainty. Our tequila supply also depends on the growth cycle of agave plants, which take approximately six to seven years to reach full maturity, requiring us to make forecasts of demand for our tequilas over a long-time horizon to determine in advance how much agave to plant or otherwise source. Factors that affect our ability to forecast accurately include changes in business strategy, market demand, consumer preferences, macroeconomic conditions, introductions of competing products, and other changes in market conditions. Additionally, our supply of aged products can deviate from expectations due to changes in forecasted maturation loss. Such forecasting errors could lead to our inability to meet the objectives of our business strategy, failure to meet future demand, or a future surplus of inventory and consequent write-down in value of such inventory. A failure to accurately forecast demand for our products or efficiently manage inventory could have a material adverse effect on our business and financial results. Further, we cannot be certain that we will be successful in using various levers, such as pricing changes, to create the desired balance of available supply and consumer demand for particular years or products. As a consequence, we may be unable to meet consumer demand for the affected products for a period of time. Furthermore, not having our products in the market consistently may adversely affect our brand equity and future sales.
Higher costs or unavailability of water, raw materials, product ingredients, or labor could adversely affect our financial results.
Our products use materials and ingredients that we purchase from suppliers. Our ability to make and sell our products depends on the availability of the raw materials, product ingredients, finished products, wood, glass and PET bottles, cans, bottle closures, packaging, and other materials used to produce and package them. Without sufficient quantities of one or more key materials, our business and financial results could suffer. For instance, only a few glass producers make bottles on a scale sufficient for our requirements, and a single producer supplies most of our glass requirements. During the recent global supply chain challenges, our primary glass provider could not produce sufficient quantities to meet our needs, which increased our cost to produce, constrained supply of some of our products, and adversely affected our financial results.
In response to these events, we took action to diversify suppliers of our raw materials, including glass. Our glass supply, as well as global supply chains, have stabilized. However, similar supply chain challenges may occur in the future, making it difficult and more expensive to produce and deliver our products. For example, a disruption in the supply of American white oak logs, staves, heading, or steel it could constrain our ability to produce or procure the new charred oak barrels in which we age our whiskeys. If any of our key suppliers were no longer able to meet our timing, quality, or capacity requirements, ceased doing business with us, or significantly raised prices, and we could not promptly develop alternative cost-effective sources of supply or production, our operations and financial results could suffer.
Higher costs or insufficient availability of suitable grain, agave, water, molasses, wood, glass, closures, and other input materials, or higher associated labor costs or insufficient availability of labor, may adversely affect our financial results. Similarly, when energy costs rise, our transportation, freight, and other operating costs, such as distilling and bottling expenses, also may increase. Our freight cost and the timely delivery of our products could be adversely affected by a number of factors, including driver or equipment shortages, higher fuel costs, weather conditions, traffic congestion, ocean freight lane disruptions, shipment container availability, rail shutdowns, increased government regulation, and other matters that could reduce the profitability of our operations. Our financial results may be adversely affected if we cannot pass along energy, freight, or other input cost increases through higher prices to our customers without reducing demand or sales. For example, during the COVID-19 pandemic and subsequent economic recovery, we experienced supply chain disruptions in connection with the availability of timely modes of transportation to ship our products globally, which resulted in higher costs and delays in supplying some of our products.
International or domestic geopolitical or other events, including the imposition of any tariffs or quotas by governmental authorities on any raw materials that we use in the production of our products, could adversely affect the supply and cost of these raw materials to us. While we do not currently expect our production operations to be directly impacted by conflicts around the world, changes in global grain and commodity pricing and availability may impact the markets where we operate. If we cannot offset higher raw material costs with higher selling prices, increased sales volume, or reductions in other costs, our profitability could be adversely affected.
Weather, acute or chronic climate change impacts, fires, diseases, and other agricultural uncertainties that affect the health, yield, quality, or price of the various raw materials used in our products also present risks for our business, including in some cases potential impairment in the recorded value of our inventory. Increasing average temperatures could also affect the maturation and yield of our aged inventory over time. Changes in weather patterns or intensity can disrupt our supply chain as well, which may affect production operations, insurance costs and coverage, and the timely delivery of our products.
Water is an essential component of our products, so the quality and quantity of available water is critical to our ability to operate our business. If extended droughts become more common or severe, or if our water supply is interrupted for other reasons, high-quality water could become scarce in some key production regions for our products,which in turn could adversely affect our business and financial results.
We might not succeed in our strategies for investments, acquisitions, dispositions, and other strategic transactions.
From time to time, we acquire or invest in additional brands or businesses. We expect to continue to seek acquisition and investment opportunities that we believe will increase long-term stockholder value, but we may not be able to find investment opportunities, or purchase brands or businesses, at acceptable prices and terms. Acquisitions and investments involve risks and uncertainties, including paying more than a brand or business is ultimately determined to be worth; potential difficulties integrating acquired brands and personnel; the possible loss of key customers or employees most knowledgeable about the acquired business; implementing and maintaining consistent U.S. public company standards, controls, procedures, policies, and information systems; exposure to unknown liabilities; business disruption; and management distraction or departure. We have in the past, and could in the future, incur restructuring charges or record impairment losses on the value of goodwill or other intangible assets resulting from previous acquisitions, or the risk of potential losses on equity investments which may also negatively affect our financial results.
From time to time, we also consider disposing of assets or businesses that may no longer meet our financial or strategic objectives. In selling assets or businesses, we may not get prices or terms as favorable as we anticipated. We could also encounter difficulty in finding buyers on acceptable terms in a timely manner, which could delay accomplishment of our strategic objectives. Expected cost savings from reduced overhead, relating to the sold assets, may not materialize. The overhead reductions could temporarily disrupt our other business operations. Any of these outcomes could negatively affect our financial results.
Our business faces various risks related to health epidemics and pandemics that could materially and adversely affect our business, our operations, our cash flows, and our financial results.
Our business, operations, cash flows, and financial results have previously been, and in the future could be, impacted by health epidemics, pandemics, and similar outbreaks, such as the COVID-19 pandemic. Any future epidemic, pandemic, or other outbreak could cause negative impacts such as (a) a global or U.S. recession or other economic crisis; (b) credit and capital markets volatility (and access to these markets, including by our suppliers and customers); (c) volatility in demand for our products; (d) changes in accessibility to our products due to illness, quarantines, “stay at home” orders, travel restrictions, retail, restaurant, bar, and hotel closures, social distancing requirements, and other government action; (e) changes in consumer behavior and preferences; and (f) disruptions in raw material supply, in our manufacturing operations, or in our distribution and supply chain. In addition, we may incur increased costs and otherwise be negatively affected if a significant portion of our workforce (or the workforces within our distribution or supply chain) cannot work or work effectively, including because of illness, quarantines, “stay at home” orders, social distancing requirements, other government action, facility closures, or other restrictions. Accordingly, a future widespread health epidemic or pandemic could materially and adversely affect our business, our operations, our cash flows, and our financial results.
Unfavorable economic conditions could negatively affect our operations and results.
Unfavorable global or regional economic conditions may be triggered by numerous developments beyond our control, including geopolitical events, health crises, and other events that trigger economic volatility on a global or regional basis. Those types of unfavorable economic conditions could adversely affect our business and financial results. In particular, a significant deterioration in economic conditions, including economic slowdowns or recessions, increased unemployment levels, inflationary pressures, or disruptions to credit and capital markets could lead to decreased consumer confidence in certain countries and consumer spending more generally, thus reducing consumer demand for our products. For example, since 2021, the United States and the European Union have experienced a rapid increase in inflation levels. Such heightened inflationary levels may negatively impact consumer disposable income and discretionary spending and, in turn, reduce consumer demand for our premium products and increase our costs. Unfavorable economic conditions could also cause governments to increase taxes on beverage alcohol to attempt to raise revenue, reducing consumers' willingness to make discretionary purchases of beverage alcohol products or pay for premium brands such as ours.
Unfavorable economic conditions could also adversely affect our suppliers, distributors, customers, and retailers, who in turn could experience cash flow challenges, more costly or unavailable financing, credit defaults, and other financial hardships. Such financial hardships could lead to distributor or retailer destocking, disruption in raw material supply, increase in bad debt expense, or increased levels of unsecured credit that we may need to provide to customers. Other potential negative consequences to our business from unfavorable economic conditions include higher interest rates, an increase in the rate of inflation, deflation, exchange rate fluctuations, credit or capital market instability, or lower returns on pension assets or lower discount rates for pension obligations (possibly requiring higher contributions to our pension plans).
Product recalls or other product liability claims could materially and adversely affect our sales.
The success of our brands depends on the positive image that consumers have of them. We could decide to or be required to recall products due to suspected or confirmed product contamination, product tampering, spoilage, regulatory non-compliance, food safety issues, or other quality issues. Any of these events could adversely affect our financial results. Actual contamination, whether deliberate or accidental, could lead to inferior product quality and even illness, injury, or death of consumers, potential liability claims, and material loss. Should a product recall become necessary, or we voluntarily recall a product in the event of contamination, damage, or other quality issue, sales of the affected product or our broader portfolio of brands could be adversely affected. A significant product liability judgment or widespread product recall may negatively impact sales and our business and financial results. Even if a product liability claim is unsuccessful or is not fully pursued, resulting negative publicity could adversely affect our reputation with existing and potential customers and our corporate and brand image.
Negative publicity could affect our business performance.
Unfavorable publicity, whether accurate or not, related to our industry or to us or our products, brands, marketing, executive leadership, employees, Board of Directors, family stockholders, operations, current or anticipated business performance, or environmental or social efforts could negatively affect our corporate reputation, stock price, ability to attract and retain high-quality talent, or the performance of our brands and business. Adverse publicity or negative commentary on social media, whether accurate or not, particularly any that go “viral,” could cause consumers or other stakeholders to react by disparaging or avoiding our brands or company, which could materially negatively affect our financial results. Additionally, investor advocacy groups, institutional investors, other market participants, stockholders, employees, consumers, customers, influencers, and policymakers have focused increasingly on the environmental, social, and governance or “sustainability”
positions and practices of companies. If our positions or practices do not meet investor or other stakeholder expectations and standards, which continue to evolve, our corporate reputation, stock price, ability to attract and retain high-quality talent, and the performance of our brands and business may be negatively affected. Stakeholders and others who disagree with our company's actions, positions, or statements may speak negatively or advocate against the company, with the potential to harm our reputation or business through negative publicity, adverse government treatment, or other means.
Our failure to attract or retain key talent could adversely affect our business.
Our success depends on the efforts and abilities of our senior management team, other key employees, and our high-quality employee base, as well as our ability to attract, motivate, reward, develop, and retain them. Difficulties in hiring or retaining key executive or other employee talent, or the unexpected loss of experienced employees resulting in the depletion of our institutional knowledge base, could have an adverse impact on our business performance, reputation, financial condition, or results of operations. Given changing demographics, immigration laws and policies, remote working trends, and demand for talent globally, we may not be able to find the people with the right skills, at the right time, and in the right location, to achieve our business objectives.
Risks Related to Our Global Operations
Our global business is subject to commercial, political, and financial risks.
Our products are sold in more than 170 countries; accordingly, we are subject to risks associated with doing business globally, including commercial, political, and financial risks. In addition, we are subject to potential business disruption caused by military conflicts; potentially unstable governments or legal systems; social, racial, civil, or political upheaval or unrest; local labor policies and conditions, including labor strikes and work stoppages; possible expropriation, nationalization, or confiscation of assets; problems with repatriation of foreign earnings; economic or trade sanctions; closure of markets to imports; anti-American sentiment; terrorism, kidnapping, extortion, or other types of violence in or outside the United States; and health crises. Violent crime is increasing in markets around the globe, including the United States. If a violent event should occur at one of our sites, it could disrupt business operations, impair brand reputation, increase insurance and security expenses, and adversely affect the price of our stock.
Additionally, we may be subject to tariffs imposed on our products by other countries, such as the tariffs imposed in 2018 following the United States tariffs on steel and aluminum. In response to these U.S. tariffs, a number of countries imposed retaliatory tariffs on U.S. imports, including on American whiskey products, which negatively affected our business until they were removed or suspended in late fiscal 2022 and early fiscal 2023. The imposition of tariffs, custom duties, or other restrictions or barriers on imports and exports, or the deterioration of economic relations between the United States and other countries, could increase the cost of our products and, to the extent that we absorb the costs of tariffs, result in higher cost of goods sold and lower gross profit and margins. They could also limit the availability of our products and prompt consumers to seek alternative products. Our success will depend, in part, on our ability to overcome the challenges we encounter with respect to these risks and other factors affecting U.S. export companies with a global business.
A failure to comply with anti-corruption laws, trade sanctions and restrictions, or similar laws or regulations may have a material adverse effect on our business and financial results.
Some of the countries where we do business have a higher risk of corruption than others. While we are committed to doing business in accordance with all applicable laws, including anti-corruption laws and global trade restrictions, we remain subject to the risk that an employee, or one of our many direct or indirect business partners, may take action determined to be in violation of international trade, money laundering, anti-corruption, or other laws, sanctions, or regulations, including the U.S. Foreign Corrupt Practices Act of 1977, the U.K. Bribery Act 2010, or equivalent local laws. Any determination that our operations or activities are not in compliance with applicable laws or regulations, particularly those related to anti-corruption and international economic or trade sanctions, could result in investigations, interruption of business, loss of business partner relationships, suspension or termination of credit agreements, licenses, and permits (our own or those of our partners), imposition of fines, legal or equitable sanctions, negative publicity, and management distraction or departure. Further, our obligation to comply with applicable anti-corruption, economic and trade sanctions, or other laws or regulations, our Code of Conduct, Code of Ethics for Senior Financial Officers, and our other policies could result in higher operating costs, delays, or even competitive disadvantages as compared to competitors based in different parts of the world.
Fluctuations in foreign currency exchange rates relative to the U.S. dollar could have a material adverse effect on our financial results.
The global scope of our business means that foreign currency exchange rate fluctuations relative to the U.S. dollar influence our financial results. In many markets outside the United States, we sell our products and pay for some goods, services, and labor costs primarily in local currencies.
Because our foreign currency revenues exceed our foreign currency expense, we have a net exposure to changes in the value of the U.S. dollar relative to those currencies. Over time, our reported financial results will be negatively impacted by a stronger U.S. dollar and will be benefited by a weaker one. We hedge some of our foreign currency exposure through the use of foreign currency derivatives or other means. However, even in those cases, we do not fully eliminate our foreign currency exposure. For details on how foreign exchange affects our business, see “Item 7A. Quantitative and Qualitative Disclosures about Market Risk - Foreign currency exchange rate risk.”
Legal and Regulatory Risks
National and local governments may adopt regulations or undertake investigations that could limit our business activities or increase our costs.
Our business is subject to extensive regulatory requirements regarding production, exportation, importation, marketing and promotion, labeling, distribution, pricing, and trade practices, among others. Changes in laws, regulatory measures, or governmental policies, or the manner in which current ones are interpreted, could subject us to governmental investigations, cause us to incur material additional costs or liabilities, and jeopardize the growth of our business in the affected market. Specifically, governments could prohibit, impose, or increase limitations on advertising and promotional activities, or times or locations where beverage alcohol may be sold or consumed, or adopt other measures that could limit our opportunities to reach consumers or sell our products. Some countries historically have banned all television, newspaper, magazine, and digital commerce/advertising for beverage alcohol products. Additional regulation of this nature could substantially reduce consumer awareness of our products in the affected markets and make the introduction of new products more challenging.
Additional regulation in the United States and other countries addressing the risks and impacts of climate change, use of water, and other environmental and social issues could increase our operating costs. Increasing regulation of greenhouse gas emissions could increase the cost of energy, including fuel, required to operate our facilities or transport and distribute our products, thereby substantially increasing the production, distribution, and supply chain costs associated with our products.
Tax increases and changes in tax rules could adversely affect our financial results.
Our business is sensitive to changes in both direct and indirect taxes. New tax rules, accounting standards or pronouncements, and changes in interpretation of existing rules, standards, or pronouncements could have a material adverse effect on our business and financial results. As a multinational company based in the United States, we are more exposed to the impact of changes in U.S. tax legislation and regulations than most of our major competitors, especially changes that affect the effective corporate income tax rate. For example, in August 2022, the U.S. enacted the Inflation Reduction Act of 2022 which, among other provisions, implemented a 15% minimum tax on book income of certain large corporations. Additional tax proposals sponsored by the current U.S. presidential administration could lead to U.S. tax changes, including significant increases to the U.S. corporate income tax rate and the minimum tax rate on certain earnings of foreign subsidiaries. While we are unable to predict whether any of these changes will ultimately be enacted, if these or similar proposals are enacted into law, they could negatively impact our effective tax rate and reduce net earnings.
At the global level, potential changes in tax rules or the interpretation of tax rules arising out of the Base Erosion and Profit Shifting project initiated by the Organization for Economic Co-operation and Development (OECD) include increased residual profit allocations to market jurisdictions and the implementation of a global minimum tax rate. In December 2021, the OECD issued Pillar Two model rules which would establish a global per-country minimum tax of 15%, and the European Union has approved a directive requiring member states to incorporate similar provisions into their respective domestic laws. The directive requires the rules to initially become effective for fiscal years starting on or after December 31, 2023. While it is uncertain whether the United States will enact legislation to adopt Pillar Two, numerous countries have enacted legislation, or have indicated their intent to adopt legislation, to implement certain aspects of Pillar Two effective January 1, 2024, with general implementation of the remaining global minimum tax rules by January 1, 2025. The OECD and implementing countries are expected to continue to revise their legislation and release additional guidance. We continue to evaluate the potential impact of the developments on our consolidated financial statements and related disclosures and based on our preliminary calculations, we do not expect the impact to be material. The adoption of these or other proposals could have a material adverse impact on our net income and cash flows in the future. Furthermore, changes in the earnings mix or applicable foreign tax laws could also negatively impact our net income and tax flows.
Our business operations are also subject to numerous duties or taxes not based on income, sometimes referred to as “indirect taxes.” These indirect taxes include excise taxes, sales or value-added taxes, property taxes, payroll taxes, import and export duties, and tariffs. Increases in or the imposition of new indirect taxes on our operations or products would increase the cost of our products or materials used to produce our products or, to the extent levied directly on consumers, make our products less affordable, which could negatively affect our financial results by reducing purchases of our products and encouraging consumers to switch to lower-priced or lower-taxed product categories. As governmental entities look for increased sources of revenue, they may increase taxes on beverage alcohol products.
In fiscal 2024, we have observed excise tax increases in markets that include France, Portugal, Romania and Türkiye. Additionally in fiscal 2024, Australia has continued to make an annual increase in excise taxes based on the consumer price index.
Our ability to market and sell our products depends heavily on societal attitudes toward drinking and governmental policies that both flow from and affect those attitudes.
Increased social and political attention has been directed at the beverage alcohol industry. For example, there remains continued attention focused largely on public health concerns related to alcohol abuse, including drunk driving, underage drinking, and the negative health impacts of the abuse and misuse of beverage alcohol. While most people who drink alcoholic beverages do so in moderation, it is commonly known and well reported that excessive levels or inappropriate patterns of drinking can lead to increased risk of a range of health conditions and, for certain people, can result in alcohol dependence. Some academics, public health officials, and critics of the alcohol industry in the United States, Europe, and other parts of the world continue to seek governmental measures to make beverage alcohol more expensive, less available, or more difficult to advertise and promote. If future scientific research indicates more widespread serious health risks associated with alcohol consumption – particularly with moderate consumption – or if for any reason the social acceptability of beverage alcohol declines significantly, sales of our products could be adversely affected.
Significant additional labeling or warning requirements or limitations on the availability of our products could inhibit sales of affected products.
Various jurisdictions have adopted or may seek to adopt significant additional product labeling or warning requirements or impose limitations on the availability of our products relating to the content or perceived adverse health consequences of some of our products. Several such labeling regulations or laws require warnings on any product with substances that the jurisdiction lists as potentially associated with cancer or birth defects. Our products already raise health and safety concerns for some regulators, and heightened requirements could be imposed. For example, in February 2021, the European Union published its Europe Beating Cancer Plan. The European Union is ultimately expected to issue a proposal for mandatory health warnings on beverage alcohol product labels. Such campaigns could result in additional governmental regulations concerning the production, marketing, labeling, or availability of our products, any of which could damage our reputation, make our premium brands unrecognizable, or reduce demand for our products, which could adversely affect our profitability. If additional or more severe requirements of this type are imposed on one or more of our major products under current or future health, environmental, or other laws or regulations, they could inhibit sales of such products. Further, we cannot predict whether our products will become subject to increased rules and regulations, which, if enacted, could increase our costs or adversely impact sales.
Counterfeiting or inadequate protection of our intellectual property rights could adversely affect our business prospects.
Our brand names, trademarks, and related intellectual property rights are critical assets, and our business depends on protecting them online and in the countries where we do business. We may not succeed in protecting our intellectual property rights in a given market or in challenging those who infringe our rights or imitate or counterfeit our products. Although we believe that our intellectual property rights are legally protected in the markets where we do business, the ability to register and enforce intellectual property rights varies from country to country. In some countries, for example, it may be more difficult to successfully stop counterfeiting or look-alike products, either because the law is inadequate or, even though satisfactory legal options may exist, it may be difficult to obtain and enforce sanctions against counterfeiters. We may not be able to register our trademarks in every country where we want to sell a particular product, and we may not obtain favorable decisions by courts or trademark offices.
Many global spirits brands, including some of our brands, experience problems with product counterfeiting and other forms of trademark infringement. We combat counterfeiting by working with other companies in the spirits industry through our membership in the Alliance Against Counterfeit Spirits (AACS) and with brand owners in other industries via our membership in React, an anti-counterfeiting network organization. While we believe AACS and React are effective organizations, they are not active in every market, and their efforts are subject to obtaining the cooperation of local authorities and courts in the markets where they are active. Despite the efforts of AACS, React, and our own teams, lower-quality and counterfeit products that could be harmful to consumers could reach the market and adversely affect our intellectual property rights, brand equity, corporate reputation, and financial results. In addition, the industry as a whole could suffer negative effects related to the manufacture, sale, and consumption of illegally produced beverage alcohol.
Litigation and legal disputes could expose our business to financial and reputational risk.
Major private or governmental litigation challenging the production, marketing, promotion, distribution, or sale of beverage alcohol or specific brands could affect our ability to sell our products. Because litigation and other legal proceedings can be costly to defend, even actions that are ultimately decided in our favor could have a negative impact on our business reputation or financial results.
Lawsuits have been brought against beverage alcohol companies alleging problems related to alcohol abuse, negative health consequences from drinking, problems from alleged marketing or sales practices, and underage drinking. While these lawsuits have been largely unsuccessful in the past, others may succeed in the future. We could also experience employment-related or cybersecurity-related class actions, environmental claims, commercial disputes, product liability actions stemming from a beverage or container production defect, a whistleblower suit, or other major litigation that could adversely affect our business results, particularly if there is negative publicity.
As discussed throughout these risk factors, governmental actions around the world are a continuing compliance risk for global companies such as ours. In addition, as a U.S. public company, we are exposed to the risk of securities-related class action suits, particularly following a precipitous drop in the share price of our stock. Adverse developments in major lawsuits concerning these or other matters could result in management distraction and have a material adverse effect on our business.
Risks Related to Cybersecurity and Data Privacy
We rely on information technology (IT) systems to manage our business operations. A cyber breach, a failure or corruption of one or more of our key information technology systems, networks, processes, associated sites, or service providers, or a failure to comply with personal data protection laws could have a material adverse impact on our business.
As a company with complex IT systems, we have been a target of cyberattacks and other hacking activities in the past, and we expect to continue to be a target in the future. While past cyberattacks and hacking activities have not materially impacted our business or disrupted our operations, increased IT security threats and more sophisticated cybercrimes and cyberattacks, including computer viruses and other malicious codes, ransomware, unauthorized access attempts, denial-of-service attacks, phishing, social engineering, hacking, and other types of attacks, pose a risk to the security and availability of our IT systems, networks, and services, including those that are managed, hosted, provided, or used by third parties, as well as the confidentiality, availability, and integrity of our data and the data of our customers, partners, consumers, employees, stockholders, suppliers, and others. As a result, we may experience material disruptions or suffer material adverse effects in the future from cyberattacks or other hacking activities. Furthermore, our increasingly mobile, hybrid, and global workforce further increases our attack surface.
In the ordinary course of our business, we receive, process, transmit, and store information relating to identifiable individuals (personal data), primarily employees and former employees, beneficiaries of employees or former employees, customers, and consumers. As a result, we are subject to various U.S. federal and state and foreign laws and regulations relating to personal data. Such laws and regulations include the California Consumer Protection Act, the California Privacy Rights Act, data protection and AI regulations in the European Union, and other similar regulations that may change or be added to frequently.
Unauthorized access to our IT network, or that of our service providers, suppliers, customers, or other direct or indirect business partners, could result in failure of our IT systems, networks, or services to function properly. This could lead to the loss or unauthorized disclosure of our business strategy or other confidential information; disruptions to our business operations; misappropriation of personal data; and reputational, competitive, or business harm. Each of these events may adversely affect our business operations or financial results, or may cause financial and reputational damage, undermine consumer confidence, subject us to government enforcement actions (including fines), or result in private litigation against us, which could result in loss of revenue, increased costs, liability for monetary damages, fines, or criminal prosecution.
Risks Related to Our Ownership and Corporate Governance Structure
The Brown family has the ability to control the outcome of matters submitted for stockholder approval.
We are a “controlled company” under New York Stock Exchange rules. Controlled companies are exempt from New York Stock Exchange listing standards that require a board composed of a majority of independent directors, a fully independent nominating/corporate governance committee, and a fully independent compensation committee. We may avail ourselves of the exemption from having a board composed of a majority of independent directors, and we utilize the exemption from having a fully independent nominating/corporate governance committee. Notwithstanding the available exemption, our Compensation Committee is composed exclusively of independent directors. As a result of our use of some “controlled company” exemptions, our corporate governance practices differ from those of non-controlled companies, which are subject to all of the New York Stock Exchange corporate governance requirements.
We have two classes of common stock. Our Class A common stock is entitled to full voting powers, including in the elections of directors, while our Class B common stock may not vote except as provided by the laws of Delaware. We have had two classes of common stock since 1959, when our stockholders approved the issuance of two shares of Class B non-voting common stock to every holder of our voting common stock.
Dual-class share structures have come under the scrutiny of major indices, institutional investors, and proxy advisory firms, with some calling for the reclassification of non-voting common stock.
A majority of our voting stock is controlled by members of the Brown family, and, collectively, they have the ability to control the outcome of stockholder votes, including the election of all of our directors and the approval or rejection of any merger, change of control, or other significant corporate transactions. We believe that having a long-term-focused, committed, and engaged stockholder base provides us with a distinct strategic advantage, particularly in a business with aged products and multi-generational brands. This advantage could be eroded or lost, however, should Brown family members cease, collectively, to be controlling stockholders of the Company.
We believe that it is in the interests of all stockholders that we remain independent and family-controlled, and we believe the Brown family stockholders share these interests. Thus, our common stock dual-class share structure, as it has existed since 1959, is perpetual, and we do not have a sunset provision in our Restated Certificate of Incorporation or By-laws that provides for the eventual reclassification of the non-voting common stock to voting common stock. However, the Brown family's interests may not always be aligned with other stockholders' interests. By exercising their control, the Brown family could cause the Company to take actions that are at odds with the investment goals or interests of institutional, short-term, non-voting, or other non-controlling investors, or that have a negative effect on our stock price. Further, because the Brown family controls the majority of our voting stock, Brown-Forman might be a less attractive takeover target, which could adversely affect the market price of both our voting and our non-voting common stock. And the difference in voting rights for our common stock could also adversely and disproportionately affect the value of our Class B non-voting common stock to the extent that investors view, or any potential future purchaser of our Company views, the superior voting rights and control represented by the Class A common stock to have value.
Item 1B. Unresolved Staff Comments
None.
Item 1C. Cybersecurity
Cybersecurity Risk Management Strategy and Processes
Our Chief Information Security Officer (CISO) leads our Global Information Security team, reports to the Chief Information Officer (CIO), and meets regularly with other members of senior management. Our CISO holds advanced degrees in Computer Science and Business Administration, in addition to relevant IT and cybersecurity certifications from organizations such as the EC Council, ISACA, and CSA. She has served in various IT roles for over 20 years, including leading the IT Security function.
Our Global Information Security Team is responsible for the information security strategy, policy, security engineering, operations, and cyber threat detection and response. Our Global Information Security Team, which includes a security operations center, seeks to protect the company against reasonably foreseeable cyber threats and risks. The cybersecurity team members have the qualifications and certifications for their roles. They also have relevant industry experience in selecting, deploying, and operating cybersecurity technologies, initiatives, and processes globally. We also rely on threat intelligence as well as other information obtained from governmental, public, or private sources, including external consultants that we engage.
We have made significant investments in people, processes, and technology to protect the confidentiality, integrity, and availability of our IT systems. As part of that effort, we utilize the National Institute of Standards and Technology Cybersecurity Framework as a guide for our security controls. We are also continuing to advance towards an architecture based on “Zero-Trust” principles, where we continuously validate the identity and security posture of every user, device, application, or network component trying to leverage our IT resources. In addition, our employees undergo annual security awareness training to improve their understanding of cybersecurity threats, and their ability to identify and escalate potential threats.
In the event of an incident, we leverage a multi-layered set of plans that include, Endpoint Detection and Response software, Security Information and Event Management tools for detection, and a Cybersecurity Incident Response Plan and Disaster Recovery Response Plan for recovery. The recovery plans outline the steps to be followed from incident detection to mitigation, recovery, and notification, including notifying designated functional leadership teams, the Disclosure Committee, the General Counsel, other senior leadership, and the Board of Directors, as appropriate. These designated leaders assess various factors, including operational, financial, legal, regulatory, reputational impacts on the Company to determine the materiality of the incident and the appropriate response..
We have established a tiered risk management strategy that helps us to evaluate our ability to protect assets (data and systems) by identifying, assessing, and prioritizing associated risk through, among other tools, the use of a non-affiliated third party assessor, audits by our internal audit team, tabletop exercises, penetration and vulnerability testing, and simulations. We report the results of these assessments to the Audit Committee of the Board of Directors.
We rely on third party service providers to deliver our products and services to our customers, including many of our technology initiatives. A cybersecurity incident at a supplier, subcontractor, or joint venture partner could materially adversely impact us. We evaluate third party providers from a cybersecurity risk perspective, which may include an assessment of that service provider’s cybersecurity posture through a questionnaire and include security and privacy addenda to our contracts where applicable. However, we rely on the third parties we use to implement security programs commensurate with their risk, and we cannot ensure in all circumstances that their efforts will be successful.
Our systems periodically experience directed attacks intended to lead to interruptions and delays in our service and operations as well as loss, misuse, or theft of personal information (of third parties, employees and their beneficiaries, and customers) and other data. These incidents have not had a material impact on our services, system, or business during the past reporting period. However, despite our capabilities, processes, and other security measures we employ, we may not be aware of all vulnerabilities or might not accurately assess the risk of an incident. Additional information on cybersecurity risks we face can be found in Item 1A. Risk Factors, which should be read in conjunction with the foregoing information.
Cybersecurity Governance
The Board of Directors oversees management’s processes for identifying and mitigating risks, including cybersecurity risks, to help align our risk exposure with our strategic objectives. The Board of Directors has delegated oversight of risks related to cybersecurity to the Audit Committee. The Audit Committee regularly reports on its activities and findings with respect to risks from cybersecurity threats to the full Board of Directors.
The Audit Committee oversees our cybersecurity posture to assess key strategic, operational, and compliance risks. Our CIO and CISO update the Audit Committee on a quarterly basis regarding cyber risks, the threat landscape, reports on our security roadmap, risk mitigation and governance, and any cybersecurity incidents.
The Company’s Information Technology, Enterprise Security, Internal Audit, as well as the Legal and Privacy teams work closely to identify issues and incidents in a timely manner, and report them to senior leadership, the Board of Directors, and appropriate regulatory bodies, as appropriate. Assessing, identifying, and managing cybersecurity risks are integrated into our overall enterprise risk management (ERM) framework that provides risk quantification, scenario analysis to determine the potential impact on the enterprise, and processes to manage risk within the parameters of the organization's risk appetite. Additionally, ERM provides support to the decision making process to enable cybersecurity risk owners to accomplish the desired level of asset protection and alignment consistent with the organization's strategy. The ERM work is presented annually to the Audit Committee and Board of Directors, including the management of top risks and the review of emerging risks.
Item 2. Properties
Our Company-owned production facilities include distilleries, a winery1, bottling plants, an RTD canning plant, warehousing operations, a cooperage, visitors' centers, and retail shops. We also have agreements with other parties for contract production in Australia, Belgium, China, Ireland, Latvia, Mexico, the Netherlands, New Zealand, South Africa, Spain, the United Kingdom, the United States, and Venezuela.
In addition to our Company-owned production locations and our corporate offices in Louisville, Kentucky, we lease office space for use in our sales, marketing, and administrative operations in the United States and in over 50 other locations around the world. The lease terms expire at various dates and are generally renewable. We believe that our facilities are in good condition and are adequate for our business.
|
|
|
|
|
|
|
|
|
Principal Properties |
| Location |
Principal Activities |
Notes |
|
|
|
| United States: |
| Louisville, Kentucky |
Corporate offices |
Includes several renovated historic structures |
|
Distilling, bottling, warehousing |
Home of Old Forester |
|
Visitors' center |
|
|
Cooperage |
Brown-Forman Cooperage |
| Lynchburg, Tennessee |
Distilling, bottling, warehousing |
Home of Jack Daniel's |
|
Visitors' center |
|
| Woodford County, Kentucky |
Distilling, bottling, warehousing |
Home of Woodford Reserve |
|
Visitors' center |
|
| Windsor, California |
Vineyards, winery, bottling, warehousing |
Home of Sonoma-Cutrer1 |
|
Visitors' center |
|
| Trinity, Alabama |
Cooperage |
Jack Daniel Cooperage2 |
|
|
|
|
|
|
|
|
|
|
|
|
| International: |
| Cour-Cheverny, France |
Distilling, bottling, warehousing |
Home of Chambord |
| Amatitán, Mexico |
Distilling, bottling, warehousing, RTD canning |
Home of Herradura and el Jimador |
|
Visitors' center |
|
| Slane, Ireland |
Distilling |
Home of Slane Irish Whiskey |
|
Visitors' center |
|
| Aberdeenshire, Scotland |
Distilling, warehousing |
Home of The Glendronach |
|
Visitors' center |
|
| Morayshire, Scotland |
Distilling, warehousing |
Home of Benriach |
|
Visitors' center |
|
| Newbridge, Scotland |
Bottling |
|
| Portsoy, Scotland |
Distilling, warehousing |
Home of Glenglassaugh |
|
Visitors' center |
|
Provincia de Panamá, Panamá |
Warehousing, bottling |
Home of Diplomático |
|
|
|
|
|
|
|
|
1Sonoma-Cutrer California Wines and related assets were divested on April 30, 2024. |
2The Jack Daniel Cooperage was divested on May 1, 2024. |
Item 3. Legal Proceedings
We operate in a litigious environment and we are sued in the normal course of business. We do not anticipate that any pending suits will have, individually or in the aggregate, a material adverse effect on our financial position, results of operations, or liquidity.
Item 4. Mine Safety Disclosures Item 5.
Not applicable.
PART II
Market for the Registrant's Common Equity, Related Stockholder Matters, and Issuer Purchases of Equity Securities
Our Class A and Class B common stock is traded on the New York Stock Exchange under the symbols “BFA” and “BFB,” respectively. As of May 31, 2024, we had 2,334 holders of record of Class A common stock and 4,382 holders of record of Class B common stock. Because of overlapping ownership between classes, as of May 31, 2024, we had only 4,732 distinct common stockholders of record.
Stock Performance Graph
The graph below compares the cumulative total shareholder return of our Class B common stock for the last five fiscal years with the total return of the Standard & Poor's (S&P) 500 Index and S&P 500 Consumer Staples Index. The information presented assumes an initial investment of $100 on April 30, 2019, and that all dividends were reinvested. The graph shows the value that each of these investments would have had on April 30 in the years since 2019.
|
|
|
|
|
|
|
|
|
|
|
|
|
|
|
|
|
|
|
|
|
|
2019 |
2020 |
2021 |
2022 |
2023 |
2024 |
| Brown-Forman Corporation |
$100 |
$118 |
$146 |
$132 |
$129 |
$96 |
S&P 500 Index |
$100 |
$101 |
$147 |
$148 |
$151 |
$186 |
S&P 500 Consumer Staples Index |
$100 |
$104 |
$127 |
$148 |
$152 |
$155 |
|
|
|
|
|
|
|
Item 6. [Reserved]
Item 7. Management's Discussion and Analysis of Financial Condition and Results of Operations
Introduction
This Management's Discussion and Analysis of Financial Condition and Results of Operations (MD&A) is intended to help the reader better understand Brown-Forman, our operations, our financial results, and our current business environment. Please read this MD&A in conjunction with our Consolidated Financial Statements and the accompanying Notes contained in “Item 8. Financial Statements and Supplementary Data” (Consolidated Financial Statements).
Our MD&A is organized as follows:
|
|
|
|
|
|
| Table of Contents |
|
Page |
| Presentation basis |
|
|
|
| Significant developments |
|
| Executive summary |
|
| Results of operations |
|
| Liquidity and capital resources |
|
|
|
|
|
| Critical accounting policies and estimates |
|
Presentation Basis
Non-GAAP Financial Measures
We use some financial measures in this report that are not measures of financial performance under U.S. generally accepted accounting principles (GAAP). These non-GAAP measures, defined below, should be viewed as supplements to (not substitutes for) our results of operations and other measures reported under GAAP. Other companies may not define or calculate these non-GAAP measures in the same way.
“Organic change” in measures of statements of operations. We present changes in certain measures, or line items, of the statements of operations that are adjusted to an “organic” basis. We use “organic change” for the following measures of the statements of operations: (a) organic net sales; (b) organic cost of sales; (c) organic gross profit; (d) organic advertising expenses; (e) organic selling, general, and administrative (SG&A) expenses; (f) organic other expense (income) net; (g) organic operating expenses1; and (h) organic operating income. To calculate these measures, we adjust, as applicable, for (1) acquisitions and divestitures, (2) impairment charges, (3) other items, and (4) foreign exchange. We explain these adjustments below.
•“Acquisitions and divestitures.” This adjustment removes (a) the gain or loss recognized on sale of divested brands, (b) any non-recurring effects related to our acquisitions and divestitures (e.g., transaction, transition, and integration costs or income), and (c) the effects of operating activity related to acquired and divested brands for periods not comparable year over year (non-comparable periods). Excluding non-comparable periods allows us to include the effects of acquired and divested brands only to the extent that results are comparable year over year.
During the third quarter of fiscal 2023, we acquired Gin Mare Brand, S.L.U. and Mareliquid Vantguard, S.L.U., which owned the Gin Mare brand (Gin Mare). This adjustment removes (a) the transaction, transition, and integration costs related to the acquisition, (b) operating activity for the non-comparable periods, which is activity in the first and second quarters of fiscal 2024, and (c) fair value adjustments to Gin Mare’s earn-out contingent consideration liability that is payable in cash no earlier than July 2024 and no later than July 2027.
During the third quarter of fiscal 2023, we acquired (a) International Rum and Spirits Distributors Unipessoal, Lda., (b) Diplomático Branding Unipessoal Lda., (c) International Bottling Services, S.A., (d) International Rum & Spirits Marketing Solutions, S.L., and (e) certain assets of Destilerias Unidas Corp., which collectively own the Diplomático Rum brand and related assets (Diplomático). This adjustment removes (a) the transaction, transition, and integration costs related to the acquisition, and (b) operating activity for the non-comparable periods, which is primarily activity in the first three quarters of fiscal 2024.
During the third quarter of fiscal 2024, we sold the Finlandia vodka business, which resulted in a pre-tax gain of $92 million, and entered into a related transition services agreement (TSA) for this business. This adjustment removes the (a) transaction costs related to the divestiture, (b) the gain on sale of the Finlandia vodka business, (c) operating activity for the
1 Operating expenses include advertising expense, SG&A expense, and other expense (income), net.
non-comparable period, which is activity in the third and fourth quarters of fiscal 2023, and (d) net sales, cost of sales, and operating expenses recognized pursuant to the TSA related to distribution services in certain markets.
During the fourth quarter of fiscal 2024, we sold the Sonoma-Cutrer wine business in exchange for an ownership percentage of 21.4% in The Duckhorn Portfolio Inc. (Duckhorn) along with $50 million cash and entered into a related TSA for this business. This transaction resulted in a pre-tax gain of $175 million. This adjustment removes the transaction costs related to the divestiture and the gain on sale of the Sonoma-Cutrer wine business.
During the second quarter of fiscal 2024, we recognized a gain of $7 million on the sale of certain fixed assets. This adjustment removes the gain from our other expense (income), net and operating income.
We believe that these adjustments allow for us to better understand our organic results on a comparable basis.
See Notes 13 and 14 to the Consolidated Financial Statements for more information.
•“Impairment Charges.” This adjustment removes the impact of impairment charges from our results of operations.
During the third quarter of fiscal 2023, we recognized a non-cash impairment charge of $96 million for the Finlandia brand name. During the fourth quarter of fiscal 2024, we recognized a non-cash impairment charge of $7 million for an immaterial discontinued brand name. We believe that these adjustments allow for us to understand our organic results on a comparable basis.
•“Other Items.” Other Items include the additional items outlined below.
“Foundation.” During the fourth quarter of fiscal 2024, we committed $23 million to the Brown-Forman Foundation and Dendrifund (the Foundation and Dendrifund) to support the communities where our employees live and work. This adjustment removes the commitment to the Foundation from our organic SG&A expenses and organic operating income to present our organic results on a comparable basis.
“Jack Daniel’s Country Cocktails business model change (JDCC).” In fiscal 2021, we entered into a partnership with the Pabst Brewing Company for the supply, sales, and distribution of Jack Daniel's Country Cocktails in the United States while Brown-Forman continued to produce certain products. During fiscal 2024, this production fully transitioned to Pabst Brewing Company for the Jack Daniel’s Country Cocktails products. This adjustment removes the non-comparable operating activity related to the sales of Brown-Forman-produced Jack Daniel’s Country Cocktails products during the fourth quarter of fiscal 2023 and fiscal 2024.
•“Foreign exchange.” We calculate the percentage change in certain line items of the statements of operations in accordance with GAAP and adjust to exclude the cost or benefit of currency fluctuations. Adjusting for foreign exchange allows us to understand our business on a constant-dollar basis, as fluctuations in exchange rates can distort the organic trend both positively and negatively. (In this report, “dollar” always means the U.S. dollar unless stated otherwise.) To eliminate the effect of foreign exchange fluctuations when comparing across periods, we translate current-year results at prior-year rates and remove transactional and hedging foreign exchange gains and losses from current- and prior-year periods.
We use the non-GAAP measure “organic change”, along with other metrics, to: (a) understand our performance from period to period on a consistent basis; (b) compare our performance to that of our competitors; (c) calculate components of management incentive compensation; (d) plan and forecast; and (e) communicate our financial performance to the Board of Directors, stockholders, and investment community. We provide reconciliations of the “organic change” in certain line items of the statements of operations to their nearest GAAP measures in the tables under “Results of Operations - Fiscal 2024 Highlights” and “Results of Operations - Year-Over-Year Comparisons.” We have consistently applied the adjustments within our reconciliations in arriving at each non-GAAP measure. We believe these non-GAAP measures are useful to readers and investors because they enhance the understanding of our historical financial performance and comparability between periods. When we provide guidance for organic change in certain measures of the statements of operations we do not provide guidance for the corresponding GAAP change, as the GAAP measure will include items that are difficult to quantify or predict with reasonable certainty, such as foreign exchange, which could have a significant impact to our GAAP income statement measures.
“Return on average invested capital.” This measure refers to the sum of net income and after-tax interest expense, divided by average invested capital. Average invested capital equals assets less liabilities, excluding interest-bearing debt, and is calculated using the average of the most recent five quarter-end balances. After-tax interest expense equals interest expense multiplied by one minus our effective tax rate. We use this non-GAAP measure because we consider it to be a meaningful indicator of how effectively and efficiently we invest capital in our business.
In fiscal 2023, we changed the methodology used to determine average invested capital. Previously, average invested capital was computed using the average of the most recent 13 month-end balances. Average invested capital is now calculated using the average of the most recent five quarter-end balances, which are disclosed in the relevant quarterly reports on Form 10-Q and Annual Reports on Form 10-K. Return on average invested capital computed using the new methodology does not materially differ from the result computed using the previous methodology for fiscal 2023. The new methodology was consistently applied to return on average invested capital for each period presented.
Definitions
Aggregations.
From time to time, to explain our results of operations or to highlight trends and uncertainties affecting our business, we aggregate markets according to stage of economic development as defined by the International Monetary Fund (IMF), and we aggregate brands by beverage alcohol category. Below, we define the geographic and brand aggregations used in this report.
Geographic Aggregations.
In “Results of Operations - Fiscal 2024 Market Highlights,” we provide supplemental information for our top markets ranked by percentage of reported net sales. In addition to markets listed by country name, we include the following aggregations:
•“Developed International” markets are “advanced economies” as defined by the IMF, excluding the United States. Our top developed international markets were Germany, Australia, the United Kingdom, France, Canada, and Spain. This aggregation represents our net sales of branded products to these markets.
•“Spain” includes Spain and certain other surrounding territories.
•“Emerging” markets are “emerging and developing economies” as defined by the IMF. Our top emerging markets were Mexico, Poland, and Brazil. This aggregation represents our net sales of branded products to these markets.
•“Brazil” includes Brazil, Uruguay, Paraguay, and certain other surrounding territories.
•“Travel Retail” represents our net sales of branded products to global duty-free customers, other travel retail customers, and the U.S. military, regardless of customer location.
•“Non-branded and bulk” includes net sales of used barrels, contract bottling services, and non-branded bulk whiskey and wine, regardless of customer location.
Brand Aggregations.
In “Results of Operations - Fiscal 2024 Brand Highlights,” we provide supplemental information for our top brands ranked by percentage of reported net sales. In addition to brands listed by name, we include the aggregations outlined below.
In fiscal 2023, we began presenting “Ready-to-Drink” products as a separate aggregation due to its more significant contribution to our growth in recent years and industry-wide category growth trends. “Whiskey” no longer contains Jack Daniel’s ready-to-drink (RTD) and ready-to-pour (RTP), and “Tequila” no longer includes New Mix. These brands are now included in the “Ready-to-Drink” brand aggregation.
•“Whiskey” includes all whiskey spirits and whiskey-based flavored liqueurs. The brands included in this category are the Jack Daniel’s family of brands (excluding the “Ready-to-Drink” products defined below), the Woodford Reserve family of brands (Woodford Reserve), the Old Forester family of brands (Old Forester), The Glendronach, Glenglassaugh, Benriach, Slane Irish Whiskey, and Coopers’ Craft.
•“American whiskey” includes the Jack Daniel’s family of brands (excluding the “Ready-to-Drink” products defined below) and premium bourbons (defined below).
•“Premium bourbons” includes Woodford Reserve, Old Forester, and Coopers’ Craft.
•“Super-premium American whiskey” includes Woodford Reserve, Gentleman Jack, and other super-premium Jack Daniel's expressions.
•“Ready-to-Drink” includes all ready-to-drink (RTD) and ready-to-pour (RTP) products. The brands included in this category are Jack Daniel’s RTD and RTP products (JD RTD/RTP), New Mix, and other RTD/RTP products.
•“Jack Daniel’s RTD/RTP” products include all RTD line extensions of Jack Daniel’s, such as Jack Daniel’s & Cola, Jack Daniel’s & Coca-Cola RTD, Jack Daniel’s Country Cocktails, Jack Daniel’s Double Jack, and other malt- and spirit-based Jack Daniel’s RTDs, along with Jack Daniel’s Winter Jack RTP.
•“Jack Daniel’s & Coca-Cola RTD” includes all Jack Daniel’s and Coca-Cola RTD products and Jack Daniel’s bulk whiskey shipments for the production of this product.
•“Tequila” includes el Jimador, the Herradura family of brands (Herradura), and other tequilas.
•“Wine” includes Korbel California Champagnes and Sonoma-Cutrer wines (which was divested on April 30, 2024). See Note 14 to the Condensed Consolidated Financial Statements for details.
•“Vodka” includes Finlandia, which was divested on November 1, 2023. See Note 14 to the Condensed Consolidated Financial Statements for details.
•“Rest of Portfolio” includes Diplomático, Chambord, Gin Mare, Korbel Brandy, and Fords Gin.
•“Non-branded and bulk” includes net sales of used barrels, contract bottling services, and non-branded bulk whiskey and wine.
•“Jack Daniel’s family of brands” includes Jack Daniel’s Tennessee Whiskey (JDTW), JD RTD/RTP, Jack Daniel’s Tennessee Honey (JDTH), Gentleman Jack, Jack Daniel’s Tennessee Apple (JDTA), Jack Daniel’s Tennessee Fire (JDTF), Jack Daniel’s Single Barrel Collection (JDSB), Jack Daniel’s Bonded Tennessee Whiskey, Jack Daniel’s Sinatra Select, Jack Daniel’s Tennessee Rye Whiskey (JDTR), Jack Daniel’s Triple Mash Blended Straight Whiskey, Jack Daniel’s Bottled-in-Bond, Jack Daniel’s American Single Malt, Jack Daniel’s 12 Year Old, Jack Daniel’s 10 Year Old, and other Jack Daniel’s expressions.
Other Metrics.
•“Shipments.” We generally record revenues when we ship or deliver our products to our customers. In this report, unless otherwise specified, we refer to shipments when discussing volume.
•“Depletions.” This is a term commonly used in the beverage alcohol industry to describe volume. Depending on the context, depletions usually means either (a) where Brown-Forman is the distributor, shipments directly to retail or wholesale customers or (b) where Brown-Forman is not the distributor, shipments from distributor customers to retailers and wholesalers. We believe that depletions measure volume in a way that more closely reflects consumer demand than our shipments to distributor customers do.
•“Consumer takeaway.” When discussing trends in the market, we refer to consumer takeaway, a term commonly used in the beverage alcohol industry that refers to the purchase of product by consumers from retail outlets, including products purchased through e-commerce channels, as measured by volume or retail sales value. This information is provided by third parties, such as Nielsen and the National Alcohol Beverage Control Association (NABCA). Our estimates of market share or changes in market share are derived from consumer takeaway data using the retail sales value metric. We believe consumer takeaway is a leading indicator of consumer demand trends.
•“Estimated net change in distributor inventories.” We generally recognize revenue when our products are shipped or delivered to customers. In the United States and certain other markets, our customers are distributors that sell downstream to retailers and consumers. We believe that our distributors’ downstream sales more closely reflect actual consumer demand than do our shipments to distributors. Our shipments increase distributors’ inventories, while distributors’ depletions (as described above) reduce their inventories. Therefore, it is possible that our shipments do not coincide with distributors’ downstream depletions and merely reflect changes in distributors’ inventories. Because changes in distributors’ inventories could affect our trends, we believe it is useful for investors to understand those changes in the context of our operating results.
We perform the following calculation to determine the “estimated net change in distributor inventories”:
•For both the current-year period and the comparable prior-year period, we calculate a “depletion-based” amount by (a) dividing the organic dollar amount (e.g. organic net sales) by the corresponding shipment volumes to arrive at a shipment per case amount, and (b) multiplying the resulting shipment per case amount by the corresponding depletion volumes. We subtract the year-over-year percentage change of the “depletion-based” amount from the year-over-year percentage change of the organic amount to calculate the “estimated net change in distributor inventories.”
•A positive difference is interpreted as a net increase in distributors’ inventories, which implies that organic trends could decrease as distributors reduce inventories; whereas, a negative difference is interpreted as a net decrease in distributors’ inventories, which implies that organic trends could increase as distributors rebuild inventories.
Significant Developments
Below, we discuss the significant developments in our business during fiscal 2023 and fiscal 2024. These developments relate to acquisitions and divestitures, Finlandia brand name impairment, tariffs, supply chain disruptions, innovation, and capital deployment.
Acquisitions and Divestitures
During the third quarter of fiscal 2023, we acquired the Gin Mare brand and the Diplomático brand and related assets for a combined purchase price of $1.2 billion. In fiscal 2023, these brands positively contributed to our reported net sales growth and negatively impacted our reported operating income growth. The negative effect on fiscal 2023 reported operating income was largely driven by transaction expenses of $44 million related to the termination of certain distribution contracts (certain post-closing costs and expenses). In fiscal 2024, these brands positively contributed to our reported net sales growth and reported operating income.
During the third quarter of fiscal 2024, we sold the Finlandia vodka business for $196 million cash and entered into a related TSA for this business. This transaction resulted in a pre-tax gain of $92 million. The TSA negatively impacted our reported gross margin during fiscal 2024.
During the fourth quarter of fiscal 2024, we sold the Sonoma-Cutrer wine business in exchange for an ownership percentage of 21.4% in Duckhorn along with $50 million cash and entered into a related TSA for this business. This transaction resulted in a pre-tax gain of $175 million.
Finlandia Impairment
During the third quarter of fiscal 2023, we recognized a non-cash impairment charge of $96 million for the Finlandia brand name, largely due to macroeconomic conditions including rising interest rates and increasing costs.
Tariffs
The removal of the European Union and United Kingdom tariffs on American whiskey (tariffs) positively affected our results during fiscal 2023. Tariffs include the combined effect of tariff-related costs, whether arising as a reduction of reported net sales or as an increase in reported cost of sales. For fiscal 2023, we estimated that lower costs associated with tariffs (a) reduced our reported cost of sales growth by approximately four percentage points, and (b) increased gross margin by approximately one and a half percentage points.
Supply Chain Disruptions
Supply chain disruptions negatively impacted our business during fiscal 2023 due to global logistics and transportation challenges that constrained product movement and increased transportation costs.
We further discuss the effects of these developments on our results where relevant below.
Innovation
•Jack Daniel’s family of brands. Innovation within the Jack Daniel’s family of brands has contributed to our growth in the last two fiscal years as described below.
◦In fiscal 2023, we announced our global relationship with The Coca-Cola Company to introduce the Jack Daniel's & Coca-Cola RTD to select markets around the world. We discuss the impact of the continued product launch on our fiscal 2024 results where relevant below.
◦In fiscal 2023, we launched Jack Daniel’s Bonded Tennessee Whiskey and Jack Daniel’s Triple Mash Blended Straight Whiskey in the United States and certain developed international and emerging markets.
◦In fiscal 2023, we launched Jack Daniel’s 12 Year Old in the United States.
◦In fiscal 2023, we launched Jack Daniel's Tennessee Travelers Whiskey in Travel Retail.
◦In fiscal 2023 and fiscal 2024, we continued the international launch of Jack Daniel’s Tennessee Apple, expanding to certain developed international and emerging markets.
◦In fiscal 2024, we launched Jack Daniel’s Bonded Rye and Jack Daniel’s Single Barrel Rye Barrel Proof in the United States.
◦In fiscal 2024, we launched Jack Daniel’s American Single Malt in Travel Retail.
◦In fiscal 2024, we introduced the Glenglassaugh old and rare cask program.
Capital Deployment
We have focused our capital deployment initiatives on (a) investing fully in our existing business, (b) continuing our acquisitions and divestitures strategy, and (c) returning cash to our stockholders.
•Investments. During fiscal 2023 and fiscal 2024, our capital expenditures totaled $411 million and focused on enabling the growth of our premium whiskey, tequila, and rum brands:
◦During fiscal 2021, our Board of Directors approved a $125 million capital investment to expand our bourbon-making capacity in Kentucky. We completed this project in fiscal 2024. We also built two additional barrel warehouses at our Woodford Reserve distillery during fiscal 2024 to support the continued growth of Woodford Reserve.
◦During fiscal 2022, our Board of Directors approved a $50 million capital investment to expand our scotch-making capacity in Scotland. We expect to complete this project in fiscal 2026. We also built an additional barrel warehouse at our The Glendronach distillery during fiscal 2023 and two additional barrel warehouses at our Glenglassaugh distillery during fiscal 2024 to support the continued growth of those brands.
◦During fiscal 2023, our Board of Directors approved an $85 million capital investment to expand our JDTW capacity in Tennessee. We also built four additional barrel warehouses at our Jack Daniel’s distillery during fiscal 2023 and fiscal 2024 to support the continued growth of JDTW.
◦During fiscal 2023, our Board of Directors approved a $200 million capital investment to expand our tequila-making capacity in Mexico.
◦During fiscal 2024, we built an additional barrel warehouse in Panamá to support the continued growth of Diplomático rum.
•Acquisitions and divestitures. During fiscal 2023, we acquired the Gin Mare brand and the Diplomático brand and related assets. During fiscal 2024, we sold the Finlandia vodka business and Sonoma-Cutrer wine business. See Notes 13 and 14 to the Consolidated Financial Statements for more information.
•Cash returned to stockholders. During fiscal 2023 and fiscal 2024, we returned a total of $1.2 billion to our stockholders through $782 million in regular dividends and $400 million in share repurchases.
Executive Summary
Fiscal 2024 Highlights
•We delivered reported net sales of $4.2 billion, a decrease of 1% compared to fiscal 2023. The decline in reported net sales was driven by lower volumes, largely offset by favorable price/mix and the positive effect of acquisitions and divestitures. An estimated net decrease in distributor inventories negatively impacted reported net sales.
◦From a brand perspective, the decline in reported net sales was driven by JDTW, partially offset by growth from our recently acquired brands, Diplomático and Gin Mare.
◦From a geographic perspective, the decline in reported net sales was driven by the United States and Japan, partially offset by growth in Mexico and Germany.
•We delivered reported gross profit of $2.5 billion, an increase of 1% compared to fiscal 2023. Gross margin increased to 60.5% in fiscal 2024, up 1.5 percentage points from 59.0% in fiscal 2023. The increase in gross margin was primarily driven by favorable price/mix and lower supply chain disruption related costs, partially offset by higher input costs and the negative effect of foreign exchange.
•We delivered reported operating income of $1.4 billion, an increase of 25% compared to fiscal 2023, driven primarily by the positive effect of acquisitions and divestitures (the gains on sale of the Finlandia vodka business and the Sonoma-Cutrer wine business), favorable price/mix, the absence of the prior year period Finlandia non-cash impairment, and lower supply chain disruption related costs, partially offset by operating expense growth, the negative effect of foreign exchange, and the $23 million commitment to the Foundation and Dendrifund.
•We delivered diluted earnings per share of $2.14, an increase of 32% compared to fiscal 2023, driven primarily by the increase in reported operating income.
•Our return on average invested capital increased to 17.3% in fiscal 2024, compared to 15.3% in fiscal 2023. This increase was driven by higher reported operating income and the benefit of a lower effective tax rate, partially offset by higher invested capital.
Summary of Operating Performance Fiscal 2023 and Fiscal 2024
|
|
|
|
|
|
|
|
|
|
|
|
|
|
|
|
|
|
|
|
|
|
|
|
|
|
|
|
|
|
|
|
|
|
|
|
|
|
|
|
|
|
|
2023 vs. 2024 |
| Fiscal year ended April 30 |
|
|
2023 |
|
2024 |
|
|
|
|
|
Reported Change |
|
|
|
Organic Change1 |
|
|
|
|
|
|
|
|
|
|
|
|
|
|
|
|
| Net sales |
|
|
$ |
4,228 |
|
|
$ |
4,178 |
|
|
|
|
|
|
(1 |
%) |
|
|
|
(1 |
%) |
| Cost of sales |
|
|
$ |
1,734 |
|
|
$ |
1,652 |
|
|
|
|
|
|
(5 |
%) |
|
|
|
(7 |
%) |
| Gross profit |
|
|
$ |
2,494 |
|
|
$ |
2,526 |
|
|
|
|
|
|
1 |
% |
|
|
|
2 |
% |
| Advertising |
|
|
$ |
506 |
|
|
$ |
529 |
|
|
|
|
|
|
4 |
% |
|
|
|
2 |
% |
| SG&A |
|
|
$ |
742 |
|
|
$ |
826 |
|
|
|
|
|
|
11 |
% |
|
|
|
7 |
% |
Gain on business divestitures |
|
|
$ |
— |
|
|
$ |
(267) |
|
|
|
|
|
|
nm4 |
|
|
|
nm4 |
| Other expense (income), net |
|
|
$ |
119 |
|
|
$ |
24 |
|
|
|
|
|
|
nm4 |
|
|
|
nm4 |
| Operating income |
|
|
$ |
1,127 |
|
|
$ |
1,414 |
|
|
|
|
|
|
25 |
% |
|
|
|
(2 |
%) |
|
|
|
|
|
|
|
|
|
|
|
|
|
|
|
|
Total operating expenses2 |
|
|
$ |
1,367 |
|
|
$ |
1,379 |
|
|
|
|
|
|
1 |
% |
|
|
|
7 |
% |
|
|
|
|
|
|
|
|
|
|
|
|
|
|
|
|
As a percentage of net sales3 |
|
|
|
|
|
|
|
|
|
|
|
|
|
|
|
| Gross profit |
|
|
59.0 |
% |
|
60.5 |
% |
|
|
|
|
|
1.5 |
pp |
|
|
|
|
|
|
|
|
|
|
|
|
|
|
|
|
|
|
|
|
| Operating income |
|
|
26.7 |
% |
|
33.8 |
% |
|
|
|
|
|
7.2 |
pp |
|
|
|
|
|
|
|
|
|
|
|
|
|
|
|
|
|
|
|
|
| Interest expense, net |
|
|
$ |
81 |
|
|
$ |
113 |
|
|
|
|
|
|
40 |
% |
|
|
|
|
| Effective tax rate |
|
|
23.0 |
% |
|
21.2 |
% |
|
|
|
|
|
(1.8 |
pp) |
|
|
|
|
| Diluted earnings per share |
|
|
$ |
1.63 |
|
|
$ |
2.14 |
|
|
|
|
|
|
32 |
% |
|
|
|
|
Return on average invested capital1 |
|
|
15.3 |
% |
|
17.3 |
% |
|
|
|
|
|
2.0 |
pp |
|
|
|
|
| Note: Results may differ due to rounding |
|
|
|
|
|
|
|
|
|
|
|
|
|
|
|
1See “Non-GAAP Financial Measures” above for details on our use of “organic change” and “return on average invested capital,” including how we calculate these measures and why we think this information is useful to readers.
2Operating expenses include advertising expense, SG&A expense, and other expense (income), net.
3Year-over-year changes in percentages are reported in percentage points (pp).
4Percentage change is not meaningful.
Results of Operations
Fiscal 2024 Market Highlights
The following table shows net sales results for our top markets, summarized by geographic area, for fiscal 2024 compared to fiscal 2023. We discuss results of the markets most affecting our performance below the table.
|
|
|
|
|
|
|
|
|
|
|
|
|
|
|
|
|
|
|
|
|
|
|
|
|
|
|
|
|
|
|
Top Markets |
|
|
|
|
Net Sales % Change vs. 2023 |
Geographic area1 |
|
% of Fiscal 2024 Net Sales |
|
Reported |
Acquisitions and Divestitures |
JDCC2 |
Foreign Exchange |
|
|
Organic3 |
| United States |
|
45 |
% |
|
(4 |
%) |
— |
% |
— |
% |
— |
% |
|
|
(4 |
%) |
| Developed International |
|
28 |
% |
|
(2 |
%) |
(2 |
%) |
— |
% |
— |
% |
|
|
(5 |
%) |
| Germany |
|
6 |
% |
|
10 |
% |
(1 |
%) |
— |
% |
(2 |
%) |
|
|
7 |
% |
| Australia |
|
5 |
% |
|
(8 |
%) |
— |
% |
— |
% |
2 |
% |
|
|
(6 |
%) |
| United Kingdom |
|
4 |
% |
|
(11 |
%) |
(1 |
%) |
— |
% |
(2 |
%) |
|
|
(14 |
%) |
| France |
|
3 |
% |
|
— |
% |
(2 |
%) |
— |
% |
(1 |
%) |
|
|
(3 |
%) |
| Canada |
|
1 |
% |
|
2 |
% |
(1 |
%) |
— |
% |
1 |
% |
|
|
2 |
% |
| Spain |
|
1 |
% |
|
2 |
% |
(1 |
%) |
— |
% |
(2 |
%) |
|
|
(1 |
%) |
| Rest of Developed International |
|
7 |
% |
|
(4 |
%) |
(6 |
%) |
— |
% |
— |
% |
|
|
(9 |
%) |
| Emerging |
|
21 |
% |
|
5 |
% |
1 |
% |
— |
% |
2 |
% |
|
|
8 |
% |
| Mexico |
|
7 |
% |
|
19 |
% |
— |
% |
— |
% |
(13 |
%) |
|
|
6 |
% |
| Poland |
|
3 |
% |
|
15 |
% |
3 |
% |
— |
% |
(6 |
%) |
|
|
11 |
% |
| Brazil |
|
2 |
% |
|
5 |
% |
— |
% |
— |
% |
(2 |
%) |
|
|
3 |
% |
| Rest of Emerging |
|
9 |
% |
|
(6 |
%) |
2 |
% |
— |
% |
14 |
% |
|
|
10 |
% |
| Travel Retail |
|
4 |
% |
|
8 |
% |
(1 |
%) |
— |
% |
— |
% |
|
|
6 |
% |
| Non-branded and bulk |
|
2 |
% |
|
(2 |
%) |
— |
% |
— |
% |
— |
% |
|
|
(2 |
%) |
| Total |
|
100 |
% |
|
(1 |
%) |
(1 |
%) |
— |
% |
— |
% |
|
|
(1 |
%) |
| Note: Results may differ due to rounding |
|
|
|
|
|
|
|
|
|
|
1See “Definitions” above for definitions of market aggregations presented here.
2"JDCC” is included in the Other Items Non-GAAP Financial Measure. See Presentation Basis above for additional details.
3See “Non-GAAP Financial Measures” above for details on our use of “organic change” in net sales, including how we calculate this measure and why we believe this information is useful to readers.
The United States’ reported net sales declined 4%, driven by lower volumes largely reflecting an estimated net decrease in distributor inventories. The decline was partially offset by higher prices across our portfolio, led by el Jimador and Woodford Reserve, and the growth of our super-premium Jack Daniel’s expressions.
Developed International
•Germany’s reported net sales increased 10%, led by the launch of the Jack Daniel’s & Coca-Cola RTD, the positive effect of foreign exchange, and the acquisitions of Diplomático and Gin Mare, partially offset by lower volumes of Jack Daniel’s & Cola.
•Australia’s reported net sales declined 8%, led by lower volumes of JD RTDs and the negative effect of foreign exchange, partially offset by higher prices for JD RTDs.
•The United Kingdom’s reported net sales declined 11%, driven by lower volumes of Jack Daniel’s & Cola, which we previously distributed, due to the introduction of the Jack Daniel’s & Coca-Cola RTD that we do not distribute in this market, as well as lower JDTW volumes. The decline was partially offset by the positive effect of foreign exchange.
•France’s reported net sales were flat due to JDTW declines, offset by the acquisition of Diplomático and the positive effect of foreign exchange.
•Reported net sales in the Rest of Developed International declined 4%, primarily driven by lower volumes across our portfolio in Japan due to an estimated net decrease in distributor inventories in preparation for the transition to owned distribution beginning April 1, 2024. This decline was partially offset by the acquisitions of Gin Mare and Diplomático.
Emerging
•Mexico’s reported net sales increased 19%, driven by the positive effect of foreign exchange and higher prices of New Mix.
•Poland’s reported net sales increased 15%, led by favorable price/mix and higher volumes of JDTW, as well as the positive effect of foreign exchange.
•Brazil’s reported net sales increased 5%, driven by higher volumes of JDTA along with the positive effect of foreign exchange. These gains were partially offset by lower volumes of JDTW, reflecting an estimated net decrease in distributor inventories, and JD RTD declines.
•Reported net sales in the Rest of Emerging declined 6%, driven by the negative effect of foreign exchange, reflecting the strengthening of the dollar primarily against the Turkish lira, and lower JDTW volumes in the United Arab Emirates due to a net decrease in distributor inventories. These declines were partially offset by JDTW growth in Türkiye.
Travel Retail’s reported net sales increased 8%, driven by growth of our super-premium American whiskey portfolio and the acquisitions of Gin Mare and Diplomático. An estimated net increase in distributor inventories positively impacted reported net sales.
Fiscal 2024 Brand Highlights
The following table highlights the global results of our top brands for fiscal 2024 compared to fiscal 2023. We discuss results of the brands most affecting our performance below the table.
|
|
|
|
|
|
|
|
|
|
|
|
|
|
|
|
|
|
|
|
|
|
|
|
|
|
|
|
Top Brands |
|
|
|
Net Sales % Change vs. 2023 |
Product category / brand family / brand1 |
|
|
|
|
|
|
Reported |
Acquisitions & Divestitures |
JDCC2 |
Foreign Exchange |
|
|
Organic3 |
| Whiskey |
|
|
|
|
|
|
(3 |
%) |
— |
% |
— |
% |
1 |
% |
|
|
(2 |
%) |
| JDTW |
|
|
|
|
|
|
(6 |
%) |
— |
% |
— |
% |
2 |
% |
|
|
(5 |
%) |
| JDTH |
|
|
|
|
|
|
(8 |
%) |
— |
% |
— |
% |
— |
% |
|
|
(8 |
%) |
| Gentleman Jack |
|
|
|
|
|
|
(10 |
%) |
— |
% |
— |
% |
2 |
% |
|
|
(9 |
%) |
| JDTA |
|
|
|
|
|
|
32 |
% |
— |
% |
— |
% |
1 |
% |
|
|
33 |
% |
| JDTF |
|
|
|
|
|
|
(11 |
%) |
— |
% |
— |
% |
— |
% |
|
|
(11 |
%) |
| Woodford Reserve |
|
|
|
|
|
|
2 |
% |
— |
% |
— |
% |
— |
% |
|
|
3 |
% |
| Old Forester |
|
|
|
|
|
|
11 |
% |
— |
% |
— |
% |
— |
% |
|
|
11 |
% |
| Rest of Whiskey |
|
|
|
|
|
|
15 |
% |
— |
% |
— |
% |
1 |
% |
|
|
16 |
% |
| Ready-to-Drink |
|
|
|
|
|
|
2 |
% |
— |
% |
1 |
% |
(4 |
%) |
|
|
— |
% |
| JD RTD/RTP |
|
|
|
|
|
|
(6 |
%) |
— |
% |
1 |
% |
— |
% |
|
|
(5 |
%) |
| New Mix |
|
|
|
|
|
|
32 |
% |
— |
% |
— |
% |
(15 |
%) |
|
|
17 |
% |
|
|
|
|
|
|
|
|
|
|
|
|
|
|
| Tequila |
|
|
|
|
|
|
(4 |
%) |
— |
% |
— |
% |
(3 |
%) |
|
|
(7 |
%) |
| el Jimador |
|
|
|
|
|
|
— |
% |
— |
% |
— |
% |
(1 |
%) |
|
|
(1 |
%) |
| Herradura |
|
|
|
|
|
|
(10 |
%) |
— |
% |
— |
% |
(3 |
%) |
|
|
(13 |
%) |
|
|
|
|
|
|
|
|
|
|
|
|
|
|
| Wine |
|
|
|
|
|
|
— |
% |
— |
% |
— |
% |
— |
% |
|
|
— |
% |
| Vodka (Finlandia) |
|
|
|
|
|
|
(16 |
%) |
19 |
% |
— |
% |
1 |
% |
|
|
3 |
% |
| Rest of Portfolio |
|
|
|
|
|
|
61 |
% |
(49 |
%) |
— |
% |
3 |
% |
|
|
15 |
% |
| Non-branded and bulk |
|
|
|
|
|
|
(2 |
%) |
— |
% |
— |
% |
— |
% |
|
|
(2 |
%) |
| Note: Results may differ due to rounding |
|
|
|
|
|
|
|
|
|
|
|
|
1See “Definitions” above for definitions of brand aggregations presented here.
2"JDCC” is included in the Other Items Non-GAAP Financial Measure. See Presentation Basis above for additional details.
3See “Non-GAAP Financial Measures” above for details on our use of “organic change” in net sales, including how we calculate this measure and why we believe this information is useful to readers.
Whiskey
•Reported net sales for JDTW decreased 6%, led by declines in Japan, the United States, the United Arab Emirates, and Sub-Saharan Africa, along with the negative effect of foreign exchange, primarily reflecting the strengthening of the dollar against the Turkish lira. These declines were partially offset by higher prices and volumes in Türkiye. An estimated net decrease in distributor inventories negatively impacted reported net sales.
•Reported net sales for JDTH declined 8%, driven by lower volumes in the United States largely reflecting an estimated net decrease in distributor inventories.
•Reported net sales for Gentleman Jack declined 10%, driven by lower volumes in the United States, largely due to an estimated net decrease in distributor inventories, and the negative effect of foreign exchange. The decline was partially offset by higher prices in Türkiye.
•Reported net sales for JDTA increased 32%, led by higher volumes in Brazil and the continued product launch in South Korea.
•Reported net sales for JDTF declined 11%, driven by lower volumes in the United States largely reflecting an estimated net decrease in distributor inventories.
•Woodford Reserve reported net sales increased 2%, driven by favorable price/mix, partially offset by lower volumes in the United States reflecting an estimated net decrease in distributor inventories.
•Old Forester reported net sales increased 11%, driven by favorable price/mix and higher volumes in the United States. An estimated net decrease in distributor inventories negatively impacted reported net sales.
•Reported net sales for Rest of Whiskey increased 15%, led by the growth of our other super-premium Jack Daniel's expressions and Glenglassaugh old and rare cask sales.
Ready-to-Drink
•The JD RTD/RTP brands reported net sales declined 6%, led by lower volumes of Jack Daniel’s & Cola RTD, partially offset by the continued launch of the Jack Daniel’s & Coca-Cola RTD. An estimated net decrease in distributor inventories in the United States negatively impacted reported net sales.
•New Mix grew reported net sales 32%, driven by the positive effect of foreign exchange and higher prices in Mexico.
Tequila
•el Jimador’s reported net sales were flat, driven by lower volumes in Mexico and the United States, offset by higher prices led by the United States and the positive effect of foreign exchange.
•Herradura reported net sales declined 10%, driven by lower volumes in the United States and Mexico, partially offset by the positive effect of foreign exchange. An estimated net decrease in distributor inventories negatively impacted reported net sales.
Wine reported net sales were flat as Korbel California Champagne declines in the United States were offset by higher volumes of Sonoma-Cutrer. An estimated net increase in distributor inventories positively impacted reported net sales. During the fourth quarter of fiscal 2024, we sold our Sonoma-Cutrer wine business. See Note 14 to the Condensed Consolidated Financial Statements and Non-GAAP Financial Measures above for details.
Vodka (Finlandia) reported net sales declined 16%, due to lower volumes. During the third quarter of fiscal 2024, we sold our Finlandia vodka business. See Note 14 to the Condensed Consolidated Financial Statements and Non-GAAP Financial Measures above for details.
Rest of Portfolio reported net sales increased 61%, largely driven by the acquisitions of Diplomático and Gin Mare.
Year-Over-Year Comparisons
Commentary below compares fiscal 2024 to fiscal 2023 results. A comparison of fiscal 2023 to fiscal 2022 results may be found in “Part II, Item 7, Management's Discussion and Analysis of Financial Condition and Results of Operations” of our Annual Report on Form 10-K for the fiscal year ended April 30, 2023 (2023 Form 10-K).
|
|
|
|
|
|
|
|
|
|
|
|
|
|
Net Sales |
|
|
|
|
|
2024 |
| Percentage change versus the prior fiscal year ended April 30 |
|
|
Volume |
Price/mix |
Total |
| Change in reported net sales |
|
|
(9 |
%) |
8 |
% |
(1 |
%) |
| Acquisitions and divestitures |
|
|
— |
% |
(1 |
%) |
(1 |
%) |
JDCC1 |
|
|
1 |
% |
(1 |
%) |
— |
% |
| Foreign exchange |
|
|
— |
% |
— |
% |
— |
% |
| Change in organic net sales |
|
|
(8 |
%) |
6 |
% |
(1 |
%) |
|
|
|
|
|
|
|
|
|
|
|
|
|
|
|
|
|
|
|
|
|
|
|
|
|
|
|
|
|
|
|
|
|
|
|
|
|
|
|
|
|
|
| Note: Results may differ due to rounding |
|
|
|
|
|
1“JDCC” is included in the Other Items Non-GAAP Financial Measure. See Presentation Basis above for additional details.
Reported net sales of $4.2 billion decreased 1%, or $50 million, in fiscal 2024 compared to fiscal 2023, driven by lower volumes, largely offset by favorable price/mix and the positive effect of acquisitions and divestitures. Lower volumes were led by Jack Daniel’s & Cola, due to the introduction of the Jack Daniel’s & Coca-Cola RTD, and JDTW, reflecting an estimated net decrease in distributor inventories. Price/mix largely reflects higher prices across much of our portfolio, led by JDTW, most notably in Türkiye in response to high inflation and currency devaluation. See “Results of Operations - Fiscal 2024 Market Highlights” and “Results of Operations - Fiscal 2024 Brand Highlights” above for details on the factors contributing to the change in reported net sales for fiscal 2024.
|
|
|
|
|
|
|
|
|
|
|
|
|
|
Cost of Sales |
|
|
|
|
|
2024 |
| Percentage change versus the prior fiscal year ended April 30 |
|
|
Volume |
Cost/mix |
Total |
| Change in reported cost of sales |
|
|
(9 |
%) |
4 |
% |
(5 |
%) |
| Acquisitions and divestitures |
|
|
— |
% |
(1 |
%) |
(1 |
%) |
JDCC1 |
|
|
1 |
% |
— |
% |
— |
% |
| Foreign exchange |
|
|
— |
% |
(2 |
%) |
(2 |
%) |
| Change in organic cost of sales |
|
|
(8 |
%) |
1 |
% |
(7 |
%) |
| Note: Results may differ due to rounding |
|
|
|
|
|
1“JDCC” is included in the Other Items Non-GAAP Financial Measure. See Presentation Basis above for additional details.
Reported cost of sales of $1.7 billion decreased $82 million, or 5%, in fiscal 2024 compared to fiscal 2023, driven by lower volumes partially offset by cost/mix. Lower volumes were led by Jack Daniel’s & Cola, due to the introduction of the Jack Daniel’s & Coca-Cola RTD, and JDTW, reflecting an estimated net decrease in distributor inventories. Cost/mix reflects (a) higher input costs, (b) the negative effect of foreign exchange, and (c) the negative effect of acquisitions and divestitures, partially offset by the absence of the significant prior year supply chain disruption related costs.
|
|
|
|
|
|
|
|
Gross Profit |
| Percentage change versus the prior fiscal year ended April 30 |
|
|
2024 |
| Change in reported gross profit |
|
|
1 |
% |
| Acquisitions and divestitures |
|
|
— |
% |
JDCC1 |
|
|
— |
% |
| Foreign exchange |
|
|
2 |
% |
| Change in organic gross profit |
|
|
2 |
% |
| Note: Results may differ due to rounding |
|
|
|
1“JDCC” is included in the Other Items Non-GAAP Financial Measure. See Presentation Basis above for additional details.
|
|
|
|
|
|
|
|
|
|
|
Gross Margin |
|
| Fiscal year ended April 30 |
|
|
2024 |
|
| Prior year gross margin |
|
|
59.0 |
% |
|
| Price/mix |
|
|
2.8 |
% |
|
| Cost (excluding tariffs) |
|
|
(0.5 |
%) |
|
|
|
|
|
|
|
|
|
|
|
|
|
|
|
|
| Foreign exchange |
|
|
(0.8 |
%) |
|
Other1 |
|
|
0.1 |
% |
|
| Change in gross margin |
|
|
1.5 |
% |
|
| Current year gross margin |
|
|
60.5 |
% |
|
| Note: Results may differ due to rounding |
|
|
|
|
1“Other” comprises the impact of acquisitions and divestitures, tariffs, and JDCC, which is included in the Other Items Non-GAAP Financial Measure (see Presentation Basis above for additional details).
Reported gross profit of $2.5 billion increased $32 million, or 1%, in fiscal 2024 compared to fiscal 2023. Gross margin increased to 60.5% in fiscal 2024, up 1.5 percentage points from 59.0% in fiscal 2023. The increase in gross margin was primarily driven by favorable price/mix and lower supply chain disruption related costs, partially offset by higher input costs and the negative effect of foreign exchange.
|
|
|
|
|
|
|
|
|
|
|
|
|
|
|
|
|
|
|
|
|
|
Operating Expenses |
| Percentage change versus the prior fiscal year ended April 30 |
| 2024 |
Reported |
Acquisitions & Divestitures |
Impairment |
Foundation1 |
Foreign Exchange |
|
Organic |
|
|
|
|
|
|
|
|
|
|
|
|
|
|
|
|
|
|
|
|
|
|
|
|
|
|
|
|
|
|
|
|
|
|
|
|
|
|
|
|
|
|
|
|
|
|
|
|
| Advertising |
4 |
% |
(2 |
%) |
— |
% |
— |
% |
(1 |
%) |
|
2 |
% |
| SG&A |
11 |
% |
— |
% |
— |
% |
(3 |
%) |
(1 |
%) |
|
7 |
% |
|
|
|
|
|
|
|
|
Total operating expenses2 |
1 |
% |
2 |
% |
8 |
% |
(2 |
%) |
(1 |
%) |
|
7 |
% |
| Note: Results may differ due to rounding |
|
|
|
|
|
|
|
1“Foundation” is included in the Other Items Non-GAAP Financial Measure. See Presentation Basis above for additional details.
2Operating expenses include advertising expense, SG&A expense, and other expense (income), net.
Reported operating expenses totaled $1.4 billion, an increase of $12 million, or 1%, in fiscal 2024 compared to fiscal 2023. The increase in reported operating expenses was driven by elevated SG&A expense, advertising expense growth, and the negative effect of foreign exchange. The increase was largely offset by the absence of a non-cash impairment charge for the Finlandia brand name in the prior year, as well as the absence of post-closing costs and expenses in connection with the acquisitions of Diplomático and Gin Mare in the prior year.
•Reported advertising expenses increased 4% in fiscal 2024, driven by increased investment in JDTW, advertising expense for the recently acquired Gin Mare and Diplomático brands, and advertising expense associated with the launch of Jack Daniel’s & Coca-Cola RTD.
•Reported SG&A expenses increased 11% in fiscal 2024, led by higher compensation and benefit-related expenses and the commitment to the Foundation and Dendrifund.
|
|
|
|
|
|
|
|
Operating Income |
| Percentage change versus the prior fiscal year ended April 30 |
|
|
2024 |
| Change in reported operating income |
|
|
25 |
% |
| Acquisitions and divestitures |
|
|
(27 |
%) |
| Impairment charges |
|
|
(7 |
%) |
Other items1 |
|
|
2 |
% |
|
|
|
|
| Foreign exchange |
|
|
4 |
% |
| Change in organic operating income |
|
|
(2 |
%) |
| Note: Results may differ due to rounding |
|
|
|
1Other Items include “JDCC” and “Foundation”. See “Non-GAAP Financial Measures” above for additional details.
Reported operating income was $1.4 billion in fiscal 2024, an increase of $287 million, or 25%, compared to fiscal 2023. Operating margin increased 7.2 percentage points to 33.8% in fiscal 2024 from 26.7% in fiscal 2023, driven primarily by the positive effect of acquisitions and divestitures (gains on sale of the Finlandia vodka business and the Sonoma-Cutrer wine business), favorable price/mix, the absence of the prior year period Finlandia non-cash impairment, and lower supply chain disruption related costs, partially offset by operating expense growth, the negative effect of foreign exchange, and the commitment to the Foundation and Dendrifund.
Interest expense (net) increased $32 million, or 40%, in fiscal 2024 compared to fiscal 2023, due to a higher average debt balances and higher average interest rates on borrowings..
Our effective tax rate for fiscal 2024 was 21.2% compared to 23.0% in fiscal 2023. The decrease in our effective tax rate was driven primarily by the decreased impact of foreign operations and state taxes and the beneficial impact of tax rate differences on the sale of the Finlandia vodka business, which was partially offset by the absence of the net benefit from the reversal of the valuation allowances and the impact of the prior fiscal year tax true-ups in fiscal 2024. See Note 12 to the Consolidated Financial Statements for details.
Diluted earnings per share were $2.14 in fiscal 2024, an increase of 32% compared to fiscal 2023, driven primarily by the increase in reported operating income.
Fiscal 2025 Outlook
Below we discuss our outlook for fiscal 2025, which reflects the trends, developments, and uncertainties (including those described above) that we expect to affect our business.
We anticipate a return to growth for organic net sales and organic operating income in fiscal 2025 driven by gains in international markets and the benefit of normalizing inventory trends. This outlook is tempered by our belief that global macroeconomic and geopolitical uncertainties will continue to create a challenging operating environment. Accordingly, we expect the following in fiscal 2025:
•Organic net sales growth in the 2% to 4% range.
•Organic operating income growth in the 2% to 4% range.
•Our effective tax rate to be in the range of approximately 21% to 23%.
•Capital expenditures planned to be in the range of $195 to $205 million.
Liquidity and Capital Resources
We generate strong cash flows from operations, which enable us to meet current obligations, fund capital expenditures, and return cash to our stockholders through regular dividends and, from time to time, through share repurchases and special dividends. We believe our investment-grade credit ratings (A1 by Moody's and A- by S&P) provide us with financial flexibility when accessing global debt capital markets and allow us to reserve adequate debt capacity for investment opportunities and unforeseen events.
Our operating cash flows are supplemented by cash and cash equivalent balances, as well as access to other liquidity sources. Cash and cash equivalents were $374 million at April 30, 2023, and $446 million at April 30, 2024. As of April 30, 2024, approximately 50% of our cash and cash equivalents were held by our foreign subsidiaries whose earnings we expect to reinvest indefinitely outside of the United States.
We continue to evaluate our future cash deployment and may decide to repatriate additional cash held by our foreign subsidiaries. This may require us to provide for and pay additional taxes.
We have a $900 million commercial paper program that we use, together with our cash flow from operations, to fund our short-term operational needs. See Note 7 to the Consolidated Financial Statements for outstanding commercial paper balances, interest rates, and days to maturity at April 30, 2023 and April 30, 2024. The average balances, interest rates, and original maturities during 2023 and 2024 are presented below.
|
|
|
|
|
|
|
|
|
|
|
|
|
|
|
|
|
|
|
|
|
|
|
|
| (Dollars in millions) |
|
|
|
|
2023 |
|
2024 |
| Average commercial paper |
|
|
|
|
$ |
158 |
|
|
$ |
475 |
|
| Average interest rate |
|
|
|
|
4.69 |
% |
|
5.46 |
% |
| Average days to maturity at issuance |
|
|
|
|
41 |
|
|
32 |
|
Our commercial paper program is supported by available commitments under our undrawn $900 million bank credit facility that expires on May 26, 2028. Although unlikely, under extreme market conditions, one or more participating banks may not be able to fund its commitments under our credit facility. To manage this counterparty credit risk, we partner with banks that have investment grade credit ratings, limit the amount of exposure we have with each bank, and monitor each bank’s financial conditions.
Our most significant short-term cash requirements relate primarily to funding our operations (such as expenditures for raw materials, production and distribution, advertising and promotion, and current taxes), dividend payments, and capital investments. Our most significant longer-term cash requirements primarily include payments related to our long-term debt, employee benefit obligations, and deferred tax liabilities (see Notes 7, 10, and 12 to the Consolidated Financial Statements).
While we expect to meet our planned short-term liquidity needs largely through cash generated from operations and borrowings under our commercial paper program, a sustained market deterioration resulting in declines in net sales and profit could require us to evaluate alternative sources of liquidity. If we have additional liquidity needs, we believe that we could access financing in the debt capital markets.
We believe our current liquidity position, supplemented by our ability to generate positive cash flows from operations in the future, and our ample debt capacity enabled by our strong short-term and long-term credit ratings, will be sufficient to meet all of our future financial commitments.
Cash Flow Summary
The following table summarizes our cash flows for each of the last two fiscal years:
|
|
|
|
|
|
|
|
|
|
|
|
|
|
|
|
|
|
| (Dollars in millions) |
|
|
|
2023 |
|
2024 |
| Cash flows from operating activities |
|
|
|
$ |
640 |
|
|
$ |
647 |
|
|
|
|
|
|
|
|
| Investing activities: |
|
|
|
|
|
|
Proceeds from business divestitures |
|
|
|
$ |
— |
|
|
$ |
246 |
|
Business acquisitions |
|
|
|
(1,195) |
|
|
— |
|
| Additions to property, plant, and equipment |
|
|
|
(183) |
|
|
(228) |
|
|
|
|
|
|
|
|
|
|
|
|
|
|
|
| Other |
|
|
|
23 |
|
|
31 |
|
| Net cash flows from investing activities |
|
|
|
$ |
(1,355) |
|
|
$ |
49 |
|
|
|
|
|
|
|
|
| Financing activities: |
|
|
|
|
|
|
| Net change in short-term borrowings |
|
|
|
$ |
234 |
|
|
$ |
192 |
|
| Net proceeds from long-term debt |
|
|
|
398 |
|
|
— |
|
| Acquisition of treasury stock |
|
|
|
|
|
(400) |
|
|
|
|
|
|
|
|
|
|
|
|
|
|
|
| Dividends paid |
|
|
|
(378) |
|
|
(404) |
|
| Other |
|
|
|
(15) |
|
|
(6) |
|
| Net cash flows from financing activities |
|
|
|
$ |
239 |
|
|
$ |
(618) |
|
|
|
|
|
|
|
|
|
|
|
|
|
|
|
|
|
|
|
|
|
|
|
|
|
|
|
|
|
Cash provided by operations of $647 million during fiscal 2024 increased $7 million from fiscal 2023, primarily reflecting a smaller increase in cash used for working capital compared to the prior fiscal year.
Cash provided by investing activities was $49 million during fiscal 2024, compared to $1,355 million used for investing activities during fiscal 2023. The $1,404 million change largely reflects $1,195 million in cash used to acquire Gin Mare and Diplomático during fiscal 2023 and proceeds of $246 million received from the divestitures of Finlandia and Sonoma-Cutrer during fiscal 2024. The change also reflects a $45 million increase in capital expenditures, due largely to additional capital spending on projects to expand the capacity of our whiskey and tequila production facilities during fiscal 2024.
Cash used for financing activities was $618 million during fiscal 2024, compared to $239 million in cash provided by financing activities during fiscal 2023. The $857 million change largely reflects a $400 million increase in share repurchases, a $398 million decrease in net proceeds from long-term debt, a $42 million decrease in net proceeds from short-term borrowings, and a $26 million increase in dividend payments.
A discussion of our cash flows for fiscal 2023 compared to fiscal 2022 may be found in “Part II, Item 7, Management's Discussion and Analysis of Financial Condition and Results of Operations,” of our 2023 Form 10-K.
Dividends
In November 2023, our Board of Directors approved a 6% increase in the quarterly cash dividend on our Class A and Class B common stock from $0.2055 per share to $0.2178 per share, effective with the regular quarterly dividend paid on January 2, 2024. As a result, the indicated annual cash dividend increased from $0.8220 per share to $0.8712 per share.
On May 23, 2024, our Board of Directors declared a regular quarterly cash dividend on our Class A and Class B common stock of $0.2178 per share. The dividend is payable on July 1, 2024, to stockholders of record on June 7, 2024.
Share Repurchases
In October 2023, our Board of Directors authorized the repurchase of up to $400 million (excluding brokerage fees and excise taxes) of outstanding shares of Class A and Class B common stock from October 2, 2023, through October 1, 2024 (the Repurchase Program), subject to market and other conditions.
Under the Repurchase Program, we repurchased 175,632 Class A shares at an average price of $59.35 per share and 6,736,658 Class B shares at an average price of $57.83 per share, for a total cost of $400 million. The program was completed in December 2023.
Critical Accounting Policies and Estimates
Our financial statements reflect some estimates involved in applying the following critical accounting policies that entail uncertainties and subjectivity. Using different estimates or policies could have a material effect on our operating results and financial condition.
Brand Names and Trademarks
When we acquire a business, we allocate the purchase price to the assets and liabilities of the acquired business, including intangible brand names and trademarks (“brand names”), based on estimated fair value. We do not amortize our brand names, all of which we consider to have indefinite lives.
We assess our brand names for impairment at least annually, or more frequently if circumstances indicate the carrying amount may be impaired. A brand name is impaired when its carrying amount exceeds its estimated fair value, in which case we write down the brand name to its estimated fair value. We estimate the fair value of a brand name using the relief-from-royalty method. We also consider market values for similar assets when available. Considerable management judgment is necessary to estimate fair value, including making assumptions about future cash flows, net sales, discount rates, and royalty rates.
We have the option, before quantifying the fair value of a brand name, to evaluate qualitative factors to assess whether it is more likely than not that the brand name is impaired. If we determine that is not the case, then we are not required to quantify the fair value. That assessment also takes considerable management judgment.
Based on our assumptions, we believe none of our brand names are impaired as of April 30, 2024. The carrying amounts of the recently-acquired Gin Mare and Diplomático brand names approximate their fair values, based on the relief-from-royalty method, using current assumptions. Reasonably possible changes in those assumptions could result in future impairment of either of those brand names. For example, we estimate that, all else equal, a 15% decline in projected net sales would result in an impairment charge of $25 million for the Gin Mare brand name and $35 million for the Diplomático brand name. We also estimate that, all else equal, a 1 percentage point increase in the discount rate would result in an impairment charge of $29 million for the Gin Mare brand name and $44 million for the Diplomático brand name.
We estimate that the fair values of our other brand names substantially exceed their carrying amounts.
Pension and Other Postretirement Benefits
We sponsor various defined benefit pension plans and postretirement plans providing retiree health care and retiree life insurance benefits. Benefits are based on factors such as years of service and compensation level during employment. We expense the benefits expected to be paid over employees' expected service. This requires us to make assumptions to determine the net benefit costs and obligations, such as discount rates, return on plan assets, the rate of salary increases, expected service, and health care cost trend rates. We review these assumptions annually and modify them based on current rates and trends when appropriate. The assumptions also reflect our historical experience and management's best judgment regarding future expectations. We believe the discount rates and expected return on plan assets are the most significant assumptions.
The discount rate used to measure the benefit obligations is determined at the beginning of each fiscal year using a yield curve based on the interest rates of high-quality debt securities with maturities corresponding to the expected timing of our benefit payments. The service cost and interest cost components are measured by applying the specific spot rates along that yield curve. The expected return on pension plan assets reflects expected capital market returns for each asset class that are based on historical returns, adjusted for the expected effects of diversification.
The following table compares the assumed discount rates and expected return on assets used in determining net periodic benefit cost for fiscal 2024 to those to be used in determining that cost for fiscal 2025.
|
|
|
|
|
|
|
|
|
|
|
|
|
|
|
|
|
|
|
|
|
|
|
|
| |
Pension Benefits |
|
Medical and Life
Insurance Benefits |
| |
2024 |
|
2025 |
|
2024 |
|
2025 |
| Discount rate for service cost |
4.98 |
% |
|
5.75 |
% |
|
5.02 |
% |
|
5.77 |
% |
| Discount rate for interest cost |
4.79 |
% |
|
5.59 |
% |
|
4.78 |
% |
|
5.58 |
% |
| Expected return on plan assets |
6.50 |
% |
|
6.50 |
% |
|
n/a |
|
n/a |
Using these assumptions, we estimate our pension and other postretirement benefit cost for fiscal 2025 will be approximately $18 million, compared to $21 million for fiscal 2024. Decreasing the assumed discount rates by 50 basis points would increase the total fiscal 2025 cost by approximately $4 million. Increasing the assumed discount rates by 50 basis points would decrease the total fiscal 2025 cost by approximately $2 million.
Decreasing/increasing the assumed return on plan assets by 50 basis points would increase/decrease the total fiscal 2025 cost by approximately $3 million.
Income Taxes
Significant judgment is required in evaluating our tax positions. We establish liabilities when some positions are likely to be challenged and may not succeed, despite our belief that our tax return positions are fully supportable. We adjust these liabilities in light of changing circumstances, such as the progress of a tax audit. We believe current liabilities are appropriate for all known contingencies, but this situation could change.
Years can elapse before we can resolve a particular matter for which we may have established a tax liability. Although predicting the final outcome or the timing of resolution of any particular tax matter can be difficult, we believe our liabilities reflect the likely outcome of known tax contingencies. Unfavorable settlement of any particular issue could require use of our cash and increase our effective tax rate. Conversely, a favorable resolution could result in reduced cash tax payments, the reversal of previously established liabilities, or some combination of these results, which could reduce our effective tax rate.
Item 7A. Quantitative and Qualitative Disclosures about Market Risk
Market risks
Our enterprise risk management process is intended to ensure that we take risks knowingly and thoughtfully and that we balance potential risks and rewards. Our integrated enterprise risk management framework is designed to identify, evaluate, communicate, and appropriately mitigate risks across our operations.
We face market risks arising from changes in foreign currency exchange rates, commodity prices, and interest rates. We manage market risks through procurement strategies as well as the use of derivative and other financial instruments. Our risk management program is governed by policies that authorize and control the nature and scope of transactions that we use to mitigate market risks. Our policy permits the use of derivative financial instruments to mitigate market risks but prohibits their use for speculative purposes.
Foreign currency exchange rate risk. Foreign currency fluctuations affect our net investments in foreign subsidiaries and foreign currency-denominated cash flows. In general, we expect our cash flows to be negatively affected by a stronger dollar and positively affected by a weaker dollar. Our most significant foreign currency exposures include the euro, the British pound, and the Australian dollar. We manage our foreign currency exposures through derivative financial instruments, principally foreign currency forward contracts, and debt denominated in foreign currency. We had outstanding currency derivatives with notional amounts totaling $747 million and $566 million at April 30, 2023 and 2024, respectively.
We estimate that a hypothetical 10% weakening of the dollar compared to exchange rates of hedged currencies as of April 30, 2024, would decrease the fair value of our then-existing foreign currency derivative contracts by approximately $45 million. This hypothetical change in fair value does not consider the expected inverse change in the underlying foreign currency exposures.
Commodity price risk. Commodity price changes can affect our production and supply chain costs. Our most significant commodities exposures include wood, corn, agave, malted barley, rye, and natural gas. We manage some of these exposures through forward purchase contracts.
Interest rate risk. Interest rate changes affect (a) the fair value of our fixed-rate debt, and (b) cash flows and earnings related to our variable-rate debt and interest-bearing investments. In addition to currently outstanding debt, any potential future debt offerings would be subject to interest rate risk.
As of April 30, 2024, our cash and cash equivalents ($446 million) and short-term commercial paper borrowings ($429 million) were exposed to interest rate changes. Based on the then-existing balances of our variable-rate debt and interest-bearing investments, a hypothetical one percentage point increase in interest rates would result in a negligible change in net interest expense.
See Notes 15 and 16 to the Consolidated Financial Statements for details on our foreign currency exchange rate risk. See “Critical Accounting Policies and Estimates” in “Item 7. Management's Discussion and Analysis of Financial Condition and Results of Operations” for a discussion of our pension and other postretirement plans' exposure to interest rate risks. Also see “Item 1A. Risk Factors” for details on how economic conditions affecting market risks also affect the demand for and pricing of our products and how we are affected by exchange rate fluctuations.
Item 8. Financial Statements and Supplementary Data
Reports of Management
Management’s Responsibility for Financial Statements
Our management is responsible for preparing, presenting, and ensuring the integrity of the financial information presented in this report. The consolidated financial statements were prepared in conformity with accounting principles generally accepted in the United States, including amounts based on management’s best estimates and judgments. In management’s opinion, the consolidated financial statements fairly present the Company’s financial position, results of operations, and cash flows.
The Audit Committee of the Board of Directors, comprising only independent directors, meets regularly with our external auditors, the independent registered public accounting firm Ernst & Young LLP (EY); with our internal auditors; and with representatives of management to review accounting, internal control structure, and financial reporting matters. Our internal auditors and EY have full access to the Audit Committee. As set forth in our Code of Conduct and Corporate Governance Guidelines, we are firmly committed to adhering to the highest standards of moral and ethical behavior in our business activities.
Management’s Report on Internal Control over Financial Reporting
Management is also responsible for establishing and maintaining adequate internal control over financial reporting, as defined in Rules 13a-15(f) and 15d-15(f) under the Securities Exchange Act of 1934, as amended. Our internal control over financial reporting is designed to provide reasonable assurance regarding the reliability of financial reporting and the preparation of financial statements for external purposes in accordance with accounting principles generally accepted in the United States. Because of its inherent limitations, internal control over financial reporting may not prevent or detect misstatements.
As of the end of our fiscal year, management conducted an assessment of the effectiveness of our internal control over financial reporting based on the framework and criteria in Internal Control – Integrated Framework (2013) issued by the Committee of Sponsoring Organizations of the Treadway Commission. Based on this assessment, management concluded that our internal control over financial reporting was effective as of April 30, 2024. EY, which audited and reported on the Company’s consolidated financial statements, has audited the effectiveness of our internal control over financial reporting as of April 30, 2024, as stated in their report.
|
|
|
|
|
|
|
|
|
|
|
|
| Dated: |
June 14, 2024 |
|
|
|
|
By: |
/s/ Lawson E. Whiting |
|
|
|
Lawson E. Whiting |
|
|
|
President and Chief Executive Officer |
|
|
|
|
|
|
|
|
|
|
By: |
/s/ Leanne D. Cunningham |
|
|
|
Leanne D. Cunningham |
|
|
|
Executive Vice President and Chief Financial Officer |
Report of Independent Registered Public Accounting Firm
To the Stockholders and the Board of Directors of Brown-Forman Corporation
Opinion on the Financial Statements
We have audited the accompanying consolidated balance sheets of Brown-Forman Corporation and Subsidiaries (the Company) as of April 30, 2024 and 2023, the related consolidated statements of operations, comprehensive income, stockholders’ equity and cash flows for each of the three years in the period ended April 30, 2024, and the related notes and financial statement schedule listed in the Index at Item 15(a)(2) (collectively referred to as the “consolidated financial statements”). In our opinion, the consolidated financial statements present fairly, in all material respects, the financial position of the Company at April 30, 2024 and 2023, and the results of its operations and its cash flows for each of the three years in the period ended April 30, 2024, in conformity with U.S. generally accepted accounting principles.
We also have audited, in accordance with the standards of the Public Company Accounting Oversight Board (United States) (PCAOB), the Company's internal control over financial reporting as of April 30, 2024, based on criteria established in Internal Control-Integrated Framework issued by the Committee of Sponsoring Organizations of the Treadway Commission (2013 framework), and our report dated June 14, 2024 expressed an unqualified opinion thereon.
Basis for Opinion
These financial statements are the responsibility of the Company's management. Our responsibility is to express an opinion on the Company’s financial statements based on our audits. We are a public accounting firm registered with the PCAOB and are required to be independent with respect to the Company in accordance with the U.S. federal securities laws and the applicable rules and regulations of the Securities and Exchange Commission and the PCAOB.
We conducted our audits in accordance with the standards of the PCAOB. Those standards require that we plan and perform the audit to obtain reasonable assurance about whether the financial statements are free of material misstatement, whether due to error or fraud. Our audits included performing procedures to assess the risks of material misstatement of the financial statements, whether due to error or fraud, and performing procedures that respond to those risks. Such procedures included examining, on a test basis, evidence regarding the amounts and disclosures in the financial statements. Our audits also included evaluating the accounting principles used and significant estimates made by management, as well as evaluating the overall presentation of the financial statements. We believe that our audits provide a reasonable basis for our opinion.
Critical Audit Matter
The critical audit matter communicated below is a matter arising from the current period audit of the financial statements that was communicated or required to be communicated to the audit committee and that: (1) relates to accounts or disclosures that are material to the financial statements and (2) involved our especially challenging, subjective or complex judgments. The communication of the critical audit matter does not alter in any way our opinion on the consolidated financial statements, taken as a whole, and we are not, by communicating the critical audit matter below, providing a separate opinion on the critical audit matter or on the account or disclosures to which it relates.
|
|
|
|
|
|
|
|
|
|
|
Valuation of Gin Mare and Diplomático Other Intangible Assets |
| Description of the Matter |
|
At April 30, 2024, the balance of the Company’s other intangible assets with indefinite lives was $990 million. As discussed in Notes 1 and 4 to the consolidated financial statements, other intangible assets with indefinite lives include intangible brand names and trademarks (“brand names”) and are assessed for impairment at least annually, or more frequently, if circumstances indicate the carrying amount may be impaired. The Company’s annual impairment test did not result in an impairment of the Gin Mare and Diplomático brand names indefinite-lived intangible assets. The Company estimated the fair value of the Gin Mare and Diplomático brand names indefinite-lived intangible assets using the relief-from-royalty method.
Auditing management’s estimate of the fair value of the Gin Mare and Diplomático brand names was complex due to the significant judgment required to determine the fair value of the brand names. The fair value estimates were sensitive to significant assumptions used in the valuation process, such as net sales, discount rates and royalty rates.
|
| How We Addressed the Matter in Our Audit |
|
We obtained an understanding, evaluated the design, and tested the operating effectiveness of controls that address the risks of material misstatement over the Company’s process to estimate the fair value of the the Gin Mare and Diplomático brand names, including controls over management’s review of the selection of assumptions, described above, used in the valuation models.
To test the estimated fair value of the Company’s Gin Mare and Diplomático brand names, we performed audit procedures that included, among others, assessing methodologies used in the valuation models and testing the significant assumptions discussed above. This included comparing the significant assumptions used by management to observable market data, current industry and economic trends, changes in the Company’s business model and customer base, historical operating results, and other relevant factors that would affect the significant assumptions. We assessed management’s historical estimates and performed sensitivity analyses of assumptions to evaluate the changes in the fair value of the brand names that would result from changes in the assumptions. We also involved valuation specialists to assist in evaluating valuation methodologies and certain assumptions used in the models.
|
/s/ Ernst & Young LLP
We have served as the Company’s auditor since 2020.
Louisville, Kentucky
June 14, 2024
Report of Independent Registered Public Accounting Firm
To the Stockholders and the Board of Directors of Brown-Forman Corporation
Opinion on Internal Control Over Financial Reporting
We have audited Brown-Forman Corporation and Subsidiaries’ internal control over financial reporting as of April 30, 2024, based on criteria established in Internal Control—Integrated Framework issued by the Committee of Sponsoring Organizations of the Treadway Commission (2013 framework), (the COSO criteria). In our opinion, Brown-Forman Corporation and Subsidiaries (the Company) maintained, in all material respects, effective internal control over financial reporting as of April 30, 2024, based on the COSO criteria.
We also have audited, in accordance with the standards of the Public Company Accounting Oversight Board (United States) (PCAOB), the consolidated balance sheets of the Company as of April 30, 2024 and 2023, the related consolidated statements of operations, comprehensive income, stockholders’ equity and cash flows for each of the three years in the period ended April 30, 2024, and the related notes and financial statement schedule listed in the Index at Item 15(a)(2) and our report dated June 14, 2024 expressed an unqualified opinion thereon.
Basis for Opinion
The Company’s management is responsible for maintaining effective internal control over financial reporting and for its assessment of the effectiveness of internal control over financial reporting included in the accompanying Management’s Report on Internal Control over Financial Reporting. Our responsibility is to express an opinion on the Company’s internal control over financial reporting based on our audit. We are a public accounting firm registered with the PCAOB and are required to be independent with respect to the Company in accordance with the U.S. federal securities laws and the applicable rules and regulations of the Securities and Exchange Commission and the PCAOB.
We conducted our audit in accordance with the standards of the PCAOB. Those standards require that we plan and perform the audit to obtain reasonable assurance about whether effective internal control over financial reporting was maintained in all material respects.
Our audit included obtaining an understanding of internal control over financial reporting, assessing the risk that a material weakness exists, testing and evaluating the design and operating effectiveness of internal control based on the assessed risk, and performing such other procedures as we considered necessary in the circumstances. We believe that our audit provides a reasonable basis for our opinion.
Definition and Limitations of Internal Control Over Financial Reporting
A company’s internal control over financial reporting is a process designed to provide reasonable assurance regarding the reliability of financial reporting and the preparation of financial statements for external purposes in accordance with generally accepted accounting principles. A company’s internal control over financial reporting includes those policies and procedures that (1) pertain to the maintenance of records that, in reasonable detail, accurately and fairly reflect the transactions and dispositions of the assets of the company; (2) provide reasonable assurance that transactions are recorded as necessary to permit preparation of financial statements in accordance with generally accepted accounting principles, and that receipts and expenditures of the company are being made only in accordance with authorizations of management and directors of the company; and (3) provide reasonable assurance regarding prevention or timely detection of unauthorized acquisition, use, or disposition of the company’s assets that could have a material effect on the financial statements.
Because of its inherent limitations, internal control over financial reporting may not prevent or detect misstatements. Also, projections of any evaluation of effectiveness to future periods are subject to the risk that controls may become inadequate because of changes in conditions, or that the degree of compliance with the policies or procedures may deteriorate.
/s/ Ernst & Young LLP
Louisville, Kentucky
June 14, 2024
Brown-Forman Corporation and Subsidiaries
Consolidated Statements of Operations
(Dollars in millions, except per share amounts)
|
|
|
|
|
|
|
|
|
|
|
|
|
|
|
|
|
|
| Year Ended April 30, |
2022 |
|
2023 |
|
2024 |
| Sales |
$ |
5,081 |
|
|
$ |
5,372 |
|
|
$ |
5,328 |
|
| Excise taxes |
1,148 |
|
|
1,144 |
|
|
1,150 |
|
| Net sales |
3,933 |
|
|
4,228 |
|
|
4,178 |
|
| Cost of sales |
1,542 |
|
|
1,734 |
|
|
1,652 |
|
| Gross profit |
2,391 |
|
|
2,494 |
|
|
2,526 |
|
| Advertising expenses |
438 |
|
|
506 |
|
|
529 |
|
| Selling, general, and administrative expenses |
690 |
|
|
742 |
|
|
826 |
|
|
|
|
|
|
|
Gain on business divestitures |
— |
|
|
— |
|
|
(267) |
|
| Other expense (income), net |
59 |
|
|
119 |
|
|
24 |
|
| Operating income |
1,204 |
|
|
1,127 |
|
|
1,414 |
|
| Non-operating postretirement expense |
13 |
|
|
29 |
|
|
3 |
|
| Interest income |
(5) |
|
|
(9) |
|
|
(14) |
|
| Interest expense |
82 |
|
|
90 |
|
|
127 |
|
| Income before income taxes |
1,114 |
|
|
1,017 |
|
|
1,298 |
|
| Income taxes |
276 |
|
|
234 |
|
|
274 |
|
| Net income |
$ |
838 |
|
|
$ |
783 |
|
|
$ |
1,024 |
|
| Earnings per share: |
|
|
|
|
|
| Basic |
$ |
1.75 |
|
|
$ |
1.63 |
|
|
$ |
2.15 |
|
| Diluted |
$ |
1.74 |
|
|
$ |
1.63 |
|
|
$ |
2.14 |
|
The accompanying notes are an integral part of the consolidated financial statements.
Brown-Forman Corporation and Subsidiaries
Consolidated Statements of Comprehensive Income
(Dollars in millions)
|
|
|
|
|
|
|
|
|
|
|
|
|
|
|
|
|
|
| Year Ended April 30, |
2022 |
|
2023 |
|
2024 |
| Net income |
$ |
838 |
|
|
$ |
783 |
|
|
$ |
1,024 |
|
| Other comprehensive income (loss), net of tax: |
|
|
|
|
|
| Currency translation adjustments |
(60) |
|
|
135 |
|
|
(7) |
|
| Cash flow hedge adjustments |
53 |
|
|
(27) |
|
|
— |
|
| Postretirement benefits adjustments |
77 |
|
|
9 |
|
|
21 |
|
| Net other comprehensive income (loss) |
70 |
|
|
117 |
|
|
14 |
|
| Comprehensive income |
$ |
908 |
|
|
$ |
900 |
|
|
$ |
1,038 |
|
The accompanying notes are an integral part of the consolidated financial statements.
Brown-Forman Corporation and Subsidiaries
Consolidated Balance Sheets
(Dollars in millions)
|
|
|
|
|
|
|
|
|
|
|
|
| April 30, |
2023 |
|
2024 |
| Assets |
|
|
|
| Cash and cash equivalents |
$ |
374 |
|
|
$ |
446 |
|
| Accounts receivable, net |
855 |
|
|
769 |
|
| Inventories: |
|
|
|
| Barreled whiskey |
1,262 |
|
|
1,490 |
|
| Finished goods |
509 |
|
|
452 |
|
| Work in process |
321 |
|
|
396 |
|
| Raw materials and supplies |
191 |
|
|
218 |
|
| Total inventories |
2,283 |
|
|
2,556 |
|
|
|
|
|
| Other current assets |
289 |
|
|
265 |
|
| Total current assets |
3,801 |
|
|
4,036 |
|
| Property, plant, and equipment, net |
1,031 |
|
|
1,074 |
|
| Goodwill |
1,457 |
|
|
1,455 |
|
| Other intangible assets |
1,164 |
|
|
990 |
|
Equity method investments |
3 |
|
|
270 |
|
| Deferred tax assets |
66 |
|
|
69 |
|
| Other assets |
255 |
|
|
272 |
|
| Total assets |
$ |
7,777 |
|
|
$ |
8,166 |
|
| Liabilities |
|
|
|
| Accounts payable and accrued expenses |
$ |
827 |
|
|
$ |
793 |
|
| Accrued income taxes |
22 |
|
|
38 |
|
|
|
|
|
| Short-term borrowings |
235 |
|
|
428 |
|
| Current portion of long-term debt |
— |
|
|
300 |
|
| Total current liabilities |
1,084 |
|
|
1,559 |
|
| Long-term debt |
2,678 |
|
|
2,372 |
|
| Deferred tax liabilities |
323 |
|
|
315 |
|
| Accrued pension and other postretirement benefits |
171 |
|
|
160 |
|
| Other liabilities |
253 |
|
|
243 |
|
| Total liabilities |
4,509 |
|
|
4,649 |
|
| Commitments and contingencies |
|
|
|
| Stockholders’ Equity |
|
|
|
| Common stock: |
|
|
|
Class A, voting, $0.15 par value (170,000,000 shares authorized; 170,000,000 shares issued) |
25 |
|
|
25 |
|
Class B, nonvoting, $0.15 par value (400,000,000 shares authorized; 314,532,000 shares issued) |
47 |
|
|
47 |
|
| Additional paid-in capital |
1 |
|
|
13 |
|
| Retained earnings |
3,643 |
|
|
4,261 |
|
| Accumulated other comprehensive income (loss), net of tax |
(235) |
|
|
(221) |
|
Treasury stock, at cost (5,215,000 and 11,932,000 shares in 2023 and 2024, respectively) |
(213) |
|
|
(608) |
|
| Total stockholders' equity |
3,268 |
|
|
3,517 |
|
| Total liabilities and stockholders' equity |
$ |
7,777 |
|
|
$ |
8,166 |
|
The accompanying notes are an integral part of the consolidated financial statements.
Brown-Forman Corporation and Subsidiaries
Consolidated Statements of Cash Flows
(Dollars in millions)
|
|
|
|
|
|
|
|
|
|
|
|
|
|
|
|
|
|
| Year Ended April 30, |
2022 |
|
2023 |
|
2024 |
| Cash flows from operating activities: |
|
|
|
|
|
| Net income |
$ |
838 |
|
|
$ |
783 |
|
|
$ |
1,024 |
|
| Adjustments to reconcile net income to net cash provided by operations: |
|
|
|
|
|
Gain on business divestitures |
— |
|
|
— |
|
|
(267) |
|
| Asset impairment charges |
61 |
|
|
96 |
|
|
7 |
|
| Depreciation and amortization |
79 |
|
|
80 |
|
|
87 |
|
| Stock-based compensation expense |
15 |
|
|
18 |
|
|
25 |
|
| Deferred income tax provision (benefit) |
(11) |
|
|
(3) |
|
|
18 |
|
|
|
|
|
|
|
| Change in fair value of contingent consideration |
— |
|
|
— |
|
|
9 |
|
| Other, net |
31 |
|
|
18 |
|
|
7 |
|
Changes in assets and liabilities, net of business acquisitions and divestitures: |
|
|
|
|
|
| Accounts receivable |
(77) |
|
|
(21) |
|
|
88 |
|
| Inventories |
(93) |
|
|
(403) |
|
|
(349) |
|
| Other current assets |
15 |
|
|
4 |
|
|
23 |
|
| Accounts payable and accrued expenses |
37 |
|
|
77 |
|
|
(31) |
|
| Accrued income taxes |
47 |
|
|
(57) |
|
|
17 |
|
| Other operating assets and liabilities |
(6) |
|
|
48 |
|
|
(11) |
|
| Cash provided by operating activities |
936 |
|
|
640 |
|
|
647 |
|
| Cash flows from investing activities: |
|
|
|
|
|
Proceeds from business divestitures |
— |
|
|
— |
|
|
246 |
|
| Business acquisitions, net of cash acquired |
— |
|
|
(1,195) |
|
|
— |
|
| Additions to property, plant, and equipment |
(138) |
|
|
(183) |
|
|
(228) |
|
|
|
|
|
|
|
|
|
|
|
|
|
|
|
|
|
|
|
|
|
|
|
|
|
|
|
|
|
|
|
| Other, net |
11 |
|
|
23 |
|
|
31 |
|
| Cash provided by (used for) investing activities |
(127) |
|
|
(1,355) |
|
|
49 |
|
| Cash flows from financing activities: |
|
|
|
|
|
| Proceeds from short-term borrowings, maturities greater than 90 days |
— |
|
|
600 |
|
|
— |
|
| Repayments of short-term borrowings, maturities greater than 90 days |
— |
|
|
(600) |
|
|
— |
|
|
|
|
|
|
|
| Net change in other short-term borrowings |
(196) |
|
|
234 |
|
|
192 |
|
| Repayment of long-term debt |
— |
|
|
(250) |
|
|
— |
|
| Proceeds from long-term debt |
— |
|
|
648 |
|
|
— |
|
|
|
|
|
|
|
|
|
|
|
|
|
|
|
|
|
|
|
| Acquisition of treasury stock |
— |
|
|
— |
|
|
(400) |
|
| Dividends paid |
(831) |
|
|
(378) |
|
|
(404) |
|
|
|
|
|
|
|
| Other, net |
(11) |
|
|
(15) |
|
|
(6) |
|
| Cash provided by (used for) financing activities |
(1,038) |
|
|
239 |
|
|
(618) |
|
| Effect of exchange rate changes on cash, cash equivalents, and restricted cash |
(47) |
|
|
(14) |
|
|
(6) |
|
| Net increase (decrease) in cash, cash equivalents, and restricted cash |
(276) |
|
|
(490) |
|
|
72 |
|
| Cash, cash equivalents, and restricted cash at beginning of period |
1,150 |
|
|
874 |
|
|
384 |
|
| Cash, cash equivalents, and restricted cash at end of period |
874 |
|
|
384 |
|
|
456 |
|
| Less: Restricted cash (included in other current assets) at end of period |
(6) |
|
|
(10) |
|
|
(10) |
|
| Cash and cash equivalents at end of period |
$ |
868 |
|
|
$ |
374 |
|
|
$ |
446 |
|
Supplemental information: |
|
|
|
|
|
Cash paid for interest |
$ |
80 |
|
|
$ |
85 |
|
|
$ |
125 |
|
Cash paid for income taxes |
$ |
226 |
|
|
$ |
278 |
|
|
$ |
242 |
|
| Non-cash additions to property, plant, and equipment |
$ |
15 |
|
|
$ |
27 |
|
|
$ |
20 |
|
|
|
|
|
|
|
The accompanying notes are an integral part of the consolidated financial statements.
Brown-Forman Corporation and Subsidiaries
Consolidated Statements of Stockholders' Equity
(Dollars in millions, except per share amounts)
|
|
|
|
|
|
|
|
|
|
|
|
|
|
|
|
|
|
|
|
|
|
|
|
|
|
|
|
|
|
|
|
|
|
|
|
|
|
|
|
|
|
|
Class A Common Stock |
|
Class B Common Stock |
|
Additional Paid-in Capital |
|
Retained Earnings |
|
AOCI |
|
Treasury Stock |
|
Total |
Balance at April 30, 2021 |
$ |
25 |
|
|
$ |
47 |
|
|
$ |
— |
|
|
$ |
3,243 |
|
|
$ |
(422) |
|
|
$ |
(237) |
|
|
$ |
2,656 |
|
|
|
|
|
|
|
|
|
|
|
|
|
|
|
|
|
|
|
|
|
|
|
|
|
|
|
|
|
|
|
|
|
|
|
|
|
|
|
|
|
|
|
| Net income |
|
|
|
|
|
|
838 |
|
|
|
|
|
|
838 |
|
| Net other comprehensive income (loss) |
|
|
|
|
|
|
|
|
70 |
|
|
|
|
70 |
|
Cash dividends ($1.7360 per share) |
|
|
|
|
|
|
(831) |
|
|
|
|
|
|
(831) |
|
|
|
|
|
|
|
|
|
|
|
|
|
|
|
| Stock-based compensation expense |
|
|
|
|
15 |
|
|
|
|
|
|
|
|
15 |
|
| Stock issued under compensation plans |
|
|
|
|
|
|
|
|
|
|
12 |
|
|
12 |
|
Loss on treasury stock issued under compensation plans |
|
|
|
|
(15) |
|
|
(8) |
|
|
|
|
|
|
(23) |
|
|
|
|
|
|
|
|
|
|
|
|
|
|
|
Balance at April 30, 2022 |
25 |
|
|
47 |
|
|
— |
|
|
3,242 |
|
|
(352) |
|
|
(225) |
|
|
2,737 |
|
|
|
|
|
|
|
|
|
|
|
|
|
|
|
|
|
|
|
|
|
|
|
|
|
|
|
|
|
|
|
|
|
|
|
|
|
|
|
|
|
|
|
| Net income |
|
|
|
|
|
|
783 |
|
|
|
|
|
|
783 |
|
| Net other comprehensive income (loss) |
|
|
|
|
|
|
|
|
117 |
|
|
|
|
117 |
|
Cash dividends ($0.7880 per share) |
|
|
|
|
|
|
(378) |
|
|
|
|
|
|
(378) |
|
|
|
|
|
|
|
|
|
|
|
|
|
|
|
| Stock-based compensation expense |
|
|
|
|
18 |
|
|
|
|
|
|
|
|
18 |
|
| Stock issued under compensation plans |
|
|
|
|
|
|
|
|
|
|
12 |
|
|
12 |
|
Loss on treasury stock issued under compensation plans |
|
|
|
|
(17) |
|
|
(4) |
|
|
|
|
|
|
(21) |
|
|
|
|
|
|
|
|
|
|
|
|
|
|
|
Balance at April 30, 2023 |
25 |
|
|
47 |
|
|
1 |
|
|
3,643 |
|
|
(235) |
|
|
(213) |
|
|
3,268 |
|
|
|
|
|
|
|
|
|
|
|
|
|
|
|
|
|
|
|
|
|
|
|
|
|
|
|
|
|
|
|
|
|
|
|
|
|
|
|
|
|
|
|
| Net income |
|
|
|
|
|
|
1,024 |
|
|
|
|
|
|
1,024 |
|
| Net other comprehensive income (loss) |
|
|
|
|
|
|
|
|
14 |
|
|
|
|
14 |
|
Cash dividends ($0.8466 per share) |
|
|
|
|
|
|
(404) |
|
|
|
|
|
|
(404) |
|
| Acquisition of treasury stock |
|
|
|
|
|
|
|
|
|
|
(404) |
|
|
(404) |
|
| Stock-based compensation expense |
|
|
|
|
25 |
|
|
|
|
|
|
|
|
25 |
|
| Stock issued under compensation plans |
|
|
|
|
|
|
|
|
|
|
9 |
|
|
9 |
|
Loss on treasury stock issued under compensation plans |
|
|
|
|
(13) |
|
|
(2) |
|
|
|
|
|
|
(15) |
|
Balance at April 30, 2024 |
$ |
25 |
|
|
$ |
47 |
|
|
$ |
13 |
|
|
$ |
4,261 |
|
|
$ |
(221) |
|
|
$ |
(608) |
|
|
$ |
3,517 |
|
The accompanying notes are an integral part of the consolidated financial statements.
Brown-Forman Corporation and Subsidiaries
Notes to Consolidated Financial Statements
(Dollars and other currency amounts in millions, except per share data)
1. Accounting Policies
We prepare our consolidated financial statements in conformity with accounting principles generally accepted in the United States (GAAP). We also apply the following accounting policies when preparing our consolidated financial statements:
Principles of consolidation. Our consolidated financial statements include the accounts of all subsidiaries in which we have a controlling financial interest. We use the equity method to account for investments in entities that we do not control but over whose operating and financial policies we have the ability to exercise significant influence. We eliminate all intercompany transactions.
Estimates. To prepare financial statements that conform with GAAP, our management must make informed estimates that affect how we report revenues, expenses, assets, and liabilities, including contingent assets and liabilities. Actual results could differ from these estimates.
Cash equivalents. Cash equivalents include bank demand deposits and all highly liquid investments with original maturities of three months or less.
Accounts receivable. Accounts receivable are recorded net of an allowance for expected credit losses (allowance for doubtful accounts). We determine the allowance using information such as customer credit history and financial condition, historical loss experience, and macroeconomic factors. We write off account balances against the allowance when we have exhausted our collection efforts. The allowance for doubtful accounts was $7 and $8 at April 30, 2023 and 2024, respectively.
Inventories. Inventories are valued at the lower of cost or net realizable value. Approximately 49% of our consolidated inventories are valued using the last-in, first-out (LIFO) cost method, which we use for the majority of our U.S. inventories. We value the remainder of our inventories primarily using the first-in, first-out (FIFO) cost method. FIFO cost approximates current replacement cost. If we had used the FIFO method for all inventories, they would have been $429 and $512 higher than reported at April 30, 2023 and 2024, respectively.
Because we age most of our whiskeys in barrels for three years or more, we bottle and sell only a portion of our whiskey inventory each year. Following industry practice, we classify all barreled whiskey as a current asset. We include warehousing, insurance, ad valorem taxes, and other carrying charges applicable to barreled whiskey in inventory costs.
We classify agave inventories, bulk tequila, barreled rum, and liquid in bottling tanks as work in process.
Property, plant, and equipment. We state property, plant, and equipment at cost less accumulated depreciation. We calculate depreciation on a straight-line basis using our estimates of useful life, which are 20–40 years for buildings and improvements; 3–10 years for machinery, equipment, vehicles, furniture, and fixtures; and 3–7 years for capitalized software.
We assess our property, plant, and equipment for impairment whenever events or changes in circumstances indicate that the carrying value of those assets may not be recoverable. When we do not expect to recover the carrying value of an asset (or asset group) through undiscounted future cash flows, we write it down to its estimated fair value. We determine fair value using discounted estimated future cash flows, considering market values for similar assets when available.
When we retire or dispose of property, plant, and equipment, we remove its cost and accumulated depreciation from our balance sheet and reflect any gain or loss in operating income. We expense the costs of repairing and maintaining our property, plant, and equipment as we incur them.
Goodwill and other intangible assets. When we acquire a business, we first allocate the purchase price to identifiable assets and liabilities, including intangible brand names and trademarks (“brand names”), based on estimated fair value. We then record any remaining purchase price as goodwill. We do not amortize goodwill or other intangible assets with indefinite lives. We consider all of our brand names to have indefinite lives.
We assess our goodwill and other indefinite-lived intangible assets for impairment at least annually, or more frequently if circumstances indicate the carrying amount may be impaired. Goodwill is impaired when the carrying amount of the related reporting unit exceeds its estimated fair value, in which case we write down the goodwill by the amount of the excess (limited to the carrying amount of the goodwill). We estimate the reporting unit's fair value using discounted estimated future cash flows or market information. Similarly, a brand name is impaired when its carrying amount exceeds its estimated fair value, in which case we write down the brand name to its estimated fair value. We estimate the fair value of a brand name using the relief-from-royalty method.
We also consider market values for similar assets when available. Considerable management judgment is necessary to estimate fair value, including the selection of assumptions about future cash flows, net sales, discount rates, and royalty rates.
We have the option, before quantifying the fair value of a reporting unit or brand name, to evaluate qualitative factors to assess whether it is more likely than not that our goodwill or brand names are impaired. If we determine that is not the case, then we are not required to quantify the fair value. That assessment also takes considerable management judgment.
Revenue recognition. Our net sales predominantly reflect global sales of beverage alcohol consumer products. We sell these products under contracts with different types of customers, depending on the market. The customer is most often a distributor, wholesaler, or retailer.
Each contract typically includes a single performance obligation to transfer control of the products to the customer. Depending on the contract, control is transferred when the products are either shipped or delivered to the customer, at which point we recognize the transaction price for those products as net sales. The transaction price recognized at that point reflects our estimate of the consideration to be received in exchange for the products. The actual amount may ultimately differ due to the effect of various customer incentives and trade promotion activities. In making our estimates, we consider our historical experience and current expectations, as applicable. Subsequent adjustments recognized for changes in estimated transaction prices are typically not material.
Net sales exclude taxes we collect from customers that are imposed by various governments on our sales, and are reduced by payments to customers unless made in exchange for distinct goods or services with fair values approximating the payments. Net sales include any amounts we bill customers for shipping and handling activities related to the products. We recognize the cost of those activities in cost of sales during the same period in which we recognize the related net sales. Sales returns, which are permitted only in limited situations, are not material. Customer payment terms generally range from 30 to 90 days. There are no significant amounts of contract assets or liabilities.
Cost of sales. Cost of sales includes the costs of receiving, producing, inspecting, warehousing, insuring, and shipping goods sold during the period.
Advertising costs. We expense the production costs of advertising when the advertisements first take place. We expense all other advertising costs during the year in which the costs are incurred.
Selling, general, and administrative expenses. Selling, general, and administrative expenses include the costs associated with our sales force, administrative staff and facilities, and other expenses related to our non-manufacturing functions.
Stock-based compensation. We use stock-based awards as part of our incentive compensation for eligible employees and directors. We recognize the grant-date fair value of an award as compensation expense on a straight-line basis over the requisite service period, which typically corresponds to the vesting period for the award. Upon forfeiture of an award prior to vesting, we reverse any previously recognized compensation expense related to that award. We classify stock-based compensation expense within selling, general, and administrative expenses.
As we recognize compensation expense for a stock-based award, we concurrently recognize a related deferred tax asset. The subsequent vesting or exercise of the award will generally result in an actual tax benefit that differs from the deferred tax asset that had been recorded. The excess (deficiency) of the actual tax benefit over (under) the previously recorded tax asset is recognized as income tax benefit (expense) on the date of vesting or exercise.
Income taxes. We base our annual provision for income taxes on the pre-tax income reflected in our consolidated statement of operations. We establish deferred tax liabilities or assets for temporary differences between GAAP and tax reporting bases and later adjust them to reflect changes in tax rates expected to be in effect when the temporary differences reverse. We record a valuation allowance as necessary to reduce a deferred tax asset to the amount that we believe is more likely than not to be realized. We do not provide deferred income taxes on undistributed earnings of foreign subsidiaries that we expect to indefinitely reinvest. We record a deferred tax charge in prepaid taxes for the difference between GAAP and tax reporting bases with respect to the elimination of intercompany profit in ending inventory.
We assess our uncertain income tax positions in two steps. First, we evaluate whether the tax position will more likely than not, based on its technical merits, be sustained upon examination, including resolution of any related appeals or litigation. For a tax position that does not meet this first criterion, we recognize no tax benefit. For a tax position that does meet the first criterion, we recognize a tax benefit in an amount equal to the largest amount of benefit that we believe has more than a 50% likelihood of being realized upon ultimate resolution. We record interest and penalties on uncertain tax positions as income tax expense.
Foreign currency transactions and translation. We report all gains and losses from foreign currency transactions (those denominated in a currency other than the entity's functional currency) in current income. The U.S. dollar is the functional currency for most of our consolidated entities. The local currency is the functional currency for some of our consolidated foreign entities. We translate the financial statements of those foreign entities into U.S. dollars, using the exchange rate in effect at the balance sheet date to translate assets and liabilities, and using the average exchange rate for the reporting period to translate income and expenses. We record the resulting translation adjustments in other comprehensive income (loss).
Accounting standards not yet adopted. In November 2023, the Financial Accounting Standards Board (FASB) issued an updated accounting standard requiring additional disclosures about significant segment expenses and other segment items. The update also requires interim disclosure of segment information that is currently required only on an annual basis. We are required to adopt the updated standard for annual disclosures beginning in fiscal 2025, and for interim disclosures in fiscal 2026, with earlier adoption permitted. The update is to be applied retroactively.
In December 2023, FASB issued an updated accounting standard requiring additional disclosures about income taxes, primarily related to the rate reconciliation and information about income taxes paid. We are required to adopt the new guidance beginning in fiscal 2026, with earlier adoption permitted. The update can be applied either prospectively or retrospectively.
We are currently evaluating the impact that adopting these accounting standards updates will have on our disclosures.
2. Balance Sheet Information
Supplemental information on our year-end balance sheets is as follows:
|
|
|
|
|
|
|
|
|
|
|
|
| April 30, |
2023 |
|
2024 |
| Other current assets: |
|
|
|
| Prepaid taxes |
$ |
122 |
|
|
$ |
100 |
|
| Other |
167 |
|
|
165 |
|
|
$ |
289 |
|
|
$ |
265 |
|
| Property, plant, and equipment: |
|
|
|
| Land |
$ |
97 |
|
|
$ |
49 |
|
| Buildings |
717 |
|
|
782 |
|
| Equipment |
889 |
|
|
928 |
|
| Construction in process |
217 |
|
|
181 |
|
|
1,920 |
|
|
1,940 |
|
| Less accumulated depreciation |
889 |
|
|
866 |
|
|
$ |
1,031 |
|
|
$ |
1,074 |
|
| Accounts payable and accrued expenses: |
|
|
|
| Accounts payable, trade |
$ |
308 |
|
|
$ |
267 |
|
| Accrued expenses: |
|
|
|
| Advertising, promotion, and discounts |
216 |
|
|
200 |
|
| Compensation and commissions |
106 |
|
|
105 |
|
| Excise and other non-income taxes |
76 |
|
|
67 |
|
|
|
|
|
|
|
|
|
|
|
|
|
| Other |
121 |
|
|
154 |
|
|
519 |
|
|
526 |
|
|
$ |
827 |
|
|
$ |
793 |
|
| Other liabilities: |
|
|
|
|
|
|
|
Contingent consideration |
$ |
63 |
|
|
$ |
69 |
|
| Other |
190 |
|
|
174 |
|
|
$ |
253 |
|
|
$ |
243 |
|
|
|
|
|
| Accumulated other comprehensive income (loss), net of tax: |
|
|
|
| Currency translation adjustments |
$ |
(104) |
|
|
$ |
(111) |
|
| Cash flow hedge adjustments |
10 |
|
|
10 |
|
| Postretirement benefits adjustments |
(141) |
|
|
(120) |
|
|
$ |
(235) |
|
|
$ |
(221) |
|
3. Earnings per Share
We calculate basic earnings per share by dividing net income available to common stockholders by the weighted average number of common shares outstanding during the period. Diluted earnings per share further includes the dilutive effect of stock-based compensation awards. We calculate that dilutive effect using the “treasury stock method” (as defined by GAAP).
The following table presents information concerning basic and diluted earnings per share:
|
|
|
|
|
|
|
|
|
|
|
|
|
|
|
|
|
|
|
2022 |
|
2023 |
|
2024 |
|
|
|
|
|
|
|
|
|
|
|
|
| Net income available to common stockholders |
$ |
838 |
|
|
$ |
783 |
|
|
$ |
1,024 |
|
|
|
|
|
|
|
| Share data (in thousands): |
|
|
|
|
|
| Basic average common shares outstanding |
478,879 |
|
|
479,155 |
|
|
476,394 |
|
| Dilutive effect of stock-based awards |
1,686 |
|
|
1,310 |
|
|
826 |
|
| Diluted average common shares outstanding |
480,565 |
|
|
480,465 |
|
|
477,220 |
|
|
|
|
|
|
|
| Basic earnings per share |
$ |
1.75 |
|
|
$ |
1.63 |
|
|
$ |
2.15 |
|
| Diluted earnings per share |
$ |
1.74 |
|
|
$ |
1.63 |
|
|
$ |
2.14 |
|
We excluded common stock-based awards for approximately 691,000 shares, 1,107,000 shares, and 1,689,000 shares from the calculation of diluted earnings per share for 2022, 2023, and 2024, respectively, because they were not dilutive for those periods under the treasury stock method.
4. Goodwill and Other Intangible Assets
The following table shows the changes in goodwill (which include no accumulated impairment losses) and other intangible assets over the past two years:
|
|
|
|
|
|
|
|
|
|
|
|
|
Goodwill |
|
Other Intangible Assets |
Balance as of April 30, 2022 |
$ |
761 |
|
|
$ |
586 |
|
|
|
|
|
Business acquisitions (Note 13) |
652 |
|
|
619 |
|
| Foreign currency translation adjustment |
44 |
|
|
55 |
|
| Impairment |
— |
|
|
(96) |
|
Balance as of April 30, 2023 |
1,457 |
|
|
1,164 |
|
Purchase accounting adjustments (Note 13) |
40 |
|
|
(53) |
|
Business divestitures (Note 14) |
(28) |
|
|
(89) |
|
|
|
|
|
| Foreign currency translation adjustment |
(14) |
|
|
(25) |
|
| Impairment |
— |
|
|
(7) |
|
Balance as of April 30, 2024 |
$ |
1,455 |
|
|
$ |
990 |
|
Our other intangible assets consist of trademarks and brand names, all with indefinite useful lives.
During fiscal 2023, we recognized a non-cash impairment charge of $96 for the Finlandia brand name, largely reflecting the effects of higher discount rates and input costs on its valuation. During fiscal 2024, we recorded a $7 impairment charge related to the write-off of the carrying amount of an immaterial discontinued brand name. The impairment charges are included in “other expense (income), net” in the accompanying consolidated statements of operations.
5. Equity Method Investments
As of April 30, 2024, our equity method investments include a 21.4% ownership of the common stock of The Duckhorn Portfolio, Inc. (“Duckhorn”), which we obtained as partial consideration for the sale of the Sonoma-Cutrer wine business to Duckhorn (Note 14). The $267 carrying amount of the investment reflects the fair value of the common stock, based on its quoted market price at the April 30, 2024 closing date of the transaction. As of April 30, 2024, the difference between the carrying amount of the investment and our proportionate share of the net assets of Duckhorn was not material.
Our other equity method investments are immaterial.
6. Contingencies
We operate in a litigious environment, and we are sued in the normal course of business. Sometimes plaintiffs seek substantial damages. Significant judgment is required in predicting the outcome of these suits and claims, many of which take years to adjudicate. We accrue estimated costs for a contingency when we believe that a loss is probable and we can make a reasonable estimate of the loss, and then adjust the accrual as appropriate to reflect changes in facts and circumstances. We do not believe it is reasonably possible that these existing loss contingencies, individually or in the aggregate, would have a material adverse effect on our financial position, results of operations, or liquidity. No material accrued loss contingencies are recorded as of April 30, 2024.
7. Debt and Credit Facilities
Our long-term debt (net of unamortized discounts and issuance costs) consisted of:
|
|
|
|
|
|
|
|
|
|
|
|
| April 30, |
2023 |
|
2024 |
3.50% senior notes, $300 principal amount, due April 15, 2025 |
$ |
299 |
|
|
$ |
300 |
|
1.20% senior notes, €300 principal amount, due July 7, 2026 |
330 |
|
|
321 |
|
2.60% senior notes, £300 principal amount, due July 7, 2028 |
375 |
|
|
375 |
|
4.75% senior notes, $650 principal amount, due April 15, 2033 |
642 |
|
|
643 |
|
4.00% senior notes, $300 principal amount, due April 15, 2038 |
295 |
|
|
295 |
|
3.75% senior notes, $250 principal amount, due January 15, 2043 |
248 |
|
|
248 |
|
4.50% senior notes, $500 principal amount, due July 15, 2045 |
489 |
|
|
490 |
|
|
|
|
|
|
2,678 |
|
|
2,672 |
|
| Less current portion |
— |
|
|
300 |
|
|
$ |
2,678 |
|
|
$ |
2,372 |
|
Debt payments required over the next five fiscal years consist of $300 in 2025, $0 in 2026, $322 in 2027, $0 in 2028, $377 in 2029, and $1,700 after 2029.
The senior notes contain terms, events of default, and covenants customary of these types of unsecured securities, including limitations on the amount of secured debt we can issue.
Details of our short-term borrowings at April 30, 2023 and 2024, are presented below:
|
|
|
|
|
|
|
|
|
|
|
|
| April 30, |
2023 |
|
2024 |
Commercial paper (par amount) |
$235 |
|
$429 |
| Average interest rate |
5.17% |
|
5.49% |
| Average remaining days to maturity |
21 |
|
12 |
We have a committed revolving credit agreement with various U.S. and international banks for $900 that expires in May 2028. At April 30, 2024, there were no borrowings outstanding under this facility.
8. Common Stock
The following table shows the change in outstanding common shares during each of the last three years:
|
|
|
|
|
|
|
|
|
|
|
|
|
|
|
|
|
|
|
|
| (Shares in thousands) |
Class A |
|
Class B |
|
Total |
Balance at April 30, 2021 |
169,110 |
|
|
309,619 |
|
|
478,729 |
|
|
|
|
|
|
|
| Stock issued under compensation plans |
65 |
|
|
226 |
|
|
291 |
|
Balance at April 30, 2022 |
169,175 |
|
|
309,845 |
|
|
479,020 |
|
|
|
|
|
|
|
| Stock issued under compensation plans |
65 |
|
|
231 |
|
|
296 |
|
Balance at April 30, 2023 |
169,240 |
|
|
310,076 |
|
|
479,316 |
|
| Acquisition of treasury stock |
(176) |
|
|
(6,736) |
|
|
(6,912) |
|
| Stock issued under compensation plans |
44 |
|
|
152 |
|
|
196 |
|
Balance at April 30, 2024 |
169,108 |
|
|
303,492 |
|
|
472,600 |
|
9. Net Sales
The following table shows our net sales by geography:
|
|
|
|
|
|
|
|
|
|
|
|
|
|
|
|
|
|
|
2022 |
|
2023 |
|
2024 |
United States |
$ |
1,917 |
|
|
$ |
1,968 |
|
|
$ |
1,889 |
|
Developed International1 |
1,137 |
|
|
1,183 |
|
|
1,158 |
|
Emerging2 |
714 |
|
|
842 |
|
|
886 |
|
Travel Retail3 |
104 |
|
|
147 |
|
|
158 |
|
Non-branded and bulk4 |
61 |
|
|
88 |
|
|
87 |
|
|
$ |
3,933 |
|
|
$ |
4,228 |
|
|
$ |
4,178 |
|
1Represents net sales of branded products to “advanced economies” as defined by the International Monetary Fund (IMF), excluding the United States. Our top developed international markets are Germany, Australia, the United Kingdom, France, Canada, and Spain.
2Represents net sales of branded products to “emerging and developing economies” as defined by the IMF. Our top emerging markets are Mexico, Poland, and Brazil.
3Represents net sales of branded products to global duty-free customers, other travel retail customers, and the U.S. military, regardless of customer location.
4Includes net sales of used barrels, contract bottling services, and non-branded bulk whiskey and wine, regardless of customer location.
The following table shows our net sales by product category:
|
|
|
|
|
|
|
|
|
|
|
|
|
|
|
|
|
|
|
2022 |
|
2023 |
|
2024 |
Whiskey1 |
$ |
2,756 |
|
|
$ |
2,915 |
|
|
$ |
2,832 |
|
Ready-to-Drink2 |
431 |
|
|
509 |
|
|
520 |
|
Tequila3 |
290 |
|
|
320 |
|
|
306 |
|
Wine4 |
219 |
|
|
206 |
|
|
205 |
|
Vodka5 |
109 |
|
|
99 |
|
|
82 |
|
Non-branded and bulk6 |
61 |
|
|
88 |
|
|
87 |
|
Rest of portfolio7 |
67 |
|
|
91 |
|
|
146 |
|
|
$ |
3,933 |
|
|
$ |
4,228 |
|
|
$ |
4,178 |
|
1Includes all whiskey spirits and whiskey-based flavored liqueurs. The brands included in this category are the Jack Daniel’s family of brands (excluding the “ready-to-drink” products outlined below), the Woodford Reserve family of brands, the Old Forester family of brands, The Glendronach, Glenglassaugh, Benriach, Slane Irish Whiskey, and Coopers’ Craft.
2Includes the Jack Daniel’s ready-to-drink (RTD) and ready-to-pour (RTP) products, New Mix, and other RTD/RTP products.
3Includes el Jimador, the Herradura family of brands, and other tequilas.
4Includes Korbel California Champagne and Sonoma-Cutrer wines (which was divested on April 30, 2024).
5Includes Finlandia Vodka (which was divested on November 1, 2023). Net sales for the second half of fiscal 2024 were recognized pursuant to the transition services agreement related to distribution services in certain markets.
6Includes net sales of used barrels, contract bottling services, and non-branded bulk whiskey and wine.
7Includes Diplomático, Chambord, Gin Mare, Korbel Brandy, and Fords Gin.
10. Pension and Other Postretirement Benefits
We sponsor various defined benefit pension plans as well as postretirement plans providing retiree health care and retiree life insurance benefits. Below, we discuss our obligations related to these plans, the assets dedicated to meeting the obligations, and the amounts we recognized in our financial statements as a result of sponsoring these plans.
Obligations. We provide eligible employees with pension and other postretirement benefits based on factors such as years of service and compensation level during employment. The pension obligation shown below (“projected benefit obligation”) consists of: (a) benefits earned by employees to date based on current salary levels (“accumulated benefit obligation”); and (b) benefits to be received by employees as a result of expected future salary increases. (The obligation for medical and life insurance benefits is not affected by future salary increases.) The following table shows how the present value of our projected benefit obligations changed during each of the last two years.
|
|
|
|
|
|
|
|
|
|
|
|
|
|
|
|
|
|
|
|
|
|
|
|
| |
Pension Benefits |
|
Medical and Life
Insurance Benefits |
| |
2023 |
|
2024 |
|
2023 |
|
2024 |
| Obligation at beginning of year |
$ |
846 |
|
|
$ |
731 |
|
|
$ |
43 |
|
|
$ |
40 |
|
| Service cost |
20 |
|
|
18 |
|
|
1 |
|
|
— |
|
| Interest cost |
32 |
|
|
34 |
|
|
1 |
|
|
2 |
|
Net actuarial loss (gain)1 |
(21) |
|
|
(61) |
|
|
(2) |
|
|
(3) |
|
|
|
|
|
|
|
|
|
| Retiree contributions |
— |
|
|
— |
|
|
2 |
|
|
3 |
|
| Benefits paid |
(146) |
|
|
(44) |
|
|
(5) |
|
|
(6) |
|
|
|
|
|
|
|
|
|
| Obligation at end of year |
$ |
731 |
|
|
$ |
679 |
|
|
$ |
40 |
|
|
$ |
36 |
|
1 The net actuarial loss (gain) during each year was primarily attributable to changes in discount rates.
Service cost represents the present value of the benefits attributed to service rendered by employees during the year. Interest cost is the increase in the present value of the obligation due to the passage of time. Net actuarial loss (gain) is the change in value of the obligation resulting from experience different from that assumed or from a change in an actuarial assumption. (We discuss actuarial assumptions used at the end of this note.) Plan amendments can also change the value of the obligation.
As shown in the previous table, the change in the value of our pension and other postretirement benefit obligations also includes the effect of benefit payments and retiree contributions. Expected benefit payments (net of retiree contributions) over the next 10 years are as follows:
|
|
|
|
|
|
|
|
|
|
|
|
|
Pension Benefits |
|
Medical and Life
Insurance Benefits |
| 2025 |
$ |
54 |
|
|
$ |
3 |
|
| 2026 |
54 |
|
|
3 |
|
| 2027 |
55 |
|
|
3 |
|
| 2028 |
56 |
|
|
3 |
|
| 2029 |
57 |
|
|
3 |
|
| 2030 – 2034 |
286 |
|
|
14 |
|
Assets. We invest in specific assets to fund our pension benefit obligations. Our investment goal is to earn a total return that, over time, will grow assets sufficiently to fund our plans' liabilities, after providing appropriate levels of contributions and accepting prudent levels of investment risk. To achieve this goal, plan assets are invested primarily in funds or portfolios of funds managed by outside managers. Investment risk is managed by company policies that require diversification of asset classes, manager styles, and individual holdings. We measure and monitor investment risk through quarterly and annual performance reviews, and through periodic asset/liability studies.
Asset allocation is the most important method for achieving our investment goals and is based on our assessment of the plans' long-term return objectives and the appropriate balances needed for liquidity, stability, and diversification. As of April 30, 2024, our target asset allocation is a mix of 26% public equity investments, 59% fixed income investments, and 15% alternative investments.
The following table shows the fair value of pension plan assets by category as of the end of the last two years. (Fair value levels are defined in Note 16.)
|
|
|
|
|
|
|
|
|
|
|
|
|
|
|
|
|
|
|
|
|
|
|
|
| |
Level 1 |
|
Level 2 |
|
Level 3 |
|
Total |
| April 30, 2023 |
|
|
|
|
|
|
|
| Equity securities |
$ |
35 |
|
|
$ |
— |
|
|
$ |
— |
|
|
$ |
35 |
|
| Cash and temporary investments |
2 |
|
|
— |
|
|
— |
|
|
2 |
|
Limited partnership interest1 |
— |
|
|
— |
|
|
1 |
|
|
1 |
|
|
$ |
37 |
|
|
$ |
— |
|
|
$ |
1 |
|
|
38 |
|
| Investments measured at net asset value: |
|
|
|
|
|
|
|
Commingled trust funds2: |
|
|
|
|
|
|
|
| Equity funds |
|
|
|
|
|
|
138 |
|
| Fixed income funds |
|
|
|
|
|
|
330 |
|
| Real estate fund |
|
|
|
|
|
|
59 |
|
| Short-term investments |
|
|
|
|
|
|
2 |
|
Limited partnership interests3 |
|
|
|
|
|
|
39 |
|
|
|
|
|
|
|
|
|
|
|
|
|
|
|
|
|
| Total |
|
|
|
|
|
|
$ |
606 |
|
|
|
|
|
|
|
|
|
| April 30, 2024 |
|
|
|
|
|
|
|
| Equity securities |
$ |
31 |
|
|
$ |
— |
|
|
$ |
— |
|
|
$ |
31 |
|
Fixed income investments |
— |
|
|
278 |
|
|
— |
|
|
278 |
|
|
|
|
|
|
|
|
|
Limited partnership interest1 |
— |
|
|
— |
|
|
1 |
|
|
1 |
|
Pending transactions |
(3) |
|
|
— |
|
|
— |
|
|
(3) |
|
|
$ |
28 |
|
|
$ |
278 |
|
|
$ |
1 |
|
|
307 |
|
| Investments measured at net asset value: |
|
|
|
|
|
|
|
Commingled trust funds2: |
|
|
|
|
|
|
|
| Equity funds |
|
|
|
|
|
|
118 |
|
| Fixed income funds |
|
|
|
|
|
|
53 |
|
| Real estate fund |
|
|
|
|
|
|
49 |
|
| Short-term investments |
|
|
|
|
|
|
11 |
|
Limited partnership interests3 |
|
|
|
|
|
|
38 |
|
|
|
|
|
|
|
|
|
|
|
|
|
|
|
|
|
| Total |
|
|
|
|
|
|
$ |
576 |
|
1 This limited partnership interest was initially valued at cost and has been adjusted to fair value as determined in good faith by management of the partnership using various factors, and does not meet the requirements for reporting at the net asset value (NAV). The valuation requires significant judgment due to the absence of quoted market prices and the inherent lack of liquidity. This limited partnership has a term expiring in September 2024.
2 Commingled trust fund valuations are based on the NAV of the funds as determined by the fund administrators and reviewed by us. NAV represents the underlying assets owned by the fund, minus liabilities and divided by the number of shares or units outstanding. Generally, for commingled trust funds other than real estate, redemptions are permitted daily with no notice period. The real estate fund is redeemable quarterly with 110 days' notice.
3 These limited partnership interests were initially valued at cost and have been adjusted using NAV per audited financial statements. Investments are generally not eligible for immediate redemption and have original terms averaging 10 to 13 years, although those periods may be extended.
The following table shows how the fair value of the Level 3 assets changed during each of the last two years. There were no transfers of assets between Level 3 and either of the other two levels.
|
|
|
|
|
|
|
|
|
|
|
|
|
|
|
|
|
|
|
Level 3 |
Balance as of April 30, 2022 |
|
|
|
|
|
|
$ |
2 |
|
| Return on assets held at end of year |
|
|
|
|
|
|
(1) |
|
|
|
|
|
|
|
|
|
|
|
|
|
|
|
|
|
|
|
|
|
|
|
|
|
Balance as of April 30, 2023 |
|
|
|
|
|
|
1 |
|
| Return on assets held at end of year |
|
|
|
|
|
|
— |
|
|
|
|
|
|
|
|
|
|
|
|
|
|
|
|
|
|
|
|
|
|
|
|
|
Balance as of April 30, 2024 |
|
|
|
|
|
|
$ |
1 |
|
The following table shows how the total fair value of all pension plan assets changed during each of the last two years. (We do not have assets set aside for postretirement medical or life insurance benefits.)
|
|
|
|
|
|
|
|
|
|
|
|
|
|
|
|
|
|
|
|
|
|
|
|
| |
Pension Benefits |
|
Medical and Life
Insurance Benefits |
| |
2023 |
|
2024 |
|
2023 |
|
2024 |
| Assets at beginning of year |
$ |
741 |
|
|
$ |
606 |
|
|
$ |
— |
|
|
$ |
— |
|
| Actual return on assets |
(7) |
|
|
(2) |
|
|
— |
|
|
— |
|
| Retiree contributions |
— |
|
|
— |
|
|
2 |
|
|
3 |
|
| Company contributions |
18 |
|
|
16 |
|
|
3 |
|
|
3 |
|
| Benefits paid |
(146) |
|
|
(44) |
|
|
(5) |
|
|
(6) |
|
| Assets at end of year |
$ |
606 |
|
|
$ |
576 |
|
|
$ |
— |
|
|
$ |
— |
|
We currently expect to contribute $16 to our pension plans and $3 to our postretirement medical and life insurance benefit plans during 2025.
Funded status. The funded status of a plan refers to the difference between its assets and its obligations. The following table shows the funded status of our plans.
|
|
|
|
|
|
|
|
|
|
|
|
|
|
|
|
|
|
|
|
|
|
|
|
| |
Pension Benefits |
|
Medical and Life
Insurance Benefits |
| April 30, |
2023 |
|
2024 |
|
2023 |
|
2024 |
| Assets |
$ |
606 |
|
|
$ |
576 |
|
|
$ |
— |
|
|
$ |
— |
|
| Obligations |
(731) |
|
|
(679) |
|
|
(40) |
|
|
(36) |
|
| Funded status |
$ |
(125) |
|
|
$ |
(103) |
|
|
$ |
(40) |
|
|
$ |
(36) |
|
The funded status is recorded on the accompanying consolidated balance sheets as follows:
|
|
|
|
|
|
|
|
|
|
|
|
|
|
|
|
|
|
|
|
|
|
|
|
|
|
|
| |
|
Pension Benefits |
|
Medical and Life
Insurance Benefits |
| April 30, |
|
2023 |
|
2024 |
|
2023 |
|
2024 |
| Other assets |
|
$ |
17 |
|
|
$ |
32 |
|
|
$ |
— |
|
|
$ |
— |
|
| Accounts payable and accrued expenses |
|
(8) |
|
|
(8) |
|
|
(3) |
|
|
(3) |
|
| Accrued pension and other postretirement benefits |
|
(134) |
|
|
(127) |
|
|
(37) |
|
|
(33) |
|
| Net liability |
|
$ |
(125) |
|
|
$ |
(103) |
|
|
$ |
(40) |
|
|
$ |
(36) |
|
| Accumulated other comprehensive income (loss), before tax: |
|
|
|
|
|
|
|
|
| Net actuarial gain (loss) |
|
$ |
(192) |
|
|
$ |
(166) |
|
|
$ |
(1) |
|
|
$ |
2 |
|
| Prior service credit (cost) |
|
(4) |
|
|
(4) |
|
|
2 |
|
|
1 |
|
|
|
$ |
(196) |
|
|
$ |
(170) |
|
|
$ |
1 |
|
|
$ |
3 |
|
The following table compares our pension plans whose accumulated benefit obligations exceed their assets with our pension plans whose assets exceed their accumulated benefit obligations.
|
|
|
|
|
|
|
|
|
|
|
|
|
|
|
|
|
|
|
|
|
|
|
|
|
|
|
|
| |
Accumulated
Benefit Obligation |
|
|
|
Plan Assets |
| April 30, |
2023 |
|
2024 |
|
|
|
|
|
2023 |
|
2024 |
| Plans with accumulated benefit obligation in excess of assets |
$ |
(131) |
|
|
$ |
(124) |
|
|
|
|
|
|
$ |
— |
|
|
$ |
— |
|
| Plans with assets in excess of accumulated benefit obligation |
(524) |
|
|
(487) |
|
|
|
|
|
|
606 |
|
|
576 |
|
| Total |
$ |
(655) |
|
|
$ |
(611) |
|
|
|
|
|
|
$ |
606 |
|
|
$ |
576 |
|
The following table compares our pension plans whose projected benefit obligations exceed their assets with our pension plans whose assets exceed their projected benefit obligations.
|
|
|
|
|
|
|
|
|
|
|
|
|
|
|
|
|
|
|
|
|
|
|
|
|
|
|
|
| |
Projected
Benefit Obligation |
|
|
|
Plan Assets |
| April 30, |
2023 |
|
2024 |
|
|
|
|
|
2023 |
|
2024 |
| Plans with projected benefit obligation in excess of assets |
$ |
(190) |
|
|
$ |
(135) |
|
|
|
|
|
|
$ |
48 |
|
|
$ |
— |
|
| Plans with assets in excess of projected benefit obligation |
(541) |
|
|
(544) |
|
|
|
|
|
|
558 |
|
|
576 |
|
| Total |
$ |
(731) |
|
|
$ |
(679) |
|
|
|
|
|
|
$ |
606 |
|
|
$ |
576 |
|
As noted above, we have no assets set aside for the postretirement medical or life insurance benefit plans.
Pension cost. The following table shows the components of the pension cost recognized during each of the last three years. The amount for each year includes amortization of the prior service cost/credit and net actuarial loss/gain included in accumulated other comprehensive loss as of the beginning of the year.
|
|
|
|
|
|
|
|
|
|
|
|
|
|
|
|
|
|
| |
Pension Benefits |
| |
2022 |
|
2023 |
|
2024 |
| Service cost |
$ |
26 |
|
|
$ |
20 |
|
|
$ |
18 |
|
| Interest cost |
22 |
|
|
32 |
|
|
34 |
|
|
|
|
|
|
|
| Expected return on assets |
(45) |
|
|
(43) |
|
|
(40) |
|
| Amortization of: |
|
|
|
|
|
| Prior service cost (credit) |
1 |
|
|
1 |
|
|
1 |
|
| Net actuarial loss (gain) |
23 |
|
|
9 |
|
|
6 |
|
| Settlement charge |
12 |
|
|
29 |
|
|
— |
|
| Net cost |
$ |
39 |
|
|
$ |
48 |
|
|
$ |
19 |
|
We determine the expected return on plan assets by applying our long-term rate of return assumption to the market-related value of plan assets, adjusted by earnings on contributions and benefit payments expected to be made during the year. We calculate the market-related value of plan assets by amortizing actual versus expected returns over five years.
We amortize prior service costs and net actuarial gains or losses on straight-line basis over the average remaining service period of the employees expected to receive benefits under the plan. However, for net actuarial gains or losses, we use a corridor approach that amortizes them only to the extent the gain or loss exceeds 10% of the greater of the projected benefit obligation or market-related value of plan assets.
The settlement charges recognized during 2022 and 2023 were triggered by fiscal year-to-date lump-sum payments under certain pension plans surpassing total annual service and interest cost for those plans.
Other postretirement benefits cost. The following table shows the components of the postretirement medical and life insurance benefits cost that we recognized during each of the last three years.
|
|
|
|
|
|
|
|
|
|
|
|
|
|
|
|
|
|
| |
Medical and Life Insurance Benefits |
| |
2022 |
|
2023 |
|
2024 |
| Service cost |
$ |
1 |
|
|
$ |
1 |
|
|
$ |
— |
|
| Interest cost |
1 |
|
|
1 |
|
|
2 |
|
| Amortization of: |
|
|
|
|
|
| Prior service cost (credit) |
(2) |
|
|
— |
|
|
— |
|
| Net actuarial loss (gain) |
1 |
|
|
— |
|
|
— |
|
| Net cost |
$ |
1 |
|
|
$ |
2 |
|
|
$ |
2 |
|
We amortize prior service costs and net actuarial gains or losses on straight-line basis over the average remaining service period of the employees expected to receive benefits under the plan.
Other comprehensive income (loss). We recognize prior service cost/credit and net actuarial loss/gain in other comprehensive income or loss (OCI) during the period in which they arise. These amounts are later amortized from accumulated OCI into pension and other postretirement benefit cost over future periods as described above. The following table shows the pre-tax effect of these amounts on OCI during each of the last three years.
|
|
|
|
|
|
|
|
|
|
|
|
|
|
|
|
|
|
|
|
|
|
|
|
|
|
|
|
|
|
|
|
|
|
|
|
| |
Pension Benefits |
|
Medical and Life
Insurance Benefits |
| |
2022 |
|
2023 |
|
2024 |
|
2022 |
|
2023 |
|
2024 |
|
|
|
|
|
|
|
|
|
|
|
|
| Net actuarial gain (loss) |
$ |
62 |
|
|
$ |
(29) |
|
|
$ |
20 |
|
|
$ |
5 |
|
|
$ |
2 |
|
|
$ |
3 |
|
| Amortization reclassified to earnings: |
|
|
|
|
|
|
|
|
|
|
|
| Prior service cost (credit) |
1 |
|
|
1 |
|
|
1 |
|
|
(2) |
|
|
— |
|
|
— |
|
| Net actuarial loss (gain) |
35 |
|
|
38 |
|
|
6 |
|
|
1 |
|
|
— |
|
|
— |
|
| Net amount recognized in OCI |
$ |
98 |
|
|
$ |
10 |
|
|
$ |
26 |
|
|
$ |
4 |
|
|
$ |
2 |
|
|
$ |
3 |
|
Assumptions and sensitivity. We use various assumptions to determine the obligations and cost related to our pension and other postretirement benefit plans. The weighted-average assumptions used in computing benefit plan obligations as of the end of the last two years were as follows:
|
|
|
|
|
|
|
|
|
|
|
|
|
|
|
|
|
|
|
|
|
|
|
|
| |
Pension Benefits |
|
Medical and Life
Insurance Benefits |
| |
2023 |
|
2024 |
|
2023 |
|
2024 |
| Discount rate |
4.91 |
% |
|
5.70 |
% |
|
4.86 |
% |
|
5.66 |
% |
| Rate of salary increase |
4.00 |
% |
|
4.00 |
% |
|
n/a |
|
n/a |
| Interest crediting rate |
3.69 |
% |
|
4.79 |
% |
|
n/a |
|
n/a |
The weighted-average assumptions used in computing benefit plan cost during each of the last three years were as follows:
|
|
|
|
|
|
|
|
|
|
|
|
|
|
|
|
|
|
|
|
|
|
|
|
|
|
|
|
|
|
|
|
|
|
|
|
| |
Pension Benefits |
|
Medical and Life
Insurance Benefits |
| |
2022 |
|
2023 |
|
2024 |
|
2022 |
|
2023 |
|
2024 |
| Discount rate for service cost |
3.36 |
% |
|
4.52 |
% |
|
4.98 |
% |
|
3.49 |
% |
|
4.50 |
% |
|
5.02 |
% |
| Discount rate for interest cost |
2.34 |
% |
|
4.12 |
% |
|
4.79 |
% |
|
2.27 |
% |
|
3.96 |
% |
|
4.78 |
% |
| Rate of salary increase |
4.00 |
% |
|
4.00 |
% |
|
4.00 |
% |
|
n/a |
|
n/a |
|
n/a |
| Interest crediting rate |
3.06 |
% |
|
3.06 |
% |
|
3.69 |
% |
|
n/a |
|
n/a |
|
n/a |
| Expected return on plan assets |
6.25 |
% |
|
6.25 |
% |
|
6.50 |
% |
|
n/a |
|
n/a |
|
n/a |
We determine the assumed discount rates using a yield curve based on the interest rates of high-quality debt securities with maturities corresponding to the expected timing of our benefit payments. We measure the service cost and interest cost components by applying the specific spot rates along the yield curve used to measure the benefit obligation at the beginning of the period.
The assumed rate of salary increase reflects the expected average annual increase in salaries as a result of inflation, merit increases, and promotions over the service period of the plan participants.
The assumed interest crediting is based on the greater of the average yield on 30-year Treasury bonds or the minimum rate specified in the applicable pension plan.
The expected return on plan assets represents the long-term rate of return that we assume will be earned over the life of the pension assets. The assumption reflects expected capital market returns for each asset class, which are based on historical returns, adjusted for the expected effects of diversification.
The assumed health care cost trend rates as of the end of the last two years were as follows:
|
|
|
|
|
|
|
|
|
|
|
|
| |
Medical and Life
Insurance Benefits |
| |
2023 |
|
2024 |
| Health care cost trend rate assumed for next year |
7.23 |
% |
|
7.13 |
% |
| Rate to which the cost trend rate is assumed to decline (the ultimate trend rate) |
4.50 |
% |
|
4.50 |
% |
| Year that the rate reaches the ultimate trend rate |
2032 |
|
2032 |
Savings plans. We also sponsor various defined contribution benefit plans that together cover substantially all U.S. employees. Employees can make voluntary contributions in accordance with their respective plans, which include a 401(k) tax deferral option. We match a percentage of each employee's contributions in accordance with plan terms. We expensed $13, $14, and $14 for matching contributions during 2022, 2023, and 2024, respectively.
International plans. The information presented above for defined benefit plans and defined contribution benefit plans reflects amounts for U.S. plans only. Information about similar international plans is not presented due to immateriality.
11. Stock-Based Compensation
The Brown-Forman 2022 Omnibus Compensation Plan (Plan) is our incentive compensation plan, designed to reward participants (including eligible executive officers, other employees, and non-employee directors) for company performance. Under the Plan, we can grant stock-based incentive awards for up to 12,412,433 shares of common stock to eligible participants until July 28, 2032. As of April 30, 2024, awards for approximately 11,269,000 shares remain available for issuance under the Plan. We try to limit the source of shares delivered to participants under the Plan to treasury shares that we purchase from time to time on the open market (in connection with a publicly announced share repurchase program), in private transactions, or otherwise.
Awards granted under the Plan include stock-settled stock appreciation rights (SSARs), performance-based restricted stock units (PBRSUs), time-based restricted stock units (RSUs), and deferred stock units (DSUs).
SSARs. We grant SSARs at an exercise price equal to the closing market price of the underlying stock on the grant date. SSARs become exercisable after three years from the first day of the fiscal year of grant and generally are exercisable for seven years after that date. The following table presents information about SSARs outstanding as of April 30, 2024, and for the year then ended.
|
|
|
|
|
|
|
|
|
|
|
|
|
|
|
|
|
|
|
|
|
|
|
|
|
Number of
SSARs
(in thousands) |
|
Weighted-
Average
Exercise Price
per SSAR |
|
Weighted-
Average
Remaining
Contractual
Term (years) |
|
Aggregate
Intrinsic Value |
Outstanding at April 30, 2023 |
4,010 |
|
|
$ |
51.76 |
|
|
|
|
|
| Granted |
336 |
|
|
69.69 |
|
|
|
|
|
| Exercised |
(568) |
|
|
37.85 |
|
|
|
|
|
| Forfeited or expired |
(28) |
|
|
64.63 |
|
|
|
|
|
|
|
|
|
|
|
|
|
Outstanding at April 30, 2024 |
3,750 |
|
|
$ |
55.37 |
|
|
4.6 |
|
$ |
12 |
|
Exercisable at April 30, 2024 |
2,617 |
|
|
$ |
48.54 |
|
|
3.4 |
|
$ |
12 |
|
|
|
|
|
|
|
|
|
|
|
|
|
|
|
|
|
|
|
|
|
|
|
|
|
|
|
|
|
|
|
|
|
|
|
|
|
|
|
|
|
|
|
|
|
|
|
|
|
|
|
|
|
|
|
|
|
|
|
|
|
|
|
|
|
|
|
|
|
|
|
|
|
|
|
|
|
|
|
|
|
|
|
|
|
|
|
|
|
|
|
|
|
|
|
|
|
|
|
|
|
|
|
|
|
|
|
|
|
|
|
|
|
|
|
|
|
|
|
|
|
|
|
|
|
|
|
|
|
|
|
|
|
|
|
|
|
|
|
|
|
|
|
|
|
|
|
|
|
|
|
|
|
|
|
|
|
|
|
|
|
|
We use the Black-Scholes pricing model to calculate the grant-date fair value of a SSAR. The weighted-average grant-date fair values and related valuation assumptions for the SSARS granted during each of the last three years were as follows:
|
|
|
|
|
|
|
|
|
|
|
|
|
|
|
|
|
|
|
2022 |
|
2023 |
|
2024 |
|
|
|
|
|
|
| Grant-date fair value |
$ |
16.61 |
|
|
$ |
20.67 |
|
|
$ |
21.69 |
|
| Valuation assumptions: |
|
|
|
|
|
| Expected term (years) |
7.0 |
|
7.0 |
|
7.0 |
| Risk-free interest rate |
1.0 |
% |
|
2.7 |
% |
|
4.1 |
% |
| Expected volatility |
24.1 |
% |
|
24.8 |
% |
|
25.0 |
% |
| Expected dividend yield |
1.0 |
% |
|
1.0 |
% |
|
1.2 |
% |
The expected term is based on past exercise experience for similar awards. The risk-free interest rate is based on zero-coupon U.S. Treasury rates as of the date of grant. Expected volatility and dividend yield are based on historical data, with consideration of other factors when applicable.
PBRSUs. The PBRSUs vest at the end of a three-year performance period that begins on the first day of the fiscal year of grant. For PBRSU granted in fiscal 2022 and 2023, performance is measured in full by comparing the three-year cumulative total shareholder return (TSR) of our Class B common stock to the three-year cumulative TSR of the companies in the Standard & Poor’s Consumer Staples Index (the peer group). Beginning with PBRSUs granted in fiscal 2024, performance is measured based in part (50%) on our TSR compared to the TSR of the peer group and in part (50%) on our adjusted operating income growth compared to the adjusted operating income growth of the peer group over the three-year performance period. At the end of the performance period, the number of PBRSUs is adjusted for performance, and then adjusted upward to account for dividends paid during the second and third years of the performance period. The resulting PBRSUs are then converted to common shares.
The following table presents information about PBRSUs outstanding as of April 30, 2024, and for the year then ended.
|
|
|
|
|
|
|
|
|
|
|
|
|
|
|
|
|
|
|
|
|
Number of
PBRSUs
(in thousands) |
|
Weighted-
Average
Fair Value at
Grant Date |
|
|
|
|
|
|
|
|
|
|
|
|
|
|
|
|
|
|
|
|
|
|
|
|
|
|
|
|
|
|
|
|
|
|
|
|
|
|
|
|
|
|
|
|
|
|
|
|
|
|
|
|
|
|
|
|
|
|
|
|
|
|
|
|
|
|
|
|
|
|
|
|
|
|
|
|
|
|
|
|
|
|
|
|
|
|
|
|
|
|
|
|
|
|
|
|
|
|
|
|
|
|
|
|
|
|
|
|
|
|
|
|
|
|
|
|
|
|
|
|
|
|
|
|
|
|
|
|
|
|
|
|
|
|
|
|
|
|
|
|
|
|
|
|
|
|
|
|
|
|
|
|
|
|
|
|
|
|
|
|
|
|
|
|
|
|
|
|
|
|
|
|
|
|
|
|
|
|
|
|
|
|
|
|
|
|
|
|
|
|
|
|
|
|
|
|
|
|
|
|
|
|
|
|
|
|
|
|
|
|
|
|
|
|
|
|
|
|
|
|
Outstanding at April 30, 2023 |
289 |
|
|
$ |
76.33 |
|
|
|
|
|
| Granted |
209 |
|
|
$ |
75.70 |
|
|
|
|
|
| Adjusted for performance and dividends |
(38) |
|
|
$ |
73.56 |
|
|
|
|
|
| Converted to common shares |
(41) |
|
|
$ |
73.56 |
|
|
|
|
|
| Forfeited |
(6) |
|
|
$ |
77.12 |
|
|
|
|
|
Outstanding at April 30, 2024 |
413 |
|
|
$ |
76.53 |
|
|
|
|
|
For the portion of the PBRSUs based on adjusted operating income performance, we calculate the grant-date fair value using the closing market price on the underlying stock at the date of grant, discounted for dividends that are not paid on the PBRSUs during the first year of the performance period.
For the portion of the PBRSUs based on TSR, we calculate the grant-date fair value using a Monte Carlo simulation model. The following table shows the assumptions used in the Monte Carlo simulation model to value the awards granted during each of the last three fiscal years.
|
|
|
|
|
|
|
|
|
|
|
|
|
|
|
|
|
|
|
2022 |
|
2023 |
|
2024 |
|
|
|
|
|
|
|
|
|
|
|
|
|
|
|
|
|
|
|
|
|
|
|
|
| Valuation assumptions: |
|
|
|
|
|
| Risk-free interest rate |
0.3 |
% |
|
2.8 |
% |
|
4.6 |
% |
| Expected volatility |
29.1 |
% |
|
29.8 |
% |
|
22.2 |
% |
| Expected dividend yield |
1.0 |
% |
|
1.0 |
% |
|
1.2 |
% |
| Remaining performance period (years) as of grant date |
2.8 |
|
2.8 |
|
2.8 |
RSUs. Beginning in fiscal 2024, we grant time-based restricted stock units (RSUs) to certain non-executive employees. Each RSU represents the right to receive one share of Class B common stock. The RSUs vest in three equal amounts at the end of each of the subsequent three fiscal years. Outstanding RSUs are credited with dividend-equivalent RSUs when dividends are paid on our common stock. The grant-date fair value of an RSU is the closing market price of the underlying stock on the grant date. The following table presents information about RSUs outstanding as of April 30, 2024, and for the year then ended.
|
|
|
|
|
|
|
|
|
|
|
|
|
|
|
|
|
|
|
|
|
Number of
RSUs
(in thousands) |
|
Weighted-
Average
Fair Value at
Grant Date |
|
|
|
|
|
|
|
|
|
|
|
|
|
|
|
|
|
|
|
|
|
|
|
|
|
|
|
|
|
|
|
|
|
|
|
|
|
|
|
|
|
|
|
|
|
|
|
|
|
|
|
|
|
|
|
|
|
|
|
|
|
|
|
|
|
|
|
|
|
|
|
|
|
|
|
|
|
|
|
|
|
|
|
|
|
|
|
|
|
|
|
|
|
|
|
|
|
|
|
|
|
|
|
|
|
|
|
|
|
|
|
|
|
|
|
|
|
|
|
|
|
|
|
|
|
|
|
|
|
|
|
|
|
|
|
|
|
|
|
|
|
|
|
|
|
|
|
|
|
|
|
|
|
|
|
|
|
|
|
|
|
|
|
|
|
|
|
|
|
|
|
|
|
|
|
|
|
|
|
|
|
|
|
|
|
|
|
|
|
|
|
|
|
|
|
|
|
|
|
|
|
|
|
|
|
|
|
|
|
|
|
|
|
|
|
|
|
|
|
|
| Outstanding at April 30, 2023 |
— |
|
|
$ |
— |
|
|
|
|
|
| Granted |
89 |
|
|
$ |
68.89 |
|
|
|
|
|
Additions for dividend equivalents |
1 |
|
|
$ |
69.41 |
|
|
|
|
|
|
|
|
|
|
|
|
|
| Forfeited |
(3) |
|
|
$ |
69.17 |
|
|
|
|
|
| Outstanding at April 30, 2024 |
87 |
|
|
$ |
68.88 |
|
|
|
|
|
DSUs. DSUs are granted to our non-employee directors. Each DSU represents the right to receive one share of common stock based on the closing price of the shares on the date of grant. Outstanding DSUs are credited with dividend-equivalent DSUs when dividends are paid on our common stock. Each annual grant vests after one year. DSUs are paid out in shares after the completion of a director's tenure on the board plus a six-month waiting period. The director may elect to receive the distribution either in a single lump sum or in ten equal annual installments. As of April 30, 2024, there were approximately 181,000 outstanding DSUs, of which approximately 159,000 were vested.
The grant-date fair value of a DSU is the closing market price of the underlying stock on the grant date. The weighted average grant-date fair values for these awards granted during each of the last three years were as follows:
|
|
|
|
|
|
|
|
|
|
|
|
|
|
|
|
|
|
|
2022 |
|
2023 |
|
2024 |
|
|
|
|
|
|
| Grant-date fair value |
$ |
67.35 |
|
|
$ |
72.10 |
|
|
$ |
71.23 |
|
|
|
|
|
|
|
|
|
|
|
|
|
|
|
|
|
|
|
|
|
|
|
|
|
|
|
|
|
|
|
Additional information. The pre-tax stock-based compensation expense and related deferred income tax benefits recognized during the last three fiscal years were as follows:
|
|
|
|
|
|
|
|
|
|
|
|
|
|
|
|
|
|
|
2022 |
|
2023 |
|
2024 |
| Pre-tax compensation expense |
$ |
15 |
|
|
$ |
18 |
|
|
$ |
25 |
|
| Deferred tax benefit |
2 |
|
|
3 |
|
|
3 |
|
|
|
|
|
|
|
|
|
|
|
|
|
|
|
|
|
|
|
|
|
|
|
|
|
|
|
|
|
|
|
|
|
|
|
|
|
|
|
|
|
|
|
As of April 30, 2024, there was $14 of total unrecognized compensation cost related to non-vested stock-based awards. That cost is expected to be recognized over a weighted-average period of 1.6 years. Further information related to our stock-based awards for the last three years is as follows:
|
|
|
|
|
|
|
|
|
|
|
|
|
|
|
|
|
|
|
2022 |
|
2023 |
|
2024 |
|
|
|
|
|
|
|
|
|
|
|
|
|
|
|
|
|
|
|
|
|
|
|
|
|
|
|
|
|
|
|
|
|
|
|
|
| Intrinsic value of SSARs exercised |
$ |
23 |
|
|
$ |
19 |
|
|
$ |
12 |
|
|
|
|
|
|
|
|
|
|
|
|
|
|
|
|
|
|
|
| Fair value of shares vested |
7 |
|
|
6 |
|
|
4 |
|
| Excess tax benefit from exercise / vesting of awards |
6 |
|
|
4 |
|
|
2 |
|
|
|
|
|
|
|
12. Income Taxes
We incur income taxes on the earnings of our U.S. and foreign operations. The following table, based on the locations of the taxable entities from which sales were derived (rather than the location of customers), presents the U.S. and foreign components of our income before income taxes:
|
|
|
|
|
|
|
|
|
|
|
|
|
|
|
|
|
|
|
2022 |
|
2023 |
|
2024 |
| United States |
$ |
954 |
|
|
$ |
841 |
|
|
$ |
917 |
|
| Foreign |
160 |
|
|
176 |
|
|
381 |
|
|
$ |
1,114 |
|
|
$ |
1,017 |
|
|
$ |
1,298 |
|
The income shown above was determined according to GAAP. Because those standards sometimes differ from the tax rules used to calculate taxable income, there are differences between (a) the amount of taxable income and pretax financial income for a year, and (b) the tax bases of assets or liabilities and their amounts as recorded in our financial statements. As a result, we recognize a current tax liability for the estimated income tax payable on the current tax return, deferred tax liabilities (tax on income that will be recognized on future tax returns), and deferred tax assets (tax from deductions that will be recognized on future tax returns) for the estimated effects of the differences mentioned above.
Total income tax expense for a year includes the tax associated with the current tax return (current tax expense) and the change in the net deferred tax asset or liability (deferred tax expense). Our total income tax expense for each of the last three years was as follows:
|
|
|
|
|
|
|
|
|
|
|
|
|
|
|
|
|
|
|
2022 |
|
2023 |
|
2024 |
| Current: |
|
|
|
|
|
| U.S. federal |
$ |
205 |
|
|
$ |
157 |
|
|
$ |
150 |
|
| Foreign |
64 |
|
|
46 |
|
|
81 |
|
| State and local |
18 |
|
|
34 |
|
|
25 |
|
|
287 |
|
|
237 |
|
|
256 |
|
| Deferred: |
|
|
|
|
|
| U.S. federal |
1 |
|
|
(4) |
|
|
16 |
|
| Foreign |
(9) |
|
|
6 |
|
|
(5) |
|
| State and local |
(3) |
|
|
(5) |
|
|
7 |
|
|
(11) |
|
|
(3) |
|
|
18 |
|
|
$ |
276 |
|
|
$ |
234 |
|
|
$ |
274 |
|
Our consolidated effective tax rate usually differs from current statutory rates due to the recognition of amounts for events or transactions with no tax consequences. The following table reconciles our effective tax rate to the federal statutory tax rate in the United States:
|
|
|
|
|
|
|
|
|
|
|
|
|
|
|
|
|
|
| |
Percent of Income Before Taxes |
| |
2022 |
|
2023 |
|
2024 |
| U.S. federal statutory rate |
21.0 |
% |
|
21.0 |
% |
|
21.0 |
% |
| State taxes, net of U.S. federal tax benefit |
1.0 |
% |
|
2.5 |
% |
|
1.3 |
% |
| Income taxed at other than U.S. federal statutory rate |
1.3 |
% |
|
3.0 |
% |
|
0.5 |
% |
| Prior intercompany sales taxed at higher than current U.S. federal statutory rate |
2.0 |
% |
|
1.0 |
% |
|
— |
% |
| Tax benefit from foreign-derived sales |
(1.8 |
%) |
|
(3.0 |
%) |
|
(1.7) |
% |
Business divestitures |
— |
% |
|
— |
% |
|
(0.7) |
% |
| Adjustments related to prior years |
0.7 |
% |
|
(0.5 |
%) |
|
— |
% |
|
|
|
|
|
|
|
|
|
|
|
|
|
|
|
|
|
|
|
|
|
|
|
|
| Excess tax benefits from stock-based awards |
(0.5 |
%) |
|
(0.3 |
%) |
|
(0.1) |
% |
| Tax rate changes |
0.4 |
% |
|
— |
% |
|
0.4 |
% |
|
|
|
|
|
|
| Valuation allowance |
— |
% |
|
(1.3 |
%) |
|
0.1 |
% |
| Other, net |
0.7 |
% |
|
0.6 |
% |
|
0.4 |
% |
| Effective rate |
24.8 |
% |
|
23.0 |
% |
|
21.2 |
% |
Deferred tax assets and liabilities as of the end of each of the last two years were as follows:
|
|
|
|
|
|
|
|
|
|
|
|
| April 30, |
2023 |
|
2024 |
| Deferred tax assets: |
|
|
|
| Postretirement and other benefits |
$ |
75 |
|
|
$ |
65 |
|
| Accrued liabilities and other |
35 |
|
|
47 |
|
| Inventories |
26 |
|
|
26 |
|
| Lease liabilities |
23 |
|
|
27 |
|
|
|
|
|
| Loss and credit carryforwards |
62 |
|
|
65 |
|
| Total deferred tax assets |
221 |
|
|
230 |
|
| Valuation allowance |
(14) |
|
|
(16) |
|
| Total deferred tax assets, net of valuation allowance |
207 |
|
|
214 |
|
| Deferred tax liabilities: |
|
|
|
| Intangible assets |
(323) |
|
|
(295) |
|
| Property, plant, and equipment |
(98) |
|
|
(93) |
|
| Right-of-use assets |
(23) |
|
|
(27) |
|
| Derivative instruments |
(3) |
|
|
(3) |
|
Equity method investments |
— |
|
|
(37) |
|
| Other |
(17) |
|
|
(5) |
|
| Total deferred tax liabilities |
(464) |
|
|
(460) |
|
| Net deferred tax liability |
$ |
(257) |
|
|
$ |
(246) |
|
Details of the loss and credit carryforwards and related valuation allowances as of the end of each of the last two years are as follows:
|
|
|
|
|
|
|
|
|
|
|
|
|
|
|
|
|
|
|
|
|
|
|
|
|
|
|
|
|
|
|
|
|
|
|
|
|
|
|
|
|
|
|
April 30, 2023 |
|
April 30, 2024 |
|
|
|
|
Gross Amount |
|
Deferred Tax Asset |
|
Valuation Allowance |
|
Gross Amount |
|
Deferred Tax Asset |
|
Valuation Allowance |
|
|
| U.S. |
|
$ |
111 |
|
|
$ |
20 |
|
|
$ |
(6) |
|
|
$ |
110 |
|
|
$ |
38 |
|
1 |
$ |
(7) |
|
|
|
| Foreign |
|
216 |
|
|
42 |
|
|
(8) |
|
|
161 |
|
|
27 |
|
2 |
(9) |
|
|
|
|
|
$ |
327 |
|
|
$ |
62 |
|
|
$ |
(14) |
|
|
$ |
271 |
|
|
$ |
65 |
|
|
$ |
(16) |
|
|
|
|
|
|
|
|
|
|
|
|
|
|
|
|
|
|
|
|
|
|
|
|
|
|
|
|
|
|
|
|
|
|
|
|
|
|
|
|
|
|
|
|
|
|
|
|
|
|
|
|
|
|
|
|
|
|
|
|
|
|
|
1As of April 30, 2024, the deferred tax asset amount includes credit carryforwards of $28 that do not expire and loss and credit carryforwards of $10 that expire in varying amounts from 2025 to 2039.
2As of April 30, 2024, the deferred tax asset includes loss carryforwards of $25 that do not expire and $2 that expire in varying amounts over the next 10 years.
As of April 30, 2024, we had approximately $1,909 of undistributed earnings from our foreign subsidiaries ($1,617 at April 30, 2023). These earnings have been previously subject to tax, primarily as a result of the 2017 Tax Cuts and Jobs Act. Historically, we have asserted that the undistributed earnings of our foreign subsidiaries are reinvested indefinitely outside the United States. We continue to maintain indefinite reinvestment assertions for most undistributed earnings of our foreign subsidiaries, and no deferred taxes have been provided on the earnings. For undistributed earnings not considered permanently reinvested, deferred tax liabilities have been provided for any applicable income taxes and withholding taxes payable in various countries, which are not significant. We have also asserted that other outside basis differences related to our foreign subsidiaries are reinvested indefinitely and that the determination of any unrecognized deferred tax liabilities is not practicable due to the complexities in the calculations. The other outside basis differences relate primarily to differences between U.S. GAAP and tax basis that arose through purchase accounting. These basis differences could reverse through sales of foreign subsidiaries or other transactions, none of which are considered probable as of April 30, 2024.
At April 30, 2024, we had $14 of gross unrecognized tax benefits, $11 of which would reduce our effective income tax rate if recognized. A reconciliation of the beginning and ending unrecognized tax benefits follows:
|
|
|
|
|
|
|
|
|
|
|
|
|
|
|
|
|
|
|
2022 |
|
2023 |
|
2024 |
| Unrecognized tax benefits at beginning of year |
$ |
12 |
|
|
$ |
14 |
|
|
$ |
21 |
|
| Additions for tax positions provided in prior periods |
2 |
|
|
8 |
|
|
1 |
|
| Additions for tax positions provided in current period |
2 |
|
|
3 |
|
|
2 |
|
| Decreases for tax positions provided in prior years |
— |
|
|
— |
|
|
(3) |
|
| Settlements of tax positions in the current period |
— |
|
|
— |
|
|
(3) |
|
| Lapse of statutes of limitations |
(2) |
|
|
(4) |
|
|
(4) |
|
| Unrecognized tax benefits at end of year |
$ |
14 |
|
|
$ |
21 |
|
|
$ |
14 |
|
We file federal income tax returns in the United States and also file tax returns in various state, local and foreign jurisdictions. The major jurisdictions where we are subject to examination by tax authorities include the United States, Australia, Brazil, Germany, Korea, Mexico, Netherlands, and the United Kingdom. We have tax years open for examination from 2013 and forward. Various tax examinations are currently in progress in the United States, for both federal and states, and in certain foreign jurisdictions. In the United States, we are participating in the Internal Revenue Service's Compliance Assurance Program for our fiscal 2024 tax year.
We believe there will be no material change in our gross unrecognized tax benefits in the next 12 months.
13. Acquisitions
On November 3, 2022, we acquired the Gin Mare and Gin Mare Capri brands through our purchase of 100% of the equity interests of Gin Mare Brand, S.L.U., a Spanish company, and Mareliquid Vantguard, S.L.U., a Spanish company (the “Gin Mare acquisition”). The acquisition was accounted for as a business combination. The purchase price of the Gin Mare acquisition was $523, which consisted of $468 in cash paid at the acquisition date plus contingent consideration of $55. The purchase price for the Gin Mare acquisition decreased by $1 as a result of certain fair value adjustments to the contingent consideration made during the first half of fiscal 2024, which were primarily a result of changes in the discount rates used to calculate the fair value as of the acquisition date.
We have allocated the purchase price of the Gin Mare acquisition based on management’s estimates and independent valuations as follows:
|
|
|
|
|
|
|
|
|
|
|
|
|
|
|
|
|
|
|
Prior Allocation1 |
|
Adjustments |
|
Final Allocation |
|
|
|
|
|
|
|
|
|
|
|
|
|
|
|
|
|
|
|
|
|
|
|
|
| Trademarks and brand names (indefinite-lived) |
$ |
307 |
|
|
$ |
(24) |
|
|
$ |
283 |
|
| Goodwill |
289 |
|
|
17 |
|
|
306 |
|
|
|
|
|
|
|
|
|
|
|
|
|
| Total assets |
596 |
|
|
(7) |
|
|
589 |
|
|
|
|
|
|
|
|
|
|
|
|
|
| Deferred tax liabilities |
72 |
|
|
(6) |
|
|
66 |
|
|
|
|
|
|
|
|
|
|
|
|
|
|
|
|
|
|
|
| Net assets acquired |
$ |
524 |
|
|
$ |
(1) |
|
|
$ |
523 |
|
|
|
|
|
|
|
1As reported in Note 12 to our consolidated financial statements in our 2023 Form 10-K.
The adjustments to the prior Gin Mare purchase price allocation reflect revised valuations for the trademarks and brand names, which were driven by an increase in the discount rates used to calculate fair values as of the acquisition date, partially offset by higher projections of future cash flows. The Gin Mare purchase price allocation was finalized during the second quarter of fiscal 2024.
The contingent consideration of $55 reflects the estimated fair value, at the acquisition date, of contingent future cash payments of up to €90 to the sellers under an “earn-out” provision of the acquisition agreement. We determined the estimated fair value of the contingent consideration using a Monte Carlo simulation, which requires the use of assumptions, such as projected future net sales, discount rates, and volatility rates.
Any contingent consideration earned by the sellers will be payable in cash no earlier than July 2024 and no later than July 2027, depending on when the sellers choose to exercise the right to receive the payment. The amount payable will depend on the achievement of net sales targets for Gin Mare for the latest fiscal year completed prior to the date of exercise by the sellers. The possible payments range from zero to €90 (approximately $89 as of the acquisition date).
At the acquisition date, we also entered into a supply agreement with the sellers for the production and supply of Gin Mare products to us, at market terms, for an initial period of 10 years (subject to subsequent renewal periods).
On January 5, 2023, we acquired the Diplomático and Botucal rum brands through our purchase of (i) 100% of the equity interests of (a) International Rum and Spirits Distributors Unipessoal, Lda., a Portuguese company, (b) Diplomático Branding Unipessoal Lda., a Portuguese company, (c) International Bottling Services, S.A., a Panamanian corporation, and (d) International Rum & Spirits Marketing Solutions, S.L., a Spanish company; and (ii) certain assets of Destilerias Unidas Corp. (the “Diplomático acquisition”). The acquisition was accounted for as a business combination. The purchase price of the Diplomático acquisition consisted of cash of $723 (net of a post-closing working capital adjustment of $4).
We have allocated the purchase price of the Diplomático acquisition based on management’s estimates and independent valuations as follows:
|
|
|
|
|
|
|
|
|
|
|
|
|
|
|
|
|
|
|
Prior Allocation1 |
|
Adjustments |
|
Final Allocation |
| Accounts receivable |
$ |
11 |
|
|
$ |
— |
|
|
$ |
11 |
|
| Inventories |
36 |
|
|
(2) |
|
|
34 |
|
| Other current assets |
25 |
|
|
— |
|
|
25 |
|
| Property, plant, and equipment |
38 |
|
|
— |
|
|
38 |
|
| Trademarks and brand names (indefinite-lived) |
312 |
|
|
(29) |
|
|
283 |
|
| Goodwill |
363 |
|
|
23 |
|
|
386 |
|
| Other assets |
2 |
|
|
— |
|
|
2 |
|
| Total assets |
787 |
|
|
(8) |
|
|
779 |
|
|
|
|
|
|
|
| Accounts payable and accrued expenses |
13 |
|
|
1 |
|
|
14 |
|
| Deferred tax liabilities |
45 |
|
|
(5) |
|
|
40 |
|
| Other liabilities |
2 |
|
|
— |
|
|
2 |
|
| Total liabilities |
60 |
|
|
(4) |
|
|
56 |
|
|
|
|
|
|
|
| Net assets acquired |
$ |
727 |
|
|
$ |
(4) |
|
|
$ |
723 |
|
|
|
|
|
|
|
1As reported in Note 12 to our consolidated financial statements in our 2023 Form 10-K.
The adjustments to the prior Diplomático purchase price allocation reflect revised valuations for the trademarks and brand names, which were driven by an increase in the discount rates used to calculate fair values as of the acquisition date, partially offset by higher projections of future cash flows. The adjustments also reflect certain other immaterial net working capital adjustments. The Diplomático purchase price allocation was finalized during the third quarter of fiscal 2024.
At the acquisition date, we also entered into a supply agreement with the sellers for their production and supply of rum to us, at market terms, for an initial period of 10 years (subject to subsequent renewal periods).
The amounts allocated to trademarks and brand names for each acquisition were estimated using the relief-from-royalty method, which requires the use of significant assumptions, such as net sales, discount rates, and royalty rates.
Goodwill is calculated as the excess of the purchase price over the fair value of the net identifiable assets acquired. The goodwill recorded for each acquisition is primarily attributable to the value of leveraging our distribution network and brand-building expertise to grow sales of the acquired brands. For the Gin Mare acquisition, we expect none of the goodwill of $306 to be deductible for tax purposes. For the Diplomático acquisition, we expect $108 of the goodwill of $386 to be deductible for tax purposes.
In connection with the acquisitions, we recognized transaction expenses of $55 during fiscal 2023. The following table shows the classification of the transaction expenses in the accompanying consolidated statement of operations.
|
|
|
|
|
|
|
|
|
|
|
|
|
|
|
2023 |
|
|
|
|
| Selling, general, and administrative expenses |
|
|
$ |
11 |
|
| Other expense (income), net |
|
|
44 |
|
| Total transaction expenses |
|
|
$ |
55 |
|
|
|
|
|
The transaction expenses largely reflect payments made to terminate certain distribution contracts related to the acquired brands.
14. Divestitures
On November 1, 2023, we sold the Finlandia vodka business to Coca-Cola HBC AG for $196 in cash. The net carrying amount of the related business assets and liabilities included in the sale was $100, consisting largely of goodwill and other intangible assets. As a result of the sale, we recognized a pre-tax gain of $92 during fiscal 2024, calculated as follows:
|
|
|
|
|
|
|
|
|
|
|
|
|
|
|
|
Cash proceeds |
|
$ |
196 |
|
|
| Net carrying amount of assets and liabilities sold |
|
(100) |
|
|
|
|
|
|
|
|
|
|
|
|
|
|
|
|
|
|
|
|
|
|
| Amounts reclassified from AOCI: |
|
|
|
| Cumulative translation losses |
|
(30) |
|
|
| Net investment hedge gain (Note 15) |
|
26 |
|
|
|
|
|
|
Pre-tax gain on divestiture of Finlandia |
|
$ |
92 |
|
|
|
|
|
|
On April 30, 2024, we sold the Sonoma-Cutrer wine business to The Duckhorn Portfolio, Inc.(“Duckhorn”) in exchange for an ownership percentage of 21.4% in Duckhorn and cash of $50. The net carrying amount of the related business assets and liabilities included in the sale was $142 and consisted of the following:
|
|
|
|
|
|
|
|
|
|
|
|
| Inventories |
$ |
56 |
|
|
|
| Property, plant, and equipment |
83 |
|
|
|
| Goodwill |
18 |
|
|
|
| Other assets |
1 |
|
| Total assets sold |
158 |
|
|
|
| Accounts payable and accrued expenses |
3 |
|
| Deferred tax liabilities |
12 |
|
| Other liabilities |
1 |
|
| Total liabilities sold |
16 |
|
|
|
| Net assets sold |
$ |
142 |
|
|
|
As a result of the sale, we recognized a pre-tax gain of $175 during the fourth quarter of fiscal 2024, calculated as follows:
|
|
|
|
|
|
|
|
|
|
|
|
|
|
|
|
Cash proceeds |
$ |
50 |
|
|
Fair value of equity interest in Duckhorn |
267 |
|
|
Total consideration received |
317 |
|
|
| Net carrying amount of assets and liabilities sold |
(142) |
|
|
Pre-tax gain on divestiture of Sonoma-Cutrer |
$ |
175 |
|
|
|
|
|
We entered into transition services agreements in connection with the divestitures of both the Finlandia and Sonoma-Cuter businesses.
15. Derivative Financial Instruments and Hedging Activities
We are subject to market risks, including the effect of fluctuations in foreign currency exchange rates, commodity prices, and interest rates. We use derivatives to help manage financial exposures that occur in the normal course of business. We formally document the purpose of each derivative contract, which includes linking the contract to the financial exposure it is designed to mitigate. We do not hold or issue derivatives for trading or speculative purposes.
We use currency derivative contracts to limit our exposure to the foreign currency exchange risk that we cannot mitigate internally by using netting strategies. We designate most of these contracts as cash flow hedges of forecasted transactions (expected to occur within three years). We record all changes in the fair value of cash flow hedges in accumulated other comprehensive income (AOCI) until the underlying hedged transaction occurs, when we reclassify that amount into earnings.
Some of our currency derivatives are not designated as hedges because we use them to partially offset the immediate earnings impact of changes in foreign currency exchange rates on existing assets or liabilities. We immediately recognize the change in fair value of these contracts in earnings.
We had outstanding currency derivatives, related primarily to our euro, British pound, and Australian dollar exposures, with notional amounts for all hedged currencies totaling $747 and $566 at April 30, 2023 and 2024, respectively. The maximum term of outstanding derivative contracts was 24 months at both April 30, 2023 and 2024.
We also use foreign currency-denominated debt to help manage our foreign currency exchange risk. We designate a portion of those debt instruments as net investment hedges, which are intended to mitigate foreign currency exposure related to non-U.S. dollar net investments in certain foreign subsidiaries. Any change in value of the designated portion of the hedging instruments is recorded in AOCI, offsetting the foreign currency translation adjustment of the related net investments that is also recorded in AOCI. The amount of foreign currency-denominated debt designated as net investment hedges was $495 and $497 as of April 30, 2023 and 2024, respectively.
At inception, we expect each financial instrument designated as a hedge to be highly effective in offsetting the financial exposure it is designed to mitigate, and we assess hedge-effectiveness continually. If we determine that any financial instruments designated as hedges are no longer highly effective, we discontinue hedge accounting for those instruments.
We use forward purchase contracts with suppliers to protect against corn price volatility. We expect to take physical delivery of the corn underlying each contract and use it for production over a reasonable period of time. Accordingly, we account for these contracts as normal purchases rather than as derivative instruments.
During fiscal 2024, we reclassified $26 of gains on net investment hedges from AOCI to earnings in connection with the divestiture of Finlandia (Note 14).
The following table presents the pre-tax impact that changes in the fair value of our derivative instruments and non-derivative hedging instruments had on AOCI and earnings during each of the last three years:
|
|
|
|
|
|
|
|
|
|
|
|
|
|
|
|
|
|
|
|
|
|
|
|
|
Classification in Statement of Operations |
|
2022 |
|
2023 |
|
2024 |
|
|
|
|
|
|
|
|
| Currency derivatives designated as cash flow hedges: |
|
|
|
|
|
|
|
| Net gain (loss) recognized in AOCI |
n/a |
|
$ |
76 |
|
|
$ |
4 |
|
|
$ |
11 |
|
| Net gain (loss) reclassified from AOCI into earnings |
Sales |
|
5 |
|
|
37 |
|
|
12 |
|
| Net gain (loss) reclassified from AOCI into earnings |
Other income (expense), net |
|
2 |
|
|
— |
|
|
— |
|
| Interest rate derivatives designated as cash flow hedges: |
|
|
|
|
|
|
|
| Net gain (loss) recognized in AOCI |
n/a |
|
— |
|
|
(1) |
|
|
— |
|
|
|
|
|
|
|
|
|
|
|
|
|
|
|
|
|
|
|
|
|
|
|
|
|
|
|
|
|
|
|
|
|
|
|
|
|
|
|
|
|
|
|
|
|
|
|
|
|
| Currency derivatives not designated as hedging instruments: |
|
|
|
|
|
|
|
| Net gain (loss) recognized in earnings |
Sales |
|
12 |
|
|
(1) |
|
|
— |
|
| Net gain (loss) recognized in earnings |
Other income (expense), net |
|
5 |
|
|
16 |
|
|
8 |
|
|
|
|
|
|
|
|
|
|
|
|
|
|
|
|
|
| Foreign currency-denominated debt designated as net investment hedge: |
|
|
|
|
|
|
|
| Net gain (loss) recognized in AOCI |
n/a |
|
78 |
|
|
3 |
|
|
3 |
|
Net gain (loss) reclassified from AOCI to earnings |
Gain on business divestitures |
|
— |
|
|
— |
|
|
26 |
|
|
|
|
|
|
|
|
|
|
|
|
|
|
|
|
|
|
|
|
|
|
|
|
|
| Total amounts presented in the accompanying consolidated statements of operations for line items affected by the net gains (losses) shown above: |
|
|
|
|
|
|
| Sales |
|
|
5,081 |
|
|
5,372 |
|
|
5,328 |
|
| Other income (expense), net |
|
|
(59) |
|
|
(119) |
|
|
(24) |
|
|
|
|
|
|
|
|
|
|
|
|
|
|
|
|
|
We expect to reclassify $7 of deferred net gains on cash flow hedges recorded in AOCI as of April 30, 2024, to earnings during fiscal 2025. This reclassification would offset the anticipated earnings impact of the underlying hedged exposures. The actual amounts that we ultimately reclassify to earnings will depend on the exchange rates in effect when the underlying hedged transactions occur.
The following table presents the fair values of our derivative instruments as of April 30, 2023 and 2024:
|
|
|
|
|
|
|
|
|
|
|
|
|
|
|
|
|
|
|
Balance Sheet Classification |
|
Derivative Assets |
|
Derivative Liabilities |
| April 30, 2023 |
|
|
|
|
|
| Designated as cash flow hedges: |
|
|
|
|
|
| Currency derivatives |
Other current assets |
|
$ |
20 |
|
|
$ |
(11) |
|
| Currency derivatives |
Other assets |
|
5 |
|
|
(1) |
|
| Currency derivatives |
Accrued expenses |
|
— |
|
|
(1) |
|
| Currency derivatives |
Other liabilities |
|
— |
|
|
(1) |
|
|
|
|
|
|
|
|
|
|
|
|
|
|
|
|
|
|
|
| Not designated as hedges: |
|
|
|
|
|
|
|
|
|
|
|
| Currency derivatives |
Other current assets |
|
3 |
|
|
— |
|
|
|
|
|
|
|
|
|
|
|
|
|
|
|
|
|
|
|
| April 30, 2024 |
|
|
|
|
|
| Designated as cash flow hedges: |
|
|
|
|
|
| Currency derivatives |
Other current assets |
|
11 |
|
|
(2) |
|
| Currency derivatives |
Other assets |
|
1 |
|
|
(1) |
|
|
|
|
|
|
|
|
|
|
|
|
|
|
|
|
|
|
|
|
|
|
|
|
|
|
|
|
|
|
|
| Not designated as hedges: |
|
|
|
|
|
|
|
|
|
|
|
|
|
|
|
|
|
|
|
|
|
|
|
| Currency derivatives |
Accrued expenses |
|
— |
|
|
(1) |
|
|
|
|
|
|
|
The fair values reflected in the above table are presented on a gross basis. However, as discussed further below, the fair values of those instruments subject to net settlement agreements are presented on a net basis in our balance sheets.
In our statements of cash flows, we classify cash flows related to cash flow hedges in the same category as the cash flows from the hedged items.
Credit risk. We are exposed to credit-related losses if the counterparties to our derivative contracts default. This credit risk is limited to the fair value of the contracts. To manage this risk, we contract only with major financial institutions that have earned investment-grade credit ratings and with whom we have standard International Swaps and Derivatives Association (ISDA) agreements that allow for net settlement of the derivative contracts. Also, we have established counterparty credit guidelines that we monitor regularly. Based on our most recent assessment. we consider our counterparty credit risk to be low.
Our derivative instruments require us to maintain a specific level of creditworthiness, which we have maintained. If our creditworthiness were to fall below that level, then the counterparties to our derivative instruments could request immediate payment or collateralization for derivative instruments in net liability positions. The aggregate fair value of all derivatives with creditworthiness requirements that were in a net liability position was $1 and $1 at April 30, 2023 and 2024, respectively.
Offsetting. As noted above, our derivative contracts are governed by ISDA agreements that allow for net settlement of derivative contracts with the same counterparty. It is our policy to present the fair values of current derivatives (that is, those with a remaining term of 12 months or less) with the same counterparty on a net basis in our balance sheets. Similarly, we present the fair values of noncurrent derivatives with the same counterparty on a net basis. We do not net current derivatives with noncurrent derivatives in our balance sheets.
The following table summarizes the gross and net amounts of our derivative contracts:
|
|
|
|
|
|
|
|
|
|
|
|
|
|
|
|
|
|
|
|
|
|
|
|
|
|
|
|
|
|
|
Gross Amounts of Recognized Assets (Liabilities) |
|
Gross Amounts Offset in
Balance Sheet
|
|
Net Amounts Presented in Balance Sheet |
|
Gross Amounts Not Offset in Balance Sheet |
|
Net Amounts |
| April 30, 2023 |
|
|
|
|
|
|
|
|
|
| Derivative assets |
$ |
28 |
|
|
$ |
(12) |
|
|
$ |
16 |
|
|
$ |
(1) |
|
|
$ |
15 |
|
| Derivative liabilities |
(14) |
|
|
12 |
|
|
(2) |
|
|
1 |
|
|
(1) |
|
| April 30, 2024 |
|
|
|
|
|
|
|
|
|
| Derivative assets |
12 |
|
|
(3) |
|
|
9 |
|
|
— |
|
|
9 |
|
| Derivative liabilities |
(4) |
|
|
3 |
|
|
(1) |
|
|
— |
|
|
(1) |
|
No cash collateral was received or pledged related to our derivative contracts as of April 30, 2023 or 2024.
16. Fair Value Measurements
The following table summarizes the assets and liabilities measured or disclosed at fair value on a recurring basis:
|
|
|
|
|
|
|
|
|
|
|
|
|
|
|
|
|
|
|
|
|
|
|
|
| |
2023 |
|
2024 |
| April 30, |
Carrying
Amount |
|
Fair
Value |
|
Carrying
Amount |
|
Fair
Value |
| Assets: |
|
|
|
|
|
|
|
| Cash and cash equivalents |
$ |
374 |
|
|
$ |
374 |
|
|
$ |
446 |
|
|
$ |
446 |
|
|
|
|
|
|
|
|
|
| Currency derivatives |
16 |
|
|
16 |
|
|
9 |
|
|
9 |
|
|
|
|
|
|
|
|
|
| Liabilities: |
|
|
|
|
|
|
|
|
|
|
|
|
|
|
|
| Currency derivatives |
2 |
|
|
2 |
|
|
1 |
|
|
1 |
|
Contingent consideration |
63 |
|
|
63 |
|
|
69 |
|
|
69 |
|
| Short-term borrowings |
235 |
|
|
235 |
|
|
428 |
|
|
428 |
|
| Long-term debt (including current portion) |
2,678 |
|
|
2,556 |
|
|
2,672 |
|
|
2,468 |
|
|
|
|
|
|
|
|
|
|
|
|
|
|
|
|
|
Fair value is defined as the exchange price that would be received for an asset or paid to transfer a liability in the principal or most advantageous market for the asset or liability in an orderly transaction between market participants at the measurement date. We categorize the fair values of assets and liabilities into three levels based on the assumptions (inputs) used to determine those values.
Level 1 provides the most reliable measure of fair value, while Level 3 generally requires significant management judgment. The three levels are:
•Level 1 – Quoted prices (unadjusted) in active markets for identical assets or liabilities.
•Level 2 – Observable inputs other than those included in Level 1, such as quoted prices for similar assets and liabilities in active markets, quoted prices for identical or similar assets and liabilities in inactive markets, or other inputs that are observable or can be derived from or corroborated by observable market data.
•Level 3 – Unobservable inputs supported by little or no market activity.
We determine the fair values of our currency derivatives (forward contracts) using standard valuation models. The significant inputs used in these models, which are readily available in public markets or can be derived from observable market transactions, include the applicable spot exchange rates, forward exchange rates, and interest rates. These fair value measurements are categorized as Level 2 within the valuation hierarchy.
We determine the fair value of long-term debt primarily based on the prices at which identical or similar debt has recently traded in the market and also considering the overall market conditions on the date of valuation. These fair value measurements are categorized as Level 2 within the valuation hierarchy.
The fair values of cash, cash equivalents, and short-term borrowings approximate the carrying amounts due to the short maturities of these instruments.
We determine the fair value of our contingent consideration liability using a Monte Carlo simulation model, which requires the use of Level 3 inputs, such as projected future net sales, discount rates, and volatility rates. Changes in any of these Level 3 inputs could result in material changes to the fair value of the contingent consideration and could materially impact the amount of non-cash expense (or income) recorded each reporting period.
The following table shows the changes in our contingent consideration liability:
|
|
|
|
|
|
Balance as of April 30, 2022 |
$ |
— |
|
Acquisition of business (Note 13) |
56 |
|
|
|
|
|
| Foreign currency translation adjustment |
7 |
|
Balance as of April 30, 2023 |
63 |
|
Purchase accounting adjustment (Note 13) |
(1) |
|
Change in fair value1 |
9 |
|
Foreign currency translation adjustment |
(2) |
|
Balance as of April 30, 2024 |
$ |
69 |
|
1Classified as “other expense (income), net” in the accompanying consolidated statement of operations.
See Note 13 for additional information about the contingent consideration liability.
We measure some assets and liabilities at fair value on a nonrecurring basis. That is, we do not measure them at fair value on an ongoing basis, but we do adjust them to fair value in some circumstances (for example, when we determine that an asset is impaired). We recognized non-cash impairment charges of $52 and $96 related to the Finlandia brand name during fiscal 2022 and 2023, respectively. The impairment charges were based on the estimated fair value of the brand name, which we determined using the relief-from-royalty method. As discussed in Note 13, we also used the relief-from-royalty method to determine fair values in connection with our accounting for business combinations. The fair value measurements determined using this method are categorized as Level 3 within the valuation hierarchy. No other material nonrecurring fair value measurements were required during the periods presented in these financial statements.
17. Leases
We enter into lease arrangements, which we use primarily for office space, vehicles, and land. Substantially all of our leases are operating leases. Our finance leases are not material.
We record lease liabilities and right-of-use (ROU) assets on our balance sheet for leases with terms exceeding 12 months. We do not record lease liabilities or ROU assets for short-term leases. The amounts recorded for lease liabilities and ROU assets are based on the estimated present value, as of the lease commencement date, of the future payments to be made over the lease term. We calculate the present value using our incremental borrowing rate that corresponds to the term of the lease. We include the effect of an option to renew or terminate a lease in the lease term when it is reasonably certain that we will exercise the option.
Some of our leases contain non-lease components (e.g., maintenance or other services) in addition to lease components. We have elected the practical expedient not to separate the non-lease components from the lease components.
The following table shows information about our leases as of the end of the last two years:
|
|
|
|
|
|
|
|
|
|
|
|
|
|
|
|
Balance Sheet Classification |
April 30,
2023 |
|
April 30,
2024 |
| Right-of-use assets |
Other assets |
$ |
84 |
|
|
$ |
96 |
|
|
|
|
|
|
| Lease liabilities: |
|
|
|
|
| Current |
Accounts payable and accrued expenses |
$ |
22 |
|
|
$ |
24 |
|
| Non-current |
Other liabilities |
63 |
|
|
73 |
|
| Total |
|
$ |
85 |
|
|
$ |
97 |
|
|
|
|
|
|
| Weighted-average discount rate |
3.3% |
|
4.2% |
| Weighted-average remaining term |
5.1 years |
|
5.1 years |
The following table shows information about the effects of leases during each of the last three years:
|
|
|
|
|
|
|
|
|
|
|
|
|
|
|
|
|
|
|
2022 |
|
2023 |
|
2024 |
Total lease cost1 |
$ |
38 |
|
|
$ |
38 |
|
|
$ |
51 |
|
Cash paid for amounts included in the measurement of lease liabilities2 |
25 |
|
|
25 |
|
|
29 |
|
| Right-of-use assets obtained in exchange for new lease liabilities |
35 |
|
|
29 |
|
|
38 |
|
1Consists primarily of operating lease cost. Other components of lease cost were not material.
2Classified within operating activities in the accompanying consolidated statements of cash flows.
The following table includes a maturity analysis of future (undiscounted) lease payments and a reconciliation of those payments to the lease liabilities recorded on our balance sheet as of April 30, 2024:
|
|
|
|
|
|
|
April 30,
2024 |
2025 |
$ |
27 |
|
2026 |
23 |
|
2027 |
19 |
|
2028 |
14 |
|
2029 |
11 |
|
| Thereafter |
13 |
|
| Total lease payments |
107 |
|
| Less: Present value discount |
(10) |
|
| Lease liabilities |
$ |
97 |
|
|
|
|
|
|
|
18. Other Comprehensive Income
The following table presents the components of net other comprehensive income (loss) during each of the last three years:
|
|
|
|
|
|
|
|
|
|
|
|
|
|
|
|
|
|
|
Pre-Tax |
|
Tax |
|
Net |
Year Ended April 30, 2022 |
|
|
|
|
|
| Currency translation adjustments: |
|
|
|
|
|
| Net gain (loss) on currency translation |
$ |
(42) |
|
|
$ |
(18) |
|
|
$ |
(60) |
|
| Reclassification to earnings |
— |
|
|
— |
|
|
— |
|
| Other comprehensive income (loss), net |
(42) |
|
|
(18) |
|
|
(60) |
|
| Cash flow hedge adjustments: |
|
|
|
|
|
| Net gain (loss) on hedging instruments |
76 |
|
|
(17) |
|
|
59 |
|
Reclassification to earnings1 |
(7) |
|
|
1 |
|
|
(6) |
|
| Other comprehensive income (loss), net |
69 |
|
|
(16) |
|
|
53 |
|
| Postretirement benefits adjustments: |
|
|
|
|
|
| Net actuarial gain (loss) and prior service cost |
67 |
|
|
(16) |
|
|
51 |
|
Reclassification to earnings2 |
34 |
|
|
(8) |
|
|
26 |
|
| Other comprehensive income (loss), net |
101 |
|
|
(24) |
|
|
77 |
|
|
|
|
|
|
|
| Total other comprehensive income (loss), net |
$ |
128 |
|
|
$ |
(58) |
|
|
$ |
70 |
|
|
|
|
|
|
|
Year Ended April 30, 2023 |
|
|
|
|
|
| Currency translation adjustments: |
|
|
|
|
|
| Net gain (loss) on currency translation |
$ |
135 |
|
|
$ |
— |
|
|
$ |
135 |
|
| Reclassification to earnings |
— |
|
|
— |
|
|
— |
|
| Other comprehensive income (loss), net |
135 |
|
|
— |
|
|
135 |
|
| Cash flow hedge adjustments: |
|
|
|
|
|
| Net gain (loss) on hedging instruments |
3 |
|
|
(1) |
|
|
2 |
|
Reclassification to earnings1 |
(37) |
|
|
8 |
|
|
(29) |
|
| Other comprehensive income (loss), net |
(34) |
|
|
7 |
|
|
(27) |
|
| Postretirement benefits adjustments: |
|
|
|
|
|
| Net actuarial gain (loss) and prior service cost |
(26) |
|
|
6 |
|
|
(20) |
|
Reclassification to earnings2 |
38 |
|
|
(9) |
|
|
29 |
|
| Other comprehensive income (loss), net |
12 |
|
|
(3) |
|
|
9 |
|
|
|
|
|
|
|
| Total other comprehensive income (loss), net |
$ |
113 |
|
|
$ |
4 |
|
|
$ |
117 |
|
|
|
|
|
|
|
Year Ended April 30, 2024 |
|
|
|
|
|
| Currency translation adjustments: |
|
|
|
|
|
| Net gain (loss) on currency translation |
$ |
(16) |
|
|
$ |
(1) |
|
|
$ |
(17) |
|
Reclassification to earnings3 |
4 |
|
|
6 |
|
|
10 |
|
| Other comprehensive income (loss), net |
(12) |
|
|
5 |
|
|
(7) |
|
| Cash flow hedge adjustments: |
|
|
|
|
|
| Net gain (loss) on hedging instruments |
11 |
|
|
(2) |
|
|
9 |
|
Reclassification to earnings1 |
(12) |
|
|
3 |
|
|
(9) |
|
| Other comprehensive income (loss), net |
(1) |
|
|
1 |
|
|
— |
|
| Postretirement benefits adjustments: |
|
|
|
|
|
| Net actuarial gain (loss) and prior service cost |
22 |
|
|
(5) |
|
|
17 |
|
Reclassification to earnings2 |
6 |
|
|
(2) |
|
|
4 |
|
| Other comprehensive income (loss), net |
28 |
|
|
(7) |
|
|
21 |
|
|
|
|
|
|
|
| Total other comprehensive income (loss), net |
$ |
15 |
|
|
$ |
(1) |
|
|
$ |
14 |
|
|
|
|
|
|
|
1For 2022, $(2) of the pre-tax amount of $(7) is classified in other expense (income) in the accompanying consolidated statements of operations. Otherwise, the pre-tax amount for each year is classified as sales.
2Pre-tax amount is classified as non-operating postretirement expense in the accompanying consolidated statements of operations.
3Pre-tax amount is classified in gain on business divestitures in the accompanying consolidated statements of operations.
19. Supplemental Information
The following table presents net sales by geography:
|
|
|
|
|
|
|
|
|
|
|
|
|
|
|
|
|
|
|
2022 |
|
2023 |
|
2024 |
|
|
|
|
|
|
United States |
$ |
1,917 |
|
|
$ |
1,968 |
|
|
$ |
1,889 |
|
Mexico |
178 |
|
|
244 |
|
|
290 |
|
Germany |
228 |
|
|
239 |
|
|
263 |
|
Australia |
219 |
|
|
221 |
|
|
204 |
|
United Kingdom |
218 |
|
|
207 |
|
|
185 |
|
Other |
1,173 |
|
|
1,349 |
|
|
1,348 |
|
Total net sales |
$ |
3,933 |
|
|
$ |
4,228 |
|
|
$ |
4,178 |
|
Net sales are attributed to countries based on where customers are located. See Note 9 for additional information about net sales, including net sales by product category.
Our two largest customers accounted for 14% and 12% of consolidated net sales in 2022; 14% and 12% of consolidated net sales in 2023; and 13% and 11% of consolidated net sales in 2024.
The net book value of property, plant, and equipment located outside the United States was $204 and $255 as of April 30, 2023 and 2024, respectively. Other long-lived assets located outside the United States are not significant.
We have concluded that our business constitutes a single operating segment.
Item 9. Changes in and Disagreements with Accountants on Accounting and Financial Disclosure
None.
Item 9A. Controls and Procedures
Evaluation of Disclosure Controls and Procedures. Our management, with the participation of our Chief Executive Officer (CEO) and Chief Financial Officer (CFO) (our principal executive and principal financial officers), has evaluated the effectiveness of our disclosure controls and procedures (as defined in Rule 13a-15(e) under the Securities Exchange Act of 1934, as amended (the “Exchange Act”)) as of the end of fiscal 2023. Based on that evaluation, our CEO and CFO concluded that our disclosure controls and procedures: (a) are effective to ensure that information required to be disclosed by the Company in our reports filed or submitted under the Exchange Act is recorded, processed, summarized, and reported within the time periods specified in the SEC's rules and forms; and (b) include controls and procedures designed to ensure that information required to be disclosed by the Company in such reports is accumulated and communicated to the Company's management, including the CEO and the CFO, as appropriate, to allow timely decisions regarding required disclosure.
Changes in Internal Control over Financial Reporting. Except as described below, there has been no change in our internal control over financial reporting during the quarter ended April 30, 2024, that has materially affected, or is reasonably likely to materially affect, our internal control over financial reporting.
Management's Report on Internal Control over Financial Reporting and Report of Independent Registered Public Accounting Firm. Management's report on our internal control over financial reporting as of April 30, 2024, and our independent registered public accounting firm's report on our internal control over financial reporting are set forth in “Item 8. Financial Statements and Supplementary Data.”
Item 9B. Other Information
During the three months ended April 30, 2024, no director or officer of the Company adopted or terminated a “Rule 10b5-1 trading arrangement” or “non-Rule 10b5-1 trading arrangement,” as each term is defined in Item 408(a) of Regulation S-K.
Item 9C. Disclosure Regarding Foreign Jurisdictions that Prevent Inspections
Not applicable.
PART III
Item 10. Directors, Executive Officers, and Corporate Governance
Information on our Executive Officers is included under the caption “Information about Our Executive Officers” in Part I of this report. For the other information required by this item, see the following sections of our definitive proxy statement for the Annual Meeting of Stockholders to be held July 25, 2024 (“2024 Proxy Statement”), which information is incorporated into this report by reference: (a) “Proposal 1: Election of Directors” (for biographical information on directors and family relationships); (b) “Code of Conduct and Code of Ethics for Senior Financial Officers” (for information on our code of ethics); (c) “Selection of Directors” (for information on the procedures by which security holders may recommend nominees to the Company's Board of Directors); (d) “Board Committees” (for information on our Audit Committee), and (e) “Hedging, Derivatives and Short Sale Transactions Prohibited” (for information on our Insider Trading Policy).
Item 11. Executive Compensation
For the information required by this item, refer to the following sections of our 2024 Proxy Statement, which information is incorporated into this report by reference: (a) “Compensation Discussion and Analysis”; (b) “Compensation Tables”; (c) “Director Compensation”; (d) “Compensation Committee Interlocks and Insider Participation”; (e) “Compensation Committee Report”; and (f) “Pay Ratio Disclosure.”
Item 12. Security Ownership of Certain Beneficial Owners and Management and Related Stockholder Matters
The following table summarizes information as of April 30, 2024, about our equity compensation plans under which we have made grants of stock options, stock appreciation rights, restricted stock, market value units, performance units, or other equity awards.
|
|
|
|
|
|
|
|
|
|
|
|
|
|
|
|
|
|
|
|
|
|
|
|
| Plan Category |
|
Number of Securities to Be Issued Upon Exercise of Outstanding Options, Warrants and Rights1 |
|
Weighted-Average Exercise Price of Outstanding Options, Warrants and Rights2 |
|
Number of Securities Remaining Available for Future Issuance Under Equity Compensation Plans |
| Equity compensation plans approved by Class A common stockholders |
|
924,961 |
|
$55.38 |
|
11,269,299 |
1Includes 249,260 Class B common shares to be issued upon exercise of stock-settled stock appreciation rights (SSARs); 83,836 Class B restricted stock units (RSUs); 192,999 Class B performance-based restricted stock units (PBRSUs); 217,867 Class A PBRSUs; 150,658 Class A common deferred stock units (DSUs); and 30,341 Class B common DSUs issued under the Brown-Forman 2004, 2013 Omnibus, and 2022 Omnibus Compensation Plans. SSARs are exercisable for an amount of our common stock with a value equal to the increase in the fair market value of the common stock from the date the SSARs were granted. The fair market value of our common stock at fiscal year-end has been used for the purposes of reporting the number of shares to be issued upon exercise of the 3,753,996 SSARs outstanding at fiscal year-end.
2RSUs, PBRSUs and DSUs have no exercise price because their value depends on continued employment or service over time, and are to be settled for shares of Class B common stock. Accordingly, these have been disregarded for purposes of computing the weighted-average exercise price.
For the other information required by this item, refer to the section entitled “Stock Ownership” of our 2024 Proxy Statement, which information is incorporated into this report by reference.
Item 13. Certain Relationships and Related Transactions, and Director Independence
For the information required by this item, refer to the following sections of our 2024 Proxy Statement, which information is incorporated into this report by reference: (a) “Certain Relationships and Related Transactions”; and (b) “Our Independent Directors.”
Item 14. Principal Accountant Fees and Services
For the information required by this item, refer to the following sections of our 2024 Proxy Statement, which information is incorporated into this report by reference: (a) “Fees Paid to Independent Registered Public Accounting Firm”; and (b) “Audit Committee Pre-Approval Policies and Procedures.”
PART IV
Item 15. Exhibits and Financial Statement Schedules
|
|
|
|
|
|
|
|
|
| |
|
Page |
| (a)(1) |
Financial Statements |
|
|
The following documents are included in Item 8 of this report: |
|
|
|
|
|
|
|
|
|
|
|
|
|
|
|
|
|
|
|
|
|
|
| (a)(2) |
Financial Statement Schedule: |
|
|
|
|
We have omitted all other schedules for which provision is made in the applicable accounting regulations of the Securities and Exchange Commission either because they are not required under the related instructions, because the information required is included in the consolidated financial statements and notes thereto, or because they do not apply.
(a)(3) Exhibits:
The following documents are filed with this report:
|
|
|
|
|
|
| Exhibit Index |
| 19 |
|
| 21 |
|
| 23 |
|
| 31.1 |
|
| 31.2 |
|
| 32 |
|
| 97 |
|
| 101 |
The following materials from Brown-Forman Corporation's Annual Report on Form 10-K for the fiscal year ended April 30, 2024, in Inline XBRL (eXtensible Business Reporting Language) format: (a) Consolidated Statements of Operations, (b) Consolidated Statements of Comprehensive Income, (c) Consolidated Balance Sheets, (d) Consolidated Statements of Cash Flows, (e) Consolidated Statements of Stockholders’ Equity, and (f) Notes to Consolidated Financial Statements. |
| 104 |
Cover Page Interactive Data File in Inline XBRL format (included in Exhibit 101). |
The following documents have been previously filed:
|
|
|
|
|
|
|
| Exhibit Index |
|
| 3.1 |
|
|
| 3.2 |
|
|
| 3.3 |
|
|
| 4.1 |
|
|
| 4.2 |
|
|
| 4.3 |
|
|
| 4.4 |
|
|
| 4.5 |
|
|
| 4.6 |
|
|
| 4.7 |
|
|
| 4.8 |
|
|
| 4.9 |
|
|
| 4.10 |
|
|
|
|
|
|
|
|
|
| Exhibit Index |
|
| 4.11 |
|
|
| 4.12 |
|
|
| 4.13 |
|
|
| 4.14 |
Officer’s Certificate dated December 12, 2012, pursuant to Sections 1.01, 2.02, 3.01, and 3.03 of the Indenture dated as of April 2, 2007, as supplemented by the First Supplemental Indenture dated as of December 13, 2010, between Brown-Forman Corporation and U.S. Bank National Association, as Trustee, setting forth the terms of the 3.75% Notes due 2043, incorporated into this report by reference to Exhibit 4.3 of Brown-Forman Corporation’s Form 8-K filed on December 12, 2012 (File No. 002-26821). |
|
| 4.15 |
Officer’s Certificate dated June 29, 2015, pursuant to Sections 1.02, 2.02, 3.01 and 3.03 of the Indenture dated as of April 2, 2007, as supplemented by the First Supplemental Indenture dated as of December 13, 2010, and the Second Supplemental Indenture dated as of June 24, 2015, between Brown-Forman Corporation and U.S. Bank National Association, as Trustee, setting forth the terms of the 4.500% Notes due 2045, incorporated into this report by reference to Exhibit 4.4 of Brown-Forman Corporation’s Form 8-K filed on June 29, 2015 (File No. 002-26821). |
|
| 4.16 |
Officers’ Certificate dated July 7, 2016, pursuant to Sections 1.01, 2.02, 3.01, and 3.03 of the Indenture dated as of April 2, 2007, as supplemented by the First Supplemental Indenture dated as of December 13, 2010, and the Second Supplemental Indenture dated as of June 24, 2015, between Brown-Forman Corporation and U.S. Bank National Association, as Trustee, setting forth the terms of the 1.200% Notes due 2026 and the 2.600% Notes due 2028, incorporated into this report by reference to Exhibit 4.4 of Brown-Forman Corporation’s Form 8-K filed on July 8, 2016 (File No. 002-26821). |
|
| 4.17 |
Officers’ Certificate dated March 26, 2018, pursuant to Sections 1.02, 2.02, 3.01, and 3.03 of the Indenture dated April 2, 2007, as supplemented by the First Supplemental Indenture dated as of December 13, 2010, and the Second Supplemental Indenture dated as of June 24, 2015, between Brown-Forman Corporation and U.S. Bank National Association, as Trustee, setting forth the terms of the 3.500% Note due 2025 and the 4.000% Note due 2038, incorporated into this report by reference to Exhibit 4.4 of Brown-Forman Corporation’s Form 8-K filed on March 26, 2018 (File No. 001-00123). |
|
| 4.18 |
Officers’ Certificate, dated March 23, 2023, pursuant to Sections 1.01, 2.02, 3.01, and 3.03 of the Indenture dated April 2, 2007, as supplemented by the First Supplemental Indenture, dated as of December 13, 2010, and the Second Supplemental Indenture, dated as of June 24, 2015, between Brown-Forman Corporation and U.S. Bank Trust Company, National Association (as successor in interest to U.S. Bank National Association), as Trustee, setting forth the terms of the 4.750% Notes due 2033, incorporated into this report by reference to Exhibit 4.4 of Brown-Forman Corporation’s Form 8-K filed on March 23, 2023 (File No. 001-00123). |
|
| 10.1 |
|
|
| 10.2 |
|
|
| 10.3 |
|
|
| 10.4 |
|
|
| 10.5 |
|
|
| 10.6 |
|
|
| 10.7 |
|
|
| 10.8 |
|
|
| 10.9 |
|
|
|
|
|
|
|
|
|
| Exhibit Index |
|
| 10.10 |
|
|
| 10.11 |
|
|
| 10.12 |
|
|
| 10.13 |
|
|
| 10.14 |
|
|
| 10.15 |
|
|
| 10.16 |
|
|
| 10.17 |
|
|
| 10.18 |
|
|
| 10.19 |
|
|
| 10.20 |
|
|
|
|
|
|
|
|
|
|
|
| * |
Indicates management contract, compensatory plan, or arrangement. |
Item 16. Form 10-K Summary Pursuant to the requirements of Section 13 or 15(d) of the Securities Exchange Act of 1934, the registrant has duly caused this report to be signed on its behalf by the undersigned, thereunto duly authorized.
None.
SIGNATURES
|
|
|
|
|
|
|
|
|
|
|
BROWN-FORMAN CORPORATION
(Registrant)
|
|
|
/s/ Lawson E. Whiting |
|
By: |
Lawson E. Whiting |
|
|
President and Chief Executive Officer |
Date: June 14, 2024
Pursuant to the requirements of the Securities Exchange Act of 1934, this report has been signed below by the following persons on behalf of the registrant and in the capacities on June 14, 2024, as indicated.
|
|
|
|
|
|
|
|
|
| Signature |
|
Title |
| /s/ Campbell P. Brown |
|
Director, Chair of the Board |
| Campbell P. Brown |
|
|
|
|
|
| /s/ Lawson E. Whiting |
|
Director, President and Chief Executive Officer of the Company |
| Lawson E. Whiting |
|
(Principal Executive Officer) |
|
|
|
/s/ Elizabeth M. Brown |
|
Director |
Elizabeth M. Brown |
|
|
|
|
|
| /s/ Stuart R. Brown |
|
Director |
| Stuart R. Brown |
|
|
|
|
|
| /s/ Mark A. Clouse |
|
Director |
| Mark A. Clouse |
|
|
|
|
|
| /s/ Marshall B. Farrer |
|
Director |
| Marshall B. Farrer |
|
|
|
|
|
| /s/ Michael J. Roney |
|
Director |
| Michael J. Roney |
|
|
|
|
|
| /s/ Jan E. Singer |
|
Director |
| Jan E. Singer |
|
|
|
|
|
| /s/ Tracy L. Skeans |
|
Director |
| Tracy L. Skeans |
|
|
|
|
|
|
|
|
|
|
|
|
|
|
| Signature |
|
Title |
| /s/ Elizabeth A. Smith |
|
Director |
| Elizabeth A. Smith |
|
|
|
|
|
| /s/ Michael A. Todman |
|
Director |
| Michael A. Todman |
|
|
|
|
|
| /s/ Leanne D. Cunningham |
|
Executive Vice President and Chief Financial Officer |
| Leanne D. Cunningham |
|
(Principal Financial Officer) |
|
|
|
| /s/ Kelli N. Brown |
|
Senior Vice President and Chief Accounting Officer |
| Kelli N. Brown |
|
(Principal Accounting Officer) |
|
|
|
Brown-Forman Corporation and Subsidiaries
Schedule II – Valuation and Qualifying Accounts
For the Years Ended April 30, 2022, 2023, and 2024
(Expressed in millions)
|
|
|
|
|
|
|
|
|
|
|
|
|
|
|
|
|
|
|
|
|
|
|
|
|
|
|
|
|
|
| Col. A |
Col. B |
|
Col. C(1) |
|
Col. C(2) |
|
Col. D |
|
Col. E |
| Description |
Balance at
Beginning
of Period |
|
Additions
Charged to
Costs and
Expenses |
|
Additions
Charged to
Other
Accounts |
|
Deductions |
|
Balance
at End
of Period |
| 2022 |
|
|
|
|
|
|
|
|
|
| Allowance for doubtful accounts |
$ |
7 |
|
|
$ |
7 |
|
|
$ |
— |
|
|
$ |
1 |
|
(1) |
$ |
13 |
|
|
|
|
|
|
|
|
|
|
|
| Deferred tax valuation allowance |
$ |
20 |
|
|
$ |
8 |
|
|
$ |
— |
|
|
$ |
1 |
|
|
$ |
27 |
|
| 2023 |
|
|
|
|
|
|
|
|
|
| Allowance for doubtful accounts |
$ |
13 |
|
|
$ |
— |
|
|
$ |
— |
|
|
$ |
6 |
|
(1) |
$ |
7 |
|
| Deferred tax valuation allowance |
$ |
27 |
|
|
$ |
4 |
|
|
$ |
— |
|
|
$ |
17 |
|
|
$ |
14 |
|
| 2024 |
|
|
|
|
|
|
|
|
|
| Allowance for doubtful accounts |
$ |
7 |
|
|
$ |
1 |
|
|
$ |
— |
|
|
$ |
— |
|
|
$ |
8 |
|
| Deferred tax valuation allowance |
$ |
14 |
|
|
$ |
2 |
|
|
$ |
2 |
|
|
$ |
2 |
|
|
$ |
16 |
|
(1)Doubtful accounts written off, net of recoveries.
EX-19
2
insidertradingpolicy.htm
EX-19
Document
Exhibit 19
Brown-Forman Corporation
Insider Trading Policy
All Officers, Employees and Directors
POLICY PURPOSE
This Insider Trading Policy (the “Policy”) provides guidelines with respect to transactions in the securities of Brown-Forman Corporation (the “Company”) and the handling of confidential information about the Company and others with which the Company does business. The Company’s Board of Directors has adopted this Policy to promote compliance with federal, state and foreign securities laws that prohibit certain persons who are aware of material nonpublic information about a company from: (i) trading in securities of that company; or (ii) providing material nonpublic information to other persons who may trade on the basis of that information.
PERSONS SUBJECT TO THE POLICY
This Policy applies to all officers of the Company and its subsidiaries, all members of the Company’s Board of Directors and all employees of the Company and its subsidiaries. This Policy also applies to family members, other members of a person’s household and entities controlled by a person covered by this Policy, as described below. From time to time, the Company may also determine that other persons should be subject to this Policy, such as contractors or consultants who have access to material nonpublic information.
TRANSACTIONS SUBJECT TO THE POLICY
This Policy applies to all transactions in the Company’s securities (collectively referred to in this Policy as “Company Securities”), including purchases, sales, gifts or any other transfers of the Company’s Class A and Class B common stock, options to purchase Company Securities, stock-settled stock appreciation rights and any other securities the Company may issue from time to time, such as warrants and convertible debentures, as well as derivative securities relating to the Company's common stock, whether or not issued by the Company.
INDIVIDUAL RESPONSIBILITY
Persons subject to this Policy have ethical and legal obligations (i) to maintain the confidentiality of information about the Company and (ii) not to engage in transactions in Company Securities while in possession of material nonpublic information. In all cases, the responsibility for determining whether an individual is in possession of material nonpublic information rests with that individual. Neither this Policy nor any action by the Company, the Securities Law Compliance Officer or any other employee or director pursuant to this Policy (or otherwise) constitutes legal advice or insulates an individual from liability under applicable securities laws. Violators of this Policy could be subject to severe legal penalties and disciplinary action by the Company for any conduct prohibited by this Policy or applicable securities laws, as described below in more detail under the heading “Consequences for Failure to Comply.”
ADMINISTRATION OF THE POLICY
The Securities Law Compliance Officer of the Company shall be designated by the Company’s General Counsel and shall serve as the Compliance Officer for the purposes of this Policy until his or her replacement by the General Counsel. In his or her absence, another employee designated by the Securities Law Compliance Officer shall be responsible for administration of this Policy. All determinations and interpretations by the Compliance Officer shall be final and not subject to further review.
POLICY STATEMENT
It is the policy of the Company that no director, officer or employee of the Company (or any other person designated by this Policy or by the Compliance Officer as subject to this Policy) who is aware of material nonpublic information relating to the Company may, directly or indirectly through family members or other persons or entities:
•Purchase, sell, or otherwise engage in transactions in Company Securities, except as otherwise specified in this Policy;
•Recommend the purchase or sale of any Company Securities;
•Disclose material nonpublic information to persons within the Company whose jobs do not require them to have that information, or outside of the Company to other persons, including, without limitation, family, friends, business associates, investors and expert consulting firms, unless any such disclosure is made in accordance with the Company’s policies regarding the protection or authorized external disclosure of information regarding the Company; or
•Assist anyone engaged in the above activities.
In addition, it is the policy of the Company that no director, officer or other employee of the Company (or any other person designated as subject to this Policy) who, in the course of working for the Company, learns of material nonpublic information about a company with which the Company does business, including a customer or supplier of the Company, may trade in that company’s securities until the information becomes public or is no longer material.
There are no exceptions to this Policy except as specifically noted herein. Transactions that may be necessary or justifiable for independent reasons (such as the need to raise money for an emergency expenditure), or small transactions, are not excepted from this Policy. The securities laws do not recognize any mitigating circumstances, and, in any event, even the appearance of an improper transaction must be avoided to preserve the Company’s reputation for adhering to the highest standards of conduct.
DEFINITION OF MATERIAL NONPUBLIC INFORMATION
What is Material Information? Information is considered “material” if a reasonable investor would consider that information important in making a decision to buy, hold or sell securities. Any information that could be expected to affect the Company’s stock price, whether it is positive or negative, should be considered material. There is no bright-line standard for assessing materiality; rather, materiality is based on an assessment of all of the facts and circumstances and is often evaluated by enforcement authorities with the benefit of hindsight. While it is not possible to define all categories of material information, some examples of information that ordinarily would be regarded as material are:
•Unpublished financial results;
•Projections of future earnings or losses;
•Changes in earnings projections;
•News of a proposed brand acquisition, business acquisition, joint venture or sale;
•Development of a significant new product or brand extension;
•Changes in the Company’s pricing or cost structure;
•Major marketing changes;
•Company restructuring;
•Changes in senior management;
•Major developments regarding customers or suppliers;
•Significant related party transactions;
•Events relating to the Company’s Securities (e.g., dividend policy changes, new offerings, stock splits, calls for redemption, repurchase plans, changes in the rights of securities holders); and
•Any confidential investigations of the Company or related to the Company’s Securities.
When is Information is Considered Nonpublic? Information that has not been disclosed to the public is generally considered to be nonpublic information. In order to establish that the information has been disclosed to the public, it may be necessary to demonstrate that the information has been widely disseminated. Information generally would be considered widely disseminated if it has been disclosed through the Dow Jones “broad tape,” newswire services, a broadcast on widely-available radio or television programs, publication in a widely-available newspaper, magazine or news website, or public disclosure documents filed with the Securities and Exchange Commission (“SEC”) that are available on the SEC’s website. By contrast, information would likely not be considered widely disseminated if it is available only to the Company’s employees, or if it is only available to a select group of analysts, brokers and institutional investors.
Once information is widely disseminated, it is still necessary to afford the investing public with sufficient time to absorb the information. As a general rule, information should not be considered fully absorbed by the marketplace until after the second full trading day after the day on which the information is released. If, for example, the Company were to make an announcement on a Wednesday, you should not trade in Company Securities until Monday. Depending on the particular circumstances, the Company may determine that a longer or shorter period should apply to the release of specific material nonpublic information.
TRANSACTIONS BY YOUR FAMILY MEMBERS AND OTHERS
This Policy applies to your family members who reside with you (including a spouse, a child, a child away at college, stepchildren, grandchildren, parents, stepparents, grandparents, siblings and in-laws), anyone else who lives in your household and any family members who do not live in your household but whose transactions in Company Securities are directed by you or are subject to your influence or control, such as parents or children who consult with you before they trade in Company Securities (collectively referred to as “Family Members”). You are responsible for the transactions of these other persons and therefore should make them aware of the need to confer with you before they trade in Company Securities, and you should treat all such transactions for the purposes of this Policy and applicable securities laws as if the transactions were for your own account. This Policy does not, however, apply to personal securities transactions of Family Members where the purchase or sale decision is made by a third party not controlled by, influenced by or related to you or your Family Members.
TRANSACTIONS BY ENTITIES THAT YOU INFLUENCE OR CONTROL
This Policy applies to any entities that you influence or control, including any corporations, limited liability companies, partnerships, or trusts (collectively referred to as “Controlled Entities”). Transactions by these Controlled Entities are treated for the purposes of this Policy and applicable securities laws as if they were for your own account.
TRANSACTIONS UNDER THE COMPANY’S COMPENSATION PLANS
This Policy does not apply to the following transactions, except as specifically noted:
Restricted Stock/Unit Awards. This Policy does not apply to the vesting of restricted stock/units, or to your election to have the Company withhold shares of stock to satisfy tax withholding requirements upon the vesting of any restricted stock/units. The Policy does apply, however, to any market sale of stock received upon vesting, including a market sale for the purpose of generating the cash needed to pay taxes.
Stock-Settled Stock Appreciation Rights (“SSARs”). This Policy does not apply to the exercise of an SSAR acquired pursuant to the Company’s plans, or to your election to have the Company withhold shares subject to a SSAR to satisfy tax withholding requirements. This Policy does apply, however, to any market sale of the underlying stock following exercise, any sale as part of a broker-assisted cashless exercise of a SSAR, or any other market sale for the purpose of generating the cash needed to pay taxes.
Stock Option Exercises. This Policy does not apply to the exercise of an employee stock option acquired pursuant to the Company’s plans, or to your election to have the Company withhold shares subject to an option to satisfy tax withholding requirements. This Policy does apply, however, to any market sale of the underlying stock following exercise, any sale as part of a broker-assisted cashless exercise of an option, or any other market sale for the purpose of generating the cash needed to pay the exercise price of an option or taxes.
401(k) Plan. At various times, it has been possible to invest contributions to the Company’s 401(k) plan in Company Securities, such as through a Company stock fund. This Policy does not apply to investments in the Company stock fund made by periodic contributions to the Company’s 401(k) plan through payroll deduction, if such investments are available. This Policy does apply, however, to certain elections you may make under the 401(k) plan, including: (a) an election to increase or decrease the percentage of your periodic contributions that will be allocated to the Company stock fund; (b) an election to make an intra-plan transfer of an existing account balance into or out of the Company stock fund; (c) an election to borrow money against your 401(k) plan account if the loan will result in a liquidation of some or all of your Company stock fund balance; and (d) an election to pre-pay a plan loan if the pre-payment will result in allocation of loan proceeds to the Company stock fund.
Employee Stock Purchase Plan. This Policy does not apply to purchases of Company Securities (Class B common stock) in the Employee Stock Purchase Plan resulting from your periodic contribution of money to such plan pursuant to the election you made at the time of your enrollment in such plan. This Policy also does not apply to purchases of Company Securities resulting from lump sum contributions to an employee stock purchase plan, provided that you elected to participate by lump sum payment at the beginning of the applicable enrollment period. This Policy does apply, however, to your election to participate in any employee stock purchase plan for any enrollment period and to your sales of Company Securities purchased pursuant to the plan.
Dividend Reinvestment Plan. This Policy does not apply to purchases of Company Securities under the Company’s dividend reinvestment plan resulting from your reinvestment of dividends paid on Company Securities. This Policy does apply, however, to voluntary purchases of Company Securities resulting from additional contributions you choose to make to the dividend reinvestment plan, and to your election to participate in the plan or increase your level of participation in the plan. This Policy also applies to your sale of any Company Securities purchased pursuant to the plan.
Mutual Funds. The Policy does not apply to transactions in mutual funds that are invested in Company Securities.
SPECIAL AND PROHIBITED TRANSACTIONS
The Company has determined that there is a heightened legal risk and/or the appearance of improper or inappropriate conduct if the persons subject to this Policy engage in transactions related to the Company’s Securities described below:
Short Sales. “Short” sales of stock (transactions where a person borrows stock, sells it, and then buys stock at a later date to replace the borrowed shares) are prohibited by this Policy. In addition, Section 16(c) of the Securities Exchange Act of 1934, as amended (the “Exchange Act”) prohibits officers and directors from engaging in short sales.
Publicly-Traded Options. A put is an option or right to sell a specific stock at a specific price before a set date, and a call is an option or right to buy a specific stock at a specific price before a set date. Transactions in put options, call options or other derivative securities, on an exchange or in any other organized market, are prohibited by this Policy.
Hedging Transactions. Hedging or monetization transactions can be accomplished through a number of possible mechanisms, including through the use of financial instruments such as prepaid variable forwards, equity swaps, and collars. Directors, officers and employees are prohibited from engaging in any such transactions.
Standing and Limit Orders. Standing and limit orders (except standing and limit orders under approved Rule 10b5-1 Plans, as described below) create heightened risks for insider trading violations similar to the use of margin accounts. There is no control over the timing of purchases or sales that result from standing instructions to a broker, and as a result the broker could execute a transaction when a director, officer or other employee is in possession of material nonpublic information. While standing or limit orders are not prohibited under this Policy, the Company discourages them. If a person subject to this Policy determines that they must use a standing or limit order, the order should be of short duration and should otherwise comply with the restrictions and procedures outlined below under the heading “Additional Procedures.”
ADDITIONAL PROCEDURES
The Company has established additional procedures in order to assist the Company in the administration of this Policy, to facilitate compliance with laws prohibiting insider trading by persons in possession of material nonpublic information, and to avoid the appearance of any impropriety. These additional procedures are applicable only to those individuals described below. Whether or not these procedures apply to you, you should not trade while aware of material nonpublic information.
Pre-Clearance Procedures. The persons designated by the Compliance Officer as being subject to these procedures, as well as the Family Members and Controlled Entities of such persons, may not engage in any transaction in Company Securities without first obtaining pre-clearance of the transaction from the Compliance Officer. A request for pre-clearance should be submitted in writing or via e-mail to the Compliance Officer at least two (2) business days in advance of the proposed transaction. The Compliance Officer is under no obligation to approve a transaction submitted for pre-clearance and may determine not to permit the transaction. If a person seeking pre-clearance is denied permission to engage in the transaction, then he or she should refrain from initiating any transaction in Company Securities and should not inform any other person of the restriction.
When a request for pre-clearance is made, the requestor should carefully consider whether he or she may be aware of any material nonpublic information about the Company and should describe fully those circumstances to the Compliance Officer. Pre-clearance is required whether or not the Company is in a “Blackout Period” or other period of restricted trading.
Quarterly Trading Restrictions. The persons designated by the Compliance Officer as subject to this restriction, as well as their Family Members or Controlled Entities, may not conduct any transactions involving the Company’s Securities (other than as specified by this Policy), during a “Blackout Period” beginning on the 16th calendar day of the last month in each fiscal quarter (April 16th, July 16th, October 16th and January 16th) and ending at the close of trading on the second full trading day following the date of the public release of the Company’s earnings results for that quarter. In other words, these persons may only conduct transactions in Company Securities during the “Window Period” beginning on the third trading day following the public release of the Company’s quarterly earnings and ending on the 16th calendar day of the last month of the next fiscal quarter.
Under certain very limited circumstances, a person subject to this restriction may be permitted to trade during a Blackout Period, but only if the Compliance Officer concludes that the person does not in fact possess material nonpublic information. Persons wishing to trade during a Blackout Period must contact the Compliance Officer for approval at least two business days in advance of any proposed transaction involving Company Securities.
Event-Specific Trading Restriction Periods. From time to time, an event may occur that is material to the Company and is known by only a small group of directors, officers and/or employees. So long as the event remains material and nonpublic, the persons designated by the Compliance Officer may not trade Company Securities. In addition, the Company’s financial results may be sufficiently material in a particular fiscal quarter that, in the judgment of the Compliance Officer, designated persons should refrain from trading in Company Securities in advance of the typical Blackout Period described above. In that situation, the Compliance Officer may notify these persons that they should not trade in the Company’s Securities without disclosing the reason for the restriction. The existence of an event-specific trading restriction period or extension of a Blackout Period will not be announced to the Company as a whole and should not be communicated to any other person. Exceptions will not be granted during an event-specific trading restriction period.
Exceptions. The quarterly trading restrictions and event-specific trading restrictions do not apply to those transactions to which this Policy does not apply, as described above under the headings “Transactions Under Company Compensation Plans.” Further, the requirement for pre-clearance, the quarterly trading restrictions and the event-specific trading restrictions do not apply to transactions conducted pursuant to approved Rule 10b5-1 plans, described under the heading “Rule 10b5-1 Plans.”
RULE 10b5-1 PLANS
Rule 10b5-1 under the Exchange Act provides a defense from insider trading liability under Rule 10b-5. In order to be eligible to rely on this defense, a person subject to this Policy must enter into a Rule 10b5-1 plan for transactions in Company Securities that meets certain conditions specified in the Rule (a “Rule 10b5-1 Plan”). If the plan meets the requirements of Rule 10b5-1, Company Securities may be purchased or sold, gifted or traded without regard to certain insider trading restrictions. To comply with the Policy, a Rule 10b5-1 Plan must be approved by the Compliance Officer and meet the requirements of Rule 10b5-1. In general, a Rule 10b5-1 Plan must be entered into in good faith and at a time when the person entering into the plan is not aware of material nonpublic information, and the plan must include the person’s certification to this effect. Once the plan is adopted, the person must not exercise any influence over the amount of securities to be traded, the price at which they are to be traded or the date of the trade. The plan must either specify the amount, pricing and timing of transactions in advance or delegate discretion on these matters to an independent third party. After adoption of the plan, trading under the plan may not begin until after a lengthy “cooling off” period prescribed by SEC rules.
Any Rule 10b5-1 Plan must be submitted for approval ten (10) days prior to the entry into the Rule 10b5-1 Plan. The plan details must be coordinated closely with the Compliance Officer to confirm compliance with the Company’s disclosure requirements and other SEC rules regarding Rule 10b5-1 plans. While no further pre-approval of transactions conducted pursuant to the Rule 10b5-1 Plan will be required, the Compliance Officer must be notified immediately upon any trade occurring under a Rule 10b5-1 plan in order to assist with disclosure obligations relating to each trade. No amendment, modification or termination of a Rule 10b5-1 Plan is permitted unless approved by the Compliance Officer.
POST-TERMINATION TRANSACTIONS
This Policy continues to apply to transactions in Company Securities even after termination of service to the Company. If an individual is in possession of material nonpublic information when his or her service terminates, that individual may not trade in Company Securities until that information has become public or is no longer material. The pre-clearance procedures specified under the heading “Additional Procedures” above, however, will cease to apply to transactions in Company Securities upon the expiration of any Blackout Period or other Company-imposed trading restrictions applicable at the time of the termination of service.
CONSEQUENCES FOR FAILURE TO COMPLY
The purchase, sale, gift or trade of securities by a person aware of material nonpublic information, or the disclosure of material nonpublic information to others who then trade in the Company’s Securities, is prohibited by federal and state laws and by the laws of foreign jurisdictions. Insider trading violations are pursued vigorously by the SEC and by federal and state enforcement authorities. Punishment for insider trading violations is severe and could include significant fines and imprisonment. The federal securities laws also impose potential liability on companies and other “controlling persons” if they fail to take reasonable steps to prevent insider trading by company personnel.
In addition, an individual’s failure to comply with this Policy may subject the individual to Company-imposed sanctions, including dismissal for cause, whether or not the employee’s failure to comply results in a violation of law.
COMPANY ASSISTANCE
Any person who has a question about this Policy or its application to any proposed transaction may obtain additional guidance from the Securities Law Compliance Officer. In the event of new Securities Law Compliance Officer is appointed by the General Counsel, the name and contact information for the new designee will be identified in the next quarterly Company blackout period memorandum.
CERTIFICATION
All persons subject to this Policy must certify their understanding of, and intent to comply with, this Policy.
Effective January 23, 2024 Securities Law Compliance Officer See also: Code of Conduct
EX-21
3
bfb-ex21_2024430x10kapril.htm
EX-21
Document
Exhibit 21
SUBSIDIARIES OF BROWN-FORMAN CORPORATION
As of April 30, 2024
|
|
|
|
|
|
|
|
|
State or Jurisdiction |
| Name |
|
Of Incorporation |
|
|
|
| Amercain Investments, C.V. |
|
Netherlands |
| AMG Trading, L.L.C. |
|
Delaware |
| The BenRiach Distillery Company Limited |
|
Scotland |
|
|
|
|
|
|
|
|
|
|
|
|
|
|
|
| Brown-Forman Australia Pty. Ltd. |
|
Australia |
| Brown-Forman Beverages Europe, Ltd. |
|
United Kingdom |
|
|
|
|
|
|
|
|
|
| Brown-Forman Beverages Worldwide, Comercio de Bebidas Ltda. |
|
Brazil |
|
|
|
|
|
|
|
|
|
| Brown-Forman Deutschland GmbH |
|
Germany |
|
|
|
| Brown-Forman France |
|
France |
|
|
|
| Brown-Forman Holding Mexico S.A. de C.V. |
|
Mexico |
|
|
|
| Brown-Forman Hungary 1 Kft. |
|
Hungary |
|
|
|
|
|
|
|
|
|
|
|
|
|
|
|
| Brown-Forman Korea Ltd. |
|
Korea |
|
|
|
|
|
|
|
|
|
| Brown-Forman Netherlands, B.V. |
|
Netherlands |
|
|
|
| Brown-Forman Polska Sp. z o.o. |
|
Poland |
|
|
|
|
|
|
|
|
|
| Brown-Forman Scotland Limited |
|
Scotland |
|
|
|
| Brown-Forman Spain, S.L. |
|
Spain |
| Brown-Forman Spirits (Shanghai) Co., Ltd. |
|
China |
| Brown-Forman Spirits Trading, L.L.C. |
|
Turkey |
| Brown-Forman Tequila Mexico, S. de R.L. de C.V. |
|
Mexico |
|
|
|
|
|
|
|
|
|
|
|
|
|
|
|
|
|
|
| Diplomatico Branding Unipessoal, Lda. |
|
Portugal |
| International Rum & Spirits Distributors Unipessoal, S.A. |
|
Portugal |
| Jack Daniel Distillery, Lem Motlow, Prop., Inc. |
|
Tennessee |
|
|
|
|
|
|
|
|
|
|
|
|
|
|
|
|
|
|
|
|
|
| Valle de Amatitan, S.A. de C.V. |
|
Mexico |
|
|
|
The names of certain subsidiaries are omitted from the above listing because such subsidiaries, considered in the aggregate as a single subsidiary, would not constitute a "significant subsidiary" under Rule 1-02(w) of Regulation S-K.
EX-23
4
bfb-ex23_2024430x10kapril.htm
EX-23
Document
Exhibit 23
Consent of Independent Registered Public Accounting Firm
We consent to the incorporation by reference in the following Registration Statements:
(1)Registration Statement (Form S-8 No. 333-253992) pertaining to the Brown-Forman Corporation Savings Plan for Collectively Bargained Employees and the Brown-Forman Corporation Savings Plan,
(2)Registration Statement (Form S-8 No. 333-169564) pertaining to the Brown-Forman Corporation Nonqualified Savings Plan,
(3)Registration Statement (Form S-8 No. 333-190122) pertaining to Brown-Forman Corporation 2013 Omnibus Compensation Plan and 2022 Omnibus Compensation Plan, and
(4)Registration Statement (Form S-3 No. 333-270365) of Brown-Forman Corporation;
of our reports dated June 14, 2024, with respect to the consolidated financial statements and financial statement schedule of Brown-Forman Corporation and Subsidiaries and the effectiveness of internal control over financial reporting of Brown-Forman Corporation and Subsidiaries included in this Annual Report (Form 10-K) of Brown-Forman Corporation for the year ended April 30, 2024.
/s/ Ernst & Young LLP
Louisville, Kentucky
June 14, 2024
EX-31.1
5
bfb-ex311_2024430x10kapril.htm
EX-31.1
Document
Exhibit 31.1
CERTIFICATION PURSUANT TO SECTION 302 OF SARBANES-OXLEY ACT OF 2002
I, Lawson E. Whiting, certify that:
1. I have reviewed this Annual Report on Form 10-K of Brown-Forman Corporation;
2. Based on my knowledge, this report does not contain any untrue statement of a material fact or omit to state a material fact necessary to make the statements made, in light of the circumstances under which such statements were made, not misleading with respect to the period covered by this report;
3. Based on my knowledge, the financial statements, and other financial information included in this report, fairly present in all material respects the financial condition, results of operations and cash flows of the registrant as of, and for, the periods presented in this report;
4. The registrant's other certifying officer and I are responsible for establishing and maintaining disclosure controls and procedures (as defined in Exchange Act Rules 13a-15(e) and 15d-15(e)) and internal control over financial reporting (as defined in Exchange Act Rules 13a-15(f) and 15d-15(f)) for the registrant and have:
a) Designed such disclosure controls and procedures, or caused such disclosure controls and procedures to be designed under our supervision, to ensure that material information relating to the registrant, including its consolidated subsidiaries, is made known to us by others within those entities, particularly during the period in which this report is being prepared;
b) Designed such internal control over financial reporting, or caused such internal control over financial reporting to be designed under our supervision, to provide reasonable assurance regarding the reliability of financial reporting and the preparation of financial statements for external purposes in accordance with generally accepted accounting principles;
c) Evaluated the effectiveness of the registrant's disclosure controls and procedures and presented in this report our conclusions about the effectiveness of the disclosure controls and procedures, as of the end of the period covered by this report based on such evaluation; and
d) Disclosed in this report any change in the registrant’s internal control over financial reporting that occurred during the registrant’s most recent fiscal quarter (the registrant’s fourth fiscal quarter in the case of an annual report) that has materially affected, or is reasonably likely to materially affect, the registrant’s internal control over financial reporting; and
5. The registrant's other certifying officer and I have disclosed, based on our most recent evaluation of internal control over financial reporting, to the registrant's auditors and the audit committee of the registrant's board of directors (or persons performing the equivalent functions):
a) All significant deficiencies and material weaknesses in the design or operation of internal control over financial reporting which are reasonably likely to adversely affect the registrant's ability to record, process, summarize and report financial information; and
b) Any fraud, whether or not material, that involves management or other employees who have a significant role in the registrant's internal control over financial reporting.
|
|
|
|
|
|
|
|
|
|
|
|
| Dated: |
June 14, 2024 |
By: |
/s/ Lawson E. Whiting |
|
|
|
Lawson E. Whiting |
|
|
|
President and Chief Executive Officer |
EX-31.2
6
bfb-ex312_2024430x10kapril.htm
EX-31.2
Document
Exhibit 31.2
CERTIFICATION PURSUANT TO SECTION 302 OF SARBANES-OXLEY ACT OF 2002
I, Leanne D. Cunningham, certify that:
1. I have reviewed this Annual Report on Form 10-K of Brown-Forman Corporation;
2. Based on my knowledge, this report does not contain any untrue statement of a material fact or omit to state a material fact necessary to make the statements made, in light of the circumstances under which such statements were made, not misleading with respect to the period covered by this report;
3. Based on my knowledge, the financial statements, and other financial information included in this report, fairly present in all material respects the financial condition, results of operations and cash flows of the registrant as of, and for, the periods presented in this report;
4. The registrant's other certifying officer and I are responsible for establishing and maintaining disclosure controls and procedures (as defined in Exchange Act Rules 13a-15(e) and 15d-15(e)) and internal control over financial reporting (as defined in Exchange Act Rules 13a-15(f) and 15d-15(f)) for the registrant and have:
a) Designed such disclosure controls and procedures, or caused such disclosure controls and procedures to be designed under our supervision, to ensure that material information relating to the registrant, including its consolidated subsidiaries, is made known to us by others within those entities, particularly during the period in which this report is being prepared;
b) Designed such internal control over financial reporting, or caused such internal control over financial reporting to be designed under our supervision, to provide reasonable assurance regarding the reliability of financial reporting and the preparation of financial statements for external purposes in accordance with generally accepted accounting principles;
c) Evaluated the effectiveness of the registrant's disclosure controls and procedures and presented in this report our conclusions about the effectiveness of the disclosure controls and procedures, as of the end of the period covered by this report based on such evaluation; and
d) Disclosed in this report any change in the registrant’s internal control over financial reporting that occurred during the registrant’s most recent fiscal quarter (the registrant’s fourth fiscal quarter in the case of an annual report) that has materially affected, or is reasonably likely to materially affect, the registrant’s internal control over financial reporting; and
5. The registrant's other certifying officer and I have disclosed, based on our most recent evaluation of internal control over financial reporting, to the registrant's auditors and the audit committee of the registrant's board of directors (or persons performing the equivalent functions):
a) All significant deficiencies and material weaknesses in the design or operation of internal control over financial reporting which are reasonably likely to adversely affect the registrant's ability to record, process, summarize and report financial information; and
b) Any fraud, whether or not material, that involves management or other employees who have a significant role in the registrant's internal control over financial reporting.
|
|
|
|
|
|
|
|
|
|
|
|
| Dated: |
June 14, 2024 |
By: |
/s/ Leanne D. Cunningham |
|
|
|
Leanne D. Cunningham |
|
|
|
Executive Vice President and Chief Financial Officer |
EX-32
7
bfb-ex32_2024430x10kapril.htm
EX-32
Document
Exhibit 32
CERTIFICATION PURSUANT TO 18 U.S.C. SECTION 1350, AS ADOPTED PURSUANT TO SECTION 906 OF THE SARBANES-OXLEY ACT OF 2002
In connection with the Annual Report of Brown-Forman Corporation (“the Company”) on Form 10-K for the period ended April 30, 2024, as filed with the Securities and Exchange Commission on the date hereof (the “Report”), each of the undersigned hereby certifies, pursuant to 18 U.S.C. Section 1350, as adopted pursuant to Section 906 of the Sarbanes-Oxley Act of 2002, in the capacity as an officer of the Company, that:
(1)The Report fully complies with the requirements of Section 13(a) of the Securities Exchange Act of 1934; and
(2)The information contained in the Report fairly presents, in all material respects, the financial condition and results of operations of the Company.
|
|
|
|
|
|
|
|
|
|
|
|
| Dated: |
June 14, 2024 |
|
|
|
|
By: |
/s/ Lawson E. Whiting |
|
|
|
Lawson E. Whiting |
|
|
|
President and Chief Executive Officer |
|
|
|
|
|
|
|
|
|
|
By: |
/s/ Leanne D. Cunningham |
|
|
|
Leanne D. Cunningham |
|
|
|
Executive Vice President and Chief Financial Officer |
A signed original of this written statement required by Section 906 has been provided to the Company and will be retained by the Company and furnished to the Securities and Exchange Commission or its staff upon request.
This certificate is being furnished solely for purposes of Section 906 and is not being filed as part of the Report.
EX-97
8
policyonrecoupmentofincent.htm
EX-97
Document
Exhibit 97
Brown-Forman Corporation
Policy on Recoupment of Incentive Compensation
(Approved November 16, 2023)
Purpose
The purpose of this policy is to set forth the procedures established by the Brown-Forman Corporation (“Brown-Forman” or the “Company”) Board of Directors (the “Board”) for the recoupment of certain executive compensation in the event of certain accounting restatements resulting from noncompliance with the financial reporting requirements under the U.S. federal securities laws in accordance with the terms and conditions set forth herein.
Definitions
For purposes of this policy, the terms set forth below shall have the following meanings:
Code: The U.S. Internal Revenue Code of 1986, as amended, and the regulations and guidance thereunder.
Committee: The Compensation Committee of the Board.
Effective Date: October 2, 2023.
Erroneously Awarded Compensation: The amount of Incentive-Based Compensation received by an Executive Officer during the fiscal period when the applicable Financial Reporting Measure relating to such Incentive-Based Compensation was attained that exceeds the amount of Incentive Based Compensation that otherwise would have been received by such Executive Officer had such amount been determined based on the applicable Restatement, computed without regard to any taxes paid (i.e., on a pre-tax basis). For Incentive-Based Compensation based on a Financial Reporting Measure, including but not limited to stock price or total shareholder return, where the amount of Erroneously Awarded Compensation is not subject to mathematical recalculation directly from the information in a Restatement, the Committee will determine the amount of such Incentive-Based Compensation that constitutes Erroneously Awarded Compensation, if any, based on a reasonable estimate of the effect of the Restatement on the stock price or total shareholder return upon which the Covered Compensation was granted, vested, or paid and the Committee shall maintain documentation of such determination and provide such documentation, as required, to the NYSE. For purposes of this policy, Incentive-Based Compensation is deemed “received” in the Company’s fiscal period during which the Financial Reporting Measure specified in or otherwise relating to the Incentive-Based Compensation award is attained, even if the grant, vesting, or payment of the Incentive-Based Compensation occurs after the end of that period.
Exchange Act: The Securities Exchange Act of 1934, as amended, and the rules promulgated thereunder.
Executive Officer: Those persons who are designated by the Board as an “officer” of the Company as such term is defined in Rule 16a-1(f) under the Exchange Act during any portion of the performance period of Incentive-Based Compensation.
Both current and former Executive Officers are subject to this policy in accordance with its terms.
Financial Reporting Measure: (i) Any measure that is determined and presented in accordance with the accounting principles used in preparing the Company’s financial statements, and any measures derived wholly or in part from such measures, (ii) stock price, or (iii) total shareholder return. For the avoidance of doubt, any such measure does not need to be presented within the Company’s financial statements or included in a filing with the SEC to constitute a Financial Reporting Measure.
Incentive-Based Compensation: Any compensation that is granted, earned, or vested based wholly or in part upon the attainment of a Financial Reporting Measure. For purposes of this policy, “Incentive-Based Compensation” shall also be deemed to include any amounts which were determined based on (or were otherwise calculated by reference to) Incentive-Based Compensation (including, without limitation, any amounts under any long-term disability, life insurance, or supplemental retirement or severance plan or agreement or any notional account that is based on Incentive-Based Compensation, as well as any earnings accrued thereon).
Lookback Period: The three completed fiscal years (plus any transition period of less than nine months that is within or immediately following the three completed fiscal years and that results from a change in the Company’s fiscal year) immediately preceding the date on which the Company is required to prepare a Restatement for a given reporting period, with such date being the earlier of: (i) the date the Board, a committee of the Board, or one or more officers of the Company authorized to take such action, if Board action is not required, concludes, or reasonably should have concluded, that the Company is required to prepare a Restatement, or (ii) the date a court, regulator, or other legally authorized body directs the Company to prepare a Restatement. Recovery of any Erroneously Awarded Compensation under this policy is not dependent on whether or when the Restatement is actually filed.
NYSE: The New York Stock Exchange.
Restatement: A required accounting restatement of any Brown-Forman financial statement due to the material noncompliance of the Company with any financial reporting requirement under U.S. federal securities laws, including (i) to correct an error in previously issued financial statements that is material to the previously issued financial statements or (ii) to correct an error in previously issued financial statements that is not material to the previously issued financial statements but that would result in a material misstatement if the error were corrected in the current period or left uncorrected in the current period. Recovery of any Erroneously Awarded Compensation under this policy is not dependent on fault, fraud, or misconduct by any person in connection with the Restatement.
For purposes of this policy, a Restatement shall not be deemed to occur in the event of a revision of the Company’s financial statements due to an out-of-period adjustment (i.e., when the error is immaterial to the previously issued financial statements and the correction of the error is also immaterial to the current period) or a retrospective (i) application of a change in accounting principles; (ii) revision to reportable segment information due to a change in the structure of the Company’s internal organization; (iii) reclassification due to a discontinued operation; (iv) application of a change in reporting entity, such as from a reorganization of entities under common control; or (v) revision for stock splits, reverse stock splits, stock dividends, or other changes in capital structure.
SEC: The U.S. Securities and Exchange Commission.
Recoupment of Erroneously Awarded Compensation
In the event of a Restatement, any Erroneously Awarded Compensation received by any Executive Officer during the Lookback Period prior to the Restatement (i) that is then-outstanding but has not yet been paid shall be automatically and immediately forfeited and (ii) that has been paid to any Executive Officer shall be subject to reasonably prompt repayment to the Company.
The Committee must pursue (and shall not have the discretion to waive) the forfeiture and/or repayment of such Erroneously Awarded Compensation, except as provided below.
Notwithstanding the foregoing, the Committee may determine not to pursue the forfeiture and/or recovery of Erroneously Awarded Compensation from any Executive Officer if the Committee determines that such forfeiture and/or recovery would be impracticable, violate home country laws, and/or involve tax qualified retirement plans, as determined by the Committee in accordance with this policy.
Notwithstanding anything to the contrary herein, the Company has no obligation to seek recoupment of amounts that are granted, vested, or earned based solely upon the occurrence or non-occurrence of non-financial events. Such exempt compensation includes, without limitation, base salary; time-vesting awards; compensation awarded on the basis of the achievement of metrics that are not Financial Reporting Measures; and compensation awarded solely at the discretion of the Committee, the Board, or a group composed entirely of independent members of the Board; provided that such amounts are in no way contingent on, and were not in any way granted on the basis of, or the achievement of, any Financial Reporting Measure.
Means of Repayment
In the event that the Committee determines that any person shall repay any Erroneously Awarded Compensation, the Committee shall promptly provide written notice to such person by email or certified mail to the physical address on file with the Company for such person, and the person shall satisfy such repayment in a manner and on such terms as required by the Committee. Subject to applicable law, the Company shall also be entitled to set off the repayment amount against any amount owed to the person by the Company, to require the forfeiture of any award granted by the Company to the person, or to take any and all necessary actions to reasonably promptly recoup the repayment amount from the person, in each case, to the fullest extent permitted under applicable law, including, without limitation, Section 409A of the Code. The Committee may also, in its discretion, permit repayment under a deferred payment plan that allows repayment of owed Erroneously Awarded Compensation as promptly as possible without unreasonable economic hardship, provided such plan complies with the federal securities laws and is properly disclosed. If the Committee does not specify a repayment timing in the written notice described above, the applicable person shall be required to repay the Erroneously Awarded Compensation to the Company by wire, cash, or cashier’s check no later than thirty (30) days after receipt of such notice.
No Indemnification
The Company shall not indemnify any person, including current or former Executive Officer, directly or indirectly, for any loss of Erroneously Awarded Compensation, or any losses that such person may incur in connection with the recovery of Erroneously Awarded Compensation pursuant to this policy, including through the payment of insurance premiums or gross-up payments.
Disclosure
In the event of a Restatement, the Company shall provide appropriate public disclosure as required by Section 10D of the Exchange Act and Section 303A.14 of the NYSE Listed Company Manual.
Administration
This policy shall be administered and interpreted by the Committee. The Committee shall make all determinations regarding the application and operation of this policy in its sole discretion, and all such determinations shall be final and binding. If the Committee determines that any person shall repay any Erroneously Awarded Compensation, the person shall satisfy such repayment as required by the Committee to the fullest extent permitted under applicable law.
Other
This policy is intended to comply with the requirements of Section 10D of the Exchange Act and Section 303A.14 of the NYSE Listed Company Manual, and shall be interpreted in a manner that satisfies such requirements. If any provision of this policy would otherwise frustrate or conflict with this intent, the provision shall be interpreted and deemed amended so as to avoid such conflict.
Any applicable award agreement or other document setting forth the terms and conditions of any compensation covered by this policy shall be deemed to include the restrictions imposed herein and incorporate this policy by reference and, in the event of any inconsistency, the terms of this policy will govern.
The provisions in this policy are intended to apply to the fullest extent of the law. If any provision of this policy is found to be unenforceable or invalid under any applicable law, such provision will be applied to the maximum extent permitted and shall automatically be deemed amended in a manner consistent with its objectives to the extent necessary to conform to applicable law. The invalidity or unenforceability of any provision of this policy shall not affect the validity or enforceability of any other provision of this policy.
This policy is in addition to the Compensation Recoupment Policy adopted by the Board as of March 28, 2013.
The rights of the Company under this policy to seek forfeiture or reimbursement are in addition to, and not in lieu of, any rights of recoupment, or remedies or rights other than recoupment, that may be available to the Company pursuant to the terms of any law, government regulation, or stock exchange listing requirement or any other policy, plan, or agreement of the Company; provided, however, that any amounts recouped under any other policy that would be recoupable under this policy shall count toward any required recoupment under this policy and vice versa.