February 14, 2024 First Quarter 2024 Investor Presentation Associated Banc-Corp Exhibit 99.1
1 Forward-Looking Statements Important note regarding forward-looking statements: Statements made in this presentation which are not purely historical are forward-looking statements, as defined in the Private Securities Litigation Reform Act of 1995. This includes any statements regarding management’s plans, objectives, or goals for future operations, products or services, and forecasts of its revenues, earnings, or other measures of performance. Such forward-looking statements may be identified by the use of words such as “believe,” “expect,” “anticipate,” “plan,” “estimate,” “should,” “will,” “intend,” "target,“ “outlook,” “project,” “guidance,” or similar expressions. Forward-looking statements are based on current management expectations and, by their nature, are subject to risks and uncertainties. Actual results may differ materially from those contained in the forward-looking statements. Factors which may cause actual results to differ materially from those contained in such forward-looking statements include those identified in the Company’s most recent Form 10-K and subsequent Form 10-Qs and other SEC filings, and such factors are incorporated herein by reference. Trademarks: All trademarks, service marks, and trade names referenced in this material are official trademarks and the property of their respective owners. Presentation: Within the charts and tables presented, certain segments, columns and rows may not sum to totals shown due to rounding. Non-GAAP Measures: This presentation includes certain non-GAAP financial measures. These non-GAAP measures are provided in addition to, and not as substitutes for, measures of our financial performance determined in accordance with GAAP. Our calculation of these non-GAAP measures may not be comparable to similarly titled measures of other companies due to potential differences between companies in the method of calculation. As a result, the use of these non-GAAP measures has limitations and should not be considered superior to, in isolation from, or as a substitute for, related GAAP measures. Reconciliations of these non-GAAP financial measures to the most directly comparable GAAP financial measures can be found at the end of this presentation.
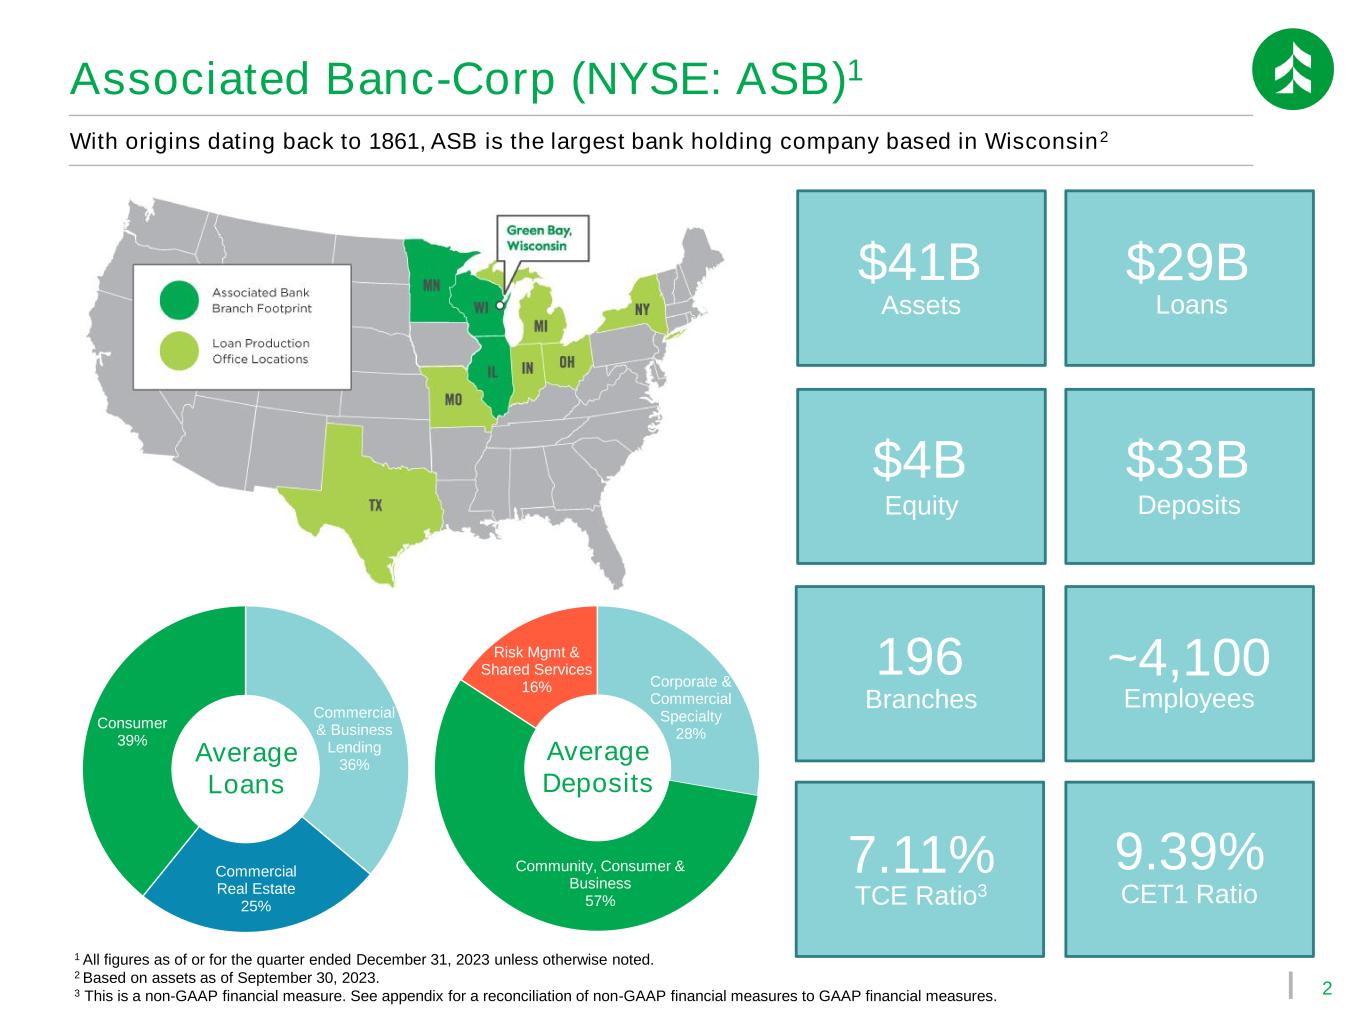
2 Commercial & Business Lending 36% Commercial Real Estate 25% Consumer 39% Corporate & Commercial Specialty 28% Community, Consumer & Business 57% Risk Mgmt & Shared Services 16% With origins dating back to 1861, ASB is the largest bank holding company based in Wisconsin2 Associated Banc-Corp (NYSE: ASB)1 $41B Assets $29B Loans $4B Equity $33B Deposits Average Loans Average Deposits 1 All figures as of or for the quarter ended December 31, 2023 unless otherwise noted. 2 Based on assets as of September 30, 2023. 3 This is a non-GAAP financial measure. See appendix for a reconciliation of non-GAAP financial measures to GAAP financial measures. 9.39% CET1 Ratio 196 Branches ~4,100 Employees 7.11% TCE Ratio3
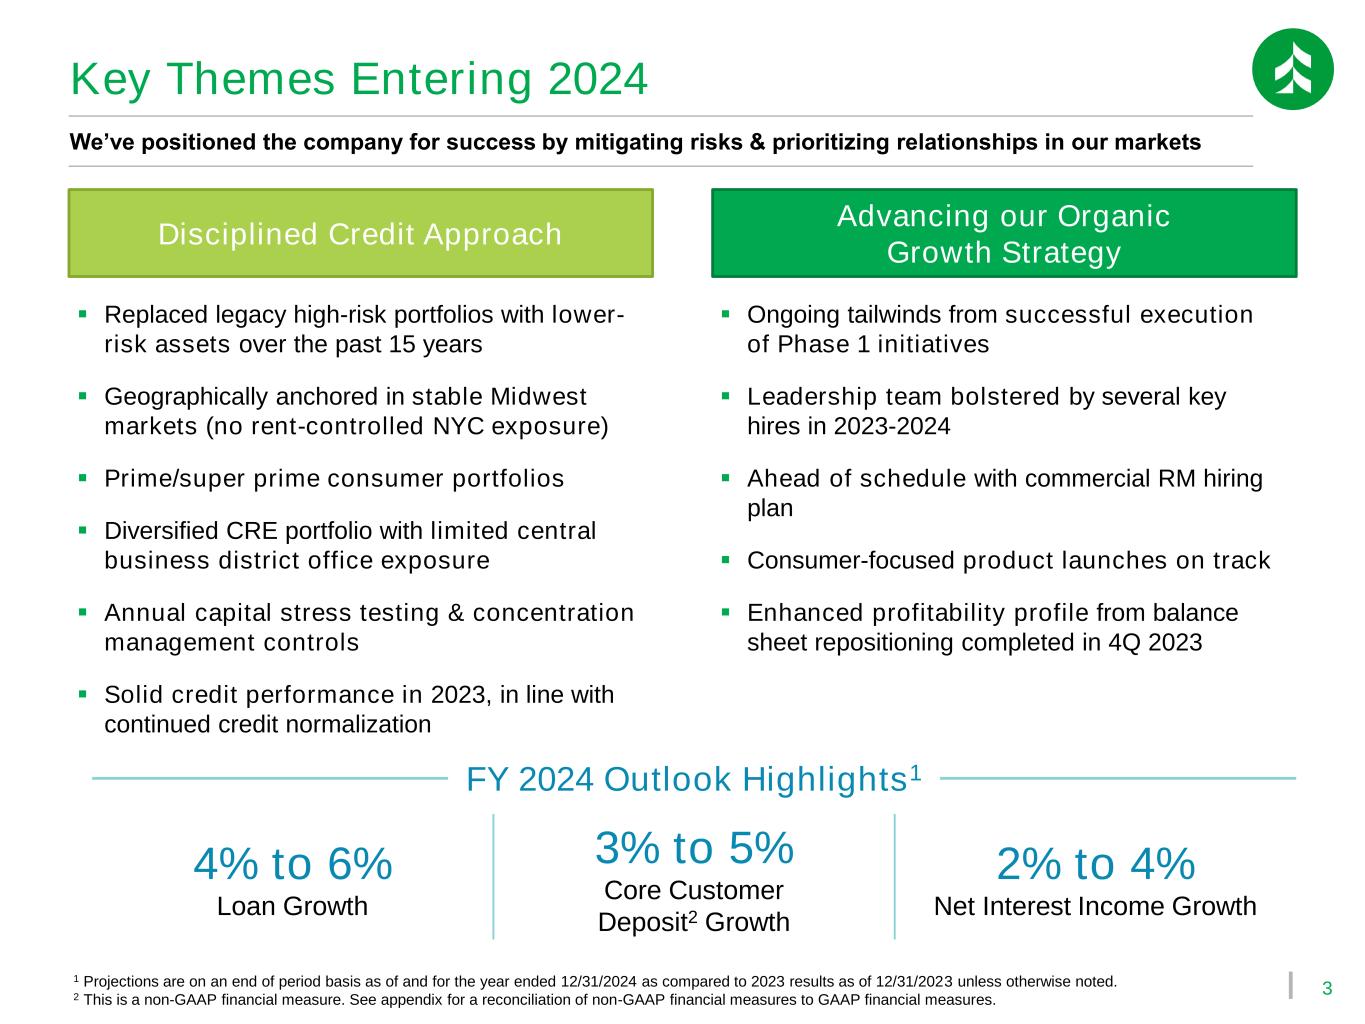
3 Key Themes Entering 2024 We’ve positioned the company for success by mitigating risks & prioritizing relationships in our markets ▪ Replaced legacy high-risk portfolios with lower- risk assets over the past 15 years ▪ Geographically anchored in stable Midwest markets (no rent-controlled NYC exposure) ▪ Prime/super prime consumer portfolios ▪ Diversified CRE portfolio with limited central business district office exposure ▪ Annual capital stress testing & concentration management controls ▪ Solid credit performance in 2023, in line with continued credit normalization ▪ Ongoing tailwinds from successful execution of Phase 1 initiatives ▪ Leadership team bolstered by several key hires in 2023-2024 ▪ Ahead of schedule with commercial RM hiring plan ▪ Consumer-focused product launches on track ▪ Enhanced profitability profile from balance sheet repositioning completed in 4Q 2023 Disciplined Credit Approach Advancing our Organic Growth Strategy 1 Projections are on an end of period basis as of and for the year ended 12/31/2024 as compared to 2023 results as of 12/31/2023 unless otherwise noted. 2 This is a non-GAAP financial measure. See appendix for a reconciliation of non-GAAP financial measures to GAAP financial measures. 4% to 6% Loan Growth 3% to 5% Core Customer Deposit2 Growth 2% to 4% Net Interest Income Growth FY 2024 Outlook Highlights1
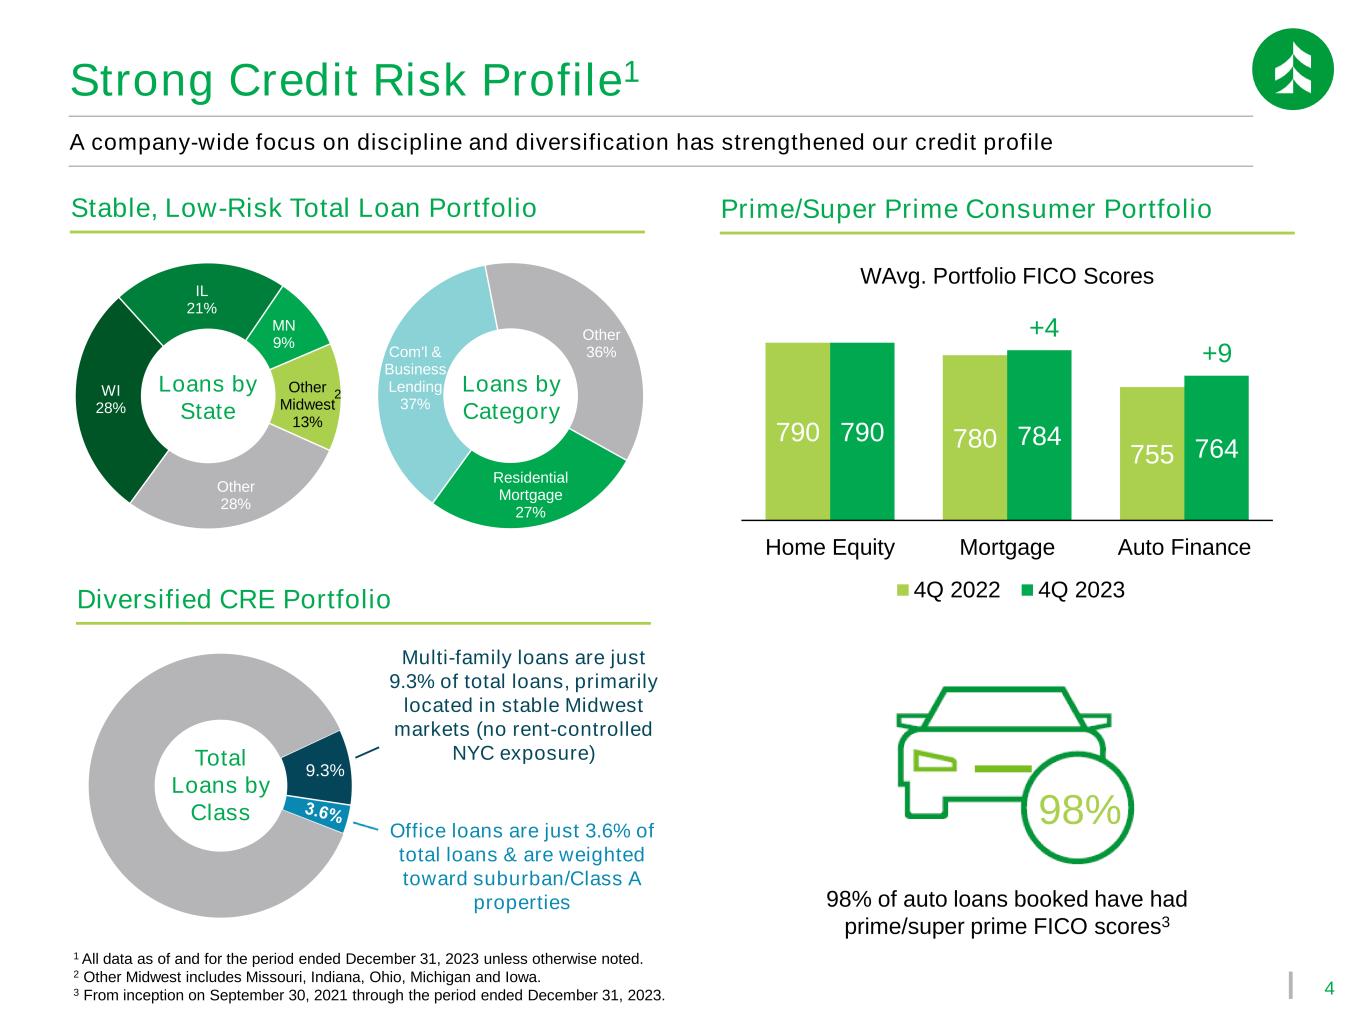
4 Com'l & Business Lending 37% Other 36% Residential Mortgage 27% 1 All data as of and for the period ended December 31, 2023 unless otherwise noted. 2 Other Midwest includes Missouri, Indiana, Ohio, Michigan and Iowa. 3 From inception on September 30, 2021 through the period ended December 31, 2023. WI 28% IL 21% MN 9% Other Midwest 13% Other 28% Loans by State 2 A company-wide focus on discipline and diversification has strengthened our credit profile Prime/Super Prime Consumer PortfolioStable, Low-Risk Total Loan Portfolio Diversified CRE Portfolio Strong Credit Risk Profile1 98% of auto loans booked have had prime/super prime FICO scores3 Total Loans by Class Loans by Category Office loans are just 3.6% of total loans & are weighted toward suburban/Class A properties 790 780 755 790 784 764 Home Equity Mortgage Auto Finance 4Q 2022 4Q 2023 +4 WAvg. Portfolio FICO Scores 98% +9 9.3% Multi-family loans are just 9.3% of total loans, primarily located in stable Midwest markets (no rent-controlled NYC exposure)
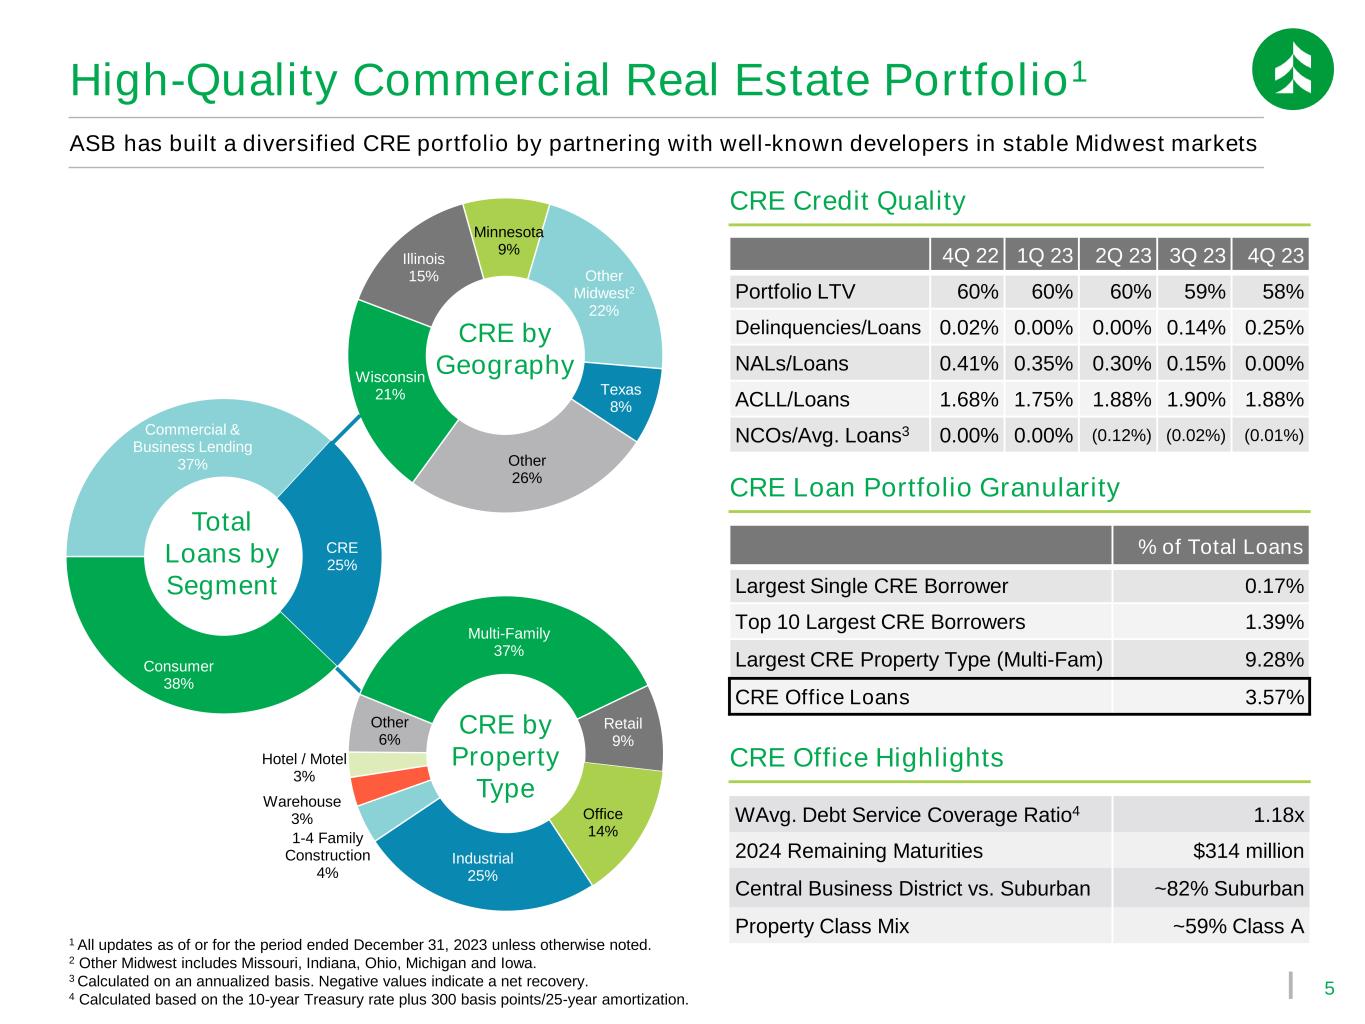
5 Wisconsin 21% Illinois 15% Minnesota 9% Other Midwest2 22% Texas 8% Other 26% Multi-Family 37% Retail 9% Office 14% Industrial 25% 1-4 Family Construction 4% Warehouse 3% Hotel / Motel 3% Other 6% Consumer 38% Commercial & Business Lending 37% CRE 25% 1 All updates as of or for the period ended December 31, 2023 unless otherwise noted. 2 Other Midwest includes Missouri, Indiana, Ohio, Michigan and Iowa. 3 Calculated on an annualized basis. Negative values indicate a net recovery. 4 Calculated based on the 10-year Treasury rate plus 300 basis points/25-year amortization. High-Quality Commercial Real Estate Portfolio1 ASB has built a diversified CRE portfolio by partnering with well-known developers in stable Midwest markets 4Q 22 1Q 23 2Q 23 3Q 23 4Q 23 Portfolio LTV 60% 60% 60% 59% 58% Delinquencies/Loans 0.02% 0.00% 0.00% 0.14% 0.25% NALs/Loans 0.41% 0.35% 0.30% 0.15% 0.00% ACLL/Loans 1.68% 1.75% 1.88% 1.90% 1.88% NCOs/Avg. Loans3 0.00% 0.00% (0.12%) (0.02%) (0.01%) CRE Credit Quality CRE Loan Portfolio Granularity % of Total Loans Largest Single CRE Borrower 0.17% Top 10 Largest CRE Borrowers 1.39% Largest CRE Property Type (Multi-Fam) 9.28% CRE Office Loans 3.57% CRE by Geography CRE by Property Type Total Loans by Segment CRE Office Highlights WAvg. Debt Service Coverage Ratio4 1.18x 2024 Remaining Maturities $314 million Central Business District vs. Suburban ~82% Suburban Property Class Mix ~59% Class A
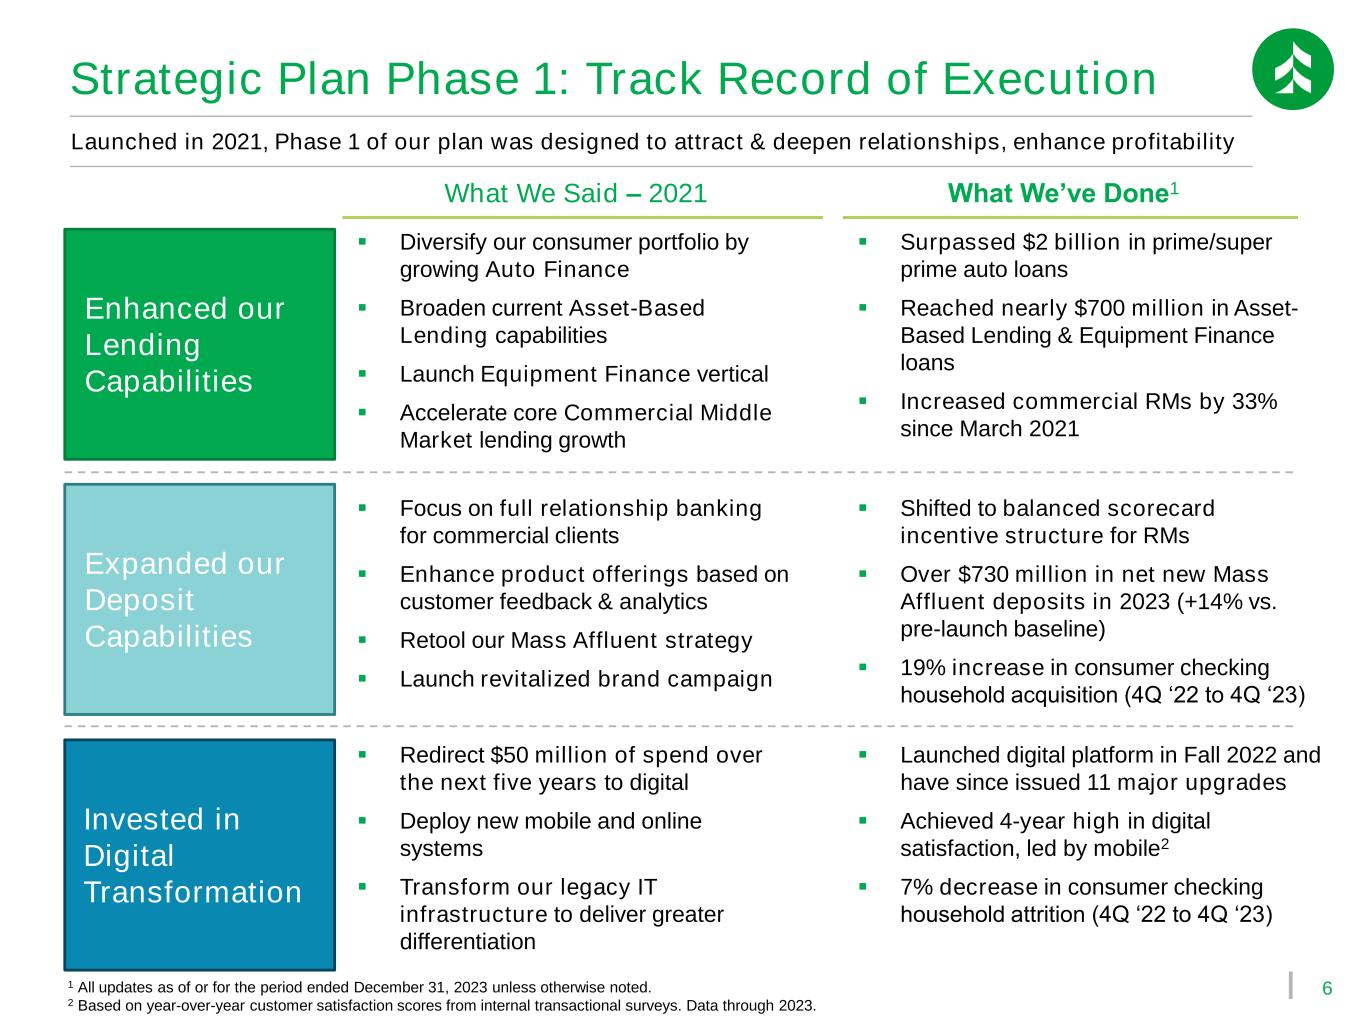
6 Strategic Plan Phase 1: Track Record of Execution Launched in 2021, Phase 1 of our plan was designed to attract & deepen relationships, enhance profitability Enhanced our Lending Capabilities Expanded our Deposit Capabilities Invested in Digital Transformation ▪ Diversify our consumer portfolio by growing Auto Finance ▪ Broaden current Asset-Based Lending capabilities ▪ Launch Equipment Finance vertical ▪ Accelerate core Commercial Middle Market lending growth ▪ Focus on full relationship banking for commercial clients ▪ Enhance product offerings based on customer feedback & analytics ▪ Retool our Mass Affluent strategy ▪ Launch revitalized brand campaign ▪ Redirect $50 million of spend over the next five years to digital ▪ Deploy new mobile and online systems ▪ Transform our legacy IT infrastructure to deliver greater differentiation What We Said – 2021 What We’ve Done1 ▪ Surpassed $2 billion in prime/super prime auto loans ▪ Reached nearly $700 million in Asset- Based Lending & Equipment Finance loans ▪ Increased commercial RMs by 33% since March 2021 ▪ Shifted to balanced scorecard incentive structure for RMs ▪ Over $730 million in net new Mass Affluent deposits in 2023 (+14% vs. pre-launch baseline) ▪ 19% increase in consumer checking household acquisition (4Q ‘22 to 4Q ‘23) ▪ Launched digital platform in Fall 2022 and have since issued 11 major upgrades ▪ Achieved 4-year high in digital satisfaction, led by mobile2 ▪ 7% decrease in consumer checking household attrition (4Q ‘22 to 4Q ‘23) 1 All updates as of or for the period ended December 31, 2023 unless otherwise noted. 2 Based on year-over-year customer satisfaction scores from internal transactional surveys. Data through 2023.
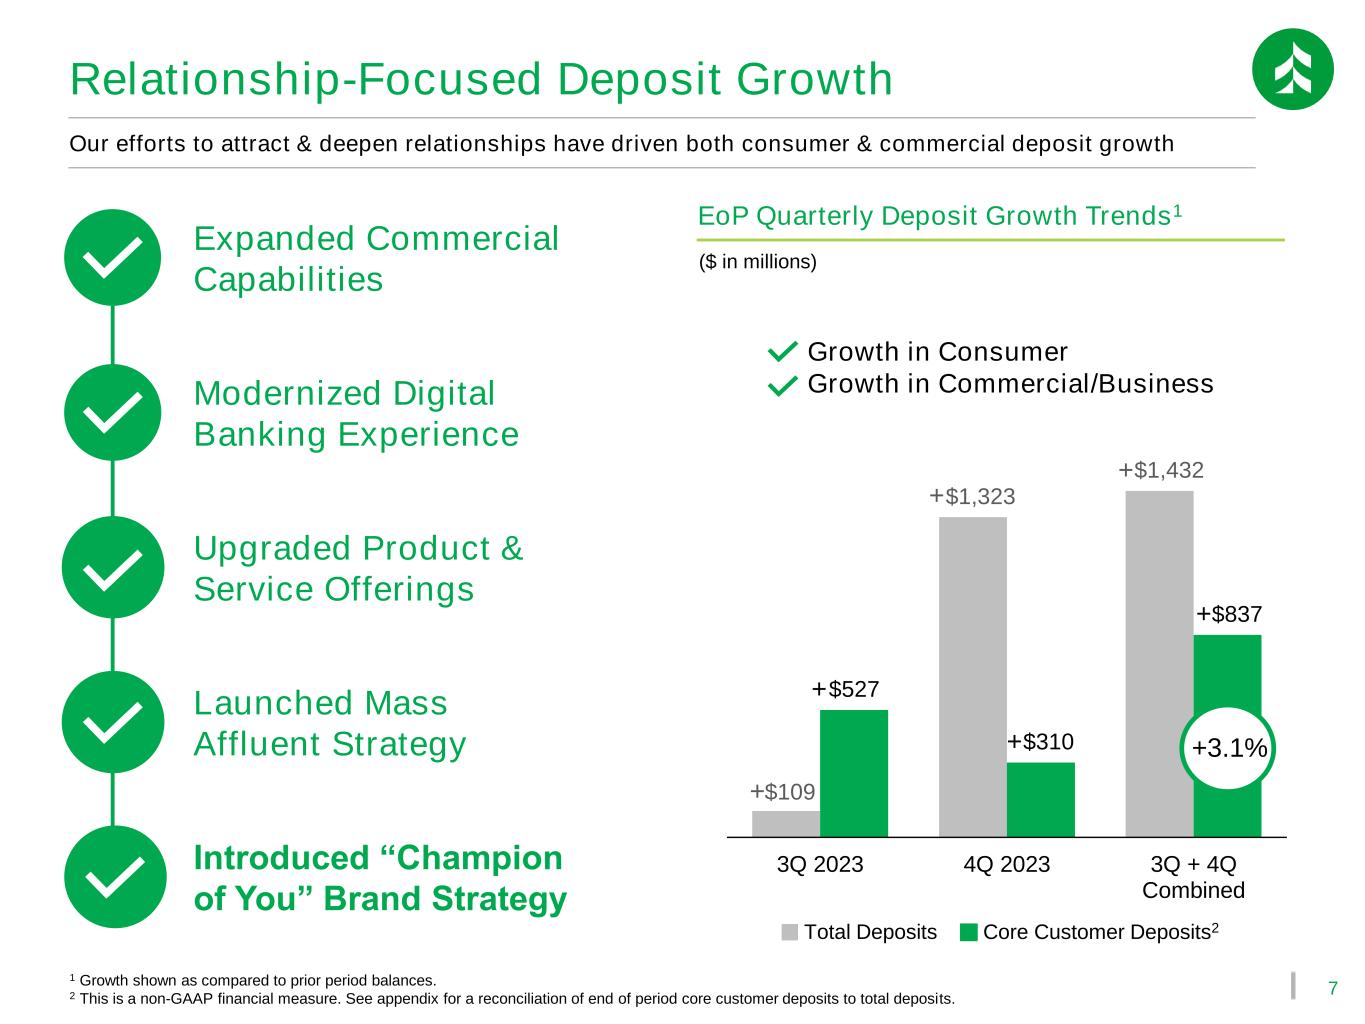
7 $109 $1,323 $1,432 $527 $310 $837 3Q 2023 4Q 2023 3Q + 4Q Combined Our efforts to attract & deepen relationships have driven both consumer & commercial deposit growth Relationship-Focused Deposit Growth Modernized Digital Banking Experience Upgraded Product & Service Offerings Launched Mass Affluent Strategy Introduced “Champion of You” Brand Strategy Expanded Commercial Capabilities 1 Growth shown as compared to prior period balances. 2 This is a non-GAAP financial measure. See appendix for a reconciliation of end of period core customer deposits to total deposits. + + EoP Quarterly Deposit Growth Trends1 ($ in millions) + +3.1% Growth in Consumer Growth in Commercial/Business + + + Core Customer Deposits2Total Deposits
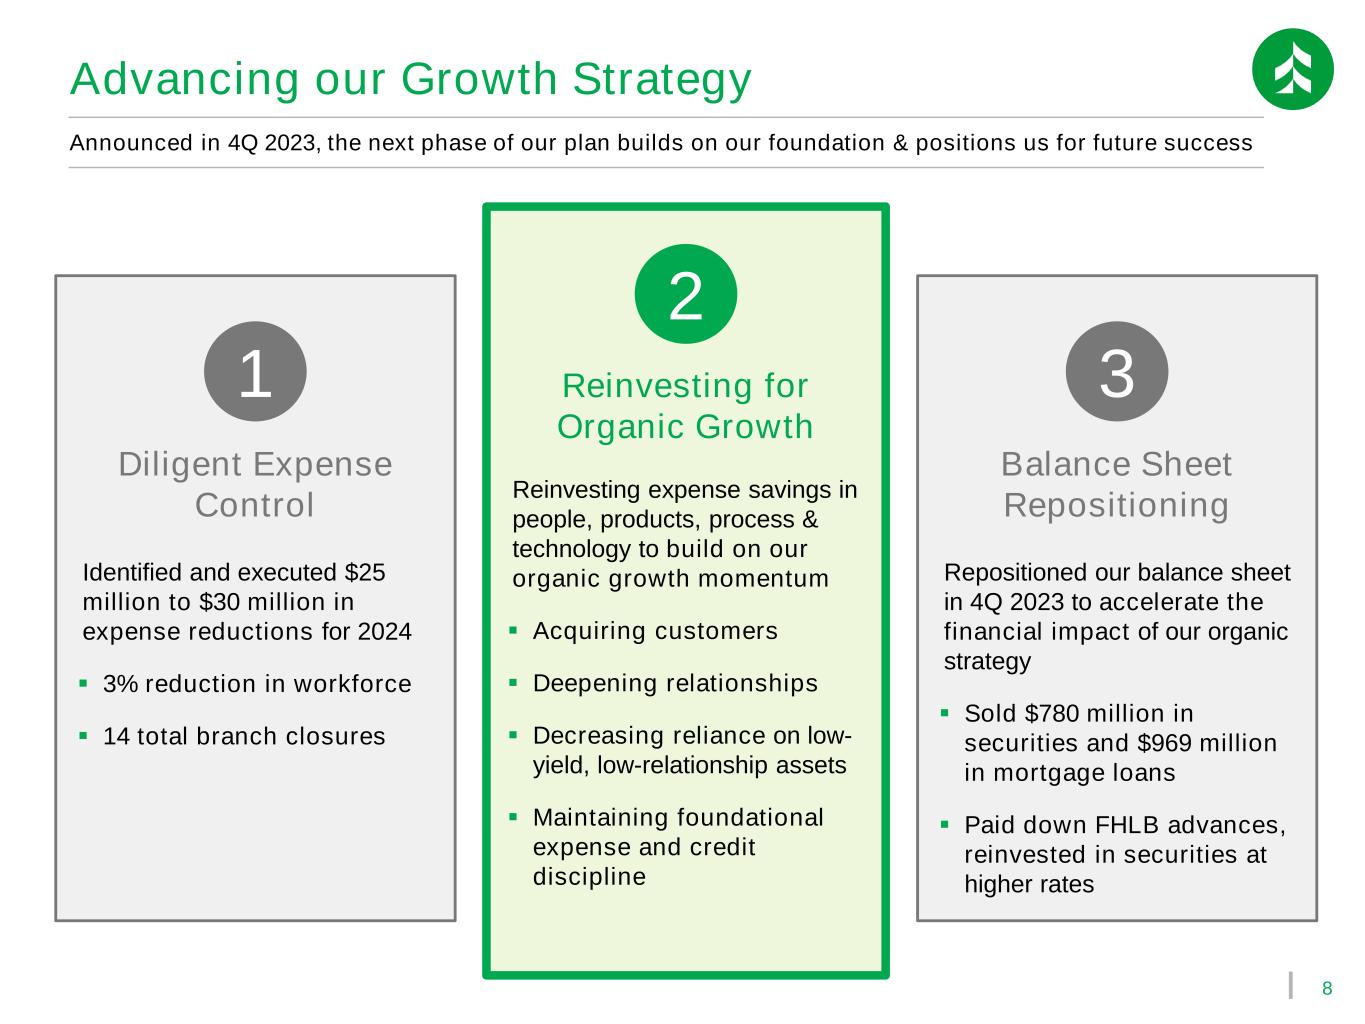
8 Advancing our Growth Strategy Announced in 4Q 2023, the next phase of our plan builds on our foundation & positions us for future success Diligent Expense Control Balance Sheet Repositioning Reinvesting for Organic Growth 1 3 Repositioned our balance sheet in 4Q 2023 to accelerate the financial impact of our organic strategy ▪ Sold $780 million in securities and $969 million in mortgage loans ▪ Paid down FHLB advances, reinvested in securities at higher rates Identified and executed $25 million to $30 million in expense reductions for 2024 ▪ 3% reduction in workforce ▪ 14 total branch closures Reinvesting expense savings in people, products, process & technology to build on our organic growth momentum ▪ Acquiring customers ▪ Deepening relationships ▪ Decreasing reliance on low- yield, low-relationship assets ▪ Maintaining foundational expense and credit discipline 2
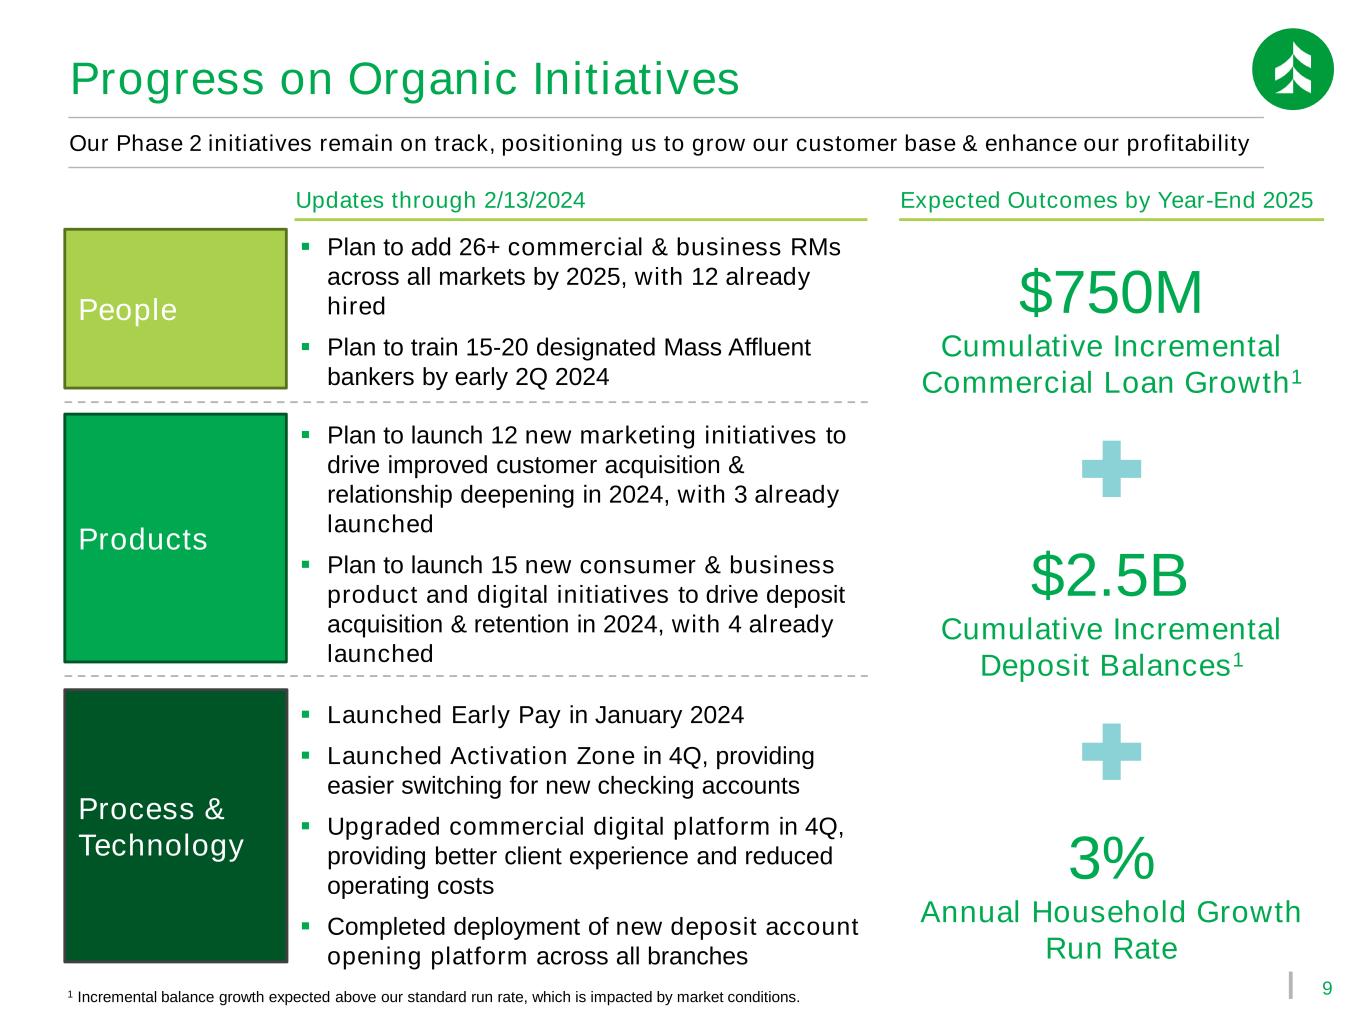
9 Progress on Organic Initiatives Our Phase 2 initiatives remain on track, positioning us to grow our customer base & enhance our profitability People Products Process & Technology ▪ Plan to add 26+ commercial & business RMs across all markets by 2025, with 12 already hired ▪ Plan to train 15-20 designated Mass Affluent bankers by early 2Q 2024 ▪ Plan to launch 12 new marketing initiatives to drive improved customer acquisition & relationship deepening in 2024, with 3 already launched ▪ Plan to launch 15 new consumer & business product and digital initiatives to drive deposit acquisition & retention in 2024, with 4 already launched ▪ Launched Early Pay in January 2024 ▪ Launched Activation Zone in 4Q, providing easier switching for new checking accounts ▪ Upgraded commercial digital platform in 4Q, providing better client experience and reduced operating costs ▪ Completed deployment of new deposit account opening platform across all branches Updates through 2/13/2024 Expected Outcomes by Year-End 2025 $2.5B Cumulative Incremental Deposit Balances1 $750M Cumulative Incremental Commercial Loan Growth1 3% Annual Household Growth Run Rate 1 Incremental balance growth expected above our standard run rate, which is impacted by market conditions.
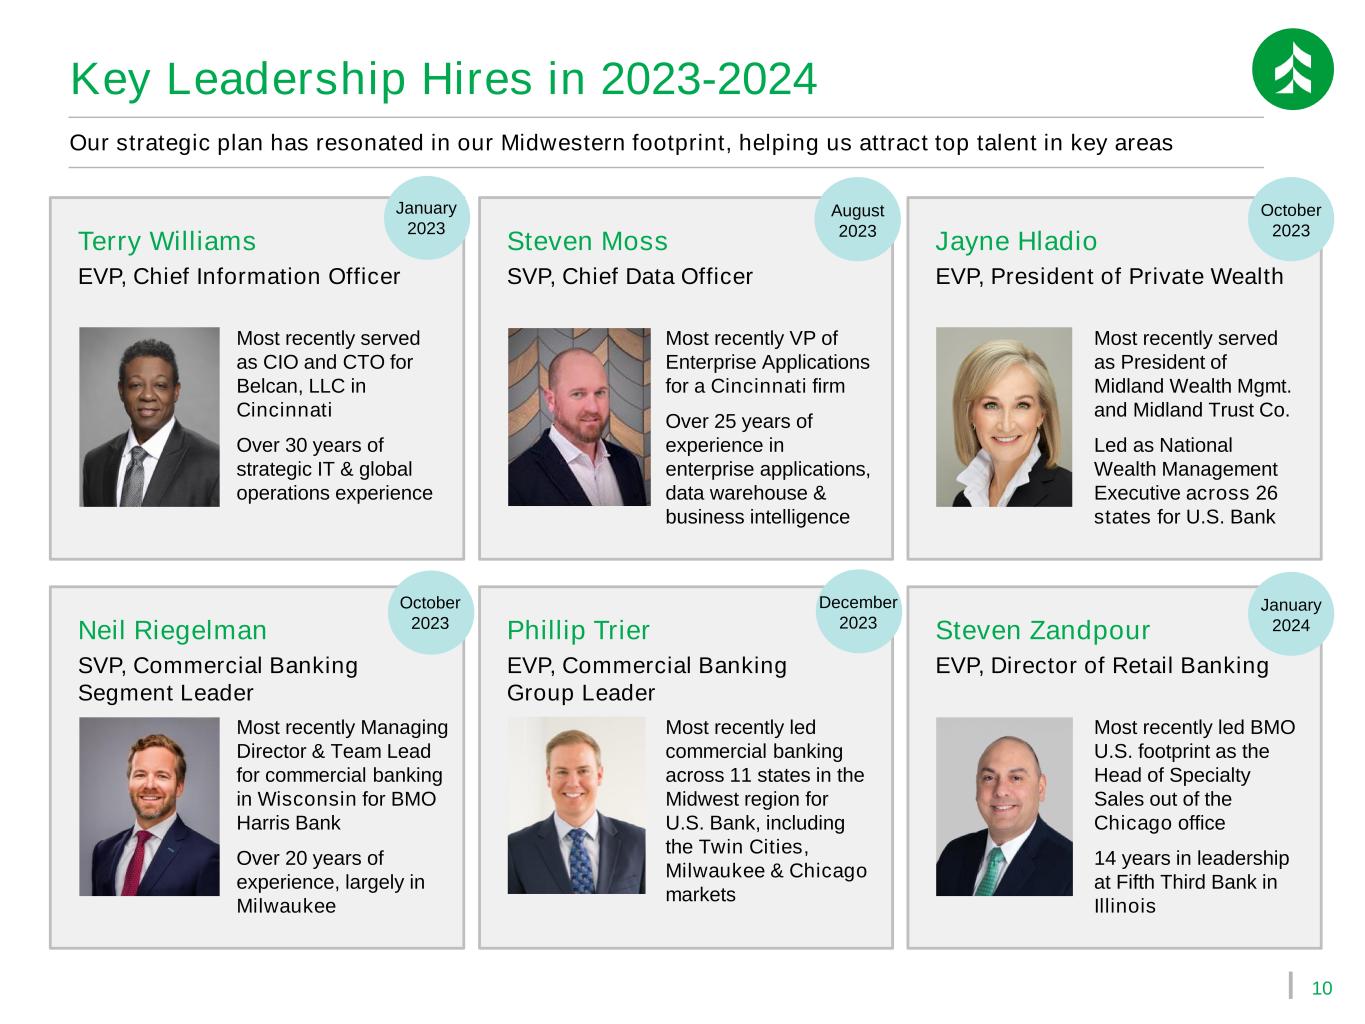
10 Key Leadership Hires in 2023-2024 Our strategic plan has resonated in our Midwestern footprint, helping us attract top talent in key areas Neil Riegelman SVP, Commercial Banking Segment Leader Most recently Managing Director & Team Lead for commercial banking in Wisconsin for BMO Harris Bank Over 20 years of experience, largely in Milwaukee Phillip Trier EVP, Commercial Banking Group Leader Most recently led commercial banking across 11 states in the Midwest region for U.S. Bank, including the Twin Cities, Milwaukee & Chicago markets Steven Zandpour EVP, Director of Retail Banking Most recently led BMO U.S. footprint as the Head of Specialty Sales out of the Chicago office 14 years in leadership at Fifth Third Bank in Illinois Terry Williams EVP, Chief Information Officer Most recently served as CIO and CTO for Belcan, LLC in Cincinnati Over 30 years of strategic IT & global operations experience Steven Moss SVP, Chief Data Officer Most recently VP of Enterprise Applications for a Cincinnati firm Over 25 years of experience in enterprise applications, data warehouse & business intelligence Jayne Hladio EVP, President of Private Wealth Most recently served as President of Midland Wealth Mgmt. and Midland Trust Co. Led as National Wealth Management Executive across 26 states for U.S. Bank January 2023 August 2023 October 2023 October 2023 December 2023 January 2024
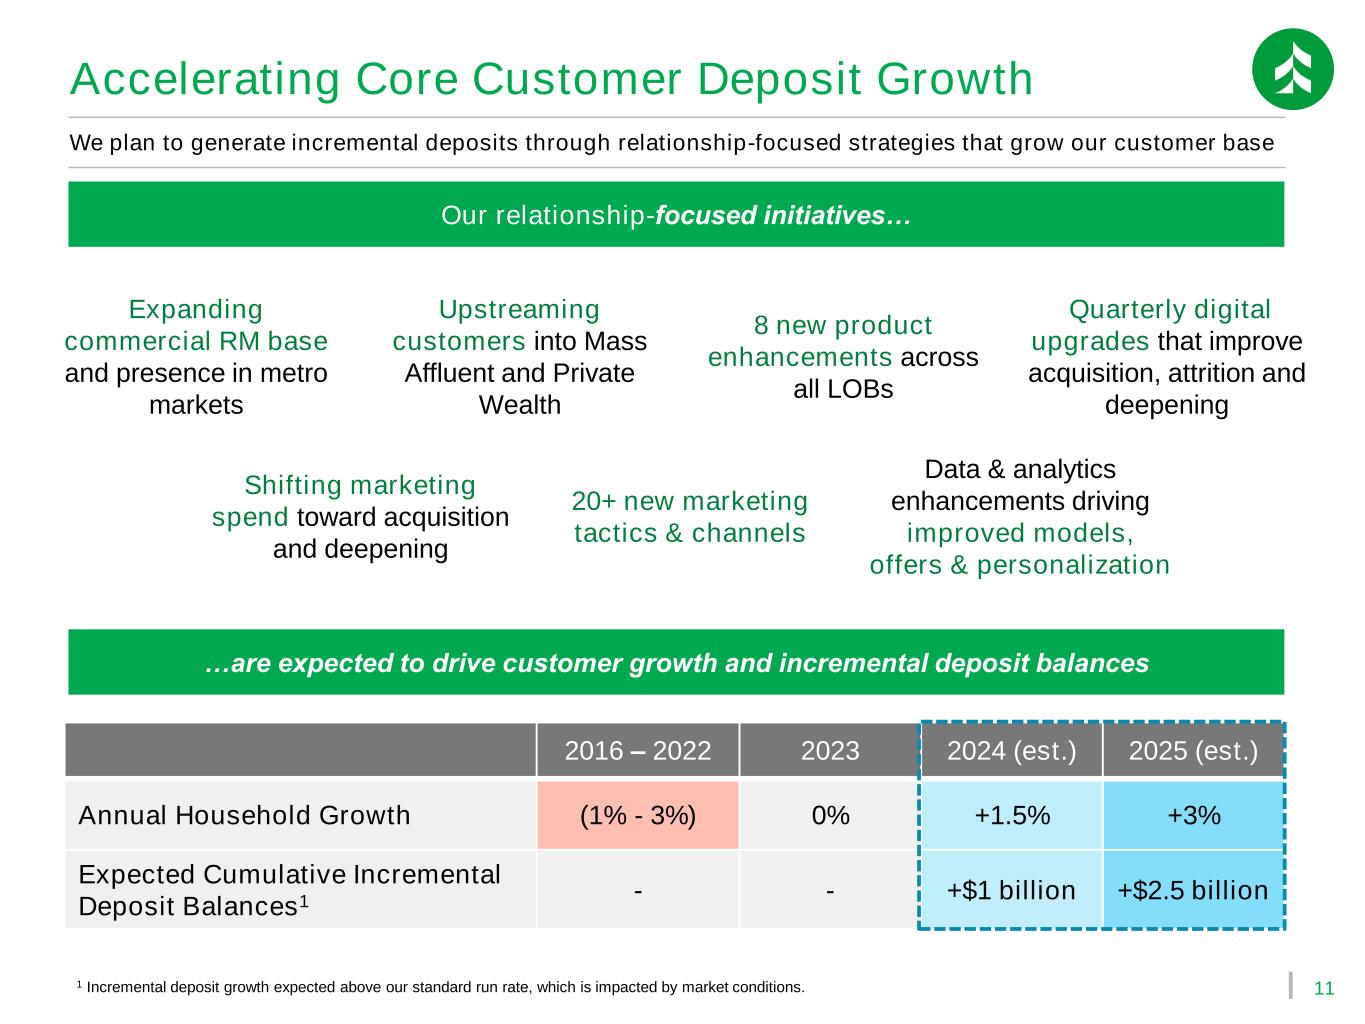
11 We plan to generate incremental deposits through relationship-focused strategies that grow our customer base Expanding commercial RM base and presence in metro markets Upstreaming customers into Mass Affluent and Private Wealth 8 new product enhancements across all LOBs Our relationship-focused initiatives… …are expected to drive customer growth and incremental deposit balances Quarterly digital upgrades that improve acquisition, attrition and deepening Shifting marketing spend toward acquisition and deepening 20+ new marketing tactics & channels Data & analytics enhancements driving improved models, offers & personalization 2016 – 2022 2023 2024 (est.) 2025 (est.) Annual Household Growth (1% - 3%) 0% +1.5% +3% Expected Cumulative Incremental Deposit Balances1 - - +$1 billion +$2.5 billion 1 Incremental deposit growth expected above our standard run rate, which is impacted by market conditions. Accelerating Core Customer Deposit Growth
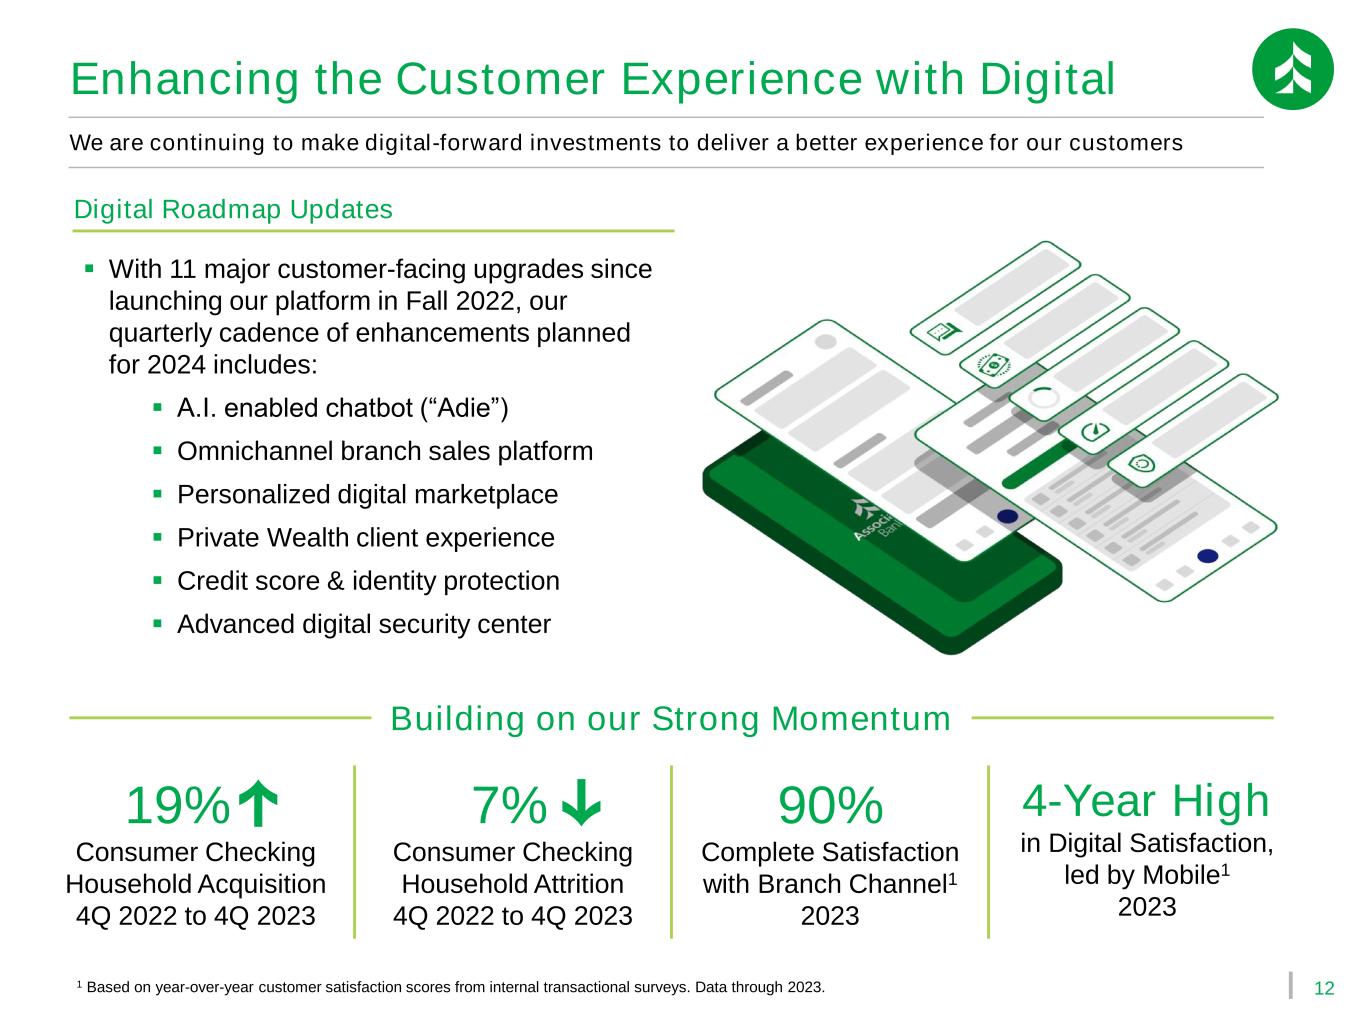
12 19% Consumer Checking Household Acquisition 4Q 2022 to 4Q 2023 7% Consumer Checking Household Attrition 4Q 2022 to 4Q 2023 90% Complete Satisfaction with Branch Channel1 2023 4-Year High in Digital Satisfaction, led by Mobile1 2023 We are continuing to make digital-forward investments to deliver a better experience for our customers 1 Based on year-over-year customer satisfaction scores from internal transactional surveys. Data through 2023. Building on our Strong Momentum ▪ With 11 major customer-facing upgrades since launching our platform in Fall 2022, our quarterly cadence of enhancements planned for 2024 includes: ▪ A.I. enabled chatbot (“Adie”) ▪ Omnichannel branch sales platform ▪ Personalized digital marketplace ▪ Private Wealth client experience ▪ Credit score & identity protection ▪ Advanced digital security center Digital Roadmap Updates Enhancing the Customer Experience with Digital
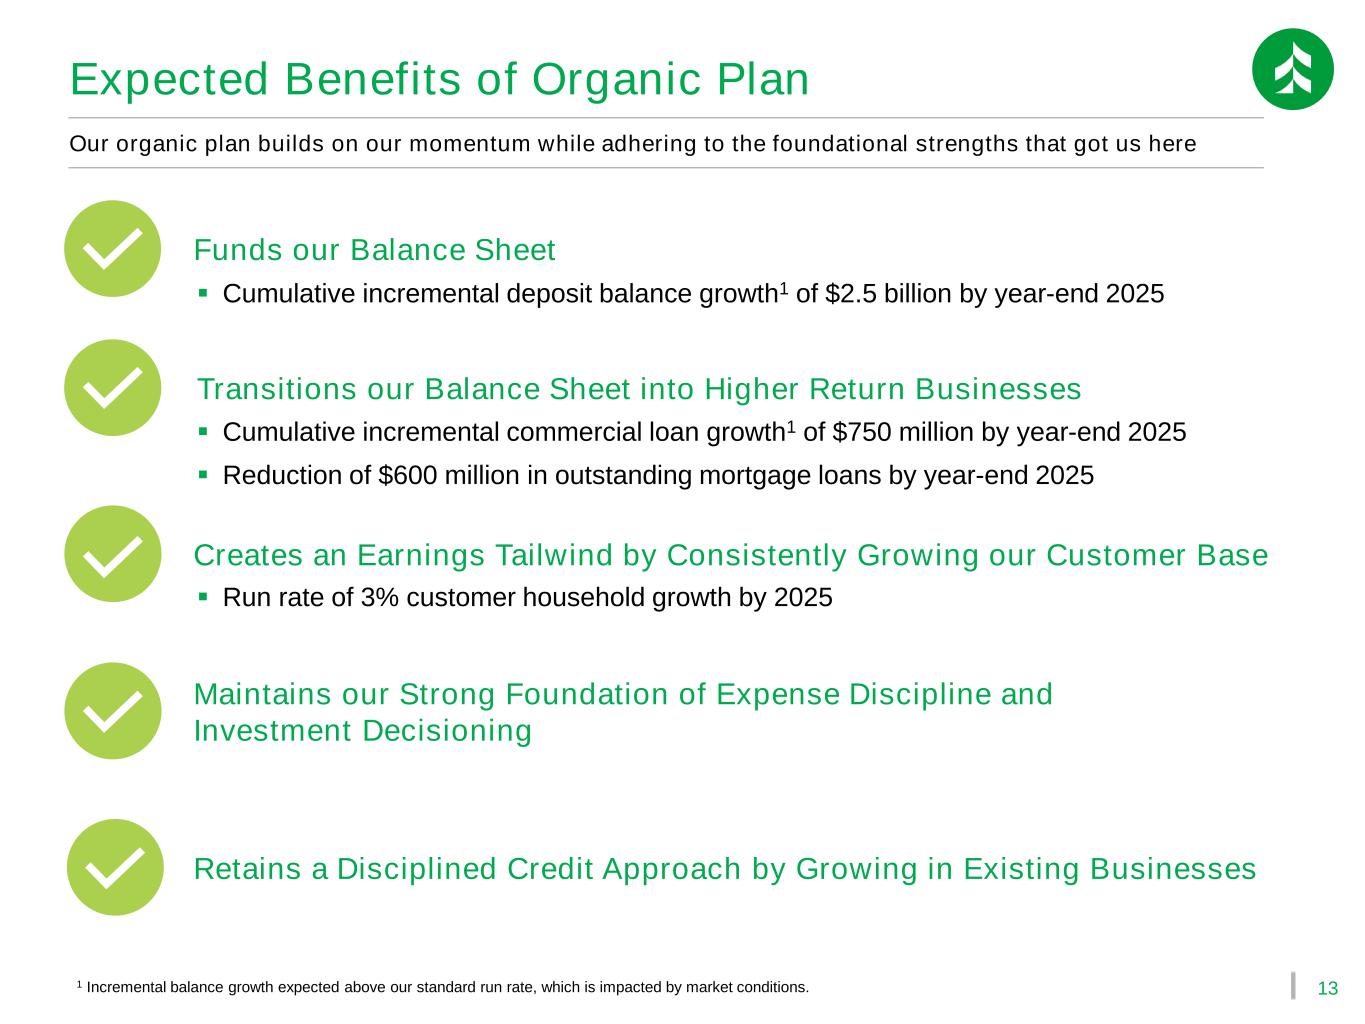
13 Our organic plan builds on our momentum while adhering to the foundational strengths that got us here Expected Benefits of Organic Plan Transitions our Balance Sheet into Higher Return Businesses Creates an Earnings Tailwind by Consistently Growing our Customer Base Maintains our Strong Foundation of Expense Discipline and Investment Decisioning Retains a Disciplined Credit Approach by Growing in Existing Businesses Funds our Balance Sheet ▪ Cumulative incremental deposit balance growth1 of $2.5 billion by year-end 2025 ▪ Cumulative incremental commercial loan growth1 of $750 million by year-end 2025 ▪ Reduction of $600 million in outstanding mortgage loans by year-end 2025 ▪ Run rate of 3% customer household growth by 2025 1 Incremental balance growth expected above our standard run rate, which is impacted by market conditions.
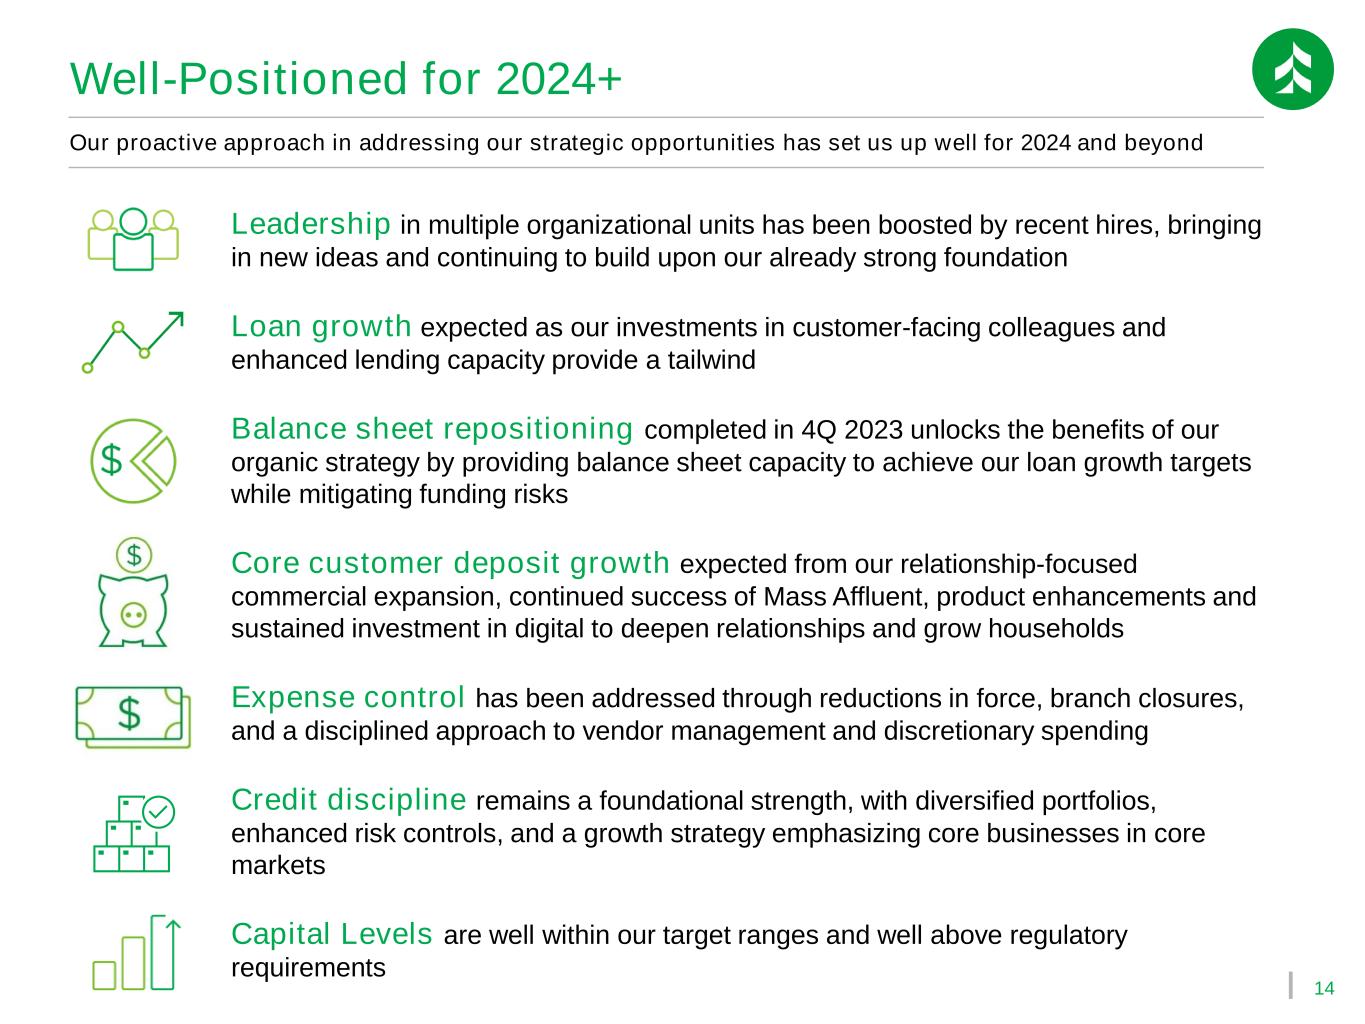
14 Well-Positioned for 2024+ Leadership in multiple organizational units has been boosted by recent hires, bringing in new ideas and continuing to build upon our already strong foundation Loan growth expected as our investments in customer-facing colleagues and enhanced lending capacity provide a tailwind Balance sheet repositioning completed in 4Q 2023 unlocks the benefits of our organic strategy by providing balance sheet capacity to achieve our loan growth targets while mitigating funding risks Core customer deposit growth expected from our relationship-focused commercial expansion, continued success of Mass Affluent, product enhancements and sustained investment in digital to deepen relationships and grow households Expense control has been addressed through reductions in force, branch closures, and a disciplined approach to vendor management and discretionary spending Credit discipline remains a foundational strength, with diversified portfolios, enhanced risk controls, and a growth strategy emphasizing core businesses in core markets Capital Levels are well within our target ranges and well above regulatory requirements Our proactive approach in addressing our strategic opportunities has set us up well for 2024 and beyond
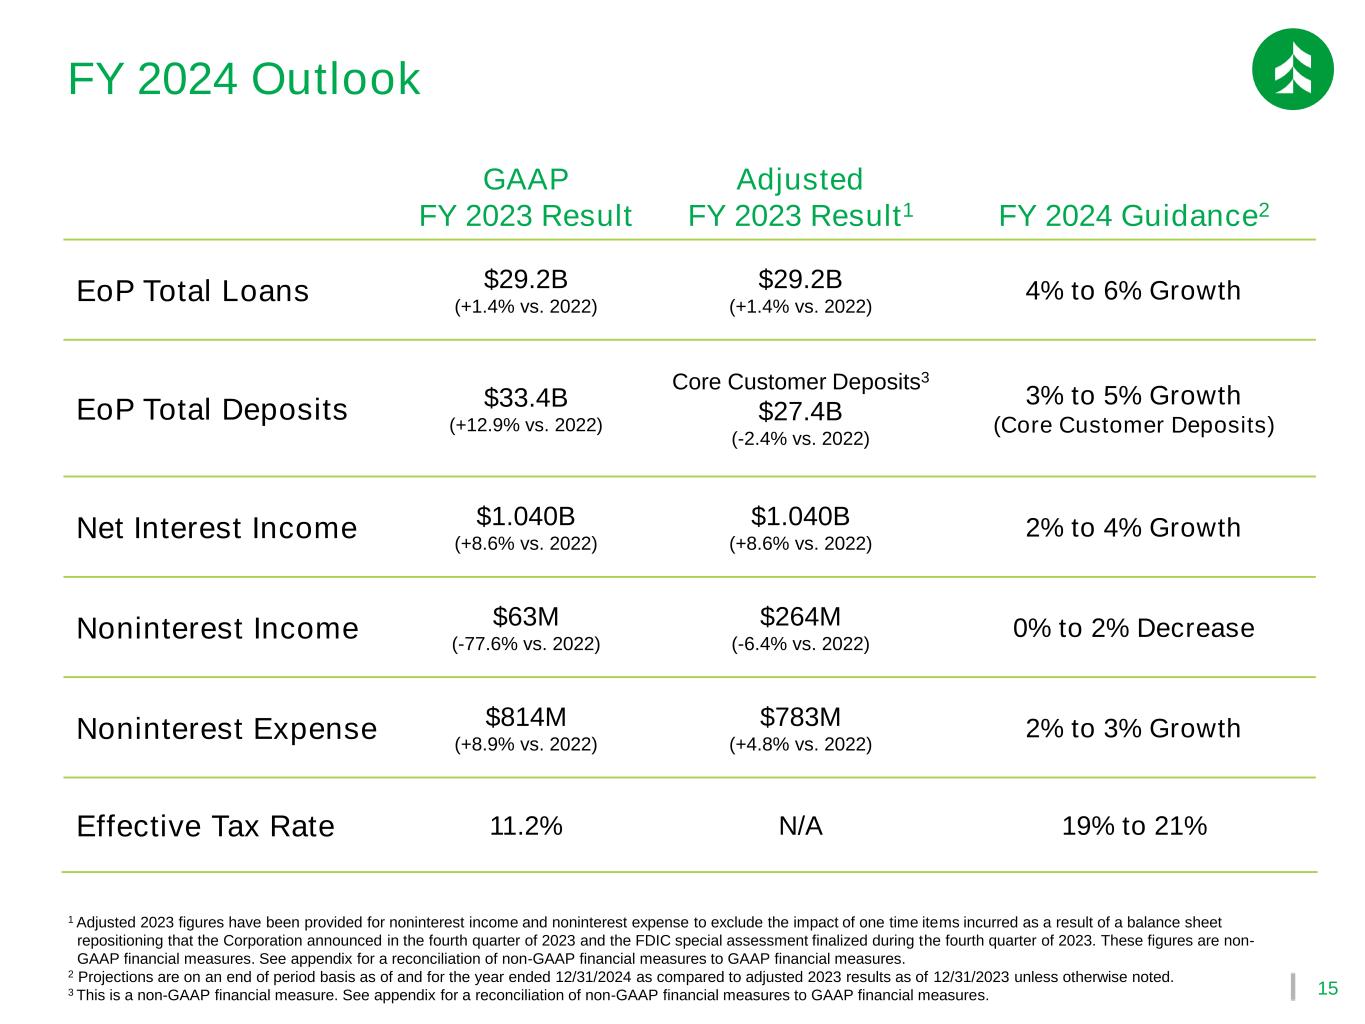
15 1 Adjusted 2023 figures have been provided for noninterest income and noninterest expense to exclude the impact of one time items incurred as a result of a balance sheet repositioning that the Corporation announced in the fourth quarter of 2023 and the FDIC special assessment finalized during the fourth quarter of 2023. These figures are non- GAAP financial measures. See appendix for a reconciliation of non-GAAP financial measures to GAAP financial measures. 2 Projections are on an end of period basis as of and for the year ended 12/31/2024 as compared to adjusted 2023 results as of 12/31/2023 unless otherwise noted. 3 This is a non-GAAP financial measure. See appendix for a reconciliation of non-GAAP financial measures to GAAP financial measures. FY 2024 Outlook GAAP FY 2023 Result Adjusted FY 2023 Result1 FY 2024 Guidance2 EoP Total Loans $29.2B (+1.4% vs. 2022) $29.2B (+1.4% vs. 2022) 4% to 6% Growth EoP Total Deposits $33.4B (+12.9% vs. 2022) Core Customer Deposits3 $27.4B (-2.4% vs. 2022) 3% to 5% Growth (Core Customer Deposits) Net Interest Income $1.040B (+8.6% vs. 2022) $1.040B (+8.6% vs. 2022) 2% to 4% Growth Noninterest Income $63M (-77.6% vs. 2022) $264M (-6.4% vs. 2022) 0% to 2% Decrease Noninterest Expense $814M (+8.9% vs. 2022) $783M (+4.8% vs. 2022) 2% to 3% Growth Effective Tax Rate 11.2% N/A 19% to 21%
Appendix
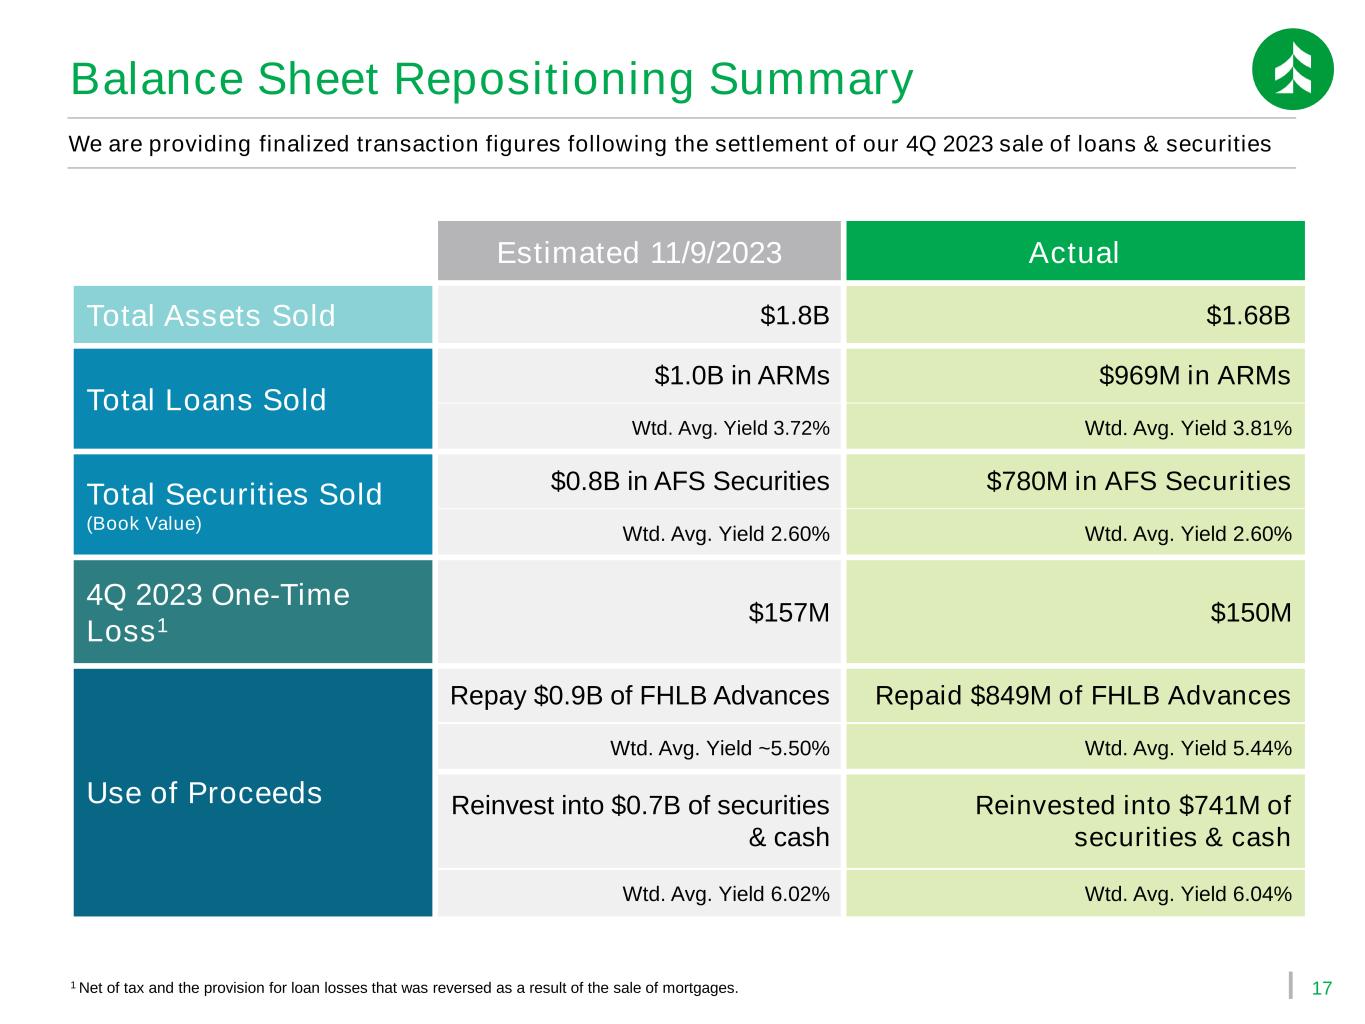
17 Balance Sheet Repositioning Summary Estimated 11/9/2023 Actual Total Assets Sold $1.8B $1.68B Total Loans Sold $1.0B in ARMs $969M in ARMs Wtd. Avg. Yield 3.72% Wtd. Avg. Yield 3.81% Total Securities Sold (Book Value) $0.8B in AFS Securities $780M in AFS Securities Wtd. Avg. Yield 2.60% Wtd. Avg. Yield 2.60% 4Q 2023 One-Time Loss1 $157M $150M Use of Proceeds Repay $0.9B of FHLB Advances Repaid $849M of FHLB Advances Wtd. Avg. Yield ~5.50% Wtd. Avg. Yield 5.44% Reinvest into $0.7B of securities & cash Reinvested into $741M of securities & cash Wtd. Avg. Yield 6.02% Wtd. Avg. Yield 6.04% We are providing finalized transaction figures following the settlement of our 4Q 2023 sale of loans & securities 1 Net of tax and the provision for loan losses that was reversed as a result of the sale of mortgages.
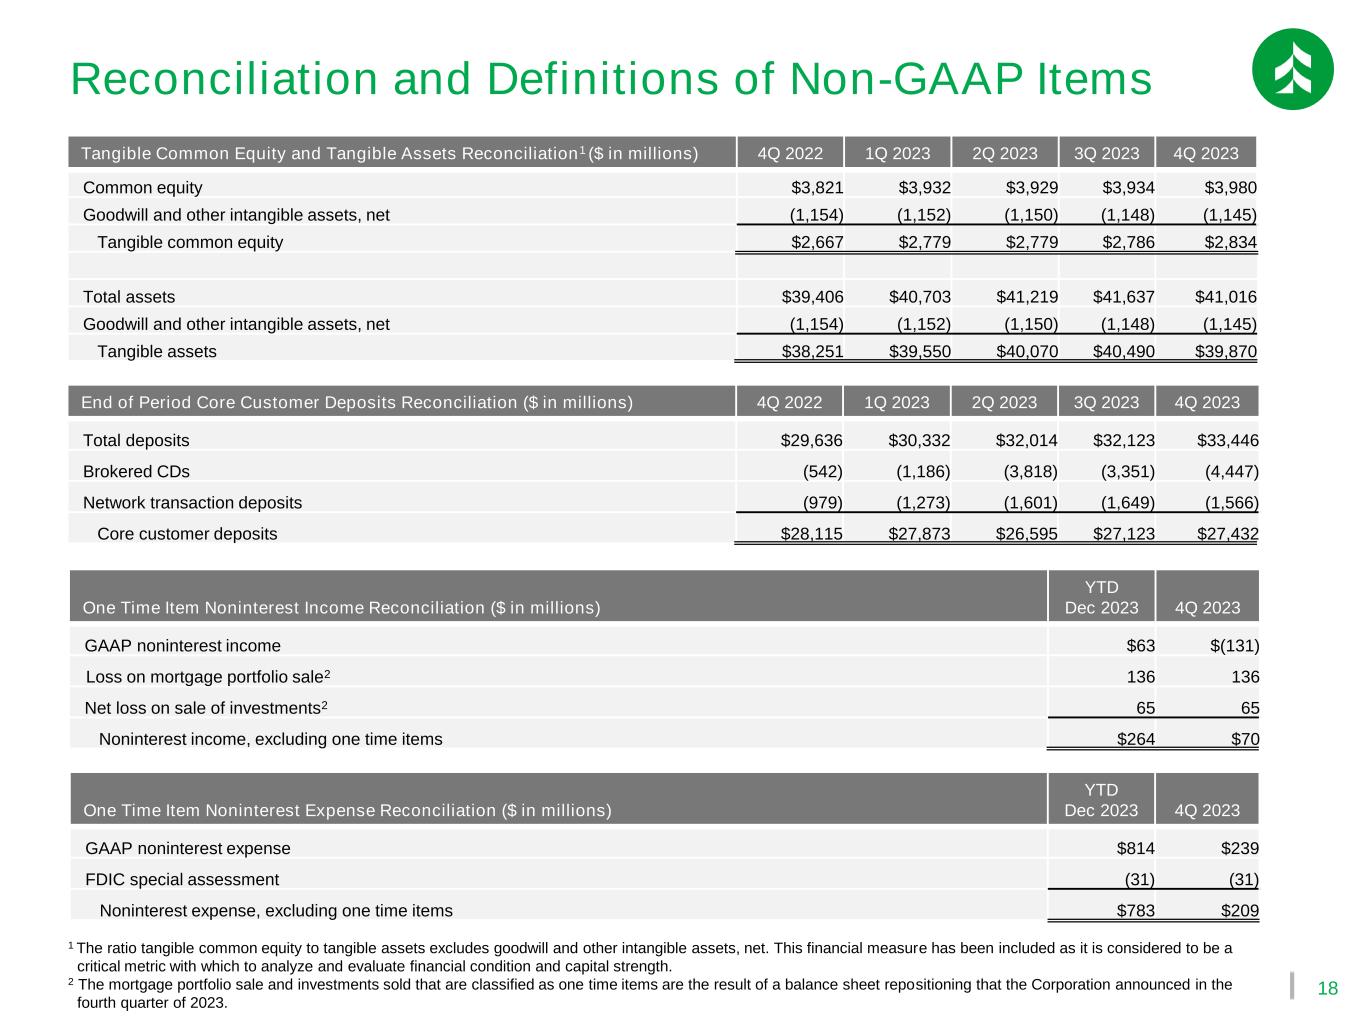
18 Reconciliation and Definitions of Non-GAAP Items Tangible Common Equity and Tangible Assets Reconciliation1 ($ in millions) 4Q 2022 1Q 2023 2Q 2023 3Q 2023 4Q 2023 Common equity $3,821 $3,932 $3,929 $3,934 $3,980 Goodwill and other intangible assets, net (1,154) (1,152) (1,150) (1,148) (1,145) Tangible common equity $2,667 $2,779 $2,779 $2,786 $2,834 Total assets $39,406 $40,703 $41,219 $41,637 $41,016 Goodwill and other intangible assets, net (1,154) (1,152) (1,150) (1,148) (1,145) Tangible assets $38,251 $39,550 $40,070 $40,490 $39,870 1 The ratio tangible common equity to tangible assets excludes goodwill and other intangible assets, net. This financial measure has been included as it is considered to be a critical metric with which to analyze and evaluate financial condition and capital strength. 2 The mortgage portfolio sale and investments sold that are classified as one time items are the result of a balance sheet repositioning that the Corporation announced in the fourth quarter of 2023. End of Period Core Customer Deposits Reconciliation ($ in millions) 4Q 2022 1Q 2023 2Q 2023 3Q 2023 4Q 2023 Total deposits $29,636 $30,332 $32,014 $32,123 $33,446 Brokered CDs (542) (1,186) (3,818) (3,351) (4,447) Network transaction deposits (979) (1,273) (1,601) (1,649) (1,566) Core customer deposits $28,115 $27,873 $26,595 $27,123 $27,432 One Time Item Noninterest Income Reconciliation ($ in millions) YTD Dec 2023 4Q 2023 GAAP noninterest income $63 $(131) Loss on mortgage portfolio sale2 136 136 Net loss on sale of investments2 65 65 Noninterest income, excluding one time items $264 $70 One Time Item Noninterest Expense Reconciliation ($ in millions) YTD Dec 2023 4Q 2023 GAAP noninterest expense $814 $239 FDIC special assessment (31) (31) Noninterest expense, excluding one time items $783 $209


