November 27, 2023 Fourth Quarter 2023 Investor Presentation Associated Banc-Corp Exhibit 99.1
1 Forward-Looking Statements Important note regarding forward-looking statements: Statements made in this presentation which are not purely historical are forward-looking statements, as defined in the Private Securities Litigation Reform Act of 1995. This includes any statements regarding management’s plans, objectives, or goals for future operations, products or services, and forecasts of its revenues, earnings, or other measures of performance. Such forward-looking statements may be identified by the use of words such as “believe,” “expect,” “anticipate,” “plan,” “estimate,” “should,” “will,” “intend,” "target,“ “outlook,” “project,” “guidance,” or similar expressions. Forward-looking statements are based on current management expectations and, by their nature, are subject to risks and uncertainties. Actual results may differ materially from those contained in the forward-looking statements. Factors which may cause actual results to differ materially from those contained in such forward-looking statements include those identified in the Company’s most recent Form 10-K and subsequent Form 10-Qs and other SEC filings, and such factors are incorporated herein by reference. Trademarks: All trademarks, service marks, and trade names referenced in this material are official trademarks and the property of their respective owners. Presentation: Within the charts and tables presented, certain segments, columns and rows may not sum to totals shown due to rounding. Non-GAAP Measures: This presentation includes certain non-GAAP financial measures. These non-GAAP measures are provided in addition to, and not as substitutes for, measures of our financial performance determined in accordance with GAAP. Our calculation of these non-GAAP measures may not be comparable to similarly titled measures of other companies due to potential differences between companies in the method of calculation. As a result, the use of these non-GAAP measures has limitations and should not be considered superior to, in isolation from, or as a substitute for, related GAAP measures. Reconciliations of these non-GAAP financial measures to the most directly comparable GAAP financial measures can be found at the end of this presentation.
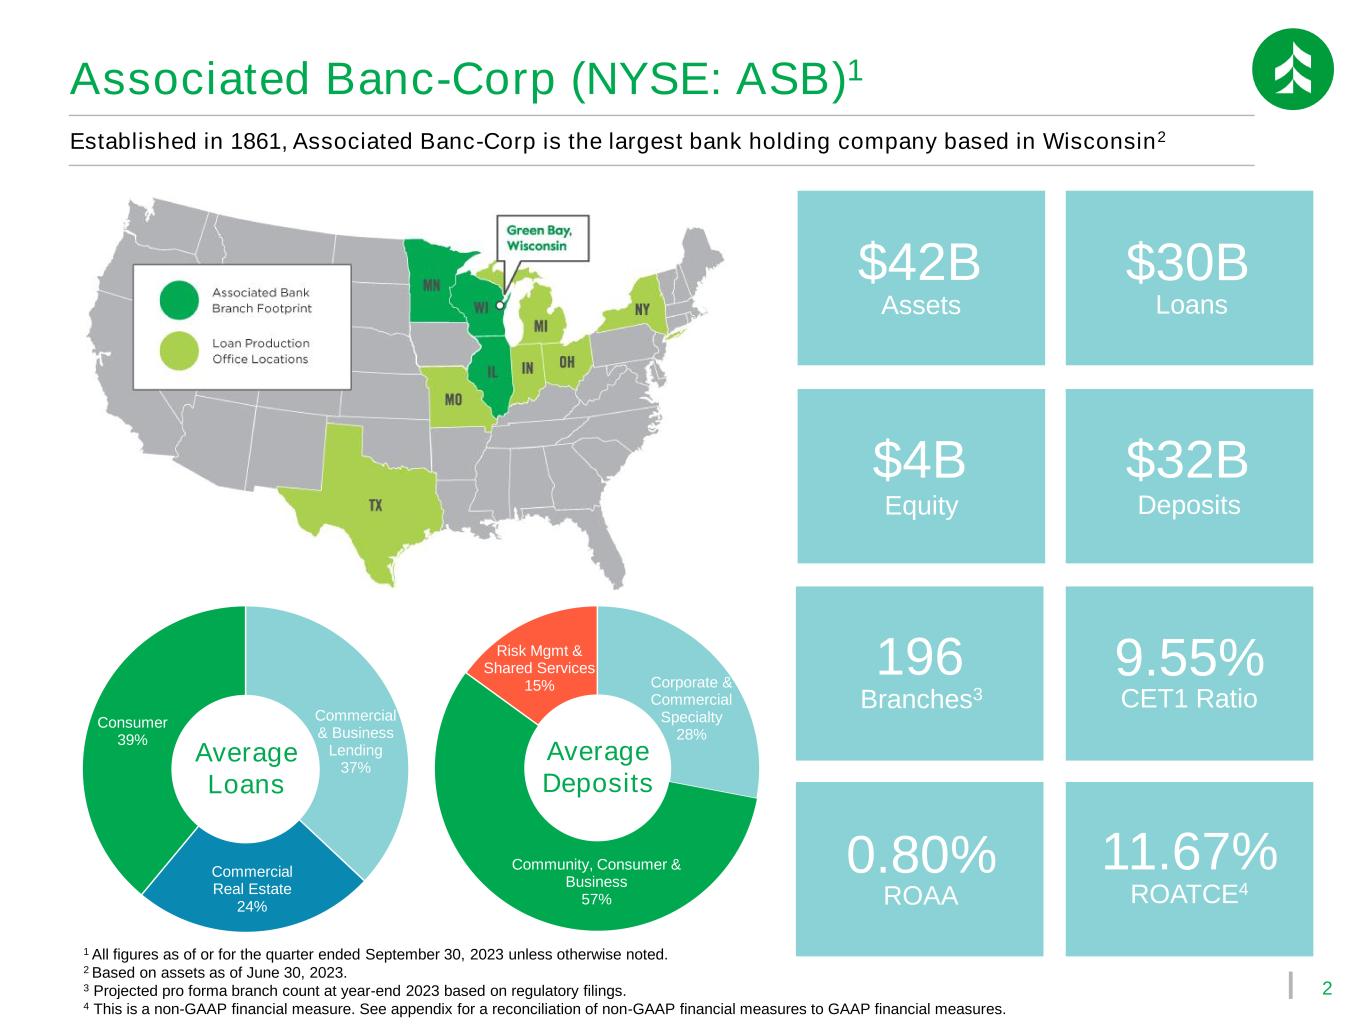
2 Commercial & Business Lending 37% Commercial Real Estate 24% Consumer 39% Corporate & Commercial Specialty 28% Community, Consumer & Business 57% Risk Mgmt & Shared Services 15% Established in 1861, Associated Banc-Corp is the largest bank holding company based in Wisconsin2 Associated Banc-Corp (NYSE: ASB)1 $42B Assets $30B Loans $4B Equity $32B Deposits Average Loans Average Deposits 1 All figures as of or for the quarter ended September 30, 2023 unless otherwise noted. 2 Based on assets as of June 30, 2023. 3 Projected pro forma branch count at year-end 2023 based on regulatory filings. 4 This is a non-GAAP financial measure. See appendix for a reconciliation of non-GAAP financial measures to GAAP financial measures. 11.67% ROATCE4 196 Branches3 9.55% CET1 Ratio 0.80% ROAA
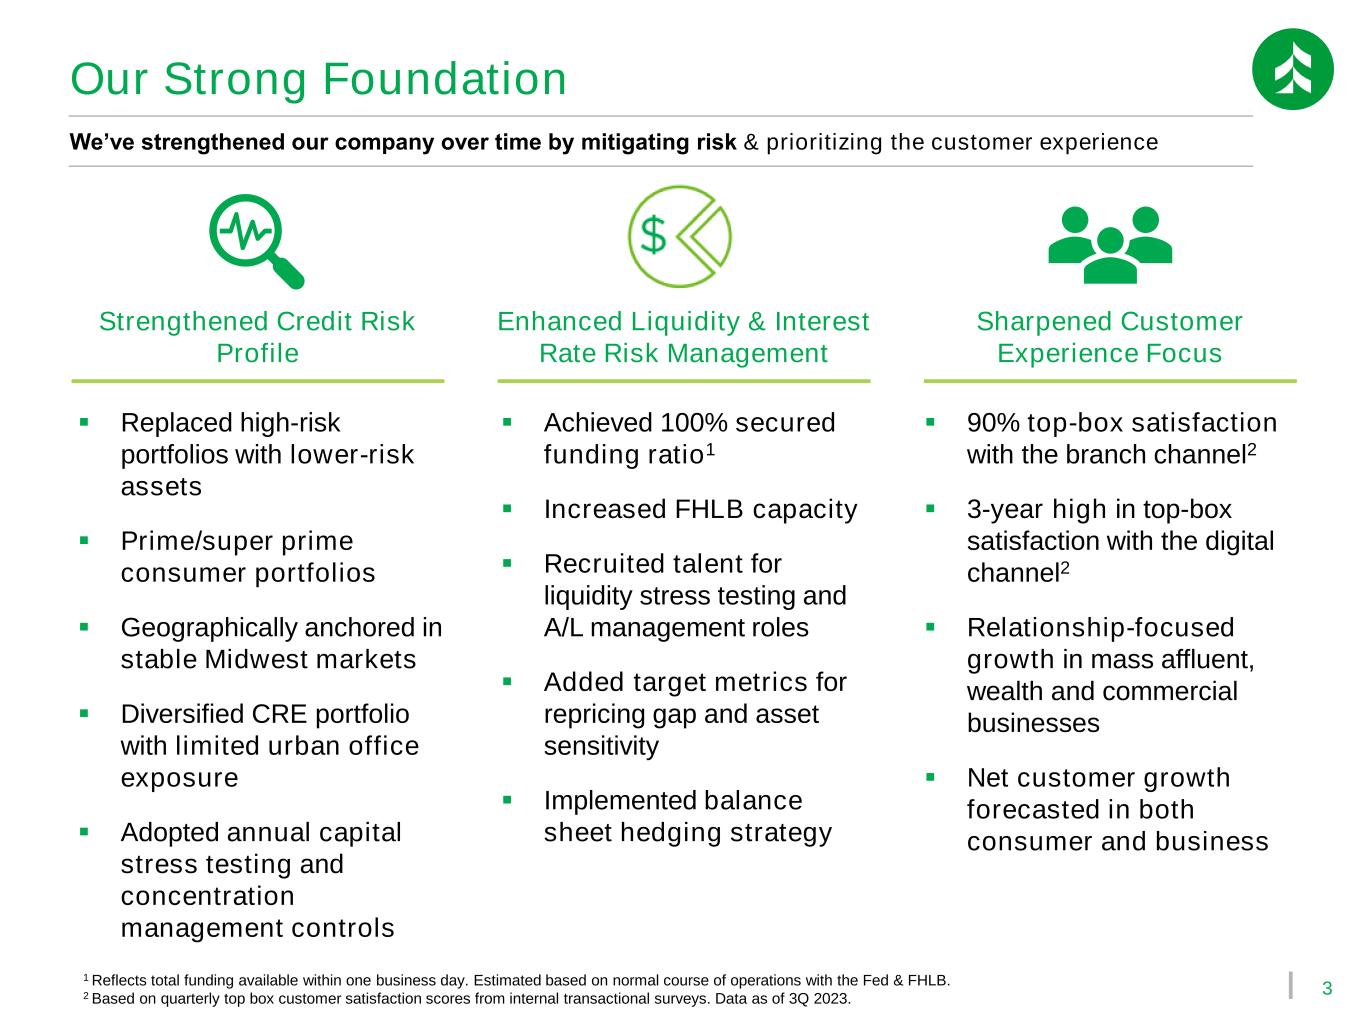
3 Our Strong Foundation We’ve strengthened our company over time by mitigating risk & prioritizing the customer experience Strengthened Credit Risk Profile Enhanced Liquidity & Interest Rate Risk Management Sharpened Customer Experience Focus ▪ Replaced high-risk portfolios with lower-risk assets ▪ Prime/super prime consumer portfolios ▪ Geographically anchored in stable Midwest markets ▪ Diversified CRE portfolio with limited urban office exposure ▪ Adopted annual capital stress testing and concentration management controls ▪ Achieved 100% secured funding ratio1 ▪ Increased FHLB capacity ▪ Recruited talent for liquidity stress testing and A/L management roles ▪ Added target metrics for repricing gap and asset sensitivity ▪ Implemented balance sheet hedging strategy ▪ 90% top-box satisfaction with the branch channel2 ▪ 3-year high in top-box satisfaction with the digital channel2 ▪ Relationship-focused growth in mass affluent, wealth and commercial businesses ▪ Net customer growth forecasted in both consumer and business 1 Reflects total funding available within one business day. Estimated based on normal course of operations with the Fed & FHLB. 2 Based on quarterly top box customer satisfaction scores from internal transactional surveys. Data as of 3Q 2023.
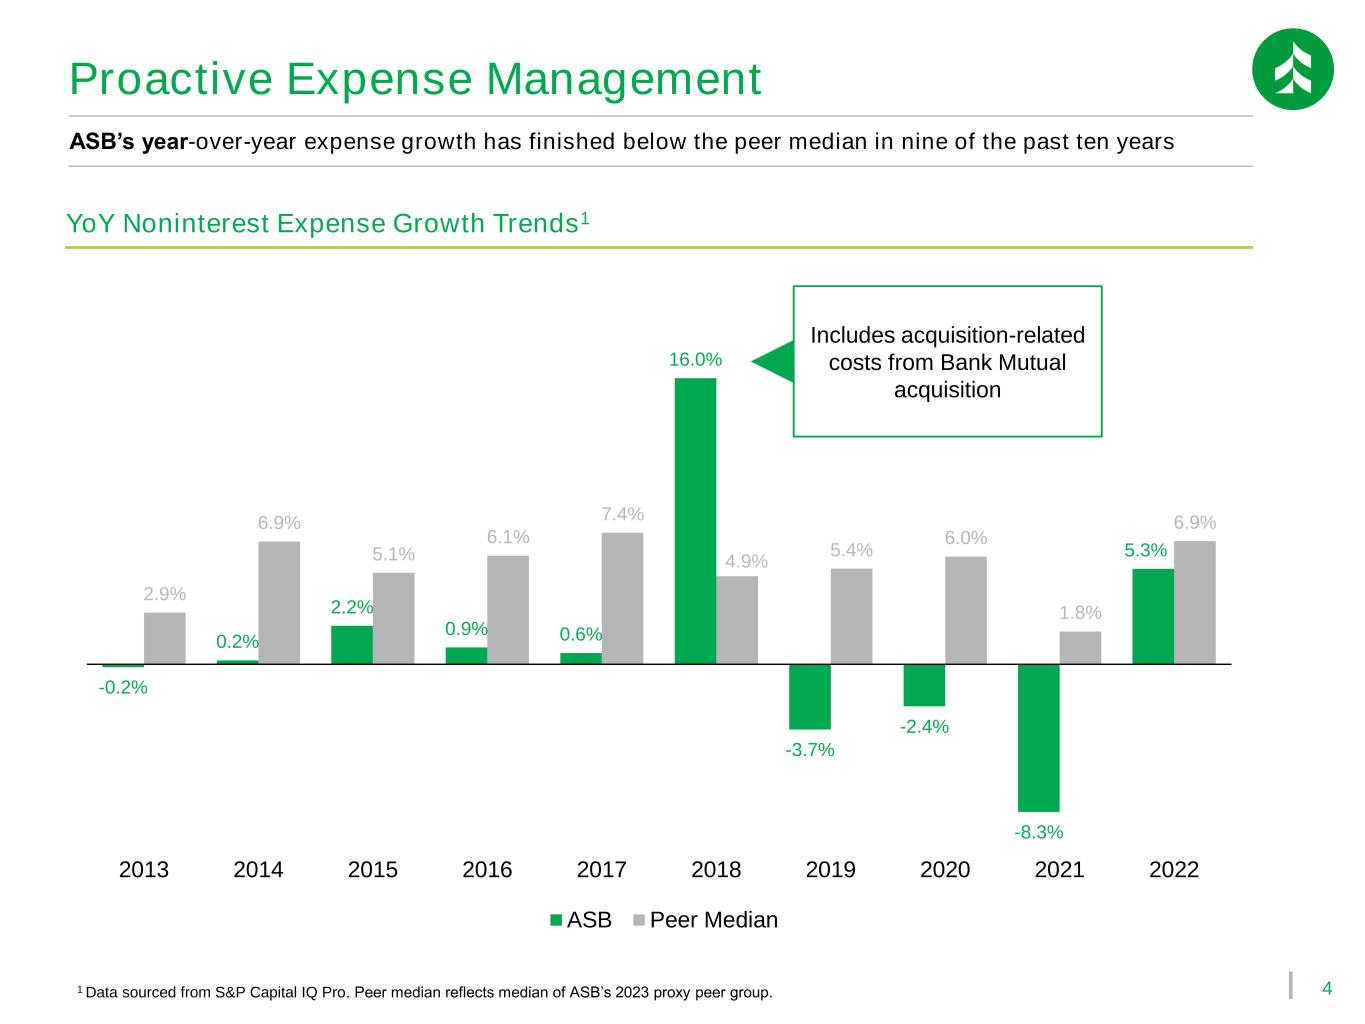
4 Proactive Expense Management ASB’s year-over-year expense growth has finished below the peer median in nine of the past ten years 1 Data sourced from S&P Capital IQ Pro. Peer median reflects median of ASB’s 2023 proxy peer group. YoY Noninterest Expense Growth Trends1 -0.2% 0.2% 2.2% 0.9% 0.6% 16.0% -3.7% -2.4% -8.3% 5.3% 2.9% 6.9% 5.1% 6.1% 7.4% 4.9% 5.4% 6.0% 1.8% 6.9% 2013 2014 2015 2016 2017 2018 2019 2020 2021 2022 ASB Peer Median Includes acquisition-related costs from Bank Mutual acquisition
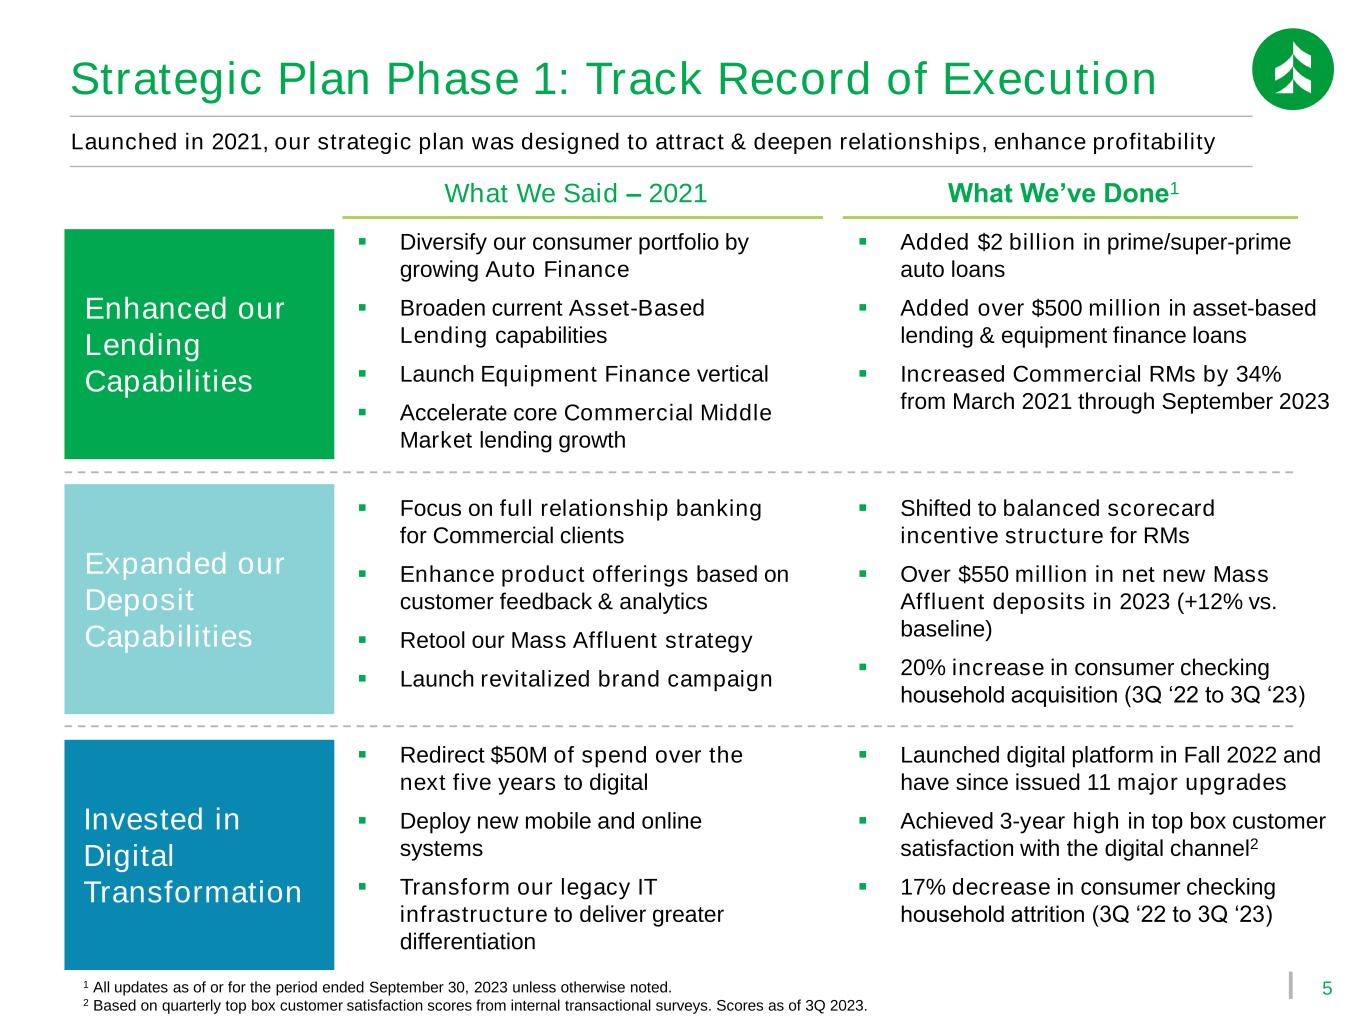
5 Strategic Plan Phase 1: Track Record of Execution Launched in 2021, our strategic plan was designed to attract & deepen relationships, enhance profitability Enhanced our Lending Capabilities Expanded our Deposit Capabilities Invested in Digital Transformation ▪ Diversify our consumer portfolio by growing Auto Finance ▪ Broaden current Asset-Based Lending capabilities ▪ Launch Equipment Finance vertical ▪ Accelerate core Commercial Middle Market lending growth ▪ Focus on full relationship banking for Commercial clients ▪ Enhance product offerings based on customer feedback & analytics ▪ Retool our Mass Affluent strategy ▪ Launch revitalized brand campaign ▪ Redirect $50M of spend over the next five years to digital ▪ Deploy new mobile and online systems ▪ Transform our legacy IT infrastructure to deliver greater differentiation What We Said – 2021 What We’ve Done1 ▪ Added $2 billion in prime/super-prime auto loans ▪ Added over $500 million in asset-based lending & equipment finance loans ▪ Increased Commercial RMs by 34% from March 2021 through September 2023 ▪ Shifted to balanced scorecard incentive structure for RMs ▪ Over $550 million in net new Mass Affluent deposits in 2023 (+12% vs. baseline) ▪ 20% increase in consumer checking household acquisition (3Q ‘22 to 3Q ‘23) ▪ Launched digital platform in Fall 2022 and have since issued 11 major upgrades ▪ Achieved 3-year high in top box customer satisfaction with the digital channel2 ▪ 17% decrease in consumer checking household attrition (3Q ‘22 to 3Q ‘23) 1 All updates as of or for the period ended September 30, 2023 unless otherwise noted. 2 Based on quarterly top box customer satisfaction scores from internal transactional surveys. Scores as of 3Q 2023.
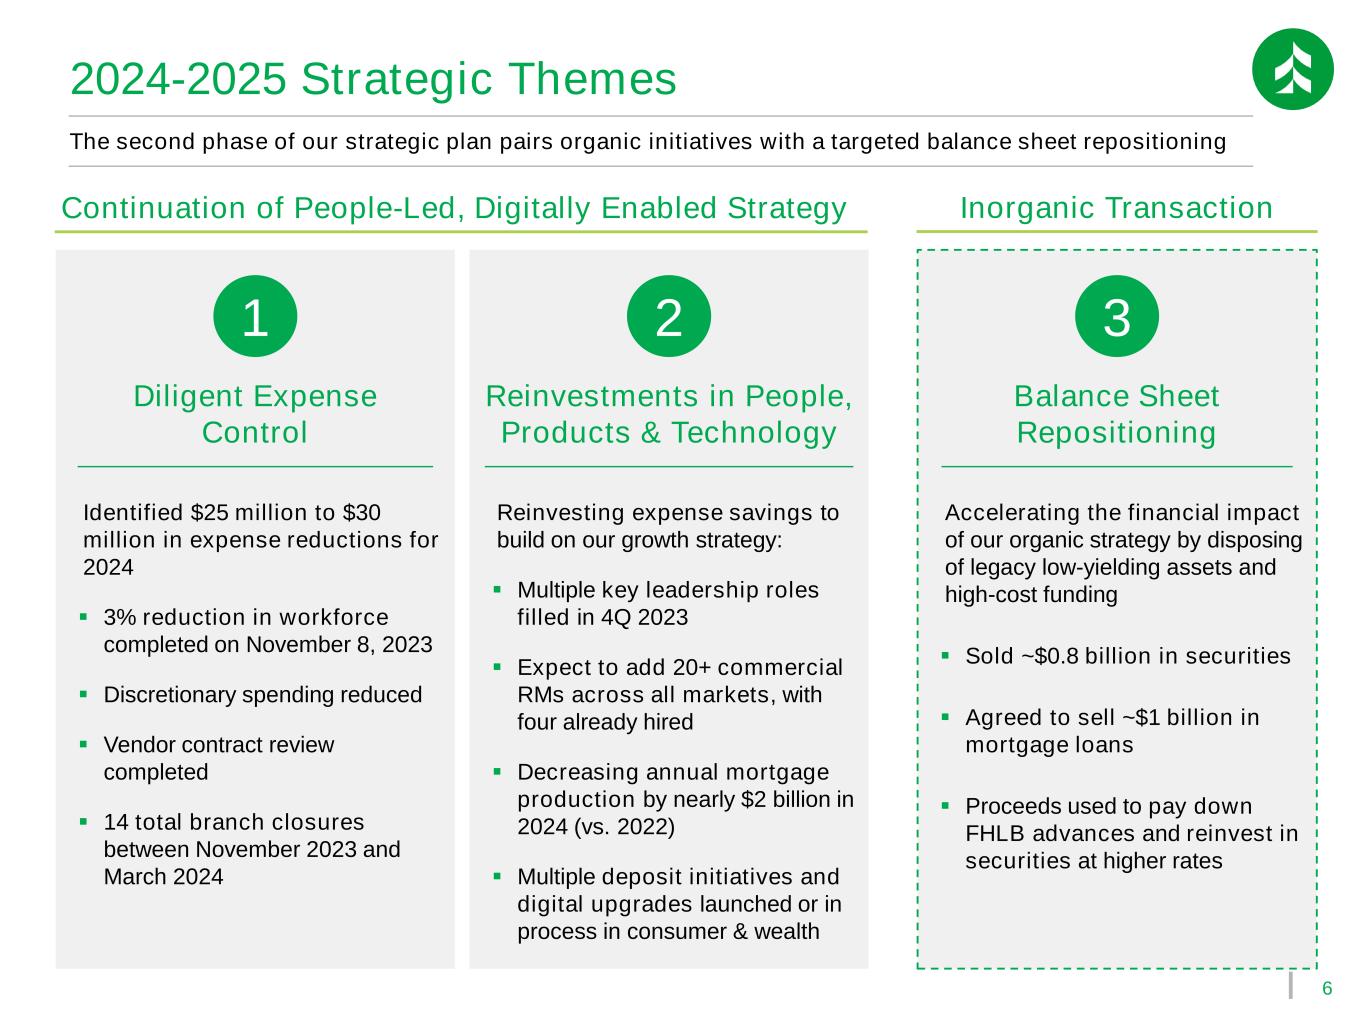
6 2024-2025 Strategic Themes The second phase of our strategic plan pairs organic initiatives with a targeted balance sheet repositioning Identified $25 million to $30 million in expense reductions for 2024 ▪ 3% reduction in workforce completed on November 8, 2023 ▪ Discretionary spending reduced ▪ Vendor contract review completed ▪ 14 total branch closures between November 2023 and March 2024 Reinvesting expense savings to build on our growth strategy: ▪ Multiple key leadership roles filled in 4Q 2023 ▪ Expect to add 20+ commercial RMs across all markets, with four already hired ▪ Decreasing annual mortgage production by nearly $2 billion in 2024 (vs. 2022) ▪ Multiple deposit initiatives and digital upgrades launched or in process in consumer & wealth Diligent Expense Control Accelerating the financial impact of our organic strategy by disposing of legacy low-yielding assets and high-cost funding ▪ Sold ~$0.8 billion in securities ▪ Agreed to sell ~$1 billion in mortgage loans ▪ Proceeds used to pay down FHLB advances and reinvest in securities at higher rates Balance Sheet Repositioning Inorganic TransactionContinuation of People-Led, Digitally Enabled Strategy Reinvestments in People, Products & Technology 1 2 3
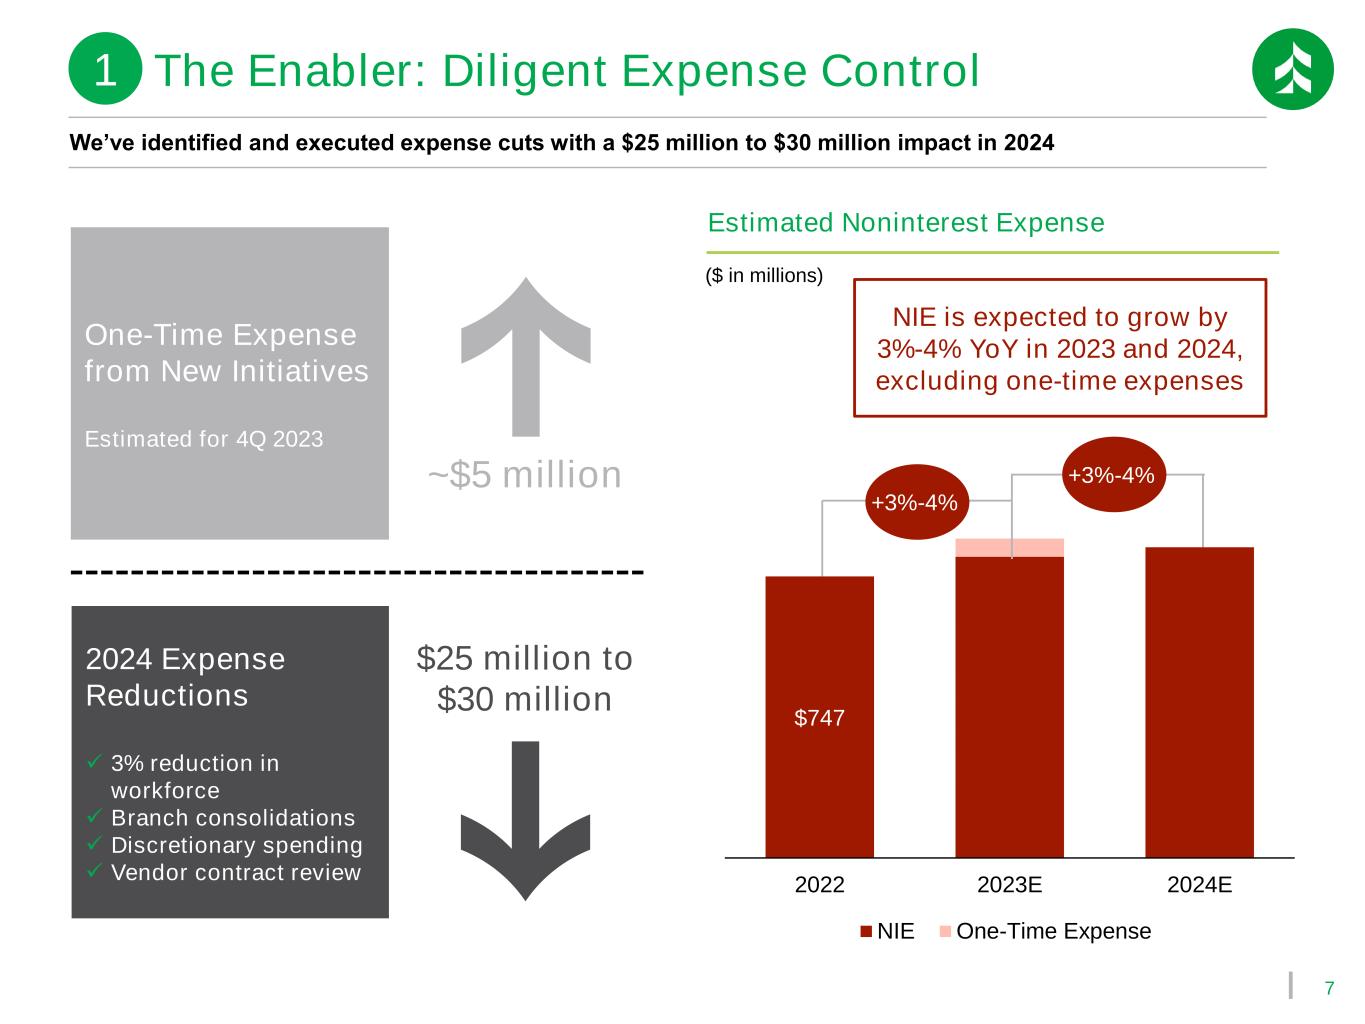
7 One-Time Expense from New Initiatives Estimated for 4Q 2023 We’ve identified and executed expense cuts with a $25 million to $30 million impact in 2024 The Enabler: Diligent Expense Control Estimated Noninterest Expense $747 2022 2023E 2024E NIE One-Time Expense NIE is expected to grow by 3%-4% YoY in 2023 and 2024, excluding one-time expenses +3%-4% +3%-4% ($ in millions) 2024 Expense Reductions ✓ 3% reduction in workforce ✓ Branch consolidations ✓ Discretionary spending ✓ Vendor contract review ~$5 million $25 million to $30 million 1
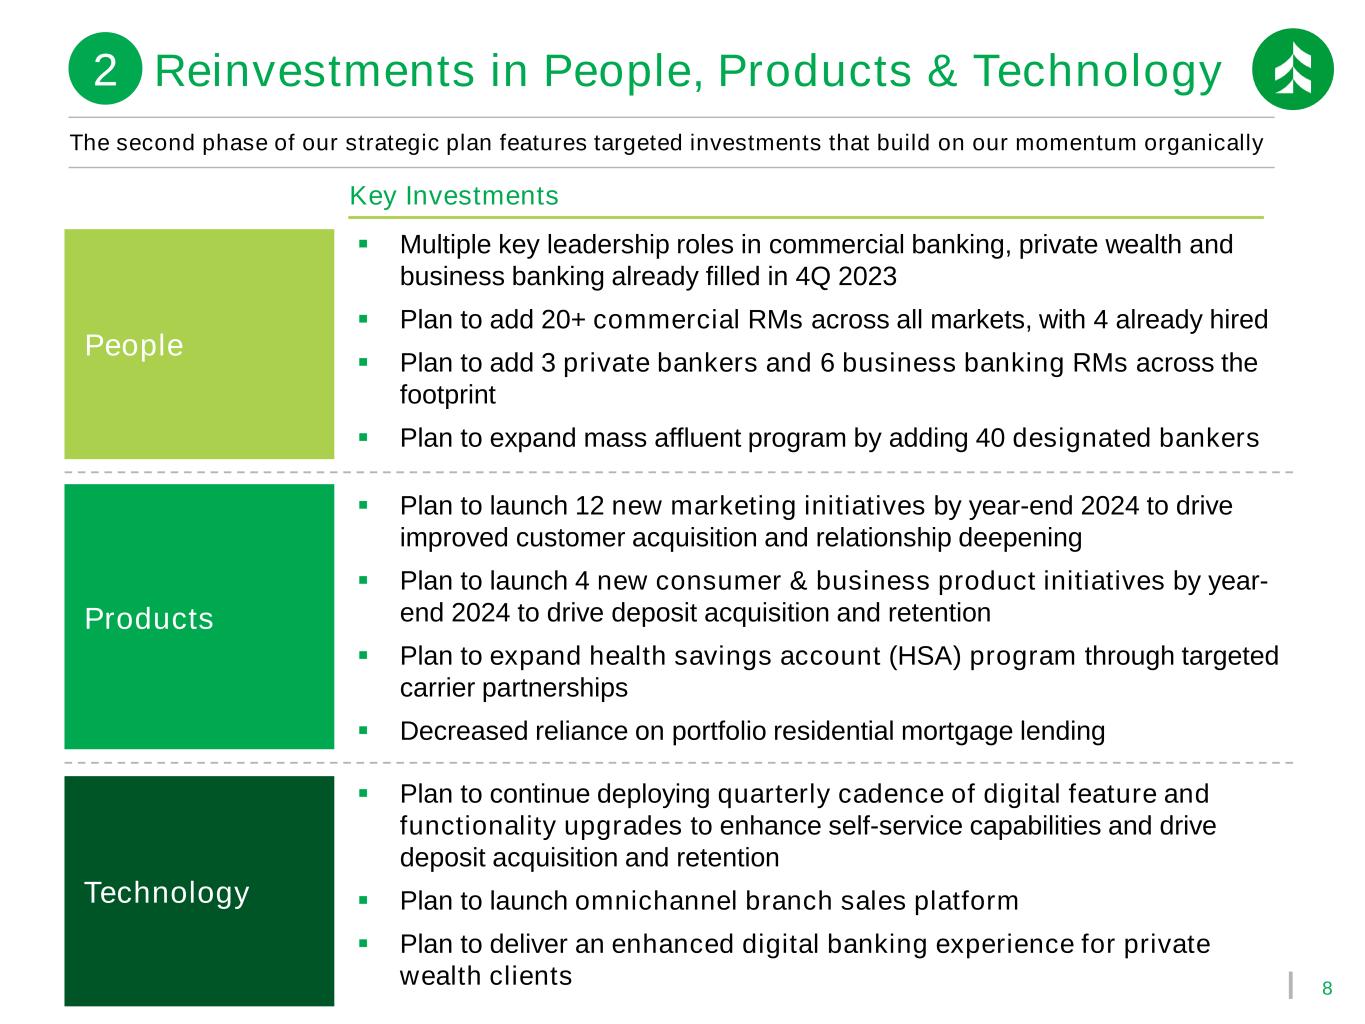
8 The second phase of our strategic plan features targeted investments that build on our momentum organically People Products Technology Key Investments ▪ Multiple key leadership roles in commercial banking, private wealth and business banking already filled in 4Q 2023 ▪ Plan to add 20+ commercial RMs across all markets, with 4 already hired ▪ Plan to add 3 private bankers and 6 business banking RMs across the footprint ▪ Plan to expand mass affluent program by adding 40 designated bankers ▪ Plan to launch 12 new marketing initiatives by year-end 2024 to drive improved customer acquisition and relationship deepening ▪ Plan to launch 4 new consumer & business product initiatives by year- end 2024 to drive deposit acquisition and retention ▪ Plan to expand health savings account (HSA) program through targeted carrier partnerships ▪ Decreased reliance on portfolio residential mortgage lending ▪ Plan to continue deploying quarterly cadence of digital feature and functionality upgrades to enhance self-service capabilities and drive deposit acquisition and retention ▪ Plan to launch omnichannel branch sales platform ▪ Plan to deliver an enhanced digital banking experience for private wealth clients 2 Reinvestments in People, Products & Technology
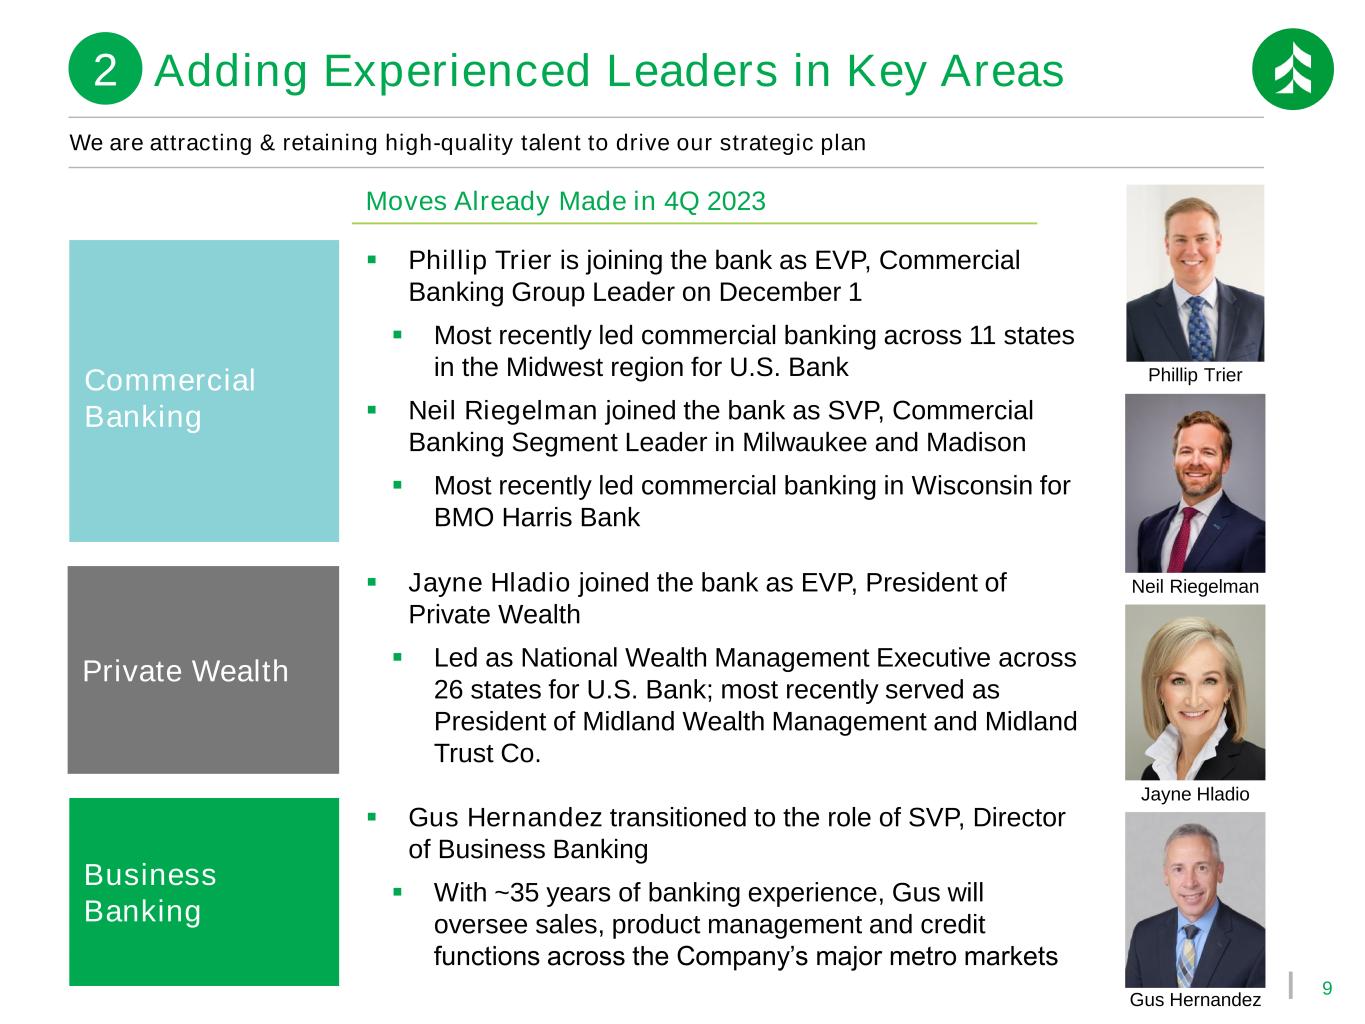
9 We are attracting & retaining high-quality talent to drive our strategic plan Private Wealth Commercial Banking Business Banking ▪ Jayne Hladio joined the bank as EVP, President of Private Wealth ▪ Led as National Wealth Management Executive across 26 states for U.S. Bank; most recently served as President of Midland Wealth Management and Midland Trust Co. ▪ Phillip Trier is joining the bank as EVP, Commercial Banking Group Leader on December 1 ▪ Most recently led commercial banking across 11 states in the Midwest region for U.S. Bank ▪ Neil Riegelman joined the bank as SVP, Commercial Banking Segment Leader in Milwaukee and Madison ▪ Most recently led commercial banking in Wisconsin for BMO Harris Bank ▪ Gus Hernandez transitioned to the role of SVP, Director of Business Banking ▪ With ~35 years of banking experience, Gus will oversee sales, product management and credit functions across the Company’s major metro markets Neil Riegelman Jayne Hladio Gus Hernandez Moves Already Made in 4Q 2023 Adding Experienced Leaders in Key Areas2 Phillip Trier
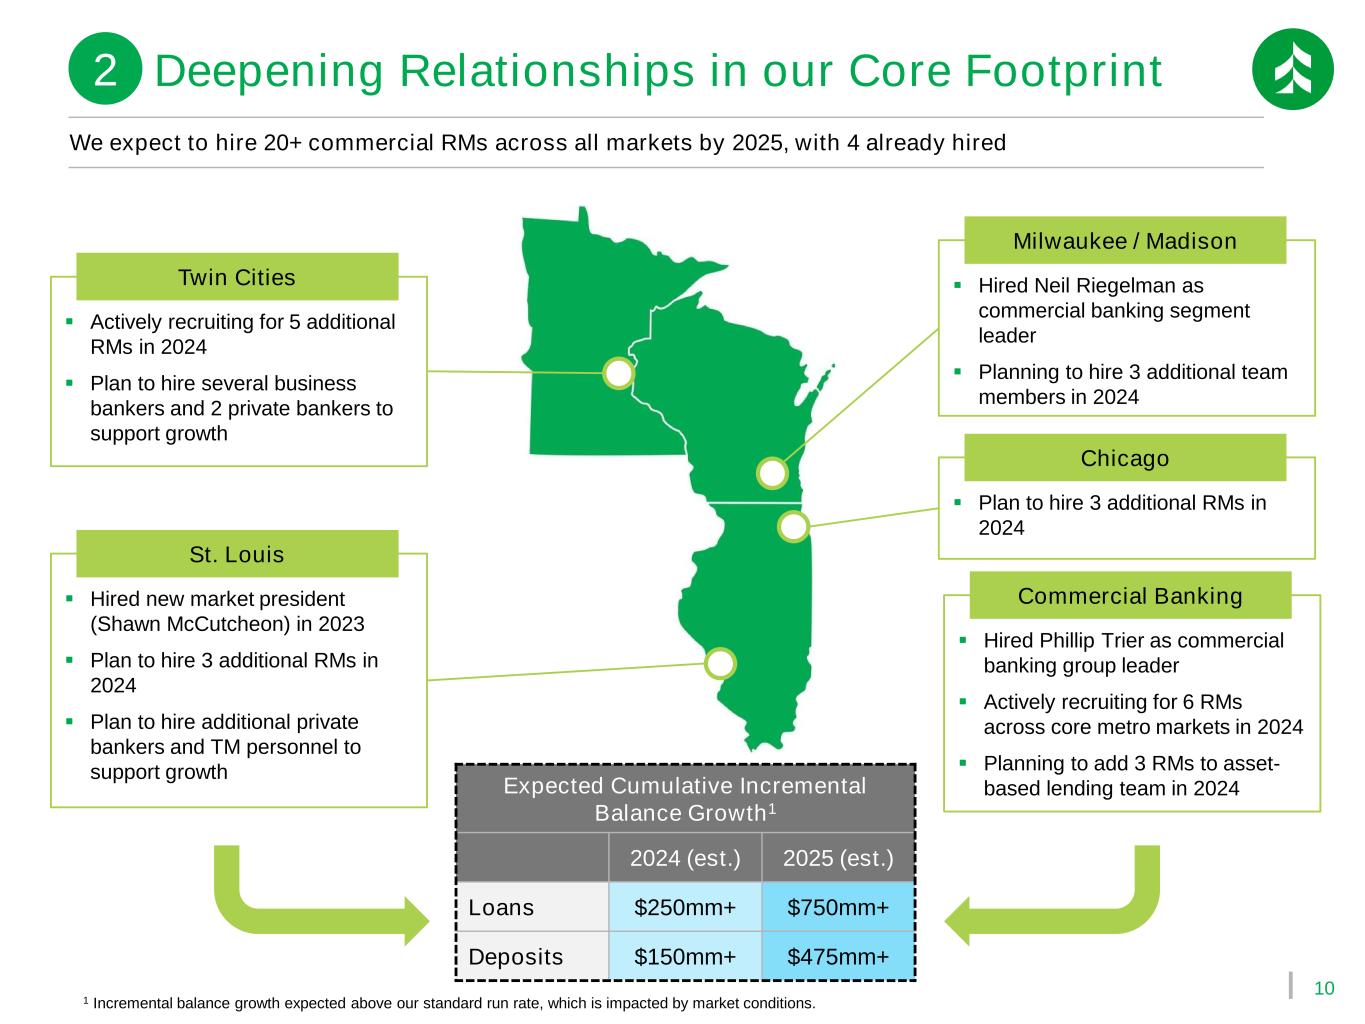
10 ▪ Hired Phillip Trier as commercial banking group leader ▪ Actively recruiting for 6 RMs across core metro markets in 2024 ▪ Planning to add 3 RMs to asset- based lending team in 2024 We expect to hire 20+ commercial RMs across all markets by 2025, with 4 already hired ▪ Hired Neil Riegelman as commercial banking segment leader ▪ Planning to hire 3 additional team members in 2024 Milwaukee / Madison ▪ Actively recruiting for 5 additional RMs in 2024 ▪ Plan to hire several business bankers and 2 private bankers to support growth Twin Cities ▪ Hired new market president (Shawn McCutcheon) in 2023 ▪ Plan to hire 3 additional RMs in 2024 ▪ Plan to hire additional private bankers and TM personnel to support growth St. Louis Commercial Banking Expected Cumulative Incremental Balance Growth1 2024 (est.) 2025 (est.) Loans $250mm+ $750mm+ Deposits $150mm+ $475mm+ Deepening Relationships in our Core Footprint2 ▪ Plan to hire 3 additional RMs in 2024 Chicago 1 Incremental balance growth expected above our standard run rate, which is impacted by market conditions.
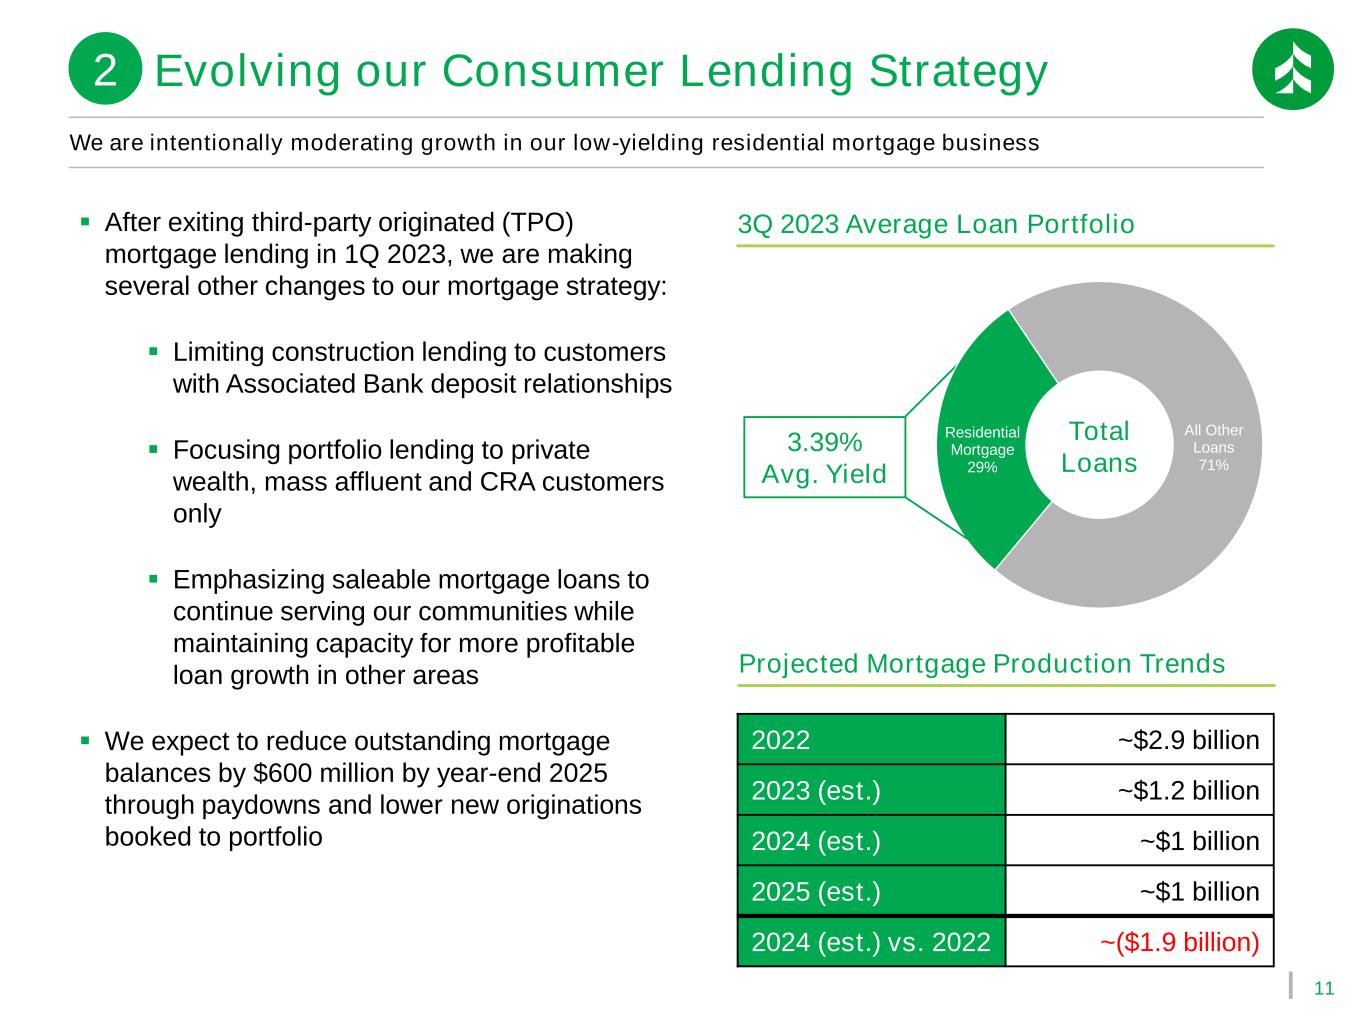
11 All Other Loans 71% Residential Mortgage 29% Total Loans We are intentionally moderating growth in our low-yielding residential mortgage business Projected Mortgage Production Trends 2022 ~$2.9 billion 2023 (est.) ~$1.2 billion 2024 (est.) ~$1 billion 2025 (est.) ~$1 billion 2024 (est.) vs. 2022 ~($1.9 billion) 3Q 2023 Average Loan Portfolio▪ After exiting third-party originated (TPO) mortgage lending in 1Q 2023, we are making several other changes to our mortgage strategy: ▪ Limiting construction lending to customers with Associated Bank deposit relationships ▪ Focusing portfolio lending to private wealth, mass affluent and CRA customers only ▪ Emphasizing saleable mortgage loans to continue serving our communities while maintaining capacity for more profitable loan growth in other areas ▪ We expect to reduce outstanding mortgage balances by $600 million by year-end 2025 through paydowns and lower new originations booked to portfolio 3.39% Avg. Yield Evolving our Consumer Lending Strategy2
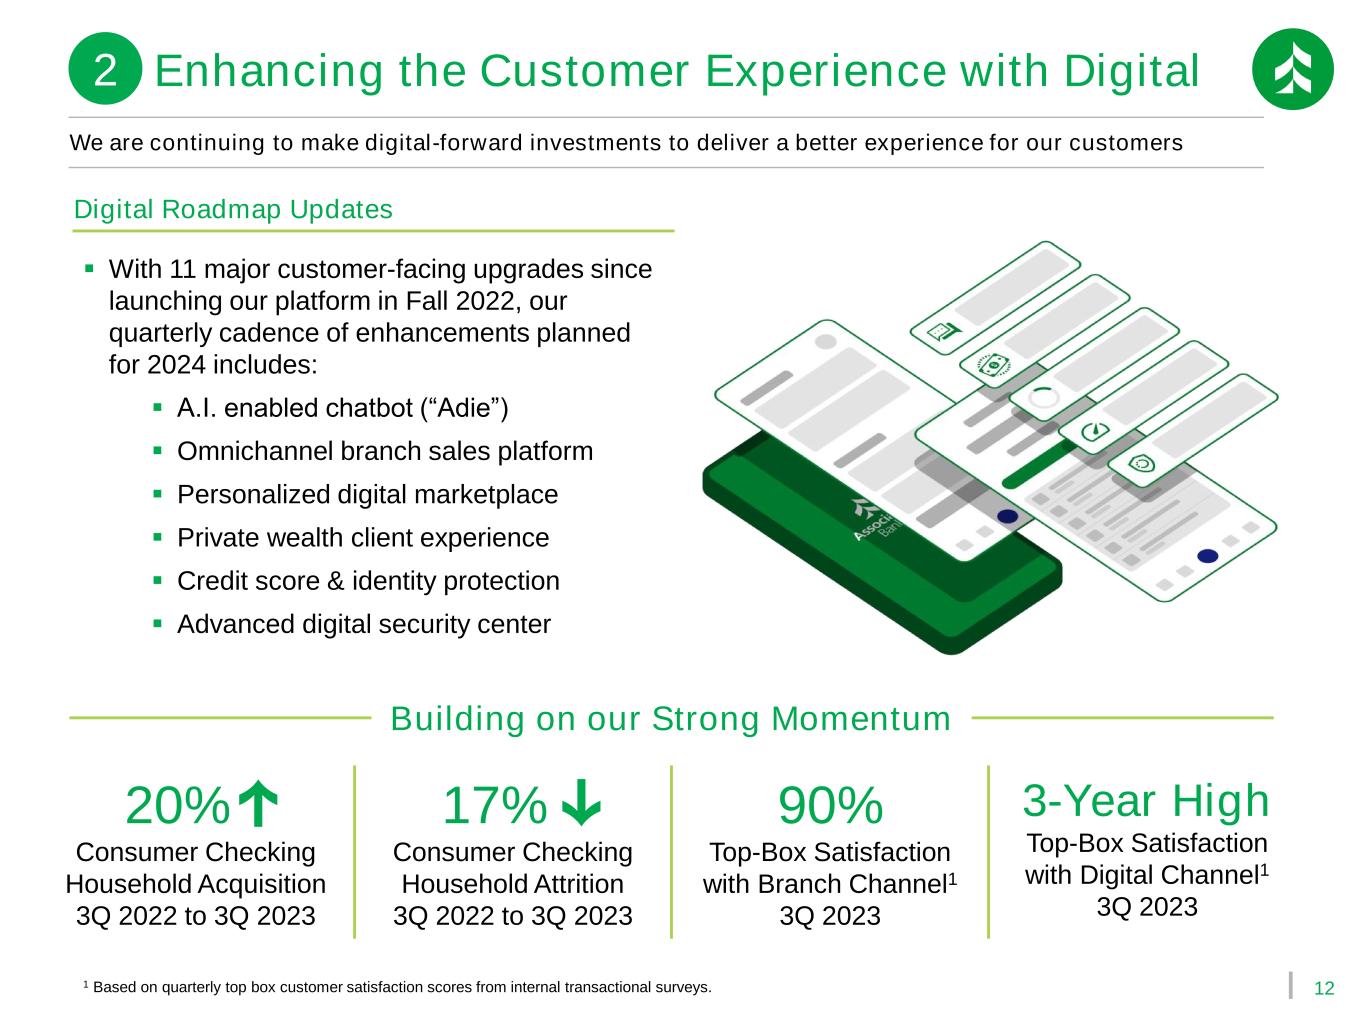
12 20% Consumer Checking Household Acquisition 3Q 2022 to 3Q 2023 17% Consumer Checking Household Attrition 3Q 2022 to 3Q 2023 90% Top-Box Satisfaction with Branch Channel1 3Q 2023 3-Year High Top-Box Satisfaction with Digital Channel1 3Q 2023 We are continuing to make digital-forward investments to deliver a better experience for our customers 1 Based on quarterly top box customer satisfaction scores from internal transactional surveys. Building on our Strong Momentum ▪ With 11 major customer-facing upgrades since launching our platform in Fall 2022, our quarterly cadence of enhancements planned for 2024 includes: ▪ A.I. enabled chatbot (“Adie”) ▪ Omnichannel branch sales platform ▪ Personalized digital marketplace ▪ Private wealth client experience ▪ Credit score & identity protection ▪ Advanced digital security center Digital Roadmap Updates Enhancing the Customer Experience with Digital2
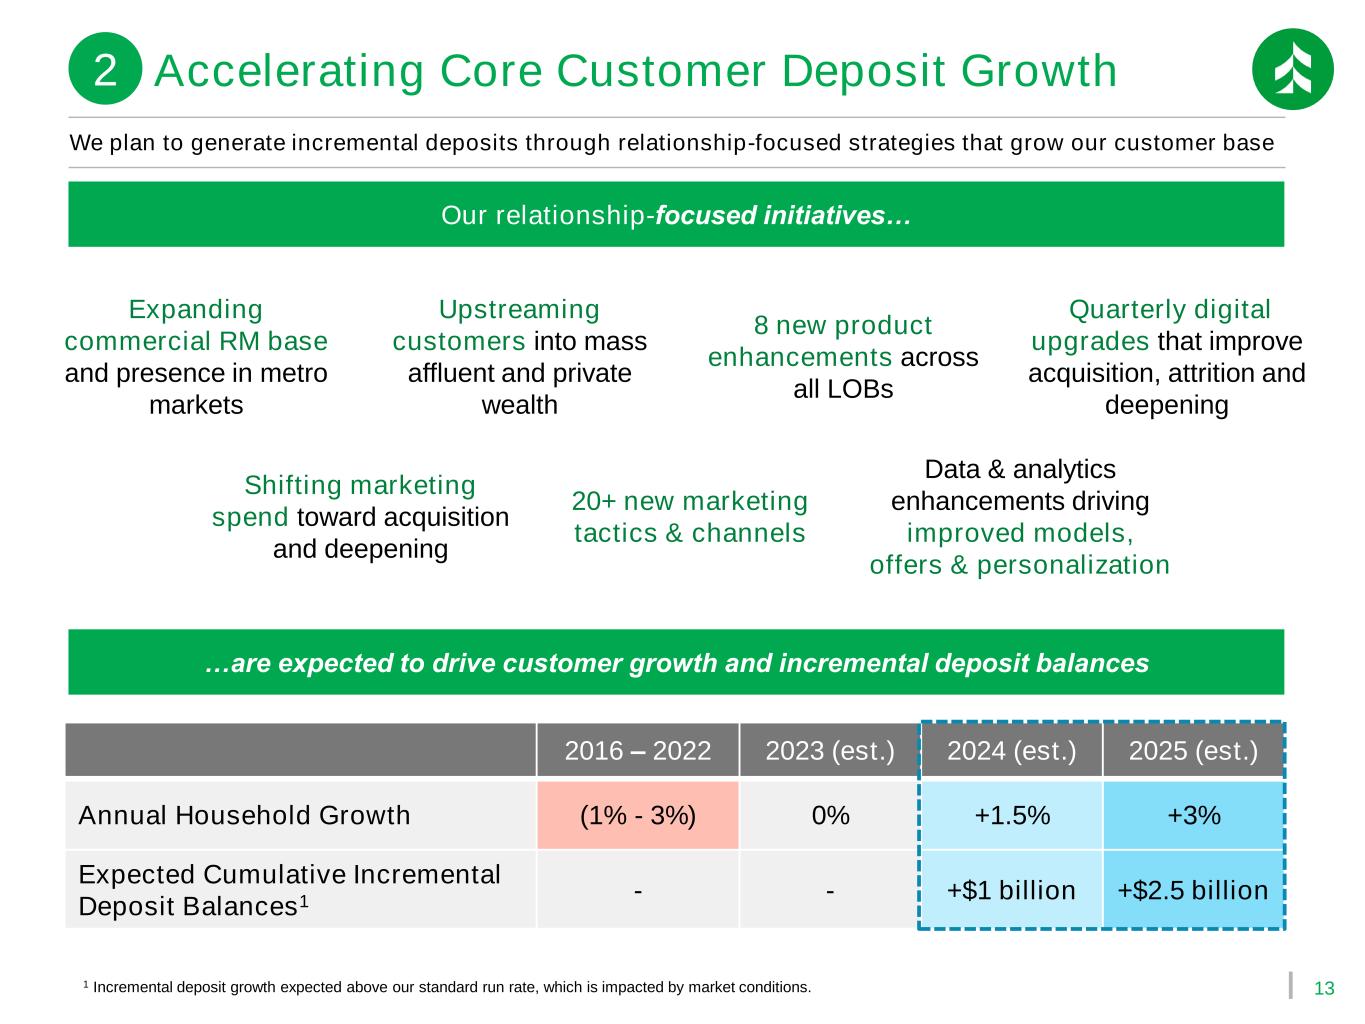
13 We plan to generate incremental deposits through relationship-focused strategies that grow our customer base Expanding commercial RM base and presence in metro markets Upstreaming customers into mass affluent and private wealth 8 new product enhancements across all LOBs Our relationship-focused initiatives… …are expected to drive customer growth and incremental deposit balances Quarterly digital upgrades that improve acquisition, attrition and deepening Shifting marketing spend toward acquisition and deepening 20+ new marketing tactics & channels Data & analytics enhancements driving improved models, offers & personalization 2016 – 2022 2023 (est.) 2024 (est.) 2025 (est.) Annual Household Growth (1% - 3%) 0% +1.5% +3% Expected Cumulative Incremental Deposit Balances1 - - +$1 billion +$2.5 billion Accelerating Core Customer Deposit Growth2 1 Incremental deposit growth expected above our standard run rate, which is impacted by market conditions.
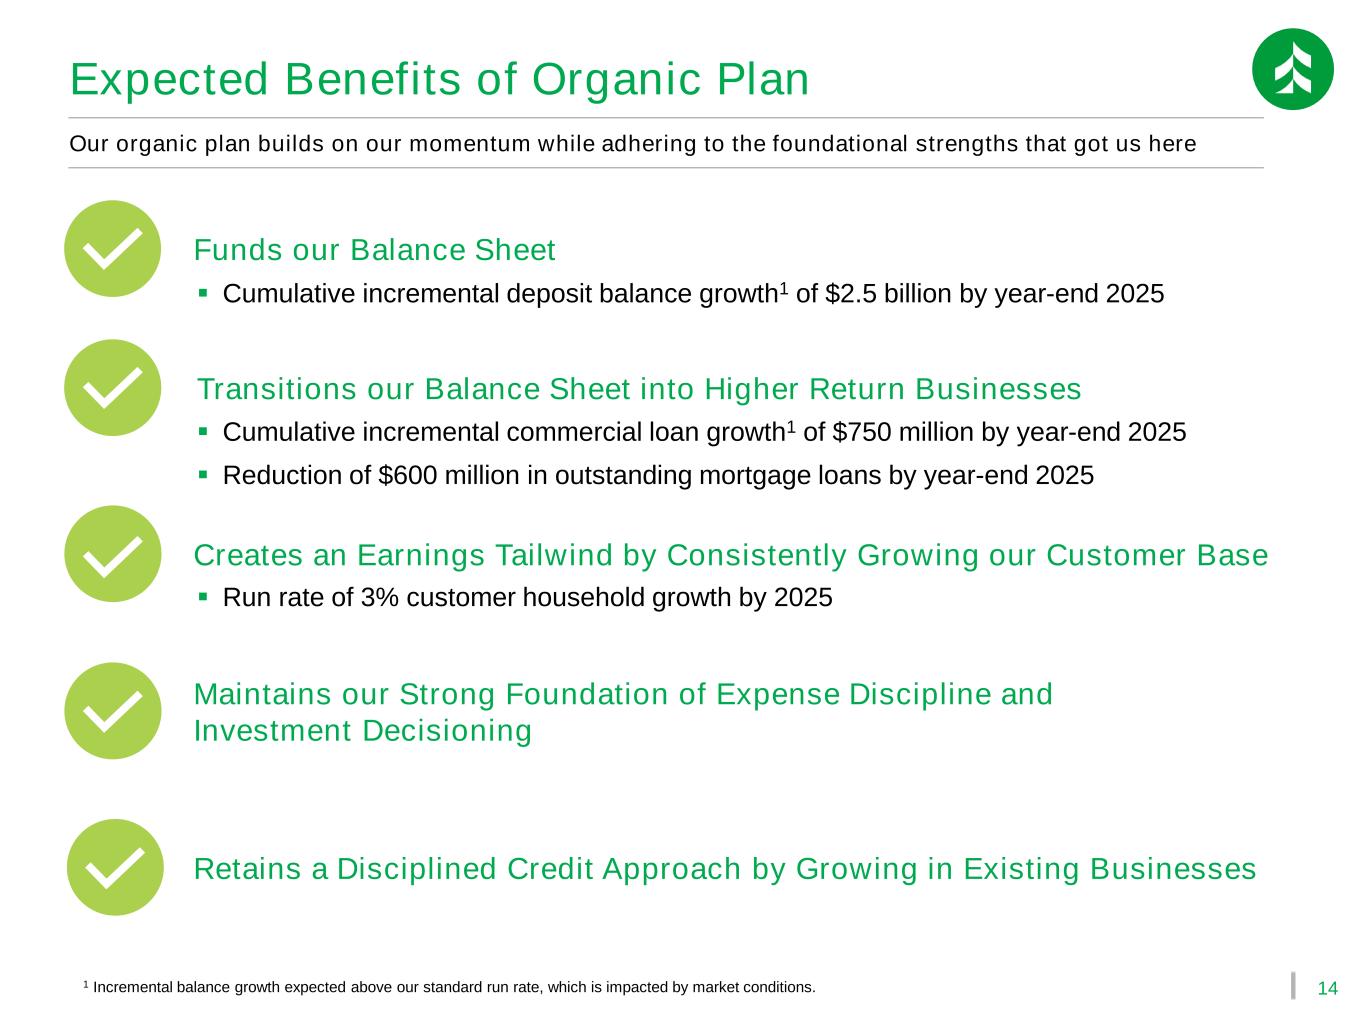
14 Our organic plan builds on our momentum while adhering to the foundational strengths that got us here Expected Benefits of Organic Plan Transitions our Balance Sheet into Higher Return Businesses Creates an Earnings Tailwind by Consistently Growing our Customer Base Maintains our Strong Foundation of Expense Discipline and Investment Decisioning Retains a Disciplined Credit Approach by Growing in Existing Businesses Funds our Balance Sheet ▪ Cumulative incremental deposit balance growth1 of $2.5 billion by year-end 2025 ▪ Cumulative incremental commercial loan growth1 of $750 million by year-end 2025 ▪ Reduction of $600 million in outstanding mortgage loans by year-end 2025 ▪ Run rate of 3% customer household growth by 2025 1 Incremental balance growth expected above our standard run rate, which is impacted by market conditions.
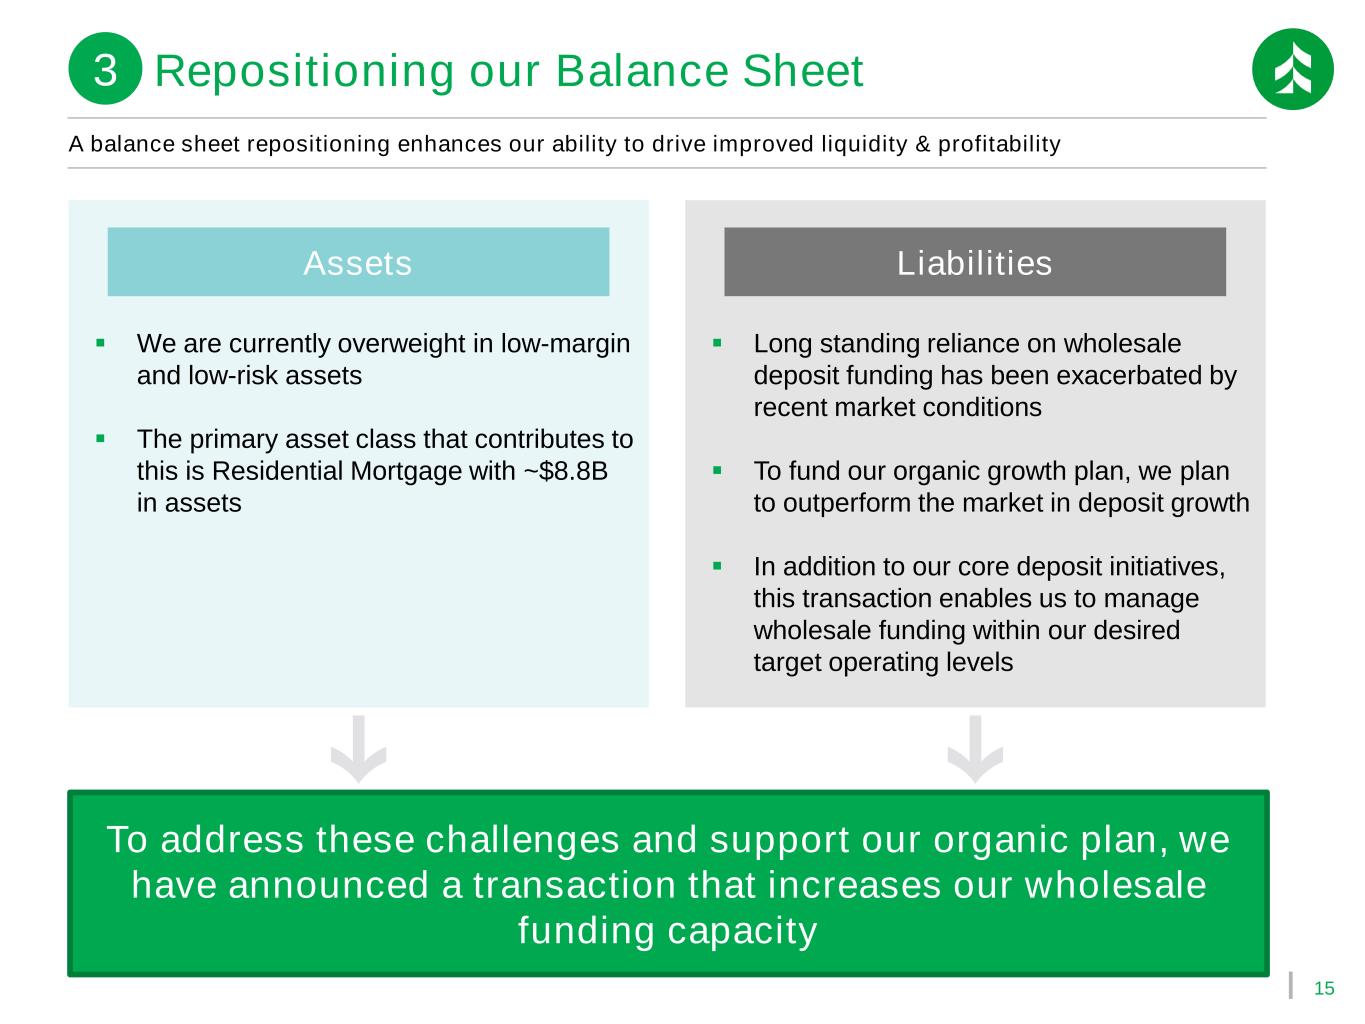
15 A balance sheet repositioning enhances our ability to drive improved liquidity & profitability ▪ We are currently overweight in low-margin and low-risk assets ▪ The primary asset class that contributes to this is Residential Mortgage with ~$8.8B in assets Assets ▪ Long standing reliance on wholesale deposit funding has been exacerbated by recent market conditions ▪ To fund our organic growth plan, we plan to outperform the market in deposit growth ▪ In addition to our core deposit initiatives, this transaction enables us to manage wholesale funding within our desired target operating levels Liabilities To address these challenges and support our organic plan, we have announced a transaction that increases our wholesale funding capacity Repositioning our Balance Sheet3
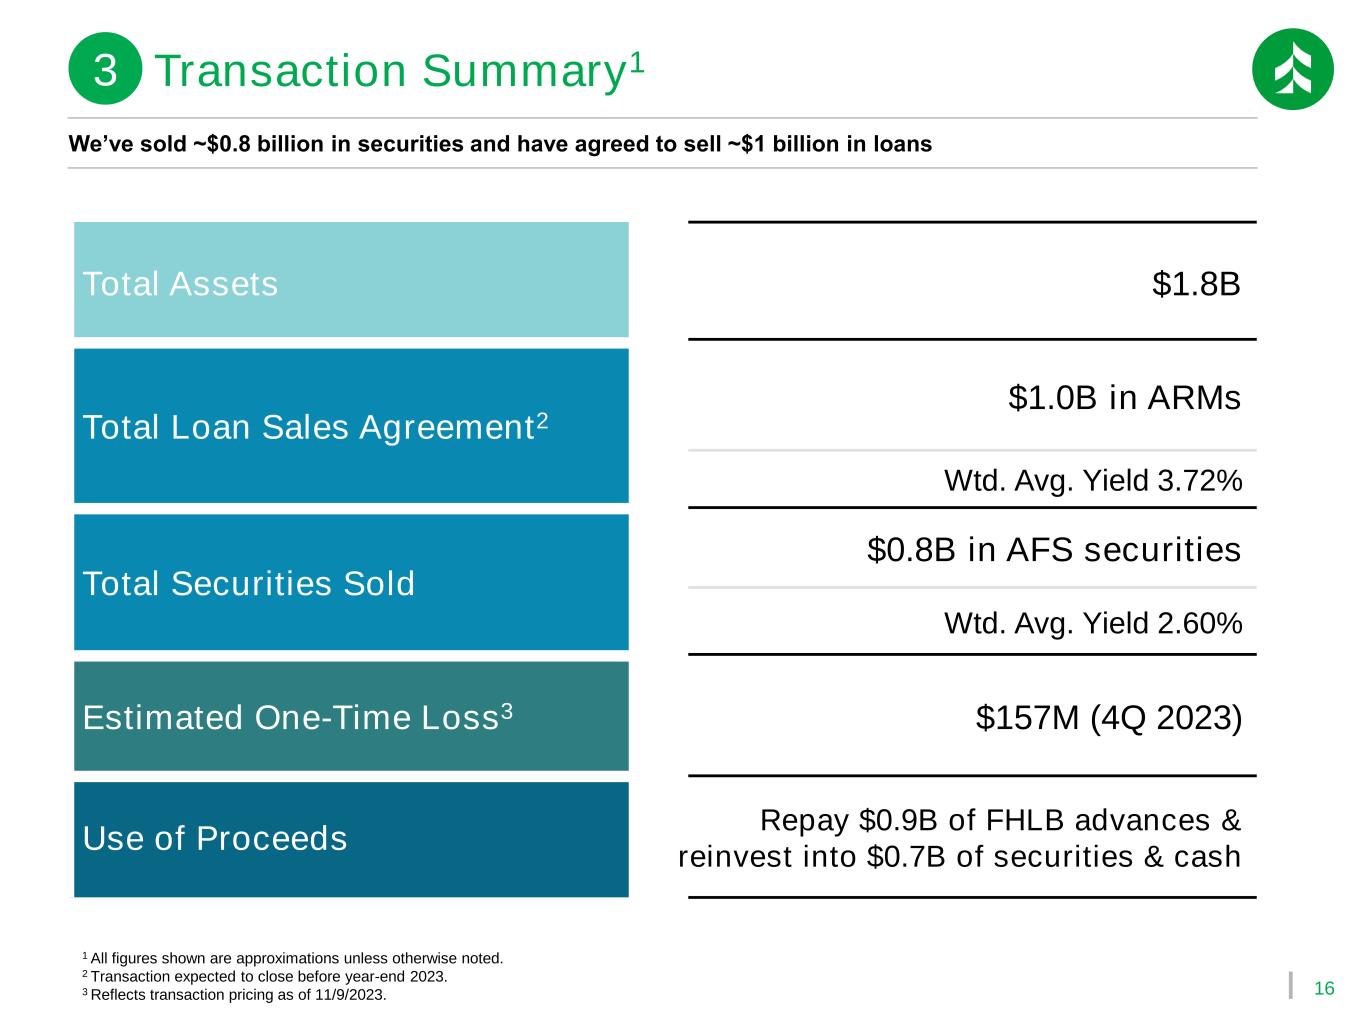
16 1 All figures shown are approximations unless otherwise noted. 2 Transaction expected to close before year-end 2023. 3 Reflects transaction pricing as of 11/9/2023. We’ve sold ~$0.8 billion in securities and have agreed to sell ~$1 billion in loans Total Assets $1.8B Total Loan Sales Agreement2 $1.0B in ARMs Wtd. Avg. Yield 3.72% Total Securities Sold $0.8B in AFS securities Wtd. Avg. Yield 2.60% Estimated One-Time Loss3 $157M (4Q 2023) Use of Proceeds Repay $0.9B of FHLB advances & reinvest into $0.7B of securities & cash Transaction Summary13
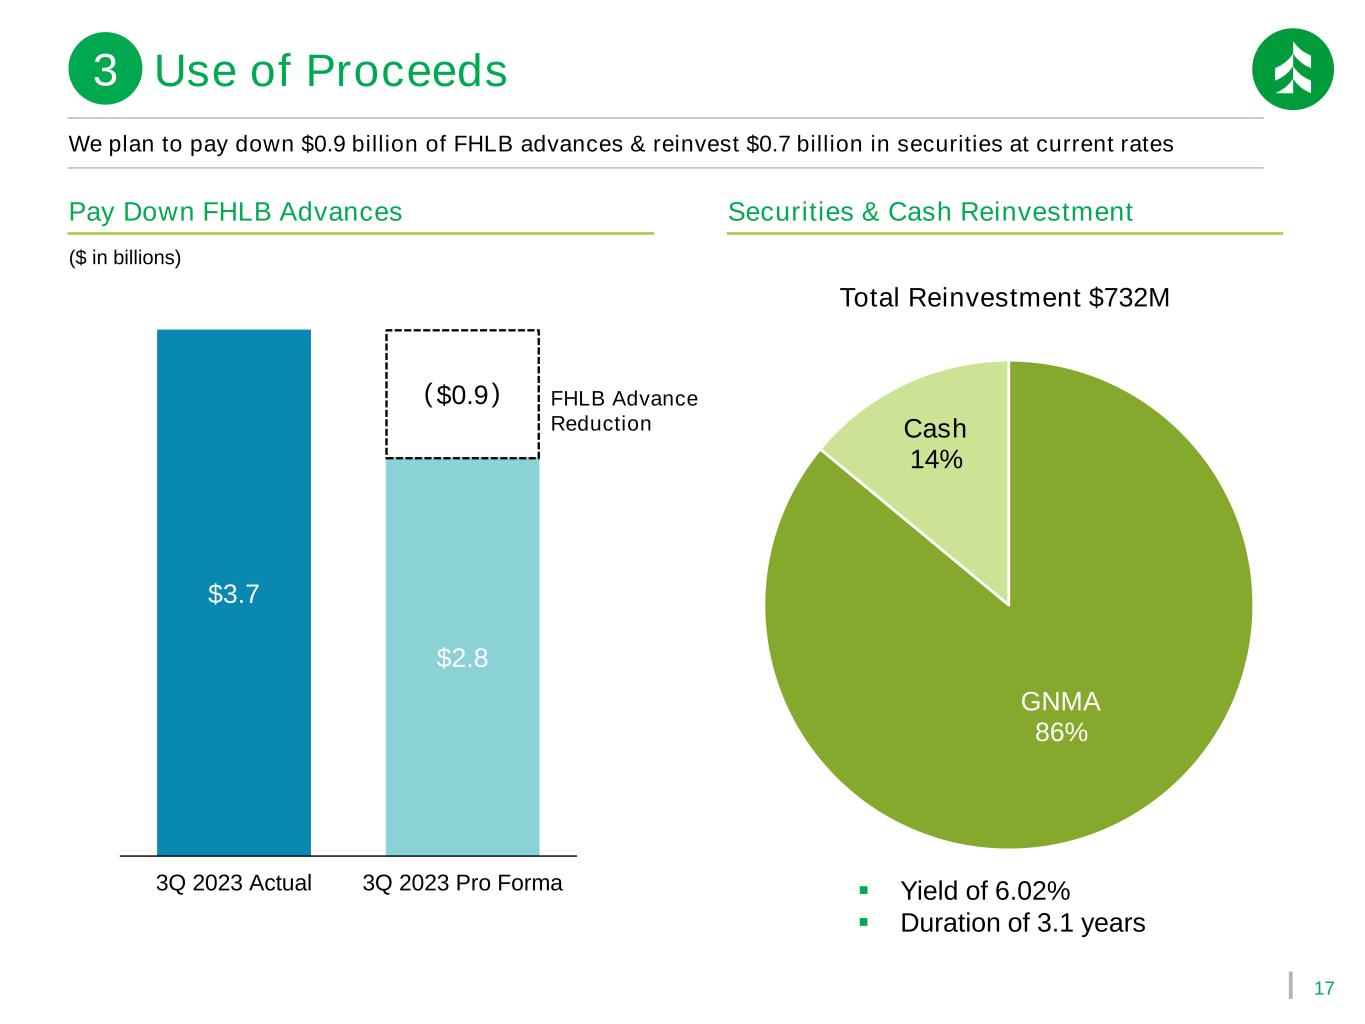
17 We plan to pay down $0.9 billion of FHLB advances & reinvest $0.7 billion in securities at current rates $3.7 $2.8 $0.9 3Q 2023 Actual 3Q 2023 Pro Forma FHLB Advance Reduction Pay Down FHLB Advances Securities & Cash Reinvestment GNMA 86% Cash 14% Total Reinvestment $732M ( ) ($ in billions) Use of Proceeds3 ▪ Yield of 6.02% ▪ Duration of 3.1 years
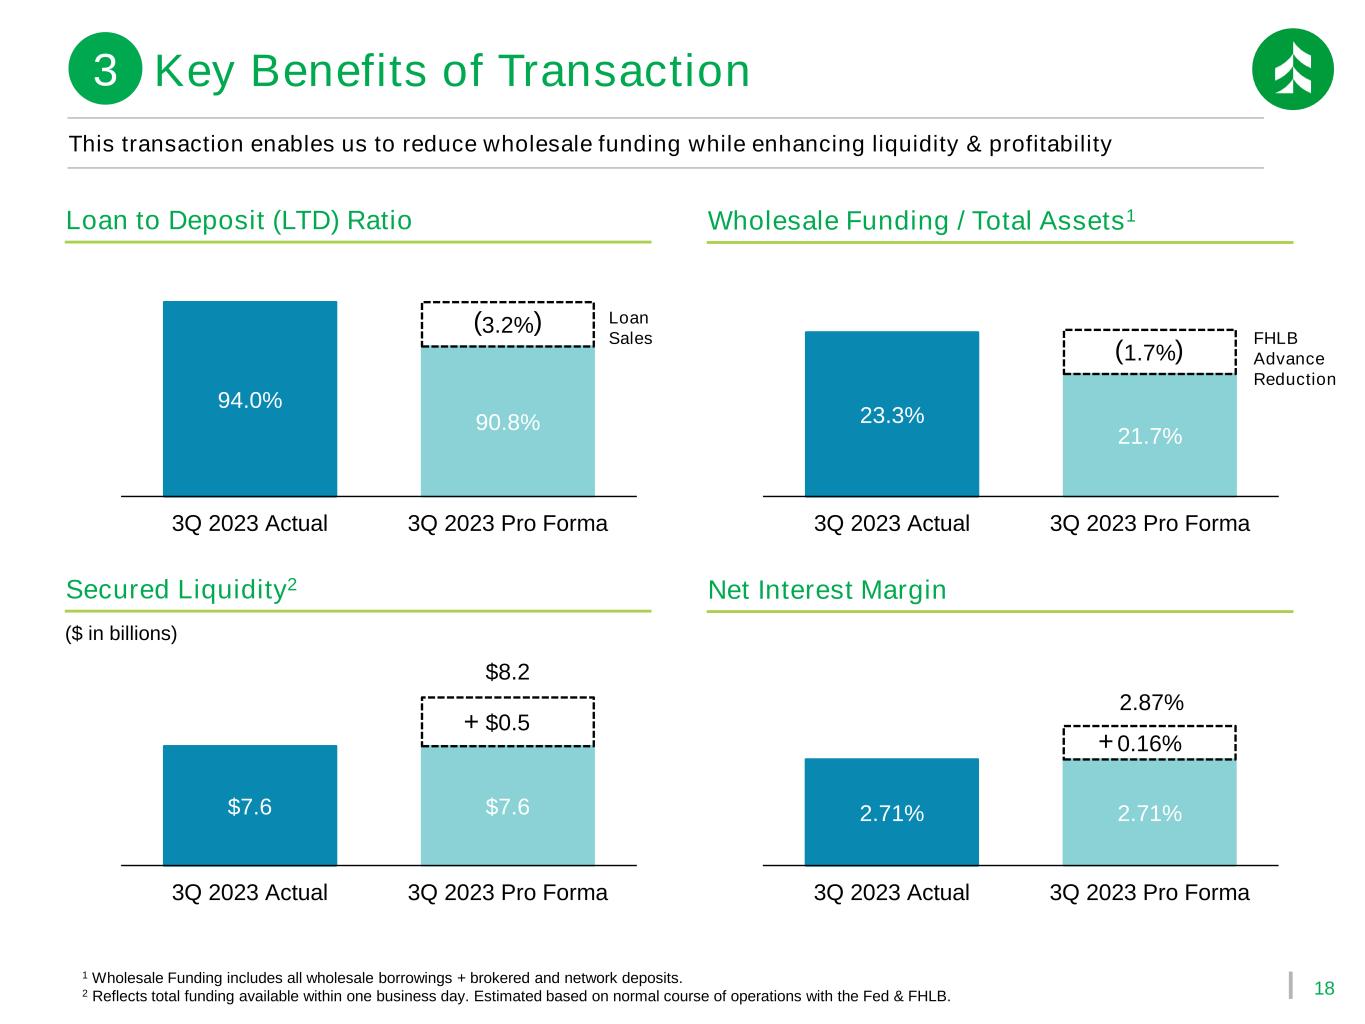
18 94.0% 90.8% 3.2% 3Q 2023 Actual 3Q 2023 Pro Forma 2.71% 2.71% 0.16% 2.87% 3Q 2023 Actual 3Q 2023 Pro Forma 1 Wholesale Funding includes all wholesale borrowings + brokered and network deposits. 2 Reflects total funding available within one business day. Estimated based on normal course of operations with the Fed & FHLB. 23.3% 21.7% 1.7% 3Q 2023 Actual 3Q 2023 Pro Forma Loan Sales Loan to Deposit (LTD) Ratio Wholesale Funding / Total Assets1 FHLB Advance Reduction $7.6 $7.6 $0.5 $8.2 3Q 2023 Actual 3Q 2023 Pro Forma Secured Liquidity2 Net Interest Margin ( ) ( ) + + ($ in billions) This transaction enables us to reduce wholesale funding while enhancing liquidity & profitability Key Benefits of Transaction3
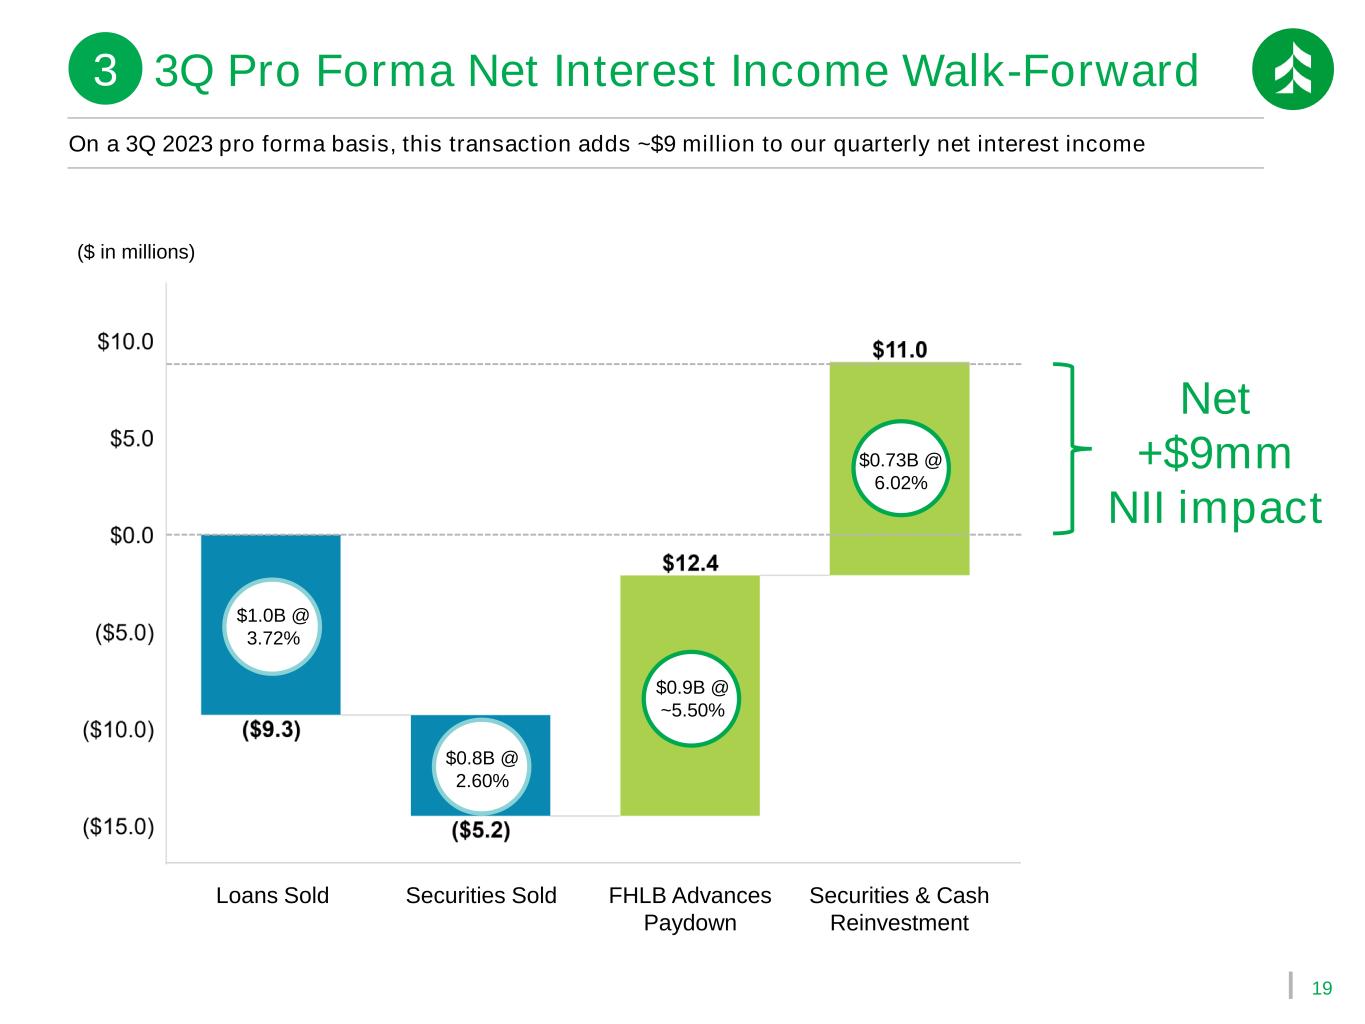
19 ($ in millions) Loans Sold Securities Sold FHLB Advances Paydown Securities & Cash Reinvestment On a 3Q 2023 pro forma basis, this transaction adds ~$9 million to our quarterly net interest income Net +$9mm NII impact $0.8B @ 2.60% $1.0B @ 3.72% $0.9B @ ~5.50% $0.73B @ 6.02% 3 3Q Pro Forma Net Interest Income Walk-Forward
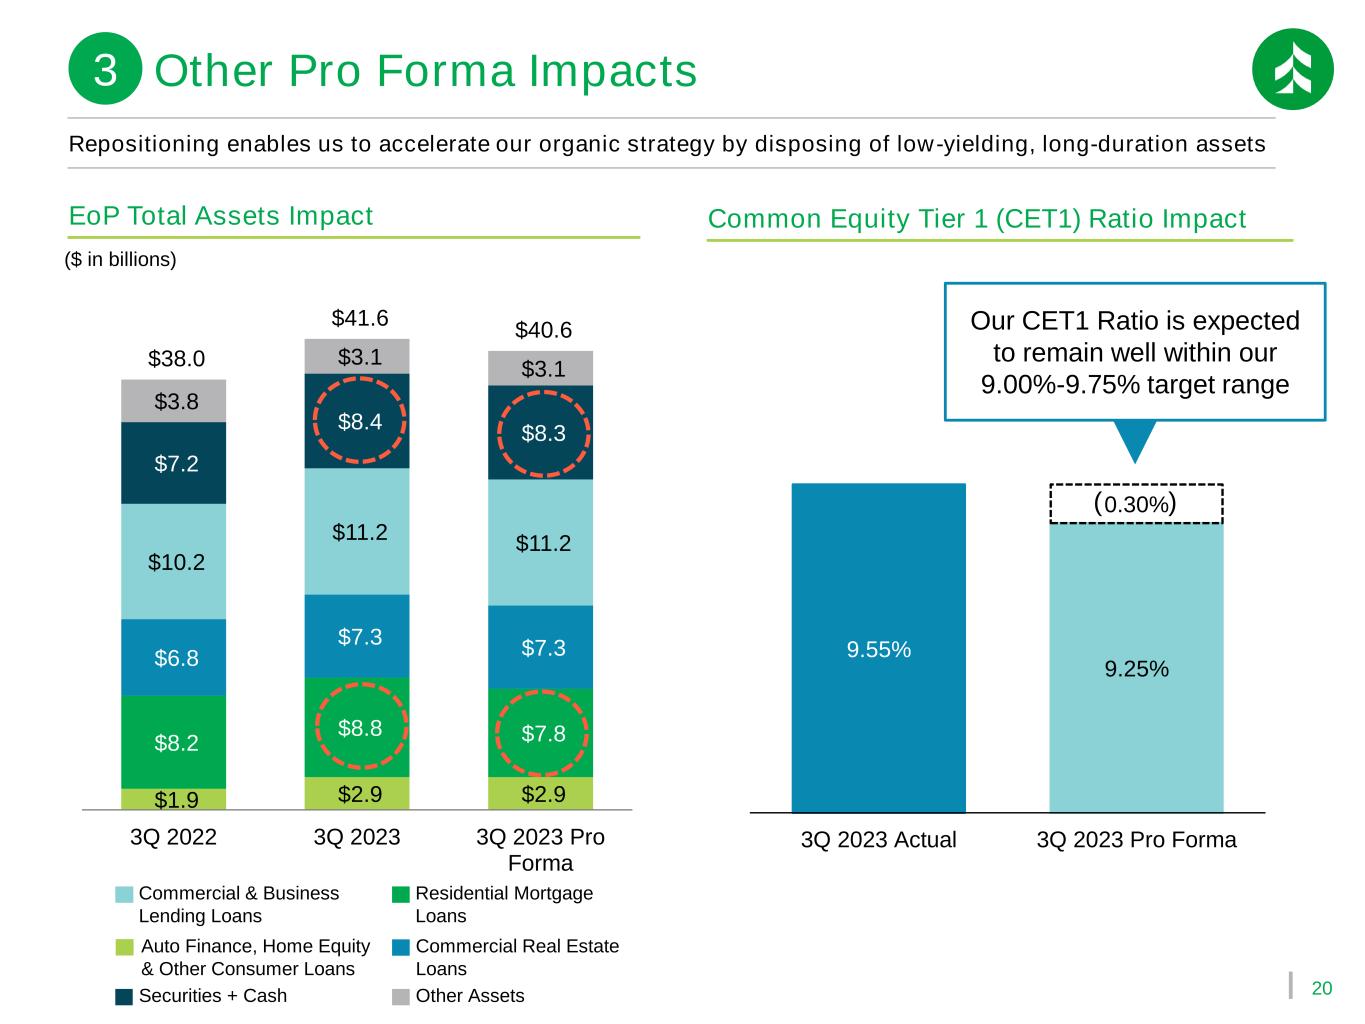
20 $1.9 $2.9 $2.9 $8.2 $8.8 $7.8 $6.8 $7.3 $7.3 $10.2 $11.2 $11.2 $7.2 $8.4 $8.3 $3.8 $3.1 $3.1 $38.0 $41.6 $40.6 3Q 2022 3Q 2023 3Q 2023 Pro Forma Repositioning enables us to accelerate our organic strategy by disposing of low-yielding, long-duration assets EoP Total Assets Impact ($ in billions) Commercial & Business Lending Loans Commercial Real Estate Loans Residential Mortgage Loans Auto Finance, Home Equity & Other Consumer Loans Other AssetsSecurities + Cash Other Pro Forma Impacts3 Common Equity Tier 1 (CET1) Ratio Impact 9.55% 9.25% 0.30% 3Q 2023 Actual 3Q 2023 Pro Forma ( ) Our CET1 Ratio is expected to remain well within our 9.00%-9.75% target range
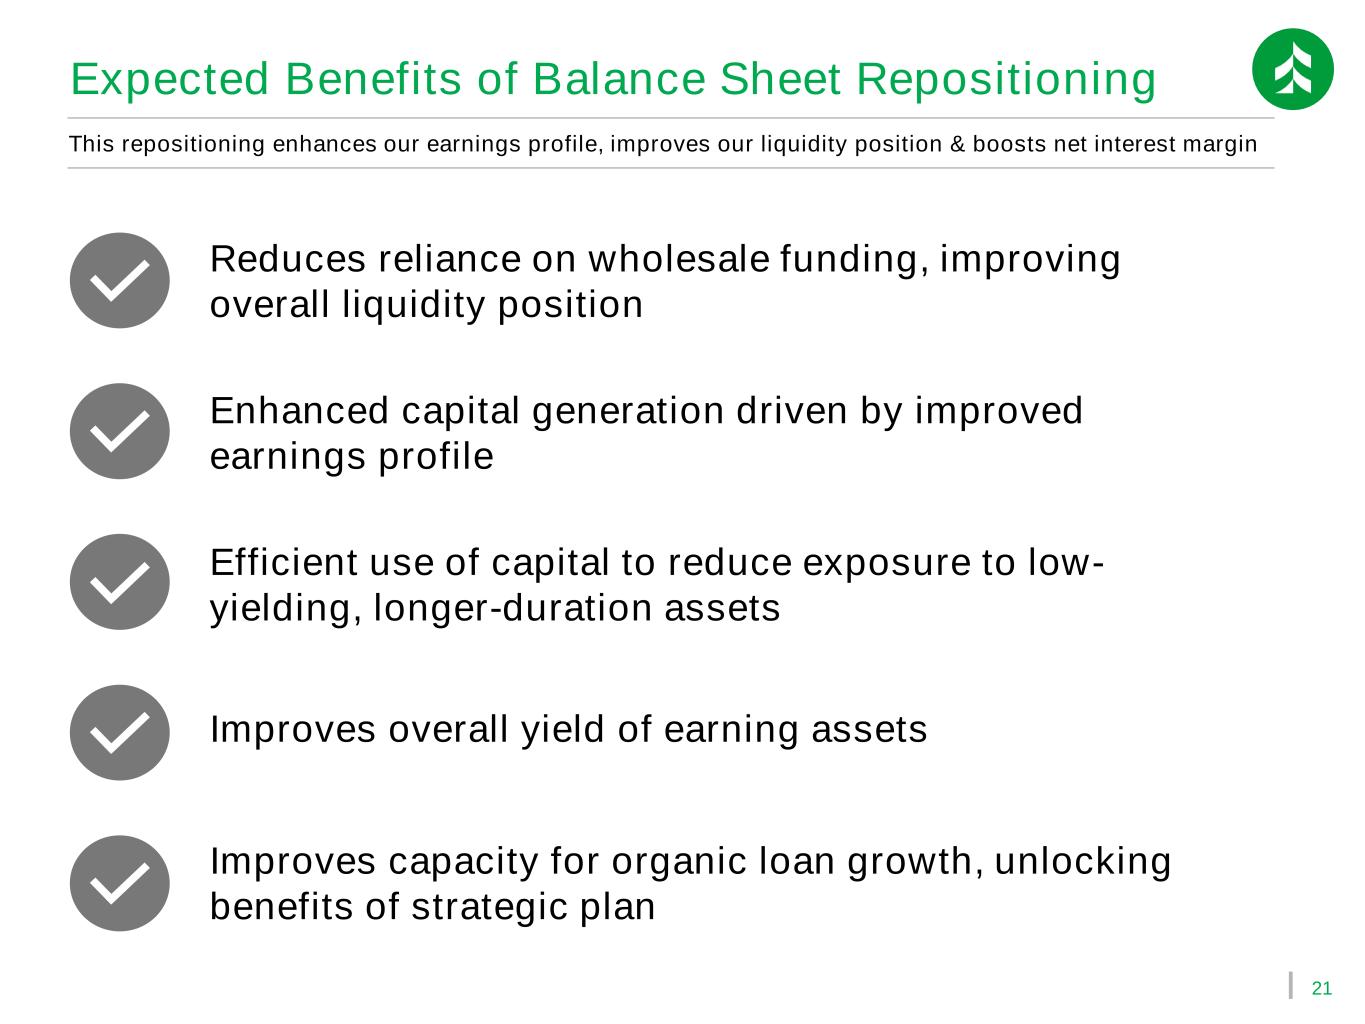
21 Expected Benefits of Balance Sheet Repositioning Improves capacity for organic loan growth, unlocking benefits of strategic plan Reduces reliance on wholesale funding, improving overall liquidity position Enhanced capital generation driven by improved earnings profile Efficient use of capital to reduce exposure to low- yielding, longer-duration assets Improves overall yield of earning assets This repositioning enhances our earnings profile, improves our liquidity position & boosts net interest margin
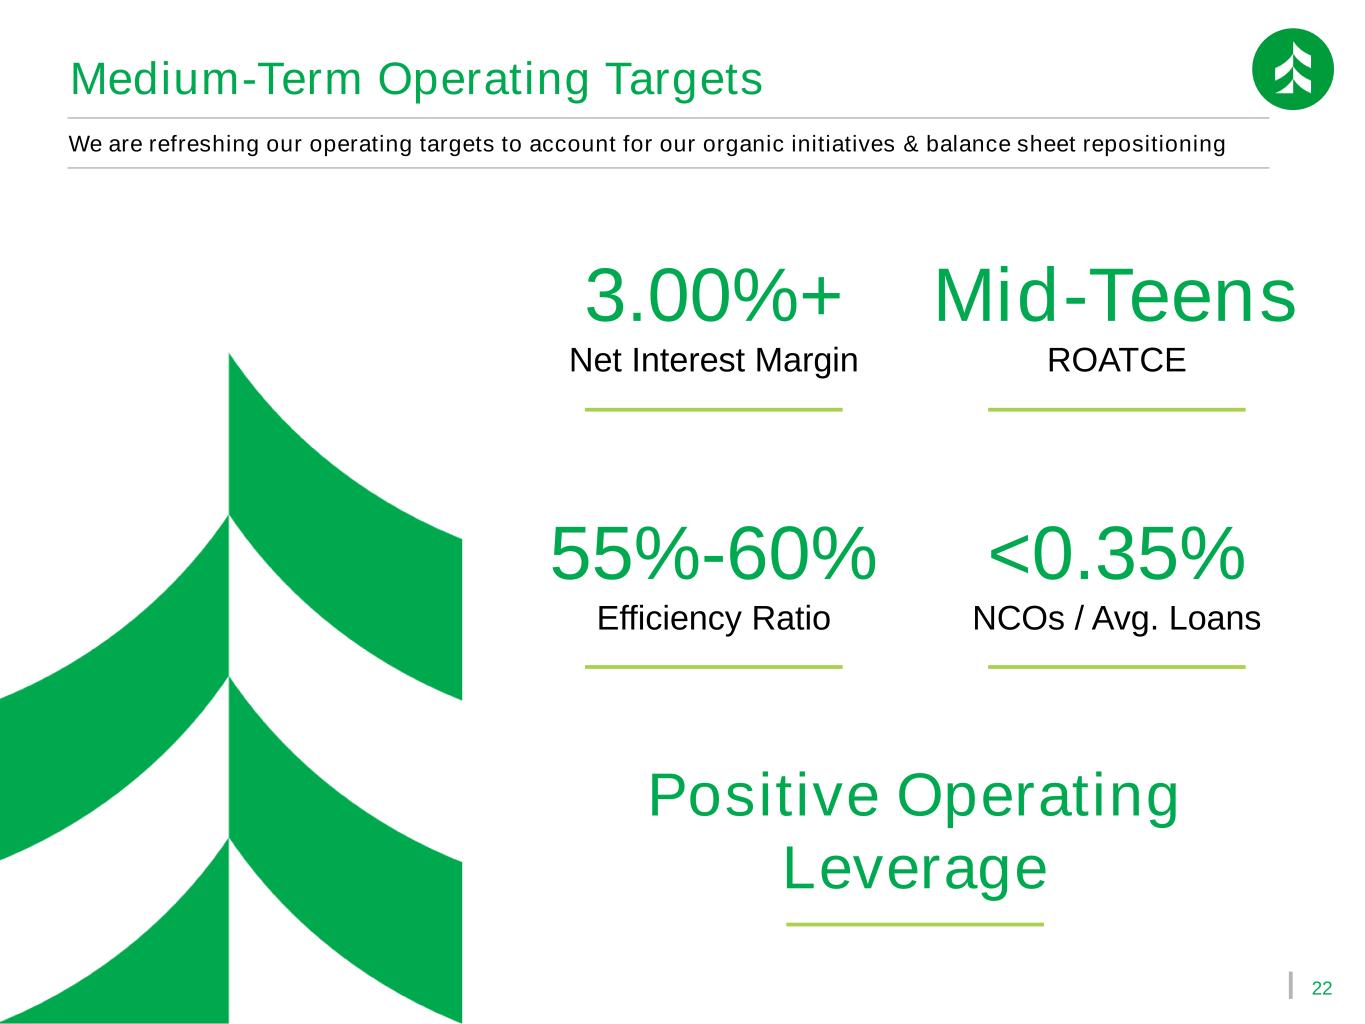
22 Medium-Term Operating Targets 3.00%+ Net Interest Margin Mid-Teens ROATCE 55%-60% Efficiency Ratio <0.35% NCOs / Avg. Loans We are refreshing our operating targets to account for our organic initiatives & balance sheet repositioning Positive Operating Leverage

Appendix
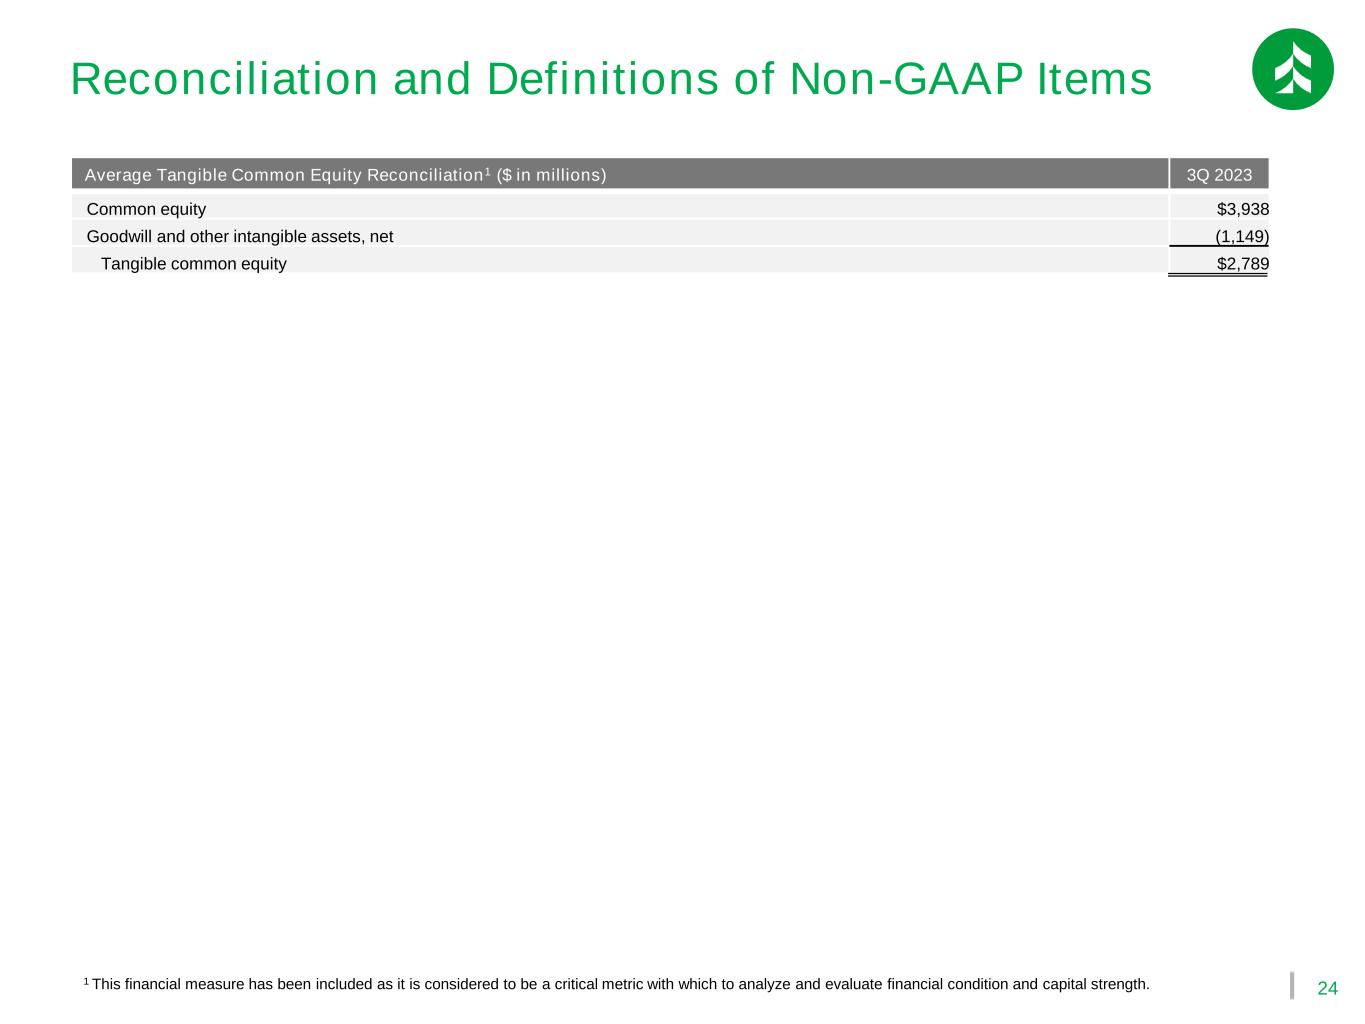
24 Reconciliation and Definitions of Non-GAAP Items 1 This financial measure has been included as it is considered to be a critical metric with which to analyze and evaluate financial condition and capital strength. Average Tangible Common Equity Reconciliation1 ($ in millions) 3Q 2023 Common equity $3,938 Goodwill and other intangible assets, net (1,149) Tangible common equity $2,789


