
September 11, 2023 Barclays Global Financial Services Conference Investor Presentation Associated Banc-Corp Exhibit 99.1
1 Forward-Looking Statements Important note regarding forward-looking statements: Statements made in this presentation which are not purely historical are forward-looking statements, as defined in the Private Securities Litigation Reform Act of 1995. This includes any statements regarding management’s plans, objectives, or goals for future operations, products or services, and forecasts of its revenues, earnings, or other measures of performance. Such forward-looking statements may be identified by the use of words such as “believe,” “expect,” “anticipate,” “plan,” “estimate,” “should,” “will,” “intend,” "target,“ “outlook,” “project,” “guidance,” or similar expressions. Forward-looking statements are based on current management expectations and, by their nature, are subject to risks and uncertainties. Actual results may differ materially from those contained in the forward-looking statements. Factors which may cause actual results to differ materially from those contained in such forward-looking statements include those identified in the Company’s most recent Form 10-K and subsequent Form 10-Qs and other SEC filings, and such factors are incorporated herein by reference. Trademarks: All trademarks, service marks, and trade names referenced in this material are official trademarks and the property of their respective owners. Presentation: Within the charts and tables presented, certain segments, columns and rows may not sum to totals shown due to rounding. Non-GAAP Measures: This presentation includes certain non-GAAP financial measures. These non-GAAP measures are provided in addition to, and not as substitutes for, measures of our financial performance determined in accordance with GAAP. Our calculation of these non-GAAP measures may not be comparable to similarly titled measures of other companies due to potential differences between companies in the method of calculation. As a result, the use of these non-GAAP measures has limitations and should not be considered superior to, in isolation from, or as a substitute for, related GAAP measures. Reconciliations of these non-GAAP financial measures to the most directly comparable GAAP financial measures can be found at the end of this presentation.
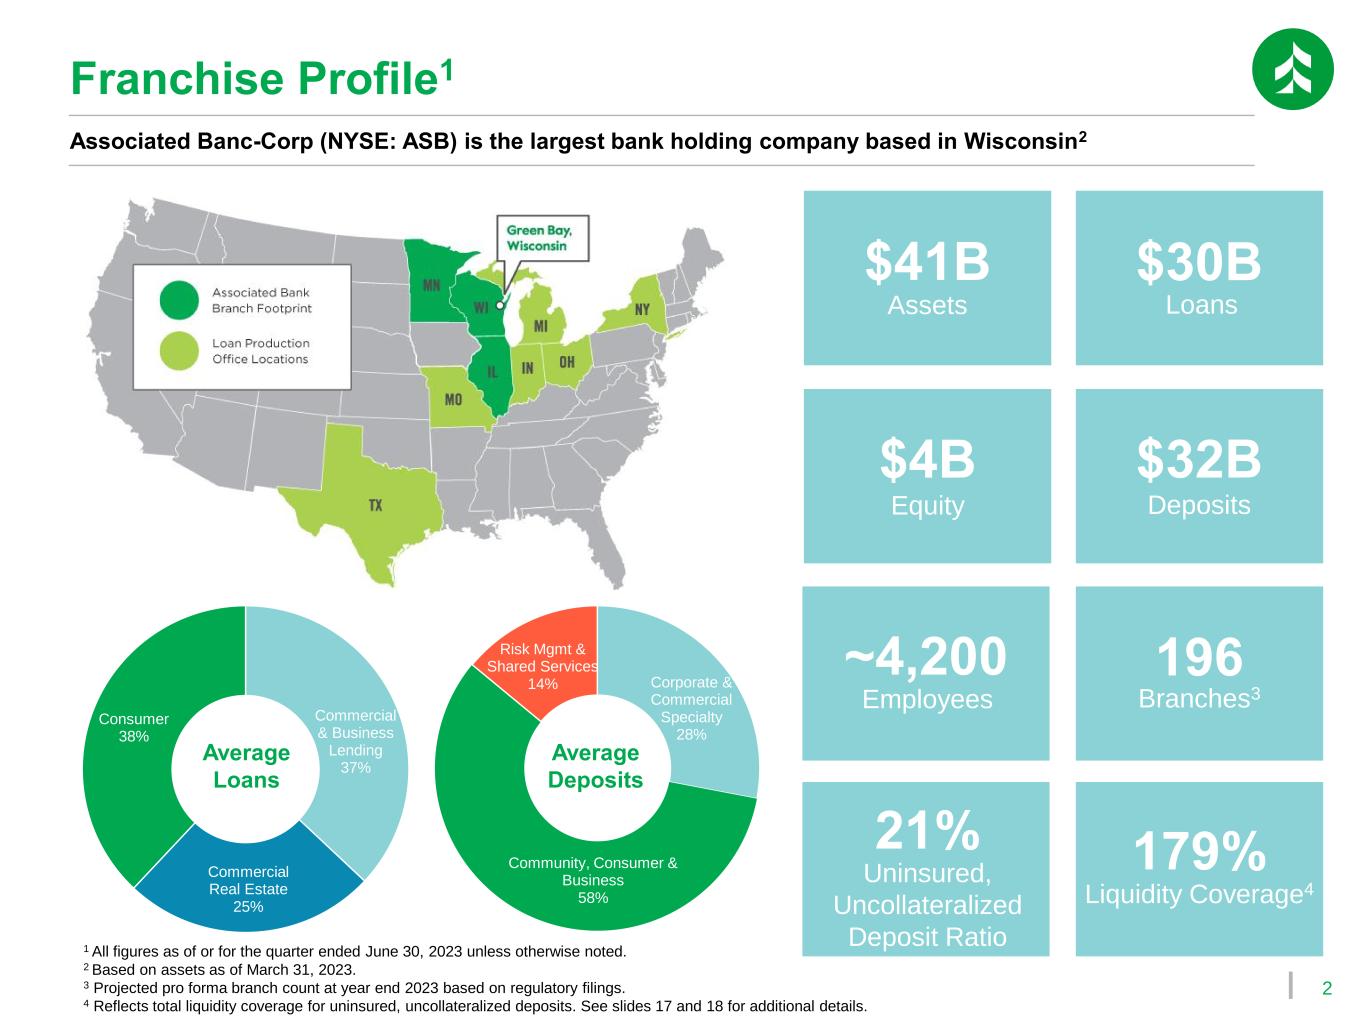
2 Commercial & Business Lending 37% Commercial Real Estate 25% Consumer 38% Corporate & Commercial Specialty 28% Community, Consumer & Business 58% Risk Mgmt & Shared Services 14% Associated Banc-Corp (NYSE: ASB) is the largest bank holding company based in Wisconsin2 Franchise Profile1 $41B Assets $30B Loans $4B Equity $32B Deposits Average Loans Average Deposits 1 All figures as of or for the quarter ended June 30, 2023 unless otherwise noted. 2 Based on assets as of March 31, 2023. 3 Projected pro forma branch count at year end 2023 based on regulatory filings. 4 Reflects total liquidity coverage for uninsured, uncollateralized deposits. See slides 17 and 18 for additional details. 21% Uninsured, Uncollateralized Deposit Ratio 179% Liquidity Coverage4 ~4,200 Employees 196 Branches3
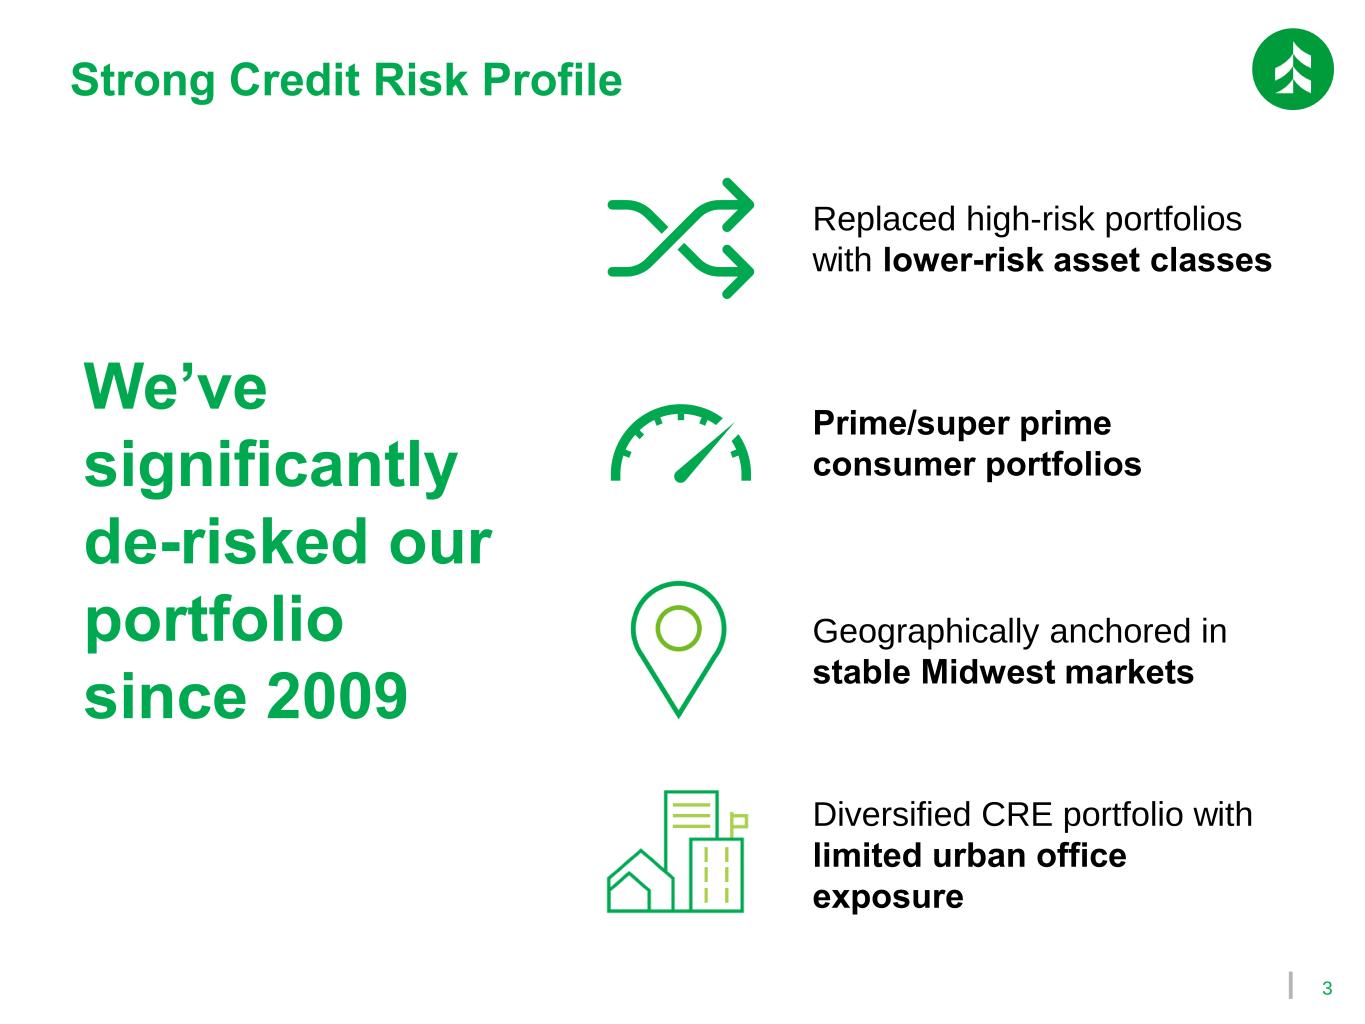
3 Strong Credit Risk Profile We’ve significantly de-risked our portfolio since 2009 Geographically anchored in stable Midwest markets Diversified CRE portfolio with limited urban office exposure Replaced high-risk portfolios with lower-risk asset classes Prime/super prime consumer portfolios
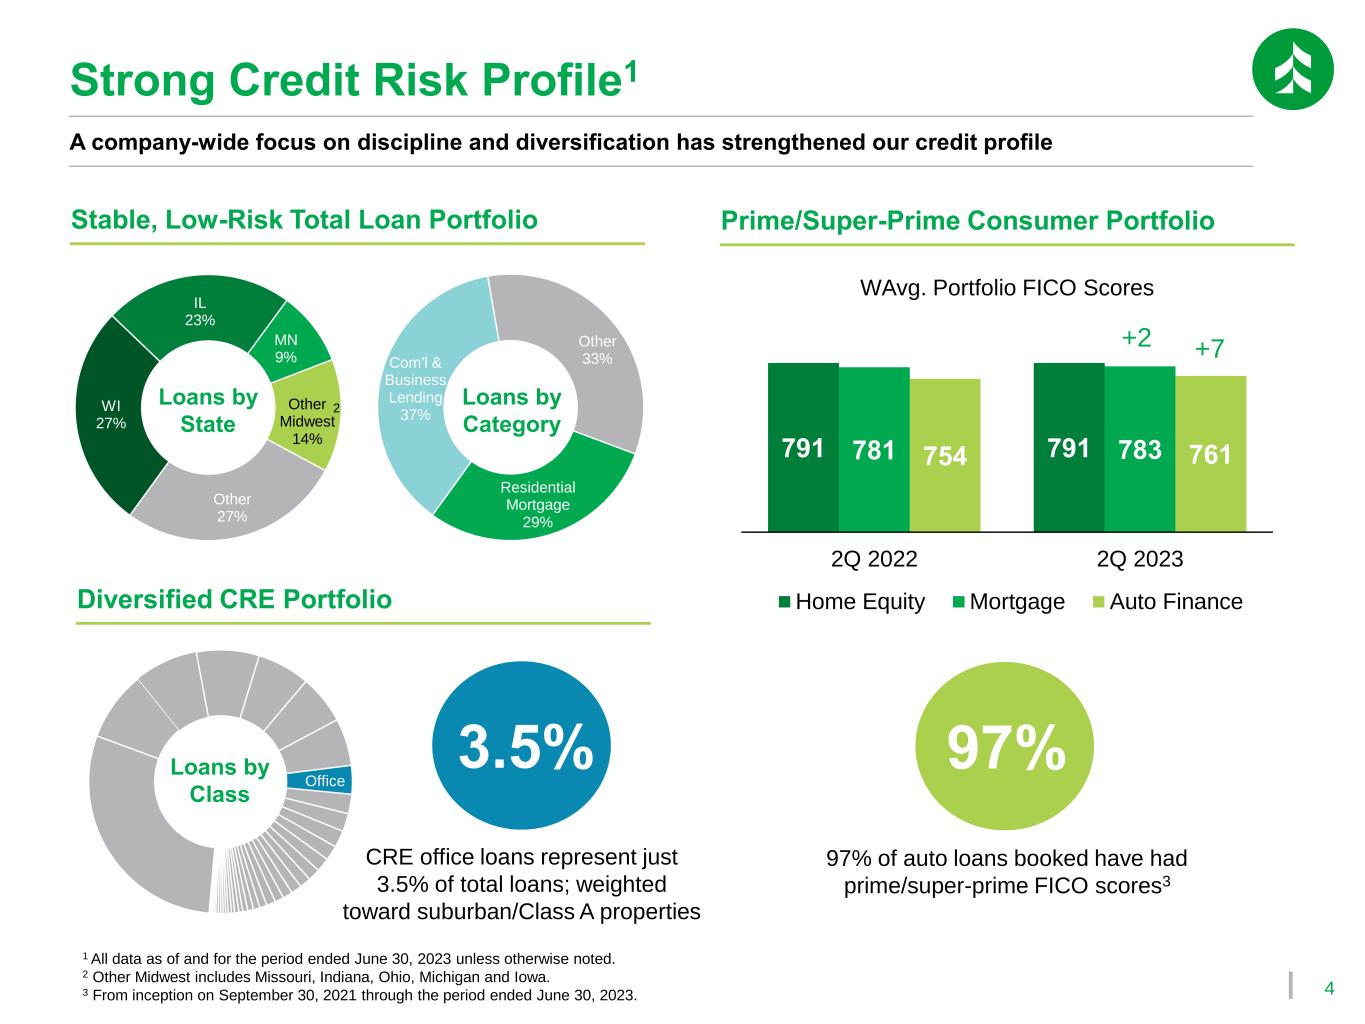
4 Com'l & Business Lending 37% Other 33% Residential Mortgage 29% 1 All data as of and for the period ended June 30, 2023 unless otherwise noted. 2 Other Midwest includes Missouri, Indiana, Ohio, Michigan and Iowa. 3 From inception on September 30, 2021 through the period ended June 30, 2023. WI 27% IL 23% MN 9% Other Midwest 14% Other 27% Loans by State 2 A company-wide focus on discipline and diversification has strengthened our credit profile Prime/Super-Prime Consumer PortfolioStable, Low-Risk Total Loan Portfolio Diversified CRE Portfolio Strong Credit Risk Profile1 97% of auto loans booked have had prime/super-prime FICO scores3 Office Loans by Class Loans by Category CRE office loans represent just 3.5% of total loans; weighted toward suburban/Class A properties 791 791781 783754 761 2Q 2022 2Q 2023 Home Equity Mortgage Auto Finance +7+2 WAvg. Portfolio FICO Scores 3.5% 97%
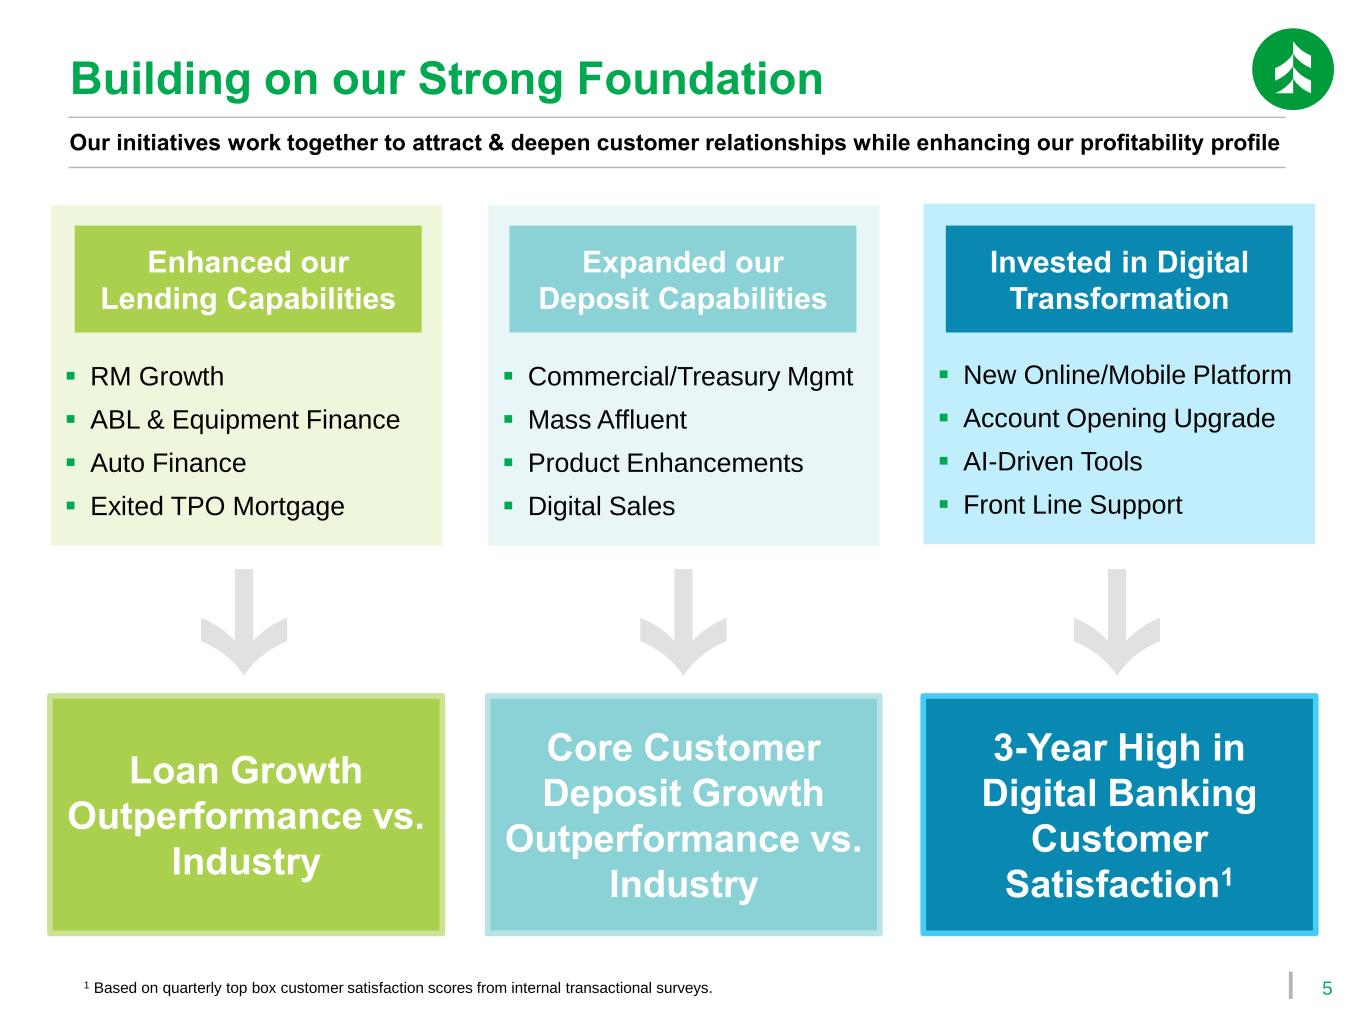
5 Building on our Strong Foundation Our initiatives work together to attract & deepen customer relationships while enhancing our profitability profile ▪ RM Growth ▪ ABL & Equipment Finance ▪ Auto Finance ▪ Exited TPO Mortgage ▪ Commercial/Treasury Mgmt ▪ Mass Affluent ▪ Product Enhancements ▪ Digital Sales ▪ New Online/Mobile Platform ▪ Account Opening Upgrade ▪ AI-Driven Tools ▪ Front Line Support Enhanced our Lending Capabilities Expanded our Deposit Capabilities Invested in Digital Transformation Loan Growth Outperformance vs. Industry Core Customer Deposit Growth Outperformance vs. Industry 3-Year High in Digital Banking Customer Satisfaction1 1 Based on quarterly top box customer satisfaction scores from internal transactional surveys.
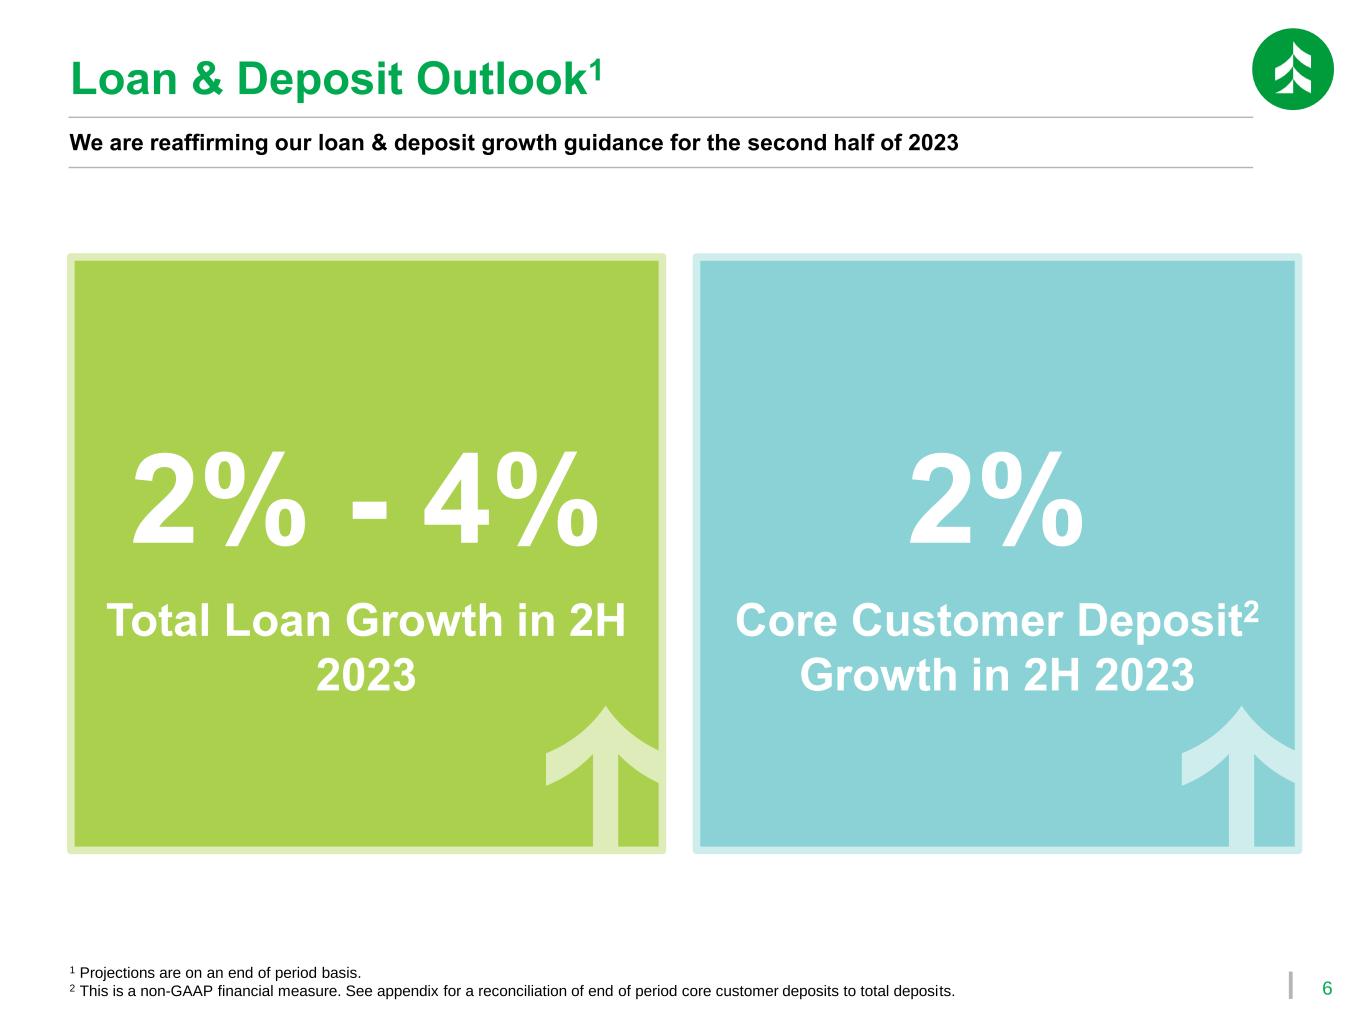
6 Loan & Deposit Outlook1 We are reaffirming our loan & deposit growth guidance for the second half of 2023 Total Loan Growth in 2H 2023 Core Customer Deposit2 Growth in 2H 2023 2% - 4% 2% 1 Projections are on an end of period basis. 2 This is a non-GAAP financial measure. See appendix for a reconciliation of end of period core customer deposits to total deposits.
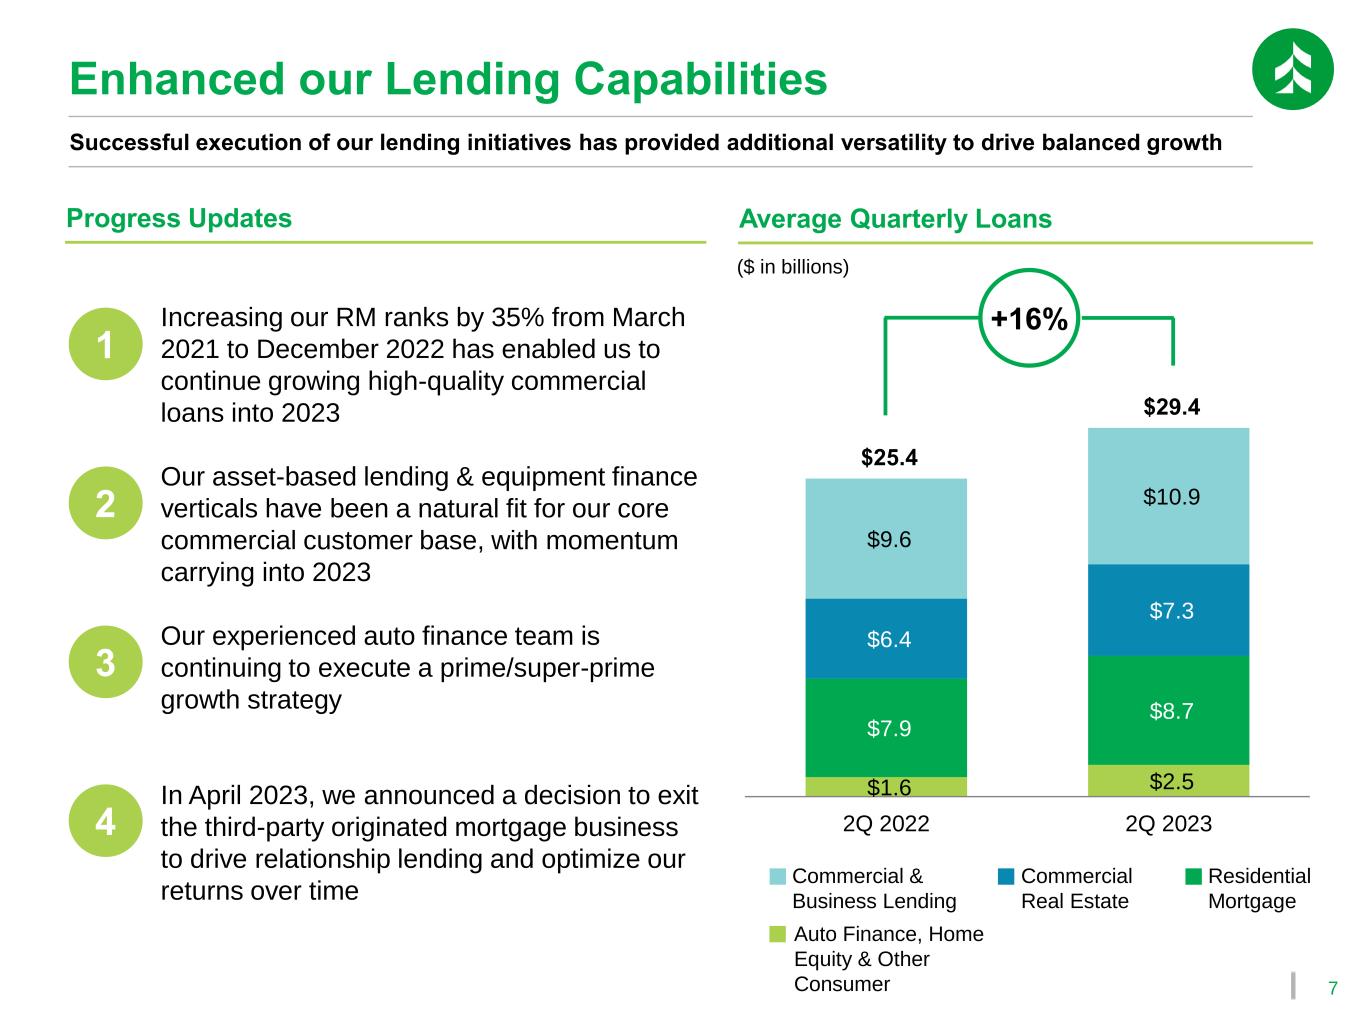
7 Successful execution of our lending initiatives has provided additional versatility to drive balanced growth Enhanced our Lending Capabilities Progress Updates 1 Increasing our RM ranks by 35% from March 2021 to December 2022 has enabled us to continue growing high-quality commercial loans into 2023 Our asset-based lending & equipment finance verticals have been a natural fit for our core commercial customer base, with momentum carrying into 2023 Our experienced auto finance team is continuing to execute a prime/super-prime growth strategy In April 2023, we announced a decision to exit the third-party originated mortgage business to drive relationship lending and optimize our returns over time 2 3 4 ($ in billions) Commercial & Business Lending Commercial Real Estate Residential Mortgage Auto Finance, Home Equity & Other Consumer Average Quarterly Loans $1.6 $2.5 $7.9 $8.7 $6.4 $7.3 $9.6 $10.9 $25.4 $29.4 2Q 2022 2Q 2023 +16%
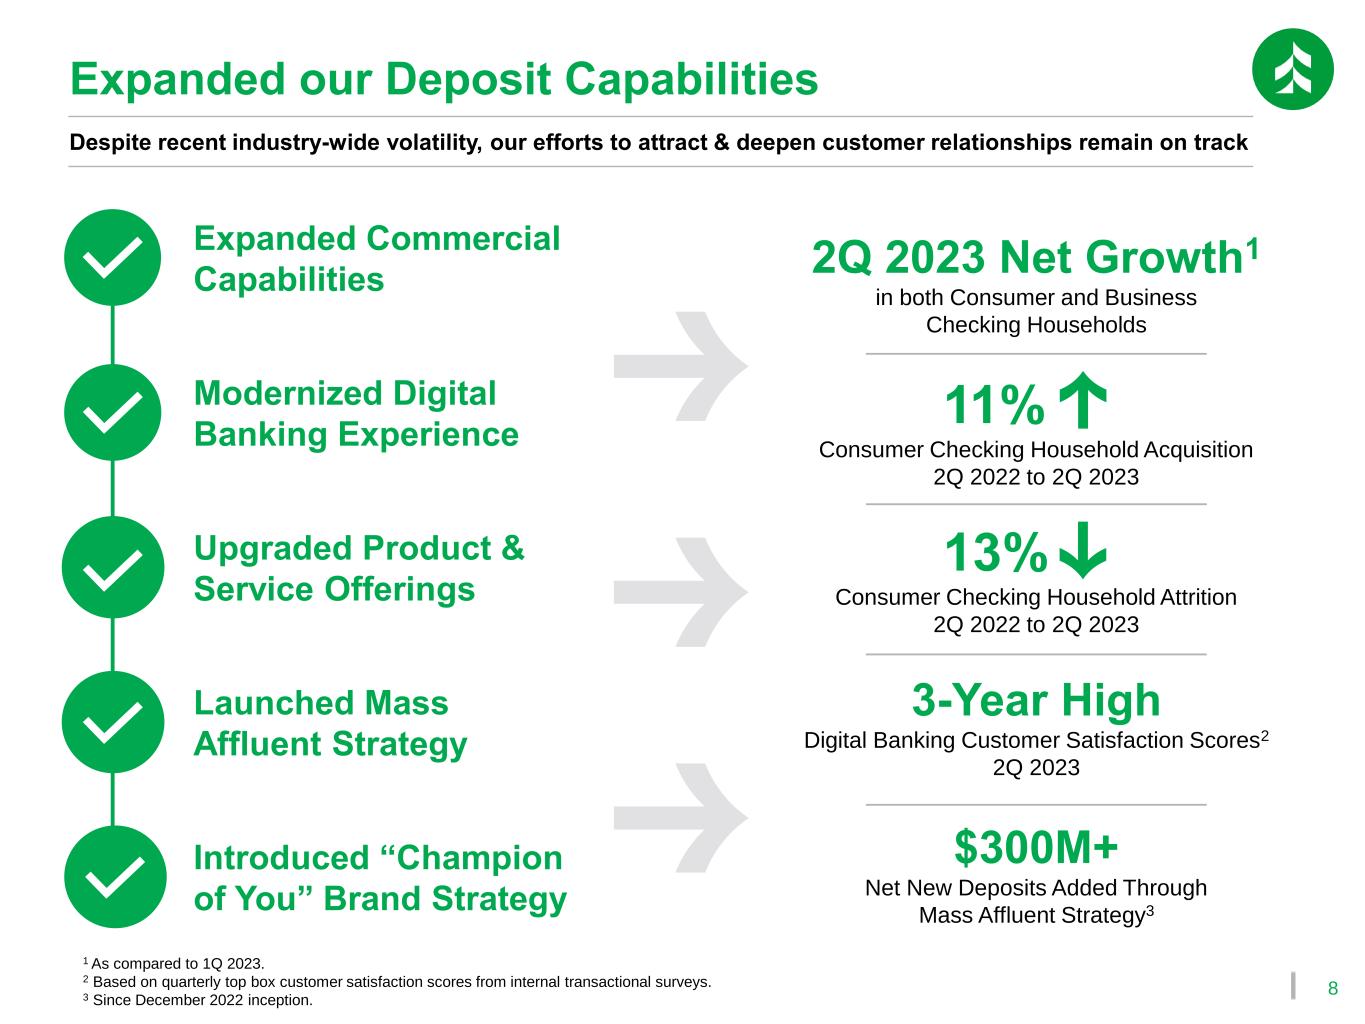
8 Despite recent industry-wide volatility, our efforts to attract & deepen customer relationships remain on track Expanded our Deposit Capabilities Modernized Digital Banking Experience Upgraded Product & Service Offerings 2Q 2023 Net Growth1 in both Consumer and Business Checking Households 11% Consumer Checking Household Acquisition 2Q 2022 to 2Q 2023 13% Consumer Checking Household Attrition 2Q 2022 to 2Q 2023 3-Year High Digital Banking Customer Satisfaction Scores2 2Q 2023 $300M+ Net New Deposits Added Through Mass Affluent Strategy3 Launched Mass Affluent Strategy Introduced “Champion of You” Brand Strategy Expanded Commercial Capabilities 1 As compared to 1Q 2023. 2 Based on quarterly top box customer satisfaction scores from internal transactional surveys. 3 Since December 2022 inception.
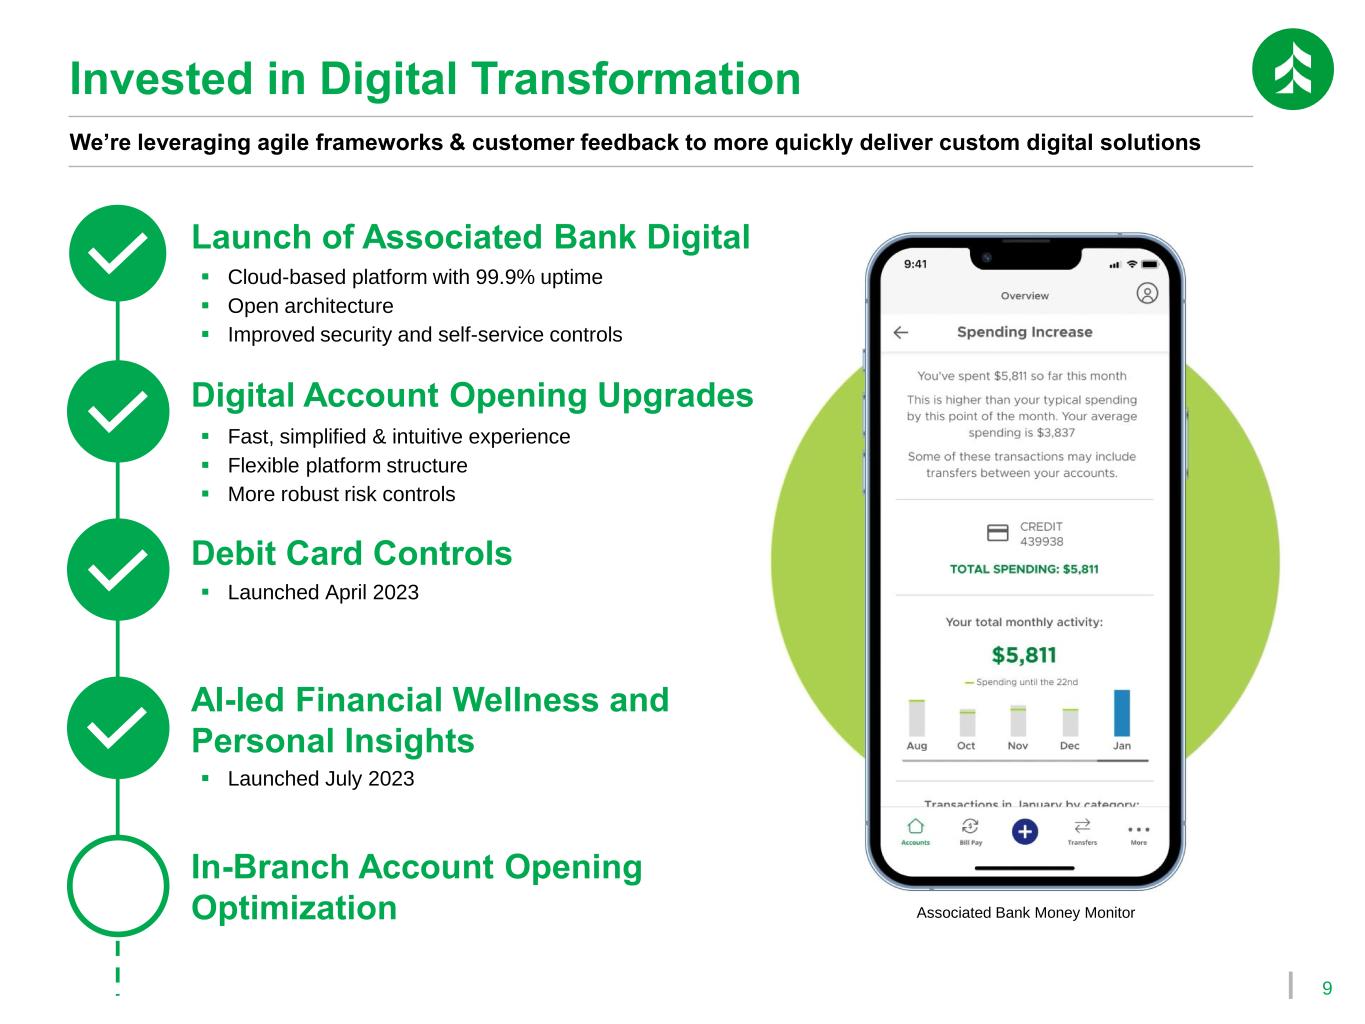
9 We’re leveraging agile frameworks & customer feedback to more quickly deliver custom digital solutions Invested in Digital Transformation Launch of Associated Bank Digital Debit Card Controls AI-led Financial Wellness and Personal Insights Digital Account Opening Upgrades ▪ Cloud-based platform with 99.9% uptime ▪ Open architecture ▪ Improved security and self-service controls ▪ Fast, simplified & intuitive experience ▪ Flexible platform structure ▪ More robust risk controls In-Branch Account Opening Optimization ▪ Launched April 2023 ▪ Launched July 2023 Associated Bank Money Monitor
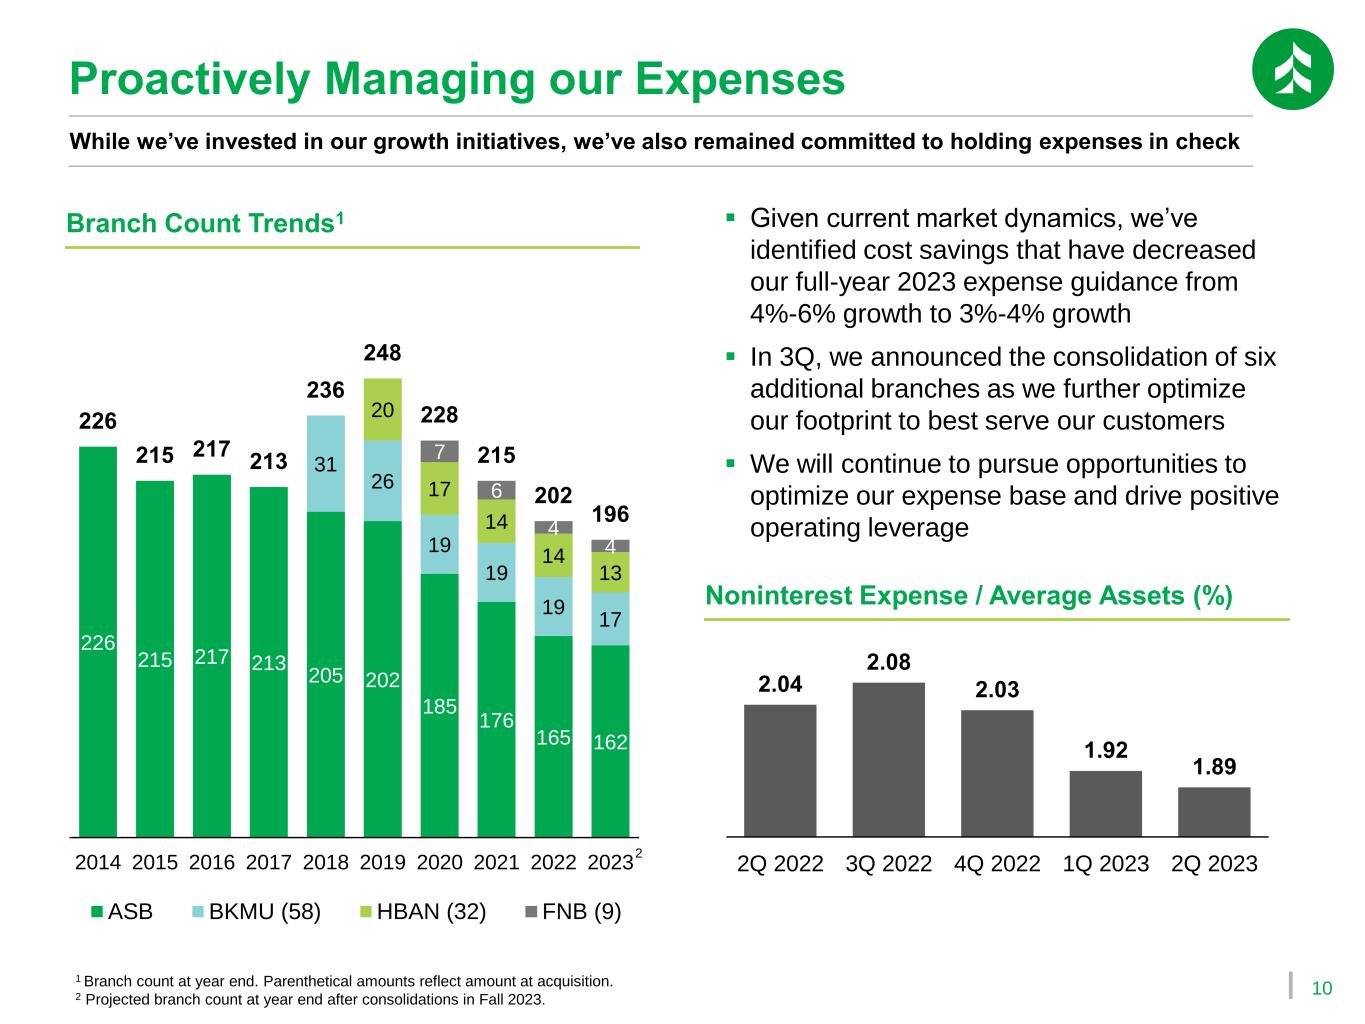
10 Proactively Managing our Expenses While we’ve invested in our growth initiatives, we’ve also remained committed to holding expenses in check ▪ Given current market dynamics, we’ve identified cost savings that have decreased our full-year 2023 expense guidance from 4%-6% growth to 3%-4% growth ▪ In 3Q, we announced the consolidation of six additional branches as we further optimize our footprint to best serve our customers ▪ We will continue to pursue opportunities to optimize our expense base and drive positive operating leverage Noninterest Expense / Average Assets (%) 2.04 2.08 2.03 1.92 1.89 2Q 2022 3Q 2022 4Q 2022 1Q 2023 2Q 2023 226 215 217 213 205 202 185 176 165 162 31 26 19 19 19 17 20 17 14 14 13 7 6 4 4 226 215 217 213 236 248 228 215 202 196 2014 2015 2016 2017 2018 2019 2020 2021 2022 2023 ASB BKMU (58) HBAN (32) FNB (9) 1 Branch count at year end. Parenthetical amounts reflect amount at acquisition. 2 Projected branch count at year end after consolidations in Fall 2023. Branch Count Trends1 2
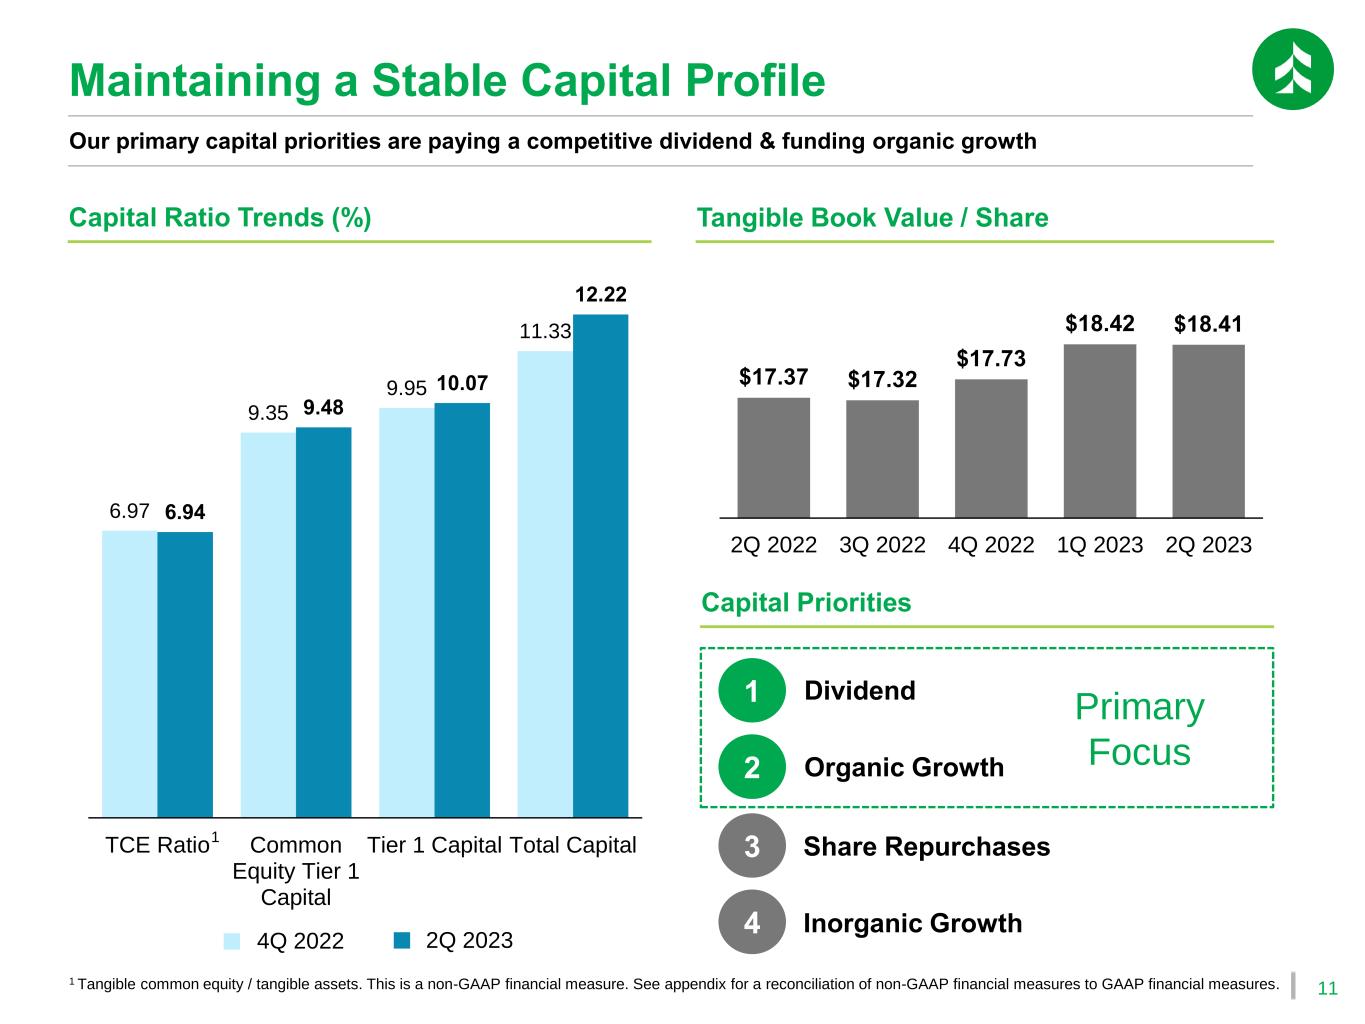
11 Capital Ratio Trends (%) 6.97 9.35 9.95 11.33 6.94 9.48 10.07 12.22 TCE Ratio Common Equity Tier 1 Capital Tier 1 Capital Total Capital 1 Tangible common equity / tangible assets. This is a non-GAAP financial measure. See appendix for a reconciliation of non-GAAP financial measures to GAAP financial measures. Our primary capital priorities are paying a competitive dividend & funding organic growth 1 Tangible Book Value / Share $17.37 $17.32 $17.73 $18.42 $18.41 2Q 2022 3Q 2022 4Q 2022 1Q 2023 2Q 2023 Capital Priorities Maintaining a Stable Capital Profile 4Q 2022 2Q 2023 1 2 3 4 Dividend Organic Growth Share Repurchases Inorganic Growth Primary Focus
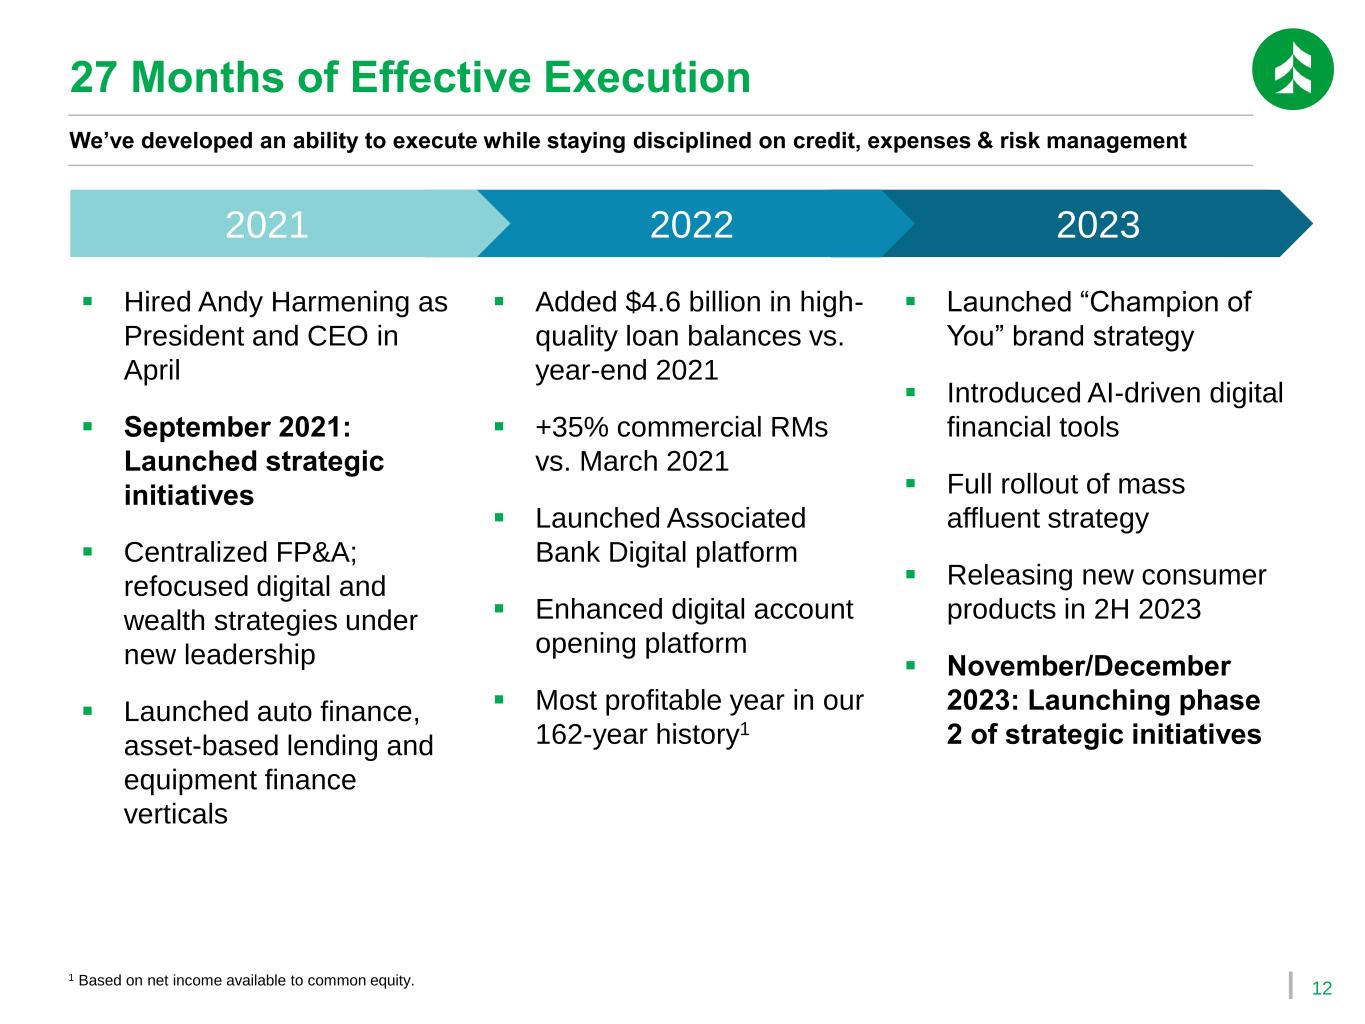
12 27 Months of Effective Execution We’ve developed an ability to execute while staying disciplined on credit, expenses & risk management 2021 2022 2023 ▪ Hired Andy Harmening as President and CEO in April ▪ September 2021: Launched strategic initiatives ▪ Centralized FP&A; refocused digital and wealth strategies under new leadership ▪ Launched auto finance, asset-based lending and equipment finance verticals ▪ Added $4.6 billion in high- quality loan balances vs. year-end 2021 ▪ +35% commercial RMs vs. March 2021 ▪ Launched Associated Bank Digital platform ▪ Enhanced digital account opening platform ▪ Most profitable year in our 162-year history1 ▪ Launched “Champion of You” brand strategy ▪ Introduced AI-driven digital financial tools ▪ Full rollout of mass affluent strategy ▪ Releasing new consumer products in 2H 2023 ▪ November/December 2023: Launching phase 2 of strategic initiatives 1 Based on net income available to common equity.
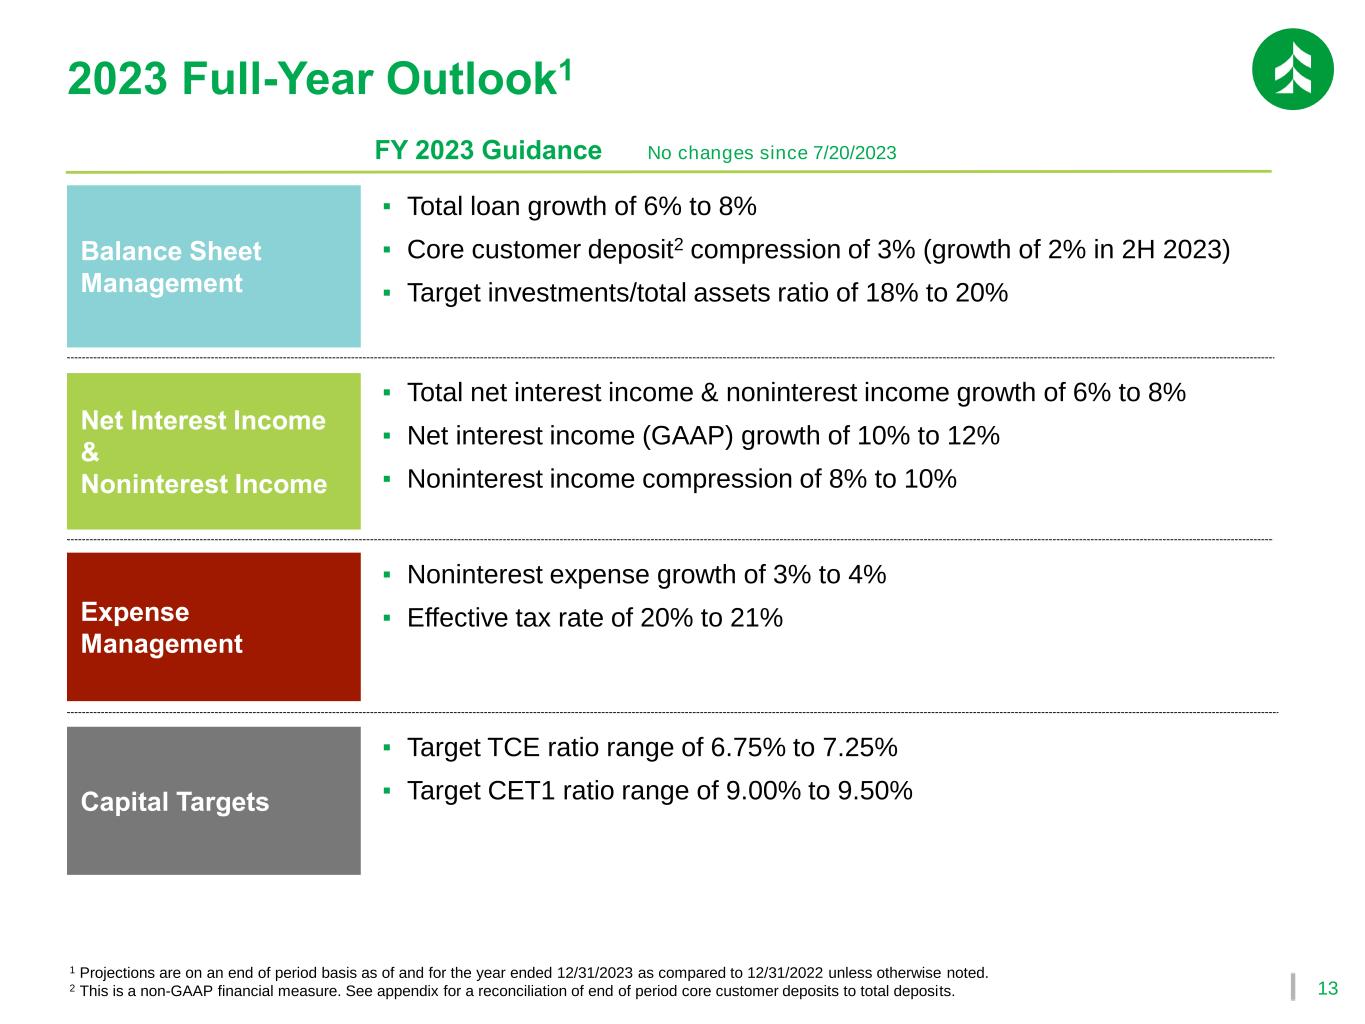
13 Balance Sheet Management Net Interest Income & Noninterest Income ▪ Total net interest income & noninterest income growth of 6% to 8% ▪ Net interest income (GAAP) growth of 10% to 12% ▪ Noninterest income compression of 8% to 10% Expense Management ▪ Noninterest expense growth of 3% to 4% ▪ Effective tax rate of 20% to 21% Capital Targets ▪ Target TCE ratio range of 6.75% to 7.25% ▪ Target CET1 ratio range of 9.00% to 9.50% ▪ Total loan growth of 6% to 8% ▪ Core customer deposit2 compression of 3% (growth of 2% in 2H 2023) ▪ Target investments/total assets ratio of 18% to 20% 2023 Full-Year Outlook1 FY 2023 Guidance No changes since 7/20/2023 1 Projections are on an end of period basis as of and for the year ended 12/31/2023 as compared to 12/31/2022 unless otherwise noted. 2 This is a non-GAAP financial measure. See appendix for a reconciliation of end of period core customer deposits to total deposits.

Appendix
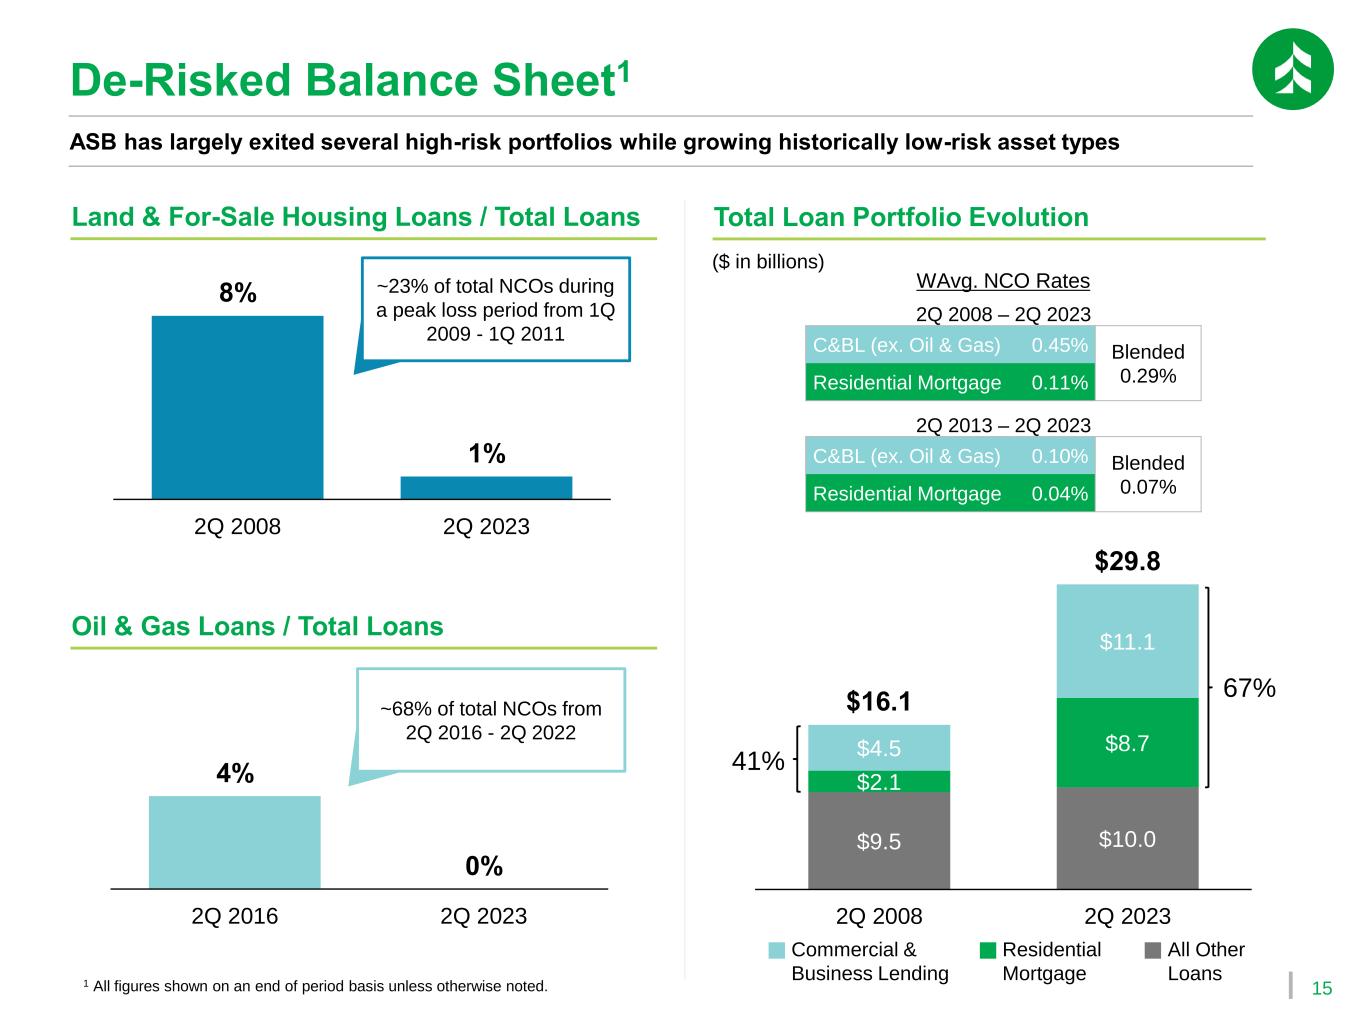
15 4% 0% 2Q 2016 2Q 2023 8% 1% 2Q 2008 2Q 2023 De-Risked Balance Sheet1 ASB has largely exited several high-risk portfolios while growing historically low-risk asset types $9.5 $10.0 $2.1 $8.7$4.5 $11.1 $16.1 $29.8 2Q 2008 2Q 2023 Land & For-Sale Housing Loans / Total Loans Oil & Gas Loans / Total Loans Total Loan Portfolio Evolution ($ in billions) Commercial & Business Lending Residential Mortgage All Other Loans 1 All figures shown on an end of period basis unless otherwise noted. 41% 67% 2Q 2013 – 2Q 2023 C&BL (ex. Oil & Gas) 0.10% Blended 0.07%Residential Mortgage 0.04% ~23% of total NCOs during a peak loss period from 1Q 2009 - 1Q 2011 ~68% of total NCOs from 2Q 2016 - 2Q 2022 2Q 2008 – 2Q 2023 C&BL (ex. Oil & Gas) 0.45% Blended 0.29%Residential Mortgage 0.11% WAvg. NCO Rates
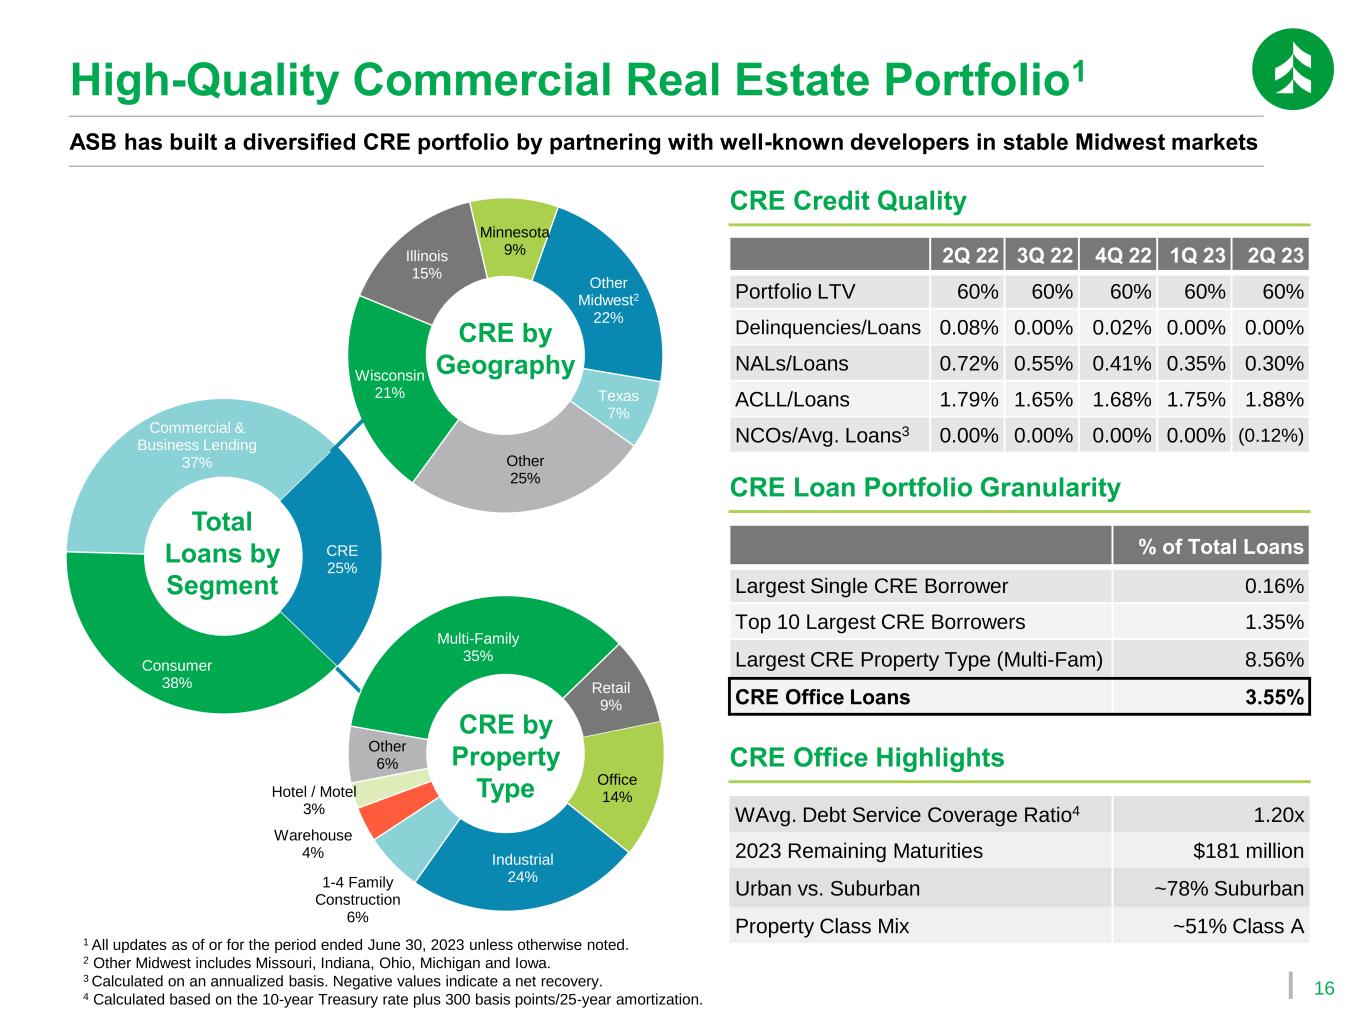
16 Wisconsin 21% Illinois 15% Minnesota 9% Other Midwest2 22% Texas 7% Other 25% Multi-Family 35% Retail 9% Office 14% Industrial 24%1-4 Family Construction 6% Warehouse 4% Hotel / Motel 3% Other 6% Consumer 38% Commercial & Business Lending 37% CRE 25% 1 All updates as of or for the period ended June 30, 2023 unless otherwise noted. 2 Other Midwest includes Missouri, Indiana, Ohio, Michigan and Iowa. 3 Calculated on an annualized basis. Negative values indicate a net recovery. 4 Calculated based on the 10-year Treasury rate plus 300 basis points/25-year amortization. High-Quality Commercial Real Estate Portfolio1 ASB has built a diversified CRE portfolio by partnering with well-known developers in stable Midwest markets 2Q 22 3Q 22 4Q 22 1Q 23 2Q 23 Portfolio LTV 60% 60% 60% 60% 60% Delinquencies/Loans 0.08% 0.00% 0.02% 0.00% 0.00% NALs/Loans 0.72% 0.55% 0.41% 0.35% 0.30% ACLL/Loans 1.79% 1.65% 1.68% 1.75% 1.88% NCOs/Avg. Loans3 0.00% 0.00% 0.00% 0.00% (0.12%) CRE Credit Quality CRE Loan Portfolio Granularity % of Total Loans Largest Single CRE Borrower 0.16% Top 10 Largest CRE Borrowers 1.35% Largest CRE Property Type (Multi-Fam) 8.56% CRE Office Loans 3.55% CRE by Geography CRE by Property Type Total Loans by Segment CRE Office Highlights WAvg. Debt Service Coverage Ratio4 1.20x 2023 Remaining Maturities $181 million Urban vs. Suburban ~78% Suburban Property Class Mix ~51% Class A
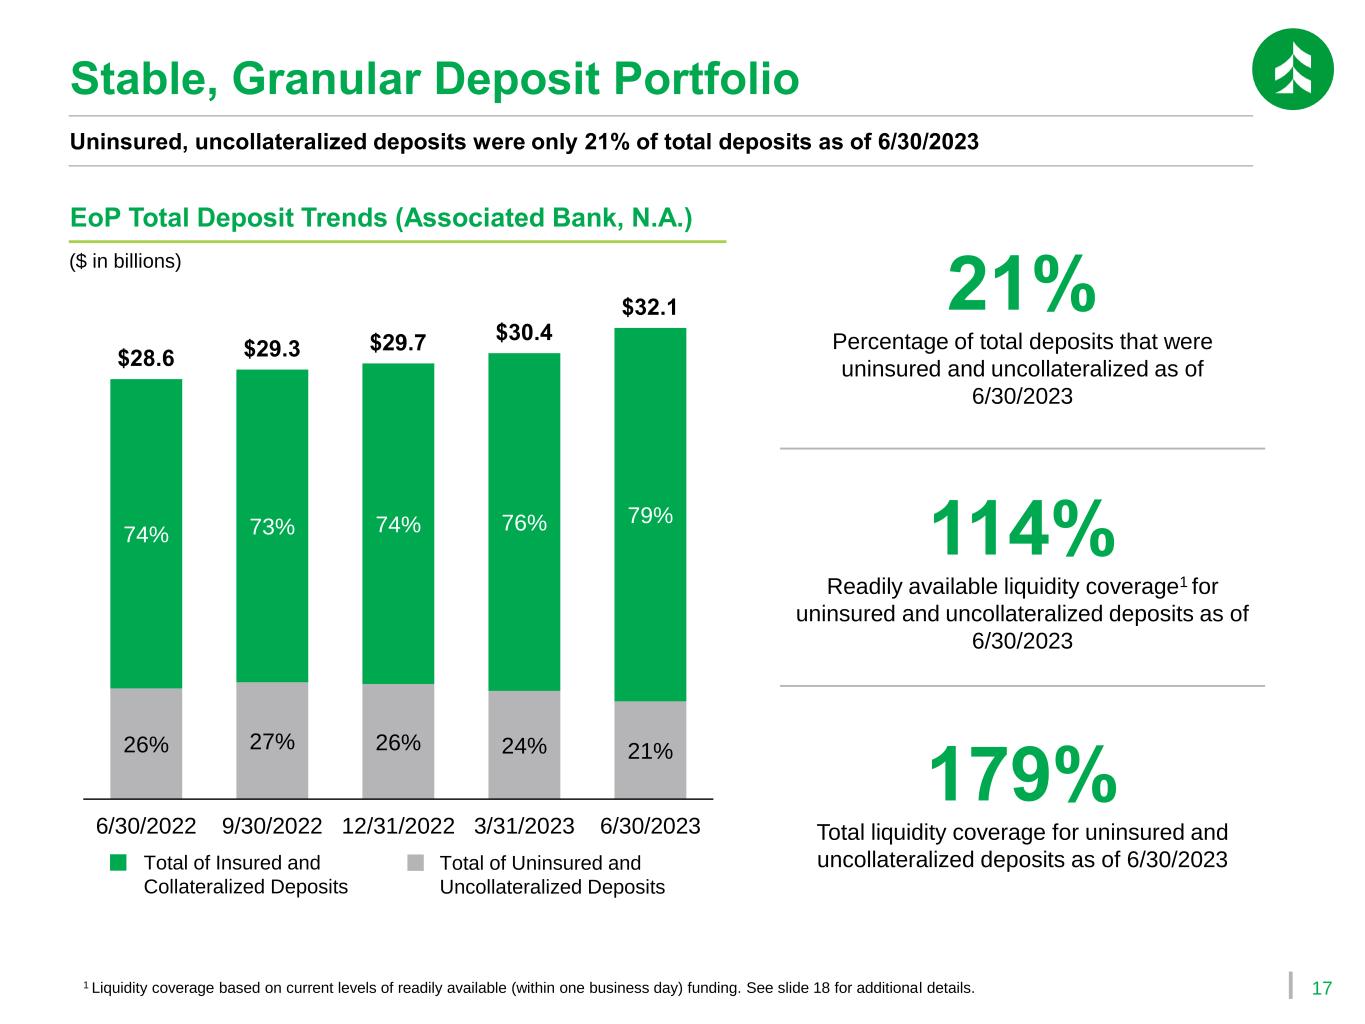
17 Stable, Granular Deposit Portfolio Uninsured, uncollateralized deposits were only 21% of total deposits as of 6/30/2023 1 Liquidity coverage based on current levels of readily available (within one business day) funding. See slide 18 for additional details. 26% 27% 26% 24% 21% 74% 73% 74% 76% 79% $28.6 $29.3 $29.7 $30.4 $32.1 6/30/2022 9/30/2022 12/31/2022 3/31/2023 6/30/2023 EoP Total Deposit Trends (Associated Bank, N.A.) ($ in billions) Total of Insured and Collateralized Deposits Total of Uninsured and Uncollateralized Deposits 21% Percentage of total deposits that were uninsured and uncollateralized as of 6/30/2023 114% Readily available liquidity coverage1 for uninsured and uncollateralized deposits as of 6/30/2023 179% Total liquidity coverage for uninsured and uncollateralized deposits as of 6/30/2023
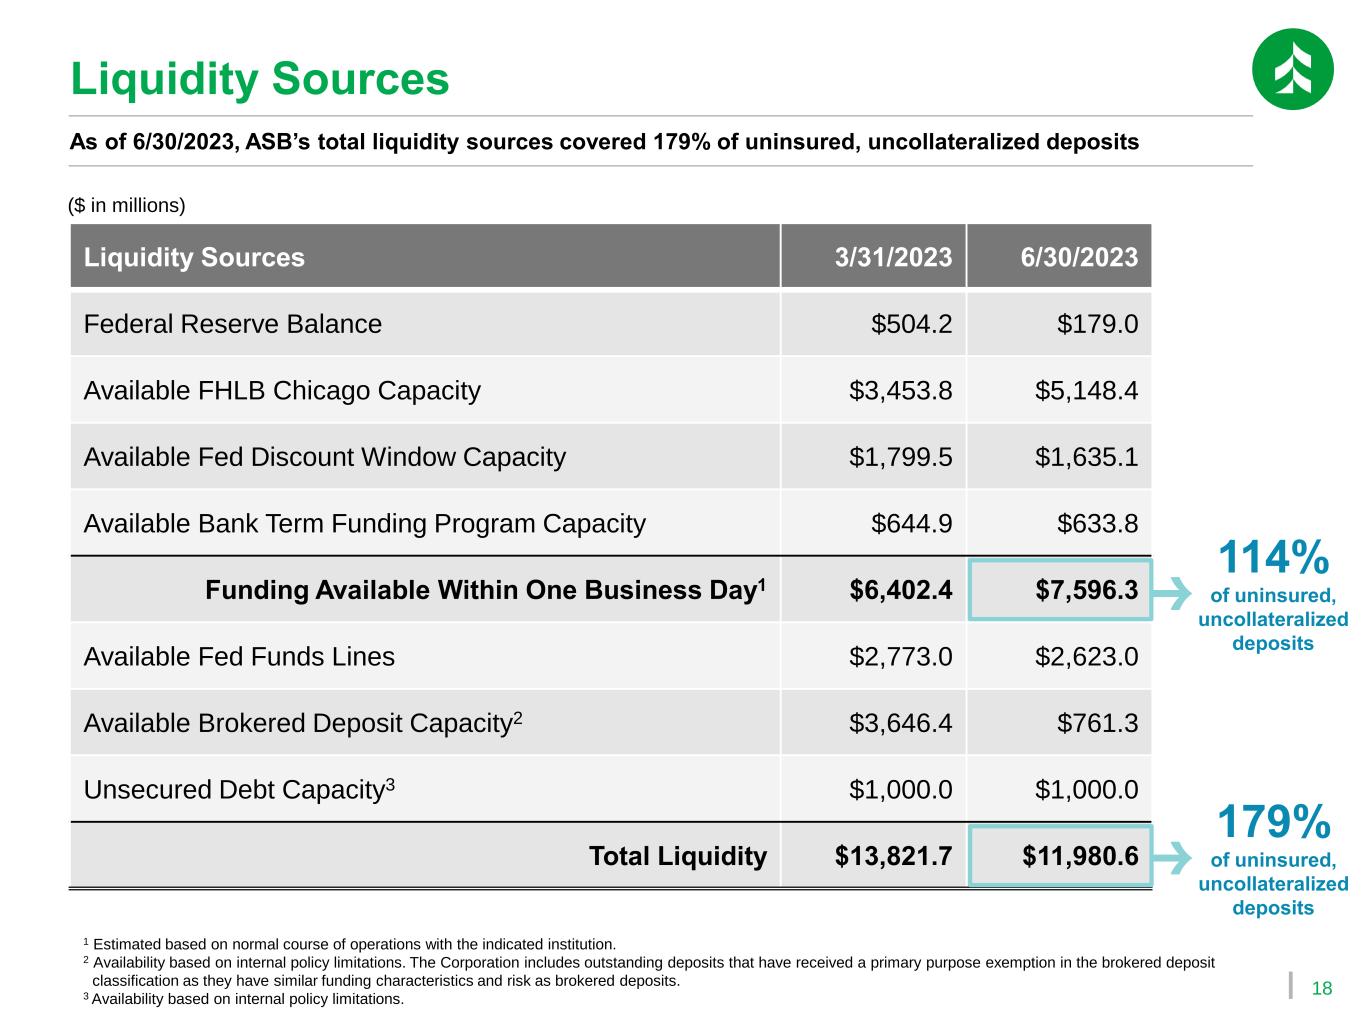
18 Liquidity Sources As of 6/30/2023, ASB’s total liquidity sources covered 179% of uninsured, uncollateralized deposits Liquidity Sources 3/31/2023 6/30/2023 Federal Reserve Balance $504.2 $179.0 Available FHLB Chicago Capacity $3,453.8 $5,148.4 Available Fed Discount Window Capacity $1,799.5 $1,635.1 Available Bank Term Funding Program Capacity $644.9 $633.8 Funding Available Within One Business Day1 $6,402.4 $7,596.3 Available Fed Funds Lines $2,773.0 $2,623.0 Available Brokered Deposit Capacity2 $3,646.4 $761.3 Unsecured Debt Capacity3 $1,000.0 $1,000.0 Total Liquidity $13,821.7 $11,980.6 ($ in millions) 114% of uninsured, uncollateralized deposits 179% of uninsured, uncollateralized deposits 1 Estimated based on normal course of operations with the indicated institution. 2 Availability based on internal policy limitations. The Corporation includes outstanding deposits that have received a primary purpose exemption in the brokered deposit classification as they have similar funding characteristics and risk as brokered deposits. 3 Availability based on internal policy limitations.
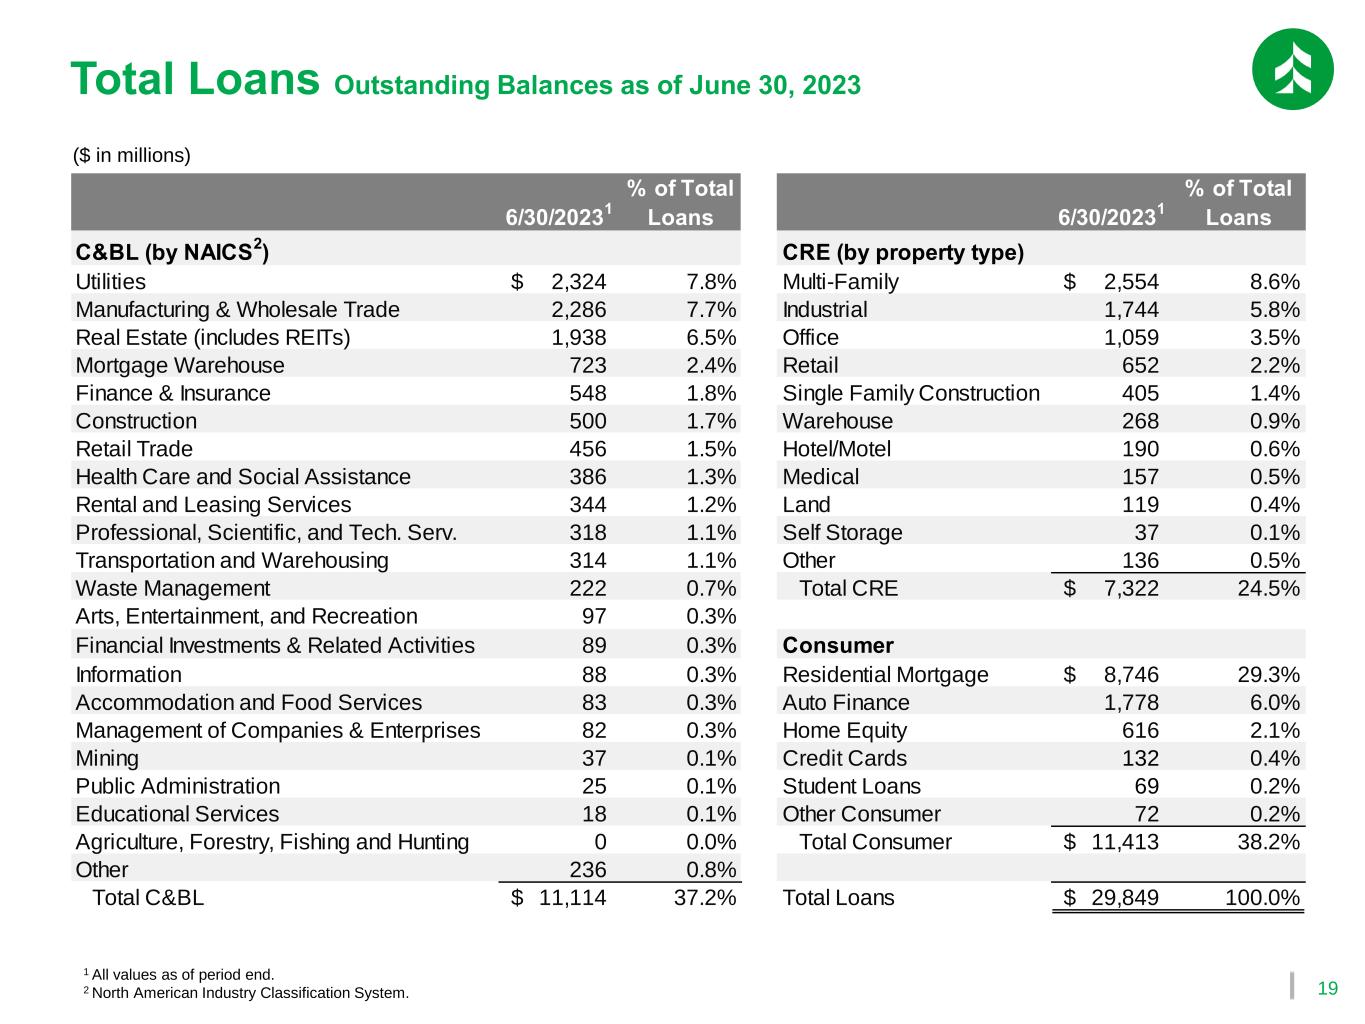
19 Total Loans Outstanding Balances as of June 30, 2023 ($ in millions) 1 All values as of period end. 2 North American Industry Classification System. 6/30/20231 % of Total Loans 6/30/20231 % of Total Loans C&BL (by NAICS2) CRE (by property type) Utilities 2,324$ 7.8% Multi-Family 2,554$ 8.6% Manufacturing & Wholesale Trade 2,286 7.7% Industrial 1,744 5.8% Real Estate (includes REITs) 1,938 6.5% Office 1,059 3.5% Mortgage Warehouse 723 2.4% Retail 652 2.2% Finance & Insurance 548 1.8% Single Family Construction 405 1.4% Construction 500 1.7% Warehouse 268 0.9% Retail Trade 456 1.5% Hotel/Motel 190 0.6% Health Care and Social Assistance 386 1.3% Medical 157 0.5% Rental and Leasing Services 344 1.2% Land 119 0.4% Professional, Scientific, and Tech. Serv. 318 1.1% Self Storage 37 0.1% Transportation and Warehousing 314 1.1% Other 136 0.5% Waste Management 222 0.7% Total CRE 7,322$ 24.5% Arts, Entertainment, and Recreation 97 0.3% Financial Investments & Related Activities 89 0.3% Consumer Information 88 0.3% Residential Mortgage 8,746$ 29.3% Accommodation and Food Services 83 0.3% Auto Finance 1,778 6.0% Management of Companies & Enterprises 82 0.3% Home Equity 616 2.1% Mining 37 0.1% Credit Cards 132 0.4% Public Administration 25 0.1% Student Loans 69 0.2% Educational Services 18 0.1% Other Consumer 72 0.2% Agriculture, Forestry, Fishing and Hunting 0 0.0% Total Consumer 11,413$ 38.2% Other 236 0.8% Total C&BL 11,114$ 37.2% Total Loans 29,849$ 100.0%
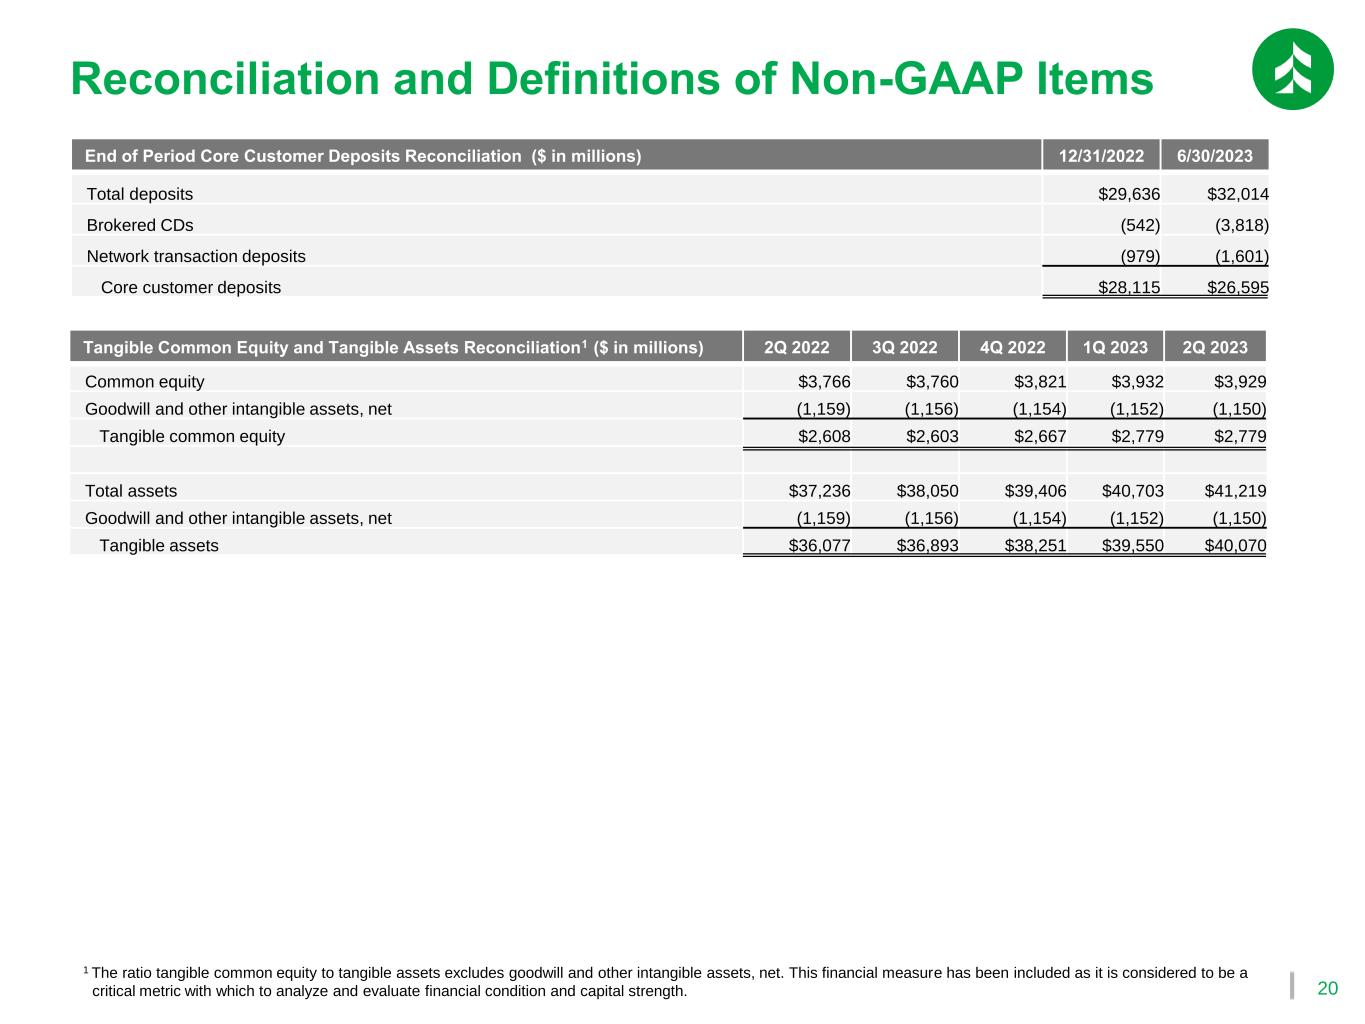
20 Reconciliation and Definitions of Non-GAAP Items 1 The ratio tangible common equity to tangible assets excludes goodwill and other intangible assets, net. This financial measure has been included as it is considered to be a critical metric with which to analyze and evaluate financial condition and capital strength. Tangible Common Equity and Tangible Assets Reconciliation1 ($ in millions) 2Q 2022 3Q 2022 4Q 2022 1Q 2023 2Q 2023 Common equity $3,766 $3,760 $3,821 $3,932 $3,929 Goodwill and other intangible assets, net (1,159) (1,156) (1,154) (1,152) (1,150) Tangible common equity $2,608 $2,603 $2,667 $2,779 $2,779 Total assets $37,236 $38,050 $39,406 $40,703 $41,219 Goodwill and other intangible assets, net (1,159) (1,156) (1,154) (1,152) (1,150) Tangible assets $36,077 $36,893 $38,251 $39,550 $40,070 End of Period Core Customer Deposits Reconciliation ($ in millions) 12/31/2022 6/30/2023 Total deposits $29,636 $32,014 Brokered CDs (542) (3,818) Network transaction deposits (979) (1,601) Core customer deposits $28,115 $26,595


